Embed Size (px)
Citation preview
Effective Progress Monitoring
Jolly Piersall – Matt Johnson - Alisa StovallIndiana Effective and Compliant IEP Resource Center
A scientifically based practice that is used to assess students’ academic performance and evaluate the effectiveness of instruction.
Can be implemented with individual students or an entire class.
What is Progress Monitoring?
To implement progress monitoring:– Student’s current levels of performance are determined,
and goals are identified for learning that will take place over time.
– The student’s academic performance is measured on a regular basis (weekly, bi-weekly, or monthly).
– Progress toward meeting the student’s goals is measured by comparing expected and actual rates of learning.
– Based on these measurements, teaching is adjusted as needed.
How does Progress Monitoring Work?
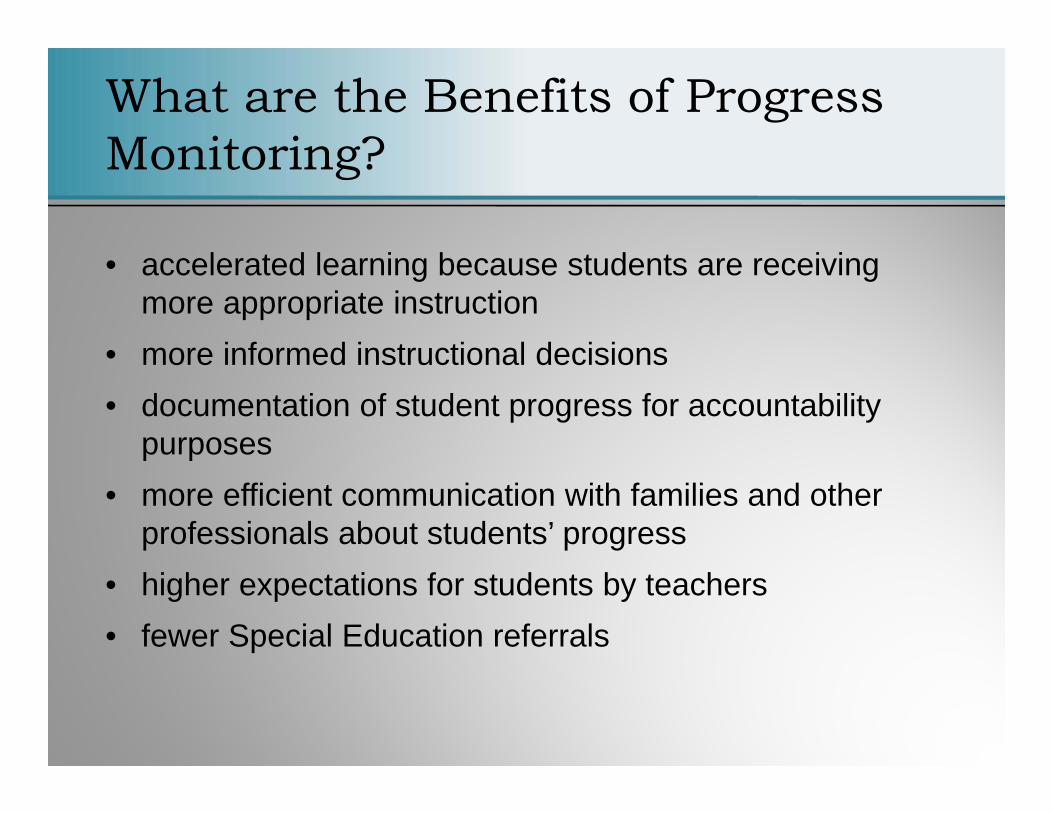
• accelerated learning because students are receiving more appropriate instruction
• more informed instructional decisions• documentation of student progress for accountability
purposes• more efficient communication with families and other
professionals about students’ progress• higher expectations for students by teachers • fewer Special Education referrals
What are the Benefits of Progress Monitoring?
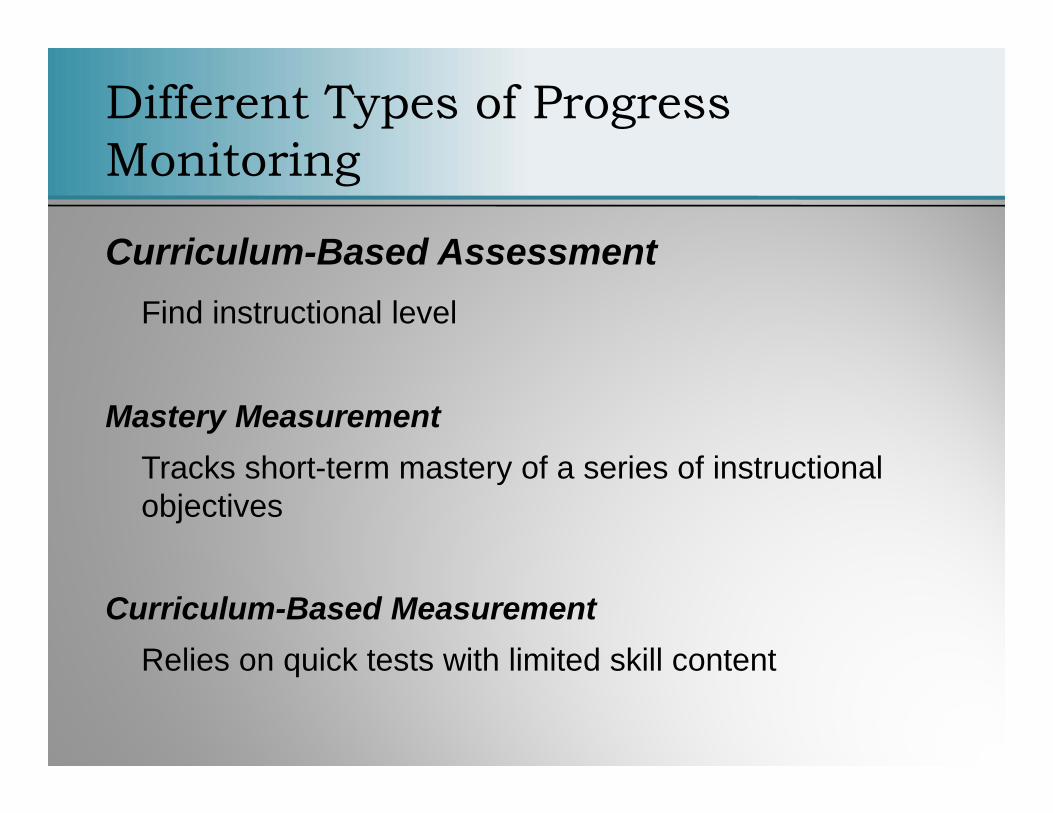
Curriculum-Based Assessment Find instructional level
Mastery Measurement Tracks short-term mastery of a series of instructional objectives
Curriculum-Based MeasurementRelies on quick tests with limited skill content
Different Types of Progress Monitoring
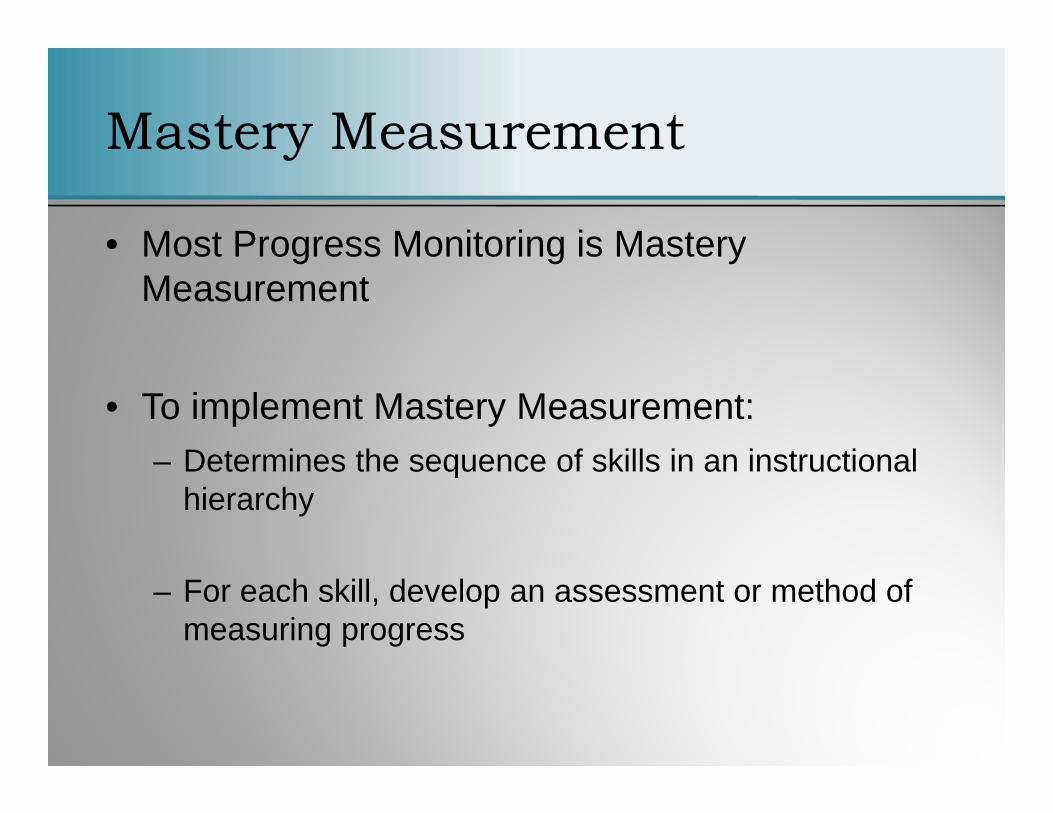
• Most Progress Monitoring is Mastery Measurement
• To implement Mastery Measurement:– Determines the sequence of skills in an instructional
hierarchy
– For each skill, develop an assessment or method of measuring progress
Mastery Measurement
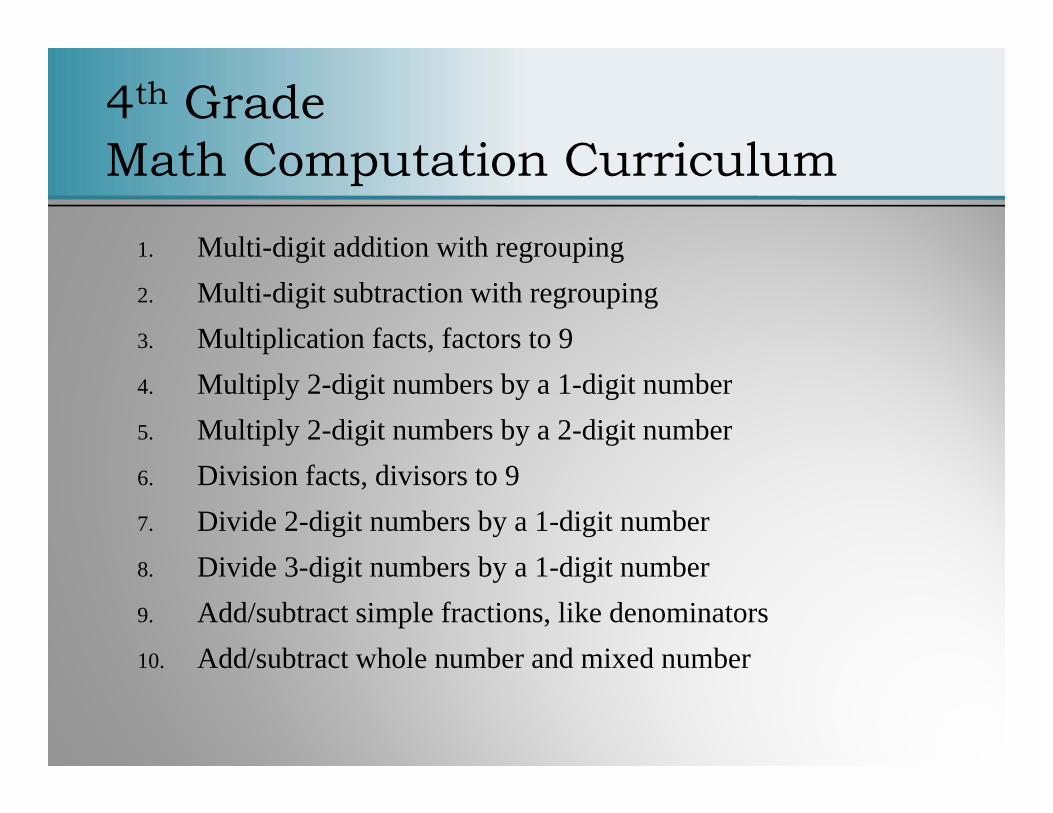
1. Multi-digit addition with regrouping2. Multi-digit subtraction with regrouping3. Multiplication facts, factors to 94. Multiply 2-digit numbers by a 1-digit number5. Multiply 2-digit numbers by a 2-digit number6. Division facts, divisors to 97. Divide 2-digit numbers by a 1-digit number8. Divide 3-digit numbers by a 1-digit number9. Add/subtract simple fractions, like denominators10. Add/subtract whole number and mixed number
4th Grade Math Computation Curriculum
8
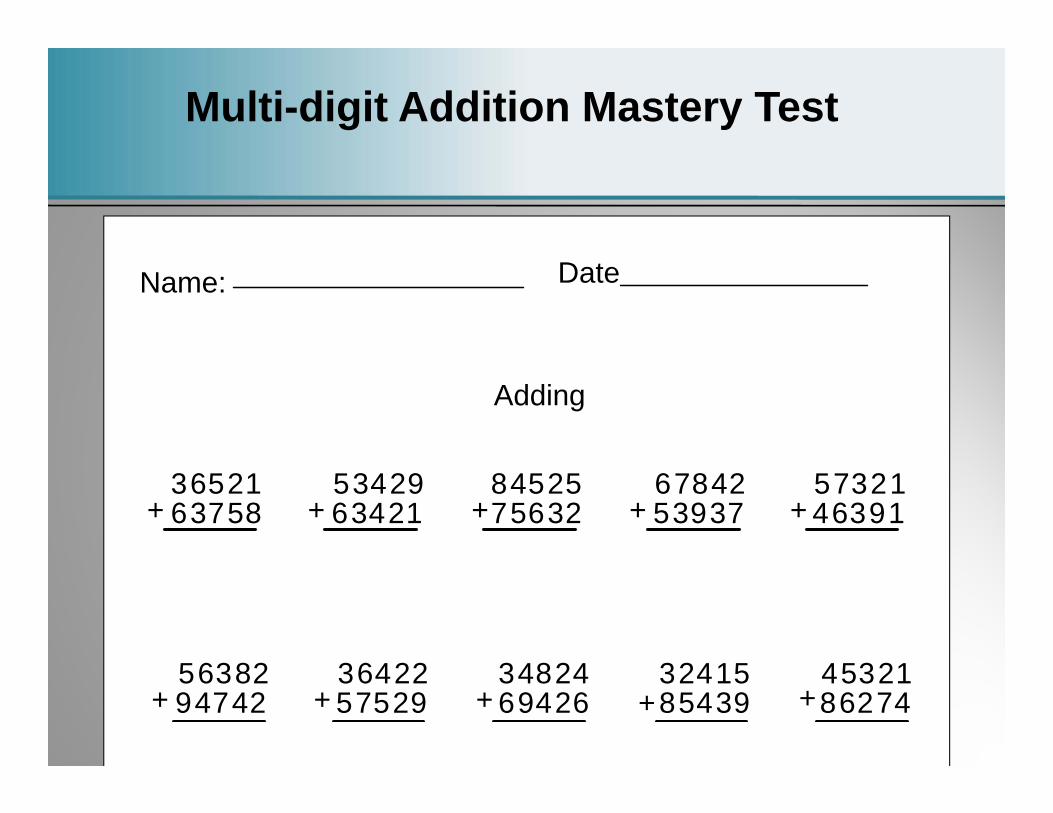
Name: Date
3652163758+
5342963421+
8452575632+
6784253937+
5638294742+
5732146391+
3642257529+
3482469426+
3241585439+
45321+86274
Adding
Multi-digit Addition Mastery Test
9
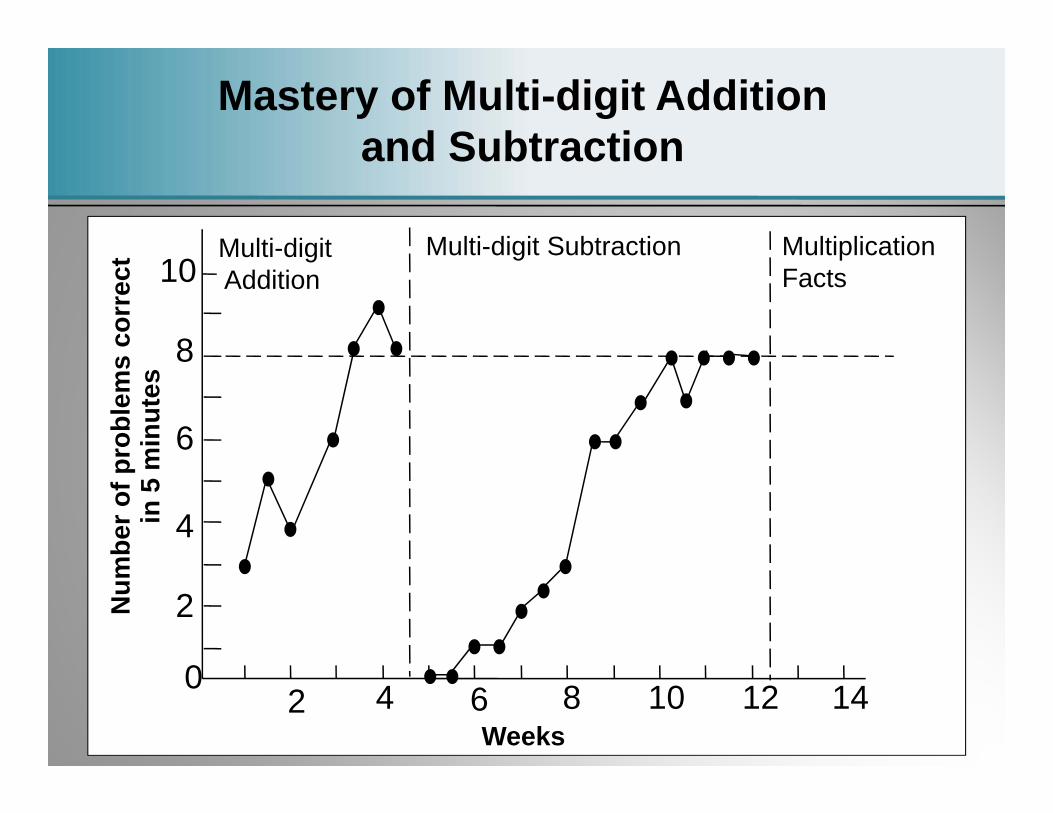
Mastery of Multi-digit Addition and Subtraction
10
8
6
4
2
0
Weeks
Num
ber o
f pro
blem
s co
rrec
tin
5 m
inut
es
Multi-digitAddition
Multi-digit Subtraction
2 4 6 8 10 12 14
Multiplication Facts
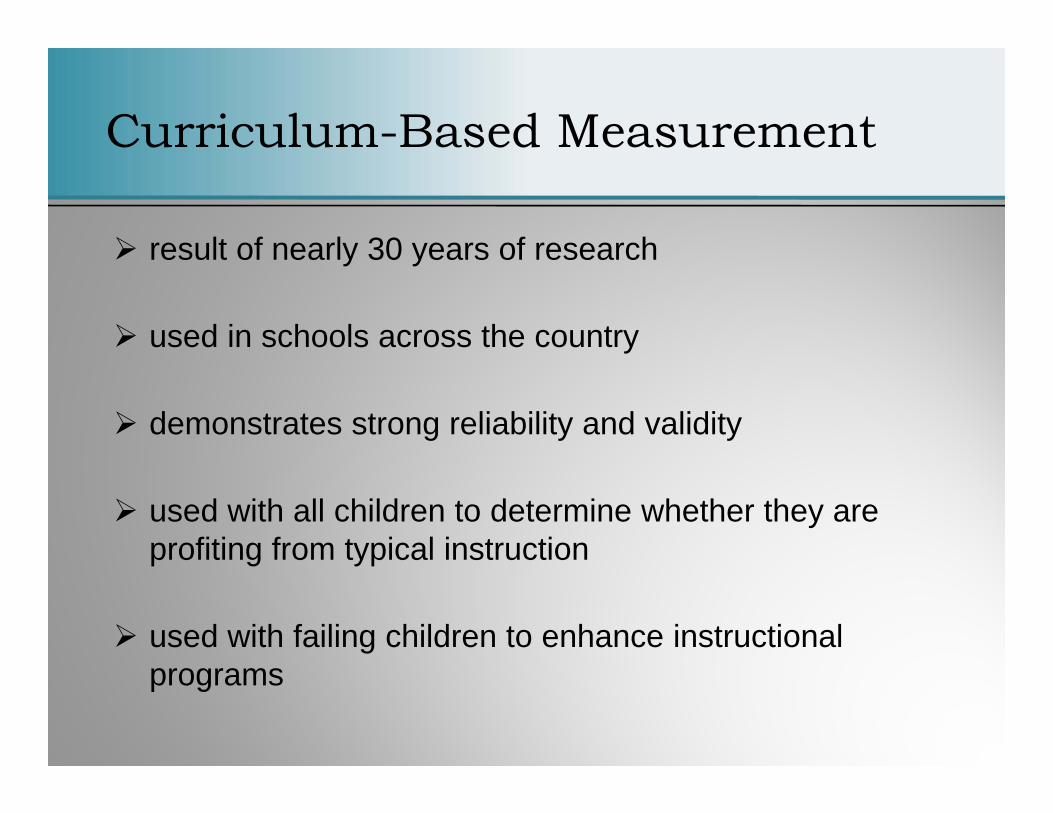
result of nearly 30 years of research
used in schools across the country
demonstrates strong reliability and validity
used with all children to determine whether they are profiting from typical instruction
used with failing children to enhance instructional programs
Curriculum-Based Measurement
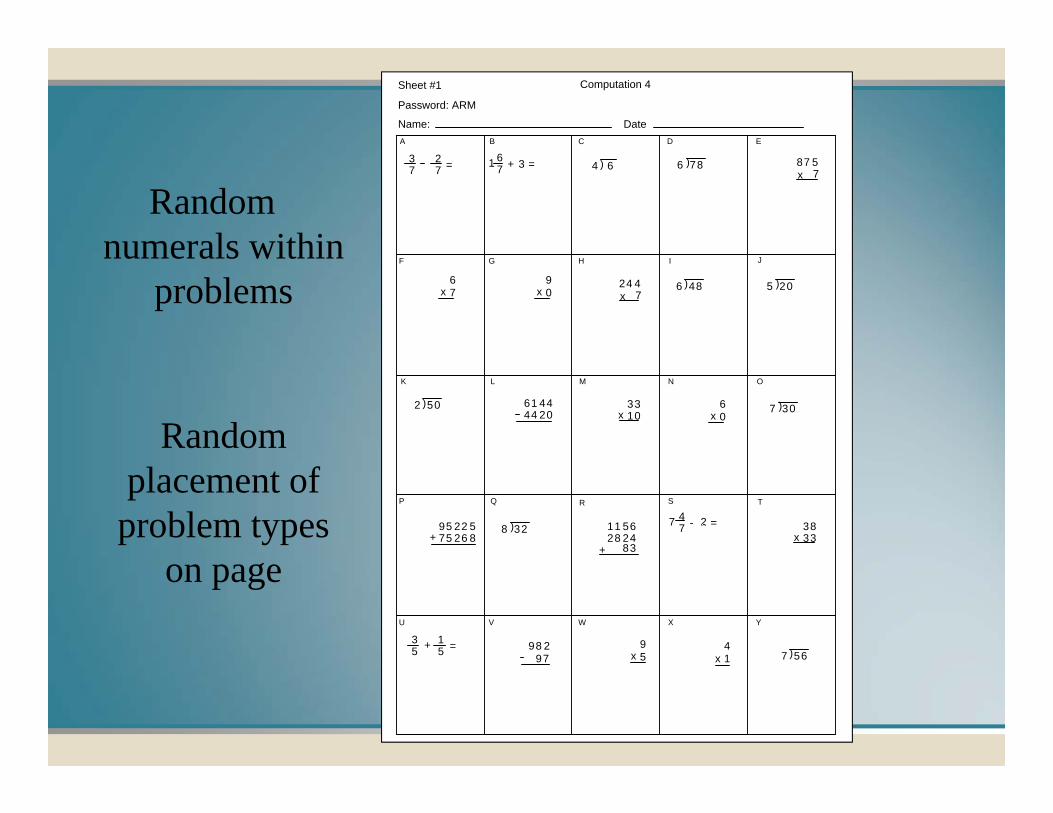
Random numerals within
problems
Random placement of
problem types on page
41x
98 297
95 22 575 26 8+
24 47x
B C D E
G H I J
L M N O
Q R S T
V W X Y
A
F
K
P
U
64 )37
27 =
61 4444 20
Sheet #1
Password: ARM
Computation 4
Name: Date
67 =31 +
47 =27 -
35
15 =+
786 ) 87 57x
67x
90x 486 ) 205 )
502 ) 3310x
60x
307 )
328 ) 11 5628 24
+ 83
3833x
95x 567 )
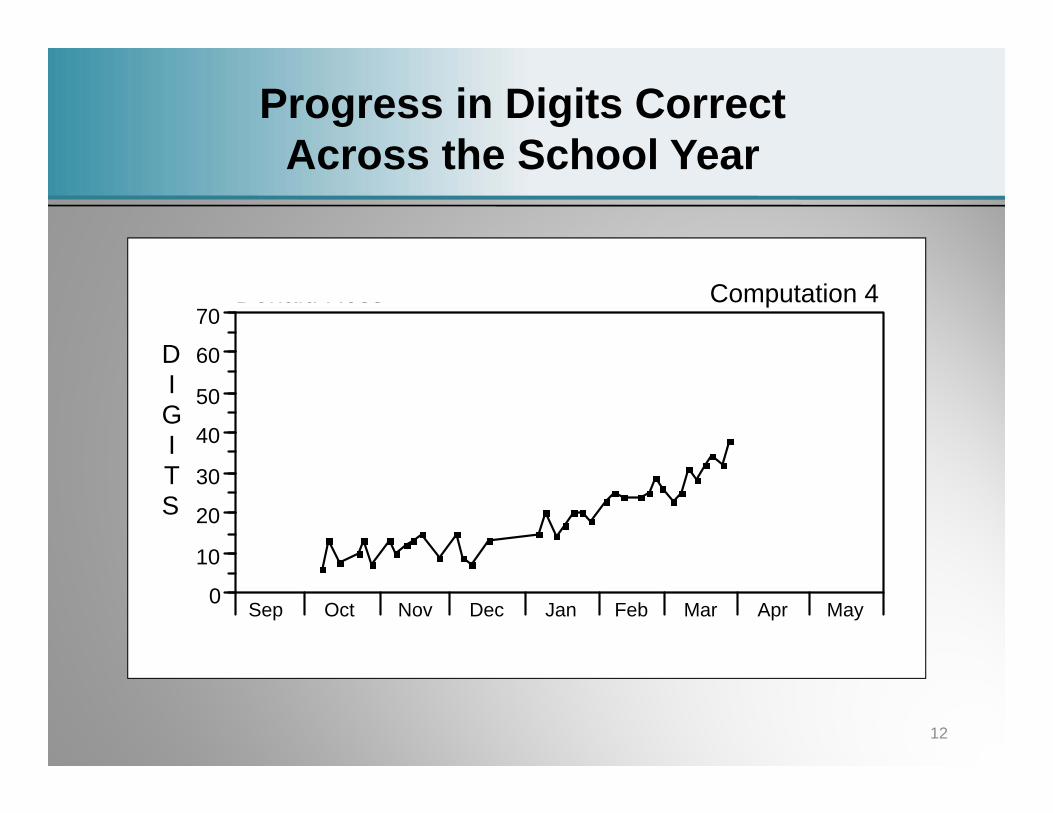
12
0
10
20
30
40
50
60
70
Sep Oct Nov Dec Jan Feb Mar Apr May
Donald Ross Computation 4
DIGITS
Progress in Digits CorrectAcross the School Year
To identify students at risk who may need additional services
To help general education teachers plan more effective instruction within their classrooms
To help special education teachers design more effective instructional programs for students who do not respond to the general education program
To document student progress for accountability purposes
To communicate with parents or other professionals about students’ progress
Progress Monitoring is used…
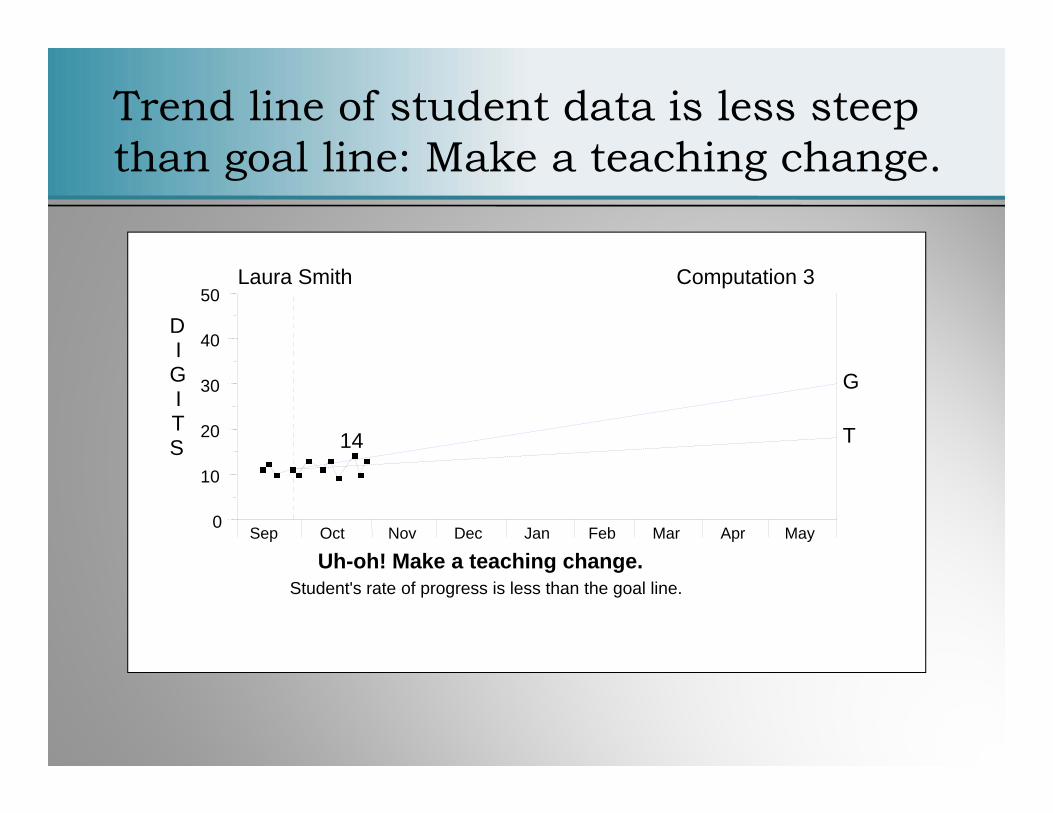
Trend line of student data is less steep than goal line: Make a teaching change.
0
10
20
30
40
50
Sep Oct Nov Dec Jan Feb Mar Apr May
Laura Smith Computation 3
DI
GITS T
G
14
Uh-oh! Make a teaching change.Student's rate of progress is less than the goal line.
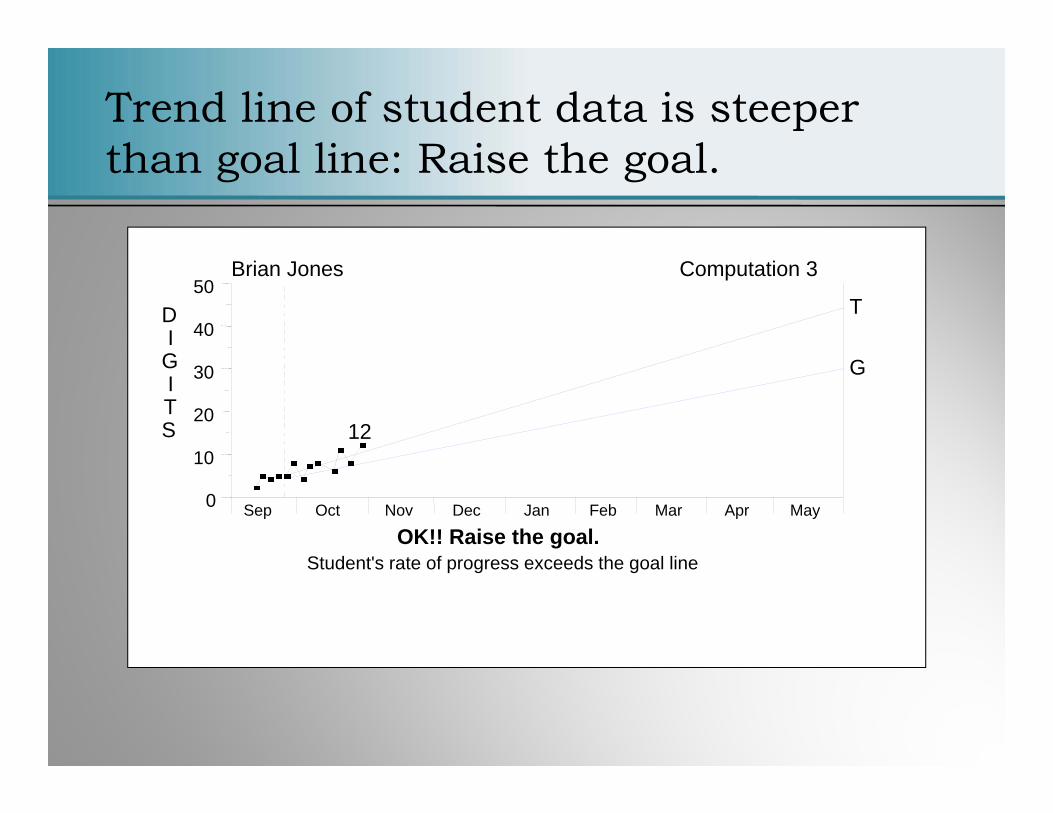
Trend line of student data is steeper than goal line: Raise the goal.
0
10
20
30
40
50
Sep Oct Nov Dec Jan Feb Mar Apr May
Brian Jones Computation 3
DI
GITS
T
G
12
OK!! Raise the goal.Student's rate of progress exceeds the goal line
• Examination of particular skills student has mastered or not mastered
• Evaluate effects of different instructional interventions for particular student
• Identify specific student strengths and needs
Using Data to Strengthen Instructional Planning
When student progress is not appropriate, consider instructional variables that can be altered:Particular skills targeted for instructionType of instructional procedures used Instructional arrangement (teacher-student ratio,
peer-mediated instruction)Allocation of time for instructionMaterials usedMotivational strategies used
Using Data to Modify Instruction
• Data-based decision making process
• Writing appropriate, measurable goals based on individual student needs
• Identify student specific interventions and accommodations
• Improve special education accountability and effectiveness
Using Data to Develop IEPs
There are four basic choices for progress monitoring:
1. Descriptive Documentation – the annual goal is aligned to standards. Teachers have the option to add objective or benchmarks of their own design.• Teachers record progress in an anecdotal format. • There may or may not be data recorded in this
documentation.• Reliance on data is based on the author of the entry.
Progress Monitoring Options
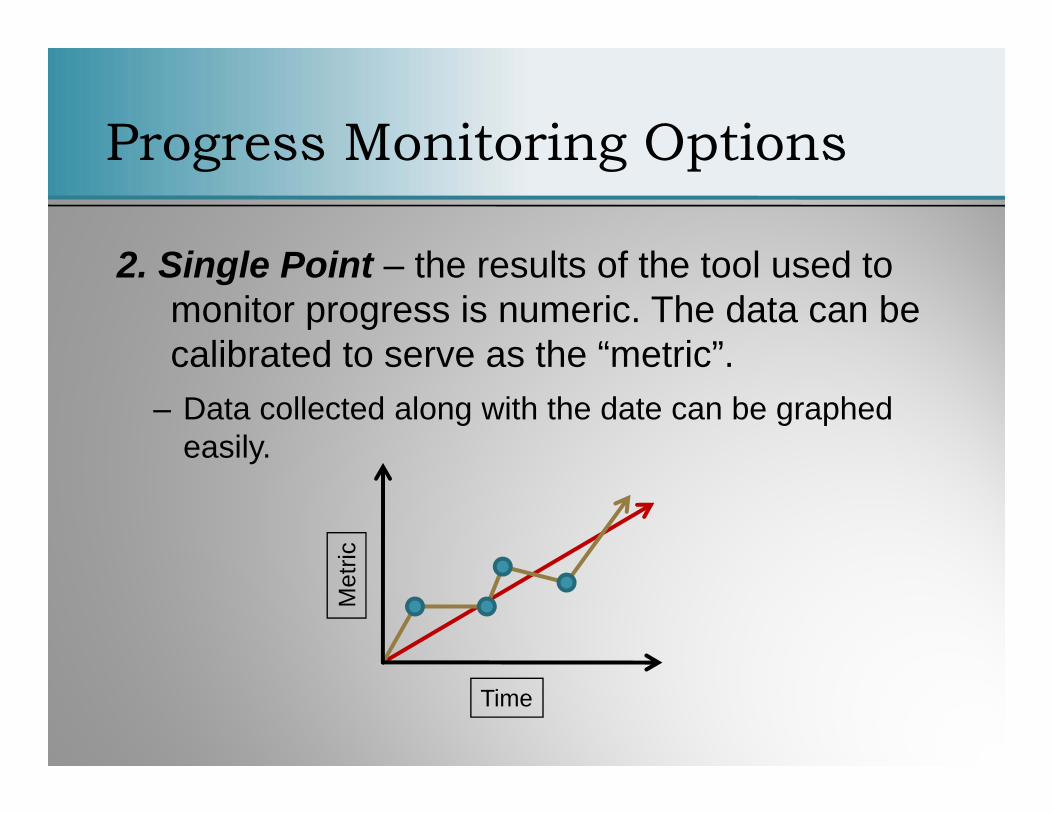
2. Single Point – the results of the tool used to monitor progress is numeric. The data can be calibrated to serve as the “metric”.
– Data collected along with the date can be graphed easily.
Met
ric
Time
Progress Monitoring Options
3. Rubrics – the author of the goal describes criteria for each level of performance.– The annual goal is aligned to state standards.– Progress is measured toward annual goal attainment
not selected standards.– In ISTART7 these levels are labeled: Not Evident,
Introduced, Emerging, Developing, Ongoing, Demonstrated, and Applied.
– Rubrics are well suited to measure progress of students for more complicated circumstances such as levels of independence, quality of work, and skill generalization.
Progress Monitoring Options
4. Collection of Indicators – measures the attainment of the annual goal based on progress toward the component objectives.– Teachers select from state standards.– The elements supporting these standards become
objectives.– Rubrics measure student progress on each element.– Overall average represents progress toward the
annual goal.
Progress Monitoring Options
• Given a sample goal how can you change the goal to fit into each of the four PM methods?
• Let’s try one together!Martin will demonstrate recall of all addition, subtraction, and multiplication facts at the rate of 20 facts per minute.
Which design will you use?
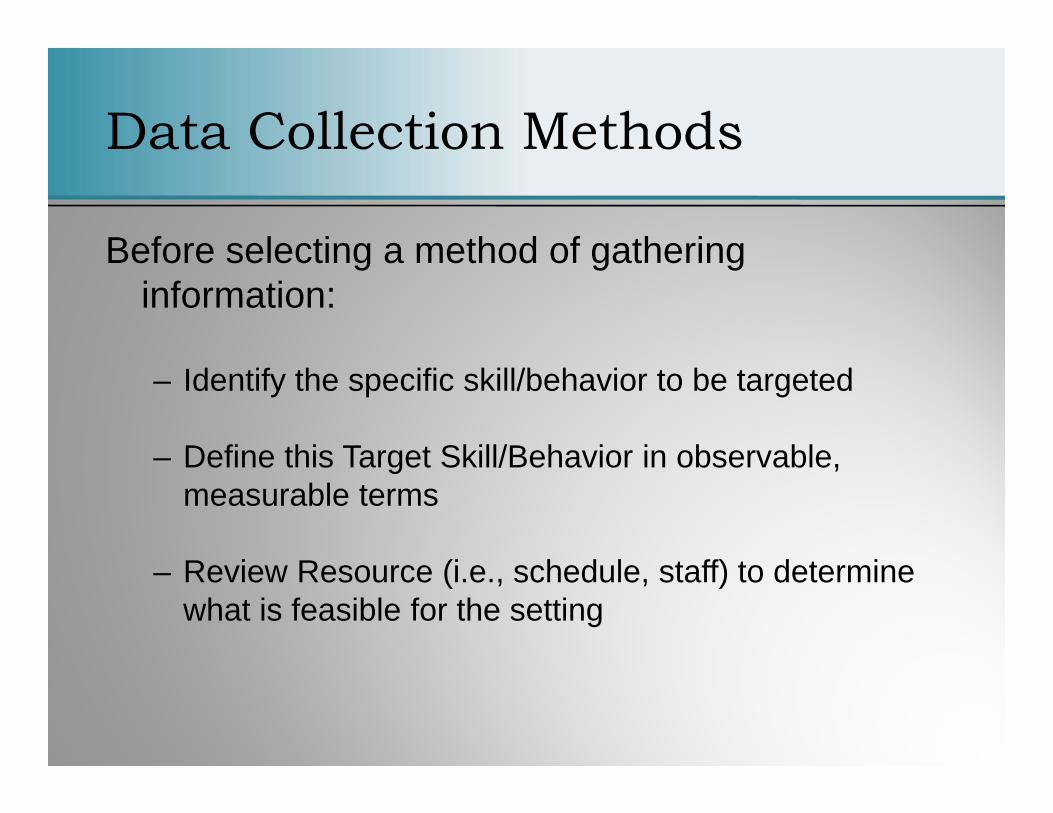
Before selecting a method of gathering information:
– Identify the specific skill/behavior to be targeted
– Define this Target Skill/Behavior in observable, measurable terms
– Review Resource (i.e., schedule, staff) to determine what is feasible for the setting
Data Collection Methods
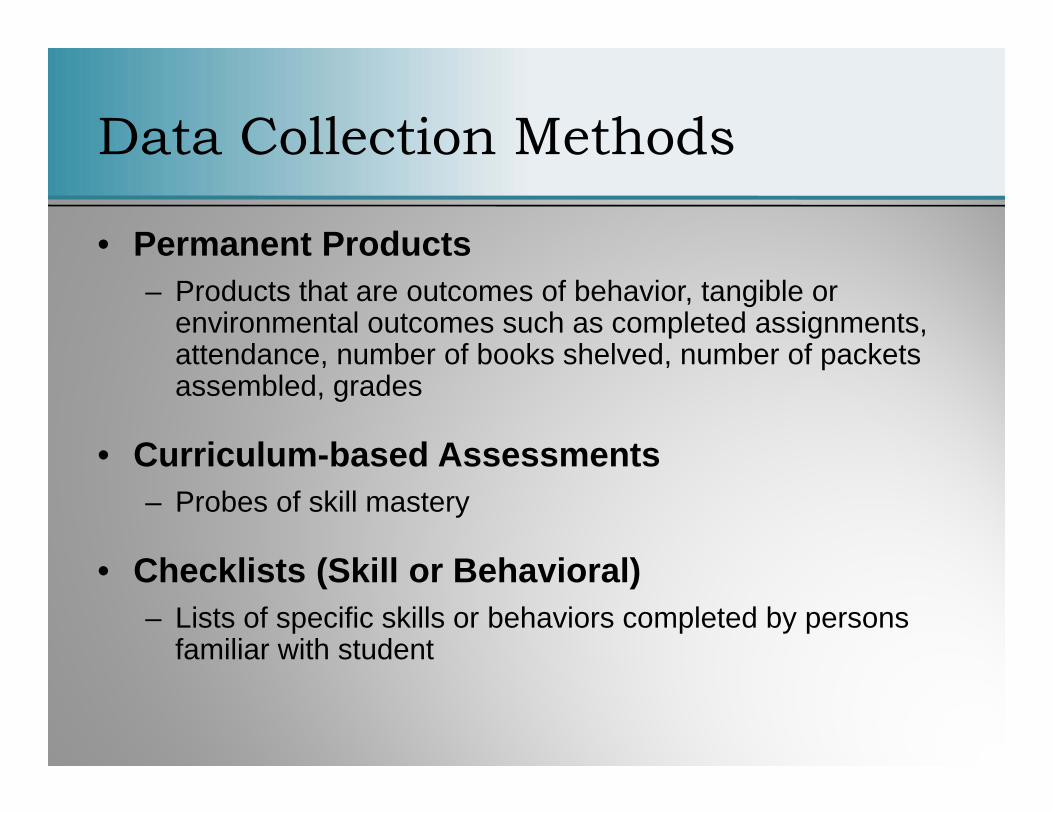
• Permanent Products– Products that are outcomes of behavior, tangible or
environmental outcomes such as completed assignments, attendance, number of books shelved, number of packets assembled, grades
• Curriculum-based Assessments– Probes of skill mastery
• Checklists (Skill or Behavioral)– Lists of specific skills or behaviors completed by persons
familiar with student
Data Collection Methods
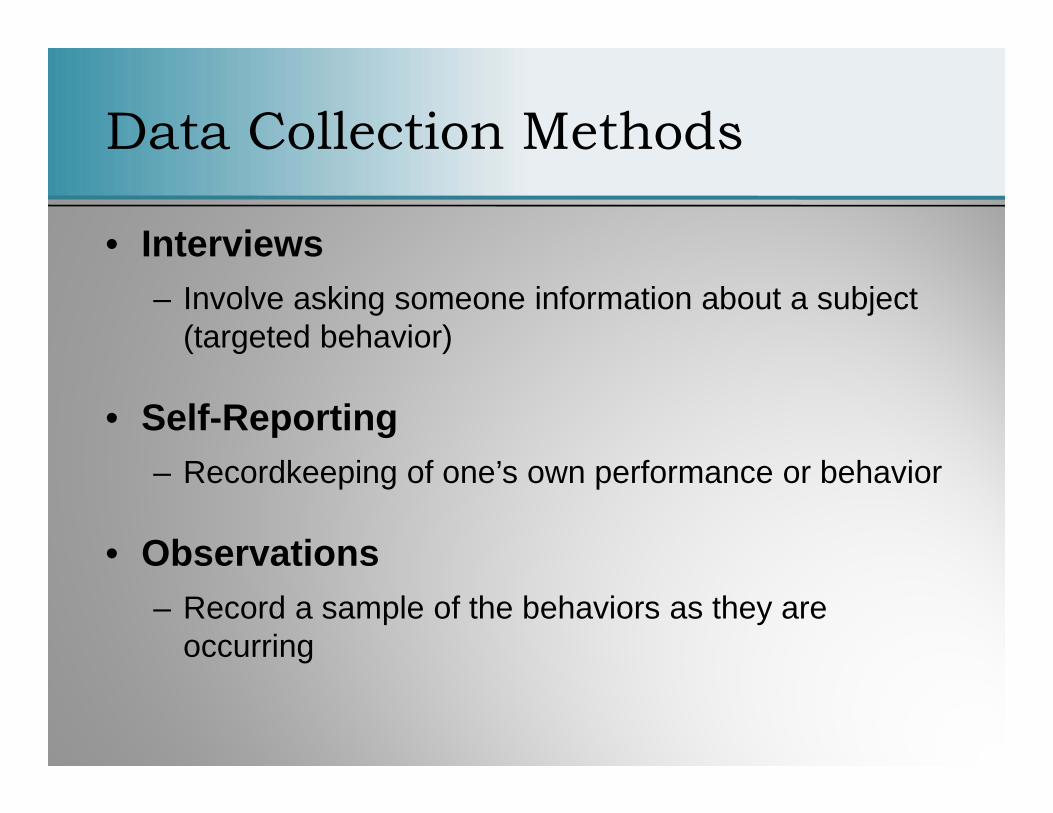
• Interviews– Involve asking someone information about a subject
(targeted behavior)
• Self-Reporting– Recordkeeping of one’s own performance or behavior
• Observations– Record a sample of the behaviors as they are
occurring
Data Collection Methods
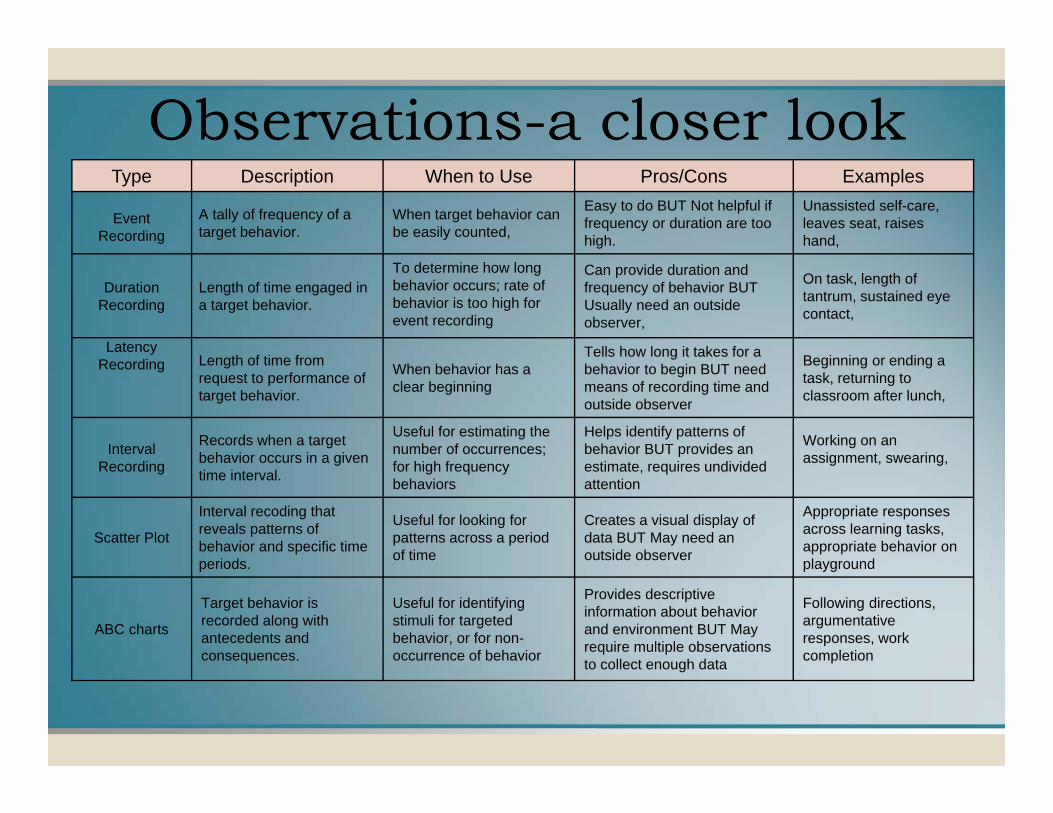
Observations-a closer lookType Description When to Use Pros/Cons Examples
Event Recording
A tally of frequency of a target behavior.
When target behavior can be easily counted,
Easy to do BUT Not helpful if frequency or duration are too high.
Unassisted self-care,leaves seat, raises hand,
Duration Recording
Length of time engaged in a target behavior.
To determine how long behavior occurs; rate of behavior is too high for event recording
Can provide duration and frequency of behavior BUT Usually need an outside observer,
On task, length of tantrum, sustained eye contact,
Latency Recording Length of time from
request to performance of target behavior.
When behavior has a clear beginning
Tells how long it takes for a behavior to begin BUT need means of recording time and outside observer
Beginning or ending a task, returning to classroom after lunch,
Interval Recording
Records when a target behavior occurs in a given time interval.
Useful for estimating the number of occurrences; for high frequency behaviors
Helps identify patterns of behavior BUT provides an estimate, requires undivided attention
Working on an assignment, swearing,
Scatter Plot
Interval recoding that reveals patterns of behavior and specific time periods.
Useful for looking for patterns across a period of time
Creates a visual display of data BUT May need an outside observer
Appropriate responses across learning tasks, appropriate behavior on playground
ABC charts
Target behavior is recorded along with antecedents and consequences.
Useful for identifying stimuli for targeted behavior, or for non-occurrence of behavior
Provides descriptive information about behavior and environment BUT May require multiple observations to collect enough data
Following directions, argumentative responses, work completion
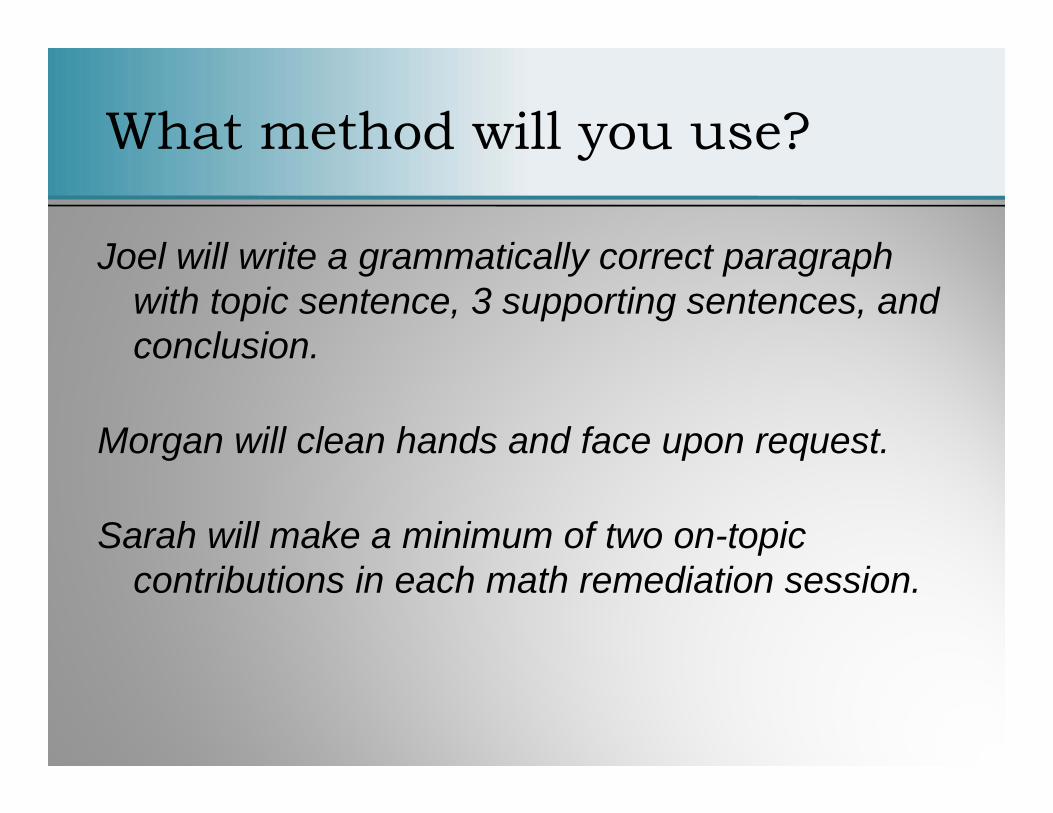
Joel will write a grammatically correct paragraph with topic sentence, 3 supporting sentences, and conclusion.
Morgan will clean hands and face upon request.
Sarah will make a minimum of two on-topic contributions in each math remediation session.
What method will you use?
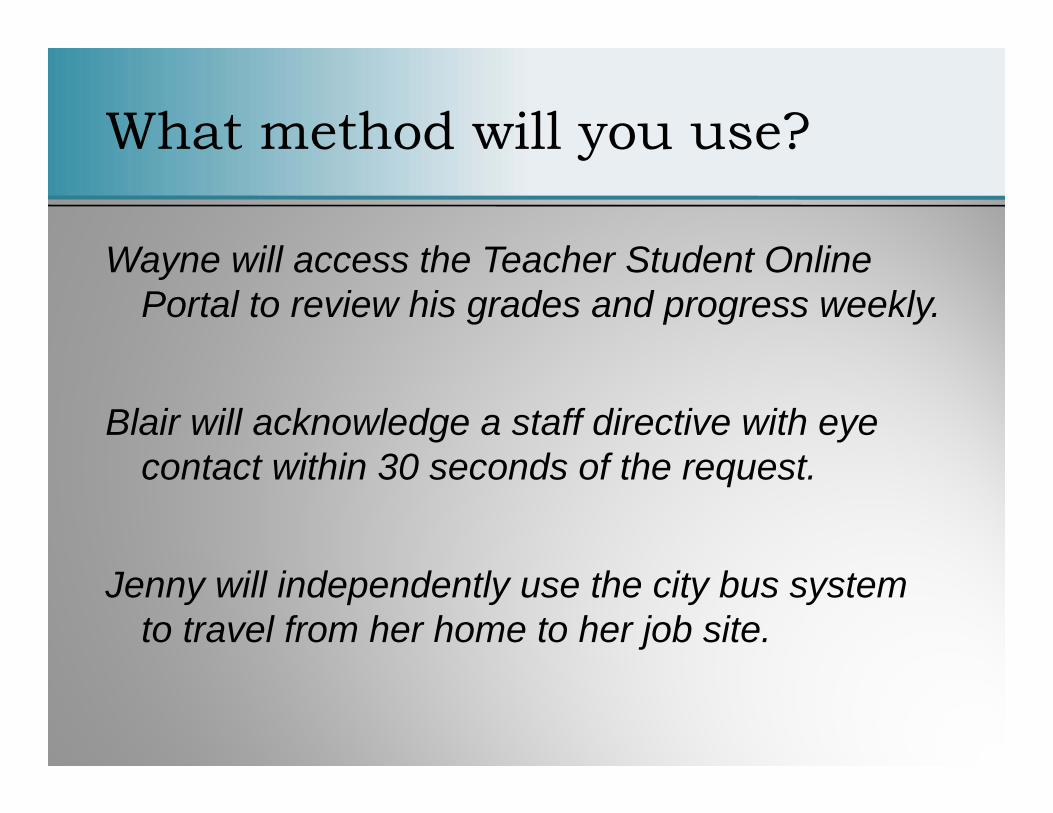
Wayne will access the Teacher Student Online Portal to review his grades and progress weekly.
Blair will acknowledge a staff directive with eye contact within 30 seconds of the request.
Jenny will independently use the city bus system to travel from her home to her job site.
What method will you use?
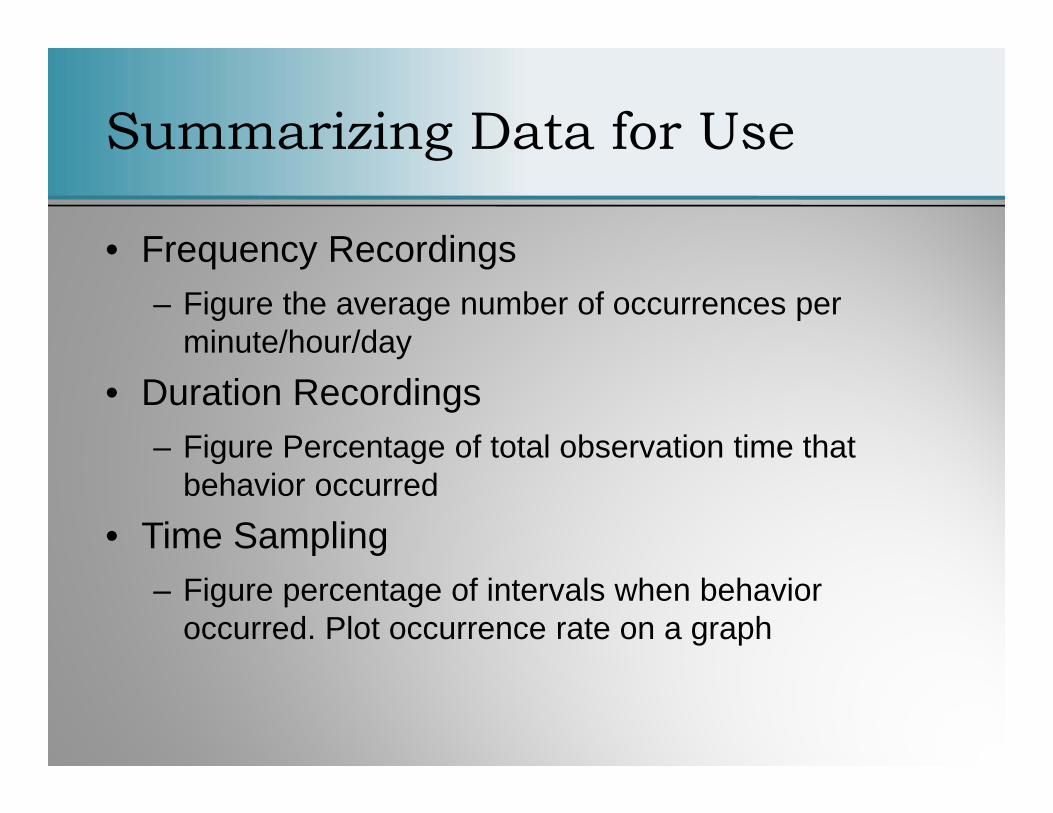
• Frequency Recordings– Figure the average number of occurrences per
minute/hour/day• Duration Recordings
– Figure Percentage of total observation time that behavior occurred
• Time Sampling– Figure percentage of intervals when behavior
occurred. Plot occurrence rate on a graph
Summarizing Data for Use
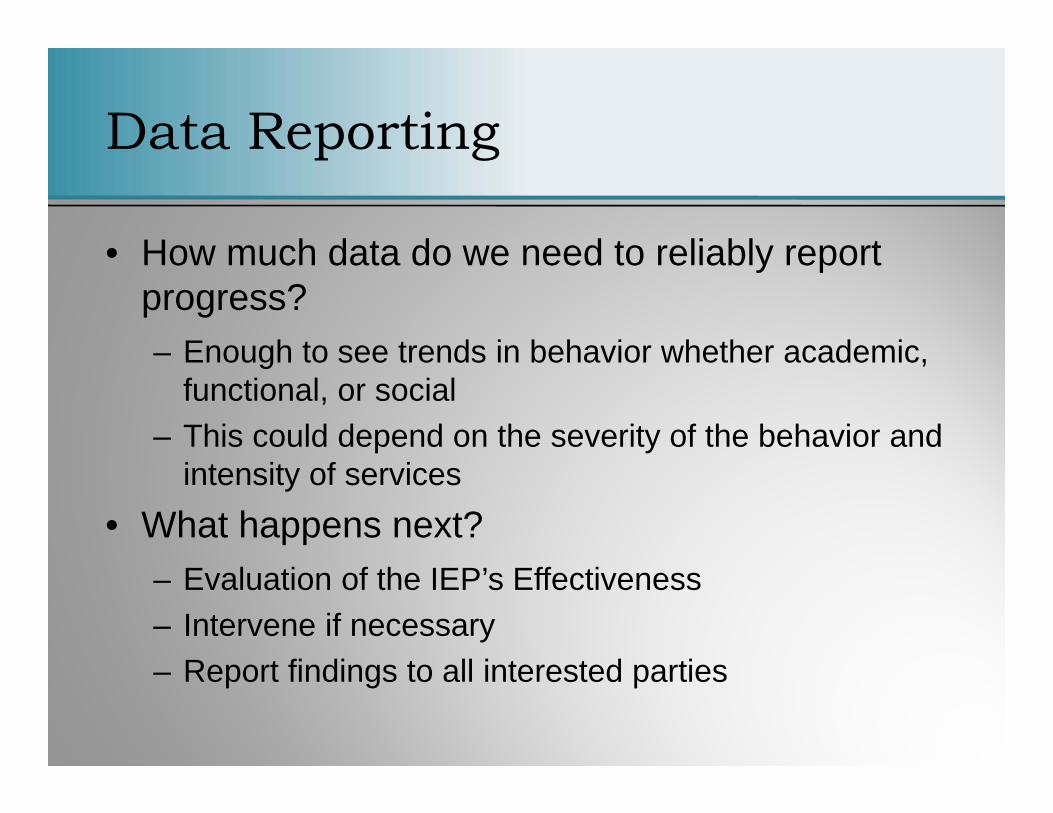
• How much data do we need to reliably report progress?– Enough to see trends in behavior whether academic,
functional, or social– This could depend on the severity of the behavior and
intensity of services• What happens next?
– Evaluation of the IEP’s Effectiveness– Intervene if necessary– Report findings to all interested parties
Data Reporting
• This evaluation should be on-going.– Goes back to frequency of collection
• Offers the opportunity to further challenge students as he/she approaches his/her goals
• Allows for timely intervention with the student– Changes can be made to the student’s program
before he or she fails
Data Reporting - Effectiveness
• Data-driven explanations and hypotheses• Determine the nature of the problem:
– Student Specific• May prompt further evaluation of the student• There may be “outside” factors affecting the
student– Systemic
• Services, placement, and/or support are not appropriate
• Staffing or methodology may also be of concern
Data Reporting – Review Results
• Always prepare to show the data behind decisions– If there are no data, what is the decision being based
upon?• If a change is required, all interested parties
should be a part of the decision– A case conference may not be needed depending on
the proposed changes in the student’s program
Data Reporting – Share!
Resources
• http://www.Interventioncentral.org• http://www.Studentprogress.org• http://www.rti4success.org – National Center
on Response to Intervention
Resources-Data Collection Forms
• Special Connections: go to Assessment Section/Teacher Tools link http://www.specialconnections.ku.edu/cgi-bin/cgiwrap/specconn/main.php?cat=assessment§ion=main
• Dr. Mac’s Behavior Management Site: go to Intervention Strategies link http://www.behavioradvisor.com/
• Teaching Children with Autism a resource by Jason M. Wallin: go to Printable Documents/Generic Data Sheetshttp://www.polyxo.com