Embed Size (px)
Citation preview
Available online at http://www.ifgdg.org
Int. J. Biol. Chem. Sci. 13(2): 1027-1042, April 2019
ISSN 1997-342X (Online), ISSN 1991-8631 (Print)
© 2019 International Formulae Group. All rights reserved. 8012-IJBCS
DOI: https://dx.doi.org/10.4314/ijbcs.v13i2.36
Original Paper http://ajol.info/index.php/ijbcs http://indexmedicus.afro.who.int
Effects of abiotic parameters main of soil on the distribution of earthworms in
a tropical moist savanna (Lamto, Central Côte d’Ivoire)
Nounfro Madjima SORO*, N’guetta Moïse EHOUMAN, Mamadou TOURE et
Seydou TIHO
UFR des Sciences de la Nature (SN), Université Nangui Abrogoua, 02 BP 801 Abidjan 02, Côte d’Ivoire.
Unité de Recherche en Ecologie et Biodiversité (UREB), Université Nangui Abrogoua, Côte d’Ivoire. * Corresponding author; E-mail: [email protected], Tel: +225 05849892 / +225 07039949
ABSTRACT
The distribution of earthworms fluctuates in relation to vegetation type and environmental factors. This
study evaluates the effects of litter input, organic matter, soil moisture and pH on the structure and relative
abundance of earthworms collected from different vegetation of Lamto reserve. Grassy savanna, woody
savanna and Forest were sampling. Each vegetation type has been divided into 3 plots. These plots were geo-
referenced using a GPS and mapped using QGIS software. For each plot, 25 points were randomly selected
using their GPS coordinates. The litters were collected manually. In TSBF (Tropical Soil Biology and Fertility)
monoliths of the earthworms have been collected by handsorting. Soil clumps were also collected to determine
the organic matter contain, soil moisture and pH. The woody savanna contained the greatest number of
earthworm species followed by the grassy savanna and the forest that had the same number of species.
Whereas, forest has the highest density of earthworms, followed by grassy and woody savannas. The moisture
of soil influences the distribution of earthworm in forest. In grassy savanna the distribution of earthworm
depends on soil moisture and organic matter. In woody savanna, the distribution of earthworm depends on soil
moisture, pH and biomass of litter.
© 2019 International Formulae Group. All rights reserved
Keywords: Earthworms, distribution, soil abiotic parameters, vegetation type, Lamto.
INTRODUCTION
Earthworm belongs to one of the most
important invertebrate groups of the class
Oligochaeta under the phylum Annelida and is
well known for its contribution to soil
formation. They occupy a place important in
ecosystems. Earthworms plays an important
role in the incorporation, transformation of
materials and improve soil structure (Decaens
and Jiminez, 2002). Through their activities,
earthworms are real actors and bioindicators
of the soil fertility (Milau et al., 2015). Since
earthworms have been recognized for their
critical role in ecosystem stability, several
studies have focused on the factors that
govern the dynamics and distribution of
earthworms in the soil. The species of
earthworms found in an environment depend
on nature, soil characteristics and conditions
climate change (Gastine et al., 2003). Their
structure and distribution mode in the soil are
various. The significance of diverse soil
habitats is one of the most influencing factors
affecting the overall earthworm distribution
(Rajkhowa et al., 2014). Population dynamics,
diversity and distribution of earthworms in
natural ecosystems of the tropics have
received considerable attention in recent years
N. M. SORO et al. / Int. J. Biol. Chem. Sci. 13(2): 1027-1042, 2019
1028
(Gonzalez et al., 2007). Several works studied
the habitat preference of various earthworm
species (Scullion and Malik, 2000). The
presence of a species in a particular habitat
and its absence from other habitats shows the
species-specific distribution of earthworms in
ecosystems (Tripathi and Bhardwaj, 2004).
The distribution of earthworm communities
also depends on the physico-chemical
characteristics of the soil. Environmental
factors such as moisture, temperature, pH and
soil texture also affect the distribution of
earthworms (Fokam et al., 2016). Changes in
land use patterns have also directly affected
the composition and population structure of
earthworm communities in different agro-
climatic regions (Lalthanzara et al., 2011;
Traoré et al., 2012; Savadogo et al., 2016;
Empwal et al., 2017). Others studies evalued
the effects of abiotic factors on the structure
of earthworm community (Singh et al., 2016).
Koné et al. (2012) highlighted the influence of
environmental factors, including litter and soil
parameters, on the abundance of earthworms.
Ehouman et al. (2012) showed that the
structure of the earthworm community varied
according to the type of vegetation. However,
no study has shown the abiotic factors
determining the distribution of earthworms in
each type of vegetation. This study aims to
determine which abiotic parameter influences
the distribution of earthworms in each
vegetation type of the natural reserve of
Lamto.
MATERIALS AND METHODS
Site description
The study was conducted in Lamto
reserve (6°13 N, 5°2 W) in Central Côte
d’Ivoire from May to September 2015. The
reserve belongs to the transition zone between
the semi-decidous humid forest in the South
and Soudanian savannas in the North. Lamto
reserve has an area of 2700 ha covered by
mosaic of forest and savanna. Lamto is
characterized by a bimodal rainfall indicating
two wet seasons from April to July and from
September to October. From 2006 to 2015 the
average rainfall is 1240 mm, the maximum
being reached in June with 177.44 mm of rain.
The lowest rainfall occurs in December with
22.12 mm. The average minimum temperature
is in August: 26.44 °C, and the maximum in
February: 29.99 °C. Most soils lie on granitic
bedrock and are classified as ferralsols. The
habitats studied were chosen according to
vegetation type. The grassy savanna consists
mainly of grasses, the woody savanna with
grasses and trees both, the forest of trees
mainly.
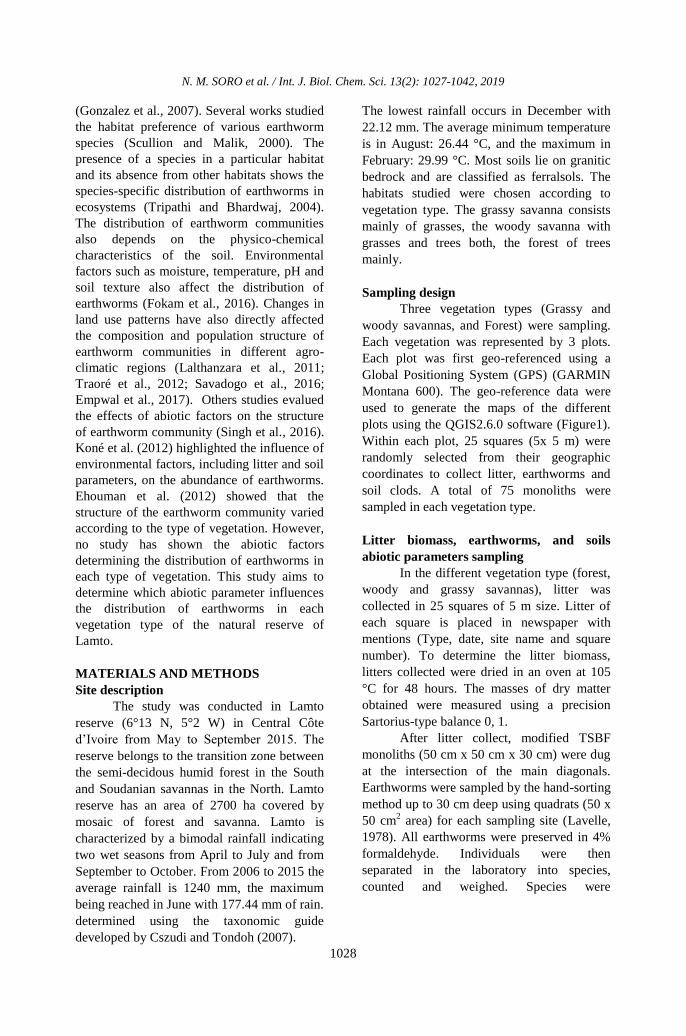
Sampling design
Three vegetation types (Grassy and
woody savannas, and Forest) were sampling.
Each vegetation was represented by 3 plots.
Each plot was first geo-referenced using a
Global Positioning System (GPS) (GARMIN
Montana 600). The geo-reference data were
used to generate the maps of the different
plots using the QGIS2.6.0 software (Figure1).
Within each plot, 25 squares (5x 5 m) were
randomly selected from their geographic
coordinates to collect litter, earthworms and
soil clods. A total of 75 monoliths were
sampled in each vegetation type.
Litter biomass, earthworms, and soils
abiotic parameters sampling
In the different vegetation type (forest,
woody and grassy savannas), litter was
collected in 25 squares of 5 m size. Litter of
each square is placed in newspaper with
mentions (Type, date, site name and square
number). To determine the litter biomass,
litters collected were dried in an oven at 105
°C for 48 hours. The masses of dry matter
obtained were measured using a precision
Sartorius-type balance 0, 1.
After litter collect, modified TSBF
monoliths (50 cm x 50 cm x 30 cm) were dug
at the intersection of the main diagonals.
Earthworms were sampled by the hand-sorting
method up to 30 cm deep using quadrats (50 x
50 cm2 area) for each sampling site (Lavelle,
1978). All earthworms were preserved in 4%
formaldehyde. Individuals were then
separated in the laboratory into species,
counted and weighed. Species were
determined using the taxonomic guide
developed by Cszudi and Tondoh (2007).
N. M. SORO et al. / Int. J. Biol. Chem. Sci. 13(2): 1027-1042, 2019
1029
The main soil abiotic parameters
(organic matter, pH, and soil moisture) were
also determined to assess their impact on the
distribution of earthworms in the soil. The
pH was determined using a Mettler-Toledo-
GmBH MP pH meter. At each monolith, soil
sample were taken at 0–20 cm depth. To
determine soil moisture, a part of soil cores
was immediately weighed for fresh mass.
The sample was then placed in a steam room
at 105 °C for 48 hours, and weighed for dry
mass. The other part of soil was air-dried,
crushed and sieved (2 mm) before the
determination of the organic matter and pH.
pH values were measured electronically on
soil-to water suspensions (Baize, 2000). 5 g
of dry soil was combustined using a LECO
CNS 2000 analyzer (LECO Corporation, St
Joseph, MI) at a temperature of 375 °C for 16
hours (Moreno et al., 2001). The organic
matter content is obtained by multiplying the
ratio of the difference between the weight of
the dry soil and the weight of the incinerated
soil on the weight of the dry soil per 100.
Soil moisture was obtained by
and organic
matter content by
Statistical analysis
The species richness of earthworms
was determined by enumerating the number
of species observed over the whole
monoliths. The density of earthworms was
defined as the number of individual per m2
area. Shannon-Weaver’s index served to
measure the diversity of the earthworm
community. This index and its evenness were
computed using the program EstimateS 7.50.
The Statistica version 7.1 software allowed
verifying the homogeneity of the variances
by the Levene test. Then, the overall
variability of earthworm densities of the
different sites was determined with the non-
parametric Kruskal-Wallis test. Finally, the
Mann-Withney U test was used to compare 2
to 2. To investigate the effects of
environmental variables (Litter biomass, soil
pH, soil organic matter and soil moisture
content on species abundances, we use an
ordination method (gradient method analysis)
developed by (Lebreton et al. 1988) in order
to summarize all the information in the
community. Thus canonical correspondence
analysis (CCA) was used. The aim of
canonical ordination is to detect the main
pattern in the relation between the species
and the observed environment (Jongman et
al. 1995). The function ade4 of programme R
was used to establish the structure of the
community of earthworms.
Figure 1 : Sampling design.
N. M. SORO et al. / Int. J. Biol. Chem. Sci. 13(2): 1027-1042, 2019
1030
RESULTS
Sampling efficiency
The species richness observed was a
very good estimate of that expected in each
habitat. The values of sampling coverage were
high for all habitats (at least 84%). The woody
savanna contained the largest number of
species (13 species) followed by grassy
savanna and forest (12 species each). The
grassy savanna had the lowest value of the
diversity index (H = 1.89). This value is 2.12
for wooded savanna and 2.19 for forest. The
value of Equitability is the same in all
vegetation type (E = 0.98, Table 1).
Density of earthworms
The density of earthworms was high in
forest following by grassy savanna. Woody
savanna had low density. In grassy savanna
the highest densities were recorded for the
species Sthulmania porifera, Chuniodrilus
palustris and Millsonia omodeoi. In woody
savanna Sthulmania porifera, Millsonia
omodeoi and Dichogaster agilisweree
dominated species. However, in the forest,
Sthulmania porifera, Chuniodrilus palustris
and Dichogaster agilis had the highest
densities (Table 2). The comparison of mean
densities of earthworms in different media
reveals the existence of significant differences
between them (Kruskal-Wallis test: F = 15.05,
P <0.05). The Mann-Whitney U test showed a
significant difference between the density of
earthworms in grassy and woody savannas;
between the grassy savanna and that of the
forest, and between the woody savanna and
that of the forest (P <0.05 for each).
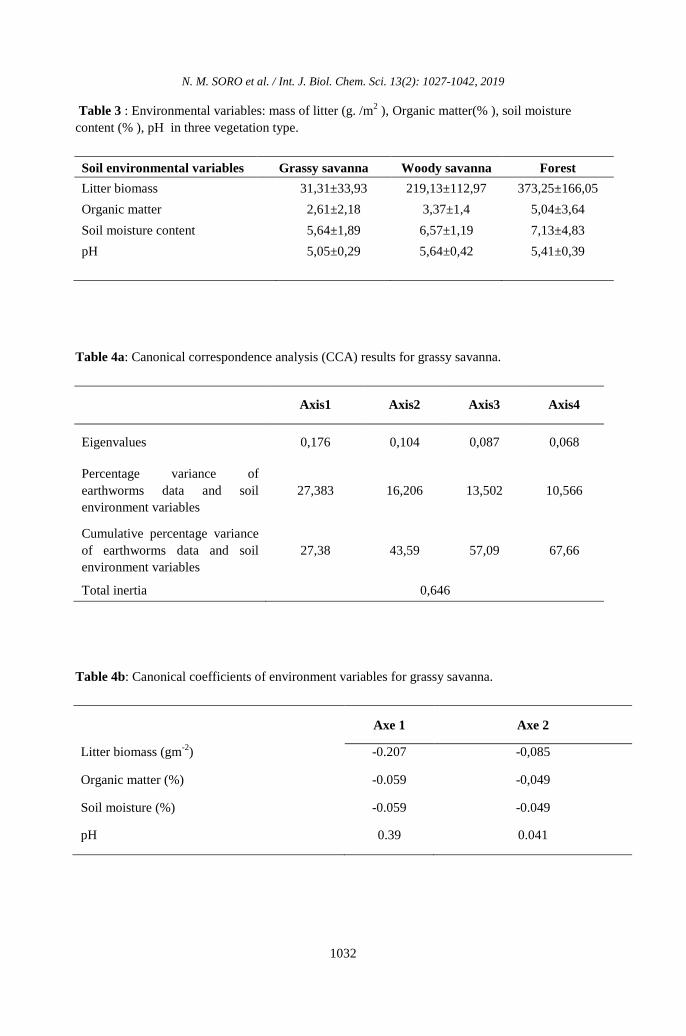
Effect of environmental variables on
species distribution by habitat type
Three soil environment variables (litter
biomass, proportion of organic matter, soil
moisture content and soil pH) were measured.
The litter biomass, organic matter and soil
moisture content were high in forest following
by woody savanna. Grassy savanna had low
litter biomass, organic matter and soil
moisture content (Table 3).
Effect of environmental variables on
species distribution
Four environmental variables (Biomass
of litter, organic matter, soil moisture and soil
pH) were measured.
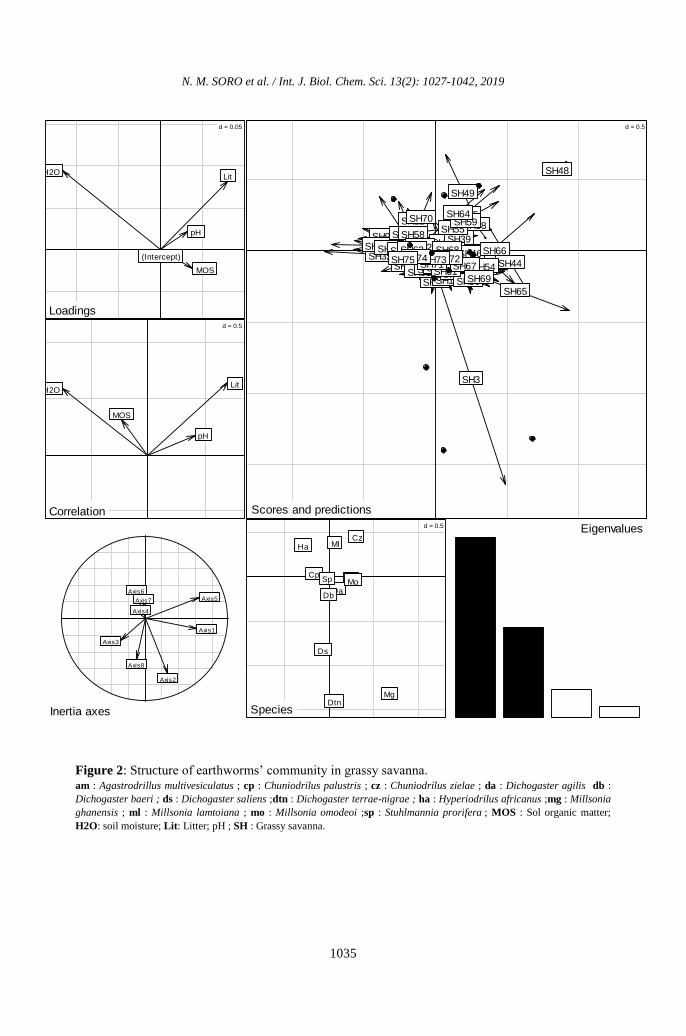
Grassy savanna
The proportion explained by the
relationship between earthworms and
environmental variables was 43.59% (Table
4a). The canonical coefficients of the
environmental variables are presented in
Table 4b and the scores of each earthworm
species in Table 4c. The first four axes of the
canonical correspondence analysis (CCA)
explain 67.66% of the variability of the
species. The axis1 formed by the gradient of
soil moisture and organic matter explains to
27.38 the variance of earthworms. The axis 2
formed by the gradient of pH and litter
explains to 16.21% the variance of
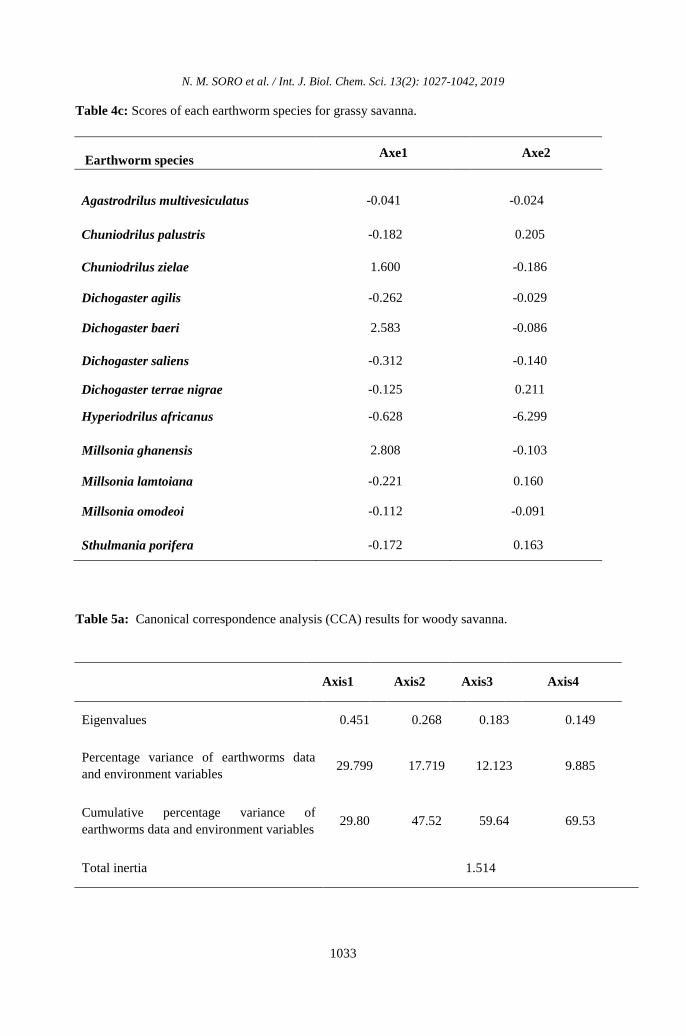
earthworms. The earthworm species that form
the axis1 are Agastrodrillus multivesiculatus,
Chuniodrilus palustris, Dichogaster agilis,
Millsonia omodeoi, Stuhlmannia proriferaand
the earthworm species that form the axis 2 are
Dichogaster baeri, Dichogaster saliens,
Dichogaster terrae-nigrae, Millsonia
lamtoiana (Figure 2).
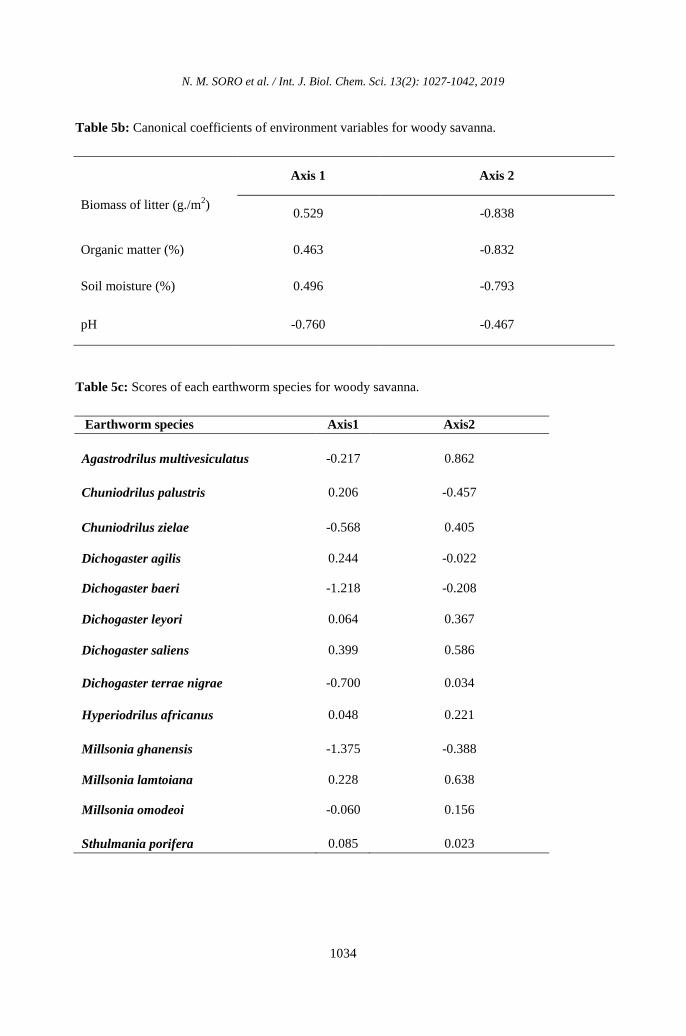
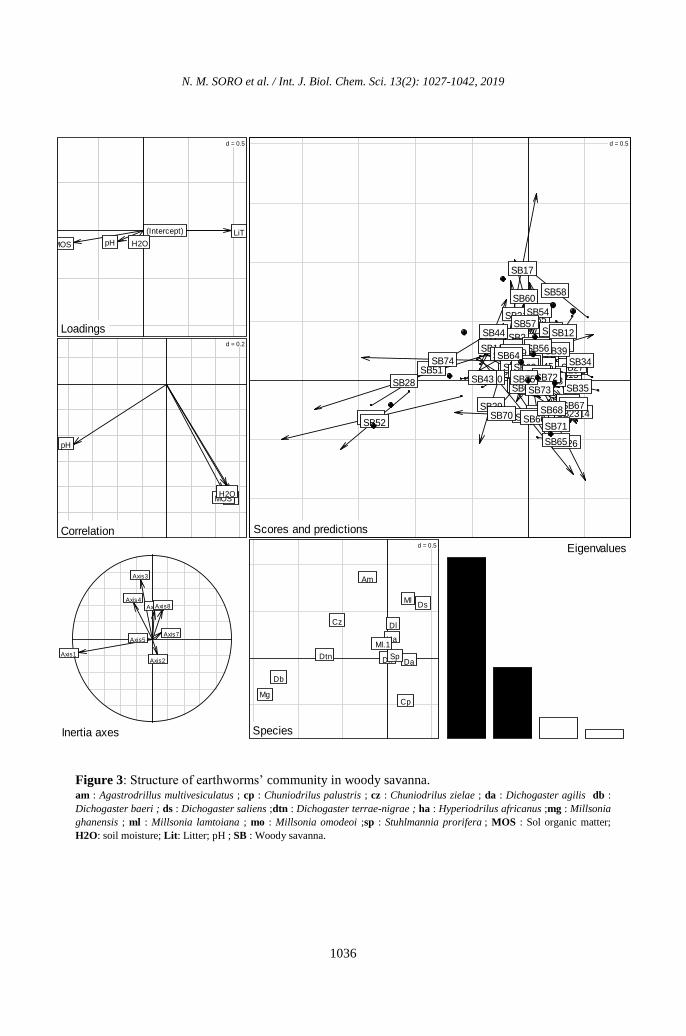
Woody savanna
The variance explained by the
relationship between earthworms and
environmental parameters was 47.52% (Table
5a). The canonical coefficients of the
environmental variables are presented in
Table 5b and the scores of each earthworm
species in Table 5c.The first four axes of the
canonical correspondence analysis (CCA)
explain 69.53% of the variability of the
species Axis 1 explains at 29.80% and axis 2
at 17.72% the correlation between
environmental parameters and earthworms.
The parameters related to the axis 1 are the
pH, the litter and the water content and the
axis 2 by the gradient of the organic matter.
The earthworms forming axis 1 are:
Dichogaster baeri, Dichogaster terrae nigrae,
Dichogaster agilis, Dichogaster leyori,
Chuniodrilus zielae, Millsonia ghanensis,
Sthulmania porifera, Hyperiodrilus africanus
and Millsonia omodeoi. Agastrodrilus
multivesiculatus and Chuniodrilus palustris
form axis 2 (Figure 3).
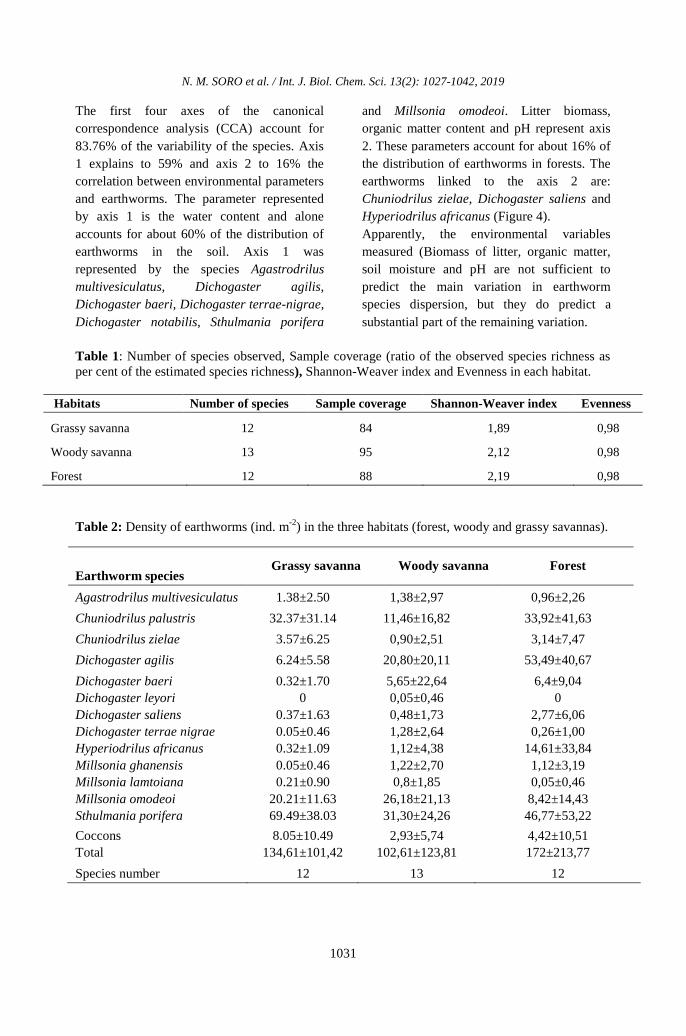
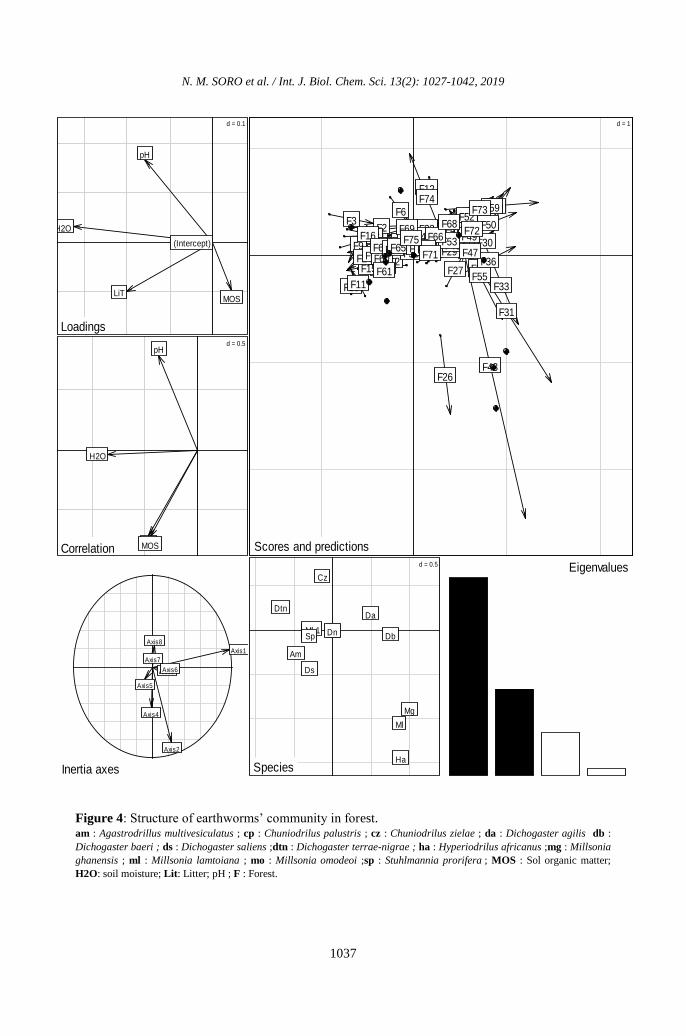
Forest
The proportion explained by the
relationship between earthworms and
environmental parameters was 75% (Table
6a). The canonical coefficients of the
parameters are presented in Table 6b and the
scores of each earthworm species in Table 6c.
N. M. SORO et al. / Int. J. Biol. Chem. Sci. 13(2): 1027-1042, 2019
1031
The first four axes of the canonical
correspondence analysis (CCA) account for
83.76% of the variability of the species. Axis
1 explains to 59% and axis 2 to 16% the
correlation between environmental parameters
and earthworms. The parameter represented
by axis 1 is the water content and alone
accounts for about 60% of the distribution of
earthworms in the soil. Axis 1 was
represented by the species Agastrodrilus
multivesiculatus, Dichogaster agilis,
Dichogaster baeri, Dichogaster terrae-nigrae,
Dichogaster notabilis, Sthulmania porifera
and Millsonia omodeoi. Litter biomass,
organic matter content and pH represent axis
2. These parameters account for about 16% of
the distribution of earthworms in forests. The
earthworms linked to the axis 2 are:
Chuniodrilus zielae, Dichogaster saliens and
Hyperiodrilus africanus (Figure 4).
Apparently, the environmental variables
measured (Biomass of litter, organic matter,
soil moisture and pH are not sufficient to
predict the main variation in earthworm
species dispersion, but they do predict a
substantial part of the remaining variation.
Table 1: Number of species observed, Sample coverage (ratio of the observed species richness as
per cent of the estimated species richness), Shannon-Weaver index and Evenness in each habitat.
Habitats Number of species Sample coverage Shannon-Weaver index Evenness
Grassy savanna 12 84 1,89 0,98
Woody savanna 13 95 2,12 0,98
Forest 12 88 2,19 0,98
Table 2: Density of earthworms (ind. m-2
) in the three habitats (forest, woody and grassy savannas).
Earthworm species Grassy savanna Woody savanna Forest
Agastrodrilus multivesiculatus 1.38±2.50 1,38±2,97 0,96±2,26
Chuniodrilus palustris 32.37±31.14 11,46±16,82 33,92±41,63
Chuniodrilus zielae 3.57±6.25 0,90±2,51 3,14±7,47
Dichogaster agilis 6.24±5.58 20,80±20,11 53,49±40,67
Dichogaster baeri 0.32±1.70 5,65±22,64 6,4±9,04
Dichogaster leyori 0 0,05±0,46 0
Dichogaster saliens 0.37±1.63 0,48±1,73 2,77±6,06
Dichogaster terrae nigrae 0.05±0.46 1,28±2,64 0,26±1,00
Hyperiodrilus africanus 0.32±1.09 1,12±4,38 14,61±33,84
Millsonia ghanensis 0.05±0.46 1,22±2,70 1,12±3,19
Millsonia lamtoiana 0.21±0.90 0,8±1,85 0,05±0,46
Millsonia omodeoi 20.21±11.63 26,18±21,13 8,42±14,43
Sthulmania porifera 69.49±38.03 31,30±24,26 46,77±53,22
Coccons 8.05±10.49 2,93±5,74 4,42±10,51
Total 134,61±101,42 102,61±123,81 172±213,77
Species number 12 13 12
N. M. SORO et al. / Int. J. Biol. Chem. Sci. 13(2): 1027-1042, 2019
1032
Table 3 : Environmental variables: mass of litter (g. /m2 ), Organic matter(% ), soil moisture
content (% ), pH in three vegetation type.
Soil environmental variables Grassy savanna Woody savanna Forest
Litter biomass 31,31±33,93 219,13±112,97 373,25±166,05
Organic matter 2,61±2,18 3,37±1,4 5,04±3,64
Soil moisture content 5,64±1,89 6,57±1,19 7,13±4,83
pH 5,05±0,29 5,64±0,42 5,41±0,39
Table 4a: Canonical correspondence analysis (CCA) results for grassy savanna.
Axis1 Axis2 Axis3 Axis4
Eigenvalues 0,176 0,104 0,087 0,068
Percentage variance of
earthworms data and soil
environment variables
27,383 16,206 13,502 10,566
Cumulative percentage variance
of earthworms data and soil
environment variables
27,38 43,59 57,09 67,66
Total inertia 0,646
Table 4b: Canonical coefficients of environment variables for grassy savanna.
Axe 1 Axe 2
Litter biomass (gm-2
) -0.207 -0,085
Organic matter (%) -0.059 -0,049
Soil moisture (%) -0.059 -0.049
pH 0.39 0.041
N. M. SORO et al. / Int. J. Biol. Chem. Sci. 13(2): 1027-1042, 2019
1033
Table 4c: Scores of each earthworm species for grassy savanna.
Earthworm species Axe1 Axe2
Agastrodrilus multivesiculatus
-0.041 -0.024
Chuniodrilus palustris -0.182 0.205
Chuniodrilus zielae 1.600 -0.186
Dichogaster agilis -0.262 -0.029
Dichogaster baeri 2.583 -0.086
Dichogaster saliens -0.312 -0.140
Dichogaster terrae nigrae -0.125 0.211
Hyperiodrilus africanus -0.628 -6.299
Millsonia ghanensis 2.808 -0.103
Millsonia lamtoiana -0.221 0.160
Millsonia omodeoi -0.112 -0.091
Sthulmania porifera -0.172 0.163
Table 5a: Canonical correspondence analysis (CCA) results for woody savanna.
Axis1 Axis2 Axis3 Axis4
Eigenvalues 0.451 0.268 0.183 0.149
Percentage variance of earthworms data
and environment variables 29.799 17.719 12.123 9.885
Cumulative percentage variance of
earthworms data and environment variables 29.80 47.52 59.64 69.53
Total inertia 1.514
N. M. SORO et al. / Int. J. Biol. Chem. Sci. 13(2): 1027-1042, 2019
1034
Table 5b: Canonical coefficients of environment variables for woody savanna.
Axis 1 Axis 2
Biomass of litter (g./m2)
0.529 -0.838
Organic matter (%) 0.463 -0.832
Soil moisture (%) 0.496 -0.793
pH -0.760 -0.467
Table 5c: Scores of each earthworm species for woody savanna.
Earthworm species Axis1 Axis2
Agastrodrilus multivesiculatus
-0.217 0.862
Chuniodrilus palustris 0.206 -0.457
Chuniodrilus zielae -0.568 0.405
Dichogaster agilis 0.244 -0.022
Dichogaster baeri -1.218 -0.208
Dichogaster leyori 0.064 0.367
Dichogaster saliens 0.399 0.586
Dichogaster terrae nigrae -0.700 0.034
Hyperiodrilus africanus 0.048 0.221
Millsonia ghanensis -1.375 -0.388
Millsonia lamtoiana 0.228 0.638
Millsonia omodeoi -0.060 0.156
Sthulmania porifera 0.085 0.023
N. M. SORO et al. / Int. J. Biol. Chem. Sci. 13(2): 1027-1042, 2019
1035
Figure 2: Structure of earthworms’ community in grassy savanna. am : Agastrodrillus multivesiculatus ; cp : Chuniodrilus palustris ; cz : Chuniodrilus zielae ; da : Dichogaster agilis db :
Dichogaster baeri ; ds : Dichogaster saliens ;dtn : Dichogaster terrae-nigrae ; ha : Hyperiodrilus africanus ;mg : Millsonia
ghanensis ; ml : Millsonia lamtoiana ; mo : Millsonia omodeoi ;sp : Stuhlmannia prorifera ; MOS : Sol organic matter;
H2O: soil moisture; Lit: Litter; pH ; SH : Grassy savanna.
d = 0.05
Loadings
d = 0.05
(Intercept)
Lit
MOS
H2O
pH
Loadings d = 0.5
Correlation
d = 0.5
Lit
MOS
H2O
pH
Correlation
Axis1
Axis2
Axis3
Axis4
Axis5 Axis6
Axis7
Axis8
Inertia axes
d = 0.5
Scores and predictions
SH1
SH2
SH3
SH4 SH5 SH6
SH7
SH8
SH9 SH10
SH11
SH12 SH13
SH14
SH15 SH16 SH17
SH18 SH19
SH20
SH21
SH22 SH23
SH24 SH25
SH26 SH27
SH28 SH29
SH30
SH31
SH32 SH33
SH34
SH35 SH36
SH37
SH38
SH39
SH40
SH41
SH42
SH43
SH44
SH45
SH46
SH47
SH48
SH49
SH50
SH51 SH52
SH53 SH54
SH55 SH56
SH57
SH58
SH59
SH60
SH61
SH62 SH63
SH64
SH65
SH66
SH67
SH68
SH69
SH70
SH71 SH72 SH73 SH74 SH75
d = 0.5
Species
Ag Cp
Cz
Da Db
Ds
Dtn
Ha
Mg
Ml
Mo Sp
Eigenvalues
N. M. SORO et al. / Int. J. Biol. Chem. Sci. 13(2): 1027-1042, 2019
1036
Figure 3: Structure of earthworms’ community in woody savanna. am : Agastrodrillus multivesiculatus ; cp : Chuniodrilus palustris ; cz : Chuniodrilus zielae ; da : Dichogaster agilis db :
Dichogaster baeri ; ds : Dichogaster saliens ;dtn : Dichogaster terrae-nigrae ; ha : Hyperiodrilus africanus ;mg : Millsonia
ghanensis ; ml : Millsonia lamtoiana ; mo : Millsonia omodeoi ;sp : Stuhlmannia prorifera ; MOS : Sol organic matter;
H2O: soil moisture; Lit: Litter; pH ; SB : Woody savanna.
d = 0.5
Loadings
d = 0.5
(Intercept) LiT
MOS H2O pH
Loadings d = 0.2
Correlation
d = 0.2
LiT MOS H2O
pH
Correlation
Axis1 Axis2
Axis3
Axis4
Axis5
Axis6
Axis7
Axis8
Inertia axes
d = 0.5
Scores and predictions
SB1 SB2
SB3
SB4
SB5
SB6
SB7
SB8
SB9 SB10
SB11
SB12
SB13
SB14
SB15 SB16
SB17
SB18 SB19 SB20
SB21 SB22
SB23
SB24 SB25
SB26
SB27
SB28
SB29
SB30
SB31
SB32 SB33
SB34
SB35
SB36
SB37
SB38 SB39
SB40
SB41 SB42 SB43
SB44
SB45
SB46
SB47
SB48 SB49
SB50 SB51
SB52
SB53
SB54
SB55
SB56
SB57
SB58
SB59
SB60
SB61
SB62
SB63
SB64
SB65
SB66
SB67 SB68
SB69
SB70 SB71
SB72
SB73
SB74
SB75
d = 0.5
Species
Am
Cp
Cz
Da
Db
Dl
Dn
Ds
Dtn
Ha
Mg
Ml
Ml.1
Sp
Eigenvalues
N. M. SORO et al. / Int. J. Biol. Chem. Sci. 13(2): 1027-1042, 2019
1037
Figure 4: Structure of earthworms’ community in forest. am : Agastrodrillus multivesiculatus ; cp : Chuniodrilus palustris ; cz : Chuniodrilus zielae ; da : Dichogaster agilis db :
Dichogaster baeri ; ds : Dichogaster saliens ;dtn : Dichogaster terrae-nigrae ; ha : Hyperiodrilus africanus ;mg : Millsonia
ghanensis ; ml : Millsonia lamtoiana ; mo : Millsonia omodeoi ;sp : Stuhlmannia prorifera ; MOS : Sol organic matter;
H2O: soil moisture; Lit: Litter; pH ; F : Forest.
d = 0.1
Loadings
d = 0.1
(Intercept)
LiT MOS
H2O
pH
Loadings d = 0.5
Correlation
d = 0.5
LiT MOS
H2O
pH
Correlation
Axis1
Axis2
Axis3
Axis4
Axis5
Axis6
Axis7
Axis8
Inertia axes
d = 1
Scores and predictions
F1 F2
F3
F4
F5
F6
F7 F8 F9
F10 F11
F12
F13 F14
F15
F16
F17 F18 F19
F20 F21
F22
F23
F24 F25
F26
F27
F28 F29 F30
F31
F32
F33
F34 F35
F36
F37
F38
F39
F40 F41 F42
F43
F44 F45
F46 F47
F48 F49 F50
F51
F52
F53
F54
F55
F56 F57
F58
F59
F60
F61
F62 F63
F64 F65
F66 F67
F68 F69
F70 F71
F72
F73 F74
F75
d = 0.5
Species
Am
Cp
Cz
Da
Db Dl Dn
Ds
Dtn
Ha
Mg
Ml
Ml.1 Sp
Eigenvalues
N. M. SORO et al. / Int. J. Biol. Chem. Sci. 13(2): 1027-1042, 2019
1038
DISCUSSION
Vegetation type and litter biomass
All vegetation types have the same
equitability value and the same Shannon-
Wiever diversity index value. This finding
could be explained by a probable stochastic
process that create a sampling biases
including the sampling period. In the rainy
season, rainfall conditions favor survival,
fertility and the growth of earthworms (Lee,
1985; Pelosi, 2008). Sampling takes place in
the rainy season at this time of year all the
earthworms have good reproduction (Vigot
and Cluzeau, 2014). In the rainy season the
earthworms rise to the surface and therefore
accessible to capture. This considerably
reduces the sampling effort whatever the type
of habitat. According to Rocklin (2003),
Shannon-Weaver's diversity indices are very
sensitive to sampling effort. The woody
savanna contains more species of earthworms
followed by grassy savanna and forest with
the same number of species. The floristic
surveys have shown that the grassy savanna
consists mainly of grasses, the woody savanna
with grasses and trees both, the forest of trees
mainly. Ramanujam et al. (2000) noted that
vegetation type influences the diversity and
distribution of earthworms. The fact that
grasses and trees coexists in woody savanna
provides a variability of food resources. This
heterogeneity of vegetation is a source of
variability of microhabitats beneficial to the
appearance of species. This result is
corroborated by the work of Decaens et al.
(1994), who reported that the more habitat
there is the greater the number of species.
Mathieu et al. (2010) reported that
earthworms prefer habitats to optimum
environmental conditions. These conditions
affect the welfare of earthworms (Lowe and
Butt, 2005).
The biomass of litter is high in forest
(373, 25±166, 05 g. /m2). It is moderately high
in woody savanna (219, 13±112, 97 g./m2)
and very low in grassy savanna (31, 31±33, 93
g. /m2).
The difference between litter
biomasses in different habitats could be
explained by the unequal density and diversity
of plants in these habitats. The vegetation
cover of each habitat is mainly at the origin of
the litter of this habitat. The low litter biomass
observed in grassy savanna may be due to the
topographic position of grassy savanna. The
grassy savanna is located at the top of the
slope during the rains the soils are leached
thus causing the loss of a quantity of litter.
Grassy savanna is burned annually in mid-
January. As it passes, the fire consumes
everything making the soil empty and thus
contributes to the reduction of the litter. In
grassy savanna, we also noticed during our
sampling that the vegetation is covered with
clumps of grasses but the soil is empty.
In woody savanna, the vegetation is
mixed (it is composed of grasses and trees).
The amount of litter biomass is certainly due
to this mixture (Hagedorn et al., 2008). These
savannas also undergo the action of fire,
which can reduce the amount of litter.
In the forest, the amount of litter is
high. This could be explained by the fact that
in the forest there are more large trees that
produce large amounts of bedding on the soil
surface. Also the vegetal cover contributes to
reduce the effects of erosion thus allowing
maintenance of the litter on the surface of the
ground.
Earthworms’ density in relation to organic
matter and soil moisture content, and pH
Whatever type of habitat is sampled,
the canonical correspondence analysis show
that soil moisture influences the earthworm
community. Bouché (1972) showed that water
represents about 86% of the weight of
earthworms. This shows the vital importance
of water in their dynamics. Also our sampling
took place in the rainy season. At this season,
rainfall conditions favor survival, fertility and
the growth of earthworms (Lee, 1985; Pelosi,
2008), thus enabling good reproduction of
earthworms (Vigot and Cluzeau, 2014). The
high density of earthworms observed is due to
the fact that in forest, canopy cover of tree
helps to keep forest soils more humid.
The canonical correspondence analysis
show that, in grassy savanna organic matter
also influences earthworms. The low density
N. M. SORO et al. / Int. J. Biol. Chem. Sci. 13(2): 1027-1042, 2019
1039
of earthworms in grassy savanna is therefore
due to the low organic matter content in the
soils of grassy savannas because lower
organic matter soils do not support high
densities of earthworms (Edwards and
Bohlen, 1996). So the density of earthworms
increases with the organic matter content
(Valchovski, 2016).
In woody savanna, earthworms
community is explain by the pH, the biomass
of litter in addition to water. Our results show
that the density of earthworms is slow in
woody savanna. The pH mean of woody
savanna is 5, 64±0, 42. This value is within
the pH range proposed by Satchell (1967)
which is 5.0 to 7.4. The low density of
earthworms is related to the quality of litter
founded in woody savanna. This corroborates
the findings of Manna et al. (2003) who
determined that the different forest litter
materials used during decomposition affected
the survival and reproduction rates of the
species of earthworm.
In general, the canonical
correspondence analysis shows that soil
environment variables account for 67.66% of
the variance of earthworms in grassy savanna,
69.53% in woody savannah and 83.76% in
forest. The unexplained variance may be due
to the phenomenon of competition (Ettema
and Wardle, 2002), that is to a
complementarity between the niches
(Ehouman, 2012), interspecific relationships
(Ehouman, 2012), the presence of predators
(Edwards and Lofty, 1977; Lee, 1985), the
type of vegetation (Ramanujam et al., 2000)
their reproductive potential and competition
(Ettema and Wardle, 2002) or the gregarious
behavior of earthworms (Rossi and Lavelle,
1998) or fire because in Lamto the savannas
are burned annually in mid-January. Fire can
act directly on earthworms epigeic species or
indirectly on endogenous species and thus
contributes to modifying the composition of
the structure of earthworms found in grassy
and woody savannas. According to Lavelle
(1978), some reach their maximum of
reproduction in October (end of the rainy
season) and its minimum between December
and January. The firing takes place in mid-
January when these species are still vulnerable
and therefore very sensitive to fire. Mutualism
with other soil organisms can also explain the
distribution of earthworms in the soil (Trigo et
al., 1999).
Conclusion
This study has provided new
information regarding the effects of abiotic
factors of soil on diversity and distribution of
earthworms species. In this study, the
structure of the earthworms’ communities
varies according to the type of vegetation and
the soil parameters. The woody savanna
contained the greatest number of earthworm
species followed by the grassy savanna and
the forest that had the same number of
species. Litter biomass, soil moisture and
organic matter contents are higher in forest
followed by woody and grassy savannas. The
forest has the highest density of earthworms.
It is followed by grassy and woody savannas.
The moisture of soil influence the distribution
of earthworm in forest. In grassy savanna the
distribution of earthworm depends on soil
moisture and organic matter. In woody
savanna, the distribution of earthworm
depends on soil moisture, pH and biomass of
litter.
COMPETING INTERESTS
The authors declare that they have no
competing interests.
AUTHORS’ CONTRIBUTIONS
This work was carried out in
collaboration between all authors. NMS
collected the data. NME analyzed the data.
NMS and NME wrote the first draft of the
manuscript. TM and TS contributed in reading
and correcting the manuscript for the final
version before submission. All authors read
and approved the final manuscript.
ACKNOWLEDGMENTS
The authors wish to express their
thanks to Professor Kolo YEO, Director of the
Ecology Research Station of Lamto for the
material and logistical support in the
realization of this study. We also thank
N. M. SORO et al. / Int. J. Biol. Chem. Sci. 13(2): 1027-1042, 2019
1040
Professor Souleymane Konaté, Director of
Ecology and Biodiversity Research Unit of
Nangui Abrogoua University, for the moral
and material support he has given us.
REFERENCES
Baize D. 2000. Guide des Analyses en
Pédologie: Techniques et Pratiques.
Editions INRA : Paris ; 260 p.
Bouché MB. 1972. Lombrics de France,
Ecologie et systématique, Institut
national de la recherche Agronomique,
Annales de Zoologie-Animal Ecology.
No hors série, Paris, 671P. Paris.
Csuzdi C, Tondoh JE. 2007. New and little‐
known earthworm species from the Ivory
Coast (Oligochaeta:
Acanthodrilidae: Benhamiinae and
Eudrilidae). Journal of Natural History,
41: 2551-2567. DOI:
https://doi.org/10.1080/00222930701742
629.
Decaëns T, Lavelle P, Jiménez Jaen JJ,
Escobar G, Rippstein G. 1994. Impact of
land management on soil macrofauna in
the Oriental Llanos of Colombia. Eu. J.
Soil Bid., 30(4): 157-168.
Decaens T, Jiminez J. 2002. Earthworm
communities under an agricultural
intensification gradient in Colombia.
Plant and Soil, 240: 133-143. DOI:
http/dx.doi.org/10.1023/A:10158446106
04
Edwards CA, Lofty JR. 1977. Biology of
Earthworms (2nd edn). Chapman and
Hall: London; 495p.
Edwards CA, Bohlen PJ. 1996. Biology and
Ecology of Earhworms (3rd
edn).
Chapman and Hall: London; 300p.
Ehouman NM, Tiho S, Dagnogo M. 2012. Co-
occurrence of earthworms in Lamto
savanna: A null model analysis of
community structure. European Journal
of Soil Biology, 53 : 40-47. DOI:
http://dx.doi.org/10.1016/j.ejsobi.2012.0
8.007.
Empwal FM, Lemtiri A, Manzanza CK, Sudi
CK, Komanda JA, Yeto EBW, Francis F.
2017. Abondance et diversité des
communautés lombriciennes dans la
Réserve et Domaine de Chasse de
Bombo-Lumene (Kinshasa). Int. J. Biol.
Chem. Sci., 11(1): 387-396.
http://ajol.info/index.php/ijbcs
Ettma CH, Wardle DA. 2002. Spatial soil
ecology. Trends Ecology Evolution,
17(4): 177-183. DOI:
http://dx.doi.org/10.1016/S0169-5347
(02)02496-5
Fokam Z, Nana PA, Bricheux G, Vigues B,
Bouchard P, Ngassam P, Sime-ngando
T. 2016. Correlation between some
environmental variables and abundance
of Almophrya mediovacuolata
(Ciliophora: Anoplophryidae)
endocommensal ciliate of an anecic
earthworms (Oligochaeta: Annelida) in
Bambui (North-West Cameroon). Int. J.
Biol. Chem. Sci., 10(5): 1983-1997.
http://ajol.info/index.php/ijbcs
Gastine A, Scherer-Lorenzen M, Leadley P.
2003. No consistent effects of plant
diversity on root biomass, soil biota and
soil abiotic conditions in temprerate
grassland communties. Applied Soil
Ecology, 24(3): 101-111. DOI:
http//hdl.handle.net/11858/00-001M-
0000000E-D04-3
Gonzalez G, Garcia E, Cruz V, Boges S,
Zalamea M and Rivera M M. 2007.
Earthworm communities along an
elevation gradient in North eastern
Puerto Rico. Europ. J. Soil Biol., 43: 24-
32. DOI: 10.1016/j.ejsobi.2007.08.044
Hagedorn F, Van Hees PAW, Handa IT, Hätte
nschwiler S. 2008. Elevated atmospheric
CO2 fuels leaching of old dissolved orga
nic matter at the alpine treeline. Global B
iogeochemical Cycles, 22. DOI:
10.1029/2007GB003026.
Jongman RHG, Ter Braak C, Van Tongeren
OFR. 1995. Data analysis in community
and landscape ecology. Cambridge
university press. Biometrics, 46(1). DOI:
10.2307/2531665.
Koné AW, Edoukou EF, Gonnety JT, N’dri
ANA, Assemien LFE, Angui PKT,
Tondoh J. 2012. Can the shrub
Chromolaena odorata (Asteraceae) be
considered as improving soil biology and
N. M. SORO et al. / Int. J. Biol. Chem. Sci. 13(2): 1027-1042, 2019
1041
plant nutrient availability? Agroforest
Syst, 85: 233–245. DOI:
10.1007/s10457-012-9497-5
Lalthanzara H, Ramanujam SN, Jha LK.
2011. Population dynamics of
earthworms in relation to soil physico-
chemical parameters in groforestry
systems of Mizoram, India. J Environ
Biol, 32(5): 599–605. DOI :
www.jeb.co.in.
Lavelle P. 1978. Les vers de terre de la savane
de Lamto (Côte d’ivoire) : peuplements,
populations et fonctions dans
l’écosysteme. Doctorat thesis, University
paris VI. 301 p.
Lebreton JD, Chessel D, Richardot-Coolet M,
Yoccoz N. 1988. L’analyse des relations
espèces - milieu par l’analyse canonique
des correspondances. I. variable de
milieux quantitatifs. Acta Oecologia
Oecology Generalis, 9(2): 137-151.
Lee KE. 1985. Earthworms, Their Ecology
and Relationships with Soils and Land
Use. Academic Press: New York; 411p.
Lowe CN, Butt KR. 2005. Culture techniques
for soil dwelling earthworms: a review.
Pedobiologia, 49(5): 401-413. DOI:
https://doi.org/10.1016/j.pedobi.2005.04.
005.
Manna MC, Jha S, Ghosh PK, Acharya CL.
2003. Comparative efficacy of three
epigeic earthworms under different
deciduous forest litters decomposition.
Bioresource Technology, 88(3): 197–
206.
Mathieu J, Barot, Blouin M, Caro G,
Decaëns T, Dubs F, Dupont L, Jouquet
P, Nai P. 2010. Habitat quality,
conspecific density, and habitat pre-use
affect the dispersal behaviour of two
earthworm species, Aporrectodea
icterica and Dendrobaena veneta, in a
mesocosm experiment. Soil Biology &
Biochemistry, 42: 203-209. DOI:
10.1016/j.soilbio.2009.10.018.
Milau F, Kachaka S, Aloni K, Mvumbi M,
Francis F. 2015. Incidence de la
déforestation sur les catégories
écologiques des vers de terre dans le
domaine et Reserve de Chasse de Bombo
Lumene (Kinshasa). Tropicultura, 33(3):
209-217. DOI:
http://hdl.handle.net/2268/186532
Pelosi C. 2008. Modelisation de la dynamique
d'une population de vers de terre
Lumbricus terrestris au champ. Institut
des sciences et industries du vivant et de
l'environnement, thèse de doctorat, Paris,
France , 95pp.
Moreno MT, Audesse P, Giroux M, Frenette
N, Cescas M. 2001. Comparaison entre
la détermination de la matière organique
des sols par la méthode de Walkley-
black et la méthode de perte au
feu. Agrosol , 12(1): 49-58.
Rajkhowa DJ, Bhattacharyya PN, Sarma AK
and Mahanta K. 2014: Diversity and
distribution of Earthworms in different
soil habitats of Assam, North-East India,
an Indo-Burma Biodiversity Hotspots.
Proc. Natl. Acad. Sci., India, Sect. B
Biol. Sci. DOI: 10.1007/s40011-014-
0380-1
Ramanujam SN, Roy B, Jha LK. 2000.
Inventory studies on the earthworm
population in agroforestry systems of
Mizoram. Proc. Intl. Workshop on
agroforestry and forest products, Aizawl.
pp. 191-194.
Rocklin D. 2003. Etude comparative de
différents indices de diversité (indice de
Shannon, indices taxonomiques) sur les
peuplements de poissons lagunaires.
Mémoire d’Initiation à la Recherche.
Maîtrise de Biologie des Populations et
des Ecosystèmes. Université de
Montpellier II Sciences et Techniques.
Rossi JP, Lavelle P. 1998. Earthworm
aggregation in the savanna of Lamto
(Côte d'Ivoire). Applied Soil Ecology,7:
195-199.13.
Satchell JE. 1967. Lumbricidae. In Soil
Biology, Burges A, Raw F (eds).
Academic Press: London; 259-322. 93.
Savadogo OM, Ouattara K, Ouedraogo I,
Kaboré SS, Traoré M, Barron J, Gordon
L, Paré S, Zombré NP. 2016. Vegetation
improvement and soil biological quality
in the Sahel of Burkina Faso. Int. J. Biol.
N. M. SORO et al. / Int. J. Biol. Chem. Sci. 13(2): 1027-1042, 2019
1042
Chem. Sci., 10(3): 1048-1058.
http://ajol.info/index.php/ijbcs.
Scullion J, Malik A. 2000. Earthworm activity
affecting organic matter, aggregation and
microbial activity in soils restored after
open cast mining for coal: Soil Biology
and Biochemistry, 32: 119-126. DOI:
https://doi.org/10.1016/S0038-
0717(99)00142-X
Singh S, Singh J, Pal Vig A. 2016. Effect of
abiotic factors on the distribution of
earthworms in different land use
patterns. The Journal of Basic & Applied
Zoology, 74: 41-50 DOI:
https://doi.org/10.1016/j.jobaz.2016.06.0
01
Traoré M, Lompo F, Ayuke F, Ouattara B,
Ouattara K, Sedogo M. 2012. Influence
des pratiques agricoles sur la macrofaune
du sol : cas de l’enfouissement de la
paille et du fumier. Int. J. Biol. Chem.
Sci., 6(4): 1761-1773. DOI:
http://dx.doi.org/10.4314/ijbcs.v6i4.31
Trigo D, Barois I, Garvin MH, Huerta E,
Irisson S, Lavelle P. 1999. Mutualism
between earthworms and soil microflora.
Pedobiologia, 43(6): 866-873. DOI:
http://www.documentation.ird.fr/hor/fdi:
010021122
Tripathi G, Bhardwaj P. 2004. Earthworm
diversity and habitat preferences in arid
regions of Rajasthan. Zoo’s Print J.,
19 (7): 1515-1519. DOI :
http://dx.doi.org/10.11609/JoTT.ZPJ.107
4.1515-9
Valchovski H. 2016. Influence of Soil
Organic Matter Content on Abundance
and Biomass of Earthworm
(Oligochaeta: Lumbricidae) Populations.
ECOLOGIA BALKANICA, 8(1): 107-
110. DOI: http://web.uni-
plovdiv.bg/mollov/EB/2016_vol8_iss1/1
07-110_eb.16116.
Vigot M, Cluzeau D. 2014. Les vers de terre.
Chambre d’Agriculture de la Vienne,
Vienne ; 10p.