Embed Size (px)
Citation preview

Walden UniversityScholarWorks
Walden Dissertations and Doctoral Studies Walden Dissertations and Doctoral StudiesCollection
2018
Effects of Income Level on the RelationshipBetween Leadership and Employee BehaviorAndrew James ShermanWalden University
Follow this and additional works at: https://scholarworks.waldenu.edu/dissertations
Part of the Business Administration, Management, and Operations Commons, ManagementSciences and Quantitative Methods Commons, and the Organizational Behavior and TheoryCommons
This Dissertation is brought to you for free and open access by the Walden Dissertations and Doctoral Studies Collection at ScholarWorks. It has beenaccepted for inclusion in Walden Dissertations and Doctoral Studies by an authorized administrator of ScholarWorks. For more information, pleasecontact [email protected].

Walden University
College of Management and Technology
This is to certify that the doctoral dissertation by
Andrew Sherman
has been found to be complete and satisfactory in all respects, and that any and all revisions required by the review committee have been made.
Review Committee Dr. Steven Tippins, Committee Chairperson, Management Faculty
Dr. David Banner, Committee Member, Management Faculty Dr. Sunil Hazari, University Reviewer, Management Faculty
Chief Academic Officer Eric Riedel, Ph.D.
Walden University 2018

Abstract
Effects of Income Level on the Relationship Between Leadership and Employee
Behavior
by
Andrew J. Sherman
MS, Western Carolina University, 2012
BS, Auburn University, 2004
Dissertation Submitted in Partial Fulfillment
of the Requirements for the Degree of
Doctor of Philosophy
Management
Walden University
May 2018

Abstract
Previous research has indicated that leadership affects employee behavior, but additional
research could explain how this relationship is mediated. The purpose of this
correlational, quantitative design study was to test the mediating effects of employee
income level on the relationship between leadership and employee behavior within the
United States. The general problem for leaders is the lack of a comprehensive
understanding regarding the relationship between their leadership and employee
behavioral outcomes. The specific management problem is that unintended employee
behavioral outcomes may be due to leadership decisions made without consideration
given to the mediating effects of employee income level. Based on Adams’s equity
theory, the primary research question for this study was “How does income level affect
the relationship between leadership and employee behavior?” To answer this question I
collected a dataset of 95 individuals using an online survey through Qualtrics. Income
level was examined as a mediation variable between leadership styles and employee
behavior in this study; however, there was no significant relationship between leadership
and employee behavior present in the dataset. It was hypothesized that income level
partially mediates the relationship between leadership and employee behavior, but the
results indicated that income level does not mediate the relationship between leadership
and employee behavior. This research is relevant to the field of management and has a
positive social change implication because it demonstrates that the understanding
regarding leaders and employees may not be as significantly correlated as previously
demonstrated.

Effects of Income Level on the Relationship Between Leadership and Employee
Behavior
by
Andrew J. Sherman
MS, Western Carolina University, 2012
BS, Auburn University, 2004
Dissertation Submitted in Partial Fulfillment
of the Requirements for the Degree of
Doctor of Philosophy
Management
Walden University
May 2018

Dedication
This dissertation is dedicated to my parents, my wife and my two daughters. My
parents, Byron and Deborah Sherman, have always seen my academic potential even
when I did not see it myself. My wife, Katie Sherman has supported me in countless
ways over the last 12 years, and she has been especially supportive of my journey
throughout this dissertation process. Finally, this work is dedicated to my amazing
daughters, Beth Anne and Lainey Sherman. I hope that this dissertation serves as a
reflection of my life-long attempt to lead you by example, and that you will be able to use
this as motivation to achieve your own personal goals in the future.

Acknowledgments
Special thank you to my committee for such great and positive support throughout
the progress of this dissertation. Also, special thanks to my wife Katie who supported me
and pushed me to excellence in all aspects of my life. I would have never been able to
complete this doctoral journey without your support. Thank you to Drs. Saad Hassan and
Masood ul Hassan for permission to expand your research regarding mediation effects on
the relationship between leadership and employee behavior. Your work has inspired me
in both this project and will continue to inspire me in my future research endeavors.

i
Table of Contents
List of Tables .......................................................................................................................v
List of Figures .................................................................................................................... vi
Chapter 1: Introduction to the Study ....................................................................................1
Background of the Study ...............................................................................................3
Problem Statement .........................................................................................................5
Purpose of the Study ......................................................................................................7
Research Questions and Hypotheses .............................................................................8
Theoretical Foundation ..................................................................................................9
Nature of the Study ......................................................................................................10
Motivation for Research ....................................................................................... 13
Definitions....................................................................................................................14
Assumptions .................................................................................................................15
Scope ..........................................................................................................................16
Limitations ...................................................................................................................17
Significance of the Study .............................................................................................17
Significance to Theory .......................................................................................... 18
Significance to Practice......................................................................................... 19
Significance to Social Change .............................................................................. 19
Summary ......................................................................................................................20
Chapter 2: Literature Review .............................................................................................22
Literature Search Strategy............................................................................................23

ii
Theoretical Foundation ................................................................................................25
Predictor Variable: Leadership ............................................................................. 28
Employee Behavior ............................................................................................... 31
Income Level ........................................................................................................ 34
Research Variables.......................................................................................................35
Predictor Variable: Leadership ............................................................................. 35
Criterion Variable: Employee Behavior ............................................................... 37
Mediation Variable: Income Level ....................................................................... 40
Synthesis of Seminal and Current Research ................................................................42
Methodology ................................................................................................................44
Other Relevant Research..............................................................................................47
Controversial Findings .................................................................................................51
Predictor Variable: Leadership ............................................................................. 51
Ethical Leadership ................................................................................................ 52
Empowering Leadership ....................................................................................... 53
Gap Identified in Current Literature ............................................................................54
Summary ......................................................................................................................55
Chapter 3: Research Method ..............................................................................................57
Research Design and Rationale ...................................................................................58
Research Questions ............................................................................................... 58
Methodology ................................................................................................................59
Population ............................................................................................................. 59

iii
Sampling ............................................................................................................... 60
Procedures for Recruitment, Participation, and Data Collection .......................... 60
Instrumentation and Operationalization of Constructs ......................................... 61
Predictor Variables................................................................................................ 62
Criterion Variables ................................................................................................ 64
Mediation Variable ............................................................................................... 66
Data Analysis Plan .......................................................................................................66
Assumptions .......................................................................................................... 67
Analysis................................................................................................................. 69
Threats to Validity .......................................................................................................69
Internal Validity .................................................................................................... 70
External Validity ................................................................................................... 71
Construct Validity ................................................................................................. 71
Ethical Procedures ................................................................................................ 72
Summary ......................................................................................................................73
Chapter 4: Results ..............................................................................................................74
Data Collection ............................................................................................................75
Changes to Data Collection Plan .......................................................................... 75
Representative Sample .......................................................................................... 76
Study Results ...............................................................................................................78
Sampling Accuracy and Reliability ...................................................................... 78
Regression Assumptions ....................................................................................... 80

iv
Linear Regression ................................................................................................. 86
Multiple Linear Regression................................................................................... 88
Findings........................................................................................................................91
Summary ......................................................................................................................93
Chapter 5: Discussion, Conclusions, and Recommendations ............................................94
Interpretation of Findings ............................................................................................96
Limitations of the Study...............................................................................................97
Recommendations ........................................................................................................98
Implications..................................................................................................................99
Conclusions ................................................................................................................100
References ........................................................................................................................102
Appendix A: Author Approvals .......................................................................................117
Appendix B: Survey .........................................................................................................119

v
List of Tables
Table 1. Sample Reliability................................................................................................79
Table 2. Descriptive Statistics............................................................................................80
Table 3. Sample Distribution .............................................................................................81
Table 4. Regression Model–Multicollinearity Test ...........................................................84
Table 5. Homogeneity of Variance Test: Glejser Test ......................................................84
Table 6. Pearson Correlation Coefficients .........................................................................86
Table 7. Leadership and Income Level Regression Model ................................................87
Table 8. Leadership and Income Level Regression Coefficients ......................................87
Table 9. Employee Behavior and Income Level Regression Model .................................87
Table 10. Employee Behavior and Income Level Regression Coefficients ......................88
Table 11. Leadership and Employee Behavior Regression Model ....................................89
Table 12. Leadership and Employee Behavior Regression Coefficients ...........................89
Table 13. Leadership and Employee Behavior Regression Model ....................................90
Table 14. Leadership and Employee Behavior Regression Coefficients ...........................90
Table 15. Two-Block Multiple Regression Model ............................................................91
Table 16. Two-Block Multiple Regression Coefficients ...................................................91

vi
List of Figures
Figure 1. Theoretical framework .........................................................................................9
Figure 2. Research framework ...........................................................................................12
Figure 3. G*Power output for sample size.........................................................................59
Figure 4. Leadership distribution histogram ......................................................................80
Figure 5. Employee behavior distribution histogram ........................................................82
Figure 6. Income level distribution histogram ...................................................................82

1
Chapter 1: Introduction to the Study
One of the most important topics in the field of management is leadership. At its
core, leadership is about generating expected behaviors in followers (Kellerman, 2007).
One of the most important aspects of the relationship between a leader and an employee
is the wage paid to the employee for labor because that income is one of the major
motivational factors for an employee (Adams, 1963). The wages paid to employees is the
largest cost of doing business (U.S. Bureau of Economic Analysis, 2016), and the return
on investments for this cost is of critical importance to business organizations. In this
study, I examined the relationship between leadership and employee behavior by testing
the effect of employee income level on the relationship.
Business leaders and organizations expect positive employee behavioral outcomes
in return for the wages paid, and those positive behavioral outcomes are vital to
organizational success (Czaplewski, Key, & Van Scotter, 2016). As a business leader, I
have been a stakeholder from both the leadership and employee perspective about
investing resources, such as wages, with an expected return of intended employee
behavioral outcomes. Over the past couple of years, I have explored the existing seminal
and current literature to find empirical evidence to explain this observation.
Upon initial review of the literature, I was not able to find any empirical evidence
to support the hypothesis that employee income level mediates the relationship between
leadership and employee behavior. I did find that other researchers (Leana & Meuris,
2015) had also observed the same gap in the literature. Leanna and Meuris (2015)
asserted that despite the critical role of income level, income level had not been heavily
2
researched. Considering how important this variable is in the motivation of employees
(Adams, 1963), this research project can add supportive empirical evidence for wage
equity theory. Based on this gap in literature, I examined the mediation of employee
income level on the relationship between leadership and employee behavior.
While reviewing the current literature pertaining to the mediation of the
relationship between leadership and employee behavior, I found a study that gave
empirical support for the mediation of perceived organizational support on the
relationship between leadership and employee behavior (Hassan & Hassan, 2015). In this
study, I partially replicate Hassan and Hassan’s (2015) research with the authors’
permission as noted in Appendix A. This study could also expand the current knowledge
on the subject by including a test of the mediation effects of employee income on the
relationship between leadership and employee behavior. By building on Adams’s (1963)
equity theory and using Hassan and Hassan’s (2015) survey, I expand upon both studies
to further the understanding of the leadership and employee behavior relationship.
I partially replicated Hassan and Hassan’s (2015) study by using the research
instruments to measure the leadership and employee behavior variables. However, I
introduced a different meditation variable (employee income level) for mediation testing.
For this study, leadership was examined using three variables: leader-member exchange
(Cropanzano, Dasborough, & Weiss, 2017), organizational justice (Moorman & Byrne,
2013), and empowering leadership (Dong, Bartol, Zhang, & Li, 2017). Employee
behavior was examined using three variables: job performance (Conte, Heffner, Roesch,

3
& Aasen, 2017), organizational citizenship (Organ, 2017), and reduced withdrawal
behavior (Afsar, Ali, Dost, & Safdar, 2017).
In this chapter, I present the academic background for the variables I used with a
preliminary literature review. Next, I define the problem statement for this research
study. Also included in this chapter is the purpose statement and the research questions
that I explored. In addition to those core concepts, this chapter also includes an
introduction to the research framework, methodology, and implications for social change
involved with this research project. The potential social change implication for this study
is an improvement in the relationship between leaders and employees at differing
employee income levels.
Background of the Study
The focus of this study was the effects of employee income level on the
relationship between leadership and employee behavior. This study is based on the
theoretical foundation of wage equity theory established by Adams (1963). Adams stated
that employee income equality leads to properly motivated employees who produce
intended behavioral outcomes, while employees who perceived their income to be unfair
may not be motivated to perform their work well.
This study was needed to generate empirical data to support Adams’s (1963)
theory. I partially replicated (Easley, Madden, & Dunn, 2000) a previous study in
Pakistan (Hassan & Hassan, 2015) that included testing of perceived organizational
support as a mediation variable for the relationship between leadership and employee
behavior. In this study, I replicated the predictor variables, criterion variables, and

4
methodology, but incrementally expanded the knowledge of that study by using a new
meditation variable and using a different population.
The seminal research for this study was Adams’s (1963) idea that income, or
wage inequality, is a social consideration for leaders. Other authors examined Adams’s
ideas in various ways such as Blau’s (1964) concept of distributive justice. Leanna and
Meuris (2015) examined the effect of income and income inequality on professional and
personal behavior, and they also concluded that there had been very little theoretical
research conducted on income level as a variable even though it is important. I further
explored income and leadership by testing employee income level as a meditation
variable on the relationship between leadership and employee behavior using multiple
variables for leadership as predictor variables and multiple employee behavioral variables
as criterion variables.
I used the leadership and employee behavior variables examined by Hassan and
Hassan (2015) in a study on perceived organizational support as a mediation variable on
the relationship between leadership and employee behavior to measure leadership and
employee behavior. The leadership variables measured and analyzed as predictor
variables were leader-member exchange (Janssen & Yperen, 2004; Zivnuska, Kacmar, &
Valle, 2017), organizational justice (Francis & Barling, 2005; Gozukara, 2017), and
empowering leadership (Mekpor, Mekpor, Dartey-Baah, & Dartey-Baah, 2017; Vecchio,
Justin, & Pearce, 2010). The employee behavioral variables examined in this study were
job performance (Chiang & Hsieh, 2012; Joseph, Jin, Newman, & O’Boyle, 2015),
organizational citizenship behavior (Chiang & Hsieh, 2012; Tuan, 2017), and reduced

5
withdrawal behavior (Eisenberger, Armeli, Rexwinkel, Lynch, & Rhoades, 2001; Smith,
Micich, & McWilliams, 2016). The mediation variable tested in this study was employee
income level.
Adams (1965) also produced seminal research on the concept of organizational
justice in his equity theory by exploring the negative behavioral consequences of injustice
within organizations. In this study, I measured leader-member exchange (Dulebohn, Wu,
& Liao, 2017); organizational justice, which is a culture of fairness (Strom, Sears, &
Kelly, 2014); and ethical leadership (Demirtas & Akdogan, 2015) as predictor variables
for employee behavior. Because this study was about employee income level, it was
important to measure multiple aspects of leadership experienced by respondents to ensure
that any difference in employee behavior was a result of income level difference and not
from poor leadership.
The effect of income level on the relationship between leadership and employee
behavior is a gap in the literature that may be more important than previously understood.
Employee income level can have wide-ranging impacts on an employee (Vohs, 2013).
This study provides future leaders guidance for evaluating their workplace relationship
relative to each employee’s current income level.
Problem Statement
The general management problem was that global competition requires
organizations to maximize the performance of their employees to respond quickly to the
changing market conditions and remain competitive from a cost management and
innovation perspective (Hassan & Hassan, 2015). The specific management problem was

6
that unintended employee behavioral outcomes such as poor job performance, lack of
organizational citizenship, or withdrawal behavior, may be due to leadership decisions
made without consideration given to the mediating effects of employee income level on
the relationship between leadership and employee behavior. Crabtree (2013) noted that
only 13% of employees are actively engaged at work. Because positive employee
behavioral outcomes and attitudes are vital to organizational success, active employee
engagement is a challenge that should be addressed by future leaders (Czaplewski et al.,
2016).
By completing this research, and informing future leaders about income level as a
mediation variable, there may be a positive social change for both leaders and employees
by potentially lessening unnecessary income inequality. Blau (1964) asserted that part of
a leader’s role is to motivate employees to increase job performance and citizenship
behavior. While there are numerous ways for leaders to motivate employees, many of
them are based on the wages paid to the employee. To motivate their employees
properly, leaders need to understand now income level affects their relationship with
employees at different levels (Gerhart, 2017).
For business organizations, return on investment for employee labor costs is
important. The largest cost of doing business is employee compensation, which
comprises 57.4% of the total cost of doing business operations according to the U.S.
Bureau of Economic Analysis (2016). Employee compensation is also the largest part of
gross domestic income (U.S. Bureau of Economic Analysis, 2016). Because it is the
greatest cost of doing business and the largest component of gross domestic income, the

7
importance of how employee income level mediates the relationship between leadership
and employee behavioral outcomes is critical to the survivability of any organization.
Leaders who do not fully understand the mediation variables between leadership
and employee behavior may suffer from poor employee performance that can render the
organization unable to remain profitable in an evolving marketplace (Hassan, Hassan, &
Shoaib, 2014). This lack of leader understanding coupled with the growing income
disparity in the United States (Zardkoohi & Bierman, 2016) has created a need for
additional leadership theory about employee income level effects on the relationship
between leadership and employee behavior. The focus of this study was to expand upon
the previous research by testing the mediation effects of employee income level on the
relationship between leadership and employee behavior.
Purpose of the Study
The purpose of this correlational, quantitative design study was to test the
mediating effects of employee income level on the relationship between leadership and
employee behavior in the United States. This study is an incremental expansion of
knowledge to Adams’s (1963) equity theory using established instruments for measuring
the leadership and employee behavior relationship. The research design partially
replicates previous research by Hassan and Hassan (2015), who reviewed the mediation
effects of perceived organizational support on the relationship between leadership and
employee behavior.

8
I combined Hassan and Hassan’s (2015) design with Adams’s (1963) theory to
examine empirical evidence that could support or detract from Adams’s theory. The
following three leadership variables were used to measure leadership:
• Leader-member exchange (Janssen & Yperen, 2004)
• Organizational justice (Francis & Barling, 2005)
• Empowering leadership (Vecchio, Justin, & Pearce, 2010)
The following three employee behavior variables were used to measure employee
behavior:
• Job performance (Chiang & Hsieh, 2012)
• Organizational citizenship behavior (Chiang & Hsieh, 2012)
• Reduced withdrawal behavior (Eisenberger et al., 2001)
Research Questions and Hypotheses
The research questions, hypotheses, and null hypotheses for this project were as
follows:
RQ1: How does employee income level mediate the relationship between
leadership and employee behavior?
Ha: Employee income level partially mediates the relationship between leadership
and employee behavior.
H0: Employee income level does not mediate the relationship between leadership
and employee behavior.
RQ2: How is employee income level related to leadership?

9
Ha: There is a significant, positive relationship between employee income level
and leadership.
H0: There is no relationship between employee income level and leadership.
RQ3: How is employee income level related to employee behavior?
Ha: There is a significant, positive relationship between employee income level
and employee behavior.
H0: There is no relationship between employee income level and employee
behavior.
Theoretical Foundation
The theoretical foundation for this study was based on Adams’s (1963) equity
theory but also encompasses Hersey and Blanchard’s (1977) situational leadership theory
as well as Fiedler’s (1964) contingency theory. Adams’s (1963) equity theory is based
on the idea that wage equalities lead to intended employee behavioral outcomes mediated
through increased employee motovation while wage inequalities perceived or real lead to
reduced employee motivation and thereby unwanted behavioral outcomes. Adams’s
equity thoery is a motovational theory that regards income equity as a balance between an
employee’s preceived inputs and the outputs to the employee from the organization.
Therefore, the mediation variable of employee income level is based on Adams’s (1963)
equity theory.

10
Figure 1. Theoretical foundation
Along with Adams’s equity thoery, this research project was also based on other
leadership theories and employee behavioral theories. For example, Burns (1978)
established leadership as a predictor of employee behavior.
The predictor category of leadership theoretical foundation for this study
consisted of the following three concepts: leader-member exchange, organizational
justice, and empowering leadership. Employee behavior as a criterion variable has also
been well established in the literature (Roethlisberger, Dickson, Wright, & Pforzheimer,
1939). For this research study, the criterion variable category of employee behavior
theoretical foundation consisted of the following three categories: job performance,
organizational citizenship, and reduced withdrawal behavior.
Nature of the Study
The research method for this study was correlational and quantitative using
multiple regression for mediation testing and analysis. The data collection consisted of
current employees of various income levels within the United States, with a target of 74
responses based on the G*power analysis that will be demonstrated in Chapter 3. The
targeted source of recruitment was Qualtrics with a contingency plan to use Walden

11
University’s participant pool. The data were analyzed using SPSS to determine the
correlation between the predictor variables and the criterion variables as well as
experimental differential testing of the mediating effects of the income levels between the
predictor and criterion variables. This research may allow business leaders to gain a
better understanding of how their leadership affects employee behavior at different
income levels and therefore improve their future labor policy decisions.
With the permission of the authors, displayed in Appendix A, I adopted a survey
questionnaire from a recent study by Hassan and Hassan (2015) for the predictor and
criterion variables. All the variables included in this study have been well established in
the literature and researchers continue to use them in the current literature. Therefore, the
variables chosen are both accepted and relevant for continued use in this study. The
variables that comprised the predictor variable category were leader-member exchange
(Blau, 1964; Cropanzano et al., 2017), organizational justice (Adams, 1965; Goth,
Bergsli, & Johanesen, 2017), and empowering leadership (Morrison, 1996; Kim & Beehr,
2017). The variables that comprised the criterion category were job performance
(Eisenberger, Fasolo, & Davis-LaMastro, 1990; Kooij, Tims, & Akkermans, 2017),
organizational citizenship behavior (Roethlisberger et al., 1939; Organ, 2017), and
reduced withdrawal behavior (Cropanzano, Rupp, Mohler & Schminke, 2001; Bai, Dong,
Liu, & Liu, 2017).
I describe the predictor and criterion variables in more detail in the Definitions
section and Chapter 2. The data collection instruments are listed Chapter 3. The predictor
and criterion variables were 5-point Likert scale, ordinal variables, and income level was

12
a categorical, mediating variable. The framework for this research project is shown in
Figure 2. I hypothesized that income level mediates the relationship between
organizational justice and employee behavior partially mediates the relationship between
leader-member exchange and employee behavior and fully mediates the relationship
between empowering leadership and employee behavior.
Figure 2. Research framework
The framework for this project was used to measure leadership variables as
predictor variables to the criterion variables of employee behavior and tested the
mediation effects of income level (Adams, 1963). After a review of the theories for the
study, I concluded that income level could mediate the relationship between leadership
and employee behavior. The research framework was developed by combining Adams’s
(1963) equity theory with Hassan and Hassan’s (2015) findings. I tested for partial or full

13
mediation of employee income level on the relationship between leadership and
employee behavior.
Motivation for Research
As a business leader working in five different labor-intensive industries—
military, construction, recycling, manufacturing, and facilities operations and
maintenance—I have developed an understanding that the relationship between
leadership and employee behavior is a key component for organizational success. As a
business executive, I have been involved in both corporate leadership and strategic
planning as well as day-to-day operations management. Throughout my business career,
I have observed that policy implementation and strategic decisions at the corporate level
seem to be met with various employee behavioral responses at the operational level.
Perhaps individuals who are receiving more compensation for their labor feel they owe
more to the organization with regard to buy-in.
Prior to this study, I have observed that the variance in the behavioral responses
may be correlated with the income level of the individual employee, but I lacked
empirical evidence due to a gap in literature. Studying the hypothesis that employee
income level mediates the relationship between leadership and employee behavior can
advance the current leadership theory. Accepting the hypothesis would have allowed me
as a business leadership practitioner to customize policy decisions based on individual
employee income level; however, the hypothesis was not supported by the results.
Accepting the null hypothesis also adds to the future decision making, but not in the way
previously anticipated.

14
Definitions
Employee behavior: The sum of the variables including job performance (Kooij,
Tims, & Akkermans, 2017), organizational citizenship behavior (Organ, 2017), and
reduced withdrawal behavior (Bai et al., 2017).
Empowering leadership: Allowing independent decision-making by employees
for decisions historically reserved for leadership (Kim & Beehr, 2017).
Income level: The total base compensation paid to an employee through annual
salary, nonincentive wages, and hourly pay or negotiated monetary fringe benefits (Leana
& Meuris, 2015).
Job performance: The degree to which an employee satisfies the requirements of
his or her employment (Kooij et al., 2017).
Leader: An individual within an organization responsible for influencing and
maximizing subordinates effort (Kruse, 2013).
Leadership: In this study, leadership was used as a category comprised of leader-
member exchange (Cropanzano et al., 2017), organizational justice (Adams, 1965), and
empowering leadership (Kim & Beehr, 2017).
Leader-member exchange: The interpersonal interaction between a leader and his
or her subordinates (Cropanzano et al., 2017).
Organizational citizenship behavior: Actions taken that demonstrate an
employee’s voluntary commitment to their organization (Organ, 2017).
Organizational justice: The sum effect of distributive fairness, interactional
fairness and procedural fairness within an organization (Hassan & Hassan, 2015).

15
Reduced withdrawal behavior: The decline of negative employee actions such as
tardiness, absenteeism, or calling in sick (Afsar et al., 2017).
Assumptions
The general assumptions for this study were as follows:
• Enough employees are willing to volunteer their responses to provide a valid
sample, and Qualtrics has access to this population.
• The empirical data and subsequent analysis will yield useful practical
application conclusions with positive social change implications.
• The data gathered in this study indicates that income level does mediate the
relationship between leadership and employee behavior. Therefore, leaders
may be able to use this information to make better business decisions.
Along with the general assumptions, this study also had several statistical
assumptions to test for mediation using linear regression. Baron and Kenny (1986) listed
the following assumptions for mediation testing:
• The assumptions for linear regression:
• Normally distributed population
• The sample is representative of the population
• Independent observations
• Homogeneity of variance
• Homogeneity of regression
• No multicollinearity

16
• There is a significant correlation between the predictor variable and the
criterion variable.
• There is a significant correlation between the predictor variable and the
mediation variable.
In this study, the assumptions for linear regression were tested first, although some
multicollinearity was expected with the mediation variable present. Secondly, the
mediation assumptions were tested using linear regression to determine the relationship
between leadership and employee behavior as well as measure the relationship between
leadership and employee income level. Finally, once the assumptions for mediation were
satisfied, a multiple regression model was used to test the mediation effects of employee
income level on the relationship between the predictor and criterion variables.
Scope
The scope of this correlational, quantitative study using mediation testing was to
examine how employee income level effects the relationship between leadership and
employee behavior. The research delimits any variable not identified by the research
questions, and the scope only encompasses variables explicitly defined and studied by
previous peer-reviewed research. The targeted population for this study was current
employees in the United States. This study also excludes any longitudinal aspect of
research for the identified variables. Because the variables included basic leadership
concepts, and previous researchers have conducted a similar study (Hassan & Hassan,
2015), the results of this study could be combined with their finding to generalize the
results further.

17
Limitations
The main limitation of this study is the use of a 5-point Likert-type scale similar
to Hassan and Hassan (2015) to measure the variables. While the Likert-type scale is one
of the most commonly accepted scales for measuring self-reported feelings and
perceptions, it only uses one type of response (Ho, 2017). The study is also limited by a
lack of longitudinal aspect, because all data collected was from a single survey. This lack
of a longitudinal element could be overcome in future research, but was not practical to
address in this project. The expected sample for this project came from one organization,
which also limits the extent to which the results can be generalized. Future research
could further generalize the results by replicating the study on different populations.
Significance of the Study
This study is significant because it could expand future leaders’ understanding
regarding employee behavior outcomes in response to their leadership at various income
levels. A recent poll showed that 13% of employees are actively engaged at work
(Crabtree, 2013). Because the largest cost of doing business is employee compensation
(U.S. Bureau of Economic Analysis, 2016), positive employee behavioral outcomes and
attitudes are vital to organizational success (Czaplewski et al., 2016), and active
employee engagement is an ongoing challenge for business leaders. Knowledge gained
by this study could better prepare leaders to influence employees at differing income
levels more appropriately and thereby improve individual and group performance.
In this study, I expanded the work by Hassan and Hassan (2015) by testing
income level as a mediation variable between leadership and employee behavior. In their

18
publication, Hassan and Hassan called for future research using a sample from a western
country. In this study, I used a sample collected from the U.S. employee population,
which further generalizes some of the relational findings presented in the initial research.
In conjunction with the results of the Hassan and Hassan project, this study gives leaders
a more comprehensive understanding of the mediating variables affecting the relationship
between leadership and employee behavior.
Significance to Theory
The specific management problem that was addressed by this study is the fact that
there are unintended negative employee behavioral outcomes potentially resulting from
leaders making decisions with an inadequate understanding of the mediating effects of
employee income level on the relationship between leadership and employee behavior.
Because a primary duty of a leader is to motivate employees to improve job performance
(Blau, 1964; Hassan & Hassan, 2015), the absence of empirical information on this
relationship is a significant gap in the current academic management theory.
Demonstrating a statistically significant finding of the relationship between
leadership, employee behavior, and income level, has numerous theoretical implications
for the field of management. For example, a new leadership style theory may be
formulated based on managing employees differently at varying income levels. Current
leadership theories such as empowering leadership (Kim & Beehr, 2017) could also be
expanded to include income levels for which the theory is most appropriate.
19
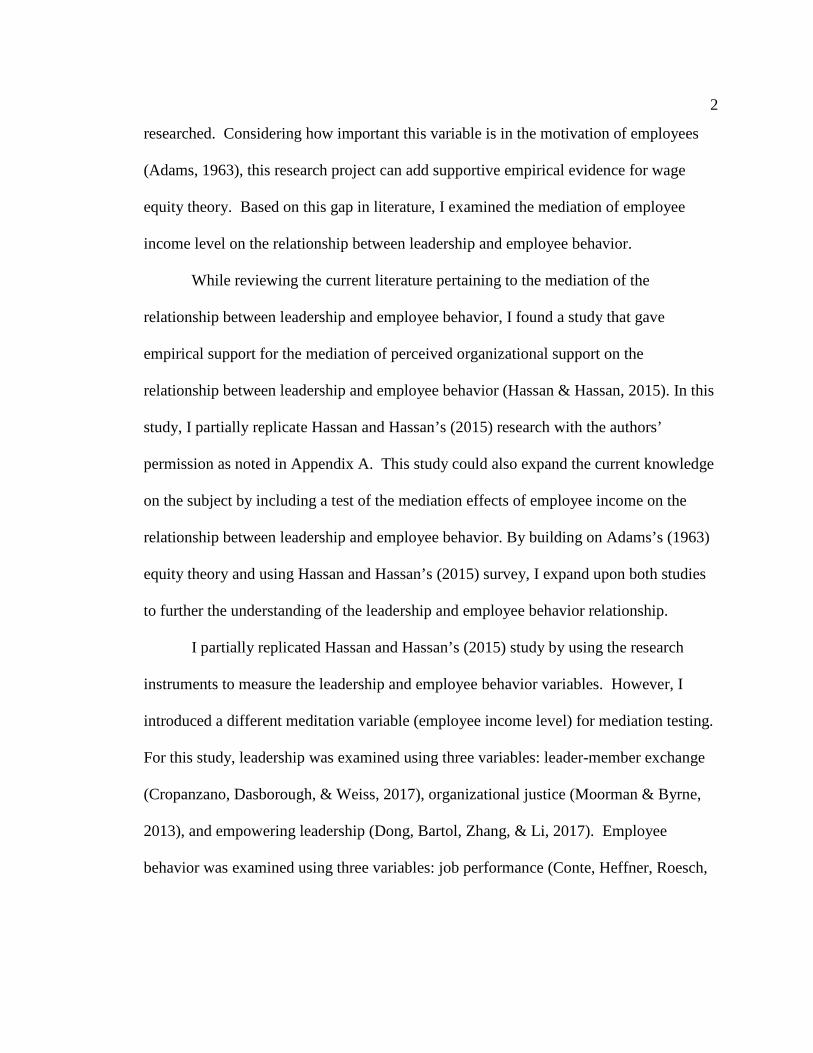
Significance to Practice
While the findings of this study could be used to affect leadership theory
development significantly, there are significant practical applications as well. Most
corporate policies in the United States today only take into account the distinction
between overtime exempt and hourly wage earner. With data suggesting that leadership
policies impact employees in different ways depending on income level, future business
policy designers and executive decision makers may develop unique plans for each
income level. While this idea of specializing policy to income level may require further
research, proper application of this approach would result in a competitive advantage for
an organization implementing the more efficient policies.
Significance to Social Change
By completing this research, and informing future leaders about income level as a
mediation variable, there may be a positive social change for both leaders and employees
by potentially lessening unnecessary income inequality. Blau (1964) asserted that part of
a leader’s role is to motivate employees to increase job performance and citizenship
behavior. In this study. I measured the effects of leadership on both employee’s job
performance and citizenship behavior. For leaders to motivate their employees properly,
they need to understand now income level influences their relationship with employees at
different levels (Gerhart, 2017). By completing this research, and informing future
leaders about income level as a mediation variable, there may be a positive social change
for both leaders and employees by potentially lessening unnecessary income inequality.

20
Any improvement to the current understanding of the relationship between
leadership and employee behavior will benefit business organizations, leaders,
employees, and the communities where the leaders and employees live and work. For the
organizations, a better understanding of this relationship throughout an organization
could lead to better policy creation and implementation, which provides a better return on
investment for labor dollars spent on employee wages. For the leaders striving to
maximize the potential of their employees, a better understanding of their relationship
with their employees about the employee’s income level could lead to more customized
coaching and mentoring of individual employees at differing income levels. For the
employees and the communities that they live in, having a better work place that is
sustainable over time brings enduring economic growth and stability.
Summary
The focus of this study was the influence of leadership on employee behavior at
various income levels. There is existing qualitative and quantitative data regarding the
topic of leadership, but the literature is further expanded with this study. The primary
inspiration for this study came from two places: my personal observations as a business
executive and a recent study by Hassan and Hassan (2015), which showed that there is at
least one mediation variable that affects the relationship between leadership and
employee behavior. The goal of this study was to expand that research by testing the
mediation effects of employee income level on the relationship between leadership and
employee behavior.

21
By using the leadership and employee behavior variables already established in
the literature and adding income level as a mediation variable, I hoped to further the
existing knowledge for leadership practitioners and management scholars. In this
chapter, I have explained the background for the study and introduced the problem
statement, purpose and research questions. The next chapter is an exhaustive literature
review of both the seminal and current research for each identified variable. The next
chapter includes a literature review of the methodology and demonstrates the income
level interaction with leadership and employee behavior is an important gap in the current
literature.

22
Chapter 2: Literature Review
The purpose of the previous section was to explain the existing management
problem that I addressed with this research project and demonstrate alignment between
that problem and the research plan. The purpose of this literature review is to explain the
current state of the academic literature pertaining to this research study regarding the
effects of employee income level on the relationship between leadership and employee
behavior. In this chapter, I present a comprehensive literature review with a primary
focus on peer-reviewed articles written in the last 5 years.
In this chapter, I explain the strategy used to conduct the literature review and the
theoretical foundation for this study along with articles related to the individual variables
that are measured. This review includes both seminal and current works and a synthesis
of the literature. The methodology for this study is explored as well as previous similar
studies. Finally, this review includes a demonstrated gap in the existing literature to be
explored by this study
The management problem addressed by this research study was unintended
employee behavioral outcomes due to employee response to leadership differing between
different income levels. The purpose of this correlational, quantitative design study was
to test the mediating effects of employee income level on the relationship between
leadership and employee behavior within a private sector, publicly traded company
operating in the United States. This study is significant in a number of ways; the primary
significance of this study as it relates to the existing literature is that this study expands
the existing knowledge regarding employee response to leadership.
23
By expanding leadership knowledge, this study presents evidence to future
leaders with regard to employee behavior outcomes in response to their leadership at
various income levels. This expansion of leadership knowledge and furthering of
leadership theory could be useful to both scholars and practitioners in the field of
leadership. By examining leadership in this new way, I may be able to use the findings
of this study as evidence to support a new theory of leadership that encompasses income
level as the primary influencing factor on employee behavioral outcomes.
The primary research question of this study was “How does income level mediate
the relationship between leadership and employee behavior?” Numerous variables
needed to be measured to answer the research question. The variables identified in the
previous chapter—leader-member exchange, organizational justice, empowering
leadership, job performance, organizational citizenship behavior, and reducing
withdrawal behavior—were the basis for the literature review process. This chapter
furthers the discussion of the variables to demonstrate both the theoretical framework and
current literature associated with this research study.
Literature Search Strategy
To complete the literature review for this research project, I used a systematic
approach. After developing my research questions and a general concept of the
methodology and variables, I began searching for literature (see Booth, Sutton, &
Papaioannou, 2016). Because this research project was inspired by a previous study
(Hassan & Hassan, 2015), I started by exploring the literature listed as support for the
variables in that study.

24
I began the literature review process by searching for seminal articles pertaining
to all the variables. Once I established the seminal background, I then used the cited by
function of Google Scholar to find other current articles related to the topic. After
reviewing over 250 peer-reviewed articles and over 20 books dating from 1960 to the
present, I was not able to find any quantitative research on the mediation effects of
employee income level on the relationship between leadership and employee behavior.
Initially, I found that a majority of the seminal research for this area of management was
conducted in the 1960s and further explored from the 1980s to the present.
It was challenging to find current literature, so I used Google Scholar’s since
function based on a 2015 year combined with cited by function while reference chaining
from current relevant peer-reviewed articles. There was much literature on each of the
variables; however, the focus of research for each of these variables has changed over
time, which made it challenging to demonstrate the most current and accepted use of each
variable. In the next section, I provide a theoretical framework on each of the variables
from both a seminal and current perspective.
In addition to adding more current works to the literature review after an initial
search, I added a section for controversial findings and conflicting leadership theories.
This section includes any literature that I could find with evidence against accepting my
alternate hypothesis as well as demonstrates the current state of debate among scholars
regarding leadership theory. The fact that leadership theory still has aspects which are
actively debated over 50 years after Adams’s (1963) work suggests that the field of
leadership is an ever-evolving field of study. While this study may expand the

25
knowledge of leadership, I believe leadership theory will always be in a state of
discussion. The strategy for finding articles that offered negative opinions of the
variables I have chosen for this study was to search for the following terms: negative
effects of leadership, negative effects of ethical leadership, and negative effects of
empowering leadership.
After the theoretical framework is established, I give an exhaustive literature
review of the current peer-reviewed publications that could be relevant to the research
topic. The primary library used was the Walden University Library, but I also included
other publicly available references found by Google Scholar. Examples of search terms
are as follows: leadership, employee behavior, job performance, income level, employee
compensation, organizational citizenship behavior, organizational citizenship behavior,
organizational justice, procedural justice, ethical leadership, and leader-member
exchange.
Theoretical Foundation
Because it was my intent to examine the relationship between leadership and
employee behavior in the United States, the theoretical foundation for this research
project was based on management theory developed in the United States after the
industrial revolution. The theoretical foundation for this study consisted of motivation,
leadership, and employee behavioral theories. The primary foundation is Adams’s
(1963) equity theory, which is a motivational theory based on an individual employee’s
perception of balance between his or her input to an organization and the output received
from the organization.
26
Adams’s (1963) equity theory helps explain that employees who believe that their
inputs such as qualifications, skills, or experience are balanced with the outputs
(compensation) they receive are more likely to be highly motivated and thereby produce
employee behaviors that are intended by their leaders. Conversely, employees who
perceive an imbalance between their inputs and outputs will have reduced motivation and
produce unwanted employee behaviors. For this study, this idea that employee income
level was an important factor in the relationship between leadership and employee
behavior is a seminal theory.
The contingency theory (Fielder, 1964) helps explain that the most desired course
of action for organizational leaders is contingent upon the internal and external situation
and is also seminal to this research when combined with Adams’s (1963) equity theory.
Contingency theory (Fielder, 1964) was important to the findings of this study because if
there was a mediation effect of employee income level on the relationship between
leadership and employee behavior, applying this finding would need different leadership
courses of action based on differing employee income levels. Similarly, situational theory
(Hersey & Blanchard, 1977) supports the idea that there is no best leadership style, but
each leader must adapt his or her leadership to each situation.
In this study, the differing situations were the different income levels of
employees. Building upon earlier research such as Adams’s equity theory suggests that
wage equalities lead to properly motivated employees and thereby result in employee
behavioral outcomes that are intended by the leader. Conversely, Adams (1963)
explained that any perceived wage inequality on the part of an employee can negatively

27
influence that employee’s motivation and will most likely result in unwanted employee
behavioral outcomes. Adams expanded his work in 1965 in addition to the others who
have expanded his work (Blau, 1964; Burns, 1978) to incorporate various leadership and
employee behavior variables.
While there are a great number of leadership and employee behavioral variables
that can be used to effectively measure leadership and employee behavior, this study
included limits to three leadership variables for the predictor category and three employee
behavioral variables for the criterion category. Burns (1978) established a precedent for
using leadership as a predictor of employee behavior. The predictor category for this
study was leadership and consisted of the variables leader-member exchange (Blau,
1964), organizational justice (Adams, 1965), and empowering leadership (Morrison,
1996).
The following theories were the basis for the criterion variables of employee
behavior: job performance (Eisenberger, Fasolo, & Davis-LaMastro, 1990),
organizational citizenship (Roethlisberger et al., 1939), and withdrawal behavior
(Cropanzano, Rupp, Mohler & Schminke, 2001). The research framework based on the
above theories is shown in Figure 1. When combined, the above theories suggest that
leadership effects employee behavior.
The following section includes an explanation of these ideas organized by
variable type as I used them in the research process. This study was a correlational,
quantitative design with mediation testing. Therefore, the variable categories were
predictor, criterion, and mediation. Leadership theory has advanced significantly over

28
the last 30 years (Day, Fleenor, Atwater, Sturm, & McKee, 2014). There are entire
academic publications such as The Leadership Quarterly that are peer-reviewed journals
dedicated solely to the expansion of leadership theory. Leadership development theory is
now its own area of research (Day et al., 2014), and this study may allow future
leadership development practitioners and scholars to assess leadership development
curriculum to determine if income level affects how a leader should tailor their style to
individuals.
Predictor Variable: Leadership
Leadership theory is a heavily researched concept and using leadership as a
predictor variable is an academically accepted practice dating back many years (Burns,
1978). Burns (1978) tried to further leadership theory research by demonstrating how a
certain method or type of leadership such as transformational should yield better results
than an alternative such as transactional. For example, the theory of transformational
leadership has matured past the point of researching demonstrating value. Currently,
researchers have studied transformational leadership effects with an assumption that
transformational leadership should be preferred to transactional leadership (Nguyen, Mia,
Winata, & Chong, 2017).
The effectiveness of leadership type may be less important than previously
thought if employee income level mediates the relationship between leadership and
employee behavior. In this study, I examined how much of the relationship between
leadership and employee behavior is mediated by employee income level. If the
relationship is fully mediated, by employee income level or any other variable, the type

29
of leadership is less important than the mediation variable when considering effects on
employee behavior. In contrast to previous literature, the purpose of this study was not to
lobby for or against any particular leadership style, method, or type.
The basic assumption from a leadership theory perspective for this study was that
the goal of all leadership is to produce desired behavioral outcomes in the followers
(Burns, 1978). In this study, I used leadership as a predictor variable in a way similar to
previous studies (Harms, Credé, Tynan, Leon, & Jeung, 2017). While some (Harms et
al., 2017) have argued that poor leadership can result in negative employee behavioral
outcomes such as burnout, and others have suggested that positive leadership can result in
positive outcomes (Newman, Schwarz, Cooper, & Sendjaya, 2017), I looked neutrally not
the outcomes generated, but rather on mediation effects between the given leadership and
the employees’ behavior.
Leader-member exchange. A universally accepted aspect of leadership is that it
entails a social exchange between the leader and the follower known as a leader-member
exchange (Blau, 1964). This exchange in a business setting is found between a
supervisor and an employee, and it exists at all levels throughout an organizational chain
of command. It is important to note that all employees except for the lowest level
employee participate in this exchange as both a leader and a member depending on whom
the employee is interacting.
The first leadership variable to be examined in this study is a leader-member
exchange. Later, social exchange theory morphed into what is known today as a leader-
member exchange (Cropanzano et al., 2017). The leader-member exchange theory is a

30
relationship-based approach focused on the interpersonal relationship between the leader
and the follower (Cropanzano et al., 2017). The aspects of leader-member exchange that
set it apart from other leadership theories is the focus on the dyadic exchange relationship
and the resources exchanged between the leaders and followers (Cropanzano et al.,
2017).
Organizational justice. Organizational justice is an extension of equity theory
(Adams, 1965). Adams’s (1965) premise was that individual employees want the firm to
treat all employees equitably. There seems to be a correlation between internal equality
and performance, such as vocational teachers-in-trading working in groups with higher
equality learning more than groups with less equality. Goth, Bergsli, & Johanesen (2017)
argued that internal equality is a prerequisite for employee job satisfaction and proficient
job performance of followers. According to Hassan and Hassan (2015), three dimensions
comprise organizational justice. The three dimensions of organizational justice are
procedural, interactional, and distributive (Hassan & Hassan, 2015).
Procedural justice is a method for establishing fair criteria for internal
organizational decision-making and applied consistently over time to all. Interactional
justice shares some of the same aspects of procedural justice regarding applying things
consistently to all, with the added layer of a focus on the fairness given to individuals
throughout the procedural process (Moorman & Byrne, 2013). Finally, the basis for
distributive justice is the individuals’ perceived the level of fairness about an individual’s
outcome when compared to that of others within the organization (Organ, 2017).
Organizational justice is an important aspect of leadership to measure for this study to

31
accurately measure the relationship between leadership and employee behavior. By
including this variable of leadership, the subsequent employee behavior responses can be
examined with respect to employee income level in both cases of high organizational
justice and low organizational justice environments.
Empowering leadership. The basis of empowering leadership is authority
delegation and collaborative decision-making (Dong et al., 2017). Empirical research has
demonstrated that leaders enabling employees to work independently can lead to greater
positive employee behavioral outcomes such as job performance (Kooij et al., 2017).
Similar to organizational justice, including the variable of empowering leadership to
measure leadership allows the mediation variable to be measured in cases where
empowering leadership is either high or low. This allowed the data collected from each
respondent to be included in the mediation testing regardless of the type of leadership
present.
Employee Behavior
Employee behavior has been studied as a criterion variable for as long as the
discussion of transactional versus transformational leadership has been present (van
Knippenberg & Sitkin, 2013). Employee behavior is commonly accepted as the most
important criterion variable to measure in the field of management. However, there is
debate regarding how to measure employee variables. For this project, the following
three variables were used to measure employee behavior: job performance (Seate, Pooe,
& Chinomona, 2016), reduced withdrawal behavior (Bai et al., 2017), and organizational
citizenship behavior (Organ, 2017).

32
Since the purpose of this research is to explore the connection between leadership
and intended leadership outcomes resulting in positive employee behavior, only positive
employee behavior outcomes are measured. By measuring multiple leadership variables
and multiple employee behavior variables, I intended to demonstrate that the mediation
effect of income level is consistent across a variety of both leadership and employee
behavioral variables. These variables are listed and discussed in priority order to the
organization.
Job performance. In previous research (Conte, Heffner, Roesch, & Aasen,
2017), authors have identified ten dimensions of the job performance variable. These ten
aspects of job performance could be categorized very similarly to the employee behavior
criterion variable discussed above, but to remain consistent with the theoretical
framework of Hassan and Hassan (2015), I have left this as a sub-category. These ten
aspects form the theoretical foundation for job performance as it pertains to this study.
There is a positive correlation with some aspects of increased job performance,
and a negative correlation with other variables. For this purpose of this study, the job
performance variables that were measured were either naturally positively correlated or
re-phased so that any increase in a job performance variable is indicative of improved job
performance. For example, instead of measuring absenteeism, this study measures
reduced withdrawal behavior as a positive employee behavior. The dimensions of job
performance (Ng & Feldman, 2008) are listed below:
• Core task performance
• Performance in training programs

33
• Organizational citizenship behaviors
• Safety performance
• Creativity
• General counterproductive work behaviors
• Workplace aggression.
• Substance abuse
• Tardiness
• Absenteeism
In this study, many of the above variables were measured in one of the three employee
behavior variable categories. General counterproductive work behaviors, tardiness, and
absenteeism, are measured under the reduced withdrawal behavior variable.
Organizational citizenship behavior. Roethlisberger, Dickson, Wright, and
Pforzheimer (1939) suggested that citizenship behaviors are part of group function
pioneered the concept of organizational citizenship behavior. Later, researchers argued
that organizational citizenship behavior should be used to measure employee
performance (Organ, 2017). This previous research has established organizational
citizenship behavior as a criterion variable for desired employee behavior. In this study
organizational citizenship behavior is an important variable to measure to determine how
employees are responding respective to their leadership. In order to test for mediation,
the data would have to demonstrate a significant relationship between leadership and
organizational citizenship behavior.

34
Reduced withdrawal behavior. Reduced withdrawal behavior is simply an
inverse variable to the withdrawal behavior variable previously researched (Afsar et al.,
2017). This variable category includes the negative aspects of job performance above
restated to demonstrate a positive relationship with improved job performance. The areas
of job performance included in withdrawal behavior are absenteeism, tardiness, and
general counterproductive work behaviors. Since the foundation of this study rests on the
premise that leadership desires to influence employee behavior in such a way that
produces intended employee behavioral outcomes, reduced withdrawal behavior is an
important employee behavioral variable to measure. For this study, a reduction of
withdrawal behavior is an indication of intended employee behavior and increased
withdrawal behavior are considered unintended employee behavior.
Income Level
The theoretical framework for the mediation variable for this study is based on the
original literature regarding income inequality (Adams, 1963). Adams’ (1963) wage
Equity Theory is the seminal research for the income level variable, and later research
(Stavrova & Ehlebracht, 2016) has expanded upon Adams (1963) to incorporate income
level as a variable for quantitative research. Income level has studied as a variable in
ways outside of leadership theory. For example, a recent study (Stavrova & Ehlebracht,
2016) linked cynical beliefs to income level.
Since most individuals’ income level is based on the wages from their place of
employment, it would stand to reason that future research regarding income level should
include workplace interactions. More specifically, future research should examine the

35
interaction between leadership and how an employee responds to that leadership. For the
purpose of this study, employee income level is the primary variable to be measured and
tested in the relationship between leadership and employee behavior.
Research Variables
Predictor Variable: Leadership
Recently, researchers have sought to predict workgroup performance by using
various leadership styles as predictors to assess what leadership style should be preferred
(Khan, Khan, Umber, Ahmad, & Shan, 2016). One of my goals for this project is to
explore how leadership influences employee behavior by examining three leadership
variables: leader-member exchange, organizational justice, and empowering leadership.
In some regards, these three variables can be combined to encompass a definition of an
ethical inter-personal leader (Muenjohn & McMurray, 2016). Prottas (2013) reported that
employee perception of leader integrity affects employee attitude and well-being.
Since previous research has demonstrated that unethical leadership can lead to
negative employee behaviors (Bonner, Greenbaum, & Mayer, 2016), the focus of this
study is to the research to areas where the leaders are ethical and thereby should be seeing
the positive employee behaviors. Since the leadership of an organization has a
tremendous effect on the moral climate (Demirtas & Akdogan, 2015), this paper seeks to
study an organization or portion of an organization whose leaders are demonstrating
ethical leadership.
Leader-member exchange. Recently, researchers have sought to expand the
literature regarding various aspects of the relationship between leader and follower

36
including liking (Dulebohn, Wu, & Liao, 2017). Also, new theories leader-member
exchange is influencing new theories such as reciprocity and quality theory (Joo & Jo,
2017). Another peer-reviewed study (Zivnuska, Kacmar, & Valle, 2017) included leader-
member exchange as a predictor variable. The data from previous quantitative studies
regarding leader-member exchange indicates that there is a positive correlation between a
high-quality relationship between the leader and follower and positive member
behavioral outcomes (Martin, Guillaume, Thomas, Lee, & Epitropaki, 2016).
Organizational justice. Internal equality within a group is now known as
organizational justice (Gozukara, 2017) is required for employee job satisfice and
proficient job performance of followers. Organizational justice has been shown to have a
positive impact on positive employee behavior outcomes (Strom, Sears, & Kelly, 2014)
in previous quantitative research. According to Hassan and Hassan (2015), there are
three dimensions to organizational justice: Procedural (Shin, Sung, Choi, & Kim, 2015),
interactional (He, Fehr, Yam, Long, & Hao, 2017), and distributive (Pereira, Schwanen,
& Banister, 2017).
Empowering leadership. A recent finding in the current literature supports the
positive impacts of empowering leadership (Mertens & Recker, 2017; Masoud & Yazdi,
2017). Other researchers have also suggested that empowering leadership can be more
effective if combined correctly with a particular leadership style (Günzel-Jensen, Hansen,
Jakobsen, & Wulff, 2017). There is an opportunity for further empirical research in this
area, but this project is limited in scope to using empowering leadership as a leadership
variable to analyze independently from leadership style.

37
Criterion Variable: Employee Behavior
Scholars continue to research employee behavior as a criterion variable (Mekpor,
Mekpor, Dartey-Baah, & Dartey-Baah, 2017). As authors introduce new leadership
concepts, they must also evaluate the idea for effectiveness using employee behavior as
the unit of measure for the model’s impact. Employee behavior is a critical variable for
leadership research because it affects numerous aspects business. For example, without
positive employee behaviors being present organizational innovation could be
challenging, and that innovation is a major component of needed organizational change
(Delmas & Pekovic, 2016).
Job performance. Job performance is the most important employee behavioral
variable from the perspective of the organization because job performance is what the
organization is purchasing by investing resources in employee compensation. Job
performance has been used as a criterion variable for employee behavior in recent
research (Joseph, Jin, Newman, & O’Boyle, 2015). This concept is the foundation for all
current leadership and business leadership theory. Since job performance is one of the
most important leadership outcome variables for future leaders, it is given the top priority
when seeking to measure employee behavior for this research study.
There has been empirical research that shows a positive relationship between job
performance and numerous predictor variables. For example, Hassan and Hassan (2015)
showed a significant positive correlation between job performance and leader-member
exchange, organizational justice, and organizational citizenship behavior. Recent research

38
has also demonstrated that leader-member exchange can progress in stages by using
affective events theory (Cropanzano, Dasborough, & Weiss, 2017).
Organizational citizenship behavior. Organizational citizenship behavior is the
first employee behavioral variable measured (Tuan, 2017). A simple definition of
organizational citizenship behavior in the workplace today is: Positive actions employees
take that extend beyond their job descriptions with the motivation of bettering the
organization (Tuan, 2017). This voluntary committee of the employee to the organization
can create a climate within the organization that is both productive and give the
organization a competitive advantage over other organizations in a competitive
marketplace.
In a global environment, there is very little that limits one organization from the
same resources that other organizations have, thus internal climate and employee
volunteerism is one thing that can differentiate an organization by giving them a
competitive advantage. For this reason, I have chosen to include organizational
citizenship behavior as one of the employee behavior variables to measure in this study.
About method for data collection about organizational citizenship behavior, there is still
some debate as to how organizational citizenship behavior should be measured.
Organizational citizenship behavior is measured by either self-ratings or other’s ratings
(Carpenter, Berry, & Houston, 2014). In this study, organizational citizenship behavior is
measured using self-reported information, and thus the research is limited by the typical
limitations of self-reported data.

39
The benefits of organizational citizenship behavior such as positive organizational
climate (DiPaola & Tschannen-Moran, 2014) have been well-documented. There is also
current research which has identified the underlying reality that organizational citizenship
behavior does have a cost (Somech, 2016) associated such as emotional fatigue (Bolino,
Hsiung, Harvey, & LePine, 2015). For this purposes of this research project that
measures the mediation of income level on the relationship between leadership variables
and organizational citizenship behavior, I hypothesize that higher income levels are
willing to pay more of the emotional cost associated with organizational citizenship
behavior than lower income levels.
Reduced withdrawal behavior. Withdrawal behavior is a term for a combination
of the following variables: turnover, absenteeism, tardiness, or calling in sick (Afsar et
al., 2017; Smith, Micich, & McWilliams, 2016). In this study, withdrawal behavior is
reversed to generate a wanted employee behavior. The inverse variable of withdrawal
behavior is reduced withdrawal behavior (Hassan & Hassan, 2015). There has been
empirical research on each of the sub-variables that comprise the withdrawal behavior
variable.
For example in a recent study (Waldman, Carter, & Hom, 2015) of Chinese
employees, the results indicated that transformational leaders tend to have less employee
turnover than transactional leaders. Similarly, a recent study found that there is an
inverse relationship between employee citizenship behavior and withdrawal behavior
(Smith, Micich, & McWilliams, 2016), which would indicate that this study should
confirm that there is a positive relationship between organizational citizenship behavior

40
and reduced withdrawal behavior. Corporate leaders are very interested in reducing
withdrawal behavior or mitigating the effects of the withdrawal behavior.
A recent Walden University dissertation researched ways to alleviate the effects
of withdrawal behavior (Alexander, 2016). Withdrawal behavior has been measured from
self-reported data (Hassan & Hassan, 2015) as well as from leader rated data (Renn,
Steinbauer, & Fenner, 2014). This project uses self-reported data to measure all of the
variables. However, the collection and analysis of leader reported performance data could
expand the research in the future.
Mediation Variable: Income Level
The mediation variable for this study is income level. Income level could be one
of the most important aspects of an employee’s response to leadership. Income level is
so important that a recent US research project studied the relationship between income
level and life expectancy (Chetty, Stepner, Abraham, Lin, Scuderi, Turner, Bergeron, &
Cutler, 2016). A relationship between income level and length of life implies that income
level may be one of the more significant variables associated with individual health.
Even though there are always exceptions, such as employees who have significant
family wealth, income is the reason employees are willing to give their time and talents to
the organization. According to Vohs (2013), not only does income level affect
employees directly by controlling the quality of life. Despite the fact that income is the
tangible link between employees and organizations, the current literature does not contain
as comprehensive research regarding this variable as the other variables previously
discussed.

41
Recent research (Hassan, S., Hassan, M., & Shoaib, 2014) has tested employee
engagement as a mediating variable, but there has been little research regarding income
level in this capacity. Recent research authors (Zardkoohi & Bierman, 2016; Cobb,
2016) have presented the idea that firms intentionally shape income inequality. Cobb
(2016) suggested that since the organization controls income wage decisions, the business
can develop the employment relationship in a way that most advantageous to the
employer. The entire power advantage according to Cobb (2016) lies with the corporate
stakeholders and executive decision makers.
One thing that Cobb does not consider is that in an economic system where forced
labor is not legal, labor is free to leave the organization if it becomes less economically
fair to its employees than other firms. A free labor market allows competitor firms to hire
employees away if they are not currently compensated fairly for their skills, labor, and
responsibility in their current employment situation. While the research of income level
is not currently exhaustive, there is an academic precedent for studying income level as a
predictor variable for organizational behavior (Leana & Meuris, 2015).
Not only does income level affect relationship within the workplace between
leaders and employees, but economic inequality can also be the motive for all sources of
social injustice up to and including murder (Daly, 2017). In an economic environment of
scarcity, humans have committed heinous crimes far exceeding the employee behavior I
have explored in this research project. Some examples of things people are willing to do
to capture a larger portion of a finite number of resources are as follows: wage war with
other people groups, attempt genocide of people groups perceived to have been the
42
beneficiaries of income inequality, overthrow governments, enslave people and publicly
torture people. Since the absence of resources can cause so many people to commit so
many horrible things, it could be possible that the presence of a moderate amount of
resources can influence people to comply with the intended desires of their leaders.
Synthesis of Seminal and Current Research
In the last 60 years, researchers have examined the relationship between
leadership and employee behavior in various ways (Adams, 1963; Blau & Blau, 1982;
Burns, 1978; Gerstner & Day, 1997). More recent literature has begun to consider this
relationship in combination with a third variable such as perceived organizational support
(Hassan & Hassan, 2015) or work stress (Yao, Fan, Guo, & Li, 2014). However, this
type of research is currently conducted outside the United States. This study continues
the current research trend of examining the leadership and employee behavior
relationship with a third variable and conducting this research on a U.S. population.
Many of the more recent studies have focused on the motivational or ethical
aspects of the relationship between leadership and employee behavior (Hassan & Hassan,
2015; Xinxin, 2013), which is a critical aspect of leadership. However, previous research
has failed to conclusively examine what external factors either detract from or add to the
effectiveness of the leadership on employee behavior. Again, since these previous
studies collected data outside of the United States, they are perhaps neglecting the most
important aspect of the leadership and employee behavior relationship in the US labor
market: employee income level.

43
Since the importance of income level is very high to Americans, and individuals
are free to search for jobs nationally with the most appealing level of income associated
(Corak, 2013), leaders need to understand how an individual employee’s income level
affects the relationship between the leader’s leadership and the employee’s behavior.
While this project does not offer a qualitative solution for leaders regarding
recommendations for leading the employees at various income levels, this project may
lay the groundwork for future qualitative leadership theory development that incorporates
the income level variable as a factor of influence on employee behavior. Leadership
theory has examined leadership in a variety of methods, and from various perspectives
(Dinh, Lord, Gardner, Meuser, Liden, & Hu, 2014), which further supports the premise
that a comprehensive leadership theory is desired by both scholars and practitioners alike.
In the discussion regarding employee behavior, managerial employees are
considered employees, and previous research has demonstrated that income level is
essential to managerial employees as well (Srivastava & Ali, 2016). Since income level
and leadership affect both labor and managerial employees, I intend to study employee
behavior at all levels. If a leader understands the affect income level has on an individual
employee, the leader could then manipulate that variable in a variety of ways including
pay-for-performance (Wang, Thornhill, & Zhao, 2016) to achieve the desired employee
behaviors from that individual.
Income level affects an employee in ways well beyond the workplace in a manner
that causes second and third order compounding effect on their work behavior. For
example, employees at lower income levels are less likely to purchase health insurance

44
(Lieberthal, 2016). This lack of health insurance could cause an employee to face major
debt consequences if they encounter significant unexpected health-related costs. The
added debt could then add stress or financial burden to the employee by requiring a
bankruptcy or a spouse to seek employment and thereby require the employee to be late
to work at times to provide childcare for the working spouse. However, employees at
higher income levels will more than likely have quality health insurance and thereby
prevent any substantial impact on their employment for the health-related costs to
themselves or their family members.
Leadership theory, in general, is continuing to evolve. A recent network analysis
of leadership theory (Meuser, Gardner, Dinh, Hu, Linden, & Lord, 2016) invested peer-
reviewed journal articles from 2000 to 2013. In this study, the authors (Meuser, et al.,
2016) studied the relationships that have from among the various existing theoretical
perspectives. Of interest to this study is the idea that leadership theory has a nature of
aggregation, meaning that previous theories can be combined to create a newer and more
dynamic leadership perspective (Dinh, et al., 2014). For example, a recent study that
servant leadership and serving culture can have a positive influence on employee and
organizational performance (Liden, Wayne, Liao, & Meuser, 2014), and this finding
could be combined with other findings such as any potential findings from this study to
create a comprehensive leadership model.
Methodology
The methodology for this study is a correlational, quantitative study. I have
selected a quantitative research methodology because it can be used in business can

45
generate recommendations by further developing an existing theory (Anderson, Sweeney,
Williams, Camm, & Cochran, 2013), and because the quantitative method is appropriate
for the continued advancement of leadership theory (Antonakis, 2017) in an incremental
way. I have chosen a correlational design using experimental differential analysis on
survey data because the goal of this study is to test the effectiveness of the mediation
variable, and an experimental differential method is the most appropriate method to test
something’s effectiveness (Johns, Hayes, Scicchitano, & Grottini, 2017).
According to Nebeker, Simon, Kalichman, Talavera, Booen, and Lopez-Arenas
(2015), experimental analysis designs answer the questions why and how. All of the
research questions presented in this prosed study are how questions. Since the primary
research question for this study is how employee income level mediates the relationship
between income level and employee behavior, a correlational, quantitative study using
survey data to perform the experimental differential analysis is the most appropriate. The
key action verb applicable to an experiment is a test (Nebeker, Simon, Kalichman,
Talavera, Booen, & Lopez-Arenas, 2015). This study tests the mediation effect of
employee income level on the relationship between leadership and employee behavior.
There are two elements of an experiment pertinent to this study: manipulation and
control (Nebeker et al., 2015). For this study, the manipulation is the inclusion and
removal of the income level variable, and the control is conducting the same exact
statistical analysis on the same dataset with the mediation variable present and with it
removed. This test allows me as a researcher to identify the level of impact income level
has on the relationship between leadership and employee behavior.

46
This study follows a three-step sequential process to test for mediation (Zhang,
Guo, Hu, & Liu, 2017). The first step in the process for this study is confirming that the
predictor variable, leadership, is a statistically significant predictor of the criterion
variable, employee behavior. To satisfy this step, regression was conducted to determine
the predictor value associated with leadership for the criterion variable of employee
behavior.
The second step is to confirm the relationship between the mediation variable and
the predictor variable. In order to accomplish this second step, research question 2 as
noted previously and restated below must be answered in a way that rejects the null
hypothesis and accepts the alternative hypothesis:
RQ2: How is employee income level related to leadership?
H2: There is a significant, positive relationship between employee income level and
leadership.
H0: There is no relationship between employee income level and leadership.
The final step in the process is regressing the predictor variable on both the
mediation variable and criterion variable to confirm or deny that the mediation variable is
a significant predictor of the criterion variable and that the previously significant
predictor variable now shows a reduction in significance (Zhang, Guo, Hu, & Liu, 2017).
So, the experimental aspect of this study is to test the relationship between leadership and
employee behavior without the presence of income level and then repeating the
relationship testing with the presence of the income level variable.

47
The research instruments and variables were chosen have a proven record of
success in previous research (Hassan & Hassan, 2015). The population and sample size
are based on my availability to data sources, namely the employees of my employer,
(Bureau of Labor Statistics, 2014 )and the research questions. Quantitative methods are
widely accepted, because of the close adherence to the scientific method (Kopf, Hsu,
Shows, & Albinsson, 2016). Since this study is using an experimental aspect in the
analysis, quantitative statistics are given more widely accepted evidence than using
qualitative assessment of a smaller number of responses.
Other Relevant Research
Other authors have conducted quantitative research to explore the relationship
between leadership and employee behavior, the study most similar to this one is the
Hassan and Hassan (2015) study, but there are ones with common research themes. For
example, in a recent study (Schmitt, Den Hartog, & Belschak, 2016), scholars used
mediation testing on similar variables but for different reasons. Schmitt, Den Hartog, and
Belschak (2016) examined work engagement as moderation and mediation variable for
the relationship between leadership and proactive work behavior. This is important to
this study because it is an example of a study that used mediation testing on the
relationship between leadership and employee behavior, just as this study does.
One significate difference between the Schmitt, Den Hartog, and Belschak (2016)
work and this study is the span of focus for the leadership and employee behavior
variables. In the Schmitt, Den Hartog, and Belschak (2016) article, the only leadership
variable explored was transformational leadership and the only employee behavior

48
variable explored was employee proactivity. While transformational leadership and
employee proactivity are certainly important components of leadership and employee
behavior, a finding based on such a narrow focus has narrow usefulness. This study
widens the finding implications to the larger concepts of leadership and employee
behavior as generalized conclusions.
The focus of another recent study (Wang, Demerouti, & Le Blanc, 2017) was
testing the mediation effect of employee adaptability on the relationship between
transformational leadership and job crafting. Similar to the Schmitt, Den Hartog, and
Belschak (2016) article, the Wang, Demerouti, and Le Blanc (2017) article tests a
meditational variable and a moderation variable on the relationship between a leadership
variable and an employee behavior variable.
Again, by only examine one leadership variable and one employee behavior the
research focus is very narrow, and while a narrow focus may be appropriate for a journal
article, the focus of this dissertation study is much more encompassing. Another
commonality between the Schmitt, Den Hartog, and Belschak (2016) article and the
Wang, Demerouti, and Le Blanc (2017) article is the fact that the latter confirmed the
finding that transformational leadership facilitates employee adaptability and proactivity.
While adaptability and proactivity are not targeted for research in this study, future
research could combine the design of these previous studies with this study to create an
even broader category for wanted employee behaviors.
Another recently completed study expanded the concept of leadership and
reduced withdrawal behavior by exploring the relationship between transformational

49
leadership and turnover intention (Wang & Hu, 2017). The Wang and Hu (2017) also
expanded the literature by conducting the study in a communist based country and by
studying a non-work related environment of Chinese physical education. The interesting
thing about the Wang and Hu (2017) study was that it involved athletic coaches instead
of traditional business leaders.
The authors repeatedly discussed the coach-athlete relationship (Wang & Hu,
2017), but this relationship is essentially a new perspective on the leader-member
exchange. The idea of combining reduced withdrawal behavior and leader-member
exchange is an important precedent for the foundational design of this study. Since it has
been established in the literature that different leadership variables and different
employee behavior variables can be combined, then they can be combined with both a
qualitative and quantitative analysis standpoint in future research.
A recent article conducted a study similar to the Hassan and Hassan (2015) study
(Xu, Loi, & Ngo, 2016). The premise of the Xu, Loi, and Ngo (2016) article was testing
the mediation effects of trust in the organization on the relationship between ethical
leadership and employee justice perceptions. Trust in organizations from Xu, Loi, and
Ngo (2016) is very similar to perceived organizational support from the Hassan and
Hassan (2015) study. Since both studies used similar mediation variables and similar
predictor variables with consistent results, a theory creation and practical application
regarding these variables can proceed. This is important for this study because if any
potential findings from this study can be combined with other research, new theory
regarding income level as a mediation factor can move forward.

50
Recently research models have expanded to more elaborate and complex versions
of the earlier models. For example, a recent study (Qian, Wang, Han, & Song, 2017)
described a double moderated mediation model of the influence of ethical leadership on
employee feedback seeking. In their study, Qian, Wang, and Song (2017) examined
leader-member exchange as a mediation variable for ethical leadership and employee
feedback seeking, they also examined emotional intelligence and work unit structure as
moderators on the mediated positive relationship between ethical leadership and
employee feedback seeking. The Qian, Wang, and Song (2017) research is important
preliminary research to this study because in explored leader-member exchange and
ethical leadership which are two of the leadership variables that I intend to collect data
for in this study.
In a German study (Blickle, Kane-Frieder, Oerder, Wihler, von Below, Schütte,
Matanovic, Mudlagk, Kokudeva, & Ferris, 2013), authors recently examined two
mediation variables on the relationship between leader power transmission and
effectiveness outcome. Leader power transmission is very similar to leader-member
exchange, and effective outcome is very similar to intended employee behavior, so the
German study is very similar in concept to this study. However, the mediation variables
tested in the German study (Bickle, et al., 2017) were based on leadership actions or
behaviors, and not a variable outside the leader-member exchange relationship. The data
set for this article (Bickle, et al., 2017) which consisted of 190 leaders and 476 followers
demonstrated that the findings could be generalized to a wider population.

51
Controversial Findings
Within the current literature, there are studies that have reported conflicting or
controversial findings. This section contrast studies, which conclude differing opinions
based on conflicting results. Some of the conclusions differ from previous research
because the data itself differs and others differ because the analysis conducted was not
consistent across all of the studies. The purpose of including this section in this study is
to demonstrate that the variables used in this study are not universally accepted.
However, even though there may not be a consensus regarding these variables, the
counterpoints to the variables do not influence either the research or intent of this study
by way of how the variables are to be included.
Predictor Variable: Leadership
In a recent publication regarding a Dutch mayor, Karsten and Hendriks (2017)
noted that even the term leader could be controversial. In societies where democratic
consensus is regarded as something that should be valued, some leaders shy away from
identifying as a leader even though they are in a leadership position. The authors
(Karsten & Hendriks, 2017) called this style of reaching a consensus bridging-and-
bonding leadership. This demonstrates that while the term leader may not be particularly
popular in certain democratic societies, organizations have an innate need for leadership.
For this purpose of this study, it is assumed that organizations as well as the individuals
within organizations both need and recognize the need for leadership.
In the discussion section of their publication, Karsten and Hendriks (2017)
explain that there are different dimensions to the aversion to leadership in the

52
Netherlands. They (Karsten & Hendriks, 2017) explained that there had been scholars
advocating for doing away with the term leadership in academic writing. While I
understand their viewpoint, I do not feel that it would be productive to simply stop
studying leadership because some scholars have decided they do not like the concept.
Granted, the term leadership is seen as a positive term in the culture that I am
researching, but even if the term leadership was not popular in my culture, I could not
exclude it from this study simply because others do not like some of the implications of
the term.
Ethical Leadership
Some authors (Wilson & McCalman, 2017) have end begun to challenge the
seemingly universally accepted concept of ethical leadership. Wilson and McCalman
(2017) presented a study which suggested that the current understanding of ethical
leadership is not effective and that ethical leadership needs some rebranding as leadership
for the greater good. Wilson and McCalman (2017) asserted that the core assumptions of
ethical leadership should be further examined and that process of investigation is
currently underway.
The reason given by Wilson and McCalman (2017) is that there are certain
leadership paradoxes that must be addressed and as such ethical leadership theory may be
better examined as a social practice theory. Wilson and McCalman (2017) call for
research into the paradoxical conceptualizations of ethical leadership. Wilson and
McCalman (2017) also present the concept of the greater good as the path forward;

53
arguing that the future research agenda should include the theory of leadership for the
greater good rather than the term ethical leadership.
However, even though Wilson and McCalman (2017) may argue that I should
have chosen to use leadership for the greater good as the variable name over ethical
leadership, I have chosen to use ethical leadership as the variable because it is a well-
established and commonly understood leadership variable. For the purpose of this study,
the subtle difference between leadership for the greater good and ethical leadership is not
material. Since the focus of this study is on employee income level, which is the
mediation variable rather than the predictor or criterion variables, any accepted leadership
variable should suffice.
Empowering Leadership
The authors of a recent study (Lee, Cheong, Kim, & Yun, 2017) suggested that
the results of empowering leadership should be questioned. Lee, Cheong, Kim, and Yun
(2017) conducted a survey regarding empowering leadership and task performance. They
(Lee et al., 2017) concluded that there could be a too-much-of-a-good-thing effect
because of the curvilinear relationship between task performance and empowering
leadership. In this study the relationship between job performance and empowering
leadership are examined, so the study may either confirm the previous work (Lee et al.,
2017) or present evidence to the contrary.
Another study (Lorinkova & Perry, 2017) also presented negative aspects of
empowering leadership. Lorinkova and Perry (2017) examined the concept of
empowering leadership in the context of cynicism and time theft. The authors

54
(Lorinkova & Perry, 2017) argue that a leader who is employing an empowering
leadership method could foster employee cynicism which leads to frustration and other
negative emotions. Once an employee is experiencing the negative emotions, they tend
to react in negative or unwanted ways. One of the ways an employee may react
negatively to empowering leadership is time theft, which is a passive way of hurting the
organization because the organization is using resources to pay for the employee’s time.
I do concede that there can be negative employee behavior results from a leader
with good intentions implementing a strategy of empowering leadership. However, for
the purpose of this study, it is not material wither or not empowering leadership can
negatively affect employee behavior. The emphasis in this study as it pertains to
empowering leadership and employee behavior is on how employee income level
interacts with either positive or negative impact on employee behavior because of
empowering leadership.
Gap Identified in Current Literature
It is fascinating that even when other authors attempt to build a comprehensive
theory by integrating older and newer leadership approaches (Dansereau, Seitz, Chiu,
Shaughnessy, & Yammarino, 2013); income level is not included as a consideration or
approach to leadership. Similarly, when contemporary scholars attempt to build a
comprehensive process model for leadership (Eberly, Johnson, Hernandez, & Avolio,
2013), income level is also omitted as a variable. If this study is able to demonstrate a
significant relationship effect of income level on the interaction between leadership and
employee behavior, perhaps a new process model could be created to include the income

55
level variable. Likewise, even current research focused on the micro level events
(Hoffman & Lord, 2013) do not include income as a factor for the interaction.
This glaring omission could explain why some authors are still questioning the
current consensus that transformational leadership is the most effective form of
leadership (van Knippenberg & Sitkin, 2013). Recent researchers have also investigated
leadership communication from a practical and theoretical perspective (Ruben &
Gigliotti, 2016) without incorporating the most tangible communication involved: the
wages given by the leader to the employee. Current literature also addresses transactional
leadership communication (Fairhurst & Connaughton, 2016) without addressing income
level, even when income level is the actual resource exchanged in the employment
relationship.
Although income level has been absent from leadership research, there has been a
great deal of study regarding income level and how organizations allocate income to
employees (Zardkoohi & Bierman, 2016). Employee behavior and income have been
studied together (Brown, Evans, Moser, & Presslee, 2016). Since previous literature
includes quantitative and qualitative studies regarding leadership, income level, and
employee behavior separately, the existing gap in the literature is how these three aspects
of the leader-employee relationship are connected.
Summary
Leadership, in general, is a well-researched and documented topic for the field of
management. Ever since Adams (1963) and Blau (1964), scholars continue to research
leadership, income, and employee behavior. However, they have not all been explicitly
56
researched in a combined quantitative manner. Leadership theory has expanded from the
traditional approaches of group-oriented, development-based and individual-based to
more modern approaches of vision-based, outcome-based, organizational, and non-
leadership (Dansereau, et al., 2013). Included in these approaches to leadership are
numerous types of leadership which have been studied from both a qualitative and
quantitative perspective (Dansereau, et al., 2013).
Leadership types are associated with the leadership theme. For example,
development-based leadership includes path-goal theory, decision-making model, servant
leadership, and situational leadership (Dansereau, et al., 2013). Even the most
contemporary themes like organizational leadership which uses a romance of leadership
type (Dansereau, et al., 2013), fail to give aspiring practitioners in the field of leadership
the tools needed to assess the implications of each leadership type on employee behavior
at varying income levels. Since leadership is required to lead teams of people with wide-
ranging income levels, leaders may need to adapt their leadership type to most
appropriately interact with employees at different income levels to maximize the
potential for employee behavior to meet intended outcomes. This research project could
be the first step towards a new leadership theory that gives future leaders the tools needed
to incorporate income level into their leadership decision-making process.

57
Chapter 3: Research Method
The purpose of this correlational, quantitative design study was to test the
mediating effects of employee income level on the relationship between leadership and
employee behavior within the United States. Hassan and Hassan (2015) established a
precedent for this type of research by examining the mediation effects of perceived
organizational support on the relationship between leadership and employee behavior. In
this study, I intended to introduce employee income level as a new meditation variable to
examine the relationship further.
In this section, the methodology, population, data collection plan, data analysis
plan are explained along with how this study overcomes threats to validity to prevent any
future criticism of this study. As a business leader, I became interested in the interaction
between leadership, employee behavior, and income level. Throughout my business
career, I have observed that policy implementation and strategic decisions at the
corporate level have been met with various employee behavioral responses at the
operational level.
The variance in the responses such as indifference or embracing the new policies
seemed to be correlated with the income level of the individual employee. Because I had
not collected any empirical data, prior to this study, this research was designed to test this
hypothesis which was based on lived experience. Although there may be other factors
that influence this outcome, income level seemed to be a factor that was consistent across
different operational units, demographics, and geographic locations.

58
Research Design and Rationale
The research design for this study was a quantitative, mediation design with
regression analysis of survey data. The predictor variables for this study were leader-
member exchange (Zivnuska, Kacmar, & Valle, 2017), organizational justice (Gozukara,
2017), and empowering leadership (Mekpor, Mekpor, Dartey-Baah, & Dartey-Baah,
2017). The criterion variables for this study were job performance (Joseph, Jin,
Newman, & O’Boyle, 2015), organizational citizenship behavior (Tuan, 2017), and
reduced withdrawal behavior (Smith, Micich, & McWilliams, 2016). The mediating
variable that I tested was employee income level (see Leana & Meuris, 2015).
Research Questions
The research questions for this study were focused on the interaction of employee
income level with leadership and employee behavior. Previous literature has continually
shown a significant relationship between leadership and employee behavior as well as the
qualitative theory that employee income level mediates the relationship between
leadership and employee behavior. However, the impact of employee income level on
the relationship between leadership and employee behavior had not been explored in the
previous literature using empirical data (Yao et al., 2014). In this study, I explored the
effects of employee income level on the relationship between leadership and employee
behavior as well as exploring the relationship between employee income level with
leadership and employee behavior individually.
Below are the research questions and hypotheses that I tested in this research
project:

59
RQ1: How does employee income level mediate the relationship between
leadership and employee behavior?
Ha: Employee income level partially mediates the relationship between leadership
and employee behavior.
H0: Employee income level does not mediate the relationship between leadership
and employee behavior.
RQ2: How is employee income level related to leadership?
Ha: There is a significant, positive relationship between employee income level
and leadership.
H0: There is no relationship between employee income level and leadership.
RQ3: How is employee income level related to employee behavior?
Ha: There is a significant, positive relationship between employee income level
and employee behavior.
H0: There is no relationship between employee income level and employee
behavior.
Methodology
Population
The targeted population for this study was individuals employed in the United
States. I intended to gather my sample from the employee population of a construction
and facility services company, however at the oral defense it was decided that a random
sampling of the population from a wider sample pool would be more representative. The
survey was designed such that any full-time employee of any for-profit, private sector

60
business could participate. The population of full-time employees in the U.S. totals
approximately 100 million (Bureau of Labor Statistics, 2014).
Sampling
To achieve a representative sample, I planned to use the services of Qualtrics to
recruit participants and administer the survey. If there were not enough responses from
Qualtrics, I could have expanded the sampling to the Walden University participant pool.
I intended to perform linear multiple regression analysis, so my minimum sample size is
74 valid responses based on the results of a G*Power test shown in Figure 3. This
sample size was selected to achieve a 95% confidence interval and a margin of error of
5%.
Figure 3. G*Power output for sample size.
Procedures for Recruitment, Participation, and Data Collection
I intended to recruit participants from one company by sending the Qualtrics
anonymous link through the company’s e-mail system. As an alternative to that
recruiting method, I planned to use the paid portion of the Qualtrics participant pool. As
a tertiary recruiting method if Qualtrics failed, I planned to use the Qualtrics link and
recruit participants through the Walden University’s participant pool. If I received too

61
many responses, I planned to use SPSS to narrow the sample of respondents for my
statistical analysis.
The only piece of demographic information that I intended to collect for this study
was the participant’s annual household income. While other demographic information
could be useful for follow-up research, I wanted to limit the amount of personal
information requested for this study to give participants the greatest amount of anonymity
as possible. I thought that if participants believed they could not be identified by their
personal information, they were more likely to respond to questions regarding their
leadership. An informed consent acknowledgment was the first response option given in
the survey. I used a force response function to omit any response without a positive
response to the informed consent variable from entry into the data management system.
I intended to collect the data using a web-based survey portal. I also had a plan to
distribute paper surveys at my workplace, but I did not receive a letter of cooperation
from the company before data collection. For the final study, I used Qualtrics to provide
the participant pool to receive approval from the company, marking this change in data
collection on my IRB application for approval. Qualtrics was able to provide the
required dataset in a number of hours from the launch of the recruiting effort.
Instrumentation and Operationalization of Constructs
The survey instrument that I used was used by Hassan and Hassan (2015). The
Hassan and Hassan survey was a combination of previously established surveys:
• Leader-member exchange, α=.93 (Janssen & Yperen, 2004)
• Organizational justice α=.95 (Francis & Barling, 2005)

62
• Empowering leadership, α=.94 (Vecchio, Justin, & Pearce, 2010)
• Job performance α=.91 (Chiang & Hsieh, 2012)
• Organizational citizenship behavior α=.86 (Chiang & Hsieh, 2012)
• Reduced withdrawal behavior α=.90 (Eisenberger et al., 2001)
The predictor variable was leadership, the criterion variable was employee
behavior, and the mediation variable was employee income level. I have received written
permission to use Hassan and Hassan’s (2015) research tools and concept via e-mail
(Appendix A). The only modification I made to the survey to was removing the
perceived organizational support mediation variable and replacing it with the continuous
variable of employee income level. Because the research design was similar, the survey
instruments were appropriate for this study.
Except for the employee income level variable, I gathered the same questionnaire
items as Hassan and Hassan’s (2015) study using a sample from a different population.
The questionnaire items were tested for reliability and validity before inclusion for
analysis. The survey included a 5-point Likert scale to quantify each predictor and
criterion variable. The mediation variable was a continuous variable. The survey
questions are below.
Predictor Variables
Leader-Member Exchange (α = TBD)
LMX1- My supervisor personally helps me solve problems.
LMX2- My relationship with my supervisor is effective.
LMX3- My supervisor defends my decisions.

63
LMX4- My supervisor considers my suggestions.
LMX5- My supervisor and I are suited to each other.
LMX6- My supervisor understands my problems.
LMX7- My supervisor recognizes my potential.
Organizational Justice (α = TBD)
Distributive fairness.
OJdf1- I am rewarded fairly for my responsibilities.
OJdf2- I am rewarded fairly for my experience.
OJdf3- I am rewarded fairly for my efforts.
OJdf4- I am rewarded fairly for my work.
OJdf5- I am rewarded fairly for my stress from the job.
Interactional justice.
OJij1- My supervisor considers my viewpoint.
OJij2- My supervisor considers situations objectively.
OJij3- My supervisor provides me timely feedback.
OJij4- My supervisor treats me with kindness.
OJij5- My supervisor shows concern for employee’s rights.
Procedural Justice
OJpj1- My employer collects information about any decision regarding
complaints.
OJpj2- My employer gives employees the opportunity to appeal decisions
regarding complaints.

64
OJpj3- My employer follows standards and policies for decision-making
regarding complaints.
OJpj4- My employer listens to the concerns from all parties involved with
a complaint.
Empowering Leadership (α = TBD)
EL1- My supervisor encourages me to find solutions.
EL2- My supervisor urges to assume responsibilities.
EL3- My supervisor asks for advice in the problem-solving process.
EL4- My supervisor urges me to see problems as opportunities.
EL5- My supervisor advises me to look for opportunities.
EL6- My supervisor encourages me to see failure as a chance of learning
EL7- My supervisor urges me to work in a team.
EL8- My supervisor encourages me to work with other employees within the
organization.
Criterion Variables
Job Performance (α = TBD)
JP1- I exceed my job responsibilities.
JP2- I meet standards.
JP3- I give satisfactory performance.
JP4- I am effective at my job.
JP5- I produce high-quality work.
Organization Citizenship Behavior (OCB) (α = TBD)

65
Altruism
OCBa1-I help others with their workload.
OCBa2- I help when someone is absent.
OCBa3- I help solve work-related problems.
OCBa4- I help new people.
OCBa5- I am always ready to help.
Courtesy
OCBc1- I prevent problems
OCBc2- I affect others positively.
OCBc3- I avoid creating problems.
OCBc4- I have a positive impact on others.
Civic Virtue
OCBcv1- I attend all meetings.
OCBcv2- I attend optional functions.
OCBcv3- I keep abreast of change.
OCBcv4- I read organizational memos.
Reduced Withdrawal Behavior (α = TBD)
RWB1- I am punctual.
RWB2- I always begin my work on time.
RWB3- My work attendance is above the norm.
RWB4- I always give advance notice when I will miss work.

66
Mediation Variable
Income level: This variable is a continuous variable for annual household income
measured in U.S. Dollars.
Data Analysis Plan
The data analysis plan for this study was developed to answer the research
questions:
RQ1: How does employee income level mediate the relationship between
leadership and employee behavior?
Ha: Employee income level partially mediates the relationship between leadership
and employee behavior.
H0: Employee income level does not mediate the relationship between leadership
and employee behavior.
RQ2: How is employee income level related to leadership?
Ha: There is a significant, positive relationship between employee income level
and leadership.
H0: There is no relationship between employee income level and leadership.
RQ3: How is employee income level related to employee behavior?
Ha: There is a significant, positive relationship between employee income level
and employee behavior.
H0: There is no relationship between employee income level and employee
behavior.
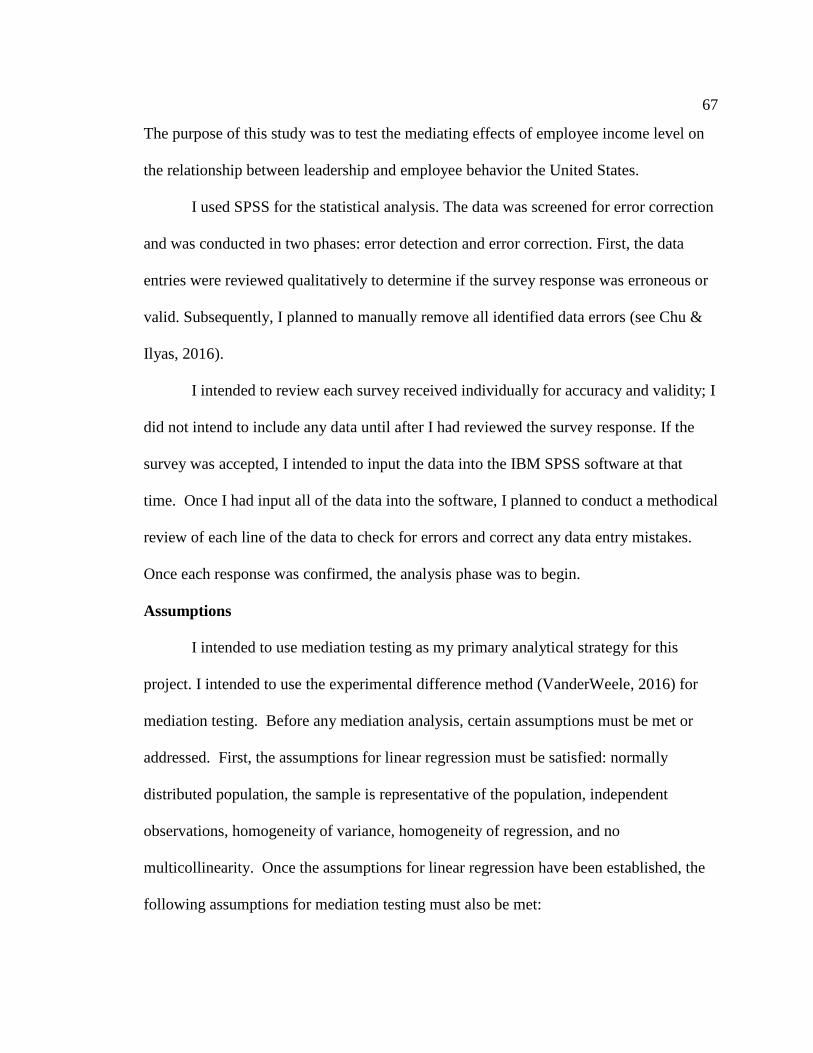
67
The purpose of this study was to test the mediating effects of employee income level on
the relationship between leadership and employee behavior the United States.
I used SPSS for the statistical analysis. The data was screened for error correction
and was conducted in two phases: error detection and error correction. First, the data
entries were reviewed qualitatively to determine if the survey response was erroneous or
valid. Subsequently, I planned to manually remove all identified data errors (see Chu &
Ilyas, 2016).
I intended to review each survey received individually for accuracy and validity; I
did not intend to include any data until after I had reviewed the survey response. If the
survey was accepted, I intended to input the data into the IBM SPSS software at that
time. Once I had input all of the data into the software, I planned to conduct a methodical
review of each line of the data to check for errors and correct any data entry mistakes.
Once each response was confirmed, the analysis phase was to begin.
Assumptions
I intended to use mediation testing as my primary analytical strategy for this
project. I intended to use the experimental difference method (VanderWeele, 2016) for
mediation testing. Before any mediation analysis, certain assumptions must be met or
addressed. First, the assumptions for linear regression must be satisfied: normally
distributed population, the sample is representative of the population, independent
observations, homogeneity of variance, homogeneity of regression, and no
multicollinearity. Once the assumptions for linear regression have been established, the
following assumptions for mediation testing must also be met:

68
• There is a significant correlation between the predictor variable and the
criterion variable.
• There is a significant correlation between the predictor variable and the
mediation variable.
To demonstrate the above assumptions for mediation testing are satisfied the following
relationships needed to be examined:
• Leadership and employee behavior
• Leader-member exchange and organizational citizenship behavior
• Leader-member exchange and job performance
• Leader-member exchange reduced withdrawal behavior
• Organizational justice and organizational citizenship behavior
• Organizational justice and job performance
• Organizational justice and reduced withdrawal behavior
• Empowering leadership and organizational citizenship behavior
• Empowering leadership and job performance
• Empowering leadership and reduced withdrawal behavior
• Leadership and employee income level
• Leader-member exchange and income level
• Organizational justice and income level
• Empowering leadership and income level

69
Analysis
Once the data set has met the assumptions or the assumptions have been
addressed, I planned to test the variables for validity using Cronbach’s α (Taber, 2016). I
intended to omit any variables that do not pass the validity testing from the analysis.
Next, a correlation analysis was to be conducted to determine significant relationships
between the predictor, criterion, and mediation variables. The third step in the analysis
process was to conduct linear regression analysis to find the level of impact the predictor
variables have on the criterion variables.
A multiple linear regression model was used to determine the effect of the
mediation variable on the predictor and criterion variables with the mediation variable
present and without the mediation variable present. The results of the regression models
were compared and contrasted to determine the level of mediation present. Hassan and
Hassan (2015) demonstrated that perceived organizational support partially mediates the
relationship between leadership and employee behavior using a similar methodology, and
I have obtained the authors’ permission to partially replicate their study.
Threats to Validity
With every study, there are threats to validity. At present, validity theory is
broken into various aspects of validity (Shono, Ames, & Stacy, 2016). To address the
threats to validity for this study, this section will list the internal, external, and construct
threats along with my response to each threat. In some cases, the threat can be mitigated,
and in other situations, the threat must be accepted for this study and resolved by future
research.

70
Internal Validity
The primary concern of internal validity from a theoretical standpoint was
variable content and interaction (Shono, Ames, & Stacy, 2016). In this study, the
relationship between the variables is established in previous literature from both an
individual item and an interaction perspective (Hassan & Hassan, 2015). Since the
variable design does not contain a significant threat to validity, the primary threat to
validity in this study was the accuracy of responses. The primary threat to internal
validity was the nature of the responses generated through self-reporting.
The error to variable data within certain variable could also be a threat to validity
because of the self-reported nature of the data. For example, a survey participant
answering a question about their organizational citizenship behavior or reduced
withdrawal behavior may not answer truthfully because they either do not have an honest
opinion of themselves or they may fear consequences from their employer if somehow
their supervisor was able to learn that they are less than an ideal employee. In addition to
intentional deception on the part of the participants, there is also a risk that the employee
does not have an accurate evaluation of themselves.
A recent study (Junco, 2013) demonstrated that people might not know as much
about themselves as we would like them to by asking how many times per day people
check their Facebook. The researcher (Junco, 2013) then used monitoring software to
count the usage and compared the results to the self-reported data. The author (Junco,
2013) concluded that while the individuals can approximate their usage, it was not
accurate enough to use for scholarly research. Also, since I intend to collect the survey

71
data from all participants at a single point in time, there should be no threat of history,
maturation, instrument change, or repeated testing for this project.
External Validity
This study did contain threats to external validity. The primary external validity
threat for this study was selection bias. However, during data collection, Qualitrics was
able to reach a wide range of participants and mitigate any threat of selection bias. Within
the population, the income level distribution may skewed rather than normally distributed
since there would most likely be a higher number of responses at the lower income levels
than responses from higher income earners.
I planned to mitigate this threat by using quota sampling by setting a requirement
that the responses to be capped equality by income range to ensure there was a variety of
income responses. Since the dataset comes from one source, the conclusion may not be
able to be generalized across the entire population without further research to confirm the
results. The selection bias for this study could have been accepted for this study, but
future research should replicate the survey and analysis on different samples within the
population to eliminate the external validity threat (Fiske, 2016).
Construct Validity
The primary construct validity threat for this project, as described in the Hassan
and Hassan (2015) study was mono-method bias resulting from using one type of scale
for a majority of the variables. I was able to partially mitigate the mono-method bias
threat by using a different categorical scale for the mediation variable. Another construct
threat to this project was restricted generalizability across constructs. Since I only
72
examined a limited number of predictor and criterion variable, the results of the
mediation testing were limited to the variables tested. Another threat to construct validity
for this project was self-reported data. All of the data collected for this study was self-
reported. Since this project was intended to be a starting point for future research in the
advancement of leadership theory, self-reported data was appropriate (Brutus, Aguinis,
and Wassmer, 2013), but did limit the study.
Ethical Procedures
To meet IRB requirements, and satisfy any ethical concerns for human testing, I
needed to gain individual informed consent, and all participants need to be volunteers.
The IRB approved the informed consent language used at the beginning of the survey as
well as the implied consent clause that indicated consent was implied by completion of
the survey. The voluntary nature of the study, as well as other informed consent clauses,
were reviewed and approved by the IRB as well.
To gain individual informed consent, the first page of the survey was a forced
response required acknowledgment of the informed consent information. No respondents
were allowed to proceed to the survey without this required step. I did not gather any
demographic or personal information except income level to protect the privacy of the
survey participants. As the research analyst, I will never have access to the identity of
any of the participants, and all data gathered will remain confidential. The data will only
be used for this academic research project and subsequent similar research opportunities.

73
Summary
This quantitative survey design study expanded the current understanding of the
relationship between leaders and employees. By collecting data on the United States
employee population through a survey, this research design might become a foundational
study of future leadership theory development that expands upon the existing Equity
Theory. While additional research may be required to generalize the results further, this
study established a precedent for leadership research that incorporates income level as an
influential factor for analysis.
Previous authors have explored mediation variable influence on the relationship
between leadership and employee behavior, but to fully understand how leadership and
employee behavior interact, more information is needed. Since the relationship between
leadership and employee behavior is one of the most important to business operations,
and income is perhaps the most important part of that relationship to both parties
involved, this study may expand the understanding of this relationship in such a way that
significantly alters the leadership paradigm.

74
Chapter 4: Results
In this chapter the results of this study include the data collection process as well
as the statistical findings relevant to the research questions and hypotheses:
RQ1: How does employee income level mediate the relationship between
leadership and employee behavior?
Ha: Employee income level partially mediates the relationship between leadership
and employee behavior.
H0: Employee income level does not mediate the relationship between leadership
and employee behavior.
RQ2: How is employee income level related to leadership?
Ha: There is a significant, positive relationship between employee income level
and leadership.
H0: There is no relationship between employee income level and leadership.
RQ3: How is employee income level related to employee behavior?
Ha: There is a significant, positive relationship between employee income level
and employee behavior.
H0: There is no relationship between employee income level and employee
behavior.
The purpose of this study was to test the mediating effects of employee income level on
the relationship between leadership and employee behavior the United States.

75
Data Collection
The data collection plan for this research project was modified throughout the oral
defense of the proposal and IRB approval process. The IRB approval number for this
study from Walden University’s IRB is 01-12-18-0500309. While the original data
collection plan involved using my employer’s employee population and Walden
University’s participant pool as possible sources of data, I decided that an independent
survey company such as Qualtrics would be able to provide a dataset free from the
selection bias associated with using my employer. Although the cost of using a
commercial firm to recruit participants was higher than using a free source, it was a better
option from an academic and scheduling perspective.
Upon receiving approval from the IRB to proceed with data collection, I began to
work with Qualtrics to launch my online survey and went through the process to gain
access to the Walden University participant pool. Less than 1 week after IRB approval,
Qualtrics had returned 106 responses to my survey. With the assumption that at least 74
of them would be valid responses, I concluded my data collection process. The response
rate for this survey was 10% according to Qualtrics’ recruiting team.
Changes to Data Collection Plan
There was only one relevant change required to the data collection and cleaning
plan as described in Chapter 3. My original plan to clean the dataset was to manually
check each response as I entered the response data into SPSS. However, the functionality
of Qualtrics provided me the dataset in SPSS format, which eliminated any possible data
entry mistakes from the survey response to the dataset used for analysis. Qualtrics also
76
rejected any incomplete responses as invalid. After the dataset was uploaded to SPSS all
that was required was to eliminate erroneous responses such as responses where a
participant selected the same choice for all questions.
Representative Sample
In order to achieve a representative sample of the population, I added two
verification questions prior to allowing participants to advance to the research survey.
The first question ensured that the respondent was currently employed in the United
States, and only participants with a yes answer were allowed to continue to the survey.
The second question was a categorical question regarding the participant’s annual
household income using the following categories for response:
1. $0-50,000
2. $50,000-$100,000
3. Over $100,000
The categories were chosen to ensure the sample contained responses from the
entry level, management level, and executive level of incomes. Qualtrics then capped the
participants allowed to continue to the survey at 33% for the first response, 34% for the
second, and 33% for the third. This step ensured that the dataset would contain
information for each of these income levels to generate an appropriate quota sample
(Moser & Stuart, 1953). While the dataset does not represent the whole population, there
were essentially three separate representative samples taken, one from each income
bracket. This sampling method was required in order to meet the normal distribution

77
requirement for the research design regarding mediation testing (Fairchild & MacKinnon,
2009).
The raw dataset consisted of 106 completed responses, and 95 of them were
complete and valid responses. The data was cleaned using an 8-step process:
1. I verified that all responses had a different IP address and were generated at a
different latitude and longitude, geographic location, to ensure that an
individual did not submit multiple responses.
2. I verified that all responses completed 100% of the survey.
3. I verified that all responses took an appropriate amount of time to complete
the survey.
4. I verified that all participants responded yes to the employment verification
question.
5. I checked all responses for a valid income level response.
6. I removed the nine responses with invalid income level responses.
7. I corrected the formatting to the income inputs to delete non-numeral
characters such as commas or dollar signs.
8. I removed two responses that answered the same response to all of the
questions.
Eleven invalid responses were removed from the dataset prior to any validity testing or
subsequent analysis. This left a dataset with 95 valid responses with a targeted sample of
74. There was no demographic information collected other than the annual household

78
income which had a range of $11,000 to $500,000 per year with a mean income of
$87,105.
Study Results
This section displays the results of the testing performed on the data. However,
the detailed interpretation and implications derived from the analysis will be explained in
Chapter 5. The first step in the data analysis process once the dataset was cleaned for
erroneous or invalid responses as previously described was to test the internal validity of
the variable instruments. The reliability test was the Cronbach’s α, and the test was run
via SPSS 24 on each variable category.
Sampling Accuracy and Reliability
The first step in the statistical testing procedure was to test the sample for
accuracy and reliability. The sample was tested for accuracy using Kaiser-Meyer-Olkin
(KMO) and was tested for reliability using Cronbach’s α. As shown in Table 1, the KMO
measure of sampling adequacy was strong for the independent variables of leader-
member exchange, organizational justice, and empowering leadership with a score of
.936. The KMO test is a scale of 0 to 1 with scores close to 1 demonstrating the strongest
sampling adequacy and a score of .6 is the normal minimum score (Williams, Onsman &
Brown, 2010).
The results of the Cronbach’s α testing showed that the leadership variables could
be used as stand-alone variables for future research using this dataset, but while the
employee behavior variables were high enough to be considered reliable scales, they did
not pass the .9 threshold. For the employee behavior analysis using this dataset, the three

79
employee behavioral categories must be aggregated to meet the .9 threshold for
Cronbach’s α. The entire 95 response dataset was used for these sampling tests, and the
results of the Cronbach’s α tests are shown in Table 1.
Table 1 Sample Reliability
Variable name Variable acronym Cronbach’s α Number of
items Leader-member exchange LMX .952 7 Organizational justice OJ .943 14 OJ – Distributive fairness OJdf .903 5 OJ – Interactional justice OJij .917 5 OJ – Procedural justice OJpj .883 4 Empowering leadership EL .909 8 Leadership Total .972 29 Job performance JP .796 5 Organizational citizenship behavior OCB .880 13 OCB – Altruism OCBa .801 5 OCB – Curtesy OCBc .744 4 OCB – Civic virtue OCBcv .694 4 Reduced withdrawal behavior RWB .676 4 Employee Behavior Total .906 22
The next step in the analysis process was combining the various variables
generated by each survey question into new variable categories. Using the compute
variable function from SPSS 24, I created a mean variable category that combined the 51
multiple choice responses into the following groups: leader-member exchange,
organizational justice, empowering leadership, job performance, organizational
citizenship behavior, and reduced withdrawal behavior. I also coded each of these
variable categories to match the acronyms shown in Table 2 for each variable category.

80
Table 2 Descriptive Statistics
Variable name Variable acronym Mean Standard
Deviation N
Leader-member exchange LMX 3.5 1.037 95 Organizational justice OJ 3.5 .792 95 Empowering leadership EL 3.6 .813 95 Job performance JP 4.3 .592 95 Organizational citizenship behavior OCB 4.1 .467 95 Reduced withdrawal behavior RWB 4.3 .538 95 Income level IL 87,105 69,567 95
The outcome of the means for each variable was anticipated by nature of self-reported
data; the respondents seem to have graded their own performance slightly higher than
that of their leaders.
Regression Assumptions
In order to use regression analysis, the assumptions for regression must be met.
These assumptions are normally distributed population, a representative sample of the
population, independent observations, homogeneity of variance, no multicollinearity, and
a signification correlational relationship between the predictor and criterion variables
(Berry, 1993). For this study, the assumptions of a representative sample and
independent observations were not tested, but the data collection was designed to address
these assumptions. The remaining assumption are discussed individually in this section.
Normal distribution. The first assumption for regression tested is normal
distribution. The skewness and kurtosis with associated standard error information for
income level, leadership, and employee behavior are shown in Table 3. Figures 4, 5, and
6 display the distribution of the three variables as a histogram.

81
Table 3 Sample Distribution
Variable Name Skewness Std. Error Kurtosis Std. Error Leadership -0.847 0.247 .292 0.490 Employee Behavior -0.514 0.247 .344 0.490 Income Level 2.749 0.247 12.873 0.490
Figure 4. Leadership distribution histogram.
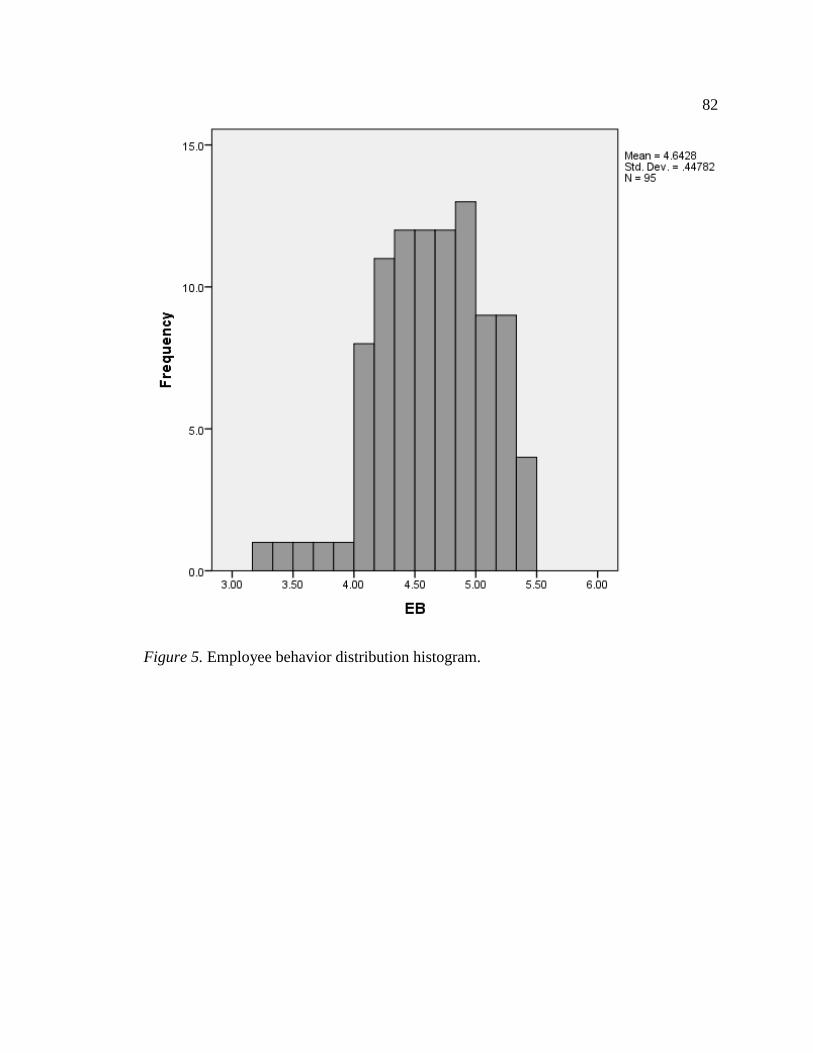
82
Figure 5. Employee behavior distribution histogram.

83
Figure 6. Income level distribution histogram.
Based on Table 3 and Figures 4-6, it is clear that the variables are slightly skewed, but
within an allowable range to be considered normally distributed for regression testing.
Multicollinearity. Another assumption for regression is that there is no
multicollinearity among the predictor variables. As demonstrated in Table 4, the variance
inflation factor (VIF) for each variable tested is between 1 and 10. A VIF value between
1 and 10 indicates that there is no multicollinearity among the variables.

84
Table 4 Regression Model–Multicollinearity Test
Model
Unstandardized Coefficients
Standardized Coefficients
t Sig.
Collinearity Statistics
B Std. Er Beta Tolerance VIF 1 (Constant) 4.607 .252 18.298 .000
LMX 0.035 0.103 0.08 0.337 0.737 0.179 5.586 OJ 0.027 0.107 0.047 0.25 0.803 0.285 3.503 EL -0.007 0.111 -0.012 -0.061 0.951 0.251 3.988 IL -1.78E-06 0 -0.276 -2.712 0.008 0.98 1.021
Note. a. Dependent Variable: Employee Behavior
Homogeneity of variance. In order to test for a problem with heteroscedasticity,
a residual variable was saved from the regression model in Table 4 and regressed with the
same variables. The results shown below in Table 5 show a significance value greater
than .05 for each variable. Therefore, the assumption for homogeneity of variance has
been met.
Table 5 Homogeneity of Variance Test: Glejser Test
Model
Unstandardized Coefficients
Standardized Coefficients
t Sig.
Collinearity Statistics
B Std.
Error Beta Tolerance VIF 1 (Constant) 0.435 0.136 3.187 0.002
LMX 0.084 0.056 0.372 1.516 0.133 0.179 5.586 OJ -0.079 0.058 -0.266 -1.367 0.175 0.285 3.503 EL -0.028 0.060 -0.097 -0.469 0.640 0.251 3.988 IL 7.191E-08 0.000 0.021 0.203 0.840 0.980 1.021
Note. a. Dependent Variable: Absolute Residual Value

85
Variable correlation. The final assumption for regression is that the variables
have a significant relationship. All of the leadership variables and employee behavior
variables were tested for correlation using the Pearson Moment correlation test. The
correlations are shown in Table 6. It is interesting to note that unlike the Hassan and
Hassan (2015) study that found significant positive relationships for all of the variables,
the data here only showed a significant relationship in 8 of the 21 relationships. A
Pearson value of 0 to 0.2 means that there is almost no correlation between the variables.
Of note from Table 7, the income level variable did not show any correlation to any of
the predictor or criterion variables.
Also, the leadership variables showed a high correlation to the other leadership
variables but no correlation to the employee behavior variables. The highly correlated
relationships among the income level variables were also shown to be significant at the
.01 level. Similarly, the employee behavior variables did not show a correlation between
the leadership variables but did demonstrate a correlation between the other employee
behavior variables. Also, the employee behavior variable correlational relationship is
significant to the .01 level.

86
Table 6 Pearson Correlation Coefficients
IL LMX OJ EL JP OCB RWB IL 1 0.035 0.028 -0.040 -.257* -0.182 -.237* Sig. 0.739 0.786 0.701 0.012 0.078 0.021 LMX 1 .841** .859** 0.137 0.159 -0.040 Sig. 0.000 0.000 0.185 0.123 0.699 OJ 1 .766** 0.112 0.127 0.010 Sig. 0.000 0.278 0.221 0.927 EL 1 0.120 0.165 -0.017 Sig. 0.246 0.110 0.874 JP 1 .563** .562** Sig. 0.000 0.000 OCB 1 .550** Sig. 0.000 RWB 1
Note. *. Correlation is significant at the 0.05 level (2-tailed). **. Correlation is significant at the 0.01 level (2-tailed).
Linear Regression
The original plan to answer RQ2: How is employee income level related to
leadership? and RQ3: How is employee income level related to employee behavior? was
to use Pearson correlation testing followed by a linear regression model to explain how
much of the variance in the employee behavior variables and the leadership variables
could be explained by income level. However, this plan assumed that there would be a
significant correlation between leadership and income level as well as between employee
behavior and income level.
For the purpose of displaying the complete results, the regression information is
shown below, even though the variables are not correlated. Tables 7 and 8 display the

87
results of the regression model associated with RQ2, and Tables 9 and 10 are the results
of the regression model used to answer RQ3.
Table 7 Leadership and Income Level Regression Model
R R Square Adjusted R
Square Std. Error of the Estimate
.010a .000 -.011 .83298 Note. a. Predictors: (Constant), IL Table 8 Leadership and Income Level Regression Coefficients
Unstandardized Coefficients
Standardized Coefficients
t Sig.
Collinearity Statistics
B Std. Error Beta Tolerance VIF (Constant) 3.566 .137 25.953 .000 IL 1.240E-
7 .000 .010 .100 .920 1.000 1.000
Note. a. Dependent Variable: Leadership
Based on the results shown above in Table 7 the R Square value for the linear
regression model is 0, which means that no part of the variance in leadership is due to the
predictor variable income level. Also, as shown in Table 8, the regression model has a
significance of .920 which does not meet the .05 threshold for significance.
Table 9 Employee Behavior and Income Level Regression Model
R R
Square Adjusted R Square
Std. Error of the Estimate
.271a .074 .064 .43331 Note. a. Predictors: (Constant), Income Level
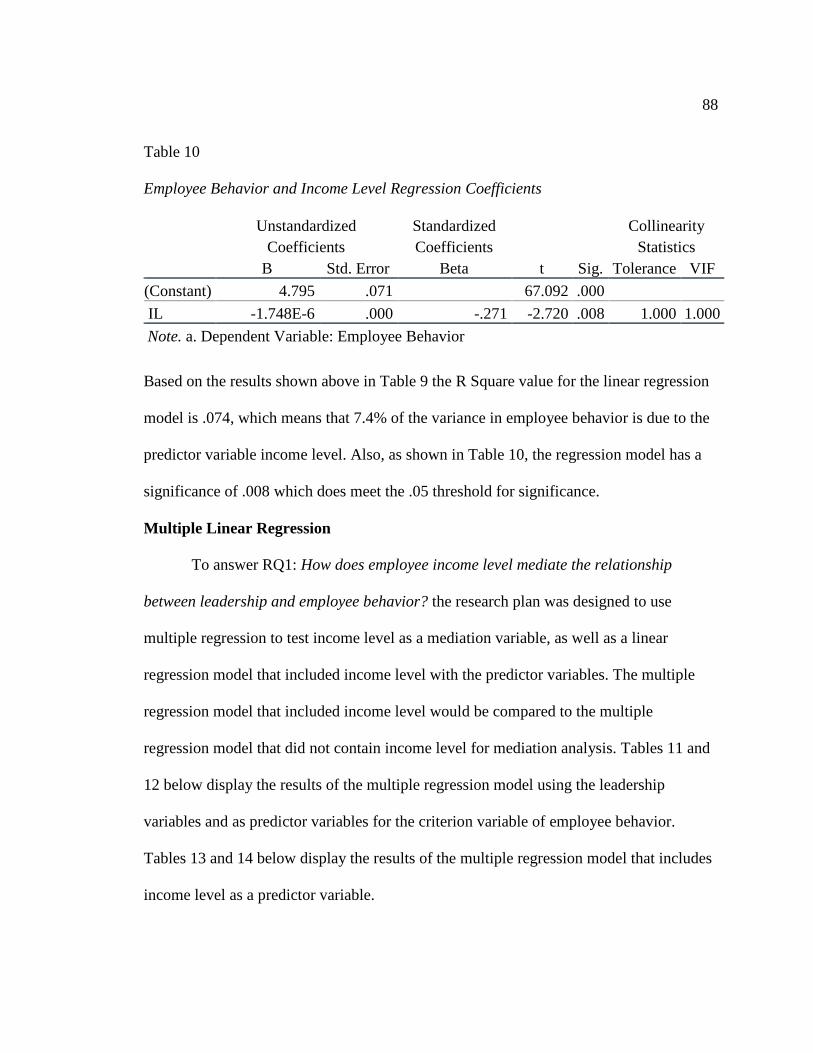
88
Table 10 Employee Behavior and Income Level Regression Coefficients
Unstandardized Coefficients
Standardized Coefficients
t Sig.
Collinearity Statistics
B Std. Error Beta Tolerance VIF (Constant) 4.795 .071 67.092 .000 IL -1.748E-6 .000 -.271 -2.720 .008 1.000 1.000 Note. a. Dependent Variable: Employee Behavior
Based on the results shown above in Table 9 the R Square value for the linear regression
model is .074, which means that 7.4% of the variance in employee behavior is due to the
predictor variable income level. Also, as shown in Table 10, the regression model has a
significance of .008 which does meet the .05 threshold for significance.
Multiple Linear Regression
To answer RQ1: How does employee income level mediate the relationship
between leadership and employee behavior? the research plan was designed to use
multiple regression to test income level as a mediation variable, as well as a linear
regression model that included income level with the predictor variables. The multiple
regression model that included income level would be compared to the multiple
regression model that did not contain income level for mediation analysis. Tables 11 and
12 below display the results of the multiple regression model using the leadership
variables and as predictor variables for the criterion variable of employee behavior.
Tables 13 and 14 below display the results of the multiple regression model that includes
income level as a predictor variable.

89
Table 11 Leadership and Employee Behavior Regression Model
R R Square Adjusted R
Square Std. Error of the Estimate
.108a .012 -.021 .45250 Note. a. Predictors: (Constant), EL, OJ, LMX
Table 12 Leadership and Employee Behavior Regression Coefficients
Unstandardized Coefficients
Standardized Coefficients
t Sig.
Collinearity Statistics
B Std. Error Beta Tolerance VIF (Constant) 4.419 .250 17.649 .000 LMX .006 .106 .015 .060 .952 .181 5.528 OJ .021 .110 .037 .190 .850 .286 3.502 EL .035 .114 .063 .305 .761 .256 3.912 Note. a. Dependent Variable: Employee Behavior
Based on the results shown in Table 11 the R Square value for the linear
regression model is .012. This means that only 1.2% of the variance in employee
behavior is due to the leadership predictor variables. Also, as shown in Table 12, the
regression model coefficients show that none of the predictor variables have a
significance value that meets the .05 threshold for significance.

90
Table 13 Leadership and Employee Behavior Regression Model
R R Square Adjusted R
Square Std. Error of the Estimate
.294a .086 .046 .43748 Note. a. Predictors: (Constant), IL, LMX, EL, OJ
Table 14 Leadership and Employee Behavior Regression Coefficients
Unstandardized Coefficients
Standardized Coefficients
t Sig.
Collinearity Statistics
B Std. Error Beta Tolerance VIF (Constant) 4.607 0.252 18.298 0.000 LMX 0.035 0.103 0.080 0.337 0.737 0.179 5.586 OJ 0.027 0.107 0.047 0.250 0.803 0.285 3.503 EL -0.007 0.111 -0.012 -0.061 0.951 0.251 3.988 IL -1.777E-06 0.000 -0.276 -2.712 0.008 0.980 1.021 Note. a. Dependent Variable: Employee behavior
Based on the results shown in Table 13 the R Square value for the linear
regression model is .086. This means that 8.6% of the variance in employee behavior is
due to the leadership predictor variables combined with income level as a predictor
variable. Also, as shown in Table 14, the regression model coefficients show that income
level is the only predictor variable which has a significance value which meets the .05
threshold for significance.
In order to verify my overall test conducted above, I used SPSS 24 to run a two
block multiple regression model. The results of that test are shown below in Tables 15
and 16, and they coincide with results displayed in the above tables.

91
Table 15 Two-Block Multiple Regression Model
Model R R Square Adjusted R
Square Std. Error of the Estimate
1 .108a 0.012 -0.021 0.45250 2 .294b 0.086 0.046 0.43748 Note. a. Predictors: (Constant), EL, OJ, LMX b. Predictors: (Constant), EL, OJ, LMX, IL
Table 16 Two-Block Multiple Regression Coefficients
Model
Unstandardized Coefficients
Standardized Coefficients
t Sig.
Collinearity Statistics
B Std. Error Beta Tolerance VIF 1 (Constant) 4.419 0.250 17.649 0.000
LMX 0.006 0.106 0.015 0.060 0.952 0.181 5.528 OJ 0.021 0.110 0.037 0.190 0.850 0.286 3.502 EL 0.035 0.114 0.063 0.305 0.761 0.256 3.912
2 (Constant) 4.607 0.252 18.298 0.000 LMX 0.035 0.103 0.080 0.337 0.737 0.179 5.586 OJ 0.027 0.107 0.047 0.250 0.803 0.285 3.503 EL -0.007 0.111 -0.012 -0.061 0.951 0.251 3.988 IL -1.777E-06 0.000 -0.276 -2.712 0.008 0.980 1.021
Note. a. Dependent Variable: Employee behavior
Findings
In the previous sections of this chapter, all of the information needed to answer
the three research questions was presented in raw form along with brief explanations of
the results’ meaning. This section will provide the research finding for this project with
92
detailed explanations. The data analysis from this project results in the following findings
according to the dataset examined:
1. There is no significant relationship between leadership and employee
behavior.
2. There is a significant positive correlational relationship between leader-
member exchange, organizational justice and empowering leadership.
3. There is a significant positive correlational relationship between job
performance, organizational citizenship behavior, and reduced withdrawal
behavior.
4. There is no significant relationship between income level and leadership.
5. There is a significant negative relationship between income level and
employee behavior.
6. Income level does not mediate the relationship between leadership and
employee behavior.
Items one through four above are demonstrated in Table 6 above as indicated in
the Pearson correlation testing. Item six above was demonstrated in two ways. First,
logically, there can be no mediation of a relationship if that relationship is not present.
Since there is not a significant correlation between leadership and employee behavior;
income level cannot mediate that relationship. Secondly, in comparison of the two linear
regression models’ R Square in Tables 9 and 11, it is observed that income level has an R
Square of .074 and leadership has an R Square of .014 when regressed as predictor
variables for employee behavior. This demonstrates that income level has more of an

93
effect on employee behavior than leadership, so while it is possible that leadership
partially mediates the relationship between income level and employee behavior, the
converse is not demonstrated by this dataset.
Summary
This research project has three research questions. The first research question
which is: How does employee income level mediate the relationship between leadership
and employee behavior? Based on the above results and the explanation given at the end
of the previous section, I accept the null hypothesis for this research question that
employee income level does not mediate the relationship between leadership and
employee behavior.
The second research question is: How is employee income level related to
leadership? Based on the Pearson correlation results displayed in Table 6 above, I accept
the null hypothesis that there is no relationship between employee income level and
leadership. The third research question is: How is employee income level related to
employee behavior? Based on the Pearson correlation results displayed in Table 6 above
along with the R Square found in Table 9 of .074, I reject the null hypothesis that there is
no relationship between employee income level and employee behavior, and conclude
that there is a significant negative relationship between income level and employee
behavior.

94
Chapter 5: Discussion, Conclusions, and Recommendations
The purpose of this correlational, quantitative design study was to test the
mediating effects of employee income level on the relationship between leadership and
employee behavior in the United States. This study was conducted to build upon the
theoretical foundation of Adams’s (1963) equity theory by examining empirical data
using quantitative statistical tools. The primary finding of this study was that while there
was no significant relationship observed between leadership and employee behavior,
there was a significant negative relationship observed between income level and
employee behavior.
When I first conducted the correlational testing, I was concerned that there was a
data entry error when transferring data from Qualtrics to SPSS 24, because the results
displayed in Table 6 that did not show a correlation between leadership and employee
behavior. I compared the data results in Qualtrics to the data results tab in SPSS to
confirm they were a match. As demonstrated by Hassan and Hassan (2015), leadership
and employee behavior have been found to have a significant positive correlation in
previous research, so the finding in this study that there was no significant relationship
between leadership and employee behavior was unexpected.
Because there was no correlation between leadership and employee behavior, the
first two research questions were answered by accepting the null hypothesis. However,
the last research question required further examination. While the Pearson correlation
demonstrated a significant negative relationship between two of the employee behavior
variables and income level, the level of correlation was low. By completing the
95
subsequent regression analysis which resulted in an R Square of .074 and a significance
of .008, I was able to conclude that there is a significant negative relationship between
income level and employee behavior.
Even though there were no leadership variables with a significant relationship to
employee income level, previous research (Hassan & Hassan, 2015), as well as the
theoretical foundation for this study (Adams, 1963) suggested that there is a significant
relationship between leadership and employee behavior. In fact, most current business
leadership theory assumes this relationship must exist, otherwise there would be no need
for business leadership theory development. Because one of the primary purposes of
business leadership is to produce desired employee behaviors, a lack of a significant
relationship between leadership and employee behavior makes any energy exerted on
business leadership a waste of resources.
The R Square resulting from the regression of income level and leadership was
zero, which meant that the income level variable does not explain any of the variation of
the leadership variable. This did not match my hypothesis, which indicated that income
level does not predict any part of the leadership variables. Perhaps future research should
replicate this study on a different sample from the same population to further generalize
or contrast the results.
While the finding that there is no significant relationship between leadership and
employee behavior was an unexpected result, it does meet the research objective of
continuing the incremental expansion of knowledge regarding the relationship among the
three variable groups studied. By demonstrating that leadership, employee income level,

96
and employee behavior are not always correlated, certain management theoretical
conclusions can now be examined and supported by this new empirical evidence. The
negative relationship between income level and employee behavior should be further
researched.
Interpretation of Findings
The findings of this quantitative research study does not support the findings of
the Hassan and Hassan (2015) study. In the Hassan and Hassan study, all the variables
had a positive, significant correlation. In this study, in which I used the same survey
instrument for six out of the seven variables, there were not the same resulting significant
relationships. This could be due to nature of using only self-reported data or because the
population in the United States in 2017 does not have the same relationships as the
previously examined population.
The findings of this study also conflict with Adams’s (1963) qualitative analysis
and resulting equity theory. Adams theorized that income inequality would decrease
motivation and thereby decrease employee behavioral outcomes. However, the findings
of this study suggest that there is a negative relationship between employee income level
and employee behavior. This finding suggests that income inequality may not impact
employee behavior as Adams suggested, and in fact could have the opposite effect.
Along with not supporting the foundational research for this study by Adams
(1963, 1965) that suggested that income level and employee behavior are positively
related, the findings of this study are also counter to other leadership research studies.
Almost all leadership theory is based on the conceptual framework that leadership effects

97
employee behavior. In fact, if leadership does not affect employee behavior, there would
be no practical or academic reason for the continued research and development of
leadership theory. While I am not suggesting that this study should replace the previous
research with regard to the understanding of the relationship between leadership and
employee behavior, it does indicate that there are at least certain situations where
leadership and employee behavior are not correlated.
Limitations of the Study
There were four main limitations of this study. First, the use of self-reported data
seemed to have inflated the employee behavior responses and decreased the leadership
responses, but there are always limitations when using only self-reported data (Ho, 2017).
Secondly, this study solely used a 5-point Likert-type scale similar to Hassan and Hassan
(2015) to measure the variables. While the Likert-type scale is one of the most commonly
accepted scales for measuring self-reported feelings and perceptions, it only uses one
type of response.
Thirdly, the study was limited to a small sample size of 95, although that sample
exceeds the minimum sample of 74 based on the G*Power analysis conducted given the
plan to use the multiple regression model. Lastly, the study is also limited by a lack of
longitudinal aspect, because all data collected was from a single survey conducted at a
single point in time. The sample for this project came from one organization, which also
limits the extent to which the results can be generalized. Future research could further
generalize the results by replicating the study on different populations.

98
This study is limited with regard to generalizability due to the sample size, and
self-reported nature of the study, however the validity and reliability testing demonstrate
that the results are a good representation of the survey instrument. In order to generalize
the results across the entire population, a wider sample will be needed to confirm or
disconfirm the results of this study. A longitudinal aspect of future research could also
help to further generalize or contrast the results of this study.
Recommendations
Because of the limitations discussed in the previous section, I have several
recommendations for subsequent research studies. First, this study was limited due to the
self-reported nature of the study, a future study that is based on supervisor reported data
for the employee behavior variables and the employee reported data for the leadership
variables could either confirm or disconfirm the findings of this study. This study was
also limited by the nature of the survey instrument used being comprised primarily of
five-point scale Likert questions. Future research could expand the survey instrument to
other types of questions in order to encompass a broader spectrum of leadership and
employee behavior responses.
Since this study was limited to a 95-case sample size and found an R Square value
of zero for one of the relationships, future research could examine if a larger or different
sample would demonstrate different results. A larger sample may also allow the results
to be further generalized across the population. Another limitation of this study was the
lack of longitudinal information. If a future research design included a longitude aspect, it
could determine if the relationship between leadership and employee behavior is

99
consistently not correlated, consistently correlated or if the relationship changes based on
changing circumstances.
Finally, since the findings of this study conflict with the findings of the previous
research from Hassan and Hassan (2015), further replication of this study on the same
population using multiple samples may allow future researchers to add evidence to
support either the findings presented in this study regarding the relationship between
leadership and employee behavior or the findings presented in Hassan and Hassan’s
study. Since this study and Hassan and Hassan (2015) studied entirely different
geographic populations, further research on both populations could be useful to determine
if the results are consistent within the populations. I also recommend partial replication
of this study to further explore the correlation between employee income level and
employee behavior. For future studies that find similar significant relationships to the
ones found in the Hassan and Hassan (2015) study, full replication of the mediation
testing as described in the research plan for this study would also be recommended.
Implications
There are multiple implications to the field of management and for potential
positive social changes as a result of the findings presented in this study. For the field of
management, leadership theory development has been previously based on the idea that
leadership affects employee behavior (Adams, 1963; 1965). However, the results of this
study imply that we may not be able to take that assumption for granted, and future
leadership theory development may need to include provisions that incorporate the

100
inconsistency of the relationship as well as the possibility of a negative relationship
between employee income level and employee behavior.
With regard to positive social change, an understanding that employee behavior
may not always be affected by employee income level or leadership should allow leaders
to judge employee behavior as a standalone variable. In the past senior leaders have
attempted to hold middle managers and supervisors accountable for employee behavior.
However, this study indicates that in the US business sector this may not be an
appropriate organizational leadership strategy. By holding employees accountable for
their own behavior, future organizations may have better long-term success with both
leader and employee performance.
Another positive social change implication is the correlation between job
performance and organizational citizenship behavior. Since there is a significant positive
correlation between job performance and organizational citizenship behavior,
organizations may be able to build a culture with high organizational citizenship by
simply ensuring high job performance. Since it is in the best interest of the organization
for an employee to have job performance, and in the best interest of everyone in the
social network to have high organizational citizenship behavior, individual accountability
for job performance could lead to a better social environment.
Conclusions
This study was designed to test the mediation of employee income level on the
relationship between leadership and employee behavior. While the results of the study
were not expected, the results do add to the current literature regarding the relationship

101
between leadership and employee behavior. Current leadership theory assumes that there
is a correlation between leadership and employee behavior, but as this study indicates that
may not always be the case. The current theory assumes a positive correlation between
employee income level and employee behavior, while this study gives evidence to the
presence of a negative relationship.
Even if future research reveals that the results of this study are the exception
rather than the norm, future theory developers should still take into account the fact that
leadership does not always affect employee behavior. Perhaps future leadership theory
regarding employee behavior should be more focused on the employee’s actions rather
than the leader’s actions. Individual accountability for job performance may actually be
more important than leadership for the long-term success of a business organization.

102
References
Adams, J. S. (1963). Wage inequities, productivity and work quality. Industrial
Relations: A Journal of Economy and Society, 3(1), 9-16. doi:10.1111/j.1468-
232X.1963.tb00805.x
Adams, J. S. (1965). Inequity in social exchange. Advances in Experimental Social
Psychology, 2, 267-299. doi:10.1016/S0065-2601(08)60108-2
Afsar, B., Ali, Z., Dost, M., & Safdar, U. (2017). Linking error management practices
with call center employees' helping behaviors and service recovery
performance. Pakistan Journal of Commerce & Social Sciences, 11(1). Retrieved
from http://www.jespk.net
Anderson, D. R., Sweeney, D. J., Williams, T. A., Camm, J. D., & Cochran, J. J.
(2013). Quantitative methods for business. Mason, OH: Cengage Learning.
Antonakis, J. (2017). The nature of leadership. Thousand Oaks, CA: Sage publications.
Bai, Y., Dong, Z., Liu, H., & Liu, S. (2017). We may be different, but I can help you: the
effects of leaders’ political skills on leader–follower power distance value
incongruence and withdrawal behavior. Journal of Leadership & Organizational
Studies, 24(2), 216-229. doi:10.1177/1548051816665582
Baron, R. M., & Kenny, D. A. (1986). The moderator-mediator variable distinction in
social psychological research: Conceptual, strategic and statistical considerations.
Journal of Personality and Social Psychology, 51, 1173-1182. Retrieved from
http://www.apa.org

103
Berry, W. D. (1993). Understanding regression assumptions. Newbury Park, CA: Sage
Publications.
Blau, P. M. (1964). Exchange and power in social life. New York, NY: Wiley.
Blau, J. R., & Blau, P. M. (1982). The cost of inequality: Metropolitan structure and
violent crime. American Sociological Review, 114-129. Retrieved from
http://www.jstor.org/stable/2095046
Blickle, G., Kane-Frieder, R. E., Oerder, K., Wihler, A., von Below, A., Schütte, N., . . .
Ferris, G. R. (2013). Leader behaviors as mediators of the leader characteristics-
follower satisfaction relationship. Group & Organization Management, 38(5),
601-629. doi:10.1177/1059601113503183
Booth, A., Sutton, A., & Papaioannou, D. (2016). Systematic approaches to a successful
literature review. Thousand Oaks, CA: Sage Publications Inc.
Brown, C., Evans, J. H., III, Moser, D., & Presslee, A. (2016). How does reducing pay
dispersion affect employee behavior? University of Pittsburgh. Retrieved from
http://www.psu.edu
Brutus, S., Aguinis, H., & Wassmer, U. (2013). Self-reported limitations and future
directions in scholarly reports: Analysis and recommendations. Journal of
Management, 39(1), 48-75. doi:10.1177/0149206312455245
Burns, J. M. (1978). Leadership. New York, NY: Harper and Row.
Chetty, R., Stepner, M., Abraham, S., Lin, S., Scuderi, B., Turner, N., . . . Cutler, D.
(2016). The association between income and life expectancy in the United States,
2001-2014. Jama, 315(16), 1750-1766. doi:10.1001/jama.2016.4226

104
Chiang, C. F., & Hsieh, T. S. (2012). The impacts of perceived organizational support
and psychological empowerment on job performance: The mediating effects of
organizational citizenship behavior. International Journal of Hospitality
Management, 31(1), 180-190. doi:10.1016/j.ijhm.2011.04.011
Chu, X., & Ilyas, I. F. (2016). Qualitative data cleaning. Proceedings of the VLDB
Endowment, 9(13), 1605-1608. Retrieved from http://www.vldb.org/
Cobb, J. A. (2016). How firms shape income inequality: Stakeholder power, executive
decision making, and the structuring of employment relationships. Academy of
Management Review, 41(2), 324-348. doi:10.5465/amr.2013.0451
Corak, M. (2013). Income inequality, equality of opportunity, and intergenerational
mobility. The Journal of Economic Perspectives, 27(3), 79-102. Retrieved from
http://hdl.handle.net/10419/80702
Conte, J. M., Heffner, T. S., Roesch, S. C., & Aasen, B. (2017). A person-centric
investigation of personality types, job performance, and attrition. Personality and
Individual Differences, 104, 554-559. doi:10.1016/j.paid.2016.09.004
Crabtree, S. (2013). Worldwide, 13% of employees are engaged at work. Retrieved from
http://www.gallup.com/poll/165269/worldwide-employees-engaged-work.aspx
Cropanzano, R., Dasborough, M. T., & Weiss, H. M. (2017). Affective events and the
development of leader-member exchange. Academy of Management
Review, 42(2), 233-258. doi:10.5465/amr.2014.0384

105
Cropanzano, R., Rupp, D. E., Mohler, C. J., & Schminke, M. (2001). Three roads to
organizational justice. Research in Personnel and Human Resources
Management, 20, 1-113. doi:10.1016/S0742-7301(01)20001-2
Czaplewski, A. J., Key, T. M., & Van Scotter II, J. R. (2016). The role of positive
organizational behavior in building a worldclass service organization. Leading the
Positive Organization: Actions, Tools, and Processes, 58. New York, NY:
Business Expert Press, LLC.
Daly, M. (2017). Killing the competition: Economic inequality and homicide. New York,
NY: Routledge.
Dansereau, F., Seitz, S. R., Chiu, C. Y., Shaughnessy, B., & Yammarino, F. J. (2013).
What makes leadership, leadership? Using self-expansion theory to integrate
traditional and contemporary approaches. The Leadership Quarterly, 24, 798-821.
doi:10.1016/j.leaqua.2013.10.008
Day, D. V., Fleenor, J. W., Atwater, L. E., Sturm, R. E., & McKee, R. A. (2014).
Advances in leader and leadership development: A review of 25years of research
and theory. The Leadership Quarterly, 25(1), 63-82.
doi:10.1016/j.leaqua.2013.11.004
Delmas, M. A., & Pekovic, S. (2016). Corporate sustainable innovation and employee
behavior. Journal of Business Ethics, 1-18. doi:10.1007/s10551-016-3163-1
Demirtas, O., & Akdogan, A. (2015). The effect of ethical leadership behavior on ethical
climate, turnover intention, and affective commitment. Journal of Business
Ethics, 130(1), 59-67. doi:10.1007/s10551-014-2196-6

106
Dinh, J. E., Lord, R. G., Gardner, W. L., Meuser, J. D., Liden, R. C., & Hu, J. (2014).
Leadership theory and research in the new millennium: Current theoretical trends
and changing perspectives. The Leadership Quarterly, 25(1), 36-62.
doi:10.1016/j.leaqua.2013.11.005
Dong, Y., Bartol, K. M., Zhang, Z. X., & Li, C. (2017). Enhancing employee creativity
via individual skill development and team knowledge sharing: Influences of dual‐
focused transformational leadership. Journal of Organizational Behavior, 38(3),
439-458. doi:10.1002/job.2134
Easley, R. W., Madden, C. S., & Dunn, M. G. (2000). Conducting marketing science:
The role of replication in the research process. Journal of Business Research,
48(1), 83-92. doi:10.1016/S0148-2963(98)00079-4
Eberly, M. B., Johnson, M. D., Hernandez, M., & Avolio, B. J. (2013). An integrative
process model of leadership: Examining loci, mechanisms, and event cycles.
American Psychologist, 68, 427-443. doi:10.1037/a0032244
Eisenberger, R., Armeli, S., Rexwinkel, B., Lynch, P. D., & Rhoades, L. (2001).
Reciprocation of perceived organizational support. Journal of Applied
Psychology, 86(1), 42-51. doi:1037//0021-9010.86.1.42
Eisenberger, R., Fasolo, P., & Davis-LaMastro, V. (1990). Perceived organizational
support and employee diligence, commitment, and innovation. Journal of Applied
Psychology, 75(1), 51-59. Retrieved from http://www.apa.org

107
Fairchild, A. J., & MacKinnon, D. P. (2009). A general model for testing mediation and
moderation effects. Prevention Science, 10(2), 87-99. doi:10.1007/s11121-008-
0109-6
Fairhurst, G. T., & Connaughton, S. L. (2014). Leadership: A communicative
perspective. Leadership, 10, 7-35. doi:10.1177/1742715013509396
Fiedler, F. E. (1964). A contingency model of leadership effectiveness. Advances in
Experimental Social Psychology, 1, 149-190. doi:10.1016/S0065-2601(08)60051-
9
Fiske, S. T. (2016). How to publish rigorous experiments in the 21st century. Journal of
Experimental Social Psychology, 66, 145-147. doi:10.1016/j.jesp.2016.01.006
Francis, L., & Barling, J. (2005). Organizational injustice and psychological
strain. Canadian Journal of Behavioural Science, 37(4), 250. Retrevied from
http://psycnet.apa.org
Gerhart, B. (2017). Incentives and pay for performance in the workplace. Advances in
Motivation Science, 4, 91-140. doi:10.1016/bs.adms.2017.02.001
Gerstner, C. R., & Day, D. V. (1997). Meta-analysis review of leader-member exchange
theory: Correlation and construct issues. Journal of Applied Psychology, 82, 827-
844. Retreived from http:// psycnet.apa.org/
Goth, U. S., Bergsli, O., & Johanesen, E. M. (2017). Integration of ethnic minorities
during group-work for vocational teachers-in-training in health
studies. International Journal of Medical Education, 8, 31.
doi:10.5116/ijme.5862.505a

108
Harms, P. D., Credé, M., Tynan, M., Leon, M., & Jeung, W. (2017). Leadership and
stress: A meta-analytic review. The Leadership Quarterly, 28(1), 178-194.
doi:10.1016/j.leaqua.2016.10.006
Hassan, S. & Hassan, M. (2015). Testing the mediating role of perceived organizational
support between leadership styles, organizational justice and employees’
behavioral outcomes. Pakistan Journal of Commerce & Social Sciences, 9(1),
131-158. Retrieved from http://www.jespk.net/publications/225.pdf
Hassan, S., Hassan, M., & Shoaib, M. (2014). Measuring the impact of perceived
organization support, psychological empowerment and rewards on employees’
satisfaction: Testing the mediating impact of employee engagement. World
Applied Sciences Journal 30(5), 652-660.
doi:10.5829/idosi.wasj.2014.20.05.14094
He, W., Fehr, R., Yam, K. C., Long, L. R., & Hao, P. (2017). Interactional justice,
leader–member exchange, and employee performance: Examining the moderating
role of justice differentiation. Journal of Organizational Behavior, 38(4), 537-
557. doi:10.1002/job.2133
Hersey, P., & Blanchard, K. H. (1977). Management of organizational behavior:
Utilizing human resources. Englewood Cliffs, N.J: Prentice-Hall.
Ho, G. W. (2017). Examining perceptions and attitudes: A review of likert-type scales
versus Q-methodology. Western Journal of Nursing Research, 39(5), 674-689.
doi:10.1177/0193945916661302

109
Hoffman, E. L., & Lord, R. G. (2013). A taxonomy of event-level dimensions:
Implications for understanding leadership processes, behavior, and
performance. The Leadership Quarterly, 24(4), 558-571.
doi:10.1016/j.leaqua.2013.03.009
Janssen, O., & Van Yperen, N. W. (2004). Employees' goal orientations, the quality of
leader-member exchange, and the outcomes of job performance and job
satisfaction. Academy of Management Journal, 47(3), 368-384.
doi:10.2307/20159587
Johns, T. L., Hayes, R., Scicchitano, M. J., & Grottini, K. (2017). Testing the
effectiveness of two retail theft control approaches: an experimental research
design. Journal of Experimental Criminology, 1-7. doi:10.1007/s1129
Junco, R. (2013). Comparing actual and self-reported measures of Facebook
use. Computers in Human Behavior, 29(3), 626-631.
doi:10.1016/j.chb.2012.11.007
Karsten, N., & Hendriks, F. (2017). Don’t call me a leader, but I am one: The Dutch
mayor and the tradition of bridging-and-bonding leadership in consensus
democracies. Leadership, 13(2), 154-172. doi:10.1177/1742715016651711
Kellerman, B. (2007). What every leaders needs to know about followers. Harvard
Business Review, 85(12), 84. Retreived from http://www.hbr.org
Kim, M., & Beehr, T. A. (2017). Self-efficacy and psychological ownership mediate the
effects of empowering leadership on both good and bad employee

110
behaviors. Journal of Leadership & Organizational Studies.
doi:10.1177/1548051817702078
Kooij, D. T., Tims, M., & Akkermans, J. (2017). The influence of future time perspective
on work engagement and job performance: the role of job crafting. European
Journal of Work and Organizational Psychology, 26(1), 4-15.
doi:10.1080/1359432X.2016.1209489
Kopf, D. A., Hsu, M. K., Shows, G. D., & Albinsson, P. A. (2016). Quantitative versus
qualitative research methods. 2016 SMA Proceedings, 470. Retrieved from
http://www.marketingadvances.org
Kruse, K. (2013). What is leadership. Forbes Magazine, 3. Retreived from
http://www.forbes.com
Leana, C. R., & Meuris, J. (2015). Living to work and working to live: Income as a driver
of organizational behavior. The Academy of Management Annals, 9(1), 55-95.
doi:10.1080/19416520.2015.1007654
Lee, S., Cheong, M., Kim, M., & Yun, S. (2017). Never too much? The curvilinear
relationship between empowering leadership and task performance. Group &
Organization Management, 42(1), 11-38. doi:10.1177/1059601116646474
Lieberthal, R. D. (2016). Demand for health insurance. What Is Health Insurance (Good)
For? 87-115. Switzerland: Springer International Publishing.
doi:10.1007/978-3-319-43796-5_4

111
Liden, R. C., Wayne, S. J., Liao, C., & Meuser, J. D. (2014). Servant leadership and
serving culture: Influence on individual and unit performance. Academy of
Management Journal, 57, 1434-1452. doi:10.5465/amj.2013.0034
Lorinkova, N. M., & Perry, S. J. (2017). When is empowerment effective? The role of
leader-leader exchange in empowering leadership, cynicism, and time
theft. Journal of Management, 43(5), 1631-1654.
doi:10.1177/0149206314560411
Martin, R., Guillaume, Y., Thomas, G., Lee, A., & Epitropaki, O. (2016). Leader–
member exchange (LMX) and performance: A meta‐analytic review. Personnel
Psychology, 69(1), 67-121. doi:10.1111/peps.12100
Meuser, J. D., Gardner, W. L., Dinh, J. E., Hu, J., Liden, R. C., & Lord, R. G. (2016). A
network analysis of leadership theory: The infancy of integration. Journal of
Management, 42(5), 1374-1403. doi:10.1177/0149206316647099
Moorman, R. H., & Byrne, Z. S. (2013). How does organizational justice affect
organizational citizenship behavior?. Handbook of Organizational Justice.
Mahwah, NJ: Erlbaum.
Morrison, E.W., (1996). Organizational citizenship behavior as a critical link between
HRM practices and service quality. Human Resource Management, 35 (4), 493–
512. doi:10.1002/(SICI)1099-050X(199624)35:4<493::AID-HRM4>3.0.CO;2-R
Moser, C. A., & Stuart, A. (1953). An experimental study of quota sampling. Journal of
the Royal Statistical Society. Series A (General), 116(4), 349-405.
doi:10.2307/2343021

112
Muenjohn, N., & McMurray, A. (2016). The impact of leadership on workplace
innovation in Thai and Vietnamese SMEs. Journal of Developing Areas, 50(5),
479-486. doi:10.1353/jda.2016.0045
Nebeker, C., Simon, G., Kalichman, M., Talavera, A., Booen, E., & Lopez-Arenas, A.
(2015). Building research integrity and capacity (BRIC): An interactive guide for
promotores/community health workers. San Diego, CA: BRIC Academy.
Newman, A., Schwarz, G., Cooper, B., & Sendjaya, S. (2017). How servant leadership
influences organizational citizenship behavior: The roles of LMX, empowerment,
and proactive personality. Journal of Business Ethics, 145(1), 49-62.
doi:10.1007/s10551-015-2827-6
Ng, T. W. H., & Feldman, D. C. (2008). The relationship of age to ten dimensions of job
performance. Journal of Applied Psychology. doi:10.1037/0021-9010.93.2.392
Nguyen, T. T., Mia, L., Winata, L., & Chong, V. K. (2017). Effect of transformational-
leadership style and management control system on managerial
performance. Journal of Business Research, 70, 202-213.
doi:10.1016/j.jbusres.2016.08.018
Organ, D. W. (2017). Recent developments in research pertaining to organizational
citizenship behavior (OCB). Annual Review of Organizational Psychology and
Organizational Behavior, 5(1). doi:10.1146/annurev-orgpsych-032117-104536
Pereira, R. H., Schwanen, T., & Banister, D. (2017). Distributive justice and equity in
transportation. Transport Reviews, 37(2), 170-191.
doi:10.1080/01441647.2016.1257660

113
Prottas, D. J. (2013). Relationships among employee perception of their manager’s
behavioral integrity, moral distress, and employee attitudes and well-
being. Journal of Business Ethics, 113(1), 51-60. doi:10.1007/s10551-012-1280-z
Qian, J., Wang, B., Han, Z., & Song, B. (2017). Ethical leadership, leader-member
exchange and feedback seeking: A double-moderated mediation model of
emotional intelligence and work-unit structure. Frontiers in Psychology, 8.
doi:10.3389/fpsyg.2017.01174
Roethlisberger, F. J., Dickson, W. J., Wright, H. A., & Pforzheimer, C. H. (1939).
Management and the worker: An account of a research program conducted by the
Western Electric Company, Hawthorne Works, Chicago. Cambridge, MA:
Harvard University Press.
Ruben, B. D. & Gigliotti, R. A. (2016). Leadership as social influence: An expanded
view of leadership communication theory and practice. Journal of Leadership and
Organizational Studies, 23, 467-479. doi:10.1177/1548051816641876
Schmitt, A., Den Hartog, D. N., & Belschak, F. D. (2016). Transformational leadership
and proactive work behaviour: A moderated mediation model including work
engagement and job strain. Journal of Occupational and Organizational
Psychology, 89(3), 588-610. doi:10.1111/joop.12143
Seate, B. M., Pooe, R. I., & Chinomona, R. (2016). The relative importance of
managerial competencies for predicting the perceived job performance of broad-
based black economic empowerment verification practitioners. SA Journal of
Human Resource Management, 14(1), 1-11. doi:10.4102/sajhrm.v14i1.696

114
Shono, Y., Ames, S. L., & Stacy, A. W. (2016). Evaluation of internal validity using
modern test theory: Application to word association. Psychological
Assessment, 28(2), 194. doi:10.1037/pas0000175
Srivastava, R., & Ali, S. H. (2016). The impact of organizational level and annual income
on the emotional intelligence and leadership of managerial personnel. Journal of
Management & Administration, 2016(2), 42-64. Retrieved from
http://www.journals.co.za
Stavrova, O., & Ehlebracht, D. (2016). Cynical beliefs about human nature and income:
Longitudinal and cross-cultural analyses. Journal of Personality and Social
Psychology, 110(1), 116. Retrieved from http://psyciq.apa.org
Strom, D. L., Sears, K. L., & Kelly, K. M. (2014). Work engagement: The roles of
organizational justice and leadership style in predicting engagement among
employees. Journal of Leadership & Organizational Studies, 21(1), 71-82.
doi:10.1177/1548051813485437
U.S. Bureau of Economic Analysis. (2016). National income and product account tables.
Retrieved from https://www.bea.gov/
U.S. Bureau of Labor Statistics. (2014) Nonprofits account for 11.4 million jobs, 10.3
percent of all private sector employment. Retrieved from https://www.bls.gov
van Knippenberg, D., & Sitkin, S. B. (2013). A critical assessment of charismatic-
transformational leadership research: Back to the drawing board? The Academy of
Management Annals, 7: 1-60. doi:10.1080/19416520.2013.759433
115
Vecchio, R. P., Justin, J. E., & Pearce, C. L. (2010). Empowering leadership: An
examination of mediating mechanisms within a hierarchical structure. The
Leadership Quarterly, 21(3), 530-542. doi:10.1016/j.leaqua.2010.03.014
Vohs, K. D. (2013). The poor's poor mental power. Science, 341(6149), 969-970.
doi:10.1126/science.1244172
Wang, H. J., Demerouti, E., & Le Blanc, P. (2017). Transformational leadership,
adaptability, and job crafting: The moderating role of organizational
identification. Journal of Vocational Behavior, 100, 185-195.
doi:10.1016/j.jvb.2017.03.009
Wang, T., Thornhill, S., & Zhao, B. (2016). Pay‐for‐performance, employee
participation, and SME performance. Journal of Small Business Management.
doi:10.1111/jsbm.12268
Wang, Y., & Hu, T. (2017). Transformational leadership behavior and turnover intention
in china physical education. Eurasia Journal of Mathematics, Science and
Technology Education, 13(9), 6357-6368. doi:10.12973/eurasia.2017.01070a
Wilson, S., & McCalman, J. (2017). Re-imagining ethical leadership as leadership for the
greater good. European Management Journal, 35(2), 151-154.
doi:10.1016/j.emj.2016.06.001
Williams, B., Onsman, A., & Brown, T. (2010). Exploratory factor analysis: A five-step
guide for novices. Australasian Journal of Paramedicine, 8(3). Retrieved from
https://ajp.paramedics.org

116
Xu, A. J., Loi, R., & Ngo, H. Y. (2016). Ethical leadership behavior and employee justice
perceptions: The mediating role of trust in organization. Journal of Business
Ethics, 134(3), 493-504. doi:10.1007/s10551-014-2457-4
Yidong, T., & Xinxin, L. (2013). How ethical leadership influence employees’ innovative
work behavior: A perspective of intrinsic motivation. Journal of Business
Ethics, 116(2), 441-455. doi:10.1007/s10551-012-1455-7
Yao, Y. H., Fan, Y. Y., Guo, Y. X., & Li, Y. (2014). Leadership, work stress and
employee behavior. Chinese Management Studies, 8(1), 109-126.
doi:10.1108/CMS-04-2014-0089
Zardkoohi, A., & Bierman, L. (2016). How firms shape income inequality: Stakeholder
power, executive decision making, and the structuring of employment
relationships. Academy of Management Review, 41(4), 744-749.
doi:10.5465/amr.2015.0197
Zivnuska, S., Kacmar, K. M., & Valle, M. (2017). The mechanisms of regulatory focus:
mindfulness, leader-member exchange, and motivational outcomes. Career
Development International, 22(1). doi:10.1108/CDI-07-2016-0120

117
Appendix A: Author Approvals
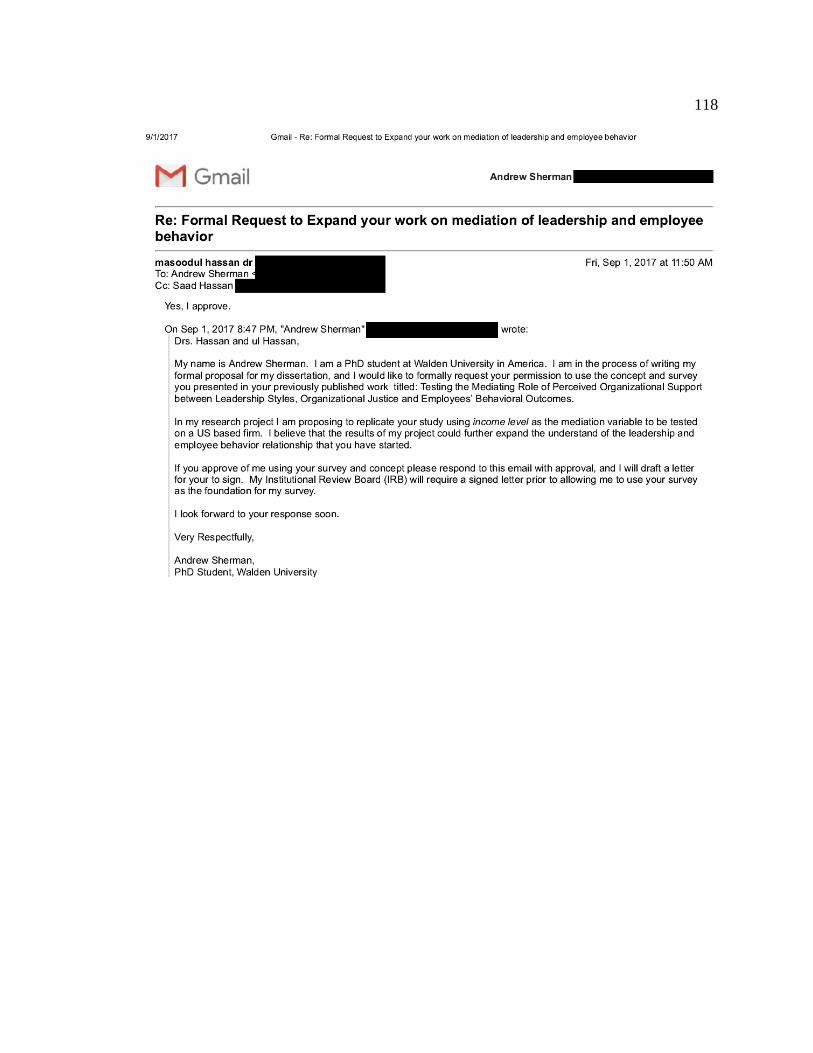
118

119
Appendix B: Survey

120
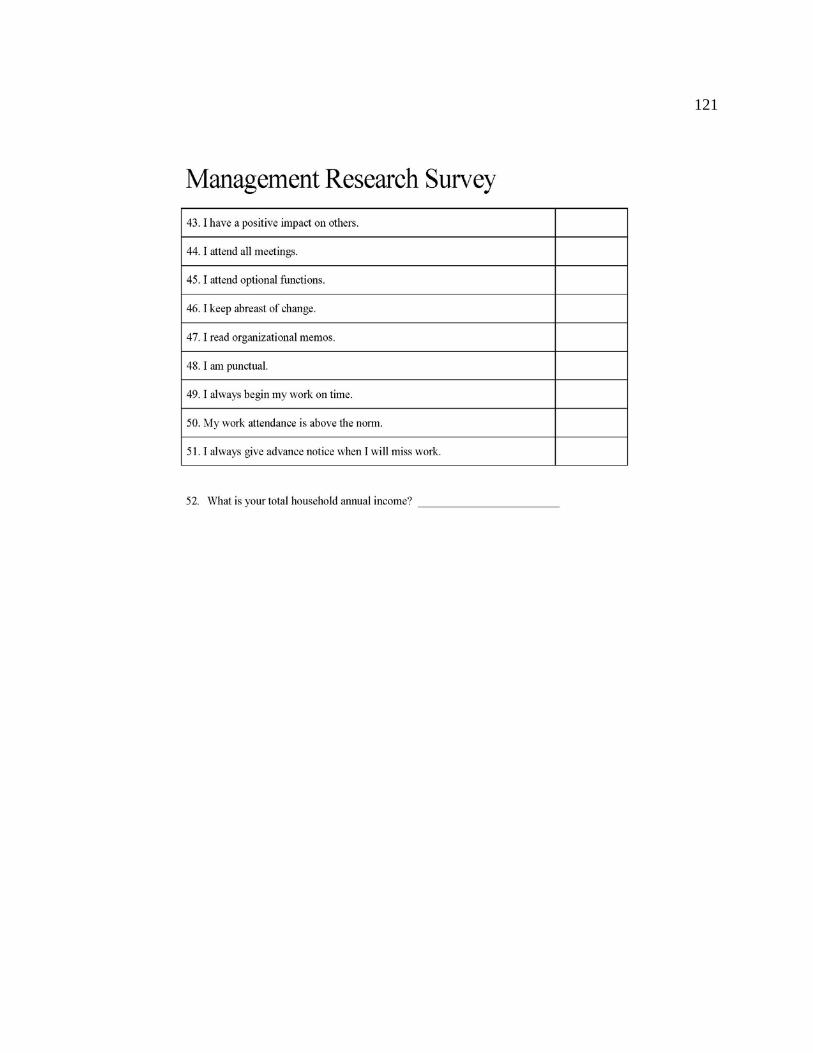
121