Embed Size (px)
Citation preview

CIRCULATIONAHA/2011/081125 – Final Version Lindman et al. Sildenafil Hemodynamics in Severe AS (Supplement)
1
Effects of Phosphodiesterase Type 5 Inhibition on Systemic and Pulmonary Hemodynamics
and Ventricular Function in Patients with Severe Symptomatic Aortic Stenosis
SUPPLEMENTAL MATERIAL
Brian R. Lindman, MD1, Alan Zajarias, MD1, José A. Madrazo, MD1,
Jay Shah, MD1, Brian F. Gage, MD, MSc2, Eric Novak, MS1,
Stephanie N. Johnson, RDCS1, Murali M. Chakinala, MD3, Tara A. Hohn, MHS1,
Mohammed Saghir, MD1, Douglas L. Mann, MD1
Institution: 1Cardiovascular Division, 2General Medical Sciences, 3Pulmonary and Critical
Care Division, Department of Medicine, Washington University School of
Medicine, St. Louis, MO.
CIRCULATIONAHA/2011/081125 – Final Version Lindman et al. Sildenafil Hemodynamics in Severe AS (Supplement)
2
Methods
Clinical variables. Hypertension was defined by medical history, use of
antihypertensive medications, or blood pressure >140/90. Diabetes mellitus was determined
from the medical record and confirmed by patient interview. Prior myocardial infarction was
defined as pathologic Q waves on ECG (if corroborated by a wall motion abnormality on echo or
other evidence of coronary disease), history of elevated troponin thought to be related to an acute
coronary syndrome, history of myocardial infarction as stated in the medical record (if supported
by other evidence of coronary disease), or evidence of infarct on nuclear imaging. Coronary
artery disease was defined as prior myocardial infarction, prior percutaneous or surgical
revascularization, or stenosis ≥50% in a major epicardial artery. Obstructive lung disease was
determined to be present if FEV1/FVC <70%.1
Hemodynamic formulas.
• Oxygen consumption (Lafarge formula for females) =
(138.1-(17.04*ln(age))+(0.378*HR))*BSA
• Oxygen consumption (Lafarge formula for males) =
(138.1-(11.49*ln(age))+(0.378*HR))*BSA
• Cardiac output (Fick method) =
Oxygen consumption / ((Aortic O2 saturation – Pulmonary artery O2
saturation)*1.36*Hgb*10)
• Cardiac index (CI) = CO / body surface area (BSA)
• Stroke volume (SV) = cardiac output (CO) / heart rate (HR)
• Pulmonary vascular resistance (PVR) (Wood units) = [mean pulmonary artery
pressure (mPAP) – pulmonary capillary wedge pressure (PCWP)] / CO
CIRCULATIONAHA/2011/081125 – Final Version Lindman et al. Sildenafil Hemodynamics in Severe AS (Supplement)
3
• Pulmonary artery compliance (PAC) = SV / (pulmonary artery systolic pressure –
pulmonary artery diastolic pressure)
• Transpulmonary gradient (TPG) = mPAP – PCWP
• Systemic vascular resistance (SVR) (Wood units) = [mean systemic arterial pressure
(mSAP) – right atrial pressure (RA)] / CO
• Systemic arterial compliance (SAC) = SV / (systolic blood pressure – diastolic blood
pressure)
• Valvuloarterial impedance (VAI) = (mean transvalvular gradient + systolic blood
pressure) / SV indexed to BSA
CIRCULATIONAHA/2011/081125 – Final Version Lindman et al. Sildenafil Hemodynamics in Severe AS (Supplement)
4
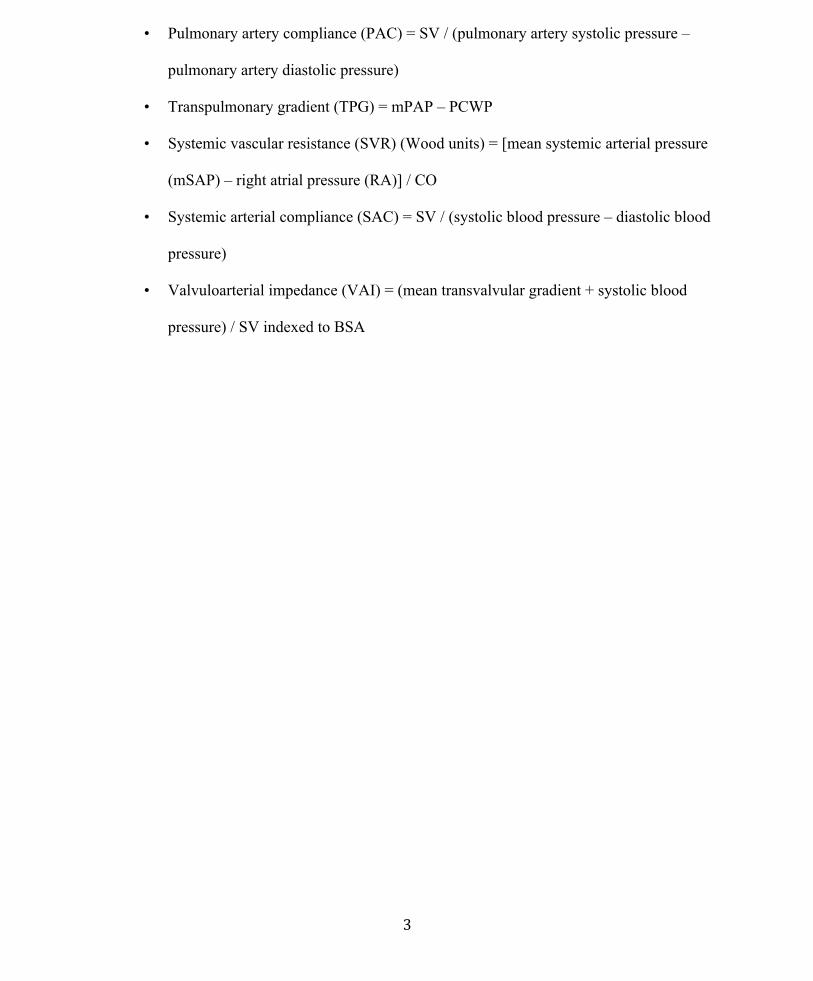
Supplemental Table 1. Clinical Characteristics by Dose of Sildenafil
40 mg (n=10)
80 mg (n=10) p-value
Age (years) 84 ± 10 88 ± 10 0.14 Female gender 50 50 1.00 Body surface area (m2) 1.9 ± 0.2 1.9 ± 0.4 0.85 Systolic blood pressure (mmHg) 154 ± 25 152 ± 17 1.00
Diastolic blood pressure (mmHg) 73 ± 9 71 ± 10 0.20
Prior myocardial infarction 10 10 1.00 Coronary artery disease 80 50 0.35 Hypertension 100 90 1.00 Atrial arrhythmia 40 10 0.30 Diabetes mellitus 50 40 1.00 Obstructive lung disease 33 38 1.00 NYHA functional class 1.00 II 10 10 III 70 60 IV 20 30 Glomerular filtration rate (mL/min/1.73m2)* 55 ± 22 60 ± 23 0.85 B-type natriuretic peptide (pg/mL) 564 ± 426 918 ± 1070 0.68 ACE-inhibitors or ARBs 40 20 0.63 ß-blockers 70 80 1.00 Calcium channel blockers 30 0 0.21 Diuretics 90 70 0.58 Statins 80 40 0.17 Prior use of a PDE5 inhibitor 10 10 1.00 Ejection fraction (EF) (%) 60 ± 16 59 ± 13 0.82 Reduced EF (<50%) 30 30 1.00 LV mass index (g/m2) 156 ± 27 154 ± 18 0.90 Relative wall thickness 0.7 ± 0.2 0.6 ± 0.1 0.09 Aortic regurgitation severity 0.63 0 30 30 1 60 40 2 10 30 Mitral regurgitation severity 0.47 0 20 10 1 60 40 2 20 50
All values are mean±SD or %. *Estimated by the MDRD method. Valve regurgitation graded: 0 (none) – 4 (severe).
CIRCULATIONAHA/2011/081125 – Final Version Lindman et al. Sildenafil Hemodynamics in Severe AS (Supplement)
5
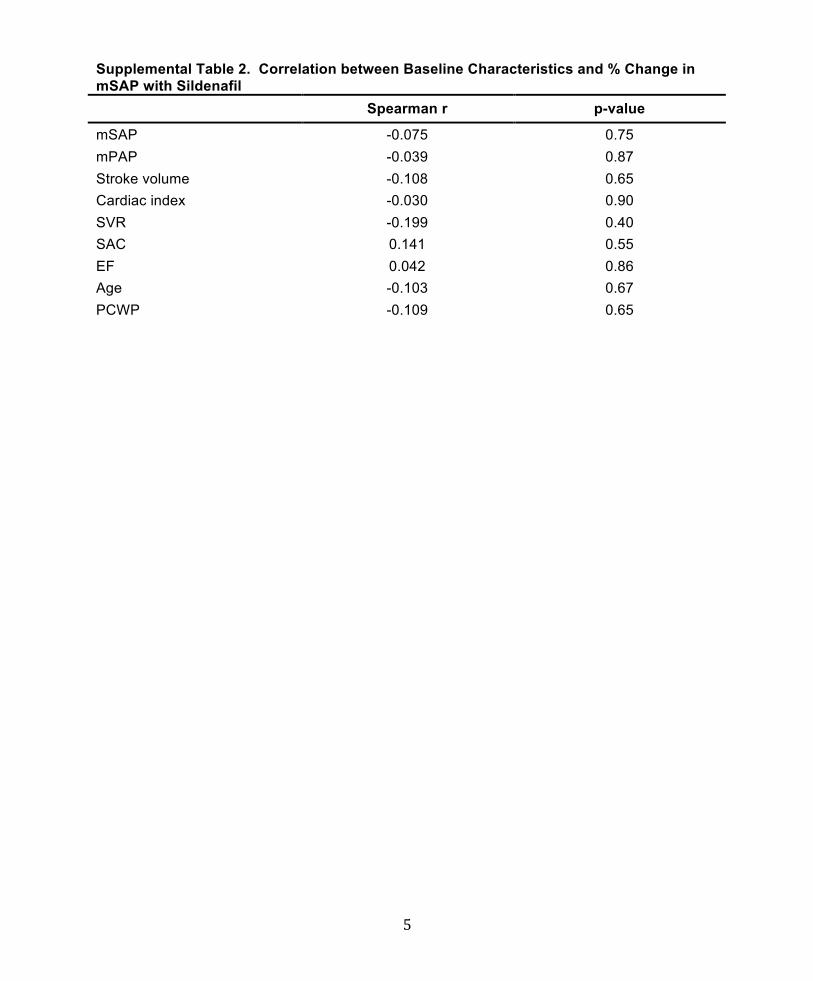
Supplemental Table 2. Correlation between Baseline Characteristics and % Change in mSAP with Sildenafil Spearman r p-value
mSAP -0.075 0.75 mPAP -0.039 0.87 Stroke volume -0.108 0.65 Cardiac index -0.030 0.90 SVR -0.199 0.40 SAC 0.141 0.55 EF 0.042 0.86 Age -0.103 0.67 PCWP -0.109 0.65
CIRCULATIONAHA/2011/081125 – Final Version Lindman et al. Sildenafil Hemodynamics in Severe AS (Supplement)
6
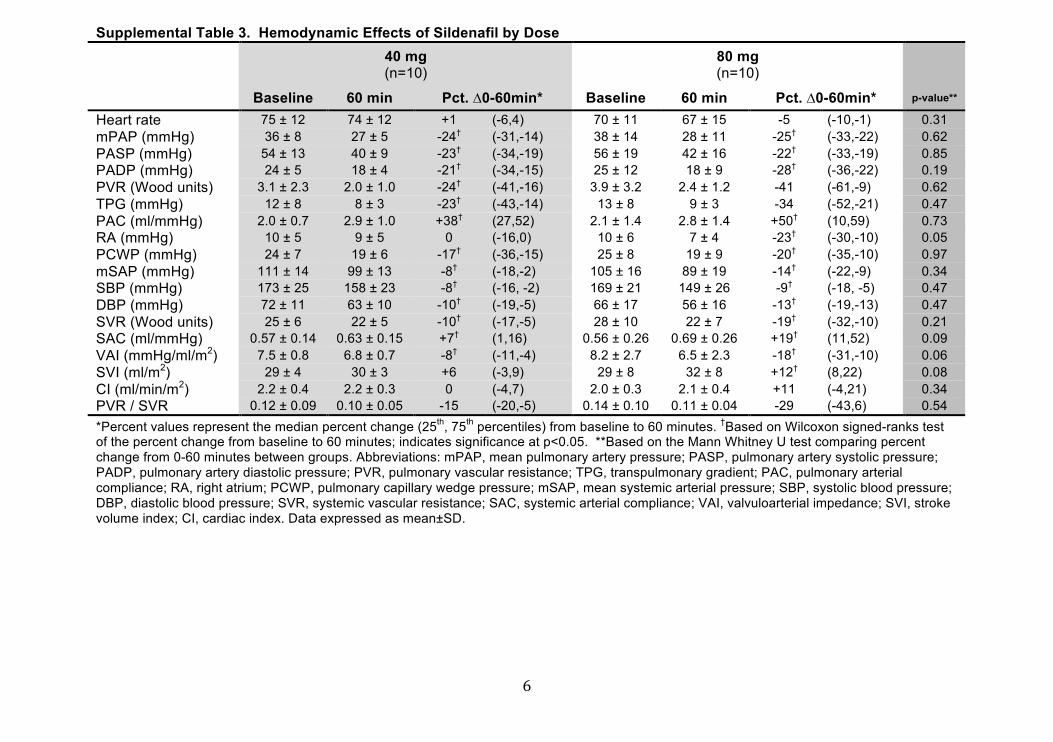
Supplemental Table 3. Hemodynamic Effects of Sildenafil by Dose 40 mg
(n=10) 80 mg (n=10)
Baseline 60 min Pct. ∆0-60min* Baseline 60 min Pct. ∆0-60min* p-value**
Heart rate 75 ± 12 74 ± 12 +1 (-6,4) 70 ± 11 67 ± 15 -5 (-10,-1) 0.31 mPAP (mmHg) 36 ± 8 27 ± 5 -24† (-31,-14) 38 ± 14 28 ± 11 -25† (-33,-22) 0.62 PASP (mmHg) 54 ± 13 40 ± 9 -23† (-34,-19) 56 ± 19 42 ± 16 -22† (-33,-19) 0.85 PADP (mmHg) 24 ± 5 18 ± 4 -21† (-34,-15) 25 ± 12 18 ± 9 -28† (-36,-22) 0.19 PVR (Wood units) 3.1 ± 2.3 2.0 ± 1.0 -24† (-41,-16) 3.9 ± 3.2 2.4 ± 1.2 -41 (-61,-9) 0.62 TPG (mmHg) 12 ± 8 8 ± 3 -23† (-43,-14) 13 ± 8 9 ± 3 -34 (-52,-21) 0.47 PAC (ml/mmHg) 2.0 ± 0.7 2.9 ± 1.0 +38† (27,52) 2.1 ± 1.4 2.8 ± 1.4 +50† (10,59) 0.73 RA (mmHg) 10 ± 5 9 ± 5 0 (-16,0) 10 ± 6 7 ± 4 -23† (-30,-10) 0.05 PCWP (mmHg) 24 ± 7 19 ± 6 -17† (-36,-15) 25 ± 8 19 ± 9 -20† (-35,-10) 0.97 mSAP (mmHg) 111 ± 14 99 ± 13 -8† (-18,-2) 105 ± 16 89 ± 19 -14† (-22,-9) 0.34 SBP (mmHg) 173 ± 25 158 ± 23 -8† (-16, -2) 169 ± 21 149 ± 26 -9† (-18, -5) 0.47 DBP (mmHg) 72 ± 11 63 ± 10 -10† (-19,-5) 66 ± 17 56 ± 16 -13† (-19,-13) 0.47 SVR (Wood units) 25 ± 6 22 ± 5 -10† (-17,-5) 28 ± 10 22 ± 7 -19† (-32,-10) 0.21 SAC (ml/mmHg) 0.57 ± 0.14 0.63 ± 0.15 +7† (1,16) 0.56 ± 0.26 0.69 ± 0.26 +19† (11,52) 0.09 VAI (mmHg/ml/m2) 7.5 ± 0.8 6.8 ± 0.7 -8† (-11,-4) 8.2 ± 2.7 6.5 ± 2.3 -18† (-31,-10) 0.06 SVI (ml/m2) 29 ± 4 30 ± 3 +6 (-3,9) 29 ± 8 32 ± 8 +12† (8,22) 0.08 CI (ml/min/m2) 2.2 ± 0.4 2.2 ± 0.3 0 (-4,7) 2.0 ± 0.3 2.1 ± 0.4 +11 (-4,21) 0.34 PVR / SVR 0.12 ± 0.09 0.10 ± 0.05 -15 (-20,-5) 0.14 ± 0.10 0.11 ± 0.04 -29 (-43,6) 0.54 *Percent values represent the median percent change (25th, 75th percentiles) from baseline to 60 minutes. †Based on Wilcoxon signed-ranks test of the percent change from baseline to 60 minutes; indicates significance at p<0.05. **Based on the Mann Whitney U test comparing percent change from 0-60 minutes between groups. Abbreviations: mPAP, mean pulmonary artery pressure; PASP, pulmonary artery systolic pressure; PADP, pulmonary artery diastolic pressure; PVR, pulmonary vascular resistance; TPG, transpulmonary gradient; PAC, pulmonary arterial compliance; RA, right atrium; PCWP, pulmonary capillary wedge pressure; mSAP, mean systemic arterial pressure; SBP, systolic blood pressure; DBP, diastolic blood pressure; SVR, systemic vascular resistance; SAC, systemic arterial compliance; VAI, valvuloarterial impedance; SVI, stroke volume index; CI, cardiac index. Data expressed as mean±SD.
CIRCULATIONAHA/2011/081125 – Final Version Lindman et al. Sildenafil Hemodynamics in Severe AS (Supplement)
7
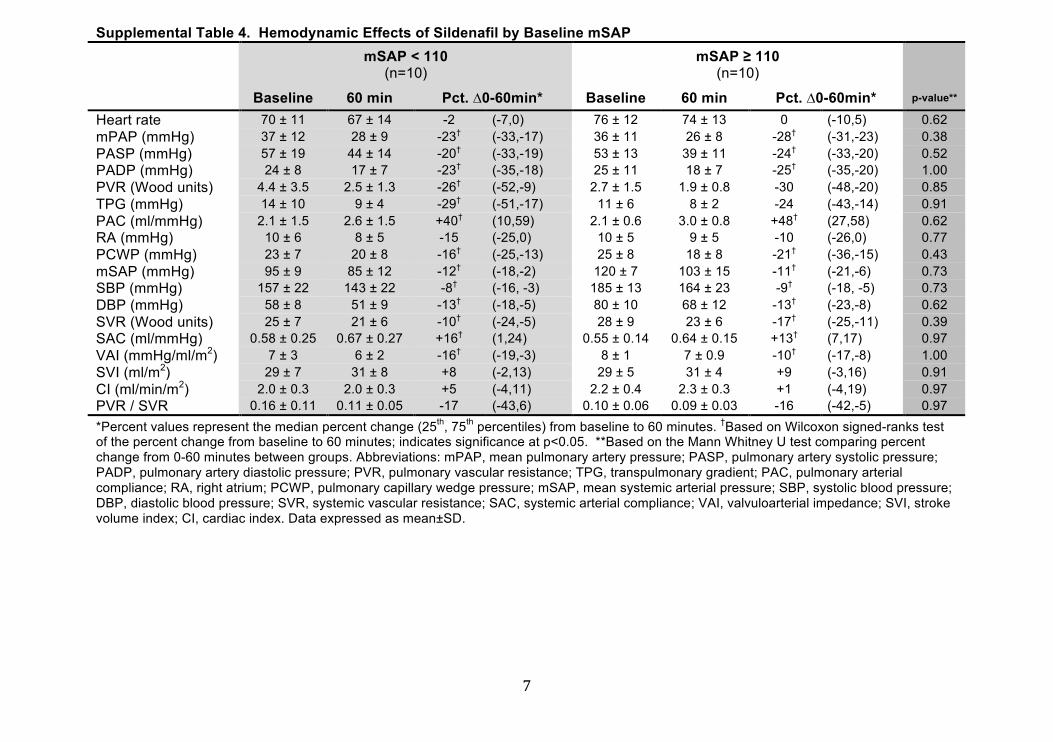
Supplemental Table 4. Hemodynamic Effects of Sildenafil by Baseline mSAP mSAP < 110
(n=10) mSAP ≥ 110
(n=10)
Baseline 60 min Pct. ∆0-60min* Baseline 60 min Pct. ∆0-60min* p-value**
Heart rate 70 ± 11 67 ± 14 -2 (-7,0) 76 ± 12 74 ± 13 0 (-10,5) 0.62 mPAP (mmHg) 37 ± 12 28 ± 9 -23† (-33,-17) 36 ± 11 26 ± 8 -28† (-31,-23) 0.38 PASP (mmHg) 57 ± 19 44 ± 14 -20† (-33,-19) 53 ± 13 39 ± 11 -24† (-33,-20) 0.52 PADP (mmHg) 24 ± 8 17 ± 7 -23† (-35,-18) 25 ± 11 18 ± 7 -25† (-35,-20) 1.00 PVR (Wood units) 4.4 ± 3.5 2.5 ± 1.3 -26† (-52,-9) 2.7 ± 1.5 1.9 ± 0.8 -30 (-48,-20) 0.85 TPG (mmHg) 14 ± 10 9 ± 4 -29† (-51,-17) 11 ± 6 8 ± 2 -24 (-43,-14) 0.91 PAC (ml/mmHg) 2.1 ± 1.5 2.6 ± 1.5 +40† (10,59) 2.1 ± 0.6 3.0 ± 0.8 +48† (27,58) 0.62 RA (mmHg) 10 ± 6 8 ± 5 -15 (-25,0) 10 ± 5 9 ± 5 -10 (-26,0) 0.77 PCWP (mmHg) 23 ± 7 20 ± 8 -16† (-25,-13) 25 ± 8 18 ± 8 -21† (-36,-15) 0.43 mSAP (mmHg) 95 ± 9 85 ± 12 -12† (-18,-2) 120 ± 7 103 ± 15 -11† (-21,-6) 0.73 SBP (mmHg) 157 ± 22 143 ± 22 -8† (-16, -3) 185 ± 13 164 ± 23 -9† (-18, -5) 0.73 DBP (mmHg) 58 ± 8 51 ± 9 -13† (-18,-5) 80 ± 10 68 ± 12 -13† (-23,-8) 0.62 SVR (Wood units) 25 ± 7 21 ± 6 -10† (-24,-5) 28 ± 9 23 ± 6 -17† (-25,-11) 0.39 SAC (ml/mmHg) 0.58 ± 0.25 0.67 ± 0.27 +16† (1,24) 0.55 ± 0.14 0.64 ± 0.15 +13† (7,17) 0.97 VAI (mmHg/ml/m2) 7 ± 3 6 ± 2 -16† (-19,-3) 8 ± 1 7 ± 0.9 -10† (-17,-8) 1.00 SVI (ml/m2) 29 ± 7 31 ± 8 +8 (-2,13) 29 ± 5 31 ± 4 +9 (-3,16) 0.91 CI (ml/min/m2) 2.0 ± 0.3 2.0 ± 0.3 +5 (-4,11) 2.2 ± 0.4 2.3 ± 0.3 +1 (-4,19) 0.97 PVR / SVR 0.16 ± 0.11 0.11 ± 0.05 -17 (-43,6) 0.10 ± 0.06 0.09 ± 0.03 -16 (-42,-5) 0.97 *Percent values represent the median percent change (25th, 75th percentiles) from baseline to 60 minutes. †Based on Wilcoxon signed-ranks test of the percent change from baseline to 60 minutes; indicates significance at p<0.05. **Based on the Mann Whitney U test comparing percent change from 0-60 minutes between groups. Abbreviations: mPAP, mean pulmonary artery pressure; PASP, pulmonary artery systolic pressure; PADP, pulmonary artery diastolic pressure; PVR, pulmonary vascular resistance; TPG, transpulmonary gradient; PAC, pulmonary arterial compliance; RA, right atrium; PCWP, pulmonary capillary wedge pressure; mSAP, mean systemic arterial pressure; SBP, systolic blood pressure; DBP, diastolic blood pressure; SVR, systemic vascular resistance; SAC, systemic arterial compliance; VAI, valvuloarterial impedance; SVI, stroke volume index; CI, cardiac index. Data expressed as mean±SD.
CIRCULATIONAHA/2011/081125 – Final Version Lindman et al. Sildenafil Hemodynamics in Severe AS (Supplement)
8
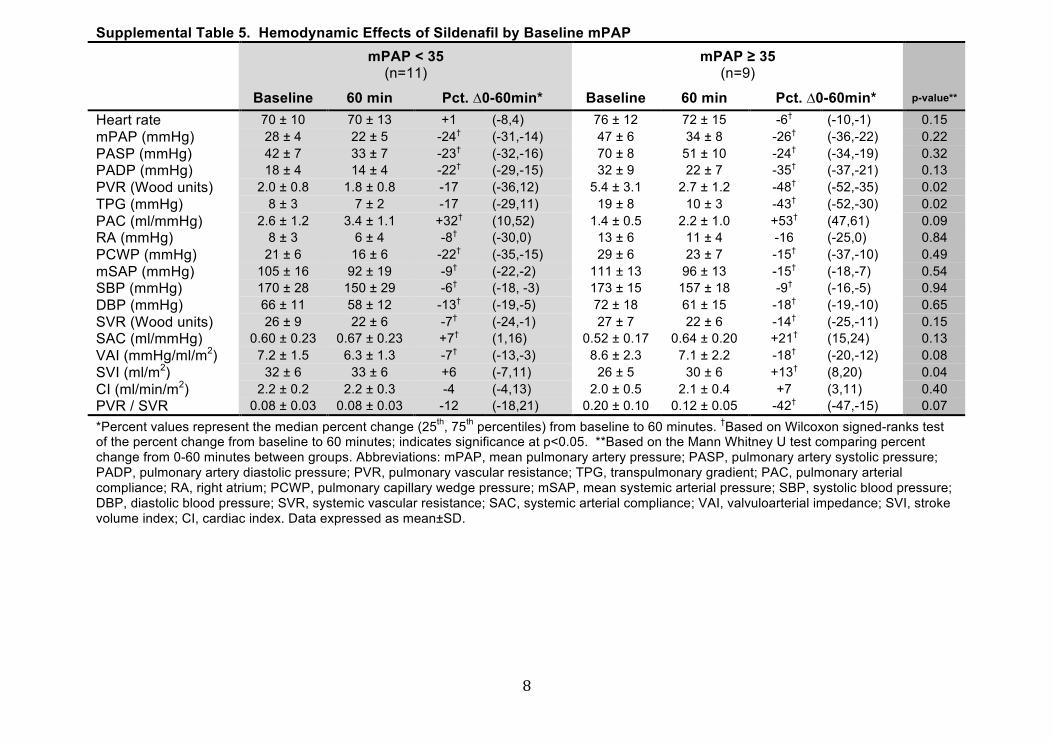
Supplemental Table 5. Hemodynamic Effects of Sildenafil by Baseline mPAP mPAP < 35
(n=11) mPAP ≥ 35
(n=9)
Baseline 60 min Pct. ∆0-60min* Baseline 60 min Pct. ∆0-60min* p-value**
Heart rate 70 ± 10 70 ± 13 +1 (-8,4) 76 ± 12 72 ± 15 -6† (-10,-1) 0.15 mPAP (mmHg) 28 ± 4 22 ± 5 -24† (-31,-14) 47 ± 6 34 ± 8 -26† (-36,-22) 0.22 PASP (mmHg) 42 ± 7 33 ± 7 -23† (-32,-16) 70 ± 8 51 ± 10 -24† (-34,-19) 0.32 PADP (mmHg) 18 ± 4 14 ± 4 -22† (-29,-15) 32 ± 9 22 ± 7 -35† (-37,-21) 0.13 PVR (Wood units) 2.0 ± 0.8 1.8 ± 0.8 -17 (-36,12) 5.4 ± 3.1 2.7 ± 1.2 -48† (-52,-35) 0.02 TPG (mmHg) 8 ± 3 7 ± 2 -17 (-29,11) 19 ± 8 10 ± 3 -43† (-52,-30) 0.02 PAC (ml/mmHg) 2.6 ± 1.2 3.4 ± 1.1 +32† (10,52) 1.4 ± 0.5 2.2 ± 1.0 +53† (47,61) 0.09 RA (mmHg) 8 ± 3 6 ± 4 -8† (-30,0) 13 ± 6 11 ± 4 -16 (-25,0) 0.84 PCWP (mmHg) 21 ± 6 16 ± 6 -22† (-35,-15) 29 ± 6 23 ± 7 -15† (-37,-10) 0.49 mSAP (mmHg) 105 ± 16 92 ± 19 -9† (-22,-2) 111 ± 13 96 ± 13 -15† (-18,-7) 0.54 SBP (mmHg) 170 ± 28 150 ± 29 -6† (-18, -3) 173 ± 15 157 ± 18 -9† (-16,-5) 0.94 DBP (mmHg) 66 ± 11 58 ± 12 -13† (-19,-5) 72 ± 18 61 ± 15 -18† (-19,-10) 0.65 SVR (Wood units) 26 ± 9 22 ± 6 -7† (-24,-1) 27 ± 7 22 ± 6 -14† (-25,-11) 0.15 SAC (ml/mmHg) 0.60 ± 0.23 0.67 ± 0.23 +7† (1,16) 0.52 ± 0.17 0.64 ± 0.20 +21† (15,24) 0.13 VAI (mmHg/ml/m2) 7.2 ± 1.5 6.3 ± 1.3 -7† (-13,-3) 8.6 ± 2.3 7.1 ± 2.2 -18† (-20,-12) 0.08 SVI (ml/m2) 32 ± 6 33 ± 6 +6 (-7,11) 26 ± 5 30 ± 6 +13† (8,20) 0.04 CI (ml/min/m2) 2.2 ± 0.2 2.2 ± 0.3 -4 (-4,13) 2.0 ± 0.5 2.1 ± 0.4 +7 (3,11) 0.40 PVR / SVR 0.08 ± 0.03 0.08 ± 0.03 -12 (-18,21) 0.20 ± 0.10 0.12 ± 0.05 -42† (-47,-15) 0.07 *Percent values represent the median percent change (25th, 75th percentiles) from baseline to 60 minutes. †Based on Wilcoxon signed-ranks test of the percent change from baseline to 60 minutes; indicates significance at p<0.05. **Based on the Mann Whitney U test comparing percent change from 0-60 minutes between groups. Abbreviations: mPAP, mean pulmonary artery pressure; PASP, pulmonary artery systolic pressure; PADP, pulmonary artery diastolic pressure; PVR, pulmonary vascular resistance; TPG, transpulmonary gradient; PAC, pulmonary arterial compliance; RA, right atrium; PCWP, pulmonary capillary wedge pressure; mSAP, mean systemic arterial pressure; SBP, systolic blood pressure; DBP, diastolic blood pressure; SVR, systemic vascular resistance; SAC, systemic arterial compliance; VAI, valvuloarterial impedance; SVI, stroke volume index; CI, cardiac index. Data expressed as mean±SD.

CIRCULATIONAHA/2011/081125 – Final Version Lindman et al. Sildenafil Hemodynamics in Severe AS (Supplement)
9
Supplemental Table 6. Hemodynamic Effects of Sildenafil by Baseline PVR PVR < 3
(n=13) PVR ≥ 3
(n=7)
Baseline 60 min Pct. ∆0-60min* Baseline 60 min Pct. ∆0-60min* p-value**
Heart rate 74 ± 11 72 ± 13 -2 (-10,4) 71 ± 13 68 ± 16 -6 (-8,0) 0.69 mPAP (mmHg) 31 ± 7 24 ± 5 -25† (-31,-17) 47 ± 10 34 ± 9 -24† (-33,-22) 0.87 PASP (mmHg) 47 ± 11 35 ± 7 -23† (-33,-19) 69 ± 12 53 ± 12 -20† (-36,-19) 1.00 PADP (mmHg) 20 ± 5 15 ± 4 -22† (-34,-20) 32 ± 11 22 ± 8 -24† (-37,-19) 0.48 PVR (Wood units) 1.9 ± 0.7 1.8 ± 0.7 -17 (-24,-9) 6.5 ± 2.7 3.0 ± 1.2 -52† (-64,-45) 0.002 TPG (mmHg) 8 ± 4 7 ± 1 -20 (-26,-10) 21 ± 7 11 ± 3 -51† (-56,-39) 0.003 PAC (ml/mmHg) 2.4 ± 1.2 3.2 ± 1.1 +40† (23,52) 1.4 ± 0.6 2.1 ± 1.1 +53† (28,61) 0.30 RA (mmHg) 9 ± 4 7 ± 4 -1† (-26,0) 13 ± 7 10 ± 6 -16 (-26,-10) 0.52 PCWP (mmHg) 23 ± 7 17 ± 6 -25† (-36,-16) 26 ± 8 23 ± 9 -13† (-18,-6) 0.07 mSAP (mmHg) 109 ± 16 95 ± 17 -10† (-21,-6) 104 ± 13 93 ± 16 -12† (-18,-3) 0.87 SBP (mmHg) 173 ± 27 153 ± 27 -11† (-18,-5) 168 ± 14 154 ± 21 -8† (-16,-2) 0.53 DBP (mmHg) 70 ± 11 60 ± 11 -13† (-23,-8) 66 ± 20 58 ± 18 -13† (-18,-7) 0.63 SVR (Wood units) 26 ± 9 22 ± 5 -10† (-21,-3) 28 ± 7 22 ± 7 -24† (-32,-10) 0.14 SAC (ml/mmHg) 0.59 ± 0.21 0.66 ± 0.21 +8† (1,16) 0.51 ± 0.18 0.65 ± 0.22 +21† (15,52) 0.06 VAI (mmHg/ml/m2) 7.3 ± 1.3 6.5 ± 1.0 -8† (-13,-3) 8.7 ± 2.7 6.9 ± 2.6 -19† (-31,-16) 0.02 SVI (ml/m2) 31 ± 5 31 ± 3 +6 (-3,8) 26 ± 8 31 ± 10 +16† (9,23) 0.006 CI (ml/min/m2) 2.2 ± 0.3 2.2 ± 0.3 -4 (-6,5) 1.8 ± 0.3 2.0 ± 0.3 +11† (7,21) 0.014 PVR / SVR 0.08 ± 0.03 0.08 ± 0.02 -7 (-17,13) 0.23 ± 0.09 0.13 ± 0.05 -43† (-47,-39) 0.004 *Percent values represent the median percent change (25th, 75th percentiles) from baseline to 60 minutes. †Based on Wilcoxon signed-ranks test of the percent change from baseline to 60 minutes; indicates significance at p<0.05. **Based on the Mann Whitney U test comparing percent change from 0-60 minutes between groups. Abbreviations: mPAP, mean pulmonary artery pressure; PASP, pulmonary artery systolic pressure; PADP, pulmonary artery diastolic pressure; PVR, pulmonary vascular resistance; TPG, transpulmonary gradient; PAC, pulmonary arterial compliance; RA, right atrium; PCWP, pulmonary capillary wedge pressure; mSAP, mean systemic arterial pressure; SBP, systolic blood pressure; DBP, diastolic blood pressure; SVR, systemic vascular resistance; SAC, systemic arterial compliance; VAI, valvuloarterial impedance; SVI, stroke volume index; CI, cardiac index. Data expressed as mean±SD.
CIRCULATIONAHA/2011/081125 – Final Version Lindman et al. Sildenafil Hemodynamics in Severe AS (Supplement)
10
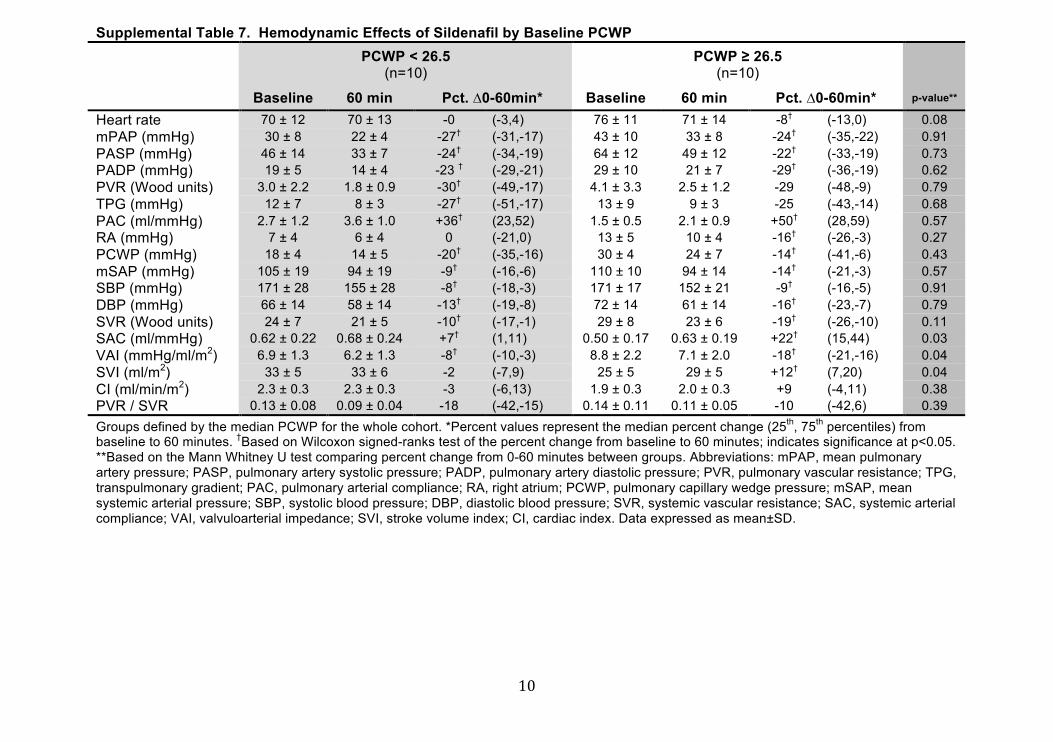
Supplemental Table 7. Hemodynamic Effects of Sildenafil by Baseline PCWP PCWP < 26.5
(n=10) PCWP ≥ 26.5
(n=10)
Baseline 60 min Pct. ∆0-60min* Baseline 60 min Pct. ∆0-60min* p-value**
Heart rate 70 ± 12 70 ± 13 -0 (-3,4) 76 ± 11 71 ± 14 -8† (-13,0) 0.08 mPAP (mmHg) 30 ± 8 22 ± 4 -27† (-31,-17) 43 ± 10 33 ± 8 -24† (-35,-22) 0.91 PASP (mmHg) 46 ± 14 33 ± 7 -24† (-34,-19) 64 ± 12 49 ± 12 -22† (-33,-19) 0.73 PADP (mmHg) 19 ± 5 14 ± 4 -23 † (-29,-21) 29 ± 10 21 ± 7 -29† (-36,-19) 0.62 PVR (Wood units) 3.0 ± 2.2 1.8 ± 0.9 -30† (-49,-17) 4.1 ± 3.3 2.5 ± 1.2 -29 (-48,-9) 0.79 TPG (mmHg) 12 ± 7 8 ± 3 -27† (-51,-17) 13 ± 9 9 ± 3 -25 (-43,-14) 0.68 PAC (ml/mmHg) 2.7 ± 1.2 3.6 ± 1.0 +36† (23,52) 1.5 ± 0.5 2.1 ± 0.9 +50† (28,59) 0.57 RA (mmHg) 7 ± 4 6 ± 4 0 (-21,0) 13 ± 5 10 ± 4 -16† (-26,-3) 0.27 PCWP (mmHg) 18 ± 4 14 ± 5 -20† (-35,-16) 30 ± 4 24 ± 7 -14† (-41,-6) 0.43 mSAP (mmHg) 105 ± 19 94 ± 19 -9† (-16,-6) 110 ± 10 94 ± 14 -14† (-21,-3) 0.57 SBP (mmHg) 171 ± 28 155 ± 28 -8† (-18,-3) 171 ± 17 152 ± 21 -9† (-16,-5) 0.91 DBP (mmHg) 66 ± 14 58 ± 14 -13† (-19,-8) 72 ± 14 61 ± 14 -16† (-23,-7) 0.79 SVR (Wood units) 24 ± 7 21 ± 5 -10† (-17,-1) 29 ± 8 23 ± 6 -19† (-26,-10) 0.11 SAC (ml/mmHg) 0.62 ± 0.22 0.68 ± 0.24 +7† (1,11) 0.50 ± 0.17 0.63 ± 0.19 +22† (15,44) 0.03 VAI (mmHg/ml/m2) 6.9 ± 1.3 6.2 ± 1.3 -8† (-10,-3) 8.8 ± 2.2 7.1 ± 2.0 -18† (-21,-16) 0.04 SVI (ml/m2) 33 ± 5 33 ± 6 -2 (-7,9) 25 ± 5 29 ± 5 +12† (7,20) 0.04 CI (ml/min/m2) 2.3 ± 0.3 2.3 ± 0.3 -3 (-6,13) 1.9 ± 0.3 2.0 ± 0.3 +9 (-4,11) 0.38 PVR / SVR 0.13 ± 0.08 0.09 ± 0.04 -18 (-42,-15) 0.14 ± 0.11 0.11 ± 0.05 -10 (-42,6) 0.39 Groups defined by the median PCWP for the whole cohort. *Percent values represent the median percent change (25th, 75th percentiles) from baseline to 60 minutes. †Based on Wilcoxon signed-ranks test of the percent change from baseline to 60 minutes; indicates significance at p<0.05. **Based on the Mann Whitney U test comparing percent change from 0-60 minutes between groups. Abbreviations: mPAP, mean pulmonary artery pressure; PASP, pulmonary artery systolic pressure; PADP, pulmonary artery diastolic pressure; PVR, pulmonary vascular resistance; TPG, transpulmonary gradient; PAC, pulmonary arterial compliance; RA, right atrium; PCWP, pulmonary capillary wedge pressure; mSAP, mean systemic arterial pressure; SBP, systolic blood pressure; DBP, diastolic blood pressure; SVR, systemic vascular resistance; SAC, systemic arterial compliance; VAI, valvuloarterial impedance; SVI, stroke volume index; CI, cardiac index. Data expressed as mean±SD.
CIRCULATIONAHA/2011/081125 – Final Version Lindman et al. Sildenafil Hemodynamics in Severe AS (Supplement)
11
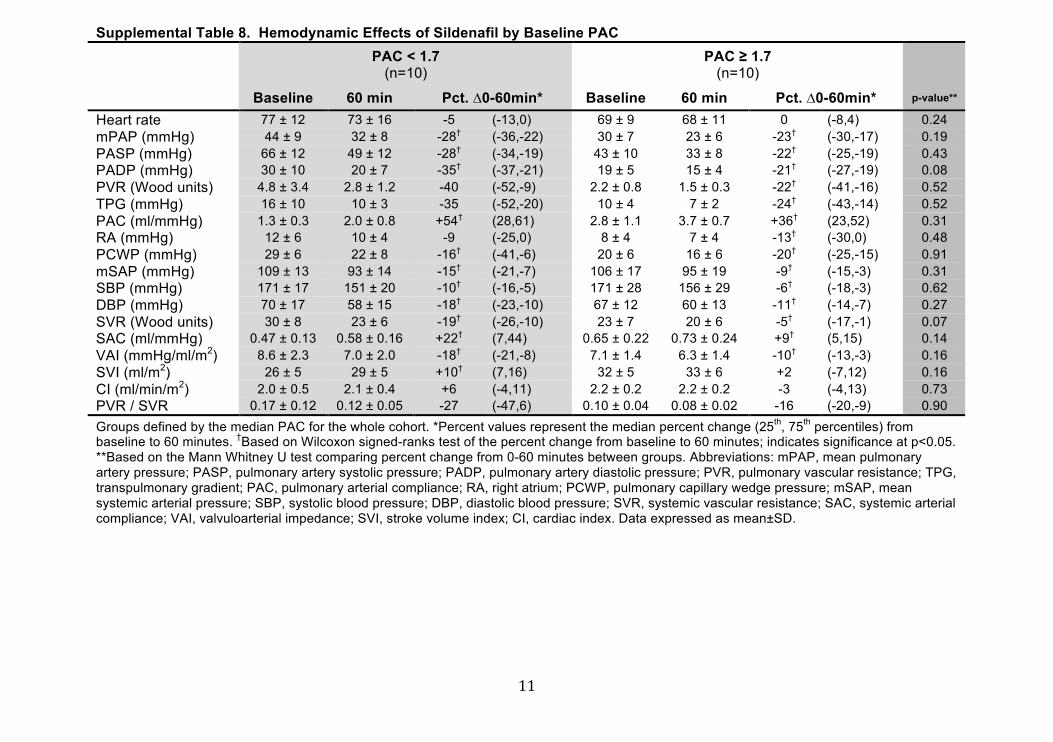
Supplemental Table 8. Hemodynamic Effects of Sildenafil by Baseline PAC PAC < 1.7
(n=10) PAC ≥ 1.7
(n=10)
Baseline 60 min Pct. ∆0-60min* Baseline 60 min Pct. ∆0-60min* p-value**
Heart rate 77 ± 12 73 ± 16 -5 (-13,0) 69 ± 9 68 ± 11 0 (-8,4) 0.24 mPAP (mmHg) 44 ± 9 32 ± 8 -28† (-36,-22) 30 ± 7 23 ± 6 -23† (-30,-17) 0.19 PASP (mmHg) 66 ± 12 49 ± 12 -28† (-34,-19) 43 ± 10 33 ± 8 -22† (-25,-19) 0.43 PADP (mmHg) 30 ± 10 20 ± 7 -35† (-37,-21) 19 ± 5 15 ± 4 -21† (-27,-19) 0.08 PVR (Wood units) 4.8 ± 3.4 2.8 ± 1.2 -40 (-52,-9) 2.2 ± 0.8 1.5 ± 0.3 -22† (-41,-16) 0.52 TPG (mmHg) 16 ± 10 10 ± 3 -35 (-52,-20) 10 ± 4 7 ± 2 -24† (-43,-14) 0.52 PAC (ml/mmHg) 1.3 ± 0.3 2.0 ± 0.8 +54† (28,61) 2.8 ± 1.1 3.7 ± 0.7 +36† (23,52) 0.31 RA (mmHg) 12 ± 6 10 ± 4 -9 (-25,0) 8 ± 4 7 ± 4 -13† (-30,0) 0.48 PCWP (mmHg) 29 ± 6 22 ± 8 -16† (-41,-6) 20 ± 6 16 ± 6 -20† (-25,-15) 0.91 mSAP (mmHg) 109 ± 13 93 ± 14 -15† (-21,-7) 106 ± 17 95 ± 19 -9† (-15,-3) 0.31 SBP (mmHg) 171 ± 17 151 ± 20 -10† (-16,-5) 171 ± 28 156 ± 29 -6† (-18,-3) 0.62 DBP (mmHg) 70 ± 17 58 ± 15 -18† (-23,-10) 67 ± 12 60 ± 13 -11† (-14,-7) 0.27 SVR (Wood units) 30 ± 8 23 ± 6 -19† (-26,-10) 23 ± 7 20 ± 6 -5† (-17,-1) 0.07 SAC (ml/mmHg) 0.47 ± 0.13 0.58 ± 0.16 +22† (7,44) 0.65 ± 0.22 0.73 ± 0.24 +9† (5,15) 0.14 VAI (mmHg/ml/m2) 8.6 ± 2.3 7.0 ± 2.0 -18† (-21,-8) 7.1 ± 1.4 6.3 ± 1.4 -10† (-13,-3) 0.16 SVI (ml/m2) 26 ± 5 29 ± 5 +10† (7,16) 32 ± 5 33 ± 6 +2 (-7,12) 0.16 CI (ml/min/m2) 2.0 ± 0.5 2.1 ± 0.4 +6 (-4,11) 2.2 ± 0.2 2.2 ± 0.2 -3 (-4,13) 0.73 PVR / SVR 0.17 ± 0.12 0.12 ± 0.05 -27 (-47,6) 0.10 ± 0.04 0.08 ± 0.02 -16 (-20,-9) 0.90 Groups defined by the median PAC for the whole cohort. *Percent values represent the median percent change (25th, 75th percentiles) from baseline to 60 minutes. †Based on Wilcoxon signed-ranks test of the percent change from baseline to 60 minutes; indicates significance at p<0.05. **Based on the Mann Whitney U test comparing percent change from 0-60 minutes between groups. Abbreviations: mPAP, mean pulmonary artery pressure; PASP, pulmonary artery systolic pressure; PADP, pulmonary artery diastolic pressure; PVR, pulmonary vascular resistance; TPG, transpulmonary gradient; PAC, pulmonary arterial compliance; RA, right atrium; PCWP, pulmonary capillary wedge pressure; mSAP, mean systemic arterial pressure; SBP, systolic blood pressure; DBP, diastolic blood pressure; SVR, systemic vascular resistance; SAC, systemic arterial compliance; VAI, valvuloarterial impedance; SVI, stroke volume index; CI, cardiac index. Data expressed as mean±SD.

CIRCULATIONAHA/2011/081125 – Final Version Lindman et al. Sildenafil Hemodynamics in Severe AS (Supplement)
12
Supplemental Table 9. Hemodynamic Effects of Sildenafil by Baseline EF Preserved EF (≥50%)
(n=14) Reduced EF (<50%)
(n=6)
Baseline 60 min Pct. ∆0-60min* Baseline 60 min Pct. ∆0-60min* p-value**
Heart rate 70 ± 10 67 ± 11 -2 (-10,4) 79 ± 13 78 ± 16 -3 (-6,4) 0.65 mPAP (mmHg) 34 ± 10 25 ± 8 -25† (-33,-22) 44 ± 12 33 ± 9 -25 (-30,-17) 0.90 PASP (mmHg) 51 ± 14 37 ± 11 -24† (-33,-20) 64 ± 18 50 ± 13 -18 (-34,-16) 0.30 PADP (mmHg) 22 ± 7 16 ± 6 -23† (-34,-19) 30 ± 12 21 ± 8 -28† (-37,-21) 0.48 PVR (Wood units) 2.8 ± 1.9 2.1 ± 1.1 -24† (-41,-16) 5.2 ± 3.9 2.4 ± 1.2 -51 (-64,12) 0.27 TPG (mmHg) 10 ± 5 8 ± 2 -24† (-39,-17) 18 ± 11 10 ± 4 -52 (-52,11) 0.30 PAC (ml/mmHg) 2.2 ± 1.2 3.2 ± 1.2 +45† (28,58) 1.7 ± 0.8 2.1 ± 0.8 +30 (-8,61) 0.48 RA (mmHg) 10 ± 5 8 ± 5 -13† (-25,0) 11 ± 7 9 ± 5 -12 (-26,3) 0.82 PCWP (mmHg) 24 ± 8 17 ± 6 -20† (-36,-15) 25 ± 7 23 ± 9 -11 (-25,-1) 0.17 mSAP (mmHg) 109 ± 13 94 ± 17 -13† (-22,-3) 104 ± 19 94 ± 16 -11 (-15,-7) 0.48 SBP (mmHg) 176 ± 24 154 ± 28 -14† (-18,-5) 160 ± 18 152 ± 15 -7 (-9,-2) 0.17 DBP (mmHg) 69 ± 11 59 ± 12 -13† (-23,-7) 68 ± 22 59 ± 19 -13† (-18,-10) 0.77 SVR (Wood units) 27 ± 9 23 ± 7 -14† (-24,-5) 25 ± 5 20 ± 3 -11† (-25,-8) 0.97 SAC (ml/mmHg) 0.57 ± 0.24 0.68 ± 0.25 +15† (8,24) 0.55 ± 0.09 0.61 ± 0.09 +4 (1,17) 0.15 VAI (mmHg/ml/m2) 7.9 ± 2.1 6.7 ± 1.9 -15† (-18,-7) 7.6 ± 1.7 6.6 ± 1.4 -8 (-21,2) 0.48 SVI (ml/m2) 30 ± 6 32 ± 7 +8 (-3,13) 27 ± 5 30 ± 5 +7 (-2,16) 0.84 CI (ml/min/m2) 2.1 ± 0.3 2.1 ± 0.3 +1 (-4,11) 2.1 ± 0.5 2.3 ± 0.3 +6 (-4,21) 0.43 PVR / SVR 0.11 ± 0.05 0.09 ± 0.03 -15† (-20,-5) 0.20 ± 0.13 0.12 ± 0.05 -45 (-47,21) 0.24 *Percent values represent the median percent change (25th, 75th percentiles) from baseline to 60 minutes. †Based on Wilcoxon signed-ranks test of the percent change from baseline to 60 minutes; indicates significance at p<0.05. **Based on the Mann Whitney U test comparing percent change from 0-60 minutes between groups. Abbreviations: mPAP, mean pulmonary artery pressure; PASP, pulmonary artery systolic pressure; PADP, pulmonary artery diastolic pressure; PVR, pulmonary vascular resistance; TPG, transpulmonary gradient; PAC, pulmonary arterial compliance; RA, right atrium; PCWP, pulmonary capillary wedge pressure; mSAP, mean systemic arterial pressure; SBP, systolic blood pressure; DBP, diastolic blood pressure; SVR, systemic vascular resistance; SAC, systemic arterial compliance; VAI, valvuloarterial impedance; SVI, stroke volume index; CI, cardiac index. Data expressed as mean±SD.
CIRCULATIONAHA/2011/081125 – Final Version Lindman et al. Sildenafil Hemodynamics in Severe AS (Supplement)
13
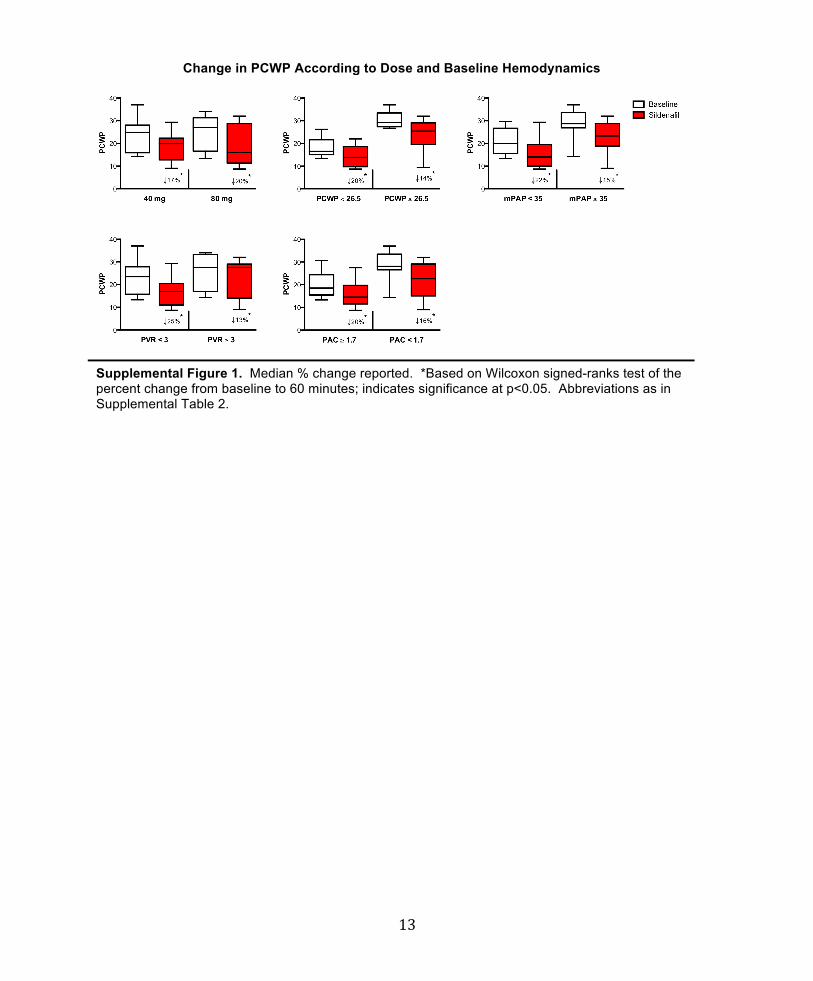
Change in PCWP According to Dose and Baseline Hemodynamics
Supplemental Figure 1. Median % change reported. *Based on Wilcoxon signed-ranks test of the percent change from baseline to 60 minutes; indicates significance at p<0.05. Abbreviations as in Supplemental Table 2.

CIRCULATIONAHA/2011/081125 – Final Version Lindman et al. Sildenafil Hemodynamics in Severe AS (Supplement)
14
Change in PAC According to Baseline Hemodynamics
Supplemental Figure 2. Median % change reported. *Based on Wilcoxon signed-ranks test of the percent change from baseline to 60 minutes; indicates significance at p<0.05. Abbreviations as in Supplemental Table 2.
CIRCULATIONAHA/2011/081125 – Final Version Lindman et al. Sildenafil Hemodynamics in Severe AS (Supplement)
15
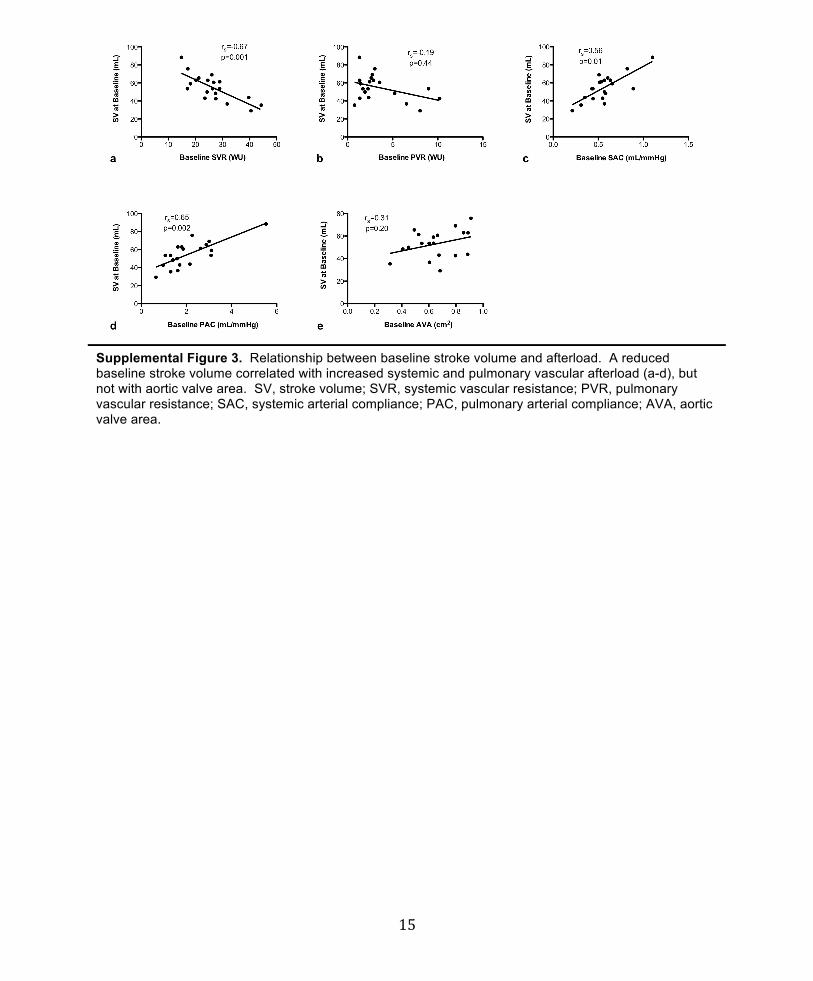
Supplemental Figure 3. Relationship between baseline stroke volume and afterload. A reduced baseline stroke volume correlated with increased systemic and pulmonary vascular afterload (a-d), but not with aortic valve area. SV, stroke volume; SVR, systemic vascular resistance; PVR, pulmonary vascular resistance; SAC, systemic arterial compliance; PAC, pulmonary arterial compliance; AVA, aortic valve area.
CIRCULATIONAHA/2011/081125 – Final Version Lindman et al. Sildenafil Hemodynamics in Severe AS (Supplement)
16
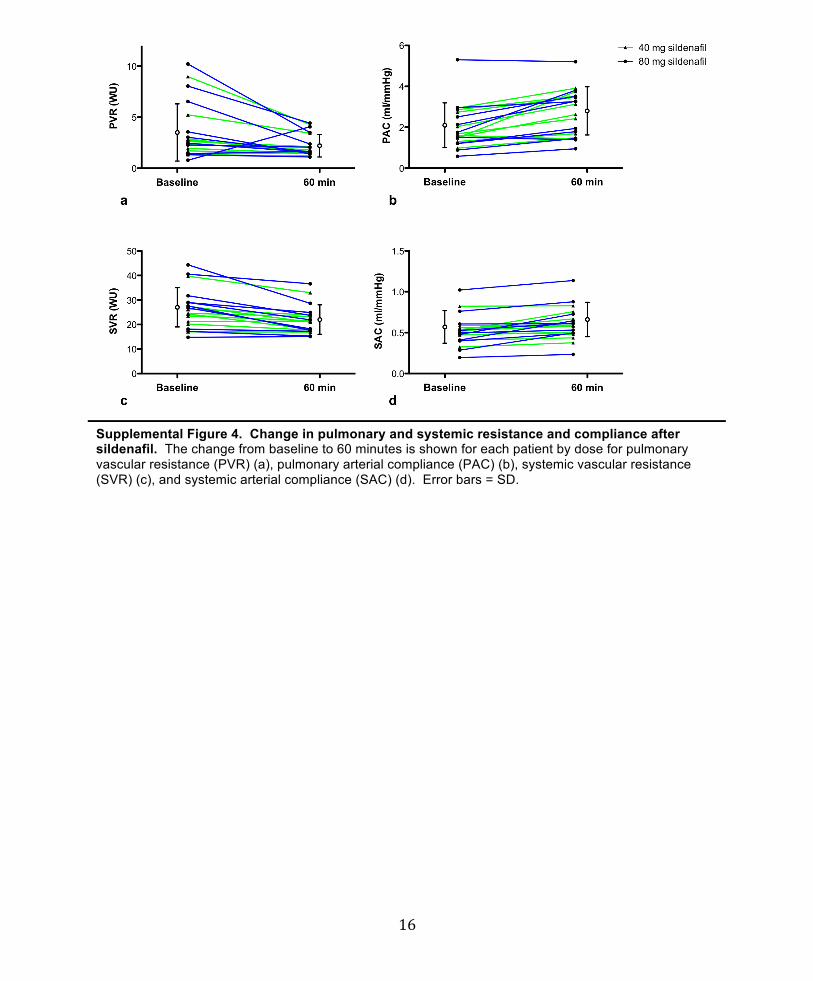
Supplemental Figure 4. Change in pulmonary and systemic resistance and compliance after sildenafil. The change from baseline to 60 minutes is shown for each patient by dose for pulmonary vascular resistance (PVR) (a), pulmonary arterial compliance (PAC) (b), systemic vascular resistance (SVR) (c), and systemic arterial compliance (SAC) (d). Error bars = SD.
CIRCULATIONAHA/2011/081125 – Final Version Lindman et al. Sildenafil Hemodynamics in Severe AS (Supplement)
17
References for the Supplemental Data
1. Pauwels RA, Buist AS, Calverley PM, Jenkins CR, Hurd SS. Global strategy for the diagnosis, management, and prevention of chronic obstructive pulmonary disease. NHLBI/WHO Global Initiative for Chronic Obstructive Lung Disease (GOLD) Workshop summary. Am J Respir Crit Care Med. 2001;163:1256-1276.


![Phosphodiesterase-4 inhibition attenuates pulmonary ... · cAMP levels [10, 11]. PDEs belong to an enzyme family with 11 different members, isoenzymes PDE1–PDE11, which exert their](https://img.pdfslide.net/doc/110x75/5f19078300de455492750ef8/phosphodiesterase-4-inhibition-attenuates-pulmonary-camp-levels-10-11-pdes.jpg)