Embed Size (px)
Citation preview
Jun-Beom ParkYongpyo JeonYoungkyung Ko
Effects of titanium brush on machinedand sand-blasted/acid-etched titaniumdisc using confocal microscopy andcontact profilometry
Authors’ affiliations:Jun-Beom Park, Youngkyung Ko, Department ofPeriodontics, Seoul St Mary’s Hospital, College ofMedicine, The Catholic University of Korea, Seoul,KoreaYongpyo Jeon, Dentium Co., Ltd., Suwon, Kyunggi-do, Korea
Corresponding author:Youngkyung Ko DDS, MSD, PhDDepartment of PeriodonticsSeoul St Mary’s HospitalCollege of MedicineThe Catholic University of Korea222, Banpo-daeroSeocho-gu, Seoul 137-701KoreaTel.: +82 2 2258 6295Fax: +82 2 537 2374e-mail: [email protected]
Key words: confocal microscopy, dental implants, scanning electron microscopy, surface prop-
erties, titanium, toothbrushing
Abstract
Objective: Mechanical techniques, including scaling with metal, plastic, or ultrasonic instruments,
rubber cup polishing, air-powder abrasive system and brushing with a conventional or a rotating
brush, have been used for the debridement of dental implants. Recently, rotating brushes with
titanium bristles (titanium brush) have been introduced for the debridement of implant surface
when peri-implant osseous defects occur. The purpose of this study was to evaluate the effects of a
titanium brush on machined (MA) and sand-blasted and acid-etched (SA) titanium surfaces using
scanning electron microscopy, confocal microscopy and profilometry. Moreover, correlations
between the two quantitative evaluation methods (confocal microscopy and contact profilometry)
were assessed.
Materials and Methods: Both MA and SA discs were treated with rotating titanium brush at
300 rpm under irrigation for a total of 40 s. Roughness measurements were taken with confocal
microscopy and surface profilometry. Then, the MA and SA surfaces were evaluated using scanning
electron microscopy to determine the changes of the surface properties.
Results: Untreated MA surface demonstrated uniform roughness with circumferential machining
marks, and scratch lines over the original surfaces were observed after treatment with the titanium
brush. Similarly, the titanium brush produced noticeable changes on the SA titanium surfaces.
However, this treatment with titanium brush did not significantly change the roughness
parameters, including the arithmetic mean height of the surface (Sa) and the maximum height of
the surface (Sz), in both MA and SA surfaces. Correlations between two evaluation methods
showed a Pearson correlation coefficient of 0.98 with linear regression R2 of 0.96.
Conclusion: This study showed that the treatment with the titanium brush did not significantly
change the roughness parameters, including Sa and Sz, in both MA and SA surfaces. Correlations
between confocal microscopy and surface profilometry showed high correlation with a Pearson
correlation coefficient of 0.98.
Peri-implantitis is defined as an inflamma-
tory process affecting the tissues around an
osseointegrated implant, resulting in the loss
of the supporting bone (Amoroso et al. 2006).
Recent reports showed that the prevalence of
peri-implantitis is assumed to be between
10% and 20% (Duddeck et al. 2012). An
increasing number of dentists are including
dental implant therapy in their clinics, and
this may lead to an increasing number of
cases with peri-implantitis (Wohlfahrt &
Lyngstadaas 2012). Mechanical techniques,
including scaling with metal, plastic, or
ultrasonic instruments, rubber cup polishing,
air-powder abrasive system and brushing
with a conventional or a rotating brush, have
been used for the debridement of dental
implants (Alhag et al. 2008; Park et al.
2012a,b; Park et al. 2013). Recently, rotating
brushes with titanium bristles (titanium
brush) have been introduced for the debride-
ment of peri-implant osseous defects (Wohl-
fahrt & Lyngstadaas 2012).
Scanning electron microscopy, confocal
microscopy and profilometry may be used to
evaluate the characteristics of the surfaces
(Park et al. 2012a,b). Scanning electron
microscopy is one of the most widely used
methods to evaluate the surface topography,
and a magnified view may show the configu-
ration and the characteristics of the surface
(Brookshire et al. 1997; Ahn et al. 2011).
Date:Accepted 25 October 2013
To cite this article:Park J-B, Jeon Y, Ko Y. Effects of titanium brush on machinedand sand-blasted/acid-etched titanium disc using confocalmicroscopy and contact profilometry.Clin. Oral Impl. Res. 26, 2015, 130–136doi: 10.1111/clr.12302
130 © 2013 John Wiley & Sons A/S. Published by John Wiley & Sons Ltd
Quantitative evaluation of the change of the
surfaces may be evaluated with confocal
microscopy and contact profilometry (Park
et al. 2012a,b). Confocal microscopy utilizes
the reconstruction of surface topography from
optical sections either by reflection or by flu-
orescence imaging (Evans et al. 2001; Howell
et al. 2002; Park et al. 2012a,b). Contact pro-
filometry utilizes a stylus, which is moved
vertically in contact with a sample and then
moved laterally across the sample (Kim et al.
2008; Zhang et al. 2010).
This study was performed to evaluate the
effects of the titanium brush on machined
(MA) and sandblasted and acid-etched (SA)
titanium surfaces using scanning electron
microscopy, confocal microscopy and profil-
ometry. Additionally, correlations between
the two quantitative evaluation methods
(confocal microscopy and contact profilome-
try) were assessed.
Material and methods
Specimen preparation for profilometry
Six MA titanium discs and six SA discs were
used in this study. The discs measured
10 mm in diameter and 2 mm in thickness.
The MA and SA titanium discs were instru-
mented with a titanium brush (Tigran Peri-
brush, Tigran Technologies AB, Malm€o,
Sweden) at 300 rpm under irrigation for 40 s
by a single operator (JP) (Fig. 1). Calibrations
were performed before the experiments, and
the average force applied in this study was
approximately 15 g.
Determination of surface properties withconfocal microscopy
Roughness parameters (arithmetic mean value
of the profile [Ra], maximum height of the pro-
file [Rz], skewness of the assessed profile
[Rsk], arithmetic mean height of the surface
[Sa], maximum height of the surface [Sz],
skewness [Ssk], developed interfacial area ratio
[Sdr], and kurtosis [Sku]) were measured before
and after instrumentation using a confocal
laser microscope (LSM5 Pascal, Zeiss, Jena,
Germany). All the values were determined at a
cutoff length of 0.04 mm in 50 sections, and
the stack size of z-sections was 0.80 lm. Each
scanning covered an area of 460.7 9 460.7 lm,
and a Gaussian filter was used to determine
the surface values. Roughness measurements
were calculated by using the proprietary soft-
ware (Topography package; Zeiss) (Stubinger
et al. 2010). Three discs were used for each
group, and measurements were taken at five
random areas from each disc.
Measurement of surface roughness withcontact profilometry
The surface roughness of MA and SA tita-
nium discs was measured using a contact
profilometer (SURFPAK-SV, Mitutoyo, Hiro-
shima, Japan). The average roughness (Ra)
was used to characterize the roughness.
Examination of the titanium discs treated withtitanium brush using scanning electronmicroscopy
Following the treating of the MA and SA tita-
nium discs with titanium brush, the surfaces
were washed twice with phosphate-buffered
saline (PBS) to remove debris. The surfaces
were evaluated using scanning electron
microscopy to determine the changes of the
surface properties after the instrumentation.
The samples were mounted on stubs. The
discs were then air-dried on a clean bench via
evaporation of hexamethyldisilazane sputter-
coated with gold palladium and observed
using a scanning electron microscope (S-4700,
Hitachi, Tokyo, Japan) at 15 kV and 20009
magnification. Images were randomly cap-
tured from each disc and were saved as TIFF.
Statistical methods
Data are represented as mean � standard
deviation. Non-parametric Mann–Whitney
U-test was used to test for statistical differ-
ences between the test and the control
groups with commercially available statisti-
cal software (SPSS 12 for Windowsl SPSS
Inc., Chicago, IL, USA). Statistical signifi-
cance was set at P < 0.05. Correlations
between the two evaluation methods were
assessed with Pearson’s correlation analysis.
Fig. 1. Titanium brush used in this study.
(a) (b)
(c) (d)
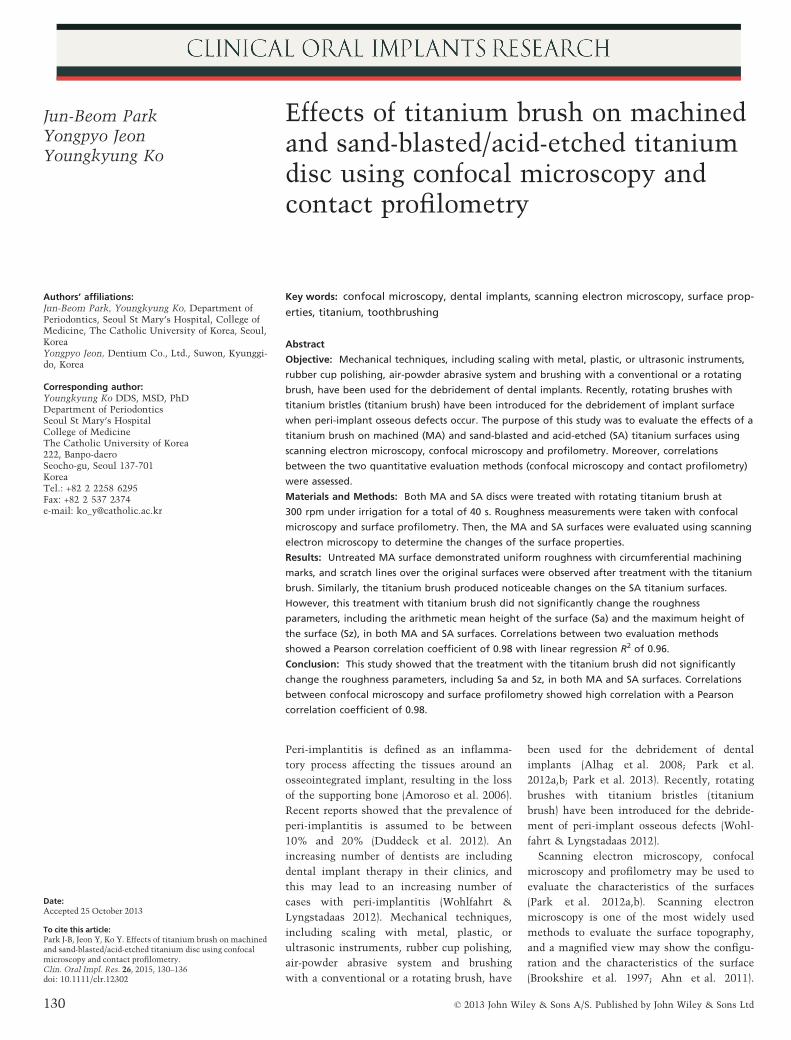
Fig. 2. The morphology of the surface of the titanium discs after treatment. (a) Untreated MA surface; (b) MA tita-
nium brush; (c) SA control (no treatment); (d) SA titanium brush. MA, Machined; SA, sand-blasted and acid-etched.
© 2013 John Wiley & Sons A/S. Published by John Wiley & Sons Ltd 131 | Clin. Oral Impl. Res. 26, 2015 / 130–136
Park et al �Titanium brush and titanium disc
Results
The gross morphology of the surface of the
MA and SA titanium discs after treatment
with titanium is shown in Fig. 2. Differences
in colour and surface texture between MA
and SA and changes after the instrumenta-
tion with titanium brush could be discrimi-
nated by visual inspection alone. The change
in the surface morphology after treatment
was obvious when compared with the
untreated MA and SA surfaces.
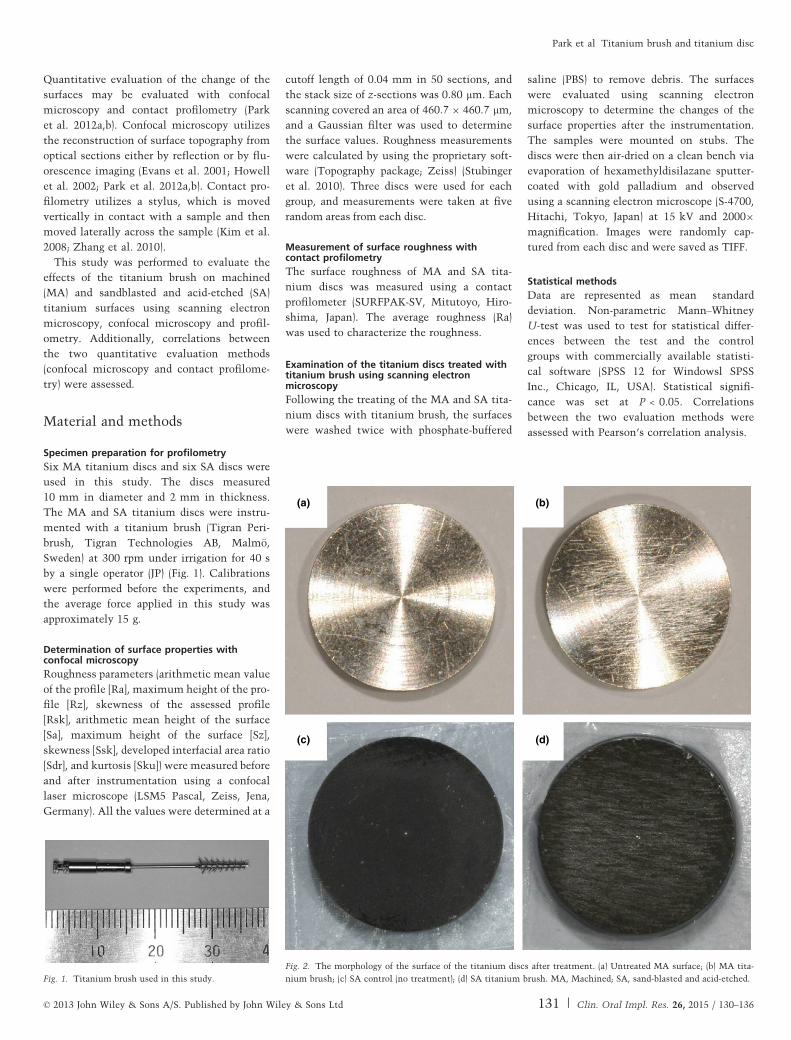
The surface properties measured with the
confocal microscope are shown in Fig. 3. The
untreated MA surface demonstrated uniform
roughness with circumferential machining
marks (Fig. 3a). The untreated MA surface
showed a relatively flat topographic configu-
ration with isotropic grooves. Scratch lines
over the original surfaces were observed after
treatment with titanium brush (Fig. 3b). The
untreated SA surface demonstrated uniform
roughness (Fig. 3c), and the titanium brush
produced noticeable changes on the SA tita-
nium surfaces (Fig. 3d). The surface charac-
teristics of examined areas are listed in
Fig. 4, and the profiles of each group are
listed in Fig. 5. Fig. 6 shows the images
obtained with contact profilometry.
The qualitative analyses of roughness
parameters using two different methods are
seen in Tables 1 and 2. There were no signifi-
cant changes of Ra value after treatment in
MA and SA discs when evaluations were per-
formed with confocal microscopy and contact
profilometry (P > 0.05). Similarly, no signifi-
cant changes of Sa and Sz values were
noticed in MA and SA surfaces after treat-
ment (P > 0.05). The changes of Ssk, Sdr and
Sku after treatments are shown in Table 1.
Ssk values were increased after the treat-
ment, and Sdr and Sku values were decreased
after the treatment. Correlations in Ra mea-
surements between two evaluation methods
showed a Pearson correlation coefficient of
0.98 with linear regression R2 of 0.96.
Fig. 7 shows the images obtained with
scanning electron microscopy from untreated
MA, treated MA, untreated SA and treated
SA implant discs. SEM images of untreated
MA showed smooth configuration with
machining marks (Fig. 7a). Scratch lines over
the original surfaces were observed after
treatment with titanium brush (Fig. 7b).
Untreated SA surface demonstrated rough
surface with sharp spikes and deep pits
(Fig. 7c). The titanium brush produced
noticeable changes on the SA titanium
surfaces (Fig. 7d).
Discussion
This study showed that treatment with tita-
nium brush did not produce significant changes
on the roughness parameters, including Sa and
Sz, in both MA and SA surfaces. Secondly,
high correlations between two evaluation
methods using Spearman’s correlation analy-
sis with coefficient of 0.98 suggested that
both methods (confocal microscopy and
(a) (b)
(c) (d)
Fig. 3. The results of the surfaces using confocal microscopy (Intensity projection with extended depth of focus). (a)
MA control (no treatment); (b) MA titanium brush; (c) SA control (no treatment); (d) SA titanium brush. MA,
Machined; SA, sand-blasted and acid-etched.
(a) (b)
(c) (d)
Fig. 4. The surface characteristics of examined area. (a) MA control (no treatment); (b) MA titanium brush; (c) SA
control (no treatment); (d) SA_titanium brush. MA, Machined; SA, sand-blasted and acid-etched.
132 | Clin. Oral Impl. Res. 26, 2015 / 130–136 © 2013 John Wiley & Sons A/S. Published by John Wiley & Sons Ltd
Park et al �Titanium brush and titanium disc
contact profilometry) might be useful for the
evaluation of the surface characteristics.
In this study, different methods were used
to evaluate the changes of the surface proper-
ties. Scanning electron microscopy showed
the change of the surface in MA and SA sur-
faces very clearly. This method is very use-
ful, but additional sample preparation is
needed, and quantitative analysis is difficult
(Brookshire et al. 1997; Lu et al. 2012). Con-
focal microscopy can measure various rough-
ness parameters and has been applied in
various applications in dentistry, including
teeth and titanium (Howell et al. 2002; Park
et al. 2012a,b). Contact profilometry, which
utilizes stylus, has several advantages
because most of the surface finish standards
in the world are written for this profilometry,
which is less influenced by a dirty environ-
ment with contaminants (Durakbasa et al.
2011). It should be kept in mind that the sty-
lus readings are influenced by the radius of
the stylus tip, the pressure of the stylus tip
on the surface and the hardness of material
(Wen et al. 1996; Durakbasa et al. 2011).
In this study, surface topography was quan-
titatively evaluated by confocal microscopy
to measure roughness parameters Ra, Rz,
Rsk, Sa, Sz, Ssk, Sdr and Sku, and by contact
profilometry to evaluate Ra. Ra is one of the
most widely used parameters of roughness,
and it remains useful as a general guideline
on the surface texture (Park et al. 2012a,b).
However, it has been shown to be too general
to describe the surface’s functional nature in
today’s ever-increasing complexity of applica-
tions because Ra averages all peaks and val-
leys of the roughness profile (Taylor et al.
2006). Rz reflects outlying points better
because it averages only the five highest
peaks and the five deepest valleys (Demircio-
glu & Durakbasa 2011). Moreover, Ra and Rz
give information only from a profile, but Sa
and Sz provide information about a surface
area, resulting in three-dimensional parame-
ters with higher reliability (Wennerberg &
Albrektsson 2010). Ssk shows the skewness
of surface height distribution and represents
the degree of symmetry of the surface heights
about the mean plane (Gruhn et al. 2012),
and it is useful in monitoring for different
types of wear conditions (Whitehouse 2000).
If Ssk is greater than zero, it indicates the
predominance of peaks; if Ssk is less than
zero, it means that valley structures have
more quantity (Tudose et al. 2007). Sdr pre-
sents information about the number and the
height of peaks of a given surface, and it is
defined as the developed interfacial area ratio
and expresses the increment of the interfacial
(a) (b)
(c) (d)
00 50 100 150 200
Distance [µm]250 300 350 400 450 0 50 100 150 200
Distance [µm]250 300 350 400 450
0 50 100 150 200Distance [µm]
250 300 350 400 4500 50 100 150 200Distance [µm]
250 300 350 400 450
5
10
15
z [µ
m] 20
25
30
0
5
10
15
z [µ
m] 20
25
30
05
1015z
[µm
]
2025303540
0
5
10
15
z [µ
m] 20
25
30
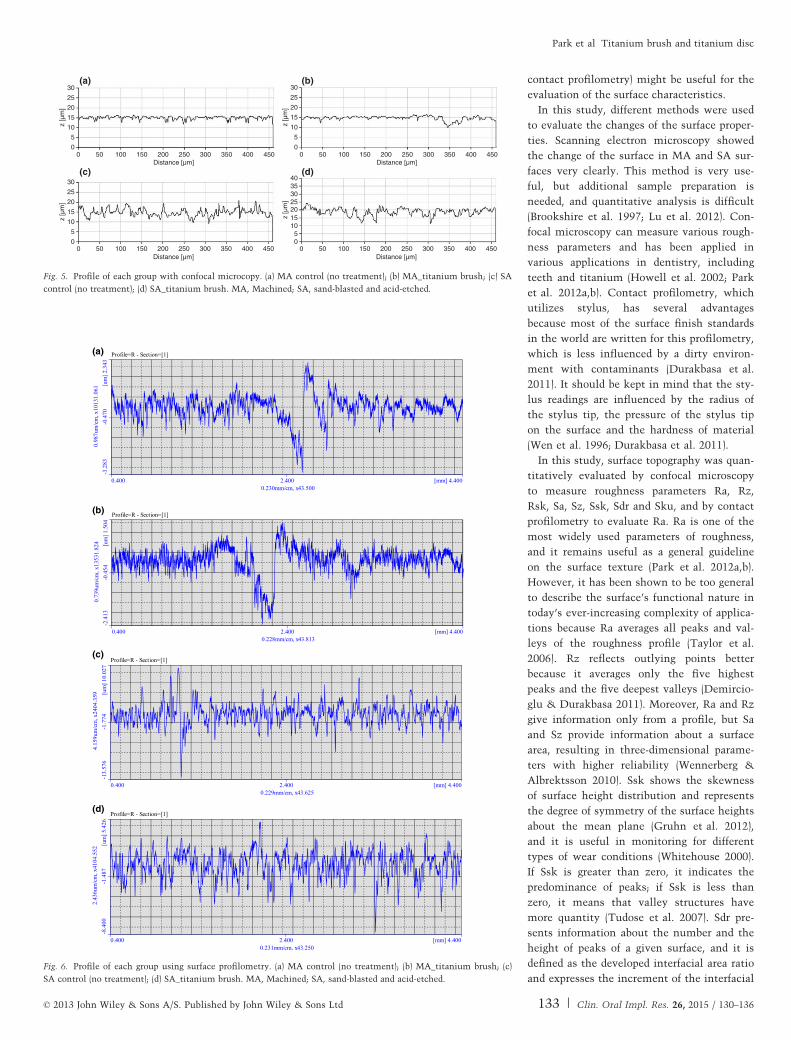
Fig. 5. Profile of each group with confocal microcopy. (a) MA control (no treatment); (b) MA_titanium brush; (c) SA
control (no treatment); (d) SA_titanium brush. MA, Machined; SA, sand-blasted and acid-etched.
(a)
(b)
(c)
(d)
Fig. 6. Profile of each group using surface profilometry. (a) MA control (no treatment); (b) MA_titanium brush; (c)
SA control (no treatment); (d) SA_titanium brush. MA, Machined; SA, sand-blasted and acid-etched.
© 2013 John Wiley & Sons A/S. Published by John Wiley & Sons Ltd 133 | Clin. Oral Impl. Res. 26, 2015 / 130–136
Park et al �Titanium brush and titanium disc
surface area relative to a flat plane baseline
(Dohan Ehrenfest et al. 2010). For a totally
flat surface, Sdr is 0%, and when Sdr is
100%, it means that the roughness of a sur-
face doubled its developed area (Dohan
Ehrenfest et al. 2010). Sdr may further differ-
entiate surfaces of similar amplitudes and
average roughness (Ejaz et al. 2006). Greater
surface area increases the area available for
bacterial adhesion (Teughels et al. 2006) and
research on biofilm formation on implant
surfaces need to consider differences in Sdr
as well. Sku characterizes the spread of the
height distribution (Ejaz et al. 2004), and Sku
is 3.00 if the surface heights are normally dis-
tributed (i.e., bell curve). If there are extreme
high peaks or deep valley features, Sku is
>3.00, and Sku is <3.00 in the absence of
extreme peaks or valleys (Qi et al. 2008).
One weakness of this study would be that
the effects of the titanium brush were tested on
titanium discs instead of using titanium
implant fixtures. Implant surface structures
vary in millimeter by design of the implant, in
micrometer and in nanometer level by surface
roughness (Svanborg et al. 2010) and the thread
of the implant demonstrate form, waviness and
roughness (Wennerberg & Albrektsson 2000).
Implant fixtures may have different thread
pitches (from narrow-pitch to wide pitch), and
thread pitch be from 0.5 mm or less to 1.6 mm
or greater (Orsini et al. 2012). The units of
roughness parameters are in micrometer ranges
(0.5–15). Thus, the thread pitch may not have
much influence on the roughness parameters
(Wennerberg et al. 1993). However, the accessi-
bility of instruments may differ with fixtures
with different pitches (Svanborg et al. 2010).
Clinically, it may be more difficult to manoeu-
vre the titanium brush in infrabony areas and
more than optimal lateral force may be applied
to the implant.
In MA surfaces, scanning electron micros-
copy showed scratch lines over the untreated
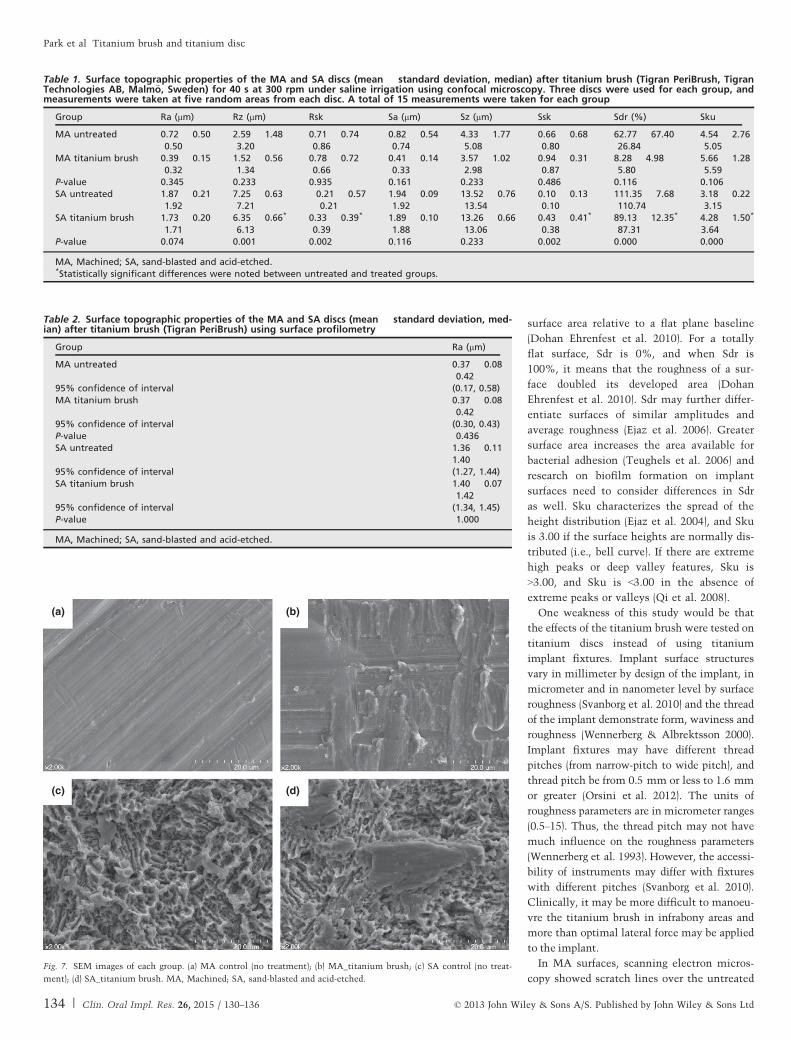
Table 1. Surface topographic properties of the MA and SA discs (mean � standard deviation, median) after titanium brush (Tigran PeriBrush, TigranTechnologies AB, Malm€o, Sweden) for 40 s at 300 rpm under saline irrigation using confocal microscopy. Three discs were used for each group, andmeasurements were taken at five random areas from each disc. A total of 15 measurements were taken for each group
Group Ra (lm) Rz (lm) Rsk Sa (lm) Sz (lm) Ssk Sdr (%) Sku
MA untreated 0.72 � 0.500.50
2.59 � 1.483.20
0.71 � 0.740.86
0.82 � 0.540.74
4.33 � 1.775.08
0.66 � 0.680.80
62.77 � 67.4026.84
4.54 � 2.765.05
MA titanium brush 0.39 � 0.150.32
1.52 � 0.561.34
0.78 � 0.720.66
0.41 � 0.140.33
3.57 � 1.022.98
0.94 � 0.310.87
8.28 � 4.985.80
5.66 � 1.285.59
P-value 0.345 0.233 0.935 0.161 0.233 0.486 0.116 0.106SA untreated 1.87 � 0.21
1.927.25 � 0.637.21
�0.21 � 0.57�0.21
1.94 � 0.091.92
13.52 � 0.7613.54
0.10 � 0.130.10
111.35 � 7.68110.74
3.18 � 0.223.15
SA titanium brush 1.73 � 0.201.71
6.35 � 0.66*
6.130.33 � 0.39*
0.391.89 � 0.101.88
13.26 � 0.6613.06
0.43 � 0.41*
0.3889.13 � 12.35*
87.314.28 � 1.50*
3.64P-value 0.074 0.001 0.002 0.116 0.233 0.002 0.000 0.000
MA, Machined; SA, sand-blasted and acid-etched.*Statistically significant differences were noted between untreated and treated groups.
Table 2. Surface topographic properties of the MA and SA discs (mean � standard deviation, med-ian) after titanium brush (Tigran PeriBrush) using surface profilometry
Group Ra (lm)
MA untreated 0.37 � 0.080.42
95% confidence of interval (0.17, 0.58)MA titanium brush 0.37 � 0.08
0.4295% confidence of interval (0.30, 0.43)P-value 0.436SA untreated 1.36 � 0.11
1.4095% confidence of interval (1.27, 1.44)SA titanium brush 1.40 � 0.07
1.4295% confidence of interval (1.34, 1.45)P-value 1.000
MA, Machined; SA, sand-blasted and acid-etched.
(a) (b)
(c) (d)
Fig. 7. SEM images of each group. (a) MA control (no treatment); (b) MA_titanium brush; (c) SA control (no treat-
ment); (d) SA_titanium brush. MA, Machined; SA, sand-blasted and acid-etched.
134 | Clin. Oral Impl. Res. 26, 2015 / 130–136 © 2013 John Wiley & Sons A/S. Published by John Wiley & Sons Ltd
Park et al �Titanium brush and titanium disc
surface. However, there were no significant
changes of Sa and Sz after treatment. A sta-
tistically significant decrease in Sdr value
suggests that spatial intricacy was decreased
after treatment. In SA surfaces, significant
changes were noted in Ssk, Sdr and Sku. A
decrease in Sdr value suggests that spatial
intricacy was reduced, and an increase in Ssk
and Sku suggests that there was a higher ten-
dency for the predominance of peaks.
Titanium brush was suggested to offer easier
access to narrow spaces and implant threads
(Tigran Technologies AB 2011). Compared with
other mechanical instrumentation, including
ultrasonic scaling, titanium brush may be con-
sidered gentler to the implant surface because
less force is applied on the titanium surface
than in previous studies (40–300 g) (Sato et al.
2004; Ramaglia et al. 2006; Duddeck et al.
2012). Titanium brushes may adapt closely to
the architecture of the implant, and rotating
titanium brush at 300–600 rpm under continu-
ous irrigation may shorten treatment time
(Duddeck et al. 2012).
It is reported that material that is less
hard than titanium may leave remnants on
the surface after treatment (Unursaikhan
et al. 2012; Ruhling et al. 1994; Schwarz
et al. 2003). Plastic- and teflon-coated
instruments may leave plastic contamina-
tions that are macroscopically visible
(Gosau et al. 2010), and the biocompatibil-
ity of the titanium surfaces may be
impaired by the contaminants (Schwarz
et al. 2006). Stainless steel particles abraded
from the metal brush may become embed-
ded in the titanium surface, and this may
initiate galvanic corrosion (Tigran Technolo-
gies AB 2009). A significant decrease in the
number of osteoblast-like cells was seen in
the presence of debris of the carbon fibres
(Schwarz et al. 2003). Similarly, fibroblasts
grown on stainless steel instrumented sur-
faces showed a somewhat rounded morphol-
ogy and a relatively reduced degree of
spreading (Dmytryk et al. 1990). Negative
impact coming from plastic or stainless
steel tools may be avoided by using tita-
nium brush (Tigran Technologies AB 2009).
Further research is needed to evaluate the
efficiency of titanium brush on removing
the contaminants and adhering bacteria and
effects of treatment on the cellular attach-
ment, proliferation and differentiation.
Conclusions
This study evaluated the effects of titanium
brush on MA and SA titanium discs using
confocal microscopy, contact profilometry
and scanning electron microscopy. Treat-
ment with titanium brush did not signifi-
cantly change the roughness parameters,
including Sa and Sz, in both MA and SA sur-
faces. Correlations between confocal micros-
copy and surface profilometry showed high
correlation with a Pearson correlation coeffi-
cient of 0.98.
Acknowledgements: This research
was supported by Seoul St. Mary’s Hospital
Clinical Medicine Research Program year of
2013 through the Catholic University of
Korea. The authors acknowledge Dentium
(Seoul, Korea) for donating the titanium discs
for this study.
References
Ahn, S.J., Han, J.S., Lim, B.S. & Lim, Y.J. (2011)
Comparison of ultraviolet light-induced photocat-
alytic bactericidal effect on modified titanium
implant surfaces. The International Journal of
Oral & Maxillofacial Implants 26: 39–44.
Alhag, M., Renvert, S., Polyzois, I. & Claffey, N.
(2008) Re-osseointegration on rough implant sur-
faces previously coated with bacterial biofilm: an
experimental study in the dog. Clinical Oral
Implants Research 19: 182–187.
Amoroso, P.F., Adams, R.J., Waters, M.G. & Wil-
liams, D.W. (2006) Titanium surface modification
and its effect on the adherence of Porphyromonas
gingivalis: an in vitro study. Clinical Oral
Implants Research 17: 633–637.
Brookshire, F.V., Nagy, W.W., Dhuru, V.B., Ziebert, G.J.
& Chada, S. (1997) The qualitative effects of various
types of hygiene instrumentation on commercially
pure titanium and titanium alloy implant abutments:
an in vitro and scanning electron microscope study.
Journal of Prosthetic Dentistry 78: 286–294.
Demircioglu, P. & Durakbasa, M.N. (2011) Investi-
gations on machined metal surfaces through the
stylus type and optical 3D instruments and their
mathematical modeling with the help of statisti-
cal techniques. Measurement 44: 611–619.
Dmytryk, J.J., Fox, S.C. & Moriarty, J.D. (1990) The
effects of scaling titanium implant surfaces with
metal and plastic instruments on cell attach-
ment. Journal of Periodontology 61: 491–496.
Dohan Ehrenfest, D.M., Coelho, P.G., Kang, B.S.,
Sul, Y.T. & Albrektsson, T. (2010) Classification
of osseointegrated implant surfaces: materials,
chemistry and topography. Trends in Biotechnol-
ogy 28: 198–206.
Duddeck, D.U., Karapetian, V.E. & Grandoch, A.
(2012) Time-saving debridment of implants with
rotating titanium brushes. Implants 13: 20–22.
Durakbasa, M.N., Osanna, P.H. & Demircioglu, P.
(2011) The factors affecting surface roughness
measurements of the machined flat and spherical
surface structures – the geometry and the preci-
sion of the surface. Measurement 44: 1986–1999.
Ejaz, S., Chekarova, I., Ashraf, M. & Lim, C.W.
(2006) A novel 3-d model of chick chorioallantoic
membrane for ameliorated studies in angiogene-
sis. Cancer Investigation 24: 567–575.
Ejaz, S., Seok, K.B. & Woong, L.C. (2004) A novel
image probing system for precise quantification
of angiogenesis. Tumori 90: 611–617.
Evans, A.R., Harper, I.S. & Sanson, G.D. (2001)
Confocal imaging, visualization and 3-D surface
measurement of small mammalian teeth. Journal
of Microscopy 204: 108–118.
Gosau, M., Hahnel, S., Schwarz, F., Gerlach, T.,
Reichert, T.E. & Burgers, R. (2010) Effect of six dif-
ferent peri-implantitis disinfection methods on in
vivo human oral biofilm. Clinical Oral Implants
Research 21: 866–872.
Gruhn, S., Fischer, R. & Vielhauer, C. (2012) Sur-
face classification and detection of latent finger-
prints based on 3D surface texture parameters.
SPIE Proceedings 8436: 1.
Howell, K., Hopkins, N. & McLoughlin, P. (2002)
Combined confocal microscopy and stereology: a
highly efficient and unbiased approach to quanti-
tative structural measurement in tissues. Experi-
mental Physiology 87: 747–756.
Kim, H., Choi, S.H., Ryu, J.J., Koh, S.Y., Park, J.H.
& Lee, I.S. (2008) The biocompatibility of SLA-
treated titanium implants. Biomedical Materials
3: 025011.
Lu, H., Zhou, L., Wan, L., Li, S., Rong, M. & Guo,
Z. (2012) Effects of storage methods on time-
related changes of titanium surface properties and
cellular response. Biomedical Materials 7:
055002.
Orsini, E., Giavaresi, G., Trire, A., Ottani, V. & Sal-
garello, S. (2012) Dental implant thread pitch and
its influence on the osseointegration process: an
in vivo comparison study. The International Jour-
nal of Oral & Maxillofacial Implants 27: 383–
392.
Park, J., Jang, Y., Choi, B., Kim, K. & Ko, Y. (2013)
Treatment with various ultrasonic scaler tips
affect efficiency of brushing of SLA titanium
discs. Journal of Craniofacial Surgery 24: 119–
123.
Park, J.B., Jang, Y.J., Koh, M., Choi, B.K., Kim, K.K.
& Ko, Y. (2012a) In vitro analysis of the efficacy
of ultrasonic scalers and a toothbrush for remov-
ing bacteria from rbm titanium discs. Journal of
Periodontology 84: 1191–1198.
Park, J.B., Kim, N. & Ko, Y. (2012b) Effects of ultra-
sonic scaler tips and toothbrush on titanium disc
surfaces evaluated with confocal microscopy.
Journal of Craniofacial Surgery 23: 1552–1558.
Qi, Q., Liu, X. & Jiang, X. (2008) Functions and
three dimensional parameters of surface texture.
SPIE Proceedings 7133: 3.
Ramaglia, L., di Lauro, A.E., Morgese, F. &
Squillace, A. (2006) Profilometric and standard
error of the mean analysis of rough implant sur-
faces treated with different instrumentations.
Implant Dentistry 15: 77–82.
© 2013 John Wiley & Sons A/S. Published by John Wiley & Sons Ltd 135 | Clin. Oral Impl. Res. 26, 2015 / 130–136
Park et al �Titanium brush and titanium disc
Ruhling, A., Kocher, T., Kreusch, J. & Plagmann,
H.C. (1994) Treatment of subgingival implant sur-
faces with teflon-coated sonic and ultrasonic sca-
ler tips and various implant curettes. An in vitro
study. Clinical Oral Implants Research 5: 19–29.
Sato, S., Kishida, M. & Ito, K. (2004) The compara-
tive effect of ultrasonic scalers on titanium sur-
faces: an in vitro study. Journal of Periodontology
75: 1269–1273.
Schwarz, F., Papanicolau, P., Rothamel, D., Beck,
B., Herten, M. & Becker, J. (2006) Influence of
plaque biofilm removal on reestablishment of the
biocompatibility of contaminated titanium sur-
faces. Journal of Biomedical Materials Research
Part A 77: 437–444.
Schwarz, F., Rothamel, D., Sculean, A., Georg, T.,
Scherbaum, W. & Becker, J. (2003) Effects of an
Er:YAG laser and the vector ultrasonic system on
the biocompatibility of titanium implants in cul-
tures of human osteoblast-like cells. Clinical
Oral Implants Research 14: 784–792.
Stubinger, S., Etter, C., Miskiewicz, M., Homann,
F., Saldamli, B., Wieland, M. & Sader, R. (2010)
Surface alterations of polished and sandblasted
and acid-etched titanium implants after Er:YAG,
carbon dioxide, and diode laser irradiation. The
International Journal of Oral & Maxillofacial
Implants 25: 104–111.
Svanborg, L.M., Andersson, M. & Wennerberg, A.
(2010) Surface characterization of commercial oral
implants on the nanometer level. Journal of
Biomedical Materials Research Part B: Applied
Biomaterials 92: 462–469.
Taylor, J.B., Carrano, A.L. & Kandlikar, S.G. (2006)
Characterization of the effect of surface rough-
ness and texture on fluid flow – past, present, and
future. International Journal of Thermal Sciences
45: 962–968.
Teughels, W., Van Assche, N., Sliepen, I. &
Quirynen, M. (2006) Effect of material character-
istics and/or surface topography on biofilm devel-
opment. Clinical Oral Implants Research 17
(Suppl 2): 68–81.
Tigran Technologies AB (2009) Effective cleaning
and conditioning of implants. European Journal
of Dental Implantology 5: 2.
Tigran Technologies AB (2011) Novel titanium
brush for implant debridement. European Journal
of Dental Implantology 7: 94.
Tudose, I.V., Horv�ath, P., Suchea, M., Christoulakis,
S., Kitsopoulos, T. & Kiriakidis, G. (2007) Correla-
tion of ZnO thin film surface properties with con-
ductivity. Applied Physics A: Materials Science &
Processing 89: 57–61.
Unursaikhan, O., Lee, J.S., Cha, J.K., Park, J.C.,
Jung, U.W., Kim, C.S., Cho, K.S. & Choi, S.H.
(2012) Comparative evaluation of roughness of
titanium surfaces treated by different hygiene
instruments. Journal of Periodontal & Implant
Science 42: 88–94.
Wen, X., Wang, X. & Zhang, N. (1996) Microrough
surface of metallic biomaterials: a literature
review. Bio-medical Materials and Engineering 6:
173–189.
Wennerberg, A. & Albrektsson, T. (2000) Suggested
guidelines for the topographic evaluation of
implant surfaces. The International Journal of
Oral & Maxillofacial Implants 15: 331–344.
Wennerberg, A. & Albrektsson, T. (2010) On
implant surfaces: a review of current knowledge
and opinions. The International Journal of Oral
& Maxillofacial Implants 25: 63–74.
Wennerberg, A., Albrektsson, T. & Andersson, B.
(1993) Design and surface characteristics of 13
commercially available oral implant systems. The
International Journal of Oral & Maxillofacial
Implants 8: 622–633.
Whitehouse, D. (2000) Surface characterization and
roughness measurement in engineering. In: Rast-
ogi, P., ed. Photomechanics, 413–461. Springer,
Berlin/Heidelberg.
Wohlfahrt, J.C. & Lyngstadaas, S.P. (2012) Mechani-
cal debridement of a peri-implant osseous defect
with a novel titanium brush and reconstruction
with porous titanium granules: a case report with
reentry surgery. Clinical Advances in Periodon-
tics 2: 136–140.
Zhang, F., Yang, G.L., He, F.M., Zhang, L.J. &
Zhao, S.F. (2010) Cell response of titanium
implant with a roughened surface containing
titanium hydride: an in vitro study. Journal
of Oral and Maxillofacial Surgery 68: 1131–
1139.
136 | Clin. Oral Impl. Res. 26, 2015 / 130–136 © 2013 John Wiley & Sons A/S. Published by John Wiley & Sons Ltd
Park et al �Titanium brush and titanium disc

本文献由“学霸图书馆-文献云下载”收集自网络,仅供学习交流使用。
学霸图书馆(www.xuebalib.com)是一个“整合众多图书馆数据库资源,
提供一站式文献检索和下载服务”的24 小时在线不限IP
图书馆。
图书馆致力于便利、促进学习与科研,提供最强文献下载服务。
图书馆导航:
图书馆首页 文献云下载 图书馆入口 外文数据库大全 疑难文献辅助工具


![Die NICHT-beschichtete bioaktive calciumhaltige Oberfläche* · [6] Wennerberg A, Albrektsson T, Lausmaa J Torque and histomorphometric evaluation of c p titanium screws blasted with](https://img.pdfslide.net/doc/110x75/5e1d714ada519825aa714bbf/die-nicht-beschichtete-bioaktive-calciumhaltige-oberflche-6-wennerberg-a-albrektsson.jpg)