Embed Size (px)
Citation preview

ENVIRONMENTALHEALTH PERSPECTIVES
ENVIRONMENTALHEALTH PERSPECTIVES
National Institutes of HealthU.S. Department of Health and Human Services
Occupational Benzene Exposure and the Risk of Lymphoma Subtypes: a Meta-Analysis of Cohort Studies
Incorporating Three Study Quality Dimensions
Jelle Vlaanderen, Qing Lan, Hans Kromhout,Nathaniel Rothman, Roel Vermeulen
doi: 10.1289/ehp.1002318 (available at http://dx.doi.org/)Online 29 September 2010
ehponline.org
ehp
1
Occupational Benzene Exposure and the Risk of Lymphoma
Subtypes: a Meta-Analysis of Cohort Studies Incorporating
Three Study Quality Dimensions
Jelle Vlaanderen1, Qing Lan2, Hans Kromhout1, Nathaniel Rothman2*, and Roel
Vermeulen1*
1 Institute for Risk Assessment Sciences, Utrecht University, 3584 CK Utrecht, the
Netherlands
2 Division of Cancer Epidemiology and Genetics, National Cancer Institute
Department of Health and Human Services, National Institutes of Health,
Bethesda MD 20892, USA
* Co-senior authors
Correspondence:
Roel Vermeulen
Institute for Risk Assessment Sciences (IRAS)
Division Environmental Epidemiology
Jenalaan 18d
3584 CK
Utrecht
Tel: +31-30-2539448
Fax: +31-30-2539499
E-mail: [email protected]
Page 1 of 42

2
Running title: Occupational Benzene and Lymphoma Subtypes
Keywords: Acute Lymphocytic Leukemia, Benzene, Chronic Lymphocytic
Leukemia, Hodgkin Lymphoma, Leukemia, Meta-analysis, Multiple Myeloma, Non-
Hodgkin Lymphoma, Occupational Exposure.
Acknowledgements: This work was performed as part of the work package
“Integrated Risk Assessment” of the ECNIS Network of Excellence (Environmental
Cancer Risk, Nutrition and Individual Susceptibility), operating within the European
Union 6th Framework Program, Priority 5: “Food Quality and Safety” (FOOD-CT-
2005-513943).
Competing interest declaration: The authors declare they have no competing
interests
Abbreviations used:
ALL: Acute lymphocytic leukemia
AML: Acute myeloid leukemia
ANLL: Acute non-lymphocytic leukemia
CLL: Chronic lymphocytic leukemia
DLBCL: Diffuse large B cell lymphoma
FL: Follicular lymphoma
HL: Hodgkin lymphoma
IARC: International Agency for Research on Cancer
ICD: International Classification of Diseases
Page 2 of 42
3
MM: Multiple myeloma
mRR: meta-Relative Risk
NHL: non-Hodgkin lymphoma
OR: Odds Ratio
RR: Relative Risk
SMR: Standardized Mortality Ratio
WHO: World Health Organization
Page 3 of 42
4
Abstract
Objective
The use of occupational cohort studies to assess the association of benzene and
lymphoma is complicated by problems with exposure misclassification, outcome
classification, and low statistical power. We performed meta-analyses of occupational
cohort studies for five different lymphoma categories: Hodgkin lymphoma (HL), non-
Hodgkin lymphoma (NHL), multiple myeloma (MM), acute lymphocytic leukemia
(ALL), and chronic lymphocytic leukemia (CLL).
Data extraction
We assessed three study quality dimensions to evaluate the impact of study quality
variations on meta-relative risks (mRR): stratification by the year-of-start of follow-
up, stratification by the strength of the reported AML association, and stratification by
the quality of benzene exposure assessment.
Data synthesis
mRRs for MM, ALL, and CLL increased with increasing study quality, regardless of
the study quality dimension. mRRs for NHL also increased with increasing study
quality, although less pronounced. No association between occupational benzene
exposure and HL was observed.
Conclusions
Our meta-analysis provides support for an association between occupational benzene
exposure and risk of MM, ALL, and CLL. The evidence for an association with NHL
is less clear, but this is likely complicated by the etiologic heterogeneity of this group
of diseases. Further consideration of the association between benzene and NHL will
require delineation of risks by NHL subtype.
Page 4 of 42
5
Introduction
The International Agency for Research on Cancer (IARC) classified benzene as a
group 1 carcinogen (‘carcinogenic to humans’) in its 1982 and 1987 evaluations
(IARC 1982; IARC 1987) based primarily on reports of an association between
occupational exposure to benzene and leukemia, particularly acute non-lymphocytic
leukemia (ANLL), which consists primarily of acute myelogenous leukemia (AML).
Recently, IARC updated its previous reviews of several chemicals and occupational
exposure circumstances, including benzene, to reassess carcinogenicity and to
consider potential associations with additional tumor sites (Baan et al. 2009). In that
review, IARC determined for the first time that in addition to the confirmed
association with ANLL, there was also limited evidence that benzene causes acute
lymphocytic leukemia (ALL), chronic lymphocytic leukemia (CLL), non-Hodgkin
lymphoma (NHL), and multiple myeloma (MM) in humans (Baan et al. 2009). At the
same time, in recent years, there has been a plethora of reviews and meta-analyses of
benzene and one or more lymphoid neoplasms, at times reaching diametrically
opposed conclusions (Alexander and Wagner 2010; Bergsagel et al. 1999; Infante
2006; Kane and Newton 2010; Lamm et al. 2005; Savitz and Andrews 1997;
Schnatter et al. 2005; Smith et al. 2007; Sonoda et al. 2001; Steinmaus et al. 2008;
Wong and Fu 2005; Wong and Raabe 1995; Wong and Raabe 1997; Wong and Raabe
2000; Wong and Raabe 2000).
There are two fundamental challenges in using the large number of occupational
cohort studies that have been published over the last ~30 years when considering the
relationship between occupational benzene exposure and the risk of lymphoid
neoplasms. First, there have been substantial changes in testing procedures, diagnostic
Page 5 of 42
6
criteria, and categorization of lymphoid neoplasms over the last half century
(Aisenberg 2000; Harris et al. 2000; Linet et al. 2007; Morton et al. 2007), the time-
period in which follow-up of these occupational cohorts took place. Indeed,
diagnostic criteria that were used in these cohort studies were based on a range of
classification strategies including the International Classification of Diseases (ICD)-7,
ICD-8, ICD-9, and ICD-O3. The changing views on the categorization of lymphoid
neoplasms is illustrated by the current categorization of ALL and CLL as subtypes of
NHL in the most recent World Health Organization (WHO) disease classification
(Swerdlow et al. 2008), although these entities have been reported separately from
NHL in essentially all occupational cohort studies of benzene-exposed workers.
Secondly, there is heterogeneity in occupational cohort studies with regard to
industry, sample size, documentation and level of benzene exposure, and
documentation of the percent of a given cohort that had true, non-trivial exposure to
benzene. Inadequate documentation, uncertain quality of follow-up, and most
problematically, potential inclusion of ‘unexposed’ workers in ‘exposed’ categories,
would have likely resulted in attenuation of the observed associations. Further, for the
purpose of reviews or meta-analyses, it can be challenging to separate out informative
from potentially non informative cohorts in the face of uncertain documentation of
key epidemiologic study design and exposure assessment characteristics.
Given the changing nature of the diagnosis of lymphoid neoplasms over time and the
heterogeneity of occupational benzene cohort study quality in the literature, it is a
challenge to discern the nature of the relationship between benzene and lymphoid
neoplasms. To address this issue we developed three strategies that we employ in a set
of meta-analyses of occupational cohort studies for five lymphoma categories defined
Page 6 of 42

7
according to ICD-9: Hodgkin lymphoma (HL) (ICD-9: 201), NHL (ICD-9: 200,202),
MM (ICD-9: 203.0), ALL (ICD-9: 204.0), and CLL (ICD-9: 204.1).
The first strategy was applied to assess the potential impact of the gradual increase in
the quality of hematological diagnoses over the last decades. This strategy involved
stratification of the studies in the meta-analyses based on the reported start of follow-
up. The year 1970 was used as a cut-off point for stratification (approximate midpoint
of follow-up of all studies included in this analysis). The second strategy was based
on the established strong association between benzene and AML. We argue that any
study that was not able to detect at least a suggestive association between benzene and
AML most likely had serious methodological limitations in one or more aspects of
study design. Examples of possible limitations are trivial exposure to benzene in the
studied cohort, inclusion of ‘unexposed’ workers in ‘exposed categories’ or flaws in
the assessment (or categorization) of health effects (Goldstein and Shalat 2000).
Therefore, we used the direction and significance level of a reported association
between benzene and AML as a proxy for the overall study quality (AML significance
level).
The third strategy was based on the evaluation of the quality of the exposure
assessment carried out in each cohort. High quality exposure assessment is essential
to discriminate exposed individuals from non-exposed individuals (Vlaanderen et al.
2008). We assigned an exposure assessment quality classification to each study based
on an a priori defined classification scheme and used this classification as an
additional proxy of study quality, reasoning that those cohort studies with the highest
quality exposure assessment had the greatest ability to identify and include workers
who were truly exposed to benzene in their analyses.
Page 7 of 42

8
We hypothesized that application of the three study quality dimensions: stratification
based on the start of follow-up, AML significance level, and exposure assessment
quality, would identify a subgroup of occupational cohort studies that is most
informative for the evaluation of the possible association between benzene and
lymphoid neoplasms.
Page 8 of 42

9
Methodology
Study identification and data extraction
A Pubmed search using the keywords “benzene”, and “cohort” or “case-control” was
conducted. We included publications in the meta-analysis if they were published in
the peer-reviewed literature, reported results for any of the five lymphoma subtypes
(HL, NHL, MM, ALL, and CLL), and were conducted in the occupational setting. We
checked references in all identified publications for additional studies. When more
than one paper was published on the same cohort the publication with the highest
quality exposure assessment was preferred (e.g. in the Australian petroleum workers
cohort for AML we preferred the nested-case control study that included an
elaborated exposure assessment approach (Glass et al. 2003) over a more recent
update on the full cohort that included no detailed benzene exposure assessment (Gun
et al. 2006)). When multiple publications with similar quality of exposure assessment
were published on the same cohort the most recent update (with the longest follow up
time) was preferred. In this meta-analysis we pooled risk ratios, odds ratios (ORs),
and standardized mortality ratios (SMRs). ORs and SMRs can be interpreted as
reasonable approximations of the risk ratio when the disease is rare, and these
measures have been pooled with risk ratios for meta-analyses before (McElvenny et
al. 2004). We use the term relative risk (RR) to refer to either the risk ratio, the odds
ratio (OR), or the standardized mortality ratio (SMR). We extracted RRs based both
on incidence and mortality. However, if a publication reported both, incidence was
preferred over mortality in the meta-analysis.
Risk estimates
Page 9 of 42
10
To allow the inclusion of studies without quantitative exposure assessment in our
analysis only RRs for “any occupational benzene exposure” vs. “background benzene
exposure” were used in the meta-analyses. If publications only reported RRs stratified
for cumulative exposure and not for “any occupational benzene exposure” vs.
“background benzene exposure”, we pooled RRs by summing observed and expected
cases for studies that reported SMRs (AML 4.8%, HL 3.7%, NHL 3.0%, MM 3.8%,
CLL 5.6% of the RRs), or by conducting a within-study random effects meta-analysis
of the non reference exposure groups for studies that reported RRs or ORs (AML
14.3%, NHL 3.0%, MM 7.7%, ALL 5.9%, CLL 16.7% of the RRs). If publications
reported only observed and expected number of cases and no RRs, we calculated RRs
and estimated associated confidence intervals with mid-P exact (Rothman and Boice
Jr. 1979) (AML 4.8%, HL 7.4%, ALL 17.6%, of the RRs). For publications that
reported no observed cases for any of the lymphoma subtypes, we calculated
continuity corrected RRs (observed and expected number of cases plus one) and we
estimated associated confidence intervals with mid-P exact (ALL 11.8%, HL 11.1%
of the RRs). If studies reported zero for the lower confidence interval a value of 0.1
was imputed to allow estimation of the variance (ALL 5.9%, MM 3.8% of the RRs ).
Three strategies for the assessment of study quality dimensions
Stratification by the year of start of follow-up was performed based on the
information provided in the included publications (follow-up started before 1970
versus follow-up started in 1970 or later). The median start of follow-up in the
stratum with studies that started follow-up before 1970 was 1947, while the median
start of follow-up in the stratum with studies that started follow-up in 1970 or later
was 1973.
Page 10 of 42

11
AML significance level was assigned to each publication based on a two-sided p-value
of the Z score which was estimated by dividing the reported log RR for AML by its
standard error. Based on the calculated AML significance level one of the following
categories (A to E) was assigned to each publication: (A) AML RR > 1, p<0.1, (B)
AML RR > 1, 0.1≤p<0.2, (C) AML RR > 1, p≥0.2, (D) AML RR ≤ 1, (E) an AML
RR was not reported.
Quality of exposure assessment (A to D) was assigned to each publication as follows:
(A) In the publication explicit quantitative exposure estimates for benzene were
reported, (B) in the publication semi-quantitative estimates of benzene exposure or
quantitative estimates of exposures containing benzene (such as gasoline) were
reported, (C) in the publication some industrial hygiene sampling results to indicate
that benzene exposure was present in the cohort that was studied were reported, (D)
the publication qualitatively indicated that benzene exposure was present in the
cohort.
Statistical analyses
We conducted random-effects meta-analyses to pool the RRs reported in the included
publications. An alpha level of 0.05 was used to assess whether meta-relative risks
(mRRs) were significantly elevated. The first set of meta-analyses was conducted on
the full set of studies stratified for the start of follow-up (follow-up started before
1970 versus follow-up started in 1970 or later). We compared mRRs by strata using a
test of interaction as suggested by Altman and Bland (Altman and Bland 2003).
We applied the study quality dimensions AML significance level and quality of
exposure assessment in two series of meta-analyses. The initial analysis in each series
included all studies regardless of quality. In each subsequent analysis the group of
Page 11 of 42

12
studies with the lowest AML significance level or the lowest quality of exposure
assessment was excluded.
Cochran’s Q test was used to assess between study heterogeneity in all meta-analyses.
A p-value < 0.1 was considered to be statistically significant evidence for between
study heterogeneity. We used I-squared to describe the percentage of total variation
across studies that was due to heterogeneity rather than chance (Higgins et al. 2003).
For analyses that displayed significant between study heterogeneity the sensitivity of
the outcome of the meta-analysis for individual studies was assessed by excluding
studies one at the time (‘jackknife analysis’). Publication bias was assessed with
Eggers graphical test (Egger et al. 1997). We performed all meta-analyses in STATA
version 11.
Page 12 of 42
13
Results
We identified forty-four publications that provided a RR for at least one of the
lymphoma subtype specific meta-analyses. Data from three publications were not
extracted: one study had likely under-ascertainment of cancer deaths as the result of
the inability to identify the type of cancer for a number of cancer deaths (Infante
2005; Sorahan et al. 2005), in one study the RR variance could not be estimated (a
nested case-control study that did not report confidence intervals (Ott et al. 1989)),
and one study reported proportionate mortality ratios which tend to underestimate the
RR (Thomas et al. 1982). Table 1 lists all publications that contributed to the meta-
analyses. For each publication the (assigned) name of the cohort, the (assigned) name
of the sub-cohort (if relevant), the literature reference, the type of industry in which
the study was performed, the follow-up period, the lymphoma sub-type for which the
publication was included (if reported with ICD-code and revision), an indicator
whether RRs were based on incidence or mortality, the assigned AML significance
level, and the assigned quality of exposure assessment are reported. The earliest
included publication dates from 1983, while the most recent publication was from
2008. For two cohorts we used non peer-reviewed publications to extract RRs for
MM (and NHL) that were not reported in the peer-reviewed publications of these
cohorts (Atkinson et al. 2001; Delzell et al. 1992). Both reports were based on the
exact same methodology and follow-up time as reports of these cohorts that appeared
in the peer-reviewed literature (Glass et al. 2003; Sathiakumar et al. 1995). A RR for
MM from a study by Decoufle et al. was included based on additional information
that was reported in the preamble to the final OSHA Benzene Standard of 1987
(Decoufle et al. 1983; OSHA 1987). We extracted NHL RRs for two studies by Wong
et al. (Wong 1987a; Wong et al. 1993) from a 1998 letter by Wong in which results
Page 13 of 42

14
from additional analyses for these studies were provided (Wong 1998). Finally, it
should be noted that there might have been a slight (non-identifiable) overlap in the
cohorts studied by Wong (Wong 1987a; Wong 1987b) and Collins et al. (Collins et al.
2003).
In Table 2 the mRR based on random-effect meta-analyses for all studies and
stratified by start of follow-up are shown for AML and the five lymphoma subtypes
(i.e. HL, NHL, MM, ALL, and CLL). The overall mRR for AML and ALL were
significantly increased (mRR=1.68 (1.35-2.10) and mRR=1.44 (1.03-2.02)). The
overall mRR for MM and CLL were slightly, but not significantly, elevated while the
overall mRR for HL and NHL were close to unity. Stratified analyses by start of
follow-up showed higher RRs for AML, NHL, and CLL for studies with a follow-up
starting in 1970 or later as compared to studies that started the follow-up before 1970
(p<0.10). No significant difference in mRR between the follow-up strata was
observed for HL, MM, and ALL. Significant between-study heterogeneity was
observed for AML, NHL, and CLL overall and in the ‘start of follow-up before 1970’
stratum (see Supplemental Material, Figure 1). Exclusion of the most influential
studies/RRs (based on the distance of the RR to the mRR and the weight of the study)
resulted in mRRs that were essentially similar (data not shown).
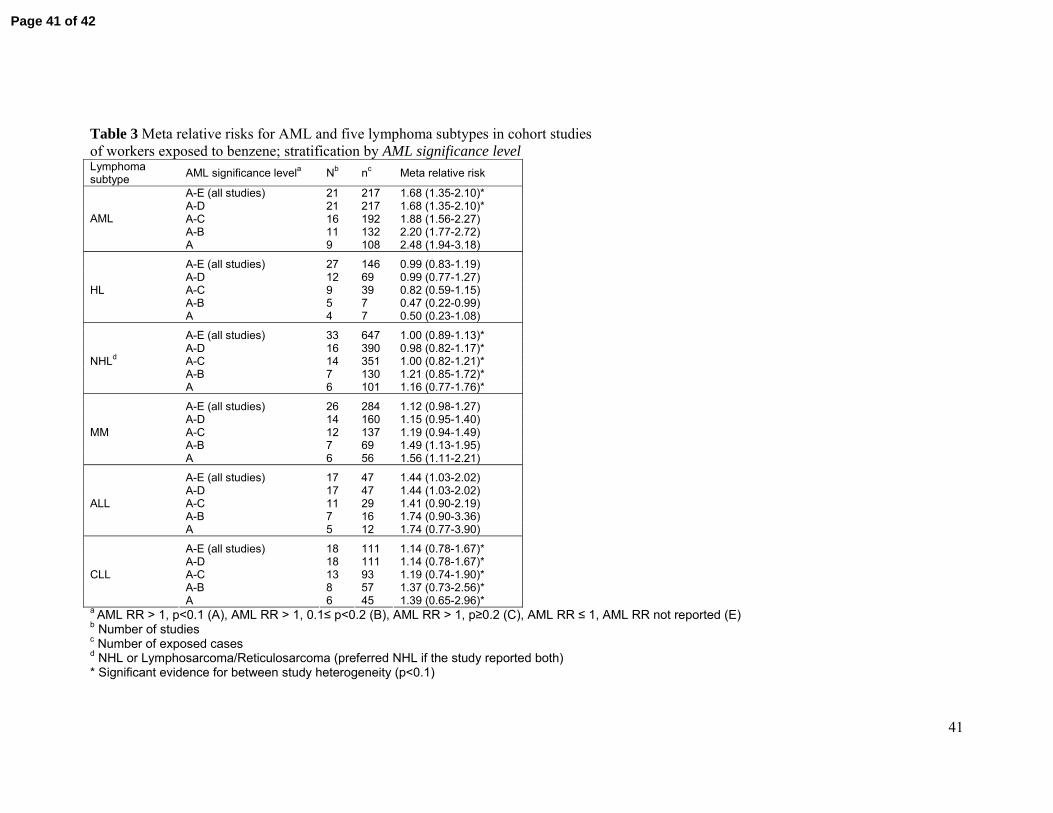
In Table 3 mRRs based on random-effects meta-analyses stratified by AML
significance level are shown for AML, HL, NHL, MM, ALL, and CLL. As could be
expected, the lymphoma mRRs based on only the studies that reported a RR for AML
(A-D) are largely similar to the mRRs based on all the studies (A-E). These studies
provide therefore a relatively unbiased representation of the full set of studies. All
outcomes except HL demonstrated an increase in mRRs with increasing AML
Page 14 of 42
15
significance level. However, the 95% confidence intervals successively widened as a
result of the reduced number of studies/RRs that were retained with each increase in
AML significance level. The increase in mRR was most pronounced for MM and ALL
but was also observed for NHL and CLL. In contrast, the mRR for HL dropped with
increasing AML significance level. Significant between-study heterogeneity was
observed for NHL and CLL in the subset of studies with AML significance level A
(p<0.10) (See Supplemental Material, Figure 2). ‘Jackknife analysis’ eliminating one
study at the time demonstrated that in the NHL analysis of the studies with AML
significance level A the RRs from Divine2000 (Divine and Hartman 2000) and
Delzell1992 (Delzell et al. 1992) had considerable impact on the between-study
heterogeneity. Exclusion of both RRs from this analysis resulted in a slight decrease
in the mRR from 1.16 (0.77-1.76) to 1.12 (0.77-1.61) with an I-squared (an estimate
of the percentage of total variation across studies that was due to heterogeneity rather
than chance) of 22.8% (p=0.27). In the CLL analysis of the studies with AML
significance level A the RRs provided by Divine2000 and Rushton1997 (Divine and
Hartman 2000; Rushton and Romaniuk 1997) appeared to be primarily responsible for
the observed between-study heterogeneity. Exclusion of both RRs from the meta-
analysis resulted in a slight decrease in the mRR from 1.39 (0.65-2.96) to 1.26 (0.65-
2.43) with an I-squared of 0% (p = 0.94).
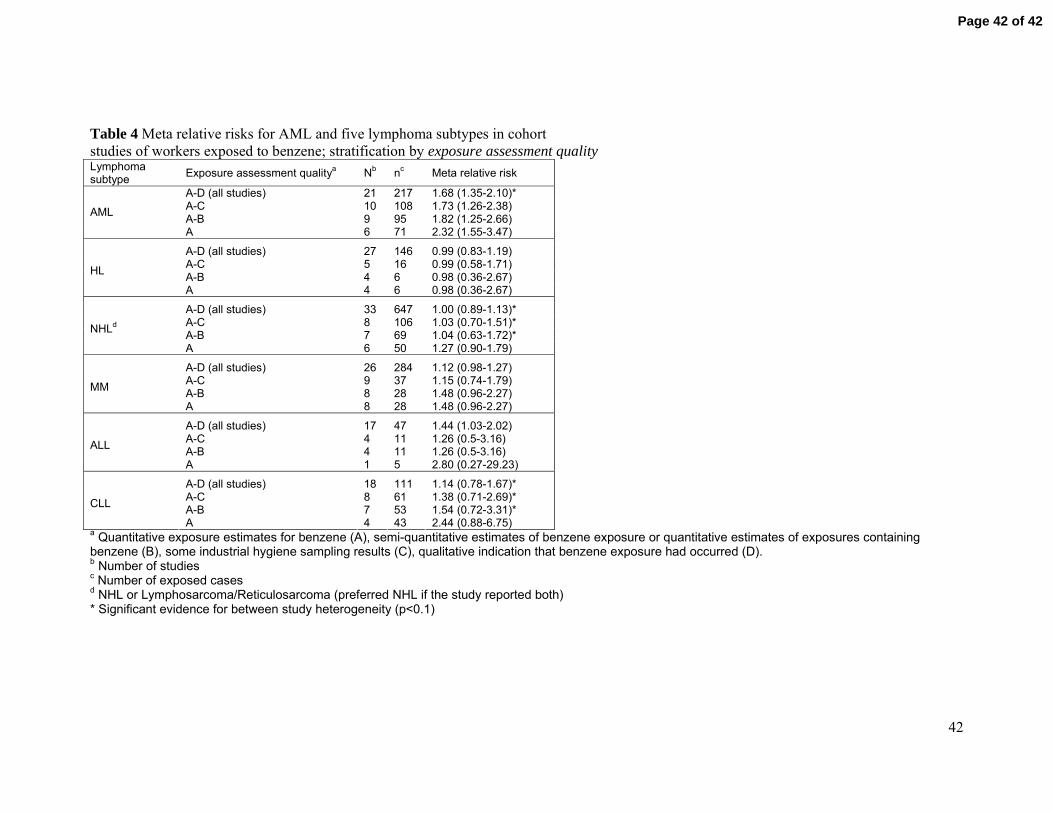
In Table 4 mRRs based on random-effects meta-analyses and stratified by quality of
exposure assessment are shown. mRRs for NHL, MM and CLL increased with
increasing quality of exposure assessment. The increase in mRR was most
pronounced for MM and CLL. Forest plots for AML and the five lymphoma subtypes
for all studies with quality of exposure A-B (Quantitative exposure estimates for
Page 15 of 42
16
benzene (A), semi-quantitative estimates of benzene exposure or quantitative
estimates of exposures containing benzene (B)) are shown in the Supplemental
Material (See Supplemental Material, Figure 3). ‘Jackknife analysis’ eliminating one
study at the time demonstrated that in the set of studies with quality of exposure A-B
the RRs provided by Wong1993 (land-based cohort) (Wong et al. 1993) and
Rushton1997 (Rushton and Romaniuk 1997) had considerable impact on the observed
between study heterogeneity in the CLL analysis. Exclusion of both RRs from the
meta-analysis resulted in a slight decrease in the mRR from 1.54 (0.72-3.31) to 1.46
(0.79-2.72) with an I-squared of 0% (p=0.43). The RR provided by Wong1998
(gasoline distribution employees) (Wong 1998) had a considerable impact on the
observed between study heterogeneity in the NHL analysis of the set of studies with
quality of exposure A-B. Exclusion of this RR resulted in a slight increase in the mRR
from 1.04 (0.63-1.72) to 1.27 (0.90-1.79) (I-squared = 0%, p=0.78).
Cross stratification of AML significance level and quality of exposure assessment with
the stratification based on the start of follow-up, although limited by a loss of
statistical power, showed that mRR patterns with increasing AML significance level
and quality of exposure assessment (See Supplemental Material, Tables 1 and 2,
respectively) were generally consistent with the patterns observed when meta-
analyses were stratified by start of follow-up (Table 2).
Egger’s test revealed no significant evidence for publication bias in the data available
for AML, HL, NHL, ALL, or CLL (See Supplemental Material, Figure 4). Evidence
for bias was observed for MM (p = 0.03), but Egger’s test became non-significant
after exclusion of all quality of exposure assessment D studies (p=0.72).
Page 16 of 42

17
Discussion
We conducted a series of meta-analyses on occupational cohort studies to assess the
possible association between benzene and lymphoid neoplasms. Utilizing different
dimensions of study quality we report evidence for an association between
occupational benzene exposure and lymphoma subtypes MM, ALL, and CLL. For
these subtypes mRRs increased with increasing study quality, regardless of the
strategy that was used to assess study quality. mRRs for NHL also increased with
increasing study quality, although less pronounced. We did not observe an association
between occupational benzene exposure and HL. Importantly, with the exception of a
chance finding, the increase in mRRs for NHL, MM, ALL, and CLL with increasing
study quality most likely reflects an actual underlying association with at least some
of these lymphoma subtypes.
As we observed mRR patterns consistent with a possible association between benzene
and all lymphoma subtypes except HL we formally explored quantitative exposure
response relations for NHL, MM, ALL and CLL including all studies with quality of
exposure assessment A (studies with quantitative estimates of benzene exposure)
based on flexible meta-regression analyses (Vlaanderen et al. 2009). The relatively
limited number of studies in category A resulted in uncertain and unstable predictions
of the exposure response curve for NHL, MM, and CLL (data not shown). For ALL
only one quality of exposure assessment A study was available which precluded
conducting a meta-regression for this lymphoma subtype. Therefore, possible dose-
response associations can only be discussed informally on a study-by-study basis.
Assessment of study quality dimensions
Page 17 of 42
18
We developed three different quality dimensions that reflect the substantial changes in
diagnosis and categorization of lymphoid neoplasms over the last half century and the
heterogeneity in occupational cohort studies with regard to industry, sample size, and
documentation of benzene exposure. The generally higher RRs in the strata with
studies that started follow-up in 1970 or later is consistent with better quality of
lymphoma diagnosis in more recent years. The higher RRs are particularly
noteworthy given that overall benzene exposure was likely reduced in workplaces
after 1970-80. Another secular trend in the quality of cohort studies over time was the
greater use of incidence rather than mortality as endpoint (e.g., 91% of cohorts
reporting CLL RRs with start of follow-up prior to 1970 used mortality as the
endpoint vs. 43 % for studies with start of follow-up in 1970 or later). It is possible
that for less aggressive subtypes (e.g., CLL), subjects that died from other causes did
not have lymphoma coded on their death certificate (Linet et al. 2007). However,
cross-stratification of results suggested that stratification by period of follow-up
explained more of the observed heterogeneity than stratification by
mortality/incidence (data not shown). Although it has been suggested that the RR for
leukemia subtypes observed in occupational studies might decrease with prolonged
follow-up time (Richardson 2008), we found only modest evidence for this
phenomenon for lymphoma subtypes. Substitution of the most recent RRs with those
of previous updates did not materially change the results (data not shown).
As the association between benzene and AML is established we argue that a well
conducted large epidemiological study on benzene and hemato- and lymphopoietic
cancers should find such an association. If at least some evidence of association is not
found one could argue that there must be known or unknown methodological
Page 18 of 42
19
limitations in the study design. Such studies would by extension most likely be non
informative regarding the association between benzene and lymphoid neoplasms.
Naturally, one should realize that a failure to find evidence for an association could
also be the result of insufficient statistical power. However, in our meta-analyses we
observed that the strong increase in mRRs for AML with increasing AML significance
levels was generally paralleled by increasing RR in lymphoma subtypes. In other
words studies that reported higher (and more significant) RRs for AML generally also
reported higher RRs for NHL, MM, ALL, and CLL.
The quality of exposure assessment has a large impact on the ability of an
epidemiological study to identify modest increased RRs. The relevance of our quality
of exposure assessment approach was illustrated with the strong increase in mRRs for
AML with increasing quality of exposure assessment. This trend provides support for
our assumption that studies that conducted a more detailed benzene exposure
assessment likely provide higher overall quality of evidence for the potential
association of benzene with adverse health outcomes. Although one would expect that
the study quality indicators for AML significance level and quality of exposure
assessment would be highly correlated this is not necessarily the case. For instance,
we did observe five studies in the lowest quality of exposure assessment category D
that still reported a significant increased RR for AML and observed two studies from
quality of exposure assessment category B in the set of studies that reported an AML
RR below unity (AML significance level category D). As such the two study quality
dimensions should be seen as complementary.
Non Hodgkin Lymphoma
Page 19 of 42
20
We observed a moderate increased RR of NHL with increasing study quality.
However, neither the overall mRR nor any of the strata specific mRRs reached formal
statistical significance. Because our formal meta-regression did not result in robust
dose-response associations we qualitatively explored exposure response relations
within each exposure assessment quality A publication that provided RRs for NHL.
Of the six exposure assessment quality A studies that reported RRs for NHL only one
study reported a significant increased RR (p for trend <0.02) with increasing
cumulative exposure to benzene (Hayes et al. 1997). In contrast, in three out of six
publications the authors reported that there was no clear trend of RRs for NHL with
increasing cumulative exposure to benzene (Bloemen et al. 2004; Collins et al. 2003;
Schnatter et al. 1996), while the remaining two publications did not report on the
quantitative relation between NHL and cumulative exposure to benzene (Rinsky et al.
2002; Wong 1987a). In addition to these six studies, two publications that included
MM in the definition of NHL did report on the quantitative relation of NHL+MM and
cumulative exposure to benzene (Glass et al. 2003; Wong 1987b). One of these
studies reported an initial increase in RR with increasing exposure to benzene
followed by a drop in RR in the upper cumulative exposure group (Wong 1987b),
while the other study reported no association (Glass et al. 2003). We note, however,
that a recent meta-analysis including both case-control and cohort studies reported a
significant elevated mRR for NHL when the analyses were restricted to the higher
exposure groups and corrected for the health worker (inclusion) effect (Steinmaus et
al. 2008).
Overall the epidemiological evidence for the association between NHL and benzene is
conflicting. This is illustrated by three recent meta-analyses that were based on
Page 20 of 42
21
largely the same data, but reached a diametrically opposite conclusion on whether
exposure to benzene is associated to NHL (Alexander and Wagner 2010; Kane and
Newton 2010; Steinmaus et al. 2008). The inconsistency in findings is partly
explained by study quality and failure to correct for biases but might also to a certain
extent be explained by the etiological heterogeneity within this group of diseases. If
some NHL subtypes (e.g. Diffuse large B cell lymphoma (DLBCL) or Follicular
lymphoma (FL)) are associated with benzene, but others are not, any NHL RR will be
attenuated due to the inclusion of non benzene-associated NHL subtypes. This is even
further complicated by the fact that the distribution of NHL subtypes may vary
considerably from population to population, which could lead to significant variation
in reported associations between potential risk factors and total NHL (Muller et al.
2005).
A series of recent population-based case-control studies provide evidence that the
association between some genetic and environmental factors varies between major
NHL subtypes like DLBCL and FL (Lan et al. 2009; Morton et al. 2008; Rothman et
al. 2006; Skibola et al. 2009; Skibola et al. 2010). Another series of recent case-
control studies that used relatively high quality retrospective exposure assessment
methods have provided evidence that this might also be true for the association
between benzene and NHL subtypes (Cocco et al. 2010; Miligi et al. 2006; Wong et
al. 2009). The studies by Cocco et al. and Wong et al. reported a stronger association
with benzene with FL (OR 1.6 (0.9-2.9) and 7.00 (1.45-33.70) respectively) than for
DLBCL (OR 0.9 (0.6-1.4) and 0.66 (0.31-1.42) respectively) (Cocco et al. 2010;
Wong et al. 2009). The study by Miligi et al. did not report a RR for FL (due to the
limited number of cases), but reported an OR of 2.4 (1.3-4.5) for DLBCL (Miligi et
al. 2006).
Page 21 of 42

22
Multiple myeloma
Our analyses are supportive of an association of benzene exposure with MM. mRRs
increased considerably and reached near statistical significance regardless of the study
quality dimension used except for the analyses stratified by AML significance level
where formal statistical significance was reached for the two highest quality strata.
Our results are similar (albeit that the point estimates of the mRRs are slightly lower)
to the results from a meta-analysis by Infante in which slightly different inclusion
criteria were applied (mRR 2.13 (95% CI 1.31 – 3.46) (Infante 2006). Further
evidence for an association between exposure to benzene and MM have been
provided by two recent population-based case-control studies that reported increased
MM RRs with increasing exposure to benzene (Cocco et al. 2010; Seniori Costantini
et al. 2008). We qualitatively explored the quantitative exposure-response relation
between benzene and MM. Two out of eight exposure assessment quality A studies
reported an increase in RR with increasing cumulative exposure (Collins et al. 2003;
Rinsky et al. 2002), in two studies the authors reported that there was no clear trend of
RRs for MM with increasing cumulative exposure to benzene (Atkinson et al. 2001;
Schnatter et al. 1996), while four studies did not report on the quantitative relation
between cumulative exposure to benzene and MM (Bloemen et al. 2004; Swaen et al.
2005; Wong 1987b; Yin et al. 1996). Therefore, although the evidence for an
association between “any occupational benzene exposure” vs. “background benzene
exposure” and the RR of MM appears to be consistent the evidence for an exposure-
response relation between benzene and MM is more ambiguous. This would in part be
explained by the much larger statistical power that is required to conduct quantitative
Page 22 of 42
23
exposure response analysis, often a complication for small-scale occupational cohort
studies.
Acute lymphocytic leukemia
The association between exposure to benzene and ALL is difficult to study because
the disease is rare in adults (Faderl et al. 2010). It is therefore noteworthy that our
analyses do strongly suggest increased RRs for ALL. We were able to identify only
two population-based case-control studies that explored benzene - ALL associations
in adults (Adegoke et al. 2003; Richardson et al. 1992). One case-control study
reported a (non significantly) increased RR for ALL with a suggestion of an
exposure-response relation (Adegoke et al. 2003), while the other study did not
observe any cases with ALL (Richardson et al. 1992). Together the evidence from
both cohort and case-control studies are strongly suggestive of a positive association
between exposure to benzene and the RR of adult ALL.
Chronic lymphocytic leukemia
Our analyses suggest that exposure to benzene is associated with an increased RR for
CLL. This is in line with results from four recent case-control studies that reported
RRs ranging from 1.4 to 2.05 (Cocco et al. 2010; Miligi et al. 2006; Seniori Costantini
et al. 2008; Wong et al. 2009). Two of these case-control studies reported an increase
in RR with increasing benzene exposure (Cocco et al. 2010; Seniori Costantini et al.
2008). Of the cohort studies with quantitative exposure assessment one study reported
that the RR for the group with higher cumulative exposure was higher than the RR for
the group with lower exposure (Glass et al. 2003). However, two cohort studies
reported no association with cumulative exposure to benzene (Collins et al. 2003;
Page 23 of 42
24
Rushton and Romaniuk 1997), while one study did not report on the quantitative
relation between cumulative exposure to benzene and CLL (Bloemen et al. 2004).
Overall conclusion
In line with the recent IARC evaluation of the carcinogenicity of benzene our meta-
analyses provide evidence for the association of occupational benzene exposure to
MM, ALL, and CLL (Baan et al. 2009). Although these findings are suggestive it is
important to realize that most analyses were based on datasets of limited size. The
evidence for an association between benzene and NHL (as defined in ICD-9) is less
convincing, but this could be explained by the heterogeneity in the association for
particular subgroups of this disease or by not accounting for certain biases. We
observed no association between benzene and HL. The discussion on the association
between benzene and NHL will likely benefit from NHL subtype specific analyses.
Unfortunately, most current occupational cohort studies lack sufficient statistical
power to perform such detailed analyses. Cohort studies with central pathology
review and well-designed case-control studies using state-of-the-art retrospective
exposure assessment methods will be needed to help evaluate the extent to which
occupational benzene exposure is associated with specific subtypes of NHL.
Finally, our overall findings, taken together with the substantial experimental and
molecular epidemiologic evidence that benzene exposure alters key components of
the immune system relevant for lymphomagenesis (e.g., CD4+ T cell level; CD4+T
cell/CD8+ T cell ratio) (Lan et al. 2004), provide support that benzene is likely to be
causally related to one or more subtypes of lymphoma.
Page 24 of 42
25
References
Adegoke OJ, Blair A, Shu XO, Sanderson M, Jin F, Dosemeci M, et al. 2003.
Occupational history and exposure and the risk of adult leukemia in Shanghai.
Ann Epidemiol 13(7):485-494.
Aisenberg AC. 2000. Historical review of lymphomas. Br J Haematol 109(3):466-
476.
Alexander DD, Wagner ME. 2010. Benzene exposure and non-hodgkin lymphoma: a
meta-analysis of epidemiologic studies. J Occup Environ Med 52(2):169-189.
Altman DG, Bland JM. 2003. Interaction revisited: the difference between two
estimates. Bmj 326(7382):219.
Atkinson S, Coppock J, Fritschi L, Glass DC, Gibbons C, Gray CN, et al. 2001.
Lympho-haematopoietic Cancer and Exposure to Benzene in the Australian
Petroleum Industry. Technical Report and Appendices.
Baan R, Grosse Y, Straif K, Secretan B, El Ghissassi F, Bouvard V, et al. 2009. A
review of human carcinogens--Part F: chemical agents and related
occupations. Lancet Oncol 10(12):1143-1144.
Bergsagel DE, Wong O, Bergsagel PL, Alexanian R, Anderson K, Kyle RA, et al.
1999. Benzene and multiple myeloma: appraisal of the scientific evidence.
Blood 94(4):1174-1182.
Bloemen LJ, Youk A, Bradley TD, Bodner KM, Marsh G. 2004.
Lymphohaematopoietic cancer risk among chemical workers exposed to
benzene. Occup Environ Med 61(3):270-274.
Cocco P, t'Mannetje A, Fadda D, Melis M, Becker N, de Sanjose S, et al. 2010.
Occupational exposure to solvents and risk of lymphoma subtypes: results
from the Epilymph case-control study. Occup Environ Med 67(5):341-347.
Page 25 of 42
26
Collingwood KW, Raabe GK, Wong O. 1996. An updated cohort mortality study of
workers at a northeastern United States petroleum refinery. Int Arch Occup
Environ Health 68(5):277-288.
Collins JJ, Ireland B, Buckley CF, Shepperly D. 2003. Lymphohaematopoeitic cancer
mortality among workers with benzene exposure. Occup Environ Med
60(9):676-679.
Consonni D, Pesatori AC, Tironi A, Bernucci I, Zocchetti C, Bertazzi PA. 1999.
Mortality study in an Italian oil refinery: extension of the follow-up. Am J Ind
Med 35(3):287-294.
Dagg TG, Satin KP, Bailey WJ, Wong O, Harmon LL, Swencicki RE. 1992. An
updated cause specific mortality study of petroleum refinery workers. Br J Ind
Med 49(3):203-212.
Decoufle P, Blattner WA, Blair A. 1983. Mortality among chemical workers exposed
to benzene and other agents. Environ Res 30(1):16-25.
Delzell E, Sathiakumar N, Cole P, Brill I. 1992. A case-control study of leukemia,
nonhodgkin's lymphoma and multiple myeloma among employees of union oil
company of california: Submitted to Union Oil Company of California.
Divine BJ, Hartman CM. 2000. Update of a study of crude oil production workers
1946-94. Occup Environ Med 57(6):411-417.
Divine BJ, Hartman CM, Wendt JK. 1999a. Update of the Texaco mortality study
1947-93: Part I. Analysis of overall patterns of mortality among refining,
research, and petrochemical workers. Occup Environ Med 56(3):167-173.
---. 1999b. Update of the Texaco mortality study 1947-93: Part II. Analyses of
specific causes of death for white men employed in refining, research, and
petrochemicals. Occup Environ Med 56(3):174-180.
Page 26 of 42

27
Egger M, Davey Smith G, Schneider M, Minder C. 1997. Bias in meta-analysis
detected by a simple, graphical test. Bmj 315(7109):629-634.
Faderl S, O'Brien S, Pui CH, Stock W, Wetzler M, Hoelzer D, et al. 2010. Adult acute
lymphoblastic leukemia: concepts and strategies. Cancer.
Fu H, Demers PA, Costantini AS, Winter P, Colin D, Kogevinas M, et al. 1996.
Cancer mortality among shoe manufacturing workers: an analysis of two
cohorts. Occup Environ Med 53(6):394-398.
Glass DC, Gray CN, Jolley DJ, Gibbons C, Sim MR, Fritschi L, et al. 2003. Leukemia
risk associated with low-level benzene exposure. Epidemiology 14(5):569-
577.
Goldstein BD, Shalat S. 2000. Non-Hodgkin's lymphoma and exposure to benzene in
petroleum workers. J Occup Environ Med 42(12):1133-1136.
Guenel P, Imbernon E, Chevalier A, Crinquand-Calastreng A, Goldberg M. 2002.
Leukemia in relation to occupational exposures to benzene and other agents: a
case-control study nested in a cohort of gas and electric utility workers. Am J
Ind Med 42(2):87-97.
Gun RT, Pratt N, Ryan P, Roder D. 2006. Update of mortality and cancer incidence in
the Australian petroleum industry cohort. Occup Environ Med 63(7):476-481.
Harris NL, Jaffe ES, Diebold J, Flandrin G, Muller-Hermelink HK, Vardiman J. 2000.
Lymphoma classification--from controversy to consensus: the R.E.A.L. and
WHO Classification of lymphoid neoplasms. Ann Oncol 11 Suppl 1:3-10.
Hayes RB, Yin SN, Dosemeci M, Li GL, Wacholder S, Travis LB, et al. 1997.
Benzene and the dose-related incidence of hematologic neoplasms in China.
Chinese Academy of Preventive Medicine--National Cancer Institute Benzene
Study Group. J Natl Cancer Inst 89(14):1065-1071.
Page 27 of 42
28
Higgins JP, Thompson SG, Deeks JJ, Altman DG. 2003. Measuring inconsistency in
meta-analyses. Bmj 327(7414):557-560.
Honda Y, Delzell E, Cole P. 1995. An updated study of mortality among workers at a
petroleum manufacturing plant. J Occup Environ Med 37(2):194-200.
Huebner WW, Wojcik NC, Rosamilia K, Jorgensen G, Milano CA. 2004. Mortality
updates (1970-1997) of two refinery/petrochemical plant cohorts at Baton
Rouge, Louisiana, and Baytown, Texas. J Occup Environ Med 46(12):1229-
1245.
IARC. 1982. Monographs. 29:93-148, 391-398.
---. 1987. Monographs Supplement 7.120-122.
Infante PF. 2005. Cancer risks in a UK benzene exposed cohort. Occup Environ Med
62(12):905-906; author reply 905-906.
---. 2006. Benzene exposure and multiple myeloma: a detailed meta-analysis of
benzene cohort studies. Ann N Y Acad Sci 1076:90-109.
Kane EV, Newton R. 2010. Benzene and the risk of non-Hodgkin lymphoma: A
review and meta-analysis of the literature. Cancer Epidemiol.
Kaplan SD. 1986. Update of a mortality study of workers in petroleum refineries. J
Occup Med 28(7):514-516.
Kirkeleit J, Riise T, Bratveit M, Moen BE. 2008. Increased risk of acute myelogenous
leukemia and multiple myeloma in a historical cohort of upstream petroleum
workers exposed to crude oil. Cancer Causes Control 19(1):13-23.
Lamm SH, Engel A, Byrd DM. 2005. Non-Hodgkin lymphoma and benzene
exposure: a systematic literature review. Chem Biol Interact 153-154:231-237.
Page 28 of 42
29
Lan Q, Morton LM, Armstrong B, Hartge P, Menashe I, Zheng T, et al. 2009. Genetic
variation in caspase genes and risk of non-Hodgkin lymphoma: a pooled
analysis of 3 population-based case-control studies. Blood 114(2):264-267.
Lan Q, Zhang L, Li G, Vermeulen R, Weinberg RS, Dosemeci M, et al. 2004.
Hematotoxicity in workers exposed to low levels of benzene. Science
306(5702):1774-1776.
Lewis RJ, Schnatter AR, Drummond I, Murray N, Thompson FS, Katz AM, et al.
2003. Mortality and cancer morbidity in a cohort of Canadian petroleum
workers. Occup Environ Med 60(12):918-928.
Linet MS, Schubauer-Berigan MK, Weisenburger DD, Richardson DB, Landgren O,
Blair A, et al. 2007. Chronic lymphocytic leukaemia: an overview of aetiology
in light of recent developments in classification and pathogenesis. Br J
Haematol 139(5):672-686.
Lynge E, Anttila A, Hemminki K. 1997. Organic solvents and cancer. Cancer Causes
Control 8(3):406-419.
McCraw DS, Joyner RE, Cole P. 1985. Excess leukemia in a refinery population. J
Occup Med 27(3):220-222.
McElvenny DM, Armstrong BG, Jarup L, Higgins JP. 2004. Meta-analysis in
occupational epidemiology: a review of practice. Occup Med (Lond)
54(5):336-344.
Miligi L, Costantini AS, Benvenuti A, Kriebel D, Bolejack V, Tumino R, et al. 2006.
Occupational exposure to solvents and the risk of lymphomas. Epidemiology
17(5):552-561.
Morton LM, Turner JJ, Cerhan JR, Linet MS, Treseler PA, Clarke CA, et al. 2007.
Proposed classification of lymphoid neoplasms for epidemiologic research
Page 29 of 42

30
from the Pathology Working Group of the International Lymphoma
Epidemiology Consortium (InterLymph). Blood 110(2):695-708.
Morton LM, Wang SS, Cozen W, Linet MS, Chatterjee N, Davis S, et al. 2008.
Etiologic heterogeneity among non-Hodgkin lymphoma subtypes. Blood
112(13):5150-5160.
Muller AM, Ihorst G, Mertelsmann R, Engelhardt M. 2005. Epidemiology of non-
Hodgkin's lymphoma (NHL): trends, geographic distribution, and etiology.
Ann Hematol 84(1):1-12.
Nilsson RI, Nordlinder R, Horte LG, Jarvholm B. 1998. Leukaemia, lymphoma, and
multiple myeloma in seamen on tankers. Occup Environ Med 55(8):517-521.
OSHA. 1987. Preamble to the final rule for benzene:Occupational Safety and Health
Administration.
Ott MG, Teta MJ, Greenberg HL. 1989. Lymphatic and hematopoietic tissue cancer in
a chemical manufacturing environment. Am J Ind Med 16(6):631-643.
Pukkala E. 1998. Cancer incidence among Finnish oil refinery workers, 1971-1994. J
Occup Environ Med 40(8):675-679.
Richardson DB. 2008. Temporal variation in the association between benzene and
leukemia mortality. Environ Health Perspect 116(3):370-374.
Richardson S, Zittoun R, Bastuji-Garin S, Lasserre V, Guihenneuc C, Cadiou M, et al.
1992. Occupational risk factors for acute leukaemia: a case-control study. Int J
Epidemiol 21(6):1063-1073.
Rinsky RA, Hornung RW, Silver SR, Tseng CY. 2002. Benzene exposure and
hematopoietic mortality: A long-term epidemiologic risk assessment. Am J
Ind Med 42(6):474-480.
Page 30 of 42

31
Rothman KJ, Boice Jr. JD. 1979. Epidemologic analysis with a programmable
calculator. Washington DC:U.S. Department of Health, Education and
Welfare
Rothman N, Skibola CF, Wang SS, Morgan G, Lan Q, Smith MT, et al. 2006. Genetic
variation in TNF and IL10 and risk of non-Hodgkin lymphoma: a report from
the InterLymph Consortium. Lancet Oncol 7(1):27-38.
Rushton L. 1993. A 39-year follow-up of the U.K. oil refinery and distribution center
studies: results for kidney cancer and leukemia. Environ Health Perspect 101
Suppl 6:77-84.
Rushton L, Romaniuk H. 1997. A case-control study to investigate the risk of
leukaemia associated with exposure to benzene in petroleum marketing and
distribution workers in the United Kingdom. Occup Environ Med 54(3):152-
166.
Sathiakumar N, Delzell E, Cole P, Brill I, Frisch J, Spivey G. 1995. A case-control
study of leukemia among petroleum workers. J Occup Environ Med
37(11):1269-1277.
Satin KP, Wong O, Yuan LA, Bailey WJ, Newton KL, Wen CP, et al. 1996. A 50-
year mortality follow-up of a large cohort of oil refinery workers in Texas. J
Occup Environ Med 38(5):492-506.
Savitz DA, Andrews KW. 1997. Review of epidemiologic evidence on benzene and
lymphatic and hematopoietic cancers. Am J Ind Med 31(3):287-295.
Schnatter AR, Armstrong TW, Nicolich MJ, Thompson FS, Katz AM, Huebner WW,
et al. 1996. Lymphohaematopoietic malignancies and quantitative estimates of
exposure to benzene in Canadian petroleum distribution workers. Occup
Environ Med 53(11):773-781.
Page 31 of 42
32
Schnatter AR, Rosamilia K, Wojcik NC. 2005. Review of the literature on benzene
exposure and leukemia subtypes. Chem Biol Interact 153-154:9-21.
Seniori Costantini A, Benvenuti A, Vineis P, Kriebel D, Tumino R, Ramazzotti V, et
al. 2008. Risk of leukemia and multiple myeloma associated with exposure to
benzene and other organic solvents: evidence from the Italian Multicenter
Case-control study. Am J Ind Med 51(11):803-811.
Skibola CF, Bracci PM, Halperin E, Conde L, Craig DW, Agana L, et al. 2009.
Genetic variants at 6p21.33 are associated with susceptibility to follicular
lymphoma. Nat Genet 41(8):873-875.
Skibola CF, Bracci PM, Nieters A, Brooks-Wilson A, de Sanjose S, Hughes AM, et
al. 2010. Tumor necrosis factor (TNF) and lymphotoxin-alpha (LTA)
polymorphisms and risk of non-Hodgkin lymphoma in the InterLymph
Consortium. Am J Epidemiol 171(3):267-276.
Smith MT, Jones RM, Smith AH. 2007. Benzene exposure and risk of non-Hodgkin
lymphoma. Cancer Epidemiol Biomarkers Prev 16(3):385-391.
Sonoda T, Nagata Y, Mori M, Ishida T, Imai K. 2001. Meta-analysis of multiple
myeloma and benzene exposure. J Epidemiol 11(6):249-254.
Sorahan T. 2007. Mortality of UK oil refinery and petroleum distribution workers,
1951-2003. Occup Med (Lond) 57(3):177-185.
Sorahan T, Kinlen LJ, Doll R. 2005. Cancer risks in a historical UK cohort of benzene
exposed workers. Occup Environ Med 62(4):231-236.
Steinmaus C, Smith AH, Jones RM, Smith MT. 2008. Meta-analysis of benzene
exposure and non-Hodgkin lymphoma: biases could mask an important
association. Occup Environ Med 65(6):371-378.
Page 32 of 42

33
Swaen GM, Scheffers T, de Cock J, Slangen J, Drooge H. 2005. Leukemia risk in
caprolactam workers exposed to benzene. Ann Epidemiol 15(1):21-28.
Swerdlow SH, Campo E, Harris N, Jaffe ES, Pileri S, Stein H, et al. 2008. WHO
Classification of Tumours of Haematopoietic and Lymphoid Tissues:
International Agency for Research on Cancer (IARC).
Thomas TL, Waxweiler RJ, Moure-Eraso R, Itaya S, Fraumeni JF, Jr. 1982. Mortality
patterns among workers in three Texas oil refineries. J Occup Med 24(2):135-
141.
Tsai SP, Gilstrap EL, Cowles SR, Snyder PJ, Ross CE. 1993. A cohort mortality study
of two California refinery and petrochemical plants. J Occup Med 35(4):415-
421.
---. 1996. Long-term follow-up mortality study of petroleum refinery and chemical
plant employees. Am J Ind Med 29(1):75-87.
Tsai SP, Wendt JK, Cardarelli KM, Fraser AE. 2003. A mortality and morbidity study
of refinery and petrochemical employees in Louisiana. Occup Environ Med
60(9):627-633.
Vlaanderen J, Portengen L, Rothman N, Lan Q, Kromhout H, Vermeulen R. 2009.
Flexible Meta-Regression to Assess the Shape of the Benzene Leukemia
Exposure Response Curve. Environ Health Perspect.
Vlaanderen J, Vermeulen R, Heederik D, Kromhout H. 2008. Guidelines to evaluate
human observational studies for quantitative risk assessment. Environ Health
Perspect 116(12):1700-1705.
Waxweiler RJ, Alexander V, Leffingwell SS, Haring M, Lloyd JW. 1983. Mortality
from brain tumor and other causes in a cohort of petrochemical workers. J Natl
Cancer Inst 70(1):75-81.
Page 33 of 42

34
Wong O. 1987a. An industry wide mortality study of chemical workers
occupationally exposed to benzene. I. General results. Br J Ind Med
44(6):365-381.
---. 1987b. An industry wide mortality study of chemical workers occupationally
exposed to benzene. II. Dose response analyses. Br J Ind Med 44(6):382-395.
---. 1995. Risk of acute myeloid leukaemia and multiple myeloma in workers exposed
to benzene. Occup Environ Med 52(6):380-384.
---. 1998. Re: Benzene and the dose-related incidence of hematologic neoplasms in
China. J Natl Cancer Inst 90(6):469-471.
Wong O, Fu H. 2005. Exposure to benzene and non-Hodgkin lymphoma, an
epidemiologic overview and an ongoing case-control study in Shanghai. Chem
Biol Interact 153-154:33-41.
Wong O, Harris F, Armstrong TW, Hua F. 2009. A hospital-based case-control study
of non-Hodgkin lymphoid neoplasms in Shanghai: Analysis of environmental
and occupational risk factors by subtypes of the WHO classification. Chem
Biol Interact.
Wong O, Harris F, Rosamilia K, Raabe GK. 2001a. An updated mortality study of
workers at a petroleum refinery in Beaumont, Texas, 1945 to 1996. J Occup
Environ Med 43(4):384-401.
---. 2001b. Updated mortality study of workers at a petroleum refinery in Torrance,
California, 1959 to 1997. J Occup Environ Med 43(12):1089-1102.
Wong O, Harris F, Smith TJ. 1993. Health effects of gasoline exposure. II. Mortality
patterns of distribution workers in the United States. Environ Health Perspect
101 Suppl 6:63-76.
Page 34 of 42

35
Wong O, Raabe GK. 1995. Cell-type-specific leukemia analyses in a combined cohort
of more than 208,000 petroleum workers in the United States and the United
Kingdom, 1937-1989. Regul Toxicol Pharmacol 21(2):307-321.
---. 1997. Multiple myeloma and benzene exposure in a multinational cohort of more
than 250,000 petroleum workers. Regul Toxicol Pharmacol 26(2):188-199.
---. 2000. A critical review of cancer epidemiology in the petroleum industry, with a
meta-analysis of a combined database of more than 350,000 workers. Regul
Toxicol Pharmacol 32(1):78-98.
---. 2000. Non-Hodgkin's lymphoma and exposure to benzene in a multinational
cohort of more than 308,000 petroleum workers, 1937 to 1996. J Occup
Environ Med 42(5):554-568.
Yin SN, Hayes RB, Linet MS, Li GL, Dosemeci M, Travis LB, et al. 1996. A cohort
study of cancer among benzene-exposed workers in China: overall results. Am
J Ind Med 29(3):227-235.
Page 35 of 42

36
Table 1 Overview of publications included in the meta-analyses.
Cohort Sub-cohort Reference Industry Follow-up
period Included for outcomes (ICDa) ICD revisiona,b I / Mc AML significance leveld
Exposure assessment qualitye
Australian petroleum workers cohort (Atkinson et al. 2001)f Petroleum
industry 1980-1998 MM(203) 9 I A A
Australian petroleum workers cohort (Glass et al. 2003) Petroleum
industry 1980-1998 AML(205.0, 208.0), CLL(204.1) 9 I A A
Australian petroleum workers cohort (Gun et al. 2006) Petroleum
industry 1981-1999 ALL(204.0), NHL (200-202) 9 I A D
Beaumont, Texas petroleum refinery cohort (Wong et al. 2001a) Petroleum
industry 1945-1996 ALL(204.0), AML(205.0), CLL(204.1), MM(203), NHL(200,202), HL(*)
8 M A D
Canadian petroleum company cohort (Schnatter et al. 1996) Petroleum
industry 1964-1983 MM(203), NHL(200, 202.0, 202.1, 202.2, 202.9) 8 M E A
Canadian petroleum company cohort (Lewis et al. 2003) Petroleum
industry 1964-1994 ALL(204.0), AML(205.0), CLL(204.1), HL(201) 9 I B D
Caprolactam workers (Swaen et al. 2005) Chemical industry 1951-2001 MM(31), HL(29) b M E A
Conoco chemical plant cohort (Decoufle et al. 1983) Chemical
industry 1947-1977 MM(*) 8 M E D
Dow cohort (Bloemen et al. 2004) Chemical industry 1940-1996
AML(205.0, 206.0, 207.0), CLL(204.1), MM(203), NHL(200.0-200.8, 202.0, 202.8), HL(201)
9 M A A
Exxon cohort Louisiana (Huebner et al. 2004) Petroleum
industry 1970-1997
ALL(204.0), AML(205.0, 206.0, 207.0, 207.2), CLL(204.1), MM(203.0), NHL(200.0-200.2, 200.8, 202.0-202.2, 202.8-202.9), HL(201)
9 M B D
Exxon cohort Texas (Huebner et al. 2004) Petroleum industry 1970-1997
ALL(204.0), AML(205.0, 206.0, 207.0, 207.2), CLL(204.1), MM(203.0), NHL(200.0-200.2, 200.8, 202.0-202.2, 202.8-202.9) HL(201)
9 M C D
Finnish Oil Refinery Workers (Pukkala 1998) Petroleum
industry 1967-1994 NHL(*), HL(*) * I E D
French gas and electric utility workers (Guenel et al. 2002) Gas and electric
utility industry 1978-1989 ALL(*), AML(*), CLL (*) O I A B
Italian oil refinery (Consonni et al. 1999) Petroleum industry 1949-1991 NHL(200,202), HL(201) 8 M E D
Martinez and Wilmington refineriy and petrochemical plants California
(Tsai et al. 1993) Petroleum industry 1973-1989 NHL(200), HL(201) 8 M E D
Page 36 of 42
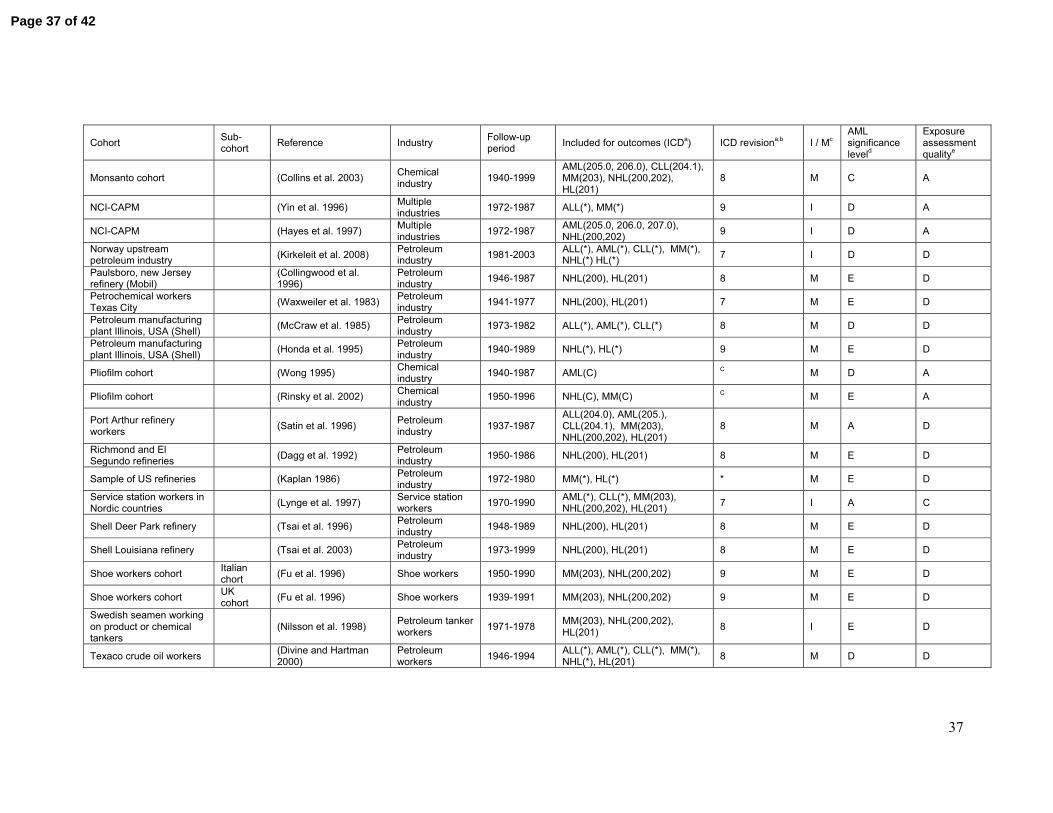
37
Cohort Sub-cohort Reference Industry Follow-up
period Included for outcomes (ICDa) ICD revisiona,b I / Mc AML significance leveld
Exposure assessment qualitye
Monsanto cohort (Collins et al. 2003) Chemical industry 1940-1999
AML(205.0, 206.0), CLL(204.1), MM(203), NHL(200,202), HL(201)
8 M C A
NCI-CAPM (Yin et al. 1996) Multiple industries 1972-1987 ALL(*), MM(*) 9 I D A
NCI-CAPM (Hayes et al. 1997) Multiple industries 1972-1987 AML(205.0, 206.0, 207.0),
NHL(200,202) 9 I D A
Norway upstream petroleum industry (Kirkeleit et al. 2008) Petroleum
industry 1981-2003 ALL(*), AML(*), CLL(*), MM(*), NHL(*) HL(*) 7 I D D
Paulsboro, new Jersey refinery (Mobil) (Collingwood et al.
1996) Petroleum industry 1946-1987 NHL(200), HL(201) 8 M E D
Petrochemical workers Texas City (Waxweiler et al. 1983) Petroleum
industry 1941-1977 NHL(200), HL(201) 7 M E D
Petroleum manufacturing plant Illinois, USA (Shell) (McCraw et al. 1985) Petroleum
industry 1973-1982 ALL(*), AML(*), CLL(*) 8 M D D
Petroleum manufacturing plant Illinois, USA (Shell) (Honda et al. 1995) Petroleum
industry 1940-1989 NHL(*), HL(*) 9 M E D
Pliofilm cohort (Wong 1995) Chemical industry 1940-1987 AML(C) C M D A
Pliofilm cohort (Rinsky et al. 2002) Chemical industry 1950-1996 NHL(C), MM(C) C M E A
Port Arthur refinery workers (Satin et al. 1996) Petroleum
industry 1937-1987 ALL(204.0), AML(205.), CLL(204.1), MM(203), NHL(200,202), HL(201)
8 M A D
Richmond and El Segundo refineries (Dagg et al. 1992) Petroleum
industry 1950-1986 NHL(200), HL(201) 8 M E D
Sample of US refineries (Kaplan 1986) Petroleum industry 1972-1980 MM(*), HL(*) * M E D
Service station workers in Nordic countries (Lynge et al. 1997) Service station
workers 1970-1990 AML(*), CLL(*), MM(203), NHL(200,202), HL(201) 7 I A C
Shell Deer Park refinery (Tsai et al. 1996) Petroleum industry 1948-1989 NHL(200), HL(201) 8 M E D
Shell Louisiana refinery (Tsai et al. 2003) Petroleum industry 1973-1999 NHL(200), HL(201) 8 M E D
Shoe workers cohort Italian chort (Fu et al. 1996) Shoe workers 1950-1990 MM(203), NHL(200,202) 9 M E D
Shoe workers cohort UK cohort (Fu et al. 1996) Shoe workers 1939-1991 MM(203), NHL(200,202) 9 M E D
Swedish seamen working on product or chemical tankers
(Nilsson et al. 1998) Petroleum tanker workers 1971-1978 MM(203), NHL(200,202),
HL(201) 8 I E D
Texaco crude oil workers (Divine and Hartman 2000)
Petroleum workers 1946-1994 ALL(*), AML(*), CLL(*), MM(*),
NHL(*), HL(201) 8 M D D
Page 37 of 42

38
Cohort Sub-cohort Reference Industry Follow-up
period Included for outcomes (ICDa) ICD revisiona,b I / Mc AML significance leveld
Exposure assessment qualitye
Texaco mortality study (Divine et al. 1999a) Petroleum industry 1947-1993 HL(201) 8 M A D
Texaco mortality study (Divine et al. 1999b) Petroleum industry 1947-1993 ALL(*), AML(*), CLL(*), MM(*),
NHL(*) 8 M A D
Torrance, California petroleum refinery (Wong et al. 2001b) Petroleum
industry 1959-1997 ALL(204.0), AML(205.0), CLL(204.1), MM(203), NHL(200,202), HL(*)
8 M A D
UK oil distribution and oil refinery workers Refinery (Rushton 1993) Petroleum
industry 1950-1989 ALL a M A D
UK oil distribution and oil refinery workers
Distribution (Rushton 1993) Petroleum
industry 1950-1989 ALL a M A D
UK oil distribution and oil refinery workers (Rushton and
Romaniuk 1997) Petroleum industry 1950-1993 AML(*), CLL (*) 9 M C A
UK oil distribution and oil refinery workers Refinery (Sorahan 2007) Petroleum
industry 1951-2003 MM (203), NHL(200,202), HL(201) 9 M E D
UK oil distribution and oil refinery workers
Distribution (Sorahan 2007) Petroleum
industry 1951-2003 MM (203), NHL(200,202), HL(201) 9 M E D
Union Oil Company cohort
Oil and gas division
(Delzell et al. 1992)f Petroleum industry 1976-1990 MM(203), NHL(200,202) 9 M D D
Union Oil Company cohort
Refining division (Delzell et al. 1992)f Petroleum
industry 1976-1990 MM(203), NHL(200,202) 9 M E D
Union Oil Company cohort
Oil and gas division
(Sathiakumar et al. 1995)
Petroleum industry 1976-1990 AML(*) 9 M D D
US chemical workers (Wong 1987a) Chemical industry 1946-1977 HL(201) 8 M E A
US chemical workers (Wong 1987b) Chemical industry 1946-1977 MM(203) 8 M E A
US chemical workers (Wong 1998) Chemical industry 1946-1977 NHL (200,202) 8 M E A
US gasoline distribution employees
Land-based (Wong et al. 1993) Petroleum
industry 1946-1986 ALL(*), AML(*), CLL(*) 8 M B B
US gasoline distribution employees Marine (Wong et al. 1993) Petroleum
industry 1946-1986 ALL(*), AML(*), CLL(*) 8 M A B
US gasoline distribution employees
Land-based and marine
(Wong 1998) Petroleum industry 1946-1986 NHL (200,202) 8 M C B
a (*) Indicates that the ICD revision or specific ICD code was not reported
Page 38 of 42
39
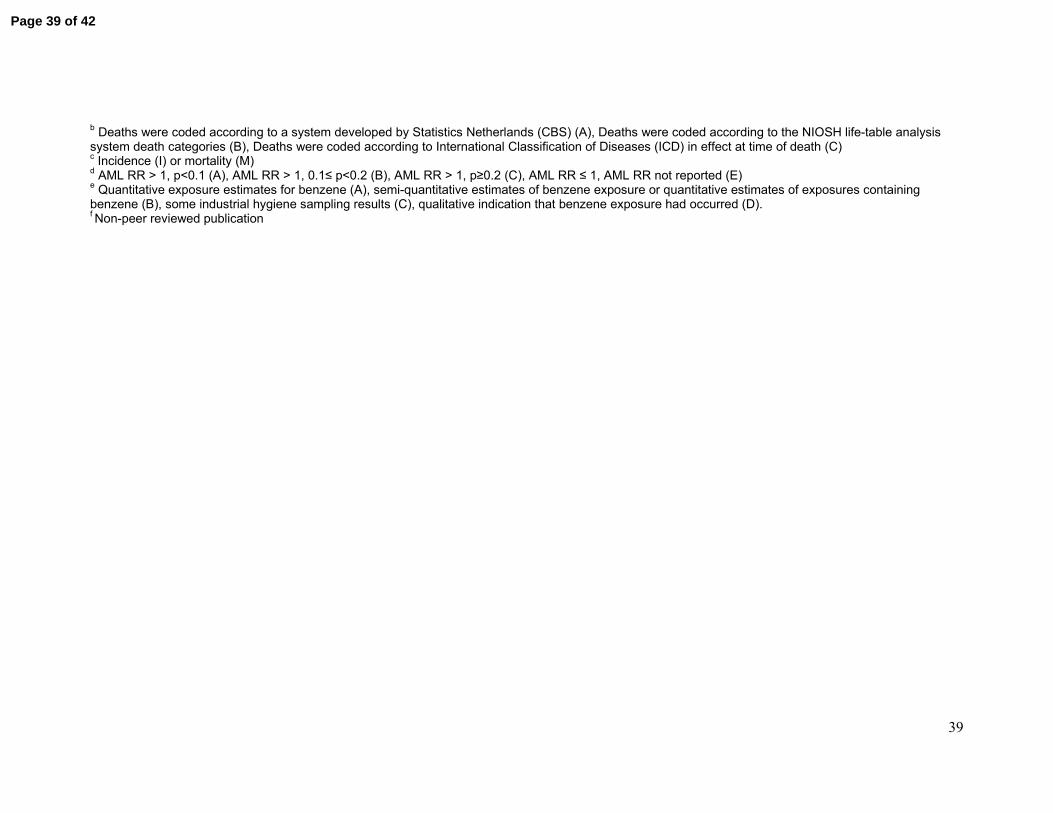
b Deaths were coded according to a system developed by Statistics Netherlands (CBS) (A), Deaths were coded according to the NIOSH life-table analysis system death categories (B), Deaths were coded according to International Classification of Diseases (ICD) in effect at time of death (C) c Incidence (I) or mortality (M) d AML RR > 1, p<0.1 (A), AML RR > 1, 0.1≤ p<0.2 (B), AML RR > 1, p≥0.2 (C), AML RR ≤ 1, AML RR not reported (E) e Quantitative exposure estimates for benzene (A), semi-quantitative estimates of benzene exposure or quantitative estimates of exposures containing benzene (B), some industrial hygiene sampling results (C), qualitative indication that benzene exposure had occurred (D). f Non-peer reviewed publication
Page 39 of 42

40
Table 2 Meta relative risks for AML and five lymphoma subtypes in cohort studies of workers exposed to benzene; stratification by start of follow-up. Lymphoma subtype Na nb Meta relative risk
(all studies) Na nb Meta relative risk (start follow-up before 1970)
Na nb Meta relative risk (start follow-up 1970 and later)
Test for difference by follow-up strata (p-value)c
AML 21 217 1.68 (1.35-2.10)* 12 119 1.43 (1.07-1.92)* 9 98 2.08 (1.59-2.72) 0.06 HL 27 146 0.99 (0.83-1.19) 19 123 1.01 (0.83-1.23) 8 23 0.91 (0.59-1.40) 0.67 NHLd 33 647 1.00 (0.89-1.13)* 22 452 0.93 (0.81-1.06)* 11 195 1.21 (0.94-1.55)* 0.07 MM 26 284 1.12 (0.98-1.27) 16 204 1.07 (0.93-1.24) 10 80 1.26 (0.92-1.71) 0.35 ALL 17 47 1.44 (1.03-2.02) 10 30 1.30 (0.88-1.92) 7 17 1.92 (1.00-3.67) 0.31 CLL 18 111 1.14 (0.78-1.67)* 11 69 0.87 (0.50-1.50)* 7 42 1.63 (1.09-2.44) 0.07 a Number of studies b Number of exposed cases c Test of interaction (Altman and Bland 2003) d NHL or Lymphosarcoma/Reticulosarcoma (preferred NHL if the study reported both) * Significant evidence for between study heterogeneity (p<0.1)
Page 40 of 42
41
Table 3 Meta relative risks for AML and five lymphoma subtypes in cohort studies of workers exposed to benzene; stratification by AML significance level Lymphoma subtype AML significance levela Nb nc Meta relative risk
A-E (all studies) 21 217 1.68 (1.35-2.10)* A-D 21 217 1.68 (1.35-2.10)* A-C 16 192 1.88 (1.56-2.27) A-B 11 132 2.20 (1.77-2.72)
AML
A 9 108 2.48 (1.94-3.18)
A-E (all studies) 27 146 0.99 (0.83-1.19) A-D 12 69 0.99 (0.77-1.27) A-C 9 39 0.82 (0.59-1.15) A-B 5 7 0.47 (0.22-0.99)
HL
A 4 7 0.50 (0.23-1.08)
A-E (all studies) 33 647 1.00 (0.89-1.13)* A-D 16 390 0.98 (0.82-1.17)* A-C 14 351 1.00 (0.82-1.21)* A-B 7 130 1.21 (0.85-1.72)*
NHLd
A 6 101 1.16 (0.77-1.76)*
A-E (all studies) 26 284 1.12 (0.98-1.27) A-D 14 160 1.15 (0.95-1.40) A-C 12 137 1.19 (0.94-1.49) A-B 7 69 1.49 (1.13-1.95)
MM
A 6 56 1.56 (1.11-2.21)
A-E (all studies) 17 47 1.44 (1.03-2.02) A-D 17 47 1.44 (1.03-2.02) A-C 11 29 1.41 (0.90-2.19) A-B 7 16 1.74 (0.90-3.36)
ALL
A 5 12 1.74 (0.77-3.90)
A-E (all studies) 18 111 1.14 (0.78-1.67)* A-D 18 111 1.14 (0.78-1.67)* A-C 13 93 1.19 (0.74-1.90)* A-B 8 57 1.37 (0.73-2.56)*
CLL
A 6 45 1.39 (0.65-2.96)* a AML RR > 1, p<0.1 (A), AML RR > 1, 0.1≤ p<0.2 (B), AML RR > 1, p≥0.2 (C), AML RR ≤ 1, AML RR not reported (E) b Number of studies c Number of exposed cases d NHL or Lymphosarcoma/Reticulosarcoma (preferred NHL if the study reported both) * Significant evidence for between study heterogeneity (p<0.1)
Page 41 of 42
42
Table 4 Meta relative risks for AML and five lymphoma subtypes in cohort studies of workers exposed to benzene; stratification by exposure assessment quality Lymphoma subtype Exposure assessment qualitya Nb nc Meta relative risk
A-D (all studies) 21 217 1.68 (1.35-2.10)* A-C 10 108 1.73 (1.26-2.38) A-B 9 95 1.82 (1.25-2.66) AML
A 6 71 2.32 (1.55-3.47)
A-D (all studies) 27 146 0.99 (0.83-1.19) A-C 5 16 0.99 (0.58-1.71) A-B 4 6 0.98 (0.36-2.67) HL
A 4 6 0.98 (0.36-2.67)
A-D (all studies) 33 647 1.00 (0.89-1.13)* A-C 8 106 1.03 (0.70-1.51)* A-B 7 69 1.04 (0.63-1.72)* NHLd
A 6 50 1.27 (0.90-1.79)
A-D (all studies) 26 284 1.12 (0.98-1.27) A-C 9 37 1.15 (0.74-1.79) A-B 8 28 1.48 (0.96-2.27) MM
A 8 28 1.48 (0.96-2.27)
A-D (all studies) 17 47 1.44 (1.03-2.02) A-C 4 11 1.26 (0.5-3.16) A-B 4 11 1.26 (0.5-3.16) ALL
A 1 5 2.80 (0.27-29.23)
A-D (all studies) 18 111 1.14 (0.78-1.67)* A-C 8 61 1.38 (0.71-2.69)* A-B 7 53 1.54 (0.72-3.31)* CLL
A 4 43 2.44 (0.88-6.75) a Quantitative exposure estimates for benzene (A), semi-quantitative estimates of benzene exposure or quantitative estimates of exposures containing benzene (B), some industrial hygiene sampling results (C), qualitative indication that benzene exposure had occurred (D). b Number of studies c Number of exposed cases d NHL or Lymphosarcoma/Reticulosarcoma (preferred NHL if the study reported both) * Significant evidence for between study heterogeneity (p<0.1)
Page 42 of 42