Embed Size (px)
Citation preview
12/10/2021/LT
Based on a contribution to the “Life and Times” column in the AMA’s Marketing Research
Words: 5,315
My Research in Marketing : How It Happened Andrew Ehrenberg
Fifty years of research into marketing topics ranging from consumer behaviour (e.g. brand loyalty)
to how advertising works
This invited paper outlines how I think my
research over the last 50+ years came about. With
hindsight, I was probably always aiming at findings
that were both simple and generalizable.
Simple findings so that I and others could see
the patterns in data which at first often looked
complex. Generalizable, within stateable conditions,
to provide validated benchmarks, possibly lawlike in
due course.
But this neat aim became explicit only slowly.
At first I just unthinkingly did what I did. It seemed
natural – like the bits of science I had picked up at
school. I didn’t set out to be different.
At University I managed a first in mathematics
at Newcastle. I then read mathematical statistics at
Cambridge with a nugatory outcome, which Sir
David Cox called 50 years later a spectacular piece of
maladministration by the University and which at the
time cost me £50 a year in salary. Cambridge was
followed by three years’ statistical lecturing and
consulting with or against Hans Eysenk at the
Institute of Psychiatry (at the well-known Maudsley
Hospital) in London.
An interest in social-science applications had
already begun to emerge early in Cambridge. But
also two aversions almost from the start: (i) to
complex (and hence questionable) statistical analysis
techniques being imposed on simple data, and (ii) to
statisticians unnecessarily parading their second-hand
mathematics in public.
A Brand’s Heavy Buyers
My first finding in marketing arose in the late 1950s
from a practical problem with the Attwood Consumer
Panel, a precursor of TNS (Taylor Nelson Sofres),
now about the world’s biggest market research
company and then my first marketing employer.
This panel measured consumers’ purchases and
was reporting too much buying of one brand,
Cadbury’s Drinking Chocolate (CDC). My boss
Douglas Brown – the first and last I ever had who
knew what I was supposed to be doing – wondered
whether the excess was due to the panel having too
many heavy buyers of CDC. (Heavy or loyal buyers
normally are crucial for a brand’s sales success.)
Could I fit a theoretical distribution to the numbers of
people who had recorded buying CDC 0, 1, 2, 3, or
more times in a year say, so as to let us legitimately
excise any excess heavies?
Most people buy a brand like CDC only quite
occasionally. I therefore tried the traditional
statistical way of modelling rare events (as a so-
called Poisson process). But that did not work too
well.
So I next tried a heterogeneous mixture of such
Poissons (called a Negative Binomial Distribution or
12/10/2021/LT
2
NBD) which would allow different consumers’
average purchase rates to differ (as of course they do)
and which I had come across in Cambridge in
modelling certain biological and social happenings
(e.g. the occurrence of rare accidents).
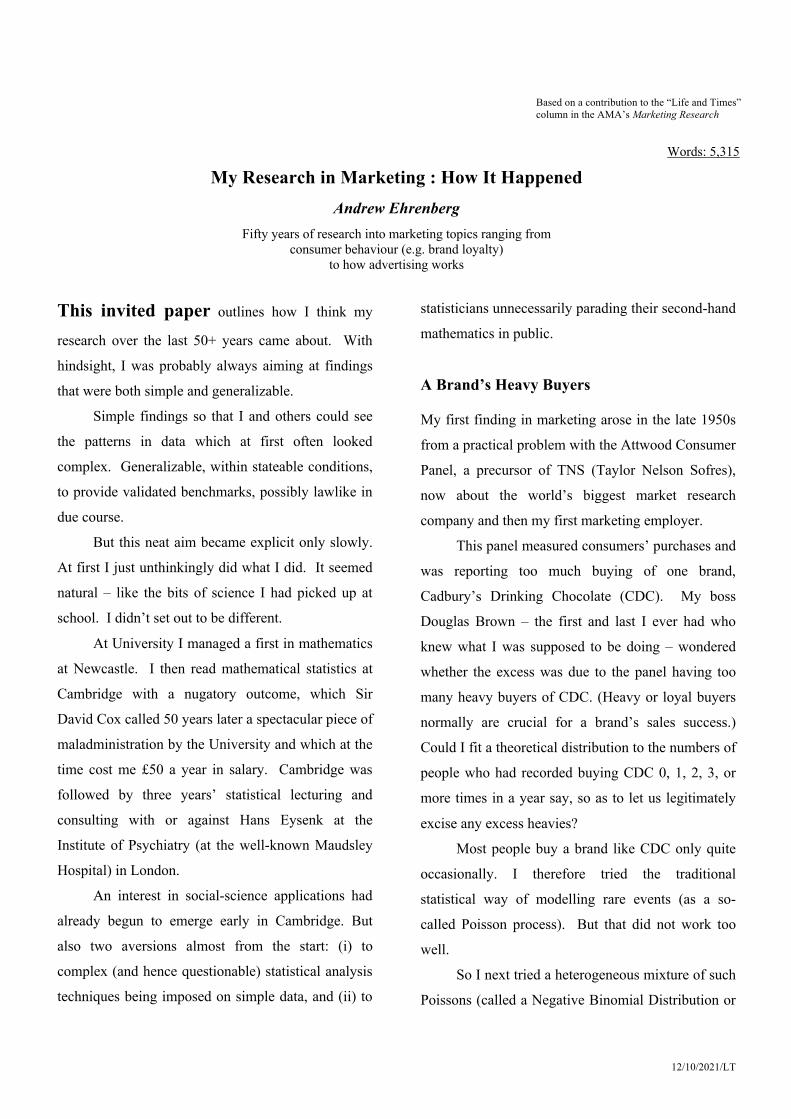
This model gave a very close fit to the
observed purchasing data, as in the graph. There was
no excess of heavier CDC buyers. As a result, our
analysis was of no help to management in its problem
with the panel’s alleged biased reporting of CDC’s
sales (which was then dealt with in other ways).
However, the big research issue for me suddenly
was: Was the fit of this new NBD model more than a
once-only fluke?
In the event, the NBD was found to fit again
and again to other data: big, medium, and small
brands of very varied grocery-type products from
soap to soup (it took much work and time). And
mascara. With correlations still well over .9. And
one persistent minor discrepancy that was in the end
fully explained in work by Chris Chatfield, my first
doctoral student.
And slowly also for different countries,
analysts, points in time, shorter and longer analysis-
periods, younger and older consumers, etc.
Such a quantified regularity was unprecedented
in marketing. So it was (and is) exciting. We had
stumbled on an empirically widely-grounded theory
to benchmark how many people do or should buy any
brand how often. (That should have been the end of
marketing’s pipedreams of just recruiting heavy-
buying buyers, but of course wasn’t.)
The theory itself was also exciting. It assumed
that consumers behaved “as-if probabilistically”.
That is very irregularly, but not literally at random, as
many physicists famously assume for the elementary
particles in quantum mechanics. But “Gott würfelt
nicht” (does not play dice), any more than His
housewives literally toss mental pennies for just
when to buy their soap powder, and for which brands
to choose.
Further regularities. The model also led to other
theoretical predictions (e.g. for the period-to-period
flow of “new”, “lapsed”, and “repeat” buyers of any
brand, and for their associated buying rates). These
predictions again held for very varied data and
showed what to expect from healthy brands in a more
or less steady market. (The model had avoided the
theoreticians’ mostly unnecessary complications of
“loyalty erosion” and “purchase feedback”.)
The NBD model’s close fit also supported its
underlying assumptions (20 years later Gerald
Goodhardt proved its main “Gamma” assumption
mathematically in Nature, one of our five
contributions to that renowned science journal).
For some years we went on examining
consumers’ buying of individual brands. (I was
fairly soon joined by Gerald Goodhardt and then
Martin Collins in a very productive commercial

12/10/2021/LT
3
three-man set-up, Aske Research Ltd, where we paid
our way, by way of facing bothersome facts rather
than as a Lawrentian self-obsession. All three before
very long also served as chairmen of the UK Market
Research Society, and later became business school
professors.)
Polygamous Brand-Buying
Suddenly an unknown US company researcher, Gary
Grahn, noticed that the different brands in his
product-category were bought at much the same
average rate.
This simple finding was a revelation, at least
once we established that it generalised.
We already had many such average buying-
rates for different brands lying around from our past
tabulations (done for years by hand – bars-and-gates
– and then with Hollerith/IBM punched-card
counter-sorters). But like everybody else, we had
never bothered to compare these rates with each
other because we expected no single or simple
outcome. (Philip Kotler’s uniquely-successful
marketing text had already long stressed that
marketing was complex and downright difficult.)
A Hollerith (IBM) Card-sorter
Grahn’s result passed through three stages with
us, over some years:
First, we thought and often said that the
average purchase rates of competitive brands, big or
small, were about equal. Or “constant” plus a bit of
error – about 3 or 4 annually in that product
category, about 6 or 7 in another. (The traditional
approximately-equal sign of successful applied
mathematics is to me its defining symbol, at its best
with correlations of .9 or more.)
Later we noticed that the small “errors” were
rather consistent over time and hence mattered.
(Calculations were done on electro-mechanical desk
calculators or on handheld mechanical Curtas if at
home or travelling. Slide rules were not useful.)
A hand-held Curta
Later still, we noted a small but common
systematic trend in these buying-rates: they decreased
slightly with the brands’ market-shares.
Abe Shuchman at Columbia then identified this
small trend with William McPhee’s recent “Double
Jeopardy” (DJ) phenomenon in quantitative
sociology: Compared with a bigger brand, a smaller
brand is of course bought by fewer consumers, but it
is also bought somewhat less often by them (because
it has more exposure to the competition). Hence it
was “punished twice”, which McPhee, also at
Columbia, had thought unfair on the smaller guys.
Brand-switching. Further empirical regularities in
people’s buying of competing brands also slowly
12/10/2021/LT
4
emerged (partly while visiting at Warwick University
in the UK, and at Columbia during the 1968 student
riots). This led to a picture of consumers of branded
grocery products as polygamous, with several steady
partners (i.e. brands), some consumed more often
than others. Two examples are:
§ Very few customers of a brand are 100%-
loyal to it over a series of purchases. Nor
do they buy it often. They therefore have
few opportunities for being disloyal.
Marketing’s common target of “more
loyal-buyers” was seen to be deeply
unreachable.
§ How many customers of brand A also buy
brands B or C in the analysis–period varies
directly with how many then buy B at all,
or C at all. This was sanctified as the
“Duplication of Purchase Law”, with a
simple adjustment discovered later for any
partitioned market. (The then-intricate data
tabulations were done by Gerald
scrounging time at the UK Atomic Energy
Laboratory on their Atlas computer – one
of the then-world’s three largest.)
All this led to my first real book, Repeat-
Buying: Facts, Theory and Applications, first
outlined while visiting at the University of Pittsburgh
("Pitt", in contrast with Carnegie-Mellon).
In 1970 I was headhunted by London Business
School (LBS) to be professor of marketing and
communication, having never read anything on either
subject. I stayed 23 years and learnt, followed by 10
or more at London South Bank University.
Family Background Over the previous forty years, I had had no great urge
to be a professor. My extended family had “been
there done that” – a dozen or more professors
(including the Regius chairs of history at Cambridge
and Oxford, Sir Geoffrey Elton and Sir Michael
Howard, and a Nobel physicist); the influential
Heidelberg psychiatrist Viktor von Weiszäcker
(uncle of the late German President) and a lifelong
friend like his wife Olympia; cousins such as Franz
Rosenzweig (the leading early-20th-century
philosopher of Judaism) and Ashley Raeburn
(treasurer of Shell pre-Watts, and vice-chair of Rolls
Royce for 15 years, who has lived “down the road”
for the last 30 years); the highly anti-semitic Martin
Luther longer ago; and also some more public
performers like Olivia Newton-John (whom I
repeatedly dandled on my knee, baby-sitting in
Cambridge), and Ben Elton (who, when I asked after
his father’s third inaugural lecture whether he’d ever
heard him lecture before, came back with the
unrehearsed Yes, but not in public).
In 1939 my close family and I, aged 13, had
sought UK asylum from Germany. My mother (who
was what I had learnt to call Aryan) had married a
dishy Heidelberg professor of philosophy just before
WWI. He had already become a Christian, and after
the army trained for the Ministry, selecting one of the
bleakest of the black parishes in the Ruhr, Germany’s
coal-mining region. (My mother became good at
telling Jewish jokes.)
By the early '30s my father had become a
prime non-pin-up for the democratically-elected Nazi
government party (a strongly-opposing Lutheran and
ecumenical clergyman, an intellectual, an academic
theologian, a scribbler, und der Jude (Jew)
Ehrenberg). In April 1939, he was unexpectedly

12/10/2021/LT
5
released from his concentration-camp (Berlin-
Sachsenhausen), through a bribe by the then-eminent
Bishop of Chichester George Bell, as I learnt only
quite recently from my father’s two-volume
biographer Professor Günter Brackelmann.
In England now in 1940, my father was
interned by our Brits for some months as an Enemy
Alien. After that he toured the United Kingdom,
preaching Christianity with a strong German accent.
As always he wrote a lot, typing fast with two
fingers: 300 articles on Google, and books earlier on
Goethe, Idealism (3 vols), Eastern Christianity (2
vols), Germany, and more (the collected
correspondence, etc.). He was also very much a
people-person.
After the war, my parents returned to Germany,
Heidelberg in the end, where my father felt he still
had tasks to tackle. (A high school was founded in
his name by the former U-boat captain, friend, and
headmaster Karl-Heinz Potthast.) My late sister,
having gone to India as a missionary hospital matron,
married an Indian theology professor, Elavinakuzhy
John, who was visiting with us last month, one of
their daughters and her husband now being
professors in New Delhi.
In Newcastle much earlier, I had met
Clemency (the daughter of one of my maths lecturers
there, I discovered). We happily married, and after
three years in Cambridge have lived in Dulwich,
London and had three children, Stephen, Carey, and
Deborah, and six grandchildren!
As a young boy my mother told me various
funnies – all very brief but quite deep, as I recognised
more fully only later. (She had always just let me
think about them.) One introduced me to the typical
correlation-is-causation conclusion of popular
science (50 years later it was also told about Winston
Churchill). She said she had had two great-uncles.
One smoked two cigars every day and died at 83.
The other never smoked in his life and died when he
was 2.
AE the Younger
Sponsors
Over the years, our research was generally supported
by industry, especially by Unilever and Beecham
(GlaxoSmithKline) already to begin with, and Esso,
Shell, J. Walter Thompson (JWT), General Foods-
Kraft, Procter & Gamble, Mars, Cadburys, Heinz,
General Motors, Pfizer, CBS, and a good many
others on both sides of the Atlantic.
Recently the work has been run as the R&D
Initiative at London South Bank University and the
Marketing Science Centre of the University of South
Australia in Adelaide, with Byron Sharp there as
R&DI director now. Numerous companies
(competitors even) can share and discuss our results
early.
A Super-Model
Back in the later ‘70s we now needed, if possible, a
general theory of consumer behaviour to account for
our many different repeat-buying and brand-
switching regularities: it was all very well in practice,
but how did it work in theory?
12/10/2021/LT
6
After some thought, Gerald Goodhardt and
Chris Chatfield realised that, in brief, all our very
diverse empirical generalisations could be
“predicted” by technically mixing the earlier
probabilistic model for repeat-buying with the so-
called Dirichlet probability distribution to cope with
brand-choice (itself a mixture of not very far-fetched
Beta-distributions).
Unlike other theories in marketing, this so-
called Dirichlet model was “simple” – it needed only
a single identifying data-input for each brand, how
big it was (its market-share)! Yet it had many
validated outputs for each competitor (with one
minor but still quite unexplained deviation).
Marketing-mix inputs like changes in
advertising, product- or service-quality, retail-
availability, or price were not needed in modelling
marketing’s usual near-steady-state markets. We felt,
and feel, that any dynamic situations potentially
involving such complex intervening factors were far
better tackled separately, against the model’s steady-
state norms. Some longer-term erosion of loyalty
was, for example, isolated later in just this way by
Robert East and Kathy Hammond, as well as
numerous subsequent insights into new brands, price
promotions, and so on.
However, I also realised slowly that our kind of
theorising – which at base describes and explains
already-established and generalised empirical
discoveries and which thus post-dicts them – was
anathema to many American academic marketing
colleagues. They espoused much more ambitious and
complex-looking econometric procedures which
never worked in practice, with the recent citation for
a Nobel typically not referring to any established
empirical patterns: It is what a close colleague had
already many years ago at the AMA’s Chicago
conference labelled the Scientification of Non-
Knowledge. Hence “I SoNK therefore I Am” (not
uncommon also in modern theoretical physics).
Sadly, there has been little dialogue with US
academics over the years. Was I too outspoken?
Consumers’ Attitudinal Beliefs
We also tackled consumers’ attitudes from the mid-
1960s on, for the late John Treasure at JWT in
London and New York working with Michael Bird,
and later with Patrick Barwise at LBS. Would
people’s expressed attitudes – what they think they
feel about brands – also follow simple and
generalisable patterns?
Not yet knowing what we were specifically
looking for, it first slowly emerged that consumers’
expressed intentions-to-buy a brand in fact foretold
their past purchases of it, and hence also their future
ones if they were, as usual, much the same. But not
any future changes.
Users of a brand usually liked it (i.e. ticked
evaluative questions like “Tastes Nice”). That
shouldn’t have been news, but was. For example, the
widely measured “Appreciation Index” (AI) for all
UK TV programs then was largely platitudinous: “People mostly said they quite liked what they watched. And they mostly watched what they said they quite liked”.
We also found increasingly that competing
brands had much the same “image” among their
users, notwithstanding David Ogilvy: Users of brand
A would feel about A pretty much what users of
brand B felt about B, at least for “evaluative” beliefs
(“Tastes Nice”, rather than the descriptive “Is Blue”).
This made sense (to us) since competitive brands
generally copy each other, whatever people may say
about the supposed need for brand differentiation.
12/10/2021/LT
7
An extensive attitudinal repeat-interviewing
study (with Neil Barnard and Patrick Barwise and
later Francesca Dall’Olmo Riley) showed inter multa
alia that
• People’s attitudinal responses wobbled
“stochastically” over time (as-if-randomly),
like their buying behavior.
• Interviewing respondents did not affect them
subsequently (long an industry-wide
nightmare).
For systematic attitude shifts, various indications
were that attitudes changed after behaviour.
Numeracy & Literacy
In the early 1970s, Stephen King of JWT (he had
been the progenitor of Campaign Planning) wrote
that “Andrew Ehrenberg has green fingers for data”.
This seemed at first oddly absurd. Surely the patterns
and exceptions in our data were obvious – anybody
like Stephen could see them (if they looked).
But then I realised that no one (certainly
including me too) had ever given any explicit
guidelines or rules for how and why we had come to
set out our tables of data so as to make any patterns
in them become self-evident. Making this tacit
know-how explicit, oddly aided by my slight
dyslexia, took much time and effort (Thank you,
Stephen). It ended up as the Data Reduction book
(the perceptive review in JASA, the leading US stats
journal, said “My first words must be, buy two copies
now – one for yourself and one to lend”). Followed
by the briefer but still quietly-contrarian Primer in
statistical methods, and two popular training videos.
For any table of data, two steps – drastic
rounding and ordering rows and/or columns by size –
always make the data vastly more graphic (the
famous John Tukey’s “interocular” – hitting you
between the eyes. Or green fingers for everyone).
Few people, if any, can divide 35.2% by 17.9%
in their heads (without mental rounding). Two
mathematicians in a seminar at Purdue University
years ago said that they could. But they gave
different answers, so that at least one of them was
wrong. Yet when rounded to 35 and 18, we can all
see that one number is obviously about twice the
other. The fault, dear Brutus – lack of numeracy – is
not in ourselves, but in our data.
For statistical graphs, we noticed that briefly
summarizing a typical line-graph’s wiggly messages
in words (e.g. by saying “Sales mostly went down”)
worked wonders for the struggling onlooker.
Verbalised captions were also remembered far better
than the most explicit wordless pictures (like the
earlier graph here without the “agree”).
Tests of such precepts were carried out with
Chuck Chakrapani (more are needed), and many
theoretical explanations came from psychologists’
vast pre-neuroscience understanding of memory
processes. For example, the great Herbert Simon had
reported that people could not remember numbers of
more than two digits if they were interrupted in any
way, even if only by their own thoughts – as in
thinking about the emerging answer where mentally
dividing 17.9 into 35.2. As my LBS colleague David
Chambers said when showing me Simon’s
monograph, that explained my enthusiasm for drastic
rounding and Simon’s Nobel Prize.
For writing technical reports, where I had long
learnt much from Helen Bloom, we developed in
some detail precepts such as, in brief,
• Start at the end. (Give all the conclusions and
main findings first.)
12/10/2021/LT
8
• The ‘Fog Factor’. Patrick Barwise’s great
simplification of the guiding rule for having
few long words (three or fewer of three or
more syllables per average sentence).
• Be Brief (e.g. like 70+ years in 5,000+ words).
• Revise strenuously. (This 26th version of this
my pre-obituary has itself had over 400
changes:
ars est celare artem
the art is to conceal not just the art but also the
laborem. Or as Dr. Johnson said: “What is
written without effort is in general read without
pleasure”. (For ‘effort’, i.e. REVISION, click
on the AE website shortly.)
Dr. Johnson had also quoted an Oxford
don’s astounding injunction: “Read over your
composition, and whenever you meet a passage
which you think is particularly fine, strike it
out” (unless of course you already know from
the reactions of others that it was fine.)
The same pattern under different conditions: Differentiated Empirical Generalisations
Over the years, we found that the same Dirichlet
repeat-buying and brand-switching patterns as for
Soap and Soup also recurred for the very different
Gasoline – the world’s biggest private labels brands,
and sold at solus-site outlets (with John Scriven);
Aviation fuel contracts (with Mark Uncles); Ready-
mix cement (Chris Pickford and Gerald); Store-
choice (Kau Ah Keng); and (with Jay Singh and
Gerald recently) category-variants like different
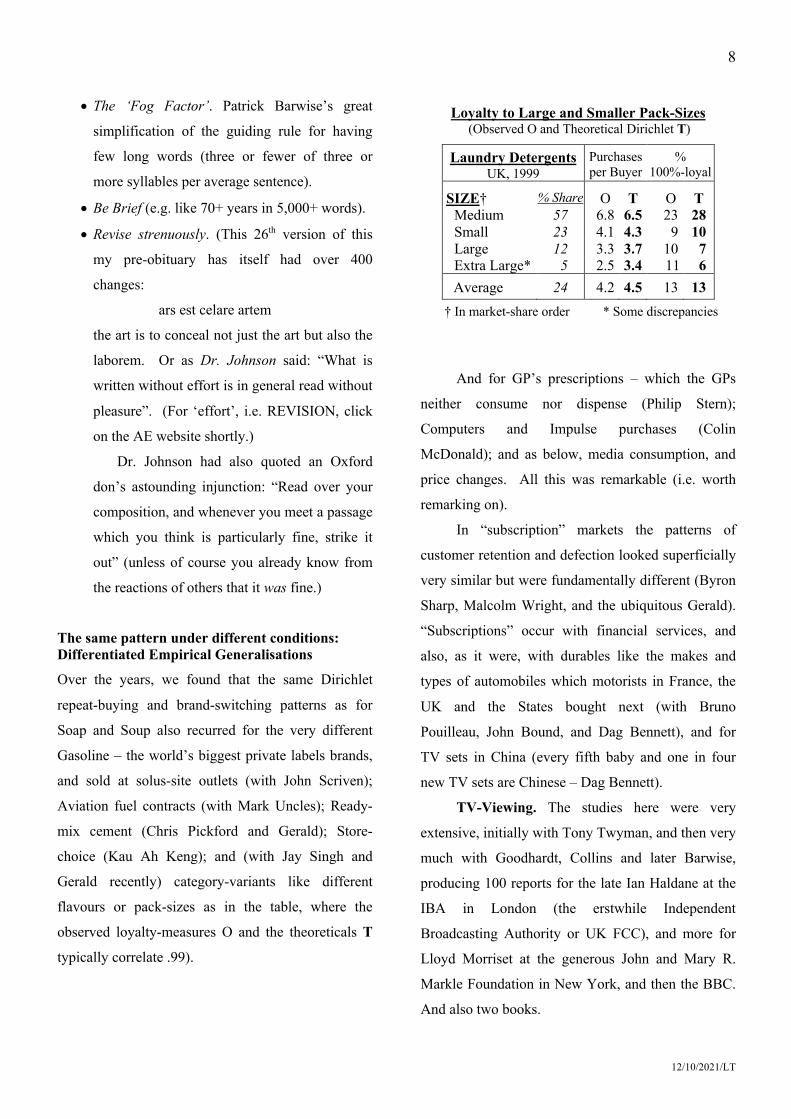
flavours or pack-sizes as in the table, where the
observed loyalty-measures O and the theoreticals T
typically correlate .99).
Loyalty to Large and Smaller Pack-Sizes (Observed O and Theoretical Dirichlet T)
Laundry Detergents UK, 1999
Purchases per Buyer
% 100%-loyal
SIZE† % Share O T O T Medium 57 6.8 6.5 23 28 Small 23 4.1 4.3 9 10 Large 12 3.3 3.7 10 7 Extra Large* 5 2.5 3.4 11 6
Average 24 4.2 4.5 13 13 † In market-share order * Some discrepancies
And for GP’s prescriptions – which the GPs
neither consume nor dispense (Philip Stern);
Computers and Impulse purchases (Colin
McDonald); and as below, media consumption, and
price changes. All this was remarkable (i.e. worth
remarking on).
In “subscription” markets the patterns of
customer retention and defection looked superficially
very similar but were fundamentally different (Byron
Sharp, Malcolm Wright, and the ubiquitous Gerald).
“Subscriptions” occur with financial services, and
also, as it were, with durables like the makes and
types of automobiles which motorists in France, the
UK and the States bought next (with Bruno
Pouilleau, John Bound, and Dag Bennett), and for
TV sets in China (every fifth baby and one in four
new TV sets are Chinese – Dag Bennett).
TV-Viewing. The studies here were very
extensive, initially with Tony Twyman, and then very
much with Goodhardt, Collins and later Barwise,
producing 100 reports for the late Ian Haldane at the
IBA in London (the erstwhile Independent
Broadcasting Authority or UK FCC), and more for
Lloyd Morriset at the generous John and Mary R.
Markle Foundation in New York, and then the BBC.
And also two books.

12/10/2021/LT
9
The patterns that occurred in TV viewing (e.g.
DJ for Program- and Channel-choice) were generally
already familiar to us from our well-established
empirical generalisations for people’s brand-choices.
Many of these patterns however still go counter to
common expectations. Thus people were by no
means fully “glued to the box”: repeat-viewing of
program series was only 50% or so week-by-week in
the past (now, with more channels, down to roughly
30% in the UK and USA).
Lord Birt’s inanely clever-clever “there’s less
in this than meets the eye” because people’s lack of
repeat-viewing could in fact be explained, ignored
TV producers’ shock if and when they learnt that half
or more of their audience this week would not be
watching the programme next week.
A prudent questionnaire-survey with Pam Mills
also showed television viewers’ wide yet sensibly-
bounded willingness to pay for more (broadly
replicated later in Canada, the United States, Japan,
and by the BBC recently).
Our various TV findings helped to thwart
Margaret Thatcher’s determined intent to privatise
the BBC. The main findings are now being updated
for the current polychannel situation, with the
detailed findings from the ‘70s as fantastic
benchmarks for how it was so long ago.
Price-Changes. In the ‘80s, our study of price
differences and price changes was opened up by
effective though expensive in-home experimentation
with Len England.
Less costly laboratory experiments, then
developed with John Scriven, generated consumer
responses to over 1,000 price-scenarios under
controlled conditions, including for some durables
and services. Price-elasticities were found not to be
specific to a particular brand or product (totally
unlike the classic “X has a price elasticity of –3.1”).
Instead, the sales effects of price varied with the
context, differing for price going up or coming down,
or for passing a reference price, and so on. (Our
account here was last month given the 2004 “best
paper” award by the Australasian Marketing
Journal.)
John Scriven also established from scanner-
panel data that consumers had Dirichlet-type harems
of acceptable polygamous Price-Bands.
Other Practical Applications Over the years, our findings were also applied to
various other marketing issues, from new brands say,
to advertising:
• New Brands. Having one day declined an
invitation from Jim Figura at US Colgate to hold an
in-house seminar with them on new brands (since we
then knew nothing special about new brands), the
realisation struck overnight that our theoretical
Dirichlet norms would of course show what to expect
for any new brand once it had “settled down”. (That
became our most popular seminar-topic for some
time, with repeat-performances at Procter &
Gamble’s Cincinnati headquarters for instance, and
elsewhere.)
Thirty years later, scanner-panel analyses of
successful new brands (with Gerald Goodhardt)
showed that loyalty to new brands unexpectedly
stabilized almost instantly, with no special settling-
down or “learning” period.
This finding was in fact not totally new. Three
earlier isolated cases of near-instant loyalty for new
brands (one case ours) had previously been dismissed
by us and/or others as obvious aberrations. But these
earlier findings had in fact already gotten it right.

12/10/2021/LT
10
• No Brand-Segmentation. An emperor’s-
clothes check of marketing’s basic notion of brand
segmentation showed that there wasn’t any –
different competitive brands appealed to much the
same kinds of consumers in extensive large-sample
Target-Group-Index data with the TGI’s 200
potential segmentation variables across 40 UK
industries. The paper in 2000 with Rachel Kennedy
received three of our five “best paper” awards
roundabout then.
Andrew Ehrenberg at home recently, standing in front of Ludwig Alfred Jonas’ portrait of his great-grandmother Julie (aged 92 and blind).
• Price Promotions. Scanner-panel analyses
with Kathy Hammond and Gerald Goodhardt
explained why price-promotions fail to attract
increased sales afterwards: The usual price cuts were
far too small to persuade people who for five or more
years previously had strenuously refrained from
buying that brand. This study well merits to be
replicated to increase its impact.
• Advertising. In our view advertising works
differently from what is commonly thought in five
ways:
1. Few if any advertisements are strongly
persuasive, or even try to be so. (Pam Mills checked
the latter out empirically with both professionals and
consumers, for TV, Print, and Outdoor.)
2. After extended discussions with Neil
Barnard, Helen Bloom, Rachel Kennedy and others,
we mostly see advertising as ‘mere publicity’ for the
advertised brand, to remind already-knowledgeable
consumers (with ads resplendently saying “Coke Is
It” and later “Always Coca-Cola”, for consumers
who already knew Coke).
3. A brand’s salience increasingly seems key:
Any propensity for the brand to come to mind or to
be noticed (a notion developed further by Jenni
Romaniuk and Byron Sharp).
4. Ads might very occasionally also nudge
towards a purchase.
5. There is no evidence whatsoever that
advertising induces people to buy products as a
whole – cigarettes, alcohol, now fatty foods, salt and
sugar. The lack of such evidence is convincing
because the industry would of course love nothing
better than positive proof that it can make people buy
things. Instead, I believe that people largely buy
them because they like them.
No Use for Statistical Techniques
As a quondam- or anti-statistician, I have never
found my subject’s commonly-used techniques, e.g.
Gaussian least-squares regression or multiple factor
analysis, to be of any use, like blood-letting or
cupping.
My main reason is simply that these techniques
have not led to a single lasting scientific discovery
over the last 100 years or more, or even to mere
claims to that effect. (Other reasons are more
technical.) In contrast, my colleagues and I have
been finding plenty of generalisable empirical
12/10/2021/LT
11
regularities without any such techniques, just like any
other successful non-statistical scientists.
My early statistical doubts from Cambridge-
days were fleshed out in various papers (some unduly
long), with constructive counter-proposals. These
were continuously applied, in our own data-analyses.
They were also discussed in often standing-room-
only seminars at MIT, the then-glamorous Bell Labs,
and elsewhere (“Preaching what we Practised”).
Over the years, we have also never sought to
justify any result as being “statistically significant” –
to verify that it had actually happened – as many
data-analysts still do. Instead, scientific results are
empirically replicated by hard slog, in our case for
different brands, products, countries, analysts, points
in time, etc.
In the 90s, these things were checked further
with the Car Challenge (partly while visiting at
NYU): Some 30+ leading modellers worldwide were
invited to apply their own preferred analytic
procedure to some simple repeat-buying data for new
cars (the new make acquired and the previous make).
The data had been replicated with very large samples
in two countries and over four separate years.
We found, mainly with Richard Colombo, that
the 20+ participating modelling experts had given 20
answers which differed about as far as 20+ answers
could.
Many had moreover analysed only one of their
eight data-sets: few had checked whether their new
finding was replicable. They were heading fast, as
far as they could tell, towards Cold Fusion.
Sum Ergo Cogito
Inverting, as a workaday scientist, the famous
philosopher’s “I think therefore I am”, I still see my
emphasis to have been on results which were both
generalisable and simple (and hence, at times, even
beautiful).
I do not see very many uncorrected mistakes in
what we did (critics have perhaps been too kind).
But I have become increasingly aware of gaps.
My oldest London friend for 50 years from the
Maudsley (though we had never talked my shop)
wrote last month: 59 Dulwich Village London SE21 9 Dec 2004
Dear Andrew,
We enjoyed the dinner.
This is about your paper. Needless to say, so far as work etc. is concerned, for me you exist on a very different planet. So your life and achievements were a delightful surprise to me. A whole secret world was opened up where wizards play with numbers and ‘results’ tumble out.
I have often wondered what you got up to. Now that you have given us a glimpse, I find it fascinating. Endless challenge, a sequence of puzzles asking to be solved.
And all you had to do was think. Marvellous! I hardly ever had to think: a very good thing for all concerned.
Even though your technical stuff is written in a foreign language, I found your writing overall very refreshing to read (I’ll overlook ‘gotten’).
Thank you very much. I’m filled with envy and admiration. And the nice thing is that lots of other people seem to be too!
Yours John
(Dr. John Fleminger, formerly Physician in Psychological Medicine. ca 1950-80, Guy’s Hospital, London.)
But not everyone. When I suggested two
months ago that the middlebrow magazine
Significance of Royal Statistical Society, my alma
mater, might like to mention my piece and its website

12/10/2021/LT
12
very briefly, as a newsy example of an applied
statistician’s work, the Editor replied (01/11/04):
Dear Andrew, … I needed some advice from the editorial board on this one.
We think that the article although very interesting, . . . would be a difficult read for someone outside marketing, and doesn’t actually describe much statistics (i.e. I didn’t employ any classic statistical “techniques”).
No wonder perhaps that the student numbers for
stats courses have sadly been dropping.
READINGS Published papers are listed at www.lsbu.ac.uk/bcim in a bibliography of some 300 titles prepared by my colleague John Bound, self-styled at 80 the world’s oldest Research Assistant.
Andrew Ehrenberg has been professor at the Ehrenberg Centre for Research in Marketing at London South Bank University, and founder of the R&D Initiative for Marketing there, and at the Ehrenberg-Bass Institute at the University of South Australia, Adelaide. He can be reached at [email protected]