Embed Size (px)
Citation preview
Annual report y e a r e n d i n g 30 June 2012

CONTENTS MESSAGE FROM THE BOARD CHAIR AND CEO ......................................................................................... 3 TRUSTEE BOARD ............................................................................................................................................ 4 INVESTMENT RETURNS AND RANKINGS..................................................................................................... 5 YOUR INVESTMENT ........................................................................................................................................ 6 THE TEAM BEHIND YOUR SUPER............................................................................................................... 14 ABOUT THE SERVICE PROVIDERS............................................................................................................. 16 TAXES, FEES AND CHARGES...................................................................................................................... 17 FINANCIAL STATEMENTS............................................................................................................................. 20 MORE INFORMATION.................................................................................................................................... 22 IMPORTANT CHANGES................................................................................................................................. 24 Abridged financial statements are shown in this report. Full (audited) financial statements and the auditor’s report are available by request. For information on how to contact us, refer to the back page of this document. Please note that the information contained in this document is of a general nature only and does not constitute personal advice as it does not take into account your personal objectives, financial situation or needs. Any advice in this document is provided by FuturePlus Financial Services Pty Limited (ABN 90 080 972 630) as an Australian Financial Services Licensee (AFSL 238445) on behalf of the Trustee of the Energy Industries Superannuation Scheme, Energy Industries Superannuation Scheme Pty Limited (ABN 72 077 947 285). Energy Industries Superannuation Scheme Pty Limited is an APRA Registrable Superannuation Entity Licensee (ABN Pool A - 22 277 243 559 and ABN Pool B - 64 322 090 181). Members should not rely solely on this information and should consider their own personal objectives, financial situation and needs before acting on this information. Prior to making any investment decision you should obtain and consider the relevant Product Disclosure Statement (PDS) pertaining to your Scheme membership and seek professional investment advice.

MESSAGE FROM THE BOARD CHAIR AND CEO This financial year has been a time of change for EISS. During the year the Fund appointed new CEO Alex Hutchison and saw a number of changes to our Board. Our funds under management grew from $3.17 billion (30 June 2011) to $3.4 billion (30 June 2012), which was a good result in a volatile market. Factors such as the European sovereign debt crisis, high budget deficits, political uncertainty in the US and the possible slowing of the Chinese economy have all contributed to a market which continues to fluctuate with high levels of volatility. In this report, you’ll see how our investment options have performed in 2011/2012 – outlined on page 5. We are very pleased that despite volatile investment conditions, all options offered in our accumulation schemes, except Cash, achieved a one year return to 30 June 2012 that ranked in the top quartile of SuperRatings’ Fund Crediting Rate Survey*. The Fund continues to build on a solid performance post the GFC and has outperformed many of its peers. In managing market volatility, the Fund has shifted its investment strategy over the past 12 months to reflect a more defensive position. This includes holding more cash, increased investment in Australian Government Bonds, and continuing to seek performance with a highly diversified portfolio of global assets. The future outlook for markets is for the world economy to soften, with analysts suggesting that volatility will be experienced for some time to come.** Accordingly, the Fund will continue to focus on investing with a long term perspective and a strong sense of stewardship. Delivering on our commitment EISS’s commitment to members is to provide the best possible financial security in retirement. We do this by working hard to maintain strong investment results and delivering high quality services to employers and members. This includes: our face-to-face, highly personalised education program delivered to members in the field; an enhanced seminar program led by specialist financial planners who are experts in our products; and the ongoing enhancement of web based services for employers and members, with a new look website
scheduled to launch in late 2012 / early 2013. Our central focus has been and remains that of delivering a strong tailored service to those in the energy industry – and we thank all employers and members for their ongoing support. If you have any questions or comments, please phone us on 1300 369 901. * Rankings are courtesy of the SuperRatings Fund Crediting Rate Survey June 2012 (Survey). The Survey has been issued by SuperRatings Pty Limited Australian Financial Services Licence No. 311880 subject to its conditions, assumptions and other relevant terms. ** RBA, Monetary Policy Decision, 3 October 2012
Mick Doust Board Chair
Alex Hutchison CEO
3

TRUSTEE BOARD The role of the EISS Trustee Board is to ensure that the Scheme is operated and managed in the best interests of all members and in accordance with its governing rules and superannuation legislation. Board directors as at 30 June 2012
Mick Doust - Chair Appointed by Electrical Trades Union of Australia (ETU) NSW Branch. Organiser, ETU, NSW Branch.
Terry Downing – Deputy Chair Appointed by Endeavour Energy. Deputy Chair, Endeavour Energy.
Justin De Lorenzo Appointed by Essential Energy. Executive General Manager, Finance and Risk, Essential Energy.
Kevin Murray Appointed by TransGrid. Former Managing Director, TransGrid.
Ian Tarrant Appointed by the United Services Union (USU) of NSW. Manager, Remuneration and Benefits, Essential Energy.
Steve Butler Appointed by ETU, NSW Branch. Secretary, ETU, NSW Branch.
Peter Dodd Appointed by Ausgrid Deputy Vice Chancellor and Chief Operating Officer - Macquarie University.
John Whelan OAM, JP* Appointed by Unions NSW. Former President, Unions NSW. Life Member, National Union of Workers.
* John resigned from the Board, effective 30 June 2012, and has been replaced by Mark Morey, Deputy Assistant Secretary, Unions NSW.
4

INVESTMENT RETURNS AND RANKINGS Despite volatile investment conditions throughout 2011/12, we posted strong returns for our members. All of our investment options, except for the Cash option, achieved a one year return to 30 June 2012 that ranked in the first quartile. In other words, for this period these investment options were in the top band of performers, outperforming many of their peers. Our Cash option posted a one year return to 30 June 2012 that ranked in the third quartile, due mainly to its lower-risk profile relative to peers. However, the Cash option’s three and five year returns ranked in the second quartile.** Go to www.eisuper.com.au for more details on investment returns. EISS returns to 30 June 2012 Accumulation, Electrical Contractors and Executive Schemes
Option One year return %*
Ranking**
High Growth -0.73 1st quartile for 1, 3 & 5 year returns Diversified 1.54 1st quartile for 1 year return Balanced 3.45 1st quartile for 1, 3 & 5 year returns Capital Guarded 5.71 1st quartile for 1 & 3 year returns Cash 3.88 3rd quartile for 1 year return; 2nd quartile for 3 & 5 year returns * These figures are rolling, reflect an annualised compound rate, and are after tax and fees. The returns indicate past performance. Past performance is not an indicator of future performance. ** Rankings are courtesy of the SuperRatings Fund Crediting Rate Survey June 2012 (Survey). The Survey has been issued by SuperRatings Pty Limited Australian Financial Services Licence No. 311880 subject to its conditions, assumptions and other relevant terms. SuperRatings
Super funds are regularly rated for their performance and their range of product and services.
EISS received a Gold ranking from SuperRatings, the second highest designation, for the Accumulation Scheme and the Account-Based Pension Plan.
SuperRatings is Australia’s leading rating agency for super funds. EISS performed strongly in the majority of categories and was particularly commended for the range and the cost of our automatic and voluntary insurance products. SelectingSuper AAA Rating
SelectingSuper is Australia’s leading financial services information company and has awarded EISS with a AAA rating which denotes an exceptional quality super fund. SelectingSuper assessed EISS against a range of benchmarks in the industry and
the fund rated exceptionally well on an overall assessment of organisational strength, administration, communications, investment performance, insurance, and other extra services. EISS is recognised as being among Australia’s leading superannuation providers.
5

YOUR INVESTMENT This section of the Annual Report lists the investment options offered within our Schemes along with more detailed information on definitions, asset allocations and past performance. Net earnings rates (investment return on the assets of the Scheme after payment of transaction costs, taxes and other expenses) disclosed in the tables on the following pages may not be the same as the rate credited to a member’s benefit due to the effect of cash flow timings. The net earnings allotted to your accounts during this period are calculated daily, based upon the applicable unit prices of the underlying investment strategies you are invested in. These unit prices are derived from the market value of the investments in your underlying investment strategy after adjustments for taxes, fees and expenses. You should note that any direct fees, contributions tax or expenses (such as insurance premiums) are deducted directly from your account and are not taken into account when deriving applicable unit prices. Please note that the following performance tables show past returns and do not indicate future returns. Member benefits invested in any particular investment strategy are not guaranteed and the value of their investment may decrease. EISS has adopted the ASFA/FSC Standard Risk Measure. The risk bands of EISS’s strategies are shown below: Investment option Estimated number of negative
years in a 20 year period Risk band Risk label
High Growth 4.2 6 High Growth 3.9 5 Medium to high Diversified 3.6 5 Medium to high Balanced 2.7 4 Medium Capital Guarded 1.5 3 Low to medium Cash 0 1 Very low The Standard Risk Measure is based on industry guidance to allow members to compare investment options that are expected to deliver a similar number of negative annual returns over any 20 year period. The Standard Risk Measure is not a complete assessment of all forms of investment risk, for instance, it does not detail what the size of a negative return could be, or the potential for a positive return to be less than a member may require to meet their objectives. Further, it does not take into account the impact of administration fees and tax on the likelihood of a negative return.
Estimated number of negative years in a 20 year period
Risk band Risk label
Very low Less than 0.5 1 Low 0.5 to less than 1 2 Low to medium 1 to less than 2 3 Medium 2 to less than 3 4 Medium to high 3 to less than 4 5 High 4 to less than 6 6 High risk 6 or greater 7 Members should still ensure they are comfortable with the risks and potential losses associated with their chosen investment option(s).
6

High Growth The High Growth strategy provides diversified exposure to growth assets with historically the highest expected return. Definition ~ The High Growth strategy has a targeted exposure to growth assets of 95%. Growth assets include such investments as Australian and international equities, and property. This strategy aims to achieve a return of CPI + 4.5% p.a. over 10 years. Due to the emphasis on growth, members should keep in mind that there may be ‘short-term volatility’ in the performance of the strategy. In other words, the value of the investment may fluctuate significantly over the short term and medium term. Objective ~ CPI + 4.5% p.a. over 10 years. Risks ~ There is a significant chance that the investment value may decrease. The chance of a negative return in any one year is one in four. The ASFA Standard Risk Measure estimated number of negative years in a 20 year period is 4.2 years. Standard Risk Measure ~ Profile: High ▪ Risk Band: 6 ▪ Risk Label: High Asset allocation Asset classes Target allocation Allowable asset
class ranges Actual 2012
(as at 30 June) Listed equities* 71% 60-95%
Total for all 69.6%
Unlisted property 3% 0-6% 1.7%Private equity 5% 0-15% 4.9%
Growth assets
Semi liquids and Absolute return
16% 0-20% Total for both
17.3%
Total growth assets 95% 90-100% 93.5%Fixed income 4% 0-10% 3.2%Semi liquids and Absolute return
0% 0% 0.0%Defensive assets
Cash 1% 0-10% 3.3%Total defensive assets
5% 0-10% 6.5%
Total assets 100%* Includes Australian and International equities, and Listed property. Five years of annual investment returns^ Year ending 30 June 2008 2009 2010 2011 2012 Pool A Accumulation, Executive and Electrical Contractors Schemes -12.2% -19.5% 11.1% 10.4% -0.7%
Rollover Plan -13.4% -20.5% 9.3% 9.9% 0.3% Account-Based Pension Plan -14.2% -22.7% 11.6% 11.6% -0.8% Pool B Retirement Scheme Contributor Financed Benefit -12.9% -19.4% 11.3% 11.2% -0.6% Other Contributions Account -13.2% -19.8% 11.8% 13.9%* -1.4% Deferred Benefit -13.6% -20.7% 10.0% 9.2% -1.1% ^ All figures are represented to one decimal place. * Revised from the 2010/11 annual report.
7

Diversified The Diversified strategy provides diversified exposure to a range of asset classes. Definition ~ The Diversified strategy targets an investment allocation of 75% to growth assets such as Australian and international equities, and property. The balance is invested in income-producing assets. This strategy aims to earn real investment growth of CPI + 3.5% p.a. over seven years. Due to the emphasis being on growth, members should keep in mind that there may be ‘short-term volatility’ in this strategy. In other words, the value of the investment may fluctuate over the short term. The volatility, however, is not as great as in the High Growth strategy. Objective ~ CPI + 3.5% p.a. over seven years. Risks ~ There is potential for the value of the investment to decrease. The chance of a negative return in any year is one in six. The ASFA Standard Risk Measure estimated number of negative years in a 20 year period is 3.6 years. Standard Risk Measure ~ Profile: High/Medium ▪ Risk Band: 5 ▪ Risk Label: Medium to High Asset allocation Asset classes Target allocation Allowable asset
class ranges Actual 2012
(as at 30 June) Listed equities* 56.5% 45-75%
Total for all 54.1%
Unlisted property 2% 0-6% 1.6%Private equity 2.5% 0-10% 1.8%
Growth assets
Semi liquids and Absolute return
14% 0-20% Total for both
14.9%
Total growth assets 75% 70-80% 72.4%Fixed income 20% 10-30% 21.6%Semi liquids and Absolute return
3% 0-10% Total for both
0.0%Defensive assets
Cash 2% 0-15% 6.0%Total defensive assets
25% 20-30% 27.6%
Total assets 100%* Includes Australian and International equities, and Listed property. Five years of annual investment returns^ Year ending 30 June 2008 2009 2010 2011 2012 Pool A Accumulation, Executive and Electrical Contractors Schemes -8.7% -14.6% 10.5% 9.1% 1.5%
Rollover Plan -10.2% -14.5% 9.5% 8.7%* 1.4% Account-Based Pension Plan -10.0% -17.0% 10.9% 10.3% 1.7% Pool B Retirement Scheme Contributor Financed Benefit -9.0% -15.1% 10.6% 9.4% 1.6% Other Contributions Account -9.3% -15.3% 10.8% 12.3%* 1.3% Deferred Benefit -9.7% -16.0% 10.2% 7.7% 1.7% ^ All figures are represented to one decimal place. * Revised from the 2010/11 annual report.
8

Balanced The Balanced strategy provides diversified exposure to a range of asset classes. Definition ~ The Balanced strategy invests up to 60% of the fund in growth assets such as Australian and international equities, property and private equity. The balance of the fund is invested in defensive assets such as interest-bearing securities. This combination aims to earn real investment growth of CPI + 3% p.a. over five years. This strategy is less volatile than the High Growth and the Diversified strategies. Objective ~ CPI + 3% p.a. over five years. Risks ~ There is a possibility that the value of the investment will decrease. The chance of a negative return in any year is one in seven. The ASFA Standard Risk Measure estimated number of negative years in a 20 year period is 2.7 years. Standard Risk Measure ~ Profile: Medium ▪ Risk Band: 4 ▪ Risk Label: Medium Asset allocation Asset classes Target allocation Allowable asset
class ranges Actual 2012
(as at 30 June) Listed equities* 42% 30-60%
Total for all 39.8%
Unlisted property 2% 0-6% 1.0%Private equity 2% 0-5% 1.5%
Growth assets
Semi liquids and Absolute return
14% 0-20% Total for both
15.0%
Total growth assets 60% 55-65% 57.3%Fixed income 32% 15-45% 37.3%Semi liquids and Absolute return
4% 0-10% Total for both
0.0%Defensive assets
Cash 4% 0-15% 5.4%Total defensive assets
40% 35-45% 42.7%
Total assets 100%* Includes Australian and International equities, and Listed property. Five years of annual investment returns^ Year ending 30 June 2008 2009 2010 2011 2012 Pool A Accumulation, Executive and Electrical Contractors Schemes -5.2% -10.4% 11.7%* 7.8% 3.5%
Rollover Plan -6.4% -11.0% 10.9% 7.5% 3.3% Account-Based Pension Plan -6.5% -12.5% 12.3% 8.8% 3.8% Pool B Retirement Scheme Contributor Financed Benefit -5.2% -11.1% 11.7% 8.3% 3.9% Other Contributions Account -5.5% -11.3% 11.7% 10.4%* 3.2% Deferred Benefit -6.0% -12.1% 11.2% 7.1% 3.2% ^ All figures are represented to one decimal place. * Revised from the 2010/11 annual report.
9
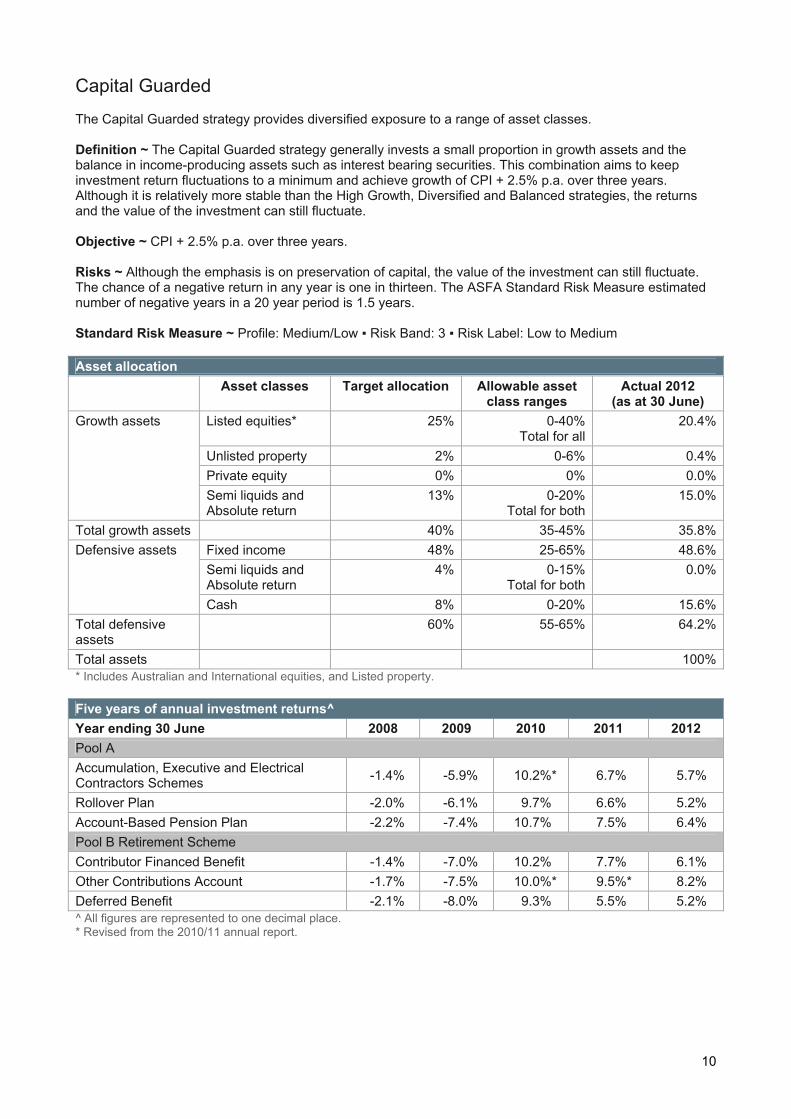
Capital Guarded The Capital Guarded strategy provides diversified exposure to a range of asset classes. Definition ~ The Capital Guarded strategy generally invests a small proportion in growth assets and the balance in income-producing assets such as interest bearing securities. This combination aims to keep investment return fluctuations to a minimum and achieve growth of CPI + 2.5% p.a. over three years. Although it is relatively more stable than the High Growth, Diversified and Balanced strategies, the returns and the value of the investment can still fluctuate. Objective ~ CPI + 2.5% p.a. over three years. Risks ~ Although the emphasis is on preservation of capital, the value of the investment can still fluctuate. The chance of a negative return in any year is one in thirteen. The ASFA Standard Risk Measure estimated number of negative years in a 20 year period is 1.5 years. Standard Risk Measure ~ Profile: Medium/Low ▪ Risk Band: 3 ▪ Risk Label: Low to Medium Asset allocation Asset classes Target allocation Allowable asset
class ranges Actual 2012
(as at 30 June) Listed equities* 25% 0-40%
Total for all 20.4%
Unlisted property 2% 0-6% 0.4%Private equity 0% 0% 0.0%
Growth assets
Semi liquids and Absolute return
13% 0-20% Total for both
15.0%
Total growth assets 40% 35-45% 35.8%Fixed income 48% 25-65% 48.6%Semi liquids and Absolute return
4% 0-15% Total for both
0.0%Defensive assets
Cash 8% 0-20% 15.6%Total defensive assets
60% 55-65% 64.2%
Total assets 100%* Includes Australian and International equities, and Listed property. Five years of annual investment returns^ Year ending 30 June 2008 2009 2010 2011 2012 Pool A Accumulation, Executive and Electrical Contractors Schemes -1.4% -5.9% 10.2%* 6.7% 5.7%
Rollover Plan -2.0% -6.1% 9.7% 6.6% 5.2% Account-Based Pension Plan -2.2% -7.4% 10.7% 7.5% 6.4% Pool B Retirement Scheme Contributor Financed Benefit -1.4% -7.0% 10.2% 7.7% 6.1% Other Contributions Account -1.7% -7.5% 10.0%* 9.5%* 8.2% Deferred Benefit -2.1% -8.0% 9.3% 5.5% 5.2% ^ All figures are represented to one decimal place. * Revised from the 2010/11 annual report.
10

Cash The Cash strategy provides exposure to cash. Definition ~ The Cash strategy invests predominantly in short-term Australian money market assets. This strategy is suited to investors targeting above RBA cash rate returns with negligible risk of capital loss. Objective ~ Equal to the 90 day Bank Bill Index (after tax). Risks ~ Negligible risk of capital loss in any given year. Standard Risk Measure ~ Profile: Low ▪ Risk Band: 1 ▪ Risk Label: Very Low Assets ~ 100% cash and income-producing assets. Asset allocation Asset allocation as at 30 June Indicative 2012 Actual 2012 (as at 30 June) Cash and income-producing assets 100% 100% Five years of annual investment returns^ Year ending 30 June 2008 2009 2010 2011 2012 Pool A Accumulation, Executive and Electrical Contractors Schemes 5.3% 4.7% 4.5% 4.0% 3.9%
Rollover Plan 4.6% 4.1% 3.8% 4.0% 3.6% Account-Based Pension Plan 5.2% 4.9% 3.9% 4.5% 4.1% Pool B Retirement Scheme Contributor Financed Benefit 4.9% 5.1% 4.4% 4.7% 4.3% Other Contributions Account 4.6% 4.9% 4.0% 7.4%* 5.8% Deferred Benefit 4.1% 4.5% 3.6% 4.0% 3.4% ^ All figures are represented to one decimal place. * Revised from the 2010/11 annual report.
11

Growth Strategy The Growth Strategy is offered in the Retirement Scheme and was formerly known as Trustee Selection. It is designed to offer real investment growth above the inflation rate over the medium to long term. Definition ~ The Growth strategy generally invests up to 85% of its funds in growth assets, such as Australian and international equities, and property. The balance is invested in income-producing assets. This combination aims to earn real investment growth above the inflation rate over a five year period. Due to the emphasis being on growth assets, members should keep in mind that there may be ‘short-term volatility’ in this strategy. In other words, the value of the investment may fluctuate significantly over the short term. Objective ~ CPI + 4% p.a. over a five year period. Risks ~ There is a significant chance that the investment value may decrease in the short term. The chance of a negative return in any year is one in five. The ASFA Standard Risk Measure estimated number of negative years in a 20 year period is 3.9 years. Standard Risk Measure ~ Profile: High/Medium ▪ Risk Band: 5 ▪ Risk Label: Medium to High Asset allocation Asset classes Target allocation Allowable asset
class ranges Actual 2012
(as at 30 June) Listed equities* 63.5% 30-80%
Total for all 62.6%
Unlisted property 3% 0-20% 2.7%Private equity 2.5% 0-30% 1.5%
Growth assets
Semi liquids and Absolute return
16% 0-20% Total for both
17.5%
Total growth assets 85% 80-90% 84.3%Fixed income 13% 0-75% 13.4%Semi liquids and Absolute return
0% 0-25% Total for both
0.0%Defensive assets
Cash 2% 0-25% 2.3%Total defensive assets
15% 10-20% 15.7%
Total assets 100%* Includes Australian and International equities, and Listed property. Five years of annual investment returns^ Year ending 30 June 2008 2009 2010 2011 2012 Contributor Financed Benefit -8.6% -17.3% 10.6% 10.6%* 0.7% Other Contributions Account -9.0% -17.7% 9.8% 13.9%* -0.2% Deferred Benefit -9.4% -18.3% 10.1% 8.9%* 0.3% ^ All figures are represented to one decimal place * Revised from the 2010/11 annual report.
12

Defined Benefit Selection The Defined Benefit Selection is the investment strategy for the Defined Benefit Scheme’s Personal Account and Other Contributions Account, and for the Scheme’s deferred members. It is designed to offer real investment growth above the inflation rate over the medium to long term. Definition ~ This strategy generally invests a high proportion of its funds in growth assets, such as Australian and international equities and property. The balance is invested in income producing assets. This combination aims to earn real investment growth above the inflation rate over a five year period. Because the emphasis is on growth, you should keep in mind that there may be what financial professionals call ‘short-term volatility’ in this strategy. In other words, the value of the investment may fluctuate over the short-term. Objective ~ CPI + 4% p.a. over a five year period. Risks ~ There is a significant chance that the investment value may decrease in the short term. The chance of a negative return in any year is one in five. The ASFA Standard Risk Measure estimated number of negative years in a 20 year period is 3.9 years. Standard Risk Measure ~ Profile: High/Medium ▪ Risk Band: 5 ▪ Risk Label: Medium to High Asset allocation Asset classes Target allocation Allowable asset
class ranges Actual 2012
(as at 30 June) Listed equities* 63.5% 30-80%
Total for all 61.6%
Unlisted property 3% 0-20% 2.4%Private equity 2.5% 0-30% 1.3%
Growth assets
Semi liquids and Absolute return
16% 0-20% Total for both
17.4%
Total growth assets 85% 80-90% 82.7%Fixed income 13% 0-75% 14.3%Semi liquids and Absolute return
0% 0-25% Total for both
0.0%Defensive assets
Cash 2% 0-25% 3.0%Total defensive assets
15% 10-20% 17.3%
Total assets 100%* Includes Australian and International equities, and Listed property. Five years of annual investment returns^ Year ending 30 June 2008 2009 2010 2011 2012 Personal Account -8.6% -17.3% 10.6% 11.1%* -0.8% Other Contributions Account -9.0% -17.7% 10.3%* 10.7%* -0.8% Deferred Benefit -9.4% -18.3% 10.1% 10.2%* -0.8% ^ All figures are represented to one decimal place. * Revised from the 2010/11 annual report.
13

THE TEAM BEHIND YOUR SUPER About the Trustee Energy Industries Superannuation Scheme Pty Limited (ABN 72 077 947 285) is the Trustee of Pool A (ABN 22 277 243 559) and Pool B (ABN 64 322 090 181) of the Scheme. The Trustee is a non-profit company solely engaged in the management and control of the Scheme and its assets for the benefit of its members. Scheme governance The Trustee is responsible for managing the Scheme, including the safekeeping of the assets and ensuring it operates in accordance with the Trust Deed, the Corporations Act 2001, the Superannuation Industry (Supervision) Act 1993 and other relevant superannuation legislation. Role of the Board The Board is responsible for setting the overall strategy for the Scheme and ensuring it is operating in accordance with the Trust Deed and all applicable laws. The Board meets most months and receives and reviews reports from its service providers, such as the Administrator (FuturePlus Financial Services), the Custodian (JPMorgan Chase Bank) and investment managers. Where necessary, the Board calls upon specialist advice from advisors, such as solicitors, accountants and the Scheme’s actuary. The Board operates under a Board Charter which, amongst other things, defines the roles and responsibilities of Directors, training requirements for Board members and sets out a Board meeting calendar. The Board has appointed the Investment Committee and the Risk, Audit and Compliance Committee to allow it to oversee the operations of the Scheme in greater detail. The Investment Committee (made up of Chair – Terry Downing, Ian Tarrant, Mick Doust and Peter Dodd) generally meets monthly to monitor the performance of the investment managers and oversee the work of the investment adviser. The Risk, Audit and Compliance Committee (made up of Chair – Kevin Murray, John Whelan, Mick Doust and Justin De Lorenzo), meet at least six times per year and reviews the internal controls and risk management of the Scheme and its service providers. Meetings of the Committee are also attended by a representative of the Scheme’s internal and external auditors.* The Board continually reviews the Scheme’s governance and compliance processes. * As at the date of publication, the Committee was made up of Mark Morey, Steve Butler, Kevin Murray and Justin De Lorenzo. Industry regulator The operations of the Scheme are supervised by the Australian Prudential Regulation Authority (APRA). Representatives of the Board meet APRA regularly, so as to keep the regulator informed about the activities of the Scheme. These meetings also provide an opportunity for the Board to hear APRA’s views about the superannuation industry generally. Indemnity insurance The Trustee is indemnified by a policy of insurance in respect of its duties as Trustee of the Scheme.
14

Energy Industries Superannuation Scheme divisions Pool A Trustee Pool B Trustee Accumulation Scheme (Division A) Includes former members of the First State Super Scheme
Retirement Scheme (Division B) Includes former members of the State Authorities Superannuation Scheme
Executive Scheme (Division E) Basic Benefit (Division C) Includes former members of the State Authorities Superannuation Scheme and the State Super Scheme
Includes former members of the Public Sector Executives Superannuation Scheme Rollover Plan and Account-Based Pension Plan (Division F)
Defined Benefit Scheme (Division D) Includes former members of the State Super Scheme
Electrical Contractors Scheme (Division N)
15

ABOUT THE SERVICE PROVIDERS The Trustee engages external experts such as investment advisers and investment managers, an administrator, a custodian, accountants, solicitors and auditors to assist it with its obligations. The Trustee reviews its service providers regularly and may from time to time make changes. Administrator The Administrator of the Scheme is FuturePlus Financial Services Pty Limited. The administrator attends to the day-to-day operation of the Scheme under a written service agreement. FuturePlus also employs salaried financial planners to assist members. FuturePlus is owned by EISS. The Trustee undertakes that it will not deal with FuturePlus more favourably than it would deal with any other independent service provider. Actuary Mercer Consulting (Australia) Pty Limited Auditor Audit Office of New South Wales Asset consultants Mercer Asset Consulting Cambridge Consulting Custodian JPMorgan Chase Bank (Sydney Branch). The custodian holds the Scheme’s assets under a written service agreement. Investment managers for the year ended 30 June 2012 AMP Capital Investors Ardea Investment Management Blackrock Investment Management Australia Charter Hall Funds Management Genesis Investment Management Goldman Sachs Asset Management Independent Asset Management Kapstream Capital Karara Capital LSV Asset Management Macquarie Investment Management Magellan Asset Management MFS Institutional Advisors Quentin Ayers Schroder Investment Management Australia Select Credit Union UBS Global Asset Management Valad Property Group Wilshire Private Markets Legal advisers DLA Piper
16

TAXES, FEES AND CHARGES General tax information Your Scheme is required to pay tax of up to 15% on all employer contributions1 received (including contributions made by way of Salary Sacrifice). Any tax payable in respect of these contributions is deducted from your account. Personal contributions made on an after-tax basis are not subject to tax. From 1 July 2005, the Federal Government abolished the surcharge payable on certain superannuation contributions. However, any debt accrued prior to this date is still payable and will be deducted from your account. The Australian Tax Office (ATO) determines the amount of surcharge (if any) which relates to your contributions. All surcharge amounts are deducted from your account and paid to the ATO on your behalf (except for the Retirement and Defined Benefit Schemes), which are held as a debt until the time your benefit is paid. Fees and other costs There are a number of fees levied by your Scheme. These include: Investment costs and expense recovery fee These are the fees and costs for investing the assets and for payment of certain other costs associated with operating your Scheme (full details of these types of fees can be found on our website or in your PDS). Note that investment management fees are not charged directly to your account. These fees are applied daily on the market value of the assets in each particular investment strategy and are deducted prior to the declaration of the relevant unit price or the striking of the Crediting Rate (in the case of Defined Benefit Selection). Administration fee The Trustee sets the administration fee at the level needed to recover the cost of administering a member’s account. Where applicable, this fee is charged on a monthly basis. A separate administration fee is not charged on Rollover Plan, Account-Based Pension Plan or the Defined Benefit (Division D) Scheme. The table below lists all fees charged to members’ accounts. For further details refer to the PDS, contact Member Services on 1300 369 901 or visit the website www.eisuper.com.au. Member protection If you are a protected member, any administration fee deducted from your account cannot exceed the earnings on your account balance in that financial year. This means that your account balance will not fall because of administration fees (excluding insurance and taxes). During the last financial year, account balances with less than $1,000 were protected. It is important to note that member protection will not fully apply in times of poor or negative returns, as Superannuation Law provides that the Scheme can charge a protected member a nominal administration fee of no more than the investment return, plus $10 in such times (subject to certain pre-conditions met by the Trustee).
17

Administration, other fees and insurance premiums charged in Pool A For the year ended 30 June 2012
Accumulation Scheme
Executive Scheme
Electrical Contractors Scheme
Rollover & Account-Based Pension plans
Administration fee: non contributing member 75c per week $3.00 per
month 75c per week N/A
Administration fee: contributing member 75c per week $6.33 per
month 75c per week N/A
Basic Death or Invalidity cover $15 per month $25 per
month2 $3.40 per week N/A
Benefit payment fee $20 per payment $30 per payment $20 per payment No charge
$30 per switch3
Optional investment switch in any financial year $20 per switch3 $20 per switch3 No charge
Voluntary insurance The cost will vary depending on the amount insured and other factors
N/A
1. Net of allowable deductions e.g. administration and insurance fees. 2. Only available to new members to the Scheme from 1 July 2005. 3. The first switch is free in any financial year. Any subsequent switches in that financial year are charged the stated amount. Investment fees charged in Pool A Accumulation, Executive and Electrical Contractors schemes Year ended 30 June 20121
Months High Growth Diversified Balanced Capital Guarded
Cash
July – February 0.67% 0.65% 0.63% 0.61% 0.56%
March - June 0.72% 0.70% 0.68% 0.66% 0.61% 1. Maximum 1 % fee applies for all investment options. Rollover and Account-Based Pension plans Year ended 30 June 20122
Months High Growth Diversified Balanced Capital Guarded Cash
July – February 1.00% 0.97% 0.92% 0.88% 0.72% March - June 0.94% 0.92% 0.90% 0.88% 0.72% 2. The Investment Fees include investment management, financial planning and account administration. Administration fees charged in Pool B
Retirement Scheme Defined Benefit Scheme Contributor Financed Benefit 75c per week N/A Other Contributions Account N/A N/A Deferred members 75c per week N/A
Investment fees charged in Pool B (accumulation accounts only) Retirement Scheme | Contributor Financed Benefit Year ended 30 June 20123
Month High Growth Growth Diversified Balanced Capital Guarded Cash
July - February 0.24% 0.23% 0.22% 0.20% 0.18% 0.13% March - June 0.21% 0.21% 0.20% 0.18% 0.15% 0.11% 3. A maximum 0.55% fee applies for the Contributor Financed Benefit.
18
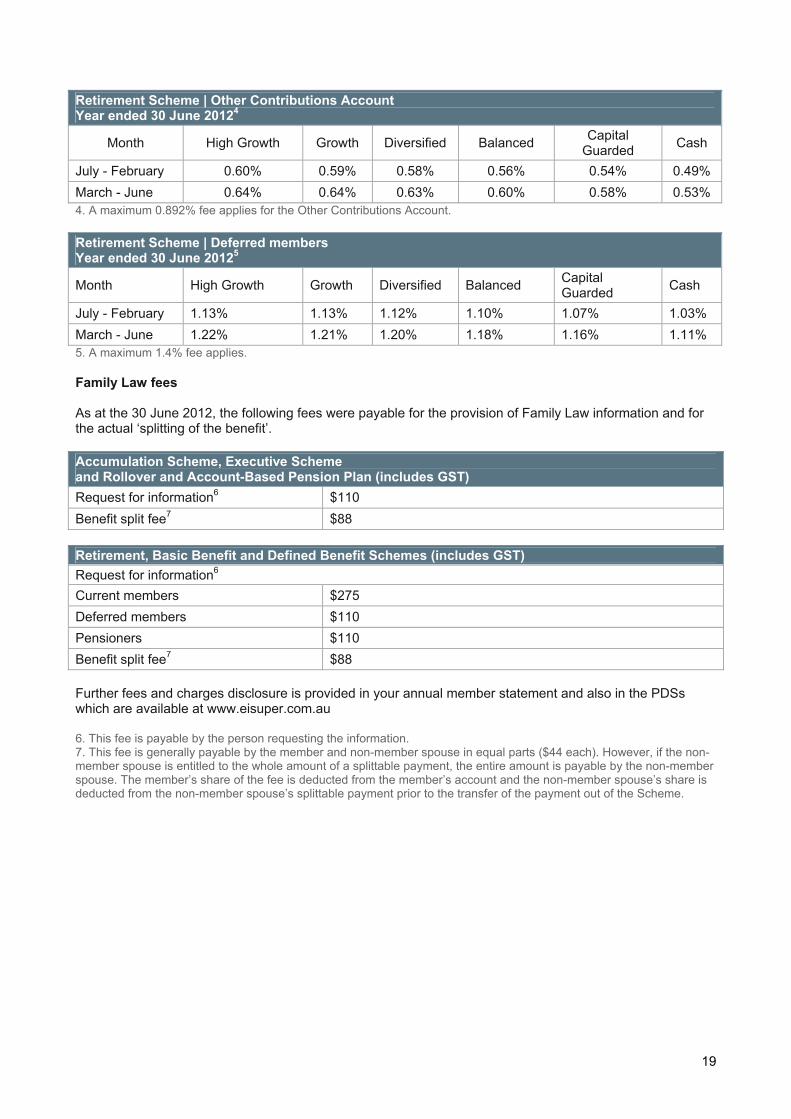
Retirement Scheme | Other Contributions Account Year ended 30 June 20124
High Growth Growth Diversified Balanced Capital Guarded Cash Month
July - February 0.60% 0.59% 0.58% 0.56% 0.54% 0.49% March - June 0.64% 0.64% 0.63% 0.60% 0.58% 0.53% 4. A maximum 0.892% fee applies for the Other Contributions Account. Retirement Scheme | Deferred members Year ended 30 June 20125
High Growth Growth Diversified Balanced Capital Guarded Cash Month
July - February 1.13% 1.13% 1.12% 1.10% 1.07% 1.03% March - June 1.22% 1.21% 1.20% 1.18% 1.16% 1.11% 5. A maximum 1.4% fee applies. Family Law fees As at the 30 June 2012, the following fees were payable for the provision of Family Law information and for the actual ‘splitting of the benefit’. Accumulation Scheme, Executive Scheme and Rollover and Account-Based Pension Plan (includes GST) Request for information6 $110 Benefit split fee7 $88 Retirement, Basic Benefit and Defined Benefit Schemes (includes GST) Request for information6
Current members $275 Deferred members $110 Pensioners $110 Benefit split fee7 $88 Further fees and charges disclosure is provided in your annual member statement and also in the PDSs which are available at www.eisuper.com.au 6. This fee is payable by the person requesting the information. 7. This fee is generally payable by the member and non-member spouse in equal parts ($44 each). However, if the non-member spouse is entitled to the whole amount of a splittable payment, the entire amount is payable by the non-member spouse. The member’s share of the fee is deducted from the member’s account and the non-member spouse’s share is deducted from the non-member spouse’s splittable payment prior to the transfer of the payment out of the Scheme.
19

FINANCIAL STATEMENTS Below is a summary of EISS’s financial statements. The complete Financial Report for both Pool A and B including the Auditor’s Report is available on request by calling Member Services on 1300 369 901 or by going to our website www.eisuper.com.au. Pool A Operating Statement for the year ended 30 June 2012
30 June 12($ ‘000)
30 June 12 ($ ‘000)
Revenue Net investment revenue 50,765 110,503 Employer contributions 153,589 144,210 Member contributions 2,704 2,799 Transfers in 112,312 129,180 Total revenue 319,370 386,692Less outgoings Administrative expenses 10,935 9,116 Contributions surcharge - 3 Income tax expense 25,167 26,625 Total outgoings 36,102 35,744Benefits accrued as a result of operations 283,268 350,948
Statement of Financial Position for the year ended 30 June 2012
30 June 12 ($ ‘000)
30 June 12 ($ ‘000)
Investments Short-term investment – 445 Unit trusts 1,474,971 1,316,441 Total investments 1,474,971 1,316,886Other assets Cash 38,400 27,030 Receivables 57 50 Deferred tax assets 12,901 12,828 Total assets 1,526,329 1,356,794Less liabilities Payables 1,925 1,596 Current tax liability 13,300 13,850 Total liabilities 15,225 15,446Net assets available to pay benefits 1,511,104 1,341,348
20

Pool B Statement of changes in net assets for the year ended 30 June 2012
30 June 12 ($ ‘000)
30 June 12 ($ ‘000)
Revenue Net investment revenue 16,644 199,479 Employer contributions 152,237 154,541 Member contributions 2,189 2,650 Transfers in 1,482 2,468 Total revenue 172,552 359,138Less outgoings Benefits paid 136,276 136,153 Administrative expenses 10,372 9,680 Contributions surcharge (64) 2 Income tax expense 21,807 39,357 Total outgoings 168,391 185,192Increase in net assets 4,161 173,946 Statement of net assets for the year ended 30 June 2012
30 June 12 ($ ‘000)
30 June 12 ($ ‘000)
Investments Unit trusts 1,931,212 1,943,989Total investments 1,931,212 1,943,989Other assets Cash 13,383 15,540 Receivables 462 123Deferred tax assets 34,586 34,401 Total assets 1,979,643 1,994,053Less liabilities Payables 292 3,273Current tax liability 11,249 26,839 Total liabilities 11,541 30,112Net assets available to pay benefits 1,968,102 1,963,941 Energy Investment Fund The Energy Investment Fund (EIF) is a wholesale investment trust. The majority of the Scheme assets are invested through EIF. The investment pool of EIF is allocated across a range of investment managers. Investment managers (and/or their weightings) are changed at appropriate times.
21

MORE INFORMATION Complaints With our focus on quality service and transparency, the Trustee is committed to ensuring that any enquiries or complaints are handled courteously and promptly. We hope that you will always receive satisfactory service from your Scheme and that all your enquiries are promptly attended to. However, if you are dissatisfied with the service you are receiving, you may lodge a formal complaint. This should be made in writing to: Complaints Resolution Officer Energy Industries Superannuation Scheme PO Box N835 Grosvenor Place NSW 1220 The Complaints Resolution Officer will consider your complaint on behalf of the Trustee and provide you with a response as soon as possible. If you are not satisfied with the response, or your complaint has not been resolved within 90 days, you have the option of referring your complaint to the Superannuation Complaints Tribunal. The Tribunal is an independent body established by the Commonwealth Government to review certain types of decisions. The contact details are: Superannuation Complaints Tribunal Locked Bag 3060 Melbourne VIC 3001 Tel: 1300 884 114 Pool A reserves The Scheme operates the following reserves in Pool A. Operational Risk Reserve The Operational Risk Reserve was established on 30 June 2008 to cover the risk of loss from inadequate or failed internal processes, people and systems or from external events. Unit Pricing Equalisation Reserve (UPER) UPER operates for the purpose of allowing reimbursement to members who have been disadvantaged by an error or anomaly to the unit price they have been allocated and that amount cannot be recovered from external sources. The maximum amount that may be maintained in this reserve for this purpose is 0.3% of assets. If the reserve exceeds this figure for any reason, that excess amount may be credited to the earnings and distributed to members.
22

Administration and tax reserves Deductions are made from members’ accounts and investment earnings to pay for the Scheme’s income tax liabilities and operational expenses. These deductions are set out in this report. The administration and tax reserves are invested in cash and applied towards the expenses they relate to as and when they become payable. Changes to the balance held in each of the above mentioned reserve accounts as at 30 June for the last three years are as follows: Year DORI1
($’000) UPER2
($’000) Admin ($’000)
Tax ($’000)
Operational Risk3 ($’000)
2010 (882) 74 11 (1,450) 947 2011 - 113 17 (185) 122 2012 - 111 17 (150) 122 Reserves The assets which support these reserves are held effectively in cash, either in a bank account, a cash management account or as a cash investment in a unit trust. Derivatives Derivatives are used to adjust the weightings of the various portfolios in line with your Scheme’s overall investment strategy. Various derivatives may be applied, such as futures and options. Strict investment guidelines detail all limits approved on the use of derivatives are in place. Currency hedging activities are also carried out in relation to the international equities portfolio, within strictly defined parameters. Derivatives can also be used to protect against possible adverse moves in the markets, to implement tactical asset allocations, or to enter or exit the market at a defined price level. Under no circumstances can they be used to gear the investment portfolio or be used for speculative trading. Various managers in EIF have, at times, made use of derivatives as part of their portfolio management activities during 2011/12. The Trustees require that all derivatives positions are (a) fully cash covered; (b) are offset to existing assets; or (c) are used to alter the exposures in underlying asset classes. Eligible Rollover Fund An Eligible Rollover Fund (ERF) is a fund which is established for the purpose of accepting and protecting benefits in respect of members of superannuation funds. If transferred to an ERF, a member ceases to have any rights which he or she previously had against the transferring fund. The Trustee has nominated ‘Australia’s Unclaimed Super Fund’ (AUSfund) as the ERF to which such members’ benefits may be paid4. Contact details are as follows: AUSfund Administration PO Box 2468 Kent Town SA 5071 Ph: 1300 361 798 Fax: 1300 366 233 The Trustee will transfer a benefit to the nominated ERF in circumstances where a benefit is split under family law. A benefit may also be transferred to that ERF for inactive accounts (where no superannuation contributions are being made) with less than $400. 1. Death and invalidity reserve. 2. Unit pricing equalisation reserve. 3. Established on 30 June 2008. 4. Industry Funds Investments Limited (IFI) - ABN 17 006 883 227, AFSL 229881 is the Responsible Entity of AUSfund, Australia’s Unclaimed Super Fund - ABN 85 945 681 973U.
23

IMPORTANT CHANGES 2012 Federal Budget The following is a summary of the super-related measures that were announced in the 2012 Federal Budget. Concessional super contributions There are caps on the amount you can contribute to super, with contributions beyond these limits attracting extra tax. If you’re under age 50 the annual concessional contributions cap is and remains at $25,000. No change. However, plans for a higher cap for some people over 50 have been deferred. For people aged 50 and over with super balances under $500,000, the annual cap was to be $50,000 from 1 July 2012. The start date for this measure has now been pushed out to 1 July 2014. This means that for 2012-13 and 2013-14 there will be a concessional contributions cap of $25,000 applicable to everyone. Concessional contributions exceeding this cap incur an excess contributions tax of 31.5%. Limit on tax offsets for ETP ‘golden handshakes’ An ETP is an Employer Termination Payment and can include payment types that fall under the banner of ‘golden handshakes’. As a Budget measure, concessional tax rates on ETP golden handshakes will only be available where the person’s total annual taxable income (including the ETP) is no more than $180,000. Amounts above this whole-of-income cap will be taxed at marginal rates. Existing arrangements will be retained for certain ETPs relating to genuine redundancy (including to those aged 65 and over), invalidity, compensation due to an employment related dispute and death. Due to the complexity of this issues involved, if you’re retiring in early 2012-13 you should consider seeking financial advice. Increased contributions tax for very high income earners People on incomes* greater than $300,000 will pay more tax on concessional super contributions, with the rate increased from 15% to 30%. In turn, this will reduce the tax concession on those contributions from 30% to 15%, bringing it more in-line with the concession received by average income earners. Tax treatment of excessive concessional contributions – that is, contributions made above the $25,000 cap – remains the same. * ‘Income’ means taxable income, concessional super contributions, adjusted fringe benefits, net investment loss, target foreign income, tax-free government pensions and benefits, less child support.
Changes to co-contributions Announced separate to the Budget, there are planned reductions to the government co-contributions scheme for personal contributions made from 1 July 2012. Year of entitlement
Maximum entitlement
Matching rate Lower threshold
Higher threshold
2011-12 $1,000 100% $31,920 $61,920 2012-13 $500 50% $31,920 $46,920 Note: the ‘Important changes’ section refers to several Government proposals, some of which had not been enacted into law at the time of writing.
24
25