Embed Size (px)
Citation preview

1
ELE 101/102Dept. of E&E, MIT Manipal L2-1
Lecture #2Lecture #2
Outline• Generation Subsystem
Sources of EnergyTypes of Generating Stations
– Hydel– Thermal– Nuclear– Non-conventional options
Additional Resources• http://www.powermin.nic.in
ELE 101/102Dept. of E&E, MIT Manipal L2-2
Power Sector at a GlancePower Sector at a Glance
Total Installed Capacity (All India):Sector MVA %
State Sector 70,224 56.2Central Sector 40,464 32.4Private Sector 14,139 11.4
Total 1, 24,827 MVA

2
ELE 101/102Dept. of E&E, MIT Manipal L2-3
Generating StationsGenerating Stations
Type Capacity (MVA) %Thermal 82,410 66.0
Coal 68,519 54.8Gas 12,690 10.2Oil 1,201 1.0
Hydro 32,326 25.9Nuclear 3,900 3.1Renewable 6,191 5.0Total 1, 24,827 MVA
ELE 101/102Dept. of E&E, MIT Manipal L2-4
Primary Sources of EnergyPrimary Sources of Energy
Fossil Fuel• Coal, Oil, and Natural Gas
Renewable Energy• Water, Solar, Wind, Wave, Tidal,
Geo-thermal etcNuclear Energy

3
ELE 101/102Dept. of E&E, MIT Manipal L2-5
Coal Fired Power PlantCoal Fired Power Plant
ELE 101/102Dept. of E&E, MIT Manipal L2-6
Indian Coal QualityIndian Coal Quality
Coal67166
Gas11840
Diesel1196
Hydro30135
Nuclear2720
Wind2488
•Coal reserves: > 250 years at present levels of consumption
•High ash: 25%-45%•Low sulfur < 0.5%•Low energy content•CO2 emissions > 1 kg per kWh•Issues:
Ash generation > 200 Million TonsCO2 emissions > 850 Million Tons

4
ELE 101/102Dept. of E&E, MIT Manipal L2-7
Thermal Power StationsThermal Power Stations
Coal Fired• Turbo alternators driven by steam turbine
Oil Fired• Crude oil OR Residual oil
Gas Fired• Fastest growing primary fuel, worldwide• Combined cycle • First stage - Gas turbine & Second stage - Steam Turbine
Diesel Fired• IC Engine as prime mover• Standby power plants
ELE 101/102Dept. of E&E, MIT Manipal L2-8
Coal Fired Power Plant Coal Fired Power Plant -- SchematicSchematic

5
ELE 101/102Dept. of E&E, MIT Manipal L2-9
Combined cycle gas fired Combined cycle gas fired Power Station Power Station -- SchematicSchematic
ELE 101/102Dept. of E&E, MIT Manipal L2-10
Hydroelectric Generating StationsHydroelectric Generating Stations

6
ELE 101/102Dept. of E&E, MIT Manipal L2-11
Hydro PowerHydro Power
7750077500FRANCE2208382237INDIA2722984500JAPAN27528121824NORWAY44000160500RUSSIA65000204300CHINA57517285603BRAZIL79511319484USA66954341312CANADA4000527000TAJIKISTAN
INSTALLED CAPACITY (GW)
POWER CAPACITY (GW)
COUNTRY
ELE 101/102Dept. of E&E, MIT Manipal L2-12
Major Generating UnitsMajor Generating Units
770ANDHRA PRADESHSRISAILAM
810KARNATAKAKALINADI
891KARNATAKASHARAVATHY
990HIMACHAL PRADESHDEHAR
920MAHARASHTRAKOYNA
960ANDHRA PRADESHNAGARJUNA
1100PUNJABBHAKRA
CAPACITY (MW)STATENAME
Three Gorges Project, China: 26 * 700 MW = 18.2 GW
7
ELE 101/102Dept. of E&E, MIT Manipal L2-13
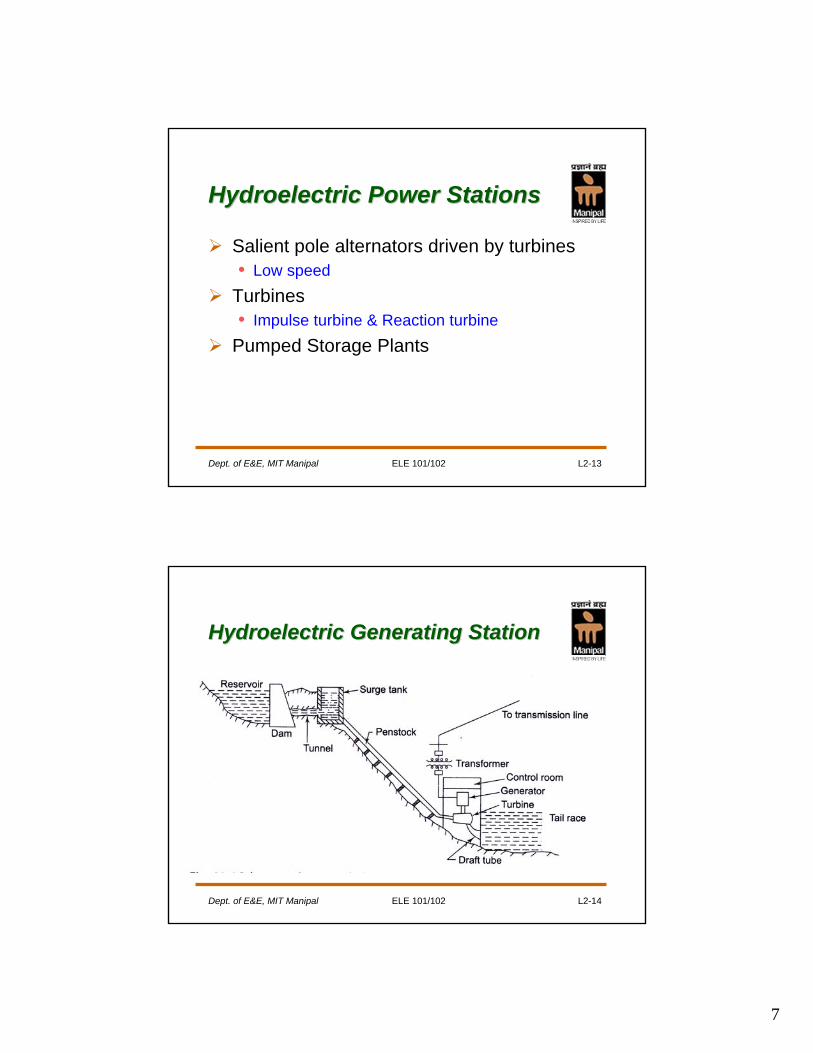
Hydroelectric Power StationsHydroelectric Power Stations
Salient pole alternators driven by turbines• Low speed
Turbines• Impulse turbine & Reaction turbine
Pumped Storage Plants
ELE 101/102Dept. of E&E, MIT Manipal L2-14
Hydroelectric Generating StationHydroelectric Generating Station

8
ELE 101/102Dept. of E&E, MIT Manipal L2-15
Pumped Storage PlantPumped Storage Plant
ELE 101/102Dept. of E&E, MIT Manipal L2-16
ItaipuItaipu DamDam (12,600 MVA)(12,600 MVA)Brazil & Paraguay Brazil & Paraguay

9
ELE 101/102Dept. of E&E, MIT Manipal L2-17
Nuclear Power StationNuclear Power Station
ELE 101/102Dept. of E&E, MIT Manipal L2-18
Nuclear FissionNuclear FissionNatural Uranium: with 0.72%
Enriched Uranium: 2-3 %
238 235 23492 92 92, ,U U U
140 93 156 36 0
235 1 236 144 90 192 0 92 54 38 0
144 90 155 37 0
3
2
2
Ba Kr n
U n U Xe Sr n
Cs Rb n
⎡ ⎤+ +⎢ ⎥⎢ ⎥+ → → + +⎢ ⎥
+ +⎢ ⎥⎣ ⎦
23592 U
23592 U

10
ELE 101/102Dept. of E&E, MIT Manipal L2-19
Nuclear ReactorsNuclear ReactorsFissile MaterialModerator• D2O, Graphite
Control rods• Boron OR Cadmium
Fast Breeder Reactors • Liquid metal (alloy of Na & K) is coolant
235 23992 94,U Pu
238 1 239 238 23992 0 92 93 94U n U Np Puβ β+ → − → − →
ELE 101/102Dept. of E&E, MIT Manipal L2-20
Nuclear Power Station Nuclear Power Station -- SchematicSchematic

11
ELE 101/102Dept. of E&E, MIT Manipal L2-21
220 MW 220 MW CalandriaCalandria
ELE 101/102Dept. of E&E, MIT Manipal L2-22
Fuel BundlesFuel Bundles
Produces energy equivalent to burning coal by weight 2 million times

12
ELE 101/102Dept. of E&E, MIT Manipal L2-23
ELE 101/102Dept. of E&E, MIT Manipal L2-24
NonNon--conventional Power Stationsconventional Power Stations
Wind power stationsSolar power plantsMicro hydel power plantsGeothermal power stationsTidal power stationsBio-mass power plant

13
ELE 101/102Dept. of E&E, MIT Manipal L2-25
BiomassBiomass
Rice husk, sugarcane bagasse
Wood chips, mulberry, coconut shells
Examples
1000 MW5,000 MWProcessing residues
50 MW17,000 MWAgro-forest residues
InstalledPotentialFeedstock
Decentralized generation
ELE 101/102Dept. of E&E, MIT Manipal L2-26
Wind PowerWind Power

14
ELE 101/102Dept. of E&E, MIT Manipal L2-27
Wind Power GenerationWind Power Generation
Wind Turbine operates at 30 to 60 rpmIndia 5th in the world
ELE 101/102Dept. of E&E, MIT Manipal L2-28
Wind map IndiaWind map India

15
ELE 101/102Dept. of E&E, MIT Manipal L2-29
Off Shore Wind Power PlantOff Shore Wind Power Plant
ELE 101/102Dept. of E&E, MIT Manipal L2-30
Solar PowerSolar Power
20 MW/ sq. km.Cost per watt - Rs. 150-200Basic Element - 0.496 V, 1 WPanel rating - 36 W;70 W etcOutput voltage - 18 V/12 V/6 V

16
ELE 101/102Dept. of E&E, MIT Manipal L2-31
200 kW Grid Interactive 200 kW Grid Interactive Solar Power PlantSolar Power Plant
ELE 101/102Dept. of E&E, MIT Manipal L2-32
Solar Thermal Power PlantSolar Thermal Power Plant
10 MW Solar Thermal Electric Power Plant. Daggett, CA

17
ELE 101/102Dept. of E&E, MIT Manipal L2-33
Small Hydro Power StationsSmall Hydro Power Stations
Total estimated global potential of 180000 MWChina has 43000 small hydro-electric power stations3000 MW of small hydro capacity in operation in the USATechnical potential in India is 6800 MWDecentralized Generation
ELE 101/102Dept. of E&E, MIT Manipal L2-34
Small Hydro in IndiaSmall Hydro in India
599.47MAHARASHTRA
652.51KARNATAKA
1207.27JAMMU & KASHMIR
1472.93UTTAR PRADESH & UTTARANCHAL
1624.78HIMACHAL PRADESH
1059.03ARUNACHAL PRADESH
TOTAL CAPACITY (MW)STATE

18
ELE 101/102Dept. of E&E, MIT Manipal L2-35
Case Study Case Study –– Micro Micro HydelHydel
Irrigation canals in PunjabLow head water fallsTotal Power Potential 130 MW
ELE 101/102Dept. of E&E, MIT Manipal L2-36
Case Study Case Study –– Micro Micro HydelHydel

19
ELE 101/102Dept. of E&E, MIT Manipal L2-37
Case Study Case Study –– Micro Micro HydelHydel
ELE 101/102Dept. of E&E, MIT Manipal L2-38
Case Study Case Study –– Micro Micro HydelHydel

20
ELE 101/102Dept. of E&E, MIT Manipal L2-39
Indian Energy Scenario byIndian Energy Scenario by 20152015
Gas14.49%
Diesel0.48%
Nuclear14.60%
Hydro15.96%
Solar thermal0.40%
Biomass1.19%
Wind1.99%
Coal50.90%
ELE 101/102Dept. of E&E, MIT Manipal L2-40
SummarySummary
Conventional Power Plants are:• Thermal – Finite Fossil Fuels, Pollution• Large Hydro – Ecological & Displacement Issues• Nuclear – Radio active waste disposal
Use of Non-conventional/ Renewable energy• Micro-hydel, Wind, Biomass
Economical viability More Nuclear Power Plants Conservation of powerControlled Fusion Reaction – Is it the solution?


