Embed Size (px)
Citation preview
Electrical Design, Implementation and Commissioning of a
LabVIEW Based Control System for a Dual Axis Solar Tracker
Matthew Robert Wilson
Bachelor of Engineering (Hon)
School of Engineering and Information Technology
Murdoch University
2015

I. Declaration
I Mathew Robert Wilson, hereby declare that all parts of this thesis paper entitled ‘Electrical
Design, Implementation and Commissioning of a LabVIEW Based Control System for a Dual Axis
Solar Tracker’ are the result of my own work except where cited.

This page has intentionally been left blank
iv
II. Abstract
This thesis outlines the implementation and commissioning of a LabVIEW based, dual axis solar
tracking system located within Murdoch University’s Renewable Energy Outdoor Test Area.
An electrical system that is capable of supplying power to the solar tracking hardware and
protecting it from the effects of overcurrent has been designed, installed and tested according
to several Australian Standards including the AS3000 Wiring Rules. The testing of the electrical
system proved that the installation was both safe and reliable and as such it was connected to
the existing Murdoch University electricity grid.
The commissioning of the solar tracking hardware proved to be problematic with various
issues delaying the progression of the project including damage to one of the main
servomotors resulting in the need for a replacement motor, corruption of VSD parameter files
and the transposition of phases during the connection of one of the motors.
A plan for testing the accuracy of the solar tracking LabVIEW program was developed using a
pyrheliometer. Extensive testing was carried out on the tracker which ultimately confirmed the
accuracy of the solar positioning algorithm. However, it was discovered that further angle
conversions will need to take place in order to make the software useable on a fixed east-west
primary axis solar array.
Overall the project has been taken from a bench tested prototype to being implemented in a
real world environment. A major step forward in the progression of this project has occurred
during this thesis and it is for this reason that the project has been considered successful by
both the current project holder and the project supervisor.

v
III. Acknowledgements
I would like to take this opportunity to thank the following people who have been on this
journey with me. Firstly, my loving wife Rebekka who has supported me and encouraged me
throughout my studies. My daughter Isabelle, who has been an amazing source of joy and
encouragement over the last two years. I would like to thank the lecturers of the school of
Engineering at Murdoch University, for their untiring efforts and dedication. Special thanks to
my thesis supervisor Graeme Cole for his support through this project and his contagious
enthusiasm for engineering. Thanks to the schools technical staff including Jeff Laava, Will
Stirling and John Boulton for their assistance throughout this project and throughout my
degree. Steven Vulin, applications engineer at SEW EURODRIVE for providing technical help
where needed. Tristan Squire, for assistance with the welding required in this project. Special
thanks to Josh McCann and Piers Klugman for their assistance in the proof-reading and editing
of this document. Finally, a huge thanks to all of the students that I have had the joy of
studying with over the course of my degree. You have all made the last four years very
enjoyable.

vi
IV. List of Contents I. Declaration ................................................................................................................................. ii
II. Abstract .....................................................................................................................................iv
III. Acknowledgements .................................................................................................................. v
IV. List of Contents ........................................................................................................................vi
V. List of Figures ............................................................................................................................ ix
VI. List of Tables............................................................................................................................. x
VII. Glossary ................................................................................................................................... xi
Chapter 1 Introduction............................................................................................................... 1
1.1 Project Introduction ...................................................................................................... 1
1.2 Document Structure ...................................................................................................... 2
Chapter 2 Project Overview ....................................................................................................... 4
2.1 Project History ............................................................................................................... 4
2.2 Solar Tracking Systems .................................................................................................. 6
2.3 Project Aims & Objectives ............................................................................................. 7
2.4 Standards & Regulations ............................................................................................... 8
Chapter 3 Hardware & Software .............................................................................................. 10
3.1 Major System components ......................................................................................... 10
3.1.1 Synchronous Servo Motors ................................................................................. 10
3.1.2 Tilt Motor ............................................................................................................ 11
3.1.3 Roll Motor ........................................................................................................... 12
3.1.4 Gear System ........................................................................................................ 13
3.1.5 Resolver System .................................................................................................. 14
3.1.6 SEW MDX 61B Variable Speed Drives ................................................................. 16
3.2 Minor System Components ......................................................................................... 16
3.3 Software ...................................................................................................................... 17
3.3.1 Movitools Motionstudio ...................................................................................... 17
3.3.2 National Instruments LabVIEW ........................................................................... 17
Chapter 4 Electrical Design, Construction & Installation ......................................................... 18
4.1 Array Location and Layout .......................................................................................... 18
4.2 Supply Requirements .................................................................................................. 19
4.3 Wiring Systems ............................................................................................................ 19
4.3.1 Electrical .............................................................................................................. 19
4.3.2 Communications ................................................................................................. 21

vii
4.4 System Protection ....................................................................................................... 25
4.4.1 Overcurrent Protection ....................................................................................... 25
4.4.2 R.C.D Protection .................................................................................................. 26
4.4.3 Isolation ............................................................................................................... 26
4.5 Earthing System ........................................................................................................... 27
4.5.1 Multiple Earthed Neutral (M.E.N) Connection .................................................... 28
4.5.2 Earthing Bonds .................................................................................................... 30
4.6 Temporary Installation of ROLL Motor ....................................................................... 31
4.7 24V Control Switches .................................................................................................. 32
4.8 Enclosure ..................................................................................................................... 33
4.8.1 Physical Size and VSD Installation Specifications ................................................ 33
4.8.2 Ingress Protection ............................................................................................... 34
4.8.3 Ventilation ........................................................................................................... 35
4.8.4 Internal Components .......................................................................................... 36
4.8.5 Framework .......................................................................................................... 37
Chapter 5 Electrical Testing ..................................................................................................... 39
5.1 Visual Inspections ........................................................................................................ 39
5.2 Testing Instruments..................................................................................................... 39
5.2.1 DMM.................................................................................................................... 39
5.2.2 Insulation Continuity Tester ................................................................................ 39
5.3 Mandatory Tests ......................................................................................................... 40
5.3.1 Continuity of Earthing System ............................................................................. 41
5.3.2 Insulation Resistance ........................................................................................... 43
5.3.3 Polarity ................................................................................................................ 45
5.3.4 Correct Circuit Connections ................................................................................ 46
5.3.5 Earth Fault Loop Impedance ............................................................................... 46
Chapter 6 Commissioning ........................................................................................................ 48
6.1 Manual Control Using Movitools Motionstudio ......................................................... 48
6.1.1 F14: Encoder Fault ............................................................................................... 49
6.1.2 F43: RS485 – Timeout / ST1 Fault ....................................................................... 50
6.1.3 F8: Speed Monitoring .......................................................................................... 53
6.2 Existing LabVIEW Program Testing and Improvements .............................................. 55
6.2.1 Plan for Testing the Solar Tracker ....................................................................... 55
6.2.2 Current Layout of the Program ........................................................................... 57

viii
6.2.3 Reference Position .............................................................................................. 58
6.2.4 Offset & Multiplier .............................................................................................. 59
6.2.5 Logging Loop ....................................................................................................... 60
6.2.6 Analysis of SPA Output ........................................................................................ 61
6.2.7 Solar Tracking Accuracy ....................................................................................... 65
Chapter 7 Future Recommendations ....................................................................................... 68
7.1 Possible Array Options ................................................................................................ 68
7.2 Reference Mode Options ............................................................................................ 71
7.3 Limit Switches .............................................................................................................. 72
7.4 Emergency Stops ......................................................................................................... 72
7.5 Control Terminal Options ............................................................................................ 72
7.6 Motor Cover ................................................................................................................ 73
7.7 LabVIEW Software Improvements .............................................................................. 74
7.7.1 Implementing Angle Conversions ....................................................................... 74
7.7.2 Software Limits .................................................................................................... 74
7.7.3 Jog Mode ............................................................................................................. 74
7.7.4 Night, Wind and Cleaning Stow ........................................................................... 74
7.8 Wind Anemometer ...................................................................................................... 75
Chapter 8 Conclusion ............................................................................................................... 76
Works Cited ................................................................................................................................. 78
Appendix A Locating Drives on Serial Bus ................................................................................... 81
Appendix B Location of Array ...................................................................................................... 82
Appendix C Electrical System Circuit & Wiring Diagram ............................................................. 83
Appendix D 24V Toggle Switches ................................................................................................ 85
Appendix E Visual Inspection Results .......................................................................................... 87
Appendix F SEW Technical Support Emails ................................................................................. 89
Appendix G SPA Test Data Output .............................................................................................. 92
Appendix H Guide to the Electronic Attachment ........................................................................ 93

ix
V. List of Figures
Figure 1-1 (Document Layout) ...................................................................................................... 3
Figure 3-1 (Helical Worm Gear) [19] ........................................................................................... 13
Figure 3-2 (Electrical Resolver) [21] ............................................................................................ 15
Figure 4-1 (Layout of Installation) [23] ........................................................................................ 18
Figure 4-2 (Wiring of TILT Motor) ............................................................................................... 21
Figure 4-3 (TILT Motor 12-Pin Connector) .................................................................................. 24
Figure 4-4 (ROLL Motor Terminal Box) ........................................................................................ 24
Figure 4-5 (Isolation Point at Existing Switchboard) ................................................................... 27
Figure 4-6 (Isolation Point at New Electrical Enclosure) ............................................................. 27
Figure 4-7 (Earthing System Design) ........................................................................................... 28
Figure 4-8 (Earth Fault Loop) ....................................................................................................... 29
Figure 4-9 (Existing M.E.N Connection) ...................................................................................... 30
Figure 4-10 (Existing Earthing Electrode) .................................................................................... 31
Figure 4-11 (Temporary Installation of ROLL Motor) .................................................................. 32
Figure 4-12 (VSD Mount) ............................................................................................................. 34
Figure 4-13 (Vent) ....................................................................................................................... 36
Figure 4-14 (Vent Dust Filter) ...................................................................................................... 36
Figure 4-15 (Enclosure Fan) ......................................................................................................... 36
Figure 4-16 (DIN and Ducting) ..................................................................................................... 37
Figure 4-17 (Enclosure Components) .......................................................................................... 37
Figure 4-18 (Enclosure Framework) ............................................................................................ 38
Figure 4-19 (Mounted Enclosure) ............................................................................................... 38
Figure 5-1 (Kyoritsu Insulation Continuity Tester Model 3132) .................................................. 40
Figure 5-2 (Testing Sequence) ..................................................................................................... 41
Figure 6-1 (Damaged Encoder).................................................................................................... 50
Figure 6-2 (ST1 Fault Popup Window)......................................................................................... 51
Figure 6-3 (Pyrheliometer) .......................................................................................................... 56
Figure 6-4 (Pyrheliometer Mount) .............................................................................................. 57
Figure 6-5 (Pyrheliometer Target) ............................................................................................... 57
Figure 6-6 (Zenith Data Comparison SPA vs. U.S Naval Observatory) ........................................ 62
Figure 6-7 (Azimuth, Zenith and Altitude as They Relate to an Observer) [33] .......................... 63
Figure 6-8 (Azimuth Data Comparison SPA vs. U.S Naval Observatory) .................................... 64
Figure 6-9 (Comparison of Altered and Unaltered Azimuth Data) ............................................. 65
x
Figure 6-10 (Example of an Irradiance vs Time Test) .................................................................. 66
Figure 7-1 (Mirrors Available in ROTA Compound) ..................................................................... 69
Figure 7-2 (Spare Array Framework) ........................................................................................... 69
Figure 7-3 (Spare PV Troughs) ..................................................................................................... 70
Figure 7-4 (Wind Anemometer Installed on Adjacent CSP System) ........................................... 75
VI. List of Tables
Table 2-1 (Tracking Performance Comparison) ............................................................................ 6
Table 3-1 (CFM71S Technical Data) [17] ..................................................................................... 11
Table 3-2 (TILT Motor Nameplate) [17] ...................................................................................... 11
Table 3-3 (DFS56M Technical Data) [17] ..................................................................................... 12
Table 3-4 (Roll Motor Nameplate) [17] ....................................................................................... 12
Table 4-1 (Communications Cable Specifications) ...................................................................... 22
Table 4-2 (DE-9 Connector Configuration) .................................................................................. 23
Table 4-3 (Resolver Wiring) ......................................................................................................... 24
Table 4-4 (Overcurrent Protection Selection Criteria) ................................................................ 26
Table 5-1 (Earth Continuity Test Results) .................................................................................... 43
Table 5-2 (Insulation Resistance Test Results) ............................................................................ 44
Table 5-3 (Earth Fault Loop Impedance Test Results) ................................................................. 47

xi
VII. Glossary
AC Alternating Current
CCW Counter Clock Wise
COMM Communications
CSP Concentrated Solar Power
CW Clock Wise
DAQ Data Acquisition
DC Direct Current
DMM Digital Multimeter
HMI Human Machine Interface
I/O Input/Output
IP Ingress Protection
M.E.N Multiple Earthed Neutral
NI National Instruments
PV Photovoltaic
ROLL East to West Rotation
ROTA Renewable Outdoor Test Area
SPA Solar Positioning Algorithm
TILT North to South Rotation
USB Universal Serial Bus
UV Ultraviolet
VI Virtual Instrument

This Page has intentionally been left blank

1
Chapter 1 Introduction
1.1 Project Introduction
The use of solar energy is an environmentally sustainable way to supply electricity to many
Australian domestic, commercial and industrial installations. The uptake of solar power in
Australia has increased rapidly over the last 7 years with over 1 million rooftop solar systems
being installed throughout Australia since 2007 [1]. Despite this growth there is still reluctance
from government bodies and industry to move towards developing large scale power plants
that rely on solar technology. One technology that is being developed that has the potential to
be used for large scale power plants is Concentrated Solar Power (CSP). This technology uses
mirrors to concentrate the sun’s rays onto a Photovoltaic (PV) receiver or can also be used to
heat fluid that drives a steam turbine [2]. In order for this technology to become more
economically viable and thus more likely to be supported, complex control systems have been
developed to help maximise the energy harvested from CSP arrays by tracking the sun’s
movements throughout the day. In fact, the use of a dual axis tracking systems can increase
the power generated by a solar array by an average of between 25-40% [3].
The project that has been undertaken as part of this thesis has been a continuation of previous
thesis work under taken by Rhyss Edwards [4], Jarrod Sibson [5] and Gregorius Gazali [6]. The
project will aim to implement and test a LabVIEW based dual axis solar tracking control
system, including the design, installation and testing of the electrical systems required. This
system calculates the sun’s precise location based upon an algorithm developed by the
National Renewable Energy Laboratory [4]. Using data calculated from this algorithm, the
project aims to track the sun using two SEW EURODRIVE branded synchronous servomotors
connected to two SEW EURODRIVE branded variable speed drives.

2
It is important to note that the project has been undertaken more for its educational value
rather than as the end product of having a functional solar tracker. This project provides
exposure to a wide variety of research options and previously un-used hardware and software.
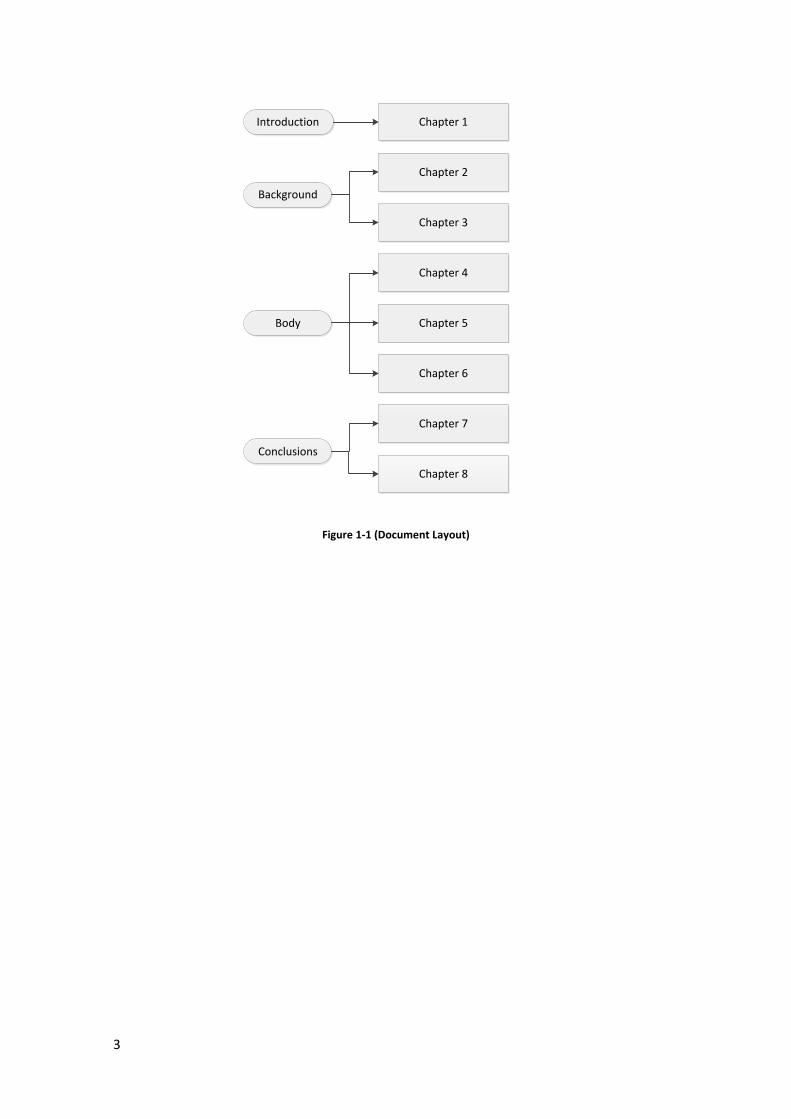
1.2 Document Structure
This document is separated into chapters for ease of reference. These chapters can be further
segregated into four categories introduction, background, body and conclusion, as shown in
Figure 1-1. The introduction to the project is given in chapter 1; this introduction will provide a
brief introduction to the project, a justification of the need for projects such as these, and an
introduction to the main aims of this project. The background of the project is covered in
chapters 2 and 3. This background will provide information on the previous work that has been
carried out on this project, the objectives that were set out for the project carried out as part
of this thesis, an introduction to the major standards that have been extensively referenced
throughout the duration of the project, and an introduction to the major hardware and
software used in the project. The body of the project is described in chapters 4, 5 and 6. These
chapters deal with major design considerations, the construction, installation and testing of all
hardware components in the system and finally a discussion of the tests that were performed,
the faults that were encountered and improvements that were made to the software during
the commissioning of the solar tracker. The conclusion of the project is given in chapters 7 and
8. These chapters provide a guide to the future works that need to be carried out on the
system as well as providing a summary of the accomplishments and shortcomings of the
project when compared to the project objectives.
3
Chapter 2
Chapter 3
Chapter 4
Chapter 5
Chapter 6
Chapter 7
Chapter 8
Background
Body
Conclusions
Introduction Chapter 1
Figure 1-1 (Document Layout)
4
Chapter 2 Project Overview
2.1 Project History
Murdoch University initially had a single operating CSP array consisting of 80 solar PV troughs
located at the University’s Rockingham campus. In 2008, when the engineering department
relocated to its current location at the University’s South St campus, a decision was made to
split the current array into three separate arrays. One array was to contain 40 panels and was
to operate using the existing mounting and tracking system while the remaining panels were
to be split into two smaller arrays with a newly developed tracking system. The project has
since been undertaken by ENG454 students as well as three thesis students, including Rhyss
Edwards in 2010, Jarrod Sibson in 2012 and Gregorius Gazali in 2014. Short summaries of the
previous thesis works are provided below:
Rhyss Edwards: Rhyss’s thesis, entitled ‘Control system design and commissioning of
photovoltaic trough concentrator systems installed at the Murdoch
University South St campus’ , was completed in 2010. The major
focus of the thesis was in developing LabVIEW software to implement
the Solar Positioning Algorithm (SPA), performing initial setup on the
SEW inverters and synchronous servomotors and carrying out initial
design work on the installation of the array motors [5].
Jarrod Sibson: Jarrod’s thesis, entitled ‘Using Variable Speed Drives, Servo Motors
and RS-485 Communication in a Solar Tracking System for
Educational Purposes’ , was completed in 2012. The focus of the
thesis was on identifying the components of the system and the
interactions between components, setting up a bench test system,
and developing a LabVIEW based controller [6].

5
Gregorius Gazali: Gregorius’s thesis, entitled ‘LabVIEW Based Network Control of SEW
VSD and Servomotors for Solar Tracking’, was completed in 2014. The
main focus of the thesis was investigating the MOVILINK protocol
used by the SEW inverters, continuing work and testing of the bench
test system, and developing the LabVIEW control program. At the
conclusion of Gregorius’ thesis, the ROLL motor was theoretically
‘tracking’ on the bench test system in the Mechatronics Laboratory.
Both motors were capable of being controlled by both Movitools
Motionstudio and via the newly developed LabVIEW controller. No
testing had been carried out on the accuracy of the SPA, and the TILT
motor was not yet tracking correctly [7].
Due to the breadth of the project, issues that have been dealt with by previous project holders
will not be discussed as part of this thesis. Instead, only information deemed relevant to the
design, implementation and commissioning of the system will be discussed. Previous thesis
papers relating to this project can be found within the electronic attachment of this thesis (see
Appendix H).
The nomenclature used for the east/west and north/south movements has been confused
throughout previous project holders. The initial thought was that the tilt motor would provide
the north to south rotation and that the roll motor would provide east to west rotation, this
nomenclature was reversed by the latest project holder and has hence caused confusion when
trying to understand the physical system and the associated software. The current project
holder will henceforth refer to all east/west movement as ROLL and all north/south movement
as TILT, as was intended by the original project holders.

6
2.2 Solar Tracking Systems
Solar tracking systems aim to maximise the amount of energy harvested from solar arrays by
tracking the sun’s movements throughout the day. Solar trackers can work by using either
open loop or closed loop control strategies. Open loop systems use complex tracking
algorithms that calculate the position of the sun based upon the array’s longitudinal and
latitudinal locations, whereas closed loop systems use instruments to measure the irradiance
that the array is exposed to and make adjustments to the position of the array in order to
maximise this irradiance level [8].
Solar trackers can track the sun either by rotating around a single axis which are known as
single-axis solar trackers, or rotating around two axes, which are known as dual-axis solar
trackers. Single axis solar trackers will track the sun’s east to west movements, with a fixed tilt.
The effectiveness of single axis trackers increases with closer proximity to the equator. This is
due to the sun taking a less variable arc through the sky during the year. Dual axis solar
trackers track the sun’s movements both from east to west and from north to south [8]. These
systems can make a solar array significantly more efficient. A simple test was conducted using
the PVWatts online solar calculator to determine the added benefits of using both single and
dual axis solar tracking. The results, presented in Table 2-1, are for a 1kW system installed at
Murdoch University [9].
Table 2-1 (Tracking Performance Comparison)
Tracking Type Annual kWh Output % Improvement on Fixed Array
Fixed (no tracking) 30° Tilt 1678 kWh
Single Axis Tracking 2023 kWh 20.56%
Dual Axis Tracking 2195 kWh 30.81%

7
Using these results and by taking the annual kWh output for the fixed 1kW system as a
baseline, the single axis tracker improves efficiency by 20.56%, while a dual axis tracker
provides a 30.81% increase in efficiency over the fixed axis system. If these increases in
efficiency were applied to a large scale CSP solar plant, it would be essential to have the most
accurate tracking system available.
A wide variety of solar trackers are commercially available. These systems vary from cheap
single axis systems geared towards the domestic market through to high precision trackers
that can be used for large scale CSP power plants. One commercially available system is the
Siemens universal solar tracking control system. This system makes a solar positioning
algorithm library available on their SIMATIC S7-1200 controllers. The algorithm used by
Siemens is the same algorithm that will be used in this project; this algorithm provides an
accuracy of up to 0.0003°, making this algorithm suitable for large scale CSP systems [10].
2.3 Project Aims & Objectives
The aim of this thesis project is to fully implement, test and refine the previously developed
control system onto one of the existing solar array frameworks. The projects tasks include the
design, installation and testing of the required electrical systems. In order to achieve this aim,
the project was split into a number of major and minor project objectives. The major
objectives will be used to measure the success of the project while the minor objectives have
only been attempted either in part or as concepts.
Major Objectives
Research previous thesis work
Rewire and recommission Gregorius Gazali’s bench tested system
Develop detailed plans for the installation of electrical enclosures, communication cabling,
computer systems and electrical wiring systems

8
Carry out installation of electrical enclosures, communication cabling, computer systems
and electrical wiring systems
Test and commission the installed electrical systems according to relevant standards
Test and service the existing motor mounted on the ‘roll’ beam
Temporarily mount a tilt motor on the existing framework
Test electrical and communication systems through the manual use of Movitools
Motionstudio
Develop a testing strategy to ensure correct operation of tracking hardware and software
Carry out extensive testing and refining of tracking software
Minor Objectives
Investigate the installation of ROLL and TILT limit switches
Investigate the installation and use of an National Instruments (NI) myRIO to control the
tracking
Carry out the installation of a replica system on the second framework
2.4 Standards & Regulations
Several standards have been used throughout this project; these standards have been used to
aid the design of the electrical system, as a guide for the testing of the system, and as a
resource to gauge the success of the tests carried out on the electrical installation. The
standards used are produced by Standards Australia for the purpose of ensuring that electrical
installations carried out in Australia are safe and reliable. This section will briefly introduce
three of the main standards that have been referenced in this project.
AS 3000:2007 – Wiring Rules
The AS3000:2007 Wiring Rules has been used extensively throughout this project. This
standard is commonly known as the ‘electrician’s bible’. All electrical installations carried out

9
in Australia are required by law to comply with this standard. The standard outlines
requirements for the design, construction and testing of an electrical installation. It has been
used specifically in this project to aid in the selection of circuit components including circuit
breakers and cabling. It was also drawn upon when developing a plan for testing the electrical
system and ensuring that the tests carried out were within the standard’s acceptable limits
[11].
AS 3017:2007 Electrical Installations – Verification Guidelines
The AS3017:2007 Electrical Installations- Verification Guidelines is used as a supplementary
standard to AS3000:2007. This standard contains extensive information on the mandatory
tests that need to be carried out on an electrical installation; it details the instruments and
methods that need to be used to carry out the tests, and gives the expected results for the
tests [12].
AS 3008:2009 Part 1.1 Electrical Installations – Selection of Cables
The AS3008.1.1:2009 Electrical Installations – Selection of Cables is used as a tool when
selecting cables for alternating current (AC) installations in Australia, up to and including 1kV.
The standard contains extensive information on the current carrying capacity and voltage drop
for various cables installed in a wide variety of situations. The standard was used when
selecting cables for the wiring systems in the circuit [13].
Other standards referenced during the course of this project include AS60529:2004 Degrees of
Protection Provided by Enclosures (IP Code) [14] and AS60947.2 Low Voltage Switchgear and
Controlgear, Circuit Breakers [15].

10
Chapter 3 Hardware & Software
This project utilises a wide variety of hardware and software. It is important to note that the
hardware that is used for this project was not selected by previous thesis students but rather
had been selected by academic staff for the purpose of providing educational value through
exposure to previously un-used hardware, such as SEW variable speed drives and synchronous
servomotors. This chapter serves to give a broad overview of the major hardware components
and the software that are to be used in this project.
3.1 Major System components
The system comprises the following major hardware components:
SEW MOVIDRIVE MDX61B0005 Inverter
SEW MOVIDRIVE MDX61B0011 Inverter
SEW EURODRIVE DS56M Synchronous Servomotor
SEW EURODRIVE CM71S Synchronous Servomotor
These system components will be discussed in this section.
3.1.1 Synchronous Servo Motors
The synchronous servomotors used in this project are part of SEW EURODRIVE’s DS/CM
synchronous servomotor range. The motors themselves operate in much the same way as
typical AC synchronous motors. By incorporating resolver feedback systems, they are also able
to provide a high level of control over speed and rotor position, hence the name synchronous
servomotors.
The motors operate by applying a set of three phase voltages, each equal in magnitude but
offset by 120°, to the stationary windings of the machine (the stator). The resulting current
flow in the stator windings then sets up a rotating magnetic field. The rotating part of the

11
motor (rotor), which is itself a permanent magnet, will then follow the rotating magnetic field
of the stator, causing the shaft of the motor to rotate [16].
The technical details of each motor used in this project, as well as their gear and resolver
systems, will now be discussed.
3.1.2 Tilt Motor
The SEW CM71S synchronous servomotor will be used as the motor that provides the north to
south rotation (TILT) for the system. This motor will be used due to its ability to provide a
higher torque output when compared to the ROLL motor. Some of the key technical details for
the motor are provided in Table 3-1 (CFM71S Technical Data) [17].
Table 3-1 (CFM71S Technical Data) [17]
CM71S Synchronous Servo Motor
Parameter Unit Description Value
NN rpm Rated Speed 3000 rpm
M0 Nm Standstill Torque 5 Nm
I0 A Standstill Current 3.3 A
Imax A Maximum Permissible current 13.2 A
mmot kg Mass of motor 9.5 kg
The complete nameplate of the TILT motor is [SA77 CM71S/TF/RH1M/SM50], a breakdown of
the meaning for each part of this nameplate is given in Table 3-2.
Table 3-2 (TILT Motor Nameplate) [17]
Tilt Motor Nameplate
Option Description
SA77 Helical Worm Gear Unit, Size 77
CM71S Motor for mounting to gear size 71
TF Thermistor (PTC resistor)
RH1M Resolver type
SM50 Motor Connector Plug size 50 (Motor End Only)
12
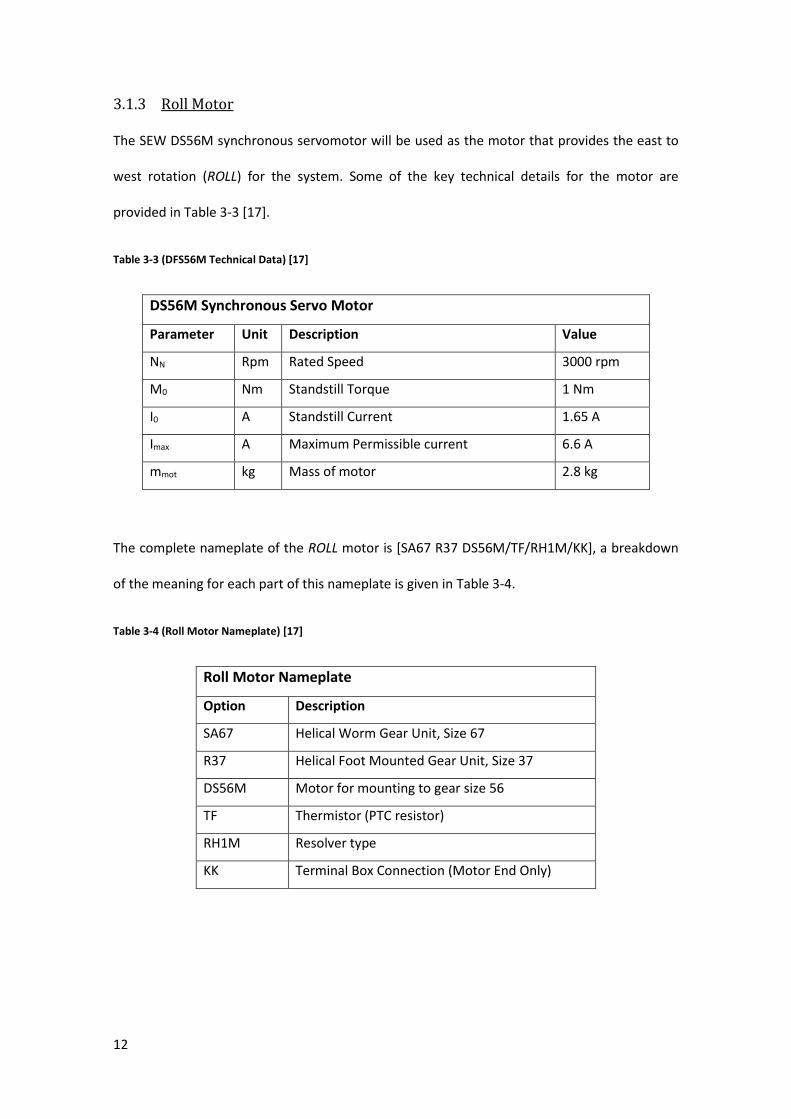
3.1.3 Roll Motor
The SEW DS56M synchronous servomotor will be used as the motor that provides the east to
west rotation (ROLL) for the system. Some of the key technical details for the motor are
provided in Table 3-3 [17].
Table 3-3 (DFS56M Technical Data) [17]
DS56M Synchronous Servo Motor
Parameter Unit Description Value
NN Rpm Rated Speed 3000 rpm
M0 Nm Standstill Torque 1 Nm
I0 A Standstill Current 1.65 A
Imax A Maximum Permissible current 6.6 A
mmot kg Mass of motor 2.8 kg
The complete nameplate of the ROLL motor is [SA67 R37 DS56M/TF/RH1M/KK], a breakdown
of the meaning for each part of this nameplate is given in Table 3-4.
Table 3-4 (Roll Motor Nameplate) [17]
Roll Motor Nameplate
Option Description
SA67 Helical Worm Gear Unit, Size 67
R37 Helical Foot Mounted Gear Unit, Size 37
DS56M Motor for mounting to gear size 56
TF Thermistor (PTC resistor)
RH1M Resolver type
KK Terminal Box Connection (Motor End Only)
13
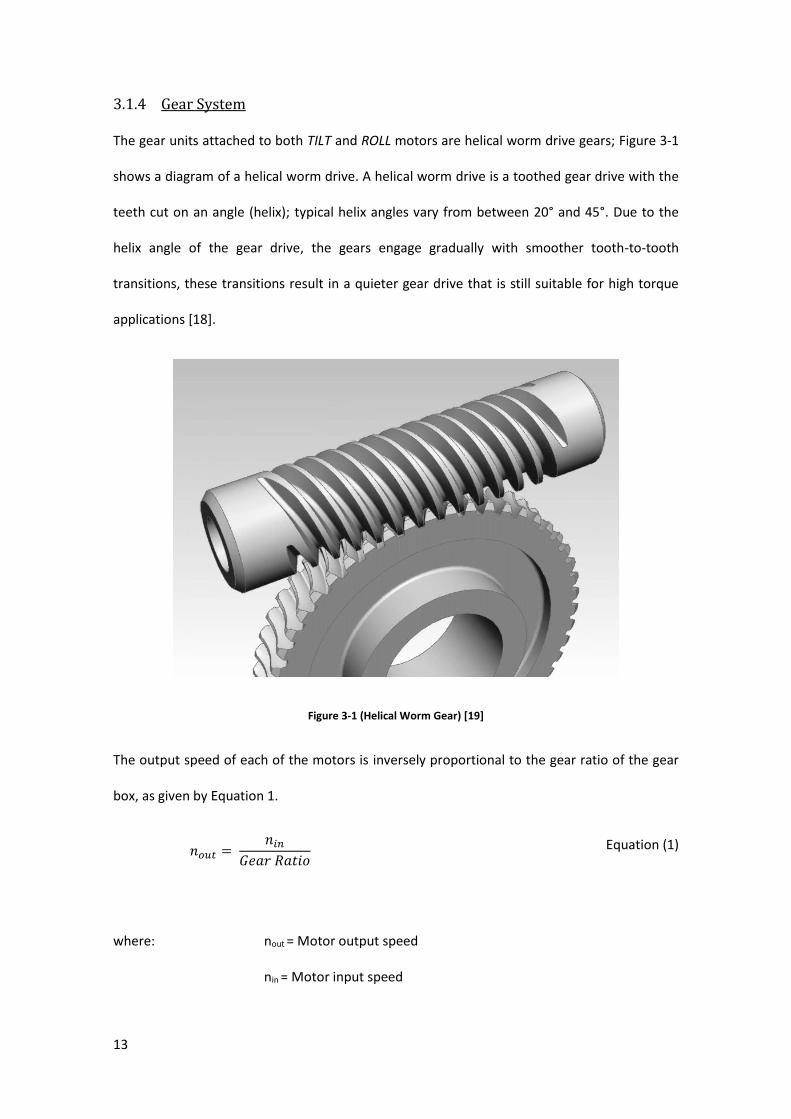
3.1.4 Gear System
The gear units attached to both TILT and ROLL motors are helical worm drive gears; Figure 3-1
shows a diagram of a helical worm drive. A helical worm drive is a toothed gear drive with the
teeth cut on an angle (helix); typical helix angles vary from between 20° and 45°. Due to the
helix angle of the gear drive, the gears engage gradually with smoother tooth-to-tooth
transitions, these transitions result in a quieter gear drive that is still suitable for high torque
applications [18].
Figure 3-1 (Helical Worm Gear) [19]
The output speed of each of the motors is inversely proportional to the gear ratio of the gear
box, as given by Equation 1.
𝑛𝑜𝑢𝑡 = 𝑛𝑖𝑛
𝐺𝑒𝑎𝑟 𝑅𝑎𝑡𝑖𝑜 Equation (1)
where: nout = Motor output speed
nin = Motor input speed

14
The output torque of the motors is directly proportional to the gear ratio of the gear box, as
shown in Equation 2.
𝑀𝑜𝑢𝑡 = 𝑀𝑖𝑛 𝑋 𝐺𝑒𝑎𝑟 𝑅𝑎𝑡𝑖𝑜 Equation (2)
Where: Mout = Motor output torque
Min = Motor input torque
The TILT motor has a gear ratio of 225.26, therefore, the maximum achievable output speed
and torque are;
𝑛𝑜𝑢𝑡 = 3000 𝑋 1
225.26= 13.32 𝑟𝑝𝑚
𝑀𝑜𝑢𝑡 = 5 𝑋 225.26 = 1126.3 𝑁𝑚
The roll motor has a gear ratio of 914.0, therefore, the maximum achievable output speed and
torque are;
𝑛𝑜𝑢𝑡 = 3000 𝑋 1
914= 3.28 𝑟𝑝𝑚
𝑀𝑜𝑢𝑡 = 5 𝑋 914 = 4970 𝑁𝑚
3.1.5 Resolver System
The resolver system used by both tilt and roll motors is the SEW RH1M resolver. The resolver is
capable of determining the motor shaft’s position, speed and direction of rotation; it achieves
this by using a rotary transformer. Figure 3-2 shows a simplified diagram of an electrical
resolver; a rotating coil (R) is attached to the motor’s rotor and two windings (S1 & S2) are
mounted in the stator of the motor; these two stator windings are mounted with an offset of

15
90˚ to each other. As the rotor winding rotates, voltages are induced into the two stator
windings; the magnitude of these voltages will vary as the rotor rotates. It is by analysing these
stator winding signals for their amplitude and zero crossing time, that the MDX61B inverter is
able to determine the rotors direction of rotation, speed and position [20].
Figure 3-2 (Electrical Resolver) [21]
The resolver feedback system represents the rotors position as a 32bit signed integer (that is,
as a number between -2147483648 and 2147483647). Due to the different gear ratios of the
two motors, a 360° rotation, and a movement of 1°, of the motor shafts are represented by
increment shifts as follows:
Tilt motor: 890 increments in 360°
1° = 890
360= 2.47222 increments
Roll motor: 3600 increments in 360°
1° = 3600
360= 10 increments
These increments were determined experimentally as outlined in Section 6.2.4.

16
3.1.6 SEW MDX 61B Variable Speed Drives
The system comprises two MDX61B variable speed drives (Inverters) a MDX61B0005 inverter
will be used to provide control of the roll motor, while the MDX61B0011 inverter will be used
to control the tilt motor. The main distinction between the two inverters is their maximum
rated output current.
One of the major features of the SEW MDX 61B inverters, is their ability to execute ‘IPOSPLUS’
positioning programs. These programs enable the control of SEW synchronous servomotors
entirely from the inverter, reducing the need for a typical master controller such as a PLC, as
the feedback from the motor’s encoders can be interpreted directly by the inverters, and the
control decisions can be made internally by the IPOSPLUS program being executed on the
inverter.
The inverters communicate using a propriety protocol called MOVILINK. This protocol can be
communicated across numerous media including SBus, RS232, RS485, Profibus – DP, Interbus
and CAN. Extensive research into the MOVILINK protocol has been conducted by previous
thesis student Gregorious Gazali, and can be found in his thesis entitled ‘LabVIEW Based
Network Control of SEW VSD and Servomotors for Solar Tracking’ [7].
3.2 Minor System Components
The system comprises the following minor system components:
Operating Terminal
Electrical Cabling
Communications Cabling
Electrical Protective Devices
Electrical Isolation Devices
Electrical Enclosure

17
Enclosure Cooling Fan
24V Toggle Switches
The selection and use of these minor system components will be discussed in detail in Chapter
4.
3.3 Software
Two types of software are used extensively throughout this project. These two software
platforms are Movitools Motionstudio and National Instruments LabVIEW. The functionality
and the use of this software as it relates to this project will now be discussed.
3.3.1 Movitools Motionstudio
Movitools Motionstudio is a proprietary software developed by SEW EURODRIVE. The
software enables the setup of new SEW devices and the configuration of various parameters
as well as various debugging and ‘wizard’ type functionality [22]. The software has been used
in this project to both control the motors manually as well as configuring various motor
parameters such as reference travel speed and direction. Appendix A, contains a guide to
locating all inverters on the serial bus using Movitools Motionstudio.
3.3.2 National Instruments LabVIEW
LabVIEW is a software platform that has been developed by National Instruments. It provides a
graphical object orientated programing interface. LabVIEW is used extensively throughout this
project, due to the ease of creating LabVIEW programs and also to the familiarity with
LabVIEW that all Murdoch University engineering students have from exposure to the program
platform throughout their degrees. In this project, LabVIEW has been used to implement the
solar positioning algorithm, transmit/receive data to the MDX61B inverters and provide a user
friendly Human Machine Interface (HMI) for the system.
18
Chapter 4 Electrical Design, Construction
& Installation
This chapter aims to provide a background on the design that has been carried out on various
parts of the system. It will also, where appropriate, detail the steps taken in both the
construction and installation of the systems hardware.
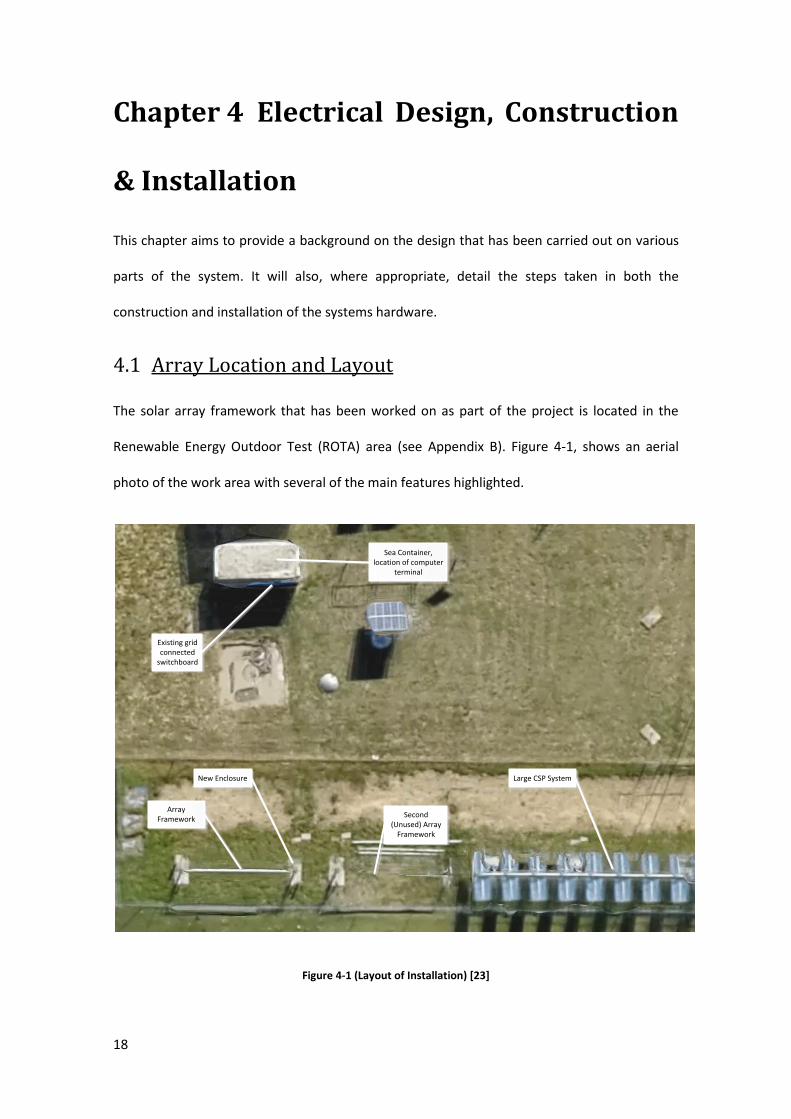
4.1 Array Location and Layout
The solar array framework that has been worked on as part of the project is located in the
Renewable Energy Outdoor Test (ROTA) area (see Appendix B). Figure 4-1, shows an aerial
photo of the work area with several of the main features highlighted.
Existing grid connected
switchboard
Sea Container, location of computer
terminal
New Enclosure
Second (Unused) Array
Framework
Large CSP System
Array Framework
Figure 4-1 (Layout of Installation) [23]

19
4.2 Supply Requirements
As discussed in section 3.1, the CM71S and DS65M motors draw nominal currents of 3.3 and
1.65 A respectively, with maximum permissible currents of 13.2 and 6.6 A respectively. The
current draw of the inverters and enclosure fan is negligible. The case of both motors
operating at their maximum current will be considered the worst case scenario for this
installation, therefore, the maximum current draw can be calculated using Equation (3). This
equation also allows for a future 20% increase in load.
𝐼𝑀𝑎𝑥𝑆𝑦𝑠𝑡𝑒𝑚= 1.2 ( 𝐼𝑀𝑎𝑥𝐼𝑛𝑣𝑒𝑟𝑡𝑒𝑟 1
+ 𝐼𝑀𝑎𝑥𝐼𝑛𝑣𝑒𝑟𝑡𝑒𝑟 2) Equation (3)
Therefore:
𝐼𝑀𝑎𝑥𝑆𝑦𝑠𝑡𝑒𝑚= 1.2 (13.2 + 6.6) = 23.76 𝐴
4.3 Wiring Systems
The wiring of the system can be separated into two categories; power and communications.
The following section will discuss the design and selection of the wiring systems.
4.3.1 Electrical
The power component of the wiring system consists of the submains cable running from the
existing grid connected supply to the array location, the enclosure wiring and the motor supply
cable running from the MDX61B inverters to the ROLL and TILT motors.
Supply Cabling
The cable that has been installed from the supply switchboard to the array is a 6mm2, four
core and earth, stranded cable. It has been installed underground in a 50mm heavy duty
conduit. According to AS3008, Table 15, the current carrying capacity of this cable installed

20
under these conditions is 46A [13]. The supply cable is therefore capable of carrying the
required 23.76A for the system.
Enclosure Cabling
All wiring within the electrical enclosure (e.g. between circuit protective devices) has been
carried out using 2.5mm2, single core, stranded cable. This cable is installed in ducting within
the enclosure and is therefore touching other cables. AS3008, Table 4, defines the current
carrying capacity of this cable as 23A [13].
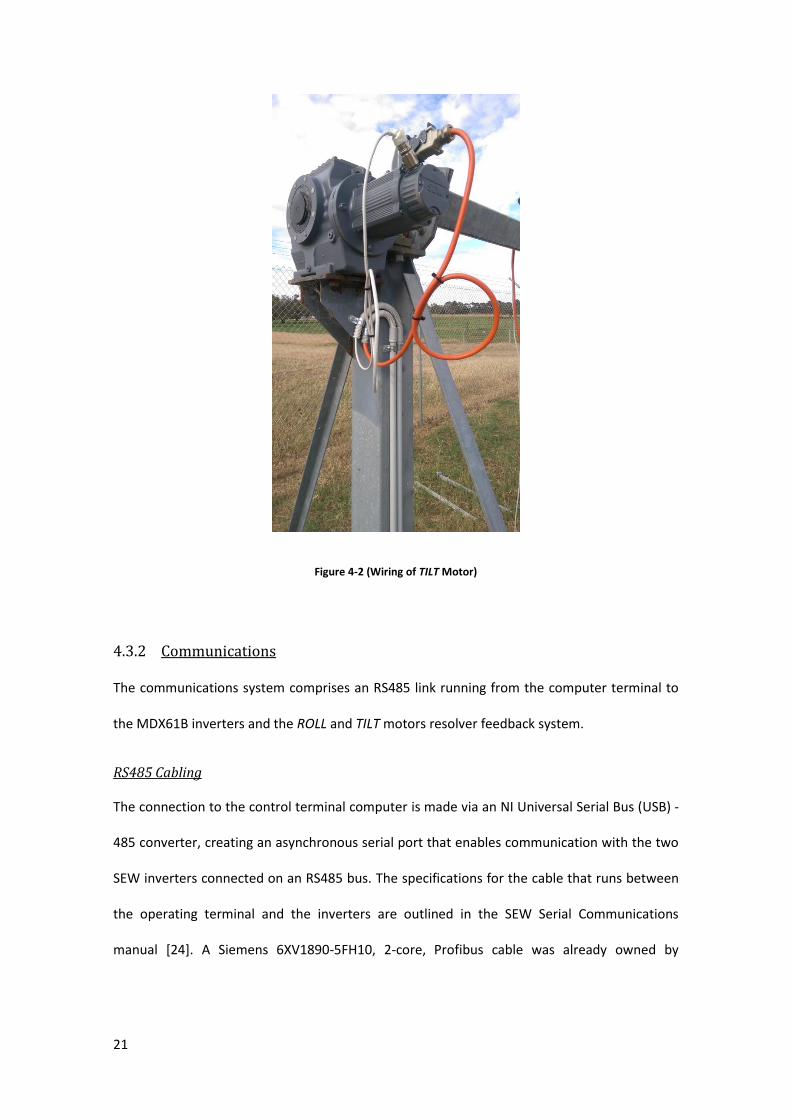
Motor Cabling
The cable that was selected for the motor supply cable running from the inverters to each of
the motors, is a 2.5mm2, three core and earth, flexible cable. The TILT motor cable is installed
in a 20mm medium duty conduit for the majority of the cable run. A service loop has been
added to the cable as in Figure 4-2. This service loop is exposed to direct sunlight and this is
permissible due to the cable being Ultraviolet (UV) rated. However, this also de-rates the
current carrying capacity of the cable to a maximum of 22A according to AS3008, Table 15
[13]. The ROLL motor wiring has not been installed in a permanent manner in order to allow
for future removal. Both cables will be rated to 22A and therefore will be capable of carrying
the required 13.2A and 6.6A for the motors.
A circuit and wiring diagram for the electrical system can be found in Appendix C.
21
Figure 4-2 (Wiring of TILT Motor)
4.3.2 Communications
The communications system comprises an RS485 link running from the computer terminal to
the MDX61B inverters and the ROLL and TILT motors resolver feedback system.
RS485 Cabling
The connection to the control terminal computer is made via an NI Universal Serial Bus (USB) -
485 converter, creating an asynchronous serial port that enables communication with the two
SEW inverters connected on an RS485 bus. The specifications for the cable that runs between
the operating terminal and the inverters are outlined in the SEW Serial Communications
manual [24]. A Siemens 6XV1890-5FH10, 2-core, Profibus cable was already owned by

22
Murdoch University’s School of Engineering and was available to be used. The specifications of
the required cable and the available cable are compared in Table 4-1.
Table 4-1 (Communications Cable Specifications)
Cable Parameter Required Cable Available Cable
Conductor Cross Section 0.5 - 0.75 mm 1.05 mm
Cable Resistance 100 -150 Ω @ 1MHz 100 Ω
Capacitance Per Unit Length ≤ 40 pF/m @ 1kHz 92pF/m
It can be seen that the cable available for use did not meet the required capacitance per unit
length. However, it was calculated that the overall capacitance of the cable was well below the
allowable value. This was due to the maximum allowable length of the cable being 200m. The
maximum capacitance of the cable is given by Equation 4, whereas the capacitance of the
actual 20m length of the available cable can be given by Equation 5.
𝐶𝑀𝑎𝑥 𝑃𝑒𝑟𝑚𝑖𝑠𝑠𝑖𝑏𝑙𝑒 = 200𝑚 × 40𝑝𝐹
𝑚= 8µ𝐹
Equation (4)
𝐶𝐴𝑣𝑎𝑖𝑙𝑎𝑏𝑙𝑒 𝐶𝑎𝑏𝑙𝑒 = 20𝑚 × 92𝑝𝐹
𝑚= 1.84 µ𝐹
Equation (5)
Based on the capacitance of the total length of cable being less than the maximum permissible
capacitance, a decision was made to install the cable that was already available with the
knowledge that the cable may possibly become redundant due to future works (see Section
7.5).
A linking cable between the NI USB-485 converter and the Siemens Profibus cable was made
with the configuration that can be seen in Table 4-2.
23
Table 4-2 (DE-9 Connector Configuration)
DE-9 Male Connector Terminal Cable Core Profibus Cable Core MDX61B X13 Terminal
1 Shield Shield
X13.9 [DGND]
&
X13.7 [DCOM]
4 White Red X13.10 [RS485 +]
8 Red
5 Yellow Green X13.11 [RS485 -]
9 Black
The shield of the Profibus cable is also connected to the chassis of the inverter, and both
inverter chassis are tied together with a separate cable. This ensures that no potential
displacement exists between the inverters. A 120 Ω resistor is connected between the red and
green cores of the Profibus Cable at the control terminal end, with no terminating resistors
being needed at the inverters connection point due to the inverters containing dynamic
terminating resistors [24]. The X13 terminals of the inverters are connected in a series bus
configuration. For further information on the connection of the RS-485 link, see the SEW Serial
Communication Manual located in the SEW documentation in the electronic attachment of
this thesis (see Appendix H).
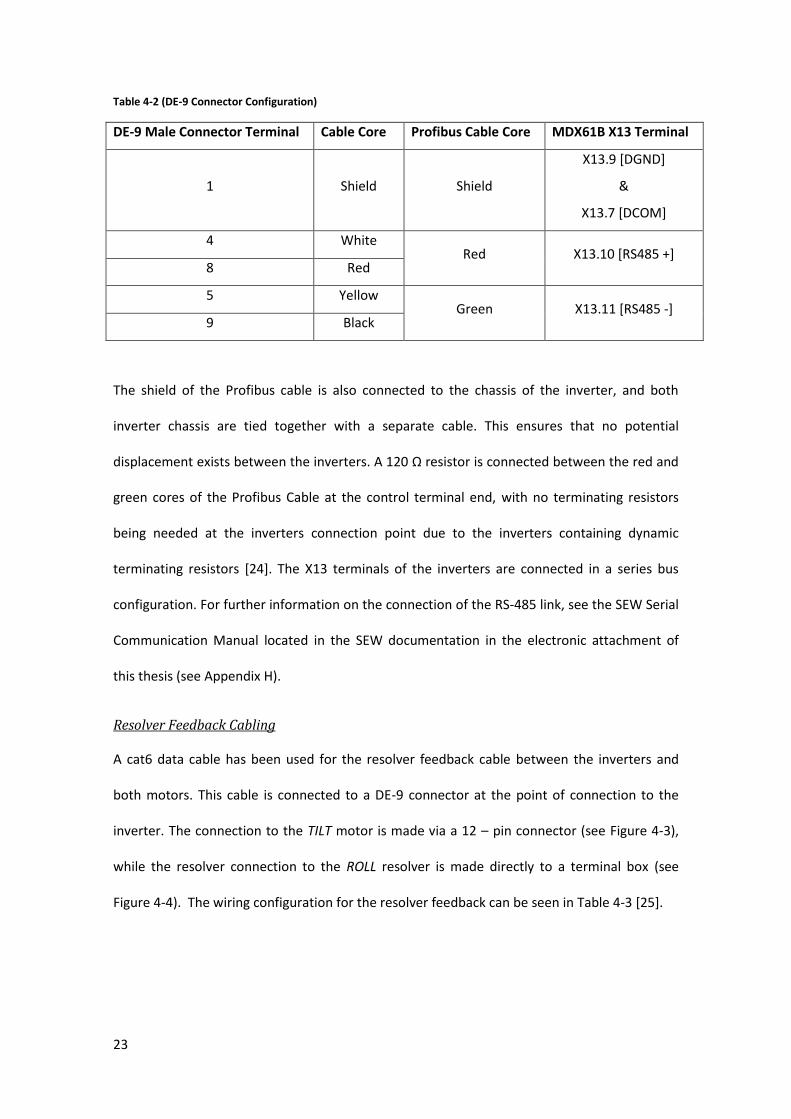
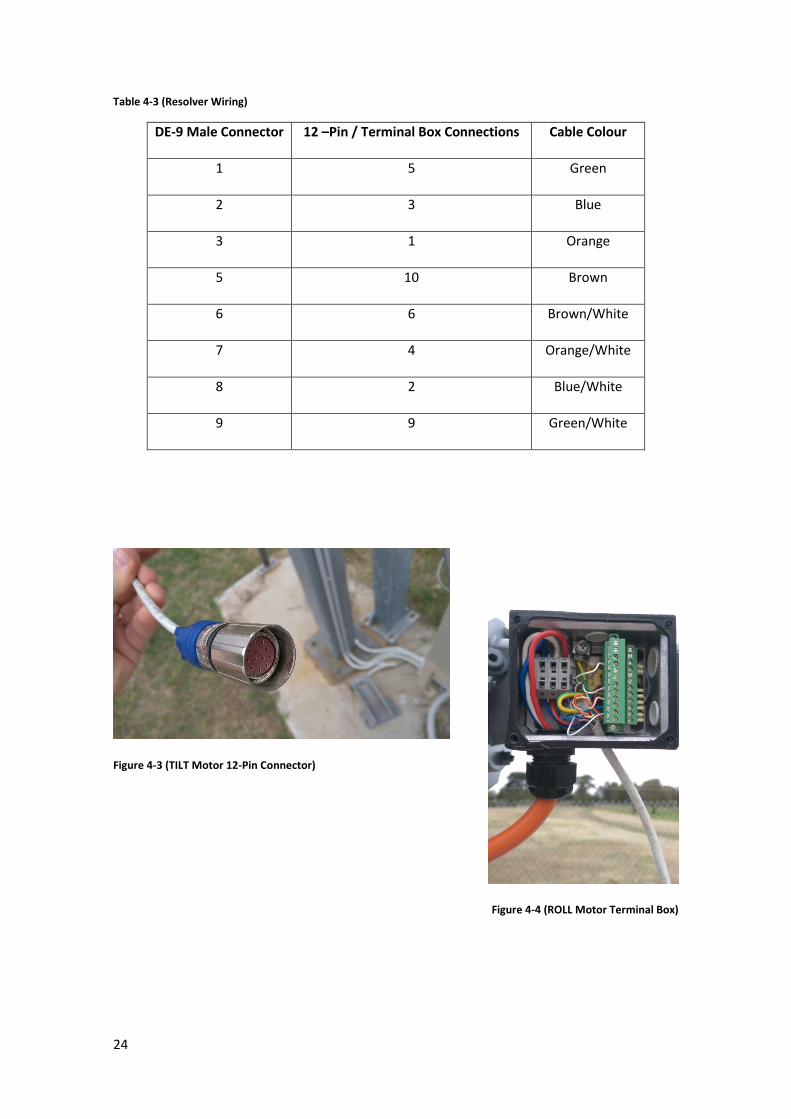
Resolver Feedback Cabling
A cat6 data cable has been used for the resolver feedback cable between the inverters and
both motors. This cable is connected to a DE-9 connector at the point of connection to the
inverter. The connection to the TILT motor is made via a 12 – pin connector (see Figure 4-3),
while the resolver connection to the ROLL resolver is made directly to a terminal box (see
Figure 4-4). The wiring configuration for the resolver feedback can be seen in Table 4-3 [25].
24
Table 4-3 (Resolver Wiring)
DE-9 Male Connector 12 –Pin / Terminal Box Connections Cable Colour
1 5 Green
2 3 Blue
3 1 Orange
5 10 Brown
6 6 Brown/White
7 4 Orange/White
8 2 Blue/White
9 9 Green/White
Figure 4-3 (TILT Motor 12-Pin Connector)
Figure 4-4 (ROLL Motor Terminal Box)

25
4.4 System Protection
Various forms of circuit protection have been designed and installed on the system. The
purpose of these systems is to limit the effects of overcurrent on the circuit’s conductors, limit
the risk to humans in the event of short circuit faults and also to provide points of isolation for
the system to facilitate safe maintenance. The various aspects of the circuit’s protection
system will now be discussed.
4.4.1 Overcurrent Protection
Overcurrent devices serve to protect the active conductors in an installation from the effects
of overcurrent. They must operate to disconnect the circuit’s supply in the event of an
overcurrent situation such as a short circuit; they must do this within an appropriate time so as
to prevent the current reaching potentially damaging magnitudes or durations [11]. An
overcurrent device must be located at the origin of every circuit. The selection of these
overcurrent devices must meet the conditions given in Equations 6 & 7.
𝐼𝐵 ≤ 𝐼𝑁 ≤ 𝐼𝑍 Equation (6)
𝐼2 ≤ 1.45 × 𝐼𝑍 Equation (7)
Where: IB = The maximum current for which the circuit is designed
IN = The nominal current of the protective device
IZ = The current carrying capacity of the conductor
I2 = The current that will ensure the effective operation of the
overcurrent protection device. In this case this may be taken as 1.45
IN.
Using these conditions, it was possible to select circuit breakers for the follow circuits:
Submains supply
ROLL Motor
26
Tilt Motor
Enclosure Fan
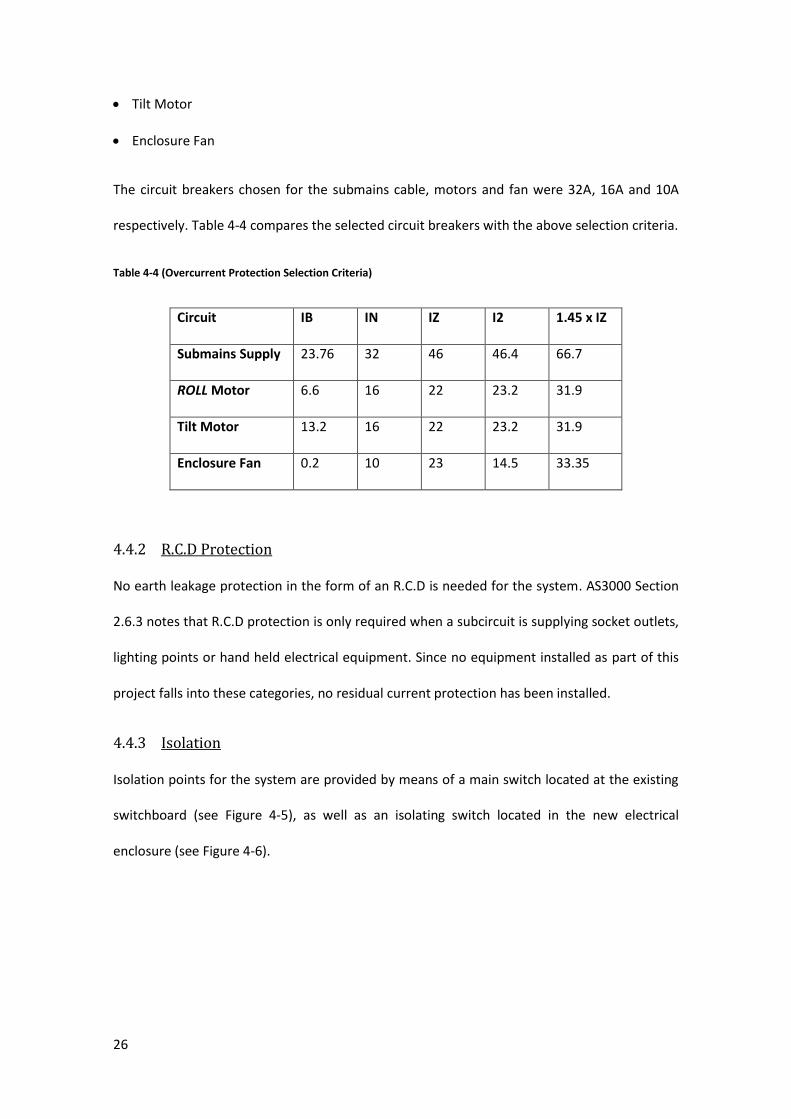
The circuit breakers chosen for the submains cable, motors and fan were 32A, 16A and 10A
respectively. Table 4-4 compares the selected circuit breakers with the above selection criteria.
Table 4-4 (Overcurrent Protection Selection Criteria)
Circuit IB IN IZ I2 1.45 x IZ
Submains Supply 23.76 32 46 46.4 66.7
ROLL Motor 6.6 16 22 23.2 31.9
Tilt Motor 13.2 16 22 23.2 31.9
Enclosure Fan 0.2 10 23 14.5 33.35
4.4.2 R.C.D Protection
No earth leakage protection in the form of an R.C.D is needed for the system. AS3000 Section
2.6.3 notes that R.C.D protection is only required when a subcircuit is supplying socket outlets,
lighting points or hand held electrical equipment. Since no equipment installed as part of this
project falls into these categories, no residual current protection has been installed.
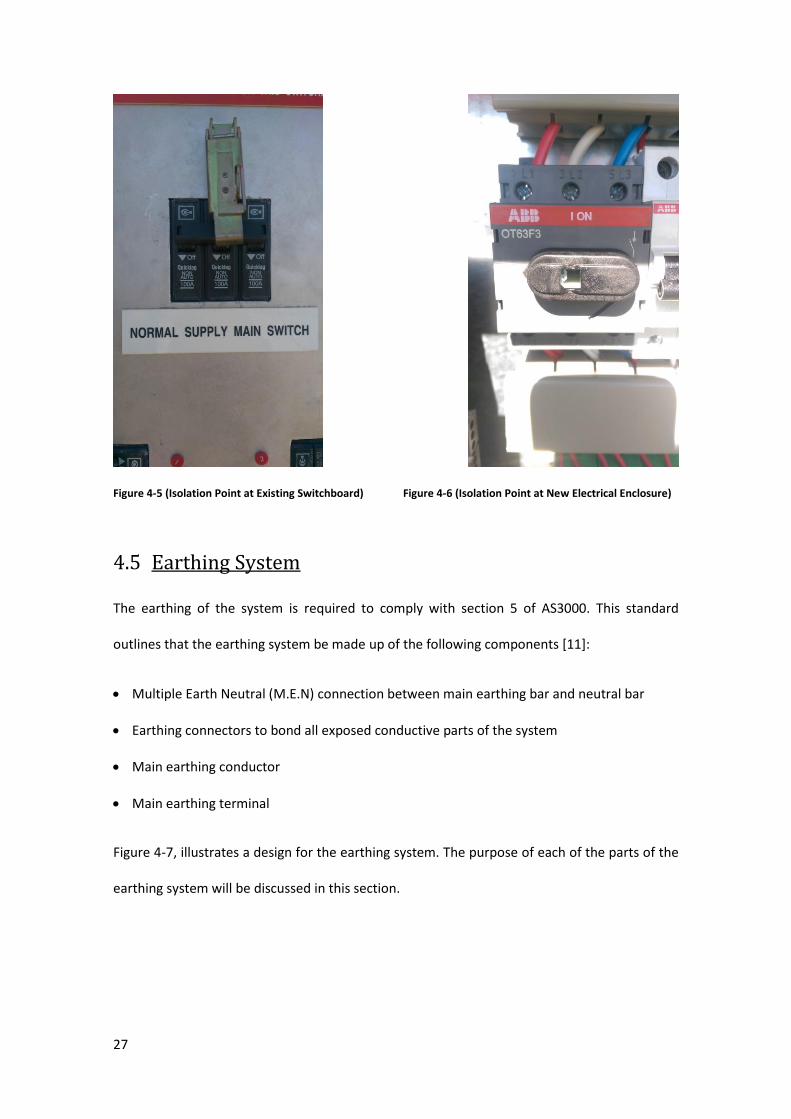
4.4.3 Isolation
Isolation points for the system are provided by means of a main switch located at the existing
switchboard (see Figure 4-5), as well as an isolating switch located in the new electrical
enclosure (see Figure 4-6).
27
Figure 4-5 (Isolation Point at Existing Switchboard)
Figure 4-6 (Isolation Point at New Electrical Enclosure)
4.5 Earthing System
The earthing of the system is required to comply with section 5 of AS3000. This standard
outlines that the earthing system be made up of the following components [11]:
Multiple Earth Neutral (M.E.N) connection between main earthing bar and neutral bar
Earthing connectors to bond all exposed conductive parts of the system
Main earthing conductor
Main earthing terminal
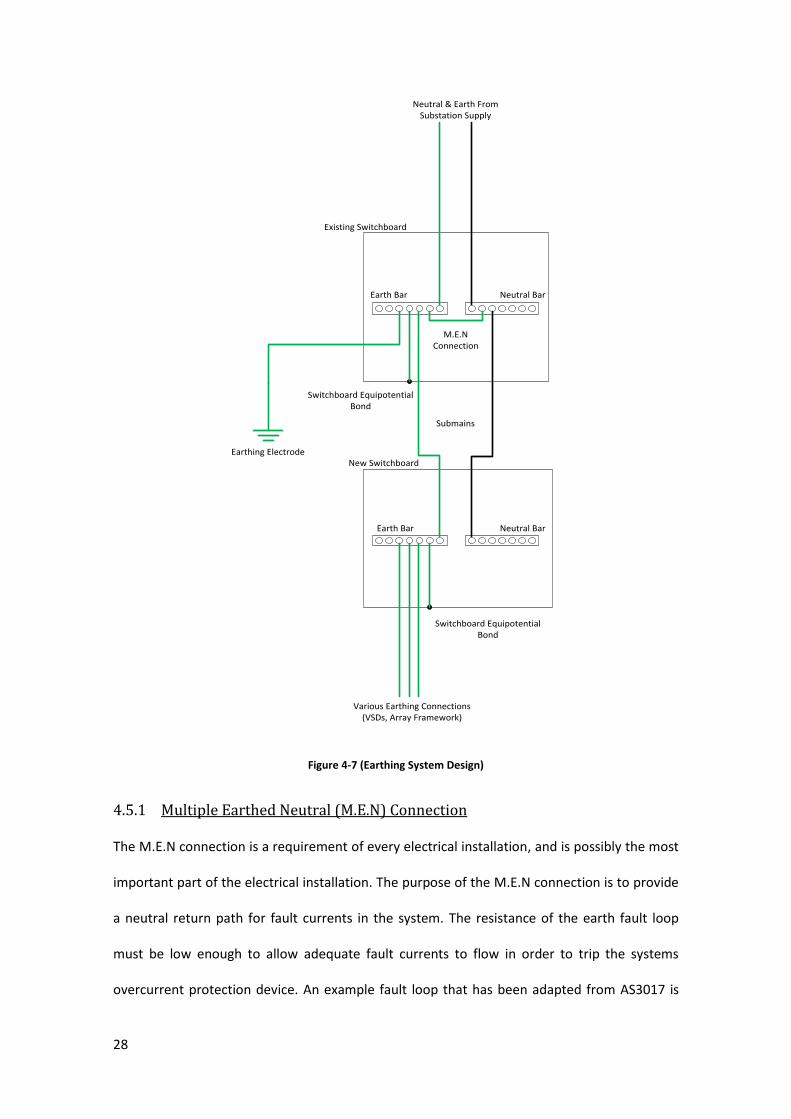
Figure 4-7, illustrates a design for the earthing system. The purpose of each of the parts of the
earthing system will be discussed in this section.
28
Neutral & Earth From Substation Supply
Existing Switchboard
Earth Bar Neutral Bar
M.E.NConnection
New Switchboard
Earth Bar Neutral Bar
Switchboard Equipotential Bond
Switchboard Equipotential Bond
Various Earthing Connections (VSDs, Array Framework)
Submains
Earthing Electrode
Figure 4-7 (Earthing System Design)
4.5.1 Multiple Earthed Neutral (M.E.N) Connection
The M.E.N connection is a requirement of every electrical installation, and is possibly the most
important part of the electrical installation. The purpose of the M.E.N connection is to provide
a neutral return path for fault currents in the system. The resistance of the earth fault loop
must be low enough to allow adequate fault currents to flow in order to trip the systems
overcurrent protection device. An example fault loop that has been adapted from AS3017 is
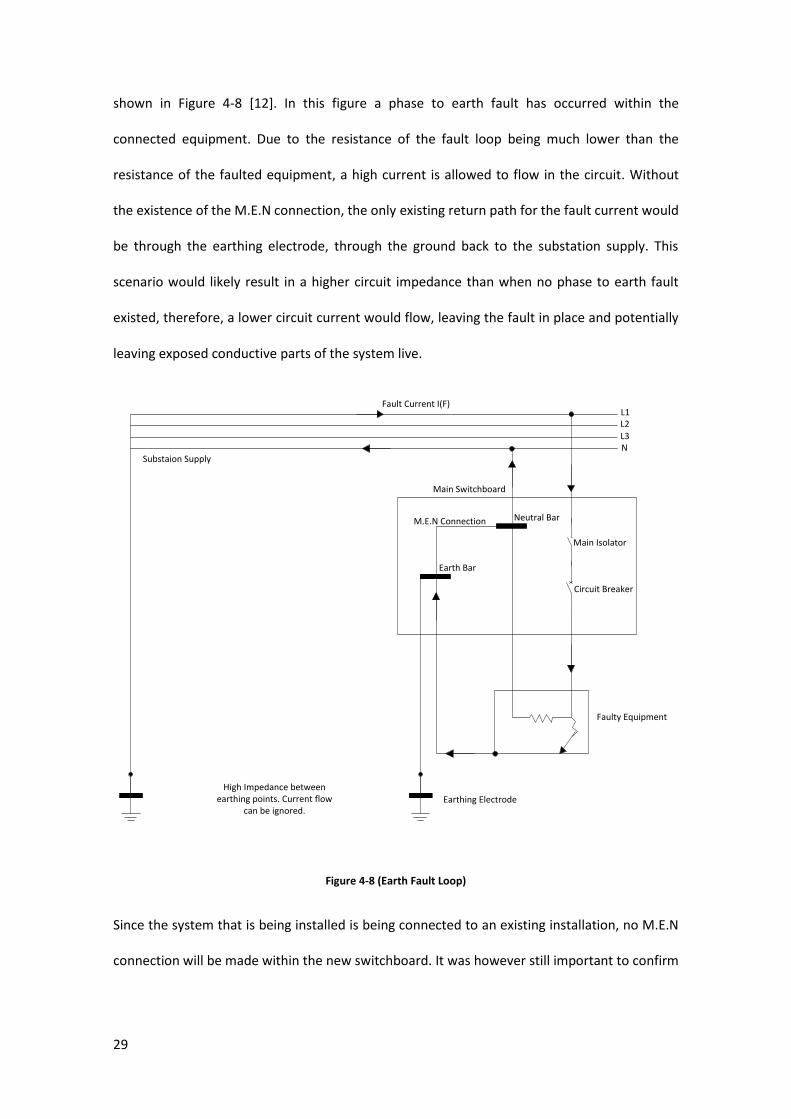
29
shown in Figure 4-8 [12]. In this figure a phase to earth fault has occurred within the
connected equipment. Due to the resistance of the fault loop being much lower than the
resistance of the faulted equipment, a high current is allowed to flow in the circuit. Without
the existence of the M.E.N connection, the only existing return path for the fault current would
be through the earthing electrode, through the ground back to the substation supply. This
scenario would likely result in a higher circuit impedance than when no phase to earth fault
existed, therefore, a lower circuit current would flow, leaving the fault in place and potentially
leaving exposed conductive parts of the system live.
Fault Current I(F)L1L2L3N
Main Switchboard
Main Isolator
Circuit Breaker
Neutral Bar
Earth Bar
Faulty Equipment
M.E.N Connection
Substaion Supply
High Impedance between earthing points. Current flow
can be ignored.Earthing Electrode
Figure 4-8 (Earth Fault Loop)
Since the system that is being installed is being connected to an existing installation, no M.E.N
connection will be made within the new switchboard. It was however still important to confirm
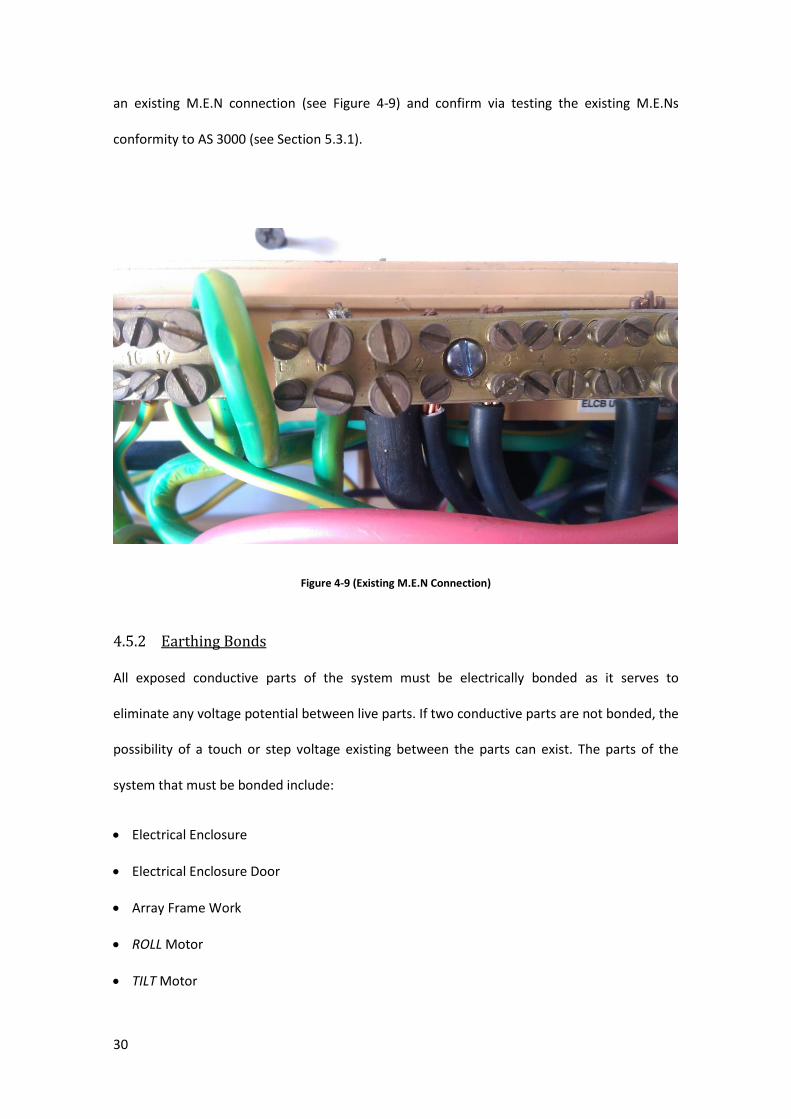
30
an existing M.E.N connection (see Figure 4-9) and confirm via testing the existing M.E.Ns
conformity to AS 3000 (see Section 5.3.1).
Figure 4-9 (Existing M.E.N Connection)
4.5.2 Earthing Bonds
All exposed conductive parts of the system must be electrically bonded as it serves to
eliminate any voltage potential between live parts. If two conductive parts are not bonded, the
possibility of a touch or step voltage existing between the parts can exist. The parts of the
system that must be bonded include:
Electrical Enclosure
Electrical Enclosure Door
Array Frame Work
ROLL Motor
TILT Motor

31
An earthing electrode must also exist in the system. The purpose of the earthing electrode is to
ensure that all earthed parts of the system are at the same potential as the physical earth. If
no earthing electrode was present, the earthing system could potentially ‘float’ above the
earth’s potential, resulting in potentially hazardous touch and or step voltages. The system was
checked to ensure the presence of an earthing electrode (see Figure 4-10).
Figure 4-10 (Existing Earthing Electrode)
4.6 Temporary Installation of ROLL Motor
The ROLL motor has been installed in a temporary fashion due to the final plans for the array
not yet being finalised. The future permanent installation of the motor will be discussed in
Chapter 7. A frame was constructed that would enable the motor to be mounted on top of the
32
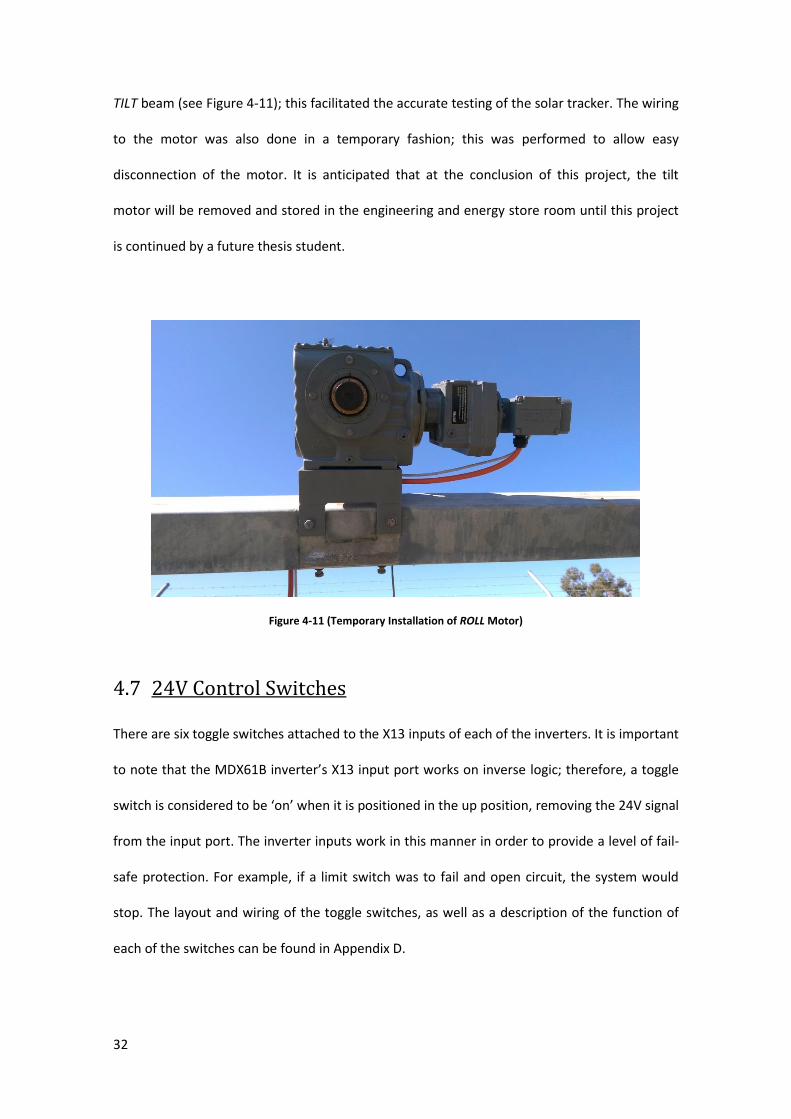
TILT beam (see Figure 4-11); this facilitated the accurate testing of the solar tracker. The wiring
to the motor was also done in a temporary fashion; this was performed to allow easy
disconnection of the motor. It is anticipated that at the conclusion of this project, the tilt
motor will be removed and stored in the engineering and energy store room until this project
is continued by a future thesis student.
Figure 4-11 (Temporary Installation of ROLL Motor)
4.7 24V Control Switches
There are six toggle switches attached to the X13 inputs of each of the inverters. It is important
to note that the MDX61B inverter’s X13 input port works on inverse logic; therefore, a toggle
switch is considered to be ‘on’ when it is positioned in the up position, removing the 24V signal
from the input port. The inverter inputs work in this manner in order to provide a level of fail-
safe protection. For example, if a limit switch was to fail and open circuit, the system would
stop. The layout and wiring of the toggle switches, as well as a description of the function of
each of the switches can be found in Appendix D.

33
Enclosure L.E.D Indicators
In the bench tested system, three 24V L.E.D indicators were connected to the inverters. These
L.E.D indicators were originally included in the design of the actual system, however they have
since been removed as they have proved unnecessary for the operation of the system. The
removal of these L.E.Ds has also been beneficial in maximising the space available within the
enclosure.
4.8 Enclosure
Several important factors needed to be considered when designing the electrical enclosure for
the system. These considerations will now be discussed.
4.8.1 Physical Size and VSD Installation Specifications
The internal size of the electrical enclosure needed to be capable of not only housing all of the
necessary components but also needed to cater for the following requirements for the
installation of the VSDs, as outlined in the MOVIDRIVE MDX60B/61B Operating Instructions
[25]:
A minimum of 100mm clearance above and below the VSD unit. No side clearance is
required (VSDs can be mounted directly next to each other)
An unobstructed cooling air supply
Units must be installed vertically
The initial thought for the enclosure was to allow the VSDs to be mounted forward facing,
allowing maximum space utilisation within the enclosure. This configuration would require an
enclosure with a minimum depth of 450mm. An enclosure was already owned by the Murdoch
University School of Engineering, however this enclosure only had a depth of 250mm. After
consultation with John Boulton, the workshop technician at Murdoch University, it was
decided that the best solution to this issue would be to mount the VSDs on the side wall of the

34
enclosure and install the rest of the components around the VSDs (see Figure 4-12). The bolts
used to fix the VSDs on the side wall of the enclosure were sealed with a suitable silicone
sealing agent to prevent the ingress of water.
Figure 4-12 (VSD Mount)
4.8.2 Ingress Protection
The enclosure needed to provide adequate protection from the harsh weather conditions that
the enclosure would be exposed to. The enclosure that was available had an Ingress Protection
(IP) rating of IP66, which, as outlined in AS60529:2004 Tables 2 & 3, means that it provides
protection from dust and powerful jets of water whilst also preventing access to hazardous
35
parts [14]. This protection was considered more than adequate for the installation
environment.
4.8.3 Ventilation
As well as the above mentioned requirement for the VSDs to have an unobstructed cooling air
supply, the MOVIDRIVE MDX60B/61B Operating Instructions also outlines 70 °C to be the
maximum storage temperature of the VSDs [25]. In order to achieve this, it was decided that a
vent and fan should be installed in the enclosure. Due to the VSDs emitting heat from both the
top and bottom of the units, fresh air would ideally be drawn from the top to the bottom of
the units. It was decided that if the fan could be mounted on the bottom of the enclosure, this
would negate the concern that the opening for the fan would allow the ingress of water (see
Figure 4-15). A louvered vent was installed on the top right side wall opposite the VSDs (see
Figure 4-13). A dust filter was installed between the vent and enclosure in order to prevent
excess dust being blown into the enclosure (see Figure 4-14). Since the fan would only need to
operate during daylight hours and on occasions when the ambient temperature of the
enclosure was exceeding a pre-set limit, it was decided that the fan should be operated
through a DIN mounted KTS 011 normally open thermostat, and set to operate when the
internal temperature of the enclosure exceeded 30˚ Celsius [26].

36
Figure 4-13 (Vent)
Figure 4-14 (Vent Dust Filter)
Figure 4-15 (Enclosure Fan)
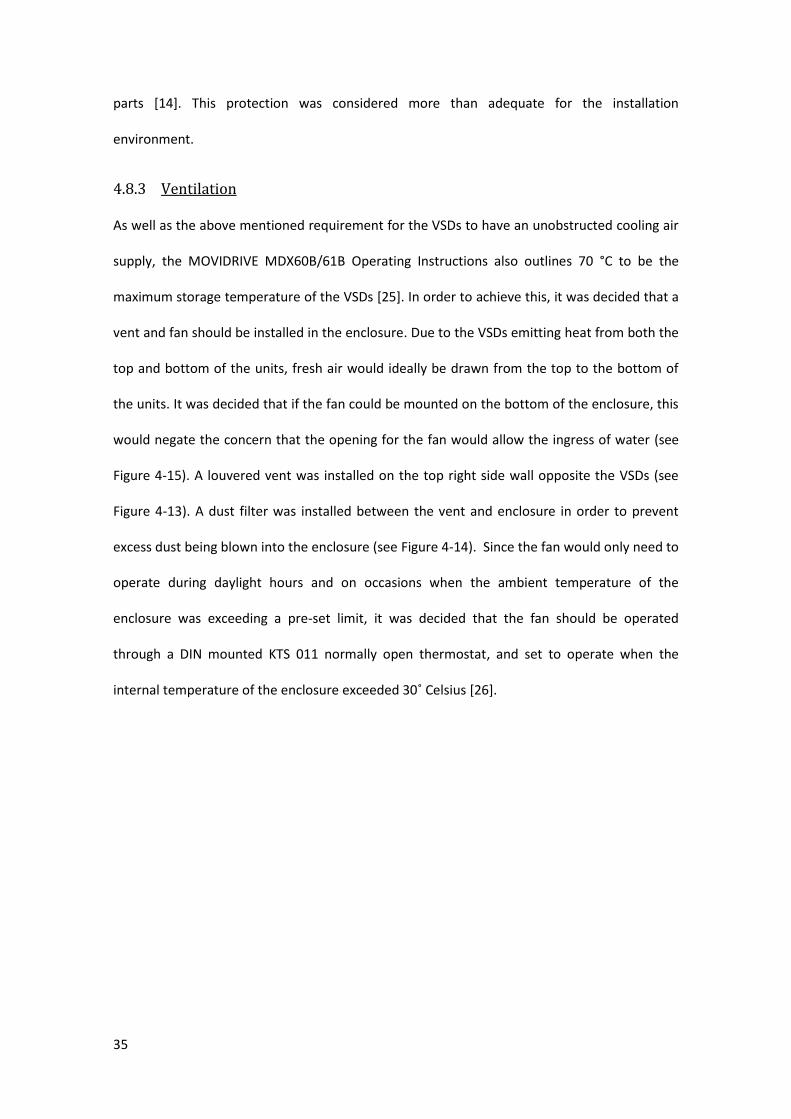
4.8.4 Internal Components
DIN railing, ducting, a neutral bar and an earth bar were all installed in the enclosure (see
Figure 4-16). The following components were then installed on the DIN rail and wired (see
Figure 4-17):
Main Isolating Switch
2x 16A 3 Phase C Curve Circuit Breakers
10A 1 Phase C Curve Circuit Breaker
Fan Thermostat Switch
24V VSD Input Switches
24V Indicator Lights
37
Figure 4-16 (DIN and Ducting)
Figure 4-17 (Enclosure Components)
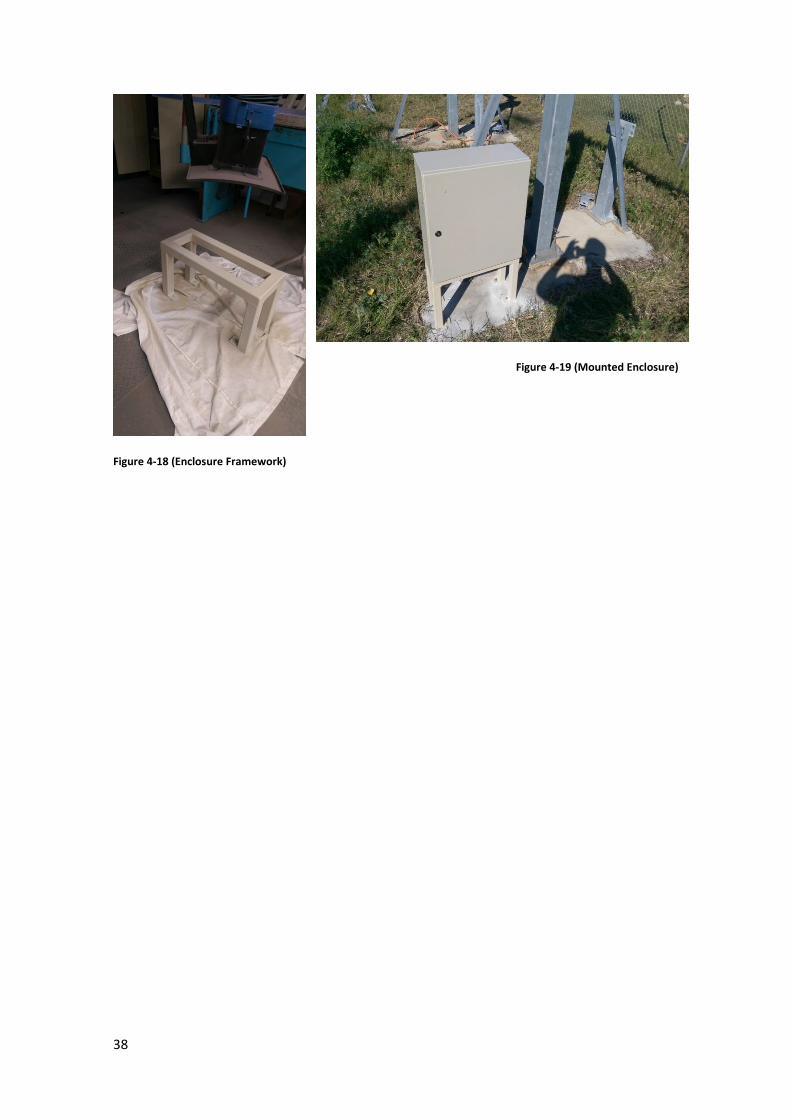
4.8.5 Framework
Due to the existing submains cable being installed directly under the array support beam, it
was necessary to install the enclosure slightly offset from where the existing cable comes
through the concrete slab. This configuration enables the cables to sweep up into the bottom
of the enclosure. To achieve this, a frame was built for the enclosure that would raise the
enclosure 250mm off the ground. The frame was constructed using 50 x 50mm heavy duty
steel tubing. The frame was then spray painted to both prevent rust and match the colour of
the enclosure (see Figure 4-18). The enclosure was mounted onto the framework and the
framework was mounted onto an existing concrete slab underneath the solar array framework
(see Figure 4-19).
38
Figure 4-18 (Enclosure Framework)
Figure 4-19 (Mounted Enclosure)

39
Chapter 5 Electrical Testing
5.1 Visual Inspections
The visual inspection of an electrical installation is one of the most important tests that can be
carried out prior to energising an installation, as it can be one of the easiest methods of picking
up faults that may not be obvious when testing using instruments. AS 3000 section 8.2
contains an extensive list of recommended visual inspections that can be carried out. Some of
these recommended tests are not relevant to the electrical installation in question and
therefore have not been carried out. However, a comprehensive list of visual inspection items
has been adapted from AS3000 and carried out on the installation. The complete list of visual
inspections carried out and their results are presented in Appendix E.
5.2 Testing Instruments
The quality and accuracy of the testing instruments used to conduct the mandatory tests is
crucial to being able to trust that the installation is installed to standards. This section will
briefly introduce the instruments that were used when testing the electrical system.
5.2.1 DMM
The digital multimeter that was used was a Keysight U1252B. This meter was used to perform
all resistance measurements; these tests were carried out on the Ω scale. The meter’s assumed
accuracy when using this scale is 0.05 + 10 (% of reading + no of significant figures) [27].
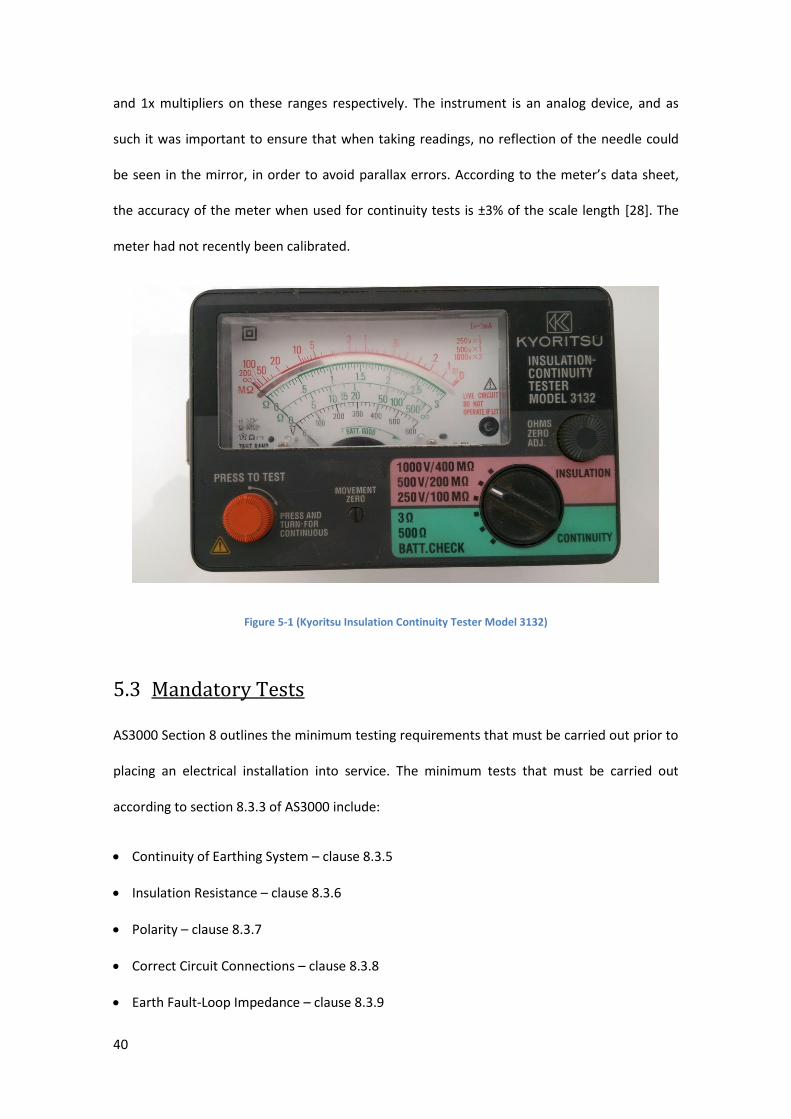
5.2.2 Insulation Continuity Tester
The Insulation continuity tester that was used was a Kyoritsu Insulation Continuity Tester
Model 3132 (see Figure 5-1). This instrument was used to perform all insulation resistance
tests, carried out on both the 250V/100MΩ and 500V/200MΩ ranges. The readings have 0.5x
40
and 1x multipliers on these ranges respectively. The instrument is an analog device, and as
such it was important to ensure that when taking readings, no reflection of the needle could
be seen in the mirror, in order to avoid parallax errors. According to the meter’s data sheet,
the accuracy of the meter when used for continuity tests is ±3% of the scale length [28]. The
meter had not recently been calibrated.
Figure 5-1 (Kyoritsu Insulation Continuity Tester Model 3132)
5.3 Mandatory Tests
AS3000 Section 8 outlines the minimum testing requirements that must be carried out prior to
placing an electrical installation into service. The minimum tests that must be carried out
according to section 8.3.3 of AS3000 include:
Continuity of Earthing System – clause 8.3.5
Insulation Resistance – clause 8.3.6
Polarity – clause 8.3.7
Correct Circuit Connections – clause 8.3.8
Earth Fault-Loop Impedance – clause 8.3.9
41
Operation of RCDs – clause 8.3.9 (Not relevant to this project)
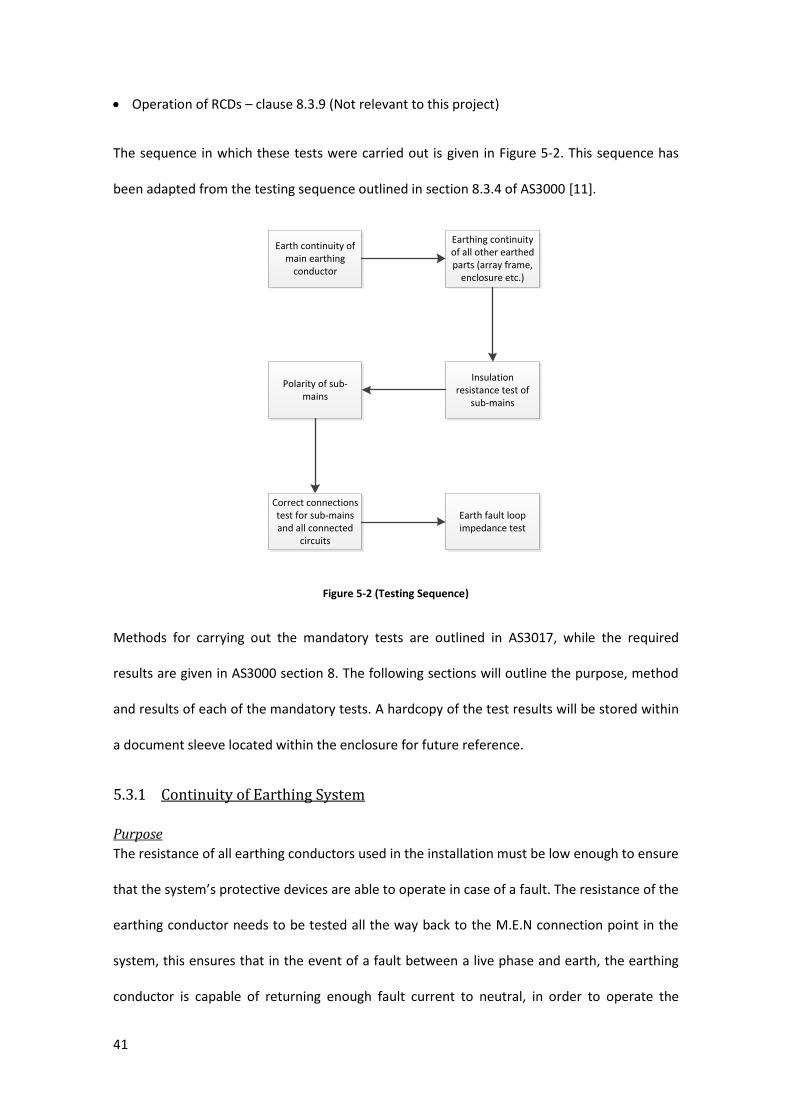
The sequence in which these tests were carried out is given in Figure 5-2. This sequence has
been adapted from the testing sequence outlined in section 8.3.4 of AS3000 [11].
Earth continuity of main earthing
conductor
Earthing continuity of all other earthed parts (array frame,
enclosure etc.)
Insulation resistance test of
sub-mains
Polarity of sub-mains
Correct connections test for sub-mains and all connected
circuits
Earth fault loop impedance test
Figure 5-2 (Testing Sequence)
Methods for carrying out the mandatory tests are outlined in AS3017, while the required
results are given in AS3000 section 8. The following sections will outline the purpose, method
and results of each of the mandatory tests. A hardcopy of the test results will be stored within
a document sleeve located within the enclosure for future reference.
5.3.1 Continuity of Earthing System
Purpose
The resistance of all earthing conductors used in the installation must be low enough to ensure
that the system’s protective devices are able to operate in case of a fault. The resistance of the
earthing conductor needs to be tested all the way back to the M.E.N connection point in the
system, this ensures that in the event of a fault between a live phase and earth, the earthing
conductor is capable of returning enough fault current to neutral, in order to operate the

42
circuit’s over current protective devices. The resistance of the main earthing conductor
connecting the M.E.N and earthing electrode was also tested.
Method
Since the new electrical enclosure is located approximately 15m away from the existing
switchboard, it was necessary to test the earth continuity through a trailing lead. An extension
lead was used as the trailing lead, with the earthing conductor of the extension lead connected
to the main earthing conductor at one end of the cable and the resistance of the earth loop
was measured using a Digital Multimeter (DMM) at the other end. The resistance of the
trailing lead was then measured. The resistance of the main earthing conductor was then
calculated using Equation 8, as outlined in AS3018 [12].
𝑅𝑀𝑎𝑖𝑛 𝐸𝑎𝑟𝑡ℎ𝑖𝑛𝑔 𝐶𝑜𝑛𝑑𝑢𝑐𝑡𝑜𝑟 = 𝑅𝐸𝑎𝑟𝑡ℎ𝑖𝑛𝑔 𝐿𝑜𝑜𝑝 − 𝑅𝑇𝑟𝑎𝑖𝑙𝑖𝑛𝑔 𝐿𝑒𝑎𝑑 Equation (8)
It was also important to test the resistance of the earthing conductor between the M.E.N link
and the earth electrode located at the existing switchboard.
Results
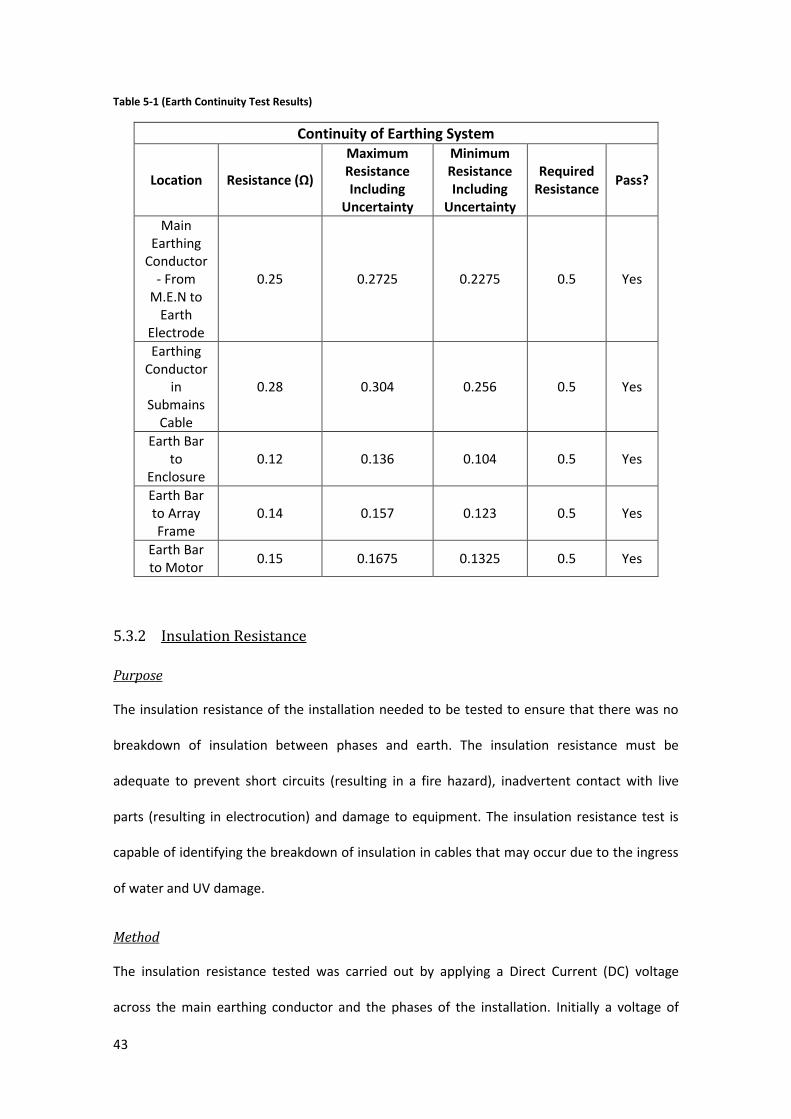
AS3000 section 8.3.5.2 states that the resistance of the main earthing conductor, or any
equipotential earthing conductor, be no more than 0.5Ω [11]. All earthing conductors were
tested and found to be below the required resistance (see Table 5-1).
43
Table 5-1 (Earth Continuity Test Results)
Continuity of Earthing System
Location Resistance (Ω)
Maximum Resistance Including
Uncertainty
Minimum Resistance Including
Uncertainty
Required Resistance
Pass?
Main Earthing
Conductor - From
M.E.N to Earth
Electrode
0.25 0.2725 0.2275 0.5 Yes
Earthing Conductor
in Submains
Cable
0.28 0.304 0.256 0.5 Yes
Earth Bar to
Enclosure 0.12 0.136 0.104 0.5 Yes
Earth Bar to Array Frame
0.14 0.157 0.123 0.5 Yes
Earth Bar to Motor
0.15 0.1675 0.1325 0.5 Yes
5.3.2 Insulation Resistance
Purpose
The insulation resistance of the installation needed to be tested to ensure that there was no
breakdown of insulation between phases and earth. The insulation resistance must be
adequate to prevent short circuits (resulting in a fire hazard), inadvertent contact with live
parts (resulting in electrocution) and damage to equipment. The insulation resistance test is
capable of identifying the breakdown of insulation in cables that may occur due to the ingress
of water and UV damage.
Method
The insulation resistance tested was carried out by applying a Direct Current (DC) voltage
across the main earthing conductor and the phases of the installation. Initially a voltage of
44
250V DC was used, followed by a test at 500V DC. It was extremely important to ensure that
the VSDs in the system were disconnected, as applying a voltage can potentially damage
sensitive electronic equipment [12].
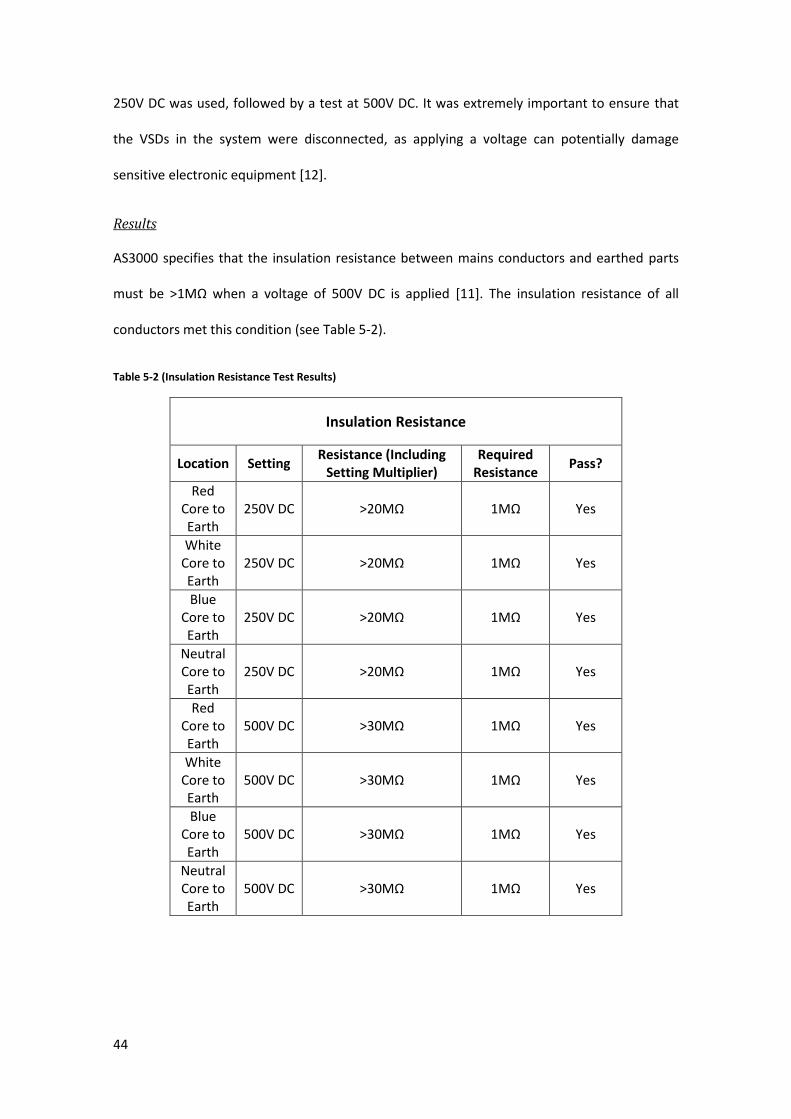
Results
AS3000 specifies that the insulation resistance between mains conductors and earthed parts
must be >1MΩ when a voltage of 500V DC is applied [11]. The insulation resistance of all
conductors met this condition (see Table 5-2).
Table 5-2 (Insulation Resistance Test Results)
Insulation Resistance
Location Setting Resistance (Including
Setting Multiplier) Required
Resistance Pass?
Red Core to Earth
250V DC >20MΩ 1MΩ Yes
White Core to Earth
250V DC >20MΩ 1MΩ Yes
Blue Core to Earth
250V DC >20MΩ 1MΩ Yes
Neutral Core to Earth
250V DC >20MΩ 1MΩ Yes
Red Core to Earth
500V DC >30MΩ 1MΩ Yes
White Core to Earth
500V DC >30MΩ 1MΩ Yes
Blue Core to Earth
500V DC >30MΩ 1MΩ Yes
Neutral Core to Earth
500V DC >30MΩ 1MΩ Yes
45
5.3.3 Polarity
Purpose
The polarity test is carried out to ensure that there has been no transposed phase, neutral or
earthing conductors. The transposition of these conductors at the point of supply can result in
the entire earthing system of the installation becoming live, whereas the incorrect connection
of these conductors at any part of the installation can result in live exposed parts in the
system. It is also vital to test that the isolation points of the system disconnect the phase
rather than the neutral conductor, as this ensures that the equipment in the installation can be
safely isolated for maintenance [11].
Method
Correct circuit polarity was tested in the following manner. Each conductor in the submains
cable was end to end tested. For example, the neutral conductor was tested for continuity
between the neutral conductor at one end of the cable and the neutral bar in the new
electrical enclosure, it was then ensured that no continuity was present between the neutral
and phase connection points and earth. This procedure was carried out for all phases, neutral
and the earth conductor. The polarity of the isolating devices was then tested by measuring
the continuity of the phases from the point of connection in the new electrical enclosure (top
of the main isolation switch) to the point of connection at the devices; the isolation switch was
then manually operated to ensure that the continuity was interrupted.
Results
Testing confirmed that no conductors were transposed during installation; all isolation devices
also disconnected the active connection to each of the VSDs and the fan.

46
5.3.4 Correct Circuit Connections
Purpose
The correct circuit connection test is important to ensure that no incorrect connections have
been made between phases, phases to earth and neutral to earth. It is different from the
polarity test in that the test ensures that no two conductors have been inadvertently
connected together. The incorrect connection of two conductors would result in short circuits
and can potentially lead to fire [11].
Method
The simplest method of testing for correct circuit connections was to test for continuity at the
supply end of the submains cable between all phases, all phase to neutral and all phases to
earth. It was important to ensure that all isolation devices were in their ‘on’ position to ensure
that the circuit connections were tested through the entire circuit. Since the motor cabling was
connected through the VSDs, these cables needed to be tested at the point of connection to
the VSDs [12].
Results
Testing confirmed that no incorrect circuit connections were made during installation.
5.3.5 Earth Fault Loop Impedance
Purpose
The purpose of carrying out an earth fault loop impedance test is to ensure that under fault
conditions the impedance of the fault loop is low enough to allow sufficient current flow for
the circuit’s protection device to operate within its specified disconnection time. In the
situation of a fault to earth, if the fault loop impedance is not significantly lower than the
original circuit impedance, the increase in current flow in the circuit may not be large enough
to cause the circuit’s overcurrent device to trip in an appropriate time. The fault loop is
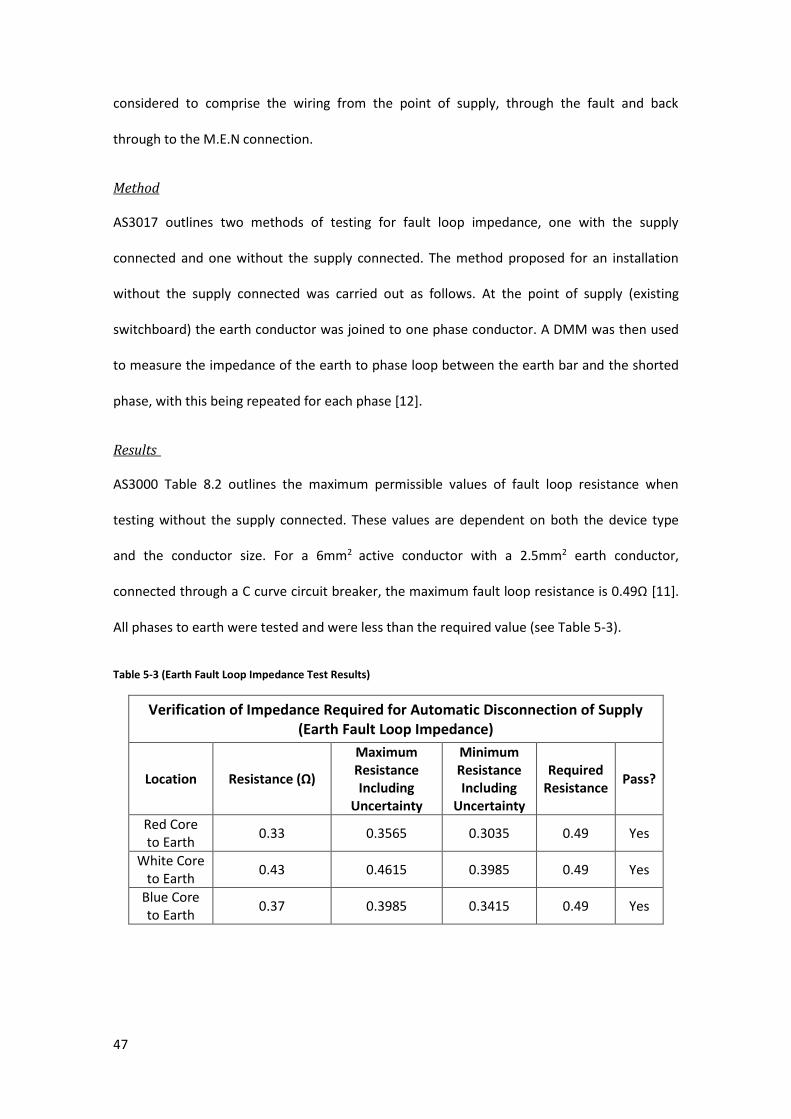
47
considered to comprise the wiring from the point of supply, through the fault and back
through to the M.E.N connection.
Method
AS3017 outlines two methods of testing for fault loop impedance, one with the supply
connected and one without the supply connected. The method proposed for an installation
without the supply connected was carried out as follows. At the point of supply (existing
switchboard) the earth conductor was joined to one phase conductor. A DMM was then used
to measure the impedance of the earth to phase loop between the earth bar and the shorted
phase, with this being repeated for each phase [12].
Results
AS3000 Table 8.2 outlines the maximum permissible values of fault loop resistance when
testing without the supply connected. These values are dependent on both the device type
and the conductor size. For a 6mm2 active conductor with a 2.5mm2 earth conductor,
connected through a C curve circuit breaker, the maximum fault loop resistance is 0.49Ω [11].
All phases to earth were tested and were less than the required value (see Table 5-3).
Table 5-3 (Earth Fault Loop Impedance Test Results)
Verification of Impedance Required for Automatic Disconnection of Supply (Earth Fault Loop Impedance)
Location Resistance (Ω)
Maximum Resistance Including
Uncertainty
Minimum Resistance Including
Uncertainty
Required Resistance
Pass?
Red Core to Earth
0.33 0.3565 0.3035 0.49 Yes
White Core to Earth
0.43 0.4615 0.3985 0.49 Yes
Blue Core to Earth
0.37 0.3985 0.3415 0.49 Yes

48
Chapter 6 Commissioning
Once the electrical installation had been installed and tested, it was possible to begin
commissioning the system. The aim of the commissioning phase was to ensure correct
operation of the motors and inverters, as well as beginning the testing and refining of the
previously developed LabVIEW software. The commissioning phase was broken down into the
following steps:
Control motors manually using Movitools Motionstudio
Control motors using LabVIEW software
Test the accuracy of the LabVIEW tracking software
Refine the written LabVIEW software
The issues encountered and the outcomes of each of these steps will be discussed in the
following sections.
6.1 Manual Control Using Movitools Motionstudio
As a first step in commissioning the system, an attempt was made to control the motors
manually using Movitools Motionstudio’s inbuilt manual mode. Since a considerable amount
of time was spent in this project resolving various faults that arose in trying to manually
control the motors, and since there was, a significant lack of documentation by previous
project holders regarding these faults, it was decided that it was important to identify these
faults and document their resolution. This section will summarise the fault type, the possible
causes of the fault, the investigation that was carried out into the fault, and the way the fault
was ultimately rectified.
49
6.1.1 F14: Encoder Fault
Fault Type
A persistent Fault F14 was initially encountered when trying to control the TILT motor in
manual mode using Movitools Motionstudio.
Possible Causes
The Movitools MDX60B/61B Inverter Operating Instructions lists the following possible causes
for a F14 fault:
Incorrect encoder cable/shield connection
Possible short circuit/broken encoder cable
defective encoder
Fault Investigation
In order to investigate this fault, the following steps were undertaken. Firstly, the encoder
cable wiring was tested to ensure continuity between the required pins on either end of the
encoder. This test confirmed that the cable was wired correctly and as such this cause was
ruled out. The motor that was used on the bench tested system was then taken down to the
PV enclosure and was temporarily connected in place of the existing motor. Upon connecting
the new motor, the fault was found to be cleared, indicating that there was a fault with the
encoder on the existing motor. The encoder end plate was then taken off the motor in order to
check for any obvious signs of a fault. It was then discovered that the motor encoder was
severely damaged by the ingress of water (see Figure 6-1); it was found that the cap that had
been placed on the encoder connection had been sun damaged and had become brittle and
cracked over time thereby allowing the ingress of water into the encoder.

50
Figure 6-1 (Damaged Encoder)
Fault correction
Initially the possibility of only replacing the motor was investigated; this would allow the
gearbox to remain coupled to the shaft and would facilitate a much simpler changeover. It was
decided that the construction of the gearbox would not allow the motor to be removed easily;
therefore, it was decided that the entire motor and gearbox should be replaced with the
motor and gearbox that was currently being used on the bench test system.
6.1.2 F43: RS485 – Timeout / ST1 Fault
Fault Type
When the motor was placed into manual mode, the popup window shown in Figure 6-2 would
appear. This window would continue to appear whenever a command was sent to the VSD.

51
Figure 6-2 (ST1 Fault Popup Window)
Possible Causes
Section 6.2 of the Movidrive MSX60B/61B Operating Instructions contains information relating
to the various information messages that can be acknowledged in Movitools Motionstudio.
The table provides the following information for the fault in question [25]:
“Manual Operation must be completed using X13:ST11/ST12 (RS485)”
This information highlighted that the error was connected to the RS485 communication link
between the operating terminal and the VSD. No further information was provided by SEW
documentation.
Fault Investigation
Since very limited information was available relating to the fault, and given the fact that the
fault had only appeared since relocating the system from the bench test environment to the
PV facility, it was decided that the fault must have been introduced during the installation of
the system. The approach that was taken to identify the fault was a methodical process of
elimination.
The first point of investigation was the computer terminal in use - the settings for the
communications (COMM) port in use were checked in the computers device manager. These
settings were checked to ensure that the COMM port was configured using the correct baud

52
rate, data bits, parity, stop bits and flow control, as outlined in previous thesis work as well as
the MOVIDRIVE Serial Communications manual.
With these settings verified as correct, the possibility of a setting in the software not being
correct was investigated. To test this, the computer terminal being used was replaced with the
terminal that was used for the bench test system. With this computer terminal installed, the
motor was again placed into manual mode, but the fault was still present.
With the computer communications settings as well as the terminal itself being ruled out as
possibilities, the next step was to test the communications cabling that was installed between
the computer terminal and the VSDs. To achieve this, a laptop with Movitools Motionstudio
installed was borrowed from the school, a much shorter communications link was then made
up and the laptop was connected directly to the faulting VSD. However, the fault remained
when the VSD was placed into manual mode. It was then noticed that whenever the error
would popup on Movitools Motionstudio, the VSD display would also show F43 (RS485
Timeout). This fault was never previously noticed as the fault seemed to only display for a
limited time after the error was generated. The communications timeout parameter P812 was
increased in an effort to try and overcome the fault, this had no effect and the fault remained.
In a final effort to eliminate the fault, the possibility of a fault within the VSD itself was
investigated. Since the school owned a second VSD that was initially brought for the second
CSP PV system, it was possible to replace the existing VSD with this spare VSD. Once the spare
VSD was installed, the VSD was successfully placed into manual mode. The VSD settings that
were available were then downloaded to the new VSD. This download immediately generated
the fault once again. Through this process of elimination, it was determined that the fault was
being generated due to the parameter files that were downloaded on the VSD.
53
Fault Correction
The parameter file that was causing the VSD to fault was thoroughly compared against the
parameter file for the ROLL motor VSD. These settings files were found to be similar in all
parameters that related to the VSDs’ communications. In consultation with Will Stirling, a
technical support technician at Murdoch University, a search was done through the entire ENG
Shared folder for any ‘.vd0’ files. This search found two files that had a later modification date
than the two files that were currently thought to be the correct settings. These two files were
downloaded to the VSDs and the fault was no longer present, so the original VSD was then
returned to service. Since then the error has appeared on several occasions when parameter
settings have been changed, the parameter files are then re-downloaded and the fault is
cleared. Whilst the original cause of the fault is still unknown, it is believed that the parameter
files were becoming corrupted in some way when parameters were changed. This fault has
highlighted the need for the clear labelling of parameter files, as the previous organisation of
the parameter files lacked any clear labelling. For this reason, an output of both inverters’
parameters as they existed at the conclusion of this project can be found in the electronic
attachment of this thesis (see Appendix H).
6.1.3 F8: Speed Monitoring
Fault Type
Fault F8 Speed Monitoring would appear soon after giving the motor a speed setpoint.
Possible Causes
The Movidrive MSX60B/61B Operating Instructions lists the following possible causes for an F8
fault:
Speed control operating at its limit due to a mechanical overload
Phase failure in power supply or motor

54
Encoder not connected correctly or incorrect direction of rotation
Fault Investigation
As this was the first time that an attempt had been made to operate the TILT motor under
load, the first thought was that the motor was not achieving the desired speed within the set
speed ramp time limits (P130 and P131). These were increased, however the fault remained.
As the resolver connection was checked in the investigation of a previous fault, this possibility
was not pursued.
The possibility of the motor being overloaded was then investigated. As discussed in section
3.1.4, an output torque of 1126.3 Nm is available at the TILT shaft. The torque required to
rotate the TILT beam has never been calculated. However, after consultation with Graeme
Cole, it was considered reasonable that the required torque would be much less than the
available torque, and therefore, the possibility of the motor being overloaded was
disregarded.
Steven Vulin, an applications engineer at SEW EURODRIVE was then contacted for technical
support relating to the fault. The email thread can be seen in Appendix F. Steven suggested the
possibility that two phases of the motor supply cable running from the VSD to the motor may
have been transposed; this possibility was then investigated and it was found that the red and
blue phases of the motor supply cable had in fact been transposed during installation. The
transposition of these phases could not have been picked up during the correct circuit
connections test as the markings on the motor connection plug were not clearly marked.
6.1.3.1 Fault Correction
The phase connection was changed at the point of connection to the motor so as to make the
connection at both ends consistent, resulting in the fault being cleared. Initially this fault was
not understood, as the transposition of two phases of a three phase motor would only cause
the reversal of the motor. It was then realised that the MDX61B inverter must be equipped

55
with the ability to know the phase sequence of the connected three phase supply. With this
knowledge and the feedback from the motor resolver of the actual direction of rotation, the
inverter is able to detect any discrepancy and remove the power supply to the motor
immediately.
6.2 Existing LabVIEW Program Testing and Improvements
The current version of the LabVIEW control software ‘Solar Tracker V3.0’, developed by
previous thesis students and most recently by Gregorious Gazali, needed to be tested for its
effectiveness in tracking the sun, and then refined. This section will discuss the plan that was
made to enable testing of the software, the current state of the program, with emphasis on
several key parts of the program and how they relate to the testing carried out, followed by a
discussion of the tests that were carried out on the software and the improvements that were
made as a result of those tests.
6.2.1 Plan for Testing the Solar Tracker
After consultation with Dr Martina Calais, it was decided that an effective method of testing
that the solar tracker is correctly tracking the sun would be to use an instrument called a
pyrheliometer. A pyrheliometer is an instrument that has been designed to measure beam, or
direct radiation. This is achieved by only allowing a solar irradiance beam of 5 degrees to pass
through a blackened cylinder and activate a thermopile, converting heat to an electrical signal
[29]. This makes the pyrheliometer ideal for testing the effectiveness of a solar tracker. Figure
6-3, shows a simple illustration of the operation of a pyrheliometer that has been adapted
from W.B Stine and R.W. Harrington’s book ‘Solar Energy Systems Design’ [30].
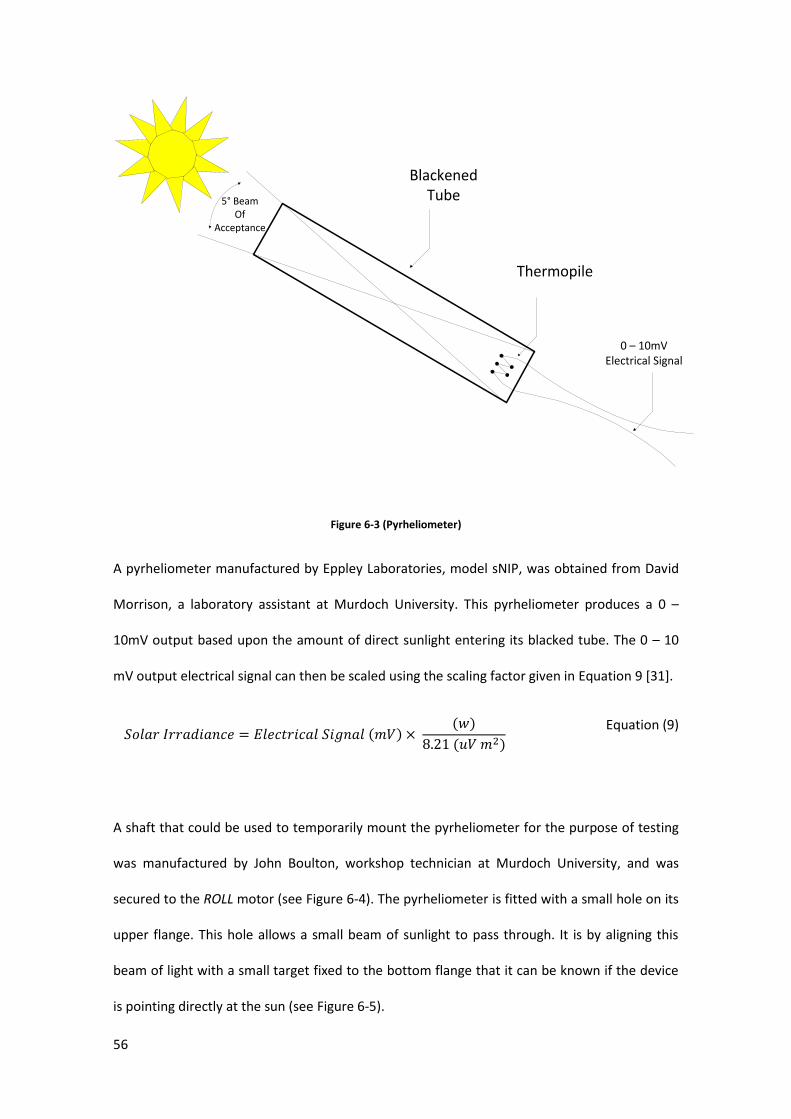
56
5° Beam Of
Acceptance
Thermopile
0 – 10mV Electrical Signal
Blackened Tube
Figure 6-3 (Pyrheliometer)
A pyrheliometer manufactured by Eppley Laboratories, model sNIP, was obtained from David
Morrison, a laboratory assistant at Murdoch University. This pyrheliometer produces a 0 –
10mV output based upon the amount of direct sunlight entering its blacked tube. The 0 – 10
mV output electrical signal can then be scaled using the scaling factor given in Equation 9 [31].
𝑆𝑜𝑙𝑎𝑟 𝐼𝑟𝑟𝑎𝑑𝑖𝑎𝑛𝑐𝑒 = 𝐸𝑙𝑒𝑐𝑡𝑟𝑖𝑐𝑎𝑙 𝑆𝑖𝑔𝑛𝑎𝑙 (𝑚𝑉) × (𝑤)
8.21 (𝑢𝑉 𝑚2)
Equation (9)
A shaft that could be used to temporarily mount the pyrheliometer for the purpose of testing
was manufactured by John Boulton, workshop technician at Murdoch University, and was
secured to the ROLL motor (see Figure 6-4). The pyrheliometer is fitted with a small hole on its
upper flange. This hole allows a small beam of sunlight to pass through. It is by aligning this
beam of light with a small target fixed to the bottom flange that it can be known if the device
is pointing directly at the sun (see Figure 6-5).
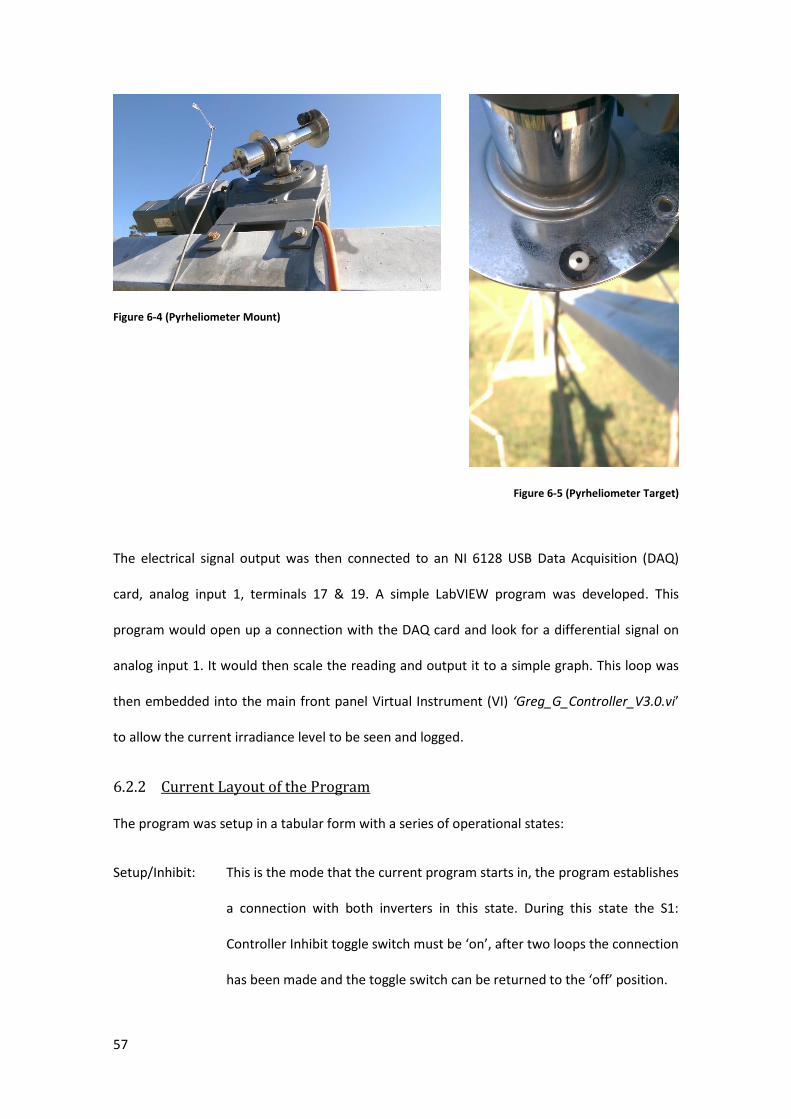
57
Figure 6-4 (Pyrheliometer Mount)
Figure 6-5 (Pyrheliometer Target)
The electrical signal output was then connected to an NI 6128 USB Data Acquisition (DAQ)
card, analog input 1, terminals 17 & 19. A simple LabVIEW program was developed. This
program would open up a connection with the DAQ card and look for a differential signal on
analog input 1. It would then scale the reading and output it to a simple graph. This loop was
then embedded into the main front panel Virtual Instrument (VI) ‘Greg_G_Controller_V3.0.vi’
to allow the current irradiance level to be seen and logged.
6.2.2 Current Layout of the Program
The program was setup in a tabular form with a series of operational states:
Setup/Inhibit: This is the mode that the current program starts in, the program establishes
a connection with both inverters in this state. During this state the S1:
Controller Inhibit toggle switch must be ‘on’, after two loops the connection
has been made and the toggle switch can be returned to the ‘off’ position.
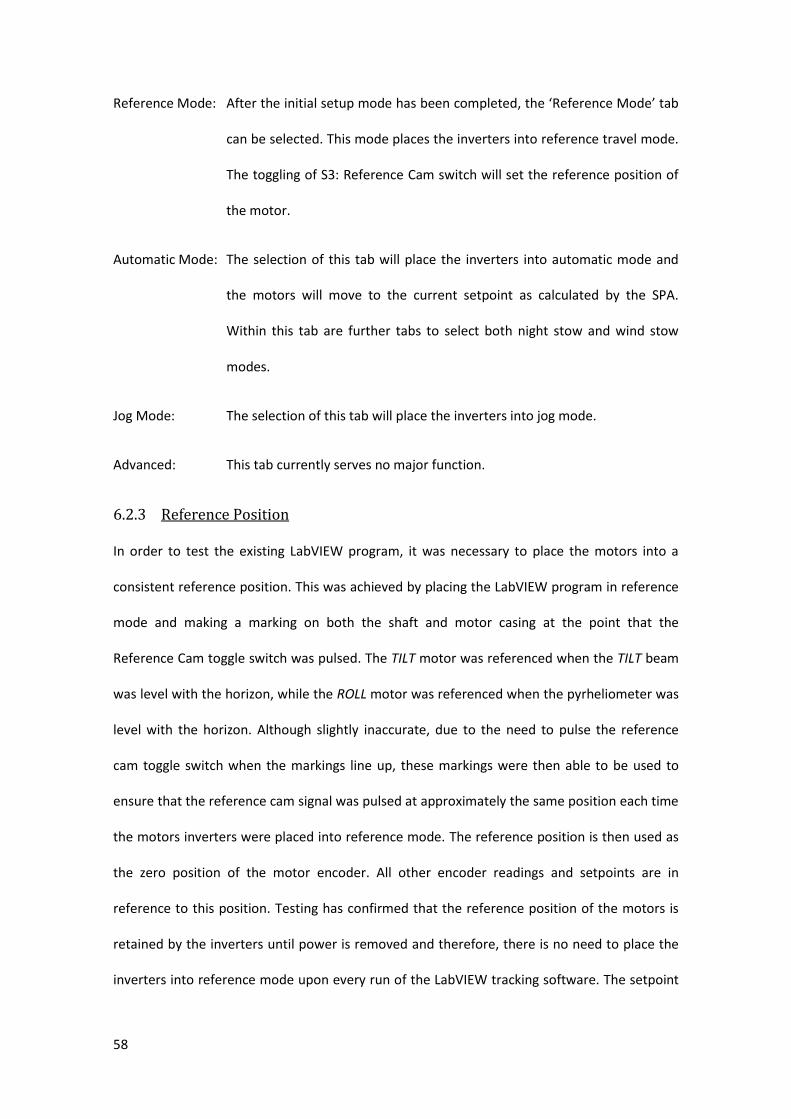
58
Reference Mode: After the initial setup mode has been completed, the ‘Reference Mode’ tab
can be selected. This mode places the inverters into reference travel mode.
The toggling of S3: Reference Cam switch will set the reference position of
the motor.
Automatic Mode: The selection of this tab will place the inverters into automatic mode and
the motors will move to the current setpoint as calculated by the SPA.
Within this tab are further tabs to select both night stow and wind stow
modes.
Jog Mode: The selection of this tab will place the inverters into jog mode.
Advanced: This tab currently serves no major function.
6.2.3 Reference Position
In order to test the existing LabVIEW program, it was necessary to place the motors into a
consistent reference position. This was achieved by placing the LabVIEW program in reference
mode and making a marking on both the shaft and motor casing at the point that the
Reference Cam toggle switch was pulsed. The TILT motor was referenced when the TILT beam
was level with the horizon, while the ROLL motor was referenced when the pyrheliometer was
level with the horizon. Although slightly inaccurate, due to the need to pulse the reference
cam toggle switch when the markings line up, these markings were then able to be used to
ensure that the reference cam signal was pulsed at approximately the same position each time
the motors inverters were placed into reference mode. The reference position is then used as
the zero position of the motor encoder. All other encoder readings and setpoints are in
reference to this position. Testing has confirmed that the reference position of the motors is
retained by the inverters until power is removed and therefore, there is no need to place the
inverters into reference mode upon every run of the LabVIEW tracking software. The setpoint

59
was set to zero on a number of occasions and the motor was checked to ensure that the shaft
returned to the previously marked reference position. This test confirmed that the motors will
retain an accurate reference position throughout multiple runs of the LabVIEW program.
6.2.4 Offset & Multiplier
When the LabVIEW program is placed into automatic mode, a position in degrees for each of
the two motors that is calculated within the SPA is sent from the SPA output, through a
multiplier and an offset. The purpose of the multiplier and offset are as follows:
Multiplier: Since the output from the SPA is in degrees, a conversion factor is
needed to convert degrees into encoder increments, so that a 1°
change in the output of the SPA corresponds to a 1° change in
position of the motor shaft. The multipliers for each of the motors
have been recorded in Gregourious Gazali’s thesis as being 3600
(ROLL) and 230 (TILT) increments per 360° rotation. After several
tests when the tracker would slowly go out of sync with the suns
movements, a simple test was performed to confirm these
increments. Markings were placed on the shaft and body of the
motors and the motors were manually increased by the recorded
increments to ensure the marks continued to line up. The ROLL
motor’s increments was confirmed to be 3600, while the TILT motor’s
increments was found to be 890. Therefore the multipliers need to
correlate a 1° change in the SPA output to a 1° change in motor
position was found to be 10 and 2.4722 for the ROLL and TILT motors
respectively. These multiplier values are different to the values given
in Gregorius Gazali’s thesis. They have been tested numerous times
and have proved to be correct on every occasion.

60
Offset: The offset is needed to adjust for the reference position of the
motors. For example, if the TILT motor has its zero reference when
the top of the beam is horizontal to the ground, the offset negates
the issue of the SPA calling this position 90°. The offset for each of
the motors is currently a user input on the front panel of the main
controller VI; this is due to the fact that the motors are extremely
unlikely to be referenced in exactly the same position upon each run.
This solution to the issue will be discussed in Chapter 7.
6.2.5 Logging Loop
Although the program already contained a loop that logged the data from various variables, it
was decided that a new loop would be implemented into the program. This new loop logged
the following data to a user selected ‘.csv’ file:
Date
Time
Tilt Angle (Zenith output from SPA.vi)
Tilt Multiplier
Tilt Offset
Tilt Setpoint
Roll Angle (Azimuth output from SPA.vi)
Roll Multiplier
Roll Offset
Roll Setpoint
Irradiance

61
6.2.6 Analysis of SPA Output
After the initial testing on the solar tracker was complete, it became obvious that there were
issues with the way the solar tracking algorithm was implemented. The algorithm that had
been implemented by Rhyss Edwards in 2010 was based upon an algorithm developed by
Ibrahim Reda and Afshin Andreas [4]. This algorithm calculates the azimuth and zenith angles
of the sun at all times for the period between the years 2000BC to 6000AD, it does this based
upon latitude and longitude values and the current date/time. A simple VI was written that
would log the current date/time as well as the algorithm’s output azimuth and zenith angles.
This VI was run for an entire day between 5:30 AM and 8:20 PM. An online calculator that was
developed by the U.S Naval Observatory [32] was then configured to output the suns azimuth
and altitude angles throughout the same day at one minute intervals. A sample of the data (30
minute intervals) from this test can be seen in Appendix G.
Figure 6-6, shows the output of the SPA’s zenith data in red and the data taken from the U.S
Naval Observatory in blue.
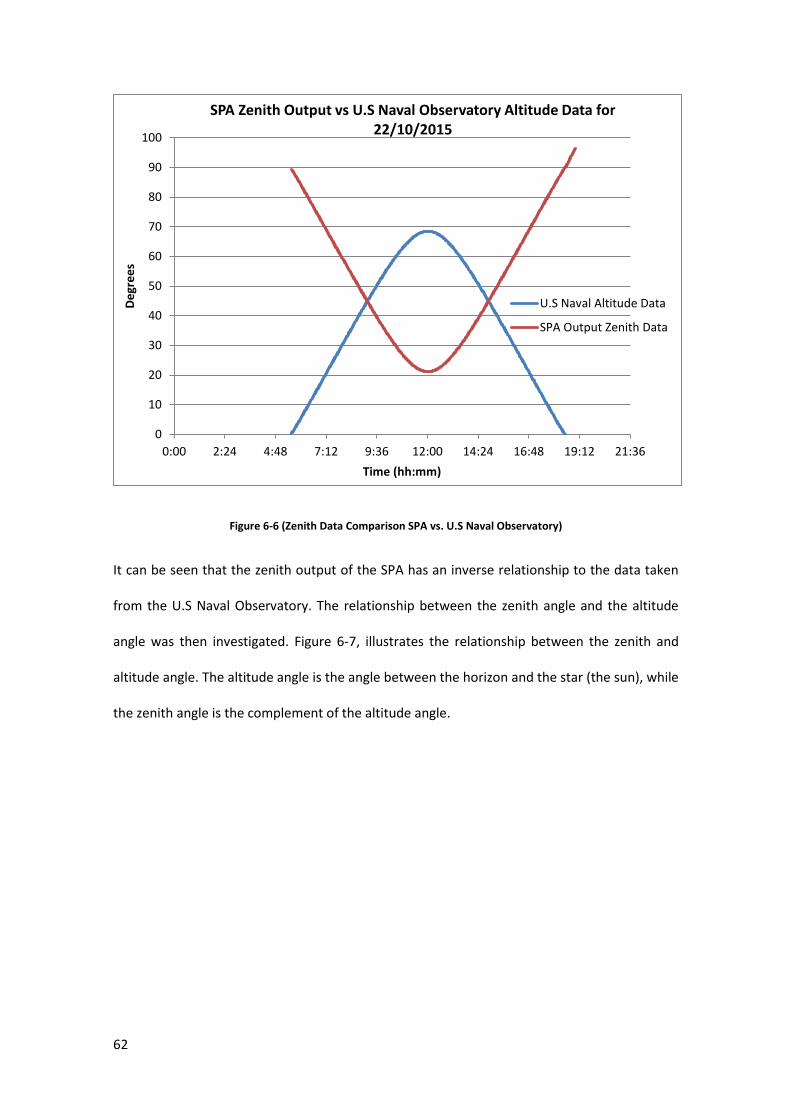
62
Figure 6-6 (Zenith Data Comparison SPA vs. U.S Naval Observatory)
It can be seen that the zenith output of the SPA has an inverse relationship to the data taken
from the U.S Naval Observatory. The relationship between the zenith angle and the altitude
angle was then investigated. Figure 6-7, illustrates the relationship between the zenith and
altitude angle. The altitude angle is the angle between the horizon and the star (the sun), while
the zenith angle is the complement of the altitude angle.
0
10
20
30
40
50
60
70
80
90
100
0:00 2:24 4:48 7:12 9:36 12:00 14:24 16:48 19:12 21:36
De
gre
es
Time (hh:mm)
SPA Zenith Output vs U.S Naval Observatory Altitude Data for 22/10/2015
U.S Naval Altitude Data
SPA Output Zenith Data
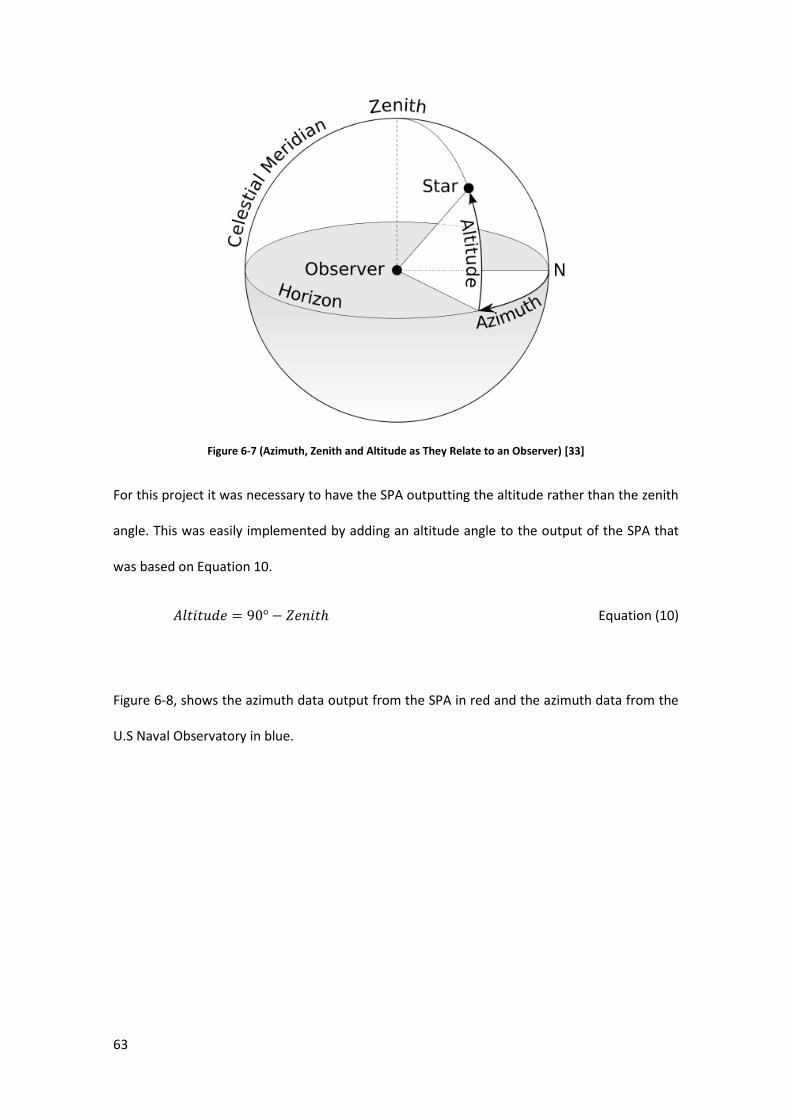
63
Figure 6-7 (Azimuth, Zenith and Altitude as They Relate to an Observer) [33]
For this project it was necessary to have the SPA outputting the altitude rather than the zenith
angle. This was easily implemented by adding an altitude angle to the output of the SPA that
was based on Equation 10.
𝐴𝑙𝑡𝑖𝑡𝑢𝑑𝑒 = 90° − 𝑍𝑒𝑛𝑖𝑡ℎ Equation (10)
Figure 6-8, shows the azimuth data output from the SPA in red and the azimuth data from the
U.S Naval Observatory in blue.

64
Figure 6-8 (Azimuth Data Comparison SPA vs. U.S Naval Observatory)
It can clearly be seen in this graph that the outputs of both data sources agree, with very little
error. This small error is believed to be due to slight discrepancies in the entered latitude and
longitude of the two sources. It can also be seen that at approximately 12:00 pm the azimuth
angle jumps from 0° up to 360°. This is due to the SPA taking a zero degree reference at the
suns peak position during the day. The effect that this has on the system was seen during the
initial testing phase, when at approximately 12pm the roll motor completed a full rotation. In
order to overcome this, a pre-existing LabVIEW function called UnwrapPhasePtByPt.VI was
used. This VI works by analysing the data being fed into it for shifts in data points of more than
pi radians (180°). If a shift in data points greater than this occurs, the VI then shifts the data
points down by 360°. A further test was conducted that confirmed the effectiveness of the
implemented solution (see Figure 6-9).
0
50
100
150
200
250
300
350
400
0:00 2:24 4:48 7:12 9:36 12:00 14:24 16:48 19:12 21:36
De
gre
es
Time (hh:mm)
SPA Azimuth Output vs U.S Naval Observatory Azimuth Data for 22/10/2015
U.S Naval Azimuth Data
SPA Output Azimuth Data
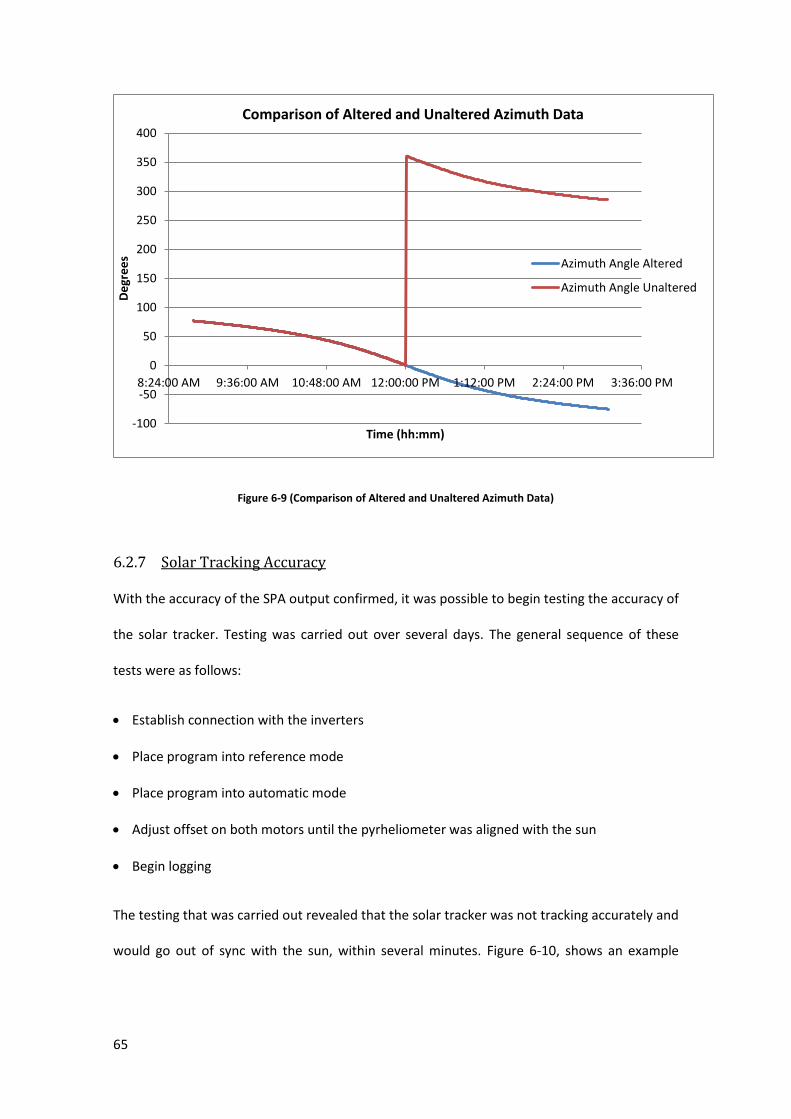
65
Figure 6-9 (Comparison of Altered and Unaltered Azimuth Data)
6.2.7 Solar Tracking Accuracy
With the accuracy of the SPA output confirmed, it was possible to begin testing the accuracy of
the solar tracker. Testing was carried out over several days. The general sequence of these
tests were as follows:
Establish connection with the inverters
Place program into reference mode
Place program into automatic mode
Adjust offset on both motors until the pyrheliometer was aligned with the sun
Begin logging
The testing that was carried out revealed that the solar tracker was not tracking accurately and
would go out of sync with the sun, within several minutes. Figure 6-10, shows an example
-100
-50
0
50
100
150
200
250
300
350
400
8:24:00 AM 9:36:00 AM 10:48:00 AM 12:00:00 PM 1:12:00 PM 2:24:00 PM 3:36:00 PM
De
gre
es
Time (hh:mm)
Comparison of Altered and Unaltered Azimuth Data
Azimuth Angle Altered
Azimuth Angle Unaltered

66
irradiance reading from one of these tests, it can be seen that the tracker has gone out of sync
with the suns movements within a 20 minute period.
Figure 6-10 (Example of an Irradiance vs Time Test)
Initially the reason for the tracker moving out of sync was unknown. It was then realised that
the trackers primary axis did not point directly from east to west. After conversations with
Trever Pryor, former Murdoch University Senior Lecturer, it was realised that even a slight
displacement of several degrees, would need to be accounted for by the tracking software.
The fact that the tracker was constructed with a fixed east west primary axis, with an inability
to rotate this axis, was then realised to be the main cause behind the tracker’s inaccuracy. The
algorithm that had been implemented would have been correct for a tracker that has the
freedom to rotate about a vertical axis. Research carried out into this revealed that for a fixed
east west axis, a conversion needed to be done to convert the azimuth and altitude angles to
the appropriate angles for a fixed primary axis tracker. A report entitled ‘General Formula for
On-Axis Sun-Tracking System’, was found to contain the information needed to implement this
solution [34]. Upon reading this report, it was decided that due to the work involved in
0
200
400
600
800
1000
1200
1400
1600
1800
2000
6:51:50 6:54:43 6:57:36 7:00:29 7:03:22 7:06:14 7:09:07 7:12:00
Irra
dia
nce
(W
/M2 )
Time (hh:mm:ss)
Irradiance vs Time

67
implementing the conversion and the late stage of the project, the conversion would not be
implemented but would instead be left for future project holders to implement.

68
Chapter 7 Future Recommendations
Due to the breadth of this thesis project, it is anticipated that at least two more theses could
cover the work needed to complete this project. There is still a large amount of work that
would be ideally suited towards an Industrial Computer Systems Engineering student, including
continued work on improving the accuracy of the tracker, researching and implementing the
correct reference mode, continued improvement and testing of the LabVIEW control program
and implementation of an embedded control terminal. A Renewable Energy Engineering
student could also carry out work including implementing and testing one of the various array
options and installing and testing various field measuring devices, such as a wind anemometer.
This section will briefly highlight and discuss some of the aspects of this project that could be
carried into future theses.
7.1 Possible Array Options
A major part of the future direction of this project will depend upon a decision on what the
solar array will be used for. Two possible options exist. Both of these options will utilise the
spare CSP mirrors and array framework that is available within the ROTA compound (see
Figure 7-1 and Figure 7-2). Since there are two identical arrays located adjacent to each other,
it is possible that both of these options could be explored. The physical construction of the
arrays have been explored by previous thesis students. However, the design and construction
of both of these options will need to be closely coordinated with John Boulton, workshop
technician at Murdoch University.
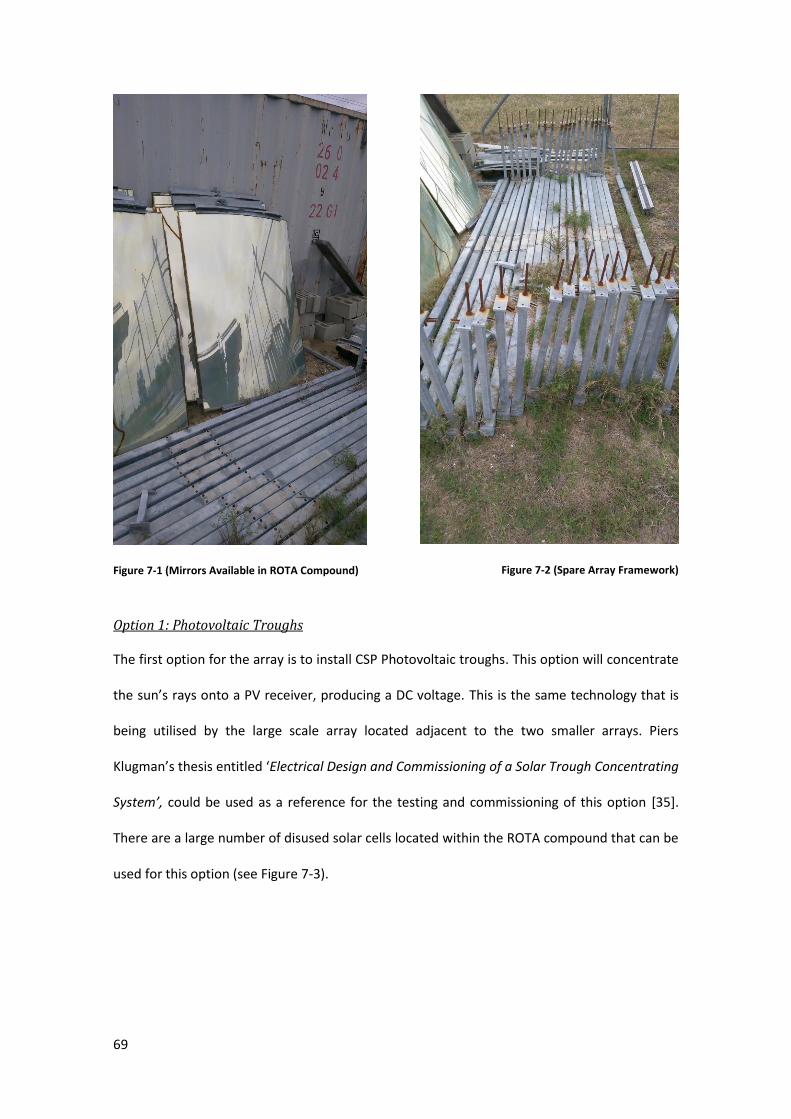
69
Figure 7-1 (Mirrors Available in ROTA Compound)
Figure 7-2 (Spare Array Framework)
Option 1: Photovoltaic Troughs
The first option for the array is to install CSP Photovoltaic troughs. This option will concentrate
the sun’s rays onto a PV receiver, producing a DC voltage. This is the same technology that is
being utilised by the large scale array located adjacent to the two smaller arrays. Piers
Klugman’s thesis entitled ‘Electrical Design and Commissioning of a Solar Trough Concentrating
System’, could be used as a reference for the testing and commissioning of this option [35].
There are a large number of disused solar cells located within the ROTA compound that can be
used for this option (see Figure 7-3).
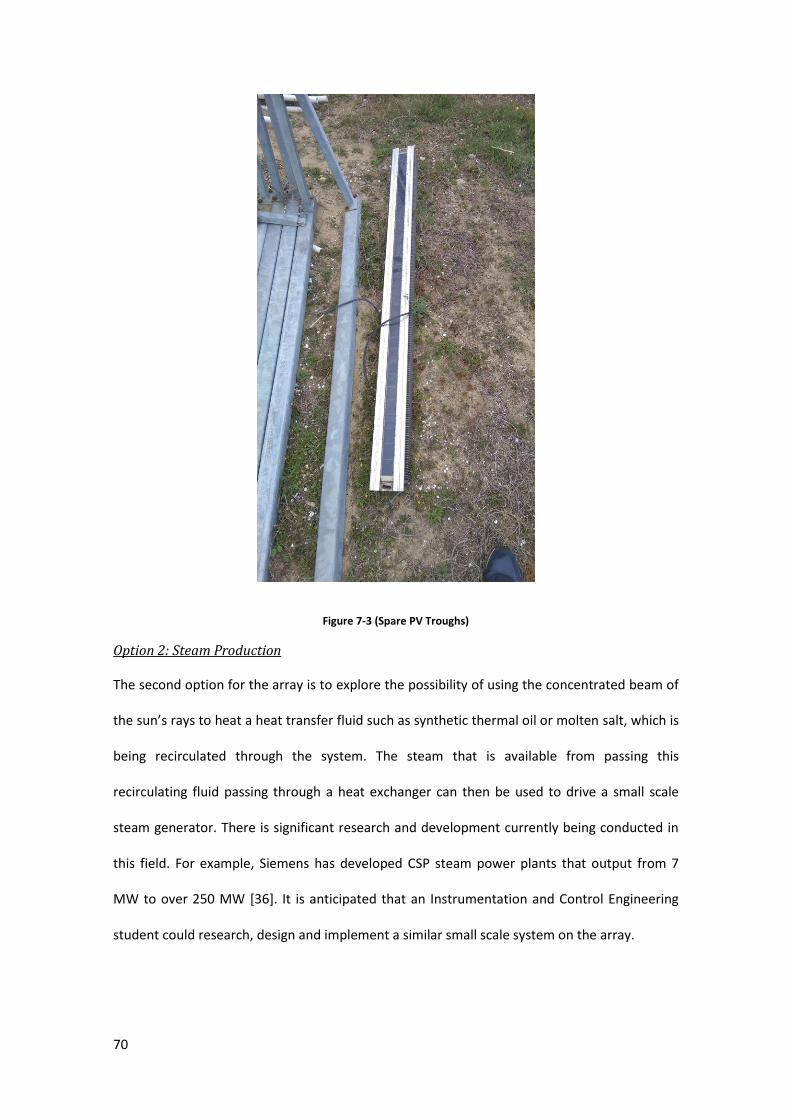
70
Figure 7-3 (Spare PV Troughs)
Option 2: Steam Production
The second option for the array is to explore the possibility of using the concentrated beam of
the sun’s rays to heat a heat transfer fluid such as synthetic thermal oil or molten salt, which is
being recirculated through the system. The steam that is available from passing this
recirculating fluid passing through a heat exchanger can then be used to drive a small scale
steam generator. There is significant research and development currently being conducted in
this field. For example, Siemens has developed CSP steam power plants that output from 7
MW to over 250 MW [36]. It is anticipated that an Instrumentation and Control Engineering
student could research, design and implement a similar small scale system on the array.

71
7.2 Reference Mode Options
Several different reference mode options are available with the Movitools ‘Parameter Tree’
P903. These options define how the inverters operate when placed into reference mode and
more specifically how they define the completion of their reference travel. The modes that are
available include [25]:
0. Left zero pulse
1. Left end of reference cam
2. Right end of reference cam
3. Limit switch clock wise (CW)
4. Limit switch counter clock wise (CCW)
5. No reference travel
6. Ref. cam flush with CW limit switch
7. Ref. cam flush with CCW limit switch
8. Without enable
The mode that is currently selected is mode 1; this means that the motor takes its reference
position when the reference cam is pulsed. If however, option 3 or 4 was used, this would
negate the need for a separate reference cam limit switch in the construction of the final
array. Rather, the CW or CCW limit switch could serve a dual purpose as being both the switch
to indicate the CW or CCW limit of travel as well as the reference position for the motors
encoder. The selection of either option 3 or 4 is recommended as it will reduce wiring, the
number of limit switches required, and the need for additional limit switch mounts.

72
7.3 Limit Switches
Limit switches for each motors CW and CCW rotation will need to be installed. These switches
will need to be positioned slightly beyond the software limit switches, ensuring that the
hardwired limit switches act as secondary protection for the system and are not frequently
switching. Toggle switches S5 & S6 currently represent the physical limit switches that will be
installed. These switches as well as the future limit switches are configured to be normally
closed switches. This ensures that in the case of a limit switch failure (e.g. switch contacts
open), the system stops, providing a failsafe nature to the system. The positioning, type and
operation of the limit switches will need to be determined by a future project holder.
7.4 Emergency Stops
Currently there is no way to quickly stop the system in case of an emergency. However, it is
thought that this would be an essential part of the final system. As mentioned in Section 4.7,
toggle switch S4: Enable can be used as an emergency stop for the inverter. A singular
emergency stop button could be mounted on the door or side wall of the enclosure. This stop
button could then apply a 24V signal to both X13.2 input terminals, therefore, stopping both
inverters simultaneously. Testing will need to be carried out in order to determine if the 24V
source from one of the inverters can be used to switch the input on the other inverter.
7.5 Control Terminal Options
Due to the existing control terminal being installed within a disused shipping container, it is
anticipated that the temperature within the container will rise beyond the maximum
recommended ambient operating temperature of the Intel Q9550 processor of 35˚C [37]. For
this reason and also for further educational benefit, it is anticipated that the system would
move towards having an embedded industrialised controller within the new electrical

73
enclosure. Two options for achieving this have been explored, with each having their own main
benefit and drawback.
Option 1: NI myRIO
A National Instruments myRIO could be installed within the electrical enclosure; these
controllers are ruggedized to be capable of operating at temperatures of up to 70°C. The NI
myRIO allows the continuous execution of an embedded LabVIEW program [38]. The major
advantage of the myRIO option is the available Input/output (I/O) modules for the NI myRIO,
as the I/O modules simplify the connection of future instruments such as the required wind
anemometer. The major drawback to using a myRIO is the inability to operate programs such
as Movitools Motionstudio when configuring the inverters.
Option 2: ARK-1550 Industrialized PC
The second option would be to use a ruggedized PC that could be mounted within the
electrical enclosure. Various models have been researched throughout this project as possible
solutions. The option that has been found to be most suitable is the ARK-1550-S9A1E. This PC
is capable of running a full windows operating system and therefore both LabVIEW and
Movitools Motionstudio would be installed on the device. The device can be stored in
temperatures up to 85°C. The device also has built in RS485 ports and would therefore negate
the need for the existing USB to RS485 converter. One of the major downfalls to using this
device is the lack of I/O ports for the various field devices yet to be installed, it would therefore
create the need for an USB DAQ card.
7.6 Motor Cover
A cover for both the ROLL and TILT motors will need to be fabricated and installed. A
discussion with John Boulton, workshop technician at Murdoch University, has already taken
place and he will install a cover on the permanently installed TILT motor. Once the ROLL motor
is installed in its permanent position, it will be possible to design and install a cover for this

74
motor also. The covers are required in order to prevent the ingress of water, which has
already proven costly for this project.
7.7 LabVIEW Software Improvements
As well as making the LabVIEW program more aesthetically pleasing and generally cleaning up
the block diagram, several aspects of the software still need to be investigated. This section
will briefly discuss these aspects.
7.7.1 Implementing Angle Conversions
As previously discussed in Section 6.2.7, the current azimuth and altitude angles being
generated by the SPA will need to be converted for use with a fixed east-west primary axis tilt-
roll solar tracker.
7.7.2 Software Limits
The precise positioning of the software limits will need to be investigated in order to
determine the location of the hardware limit switches, as discussed in Section 7.3.
7.7.3 Jog Mode
Currently when the ‘Jog Mode’ tab is selected, the inverters are placed into their inbuilt Jog
mode. During testing, this mode seemed inappropriate for the desired jog function. It is
possible that rather than placing the inverters into Jog Mode, this tab should simply have a
manual control over the setpoint of the motors, so that the setpoint can be incrementally
changed. This could result in very slow and precise movement of the array into the desired
location.
7.7.4 Night, Wind and Cleaning Stow
The location of all of these stow positions will need to be investigated. At present they are all
set to return to the reference position (position 0). Dependent of the type of array that is
installed, the wind stow should place the array into its most horizontal position, as this will
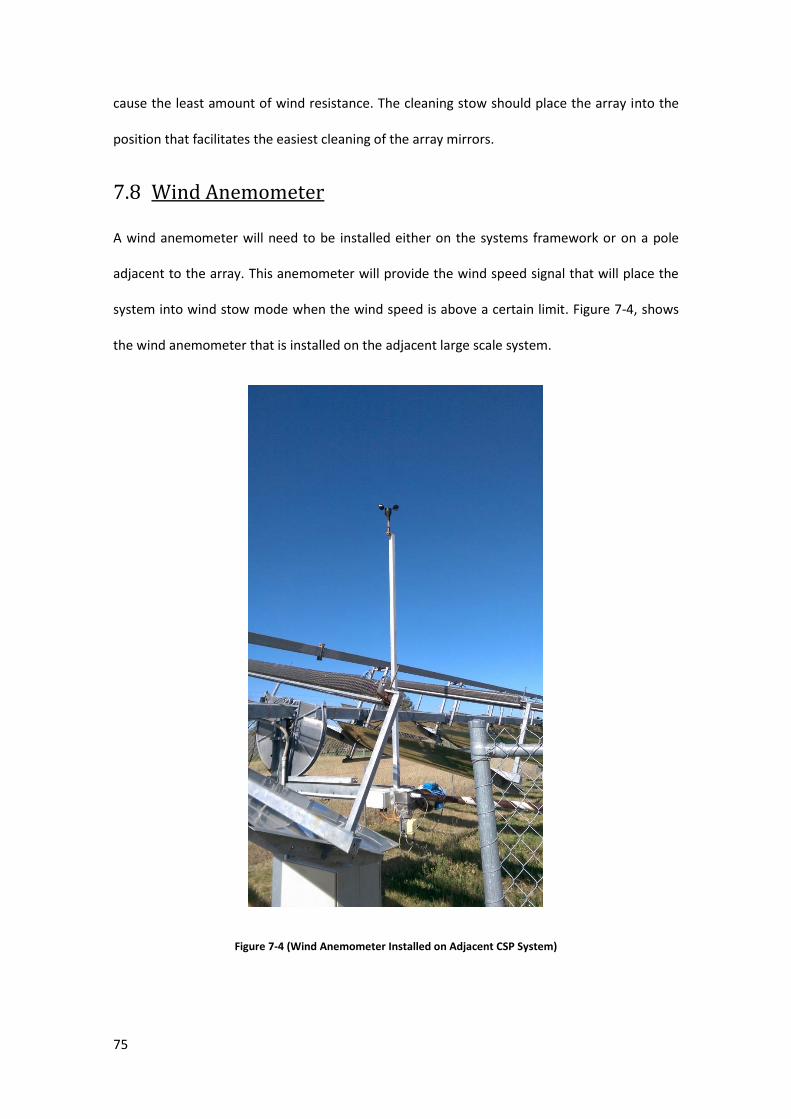
75
cause the least amount of wind resistance. The cleaning stow should place the array into the
position that facilitates the easiest cleaning of the array mirrors.
7.8 Wind Anemometer
A wind anemometer will need to be installed either on the systems framework or on a pole
adjacent to the array. This anemometer will provide the wind speed signal that will place the
system into wind stow mode when the wind speed is above a certain limit. Figure 7-4, shows
the wind anemometer that is installed on the adjacent large scale system.
Figure 7-4 (Wind Anemometer Installed on Adjacent CSP System)

76
Chapter 8 Conclusion
This project has continued the work begun by several previous thesis students on a LabVIEW
based dual axis solar tracking system. In particular, it has aimed to implement and commission
the solar tracking hardware and begin the testing and refinement of the LabVIEW tracking
software. Due to the immense size of the project, it was essential to outline clear objectives for
the 16 weeks allocated to the project. These objectives were split into major and minor
objectives, with the major objectives being used to gauge the success of the project.
As a major part of this project, an electrical system needed to be designed that was capable of
not only supplying power to the solar tracking hardware but also protecting it should fault
situations arise. Although much of the hardware was previously purchased for the project, it
was necessary to design short circuit protection for the system, as well as decide upon an
appropriate electrical enclosure and cabling. This design was then implemented and tested to
ensure compliance to the AS3000 Wiring rules. This confirmed that the installation was both
safe and reliable, and as such ready to be connected to the existing electricity grid.
The commissioning of the system revealed several major issues that caused major delays to
the progression of the project. These setbacks included: damage to the TILT motor that
ultimately required replacing the motor; unidentified corruption of parameter files; and the
transposing of motor phases. In order to test the accuracy of the solar tracker, a pyrheliometer
was connected to an NI DAQ card and some basic LabVIEW software was written. The testing
of the tracker revealed that the solar positioning algorithm was accurate and only needed to
be slightly adjusted in order to be tested on the physical system. The testing of the physical
system revealed that the azimuth and altitude angles being output from the algorithm needed
to be converted for use for a fixed east-west primary axis solar tracker. A useful resource on

77
the conversion of these angles was found, however the project holder lacked the time needed
to implement and test this solution.
Despite encountering several major hurdles that placed the success of the project in doubt,
the project is largely considered successful. The work that had been begun by previous project
holders was taken from a bench tested prototype and implemented in a real world
environment. This testing lead to a series of improvements to the existing LabVIEW software.
Despite the tracker’s inability to track for any significant length of time, a large amount of
progress has been made on the project, as well as setting clear direction for future work.

78
Works Cited
[1] T. Flannery and V. Sahajwalla, “The Critical Decade: Australia's Future - Solar Energy,”
Climate Commission Secretariat , Canberra, 2013.
[2] Clean Energy Council, “Concentrated Solar Thermal,” 2014. [Online]. Available:
http://www.cleanenergycouncil.org.au/technologies/concentrated-solar-thermal.html.
[Accessed 5 August 2015].
[3] A. Luque and S. Hegedus, Handbook of Photovoltaic Science and Engineering 2nd Edition,
West Sussex: John Wiley & Sons, 2011.
[4] I. Reda and A. Andreas, “Solar Position Algorithm for Solar Radiation Applications,”
National Renewable Energy Laboratory , Colorado, 2008.
[5] R. Edwards, “Control system design and commissioning of photovoltaic trough
concentrator systems installed at the Murdoch University South st campus,” Murdoch
University, Perth, 2010.
[6] J. Sibson, “Using Variable Speed Drives, Servo Motors and RS-485 Communication in a
Solar Tracking System for Educational Purposes,” Murdoch University, Perth, 2012.
[7] G. Gazali, “LabVIEW Based Network Control of SEW VSD and Servomotors for Solar
Tracking,” Murdoch University, Perth, 2014.
[8] Solar Choice, “Soalr Trackers,” 21 January 2010. [Online]. Available:
http://www.solarchoice.net.au/blog/solar-trackers/. [Accessed 2 November 2015].
[9] National Renewable Energy Laboratory, “PVWatts Calculator,” 2015. [Online]. Available:
http://pvwatts.nrel.gov/. [Accessed 2 November 2015].
[10] Siemens, “Simply Follow The Sun,” Siemens AG, Karlsruhe, 2012.
[11] Joint Technical Committee EL-001, AS 3000:2007 Wiring Rules, Sydney; Wellington:
Standards Australia; Standards New Zealand, 2007.
[12] Joint Technical Committee EL-001, AS/NZS 3017:2007 Electrical installations - Verification
guidelines, Sydney; Wellington: Standards Australia; Standards New Zealand, 2007.
[13] Joint Technical Committee EL-001, AS/NZS 3008.1.1:2009 Electrical Installations -
Selection of Cables, Sydney: Standards Australia, 2009.
[14] Committee EL-026, AS 60529 - 2004 Degrees of protection provided by enclosures (IP
code), Sydney: Standards Australia International Ltd, 2004.

79
[15] Joint Technical Committee EL-006, AS/NZS IEC 60947.2:2015 Low Voltage Switchgear and
Controlgear Part 2: Circuit Breakers, Sydney: SAI Global Limited, 2015.
[16] S. J. Chapman, Electric Machinery Fundamentals, New York: McGraw-Hill, 2012.
[17] SEW EURODRIVE, DFS/CFM Synchronous Servomotors Operating Instructions, Bruchsal:
SEW EURODRIVE, 2008.
[18] T. Atkins and M. Escudier, Dictionary of Mechanical Engineering, Oxford University Press,
2013.
[19] Catsquisher, “Worm Gear,” 23 January 2011. [Online]. Available:
https://commons.wikimedia.org/wiki/File:Worm_Gear.gif. [Accessed 14 October 2015].
[20] SEW EURODRIVE, SEW Encoder Systems, Bruchsal: SEW EURODRIVE, 1999.
[21] H. Seehagel, “ResolverPrinzip,” 25 January 2004. [Online]. Available:
https://commons.wikimedia.org/wiki/File:ResolverPrinzip.png. [Accessed 17 October
2015].
[22] SEW EURODRIVE, MOVITOOLS Motionstudio Manual, Bruchsal: SEW EURODRIVE, 2009.
[23] Google, “Google Maps,” 2015. [Online]. Available: https://www.google.com.au/maps/.
[Accessed 28 October 2015].
[24] SEW EURODRIVE , “Movidrive Serial Communications,” SEW EURODRIVE, Bruchsal, 2001.
[25] SEW EURODRIVE, MOVIDRIVE MDX60B/61B Operating Instructions, Bruchsal: SEW
EURODRIVE, 2010.
[26] STEGO, Small, compact Thermostat KTO 011/KTS 011, STEGO.
[27] Keysight Technologies, “U1250 Series Handheld Digital Multimeters,” Keysight
Technologies, 2015.
[28] LEDA Electronics PTY LTD, “Model 3132 Insulation Continuity Tester,” [Online]. Available:
http://www.ledaelectronics.com.au/kyoritsu_3132.htm. [Accessed 4 November 2015].
[29] Global Greenhouse Warming, “Pyrheliometer,” 2015. [Online]. Available:
http://www.global-greenhouse-warming.com/pyrheliometer.html. [Accessed 15
September 2015].
[30] W. Stine and R. Harrington, Solar Energy Systems Design, Wiley and Sons, 1986.
[31] The Eppley Laboratory, INC., “Normal Incidence Pyrheliometer Model sNIP,” The Eppley
Laboratory, INC., Newport.

80
[32] U.S Naval Observatory, “Sun or Moon Altitude/Azimuth Table,” 24 July 2015. [Online].
Available: http://aa.usno.navy.mil/data/docs/AltAz.php. [Accessed 23 October 2015].
[33] T. Carlson, “ A schematic diagram of the terms "Azimuth" and "Altitude" as they relate to
the viewing of celestial objects,” [Online]. Available:
https://commons.wikimedia.org/wiki/File:Azimuth-
Altitude_schematic.svg#/media/File:Azimuth-Altitude_schematic.svg. [Accessed 26
October 2015].
[34] K.-K. Chong and C.-W. Wong, “General Formula for On-Axis Sun-Tracking System,”
Universiti Tunku Abdul Rahman, Malaysia.
[35] P. Klugman, “Electrical Design and Commissioning of a Solar Trough Concentrating
System,” Murdoch University , Perth, 2015.
[36] Siemens, “Steam Turbines for CSP Plants,” Siemens AG Energy Sector, Erlangen, 2011.
[37] Intel, “Thermal Management for Intel Core2 Family Sesktop Processors,” 25 July 2009.
[Online]. Available: http://www.intel.com/support/processors/sb/CS-
030615.htm?wapkw=q9550. [Accessed 31 October 2015].
[38] National Instruments, “NI myRIO,” National Instruments, 2014. [Online]. Available:
http://sine.ni.com/nips/cds/view/p/lang/en/nid/211736. [Accessed 1 November 2015].
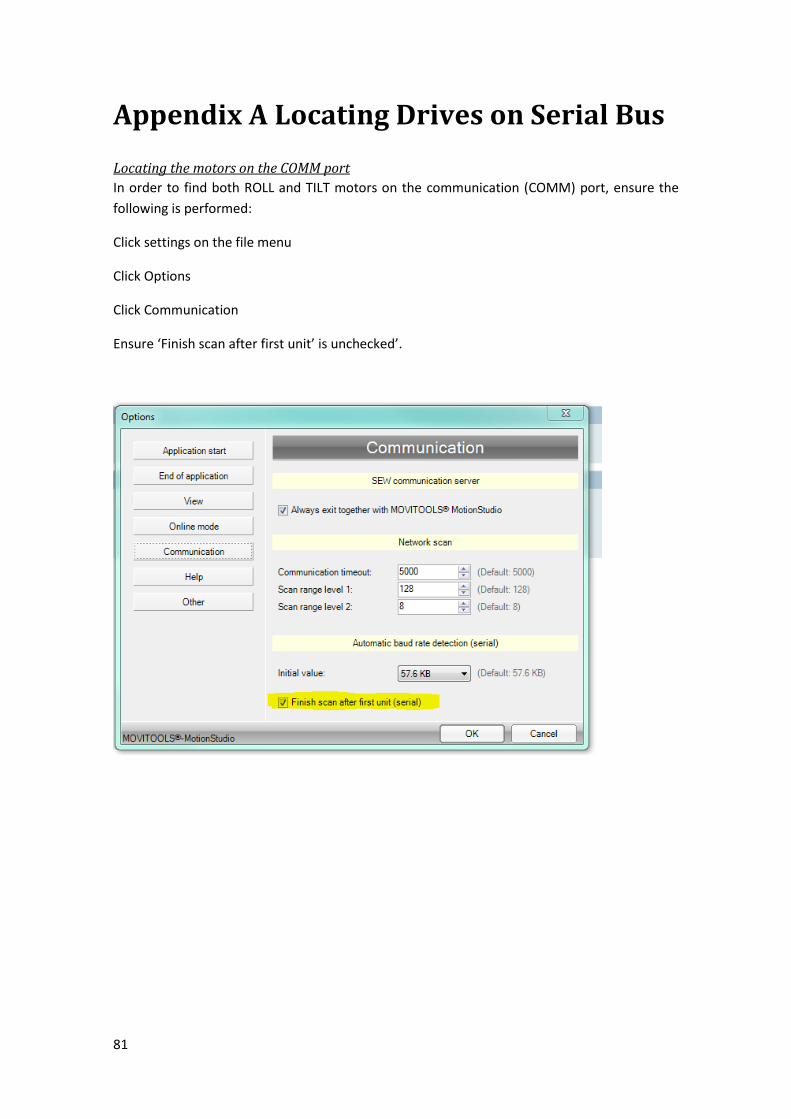
81
Appendix A Locating Drives on Serial Bus
Locating the motors on the COMM port
In order to find both ROLL and TILT motors on the communication (COMM) port, ensure the
following is performed:
Click settings on the file menu
Click Options
Click Communication
Ensure ‘Finish scan after first unit’ is unchecked’.
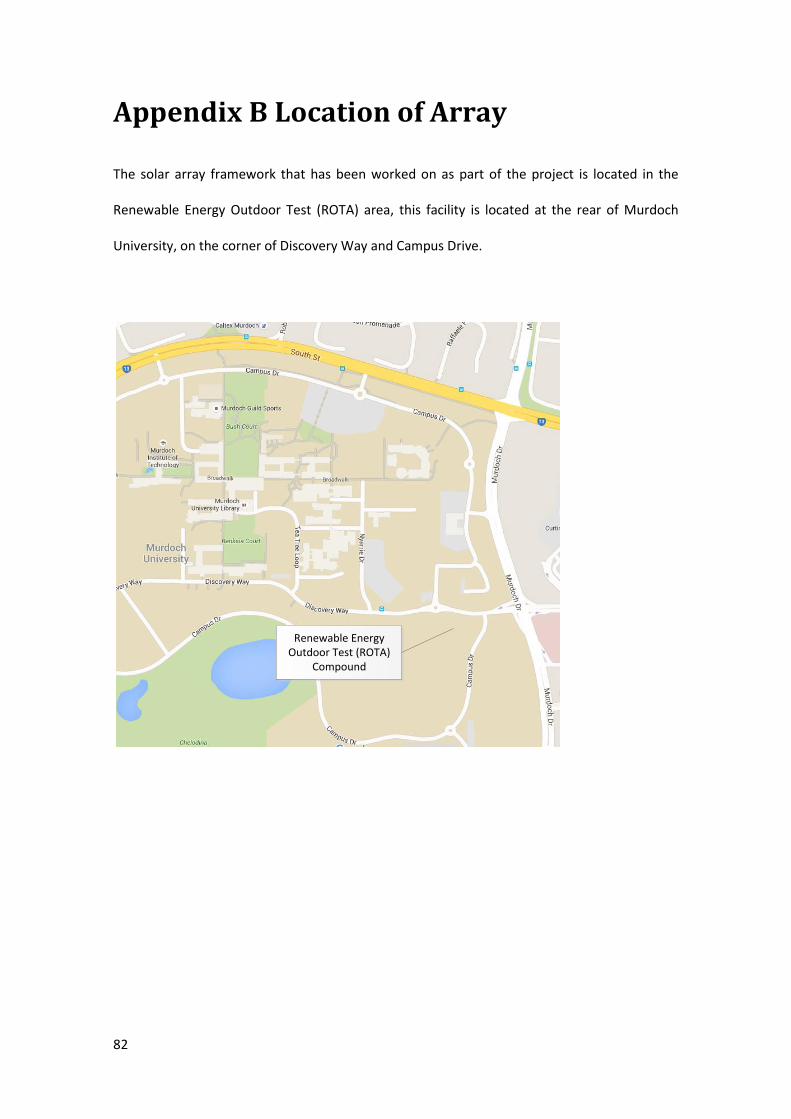
82
Appendix B Location of Array
The solar array framework that has been worked on as part of the project is located in the
Renewable Energy Outdoor Test (ROTA) area, this facility is located at the rear of Murdoch
University, on the corner of Discovery Way and Campus Drive.
Renewable Energy Outdoor Test (ROTA)
Compound
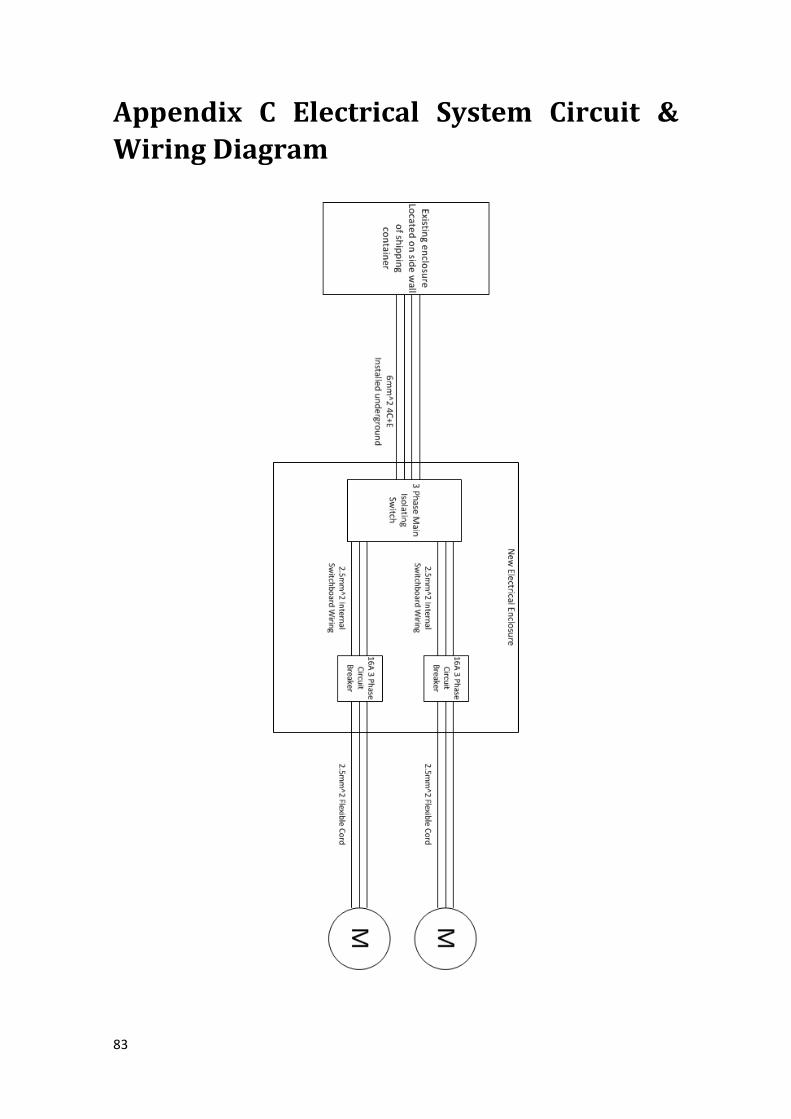
83
Appendix C Electrical System Circuit &
Wiring Diagram
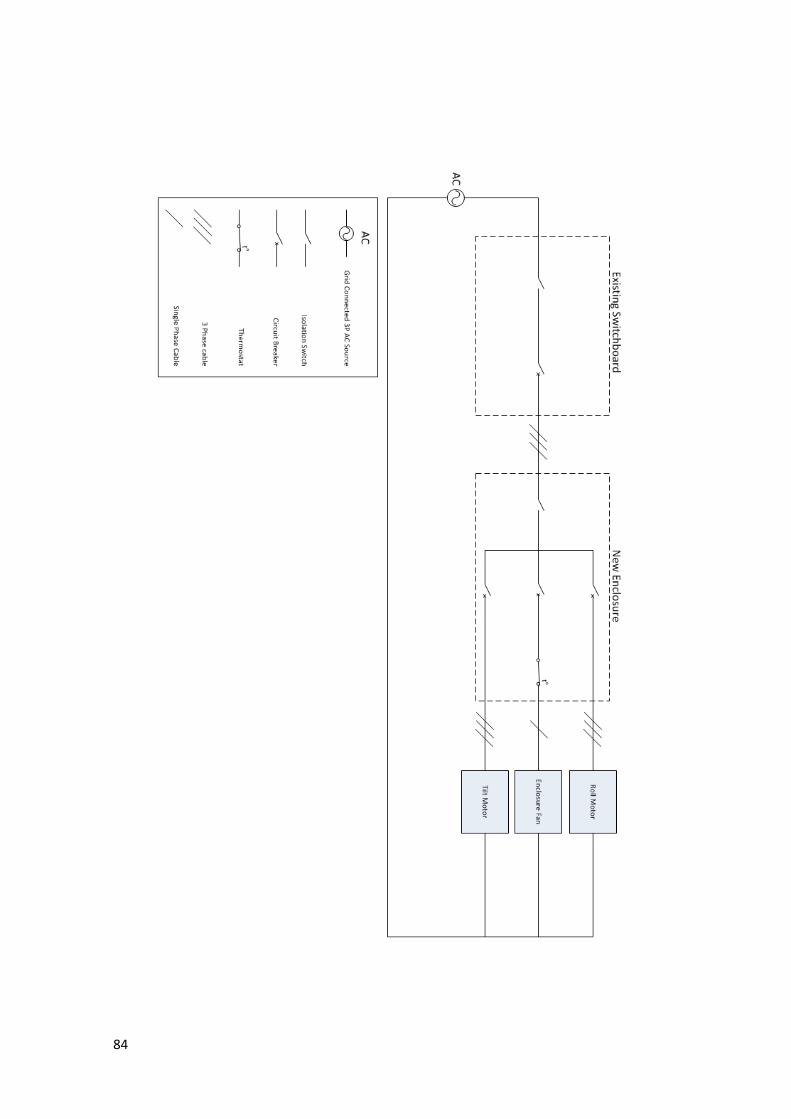
84
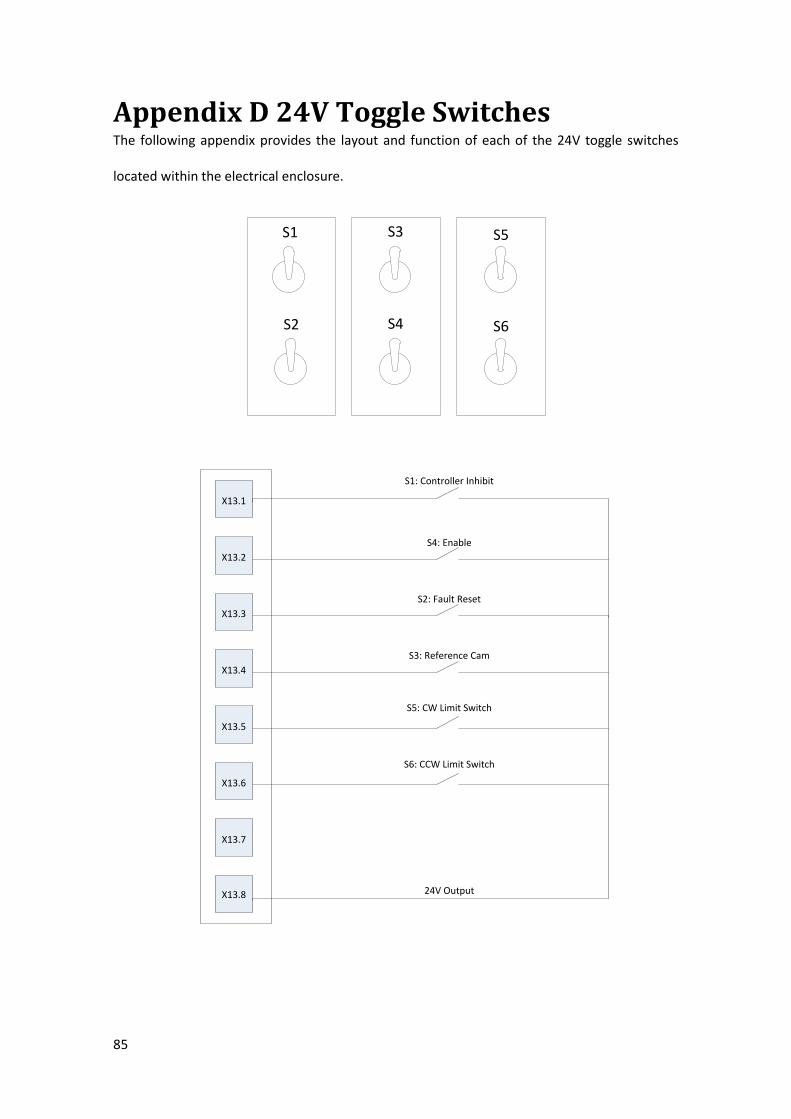
85
Appendix D 24V Toggle Switches The following appendix provides the layout and function of each of the 24V toggle switches
located within the electrical enclosure.
S1
S2
S3
S4
S5
S6
X13.1
X13.2
X13.3
X13.4
X13.5
X13.6
X13.7
X13.8 24V Output
S1: Controller Inhibit
S4: Enable
S2: Fault Reset
S3: Reference Cam
S5: CW Limit Switch
S6: CCW Limit Switch

86
S1: Controller Inhibit
This switch must be in its ‘off’ state in order to upload parameters to the inverters and when
controlling the motors in manual mode. The switch must be ‘off’ until the LabVIEW software
has made a successful connection to the drive; it can then be returned to its ‘on’ position.
S2: Fault Reset
This switch is used as an inverter reset switch in the event of an inverter fault.
S3: Reference Cam
When the inverters are placed into reference mode, they will rotate until this switch is pulsed,
the inverter will then use this position as the reference for all encoder readings. This switch
will eventually be a limit switch on the array, further information on this switch and its role in
the future of the project can be found in Chapter 7.
S4: Enable
This switch must be in its ‘off’ state in order for the drive to operate. This input can be used as
a future emergency stop, this will be discussed in Chapter 7.
S5: CW Limit Switch
This switch is used to represent the future limit switch for clock wise movement, it must be
‘off’ for the operation of the drive.
S6: CCW Limit Switch
This switch is used to represent the future limit switch for counter clock wise movement, it
must be ‘off’ for the operation of the drive.

87
Appendix E Visual Inspection Results
The table below is a list of all of the visual inspections that were carried out as part of the
electrical testing phase of the project. This list has been adapted from AS3000 Wiring Rules.
Visual Inspection AS3000 - 8.2
Test Result
General
Does the installation provide basic protection (Protection against direct contact
with live parts). Pass
Does the installation provide fault protection (protection against indirect contact
with exposed conductive parts), e.g. by the use of double insulation. Pass
Does the installation provide protection against hazardous parts, e.g. by the use of
enclosures. Pass
Is the electrical equipment used in the installation in good general condition, e.g.
signs of damage. Pass
Consumers Mains
Underground installation conditions, e.g. depth and enclosure. Pass
Switchboards
Does the location of the switchboards allow access and egress. Pass
Protective devices, e.g. selection and setting of adjustable protective devices for
compliance with overcurrent protection, arc fault protection and discrimination
requirements. Pass
Isolating devices, e.g. main switch. Pass
Connecting devices, e.g. neutral bar and earth bar. Pass
Connection and fixing of wiring and switchgear. Pass
Identification and labelling of electrical equipment
Protection against external influences Pass

88
Wiring Systems
Motor wiring conductor size, e.g. current carrying capacity and voltage drop. Pass
Adequate support and fixings Pass
Connections and enclosures Pass
Installation conditions Pass
Protection against external influences, e.g. conduit Pass
Electrical Equipment
Isolation devices for protection against injury from mechanical movement devices,
e.g. motors. Pass
Does equipment comply with required standards. Pass
Adequate support and fixings. Pass
Protection against external influences. Pass
Earthing System
MEN system Pass
Earth Electrode Pass
Earthing conductors size Pass
Equipotential bonding conductors size Pass
Connections and terminations Pass
Protection against external influences Pass
Connection to earthing arrangements for other systems Pass

89
Appendix F SEW Technical Support
Emails
The following email tread is a conversation had between the current project holder and Steven
Vulin, applications engineer at SEW EURODRIVE, regarding the speed monitoring fault
encountered during commissioning.
Email 1
Hi Steven,
I am a student at Murdoch University and I am currently doing my final year thesis, I am
implementing a system that was previously setup on a test bench. I’m currently trying to
control a SA77 motor via a MDX61B0011 VSD and I am getting an F41 fault when trying to
control the motor in manual mode. Any help that you could provide would be much
appreciated
Regards,
Matt Wilson
Email 2
Matt
Does the fault only occur when you put the drive into manual mode?
Regards,
Email 3
Yes at the moment it is, I am trying to control in manual mode as a first step after installation.
Matt
Email 4
Matt
Chances are you have an Ipos program running in the drive that uses the watchdog
timer function. If that’s the case there will be some sort of event that will occur
periodically to reset the watchdog timer, otherwise the drive faults out.
You mentioned the drive was already setup….. If you are doing a different application
then do a factory reset and reconfigure from scratch. Otherwise you’ll need to figure out
what is supposed to trigger the watchdog timer or disable the _WdOn command in the
Ipos Program

90
Regards,
Email 5
Hi Steven,
Thanks for your reply. The VSD I was using was a new one as I had left the old one on the
bench test system, I have this morning swaped the two VSDs and the fault is now gone. I am
now getting a fault F8, I have tried to increase the following parameters with no success 13,
131, 132, 133, 501 and 503 which I take as the ramp times and the deceleration times. The
motor is now coupled to a solar array beam as opposed to previously having nothing attached.
Regards,
Matt
Email 6
Matt
Have you done a “startup” to set up the motor?
If so then check P303 Current limit or P304 Torque Limit….If you have an induction
motor use P303 Current limit and if you have a servo motor use P304 Torque Limit.
The Speed Monitoring Function (P500) compares the actual current draw with P303
Current limit or P304 Torque Limit values. If the actual current draw is higher than P303
Current limit or P304 Torque Limit values (depending on the type of motor) then a
delay timer is triggered (P501) and the F08 fault generated after the timer expires.
Generally speaking the Speed monitoring function is used to protect against
mechanical jams. But if you have a servo motor or induction motor with encoder then
incorrect connection or faulty encoder can sometimes trigger speed monitoring as well.
See how you go. If you have no luck let me know and I can pay you a visit to assist.
Regards,
Email 7
Hi Steven,
I have a Cm71S motor that has been through a start up. The P304 Torque limit is currently set
to 200% which I believe is the maximum. I was able to manually control the motor yesterday
after disabling the speed monitoring function, this seemed to work but I’m guessing this is not
a safe thing to do. When it was operating, the output current reading that I saw on the manual
mode window was at 200% which would explain why the F8 fault was appearing. Besides the
motor being overloaded (or faulty bearings etc.) is there any other possible to cause. The gear
box on the motor has a ratio of 225.26 so I am assuming the motor is cable of delivering the
rated motor torque x 225.26, which would be 16.5 x 225.26 = 3716.79 Nm. Am I correct in
assuming this? If so I can’t see how the motor could be overloaded.
Matt

91
Email 8
Matt
Does the motor have a brake and if so is it disengaging? If you are not sure send a
photo of the nameplate to me.
Also, check the Inverter output terminals U, V & W are connected to the motor
terminals U, V & W. They MUST match. Then, check that the encoder count increases
when you run the motor CW.
Failing that try removing the motor from the gearbox and see if the issue still exists.
The CM71S has a nominal torque of 5Nm…..so 5x225.26=1126.3Nm. P304 Torque
Limit dictates your max torque output. The short term peak torque achievable is
dependent on the inverter size…see below-
Regards,
Email 9
Hi Steven,
Thankyou for your help with this issue, the motor supply cable did in fact have two phases
transposed and this was the cause of the fault.
Regards, Matt
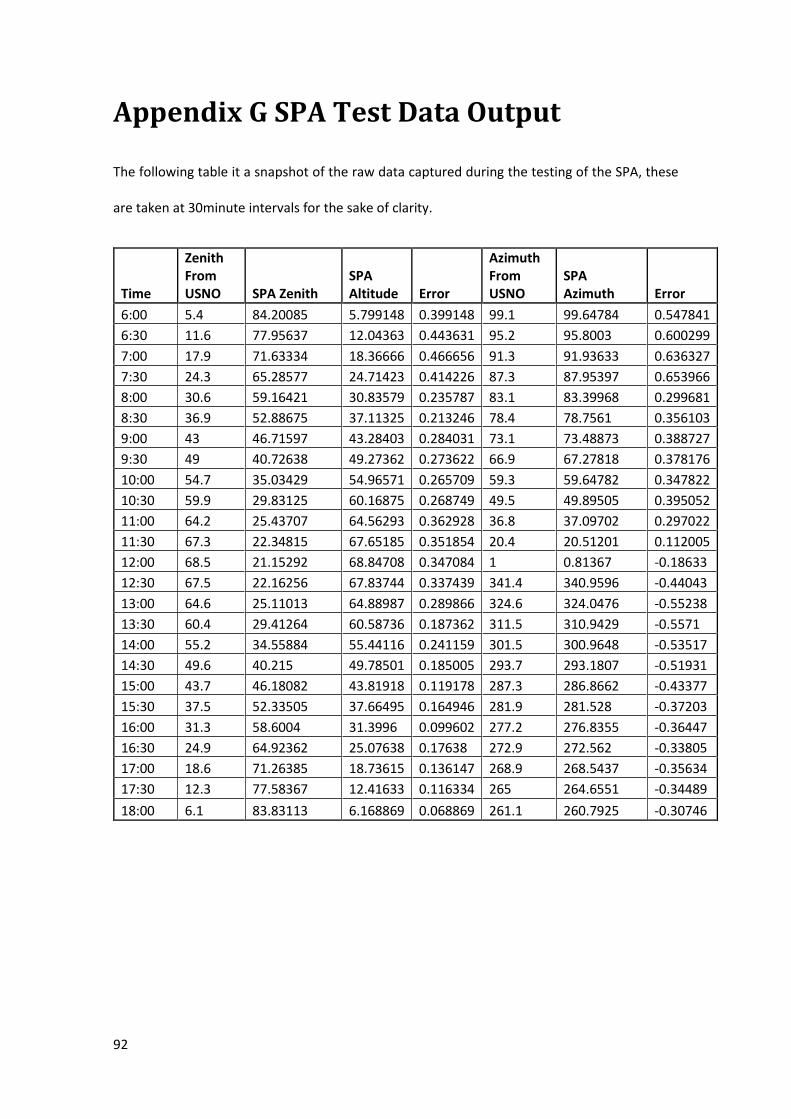
92
Appendix G SPA Test Data Output
The following table it a snapshot of the raw data captured during the testing of the SPA, these
are taken at 30minute intervals for the sake of clarity.
Time
Zenith From USNO SPA Zenith
SPA Altitude Error
Azimuth From USNO
SPA Azimuth Error
6:00 5.4 84.20085 5.799148 0.399148 99.1 99.64784 0.547841
6:30 11.6 77.95637 12.04363 0.443631 95.2 95.8003 0.600299
7:00 17.9 71.63334 18.36666 0.466656 91.3 91.93633 0.636327
7:30 24.3 65.28577 24.71423 0.414226 87.3 87.95397 0.653966
8:00 30.6 59.16421 30.83579 0.235787 83.1 83.39968 0.299681
8:30 36.9 52.88675 37.11325 0.213246 78.4 78.7561 0.356103
9:00 43 46.71597 43.28403 0.284031 73.1 73.48873 0.388727
9:30 49 40.72638 49.27362 0.273622 66.9 67.27818 0.378176
10:00 54.7 35.03429 54.96571 0.265709 59.3 59.64782 0.347822
10:30 59.9 29.83125 60.16875 0.268749 49.5 49.89505 0.395052
11:00 64.2 25.43707 64.56293 0.362928 36.8 37.09702 0.297022
11:30 67.3 22.34815 67.65185 0.351854 20.4 20.51201 0.112005
12:00 68.5 21.15292 68.84708 0.347084 1 0.81367 -0.18633
12:30 67.5 22.16256 67.83744 0.337439 341.4 340.9596 -0.44043
13:00 64.6 25.11013 64.88987 0.289866 324.6 324.0476 -0.55238
13:30 60.4 29.41264 60.58736 0.187362 311.5 310.9429 -0.5571
14:00 55.2 34.55884 55.44116 0.241159 301.5 300.9648 -0.53517
14:30 49.6 40.215 49.78501 0.185005 293.7 293.1807 -0.51931
15:00 43.7 46.18082 43.81918 0.119178 287.3 286.8662 -0.43377
15:30 37.5 52.33505 37.66495 0.164946 281.9 281.528 -0.37203
16:00 31.3 58.6004 31.3996 0.099602 277.2 276.8355 -0.36447
16:30 24.9 64.92362 25.07638 0.17638 272.9 272.562 -0.33805
17:00 18.6 71.26385 18.73615 0.136147 268.9 268.5437 -0.35634
17:30 12.3 77.58367 12.41633 0.116334 265 264.6551 -0.34489
18:00 6.1 83.83113 6.168869 0.068869 261.1 260.7925 -0.30746

93
Appendix H Guide to the Electronic
Attachment
The electronic attachment of this thesis can be found in either the ENGshared folder (In the
PVT_Project Folder) or a copy contained on a thumb drive can be obtained from June Burnett,
academic support officer at Murdoch University. The following items can be found on the
electronic attachment:
All LabVIEW software
The latest Movitools project files
PDF copies of all VSD parameter files as they were at the conclusion of this project
A folder containing all previous project holders work
A folder containing a SEW documentation
A folder containing all data sheets used
A folder containing all tracking algorithms used and needed
A folder containing commissioning tests .csv files