Embed Size (px)
Citation preview
ELECTRICITY GENERATION AND CONSUMPTION IN IRAN
AND THE ROLE OF NUCLEAR POWER FOR SUSTAINABLE
ENERGY
AFSHIN MAZANDARANY
FACULTY OF ENGINEERING
UNIVERSITY OF MALAYA
KUALA LUMPUR
2012

ii
ELECTRICITY GENERATION AND CONSUMPTION IN IRAN
AND THE ROLE OF NUCLEAR POWER FOR SUSTAINABLE
ENERGY
AFSHIN MAZANDARANY
THESIS SUBMITED IN FULFILMENT OF THE
REQUIREMENTS FOR THE DEGREE OF DOCTOR OF
PHILOSOPHY
FACULTY OF ENGINEERING
UNIVERSITY OF MALAYA
KUALA LUMPUR
2012

iii
UNIVERSITY OF MALAYA
ORIGINAL LITERARY WORK DECLARATION
Name of Candidate: AFSHIN MAZANDARANY
Registration/Matric No: KHA080054
Name of Degree: DOCTOR OF PHILOSOPHY
Title of Project Pager/Research Report/Dissertation/Thesis (“This Work”):
ELECTRICITY GENERATION AND CONSUMPTION IN IRAN
AND THE ROLE OF NUCLEAR POWER FOR SUSTAINABLE
ENERGY
Field of Study: Mechanical Engineering
I do solemnly and sincerely declare that:
(1) I am the sole author/writer of this Work;
(2) This Work is original;
(3) Any use of any work in which copyright exists was done by way of fair dealing and
for permitted purposes and any excerpt or extract form, or reference to or
reproduction of any copyright work has been disclosed expressly and
sufficiently and the title of the Work and its authorship have been acknowledged
in this Work;
(4) I do not have any actual knowledge nor do I ought reasonably to know that the
making of this work constitutes an infringement of any copyright work;
(5) I hereby assign all and every rights in the copyright to this Work to the
University of Malaya (“UM”), who henceforth shall be owner of the copyright in
this Work and that any reproduction or use in any form or by any means whatsoever
is prohibited without the written consent of UM having been first had and obtained;
(6) I am fully aware that if in the course of making this Work I have infringed any
copyright whether intentionally or otherwise, I may be subject to legal action or any
other action as may be determined by UM.
Candidate’s Signature Date:
Subscribed and solemnly declared before,
Witness’s Signature Date:
Name:
Designation:
iv
Abstract
Over the years, the consumption of all types of energy, such as electricity, have
increased rapidly in Iran. The economic growth of the country depends on electricity,
and, therefore, the trend of electricity consumption is likely to keep growing in the
future to sustain this growth. In view of this need, the government plans to build many
new power plants and decided to redevelop its nuclear program to meet the rising
electricity demand and decrease the consumption of fossil fuels. In this study, the effect
of this policy on four major aspects of energy sustainability, including environmental
pollution, electricity demand, energy security and electricity price have been verified.
A clear view of 43 years of the evolutionary trend of the country’s power sector,
has been shown by gathering data, including the capacity installed, electricity generated
and amount of fossil fuel used from the years 1967 to 2009. In addition, the future
power plant composition for Iran is investigated, and the fuel consumption and
emissions predicted until 2025. In recent decades, thermal power plants generated about
94% of electricity and about 6% was generated by renewable sources such as
hydropower. If the dominance of new power plants is by thermal type, the CO2 and
other air pollutant emissions will increase. The results show that increasing the share of
renewable sources and the construction of 20,000 MW nuclear reactors will reduce 26%
of hazardous CO2 emissions into the environment; nevertheless, there are some other
effective policies and technologies that can be implemented to control the emissions.
In respect of answering the country’s growth rate for energy demand, which is
very high, neither nuclear nor fossil fuels can cope with the current growth. Therefore,
the only solution is rationalizing the energy demand and controlling energy wastage by
encouraging energy efficiency.

v
In the field of energy security, although Iran has huge oil and gas reserves, it
faces many threats. The major threats are the high growth rates of energy consumption,
economic dependency on crude oil exports, wastage of energy, lack of attention to
common fossil fuel resources and political conflict. Therefore, the energy policy must
be reformed to address these problems rather than investing in nuclear facilities.
To investigate the relative cost of electricity generated in each alternative
generator, the simple levelized electricity cost was selected as a method. The results
show that in the country’s current circumstances, the electricity cost in fossil fuel power
plants will be cheaper than nuclear.
In conclusion, although nuclear energy, including its fuel cycle is Iran’s assured
right, constructing more nuclear power plants will not solve the energy sustainability
problems. In fact, it may be the catalyst for deterioration since it will divert capital and
other finite resources from top priority and economic projects such as energy efficiency,
high-technology development and energy resources management.

vi
Abstrak
Sejak berdekad yang lalu, peningkatan pesat bagi semua jenis tenaga
termasuklah tenaga elektrik telah berlaku di Iran. Tenaga elektrik juga telah membantu
kepada pertumbuhan ekonomi di negara ini. Oleh itu, penggunaan elektrik haruslah
berkekalan demi menjamin pertumbuhan ini. Memandangkan keperluan tenaga elektrik
yang tinggi di negara ini, kerajaan telah mengambil keputusan untuk membina lebih
banyak loji janakuasa baru dan merancang untuk membangunkan semula program
nuklearnya demi memenuhi peningkatan permintaan tenaga elektrik dan seterusnya
mengurangkan penggunaan bahan api fosil. Dalam kajian ini, empat aspek utama
kemampanan tenaga telah dikenalpasti termasuklah pencemaran alam sekitar,
permintaan tenaga elektrik, keselamatan tenaga dan seterusnya harga elektrik.
Evolusi sektor kuasa di negara ini selama 43 tahun dari tahun 1967 hingga 2009
telah ditunjukan melalui pengumpulan data, termasuklah kapasiti elektrik yang dipasang
dan bahan api fosil yg digunakan. Di samping itu, komposisi loji kuasa pada masa
hadapan di Iran juga dikaji, dan ramalan penggunaan bahan api dan pencemarannya
sehingga tahun 2025 telah dibuat. Dalam sedekad yang lalu loji kuasa termal
menghasilkan kira-kira 94% daripada tenaga elektrik dan 6% selebihnya dijana oleh
sumber yang boleh diperbaharui seperti kuasa-hidro. Jika pembinaan loji janakuasa
yang baru juga didominasikan daripada jenis termal, maka pelepasan CO2 dan lain-lain
pencemar udara akan meningkat. Keputusan kajian menunjukkan bahawa dengan
meningkatkan bahagian sumber-sumber yang boleh diperbaharui dan pembinaan
reaketor nuklir berkuasa 20,000 MW akan mengurangkan perlepasan CO2 yang
berbahaya kepada alam sekitar, namun terdapat beberapa lagi teknolologi dan dasar lain
yang berkesan boleh dilaksanakan untuk mengawal perlepasan gas ini ke atmosfera.
Dalam memenuhi permintaan tenaga, kadar pertumbuhan di negara ini juga
sangat tinggi. Bahan api fosil mahupun nuklear tidak dapat menampung kadar

vii
pertumbuhan ini. Jadi, satu-satunya penyelesaian untuk merasionalkan permintaan
tenaga dan seterusnya mengawal pembaziran tenaga ialah dengan menggalakkan
kecekapan tenaga.
Dalam bidang keselamatan tenaga, walaupun Iran mempunyai rizab minyak dan
gas yang besar namun masih lagi berhadapan dengan banyak ancaman. Antara
ancamannya adalah kadar pertumbuhan penggunaan tenaga yang tinggi, pergantungan
ekonomi ke atas eksport minyak mentah, pembaziran tenaga, kurang pemerhatian
kepada sumber-sumber biasa dan konflik politik. Jadi pembaharuan dasar tenaga perlu
dilakukan untuk menyelesaikan masalah ini agar tidak melarat ke atas kemudahan
nuklear.
Untuk menyiasat kos relatif elektrik yang dijana dalam setiap penjana alternatif,
kos ‘levelized’ elektrik mudah telah dipilih sebagai salah satu kaedah. Hasil kajian
menunjukkan bahawa dalam keadaan semasa negara, kos elektrik di loji kuasa bahan
api fosil akan lebih murah daripada nuklear.
Kesimpulannya, walaupun tenaga nuklear, termasuklah kitaran bahan api adalah
hak Iran, pembinaan loji kuasa nuklear tidak akan menyelesaikan masalah kemampanan
tenaga. Malah boleh menjadi pemangkin kepada kemerosotan kerana ia akan
mengalihkan modal dan sumber keutamaan lain daripada projek-projek ekonomi seperti
kecekapan tenaga, pembangunan berteknologi tinggi dan pengurusan sumber tenaga.

viii
ACKNOWLEDGEMENTS
“In the name of God, the most Beneficent and the most Merciful”
The PhD research was conducted in the Department of Mechanical Engineering,
University of Malaya. This research could not have been completed without the help of
many people which I would like to appreciate to them now.
First, I wish to express my sincere gratitude to my supervisors, Professor Dr.
T.M.Indra Mahlia and Dr. Chong Wen Tong for their valuable guidance and advices
throughout the research. Their opinions on my research are extremely helpful in the
making of the thesis a success.
I am very grateful to my wife, Fatemeh for her patience in putting up with me
all through last three years. I also would like to give many special thanks to my parents,
sister and brothers for their financial support and constant encouragement in my
endeavor to complete my doctoral research. Without their support, I have not the
opportunity to continue my study oversea.
Finally, I want to present this work to my lovely land Iran. I wish this research
has a little share on the country’s development to reach a better position it deserves.
Afshin Mazandarani
Department of Mechanical Engineering
Faculty of Engineering
University of Malaya
November 2012
ix
Table of Contents
: Introduction ................................................................................................... 1 Chapter 1
1.1 Background ................................................................................................. 1
1.2 Research objectives ..................................................................................... 2
1.3 Limitations of the research .......................................................................... 4
1.4 Significance of findings .............................................................................. 5
1.5 Original contribution ................................................................................... 7
: Literature review ........................................................................................... 8 Chapter 2
2.1 Energy in Iran .............................................................................................. 8
2.2 Power plant sector in Iran ......................................................................... 14
2.2.1 Fossil fuel based power plants ........................................................... 15
2.2.2 Renewable energy power plants......................................................... 17
2.3 Future power plant composition................................................................ 19
2.3.1 Fossil fuel based power plants ........................................................... 20
2.3.2 Hydropower plants ............................................................................. 22
2.3.3 Non-hydro renewable energies .......................................................... 23
2.3.4 Nuclear power plant ........................................................................... 27
: Methodology ............................................................................................... 34 Chapter 3
3.1 Introduction ............................................................................................... 34
3.2 Power sector composition ......................................................................... 35
3.2.1 Method of data estimation .................................................................. 35
3.2.2 Per-capita nominal capacity ............................................................... 36

x
3.2.3 Per-capita electricity consumption ..................................................... 36
3.2.4 Percentage of nominal capacity and electricity generation ................ 37
3.3 Thermal power plant emissions ................................................................ 37
3.3.1 Emissions production ......................................................................... 38
3.3.2 Emissions per unit of electricity generation ....................................... 39
3.3.3 Emissions per unit of electricity generation for each type of power
plant ......................................................................................................................... 40
3.4 Prediction of future power plant sector composition ................................ 40
3.4.1 Scenarios ............................................................................................ 40
3.4.2 Total capacity prediction .................................................................... 42
3.4.3 Power plants nominal capacities ........................................................ 42
3.4.4 Capacity factor ................................................................................... 43
3.4.5 Electricity generation ......................................................................... 43
3.4.6 Fuel consumption per unit of electricity generated ............................ 44
3.4.7 Fuel consumption in the future .......................................................... 44
3.4.8 Fuel consumption in fuel switching scenario ..................................... 45
3.4.9 Emissions in the future ....................................................................... 45
3.5 Electricity cost ........................................................................................... 46
3.6 Data collection .......................................................................................... 48
3.6.1 Power sector data ............................................................................... 48
3.6.2 Financial data ..................................................................................... 50
: Results ......................................................................................................... 53 Chapter 4
4.1 Iranian power sector composition ............................................................. 53
xi
4.1.1 Power generation growth ................................................................... 53
4.1.2 Per-capita capacities ........................................................................... 54
4.1.3 Pattern of electricity generation ......................................................... 56
4.1.4 Capacity factors .................................................................................. 62
4.1.5 Fuel consumption per unit electricity generation ............................... 63
4.2 Emissions production ................................................................................ 64
4.2.1 Emissions per unit of electricity generation ....................................... 72
4.3 Future power plants composition .............................................................. 73
4.4 Future fuel consumption and prediction of emissions in power plants ..... 77
4.4.1 Future fuel consumption .................................................................... 77
4.4.2 Emissions in 2025 .............................................................................. 78
4.5 Electricity price ......................................................................................... 83
4.5.1 Impact of environmental issues on electricity price ........................... 85
: Discussions .................................................................................................. 87 Chapter 5
5.1 Power sector composition ......................................................................... 87
5.2 Emission Production ................................................................................. 89
5.3 Future power plant composition................................................................ 91
5.4 Future fuel consumption and prediction of emissions in power plants ..... 92
5.5 The electricity price................................................................................... 94
5.6 Impact of nuclear power on energy sustainability .................................... 96
5.6.1 Environmental effects ........................................................................ 97
5.6.2 Energy demand................................................................................. 101

xii
5.6.3 Energy security................................................................................. 104
: Conclusion and recommendations............................................................. 111 Chapter 6
Bibliography : ………………………………………………………..………………118
Appendix A : …………………………………………………………………………128

xiii
List of Figures
Figure 2-1 OPEC proven crude oil reserves in 2010 ........................................................ 8
Figure 2-2 Natural gas reserves in 2009 (Top 10 countries) ............................................. 9
Figure 2-3. Total energy production, exports and consumption in Iran from 1967 to
2009 ................................................................................................................................. 10
Figure 2-4 Total oil production, exports and consumption in Iran from 1967 to 2009 .. 11
Figure 2-5. Total natural gas production, exports and consumption in Iran from 1967 to
2009 ................................................................................................................................. 12
Figure 2-6 Amount and share of each sector in the fossil fuel energy demand in 2009 . 13
Figure 2-7. Energy consumption in each sector by the source of energy in 2009 .......... 14
Figure 2-8. Energy flow of the power plant sector in 2009 ............................................ 15
Figure 2-9. Iranian hydropower plants nominal capacity ............................................... 22
Figure 2-10. Wind atlas map of Iran ............................................................................... 24
Figure 2-11. Solar radiation in Iran ................................................................................. 25
Figure 2-12. Geothermal potential of Iran ...................................................................... 26
Figure 2-13. Iranian nuclear facilities ............................................................................. 32
Figure 3-1. Flowchart summarizing the methodologies used in the research ................. 35
Figure 4-1. Nominal capacity (MW) of Iranian power plants by type from 1967 to 2009
......................................................................................................................................... 53
Figure 4-2. Electricity generation (GWh) in Iranian power plants by type from 1967 to
2009 ................................................................................................................................. 54
Figure 4-3. The growth of per-capita nominal capacity and per-capita electricity
consumption and population between 1967 and 2009 .................................................... 56
Figure 4-4. Pattern of electricity generation for each type of power plants from 1967 to
2009 ................................................................................................................................. 60

xiv
Figure 4-5. Pattern of nominal capacity for each type of power plants in Iran from 1967
to 2009 ............................................................................................................................. 61
Figure 4-6. Share of nominal capacity and electricity generation in Iranian power plants
in 2009 ............................................................................................................................. 62
Figure 4-7. Iranian power plants capacity factor from 2001 to 2009.............................. 63
Figure 4-8. Total fuel consumed in Iranian power plants from 1967 to 2009 ................ 64
Figure 4-9 Share of each fuel type in total energy consumed in thermal power plants .. 65
Figure 4-10. Total emission in Iranian power plants from 1967 to 2009 ....................... 67
Figure 4-11. Emission per unit electricity generation from 1967 to 2009 ...................... 69
Figure 4-12. Power plants emission contribution (%) in 2009 ....................................... 72
Figure 4-13. Historical data and forecasted nominal capacity of Iranian power plants
from 1980 to 2025 ........................................................................................................... 74
Figure 4-14. Nominal capacity (MW and %) in Iranian new power plant composition in
2025 ................................................................................................................................. 76
Figure 4-15. Pattern of nominal capacity for each type of power plants in Iran from
2009 to 2025 .................................................................................................................... 76
Figure 4-16. Power plants fossil fuel consumption in 2009 and three scenarios in 2025
......................................................................................................................................... 78
Figure 4-17. CO2 emission for each type of power plants in 2009 and three scenarios in
2025 ................................................................................................................................. 81
Figure 4-18. SO2 emission for each type of power plants in 2009 and three scenarios in
2025 ................................................................................................................................. 81
Figure 4-19. NOx emission for each type of power plants in 2009 and three scenarios in
2025 ................................................................................................................................. 82
Figure 4-20. CO emission for each type of power plants in 2009 and three scenarios in
2025 ................................................................................................................................. 82

xv
Figure 4-21. Levelized electricity cost range ($/MWh) in different power plants ......... 84
Figure 4-22. Medium levelized electricity cost in power plants by cost types ............... 84
Figure 4-23. Shares of each cost type on total levelized electricity cost in power plants
......................................................................................................................................... 85
Figure 5-1. Iranian oil and natural gas resources .......................................................... 107
Figure 5-2. Natural gas routes in the region .................................................................. 109
xvi
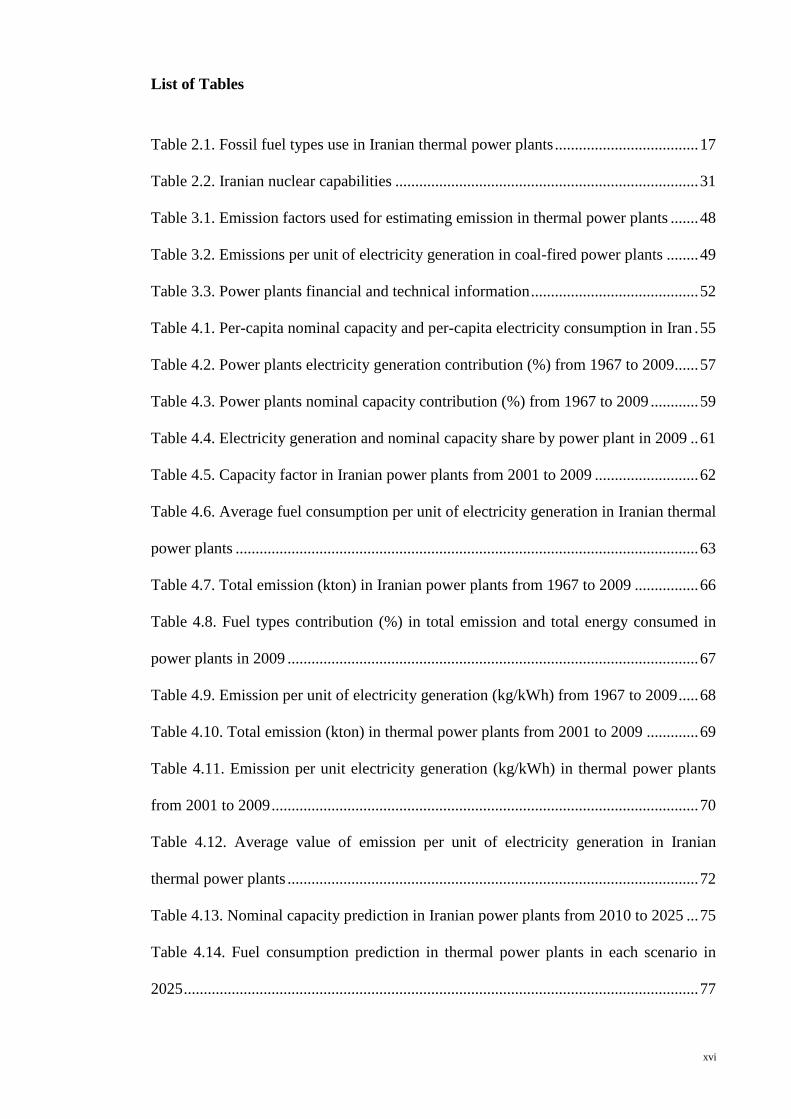
List of Tables
Table 2.1. Fossil fuel types use in Iranian thermal power plants .................................... 17
Table 2.2. Iranian nuclear capabilities ............................................................................ 31
Table 3.1. Emission factors used for estimating emission in thermal power plants ....... 48
Table 3.2. Emissions per unit of electricity generation in coal-fired power plants ........ 49
Table 3.3. Power plants financial and technical information .......................................... 52
Table 4.1. Per-capita nominal capacity and per-capita electricity consumption in Iran . 55
Table 4.2. Power plants electricity generation contribution (%) from 1967 to 2009...... 57
Table 4.3. Power plants nominal capacity contribution (%) from 1967 to 2009 ............ 59
Table 4.4. Electricity generation and nominal capacity share by power plant in 2009 .. 61
Table 4.5. Capacity factor in Iranian power plants from 2001 to 2009 .......................... 62
Table 4.6. Average fuel consumption per unit of electricity generation in Iranian thermal
power plants .................................................................................................................... 63
Table 4.7. Total emission (kton) in Iranian power plants from 1967 to 2009 ................ 66
Table 4.8. Fuel types contribution (%) in total emission and total energy consumed in
power plants in 2009 ....................................................................................................... 67
Table 4.9. Emission per unit of electricity generation (kg/kWh) from 1967 to 2009 ..... 68
Table 4.10. Total emission (kton) in thermal power plants from 2001 to 2009 ............. 69
Table 4.11. Emission per unit electricity generation (kg/kWh) in thermal power plants
from 2001 to 2009 ........................................................................................................... 70
Table 4.12. Average value of emission per unit of electricity generation in Iranian
thermal power plants ....................................................................................................... 72
Table 4.13. Nominal capacity prediction in Iranian power plants from 2010 to 2025 ... 75
Table 4.14. Fuel consumption prediction in thermal power plants in each scenario in
2025 ................................................................................................................................. 77

xvii
Table 4.15. Emissions in 2009 and emissions prediction in each power plant and each
scenario in 2025 .............................................................................................................. 79
Table 4.16. Levelized electricity cost ($/MWh) in power plants by cost types. ............. 83
Table 4.17. Impact of carbon price on electricity generation cost ($/MWh) in Iran ...... 86
Table A.1. Nominal capacity (MW) for all types of power plants from 1967 to 2009.129
Table A.2. Electricity generation (GWh) for all types of power plants from 1967 to
2009 …………………………………………………………………………………..130
Table A.3. Exchange electricity between Iran and neighboring countries (GWh) ...131
Table A.4. Population of Iran for selected years between 1956 and 2009 ………..132
Table A.5. Total fossil fuel consumption for power plants from 1967 to 1978 …….132
Table A.6. Composition of fuel consumption in power plants from 1979 to 1997 ....133
Table A.7. Composition of fuel consumption in power plants from 1998 to 2009 ...135

xviii
List of Symbols and Abbreviations
CEC impact of carbon price on electricity cost ($/MWh)
CF power plant capacity factor (%)
CP carbon price ($/ton CO2)
CRF capital recovery factor
CV calorific value (kcal/l)
EF
emission factor in power plant (kg/m3,kg/l)
EG electricity generation from power plant (GWh)
EM power plant emission (kton)
EP emission per unit electricity generation (kg/kWh)
EX exchange electricity with neighboring countries (GWh)
FC fossil fuel consumption (Mm3,Ml, kton)
FE fuel consumption per unit electricity generation (m3/kWh, kg/kWh, l/kWh)
FT fuel cost ($, $/MMBtu)
HR heat rate (Btu/kWh)
I investment and cash flow during construction ($)
k,C constant values
LEC levelized electricity cost ($/MWh)
NC power plant nominal capacity (MW)

xix
NP share of nominal capacity (%)
OCC overnight capital cost ($/kW)
OMC operation and maintenance cost ($, $/kW-year, $/MWh)
P population
PC per-capita electricity consumption (kWh)
PE share of electricity generation (%)
PF share of thermal energy (%)
PN per-capita nominal capacity (W)
R interest rate
SF share of fuel emission (%)
T life time of power plant (Year)
x year predicted – year start
y predicted value
Subscripts
f fuel type consumed in power plant
i in the year i
ng natural gas
sf substituted fuel

xx
Superscripts
n power plant type
p emission type (CO2, SO2, NOx and CO)
T thermal power plants
1
: Chapter 1
Introduction
1.1 Background
It is well known that there is a direct relation between electricity consumption
and economic growth. Therefore, the electricity sector has to be developed to sustain
this growth (Squalli, 2007). Like other developing countries, the majority of energy
sources used in Iranian power plants are fossil fuels (IEA, 2008). More electricity
generation in thermal power plants will increase fossil fuel consumption, which
subsequently results in an increase in emissions. Increasing fuel consumption in power
plants or other energy sectors such as domestic, industry, and transport will also cause
rapid resource depletion and reduce energy exports as the major sources of the
government’s income.
Based on the long-term energy plans, Iran wants to diversify its power plant
types and utilization of alternative sources to achieve energy security. One of the recent
types of power plant that Iran wants to develop is the nuclear power plant (NPP). Iran
plans to construct enough NPPs to be capable of supplying 20,000 MW, in various parts
of the country by 2025 to steadily meet the electricity demand, sustain the energy
exporting ability of the government and decrease fossil fuel consumption by power
plants. For the fulfillment of this requirement, the nuclear fuel cycle activities have been
started by the Atomic Energy Organization of Iran (AEOI). Many research centers and
divisions were established, and the technological and scientific infrastructures have
been greatly enhanced.
Iran has decided to produce a certain amount of its future fuel needs through
nuclear power plants. However, this policy causes some difficulties for the country

2
because of the international community’s concern in respect of Iran’s nuclear fuel cycle
activities. These concerns have led to four sets of United Nations Security Council
(UNSC) sanctions and also some sanctions from the E.U. and U.S. over Iran’s refusal to
suspend uranium enrichment.
1.2 Research objectives
The first objective of this study is to obtain the pattern of many aspects of
electricity generation in the Iranian power sector in last four decades and also its
prediction until 2025. This objective includes number of power plant types, share of
each type in the past and the future, base and peak load types and the share and overall
amount of each fuel types consumed or probably will be used in the future. For future
composition prediction, the government policy in the power sector and the trend of
changes in this sector must be taken into account.
The second objective is estimating the total emissions due to electricity
generation in the country in the past and also its prediction in the future. In general,
thermal power plants operated by fossil fuels produce huge amounts of air pollutants
and caused power sector as one of the major sources of air pollutants such as
greenhouse gases in the country. To control the pollutant in this sector and also to be
able to compare several types in view of emissions, it is necessary to have a clear view
on the pattern of emission in power sector for each type of power plant. The pollutants
that will be considered in this study are carbon monoxide (CO), sulfur dioxide (SO2),
carbon dioxide (CO2) and nitrogen oxides (NOx). Fuel consumption profile in Iran is
significantly different from other developing countries, and this difference plays a
significant role in defining the air pollutant's characteristics of power plants. Awareness
of the amount of emissions per unit of electricity generation in each type of thermal
3
power plant is necessary for the selection of the best plant type with regard to air
pollutants and for assessing possible emissions in the future. In view of Iran’s huge
fossil fuel reservoirs, the dominance of fossil fuel based power plants in the future is
predictable, and it is unlikely that the share of other types is likely to become significant
soon. The effect of keeping the current composition and the new one which the
government plans to introduce and the environmental effect of fuel switching to low
carbon fossil fuels will be discussed too. As regards to fossil fuel reserves and
dominance of thermal power plants, what will be the effect of energy policy and the
government’s plan on fuel consumption and emissions in the future? How much nuclear
power plants can help to mitigate the emissions and fossil fuel consumption? Are there
any capabilities such as renewable energy sources in the country to control the
emissions and change the fossil fuel dominance? What are the shares of each fossil fuel
types on emissions and how much can control the pollutants by switching to low carbon
fuel types? The results will show how each strategy influences the emissions and fuel
consumption in the future electricity sector of the country.
The third objective of the thesis is gathering all major threats of energy security
in Iran. The current local and international circumstances and the government’s energy
policy must be taken into account to find and analysis the threats. It is necessary to find
and present the policy suggestions to resolve or control any of the threats.
The fourth objective is to estimate the electricity price generated in each type of
power plants in Iran. The types including, fossil-fuel based, nuclear, hydro power and
also renewable energy sources. Because of lack in accurate financial data in the country
and also many uncertainties, the main effort is to find a range of price by using the
major electricity generation costs. Other minor costs also must be mentioned and the
probable price based on the countries situation should be discussed.

4
Finally, the most important objective of the study is to investigate the effect of
investing in nuclear power as an electricity generator in the country’s power plant sector
and generally on energy sustainability. Four key factors, including energy price,
environmental issues, energy demand and security will be taken into account in this
study. This study will try to determine whether or not nuclear energy is suitable for the
country’s energy sustainability and whether there are better ways for sustainability in
respect of the four factors. This will be done after presenting the history of Iran’s
nuclear activities in the last four decades and its infrastructure, which has been
developed for fulfillment of the government’s energy policy.
To summarize, this study will try to answer these questions:
What was the composition of the power sector in the last five decades, especially the
pattern of fuel consumption, electricity generation and emissions?
What will be the probable pattern of fuel consumption, electricity generation and
emissions in the Iranian power sector in the future?
Is electricity cost generated by nuclear power plants cheaper in comparison with
thermal types in Iran?
Can Iran survive without nuclear power plants or is there any better alternative to
secure future energy demand?
Are there any recommended projects to achieve energy sustainability in Iran? If so,
in which order of priority should these projects be acted upon?
1.3 Limitations of the research
To determine the sustainable power plant composition, which is vital for the
country many considerations should be taken into account. Among them, four important

5
factors price, environmental issue, demand and security will be verified in this study.
Another reason for considering these four factors is that they are the main criteria for
developing nuclear power plants. Many believe that nuclear power is a clean energy that
can increase energy security as well as meet the electricity demand and generate cheap
electricity. This research is done based on the country’s current situation to verify these
criteria. The present situation of the country may change in the future. For example, a
change in the interest rate or finding new markets for natural gas will change the
comparability of electricity price for different types of power plant. New or local
technology can also change the situation of the energy sector of the country. There are
also various internal and international political events that may change the situation in
the future as well.
1.4 Significance of findings
Each country is in a unique situation to decide about its best energy strategy for
all sectors, including electricity generation. In addition, according to their energy
resources, technical and economic abilities they also have many options for their power
plant composition. Because there are many alternative technologies and fuels available
for this sector, it is important for policy makers to understand the implications of the
different policies intended to meet the targets (Nakata, 2004). A comprehensive and
optimized structure for the electricity generation to meet the needs of the country
requires certain consideration. There are many criteria that are important for making
decisions about the future electricity sector structure, such as job creation, energy
demand, opportunities, military security, risk of project, environmental concerns and
available technology. Fuel price, capital funds and environmental costs are also
important factors to take into account in the electricity sector economic analyses. In
6
addition, there may also be certain global factors such as carbon trading at the national
and international level (Oh et al., 2010). Another important analysis for making
decisions pertaining to energy options is the opportunity cost as the value of the next
best alternative choice. As these sets of criteria are different for each country, energy
decisions cannot be made on a ‘one size fits all’ basis. There is no unique answer for the
optimal policy for all, and the strategy in each country depends on the respective
situation.
Power plant type selection depends on the country’s energy policy. For some
countries environmental issues are the first priority while for others the electricity price,
energy security or even job creation are the main priorities. Understanding the results of
this study will help the decision makers in the country to find a solution for energy
sustainability. Moreover, the points that will be suggested can also help them determine
the best options based on the abilities and constraints of Iran in the contemporary
circumstances. They can optimize the strategy by changing certain policies, especially
high-risk ones that are causing problems for the country. The results can also be used
for other developing countries that want to use nuclear energy in their energy basket.
These countries may be among the oil rich or those that import a major part of their
energy. Both can simulate this study for their respective situations. The statistical
importance of the thesis data is that the many energy related data collected. So
researchers have the capability to use them in their research. The power sector data,
such as fuel consumption, emission, electricity generation and pattern in last 42 years or
even the forecasted data for next 16 years are all gathered in the thesis.

7
1.5 Original contribution
At this time when Iranian nuclear activities are considered controversial by
international organizations such as the UN and IAEA, there are not many related
scientific thesis. The conflict between two sides is mainly on uranium enrichment
facilities. Iran pursues uranium enrichment because believes that nuclear energy is
clean, cheap and can answer the energy demand and also helps energy security of the
country. This policy and international sanctions made many difficulties for the country.
This thesis investigates the country’s situation and tries to suggest solutions to address
the difficulties. Work in this field is imperative for international energy security and to
decrease tension in this oil rich region. It is also essential and valuable to find a win-win
solution to resolve the concerns of both sides. The author hopes to diminish tensions,
which even may cause a war in the region by presenting scientific solution to achieve
the main goals in the energy related field. The goals, which in the current circumstances
may not be realizable through continuing nuclear activities. Although Iran has declared
on several occasions that it’s nuclear activities are for peaceful purposes, this study tries
to develop certain recommendations and alternative ways for the energy sector of the
country. If the activities are not peaceful, the problem would be changed, and it would
be hard to find a logical scientific solution. Moreover, this study does not present the
political or legal justifications but collects energy-related data for the country, including
threats and opportunities to provide a wide view and facilitate careful consideration of
the many aspects pertaining to energy sustainability in Iran. This study will also provide
conditions for other researchers in Iran or similar developing countries in respect of
energy policy to consider more factors or also verify the sensitivity effect of particular
factors on energy sustainability.

8
: Chapter 2
Literature review
2.1 Energy in Iran
Iran has an area of 1,648,195 km2, with a population of about 75 million based
on the latest census in 2011, 71% of which live in the urban area, and around 29% live
in the rural area (Statistical Centre of Iran, 2012). The country is a member of OPEC
(Organization of Petroleum Exporting Countries), which controls about 81% of the
world’s oil reserves and produces about 42% of the world’s oil production. Iran is one
of the major exporters of crude oil with approximately 10% of the world’s oil reserves
(151 billion barrels) (Figure 2-1) (OPEC, 2011).
Figure 2-1 OPEC proven crude oil reserves in 2010
Iran has the second largest reserves of natural gas in the world with
approximately 19.7% of the world’s proven natural gas reserves which are about 33,090
billion standard cubic meters (Figure 2-2) (OPEC, 2011). There are considerable
undeveloped gas resources in the country such as the South Pars gas reservoir in the

9
Persian Gulf, which is equivalent to 6.7% of the total world’s resources or around 62%
of Iranian natural gas reserves (Energy Information Administration, 2010b; Hessari,
2005; Ministry of Energy, 2009c).
Figure 2-2 Natural gas reserves in 2009 (Top 10 countries)
It has been a century since commercial crude oil was discovered in Iran (Masjed
Soleiman in the south-west of the country). Subsequently, the petrochemical industry
has had a major influence on the political, economic, cultural and social aspects, as well
as the security of the country. Since the industry was nationalized in 1953, crude oil
exports have been the main source of the government’s revenue upon which the
country’s economy is heavily petrochemical-product dependent. Nowadays, crude oil
exports are the engine of the country’s economic growth constituting 80% of the foreign
exchange earnings, nearly 50% of the government budget revenue and about 23% of the
GDP (Central Bank of Iran, 2010). In the last three decades, the consumption rate of all
types of energy carriers in all sectors industry, transportation, agriculture and domestic
10
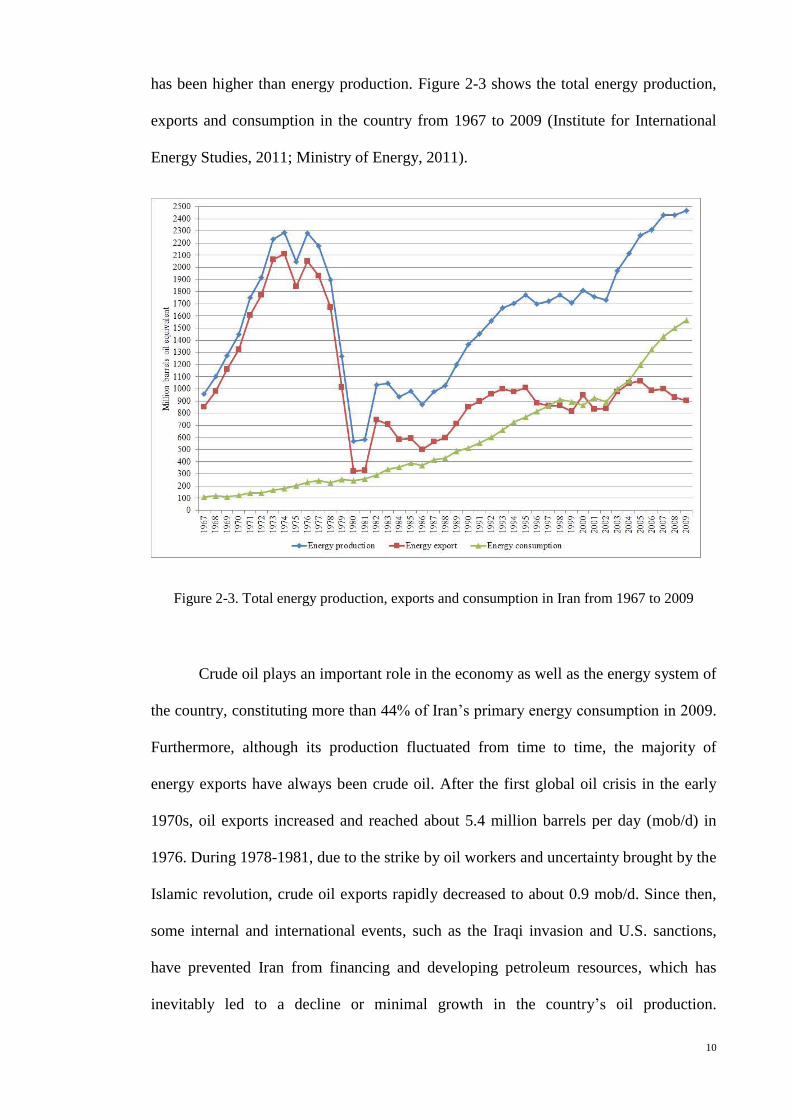
has been higher than energy production. Figure 2-3 shows the total energy production,
exports and consumption in the country from 1967 to 2009 (Institute for International
Energy Studies, 2011; Ministry of Energy, 2011).
Figure 2-3. Total energy production, exports and consumption in Iran from 1967 to 2009
Crude oil plays an important role in the economy as well as the energy system of
the country, constituting more than 44% of Iran’s primary energy consumption in 2009.
Furthermore, although its production fluctuated from time to time, the majority of
energy exports have always been crude oil. After the first global oil crisis in the early
1970s, oil exports increased and reached about 5.4 million barrels per day (mob/d) in
1976. During 1978-1981, due to the strike by oil workers and uncertainty brought by the
Islamic revolution, crude oil exports rapidly decreased to about 0.9 mob/d. Since then,
some internal and international events, such as the Iraqi invasion and U.S. sanctions,
have prevented Iran from financing and developing petroleum resources, which has
inevitably led to a decline or minimal growth in the country’s oil production.
11
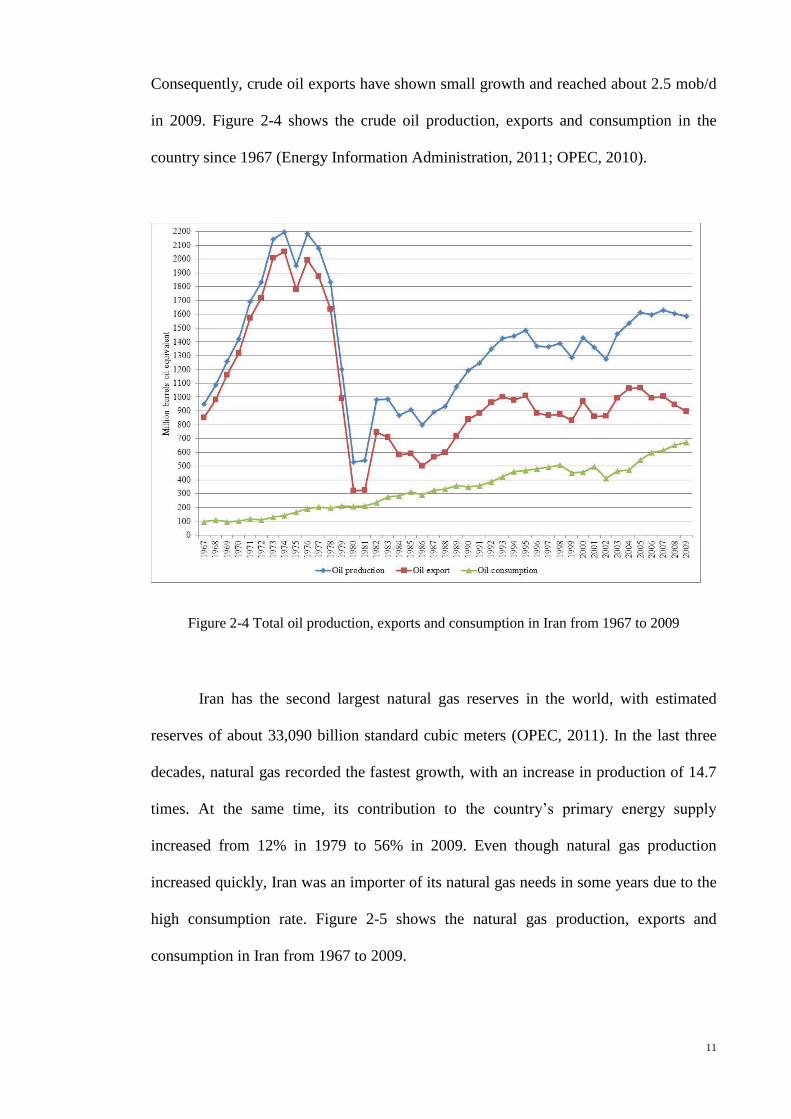
Consequently, crude oil exports have shown small growth and reached about 2.5 mob/d
in 2009. Figure 2-4 shows the crude oil production, exports and consumption in the
country since 1967 (Energy Information Administration, 2011; OPEC, 2010).
Figure 2-4 Total oil production, exports and consumption in Iran from 1967 to 2009
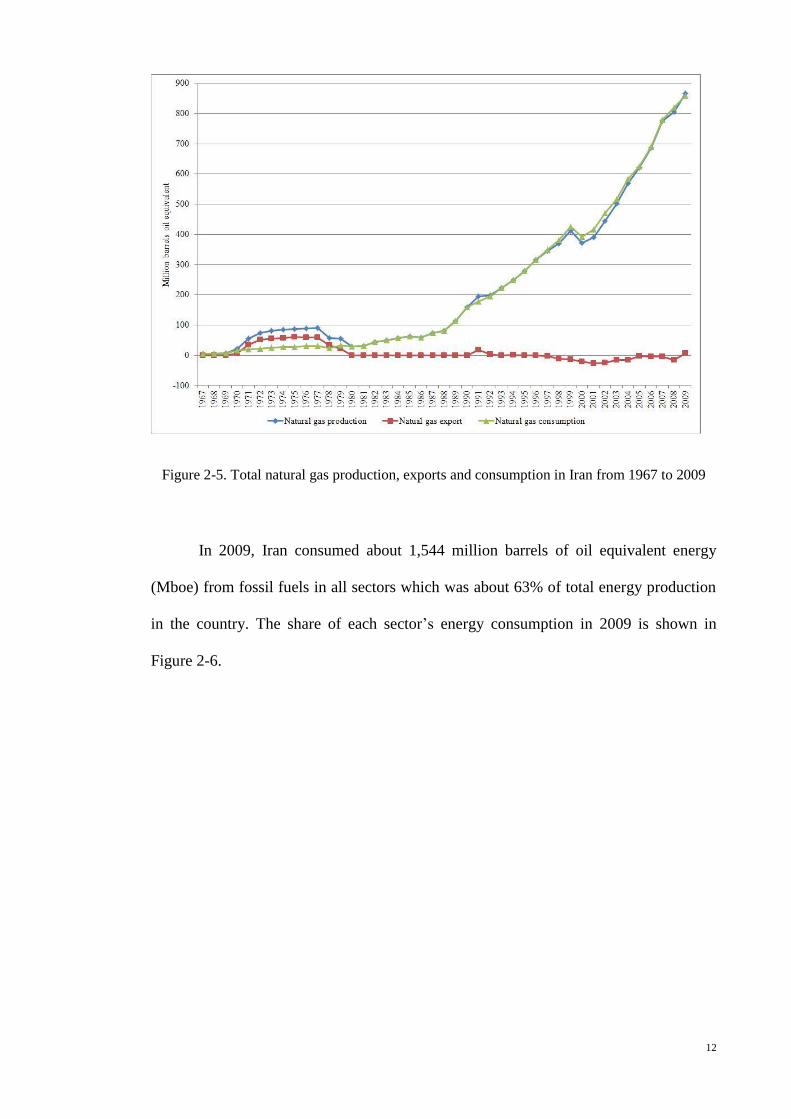
Iran has the second largest natural gas reserves in the world, with estimated
reserves of about 33,090 billion standard cubic meters (OPEC, 2011). In the last three
decades, natural gas recorded the fastest growth, with an increase in production of 14.7
times. At the same time, its contribution to the country’s primary energy supply
increased from 12% in 1979 to 56% in 2009. Even though natural gas production
increased quickly, Iran was an importer of its natural gas needs in some years due to the
high consumption rate. Figure 2-5 shows the natural gas production, exports and
consumption in Iran from 1967 to 2009.
12
Figure 2-5. Total natural gas production, exports and consumption in Iran from 1967 to 2009
In 2009, Iran consumed about 1,544 million barrels of oil equivalent energy
(Mboe) from fossil fuels in all sectors which was about 63% of total energy production
in the country. The share of each sector’s energy consumption in 2009 is shown in
Figure 2-6.

13
Figure 2-6 Amount and share of each sector in the fossil fuel energy demand in 2009
The highest energy consumption sectors in Iran are domestic and power plants,
which together consume half of the country’s total energy. This is followed by
transportation, industry, non-energy sector, the energy sector, and agriculture,
respectively. The consumption of each energy carrier, including electricity, petroleum,
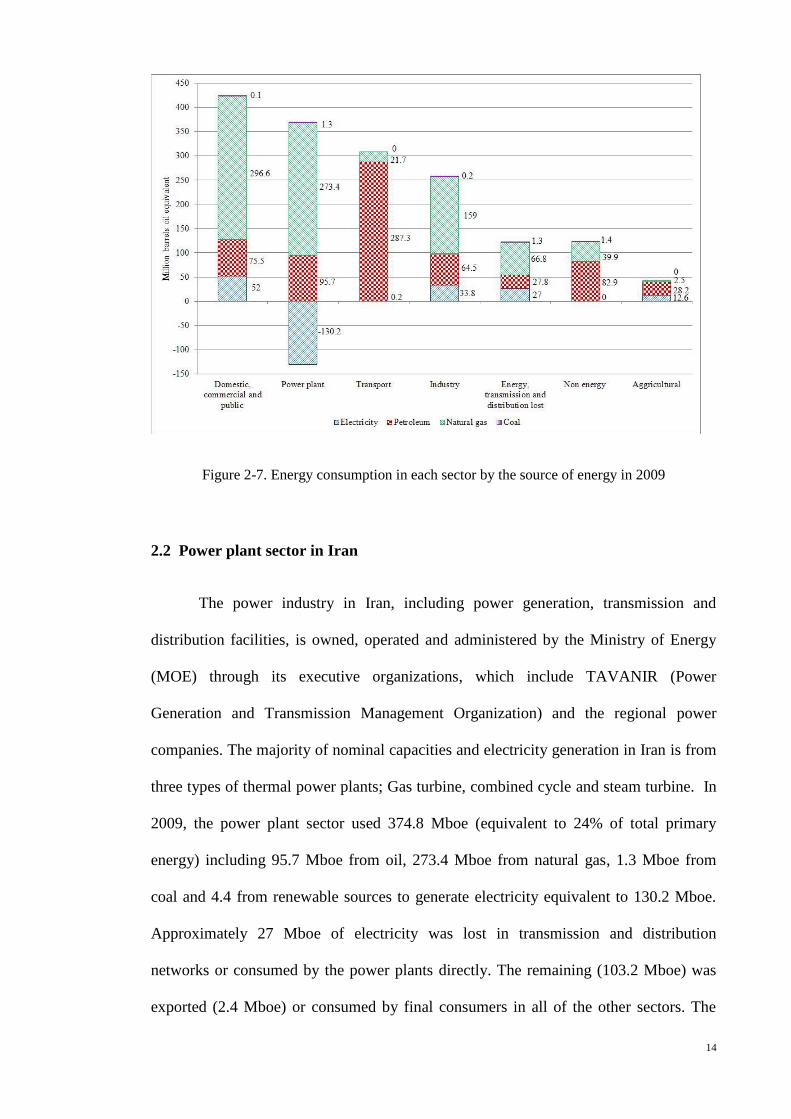
natural gas and coal, in all sectors, for 2009, is shown in Figure 2-7.
14
Figure 2-7. Energy consumption in each sector by the source of energy in 2009
2.2 Power plant sector in Iran
The power industry in Iran, including power generation, transmission and
distribution facilities, is owned, operated and administered by the Ministry of Energy
(MOE) through its executive organizations, which include TAVANIR (Power
Generation and Transmission Management Organization) and the regional power
companies. The majority of nominal capacities and electricity generation in Iran is from
three types of thermal power plants; Gas turbine, combined cycle and steam turbine. In
2009, the power plant sector used 374.8 Mboe (equivalent to 24% of total primary
energy) including 95.7 Mboe from oil, 273.4 Mboe from natural gas, 1.3 Mboe from
coal and 4.4 from renewable sources to generate electricity equivalent to 130.2 Mboe.
Approximately 27 Mboe of electricity was lost in transmission and distribution
networks or consumed by the power plants directly. The remaining (103.2 Mboe) was
exported (2.4 Mboe) or consumed by final consumers in all of the other sectors. The

15
highest electricity consumer sector is the domestic, accounting for about 50% (52
Mboe), while industry accounts for 33% (33.8 Mboe). Figure 2-8 shows the energy
flow of the power plant sector in Iran in 2009 (Ministry of Energy, 2011).
Figure 2-8. Energy flow of the power plant sector in 2009
2.2.1 Fossil fuel based power plants
At present, most of the Iranian power plants are using fossil fuels or non-
renewable sources such as natural gas, fuel oil and diesel to generate electricity. These
power plants are steam turbine, combined cycle, gas turbine and diesel engine.
Steam turbine power plants
The steam turbine type is a base-load power plant. It produces steam of high
purity, high pressure and at a high temperature, which causes the steam turbine to drive
the electric generator. In 2009, steam power plants have 15,598 MW nominal capacity,
which is equivalent to 29.5% of total nominal capacity and produces 45.4% of the total
electricity generation in the country. The efficiency of these power plants in Iran is
about 36% (Ministry of Energy, 2009b).
Gas turbine power plants
Gas turbines are open cycle and do not use water for operation, and require little
time (2-3 years) to build. Gas turbine power plants are sometimes installed as

16
emergency generators. They are mainly used at peak-load or in places that are difficult
to find water resources to use for steam power generation; their thermal efficiency is
about 29% (Ministry of Energy, 2009b). Today, gas turbine power plants in Iran have a
nominal capacity of approximately 18,077 MW, which is equivalent to 34.1% of the
total capacity and produce 25.6% of the total electricity generated in the country.
Combined cycle power plants
Combined cycle power plants are based on the structure of the simple gas
turbine with steam units added to use the residual heat of the flue gasses. This type of
fossil fuel power plant uses the gas turbine in conjunction with a heat recovery steam
generator (HRSG). It is referred to as a combined cycle power plant because it
combines the Brayton cycle of the gas turbine with the Rankine cycle of the HRSG.
This type of power plant has a capacity of 13,664 MW nominal, which is equivalent to
24.3% of the total nominal capacity and produced 29% of the total electricity generated
in the country in 2009. The thermal efficiency of these plants in Iran is about 44%
(Ministry of Energy, 2009b). The maximum efficiency of combined cycle plants
reached a record heat rate of 5690 Btu/kWh, or just under 60%, at a facility in Baglan
Bay, Wales (General Electric Company, 2009).
Diesel engine power plants
The purpose of diesel engine power plants is to provide back up power for
hospitals, water pumps and industries that need to ensure a reliable power supply at all
times. Today diesel engine power plants represent some 10–15% of the total installed
capacity all over the world but constitute less than 0.1% in Iran (Kanoglu et al., 2005).
The efficiency of this type of power plant in Iran is about 32% (Ministry of Energy,
2009b).

17
Fossil fuel consumption in thermal power plants
The type of fuel used for power plants depends on many factors, especially the
economic, politic and technical parameters. These parameters include the cost of the
fuel, geographical location of the power plants, availability of the fuel, environmental
concerns and medium and long-term policies of the energy sector. For example, the fuel
type used in thermal power plants in India and China are mainly coal (Perkins, 2005;
Zhang et al., 2007). In Iran, fossil fuels such as fuel oil, diesel and natural gas are the
main fossil fuels used in thermal power plants. However, mostly the power plants use
natural gas as a primary-fuel, except for diesel engines and the power plants that are
located far from national gas pipelines. There are also emergency backup fuels for
power plants. For example, in the winter when the residential usage of natural gas is
maximized, due to the pressure drop in the national gas pipeline, some power plants
switch their fuel type. The substitute fuel for steam power plants is fuel oil, and for gas
turbine and combined cycle power plants it is diesel oil. Diesel oil is a unique fuel for
diesel engines and is only used at the starting stage for steam power plants. The types of
fuel consumed in Iranian power plants are presented in Table 2.1.
Table 2.1. Fossil fuel types use in Iranian thermal power plants
Fuel type Steam turbine Gas turbine Combined cycle Diesel engine
Natural gas x x x -
Diesel x x x x
Fuel oil x - - -
x = fuel is consume in power plant, and (-) = fuel is not consume in power plant
2.2.2 Renewable energy power plants
Renewable energy is generated from renewable resources such as wind, solar,
hydro and geothermal. The ecological and geographical characteristics of Iran are well

18
suited to a diverse and extensive use of renewable energy sources. In addition, the
demographically diverse large population in scattered and remote areas with different
climates dictates the use of all sources of renewable energy in Iran for better and
equitable access to energy (Mostafaeipour et al., 2009). Non-hydro renewable energy
comprises about 5% of global power generating capacity and supplies about 3.4% of
global electricity production (REN21, 2007). At this time, Iran is using renewable
resources such as hydro and wind to generate electricity.
Hydropower plants
Hydropower is more expensive initially but provides continuous supply of
electricity with high efficiency and a longer life span of the associated infrastructure. It
considerably reduces energy losses, enhances network stability and provides a higher
availability factor compared to the other types of power plant if adequate water
resources are available.
The average annual rainfall of Iran is about 250mm, compared to the world
(with an average annual rainfall of 750 mm) Iran is considered a dry country
(Mohammadi, 2011). Therefore, it is natural that Iran is unable to use all its hydropower
capacity. For example, in 2008, only 2.2% of electricity was generated using
hydropower plants, even though these plants had 14.5% of the total nominal capacity
(Ministry of Energy, 2009c).
Wind turbines
Iran has a large wind potential due to its geographical location (Ministry of
Energy, 2008a). This is a scientifically reliable for both offshore and onshore regions.
This potential for wind power generation and supplying to the national distributing
network, could offer many advantages including job creation in the country. In recent
years, Iran has made considerable progress in utilizing wind energy. Up unto the end of

19
2008, 113 wind turbines were installed in several regions of the country with a total
capacity of 63MW.
2.3 Future power plant composition
For sustainable development and to increase energy security, the Iranian
government plans to fulfill many energy-related projects and increase power plant
diversity. The country is currently launching and developing new energy sources such
as nuclear, coal and more renewable energies like solar thermal, solar photovoltaic,
geothermal, biomass, bio-gas, hydrogen, wave and fuel cells, which are all undergoing
feasibility studies or still under development (SUNA, 2009). In addition, in recent years,
several actions have been taken in order to increase the efficiency and capacity of power
generation, such as empowering gas turbines for some plants, removing the limits on
some generation units and equipping the gas turbines of combined cycle power plants
with cooling systems for inlet air (Niroo Research Institute, 2008). The installation of
steam turbine units next to gas turbines has been carried out in many power plants in
order to achieve a combined cycle. This has resulted in higher efficiency of the unit, less
consumption of fuel, and, consequently, lower release of emissions. Power plant
modernization and performance improvement has also raised the share of the combined
cycle type causing an increase in the total thermal efficiency. The average efficiency of
Iranian power plants in the past 30 years increased from 26% to 37% (TAVANIR,
2009a). Therefore, there will be less fuel consumption to generate a unit of electricity
compared with the old power plants. However, in light of according to Iran’s huge oil
and gas reservoirs, the dominance of fossil fuel based power plants in the future is
predictable, and it is unlikely that the share of the other types will become significant in
the near future.

20
Details of the potential government goals for changes in fuel source composition
and development of the electricity sector were collected from various sources and
described in the following sections. Despite all the technical, economic, and political
limitations that Iran may face in achieving the goal, these are considered as the likely
composition of Iran’s future power plants.
2.3.1 Fossil fuel based power plants
Steam turbines
Due to the high investment required for the construction of steam turbines, there
has not been much new development of this type of power plant in recent years. The
capacity of steam power plants in 2004 was 15,229 MW, but with less than 1% annual
growth only reached 15,704 MW in 2009. It is expected that this trend will continue in
the coming years, and its share of the capacity and electricity generation will be less
than before. Other reasons for the lack of development of the steam power plant are that
they are base-load plants, and it is expected that in the coming years more concentration
will be focused on peak-load power plants. In addition, the construction of nuclear
power plants which is a kind of base-load plant, has contributed to the decrease in the
share of steam power plants (TAVANIR, 2009b). In this study, the steam power plant
capacity in the future is considered the same as the capacity in year 2009.
Diesel engines
The share of diesel engine power plants in Iran’s power capacity and also in
electricity generation, decreased from 21% to less than 1% since 1967. The policy not to
construct a new capacity for diesel engines is due to the fuel prices and pollution

21
problems. In this study, no more investments are envisaged for this type of power plant,
and its total capacity is considered to remain at 425 MW as in 2009.
Coal-fired
Iran has no coal-fired power plants at the moment, however, having the
resources of coal, has made it start a coal-fired power plant in Zarand region and it plans
to increase its capacity after commissioning 5,000 MW in the long-term (Ministry of
Energy, 2009a). In this study, the capacity of 5,000 MW is considered for this type of
power plant in 2025.
Gas turbines and combined cycles
The gas turbine power plants can be used in the rapid operation when the
electricity demand is at its peak. When considering fuel prices, gas turbine power plants
have an economic justification, however, from the viewpoint of national interests, it is
one of the major energy policies in the country to make use of this fuel type at higher
efficiency as combined cycle power plants (TAVANIR, 2009b). Accordingly, the
government plans to launch 27 steam units for the existing gas turbine power plants, and
many of them will become the combined cycle type (TAVANIR, 2009a). Since 2000,
the share of the combined cycle and gas turbine type has grown rapidly, and probably
these types will have the largest share of electricity production in the country in the
future. In this study, the capacity of gas turbines and the combined cycles in the future
are considered to be equivalent to the remaining capacity needed after the consideration
of all other types.

22
2.3.2 Hydropower plants
Hydropower plants do not discharge air pollutant emissions during operation and
provide cheap electricity production and other benefits. In addition, due to the flexible
operation, they are important for network stability. In recent years, despite a drought
which has reduced their share of electricity generation, the construction process of
hydropower plants has increased and several huge projects are under feasibility, study
and construction. Based on the country's 20-year vision plan (2006-2025), the entire
hydropower capacity should be extracted and exploited (MehrNews Agency, 2008).
Figure 2-9 shows the capacity growth of hydropower plants in the country (Iran water &
power resources developement Co., 2009).
Figure 2-9. Iranian hydropower plants nominal capacity

23
2.3.3 Non-hydro renewable energies
Although most of the Middle East countries are rich in fossil energy resources, the
use of Renewable Energy Sources (RES) has started to be of interest to the scientific
community and government (Mostafaeipour & Mostafaeipour, 2009). Energy
Information Administration (EIA) predicted that renewable energies are projected to
account for a modest 3% of the Middle East total electricity generation by 2030 (Energy
Information Administration, 2009).
Iran is a developing country with a high rate of electricity consumption. In order
to secure the supply of electrical energy, renewable energy should play an important
role in helping the sustainable development, especially in Iran where most different
types of RES are available and are also possible to implement to acquire the required
energy supply (Ghobadian et al., 2009). According to the objectives of the fourth 5-year
plan, the government will increase the share of electricity production from these sources
to 1% (PENN, 2008). The government policy to purchase electricity produced from
renewable resources from the private sector will encourage investment in this sector.
Furthermore, because of reduction in the costs due to technological development, it is
expected to speed up the growth to achieve the goal as soon as possible (Ministry of
Energy, 2009c). In Iran, the renewable sources of energy including wind, solar and
geothermal will account for 3% of the country’s nominal electricity generation capacity
(Ministry of Energy News Agency, 2010).
Wind energy
Due to Iran’s geographical location, it has a good potential for the production of
electricity using wind energy. The renewable energy organization of Iran (SUNA) has
provided a national wind map (wind atlas), as shown in Figure 2-10 (Renewable Energy
Organization of Iran, 2010). The total potential for wind power was initially estimated

24
as 30,000 MW (GWEC, 2006). In recent years, various activities have been done to
implement wind energy for the generation of electricity, and the application of wind
energy has been developed very fast (Ameri et al., 2006). Since 2001, the use of wind
energy has been growing rapidly, and its capacity has increased 30% annually and
reached 92 MW in 2009. Finally, based on the next country's development plans, 2,500
MW of wind turbines will be developed (TAVANIR, 2009a).
Figure 2-10. Wind atlas map of Iran
Solar energy
The average solar radiation for Iran is about 5.3 kWh/m2/day and it is even
higher in the central region of Iran, with more than 7.7 h/day (more than 2,800 h/year),
as depicted in Figure 2-11 (Center for Environment and Energy Research and Studies,
2005; Ministry of Energy, 2008b). The first integrated solar combined cycle system
(ISCC), which is the biggest of this type of power plant in the Middle East, is under
construction in Yazd. Technical and economic assessment has shown that this is the

25
most suitable project for renewable energy sources in Iran (Hosseini et al., 2005). The
great amount of solar energy potential and environmental interest are among the main
considerations that led the Ministry of Energy to define, support and install the first 250
kW pilot solar thermal power plant in Shiraz (Ministry of Energy, 2009c; Yaghoubi et
al., 2003). The Center of Renewable Energy Research and Application (CRERA) and
Atomic Energy Organization of Iran (AEOI) has conducted and completed many
research projects in the area of solar energy. For example, the design and simulation of
solar water pumps, solar water distillation of various types, design, manufacture, and
simulation of solar collectors of different types, solar refrigerator and design and the
manufacture of solar air heaters (Ghobadian, et al., 2009).
Figure 2-11. Solar radiation in Iran

26
Geothermal energy
It is indicated that 8.8% of Iran has prospects for geothermal power plants with
potential for about 18 fields (Noorollahi et al., 2009). The internal geothermal energy
has been estimated to provide about 1400 MW of power for the consumers in Iran
(Fadai, 2007). Studies by CRERA showed that ten promising areas have been identified
throughout Iran since 1995 (see Figure 2-12) (Lavizeh, 2002). The Ministry of Energy
has started building the first geothermal power generation in one of these areas in
Meshkinshahr in the North West of Iran. It is predicted that in phase I, about 5 MW and
in phase II, about 55 MW electricity will be produced from these projects (Ministry of
Energy, 2009c).
Figure 2-12. Geothermal potential of Iran

27
2.3.4 Nuclear power plant
Nuclear power plants (NPP) have some advantages in comparison with fossil
fuel types. They are a base-load type, which helps networks in terms of stability, as well
as decreasing the emissions of greenhouse gases. Moreover, the price of nuclear fuel is
comparatively stable, while not requiring much space to store. Someone compare
benefits of nuclear electricity with other alternatives in their countries. For example, (de
Carvalho et al., 2009) compared construction of new nuclear power with hydro power in
Brazil and showed that nuclear has not priority for expand power generation and large
scale hydro power plants are cost effective than nuclear. Brazil has a huge hydro power
potential around 261 GWh, which merely 27% of them are in use. His study shows that
using more hydro power and also optimizing the energy sector with conjunction with
fossil fuel power plants is the best solution for Brazil’s situation.
Nuclear energy has been used to produce electricity for more than 50 years. In
2007, it provided about 17% of the world’s electricity supply, 23% in the Organization
for Economic Co-operation and Development countries (OECD) and about 30% in
Europe. Currently, around 438 reactors, representing a total capacity of 372 GW (2,719
TWh) are in operation in the world, and 54 reactors are still under construction
(International Atomic Energy Agency, 2010; International Energy Agency (IEA), 2010;
Lior et al., 2007). According to the IAEA’s 2006 projections, the world nuclear power
capacity is expected to expand to a minimum of 414 GW in 2030 and a maximum of
679 GW according to the high estimates (International Atomic Energy Agency, 2007).
According to Gorashi, Iran needs 15 GW nuclear power plants to be constructed within
30 years to secure a sustainable energy development (Ghorashi, 2007). Based on other
reasons the need for energy, superior technology achievement, creating diversity,
energy security, and environmental advantages nuclear power plant development is

28
considered by some as a necessity for the long-term plan for energy supply (ISCA
Agency, 2009).
Based on the long-term energy plans, Iran wants to diversify its power plant
types and utilize alternative sources to achieve energy security. One of the recent power
plant types that Iran wants to develop is nuclear power plant (NPP). The idea of
building NPP in Iran is not new. In the mid-1970s, a major nuclear power program was
recommended to Iran by the U.S.A. based on the future energy needs of the country.
This study was carried out at Stanford University. The proposed NPP began by the
construction of two 1,200 MW NPP at Bushehr supervised by Kraftwerk Union AG
(KWU), a subsidiary of Siemens. The Bushehr NPP unit 1 reactor was 85% complete
prior to the Iranian revolution, and was due to be completed in 1981, however in 1979
(after the revolution) the construction program was suspended. In 1995, the Atomic
Energy Organization of Iran (AEOI) and the Ministry of Atomic Energy of the Russian
Federation (MINATOM), signed a contract on the scope of work for completing the
Bushehr NPP unit 1 with a 1000 MW pressurized water reactor (PWR) (IAEA, 2009).
The launching of this power plant was postponed several times, however, the nuclear
fuel was finally transferred in Aug 2010, and will probably be generating electricity by
early 2011 (Worldnews, 2010). In line with the construction of 1,000 MW pressurized
water reactor type at Bushehr with Russia’s assistance, Iran is planning to operate a
nuclear power plant of 360 MW using local technology (TAVANIR, 2009b). In
addition, construction of 5,000 MW of nuclear power plants is considered as a goal in
the fifth 5-year national development plan (started 21 March 2010). Following the trend
in the sixth and seventh country's 5-year plans by 2025, nuclear power plants will
supply 10% of the electrical energy needs of the country equivalent to 20,000 MW
(MehrNews Agency, 2009). The main goals of Iran are to meet the electricity demand,
sustain the energy exporting ability for the government and decrease the fossil fuel

29
consumption by power plants. For the fulfillment of these requirements, the nuclear fuel
cycle activities have been started by AEOI. Many research centers and divisions have
been established, and the technological and scientific infrastructures have been greatly
enhanced (World information service on energy, 2010; World nuclear association,
2010a).
However, as the time for the commissioning of the Bushehr nuclear power plant
has been prolonged, it is not clear as to whether a 10% supply of electricity needs from
nuclear power by 2025 is realistic. In addition, further concerns of the international
community in respect of the Iranian nuclear activities and the imposition of various
sanctions, has increased the economic, political and social costs to execute the plan
(World Nuclear Association, 2010b). Nevertheless, in this part of study, the government
targets on constructing 20,000 MW nuclear power plants by 2025 is considered as the
capacity for this type of power plant.
Uranium resources in Iran have not been fully researched, but it is speculated to
range between 700 and 1,400 tons (for extraction cost less than 260 US$/kg) (Ministry
of Energy, 2011). At the moment, the majority of uranium used in Iran is imported
(IAEA, 2009). Iran has a uranium mine in Saghand and is capable of producing
yellowcake by milling uranium ore in another mine in Gachin near Bandar-Abbas. It has
also been able to turn yellowcake into UO2 and then to UF6 gas in the Esfahan nuclear
technology center as well as enriching this gas to increase the amount of U-235 at the
fuel enrichment plant in Natanz. The final stage of the chain is converting UF6 back to
UO2 and into ceramic fuel pellets, which Iran plans to do in the Esfahan nuclear
technology center. Iran has considered two storage sites in Anarak and Karaj for
depositing the used fuels in the future.

30
Nuclear fuel cycle in Iran
Nowadays, although 32 countries are generating electricity using NPPs, only 8
of them have industrial nuclear fuel production for their own consumption or for export.
Other countries do not have it because of economic, technical or political reasons. Iran
has some justifications for producing some parts of its future nuclear fuel needs. First, it
plans to construct NPPs capable of generating 20,000 MW NPP, which will supplement
10% to 20% of its energy needs and it hopes to be at least partially independent when it
comes to nuclear fuel. Second, although it has had some share in the enrichment
factories or uranium mines abroad since 1975, it has faced some difficulties in the past
in terms of accessing nuclear fuel or having laboratory facilities to conduct experiments
(Reuters, 2010). Consequently, to resolve these concerns Iran has successfully
developed all the elements of the nuclear fuel cycle itself by constructing many nuclear
facilities to achieve independence. This has led to the indirect consequences of Iran
developing an indigenous nuclear fuel cycle that is capable of supplying and sustaining
its own NPP. The list of facilities in the design, operating or under construction phases
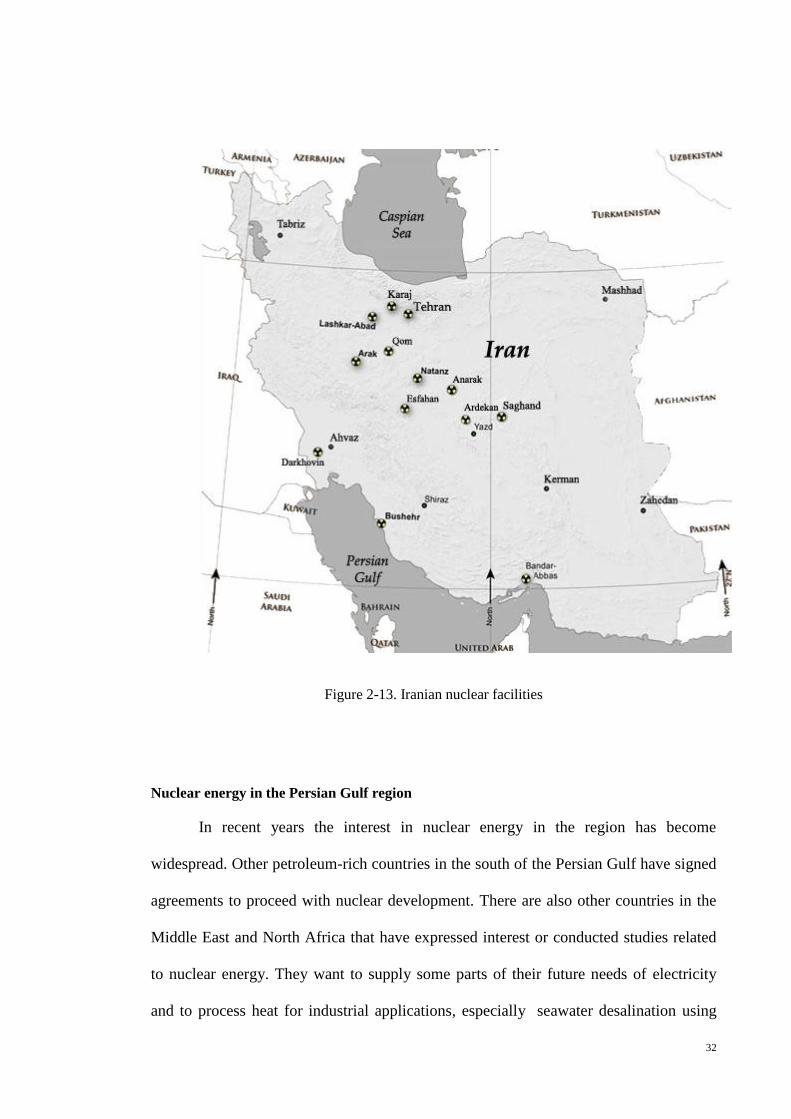
in the country are tabulated in Table 2.2 and shown in the country’s map in Figure 2-13
(AEOI, 2009; Nuclear Threat Initiative, 2010; The Institute for Science and
International Security, 2010; World nuclear association, 2010a).

31
Table 2.2. Iranian nuclear capabilities
Location Capability
Anarak Waste storage site
Arak Hot cell facility for production of radioisotopes
Heavy water production plant
Ardekan Uranium mine
Bandar-Abbas (Gachin) Uranium mine
yellowcake production
Bushehr Nuclear power plant
Darkhovin Nuclear power plant (under design)
Esfahan Nuclear technology center
Miniature neutron source reactor
Light water sub-critical reactor
Heavy water zero power reactor
Fuel fabrication laboratory
Uranium conversion facility
Fuel manufacturing plant
Karaj Radioactive waste storage
Lashkar Ab’ad Pilot uranium laser enrichment plant
Natanz Pilot fuel enrichment plant
Fuel enrichment plant
Qom (Fardo) Semi-industrial uranium enrichment
Saghand Uranium mine
Tehran Nuclear research center
Molybdenum, Iodine, and Xenon
Radioisotope production facility
Jabr Ibn Hayan multipurpose laboratories
Waste handling facility
32
Figure 2-13. Iranian nuclear facilities
Nuclear energy in the Persian Gulf region
In recent years the interest in nuclear energy in the region has become
widespread. Other petroleum-rich countries in the south of the Persian Gulf have signed
agreements to proceed with nuclear development. There are also other countries in the
Middle East and North Africa that have expressed interest or conducted studies related
to nuclear energy. They want to supply some parts of their future needs of electricity
and to process heat for industrial applications, especially seawater desalination using

33
nuclear energy (El-Genk, 2008; Murphy, 2007). The main goal of developed countries
in supporting petroleum-rich countries in this way is to keep them assured of primary
energy exports in the future while creating two-way dependency on nuclear and fossil
fuels. The same situation happened about four decades ago in Iran when its population
was one-third of what it is today, and when it produced 5 to 6 mob/d oil with only 10%
for domestic use. At that time, the developed countries helped Iran to construct much of
its infrastructure and proposed the development of some thousands of MW of nuclear
electricity.

34
: Chapter 3
Methodology
3.1 Introduction
In this chapter, the outline of the methodology employed in the study is
presented. As shown in Figure 3-1, there are many methodologies used in this study.
There is a mathematical method to find unavailable data in the past, analyze trends and
estimates for future data. The methodology is to analyze the power sector composition.
There are many equations for verifying various aspects of the power sector such as
capacity, generation, fuel consumption and emissions. The levelized electricity cost is
also selected as a methodology to estimate the electricity price in power plants. All the
collected data used in this study is presented in separate tables at the end of this chapter.
The data are related to the Iranian power sector over the last 43 years such as power
capacity, generation and fuel consumption.

35
Figure 3-1. Flowchart summarizing the methodologies used in the research
3.2 Power sector composition
3.2.1 Method of data estimation
Some data are already available but others have to be estimated. There are
several methods for estimating data; one that is widely used is polynomial curve fitting.
This method tries to describe the relationship between a variable X as the function of
available data and a response Y that seeks to find a smooth curve that best fits the data,
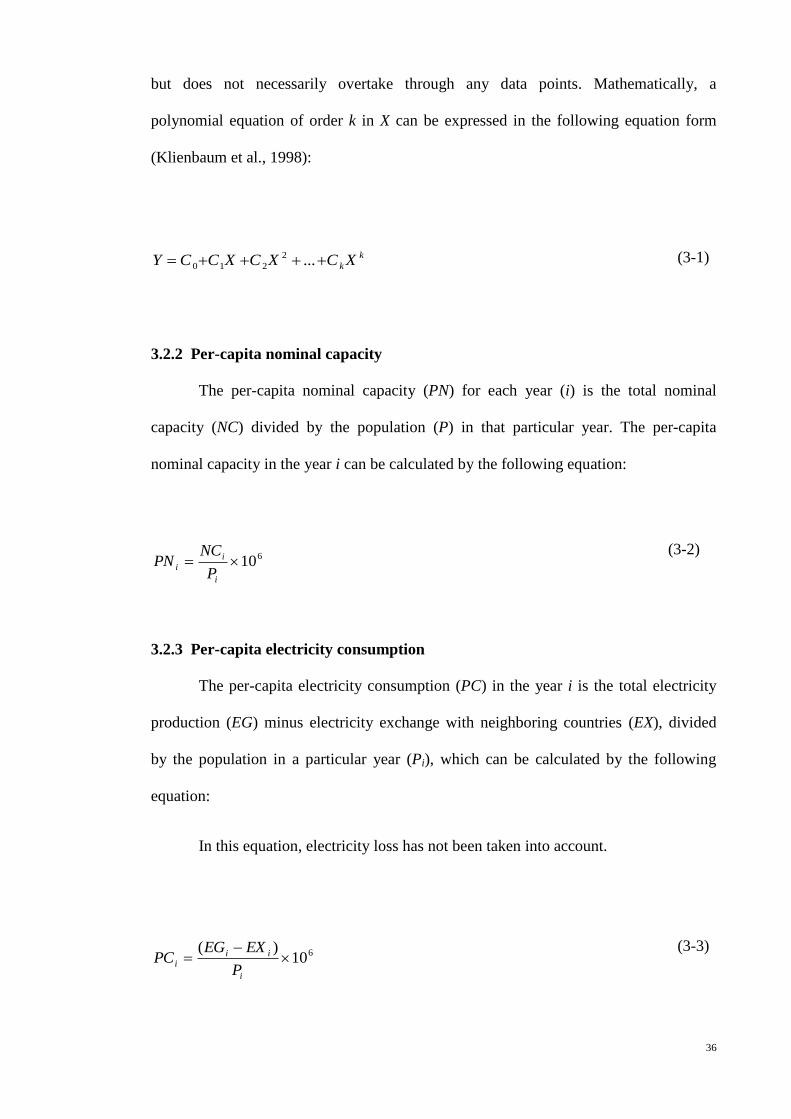
36
but does not necessarily overtake through any data points. Mathematically, a
polynomial equation of order k in X can be expressed in the following equation form
(Klienbaum et al., 1998):
k
k XCXCXCCY ...2
210 (3-1)
3.2.2 Per-capita nominal capacity
The per-capita nominal capacity (PN) for each year (i) is the total nominal
capacity (NC) divided by the population (P) in that particular year. The per-capita
nominal capacity in the year i can be calculated by the following equation:
610i
i
iP
NCPN
(3-2)
3.2.3 Per-capita electricity consumption
The per-capita electricity consumption (PC) in the year i is the total electricity
production (EG) minus electricity exchange with neighboring countries (EX), divided
by the population in a particular year (Pi), which can be calculated by the following
equation:
In this equation, electricity loss has not been taken into account.
610)(
i
ii
iP
EXEGPC
(3-3)

37
3.2.4 Percentage of nominal capacity and electricity generation
To understand the changes in pattern of nominal capacity and electricity
generation, the share of each type of power plant (NPin & PEi
n) can be identified by the
following equations:
100i
n
in
iNC
NCNP
(3-4)
100i
n
in
iEG
EGPE
(3-5)
3.3 Thermal power plant emissions
The methodology used to evaluate emissions in power plants is the one
recommended by the Emissions Inventory Improvement Program of the U.S.
Environmental Protection Agency. An emissions factor is a representative value that
attempts to relate the quantity of a pollutant released into the atmosphere with an
activity associated with the release of that pollutant. These factors are usually expressed
as the weight of the pollutant divided by a unit weight, volume, distance, or duration of
the activity emitting the pollutant (e.g., kilograms of particulate emitted per liter of
diesel burned). In most cases, these factors are simply the averages of all available data
of acceptable quality, and are generally assumed to be representative of the long-term
averages for all the facilities in the source category (EIIP, 2001; U.S. Environmental
Protection Agency, 2010).
The emissions factor of a fuel will be different based on the power plant type. As
mentioned in Table 2.1, all thermal power plants (except diesel engines) use more than

38
one type of fossil fuel. Therefore, the emissions factor for each fuel, such as diesel will
be different from that of a steam turbine, gas turbine or diesel engine power plant.
Consequently, fuel has three different combustion types and boiler configurations in
these three types of power plant.
The amount of SO2 is directly related to the amount of sulfur. The amounts of
sulfur in diesel and fuel oil and the calorific value of natural gas have not been fixed so
the mean value is used in the calculations.
3.3.1 Emissions production
To estimate the total emissions due to electricity generation in the country, the
amount and type of fuel used in all power plants should be considered. The emission
production is equal to the emissions factor (EF) multiplied by the amount of fuel
consumed (FC). Therefore, the emissions p due to use of fuel f in power plant type n in
the year i, can be calculated by the following equation:
n
fi
np
f
pn
fi FCEFEM (3-6)
To assess the impact of each type of fuel in total emissions of each power plant,
the contribution of each fuel in total emissions (SF) can be calculated by the following
equation:
100
f
pn
fi
pn
fipn
fiEM
EMSF
(3-7)

39
The annual emissions (EMip) are the summation of emissions for all types of
power plant due to all types of fuel used. This can be calculated by the following
equation:
n f
pn
fi
p
i EMEM (3-8)
Thermal energy released due to inflammation of each type of fuel depends on
the calorific value of the fuel (CVf). The share of each type of fuel in total thermal
energy consumed in power plants (PF) can be calculated by the following equation:
100
f
n
fif
n
fifn
fiFCCV
FCCVPF
(3-9)
3.3.2 Emissions per unit of electricity generation
The emissions per unit of electricity generation (EP) in the Iranian power sector
for each year is a function of total annual emissions (EM) divided by total electricity
generated (EG) by the thermal power plants. This can be calculated by the following
equation:
T
i
p
ip
iEG
EMEP
(3-10)

40
3.3.3 Emissions per unit of electricity generation for each type of power plant
Awareness of the amount of emissions per unit of electricity generation in each
type of thermal power plant is necessary for selecting the best of plant type with regard
to air pollutants and for assessing possible emissions in the future. The emissions per
unit of electricity generation for each type of power plant is a function of the emissions
factor, fuel consumption in each type of power plant and electricity generation from that
particular power plant. The emissions p per unit electricity generation in power plant
type n in the year i, can be calculated by the following equation:
n
i
f
n
fi
pn
f
pn
iEG
FCEF
EP
(3-11)
3.4 Prediction of future power plant sector composition
3.4.1 Scenarios
The scenarios are tools for ordering perceptions about alternative future
environments. The results might not be an accurate picture of tomorrow, but may
provide a better decision about the future. Regardless of how things could actually be,
both the analysts and the decision makers will have a scenario that resembles a given
future and will help researchers consider both the possibilities and consequences of the
future (Schwartz, 1996). In addition, to understand the condition of fuel consumption
and emissions in the future, three alternative scenarios will be discussed. These
scenarios include two power plant compositions and a fuel type switching that is
evaluated for the timeframe of 2025, which is the end of the Iran’s 20-year vision plan.
The scenarios selected according to the thesis objectives. The first one is to verify the
effect of the government future power sector composition. The second one selected to

41
approximate the future condition if the composition does not change (business as usual).
The third scenario is to verify the effect of applying a new energy policy in power plant
fuel types on the future conditions.
Scenario 1
To estimate the future emissions, it is essential to know the power plant
developmental pattern. The future power plant composition presented in Chapter 2-3 is
considered as the first scenario. The first scenario mainly focuses on the new power
plant composition that the government is planning to implement.
Scenario 2 (old composition)
In this scenario, the fuel types and the composition of power plants in the future
are assumed to be the same as in year 2009. No improvement in technology, change in
the power plant composition and fuel consumption or apply in long-term policies has
been considered. In other words, this is the simplest way to simulate the emissions and
fuel consumption in the future.
Scenario 3 (fuel switching)
The difference between the first two scenarios is the composition of power plants.
While in this scenario, the main point is the fuel switching, while the power plant
composition will remain the same as the first scenario. As some countries are seeking to
reduce their emissions by converting to a low carbon content type of fuel, the effect of a
stable supply of natural gas and reduction in the use of liquid fuels in thermal power
plants is investigated in this scenario. Supplying 100% energy from natural gas and
eliminating diesel are considered for gas turbines and combined cycle power plants. For
steam turbine power plants, diesel is used at the starting stage. For this reason, using
natural gas instead of only fuel oil has been evaluated.
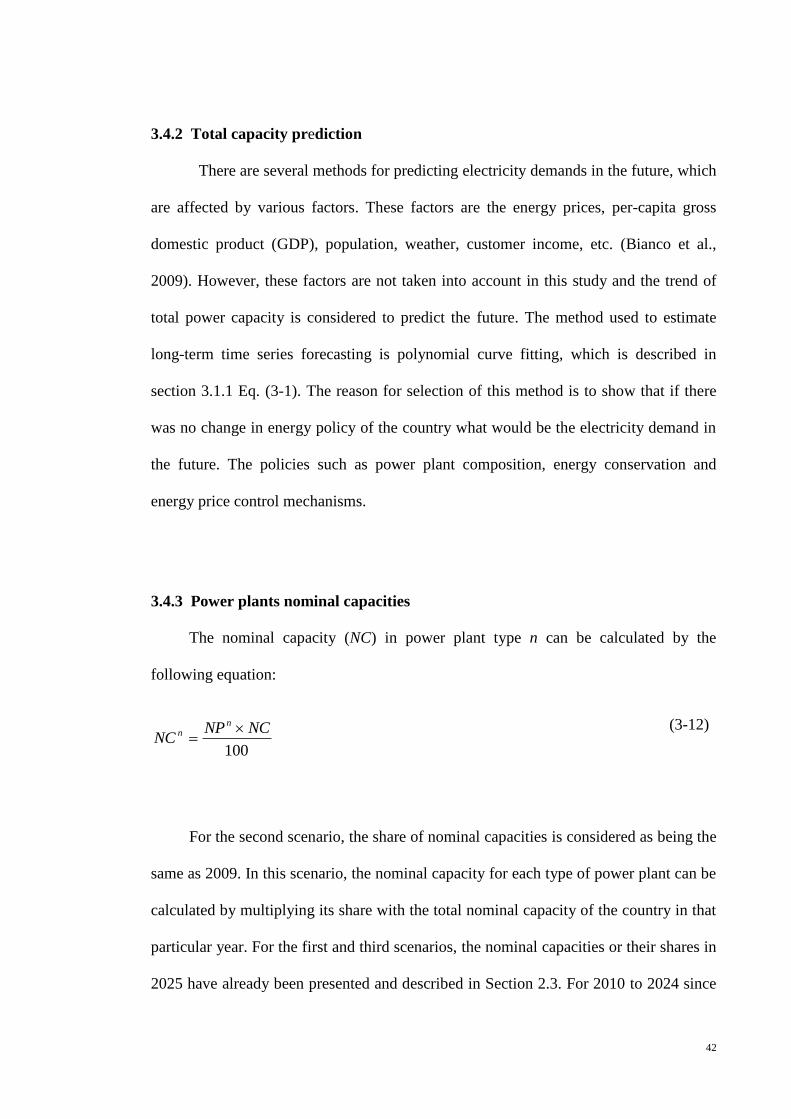
42
3.4.2 Total capacity prediction
There are several methods for predicting electricity demands in the future, which
are affected by various factors. These factors are the energy prices, per-capita gross
domestic product (GDP), population, weather, customer income, etc. (Bianco et al.,
2009). However, these factors are not taken into account in this study and the trend of
total power capacity is considered to predict the future. The method used to estimate
long-term time series forecasting is polynomial curve fitting, which is described in
section 3.1.1 Eq. (3-1). The reason for selection of this method is to show that if there
was no change in energy policy of the country what would be the electricity demand in
the future. The policies such as power plant composition, energy conservation and
energy price control mechanisms.
3.4.3 Power plants nominal capacities
The nominal capacity (NC) in power plant type n can be calculated by the
following equation:
100
NCNPNC
nn
(3-12)
For the second scenario, the share of nominal capacities is considered as being the
same as 2009. In this scenario, the nominal capacity for each type of power plant can be
calculated by multiplying its share with the total nominal capacity of the country in that
particular year. For the first and third scenarios, the nominal capacities or their shares in
2025 have already been presented and described in Section 2.3. For 2010 to 2024 since
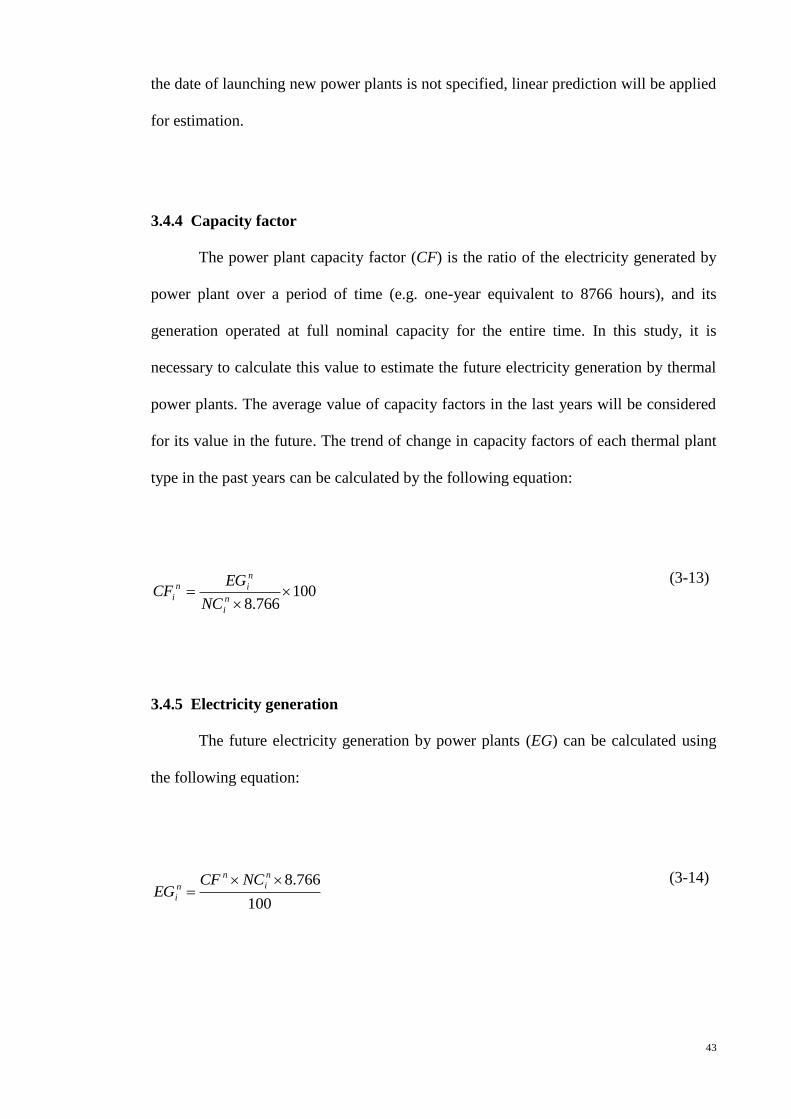
43
the date of launching new power plants is not specified, linear prediction will be applied
for estimation.
3.4.4 Capacity factor
The power plant capacity factor (CF) is the ratio of the electricity generated by
power plant over a period of time (e.g. one-year equivalent to 8766 hours), and its
generation operated at full nominal capacity for the entire time. In this study, it is
necessary to calculate this value to estimate the future electricity generation by thermal
power plants. The average value of capacity factors in the last years will be considered
for its value in the future. The trend of change in capacity factors of each thermal plant
type in the past years can be calculated by the following equation:
100766.8
n
i
n
in
iNC
EGCF
(3-13)
3.4.5 Electricity generation
The future electricity generation by power plants (EG) can be calculated using
the following equation:
100
766.8
n
i
n
n
i
NCCFEG
(3-14)
44
3.4.6 Fuel consumption per unit of electricity generated
The fuel f consumption per unit electricity generation in power plant type n in the
year i can be calculated by the following equation:
n
i
n
fin
fiEG
FCFE
(3-15)
To estimate the average fuel consumption for a unit of electricity production in
each type of power plant, only the values related to certain years are applied. The
average fuel consumption for certain years is considered as a selected value, calculated
by the following equation:
8
... 200820022001
n
f
n
f
n
fn
f
FEFEFEFE
(3-16)
3.4.7 Fuel consumption in the future
The total fuel consumption in thermal power plants (FC) in the future is estimated
by multiplying the average fuel consumption (FE) per unit of electricity generated by
power plants in last years and the electricity generated (EG) which predicted for the
future. This can be calculated by the following equation:
n
i
n
f
n
fi EGFEFC (3-17)
45
3.4.8 Fuel consumption in fuel switching scenario
In the third scenario due to the replacement of fuel oil with natural gas, the
consumption of fuel oil in power plants is eliminated. The diesel consumption used in
diesel engines or as the starter in steam turbines can still be calculated by Eq. (3-17). In
fact, natural gas fuel (ng) should compensate for the thermal energy of liquid fuels; its
excess volume use can be calculated by the following equation:
n
sf
ng
sfn
ng FCCV
CVFC
(3-18)
The substituted fuel (sf) for the gas turbine and combined cycle is diesel and for
the steam turbine it is fuel oil. The natural gas caloric value depends on the source of
fuel. However in this study the average value has been considered in the calculation.
3.4.9 Emissions in the future
The pollutant p emissions per unit electricity generation for power plant type n is
calculated by multiplying the emissions factor (EF) and average fuel consumption per
unit of electricity generation (FE) in the respective power plants in the last years, which
can be calculated by the following equation:
n
f
pn
f
pn FEEFEP (3-19)
The total of annual emissions (EM) is equal to the summation of emissions per

46
unit of electricity generation (EP) multiplied by the amount of electricity generated
(EG) by the respective power plant (n) in the year (i). This can be calculated by the
following equation:
n
n
i
pnp
i EGEPEM (3-20)
For the fuel-switching scenario, emissions (EM) can be calculated by multiplying
the emissions factor (EF) by the amount of fuel consumed (FC). Therefore, the total
emissions p of fuel f in power plant type n, can be calculated by the following equation:
n f
n
f
np
f
p FCEFEM (3-21)
3.5 Electricity cost
Levelized electricity cost (LEC) is the price at which electricity must be
generated from a specific source in order to break even (International Energy Agency,
2005). It is an economic assessment of all the electricity generated by a technology as
well as the cost of the power generation system, including the building and operating
costs over its lifetime. The levelized cost is useful in evaluating the financial feasibility
of a power generation technology and the cost of one technology against other
alternatives. In other words, it is the methodology used to compare different
technologies in the electricity market. The LEC can be calculated by the following
equation, which OMC is operation and maintenance cost, FC is fuel cost, r is interest
rate, n is total life time of the power plant and i is the year.

47
∑
( )
∑
( )
(3-22)
In this study, to approximate the relative cost of electricity generated in each
alternative electricity generator, the simple levelized electricity cost (sLEC) is selected
as a methodology. The main reason to select this methodology is the limitation of
gathering accurate an up-to-date information about many minor costs related to the
electricity generation in the country. More accurate analyses need accurate data and
taking into account the effect of many factors such as fuel price in local and
international market and also considering the variation of inflation as well. In this
methodology, the common and major costs of power generation, including capital,
operation and maintenance, and fuel have been considered based on their performances
in Iran. The sLEC can be calculated using the following equation:
(3-23)
In this equation, OMC is fixed and the variable operation and maintenance costs.
FT is fuel cost in terms of thermal value, and HR is the heat rate, the ratio of input
energy and output electricity generated, which depends on the efficiency of the power
plant. CF is capacity factors, the ratio of the electricity generated by power plant over a
period of time (e.g., one-year equivalent to 8,766 hours), and its generation operated at
full nominal capacity for the entire time. OCC is the overnight capital cost the cost of a
project if it was completed "overnight" and also if no interest was considered during
48
construction. CRF is the capital recovery factor, which indeed simulates the overnight
capital cost as a constant annuity cost for a given length of time or number of annuities
received (t). The CRF can be calculated by the following equation:
( )
( )
(3-24)
To evaluate the impact of carbon emissions trading on electricity cost, the
effects of carbon price variation on the electricity cost (CEC) will be calculated by
multiplying the emissions per unit electricity generation (EP) in Iranian thermal power
plants with carbon prices (CP). This can be calculated by the following equation:
(3-25)
3.6 Data collection
3.6.1 Power sector data
The data used for this study are based on the electricity generation, exchanged
electricity with neighboring countries, fossil fuel used and population of Iran from 1967
to 2009. These data were collected from references (Ministry of Energy, 1979 - 2007;
Statistical Centre of Iran, 2006; TAVANIR, 2008) and are presented in Appendix A in
Table A - 1 to Table A - 7.
The emission factors for all types of fuel with different combustion types were
mostly obtained from references (EPA, 2002; U.S. Environmental Protection Agency,
2010) and given in Table 3.1.
Table 3.1. Emission factors used for estimating emission in thermal power plants
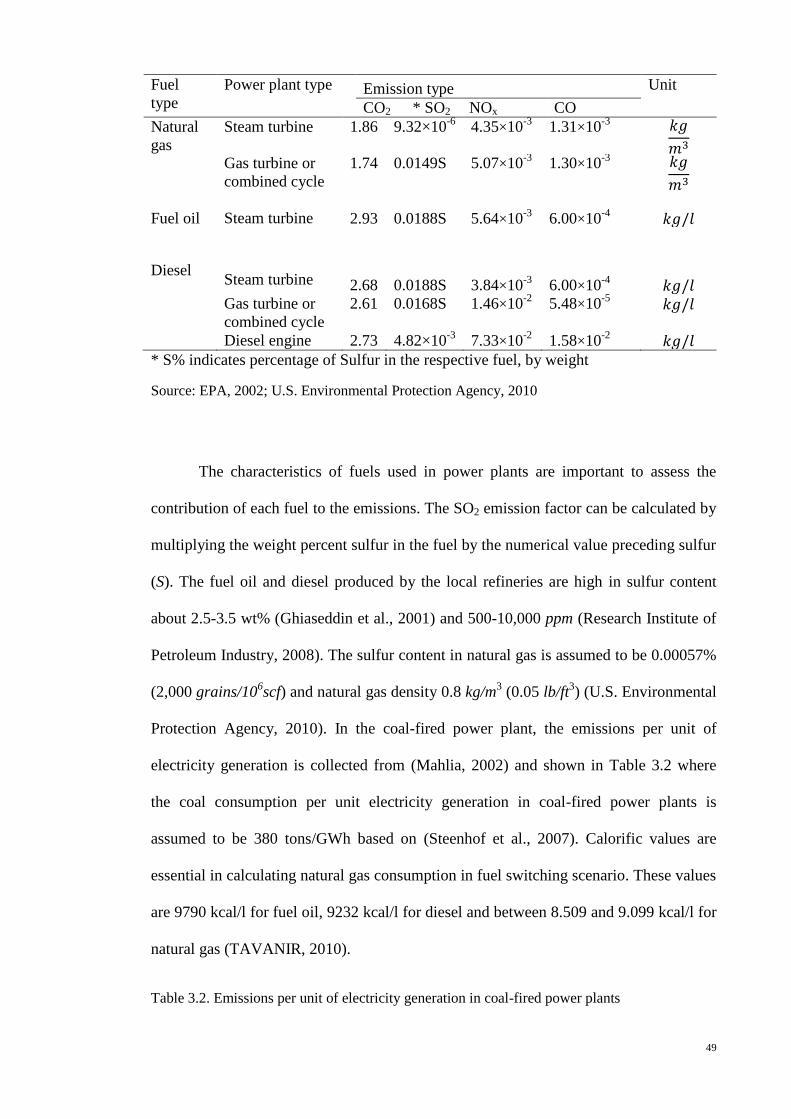
49
Fuel
type
Power plant type Emission type Unit
CO2 * SO2 NOx CO
Natural
gas
Steam turbine 1.86 9.32×10⁻⁶
4.35×10⁻³
1.31×10⁻³
Gas turbine or
combined cycle
1.74 0.0149S 5.07×10⁻³
1.30×10⁻³
Fuel oil Steam turbine 2.93 0.0188S 5.64×10⁻³
6.00×10⁻⁴
Diesel
Steam turbine 2.68 0.0188S 3.84×10⁻³
6.00×10⁻⁴
Gas turbine or
combined cycle
2.61 0.0168S 1.46×10⁻²
5.48×10⁻⁵
Diesel engine 2.73 4.82×10⁻³
7.33×10⁻²
1.58×10⁻²
* S% indicates percentage of Sulfur in the respective fuel, by weight
Source: EPA, 2002; U.S. Environmental Protection Agency, 2010
The characteristics of fuels used in power plants are important to assess the
contribution of each fuel to the emissions. The SO2 emission factor can be calculated by
multiplying the weight percent sulfur in the fuel by the numerical value preceding sulfur
(S). The fuel oil and diesel produced by the local refineries are high in sulfur content
about 2.5-3.5 wt% (Ghiaseddin et al., 2001) and 500-10,000 ppm (Research Institute of
Petroleum Industry, 2008). The sulfur content in natural gas is assumed to be 0.00057%
(2,000 grains/106scf) and natural gas density 0.8 kg/m
3 (0.05 lb/ft
3) (U.S. Environmental
Protection Agency, 2010). In the coal-fired power plant, the emissions per unit of
electricity generation is collected from (Mahlia, 2002) and shown in Table 3.2 where
the coal consumption per unit electricity generation in coal-fired power plants is
assumed to be 380 tons/GWh based on (Steenhof et al., 2007). Calorific values are
essential in calculating natural gas consumption in fuel switching scenario. These values
are 9790 kcal/l for fuel oil, 9232 kcal/l for diesel and between 8.509 and 9.099 kcal/l for
natural gas (TAVANIR, 2010).
Table 3.2. Emissions per unit of electricity generation in coal-fired power plants
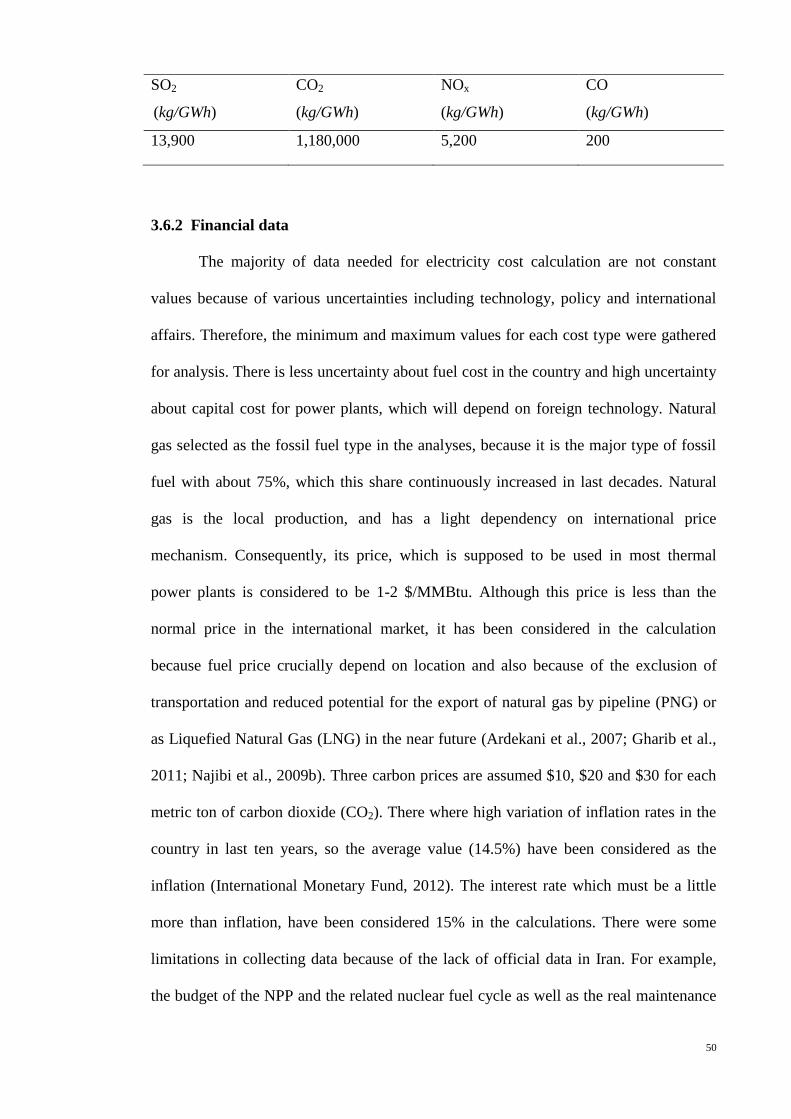
50
SO2
(kg/GWh)
CO2
(kg/GWh)
NOx
(kg/GWh)
CO
(kg/GWh)
13,900 1,180,000 5,200 200
3.6.2 Financial data
The majority of data needed for electricity cost calculation are not constant
values because of various uncertainties including technology, policy and international
affairs. Therefore, the minimum and maximum values for each cost type were gathered
for analysis. There is less uncertainty about fuel cost in the country and high uncertainty
about capital cost for power plants, which will depend on foreign technology. Natural
gas selected as the fossil fuel type in the analyses, because it is the major type of fossil
fuel with about 75%, which this share continuously increased in last decades. Natural
gas is the local production, and has a light dependency on international price
mechanism. Consequently, its price, which is supposed to be used in most thermal
power plants is considered to be 1-2 $/MMBtu. Although this price is less than the
normal price in the international market, it has been considered in the calculation
because fuel price crucially depend on location and also because of the exclusion of
transportation and reduced potential for the export of natural gas by pipeline (PNG) or
as Liquefied Natural Gas (LNG) in the near future (Ardekani et al., 2007; Gharib et al.,
2011; Najibi et al., 2009b). Three carbon prices are assumed $10, $20 and $30 for each
metric ton of carbon dioxide (CO2). There where high variation of inflation rates in the
country in last ten years, so the average value (14.5%) have been considered as the
inflation (International Monetary Fund, 2012). The interest rate which must be a little
more than inflation, have been considered 15% in the calculations. There were some
limitations in collecting data because of the lack of official data in Iran. For example,
the budget of the NPP and the related nuclear fuel cycle as well as the real maintenance

51
costs for the thermal power plants in Iran cannot be determined exactly. In these cases,
international data have been used instead of local data. The data related to the financial
information of power plants was gathered from Refs (Massachusetts Institute of
Technology, 2009; Najibi et al., 2009a; National renewable energy laboratory, 2010)
and shown in Table 3.3.

52
Table 3.3. Power plants financial and technical information
Power plant type
Overnight cost
($/kW)
Fix OMC
($/kW-Y)
Variable OMC
($/MWh)
Capacity
factor
Fuel cost
($/MMBtu)
Heat rate
(Btu/kWh)
Life time
(Year)
Steam turbine Min 650 6 3 0.64 1 9,626 30
Max 1,500 25 26 0.71 2 9,626
Gas turbine Min 650 6 3 0.26 1 11,628 20
Max 1,500 25 26 0.35 2 11,628
Combined cycle Min 554 5 1 0.50 1 8,029 20
Max 1,172 17 3 0.61 2 8,029
Coal-fired
Min 1,549 19 2 0.85 2.6 8,870 30
Max 5,350 37 9 0.85 2.6 8,870
Nuclear
Min 3,206 12 0 0.9 0.67 10,400 40
Max 7,550 90 10 0.86 0.67 10,400
Hydro power Min 1,239 14 2 0.07 - - 40
Max 3,226 15 5 0.32 - -
Wind turbine Min 1,206 12 0 0.21 - - 30
Max 2,341 49 6 0.35 - -
Geothermal Min 1,664 66 0 0.95 - - 40
Max 3,901 160 28 0.7 - -
Photovoltaic
Min 5,058 7 0 0.26 - - 30
Max 6,000 34 0 0.1 - -
Solar thermal Min 3,623 54 0 0.5 - - 30
Max 5,899 66 0 0.24 - -
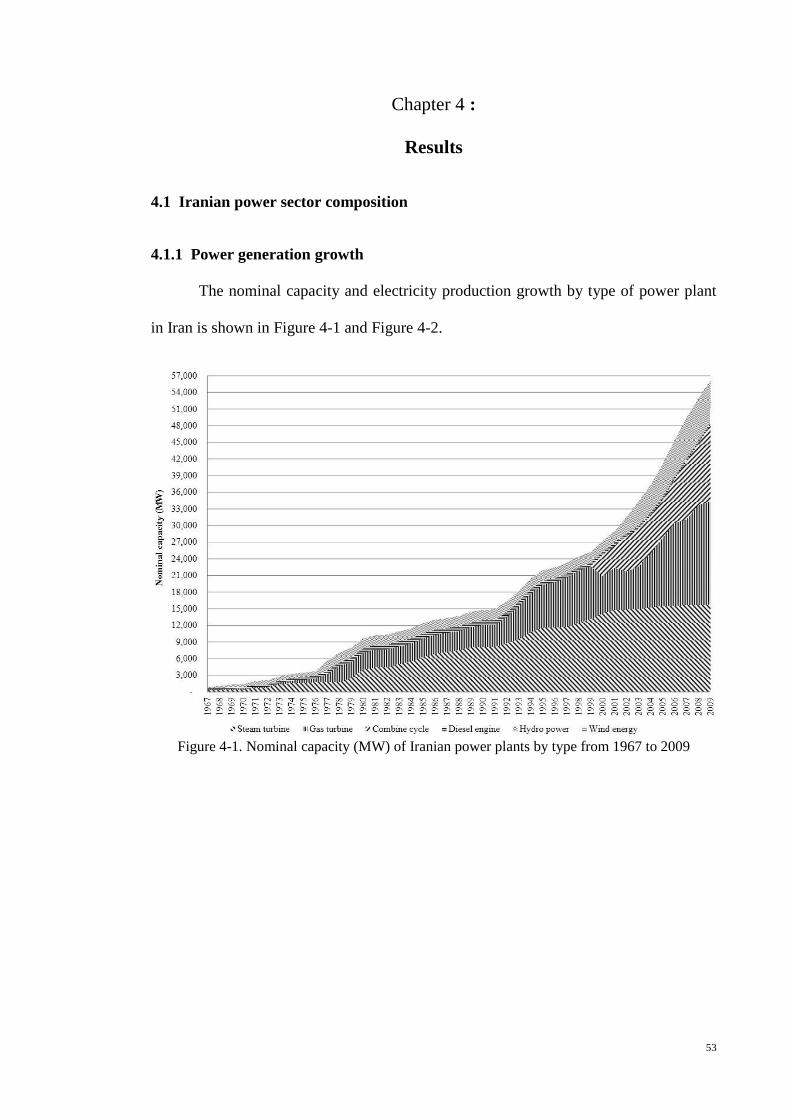
53
: Chapter 4
Results
4.1 Iranian power sector composition
4.1.1 Power generation growth
The nominal capacity and electricity production growth by type of power plant
in Iran is shown in Figure 4-1 and Figure 4-2.
Figure 4-1. Nominal capacity (MW) of Iranian power plants by type from 1967 to 2009

54
Figure 4-2. Electricity generation (GWh) in Iranian power plants by type from 1967 to 2009
4.1.2 Per-capita capacities
There is empirical evidence of a long-run relationship between per-capita
electricity generation and real per-capita GDP in Iran (Squalli, 2007). The annual
population growth is estimated using the data in Table A - 4 and Eq. (3-1). The nominal
capacity and electricity consumption per person have been calculated using Eqs. (3-2)
and (3-3) based on the data in Table A - 1 to Table A - 4. The share of exchange
electricity with neighboring countries is very small (~1%); therefore, the per-capita rate
of electricity generation and consumption should remain the same. The results are
tabulated in Table 4.1 and illustrated in Figure 4-3.

55
Table 4.1. Per-capita nominal capacity and per-capita electricity consumption in Iran
Year Per-capita nominal
capacity (W)
Per-capita electricity
consumption (kWh)
1967 36 71
1968 39 93
1969 49 120
1970 51 156
1971 71 196
1972 72 237
1973 93 311
1974 103 358
1975 106 394
1976 109 421
1977 158 448
1978 192 474
1979 207 509
1980 242 500
1981 247 542
1982 240 613
1983 245 685
1984 247 738
1985 259 769
1986 264 792
1987 262 838
1988 262 839
1989 270 910
1990 270 1,001
1991 265 1,066
1992 286 1,121
1993 314 1,226
1994 347 1,307
1995 368 1,343
1996 373 1,423
1997 381 1,503
1998 393 1,568
1999 399 1,685
2000 423 1,834
2001 443 1,943
2002 475 2,081
2003 510 2,232
2004 546 2,388
2005 591 2,556
2006 642 2,728
2007 691 2,842
2008 729 2,952

56
Figure 4-3. The growth of per-capita nominal capacity and per-capita electricity consumption
and population between 1967 and 2009
4.1.3 Pattern of electricity generation
The pattern of electricity generation and nominal capacity, based on the power
plant type is calculated based on the data in Table A - 1 and Table A - 2 and Equations
(3-4) and (3-5). The results are tabulated in Table 4.2, Table 4.3 and illustrated in
Figure 4-4 and Figure 4-5.
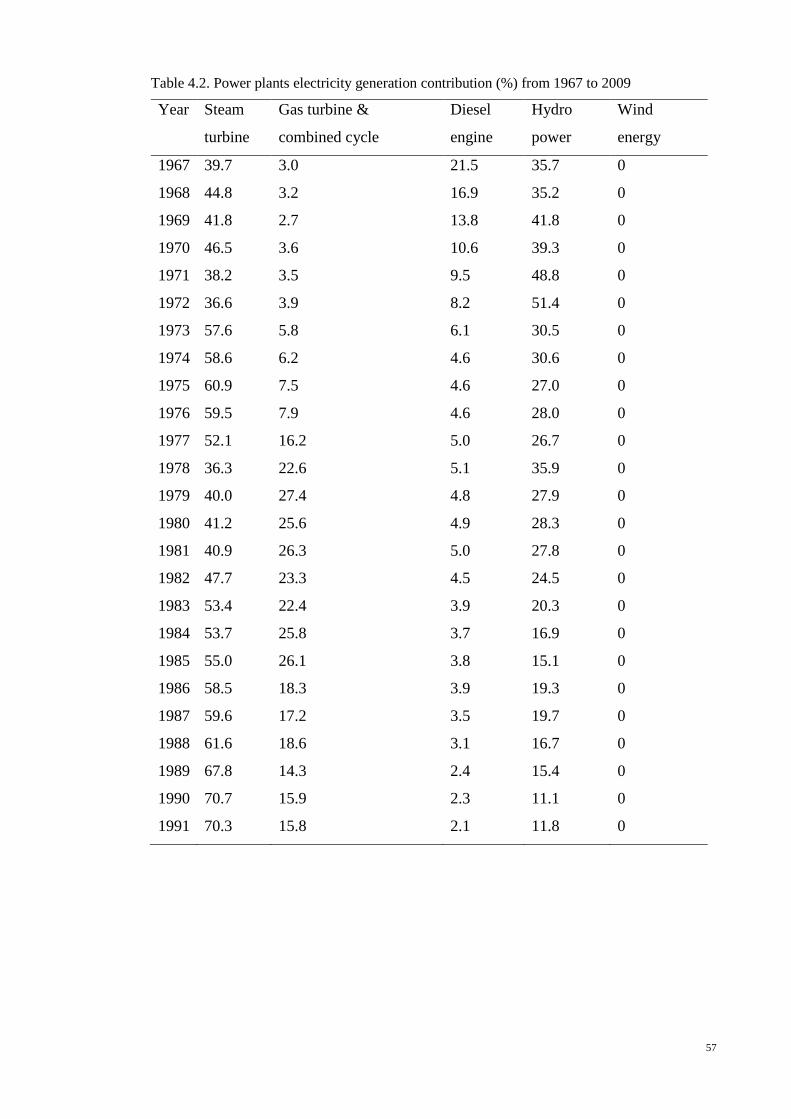
57
Table 4.2. Power plants electricity generation contribution (%) from 1967 to 2009
Year Steam
turbine
Gas turbine &
combined cycle
Diesel
engine
Hydro
power
Wind
energy
1967 39.7 3.0 21.5 35.7 0
1968 44.8 3.2 16.9 35.2 0
1969 41.8 2.7 13.8 41.8 0
1970 46.5 3.6 10.6 39.3 0
1971 38.2 3.5 9.5 48.8 0
1972 36.6 3.9 8.2 51.4 0
1973 57.6 5.8 6.1 30.5 0
1974 58.6 6.2 4.6 30.6 0
1975 60.9 7.5 4.6 27.0 0
1976 59.5 7.9 4.6 28.0 0
1977 52.1 16.2 5.0 26.7 0
1978 36.3 22.6 5.1 35.9 0
1979 40.0 27.4 4.8 27.9 0
1980 41.2 25.6 4.9 28.3 0
1981 40.9 26.3 5.0 27.8 0
1982 47.7 23.3 4.5 24.5 0
1983 53.4 22.4 3.9 20.3 0
1984 53.7 25.8 3.7 16.9 0
1985 55.0 26.1 3.8 15.1 0
1986 58.5 18.3 3.9 19.3 0
1987 59.6 17.2 3.5 19.7 0
1988 61.6 18.6 3.1 16.7 0
1989 67.8 14.3 2.4 15.4 0
1990 70.7 15.9 2.3 11.1 0
1991 70.3 15.8 2.1 11.8 0
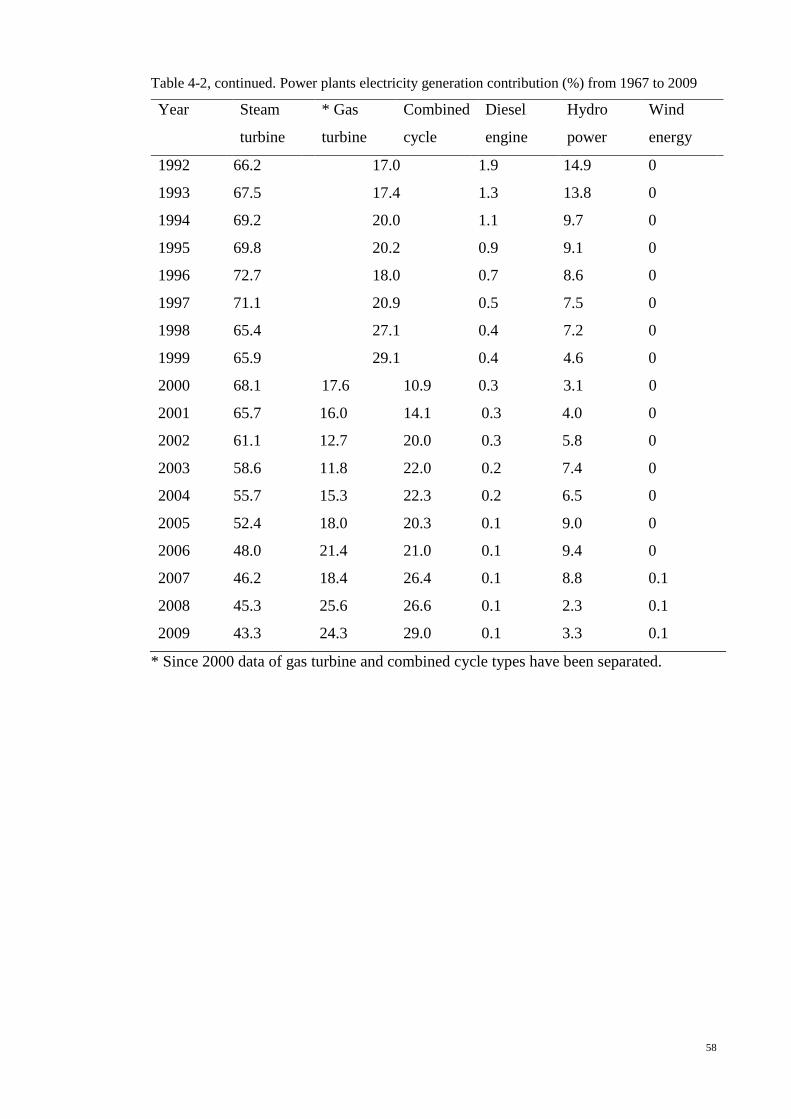
58
Table 4-2, continued. Power plants electricity generation contribution (%) from 1967 to 2009
Year Steam
turbine
* Gas
turbine
Combined
cycle
Diesel
engine
Hydro
power
Wind
energy
1992 66.2 17.0 1.9 14.9 0
1993 67.5 17.4 1.3 13.8 0
1994 69.2 20.0 1.1 9.7 0
1995 69.8 20.2 0.9 9.1 0
1996 72.7 18.0 0.7 8.6 0
1997 71.1 20.9 0.5 7.5 0
1998 65.4 27.1 0.4 7.2 0
1999 65.9 29.1 0.4 4.6 0
2000 68.1 17.6 10.9 0.3 3.1 0
2001 65.7 16.0 14.1 0.3 4.0 0
2002 61.1 12.7 20.0 0.3 5.8 0
2003 58.6 11.8 22.0 0.2 7.4 0
2004 55.7 15.3 22.3 0.2 6.5 0
2005 52.4 18.0 20.3 0.1 9.0 0
2006 48.0 21.4 21.0 0.1 9.4 0
2007 46.2 18.4 26.4 0.1 8.8 0.1
2008 45.3 25.6 26.6 0.1 2.3 0.1
2009 43.3 24.3 29.0 0.1 3.3 0.1
* Since 2000 data of gas turbine and combined cycle types have been separated.
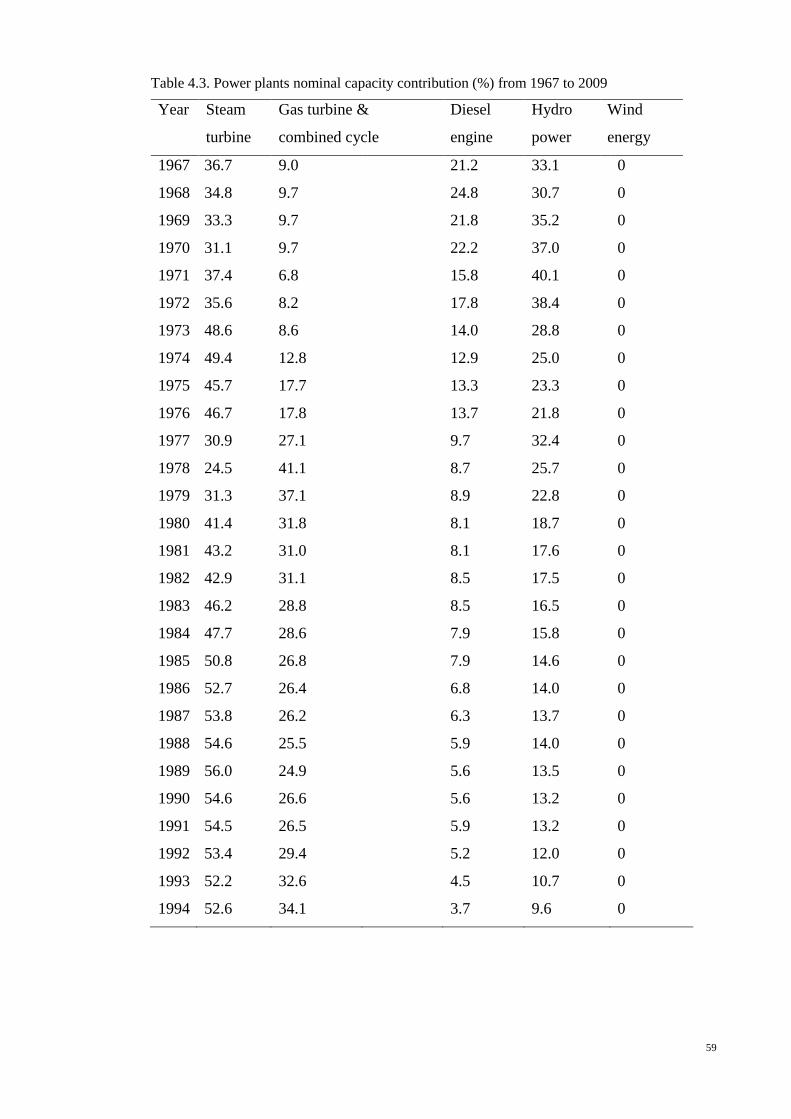
59
Table 4.3. Power plants nominal capacity contribution (%) from 1967 to 2009
Year Steam
turbine
Gas turbine &
combined cycle
Diesel
engine
Hydro
power
Wind
energy
1967 36.7 9.0 21.2 33.1 0
1968 34.8 9.7 24.8 30.7 0
1969 33.3 9.7 21.8 35.2 0
1970 31.1 9.7 22.2 37.0 0
1971 37.4 6.8 15.8 40.1 0
1972 35.6 8.2 17.8 38.4 0
1973 48.6 8.6 14.0 28.8 0
1974 49.4 12.8 12.9 25.0 0
1975 45.7 17.7 13.3 23.3 0
1976 46.7 17.8 13.7 21.8 0
1977 30.9 27.1 9.7 32.4 0
1978 24.5 41.1 8.7 25.7 0
1979 31.3 37.1 8.9 22.8 0
1980 41.4 31.8 8.1 18.7 0
1981 43.2 31.0 8.1 17.6 0
1982 42.9 31.1 8.5 17.5 0
1983 46.2 28.8 8.5 16.5 0
1984 47.7 28.6 7.9 15.8 0
1985 50.8 26.8 7.9 14.6 0
1986 52.7 26.4 6.8 14.0 0
1987 53.8 26.2 6.3 13.7 0
1988 54.6 25.5 5.9 14.0 0
1989 56.0 24.9 5.6 13.5 0
1990 54.6 26.6 5.6 13.2 0
1991 54.5 26.5 5.9 13.2 0
1992 53.4 29.4 5.2 12.0 0
1993 52.2 32.6 4.5 10.7 0
1994 52.6 34.1 3.7 9.6 0

60
Table 4-3, continued. Power plants nominal capacity contribution (%) from 1967 to 2009
Year Steam
turbine
* Gas
turbine
Combined
cycle
Diesel
engine
Hydro
power
Wind
energy
1995 52.7 35.3 3.0 8.9 0
1996 51.8 36.4 3.0 8.8 0
1997 50.2 38.3 2.9 8.6 0
1998 50.7 38.6 2.5 8.2 0
1999 52.0 37.8 2.3 7.9 0
2000 52.0 24.9 13.8 2.0 7.4 0
2001 51.1 26.1 14.0 1.8 6.9 0
2002 47.1 21.8 20.0 1.6 9.6 0
2003 43.4 22.3 19.9 1.4 12.9 0
2004 40.8 26.0 18.3 1.3 13.4 0.1
2005 38.0 29.4 16.7 1.2 14.7 0.1
2006 34.3 32.8 17.3 0.9 14.5 0.1
2007 31.6 31.2 21.2 0.8 15.0 0.1
2008 29.5 34.1 21 0.8 14.5 0.1
2009 28.0 33.1 24.3 0.8 13.7 0.2
* Since 2000 data of gas turbine and combined cycle types have been separated.
Figure 4-4. Pattern of electricity generation for each type of power plants from 1967 to 2009

61
Figure 4-5. Pattern of nominal capacity for each type of power plants in Iran from 1967 to 2009
The share of each type of power plant in nominal capacity and electricity
generation in 2009 is tabulated in Table 4.4 and is shown in Figure 4-6.
Table 4.4. Electricity generation and nominal capacity share by power plant in 2009
Steam
turbine
(%)
Gas
turbine
(%)
Combined
cycle
(%)
Diesel
engine
(%)
Hydro
power
(%)
Wind
energy
(%)
Nominal capacity 28.0 33.1 24.3 0.8 13.7 0.2
Electricity generation 43.3 24.3 29.0 0.1 3.3 0.1
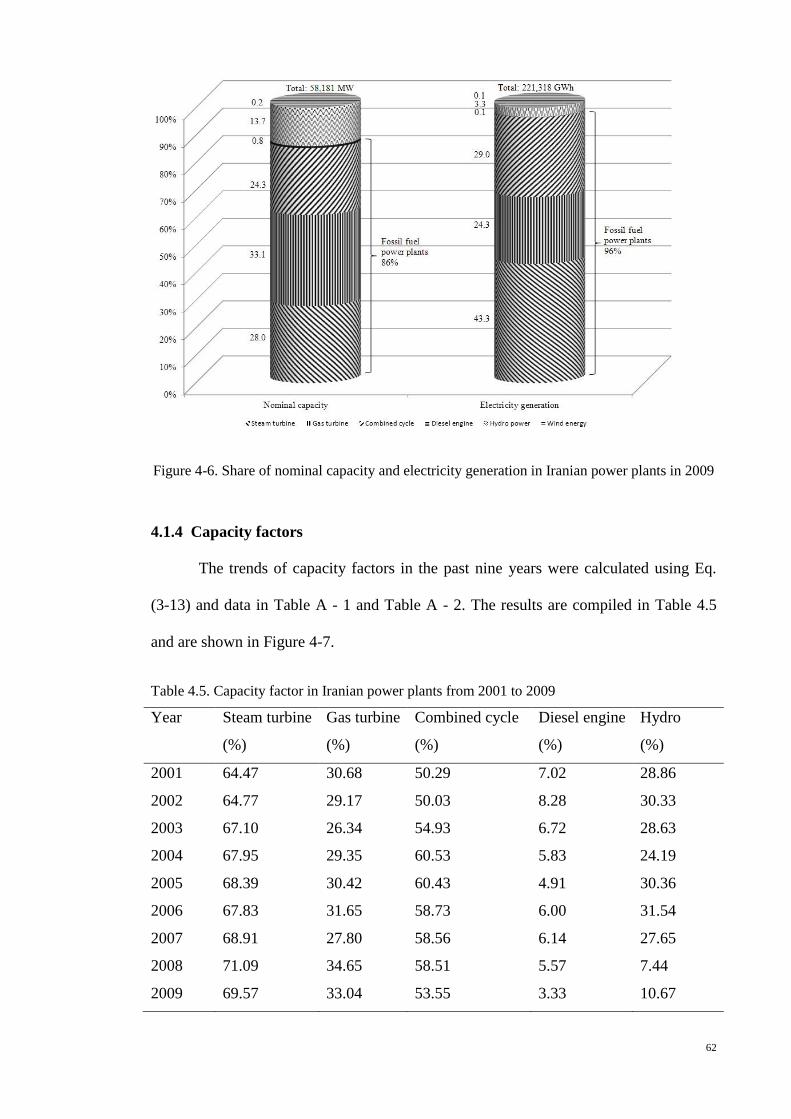
62
Figure 4-6. Share of nominal capacity and electricity generation in Iranian power plants in 2009
4.1.4 Capacity factors
The trends of capacity factors in the past nine years were calculated using Eq.
(3-13) and data in Table A - 1 and Table A - 2. The results are compiled in Table 4.5
and are shown in Figure 4-7.
Table 4.5. Capacity factor in Iranian power plants from 2001 to 2009
Year Steam turbine
(%)
Gas turbine
(%)
Combined cycle
(%)
Diesel engine
(%)
Hydro
(%)
2001 64.47 30.68 50.29 7.02 28.86
2002 64.77 29.17 50.03 8.28 30.33
2003 67.10 26.34 54.93 6.72 28.63
2004 67.95 29.35 60.53 5.83 24.19
2005 68.39 30.42 60.43 4.91 30.36
2006 67.83 31.65 58.73 6.00 31.54
2007 68.91 27.80 58.56 6.14 27.65
2008 71.09 34.65 58.51 5.57 7.44
2009 69.57 33.04 53.55 3.33 10.67

63
Figure 4-7. Iranian power plants capacity factor from 2001 to 2009
4.1.5 Fuel consumption per unit electricity generation
The average fuel consumption per unit electricity generation for each type of
thermal power plant from 2001 to 2009 is calculated using equations (3-15) and (3-16)
and data from Table A - 2 and Table A - 7. The results are tabulated in Table 4.6.
Table 4.6. Average fuel consumption per unit of electricity generation in Iranian thermal power
plants
Fuel type Steam
turbine
Gas
turbine
Combined
cycle
Diesel
engine
Natural gas (m3/kWh) 0.1841 0.2910 0.2019 -
Diesel (l/kWh) 0.0008 0.0602 0.0220 0.2981
Fuel oil (l/kWh) 0.0785 - - -

64
4.2 Emissions production
Based on Table A - 5 to Table A - 7, the quantity of all types of fuel consumed
in power plants in Iran is illustrated in Figure 4-8.
Figure 4-8. Total fuel consumed in Iranian power plants from 1967 to 2009
Figure 4-9 also shows the share of total energy for each fuel type used in Iranian
thermal power plants.

65
Figure 4-9 Share of each fuel type in total energy consumed in thermal power plants
The total emissions in Iran’s power plants were calculated based on equations
(3-6) and (3-8) and Table A - 5 to Table A - 7 and Table 3.1. For the years between
1967 and 1979 (Table A - 5), only the total fuel consumed was presented. To estimate
the fuel consumption for each type of power plant for these years, the total diesel oil is
divided by 27% in diesel engines, 70% in both gas turbine and combined cycle and 3%
in steam turbines. The total natural gas consumed, is divided by 45% in steam turbines
and 55% in gas turbines. The total emissions in Iranian thermal power plants from 1967
to 2009 are presented in Table 4.7 and illustrated in Figure 4-10.
Based on Table 2.1, most of the thermal power plants used both liquid fuel and
natural gas. The share of each type of fuel in total thermal energy consumed, and total
emissions in 2009 are calculated by using Eqs. (3-7) and (3-9), and presented in
Table 4.8.

66
Table 4.7. Total emission (kton) in Iranian power plants from 1967 to 2009
Year CO2 SO2 NOx CO
1967 1,294 19 6 1
1968 1,602 25 6 1
1969 1,829 29 7 1
1970 2,445 39 9 1
1971 2,481 35 9 1
1972 2,634 30 10 2
1973 4,769 53 18 3
1974 5,227 51 21 3
1975 6,762 76 25 4
1976 7,585 86 29 4
1977 8,723 72 44 7
1978 9,342 69 57 9
1979 10,988 71 53 8
1980 10,974 91 50 9
1981 12,263 114 55 9
1982 14,068 117 61 11
1983 17,568 158 71 12
1984 20,568 192 82 13
1985 23,382 219 95 14
1986 23,442 247 90 14
1987 24,217 212 92 16
1988 25,623 228 92 16
1989 27,850 241 92 17
1990 32,245 280 103 19
1991 34,172 297 106 21
1992 35,049 282 110 21
1993 40,631 335 117 23
1994 43,039 341 123 24
1995 46,036 389 128 24
1996 48,913 428 129 25
1997 52,006 407 137 27
1998 51,528 281 135 30
1999 58,662 344 156 34
2000 63,838 377 167 36
2001 69,598 398 184 38
2002 72,650 368 194 42
2003 73,050 291 194 44
2004 81,574 343 221 47
2005 88,661 380 242 51
2006 97,817 470 281 52
2007 102,903 516 292 55
2008 115,150 542 325 63
2009 118,079 582 336 63
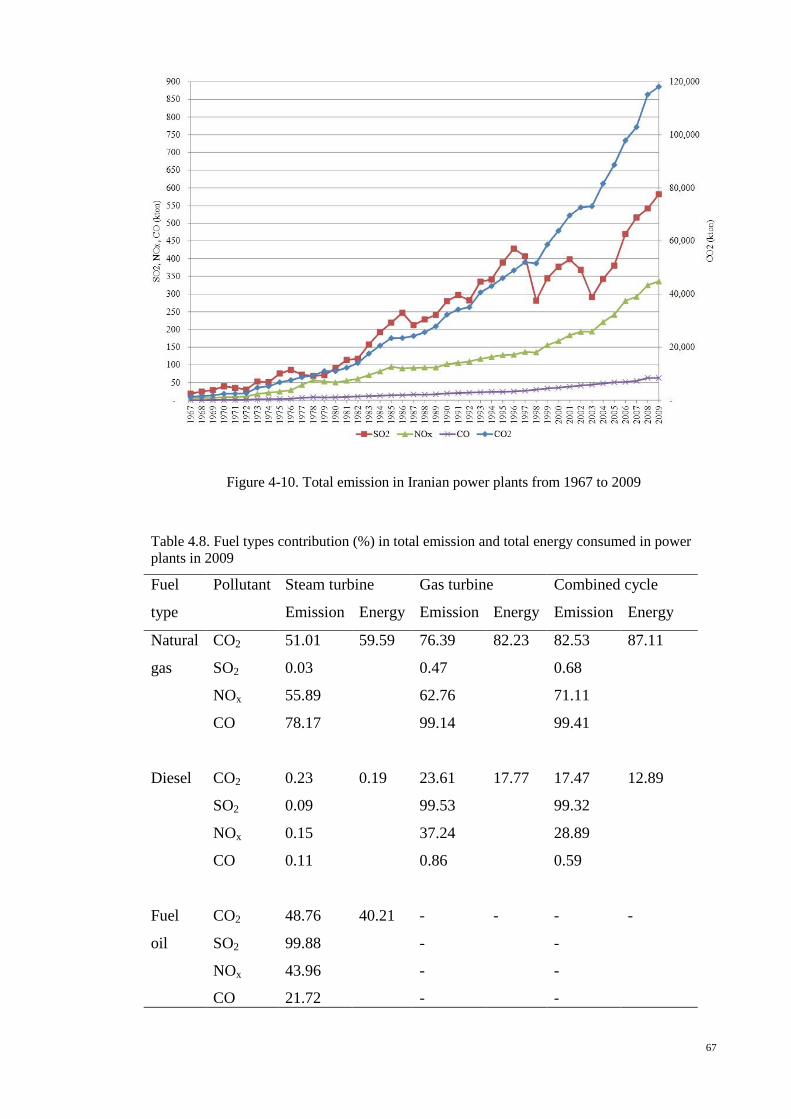
67
Figure 4-10. Total emission in Iranian power plants from 1967 to 2009
Table 4.8. Fuel types contribution (%) in total emission and total energy consumed in power
plants in 2009
Fuel
type
Pollutant
Steam turbine Gas turbine Combined cycle
Emission Energy Emission Energy Emission Energy
Natural
gas
CO2 51.01 59.59 76.39 82.23 82.53 87.11
SO2 0.03 0.47 0.68
NOx 55.89 62.76 71.11
CO 78.17 99.14 99.41
Diesel CO2 0.23 0.19 23.61 17.77 17.47 12.89
SO2 0.09 99.53 99.32
NOx 0.15 37.24 28.89
CO 0.11 0.86 0.59
Fuel
oil
CO2 48.76 40.21 - - - -
SO2 99.88 - -
NOx 43.96 - -
CO 21.72 - -

68
The emissions per unit electricity generation in power sector is calculated using
Eq. (3-10) and the results are tabulated in Table 4.9 and shown in Figure 4-11.
Table 4.9. Emission per unit of electricity generation (kg/kWh) from 1967 to 2009
Year CO2 SO2 NOx CO
1967 0.7026 0.0101 0.0032 0.0004
1968 0.6589 0.0101 0.0025 0.0003
1969 0.5722 0.0091 0.0021 0.0003
1970 0.5744 0.0092 0.0021 0.0003
1971 0.4518 0.0064 0.0017 0.0002
1972 0.3835 0.0044 0.0015 0.0002
1973 0.5115 0.0057 0.0019 0.0003
1974 0.4682 0.0046 0.0019 0.0003
1975 0.5292 0.0059 0.0019 0.0003
1976 0.5337 0.0060 0.0020 0.0003
1977 0.5537 0.0046 0.0028 0.0004
1978 0.5374 0.0040 0.0033 0.0005
1979 0.5652 0.0037 0.0027 0.0004
1980 0.5520 0.0046 0.0025 0.0004
1981 0.5473 0.0051 0.0025 0.0004
1982 0.5344 0.0045 0.0023 0.0004
1983 0.5758 0.0052 0.0023 0.0004
1984 0.6033 0.0056 0.0024 0.0004
1985 0.6368 0.0060 0.0026 0.0004
1986 0.6004 0.0063 0.0023 0.0004
1987 0.5691 0.0050 0.0022 0.0004
1988 0.5853 0.0052 0.0021 0.0004
1989 0.5716 0.0049 0.0019 0.0003
1990 0.5874 0.0051 0.0019 0.0004
1991 0.5723 0.0050 0.0018 0.0003
1992 0.5478 0.0044 0.0017 0.0003
1993 0.5696 0.0047 0.0016 0.0003
1994 0.5583 0.0044 0.0016 0.0003
1995 0.5751 0.0049 0.0016 0.0003
1996 0.5699 0.0050 0.0015 0.0003
1997 0.5634 0.0044 0.0015 0.0003
1998 0.5265 0.0029 0.0014 0.0003
1999 0.5472 0.0032 0.0015 0.0003
2000 0.5390 0.0032 0.0014 0.0003
2001 0.5473 0.0031 0.0014 0.0003
2002 0.5272 0.0027 0.0014 0.0003
2003 0.4881 0.0019 0.0013 0.0003
2004 0.5009 0.0021 0.0014 0.0003
2005 0.4979 0.0021 0.0014 0.0003
2006 0.5080 0.0024 0.0015 0.0003
2007 0.5045 0.0025 0.0014 0.0003
2008 0.5368 0.0025 0.0015 0.0003
2009 0.5335 0.0026 0.0015 0.0003

69
Figure 4-11. Emission per unit electricity generation from 1967 to 2009
For 9 years (2001 to 2009), there was detailed information of the fuel consumed
and electricity generated for all types of power plants. Therefore, the amount of total
emissions and emissions per unit of electricity generation in each type of power plant
were calculated more precisely. These data were calculated by using Eqs. (3-8) and
(3-11) and tabulated in Table 4.10 and Table 4.11.
Table 4.10. Total emission (kton) in thermal power plants from 2001 to 2009
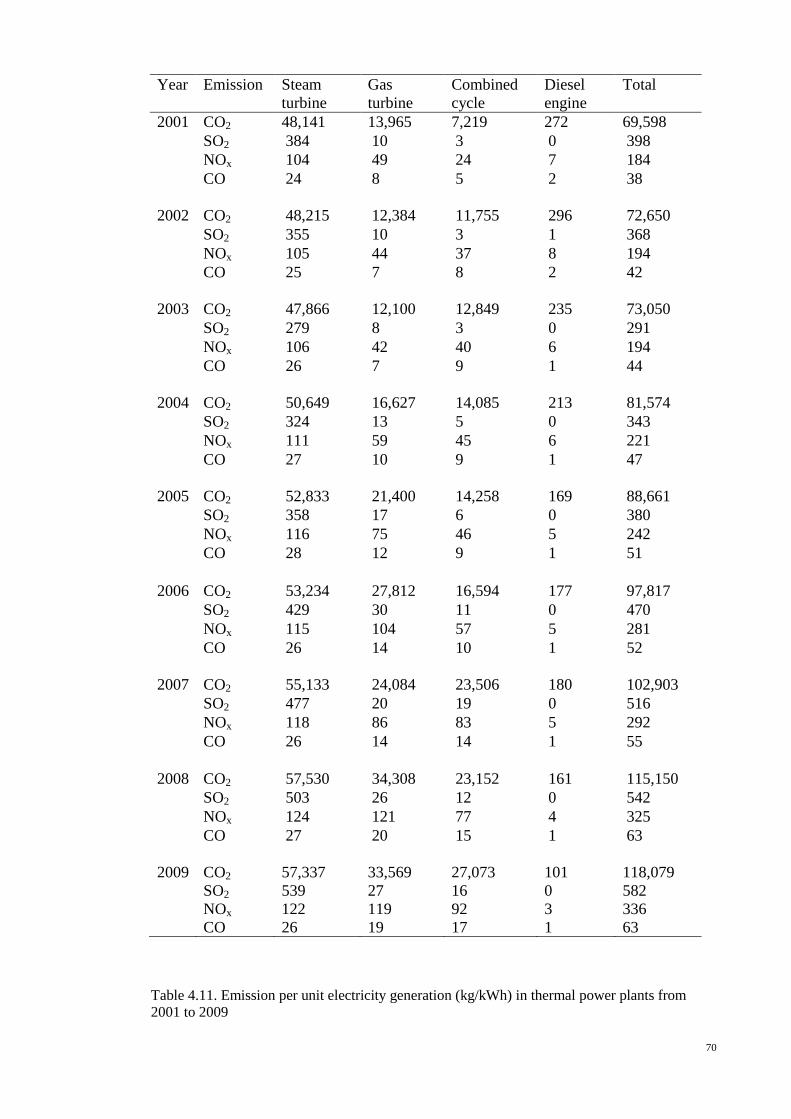
70
Year Emission Steam
turbine
Gas
turbine
Combined
cycle
Diesel
engine
Total
2001 CO2 48,141 13,965 7,219 272 69,598
SO2 384 10 3 0 398
NOx 104 49 24 7 184
CO 24 8 5 2 38
2002 CO2 48,215 12,384 11,755 296 72,650
SO2 355 10 3 1 368
NOx 105 44 37 8 194
CO 25 7 8 2 42
2003 CO2 47,866 12,100 12,849 235 73,050
SO2 279 8 3 0 291
NOx 106 42 40 6 194
CO 26 7 9 1 44
2004 CO2 50,649 16,627 14,085 213 81,574
SO2 324 13 5 0 343
NOx 111 59 45 6 221
CO 27 10 9 1 47
2005 CO2 52,833 21,400 14,258 169 88,661
SO2 358 17 6 0 380
NOx 116 75 46 5 242
CO 28 12 9 1 51
2006 CO2 53,234 27,812 16,594 177 97,817
SO2 429 30 11 0 470
NOx 115 104 57 5 281
CO 26 14 10 1 52
2007 CO2 55,133 24,084 23,506 180 102,903
SO2 477 20 19 0 516
NOx 118 86 83 5 292
CO 26 14 14 1 55
2008 CO2 57,530 34,308 23,152 161 115,150
SO2 503 26 12 0 542
NOx 124 121 77 4 325
CO 27 20 15 1 63
2009 CO2 57,337 33,569 27,073 101 118,079
SO2 539 27 16 0 582
NOx 122 119 92 3 336
CO 26 19 17 1 63
Table 4.11. Emission per unit electricity generation (kg/kWh) in thermal power plants from
2001 to 2009

71
Year Emission Steam
turbine
Gas turbine Combined
cycle
Diesel
engine
2001 CO2 0.5765 0.6864 0.4033 0.8290
SO2 0.0046 0.0005 0.0002 0.0015
NOx 0.0012 0.0024 0.0013 0.0223
CO 0.0003 0.0004 0.0003 0.0048
2002 CO2 0.5722 0.7064 0.4261 0.8328
SO2 0.0042 0.0006 0.0001 0.0015
NOx 0.0012 0.0025 0.0013 0.0224
CO 0.0003 0.0004 0.0003 0.0048
2003 CO2 0.5460 0.6837 0.3906 0.8086
SO2 0.0032 0.0005 0.0001 0.0014
NOx 0.0012 0.0024 0.0012 0.0217
CO 0.0003 0.0004 0.0003 0.0047
2004 CO2 0.5583 0.6657 0.3886 0.8450
SO2 0.0036 0.0005 0.0001 0.0015
NOx 0.0012 0.0023 0.0012 0.0227
CO 0.0003 0.0004 0.0003 0.0049
2005 CO2 0.5658 0.6661 0.3939 0.7984
SO2 0.0038 0.0005 0.0002 0.0014
NOx 0.0012 0.0023 0.0013 0.0214
CO 0.0003 0.0004 0.0003 0.0046
2006 CO2 0.5756 0.6745 0.4113 0.8066
SO2 0.0046 0.0007 0.0003 0.0014
NOx 0.0012 0.0025 0.0014 0.0217
CO 0.0003 0.0004 0.0003 0.0047
2007 CO2 0.5851 0.6405 0.4369 0.8008
SO2 0.0051 0.0005 0.0003 0.0014
NOx 0.0013 0.0023 0.0015 0.0215
CO 0.0003 0.0004 0.0003 0.0046
2008 CO2 0.5919 0.6248 0.4061 0.7896
SO2 0.0052 0.0005 0.0002 0.0014
NOx 0.0013 0.0022 0.0013 0.0212
CO 0.0003 0.0004 0.0003 0.0046
2009 CO2 0.5987 0.6234 0.4221 0.8146
SO2 0.0056 0.0005 0.0003 0.0014
NOx 0.0013 0.0022 0.0014 0.0219
CO 0.0003 0.0004 0.0003 0.0047
The data for year 2009 in Table 4.10 is selected to show the share of each type
of power plant for total emissions. The contribution of each type of thermal power plant
in total emissions in 2009 is presented in Figure 4-12.

72
Figure 4-12. Power plants emission contribution (%) in 2009
4.2.1 Emissions per unit of electricity generation
Emissions per unit of electricity generated in the power plants are calculated
using data from Table 3.1 and Table 4.6 in Eq. (3-19). The results are tabulated in
Table 4.12.
Table 4.12. Average value of emission per unit of electricity generation in Iranian thermal
power plants
CO2
(kg/kWh)
SO2
(kg/kWh)
NOx
(kg/kWh)
CO
(kg/kWh)
Steam turbine 5.75×10⁻¹
4.44×10⁻³
1.30×10⁻³
2.88×10⁻⁴

73
Gas turbine 6.64×10⁻¹
5.33×10⁻⁴
2.36×10⁻³
3.81×10⁻⁴
Combined cycle 4.09×10⁻¹
1.96×10⁻⁴
1.35×10⁻³
2.64×10⁻⁴
Diesel engine 8.13×10⁻¹
1.44×10⁻³
2.18×10⁻²
4.71×10⁻³
4.3 Future power plants composition
Based on the polynomial curve fitting method described in the methodology
chapter, the total power plant capacity for the coming years is estimated by the
assessment of historical data from 1980 to 2009. Using Eq. (3-1) and the data in Table
A - 1, the total nominal capacity equation is estimated by the following equation:
1228786.548715.64 2 xxy 988.02 R
Iran's historical nominal capacity for the past thirty years and its forecasted
value until 2025 is shown in Figure 4-13.
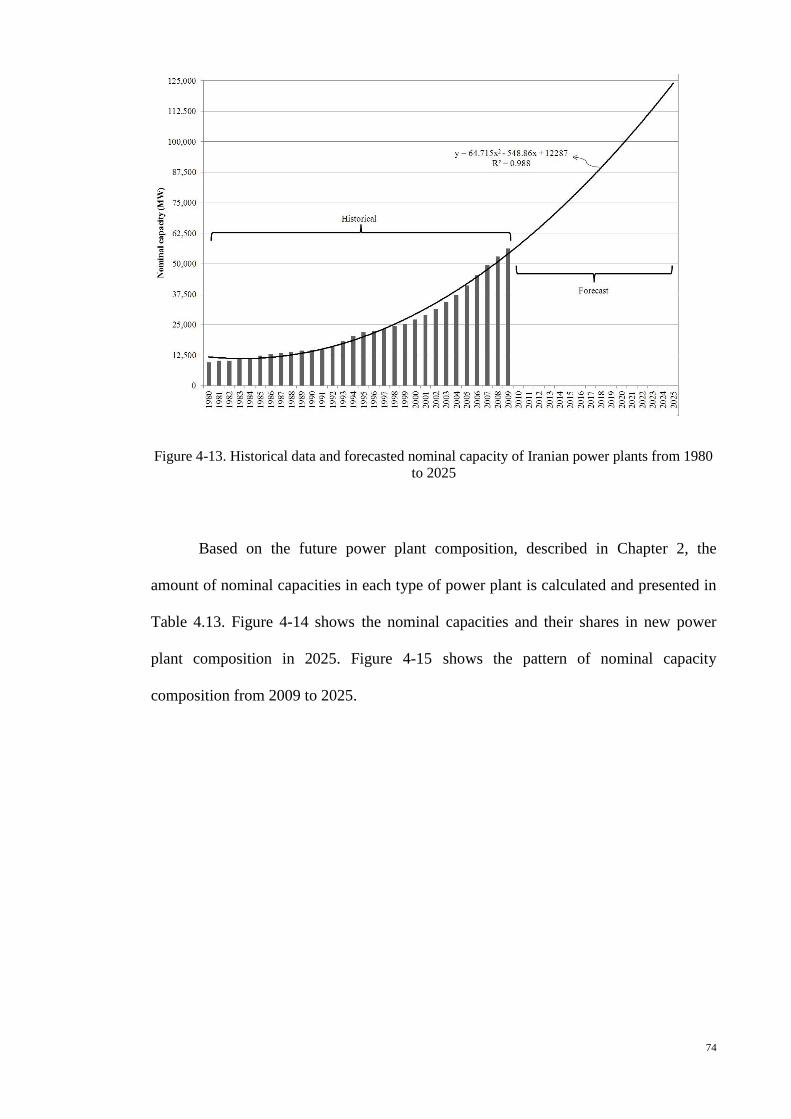
74
Figure 4-13. Historical data and forecasted nominal capacity of Iranian power plants from 1980
to 2025
Based on the future power plant composition, described in Chapter 2, the
amount of nominal capacities in each type of power plant is calculated and presented in
Table 4.13. Figure 4-14 shows the nominal capacities and their shares in new power
plant composition in 2025. Figure 4-15 shows the pattern of nominal capacity
composition from 2009 to 2025.
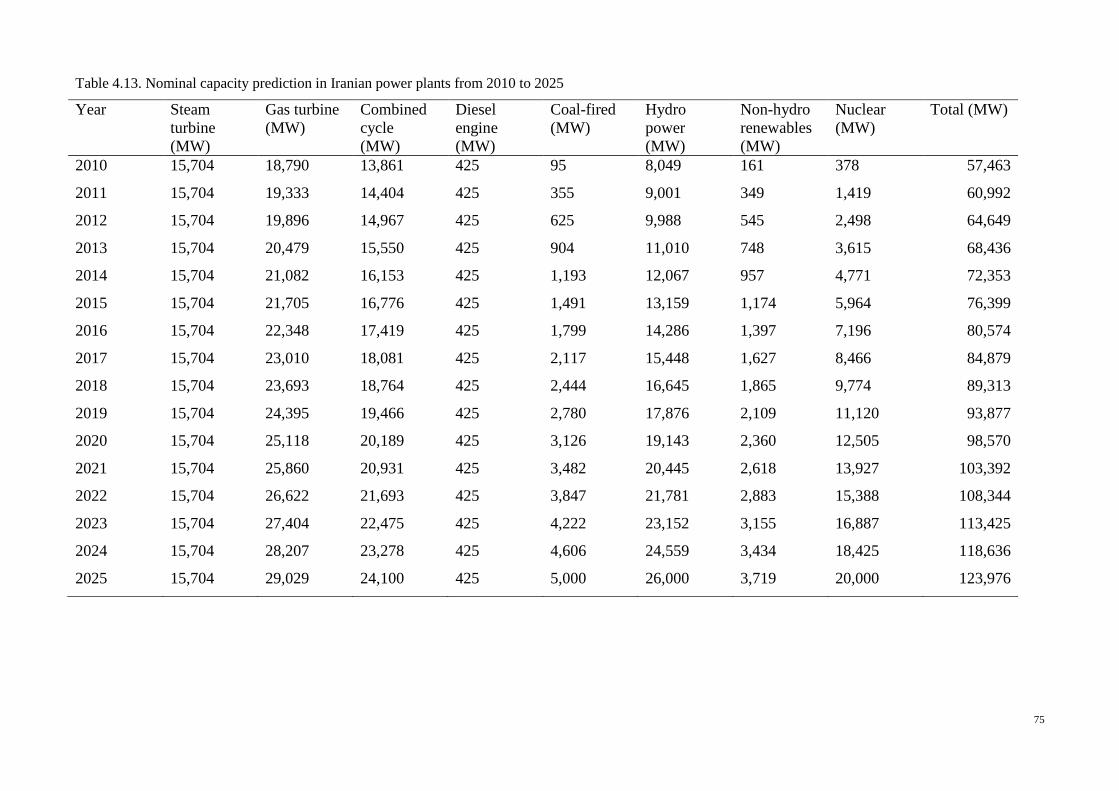
75
Table 4.13. Nominal capacity prediction in Iranian power plants from 2010 to 2025
Year Steam
turbine
(MW)
Gas turbine
(MW)
Combined
cycle
(MW)
Diesel
engine
(MW)
Coal-fired
(MW)
Hydro
power
(MW)
Non-hydro
renewables
(MW)
Nuclear
(MW)
Total (MW)
2010 15,704 18,790 13,861 425 95 8,049 161 378 57,463
2011 15,704 19,333 14,404 425 355 9,001 349 1,419 60,992
2012 15,704 19,896 14,967 425 625 9,988 545 2,498 64,649
2013 15,704 20,479 15,550 425 904 11,010 748 3,615 68,436
2014 15,704 21,082 16,153 425 1,193 12,067 957 4,771 72,353
2015 15,704 21,705 16,776 425 1,491 13,159 1,174 5,964 76,399
2016 15,704 22,348 17,419 425 1,799 14,286 1,397 7,196 80,574
2017 15,704 23,010 18,081 425 2,117 15,448 1,627 8,466 84,879
2018 15,704 23,693 18,764 425 2,444 16,645 1,865 9,774 89,313
2019 15,704 24,395 19,466 425 2,780 17,876 2,109 11,120 93,877
2020 15,704 25,118 20,189 425 3,126 19,143 2,360 12,505 98,570
2021 15,704 25,860 20,931 425 3,482 20,445 2,618 13,927 103,392
2022 15,704 26,622 21,693 425 3,847 21,781 2,883 15,388 108,344
2023 15,704 27,404 22,475 425 4,222 23,152 3,155 16,887 113,425
2024 15,704 28,207 23,278 425 4,606 24,559 3,434 18,425 118,636
2025 15,704 29,029 24,100 425 5,000 26,000 3,719 20,000 123,976

76
Figure 4-14. Nominal capacity (MW and %) in Iranian new power plant composition in 2025
Figure 4-15. Pattern of nominal capacity for each type of power plants in Iran from 2009 to
2025
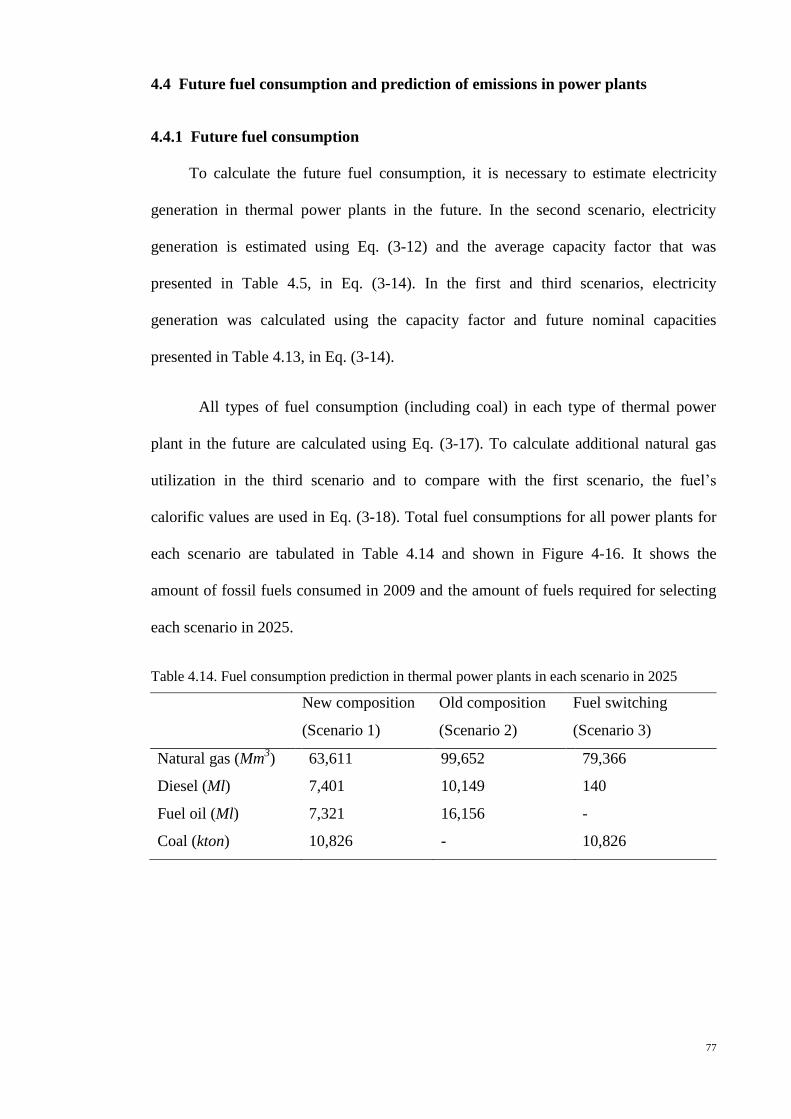
77
4.4 Future fuel consumption and prediction of emissions in power plants
4.4.1 Future fuel consumption
To calculate the future fuel consumption, it is necessary to estimate electricity
generation in thermal power plants in the future. In the second scenario, electricity
generation is estimated using Eq. (3-12) and the average capacity factor that was
presented in Table 4.5, in Eq. (3-14). In the first and third scenarios, electricity
generation was calculated using the capacity factor and future nominal capacities
presented in Table 4.13, in Eq. (3-14).
All types of fuel consumption (including coal) in each type of thermal power
plant in the future are calculated using Eq. (3-17). To calculate additional natural gas
utilization in the third scenario and to compare with the first scenario, the fuel’s
calorific values are used in Eq. (3-18). Total fuel consumptions for all power plants for
each scenario are tabulated in Table 4.14 and shown in Figure 4-16. It shows the
amount of fossil fuels consumed in 2009 and the amount of fuels required for selecting
each scenario in 2025.
Table 4.14. Fuel consumption prediction in thermal power plants in each scenario in 2025
New composition
(Scenario 1)
Old composition
(Scenario 2)
Fuel switching
(Scenario 3)
Natural gas (Mm3) 63,611 99,652 79,366
Diesel (Ml) 7,401 10,149 140
Fuel oil (Ml) 7,321 16,156 -
Coal (kton) 10,826 - 10,826

78
Figure 4-16. Power plants fossil fuel consumption in 2009 and three scenarios in 2025
4.4.2 Emissions in 2025
The amount of emissions is calculated using electricity generation predicted in
thermal power plants and emissions per unit electricity generation in Iranian thermal
power plants (Eq. (3-20)). In the fuel-switching scenario, total emissions are calculated
using the emission factors and fuel consumption data in Eq. (3-21). The results are
tabulated in Table 4.15 and presented in Figure 4-17 to Figure 4-20 for CO2, SO2, NOx
and CO respectively.

79
Table 4.15. Emissions in 2009 and emissions prediction in each power plant and each scenario
in 2025
Emission (ton) Year (scenario)
Power plant type 2009 2025 (S1) 2025 (S2) 2025 (S3)
CO2
Steam turbine 57,386,356 53,666,601 118,427,776 47,210,496
Gas turbine 33,612,842 51,296,603 72,504,056 47,665,692
Combined cycle 27,111,770 48,583,157 60,786,094 46,542,970
Diesel engine 100,836 180,932 399,267 180,932
Coal-fired - 33,617,610 - 33,617,610
Total 118,211,804 187,344,902 252,117,194 175,217,699

80
Table 27, continued. Emissions in 2009 and emissions prediction in each power plant and each
scenario in 2025
Emission (ton) Year (Scenario)
Power plant type 2009 2025 (S1) 2025 (S2) 2025 (S3)
SO2
Steam turbine 539,889 414,676 915,079 968
Gas turbine 26,886 41,154 58,169 232
Combined cycle 16,075 23,221 29,053 227
Diesel engine 178 320 706 320
Coal-fired - 396,004 - 396,004
Total 583,028 875,375 1,003,007 397,750
NOx
Steam turbine 122,411 121,454 268,016 110,442
Gas turbine 119,144 181,926 257,139 138,664
Combined cycle 91,616 159,706 199,821 135,398
Diesel engine 2,711 4,865 10,736 4,865
Coal-fired - 148,145 - 148,145
Total 335,883 616,097 735,712 537,514
CO
Steam turbine 26,277 26,860 59,273 33,092
Gas turbine 19,317 29,453 41,629 35,533
Combined cycle 16,786 31,279 39,136 34,696
Diesel engine 584 1,048 2,313 1,048
Coal-fired - 5,698 - 5,698
Total 62,964 94,338 142,351 110,066

81
Figure 4-17. CO2 emission for each type of power plants in 2009 and three scenarios in 2025
Figure 4-18. SO2 emission for each type of power plants in 2009 and three scenarios in 2025

82
Figure 4-19. NOx emission for each type of power plants in 2009 and three scenarios in 2025
Figure 4-20. CO emission for each type of power plants in 2009 and three scenarios in 2025
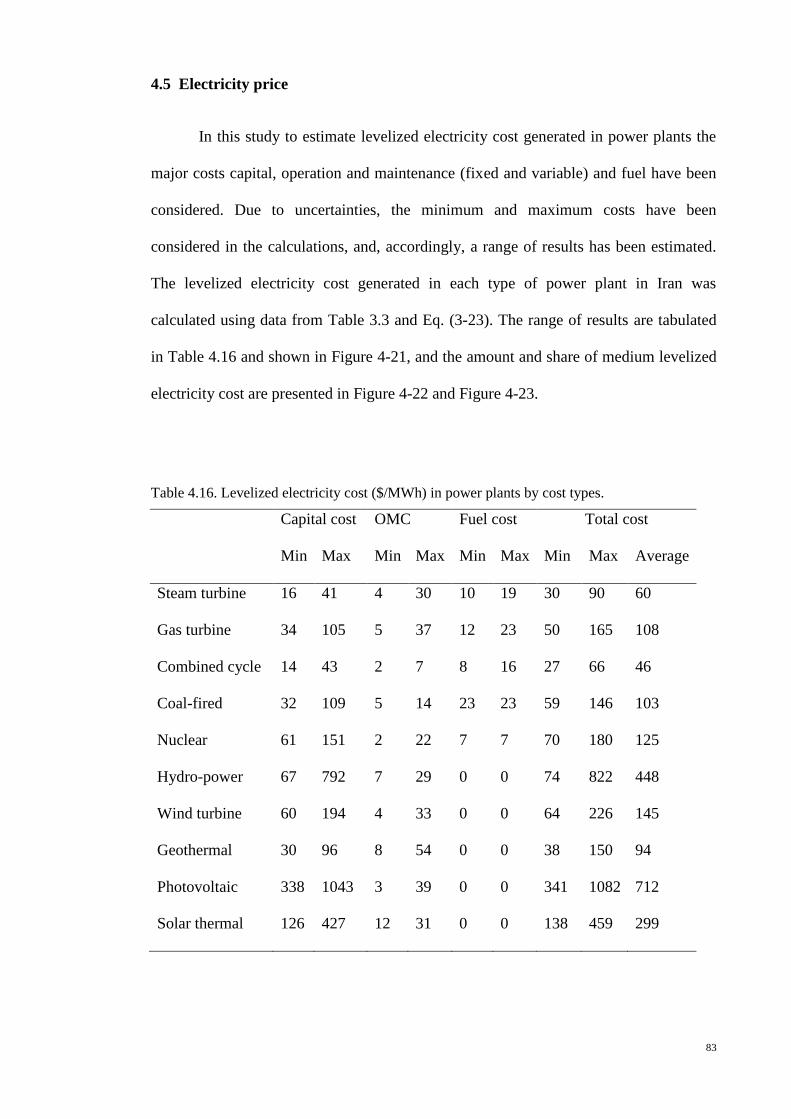
83
4.5 Electricity price
In this study to estimate levelized electricity cost generated in power plants the
major costs capital, operation and maintenance (fixed and variable) and fuel have been
considered. Due to uncertainties, the minimum and maximum costs have been
considered in the calculations, and, accordingly, a range of results has been estimated.
The levelized electricity cost generated in each type of power plant in Iran was
calculated using data from Table 3.3 and Eq. (3-23). The range of results are tabulated
in Table 4.16 and shown in Figure 4-21, and the amount and share of medium levelized
electricity cost are presented in Figure 4-22 and Figure 4-23.
Table 4.16. Levelized electricity cost ($/MWh) in power plants by cost types.
Capital cost OMC Fuel cost Total cost
Min Max Min Max Min Max Min Max Average
Steam turbine 16 41 4 30 10 19 30 90 60
Gas turbine 34 105 5 37 12 23 50 165 108
Combined cycle 14 43 2 7 8 16 27 66 46
Coal-fired 32 109 5 14 23 23 59 146 103
Nuclear 61 151 2 22 7 7 70 180 125
Hydro-power 67 792 7 29 0 0 74 822 448
Wind turbine 60 194 4 33 0 0 64 226 145
Geothermal 30 96 8 54 0 0 38 150 94
Photovoltaic 338 1043 3 39 0 0 341 1082 712
Solar thermal 126 427 12 31 0 0 138 459 299

84
Figure 4-21. Levelized electricity cost range ($/MWh) in different power plants
Figure 4-22. Medium levelized electricity cost in power plants by cost types
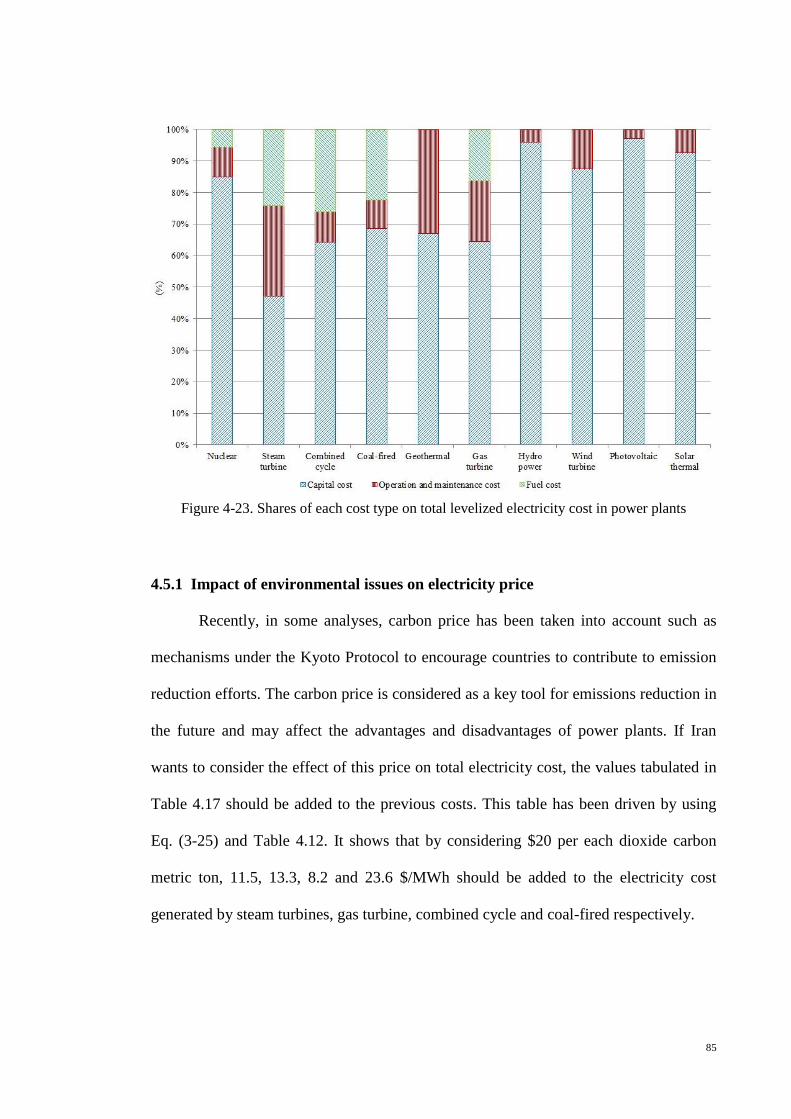
85
Figure 4-23. Shares of each cost type on total levelized electricity cost in power plants
4.5.1 Impact of environmental issues on electricity price
Recently, in some analyses, carbon price has been taken into account such as
mechanisms under the Kyoto Protocol to encourage countries to contribute to emission
reduction efforts. The carbon price is considered as a key tool for emissions reduction in
the future and may affect the advantages and disadvantages of power plants. If Iran
wants to consider the effect of this price on total electricity cost, the values tabulated in
Table 4.17 should be added to the previous costs. This table has been driven by using
Eq. (3-25) and Table 4.12. It shows that by considering $20 per each dioxide carbon
metric ton, 11.5, 13.3, 8.2 and 23.6 $/MWh should be added to the electricity cost
generated by steam turbines, gas turbine, combined cycle and coal-fired respectively.

86
Table 4.17. Impact of carbon price on electricity generation cost ($/MWh) in Iran
Power plant type Carbon price ($/ton CO2)
10 20 30
Steam turbine 5.75 11.5 17.25
Gas turbine 6.64 13.28 19.92
Combined cycle 4.09 8.18 12.27
Coal-fired 11.8 23.6 35.4
The same process can be done to quantify the environmental effect of power
plants such as emissions other than CO2 in fossil fuel based types and even radioactive
radiation risk in nuclear power plants or nuclear used fuel waste management. The
weight of each of them on decision making, depend on the government environmental
policy or country’s international commitments.

87
: Chapter 5
Discussions
5.1 Power sector composition
As shown in the Figure 4-1 and Figure 4-2, the annual electricity production
growth in the country was 12.1%, and the annual nominal capacity growth was 10.2%.
This is equivalent to an annual growth of 5,225 MWh of electricity production that
needs to create 1,315 MW of new power generation capacity annually.
For 43 years, from 1967 to 2009, the average of population growth in Iran was
2.5%. Nonetheless, the per-capita electricity consumption increased by about 4,200%,
which is equivalent to an average annual growth rate of 9.3%. Electricity consumption
per person increased from 71 kWh in 1967 to 3,000 kWh in 2009. This very high
growth is due to the economic growth that caused the rate of electricity production to be
much higher than the population growth.
As power plants were developed a long time ago, their structure has also been
changed from time to time to meet the current electricity demands of the country.
Figure 4-5 shows the change in the pattern of nominal capacity composition from 1967
to 2009. This figure shows that in the last two decades (1989-2009), the share of the
steam power plants decreased from 56% to 28%, while the share of the gas turbine and
combined cycle together have increased from 25% to 57%. The reasons for these
changes are the enormous gas resources in the country, high efficiency, and fewer
emissions when natural gas is used in combined cycle power plants compared to other
thermal types.
Figure 4-4 shows that the electricity generation from fossil fuel is much higher
than renewable resources. This is due to the tendency to use more fossil fuel power

88
plants in order to meet high electricity demand. This is also due to the huge fossil fuel
resources in the country, deficiency of water resources and lack of investment in
renewable sources. There have been some changes in the pattern of thermal power
plants. Since 2001, many gas turbines and combined cycle power plants were
developed; therefore, the contribution of electricity production by these power plants
has been increased. This is due to the government's policy to increase the contribution
of gas turbine and combined cycle plants. While the diesel engine power plants are
slowly being phased out in Iran, the share of the nominal capacity or electricity
generation of this type of power plant decreased from 21% in 1967 to 0.1% in 2009.
Meanwhile, the contribution of hydropower plants has been consistently decreasing
from 40% in 1971 to 13.7% in 2009. Unlike steam turbine and combined cycle power
plants, the share of electricity production from the hydropower plants was always less
than its nominal capacity because of drought and limited water resources.
The share of each type of power plant in nominal capacity and electricity
generation in 2009 is tabulated in Table 4.4 and is shown in Figure 4-6. This shows that
in 2009, about 85% of nominal capacities and more than 96% of electricity produced
was by three types of thermal power plant; gas turbine, combined cycle and steam
turbine. Although hydropower plants have 13.7% of nominal capacity, because of the
water shortage in the country, only about 3.3% of the electricity is generated by this
type.
Iran has great potential for generating electricity from wind and solar sources;
however, the amount of electricity generated from these resources is still very small.
Although since 2001 there has been a 30% annual growth rate in electricity generation
from wind turbines, less than 0.1% of total electricity is generated from this source.
Several components influence the power plant capacity factors, including life
span, purpose, overhaul maintenance, fuel supply, and technology used in power plants.
89
Figure 4-7 shows that this factor for the base-load (e.g., steam turbine) and peak-load
power plants, which were usually added to the network at the peak electricity demand
hours. The average capacity factors for steam turbine, gas turbine, combined cycle and
diesel engines have been evaluated at 67.8%, 30.3%, 56.2% and 6.0%, respectively. In
this study, the capacity factor of the coal-fired power plants is assumed to be 65.0%
(Energy Information Administration, 2010a).
5.2 Emission Production
The growth of all types of fuel consumed by Iranian power plants has been
depicted in the Figure 4-8. Natural gas is expected to be the fastest growing component
of world energy consumption (International Energy Outlook 2002 with projection to
2020, December 2001). This figure shows that natural gas consumption growth is more
than other types of fuel in Iranian thermal power plants. The average annual growth of
natural gas was 20%, while fuel oil and diesel were 9% from 1967 to 2009.
Figure 4-9 also shows the share of total energy for each fuel type used in Iranian
thermal power plants. It shows that the contribution of natural gas increased from 3% in
1967 to 73% in 2009. This share can increase more by supplying natural gas in the
winter when some power plants switch to liquid fuels because of the pressure drop in
gas pipelines.
For these 42 years (1967 to 2009), the average annual growth rate of emissions
was 11% for CO2, 9% for SO2, 10% for NO2 and 11% for CO. Emission fluctuations in
some years are due to the change in the amount and type of fuel used. Fuel use changes
might be due to the rate of exploitation of hydropower plants, replacement of natural
gas with liquid fuel in some cases and because of overhaul and maintenance in some old
power plants. As seen in Figure 4-10, decreases in CO2 and SO2 emissions were
observed due to a decrease in the liquid fuel consumption. For instance, in 1998 and

90
2003, while the liquid fuel consumption decreased, especially fuel oil (Figure 4-8), CO2
and SO2 emissions also decreased.
The year 2009 is considered as a sample to show that the emissions in power
plants are more due to the use of liquid fuels. For example, as resulted in Table 4.8
although about 18% of thermal energy used in gas turbine power plants is from diesel
respectively, more than 24%, 37% and 99% of CO2, NOx and SO2 were emitted due to
consumption of this type of fuel. These results are almost the same for the diesel used in
the combined cycle power plants, and for the fuel oil used in the steam turbine power
plants. Therefore, if the use of liquid fuels in thermal power plants can be avoided, the
amount of SO2 emitted in these power plants will be decreased significantly.
The important point observed from results depicted in Figure 4-11 is that the
trend of emissions per unit electricity generation is decreasing. This is due to more
natural gas being used instead of liquid fuels and the increase in the thermal power plant
efficiency. Increasing the efficiency of thermal power plants was caused by replacing
the gas turbine power plants with combined cycle and by increasing the efficiency of
new turbines.
The Figure 4-12 shows that the contribution of diesel engines for all types of
emission was insignificant. Comparison of the thermal power plants with regard to
emissions shows that the worst type is the steam turbine, which produces the highest
amount of emissions while the best type is the combined cycle. Except for the NOx
emissions, for which both the gas turbine power plant and steam turbine have the same
emission, in this comparison, the diesel engine is eliminated due to the insignificant
share of electricity generation.
The data for Table 4.12 have been calculated by using the past 8-year fuel mix.
Therefore, by changing the fuel mix used in thermal power plants, this data will be

91
changed. For example, by increasing the contribution of natural gas in power plants, the
emissions per unit of electricity generated will be decreased. The results show that the
combined cycle power plant is the best thermal type in terms of greenhouse gas
emissions. The results found are also similar to the data that was experimentally
calculated using analysis and measurement of flue gases of Iran’s fossil fuel power
plants (steam turbine, gas turbine and combined-cycle types) (Nazari et al., 2010).
5.3 Future power plant composition
Iran's historical nominal capacity for the past thirty years and its forecasted
value until 2025 is shown in Figure 4-13. Accordingly, the total capacity of Iranian
power plants in 2025 is estimated to be about 124,000 MW. This value shows that the
expected demand for electricity during the coming 16 years would require the
installation of as many power plant capacities as installed in the entire past forty years.
It is equivalent to the construction of 4,200 MW nominal capacities each year, which is
very high in contrast with the annual 2,900 MW capacity increase over the last decade.
It also shows that in order to maintain the trend of the country’s power sector
development, the annual growth of 5.1% of the nominal capacity in power plants is
required until 2025. This trend will increase the nominal capacity per-capita from 762
W in 2009 to 1300 W in 2025 and electricity generation per-capita will also increase
from 3000 kWh to 5700 kWh.
Figure 4-14 shows the nominal capacities and their shares in new power plant
composition in 2025. Figure 4-15 shows the pattern of nominal capacity composition
from 2009 to 2025. These figures show that power plant diversity will increase to ten
(five thermals, four renewables and a nuclear). They also show that the share of thermal
power plants will decrease from 85% to 60% in the new power plant composition in the
future.

92
5.4 Future fuel consumption and prediction of emissions in power plants
Future power sector’s fossil fuel consumption has been presented in Table 4.14
and shown in Figure 4-16. The results show that in the new power plant composition
(first scenario); the consumption of natural gas will increase by 47% and diesel by 50%.
In addition, coal consumption in coal-fired power plants will reach 10,826 ktons. The
total coal production in the country in 2008 was about 2,736 ktons. Therefore, providing
this amount of coal to use in coal-fired power plants will require a huge amount of
investment to increase production or imports (Ministry of Energy, 2009c).
In the second scenario where the same composition of power plants as in 2009 is
assumed, all types of fuel consumption will increase by 130%, 106% and 69% for
natural gas, diesel and fuel oil respectively. Meanwhile, in the third scenario, with the
replacement of liquid petroleum with natural gas, in 2025 only the consumption of
7,321 Ml fuel oil is eliminated, and diesel consumption is decreased by 97 vol%, which
is equivalent to 7,261 Ml. However, natural gas consumption will increase 15,755 Mm3.
In view of fuel supply in this scenario, theoretically it is possible for the country to
switch fuel to natural gas, because Iran is rich in natural gas resources, which is used by
many power plants. Nevertheless, it should be made available over the year, especially
in the winter when domestic consumption is maximum. In addition, it is necessary for
those that previously did not use natural gas to construct pipelines and to technically
prepare them to use this type of fuel.
CO2 emissions
Figure 4-17 presents CO2 emissions from the electricity sector in Iran in
different scenarios compared with emissions in 2009. The results show that in the new
composition (first scenario) CO2 emissions are 1.6 times higher than those in 2009. If

93
the old structure of electric power industries continues (second scenario), CO2 emissions
will increase 2.1 times by 2025. This means that the new composition, including 20,000
MW nuclear power plants will cause 26% CO2 abatement in comparison with the
current power plant mix in 2025. In addition, the results of scenario 3 show that after
natural gas substitutions, the total emissions will be reduced by 6%. The share of coal-
fired power plants in total CO2 emissions will be 18% because the coal-fired has the
highest emissions among the thermal types. By substituting it with combined cycles,
Iran can also decrease another 9% of CO2 emissions.
SO2 emissions
The results of SO2 emissions in different scenarios are presented in Figure 4-18.
The rate of SO2 in the new power plant composition will increase by 50% and in the
second scenario it will be up to 72% compared with the amount in 2009. In the third
scenario by eliminating or reducing the use of sulfur-containing fuels such as fuel oil
and diesel, the amount of emissions decreased 55% compared with the use of the new
composition and 32% less than the amount in 2009. In this scenario, the SO2 emissions
are mostly due to coal-fired power plants, which use a huge volume of coal containing
large amounts of sulfur. In order to reduce SO2 emissions other methods such as
elimination or reduction of sulfur in the fuel or using the flue gas desulfurization (FGD)
for removing SO2 from the exhaust flue gases should be adopted (Wikipedia, 2010).
Withdrawing to construct or substituting the coal-fired type with the combined cycle is
also another alternative for eliminating SO2 in the future.
NOx emissions
The NOx emissions by power plants in different scenarios are given in
Figure 4-19. The results show that NOx emissions will increase 83% until 2025 for the
new power plant composition and if the composition does not change, this will increase

94
to 119%. By natural gas substitution, the NOx emissions will decrease about 13% in
comparison with the first scenario.
CO emissions
The CO emissions in each scenario are shown in Figure 4-20. The figure shows
that the amount of CO emissions in the first scenario will be 1.5 times higher and in the
second scenario, 2.3 times higher than the amount in 2009. Therefore, for CO
emissions, it seems that the new power plant structure is better than the old one.
Nevertheless, if liquid petroleum is replaced by natural gas, the power plants will
produce more CO emissions about 17% higher than the first scenario or equivalent to
1.7 times in 2009.
5.5 The electricity price
In terms of medium levelized electricity cost, the results presented in Table 4.16
Figure 4-21, show that the best base-load power plants are the combined cycle, steam
turbine, geothermal, coal-fired and nuclear, respectively. For peak-load power plants,
the foremost types are gas turbine and hydropower. Among the intermittent sources,
wind turbines generate the cheapest electricity price. Solar thermal, and photovoltaic are
ranked number two and three respectively. These estimations are based on the medium
of the range of results. There are many factors, which can effect on actual electricity
cost in top or bottom this range for each alternative.
There are also some determinant costs, which are not considered in this
calculation but will contribute to the overall costs such as transmission and distribution
network costs, decommissioning and waste disposal management and liability for
nuclear damage. Iran has some abilities that cause a decrease on capital cost such as low
labor cost, and also governmental support. For sensitivity analysis, variation of some
factors should be taken into account. For instance, the two-digit inflation rate in Iran can
95
affect the real interest rate which plays a critical role in the levelized electricity cost,
especially for high capital cost and long construction time power plants such as nuclear.
The local technology will probably decrease the electricity price generated by thermal,
solar thermal and hydro power types, due to the good experience in manufacturing these
types and their ancillary equipment in Iran (Dehqan, 2010; Mehdi, 2011). For coal-fired
and nuclear types, Iran does not have the local technology and has to adopt foreign
technology. This issue will probably increase the electricity cost generated by these
power plants. This is especially evident for NPP, where many countries or companies
are reluctant to deal with Iran due to the U.S. or United Nations Security Council
(UNSC) sanctions. Dependency on foreign technology and cooperation are the main
reasons to prolong its construction time in Iran. For instance, the first nuclear power
plants which restarted construction, were completed after 16 years while the normal
construction time is 6 years. Moreover, according to Katoozian, the Head of the Energy
Commission of the Iranian parliament, Russia charged Iran more than 150% of normal
price (Katoozian, 2011). In terms of fuel availability criteria, Iran has good access to
natural gas to use in power plants, but would probably have to import more coal to use
in a coal-fired type. There are also some limitations on operating hydropower plants
because of drought, leading to the low capacity factor (about 11% in 2009). These
results may vary in the future by developing technologies. For example, the electricity
price generated by renewable energy technologies such as photovoltaic, solar and wind
are decreasing, and, consequently these types will be more comparable with nuclear or
even thermal types (Blakburn et al., 2010).
There are some factors, which can make nuclear electricity comparable with
thermal types in the future. The first factor is the ability to export natural gas to the
international market. This goal can be reached by achieving LNG technology or by
connecting to new markets by pipeline. After that the natural gas price will increase in

96
thermal power plants and will affect the electricity cost generated by them. Another
factor is the interest rate, which is high in the country at present. This factor has a
considerable effect on nuclear electricity because of the considerable capital cost. That
is why in the countries with low interest rates, (e.g., less than 5%) nuclear is comparable
with thermal types. Therefore, by decreasing inflation, and, consequently, the interest
rate in the country, the electricity cost will decrease in NPPs. Achieving the technology
of nuclear reactor construction is necessary for a country to be independent of foreign
countries, especially for Iran, which has local nuclear fuel cycle technology and wants
to construct 20,000 MW of NPP.
As shown in Figure 4-23 about 85% of the electricity generation costs in nuclear
power plants are fixed costs, where 9% is for operation and only 6% is for fuel cost. The
share of capital cost for most renewable energy power plants is also high; however, for
thermal power plants the running costs (including operation and maintenance cost and
fuel cost) have a higher share. The results also shown that the most expensive electricity
generated is by hydropower plants. One reason is the low capacity factor due to the
limitations of hydropower in the country, and the second reason is the construction
costs. Needless to say, dams are multi-purpose structures to save water for agricultural
use, flood control as well as electricity generation. If only the share of electricity
generation costs in capital, operation and maintenance were considered in the
calculation, the electricity price in hydropower plants would decrease.
5.6 Impact of nuclear power on energy sustainability
Currently, many countries are endorsing nuclear power plant to increase their
power capacity as an alternative to their primary energy dependency. Most of them do
not have enough fossil fuel resources and strongly depend on imports. Based on the
Nuclear non-Proliferation Treaty (NPT), the enrichment of uranium for a civilian

97
nuclear program is a member’s undeniable right. There is also no absolute evidence in
the reports of the International Atomic Energy Agency (IAEA) showing that Iran is
intending to weaponize uranium (Campaign Against Sanctions and Military
Intervention in Iran, 2010). Some international concerns exist about the main goal of the
Iranian nuclear fuel cycle which can be used to make fuel or, in the highly extended
form, the fissile core of an atomic weapon. These concerns have led to four sets of
UNSC sanctions, and also some sanctions from the E.U. and U.S. over Iran’s refusal to
suspend uranium enrichment. These sanctions have focused on restrictions of trade with
Iran that would help the development of its nuclear technology (Smith, 2010). Although
these sanctions, are not taken into account in the electricity price calculation in this
study, it clearly has substantial direct and indirect effects on many aspects of the
country, such as underdevelopment of the petrochemical and natural gas industries, high
insurance cost, decreased foreign investment, unemployment, brain drain, decrease
national currency value, political and military threat as well as foreign trade difficulties.
Moreover, they will influence the cost of all related activities from production,
conversion, enrichment, and fabrication. However, the results tabulated in Table 4.16
show that based on the medium levelized electricity cost, nuclear electricity is not cost-
effective in comparison with thermal electricity generation in Iran.
5.6.1 Environmental effects
The share of CO2 emissions by the Iranian power plant sector was about 29% of
the total emissions in the country in 2010 (Ministry of Energy, 2012). Other major
sources are domestic, transportation and industry with about 25%, 23% and 17%
respectively. Even if Iran could construct 20,000 MW nuclear power plants by 2025,
emissions in this sector in comparison with the current power plant mix will decrease by
26%. This value will be equivalent to a decrease of only about 6% of the total emissions

98
in the country at that time. Therefore, emissions control should be taken into
consideration in all sectors. Moreover, if emissions mitigation is the case, coal-fired
power plants should not be constructed as they have the highest emission factors among
all fossil fuel types. In addition, although Iran may gain by decreasing emissions by
doing some projects, such as Joint Implementation (JI), there are some reasons that
show it is not essential for the country to encourage low emissions power plants. First of
all, based on the Kyoto Protocol, which was ratified by the country in 2005, Iran has no
emission limitations or reduction commitment. Second, the most critical energy-related
environmental problem is air pollution in Iran’s big cities (Sabetghadam, 2006). There
are many days, designated as public holidays by the government because of heavy air
pollution. In winter 2007, air pollution killed 3,600 people during a month in Tehran,
Iran’s capital (Terra daily, 2007). This disaster occurred mainly, due to transportation
activities and domestic fossil fuel consumption for heating. The share of power plant
emissions in this problem were low, therefore, no one can deny the significant priority
to resolve this lethal environmental problem by amendment of the transport and
domestic sectors rather than by decreasing emissions in the power plants. In addition,
NPPs are usually constructed near water resources for high efficiency at sea level and
their need for a huge amount of water for use or desalination. All the big cities in Iran
that have an air pollution problem are far from these locations, and, therefore, the
construction of NPP would not help to decrease their air pollution problems.
There are some points about the environmental effect of NPP that should be
considered. First, in considering the life cycle emissions, nuclear power is less but not a
zero emissions power plant. Although they have no emissions during operation, some
indirectly related activities, that use fossil fuel contribute to emissions. For example,
activities during the construction, fuel fabrication from mining, uranium enrichment,
transmission, used fuel repository during plant life time, and also power plant

99
decomposition, all produce emissions (Fleming, 2007). Second, there are other pollution
problems related to nuclear activities such as radioactivity in mines or in the fabrication
process or from the fuel used, which will be active for thousands of years. This is a
grave threat to health and to the environment and should be an important part of any
nuclear development plan. According to (Hamed, 2011) nuclear energy also depends on
water resources and increases the environmental degradation cost, especially for the
central area and Persian Gulf coast parts of the country. Last, but not least, the recent
incidents at Japan's Fukushima NPP in March 2011 have clearly demonstrated that more
should be done to strengthen safety and ensure reliability, especially for a developing
country such as Iran which is well-known for its long history of earthquake activity.
Many studies have been conducted to find methods for emissions abatement by
improving technology. For instance, Holttinen studied the effect of wind energy on CO2
abatement in the Nordic countries. This study showed that if coal-fired power plants
were replaced by wind turbines, it could reduce CO2 emissions by more than 0.6
kg/kWh (Holttinen et al., 2004). Romeo showed that Spain could reduce CO2 emissions
by up to 90% by 2050 in an efficiency scenario with carbon capture and storage (CCS)
and renewable energies. Therefore, the development of CCS projects in Spain is
essential in order to maintain economic development without increasing CO2 emissions
and as an action response to Kyoto protocol targets (Romeo et al., 2009). The use of
renewable energy could reduce the share of coal power plants from 44% to 39%, as well
as decrease the cumulative emissions of CO2 by 8%, SO2 by 3%, and NOx by 4% in
Vietnam (Nguyen et al., 2009). In addition, renewable energy could help avoid
installing 4,400 MW of fossil fuel generating capacity, conserve domestic coal, and
decrease coal and gases imports and improve energy security. The influence of different
types of power generation technologies, especially the potential role of natural gas

100
combined cycle and nuclear power plants on CO2 emissions in Shanghai, China were
discussed by (Gnansounou et al., 2004).
Iran could also apply many techniques to decrease emissions in the country and
has high potential to decrease the amount of GHG emissions by up to 31% by 2021
(National Climate Change Office, 2003). In the power plant sector, although NPP helps
decrease emissions, it is not the only choice and there are many other effective policies.
For example, using the more combined cycle type by substitution of the gas turbines,
avoiding construction of the high emissions coal-fired type and also switching the fuel
from liquid petroleum (e.g., fuel oil and diesel) to low carbon fossil fuel (natural gas) as
demonstrated in this study, will decrease emissions. Here are some other improvement
policies for emissions mitigation in selected sectors (Shafie-pour, 2004):
Power plant sector:
Enhancing power plant efficiency.
Using smart technologies for transmission and distribution.
Decreasing transmission and distribution losses.
Using carbon capture and storage technique (CCS).
Decarbonisation or desulfurization of fuels or flue gases.
Industry sector:
Reduction of fugitive emissions at refineries.
Sulfur content reduction of middle distillates (fuel oil and diesel).
Reduction of flaring.
Transportation sector:
Maintenance and inspection of vehicles based on emissions standard.
Scrapping of outmoded vehicles.
Enhancing public transport.

101
Domestic and commercial sector:
Increasing the use of renewable sources of energy.
Demand side management program.
Standardizing and labeling for appliances.
In terms of environmental issues, especially for emissions reduction, although
NPP and renewable energies are advised, developing them is not considered urgent for
Iran, because it has considerable potential to decrease emissions in all sectors, which
can be done easily and cheaply.
5.6.2 Energy demand
There are many indicators that show that the energy industry in Iran is
unsustainable, and that the government should conduct some proper and rational energy
policies to correct it in both the near-term and long-term. For example, the high growth
rate of energy consumption due to over US$ 50 billion subsidies in all energy sectors,
including electricity sector, and about 22% electricity loss in transmission and
distribution (A. R. Karbassi et al., 2007; Khosroshahi et al., 2009; Ministry of Energy,
2009c). Due to cheap prices of all energy carriers, population growth and enhanced life
standards, the final energy consumption has increased more than 7% annually, and
electricity production has risen 10% yearly in the last two decades (IAEA, 2009). As
shown in Figure 2-3 to Figure 2-5, the growth rate of energy consumption is higher than
energy production. It is undeniable that if this trend continues Iran will not be able to
export energy as the major revenue of the government in near future. To correct this
trend the government eliminated energy subsidies in December 2010 (CNN, 2010). By
doing so, it hopes that rising fuel prices will lead to more efficient use and finally
decrease the annual rate of consumption growth in the future.
102
Like any other energy sector, electricity demand has greatly increased in Iran.
Electricity usage has increased by over eleven-times over the past 30 years, and nominal
capacity has increased by the equivalent of 1,552 MW annually, and reached 56,181
MW in 2009. If this trend continues, Iran must construct 4,200 MW each year to answer
the demand.
All other sectors in the country also consume energy irrationally, sometimes
higher than the world average. For example, the fossil fuel consumption in the domestic
sector is almost equal to the power plant sector as shown in Figure 2-6 and Figure 2-7.
The amounts of each type of fossil fuel consumption in this sector in 2009 were 75.5
Mboe, 296.6 Mboe and 0.1 Mboe for petroleum, natural gas and coal respectively.
These large amounts of fossil fuel consumption which were mostly used for water or
space heating, are due to low energy prices, old technologies for most energy
consuming devices and lack of enthusiasm in using latest technologies in building
construction. There are many cost-effective suggestions that do not need a huge amount
of investment or advanced technologies, which can help control or rationalize the
energy consumption trend without decreasing the country’s GDP, for instance, Iran has
good potential to use solar energy using simple technology, such as solar water heating
instead of gas water heaters. By doing this, most of the fuel requirements of water
heating in residential buildings could be eliminated. Another suggestion is applying
stricter supervision of optimal energy efficiency in buildings, which is already ratified,
and could help to improve this trend.
Based on Figure 2-8, there are similar problems in the power plant sector, which
are depicted by its energy flow. It shows that 65.3% of the primary energy was wasted
as heat and the total Iranian power plant efficiency is about 34.7%. This efficiency is
about 7% less than OECD countries or about 3% less than the world average
(Maruyama et al., 2009). Iran could increase the efficiency in the power plants by

103
changing low efficiency thermal types to more efficient types such as the combined
cycle, or using combined heat and power (CHP) technology. Another 7.2% of primary
energy is lost in transmission and distribution networks and finally only 27.5% is
consumed by the end users. The transmission and distribution networks lost or wasted
about 21% of electricity generated. This huge loss, which was only about 7% in 1994,
increased due to the lack of investment in the transmission and distribution network
with a simultaneous development of power plant capacities (Ministry of Energy, 2011).
Clearly, investment in optimizing transmission and distribution networks, is not only a
high priority, but is also more cost-effective than the construction of new power plants.
Wasting energy and low efficiency is not exclusive to the power plant sector. These
problems and irrational use of energy also occur in most other sectors. Some studies
show that the potential for energy saving in the transportation and industry sectors are
about 45% and 35%, respectively (A.R. Karbassi et al., 2005). According to
(Supersberger, 2009), until 2050, a 50% increase in efficiency in the power plant sector
is possible on the generation side and 60% on the consumption side.
In terms of energy demand, despite the launching of the Bushehr NPP in 2012,
at that time the share of the nuclear capacity and generation in the power plant sector
would be about 2% and 3% respectively. This is equivalent to about 0.3% in the total
country’s energy demand, which only uses electricity and no other type of energy
carriers. Therefore, nuclear power plants are neither the sole solution for electricity
demand nor for energy consumption in the country.
Iran can improve the electricity sector and increase sustainability by power plant
improvements and technological advances in the transmission and distribution in order
to reduce its losses. This will improve energy efficiency and help to postpone
investment of the new power plants that are in most cases fossil fuel based. Clearly, this
action is more cost-effective than developing new power plants. For example, the

104
reduction of 3% of the 22% total loss is almost equivalent to the electricity generation in
1,000 MW based-load steam turbine or coal-fired power plants.
5.6.3 Energy security
In most countries, energy security is diversified to decrease dependency on a
single source and the guarantee of fuel supplies in the long-term. These definitions for
Iran (and probably some petroleum-rich countries) are not applicable, largely because of
the huge fossil fuel resources, and, hence, reduced concern about such issues. Despite,
Iran being the second in rank for natural gas and fourth for oil reserves, there are still
some issues that jeopardize the energy security of the country.
Dependency on crude oil export
Its economic dependency on crude oil exports constitutes one of the main threats
to the energy security for Iran. Keeping oil exports is vital for many countries, which is
why it is encouraged by fossil fuel importers; also two wars in the Persian Gulf region
have occurred to save energy exports. However, for Iran, this dependency has many
disadvantages. First, receiving an easy income by exporting raw materials in the last
century resulted in the lack of infrastructural development in other income sectors such
as industrial, tourism, agricultural and commercial. Moreover, due to the current
political situation arising from the nuclear fuel cycle, an oil export boycott will halt the
country’s economy, especially, when other petroleum rich nations increase their
production to counter the absence of Iranian petroleum in the energy market (AsrIran,
2011b; Reuters, 2011). Furthermore, higher levels of exportation mean more
exploitation, which lead to the quicker depletion of resources. Dependency on crude oil
exports have also increased the military and security budget of the country to keep oil
exports safe in a region of high conflict.

105
To avoid these possible problems, Iran must decrease its dependency on crude
oil exports and develop other sectors and prepare for competition with other countries to
export products and provide services. This policy has many benefits for the country
such as coping with 10% unemployment, decreasing vulnerability to fluctuating oil
prices and serious universal sanctions. Iran has the ability to develop other sources of
income such as a highly educated labor source, deep ancient civilization, location in
geopolitical region and four-season climate to develop agriculture sector, while using oil
to support economic growth. Clearly, income from services or product exports instead
of crude oil will conserve natural resources for the future. Therefore, the attitude for the
crude oil income must be reformed. The income from crude oil exports should not be
considered as revenue, but as selling natural wealth. Oil must be acknowledged as a
strategic product because it is not renewable and there is not any substitution or
alternative for it. In fact, if Iran replaces crude oil revenue with other incomes, it will
have energy security for a longer period than many other countries.
High growth energy consumption
The second threat to energy security in Iran is energy consumption from high
growth, largely due to huge subsidies for all energy products such as gasoline, natural
gas as well as electric power. For instance, based on aging and energy-inefficient
vehicles in the transportation sector, gasoline consumption has increased rapidly. In
addition, due to less investment in refinery capacity, the country is not able to produce
enough gasoline. Consequently, imports of gasoline have increased each year and
reached almost $4 billion in 2007. Moreover, increasing energy consumption will cause
limitations to the export of energy, fund wastage as well as earlier source depletion. As
shown in Figure 2-3, if this trend continues it is predictable that there will not be any
extra energy for export in the next decade, and that the country would have to import
some part of its energy needs in later decades. Some conservation and energy
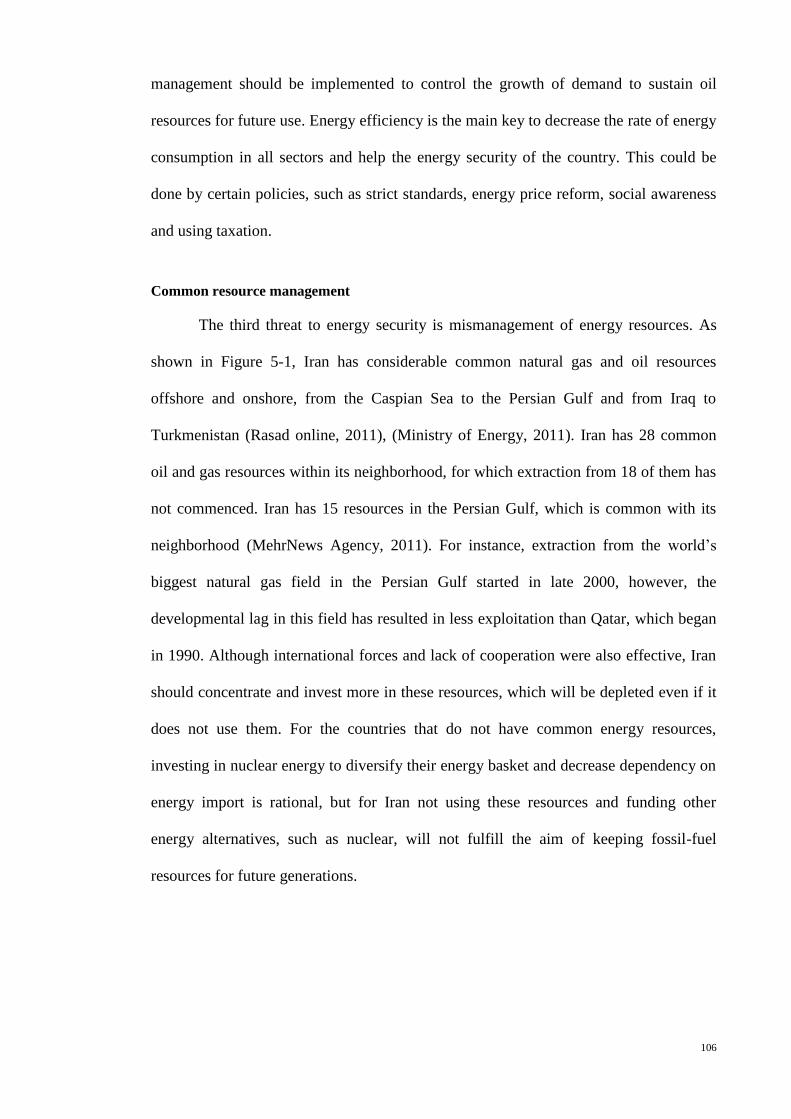
106
management should be implemented to control the growth of demand to sustain oil
resources for future use. Energy efficiency is the main key to decrease the rate of energy
consumption in all sectors and help the energy security of the country. This could be
done by certain policies, such as strict standards, energy price reform, social awareness
and using taxation.
Common resource management
The third threat to energy security is mismanagement of energy resources. As
shown in Figure 5-1, Iran has considerable common natural gas and oil resources
offshore and onshore, from the Caspian Sea to the Persian Gulf and from Iraq to
Turkmenistan (Rasad online, 2011), (Ministry of Energy, 2011). Iran has 28 common
oil and gas resources within its neighborhood, for which extraction from 18 of them has
not commenced. Iran has 15 resources in the Persian Gulf, which is common with its
neighborhood (MehrNews Agency, 2011). For instance, extraction from the world’s
biggest natural gas field in the Persian Gulf started in late 2000, however, the
developmental lag in this field has resulted in less exploitation than Qatar, which began
in 1990. Although international forces and lack of cooperation were also effective, Iran
should concentrate and invest more in these resources, which will be depleted even if it
does not use them. For the countries that do not have common energy resources,
investing in nuclear energy to diversify their energy basket and decrease dependency on
energy import is rational, but for Iran not using these resources and funding other
energy alternatives, such as nuclear, will not fulfill the aim of keeping fossil-fuel
resources for future generations.
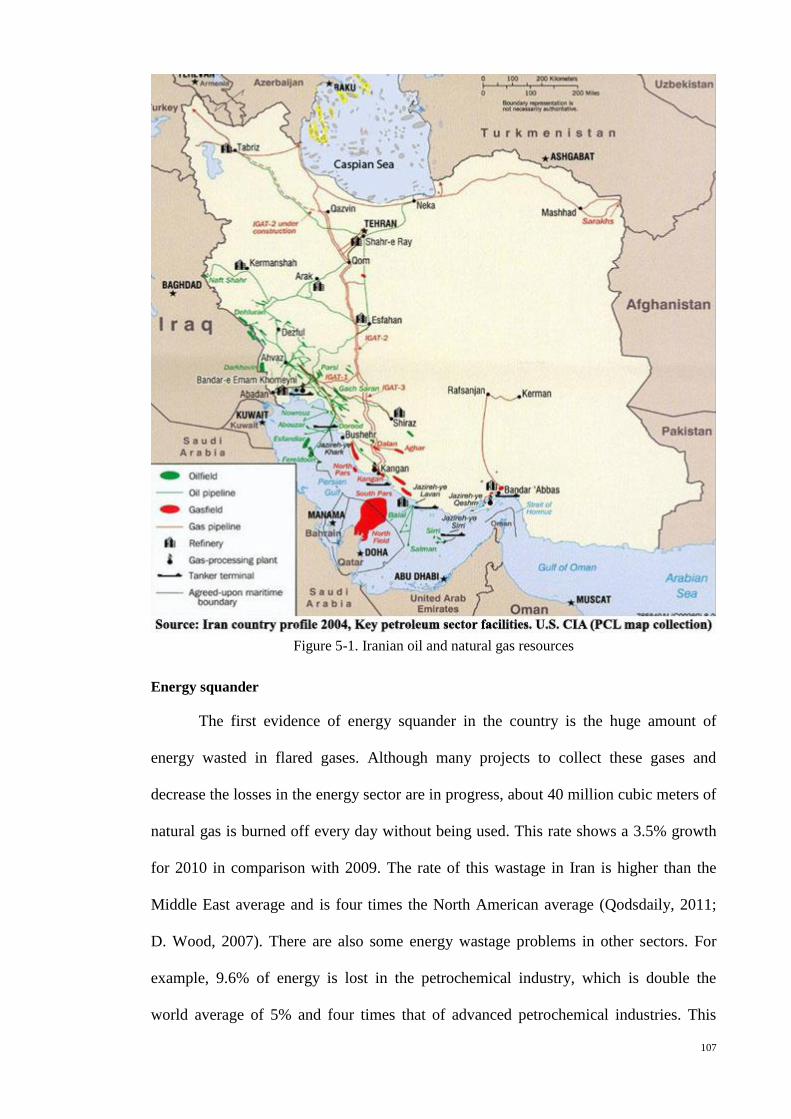
107
Figure 5-1. Iranian oil and natural gas resources
Energy squander
The first evidence of energy squander in the country is the huge amount of
energy wasted in flared gases. Although many projects to collect these gases and
decrease the losses in the energy sector are in progress, about 40 million cubic meters of
natural gas is burned off every day without being used. This rate shows a 3.5% growth
for 2010 in comparison with 2009. The rate of this wastage in Iran is higher than the
Middle East average and is four times the North American average (Qodsdaily, 2011;
D. Wood, 2007). There are also some energy wastage problems in other sectors. For
example, 9.6% of energy is lost in the petrochemical industry, which is double the
world average of 5% and four times that of advanced petrochemical industries. This

108
wastage is equivalent to 57 million barrels of oil per year. In addition, 10% of natural
gas is lost, which is equivalent to about $3 billion per year in pipelines or in compressor
stations, due to worn-out equipment. Obviously, the investment to control and utilize
some of the wastage in the power sector is more cost-effective than even renewable
energy (T. W. Wood et al., 2007) (Iranian Students' News Agency, 2010).
Political conflict
Political conflicts with the West have caused some difficulties for the country’s
energy sector. For example, there are problems in obtaining up to date technology,
including enhanced recovery methods to stop the natural decline of oil production,
which is estimated at 24%, as compared to the world average of 35%. This value in
some countries is 48% and, in Norway, it is 65% (Bina, 2009; Khabaronline.ir, 2011).
In the natural gas section, its projects for the development of PNG or LNG face many
problems because of the political pressures and limitations or the requirements for
significant foreign investment. One noteworthy example is the exporting of 150 million
cubic meters of natural gas per day to India and Pakistan by pipeline, which was
suggested about two decades ago but has not been finalized yet. As shown in
Figure 5-2, other routes have been suggested and supported that bypass Iran without
compromising the oil and gas exports to the international market (AsrIran, 2011a). For
example, a natural gas pipeline from Turkmenistan to Pakistan and India via
Afghanistan or also another pipeline which will transfer Caspian Sea oil to Europe
nominated Baku, Tbilisi, and the Ceyhan pipeline. Although, currently, Iran is exporting
natural gas to Turkey, it seems unlikely to extend this pipeline to be able to export
natural gas to Europe. Not only, because of pressure from the West, but also because
Europe is the traditional market of Russia’s natural gas, and this country will be totally
reluctant to have a competitor. These examples show that diplomatic efforts and

109
international cooperation have great roles to expand Iranian energy customers around
the world.
Figure 5-2. Natural gas routes in the region
In conclusion, in terms of energy security, nuclear energy is not a rational choice
for Iran. First, limited uranium resources will force Iran to seek a supplier on the world
market, especially if Iran wants to construct 20,000 MW of NPPs. Therefore, this
limitation will lead to some kind of dependency on foreign raw materials and will
impact on the energy security of the country. Accurate analyses should be done in terms
of the approved amount of Iranian uranium mines or ability to use its share abroad, to
attain nuclear fuel independence (Reuters, 2010). However, there are some solutions for
this concern. For example, the IAEA recently approved a global nuclear fuel bank,
which aims at providing an alternative to those countries, such as Iran, which seek to
produce their own nuclear fuel. There is also uncertainty about fuel fabrication costs in
the country, as the direct and indirect costs of fuel enrichment are probably expensive

110
and buying nuclear fuel is cheaper than producing. In addition, the high capital cost for
NPP construction has caused another difficulty for the country, which has limited funds
earned by crude oil exports. Investment in nuclear energy has led to the unfledged
development of other important energy industries as well as a significant shortage of
capital resources available for other projects. This is evident in the oil and gas sector,
where, Iran’s oil production has remained stagnant and will likely not increase due to
insufficient investment and certain international limitations in developing oil fields.

111
: Chapter 6
Conclusion and recommendations
The first objective of the thesis was to show a clear view of power sector
development in last five decades. It describes and shows that there has been a high
growth rate of electricity consumption in the country. The majority in share and
capacity of power plants are fossil-fuel based. This share always was increasing, which
increased from 67% to 86% and by new power plant composition will be decrease to
60% in 2025. The per capita electricity consumption was increased about 9.3%
annually. The historical power capacity in the past forty years used to predict the power
sector capacity in the future. The analysis shows that if this trend is to continue, the
increase in electricity consumption is expected to be around 10% in the upcoming years.
Accordingly, the total capacity is estimated to be about 124,000 MW in 2025, which is
equal to an annual increase of 5.1%. This growth is equivalent to the construction of a
4,000 MW power plant each year. The results also show that in the new power plant
composition, which government plans to increase variety from six to ten types and
construct enough NPPs to be capable of supplying 20,000 MW, in various parts of the
country, the consumption of natural gas will increase by 47% and diesel by 50%. In
addition, coal consumption in coal-fired power plants will reach 10,826 ktons. In the
second scenario where the same composition of power plants as in 2009 is assumed, all
types of fuel consumption will increase by 130%, 106% and 69% for natural gas, diesel
and fuel oil respectively.
In the second step to investigate the environmental effect of power plants, the
pattern of emissions in the past 42 years was calculated and described. This showed that
thermal power generators that use fossil fuels and play an important role in the
country’s power sector, are one of the major sources of emissions in the country. The
results show that the best types of thermal power plant with regard to air pollution are

112
the combined cycle, gas turbine and steam turbine, respectively. The hydropower plants
are the cleanest energy source, since they have no emissions during operation. However,
the study shows that these plants are unstable and can only be used as a supplementary
supply because of the unreliability of water resources. Iran also has considerable
potential for generating electricity from non-hydro renewable energy resources such as
wind and solar. The development of these resources provides more diverse energy
resources besides the dominant fossil fuels. In addition, it helps to meet the growing
energy demand while addressing environmental concerns and sustainability issues;
however, the amount of electricity generated from these resources is still under 0.1%.
Therefore, based on data analyses, Iran has to cover the required new capacities by
launching thermal power plants. The future power sector composition predicted based
on the government plans. The government wants to change the structure of the power
industry with lower share of fossil fuel base plants. In reality, because of the technical,
economical or lack of fuel supply as well as other factors, the power sector of the
country may develop differently. In this study, two other alternative scenarios were
considered to understand the condition of fuel consumption and emissions in the future.
This study indicates that if the power plant composition does not change the CO2
emissions in 2025 will be 252 Mtons and SO2, NOx and CO emissions will increase to
72%, 119% and 126%, respectively in comparison to the respective amounts in 2009. In
the new composition, by using more hydropower, renewable sources and 20,000 MW
nuclear power plants, the share of the thermal power plants of the total capacity will
decrease and the CO2 emissions in 2025 will decrease 26% in comparison with the
current composition. Although based on the Kyoto Protocol, there is no commitment for
the country for emissions mitigation and Iran has some vital air pollution problems in
the big cities, it is also possible to achieve more emissions reductions with gradual
conversion of liquid fuel to natural gas, as described in the alternative scenario and by
113
increasing the contribution of the combined cycle as a more efficient type of thermal
power plant. It is found that by substitution of liquid petroleum fuels by natural gas in
the new composition, Iran can decrease the emissions of CO2 by 6%, SO2 by 55% and
NOx by 13%. The withdrawing of coal-fired power plants and substituting them with
combined cycles can also decrease the CO2 emissions by another 9% in the future.
Meanwhile, many of the other environmental problems of nuclear activities, such as
nuclear radiation from uranium mining and NPP decomposition, must be considered by
policy makers.
Although Iran has the second largest reserves of natural gas and the fourth
largest crude oil resources in the world, it faces great challenges in securing the energy
sector. In spite of the huge amount of petroleum income in the past decades, the present
policy not only seriously affects the country’s economic independence, but has also
resulted in less development in other income sectors. The high dependency on crude oil
exports, abnormal growth in energy consumption with low efficient in all sectors are
other threats to the energy security in the country. Another Iranian energy security threat
is low extraction share in common oil and gas resources in comparison with its
neighborhoods. Not using these resources and funding other energy alternatives will not
fulfill the aim of keeping these resources for future generations. Another major energy
security threats such as political conflict and high energy squander described in the
thesis. These all show that Iran’s energy industry is unfavorable and this trend cannot
continue for long time. Although for increasing energy security, the government plans
to increase power plant diversity by using new types such as nuclear, coal and more
renewable energies, the most important action is to reform the inefficient oil and gas
consumption in all sectors, especially in nonproductive sectors such as domestic.
Therefore, adopting a comprehensive policy package in the short-, medium- and long-
term is essential for achieving a stable and sustainable energy supply in the future.

114
In the next step, the electricity price generated in different types of power plant
is calculated. The calculation has been done based on major costs including capital cost,
operation and maintenance and fuel cost for Iranian situations such as local fuel price,
interest rate and capacity factors. The results show that the best base-load power plants
are combined cycle, steam turbine, geothermal, coal-fired and nuclear respectively. For
peak-load power plants, the foremost types are gas turbine and hydropower. The results
also show that in the current circumstances, nuclear power does not generate cheap
electricity for Iran. The price might be comparable in the future if Iran connected to the
international natural gas market, decreased the country’s inflation rate, achieved better
international cooperation and solved the obstacles presented by sanctions.
The final objective of the thesis was to investigate the effect of NPP construction
on energy sustainability in Iran. Nowadays there is a serious conflict between Iranian
government and UNSC and the West about the country’s nuclear activities, which
caused applying heavy sanctions. So the country’s atmosphere is not normal to make a
decision about this technology only based on the scientifically analyses or even in the
view of the public opinion. Although in many countries economic analysis or even
public opinion have the major weights for making decision, in Iran other factors
especially political have higher influence on this issue now. If this situation changed,
researchers can do some more researches including finding public opinions around
nuclear safety and also environmental risk of this type of power plant and the results can
be added to other analyses have been done in this thesis. For more accurate economic
analyses, an advance methodology including many other factors, must be taken into
account. The factors such as financial parameter’s variation, quantifying emission’s
costs and non-tangible parameters like risk of radioactive radiation and environmental
threats. Iran’s situation is different from most countries, and, therefore, its energy
sustainability strategies and road map should be geared accordingly. For example, to
115
answer the around 10% annual increase in electricity consumption, neither nuclear nor
fossil fuel based power plants can meet these needs. Fortunately, Iran has a great
potential for energy conservation to control and answer the demand. Decreasing 22% of
electricity loss and increasing the efficiency of power plants by 34% are two high
priority actions that can be done. At this time, nuclear energy cannot solve the country’s
energy structure weakness, and, furthermore, causes more difficulty for energy security
by the increase in lateral costs, as well as the lack of financial funding and international
cooperation in other energy sectors. Moreover, choosing to invest heavily in nuclear
technology instead of accelerating the development of Iran’s valuable oil and gas
resources has led to the limited ability to produce oil and gas, and refining of petroleum
products.
In conclusion, nuclear energy is useful for diversifying the types of power plant
and presents some lateral benefits to industry, medicine and agriculture. It may help the
energy security in many countries by enabling them to be independent or less dependent
on foreign fossil fuels. Nuclear development may also be economically attractive for
generating cheap electricity in certain countries that are financially stable, have a low
discount rate, high energy demand growth, scarce alternative sources, and where there is
a priority for energy supply security or compulsive regulation to the greenhouse gas
reduction. Iran has rich oil and gas reserves and there is not concern about energy
supply to require the use of nuclear energy to decrease such concerns. For Iran, even if
it's nuclear activities assumed peaceful, nuclear electricity, because of direct access to
low-cost fossil fuels is not cost competitive. Not only because there are other types of
electricity generators that are cheaper but also because of the lack of attention and
investment in the urgent and important actions required for energy sustainability. In
terms of energy sustainability and security in Iran, there are high opportunities for
energy security and many more effective and cost efficient ways than increasing

116
extraction from non-renewable resources or development of nuclear power plants.
Although the government’s effort to keep the country’s right for uranium enrichment is
appreciable, the construction of more nuclear power plants in Iran is not recommended,
and concentration on other alternatives will create greater energy security, job potential,
environmental and economic benefits, and maintain resources for the future as well as
engender political stability. Some high priority energy policies for Iran’s energy
sustainability are suggested below. These suggestions have even higher priority than
developing renewable energy sources which is usually suggested.
Diversifying the economy by developing other income sectors such as industry,
tourism, and agriculture.
Development of petroleum products and LNG technology to be replaced with crude
oil exports and expand country’s energy market.
Pay more attention to extraction of oil and natural gas from common resources.
Applying energy efficiency policies in all sectors to decrease high energy wastage.
Decreasing 20% transmission and distribution network losses.
Developing mechanisms for conserving energy such as unused flared gases.
Decreasing tension in international relations and increasing two-way collaboration.
Reduction in the share of coal-fired power plants as the worst fossil fuel based
power plant in term of emission or using techniques to diminish the harmful effects
of coal consumption.
Use of more combined cycles for higher efficiency in thermal power plants.
Substitution of liquid fuels with natural gas as a major fuel and arrange its supply to
most thermal power plants throughout the year.
117
Bibliography
AEOI. (2009). Some necessities of nuclear power plants for Iran. Retrieved 20 Dec
2010, from
http://www.aeoi.org.ir/Portal/Home/ShowPage.aspx?Object=Event&CategoryID
=abb810e6-37fa-47b2-821b-8eae0c8c1f8c&LayoutID=6b70c2a1-4197-410a-
a296-c6393e10a48e&ID=f278dc6a-8b19-4b54-8a89-74ca78ceba5f [In Persian]
Ameri, M., Ghadiri, M., & Hosseini, M. (2006). Recent Advances in the Implementation
of Wind Energy in Iran. Paper presented at the The 2nd Joint International
Conference on “Sustainable Energy and Environment (SEE 2006)".
Ardekani, A. T., & Ghofrani, M. B. (2007). Economical competitiveness of nuclear
power plants in Iran. Paper presented at the 22nd international power system
conference.
AsrIran. (2011a). akistan does not buy Iranian natural gas., from
http://www.asriran.com/fa/news/187218 [in Persian]
AsrIran. (2011b). The need for vigilance on credit oil sales to India. from
http://www.asriran.com/fa/news/171132 [In Persian]
Bianco, V., Manca, O., & Nardini, S. (2009). Electricity consumption forecasting in
Italy using linear regression models. Energy, 34(9), 1413-1421.
Bina, C. (2009). Petroleum and energy policy in Iran.
Blakburn, J. O., & Cunningham, S. (2010). Solar and nuclear cost - The historic
crossover
Campaign Against Sanctions and Military Intervention in Iran. (2010). Iran-US
Standoff: The Fact Sheets.
Center for Environment and Energy Research and Studies. (2005). Climate policy and
sustainable development: opportunities for Iranian – German cooperation. Case
study: solar thermal energy in Iran.
Central Bank of Iran. (2010). Annual review 2009/10.
CNN. (2010). Fuel prices in Iran rose as latest subsidy reforms began. Retrieved 23
Dec 2010, from
http://www.cnn.com/2010/WORLD/meast/12/20/iran.subsidies/index.html

118
de Carvalho, J. F., & Sauer, I. L. (2009). Does Brazil need new nuclear power plants?
Energy Policy, 37(4), 1580-1584.
Dehqan, S. (2010, 5 Sep 2010). Iran among top power plant manufacturers. Iran-Daily.
EIIP. (2001). Emission Inventory Improvement Program - Introduction to stationary
point source emissions inventory development. Morrisville, North Carolina:
Eastern Research Group, Inc. for the US Environmental Protection Agency.
El-Genk, M. S. (2008). On the introduction of nuclear power in Middle East countries:
Promise, strategies, vision and challenges. Energy Conversion and Management,
49(10), 2618-2628.
Energy Information Administration. (2009). International energy outlook 2008.
Washington, DC.
Energy Information Administration. (2010a). Average capacity factors by energy
source. Retrieved 25 Aug 2010, from
http://www.eia.doe.gov/cneaf/electricity/epa/epata6.html
Energy Information Administration. (2010b). Iran energy data, statistics and analysis -
oil, gas, electricity, coal.
Energy Information Administration. (2011). World crude oil production, 1960-2009.
Retrieved 10 Jan 2011, from http://www.eia.doe.gov/aer/txt/ptb1105.html
EPA. (2002). Documentation for The EPA Modeling Applications Washington, DC: US
Environmental Protection Agency (Clean Air Markets Division).
Fadai, D. (2007). Utilization of renewable energy sources for power generation in Iran.
Renewable and Sustainable Energy Reviews, 11(1), 173-181.
Fleming, D. (2007). The lean guide to nuclear energy. A life-cycle in trouble. London:
The lean economy connection.
General Electric Company. (2009). H System Power Island Retrieved 16.6.2009, from
http://www.ge-
energy.com/prod_serv/products/gas_turbines_cc/en/h_system/index.htm
Gharib, M., Yaghooti, A., & Buygi, M. O. (2011). Efficiency Upgrade in PWRs.
Energy and Power Engineering, 3, 533-536.

119
Ghiaseddin, M., & Bazargan, N. (2001). Air Pollution Emitted from Fossil Fuel Power
Plants. Tehran: Niroo Research Institute.
Ghobadian, B., Najafi, G., Rahimi, H., & Yusaf, T. F. (2009). Future of renewable
energies in Iran. Renewable and Sustainable Energy Reviews, 13(3), 689-695.
Ghorashi, A. H. (2007). Prospects of nuclear power plants for sustainable energy
development in Islamic Republic of Iran. Energy Policy, 35(3), 1643-1647.
Gnansounou, E., Dong, J., & Bedniaguine, D. (2004). The strategic technology options
for mitigating CO2 emissions in power sector: assessment of Shanghai
electricity-generating system. Ecological Economics, 50(1-2), 117-133.
GWEC. (2006). Global wind report.
Hamed, B. (2011). The prospective environmental impacts of Iran nuclear energy
expansion. Energy Policy, 39(10), 6351-6359.
Hessari, F. A. (2005). Sectoral energy consumption in Iran. Renewable and Sustainable
Energy Reviews, 9(2), 203-214.
Holttinen, H., & Tuhkanen, S. (2004). The effect of wind power on CO2 abatement in
the Nordic Countries. Energy Policy, 32(14), 1639-1652.
Hosseini, R., Soltani, M., & Valizadeh, G. (2005). Technical and economic assessment
of the integrated solar combined cycle power plants in Iran. Renewable Energy,
30(10), 1541-1555.
IAEA. (2009). Country nuclear power profiles; Iran.
IEA. (2008). Keyword Energy Statistics. Paris.
Institute for International Energy Studies. (2011). Iran's hydrocarbons energy balance
2009.
International Atomic Energy Agency. (2007). Energy, electricity and nuclear power:
developments and projections - 25 years past and future. Vienna.
International Atomic Energy Agency. (2010). The status of nuclear power plants.
Retrieved 2 Apr 2010, from http://www.iaea.or.at/programmes/a2/
International Energy Agency. (2005). Projected costs of generating electricity

120
International Energy Agency (IEA). (2010). Key world energy statistics 2009. Paris.
International Energy Outlook 2002 with projection to 2020. (December 2001). Energy
Information Administration – Office of Integrated Analysis and forecasting –US
Department of Energy, . Washington DC.
International Monetary Fund. (2012). Regional Economic Outlook, Middle East and
Central Asia Department. Washington, D.C.
Iran water & power resources developement Co. (2009). Process of study, execution
and operation projects. Retrieved 1 Apr 2010, from
http://en.iwpco.ir/Gains.aspx
Iranian Students' News Agency. (2010). Conservation of 20 million barrels oil by
optimizing in oil and gas refineries. Retrieved 11 Nov 2012, from
http://old.isna.ir/ISNA/NewsView.aspx?ID=News-1683502 [in Persian]
ISCA Agency. (2009). Development of nuclear power plants is the major goal of Iran.
Retrieved 1 Mar 2010, from
http://iscanews.ir/fa/ShowNewsItem.aspx?NewsItemID=265315 [in Persian]
Kanoglu, M., KazIm IsIk, S., & Abusoglu, A. (2005). Performance characteristics of a
Diesel engine power plant. Energy Conversion and Management, 46(11-12),
1692-1702.
Karbassi, A. R., Abduli, M. A., & Mahin Abdollahzadeh, E. (2007). Sustainability of
energy production and use in Iran. Energy Policy, 35(10), 5171-5180.
Karbassi, A. R., & Shafizadeh, M. A. (2005). Energy efficiency indicators in developed
and developing countries. Iranian Journal of Energy, 23, 18-30.
Katoozian. (2011). Russia charged Iran more than 50%. Retrieved 25/09/2011, 2011,
from http://www.khabaronline.ir/news-132662.aspx
Khabaronline.ir. (2011). Enhanced Oil Recovery in Iran is 24%. Retrieved 10 Mar
2011, from http://www.khabaronline.ir/news-44761.aspx [In Persian]
Khosroshahi, K. A., Jadid, S., & Shahidehpour, M. (2009). Electric Power Restructuring
in Iran: Achievements and Challenges. The Electricity Journal, 22(2), 74-83.
Klienbaum, Kupper, Nizam, & Muller. (1998). Applied regression analysis and other
multivariable methods. (4th ed.). USA: Thomson Higher Education.

121
Lavizeh, F. (2002). General report on geothermal and related fields in Iran Tehran:
Geological survey of Iran.
Lior, N., & Chair, P. (2007). Brief summary of the ECOS '05 panel on "future power
generation". Energy, 32(4), 254-260.
Mahlia, T. M. I. (2002). Emissions from electricity generation in Malaysia. Renewable
Energy, 27(2), 293-300.
Maruyama, N., & Eckelman, M. J. (2009). Long-term trends of electric efficiencies in
electricity generation in developing countries. Energy Policy, 37(5), 1678-1686.
Massachusetts Institute of Technology. (2009). Update on the cost of nuclear power:
Center for energy and environmental policy research.
Mehdi, M. (2011). Heavy duty gas turbines in Iran, India and China: Do national energy
policies drive the industries? Energy Policy(0).
MehrNews Agency. (2008). Extraction and exploitation all hydrp-power capacity.
Retrieved 1 Mar 2010, from
http://www.mehrnews.com/fa/newsdetail.aspx?NewsID=805443 [in Persian]
MehrNews Agency. (2009). 2.5 times increase in fuel production capacity at Natanz
with new centrifuges Retrieved 1 Aug 2010, from
http://www.mehrnews.com/fa/NewsDetail.aspx?NewsID=857500 [in Persian]
MehrNews Agency. (2011). 28 common oil and gas resources with arabian countries.
2012, from http://www.mehrnews.com/fa/newsdetail.aspx?NewsID=1360901
[in Persian]
Ministry of Energy. (1979 - 2007). Electric Power in Iran. Tehran: Information
Resources Management and Statistics Bureau.
Ministry of Energy. (2008a). Energy in Iran 2006.
Ministry of Energy. (2008b). Energy in Iran,2006. Tehran: Power and energy planning
department, Deputy for energy and electricity affairs.
Ministry of Energy. (2009a). Development of coal-fired power plants. Retrieved 1 Aug
2010, from http://news.moe.org.ir/vdcf.cdciw6dyegiaw.html [In Persian]
Ministry of Energy. (2009b). Formal Statistics of Iranian Electricity Industry in 1387.
Retrieved from http://amar.tavanir.org.ir/latin/.
122
Ministry of Energy. (2009c). Iranian energy balance sheet, yearbook 1387(2008).
Tehran.
Ministry of Energy. (2011). Iran energy balance 2009.
Ministry of Energy. (2012). Iran energy balance in 2010.
Ministry of Energy News Agency. (2010). Renewable sources to account for 3% of the
country’s electricity generation. Retrieved 22 Aug 2010, from
http://news.moe.org.ir/vdcaaon6.49nou1gtk4.html
Mohammadi, B. (2011). Analyze of the trend of annual precipitation of Iran. Geography
and Environmental Planning, 43(3), 12.
Mostafaeipour, A., & Mostafaeipour, N. (2009). Renewable energy issues and
electricity production in Middle East compared with Iran. Renewable and
Sustainable Energy Reviews, 13(6-7), 1641-1645.
Murphy, D. (2007, November 1, 2007). Middle East racing to nuclear power. Christian
Science Monitor. Retrieved from http://www.csmonitor.com/2007/1101/p01s03-
wome.html
Najibi, H., Rezaei, R., Javanmardi, J., Nasrifar, K., & Moshfeghian, M. (2009a).
Economic evaluation of natural gas transportation from Iran's South-Pars gas
field to market. Applied Thermal Engineering, 29(10), 2009-2015.
Najibi, H., Rezaei, R., Javanmardi, J., Nasrifar, K., & Moshfeghian, M. (2009b).
Economic evaluation of natural gas transportation from Iran’s South-Pars gas
field to market. Applied Thermal Engineering, 29(10), 2009-2015.
Nakata, T. (2004). Energy-economic models and the environment. Progress in Energy
and Combustion Science, 30(4), 417-475.
National Climate Change Office. (2003). Climate change in Iran.
National renewable energy laboratory. (2010). Simple levelized cost of energy (LCOE);
Calculator documentation. (22 Nov 2010). Retrieved from
http://www.nrel.gov/analysis/lcoe_documentation.html
Nazari, S., Shahhoseini, O., Sohrabi-Kashani, A., Davari, S., Paydar, R., & Delavar-
Moghadam, Z. (2010). Experimental determination and analysis of CO2, SO2
and NOx emission factors in Iran's thermal power plants. Energy, 35(7), 2992-
2998.

123
Nguyen, N. T., & Ha-Duong, M. (2009). Economic potential of renewable energy in
Vietnam's power sector. Energy Policy, 37(5), 1601-1613.
Niroo Research Institute. (2008). Annual Research Report 2006-2007. Tehran.
Noorollahi, Y., Yousefi, H., Itoi, R., & Ehara, S. (2009). Geothermal energy resources
and development in Iran. Renewable and Sustainable Energy Reviews, 13(5),
1127-1132.
Nuclear Threat Initiative. (2010). Iran nuclear sites. Retrieved 27 Dec 2010, from
http://www.nti.org/e_research/profiles_pdfs/Iran/iran_nuclear_sites.pdf
Oh, T. H., & Chua, S. C. (2010). Energy efficiency and carbon trading potential in
Malaysia. Renewable and Sustainable Energy Reviews, 14(7), 2095-2103.
OPEC. (2010). Annual statistical bulletin 2009. Vienna.
OPEC. (2011). Annual statistical bulletin 2010/2011. Vienna.
PENN. (2008). Share of electricity produced from renewable sources in 2009.
Retrieved 1 Mar 2010, from http://www.irpetro.com/newsdetail-609-fa.html [in
Persian]
Perkins, R. (2005). Electricity sector restructuring in India: an environmentally
beneficial policy? Energy Policy, 33(4), 439-449.
Qodsdaily. (2011, 3/7/2011). 3.5% increase in wasted flared gases in 2010 Qodsdaily, p.
3.
Rasad online. (2011). Common resources between Iran and Arab Countries. from
http://www.rasadonline.com/view-6739.html [In Persian]
REN21. (2007). Global Status Report. Retrieved 10/09/2009, from www.ren21.net
Renewable Energy Organization of Iran. (2010). Wind atlas map of Iran. Retrieved 26
May 2010, from http://www.suna.org.ir/ationoffice-windenergyoffice-
windatlasmap-fa.html
Research Institute of Petroleum Industry. (2008). Designing the first industrial unit aids
deep desulphurization from diesel oil by UDHDS technology. Retrieved 20
July 2009, from http://pananews.ir/print/?id=94 [In Persian]
124
Reuters. (2010). Namibian uranium mine mulls action on Iran's stake. Retrieved 24
Dec 2010, from http://www.reuters.com/article/idUSN1810113720101018
Reuters. (2011). SArabia to sell India oil after Iran cuts supply. The Nation, from
http://www.nation.com.pk/pakistan-news-newspaper-daily-english-
online/Business/27-Jul-2011/SArabia-to-sell-India-oil-after-Iran-cuts-supply
Romeo, L. M., Calvo, E., Valero, A., & De Vita, A. (2009). Electricity consumption and
CO2 capture potential in Spain. Energy, 34(9), 1341-1350.
Sabetghadam, M. (2006). Energy and sustainable development in Iran: Helio
International - Sustainable Energy Watch.
Schwartz, P. (1996). The art of the long view: Planning in an uncertain world, . New
York: Doubleday.
Shafie-pour. (2004). Environmental energy review in Iran.: Iranian department of
environment, Final report text, and annex.
Smith, B. (2010). Iran’s nuclear programme, and sanctions
Squalli, J. (2007). Electricity consumption and economic growth: Bounds and causality
analyses of OPEC members. Energy Economics, 29(6), 1192-1205.
Statistical Centre of Iran. (2006). Population and Manpower. Retrieved 16.3.2009,
from http://www.amar.org.ir
Statistical Centre of Iran. (2012). Population and manpower census in 2011. Retrieved
13.11.2012, from http://www.amar.org.ir
Steenhof, P. A., & Fulton, W. (2007). Factors affecting electricity generation in China:
current situation and prospects. Technological Forecasting and Social Change,
74(5), 663-681.
SUNA. (2009). New energy source organization - Renewable Energy Research and
Technology Bureau. Retrieved 19/7/2009, from
http://www.suna.org.ir/researchoffice-en.html
Supersberger, N. (2009). Energy systems in OPEC countries of the Middle East and
North Africa.
TAVANIR. (2008). Statistical Report on 41 Years of Activities of Iran Electric Power
Industry (1967 – 2007). Tehran.

125
TAVANIR. (2009a). Conversion gas turbine power plants to combined cycle Retrieved
01 Apr 2010, from http://news.tavanir.org.ir/press/press_detail.php?id=11619
[in Persian]
TAVANIR. (2009b). Fourth 5-year plan in electricity sector. Retrieved 1 Aug 2010,
from http://www.tavanir.org.ir/info/stat85/sanatfhtml/Future.htm [in Persian]
TAVANIR. (2010). Statistical reports on 43 years of activities of Iran electric power
industry (1967 - 2009). Tehran.
Terra daily. (2007). Tehran pollution kills 3,600. Retrieved 23 Dec 2010, from
http://www.terradaily.com/reports/Tehran_Pollution_Kills_3600_In_A_Month_
999.html
The Institute for Science and International Security. (2010). Nuclear Iran. Retrieved
Jan 2011, from http://www.isisnucleariran.org/
U.S. Environmental Protection Agency. (2010). Emissions Factors & AP 42, Volume I,
Fifth Edition. Retrieved May 24, 2010, from
http://www.epa.gov/ttn/chief/ap42/index.html
Wikipedia. (2010). Flue-gas desulfurization. Retrieved 10 Apr 2010, from
http://en.wikipedia.org/wiki/Flue-gas_desulfurization
Wood, D. (2007). Iran's strong case for nuclear power is obscured by UN sanctions and
geopolitics. Atoms for Peace: An International Journal, 1(4), 287.
Wood, T. W., Milazzo, M. D., Reichmuth, B. A., & Bedell, J. (2007). The economics of
energy independence for Iran. Nonproliferation Review, 14(1), 89.
World information service on energy. (2010). Uranium enrichment and fuel fabrication
- Current issues (Asia). Retrieved 25 Dec 2010, from http://www.wise-
uranium.org/epasi.html
World nuclear association. (2010a). Nuclear energy in Iran. Retrieved 1 jan 2011, from
http://www.world-nuclear.org/info/inf119_nucleariran.html
World Nuclear Association. (2010b). Nuclear energy in Iran. Retrieved May 2010,
from http://www.world-nuclear.org/info/inf119_nucleariran.html
Worldnews. (2010). Iran transfered fuel into its first nuclear power plant. Retrieved 21
Dec 2010, from

126
http://article.wn.com/view/2010/08/22/Iran_transfers_fuel_into_its_first_nuclear
_power_plant_u/
Yaghoubi, M., Azizian, K., & Kenary, A. (2003). Simulation of Shiraz solar power
plant for optimal assessment. Renewable Energy, 28(12), 1985-1998.
Zhang, Q., Weili, T., Yumei, W., & Yingxu, C. (2007). External costs from electricity
generation of China up to 2030 in energy and abatement scenarios. Energy
Policy, 35(8), 4295-4304.

127
Appendix A
Table A - 1. Nominal capacity (MW) for all types of power plants from 1967 to 2009
Year Steam
turbine
Gas turbine &
combined cycle
Diesel
engine
Hydro
power
Wind
energy
Total
1967 343 84 198 309 0 934
1968 351 98 250 309 0 1,008
1969 437 128 286 462 0 1,313
1970 434 135 310 517 0 1,396
1971 746 135 316 800 0 1,997
1972 746 172 372 804 0 2,094
1973 1,359 241 390 804 0 2,794
1974 1,587 410 414 804 0 3,215
1975 1,576 610 459 804 0 3,449
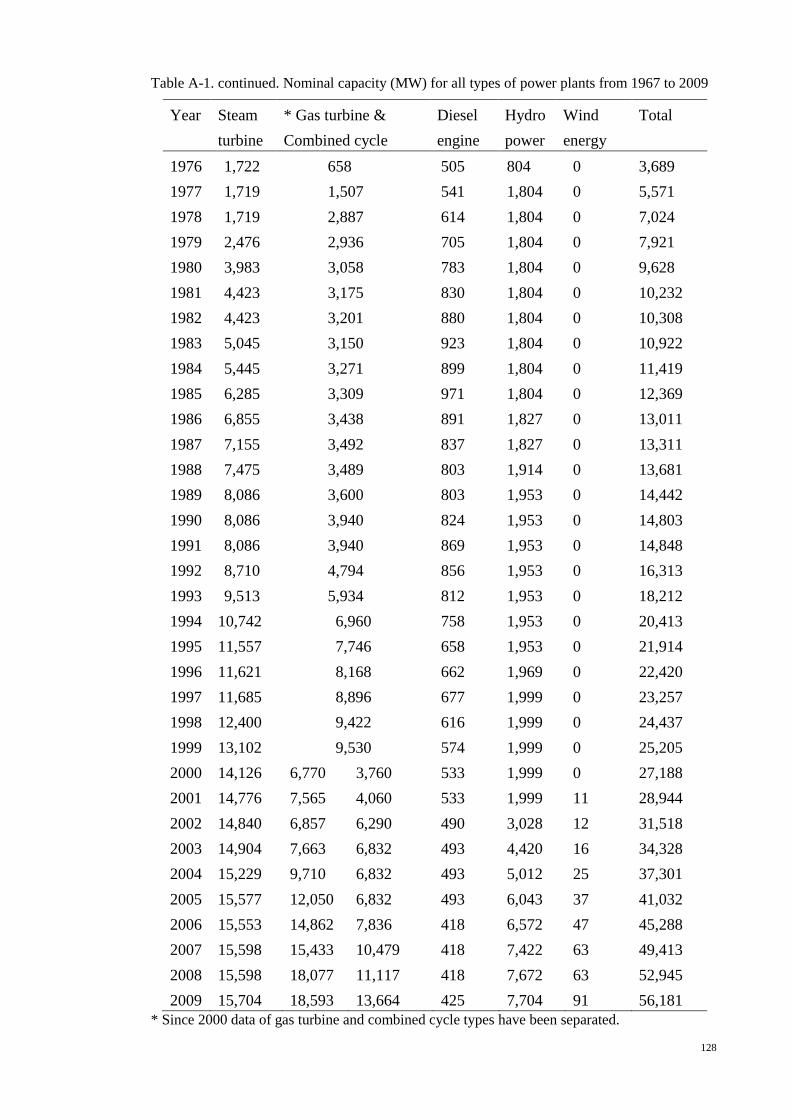
128
Table A-1. continued. Nominal capacity (MW) for all types of power plants from 1967 to 2009
Year Steam
turbine
* Gas turbine &
Combined cycle
Diesel
engine
Hydro
power
Wind
energy
Total
1976 1,722 658 505 804 0 3,689
1977 1,719 1,507 541 1,804 0 5,571
1978 1,719 2,887 614 1,804 0 7,024
1979 2,476 2,936 705 1,804 0 7,921
1980 3,983 3,058 783 1,804 0 9,628
1981 4,423 3,175 830 1,804 0 10,232
1982 4,423 3,201 880 1,804 0 10,308
1983 5,045 3,150 923 1,804 0 10,922
1984 5,445 3,271 899 1,804 0 11,419
1985 6,285 3,309 971 1,804 0 12,369
1986 6,855 3,438 891 1,827 0 13,011
1987 7,155 3,492 837 1,827 0 13,311
1988 7,475 3,489 803 1,914 0 13,681
1989 8,086 3,600 803 1,953 0 14,442
1990 8,086 3,940 824 1,953 0 14,803
1991 8,086 3,940 869 1,953 0 14,848
1992 8,710 4,794 856 1,953 0 16,313
1993 9,513 5,934 812 1,953 0 18,212
1994 10,742 6,960 758 1,953 0 20,413
1995 11,557 7,746 658 1,953 0 21,914
1996 11,621 8,168 662 1,969 0 22,420
1997 11,685 8,896 677 1,999 0 23,257
1998 12,400 9,422 616 1,999 0 24,437
1999 13,102 9,530 574 1,999 0 25,205
2000 14,126 6,770 3,760 533 1,999 0 27,188
2001 14,776 7,565 4,060 533 1,999 11 28,944
2002 14,840 6,857 6,290 490 3,028 12 31,518
2003 14,904 7,663 6,832 493 4,420 16 34,328
2004 15,229 9,710 6,832 493 5,012 25 37,301
2005 15,577 12,050 6,832 493 6,043 37 41,032
2006 15,553 14,862 7,836 418 6,572 47 45,288
2007 15,598 15,433 10,479 418 7,422 63 49,413
2008 15,598 18,077 11,117 418 7,672 63 52,945
2009 15,704 18,593 13,664 425 7,704 91 56,181
* Since 2000 data of gas turbine and combined cycle types have been separated.

129
Table A - 2. Electricity generation (GWh) for all types of power plants from 1967 to 2009
Year Steam
turbine
Gas turbine &
combined cycle
Diesel
engine
Hydro
power
Wind
energy
Total
1967 732 56 396 658 0 1,842
1968 1,088 77 411 855 0 2,431
1969 1,336 85 440 1,336 0 3,197
1970 1,978 155 452 1,671 0 4,256
1971 2,097 194 520 2,679 0 5,490
1972 2,513 265 564 3,528 0 6,870
1973 5,374 541 567 2,842 0 9,324
1974 6,545 688 511 3,421 0 11,165
1975 7,785 955 593 3,445 0 12,778
1976 8,455 1,122 659 3,975 0 14,211
1977 8,203 2,558 781 4,213 0 15,755
1978 6,316 3,928 893 6,249 0 17,386
1979 7,769 5,327 926 5,419 0 19,441
1980 8,197 5,088 976 5,620 0 19,881
1981 9,174 5,883 1,120 6,229 0 22,406
1982 12,562 6,141 1,173 6,447 0 26,323
1983 16,296 6,826 1,184 6,203 0 30,509
1984 18,309 8,780 1,255 5,750 0 34,094
1985 20,200 9,570 1,400 5,550 0 36,720
1986 22,860 7,160 1,508 7,517 0 39,045
1987 25,360 7,305 1,499 8,390 0 42,554
1988 26,968 8,146 1,350 7,311 0 43,775
1989 33,056 6,974 1,173 7,522 0 48,725
1990 38,836 8,723 1,254 6,083 0 54,896
1991 41,947 9,463 1,244 7,056 0 59,710
1992 42,362 10,866 1,224 9,530 0 63,982
1993 48,166 12,419 927 9,823 0 71,335
1994 53,376 15,402 863 7,445 0 77,086
1995 55,901 16,145 723 7,275 0 80,044
1996 62,364 15,475 610 7,376 0 85,825
1997 65,628 19,298 476 6,908 0 92,310
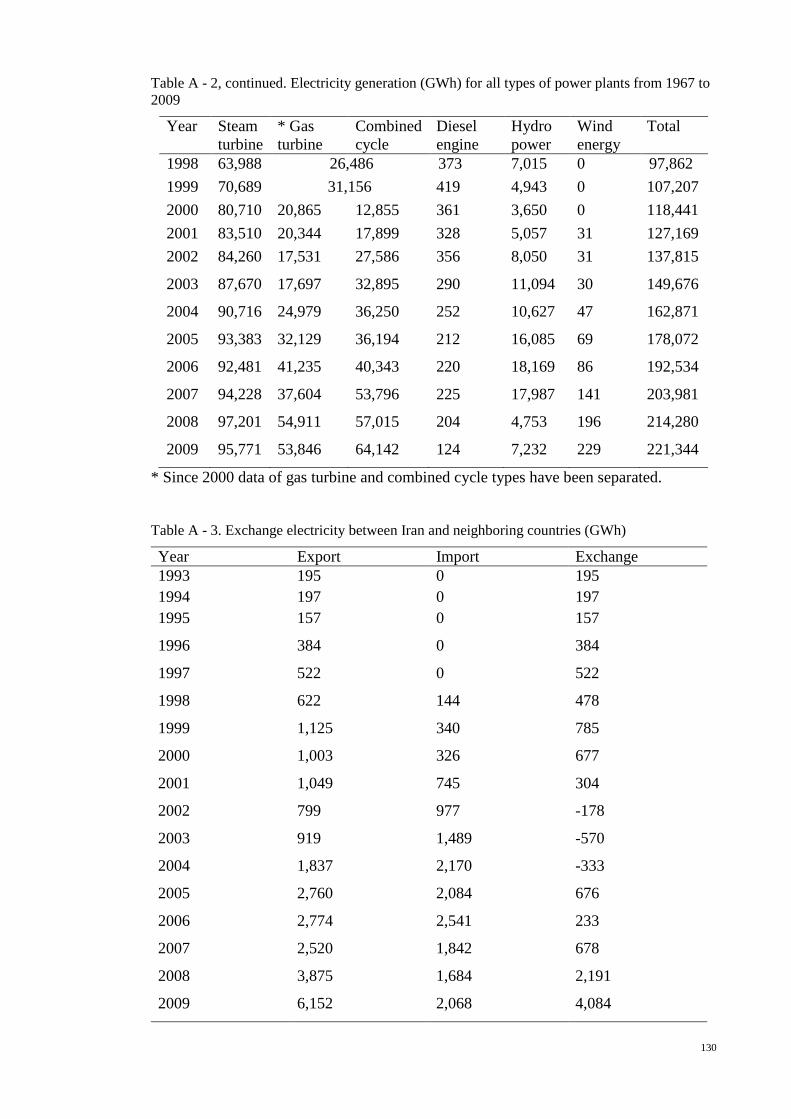
130
Table A - 2, continued. Electricity generation (GWh) for all types of power plants from 1967 to
2009
Year Steam
turbine
* Gas
turbine
Combined
cycle
Diesel
engine
Hydro
power
Wind
energy
Total
1998 63,988 26,486 373 7,015 0 97,862
1999 70,689 31,156 419 4,943 0 107,207
2000 80,710 20,865 12,855 361 3,650 0 118,441
2001 83,510 20,344 17,899 328 5,057 31 127,169
2002 84,260 17,531 27,586 356 8,050 31 137,815
2003 87,670 17,697 32,895 290 11,094 30 149,676
2004 90,716 24,979 36,250 252 10,627 47 162,871
2005 93,383 32,129 36,194 212 16,085 69 178,072
2006 92,481 41,235 40,343 220 18,169 86 192,534
2007 94,228 37,604 53,796 225 17,987 141 203,981
2008 97,201 54,911 57,015 204 4,753 196 214,280
2009 95,771 53,846 64,142 124 7,232 229 221,344
* Since 2000 data of gas turbine and combined cycle types have been separated.
Table A - 3. Exchange electricity between Iran and neighboring countries (GWh)
Year Export Import Exchange
1993 195 0 195
1994 197 0 197
1995 157 0 157
1996 384 0 384
1997 522 0 522
1998 622 144 478
1999 1,125 340 785
2000 1,003 326 677
2001 1,049 745 304
2002 799 977 -178
2003 919 1,489 -570
2004 1,837 2,170 -333
2005 2,760 2,084 676
2006 2,774 2,541 233
2007 2,520 1,842 678
2008 3,875 1,684 2,191
2009 6,152 2,068 4,084
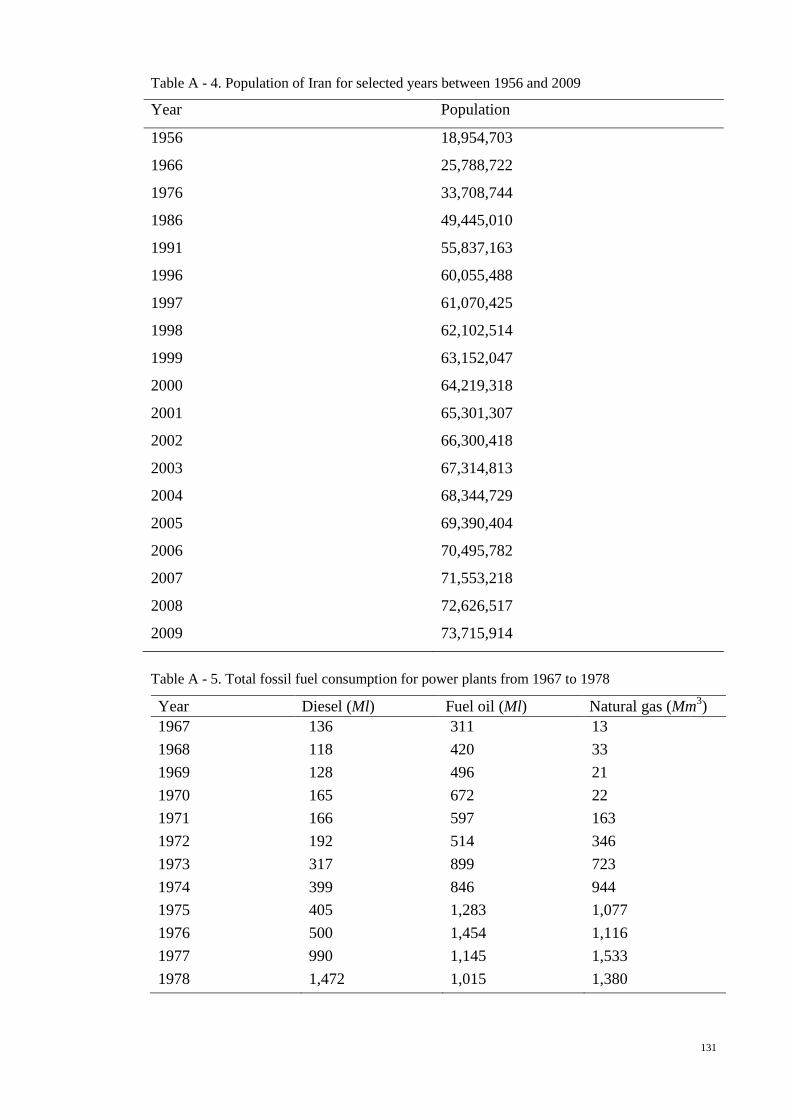
131
Table A - 4. Population of Iran for selected years between 1956 and 2009
Year Population
1956 18,954,703
1966 25,788,722
1976 33,708,744
1986 49,445,010
1991 55,837,163
1996 60,055,488
1997 61,070,425
1998 62,102,514
1999 63,152,047
2000 64,219,318
2001 65,301,307
2002 66,300,418
2003 67,314,813
2004 68,344,729
2005 69,390,404
2006 70,495,782
2007 71,553,218
2008 72,626,517
2009 73,715,914
Table A - 5. Total fossil fuel consumption for power plants from 1967 to 1978
Year Diesel (Ml) Fuel oil (Ml) Natural gas (Mm3)
1967 136 311 13
1968 118 420 33
1969 128 496 21
1970 165 672 22
1971 166 597 163
1972 192 514 346
1973 317 899 723
1974 399 846 944
1975 405 1,283 1,077
1976 500 1,454 1,116
1977 990 1,145 1,533
1978 1,472 1,015 1,380

132
Table A - 6. Composition of fuel consumption in power plants from 1979 to 1997
Year Fuel type Steam
turbine
Gas turbine &
combined cycle
Diesel
engine
Total
1979 Natural gas (Mm3) 1,130 1,205 - 2,335
Diesel (Ml) 27 1,097 273 1,398
Fuel oil (Ml) 1,058 - 4 1,064
1980 Natural gas (Mm3) 775 1,503 - 2,278
Diesel (Ml) 29 663 291 983
Fuel oil (Ml) 1,473 - - 1,473
1981 Natural gas (Mm3) 610 1,750 - 2,360
Diesel (Ml) 12 606 330 948
Fuel oil (Ml) 1,901 - - 1,901
1982 Natural gas (Mm3) 1,314 1,862 - 3,177
Diesel (Ml) 14 655 341 1,010
Fuel oil (Ml) 1,947 - - 1,947
1983 Natural gas (Mm3) 1,748 1,873 - 3,621
Diesel (Ml) 37 886 357 1,280
Fuel oil (Ml) 2,618 - - 2,618
1984 Natural gas (Mm3) 1,672 2,213 - 3,885
Diesel (Ml) 27 1,222 373 1,622
Fuel oil (Ml) 3,183 - - 3,183
1985 Natural gas (Mm3) 1,740 2,252 - 3,992
Diesel (Ml) 32 1,754 406 2,192
Fuel oil (Ml) 3,568 - - 3,568
1986 Natural gas (Mm3) 1,939 1,916 - 3,856
Diesel (Ml) 58 1,152 431 1,641
Fuel oil (Ml) 4,150 - - 4,150
1987 Natural gas (Mm3) 3,183 2,268 - 5,451
Diesel (Ml) 91 952 437 1,480
Fuel oil (Ml) 3,559 - - 3,559
1988 Natural gas (Mm3) 3,271 2,459 - 5,730
Diesel (Ml) 86 1,042 389 1,517
Fuel oil (Ml) 3,839 - - 3,839
1989 Natural gas (Mm3) 4,666 2,197 - 6,863
Diesel (Ml) 61 855 344 1,259
Fuel oil (Ml) 4,101 - - 4,101
1990 Natural gas (Mm3) 5,454 2,862 - 8,316
Diesel (Ml) 34 751 358 1,143
Fuel oil (Ml) 4,809 - - 4,809
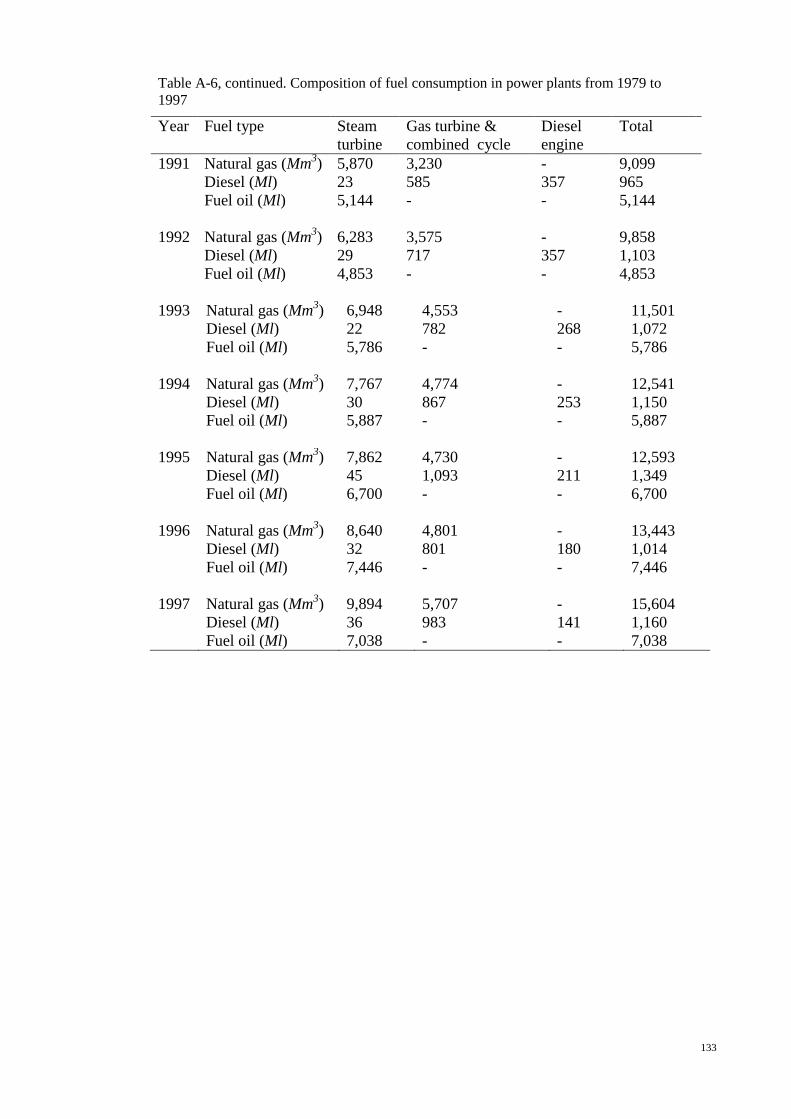
133
Table A-6, continued. Composition of fuel consumption in power plants from 1979 to
1997
Year Fuel type Steam
turbine
Gas turbine &
combined cycle
Diesel
engine
Total
1991 Natural gas (Mm3) 5,870 3,230 - 9,099
Diesel (Ml) 23 585 357 965
Fuel oil (Ml) 5,144 - - 5,144
1992 Natural gas (Mm3) 6,283 3,575 - 9,858
Diesel (Ml) 29 717 357 1,103
Fuel oil (Ml) 4,853 - - 4,853
1993 Natural gas (Mm3) 6,948 4,553 - 11,501
Diesel (Ml) 22 782 268 1,072
Fuel oil (Ml) 5,786 - - 5,786
1994 Natural gas (Mm3) 7,767 4,774 - 12,541
Diesel (Ml) 30 867 253 1,150
Fuel oil (Ml) 5,887 - - 5,887
1995 Natural gas (Mm3) 7,862 4,730 - 12,593
Diesel (Ml) 45 1,093 211 1,349
Fuel oil (Ml) 6,700 - - 6,700
1996 Natural gas (Mm3) 8,640 4,801 - 13,443
Diesel (Ml) 32 801 180 1,014
Fuel oil (Ml) 7,446 - - 7,446
1997 Natural gas (Mm3) 9,894 5,707 - 15,604
Diesel (Ml) 36 983 141 1,160
Fuel oil (Ml) 7,038 - - 7,038
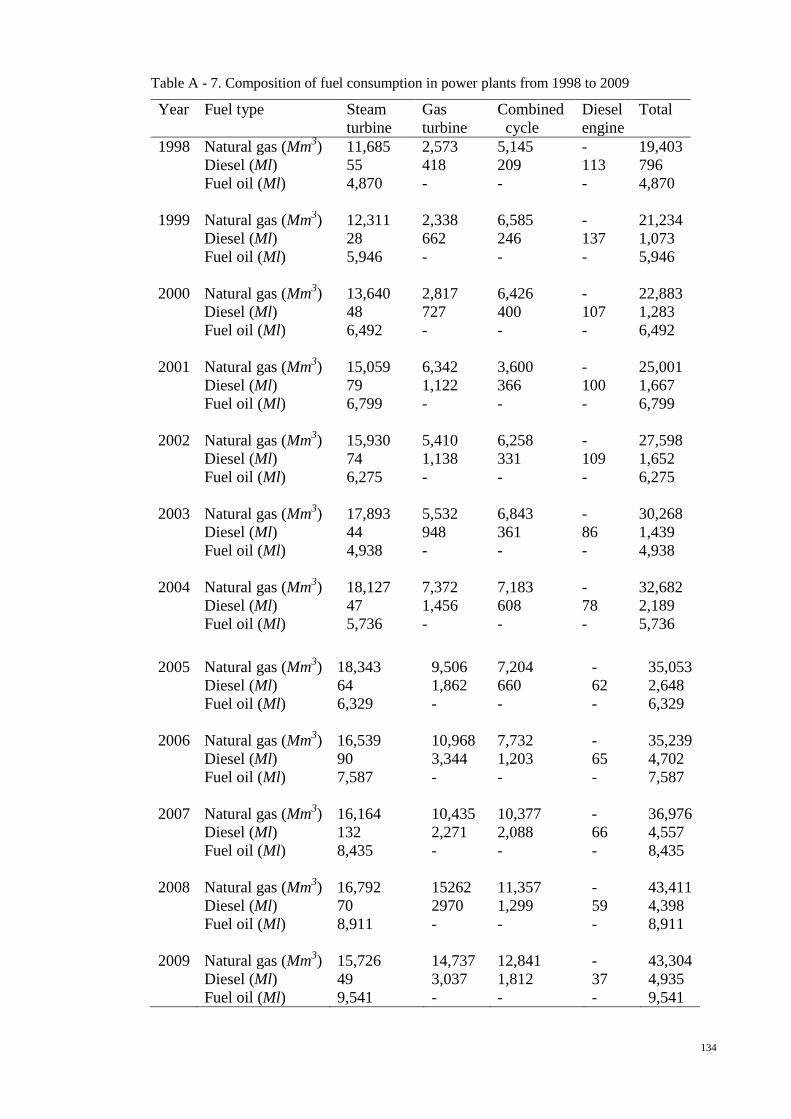
134
Table A - 7. Composition of fuel consumption in power plants from 1998 to 2009
Year Fuel type Steam
turbine
Gas
turbine
Combined
cycle
Diesel
engine
Total
1998 Natural gas (Mm3) 11,685 2,573 5,145 - 19,403
Diesel (Ml) 55 418 209 113 796
Fuel oil (Ml) 4,870 - - - 4,870
1999 Natural gas (Mm3) 12,311 2,338 6,585 - 21,234
Diesel (Ml) 28 662 246 137 1,073
Fuel oil (Ml) 5,946 - - - 5,946
2000 Natural gas (Mm3) 13,640 2,817 6,426 - 22,883
Diesel (Ml) 48 727 400 107 1,283
Fuel oil (Ml) 6,492 - - - 6,492
2001 Natural gas (Mm3) 15,059 6,342 3,600 - 25,001
Diesel (Ml) 79 1,122 366 100 1,667
Fuel oil (Ml) 6,799 - - - 6,799
2002 Natural gas (Mm3) 15,930 5,410 6,258 - 27,598
Diesel (Ml) 74 1,138 331 109 1,652
Fuel oil (Ml) 6,275 - - - 6,275
2003 Natural gas (Mm3) 17,893 5,532 6,843 - 30,268
Diesel (Ml) 44 948 361 86 1,439
Fuel oil (Ml) 4,938 - - - 4,938
2004 Natural gas (Mm3) 18,127 7,372 7,183 - 32,682
Diesel (Ml) 47 1,456 608 78 2,189
Fuel oil (Ml) 5,736 - - - 5,736
2005 Natural gas (Mm3) 18,343 9,506 7,204 - 35,053
Diesel (Ml) 64 1,862 660 62 2,648
Fuel oil (Ml) 6,329 - - - 6,329
2006 Natural gas (Mm3) 16,539 10,968 7,732 - 35,239
Diesel (Ml) 90 3,344 1,203 65 4,702
Fuel oil (Ml) 7,587 - - - 7,587
2007 Natural gas (Mm3) 16,164 10,435 10,377 - 36,976
Diesel (Ml) 132 2,271 2,088 66 4,557
Fuel oil (Ml) 8,435 - - - 8,435
2008 Natural gas (Mm3) 16,792 15262 11,357 - 43,411
Diesel (Ml) 70 2970 1,299 59 4,398
Fuel oil (Ml) 8,911 - - - 8,911
2009 Natural gas (Mm3) 15,726 14,737 12,841 - 43,304
Diesel (Ml) 49 3,037 1,812 37 4,935
Fuel oil (Ml) 9,541 - - - 9,541