Embed Size (px)
Citation preview
Electronic Chromatogram Review at Biogen Idec: Past, Present, ad Future Lilong Huang, Sarah Yuan, Doug Cecchini, and Andre Walker
ISPE Boston Area Chapter 20Jun2013

Outline
• Introduction
• Biogen Idec Multivariate Analysis Journey
• Case Studies
• Summary
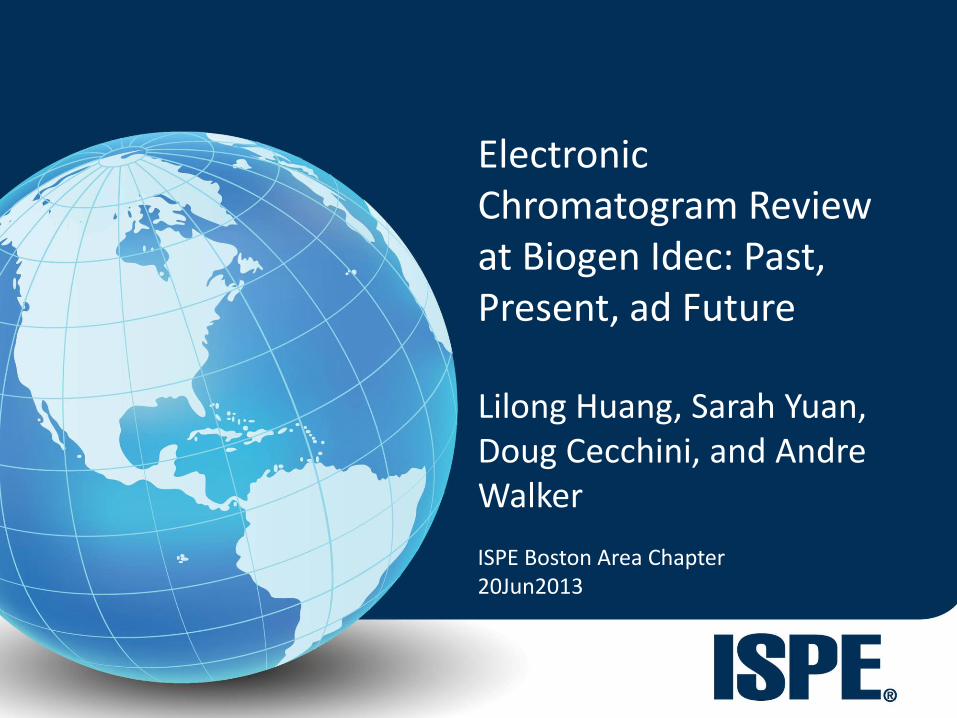
Inundata-ed
Temperature UV
VCD
pH Osmo
? ?
??
??
?? ? ?
?? ??
?? ??
Temperature
UV
VCD
pH
Osmo
? ? ??
??
??
? ?
??
?? ?? ??
DO
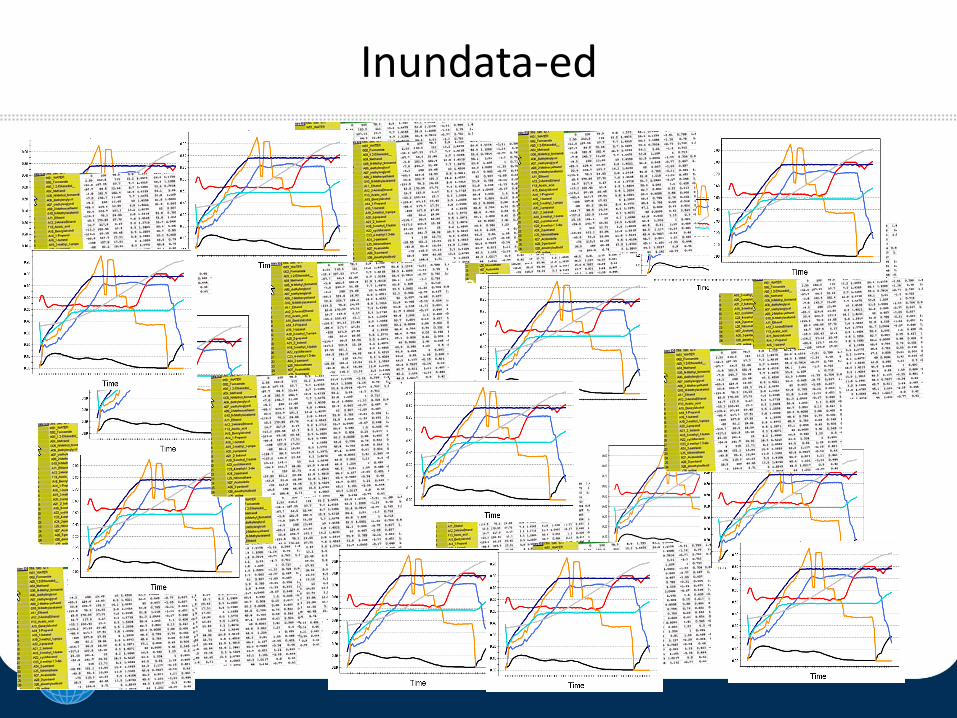
This Looks Better
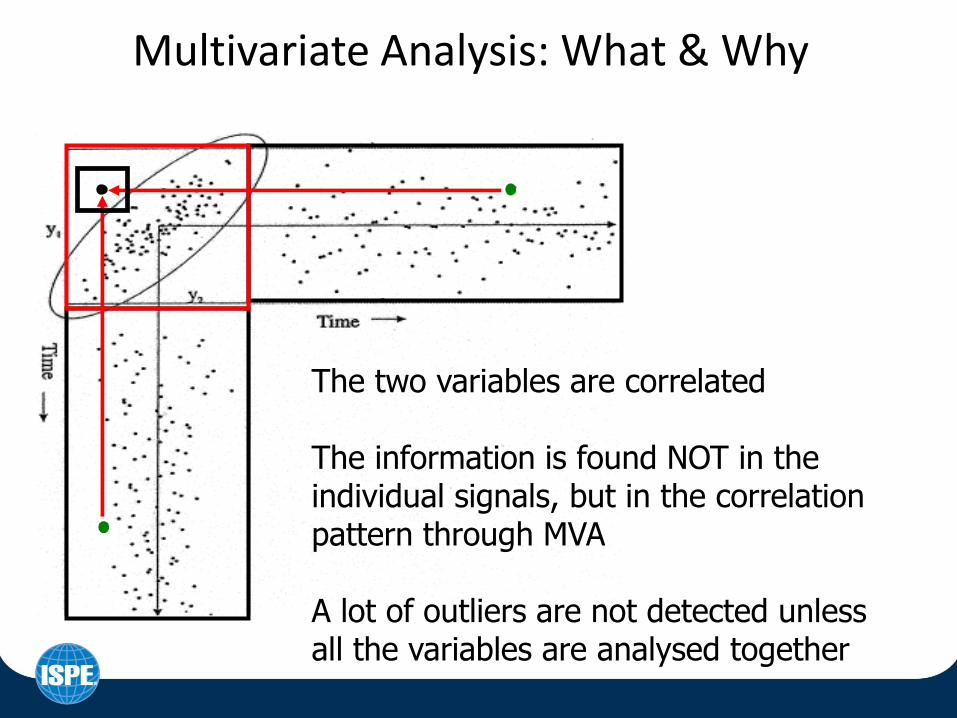
Multivariate Analysis: What & Why
The two variables are correlated The information is found NOT in the individual signals, but in the correlation pattern through MVA A lot of outliers are not detected unless all the variables are analysed together
Biogen Idec Advanced Process Control
• Established an infrastructure for data centralization and real time process monitoring
– Achieved full scale utilization of Disoverant and SBOL • 2003: 1st Discoverant Hierarchy & 1st Cell Culture SBOL
• 2006: SBOL on Manufacturing Floor
• 2007: 1st Purification SBOL model
• 2013: Approved patent on “Systems and Methods for Evaluating Chromatography Column Performance”, US008410928B2, 02Apr2013
• Built a culture of advanced process monitoring
– Shift Trend Review + Routine Trend Review

Centralized Data Management System
Batch Record
Bioreactor Purification. Drug
Substance Inoculation Raw Material
Data/Information
Flow
Material Flow
OPM LIMS
Interface
System allows user to
access data from any
system
Built-in analytics
provide for control
charts, Cpk analysis,
etc.
PI
Data Management System (Discoverant)
User
Drug
Product
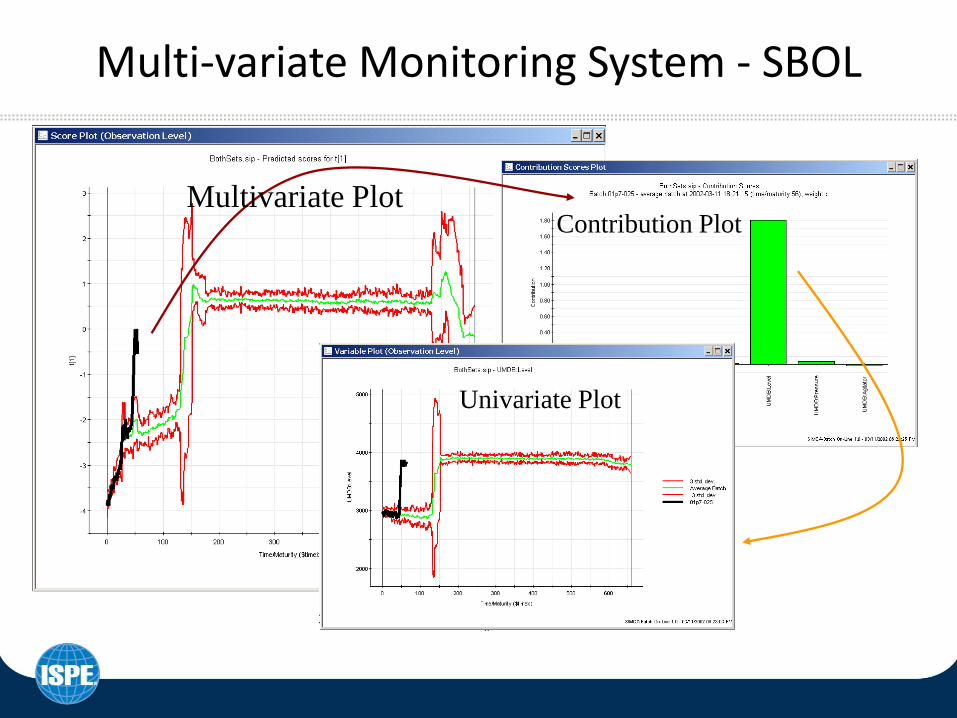
Multivariate Plot
Contribution Plot
Univariate Plot
Multivariate Plot
Multi-variate Monitoring System - SBOL
9
Multivariate Chromatogram Analysis
• Motivation
– Chromatograms contain a lot of information that we are not utilizing
– Exploit already available continuous data • UV, conductivity, pH, pressure, volumetric flow
• Goals
– Non-subjective, quantitative method for evaluating chromatograms
• Example: Analysis of elution peak UV tracing
– MVA model using discrete parameters that describe the characteristics of the elution UV peak
10
UV
0
0.1
0.2
0.3
0.4
0.5
0.6
0 200 400 600 800 1000 1200 1400 1600 1800 2000
UV
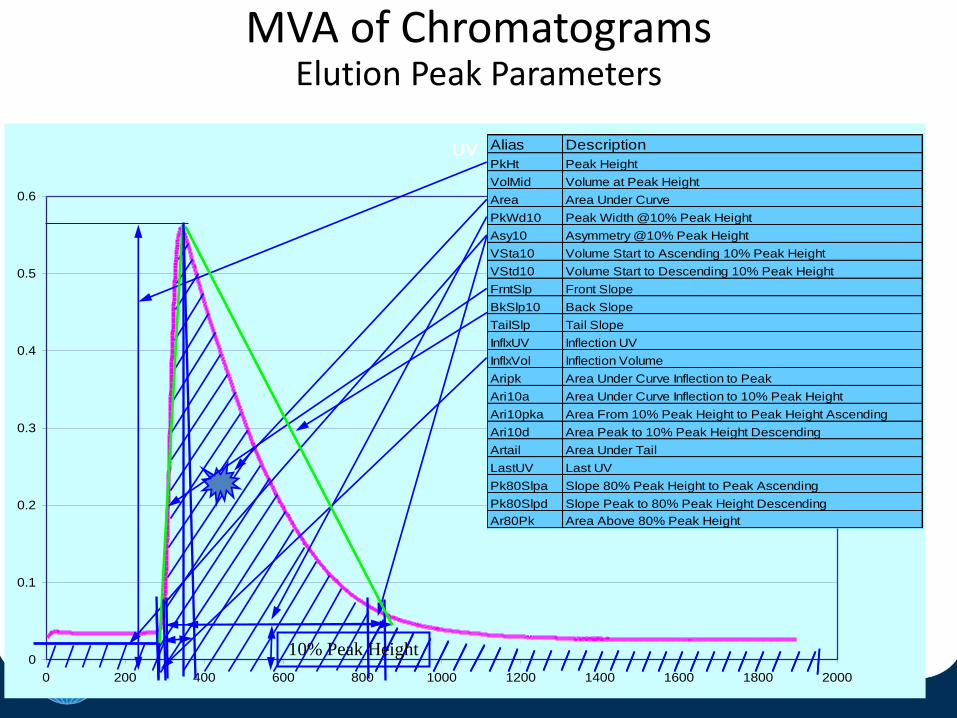
MVA of Chromatograms Elution Peak Parameters
10% Peak Height
Alias Description
PkHt Peak Height
VolMid Volume at Peak Height
Area Area Under Curve
PkWd10 Peak Width @10% Peak Height
Asy10 Asymmetry @10% Peak Height
VSta10 Volume Start to Ascending 10% Peak Height
VStd10 Volume Start to Descending 10% Peak Height
FrntSlp Front Slope
BkSlp10 Back Slope
TailSlp Tail Slope
InflxUV Inflection UV
InflxVol Inflection Volume
Aripk Area Under Curve Inflection to Peak
Ari10a Area Under Curve Inflection to 10% Peak Height
Ari10pka Area From 10% Peak Height to Peak Height Ascending
Ari10d Area Peak to 10% Peak Height Descending
Artail Area Under Tail
LastUV Last UV
Pk80Slpa Slope 80% Peak Height to Peak Ascending
Pk80Slpd Slope Peak to 80% Peak Height Descending
Ar80Pk Area Above 80% Peak Height
11
Case Study #1: AUP
• Area under peak (AUP) of elution UV peak was proposed as an alternative to quantify protein concentration
• Ratios of AUP to total offline A280 across manufacturing sites were shown to be different
• Investigation was Launched
– To understand root cause and harmonize practice
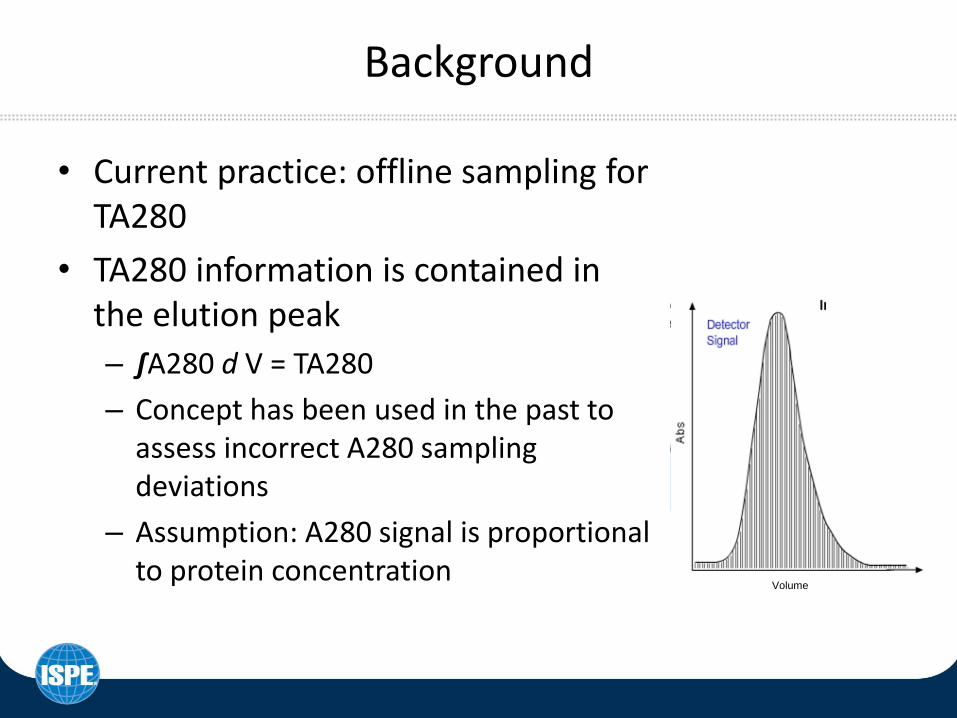
Background
• Current practice: offline sampling for TA280
• TA280 information is contained in the elution peak
– ∫A280 d V = TA280
– Concept has been used in the past to assess incorrect A280 sampling deviations
– Assumption: A280 signal is proportional to protein concentration
Volume
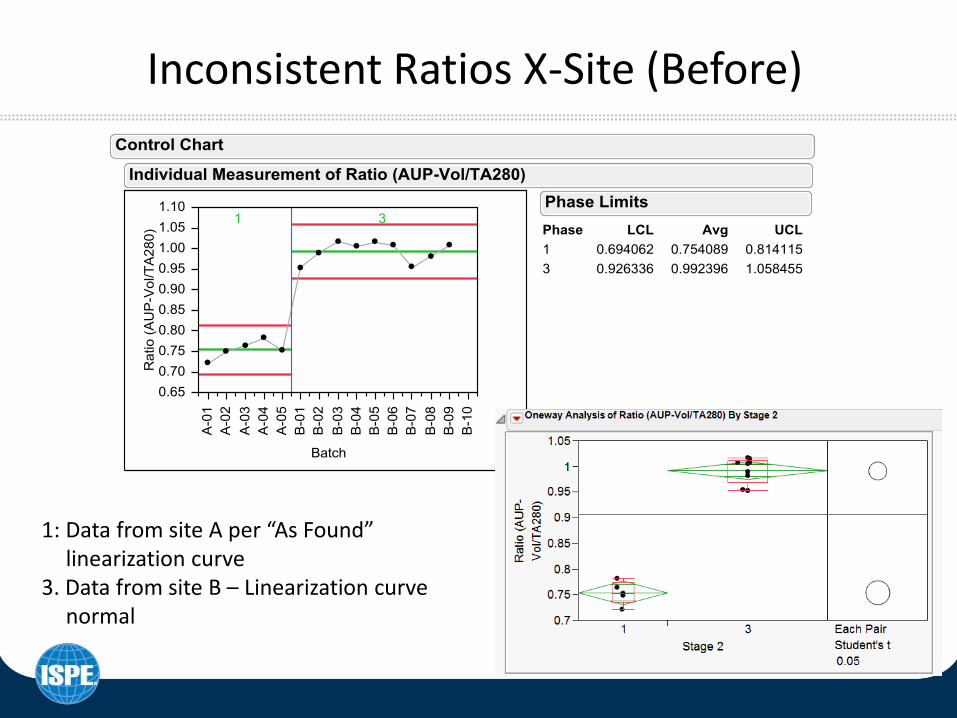
Inconsistent Ratios X-Site (Before)
1: Data from site A per “As Found” linearization curve
3. Data from site B – Linearization curve normal
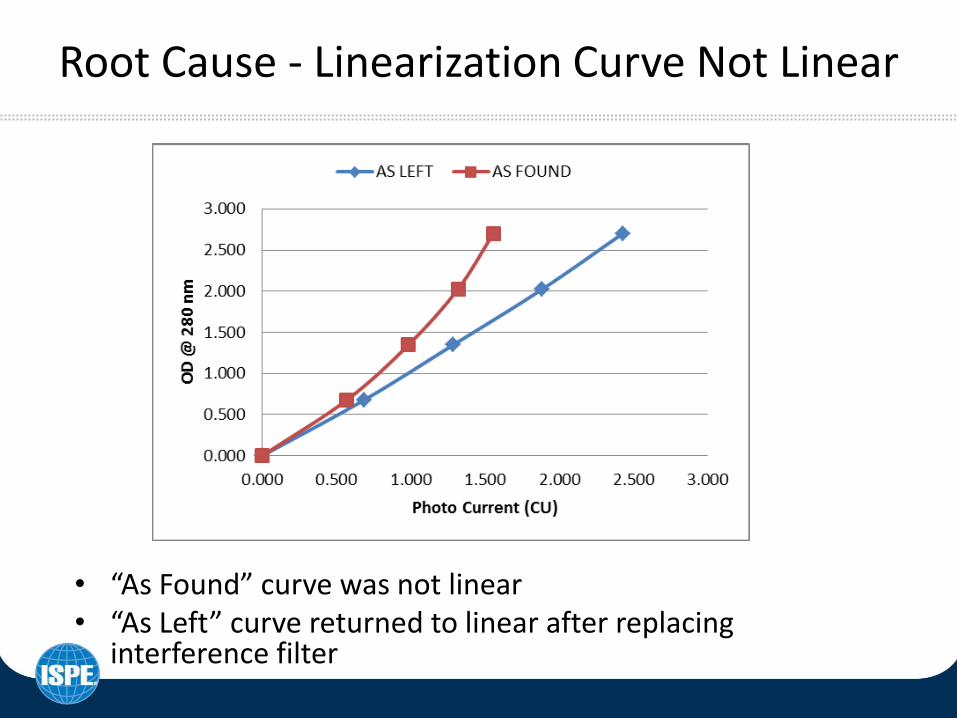
Root Cause - Linearization Curve Not Linear
• “As Found” curve was not linear • “As Left” curve returned to linear after replacing
interference filter
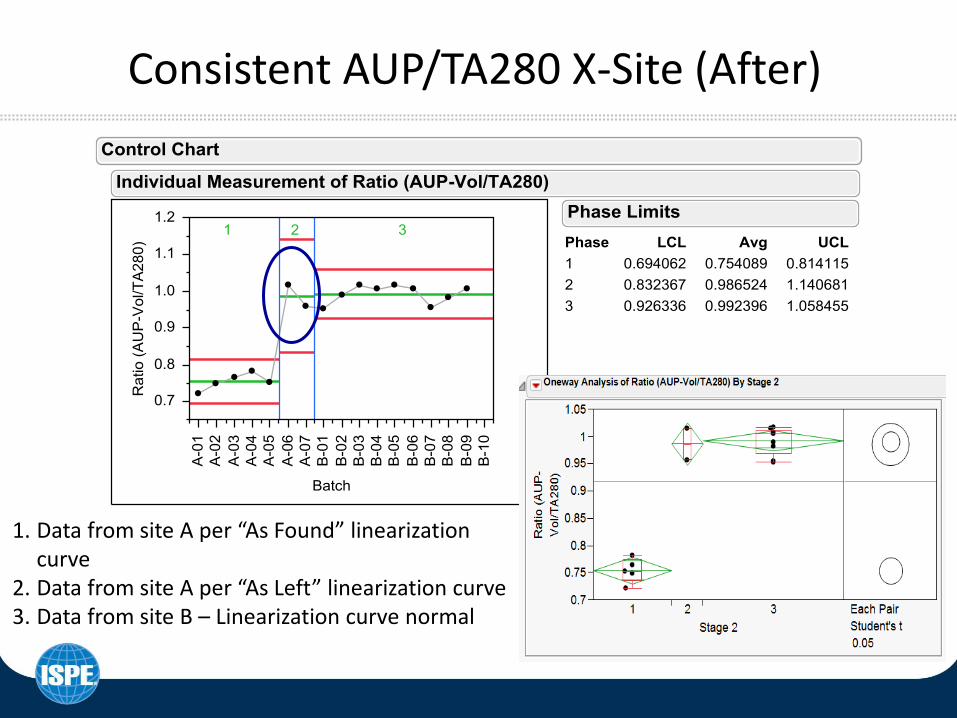
Consistent AUP/TA280 X-Site (After)
1. Data from site A per “As Found” linearization curve
2. Data from site A per “As Left” linearization curve 3. Data from site B – Linearization curve normal
Lessons Learned
• Area under peak of elution could add significant value to real time chromatography performance monitoring
• Question: Is UV representative of protein concentration?
• Answer: Correct linearization table is critical to UV meter performance and success of Chromatogram analysis (including AUP)
17
Case Study #2 – Elution UV Chromatogram Analysis
• Residual host cell protein was showing a gradual upward trend in the drug substance
• AIEX step (column 2) was suspected root cause
• Investigation was launched
– Started by building a multivariate process model (approximately 60 variables covering cell culture and purification)
18
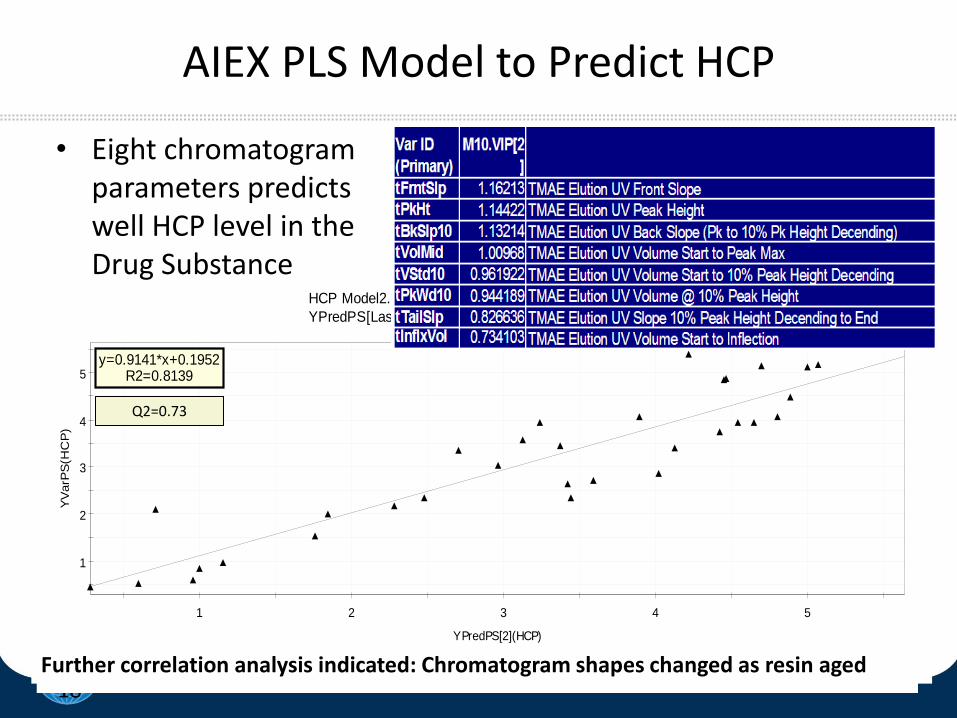
AIEX PLS Model to Predict HCP
1
2
3
4
5
1 2 3 4 5
YV
arP
S(H
CP
)
YPredPS[2](HCP)
HCP Model2.M10 (PLS), HCP Model, PS-HCP Model2
YPredPS[Last comp.](HCP)/YVarPS(HCP)
RMSEP = ---
y=0.9141*x+0.1952R2=0.8139
SIMCA-P+ 11.5 - 5/5/2008 3:48:16 PM
Q2=0.73
• Eight chromatogram parameters predicts well HCP level in the Drug Substance
Further correlation analysis indicated: Chromatogram shapes changed as resin aged
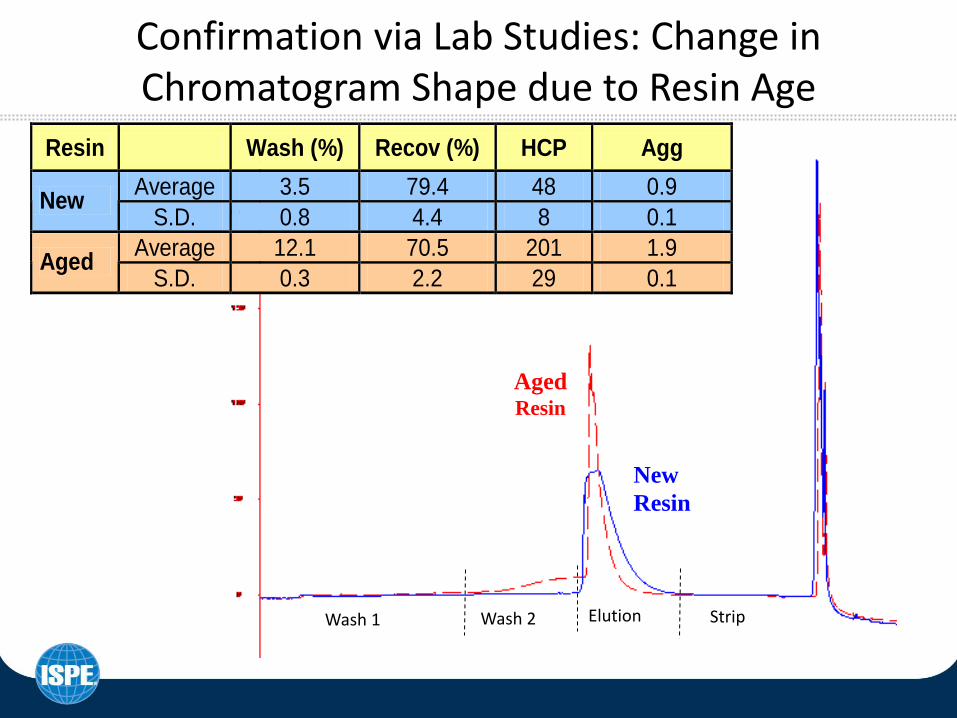
Confirmation via Lab Studies: Change in Chromatogram Shape due to Resin Age
Resin Wash (%) Recov (%) HCP Agg
Average 3.5 79.4 48 0.9 New
S.D. 0.8 4.4 8 0.1
Average 12.1 70.5 201 1.9 Aged
S.D. 0.3 2.2 29 0.1
Aged
Resin
New
Resin
Wash 1 Wash 2 Elution Strip

Chromatogram MVA Summary
• Chromatogram MVA enabled successful root cause investigation of the HCP upward shift
– Multivariate analysis of cell culture and chromatogram parameters indicated that chromatogram parameters were strongly correlated with HCP
– Further correlation analysis indicated that resin age contributed to the chromatogram shape shift
– Lab studies confirmed that resin age contributed to the column performance shift and the gradual upward trend of HCP
21
Summary and Conclusions
• Biogen Idec’s E-Chrom Review
– Our Goal is to develop non-subjective, quantitative method for evaluating chromatograms
• Data Accuracy is Key
– Adequate instrument calibration/maintenance ensures accurate data and successful electronic chromatogram analysis
• Multivariate Chromatogram Review
– More objective and quantitative than visual inspection
– Relates chromatogram characteristics to column performance and product quality attributes
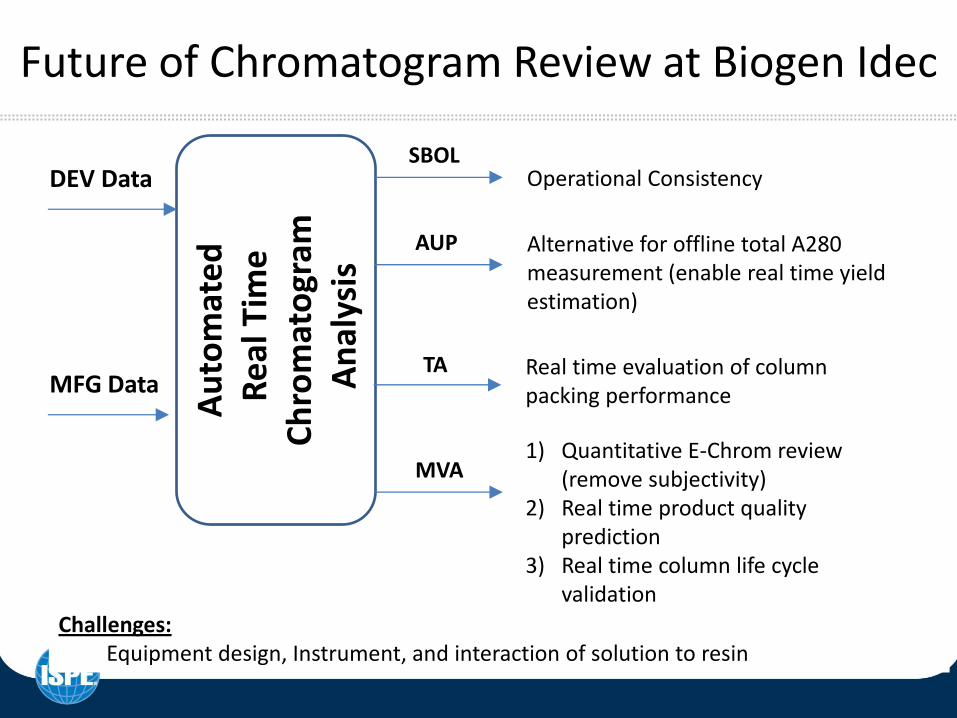
Future of Chromatogram Review at Biogen Idec
Au
tom
ate
d
Re
al T
ime
C
hro
mat
ogr
am
An
alys
is AUP Alternative for offline total A280
measurement (enable real time yield estimation)
TA Real time evaluation of column packing performance
MVA 1) Quantitative E-Chrom review
(remove subjectivity) 2) Real time product quality
prediction 3) Real time column life cycle
validation
DEV Data
MFG Data
SBOL Operational Consistency
Challenges: Equipment design, Instrument, and interaction of solution to resin
Acknowledgement
• Doug Cecchini • Joydeep Ganguly • Robert Genduso • Ben Gilbert • John Pieracci • Jeff Simeone • Jorg Thommes • Andre Walker • Sarah Yuan

24
Excess slides
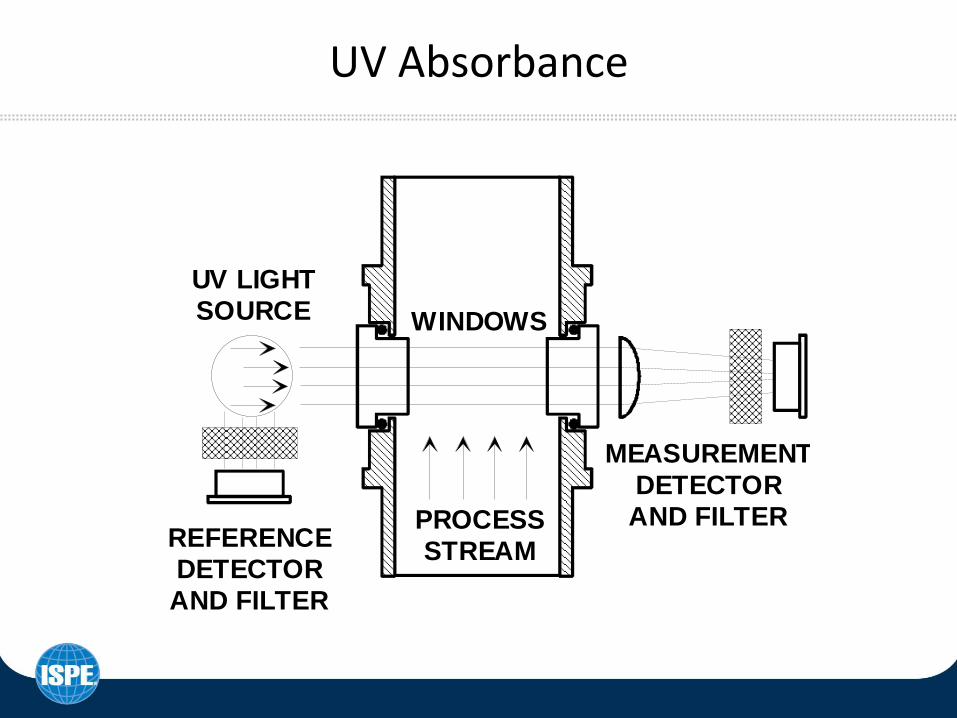
UV Absorbance
UV LIGHT
SOURCE
REFERENCE
DETECTOR
AND FILTER
MEASUREMENT
DETECTOR
AND FILTERPROCESS
STREAM
WINDOWS
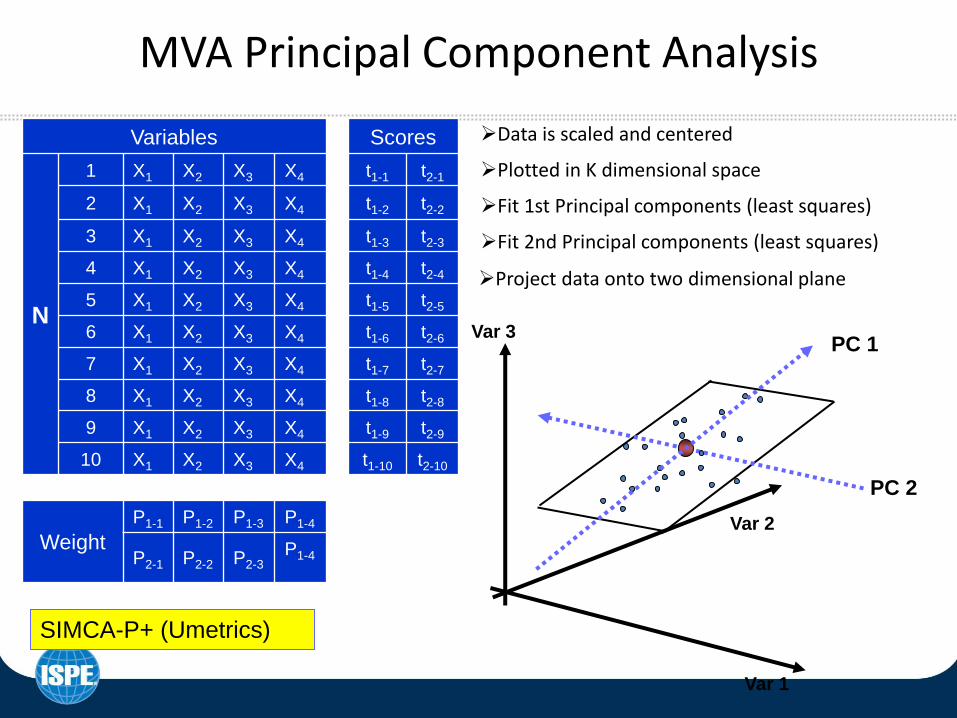
MVA Principal Component Analysis
Variables Scores
N
1 X1 X2 X3 X4 t1-1 t2-1
2 X1 X2 X3 X4 t1-2 t2-2
3 X1 X2 X3 X4 t1-3 t2-3
4 X1 X2 X3 X4 t1-4 t2-4
5 X1 X2 X3 X4 t1-5 t2-5
6 X1 X2 X3 X4 t1-6 t2-6
7 X1 X2 X3 X4 t1-7 t2-7
8 X1 X2 X3 X4 t1-8 t2-8
9 X1 X2 X3 X4 t1-9 t2-9
10 X1 X2 X3 X4 t1-10 t2-10
Weight
P1-1 P1-2 P1-3 P1-4
P2-1 P2-2 P2-3 P1-4
SIMCA-P+ (Umetrics)
Var 3
Var 2
Var 1
Project data onto two dimensional plane
PC 2
Fit 2nd Principal components (least squares)
Data is scaled and centered
Plotted in K dimensional space
Fit 1st Principal components (least squares)
PC 1
27
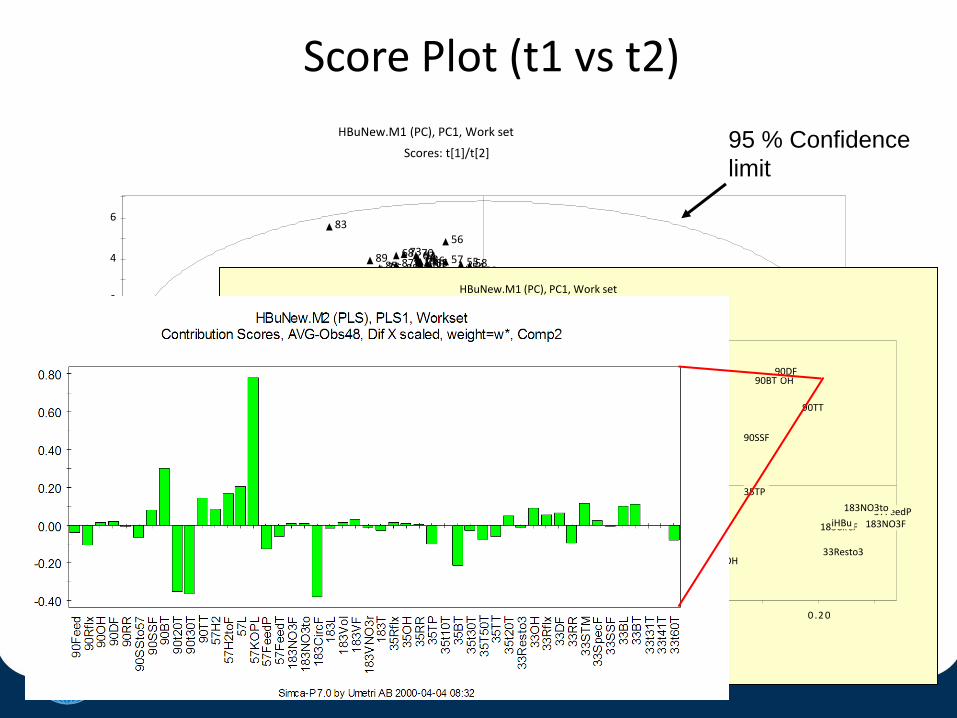
Score Plot (t1 vs t2)
- 6
- 4
- 2
0
2
4
6
- 9 - 8 - 7 - 6 - 5 - 4 - 3 - 2 - 1 0 1 2 3 4 5 6 7 8 9
t[2
]
t[1]
HBuNew.M1 (PC), PC1, Work set
Scores: t[1]/t[2]
Ellipse: Hotelling T2 (0.05)
1 2
3 4 5
6 7 8
9 10 11
12 13 14 15
16
17 18 19 20 21 22 23 24 25 26 27 28 29
30 31 32 33
34
35 36 37 38
39 40
41 42 43
44
45
46
47
48
49 50
51
52 53 54 55
56
57 58 59
60 61 62 63 64
65 66 67 68 69
70 71 72
73 74 75 76
77 78 79
80 81
82
83
84 85 86 87 88
89
90 91
92 93 94 95 96
97 98
99
100
101 102 103
104 105 106
107 108 109 110 111
112 113 114
115 116
117 118 119
120 121 122 123
124 125 126
127 128
129
130
131 132
133
134 135
136 137 138
139
140 141 142
Simca-P 7.0 by Umetri AB 2000-03-30 12:07
95 % Confidence
limit
- 0 . 2 0
- 0 . 1 0
0 . 0 0
0 . 1 0
0 . 2 0
0 . 3 0
- 0 . 2 0 - 0 . 1 0 0 . 0 0 0 . 1 0 0 . 2 0
p[2
]
p[1]
HBuNew.M1 (PC), PC1, Work set
Loadings: p[1]/p[2]
90Feed
90Rflx 90OH
90DF
90RR
90SSto57
90SSF
90BT
90t20T
90t30T 90TT
57H2 57H2toF
57L
57KOPL
57FeedP
57FeedT
183NO3F
183NO3to
183CircF 183L 183Vol
183VF 183VNO3r
183T 35Rflx
35OH 35RR
35TP
35t10T
35BT
35t30T 35T50T
35TT
35t20T
33Resto3
33OH
33Rflx
33DF
33RR
33STM
33SpecF
33SSF
33BL 33BT
33t31T 33t41T 33t60T Assayo%
iHBu
Simca-P 7.0 by Umetri AB 2000-03-30 12:17