Embed Size (px)
Citation preview
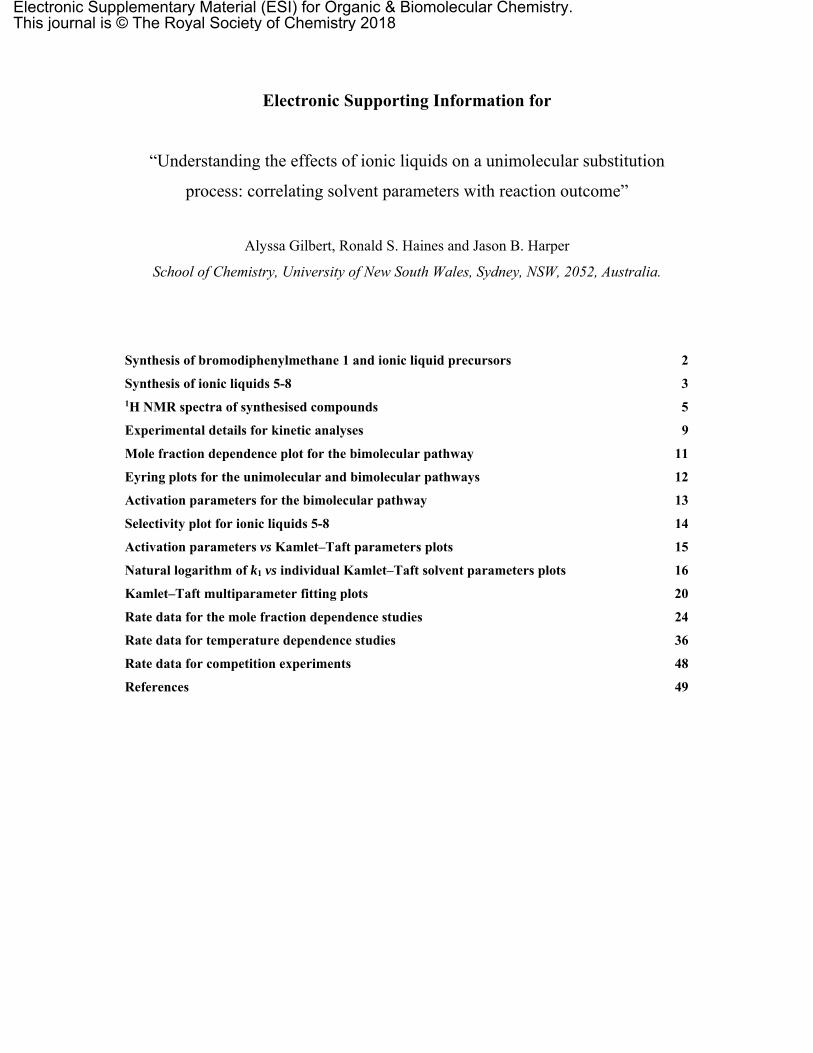
Electronic Supporting Information for
“Understanding the effects of ionic liquids on a unimolecular substitution
process: correlating solvent parameters with reaction outcome”
Alyssa Gilbert, Ronald S. Haines and Jason B. Harper
School of Chemistry, University of New South Wales, Sydney, NSW, 2052, Australia.
Synthesis of bromodiphenylmethane 1 and ionic liquid precursors 2
Synthesis of ionic liquids 5-8 3 1H NMR spectra of synthesised compounds 5
Experimental details for kinetic analyses 9
Mole fraction dependence plot for the bimolecular pathway 11
Eyring plots for the unimolecular and bimolecular pathways 12
Activation parameters for the bimolecular pathway 13
Selectivity plot for ionic liquids 5-8 14
Activation parameters vs Kamlet–Taft parameters plots 15
Natural logarithm of k1 vs individual Kamlet–Taft solvent parameters plots 16
Kamlet–Taft multiparameter fitting plots 20
Rate data for the mole fraction dependence studies 24
Rate data for temperature dependence studies 36
Rate data for competition experiments 48
References 49
Electronic Supplementary Material (ESI) for Organic & Biomolecular Chemistry.This journal is © The Royal Society of Chemistry 2018
S2
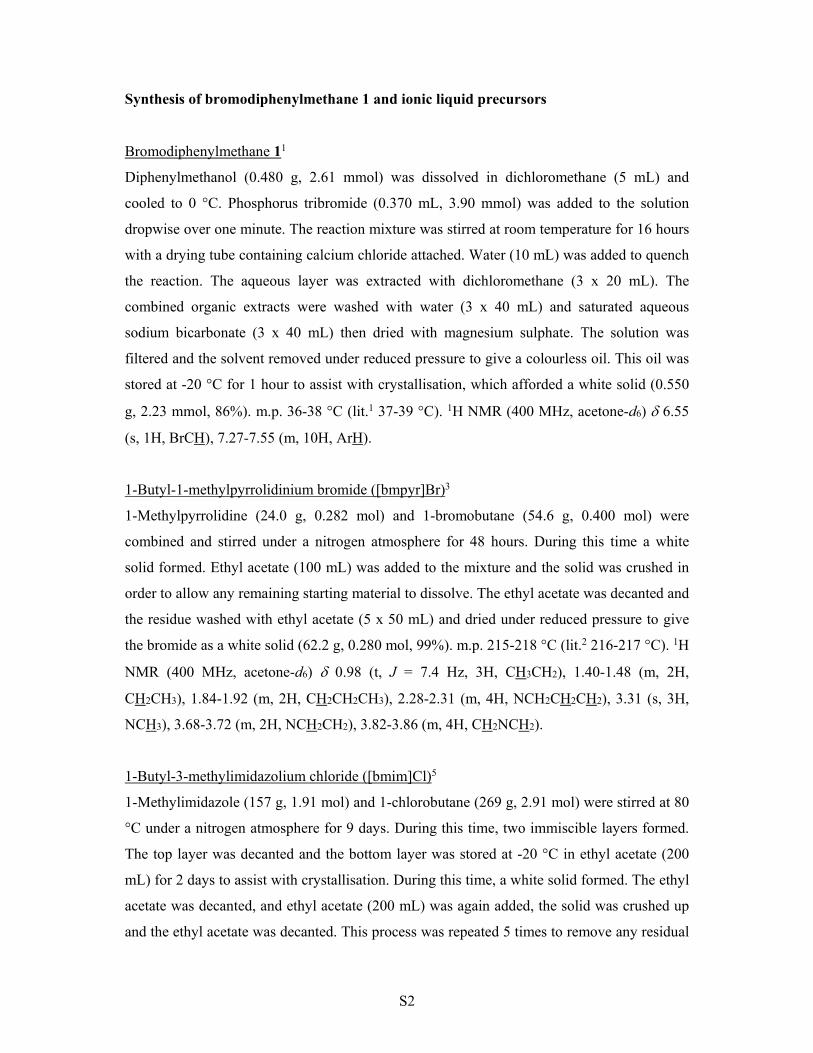
Synthesis of bromodiphenylmethane 1 and ionic liquid precursors
Bromodiphenylmethane 11
Diphenylmethanol (0.480 g, 2.61 mmol) was dissolved in dichloromethane (5 mL) and
cooled to 0 °C. Phosphorus tribromide (0.370 mL, 3.90 mmol) was added to the solution
dropwise over one minute. The reaction mixture was stirred at room temperature for 16 hours
with a drying tube containing calcium chloride attached. Water (10 mL) was added to quench
the reaction. The aqueous layer was extracted with dichloromethane (3 x 20 mL). The
combined organic extracts were washed with water (3 x 40 mL) and saturated aqueous
sodium bicarbonate (3 x 40 mL) then dried with magnesium sulphate. The solution was
filtered and the solvent removed under reduced pressure to give a colourless oil. This oil was
stored at -20 °C for 1 hour to assist with crystallisation, which afforded a white solid (0.550
g, 2.23 mmol, 86%). m.p. 36-38 °C (lit.1 37-39 °C). 1H NMR (400 MHz, acetone-d6) 6.55
(s, 1H, BrCH), 7.27-7.55 (m, 10H, ArH).
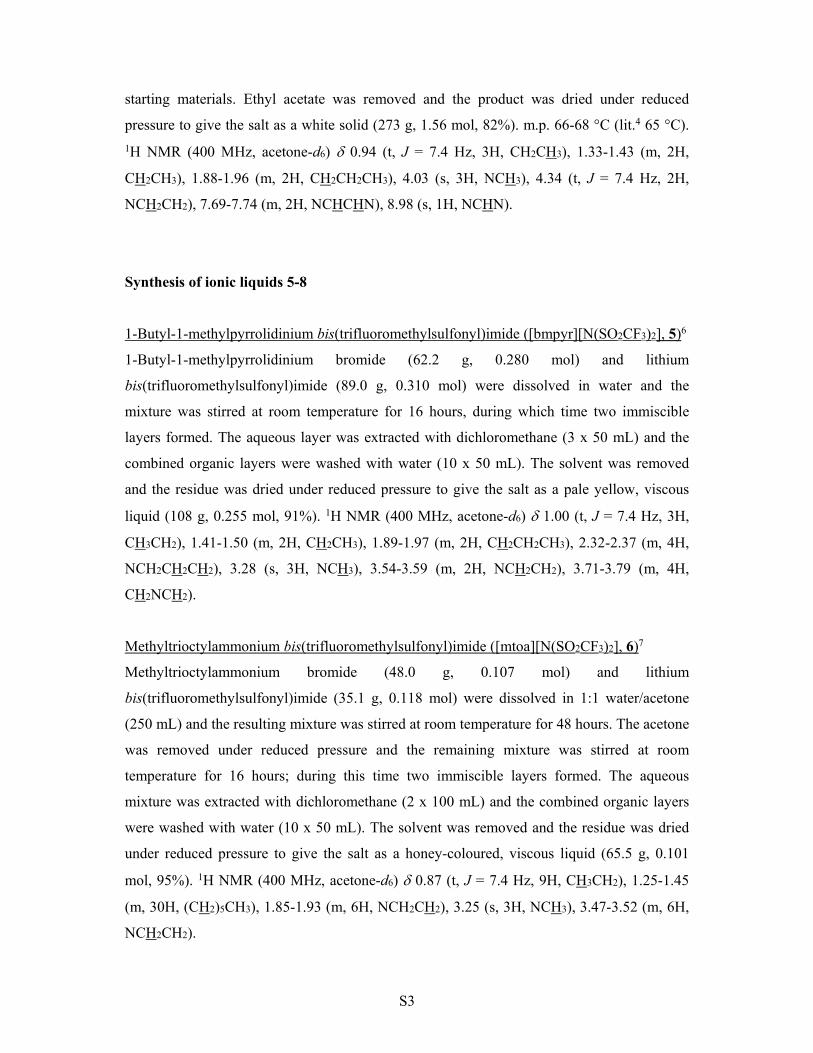
1-Butyl-1-methylpyrrolidinium bromide ([bmpyr]Br)3
1-Methylpyrrolidine (24.0 g, 0.282 mol) and 1-bromobutane (54.6 g, 0.400 mol) were
combined and stirred under a nitrogen atmosphere for 48 hours. During this time a white
solid formed. Ethyl acetate (100 mL) was added to the mixture and the solid was crushed in
order to allow any remaining starting material to dissolve. The ethyl acetate was decanted and
the residue washed with ethyl acetate (5 x 50 mL) and dried under reduced pressure to give
the bromide as a white solid (62.2 g, 0.280 mol, 99%). m.p. 215-218 °C (lit.2 216-217 °C). 1H
NMR (400 MHz, acetone-d6) 0.98 (t, J = 7.4 Hz, 3H, CH3CH2), 1.40-1.48 (m, 2H,
CH2CH3), 1.84-1.92 (m, 2H, CH2CH2CH3), 2.28-2.31 (m, 4H, NCH2CH2CH2), 3.31 (s, 3H,
NCH3), 3.68-3.72 (m, 2H, NCH2CH2), 3.82-3.86 (m, 4H, CH2NCH2).
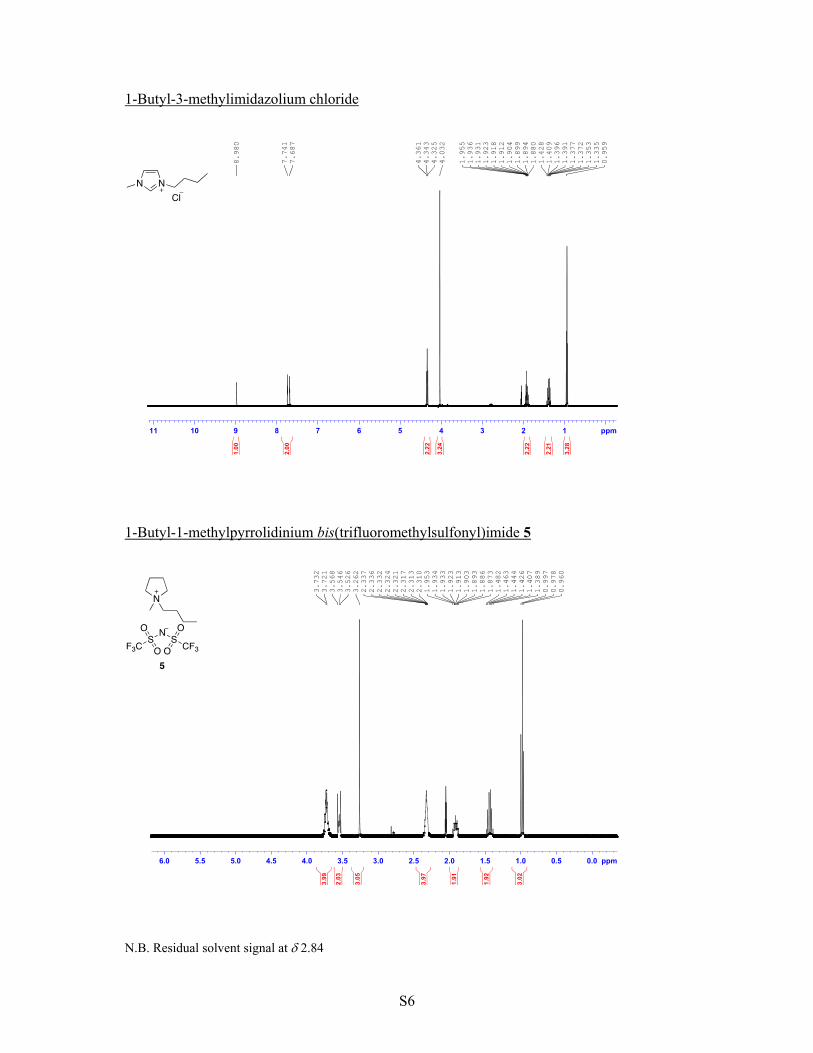
1-Butyl-3-methylimidazolium chloride ([bmim]Cl)5
1-Methylimidazole (157 g, 1.91 mol) and 1-chlorobutane (269 g, 2.91 mol) were stirred at 80
°C under a nitrogen atmosphere for 9 days. During this time, two immiscible layers formed.
The top layer was decanted and the bottom layer was stored at -20 °C in ethyl acetate (200
mL) for 2 days to assist with crystallisation. During this time, a white solid formed. The ethyl
acetate was decanted, and ethyl acetate (200 mL) was again added, the solid was crushed up
and the ethyl acetate was decanted. This process was repeated 5 times to remove any residual
S3
starting materials. Ethyl acetate was removed and the product was dried under reduced
pressure to give the salt as a white solid (273 g, 1.56 mol, 82%). m.p. 66-68 °C (lit.4 65 °C).
1H NMR (400 MHz, acetone-d6) 0.94 (t, J = 7.4 Hz, 3H, CH2CH3), 1.33-1.43 (m, 2H,
CH2CH3), 1.88-1.96 (m, 2H, CH2CH2CH3), 4.03 (s, 3H, NCH3), 4.34 (t, J = 7.4 Hz, 2H,
NCH2CH2), 7.69-7.74 (m, 2H, NCHCHN), 8.98 (s, 1H, NCHN).
Synthesis of ionic liquids 5-8
1-Butyl-1-methylpyrrolidinium bis(trifluoromethylsulfonyl)imide ([bmpyr][N(SO2CF3)2], 5)6
1-Butyl-1-methylpyrrolidinium bromide (62.2 g, 0.280 mol) and lithium
bis(trifluoromethylsulfonyl)imide (89.0 g, 0.310 mol) were dissolved in water and the
mixture was stirred at room temperature for 16 hours, during which time two immiscible
layers formed. The aqueous layer was extracted with dichloromethane (3 x 50 mL) and the
combined organic layers were washed with water (10 x 50 mL). The solvent was removed
and the residue was dried under reduced pressure to give the salt as a pale yellow, viscous
liquid (108 g, 0.255 mol, 91%). 1H NMR (400 MHz, acetone-d6) 1.00 (t, J = 7.4 Hz, 3H,
CH3CH2), 1.41-1.50 (m, 2H, CH2CH3), 1.89-1.97 (m, 2H, CH2CH2CH3), 2.32-2.37 (m, 4H,
NCH2CH2CH2), 3.28 (s, 3H, NCH3), 3.54-3.59 (m, 2H, NCH2CH2), 3.71-3.79 (m, 4H,
CH2NCH2).
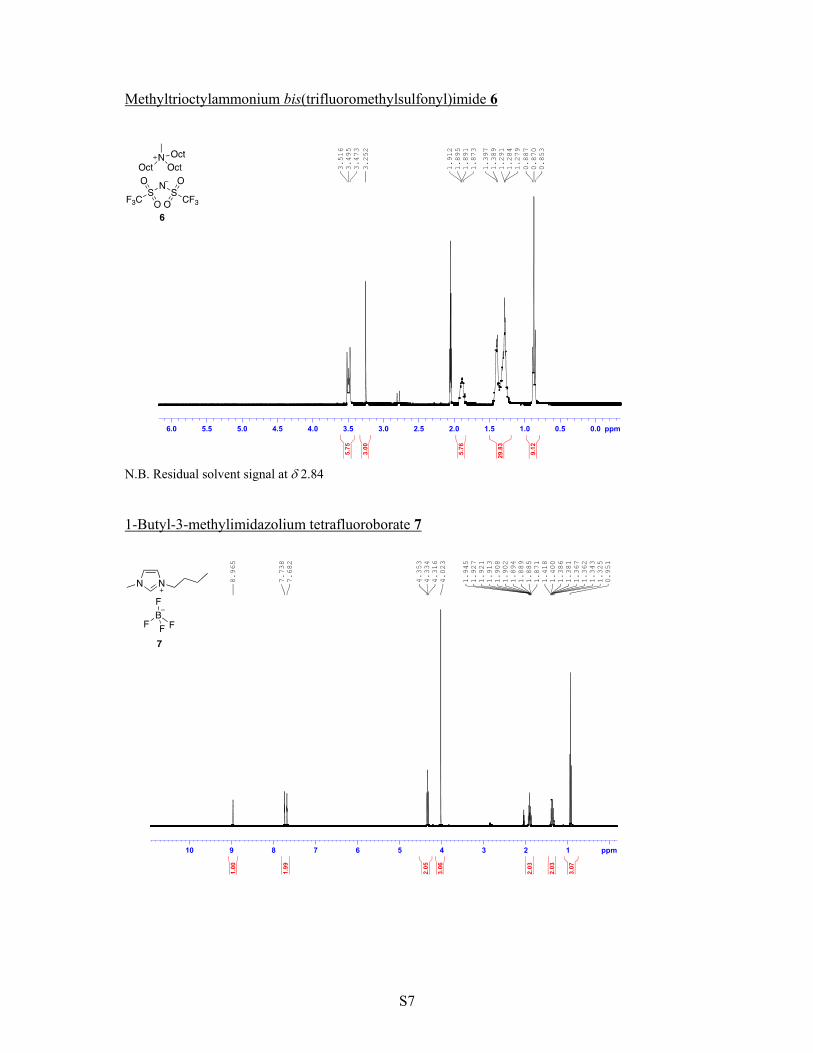
Methyltrioctylammonium bis(trifluoromethylsulfonyl)imide ([mtoa][N(SO2CF3)2], 6)7
Methyltrioctylammonium bromide (48.0 g, 0.107 mol) and lithium
bis(trifluoromethylsulfonyl)imide (35.1 g, 0.118 mol) were dissolved in 1:1 water/acetone
(250 mL) and the resulting mixture was stirred at room temperature for 48 hours. The acetone
was removed under reduced pressure and the remaining mixture was stirred at room
temperature for 16 hours; during this time two immiscible layers formed. The aqueous
mixture was extracted with dichloromethane (2 x 100 mL) and the combined organic layers
were washed with water (10 x 50 mL). The solvent was removed and the residue was dried
under reduced pressure to give the salt as a honey-coloured, viscous liquid (65.5 g, 0.101
mol, 95%). 1H NMR (400 MHz, acetone-d6) 0.87 (t, J = 7.4 Hz, 9H, CH3CH2), 1.25-1.45
(m, 30H, (CH2)5CH3), 1.85-1.93 (m, 6H, NCH2CH2), 3.25 (s, 3H, NCH3), 3.47-3.52 (m, 6H,
NCH2CH2).
S4
1-Butyl-3-methylimidazolium tetrafluoroborate ([bmim][BF4], 7)6
1-Butyl-3-methylimidazolium chloride (146 g, 0.834 mol) and sodium tetrafluoroborate (102
g, 0.925 mol) were combined with acetone (250 mL) and stirred at room temperature for 16
hours. The white precipitate that formed during this time was filtered off and discarded. The
acetone was removed from the filtrate in vacuo and the remaining liquid dissolved in
dichloromethane (200 mL). The solution was stored at -20 °C overnight to assist with
precipitation of any residual sodium chloride in the mixture. Sodium chloride was filtered off
and discarded, and the solvent removed in vacuo. Dichloromethane (200 mL) was again
added and the process was repeated 8 times to ensure removal of sodium chloride. The
dichloromethane was removed and the resultant liquid dried under reduced pressure to give
the salt as a pale yellow, viscous liquid (150 g, 0.664 mol, 80%). 1H NMR (400 MHz,
acetone-d6) 0.95 (t, J = 7.4 Hz, 3H, CH2CH3), 1.34-1.42 (m, 2H, CH2CH3), 1.89-1.96 (m,
2H, CH2CH2CH3), 4.04 (s, 3H, NCH3), 4.35 (t, J = 7.4 Hz, 2H, NCH2CH2), 7.70-7.76 (m,
2H, NCHCHN), 8.98 (s, 1H, NCHN).
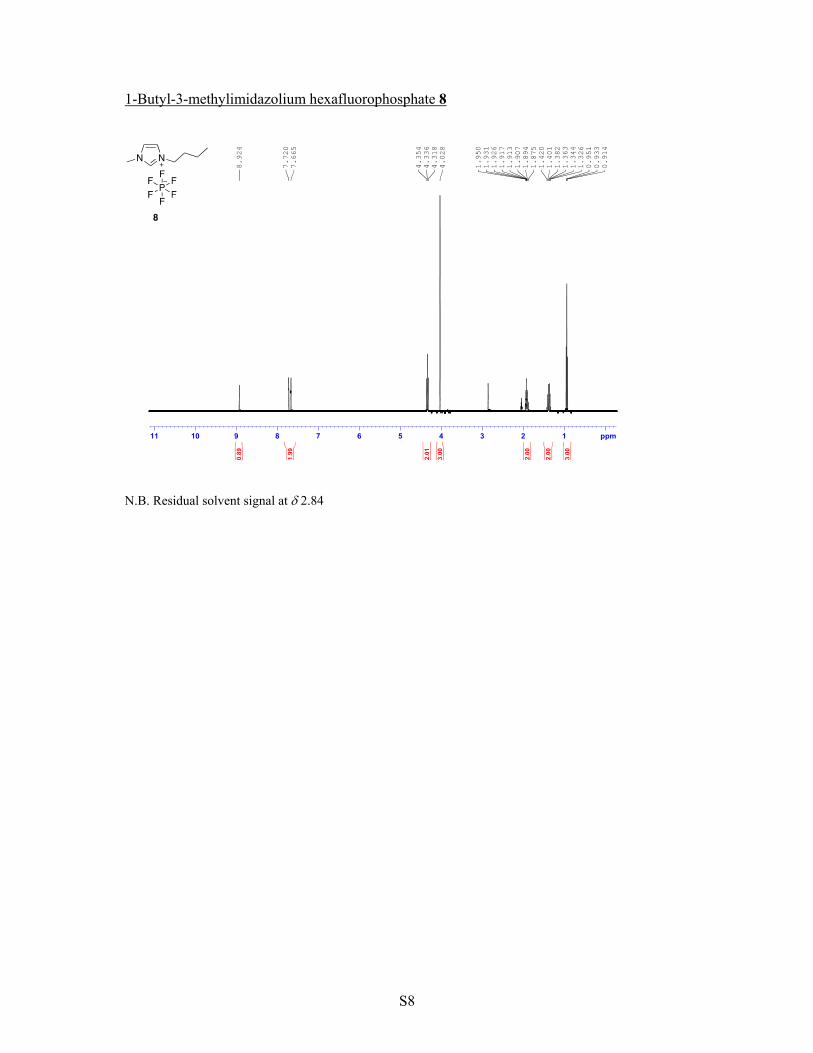
1-Butyl-3-methylimidazolium hexafluorophosphate ([bmim][PF6], 8)5
1-Butyl-3-methylimidazolium chloride (68.1 g, 0.390 mol) in water (100 mL) and potassium
hexafluorophosphate (80.3 g, 0.436 mol) in water (300 mL) were combined and the resulting
mixture was stirred at room temperature for 18 hours. During this time, two immiscible
layers formed. The aqueous layer was extracted with dichloromethane (2 x 150 mL) and the
combined organic layers were washed with water (10 x 100 mL). The dichloromethane was
removed and the resultant colourless liquid was dried under reduced pressure to give the salt
as a colourless, viscous liquid (86.7 g 0.305 moles, 78%). 1H NMR (400 MHz, acetone-d6)
0.94 (t, J = 7.4 Hz, 3H, CH2CH3), 1.35-1.41 (m, 2H, CH2CH3), 1.88-1.96 (m, 2H,
CH2CH2CH3), 4.03 (s, 3H, NCH3), 4.34 (t, J = 7.4 Hz, 2H, NCH2CH2), 7.67-7.73 (m, 2H,
NCHCHN), 8.93 (s, 1H, NCHN).
S5
11 10 9 8 7 6 5 4 3 2 1 ppm
6.
55
0
7.
29
97
.3
55
7.
37
57
.3
93
7.
53
47
.5
53
7.
55
7
1.00
10.44
1H NMR spectra of synthesised compounds
Bromodiphenylmethane 1
N.B. Residual solvent signal at 2.84
1-Butyl-1-methylpyrrolidinium bromide
6.0 5.5 5.0 4.5 4.0 3.5 3.0 2.5 2.0 1.5 1.0 0.5 0.0 ppm
0.
96
30
.9
82
1.
00
01
.3
86
1.
40
51
.4
23
1.
44
21
.4
61
1.
47
91
.8
44
1.
85
71
.8
64
1.
87
41
.8
85
1.
89
51
.9
05
1.
92
42
.2
80
2.
29
52
.3
04
3.
30
83
.6
77
3.
69
83
.7
19
3.
81
23
.8
16
3.
82
13
.8
28
3.
83
83
.8
45
2.95
2.04
1.99
3.85
3.00
2.03
3.87
S6
1-Butyl-3-methylimidazolium chloride
1-Butyl-1-methylpyrrolidinium bis(trifluoromethylsulfonyl)imide 5
N.B. Residual solvent signal at 2.84
11 10 9 8 7 6 5 4 3 2 1 ppm
0.
95
91
.3
35
1.
35
31
.3
72
1.
37
71
.3
91
1.
39
61
.4
09
1.
42
81
.8
80
1.
89
41
.8
99
1.
90
41
.9
12
1.
91
81
.9
23
1.
93
11
.9
36
1.
95
5
4.
03
24
.3
25
4.
34
34
.3
61
7.
68
77
.7
41
8.
98
0
3.28
2.21
2.22
3.24
2.22
2.00
1.00
6.0 5.5 5.0 4.5 4.0 3.5 3.0 2.5 2.0 1.5 1.0 0.5 0.0 ppm
0.
96
00
.9
78
0.
99
71
.3
89
1.
40
71
.4
26
1.
44
41
.4
63
1.
48
21
.8
73
1.
88
61
.8
93
1.
90
31
.9
13
1.
92
31
.9
33
1.
93
41
.9
53
2.
31
02
.3
13
2.
31
72
.3
21
2.
32
42
.3
32
2.
33
62
.3
37
3.
26
23
.5
26
3.
54
63
.5
68
3.
72
13
.7
32
3.02
1.92
1.91
3.97
3.05
2.03
3.99
S7
Methyltrioctylammonium bis(trifluoromethylsulfonyl)imide 6
N.B. Residual solvent signal at 2.84
1-Butyl-3-methylimidazolium tetrafluoroborate 7
6.0 5.5 5.0 4.5 4.0 3.5 3.0 2.5 2.0 1.5 1.0 0.5 0.0 ppm
0.
85
30
.8
70
0.
88
71
.2
79
1.
28
41
.2
91
1.
38
91
.3
97
1.
87
31
.8
91
1.
89
51
.9
12
3.
25
23
.4
73
3.
49
53
.5
16
9.12
29.83
5.76
3.00
5.75
10 9 8 7 6 5 4 3 2 1 ppm
0.
95
11
.3
25
1.
34
31
.3
62
1.
36
71
.3
81
1.
38
61
.4
00
1.
41
81
.8
71
1.
88
51
.8
89
1.
89
41
.9
02
1.
90
81
.9
13
1.
92
11
.9
27
1.
94
5
4.
02
34
.3
16
4.
33
44
.3
53
7.
68
27
.7
38
8.
96
5
3.07
2.03
2.03
3.06
2.05
1.99
1.00
S8
1-Butyl-3-methylimidazolium hexafluorophosphate 8
N.B. Residual solvent signal at 2.84
11 10 9 8 7 6 5 4 3 2 1 ppm
0.
91
40
.9
33
0.
95
11
.3
26
1.
34
41
.3
63
1.
38
21
.4
01
1.
42
01
.8
75
1.
89
41
.9
07
1.
91
31
.9
17
1.
92
61
.9
31
1.
95
0
4.
02
84
.3
18
4.
33
64
.3
54
7.
66
57
.7
20
8.
92
4
3.00
2.00
2.00
3.00
2.01
1.99
0.89
S9
Experimental details for kinetic analyses
Kinetic analyses were carried out in solutions containing the electrophile 1 (ca. 0.01 mol L-1)
and varying concentrations of the nucleophile 2 (see Tables S2-S11 for exact amounts) in the
desired solvent mixture containing acetonitrile and one of the ionic liquids 5-8. An aliquot
(ca. 0.5 mL) from each stock solution was placed in an NMR tube. For all kinetic analyses,
there was at least a 10-fold excess of the nucleophile 2 to ensure reactions occurred under
pseudo first order conditions.
Reactions were monitored using 1H NMR spectroscopy in situ until 95% of the electrophile 1
was consumed, as determined by the signal at ca. 6.5 ppm, with the spectrometer set to the
desired temperature (47.5 °C for mole fraction dependence studies, and in the range 19.8-63.9
°C for temperature dependence studies) for the duration of the reaction. All kinetic analyses
were performed in triplicate. Competition experiments also monitored the depletion of the
signal representing the benzylic protons of electrophile 9 at ca. 4.5 ppm.
NMR spectra used for kinetic analyses were processed using MestReNova 10.1 software. For
each case, the pseudo first order rate constant (kobs) was calculated by integrating the signal at
6.5 ppm and fitting the natural logarithm of the integrations to a linear function using
Microsoft Excel 16.16.1 LINEST function.
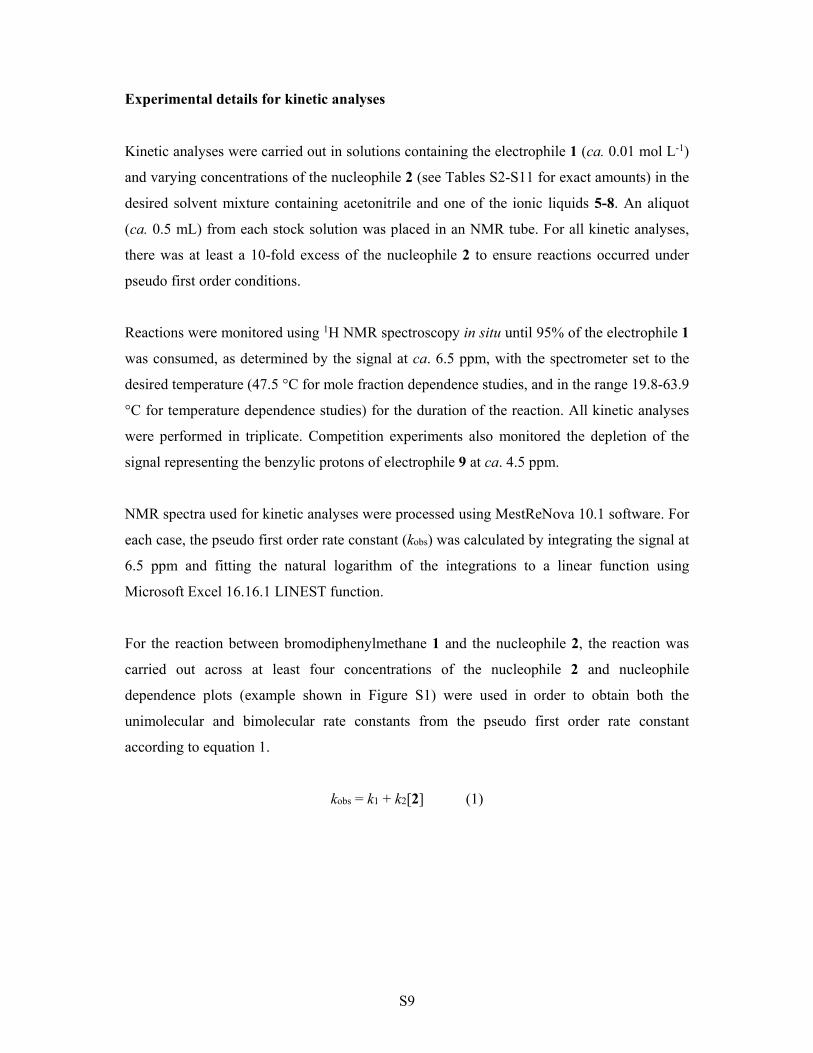
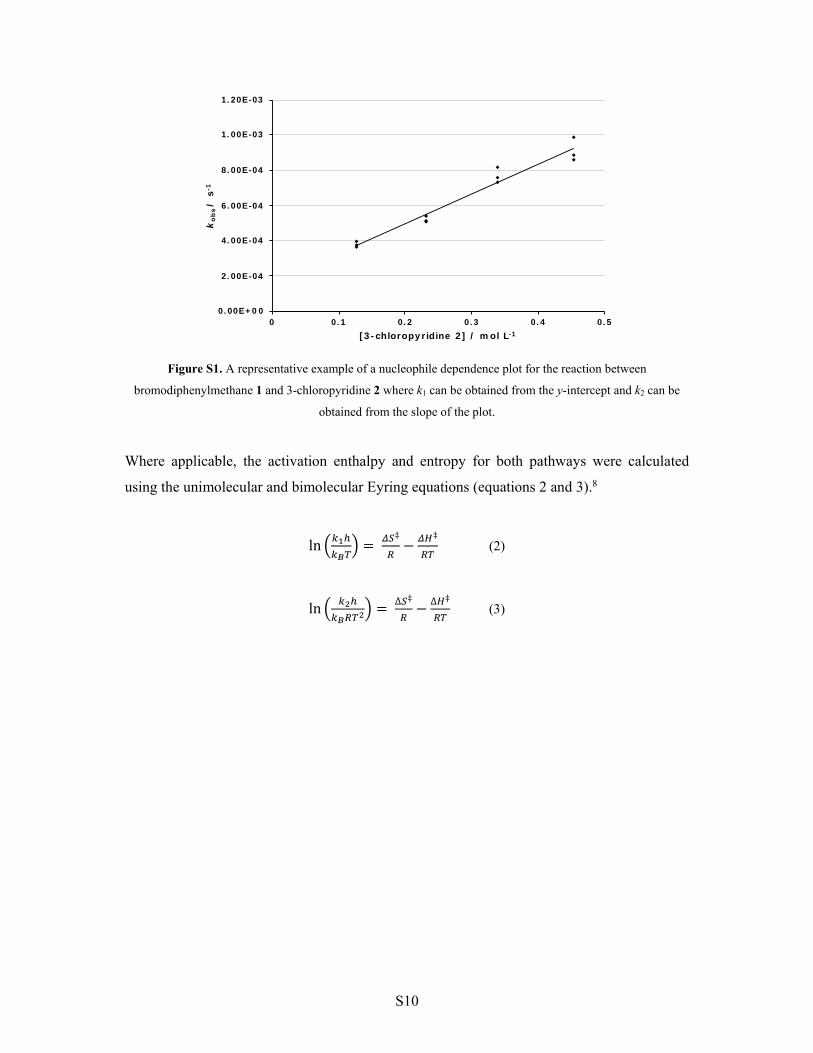
For the reaction between bromodiphenylmethane 1 and the nucleophile 2, the reaction was
carried out across at least four concentrations of the nucleophile 2 and nucleophile
dependence plots (example shown in Figure S1) were used in order to obtain both the
unimolecular and bimolecular rate constants from the pseudo first order rate constant
according to equation 1.
kobs = k1 + k2[2] (1)
S10
Figure S1. A representative example of a nucleophile dependence plot for the reaction between
bromodiphenylmethane 1 and 3-chloropyridine 2 where k1 can be obtained from the y-intercept and k2 can be
obtained from the slope of the plot.
Where applicable, the activation enthalpy and entropy for both pathways were calculated
using the unimolecular and bimolecular Eyring equations (equations 2 and 3).8
ln ‡ ‡
(2)
ln ∆ ‡ ∆ ‡ (3)
0.00E+00
2.00E-04
4.00E-04
6.00E-04
8.00E-04
1.00E-03
1.20E-03
0 0.1 0.2 0.3 0.4 0.5
ko
bs/
s-1
[3-chloropyridine 2] / mol L-1
S11
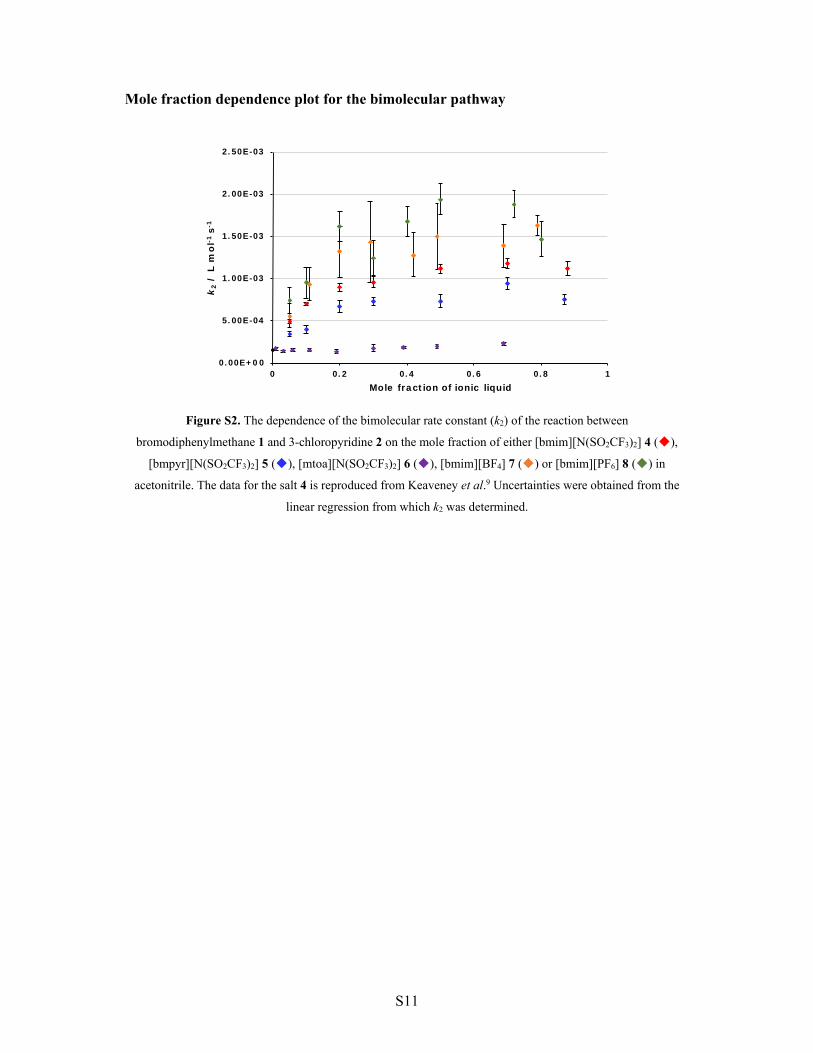
Mole fraction dependence plot for the bimolecular pathway
Figure S2. The dependence of the bimolecular rate constant (k2) of the reaction between
bromodiphenylmethane 1 and 3-chloropyridine 2 on the mole fraction of either [bmim][N(SO2CF3)2] 4 (),
[bmpyr][N(SO2CF3)2] 5 (), [mtoa][N(SO2CF3)2] 6 (), [bmim][BF4] 7 () or [bmim][PF6] 8 () in
acetonitrile. The data for the salt 4 is reproduced from Keaveney et al.9 Uncertainties were obtained from the
linear regression from which k2 was determined.
0.00E+00
5.00E-04
1.00E-03
1.50E-03
2.00E-03
2.50E-03
0 0.2 0.4 0.6 0.8 1
k2
/ L
mo
l-1 s
-1
Mole fraction of ionic liquid
S12
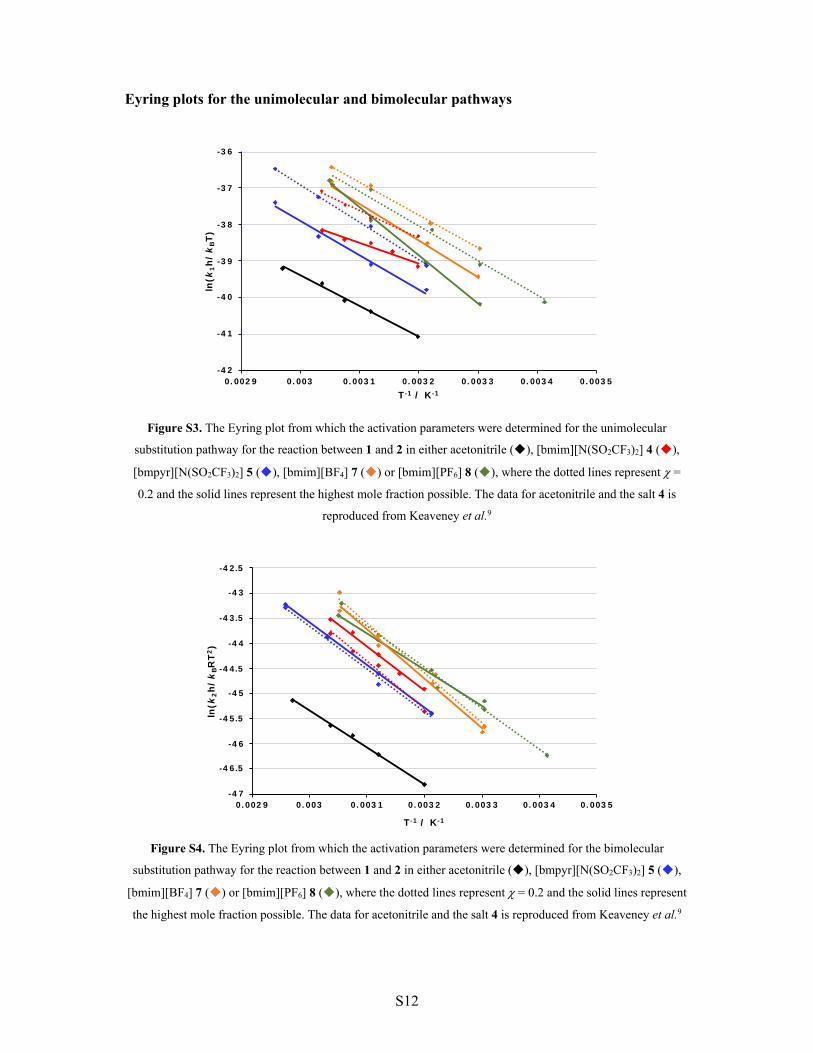
Eyring plots for the unimolecular and bimolecular pathways
Figure S3. The Eyring plot from which the activation parameters were determined for the unimolecular
substitution pathway for the reaction between 1 and 2 in either acetonitrile (), [bmim][N(SO2CF3)2] 4 (),
[bmpyr][N(SO2CF3)2] 5 (), [bmim][BF4] 7 () or [bmim][PF6] 8 (), where the dotted lines represent =
0.2 and the solid lines represent the highest mole fraction possible. The data for acetonitrile and the salt 4 is
reproduced from Keaveney et al.9
Figure S4. The Eyring plot from which the activation parameters were determined for the bimolecular
substitution pathway for the reaction between 1 and 2 in either acetonitrile (), [bmpyr][N(SO2CF3)2] 5 (),
[bmim][BF4] 7 () or [bmim][PF6] 8 (), where the dotted lines represent = 0.2 and the solid lines represent
the highest mole fraction possible. The data for acetonitrile and the salt 4 is reproduced from Keaveney et al.9
-42
-41
-40
-39
-38
-37
-36
0.0029 0.003 0.0031 0.0032 0.0033 0.0034 0.0035
ln(k
1h
/k
BT
)
T-1 / K-1
-47
-46.5
-46
-45.5
-45
-44.5
-44
-43.5
-43
-42.5
0.0029 0.003 0.0031 0.0032 0.0033 0.0034 0.0035
ln(k
2h
/k
BR
T2)
T-1 / K-1
S13
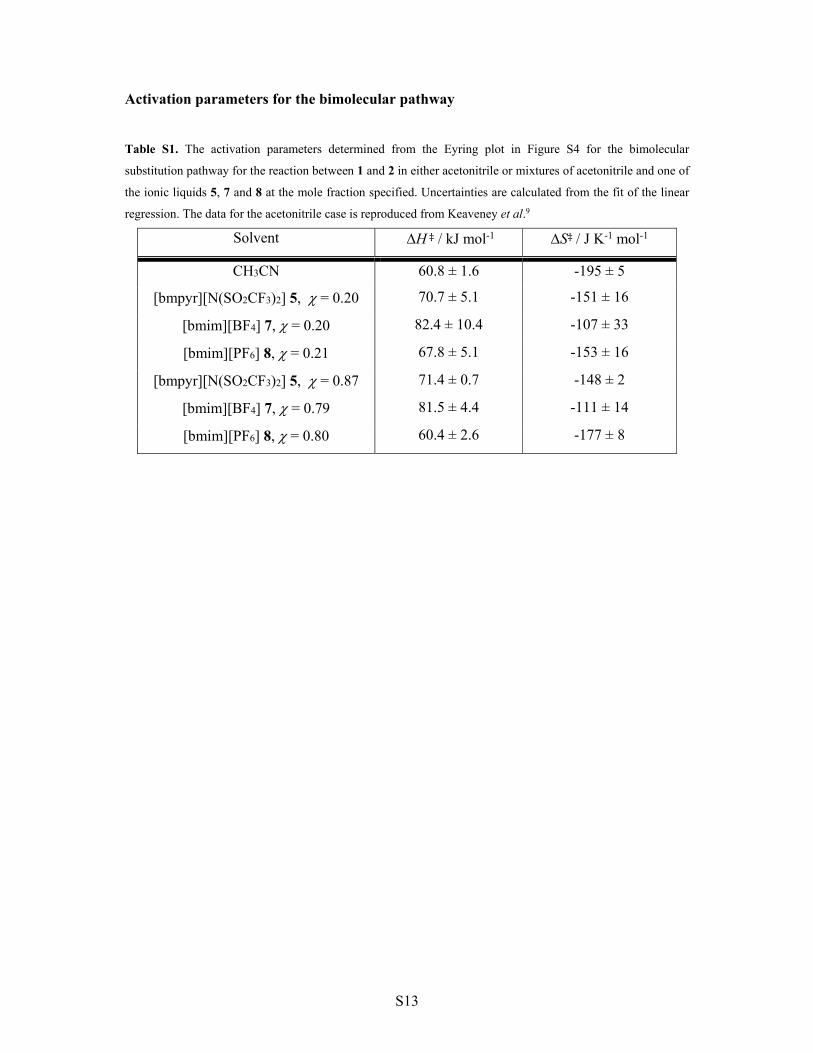
Activation parameters for the bimolecular pathway
Table S1. The activation parameters determined from the Eyring plot in Figure S4 for the bimolecular
substitution pathway for the reaction between 1 and 2 in either acetonitrile or mixtures of acetonitrile and one of
the ionic liquids 5, 7 and 8 at the mole fraction specified. Uncertainties are calculated from the fit of the linear
regression. The data for the acetonitrile case is reproduced from Keaveney et al.9
Solvent H ‡ / kJ mol-1 S‡ / J K-1 mol-1
CH3CN 60.8 ± 1.6 -195 ± 5
[bmpyr][N(SO2CF3)2] 5, = 0.20 70.7 ± 5.1 -151 ± 16
[bmim][BF4] 7, = 0.20 82.4 ± 10.4 -107 ± 33
[bmim][PF6] 8, = 0.21 67.8 ± 5.1 -153 ± 16
[bmpyr][N(SO2CF3)2] 5, = 0.87 71.4 ± 0.7 -148 ± 2
[bmim][BF4] 7, = 0.79 81.5 ± 4.4 -111 ± 14
[bmim][PF6] 8, = 0.80 60.4 ± 2.6 -177 ± 8
S14
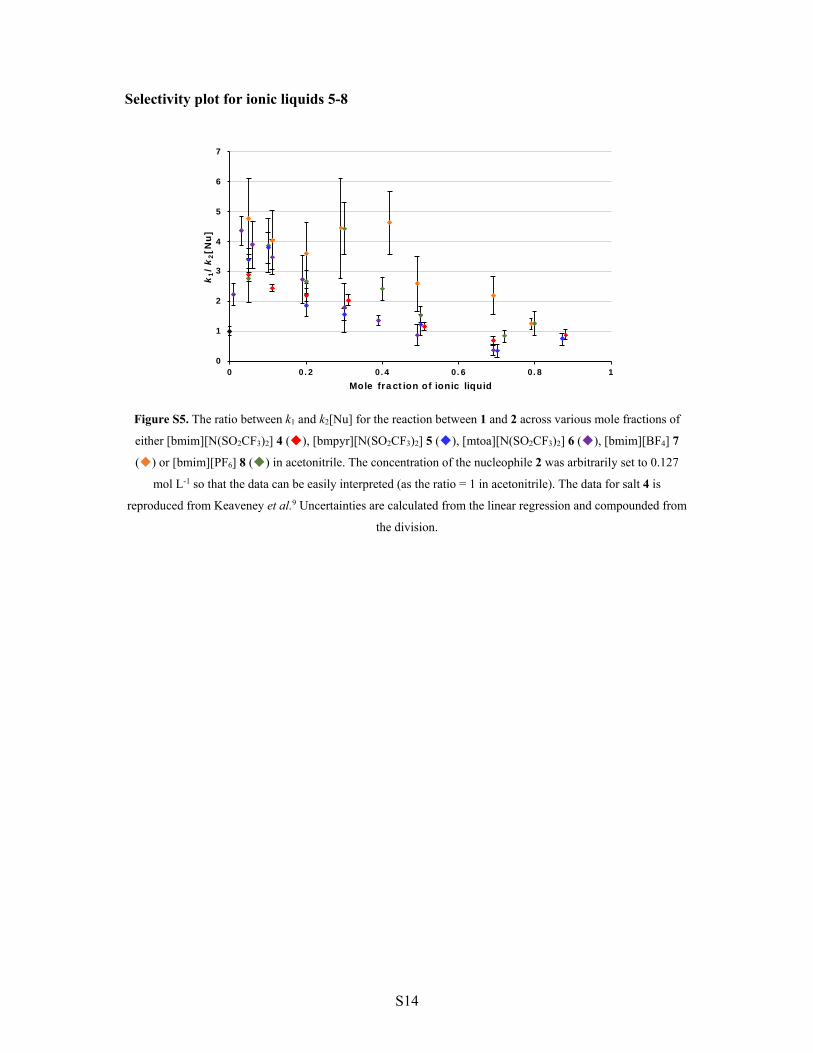
Selectivity plot for ionic liquids 5-8
Figure S5. The ratio between k1 and k2[Nu] for the reaction between 1 and 2 across various mole fractions of
either [bmim][N(SO2CF3)2] 4 (), [bmpyr][N(SO2CF3)2] 5 (), [mtoa][N(SO2CF3)2] 6 (), [bmim][BF4] 7
() or [bmim][PF6] 8 () in acetonitrile. The concentration of the nucleophile 2 was arbitrarily set to 0.127
mol L-1 so that the data can be easily interpreted (as the ratio = 1 in acetonitrile). The data for salt 4 is
reproduced from Keaveney et al.9 Uncertainties are calculated from the linear regression and compounded from
the division.
0
1
2
3
4
5
6
7
0 0.2 0.4 0.6 0.8 1
k1/
k2[N
u]
Mole fraction of ionic liquid
S15
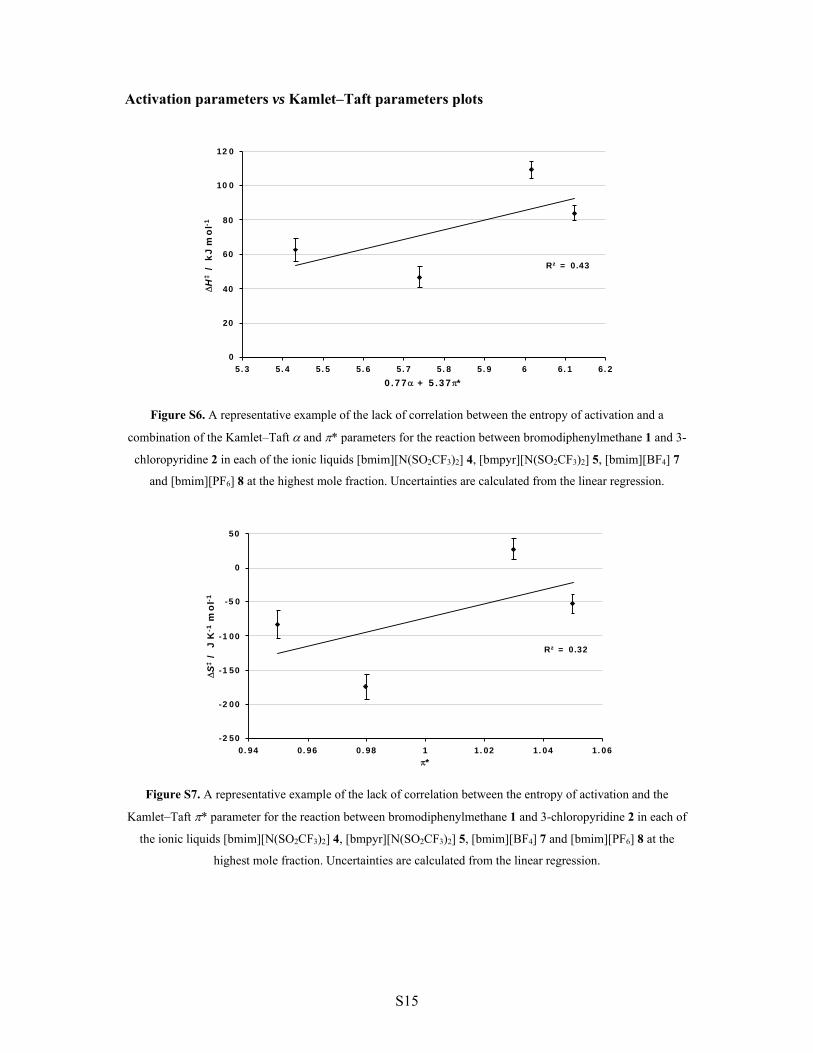
Activation parameters vs Kamlet–Taft parameters plots
Figure S6. A representative example of the lack of correlation between the entropy of activation and a
combination of the Kamlet–Taft and * parameters for the reaction between bromodiphenylmethane 1 and 3-
chloropyridine 2 in each of the ionic liquids [bmim][N(SO2CF3)2] 4, [bmpyr][N(SO2CF3)2] 5, [bmim][BF4] 7
and [bmim][PF6] 8 at the highest mole fraction. Uncertainties are calculated from the linear regression.
Figure S7. A representative example of the lack of correlation between the entropy of activation and the
Kamlet–Taft * parameter for the reaction between bromodiphenylmethane 1 and 3-chloropyridine 2 in each of
the ionic liquids [bmim][N(SO2CF3)2] 4, [bmpyr][N(SO2CF3)2] 5, [bmim][BF4] 7 and [bmim][PF6] 8 at the
highest mole fraction. Uncertainties are calculated from the linear regression.
R² = 0.43
0
20
40
60
80
100
120
5.3 5.4 5.5 5.6 5.7 5.8 5.9 6 6.1 6.2
H
‡/
kJ
mo
l-1
0.77 + 5.37*
R² = 0.32
-250
-200
-150
-100
-50
0
50
0.94 0.96 0.98 1 1.02 1.04 1.06
S
‡/
J K
-1m
ol-1
*
S16
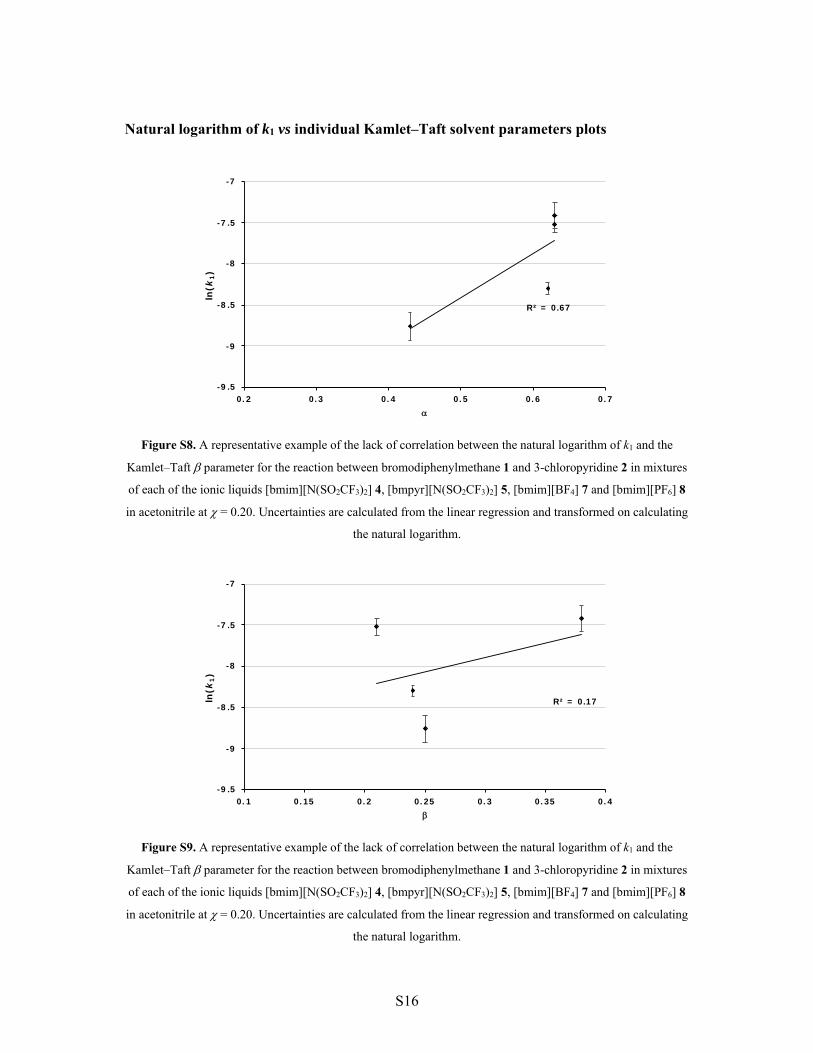
Natural logarithm of k1 vs individual Kamlet–Taft solvent parameters plots
Figure S8. A representative example of the lack of correlation between the natural logarithm of k1 and the
Kamlet–Taft parameter for the reaction between bromodiphenylmethane 1 and 3-chloropyridine 2 in mixtures
of each of the ionic liquids [bmim][N(SO2CF3)2] 4, [bmpyr][N(SO2CF3)2] 5, [bmim][BF4] 7 and [bmim][PF6] 8
in acetonitrile at = 0.20. Uncertainties are calculated from the linear regression and transformed on calculating
the natural logarithm.
Figure S9. A representative example of the lack of correlation between the natural logarithm of k1 and the
Kamlet–Taft parameter for the reaction between bromodiphenylmethane 1 and 3-chloropyridine 2 in mixtures
of each of the ionic liquids [bmim][N(SO2CF3)2] 4, [bmpyr][N(SO2CF3)2] 5, [bmim][BF4] 7 and [bmim][PF6] 8
in acetonitrile at = 0.20. Uncertainties are calculated from the linear regression and transformed on calculating
the natural logarithm.
R² = 0.67
-9.5
-9
-8.5
-8
-7.5
-7
0.2 0.3 0.4 0.5 0.6 0.7
ln(k
1)
R² = 0.17
-9.5
-9
-8.5
-8
-7.5
-7
0.1 0.15 0.2 0.25 0.3 0.35 0.4
ln(k
1)
S17
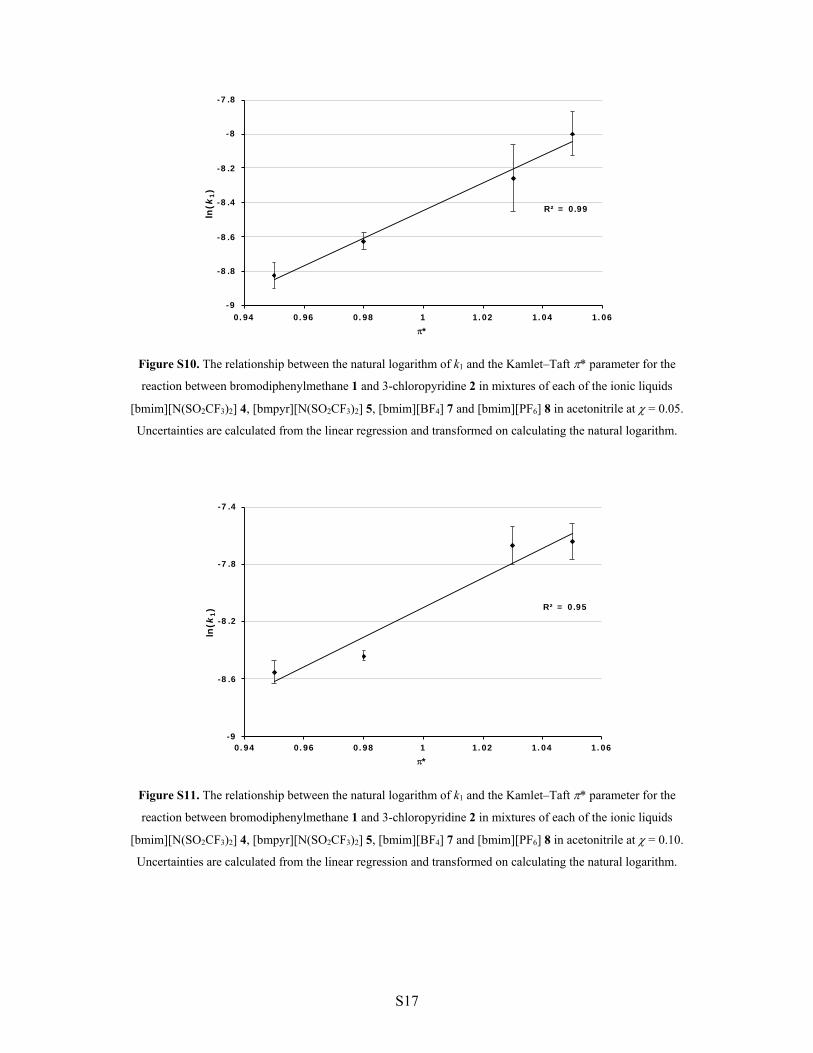
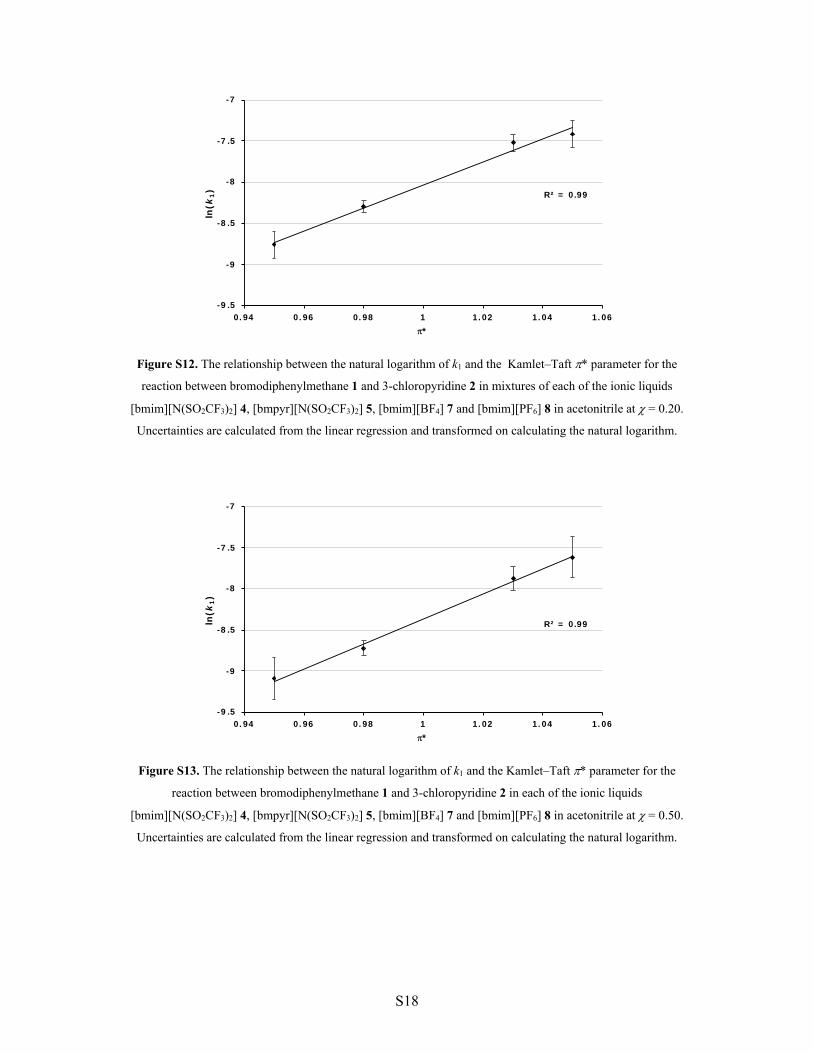
Figure S10. The relationship between the natural logarithm of k1 and the Kamlet–Taft * parameter for the
reaction between bromodiphenylmethane 1 and 3-chloropyridine 2 in mixtures of each of the ionic liquids
[bmim][N(SO2CF3)2] 4, [bmpyr][N(SO2CF3)2] 5, [bmim][BF4] 7 and [bmim][PF6] 8 in acetonitrile at = 0.05.
Uncertainties are calculated from the linear regression and transformed on calculating the natural logarithm.
Figure S11. The relationship between the natural logarithm of k1 and the Kamlet–Taft * parameter for the
reaction between bromodiphenylmethane 1 and 3-chloropyridine 2 in mixtures of each of the ionic liquids
[bmim][N(SO2CF3)2] 4, [bmpyr][N(SO2CF3)2] 5, [bmim][BF4] 7 and [bmim][PF6] 8 in acetonitrile at = 0.10.
Uncertainties are calculated from the linear regression and transformed on calculating the natural logarithm.
R² = 0.99
-9
-8.8
-8.6
-8.4
-8.2
-8
-7.8
0.94 0.96 0.98 1 1.02 1.04 1.06
ln(k
1)
*
R² = 0.95
-9
-8.6
-8.2
-7.8
-7.4
0.94 0.96 0.98 1 1.02 1.04 1.06
ln(k
1)
*
S18
Figure S12. The relationship between the natural logarithm of k1 and the Kamlet–Taft * parameter for the
reaction between bromodiphenylmethane 1 and 3-chloropyridine 2 in mixtures of each of the ionic liquids
[bmim][N(SO2CF3)2] 4, [bmpyr][N(SO2CF3)2] 5, [bmim][BF4] 7 and [bmim][PF6] 8 in acetonitrile at = 0.20.
Uncertainties are calculated from the linear regression and transformed on calculating the natural logarithm.
Figure S13. The relationship between the natural logarithm of k1 and the Kamlet–Taft * parameter for the
reaction between bromodiphenylmethane 1 and 3-chloropyridine 2 in each of the ionic liquids
[bmim][N(SO2CF3)2] 4, [bmpyr][N(SO2CF3)2] 5, [bmim][BF4] 7 and [bmim][PF6] 8 in acetonitrile at = 0.50.
Uncertainties are calculated from the linear regression and transformed on calculating the natural logarithm.
R² = 0.99
-9.5
-9
-8.5
-8
-7.5
-7
0.94 0.96 0.98 1 1.02 1.04 1.06
ln(k
1)
*
R² = 0.99
-9.5
-9
-8.5
-8
-7.5
-7
0.94 0.96 0.98 1 1.02 1.04 1.06
ln(k
1)
*
S19
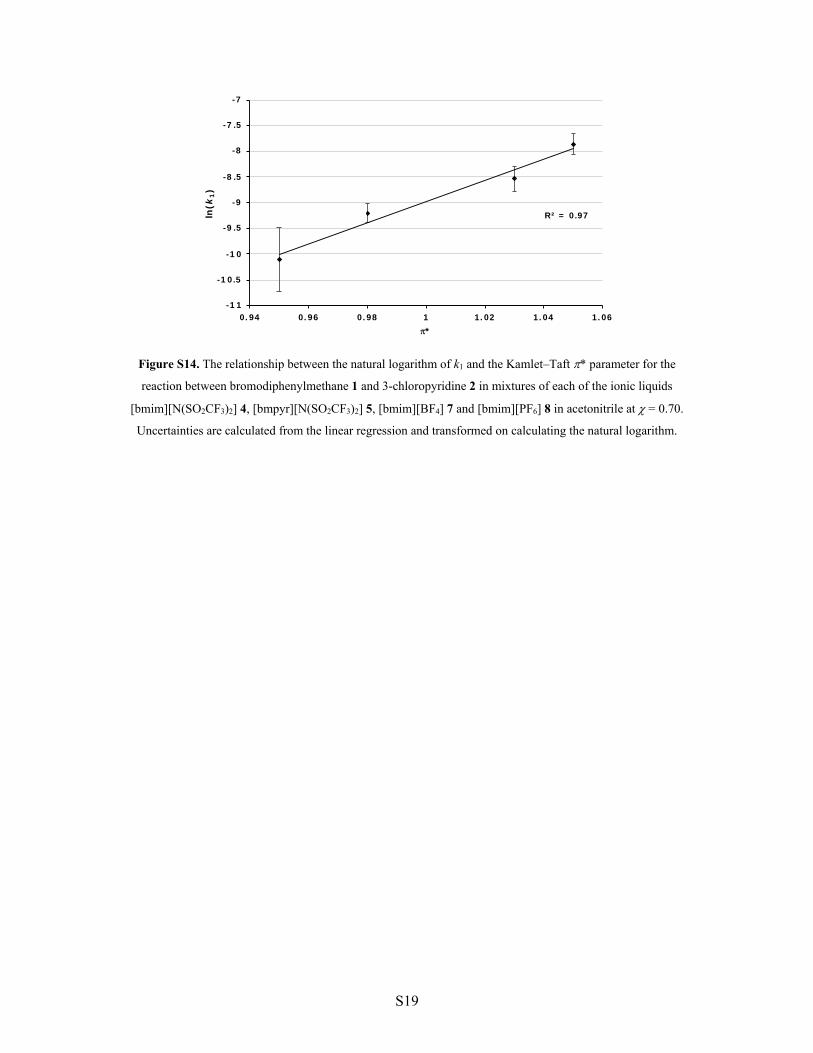
Figure S14. The relationship between the natural logarithm of k1 and the Kamlet–Taft * parameter for the
reaction between bromodiphenylmethane 1 and 3-chloropyridine 2 in mixtures of each of the ionic liquids
[bmim][N(SO2CF3)2] 4, [bmpyr][N(SO2CF3)2] 5, [bmim][BF4] 7 and [bmim][PF6] 8 in acetonitrile at = 0.70.
Uncertainties are calculated from the linear regression and transformed on calculating the natural logarithm.
R² = 0.97
-11
-10.5
-10
-9.5
-9
-8.5
-8
-7.5
-7
0.94 0.96 0.98 1 1.02 1.04 1.06
ln(k
1)
*
S20
Kamlet–Taft multiparameter fitting plots
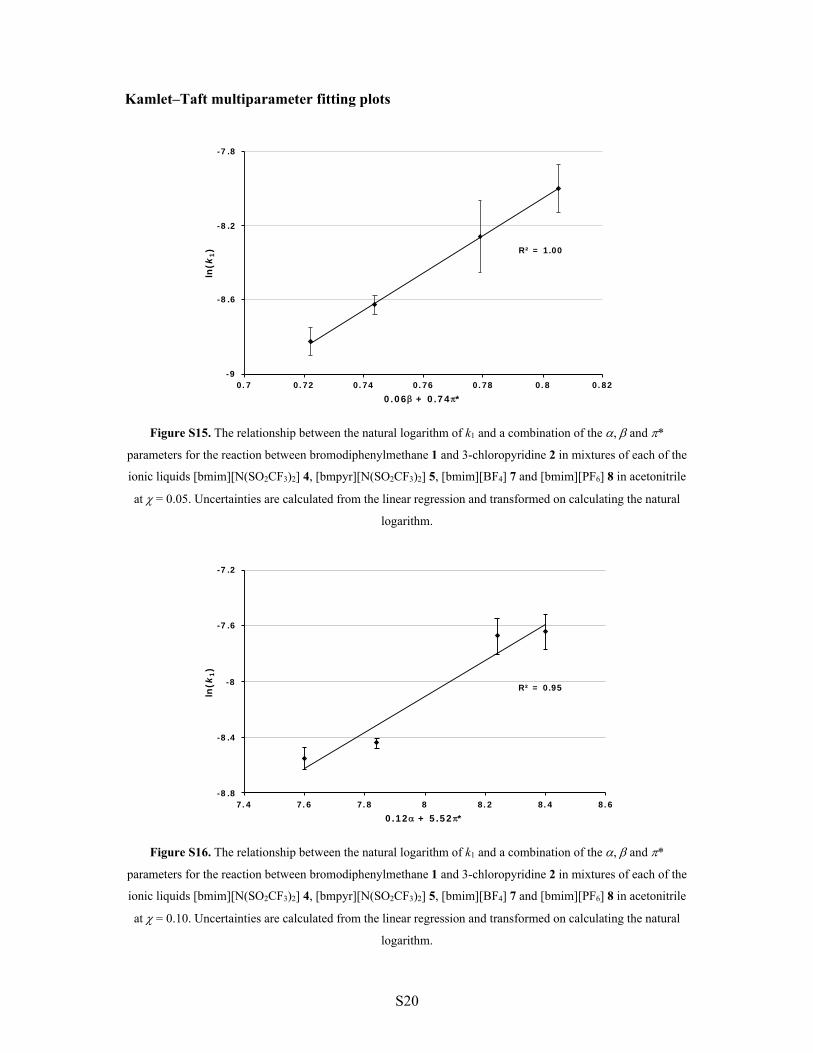
Figure S15. The relationship between the natural logarithm of k1 and a combination of the , and *
parameters for the reaction between bromodiphenylmethane 1 and 3-chloropyridine 2 in mixtures of each of the
ionic liquids [bmim][N(SO2CF3)2] 4, [bmpyr][N(SO2CF3)2] 5, [bmim][BF4] 7 and [bmim][PF6] 8 in acetonitrile
at = 0.05. Uncertainties are calculated from the linear regression and transformed on calculating the natural
logarithm.
Figure S16. The relationship between the natural logarithm of k1 and a combination of the , and *
parameters for the reaction between bromodiphenylmethane 1 and 3-chloropyridine 2 in mixtures of each of the
ionic liquids [bmim][N(SO2CF3)2] 4, [bmpyr][N(SO2CF3)2] 5, [bmim][BF4] 7 and [bmim][PF6] 8 in acetonitrile
at = 0.10. Uncertainties are calculated from the linear regression and transformed on calculating the natural
logarithm.
R² = 1.00
-9
-8.6
-8.2
-7.8
0.7 0.72 0.74 0.76 0.78 0.8 0.82
ln(k
1)
0.06 + 0.74*
R² = 0.95
-8.8
-8.4
-8
-7.6
-7.2
7.4 7.6 7.8 8 8.2 8.4 8.6
ln(k
1)
0.12 + 5.52*
S21
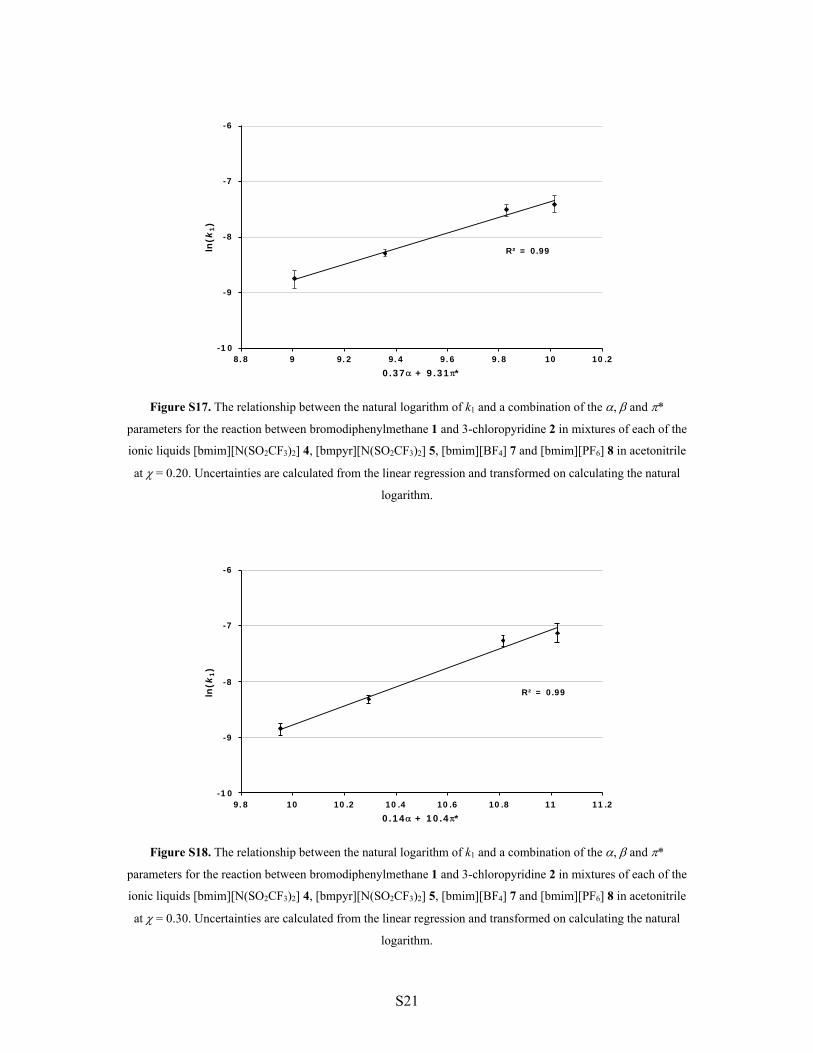
Figure S17. The relationship between the natural logarithm of k1 and a combination of the , and *
parameters for the reaction between bromodiphenylmethane 1 and 3-chloropyridine 2 in mixtures of each of the
ionic liquids [bmim][N(SO2CF3)2] 4, [bmpyr][N(SO2CF3)2] 5, [bmim][BF4] 7 and [bmim][PF6] 8 in acetonitrile
at = 0.20. Uncertainties are calculated from the linear regression and transformed on calculating the natural
logarithm.
Figure S18. The relationship between the natural logarithm of k1 and a combination of the , and *
parameters for the reaction between bromodiphenylmethane 1 and 3-chloropyridine 2 in mixtures of each of the
ionic liquids [bmim][N(SO2CF3)2] 4, [bmpyr][N(SO2CF3)2] 5, [bmim][BF4] 7 and [bmim][PF6] 8 in acetonitrile
at = 0.30. Uncertainties are calculated from the linear regression and transformed on calculating the natural
logarithm.
R² = 0.99
-10
-9
-8
-7
-6
8.8 9 9.2 9.4 9.6 9.8 10 10.2
ln(k
1)
0.37 + 9.31*
R² = 0.99
-10
-9
-8
-7
-6
9.8 10 10.2 10.4 10.6 10.8 11 11.2
ln(k
1)
0.14 + 10.4*
S22
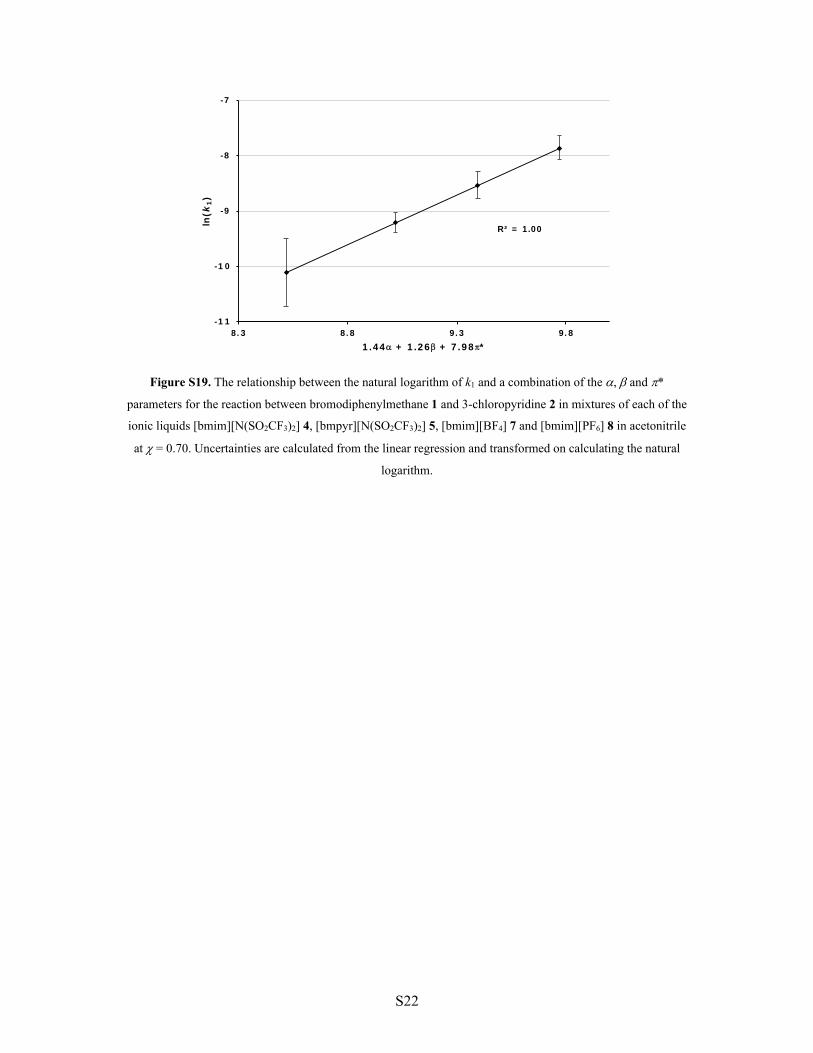
Figure S19. The relationship between the natural logarithm of k1 and a combination of the , and *
parameters for the reaction between bromodiphenylmethane 1 and 3-chloropyridine 2 in mixtures of each of the
ionic liquids [bmim][N(SO2CF3)2] 4, [bmpyr][N(SO2CF3)2] 5, [bmim][BF4] 7 and [bmim][PF6] 8 in acetonitrile
at = 0.70. Uncertainties are calculated from the linear regression and transformed on calculating the natural
logarithm.
R² = 1.00
-11
-10
-9
-8
-7
8.3 8.8 9.3 9.8
ln(k
1)
1.44 + 1.26 + 7.98*
S23
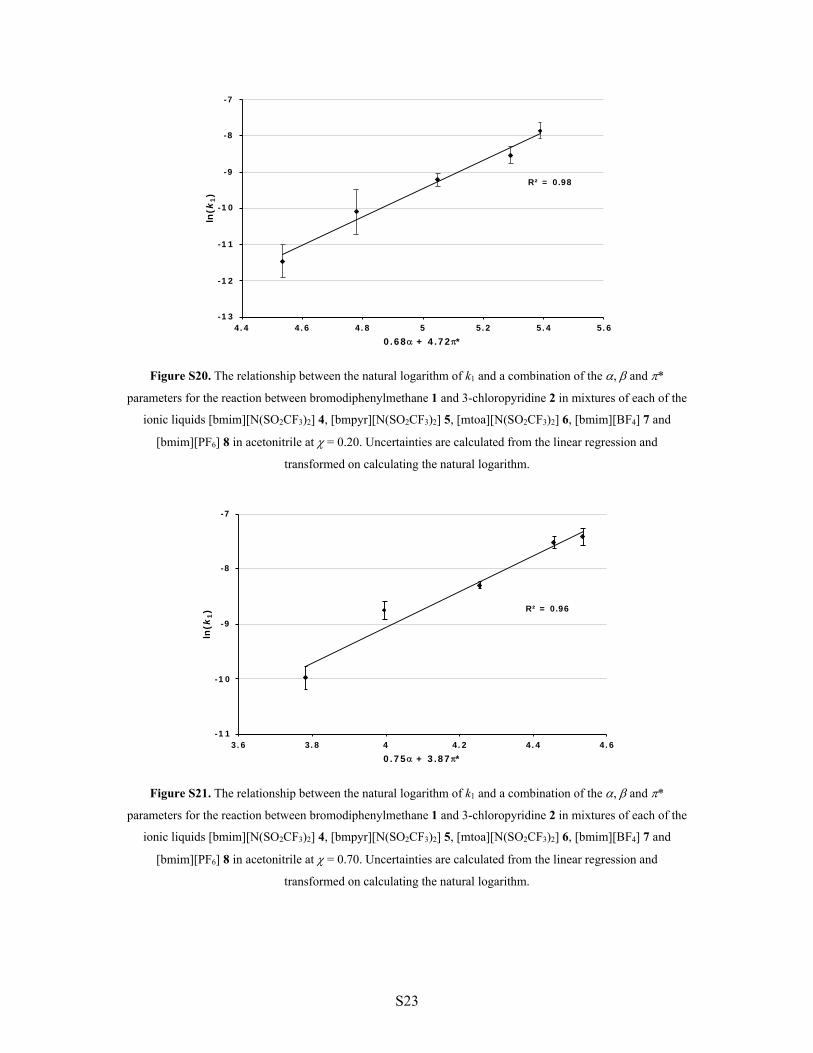
Figure S20. The relationship between the natural logarithm of k1 and a combination of the , and *
parameters for the reaction between bromodiphenylmethane 1 and 3-chloropyridine 2 in mixtures of each of the
ionic liquids [bmim][N(SO2CF3)2] 4, [bmpyr][N(SO2CF3)2] 5, [mtoa][N(SO2CF3)2] 6, [bmim][BF4] 7 and
[bmim][PF6] 8 in acetonitrile at = 0.20. Uncertainties are calculated from the linear regression and
transformed on calculating the natural logarithm.
Figure S21. The relationship between the natural logarithm of k1 and a combination of the , and *
parameters for the reaction between bromodiphenylmethane 1 and 3-chloropyridine 2 in mixtures of each of the
ionic liquids [bmim][N(SO2CF3)2] 4, [bmpyr][N(SO2CF3)2] 5, [mtoa][N(SO2CF3)2] 6, [bmim][BF4] 7 and
[bmim][PF6] 8 in acetonitrile at = 0.70. Uncertainties are calculated from the linear regression and
transformed on calculating the natural logarithm.
R² = 0.98
-13
-12
-11
-10
-9
-8
-7
4.4 4.6 4.8 5 5.2 5.4 5.6
ln(k
1)
0.68 + 4.72*
R² = 0.96
-11
-10
-9
-8
-7
3.6 3.8 4 4.2 4.4 4.6
ln(k
1)
0.75 + 3.87*
S24
Rate data for the mole fraction dependence studies
Table S2. The mole fraction of [bmpyr][N(SO2CF3)2] 5, the exact amounts of ionic liquid 5, acetonitrile, the
bromide 1 and the nucleophile 2, the nucleophile 2 concentration, the observed pseudo first order rate constant
(kobs) and the resultant k1 and k2 for each stock solution.
χ5 Mass ionic
liquid / g
Mass acetonitrile
/ g
Mass bromine
1 / g
Mass pyridine
2 / g
[Nu] / mol L-1
kobs / 10-4
s-1 k1 / 10-4 s-1
k2 / 10-4 L mol-1 s-1
0.05 0.616 1.147 0.0045 0.107 0.473 3.02 1.47 (0.12) 3.44 (0.31) 3.19
0.626
1.150
0.0040
0.088
0.388 3.05 2.78
2.80
0.637
1.150
0.0046
0.064
0.283 2.75 2.34
0.687 0.653
1.150 1.180
0.0048 0.0044
0.069 0.046
0.303 0.203
2.57 2.77 2.13
2.14 2.10
0.11 1.013 0.902 0.0038 0.105 0.461 3.77 1.93 (0.15) 4.03 (0.44) 3.96
1.012
0.913
0.0038
0.089
0.391 4.04 3.35
3.24
1.017
0.906
0.0043
0.064
0.281 3.33 3.16
3.11
1.110
0.901
0.0031
0.045
0.196 3.10 2.66
1.121
0.902
0.0035
0.044
0.192 2.69 2.83
0.20 1.553 0.602 0.0040 0.106 0.468 4.22 1.57 (0.26) 6.68 (0.75) 4.75
1.550
0.610
0.0038
0.085
0.374 4.75 4.03
4.62
1.452
0.645
0.0041
0.068
0.299 4.18 3.36
3.79
1.534
0.630
0.0038
0.045
0.199 3.53 2.80
2.83 2.87
S25
0.30 1.814 0.402 0.0049 0.105 0.464 4.70 1.43 (0.16) 7.28 (0.48) 4.83
1.840
0.415
0.0042
0.085
0.375 4.83 3.89
4.59
1.900
0.420
0.0040
0.060
0.264 4.10 3.30
3.34
1.900
0.440
0.0040
0.045
0.198 3.39 2.88
2.90 2.82
0.48 1.814 0.402 0.0049 0.105 0.501 4.59 1.13 (0.28) 7.28 (0.79) 4.68
1.840
0.415
0.0042
0.085
0.371 4.68 3.70
4.26
1.900
0.420
0.0040
0.060
0.300 4.28 3.07
3.67
1.900
0.440
0.0040
0.045
0.203 3.09 2.30
2.42 2.85
0.70 2.425 0.070 0.0043 0.106 0.469 4.29 0.41 (0.25) 9.38 (0.71) 4.80
2.430
0.080
0.0037
0.097
0.429 4.67 5.01
4.56
2.491
0.081
0.0040
0.077
0.338 4.75 3.48
3.46
2.447
0.081
0.0043
0.067
0.295 3.27 3.15
3.03
2.499
0.092
0.0041
0.045
0.198 3.35 2.37
2.24 2.25 0.87 6.646 0.000 0.0098 0.257 0.453 3.78 0.70 (0.19) 7.48 (0.61)
3.77
6.692
0.022
0.0100
0.193
0.339 4.49 3.55
3.36
6.701
0.052
0.0096
0.132
0.232 3.12 2.77
S26
2.37
6.727
0.075
0.0106
0.072
0.127 2.25 1.63
1.48 1.68
S27
Table S3. The mole fraction of [mtoa][N(SO2CF3)2] 6, the exact amounts of ionic liquid 6, acetonitrile, the
bromide 1 and the nucleophile 2, the nucleophile 2 concentration, the observed pseudo first order rate constant
(kobs) and the resultant k1 and k2 for each stock solution.
χ6
Mass ionic
liquid / g
Mass acetonitrile
/ g
Mass bromide
1 / g
Mass pyridine
2 / g
[Nu] / mol L-1
kobs / 10-4
s-1 k1 / 10-4 s-1 k2 / 10-4 L
mol-1 s-1
0.01 0.199 1.360 0.0035 0.103 0.454 1.23 0.48 (0.06) 1.71 (0.18) 1.35
0.247
1.360
0.0039
0.085
0.372 1.21 1.15
1.18
0.229
1.360
0.0036
0.066
0.288 1.03 0.93
1.00
0.212
1.370
0.0033
0.045
0.197 0.93 0.82
0.79 0.89
0.03 0.507 1.200 0.0049 0.105 0.464 1.36 0.77 (0.05) 1.39 (0.13) 1.47
0.394
1.210
0.0048
0.085
0.373 1.41 1.30
0.492
1.210
0.0041
0.063
0.277
1.28 1.14
1.12
0.470
1.230
0.0049
0.048
0.210 1.17 1.02
1.02 1.15
0.06 0.841 0.901 0.0039 0.105 0.464 1.59 0.76 (0.08) 1.53 (0.26) 1.41
0.797
0.907
0.0038
0.085
0.372 1.43 1.32
1.22
0.859
0.902
0.0036
0.065
0.284 1.26 1.44
1.20 1.34 1.10
0.861
0.906
0.0048
0.046
0.203 1.09 0.91
0.830
0.951
0.0033
0.034
0.151 1.00 1.06
0.98
S28
1.00 0.11 1.162 0.650 0.0036 0.106 0.466 1.37 0.66 (0.07) 1.50 (0.21)
1.37
1.200
0.650
0.0038
0.086
0.377 1.34 1.28
1.22
1.187
0.651
0.0036
0.066
0.291 1.19 0.99
1.14
1.193
0.649
0.0045
0.048
0.213 1.01 0.94
0.86 1.21 1.05 1.16
1.160
0.673
0.0045
0.026
0.112 0.90 0.75
0.81
0.19 1.547 0.400 0.0049 0.107 0.470 1.27 0.46 (0.10) 1.33 (0.28) 1.03
1.471 1.546
0.401 0.401
0.0045 0.0047
0.088 0.089
0.388 0.394
1.15 0.98 0.87
1.500
0.401
0.0042
0.065
0.285 0.82 0.92
0.76
1.506
0.420
0.004
0.050
0.198 0.89 0.74
0.78 0.71
0.3 1.778 0.220 0.0038 0.104 0.459 1.33 0.42 (0.02) 1.70 (0.44) 1.37
1.730
0.233
0.0042
0.087
0.383 0.97 1.15
0.99
1.731
0.244
0.0042
0.067
0.296 0.87 0.95
0.92
1.749
0.256
0.0038
0.044
0.195 1.04 0.74
0.72
0.39 1.806 0.148 0.0045 0.110 0.485 1.18 0.32 (0.04) 1.87 (0.11) 1.27
1.891
0.159
0.0038
0.083
0.366 1.28 0.99
1.03
S29
1.839
0.170
0.0039
0.064
0.283
0.92 0.85
0.87
1.849
0.173
0.0039
0.045
0.196 0.85 0.69
0.70 0.70
0.49 1.906 0.092 0.004 0.105 0.461 1.10 0.22 (0.08) 1.97 (0.24) 1.14
1.871
0.103
0.0036
0.087
0.385 1.14 1.11
1.04
1.900
0.111
0.0041
0.069
0.303 0.86 0.70
0.85
1.929
0.120
0.0042
0.045
0.196 0.71 0.66
0.62 0.61
0.69 1.986 0.021 0.0039 0.107 0.470 1.18 0.11 (0.05) 2.27 (0.15) 1.21
2.028
0.030
0.0035
0.087
0.384 1.10 1.03
1.02
2.037
0.035
0.0048
0.064
0.283 1.00 0.78
0.71
2.037
0.041
0.004
0.043
0.191 0.78 0.42
0.39
2.000
0.050
0.0044
0.024
0.107 0.47 0.43
0.37 0.45
S30
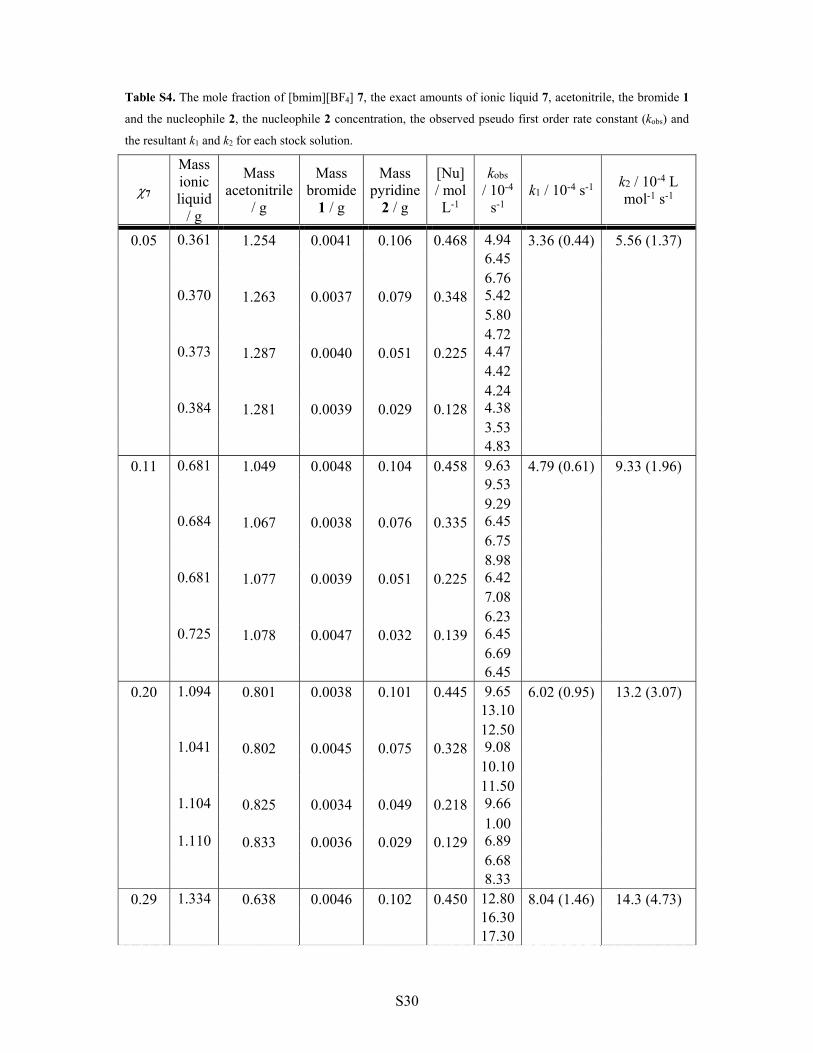
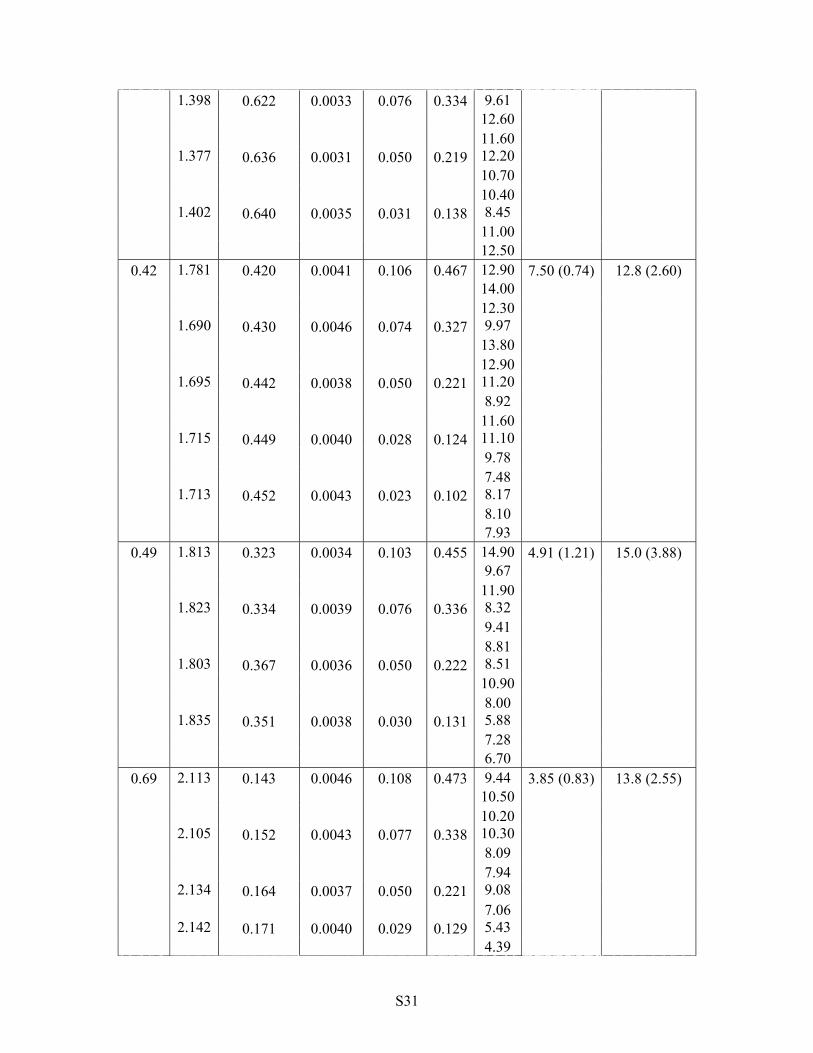
Table S4. The mole fraction of [bmim][BF4] 7, the exact amounts of ionic liquid 7, acetonitrile, the bromide 1
and the nucleophile 2, the nucleophile 2 concentration, the observed pseudo first order rate constant (kobs) and
the resultant k1 and k2 for each stock solution.
7
Mass ionic liquid
/ g
Mass acetonitrile
/ g
Mass bromide
1 / g
Mass pyridine
2 / g
[Nu] / mol L-1
kobs / 10-4
s-1 k1 / 10-4 s-1 k2 / 10-4 L
mol-1 s-1
0.05 0.361 1.254 0.0041 0.106 0.468 4.94 3.36 (0.44) 5.56 (1.37) 6.45
0.370
1.263
0.0037
0.079
0.348 6.76 5.42
5.80
0.373
1.287
0.0040
0.051
0.225 4.72 4.47
4.42
0.384
1.281
0.0039
0.029
0.128 4.24 4.38
3.53 4.83
0.11 0.681 1.049 0.0048 0.104 0.458 9.63 4.79 (0.61) 9.33 (1.96) 9.53
0.684
1.067
0.0038
0.076
0.335 9.29 6.45
6.75
0.681
1.077
0.0039
0.051
0.225 8.98 6.42
7.08
0.725
1.078
0.0047
0.032
0.139 6.23 6.45
6.69 6.45
0.20 1.094 0.801 0.0038 0.101 0.445 9.65 6.02 (0.95) 13.2 (3.07) 13.10
1.041
0.802
0.0045
0.075
0.328 12.50 9.08
10.10
1.104
0.825
0.0034
0.049
0.218 11.50 9.66
1.110
0.833
0.0036
0.029
0.129 1.00 6.89
6.68 8.33
0.29 1.334 0.638 0.0046 0.102 0.450 12.80 8.04 (1.46) 14.3 (4.73) 16.30 17.30
S31
1.398 0.622 0.0033 0.076 0.334 9.61 12.60
1.377
0.636
0.0031
0.050
0.219 11.60 12.20
10.70
1.402
0.640
0.0035
0.031
0.138 10.40 8.45
11.00 12.50
0.42 1.781 0.420 0.0041 0.106 0.467 12.90 7.50 (0.74) 12.8 (2.60) 14.00
1.690
0.430
0.0046
0.074
0.327 12.30 9.97
13.80
1.695
0.442
0.0038
0.050
0.221 12.90 11.20
8.92
1.715
0.449
0.0040
0.028
0.124 11.60 11.10
9.78
1.713
0.452
0.0043
0.023
0.102 7.48 8.17
8.10 7.93
0.49 1.813 0.323 0.0034 0.103 0.455 14.90 4.91 (1.21) 15.0 (3.88) 9.67
1.823
0.334
0.0039
0.076
0.336 11.90 8.32
9.41
1.803
0.367
0.0036
0.050
0.222 8.81 8.51
10.90
1.835
0.351
0.0038
0.030
0.131 8.00 5.88
7.28 6.70
0.69 2.113 0.143 0.0046 0.108 0.473 9.44 3.85 (0.83) 13.8 (2.55) 10.50
2.105
0.152
0.0043
0.077
0.338 10.20 10.30
8.09
2.134
0.164
0.0037
0.050
0.221 7.94 9.08
2.142
0.171
0.0040
0.029
0.129 7.06 5.43
4.39
S32
5.09 0.79 5.499 0.152 0.0114 0.263 0.463 10.40 2.56 (0.36) 16.2 (1.14)
10.40
5.468
0.214
0.0097
0.199
0.350 9.96 8.67
7.86
5.513
0.237
0.0098
0.129
0.227 7.30 6.96
6.39
5.541
0.260
0.0099
0.075
0.131 5.94 4.95
4.22 4.96
S33
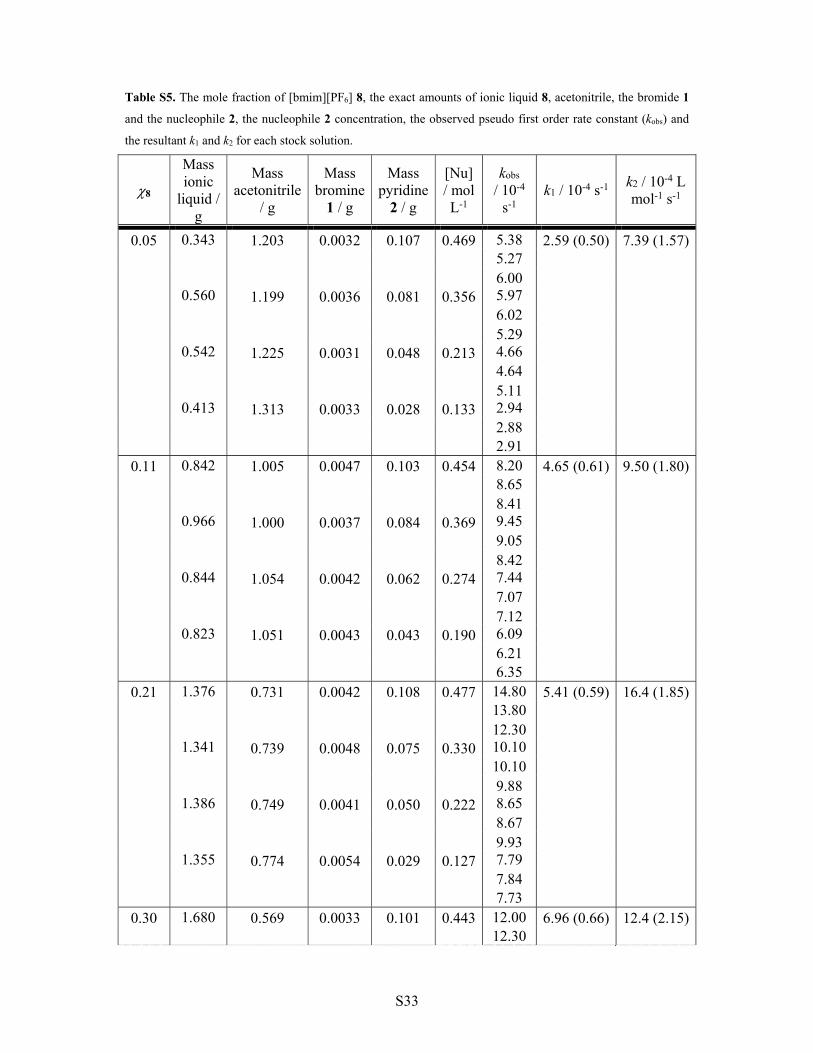
Table S5. The mole fraction of [bmim][PF6] 8, the exact amounts of ionic liquid 8, acetonitrile, the bromide 1
and the nucleophile 2, the nucleophile 2 concentration, the observed pseudo first order rate constant (kobs) and
the resultant k1 and k2 for each stock solution.
8
Mass ionic
liquid / g
Mass acetonitrile
/ g
Mass bromine
1 / g
Mass pyridine
2 / g
[Nu] / mol L-1
kobs / 10-4
s-1 k1 / 10-4 s-1 k2 / 10-4 L
mol-1 s-1
0.05 0.343 1.203 0.0032 0.107 0.469 5.38 2.59 (0.50) 7.39 (1.57) 5.27
0.560
1.199
0.0036
0.081
0.356 6.00 5.97
6.02
0.542
1.225
0.0031
0.048
0.213 5.29 4.66
4.64
0.413
1.313
0.0033
0.028
0.133 5.11 2.94
2.88 2.91
0.11 0.842 1.005 0.0047 0.103 0.454 8.20 4.65 (0.61) 9.50 (1.80) 8.65
0.966
1.000
0.0037
0.084
0.369 8.41 9.45
9.05
0.844
1.054
0.0042
0.062
0.274 8.42 7.44
7.07
0.823
1.051
0.0043
0.043
0.190 7.12 6.09
6.21 6.35
0.21 1.376 0.731 0.0042 0.108 0.477 14.80 5.41 (0.59) 16.4 (1.85) 13.80
1.341
0.739
0.0048
0.075
0.330 12.30 10.10
10.10
1.386
0.749
0.0041
0.050
0.222 9.88 8.65
8.67
1.355
0.774
0.0054
0.029
0.127 9.93 7.79
7.84 7.73
0.30 1.680 0.569 0.0033 0.101 0.443 12.00 6.96 (0.66) 12.4 (2.15) 12.30
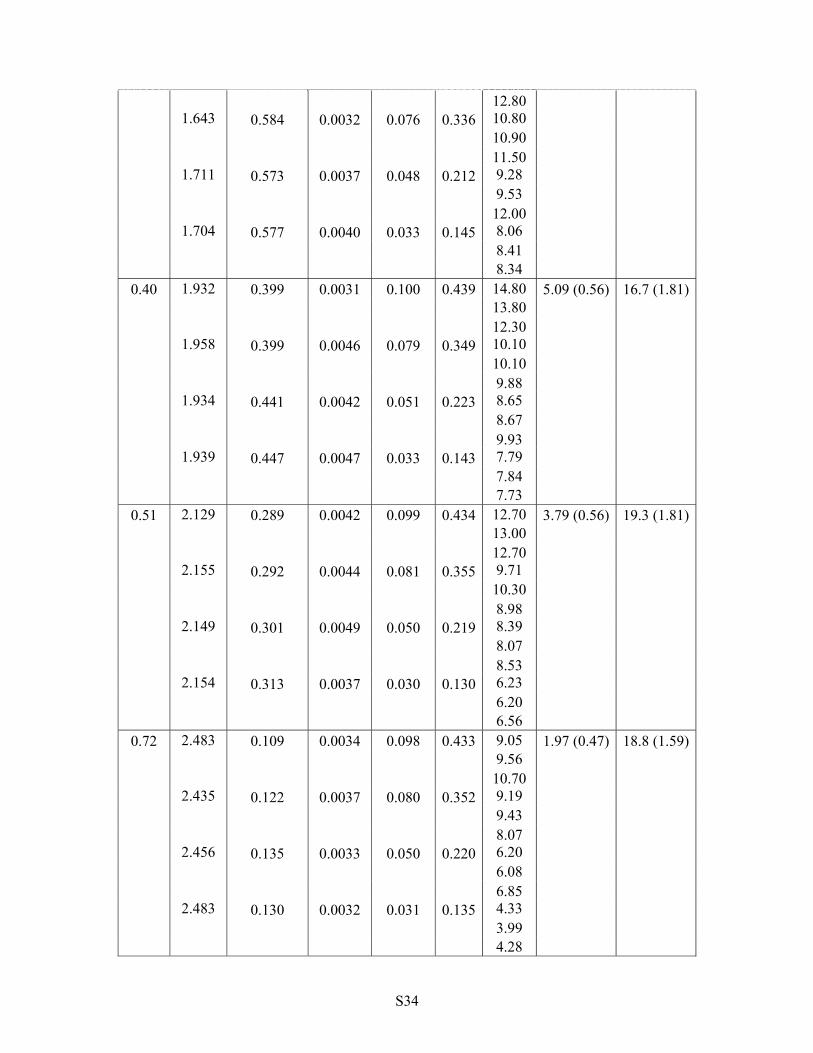
S34
1.643
0.584
0.0032
0.076
0.336
12.80 10.80
10.90
1.711
0.573
0.0037
0.048
0.212 11.50 9.28
9.53
1.704
0.577
0.0040
0.033
0.145 12.00 8.06
8.41 8.34
0.40 1.932 0.399 0.0031 0.100 0.439 14.80 5.09 (0.56) 16.7 (1.81) 13.80
1.958
0.399
0.0046
0.079
0.349 12.30 10.10
10.10
1.934
0.441
0.0042
0.051
0.223 9.88 8.65
8.67
1.939
0.447
0.0047
0.033
0.143 9.93 7.79
7.84 7.73
0.51 2.129 0.289 0.0042 0.099 0.434 12.70 3.79 (0.56) 19.3 (1.81) 13.00
2.155
0.292
0.0044
0.081
0.355 12.70 9.71
10.30
2.149
0.301
0.0049
0.050
0.219 8.98 8.39
8.07
2.154
0.313
0.0037
0.030
0.130 8.53 6.23
6.20 6.56
0.72 2.483 0.109 0.0034 0.098 0.433 9.05 1.97 (0.47) 18.8 (1.59) 9.56
2.435
0.122
0.0037
0.080
0.352 10.70 9.19
9.43
2.456
0.135
0.0033
0.050
0.220 8.07 6.20
6.08
2.483
0.130
0.0032
0.031
0.135 6.85 4.33
3.99 4.28
S35
0.80 6.274 0.140 0.0103 0.261 0.460 9.83 2.34 (0.67) 14.7 (2.09) 8.95
6.295
0.171
0.0101
0.203
0.358
9.20 8.08
6.90
6.325
0.199
0.0102
0.131
0.231 6.50 7.71
5.71
6.332
0.231
0.0100
0.076
0.135 4.51 4.13
4.58 4.14
S36
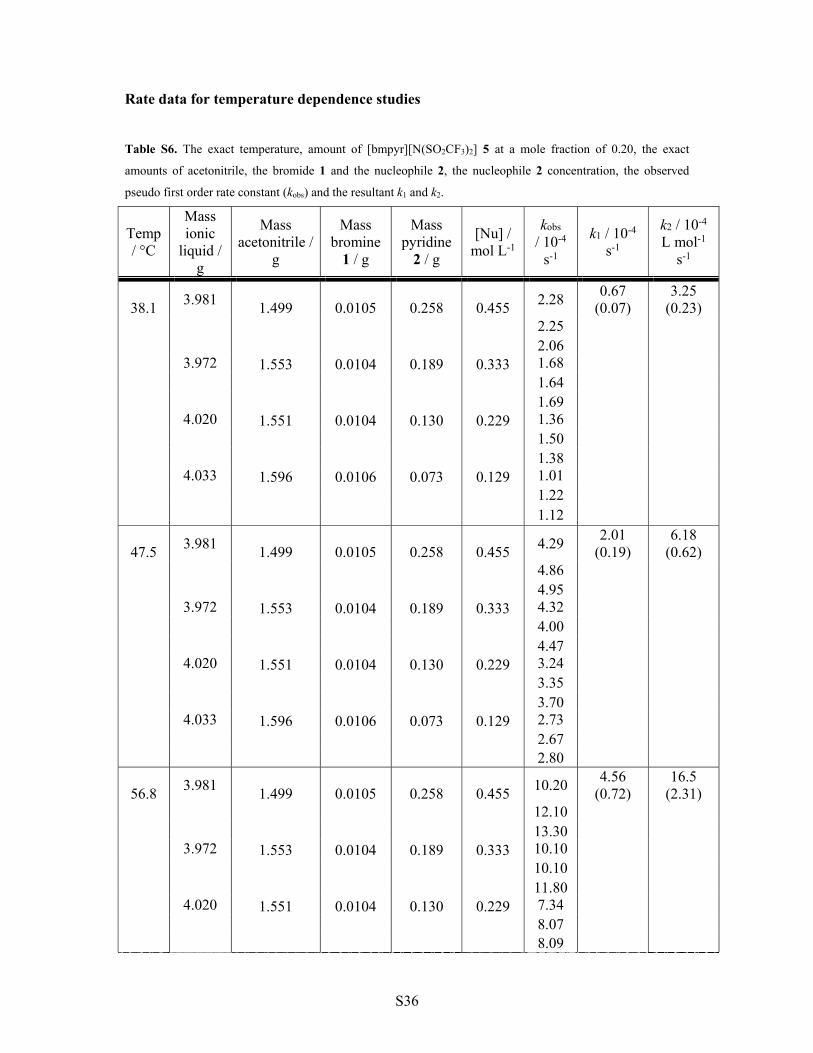
Rate data for temperature dependence studies
Table S6. The exact temperature, amount of [bmpyr][N(SO2CF3)2] 5 at a mole fraction of 0.20, the exact
amounts of acetonitrile, the bromide 1 and the nucleophile 2, the nucleophile 2 concentration, the observed
pseudo first order rate constant (kobs) and the resultant k1 and k2.
Temp / °C
Mass ionic
liquid / g
Mass acetonitrile /
g
Mass bromine
1 / g
Mass pyridine
2 / g
[Nu] / mol L-1
kobs / 10-4
s-1
k1 / 10-4 s-1
k2 / 10-4 L mol-1
s-1
38.1 3.981
1.499 0.0105 0.258 0.455 2.28
0.67 (0.07)
3.25 (0.23)
2.25
3.972
1.553
0.0104
0.189
0.333 2.06 1.68
1.64
4.020
1.551
0.0104
0.130
0.229 1.69 1.36
1.50
4.033
1.596
0.0106
0.073
0.129 1.38 1.01
1.22
1.12
47.5 3.981
1.499 0.0105 0.258 0.455 4.29
2.01 (0.19)
6.18 (0.62)
4.86
3.972
1.553
0.0104
0.189
0.333 4.95 4.32
4.00
4.020
1.551
0.0104
0.130
0.229 4.47 3.24
3.35
4.033
1.596
0.0106
0.073
0.129 3.70 2.73
2.67 2.80
56.8 3.981
1.499 0.0105 0.258 0.455 10.20
4.56 (0.72)
16.5 (2.31)
12.10
3.972
1.553
0.0104
0.189
0.333 13.30 10.10
10.10
4.020
1.551
0.0104
0.130
0.229 11.80 7.34
8.07 8.09
S37
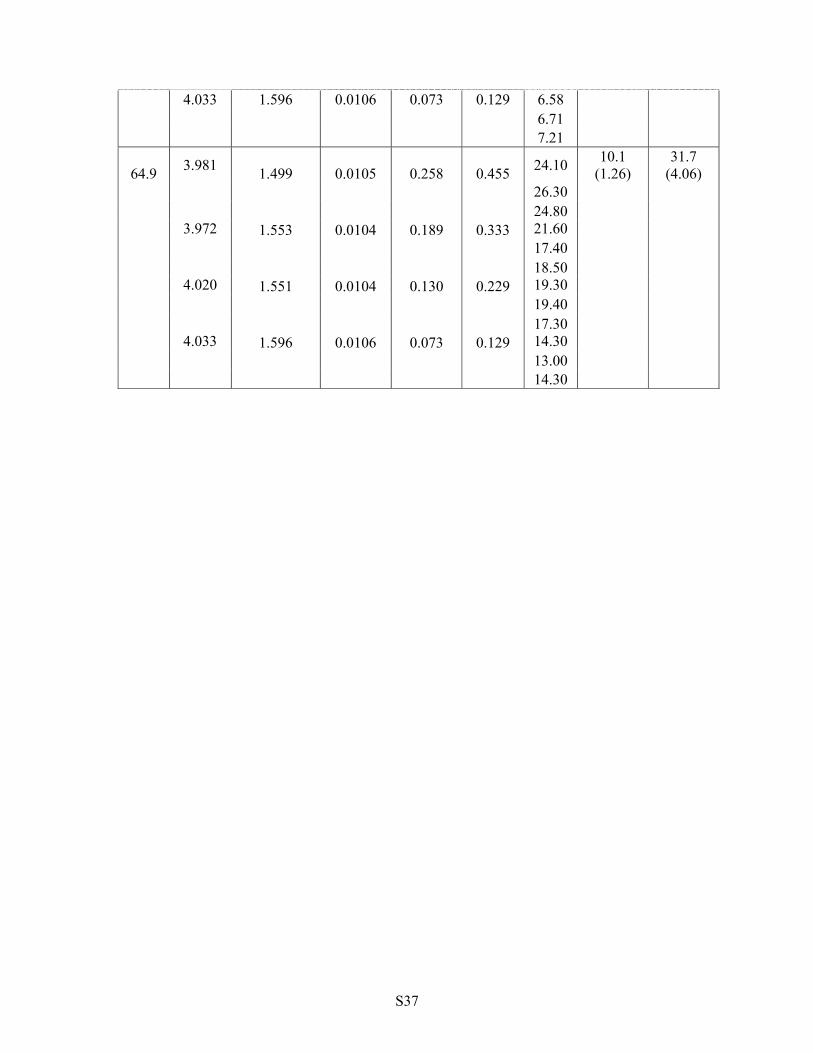
4.033 1.596 0.0106 0.073 0.129 6.58 6.71 7.21
64.9 3.981
1.499 0.0105 0.258 0.455 24.10
10.1 (1.26)
31.7 (4.06)
26.30
3.972
1.553
0.0104
0.189
0.333 24.80 21.60
17.40
4.020
1.551
0.0104
0.130
0.229 18.50 19.30
19.40
4.033
1.596
0.0106
0.073
0.129 17.30 14.30
13.00 14.30
S38
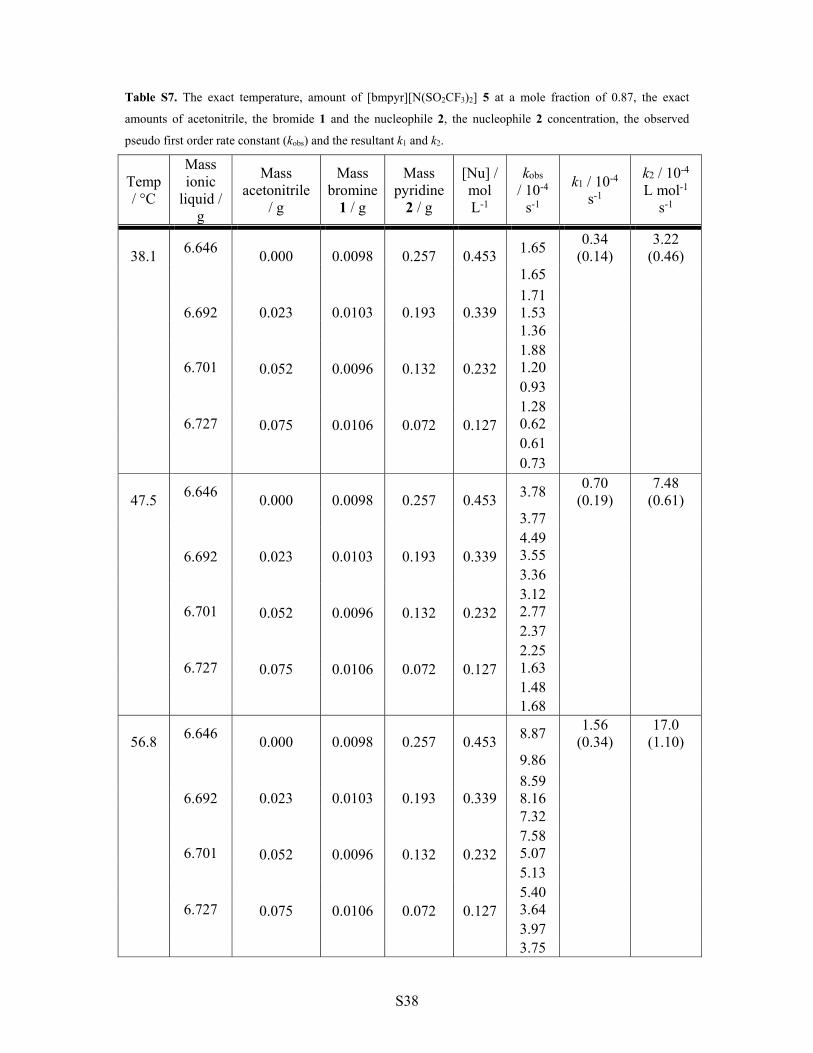
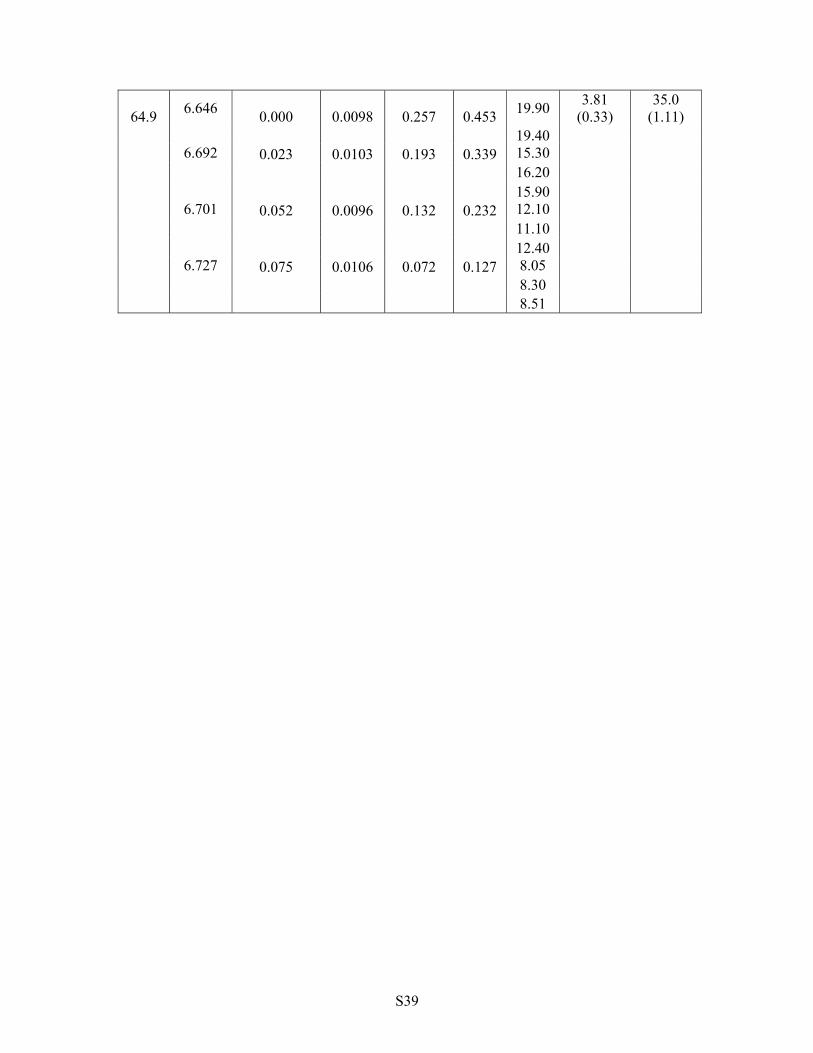
Table S7. The exact temperature, amount of [bmpyr][N(SO2CF3)2] 5 at a mole fraction of 0.87, the exact
amounts of acetonitrile, the bromide 1 and the nucleophile 2, the nucleophile 2 concentration, the observed
pseudo first order rate constant (kobs) and the resultant k1 and k2.
Temp / °C
Mass ionic
liquid / g
Mass acetonitrile
/ g
Mass bromine
1 / g
Mass pyridine
2 / g
[Nu] / mol L-1
kobs / 10-4
s-1
k1 / 10-4 s-1
k2 / 10-4 L mol-1
s-1
38.1 6.646
0.000 0.0098 0.257 0.453 1.65
0.34 (0.14)
3.22 (0.46)
1.65
6.692
0.023 0.0103
0.193
0.339
1.71 1.53
1.36
6.701
0.052
0.0096
0.132
0.232 1.88 1.20
0.93
6.727
0.075
0.0106
0.072
0.127 1.28 0.62
0.61
0.73
47.5 6.646
0.000 0.0098 0.257 0.453 3.78
0.70 (0.19)
7.48 (0.61)
3.77
6.692
0.023 0.0103
0.193
0.339
4.49 3.55
3.36
6.701
0.052
0.0096
0.132
0.232 3.12 2.77
2.37
6.727
0.075
0.0106
0.072
0.127 2.25 1.63
1.48 1.68
56.8 6.646
0.000 0.0098 0.257 0.453 8.87
1.56 (0.34)
17.0 (1.10)
9.86
6.692
0.023 0.0103
0.193
0.339
8.59 8.16
7.32
6.701
0.052
0.0096
0.132
0.232 7.58 5.07
5.13
6.727
0.075
0.0106
0.072
0.127 5.40 3.64
3.97 3.75
S39
64.9 6.646
0.000 0.0098 0.257 0.453 19.90
3.81 (0.33)
35.0 (1.11)
6.692
0.023
0.0103
0.193
0.339
19.40 15.30
16.20
6.701
0.052
0.0096
0.132
0.232 15.90 12.10
11.10
6.727
0.075
0.0106
0.072
0.127 12.40 8.05
8.30 8.51
S40
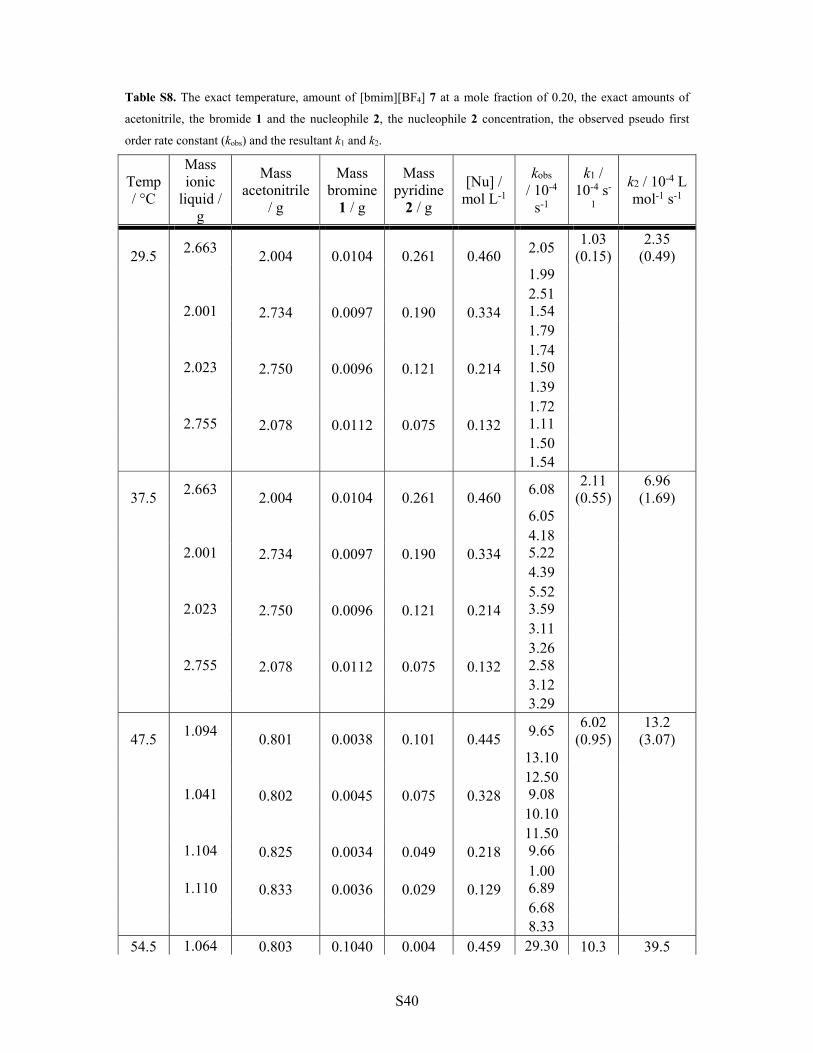
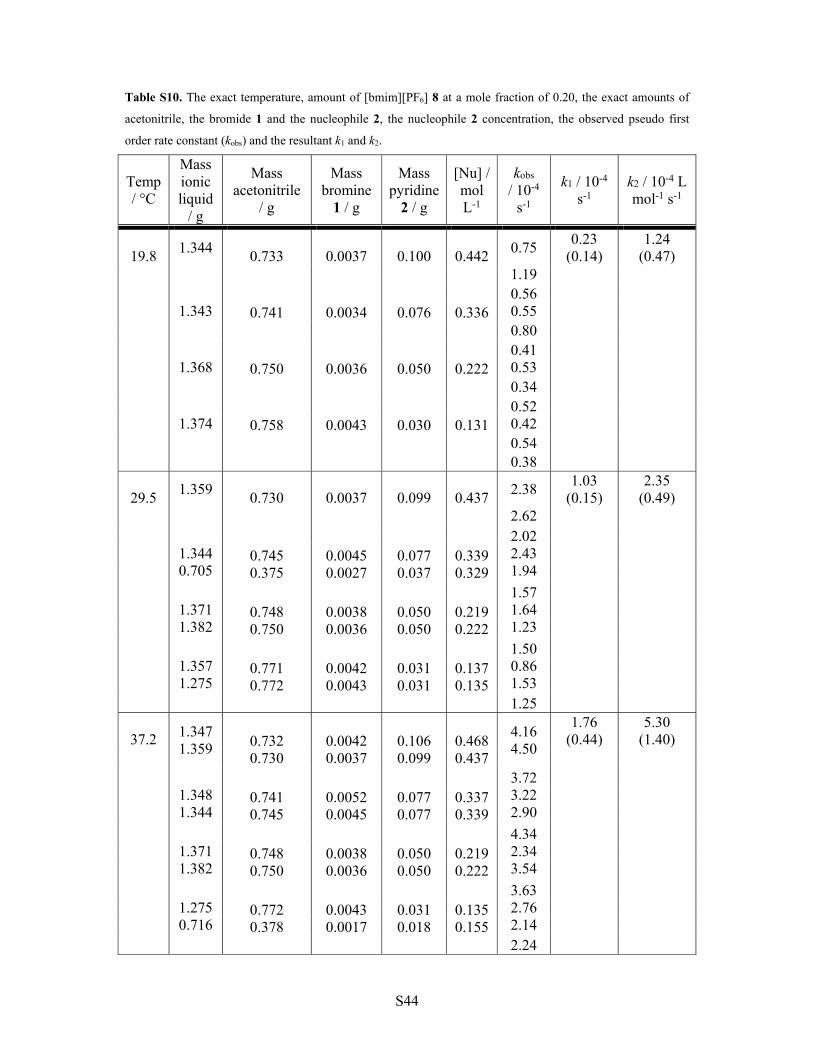
Table S8. The exact temperature, amount of [bmim][BF4] 7 at a mole fraction of 0.20, the exact amounts of
acetonitrile, the bromide 1 and the nucleophile 2, the nucleophile 2 concentration, the observed pseudo first
order rate constant (kobs) and the resultant k1 and k2.
Temp / °C
Mass ionic
liquid / g
Mass acetonitrile
/ g
Mass bromine
1 / g
Mass pyridine
2 / g
[Nu] / mol L-1
kobs / 10-4
s-1
k1 / 10-4 s-
1
k2 / 10-4 L mol-1 s-1
29.5 2.663
2.004 0.0104 0.261 0.460 2.05
1.03 (0.15)
2.35 (0.49)
1.99
2.001
2.734
0.0097
0.190
0.334 2.51 1.54
1.79
2.023
2.750
0.0096
0.121
0.214 1.74 1.50
1.39
2.755
2.078
0.0112
0.075
0.132 1.72 1.11
1.50 1.54
37.5 2.663
2.004 0.0104 0.261 0.460 6.08
2.11 (0.55)
6.96 (1.69)
6.05
2.001
2.734
0.0097
0.190
0.334 4.18 5.22
4.39
2.023
2.750
0.0096
0.121
0.214 5.52 3.59
3.11
2.755
2.078
0.0112
0.075
0.132 3.26 2.58
3.12 3.29
47.5 1.094
0.801 0.0038 0.101 0.445 9.65
6.02 (0.95)
13.2 (3.07)
13.10
1.041
0.802
0.0045
0.075
0.328 12.50 9.08
10.10
1.104
0.825
0.0034
0.049
0.218 11.50 9.66
1.110
0.833
0.0036
0.029
0.129 1.00 6.89
6.68 8.33
54.5 1.064 0.803 0.1040 0.004 0.459 29.30 10.3 39.5
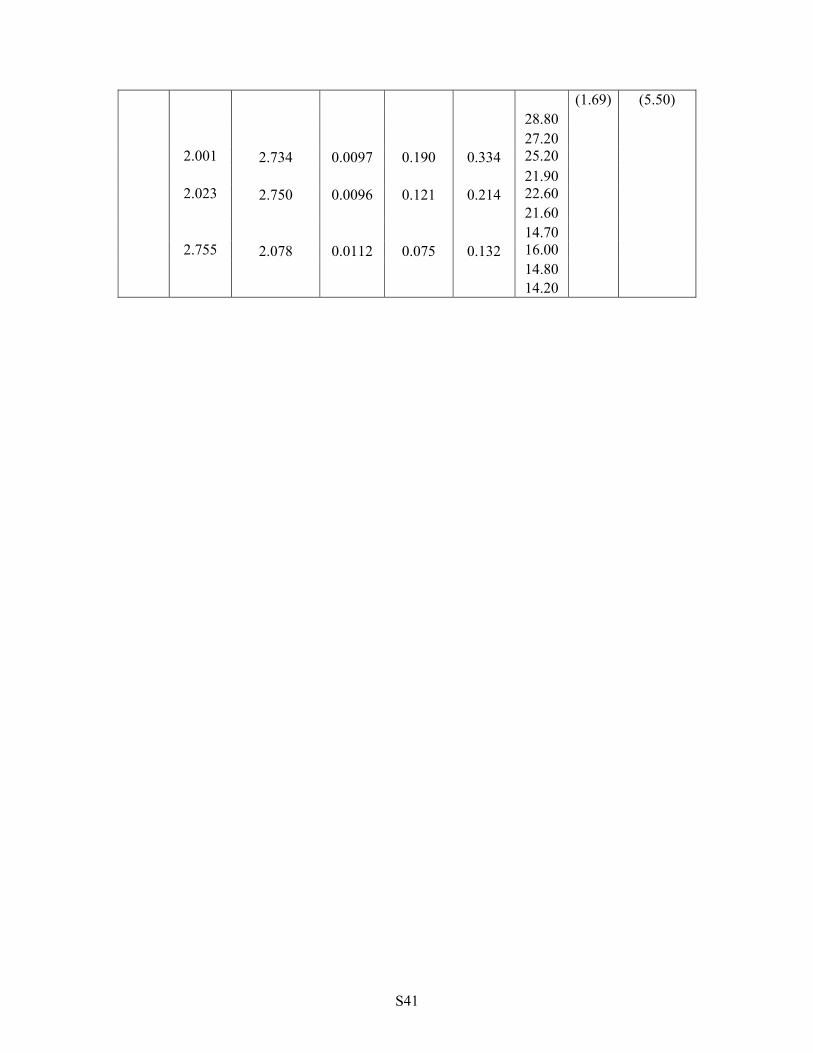
S41
(1.69) (5.50) 28.80
2.001
2.734
0.0097
0.190
0.334 27.20 25.20
2.023
2.750
0.0096
0.121
0.214 21.90 22.60
21.60
2.755
2.078
0.0112
0.075
0.132 14.70 16.00
14.80 14.20
S42
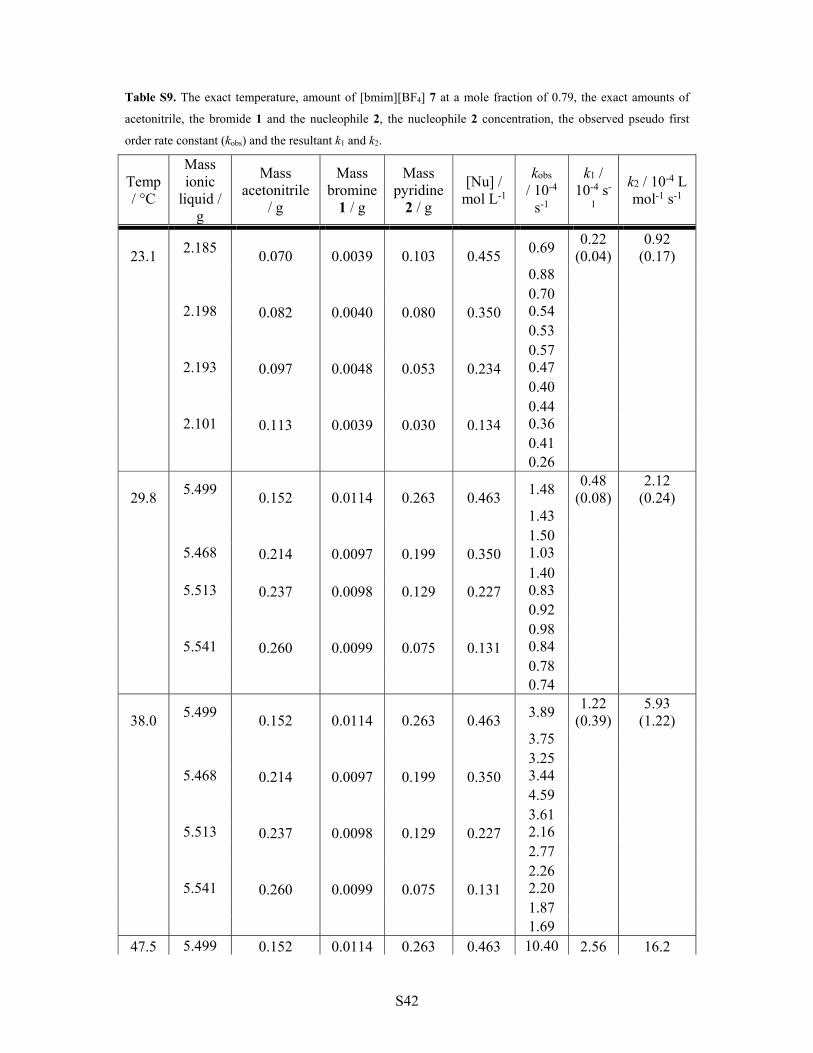
Table S9. The exact temperature, amount of [bmim][BF4] 7 at a mole fraction of 0.79, the exact amounts of
acetonitrile, the bromide 1 and the nucleophile 2, the nucleophile 2 concentration, the observed pseudo first
order rate constant (kobs) and the resultant k1 and k2.
Temp / °C
Mass ionic
liquid / g
Mass acetonitrile
/ g
Mass bromine
1 / g
Mass pyridine
2 / g
[Nu] / mol L-1
kobs / 10-4
s-1
k1 / 10-4 s-
1
k2 / 10-4 L mol-1 s-1
23.1 2.185
0.070 0.0039 0.103 0.455 0.69
0.22 (0.04)
0.92 (0.17)
0.88
2.198
0.082
0.0040
0.080
0.350 0.70 0.54
0.53
2.193
0.097
0.0048
0.053
0.234 0.57 0.47
0.40
2.101
0.113
0.0039
0.030
0.134 0.44 0.36
0.41 0.26
29.8 5.499
0.152 0.0114 0.263 0.463 1.48
0.48 (0.08)
2.12 (0.24)
1.43
5.468
0.214
0.0097
0.199
0.350 1.50 1.03
5.513
0.237
0.0098
0.129
0.227 1.40 0.83
0.92
5.541
0.260
0.0099
0.075
0.131 0.98 0.84
0.78 0.74
38.0 5.499
0.152 0.0114 0.263 0.463 3.89
1.22 (0.39)
5.93 (1.22)
3.75
5.468
0.214
0.0097
0.199
0.350 3.25 3.44
4.59
5.513
0.237
0.0098
0.129
0.227 3.61 2.16
2.77
5.541
0.260
0.0099
0.075
0.131 2.26 2.20
1.87 1.69
47.5 5.499 0.152 0.0114 0.263 0.463 10.40 2.56 16.2
S43
(0.36) (1.14) 10.40
5.468
0.214
0.0097
0.199
0.350 9.96 8.67
7.86
5.513
0.237
0.0098
0.129
0.227 7.30 6.96
6.39
5.541
0.260
0.0099
0.075
0.131 5.94 4.95
4.22 4.96
54.4 5.499
0.152 0.0114 0.263 0.463 17.60
6.97 (1.05)
27.6 (3.29)
18.20
5.468
0.214
0.0097
0.199
0.350 22.10 17.50
17.80
5.513
0.237
0.0098
0.129
0.227 16.90 14.00
13.30
5.541
0.260
0.0099
0.075
0.131 11.90 11.50
10.70 9.14
S44
Table S10. The exact temperature, amount of [bmim][PF6] 8 at a mole fraction of 0.20, the exact amounts of
acetonitrile, the bromide 1 and the nucleophile 2, the nucleophile 2 concentration, the observed pseudo first
order rate constant (kobs) and the resultant k1 and k2.
Temp / °C
Mass ionic liquid
/ g
Mass acetonitrile
/ g
Mass bromine
1 / g
Mass pyridine
2 / g
[Nu] / mol L-1
kobs / 10-4
s-1
k1 / 10-4 s-1
k2 / 10-4 L mol-1 s-1
19.8 1.344
0.733 0.0037 0.100 0.442 0.75
0.23 (0.14)
1.24 (0.47)
1.19
1.343
0.741
0.0034
0.076
0.336 0.56 0.55
0.80
1.368
0.750
0.0036
0.050
0.222 0.41 0.53
0.34
1.374
0.758
0.0043
0.030
0.131 0.52 0.42
0.54 0.38
29.5 1.359
0.730 0.0037 0.099 0.437 2.38
1.03 (0.15)
2.35 (0.49)
2.62
1.344 0.705
0.745 0.375
0.0045 0.0027
0.077 0.037
0.339 0.329
2.02 2.43 1.94
1.371 1.382
0.748 0.750
0.0038 0.0036
0.050 0.050
0.219 0.222
1.57 1.64 1.23
1.357 1.275
0.771 0.772
0.0042 0.0043
0.031 0.031
0.137 0.135
1.50 0.86 1.53
1.25
37.2 1.347 1.359 0.732
0.730 0.0042 0.0037
0.106 0.099
0.468 0.437
4.16 4.50
1.76 (0.44)
5.30 (1.40)
1.348 1.344
0.741 0.745
0.0052 0.0045
0.077 0.077
0.337 0.339
3.72 3.22 2.90
1.371 1.382
0.748 0.750
0.0038 0.0036
0.050 0.050
0.219 0.222
4.34 2.34 3.54
1.275 0.716
0.772 0.378
0.0043 0.0017
0.031 0.018
0.135 0.155
3.63 2.76 2.14
2.24
S45
47.5 1.376
0.731 0.0042 0.108 0.477 14.80
5.41 (0.59)
16.4 (1.85)
13.80
1.341
0.739
0.0048
0.075
0.330 12.30 10.10
10.10
1.386
0.749
0.0041
0.050
0.222 9.88 8.65
8.67
1.355
0.774
0.0054
0.029
0.127 9.93 7.79
7.84 7.73
54.2 1.347
0.732 0.0042 0.106 0.468 19.90
6.38 (1.56)
31.8 (5.05)
1.353
0.730
0.0035
0.098
0.432
24.00 19.30
14.7
1.348
0.741
0.0052
0.077 0.337
25.1 20.90
1.344 1.371
0.745 0.748
0.0045 0.0038
0.077 0.050
0.339 0.219
16.50 14.50 13.80
1.357
0.771
0.0042
0.031
0.137 12.10 8.24
1.275 1.381
0.772 0.761
0.0043 0.0037
0.031 0.023
0.135 0.102
10.80 11.50 7.94
9.70 1.34
S46
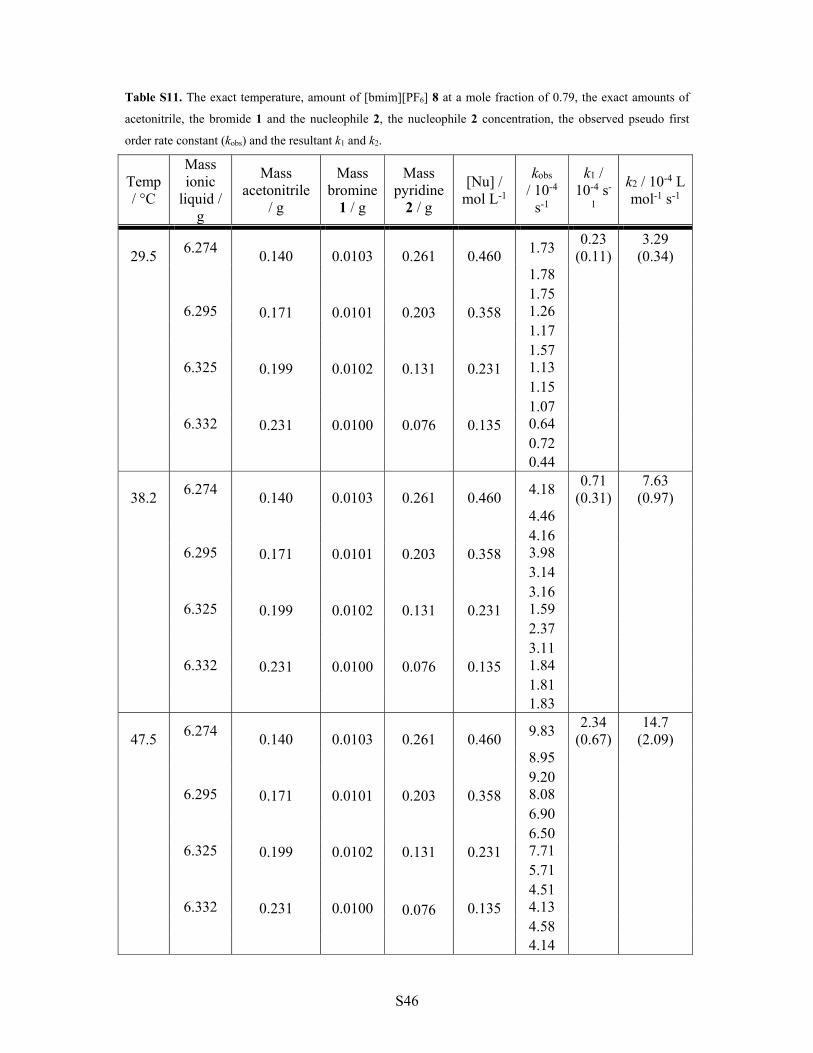
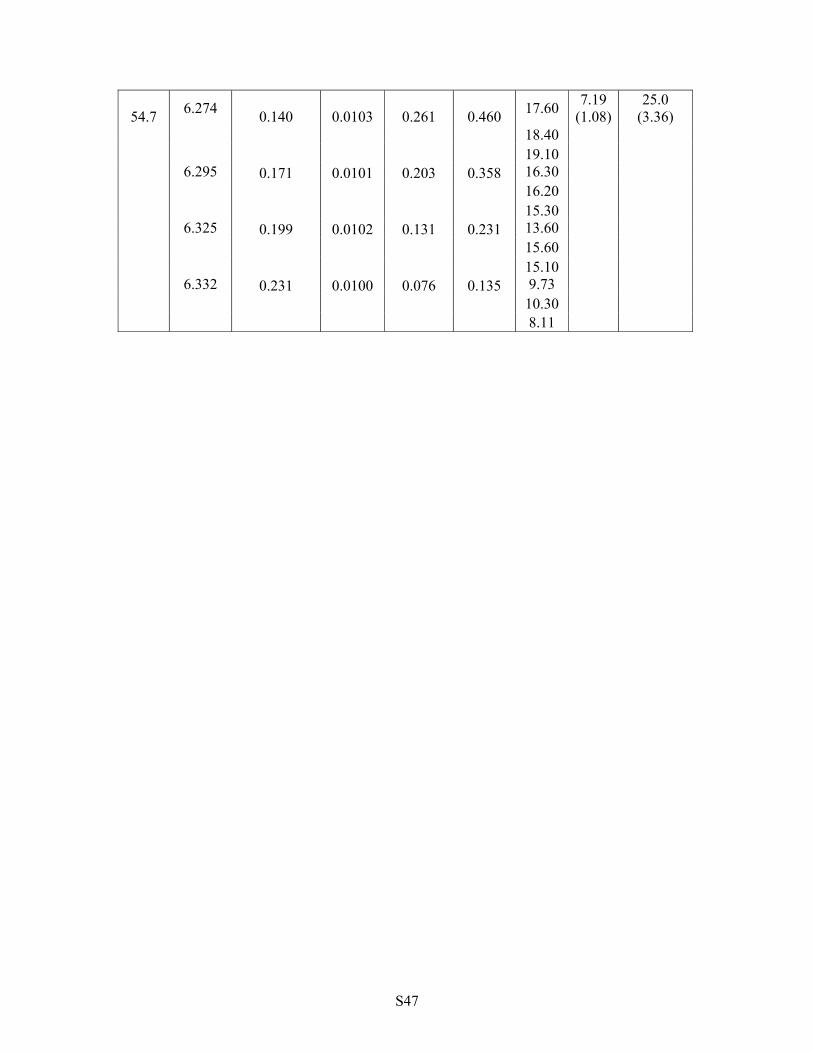
Table S11. The exact temperature, amount of [bmim][PF6] 8 at a mole fraction of 0.79, the exact amounts of
acetonitrile, the bromide 1 and the nucleophile 2, the nucleophile 2 concentration, the observed pseudo first
order rate constant (kobs) and the resultant k1 and k2.
Temp / °C
Mass ionic
liquid / g
Mass acetonitrile
/ g
Mass bromine
1 / g
Mass pyridine
2 / g
[Nu] / mol L-1
kobs / 10-4
s-1
k1 / 10-4 s-
1
k2 / 10-4 L mol-1 s-1
29.5 6.274
0.140 0.0103 0.261 0.460 1.73
0.23 (0.11)
3.29 (0.34)
1.78
6.295
0.171
0.0101
0.203
0.358 1.75 1.26
1.17
6.325
0.199
0.0102
0.131
0.231 1.57 1.13
1.15
6.332
0.231
0.0100
0.076
0.135 1.07 0.64
0.72 0.44
38.2 6.274
0.140 0.0103 0.261 0.460 4.18
0.71 (0.31)
7.63 (0.97)
4.46
6.295
0.171
0.0101
0.203
0.358 4.16 3.98
3.14
6.325
0.199
0.0102
0.131
0.231 3.16 1.59
2.37
6.332
0.231
0.0100
0.076
0.135 3.11 1.84
1.81 1.83
47.5 6.274
0.140 0.0103 0.261 0.460 9.83
2.34 (0.67)
14.7 (2.09)
8.95
6.295
0.171
0.0101
0.203
0.358 9.20 8.08
6.90
6.325
0.199
0.0102
0.131
0.231 6.50 7.71
5.71
6.332
0.231
0.0100
0.076
0.135
4.51 4.13
4.58 4.14
S47
54.7 6.274
0.140 0.0103 0.261 0.460 17.60
7.19 (1.08)
25.0 (3.36)
18.40
6.295
0.171
0.0101
0.203
0.358 19.10 16.30
16.20
6.325
0.199
0.0102
0.131
0.231 15.30 13.60
15.60
6.332
0.231
0.0100
0.076
0.135 15.10 9.73
10.30 8.11
S48
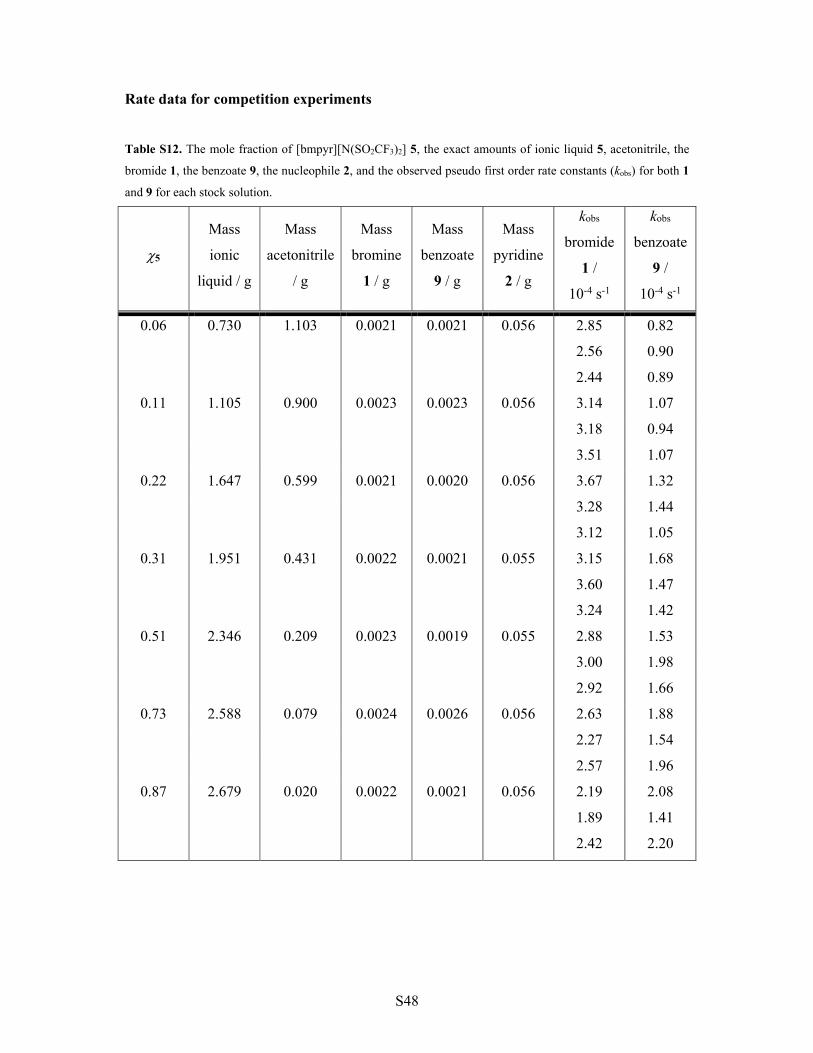
Rate data for competition experiments
Table S12. The mole fraction of [bmpyr][N(SO2CF3)2] 5, the exact amounts of ionic liquid 5, acetonitrile, the
bromide 1, the benzoate 9, the nucleophile 2, and the observed pseudo first order rate constants (kobs) for both 1
and 9 for each stock solution.
5
Mass
ionic
liquid / g
Mass
acetonitrile
/ g
Mass
bromine
1 / g
Mass
benzoate
9 / g
Mass
pyridine
2 / g
kobs
bromide
1 /
10-4 s-1
kobs
benzoate
9 /
10-4 s-1
0.06 0.730 1.103 0.0021 0.0021 0.056 2.85 0.82
2.56 0.90
2.44 0.89
0.11 1.105 0.900 0.0023 0.0023 0.056 3.14 1.07
3.18 0.94
3.51 1.07
0.22 1.647 0.599 0.0021 0.0020 0.056 3.67 1.32
3.28 1.44
3.12 1.05
0.31 1.951 0.431 0.0022 0.0021 0.055 3.15 1.68
3.60 1.47
3.24 1.42
0.51 2.346 0.209 0.0023 0.0019 0.055 2.88 1.53
3.00 1.98
2.92 1.66
0.73 2.588 0.079 0.0024 0.0026 0.056 2.63 1.88
2.27 1.54
2.57 1.96
0.87 2.679 0.020 0.0022 0.0021 0.056 2.19 2.08
1.89 1.41
2.42 2.20
S49
References
1. B. Denegri, A. Streiter, S. Jurić, A. R. Ofial, O. Kronja and H. Mayr, Chem.- Eur. J., 2006, 12, 1648-1656.
2. V. Strehmel and V. Senkowski, J. Polym. Sci. A, 2015, 53, 2849-2859. 3. E. E. L. Tanner, R. R. Hawker, H. M. Yau, A. K. Croft and J. B. Harper, Org. Biomol.
Chem., 2013, 11, 7516-7521. 4. J. Flieger and A. Czajkowska-Żelazko, J. Sep. Sci., 2012, 35, 248-255. 5. L. Cammarata, S. G. Kazarian, P. A. Salter and T. Welton, Phys. Chem. Chem. Phys.,
2001, 3, 5192-5200. 6. H. Srour, H. Rouault, C. C. Santini and Y. Chauvin, Green Chem., 2013, 15, 1341-
1347. 7. G. Chatel, C. Monnier, N. Kardos, C. Voiron, B. Andrioletti and M. Draye, Appl. Cat.
A., 2014, 478, 157-164. 8. H. Eyring, J. Chem. Phys., 1935, 3, 107-115. 9. S. T. Keaveney, B. P. White, R. S. Haines and J. B. Harper, Org. Biomol. Chem.,
2016, 14, 2572-2580.