Embed Size (px)
Citation preview
Elements of Student Success (Formerly Achieving the Dream Student Success Elements)
2016 Edition
March 2016 KCCD Institutional Research and Reporting
Bakersfield College
KCCD Institutional Research and Reporting i March 2016
TABLE OF CONTENTS Methodology Notes
Document Background and Overview …. .......................................................................................................................................................... ii
Summary Results ................................................................................................................................................................................................. ii
Pipeline Observation ........................................................................................................................................................................................... ii
Cohort Definition ................................................................................................................................................................................................. ii Outcome and Momentum Point Elements Described ..................................................................................................................................... iii Additional Student Success Momentum Point Measures ............................................................................................................................... iv
Student Characteristics ..................................................................................................................................................................................... v Notes on Cohort and Differences from 2015 Report ....................................................................................................................................... vi
Notes on How to Interpret the Results ............................................................................................................................................................. vi Student Success Element Results
Summary Results ................................................................................................................................................................................................ 1
Pipeline Observation Results ............................................................................................................................................................................. 3
Element A: 12 Unit College-level Completion in First Term .......................................................................................................................... 5
Element B: Persistence from One Term to the Next ....................................................................................................................................... 7
Element C: Successful Course Completion (Completion with a Grade of “C” or Better) ........................................................................... 9
Element D: Successful Completion of Remedial Instruction (Completion with a Grade of “C” or Better) English .......................................................................................................................................................................................... 11 Math .............................................................................................................................................................................................. 13
Element E: Completion of College-level English or Math English ........................................................................................................................................................................................... 15 Math ............................................................................................................................................................................................... 17
Element F: Completion of Gateway English or Math Courses .......................................................................................................................... English ........................................................................................................................................................................................... 19 Math ............................................................................................................................................................................................... 21
Element G: 30 Unit College-level Completion in First Year ......................................................................................................................... 23
Element H: Attain a Certificate, Degree and/or Transfer .............................................................................................................................. 25
KCCD Institutional Research and Reporting ii March 2016
METHODOLOGY NOTES
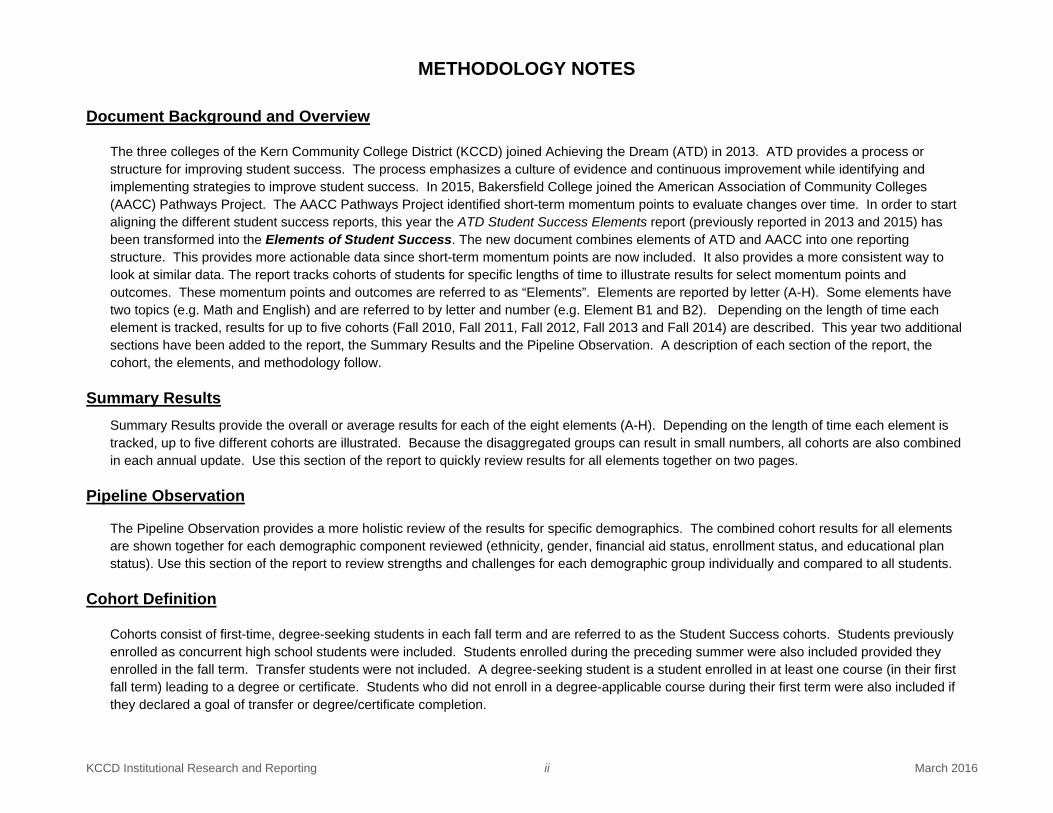
Document Background and Overview
The three colleges of the Kern Community College District (KCCD) joined Achieving the Dream (ATD) in 2013. ATD provides a process or structure for improving student success. The process emphasizes a culture of evidence and continuous improvement while identifying and implementing strategies to improve student success. In 2015, Bakersfield College joined the American Association of Community Colleges (AACC) Pathways Project. The AACC Pathways Project identified short-term momentum points to evaluate changes over time. In order to start aligning the different student success reports, this year the ATD Student Success Elements report (previously reported in 2013 and 2015) has been transformed into the Elements of Student Success. The new document combines elements of ATD and AACC into one reporting structure. This provides more actionable data since short-term momentum points are now included. It also provides a more consistent way to look at similar data. The report tracks cohorts of students for specific lengths of time to illustrate results for select momentum points and outcomes. These momentum points and outcomes are referred to as “Elements”. Elements are reported by letter (A-H). Some elements have two topics (e.g. Math and English) and are referred to by letter and number (e.g. Element B1 and B2). Depending on the length of time each element is tracked, results for up to five cohorts (Fall 2010, Fall 2011, Fall 2012, Fall 2013 and Fall 2014) are described. This year two additional sections have been added to the report, the Summary Results and the Pipeline Observation. A description of each section of the report, the cohort, the elements, and methodology follow.
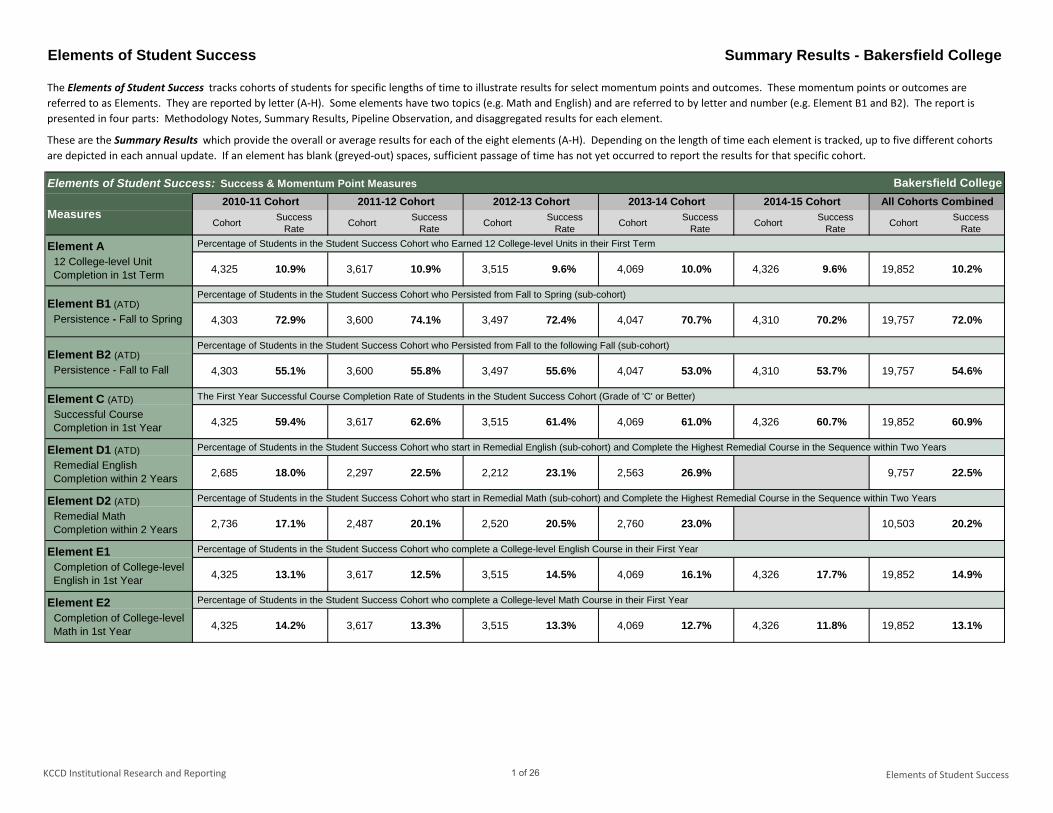
Summary Results Summary Results provide the overall or average results for each of the eight elements (A-H). Depending on the length of time each element is tracked, up to five different cohorts are illustrated. Because the disaggregated groups can result in small numbers, all cohorts are also combined in each annual update. Use this section of the report to quickly review results for all elements together on two pages.
Pipeline Observation
The Pipeline Observation provides a more holistic review of the results for specific demographics. The combined cohort results for all elements are shown together for each demographic component reviewed (ethnicity, gender, financial aid status, enrollment status, and educational plan status). Use this section of the report to review strengths and challenges for each demographic group individually and compared to all students.
Cohort Definition
Cohorts consist of first-time, degree-seeking students in each fall term and are referred to as the Student Success cohorts. Students previously enrolled as concurrent high school students were included. Students enrolled during the preceding summer were also included provided they enrolled in the fall term. Transfer students were not included. A degree-seeking student is a student enrolled in at least one course (in their first fall term) leading to a degree or certificate. Students who did not enroll in a degree-applicable course during their first term were also included if they declared a goal of transfer or degree/certificate completion.
KCCD Institutional Research and Reporting iii March 2016
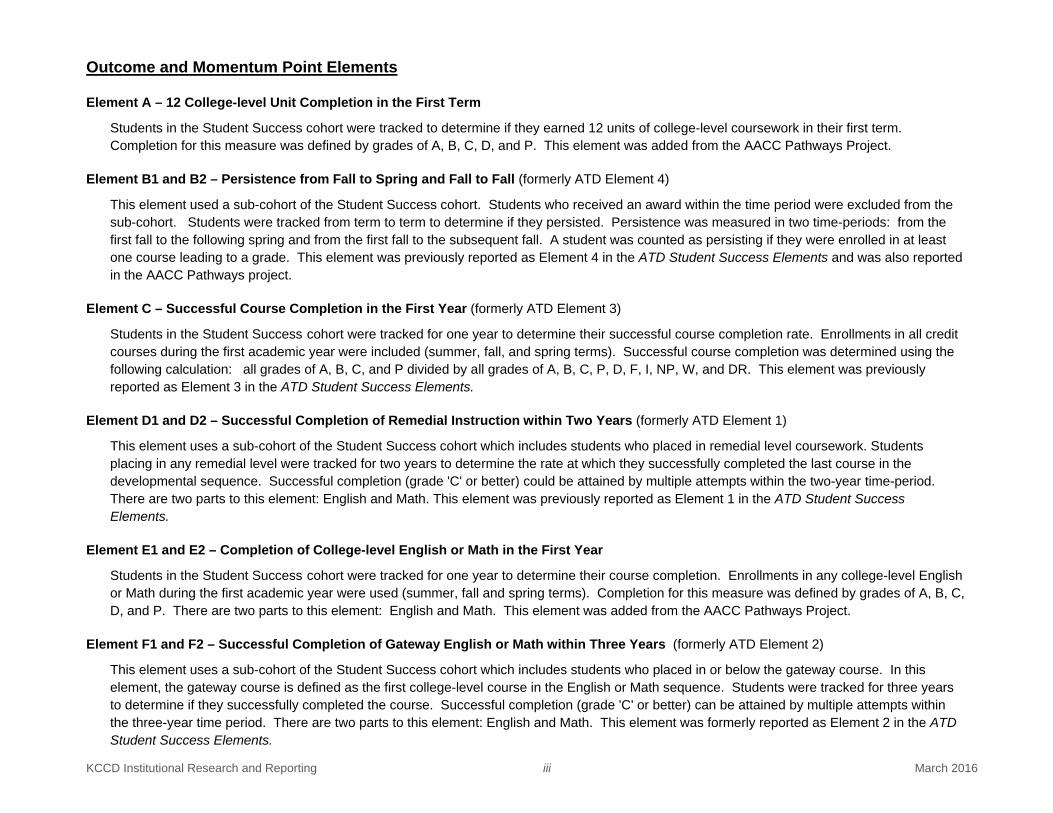
Outcome and Momentum Point Elements
Element A – 12 College-level Unit Completion in the First Term Students in the Student Success cohort were tracked to determine if they earned 12 units of college-level coursework in their first term. Completion for this measure was defined by grades of A, B, C, D, and P. This element was added from the AACC Pathways Project.
Element B1 and B2 – Persistence from Fall to Spring and Fall to Fall (formerly ATD Element 4)
This element used a sub-cohort of the Student Success cohort. Students who received an award within the time period were excluded from the sub-cohort. Students were tracked from term to term to determine if they persisted. Persistence was measured in two time-periods: from the first fall to the following spring and from the first fall to the subsequent fall. A student was counted as persisting if they were enrolled in at least one course leading to a grade. This element was previously reported as Element 4 in the ATD Student Success Elements and was also reported in the AACC Pathways project.
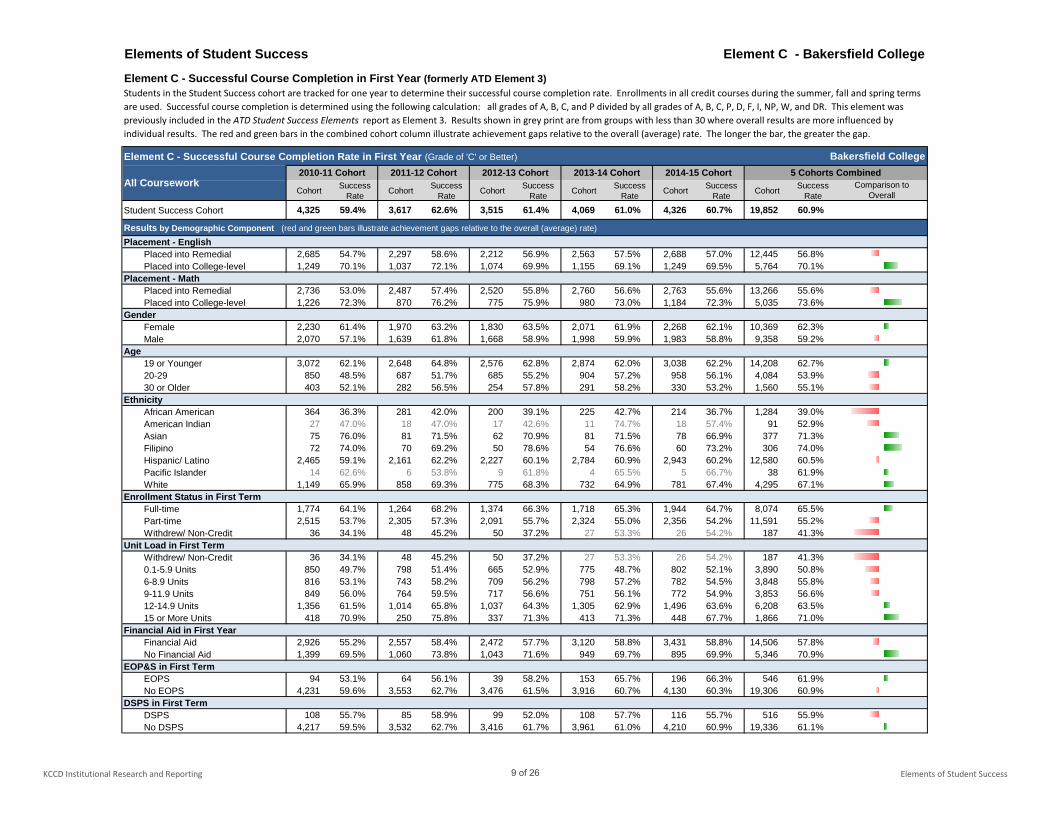
Element C – Successful Course Completion in the First Year (formerly ATD Element 3)
Students in the Student Success cohort were tracked for one year to determine their successful course completion rate. Enrollments in all credit courses during the first academic year were included (summer, fall, and spring terms). Successful course completion was determined using the following calculation: all grades of A, B, C, and P divided by all grades of A, B, C, P, D, F, I, NP, W, and DR. This element was previously reported as Element 3 in the ATD Student Success Elements.
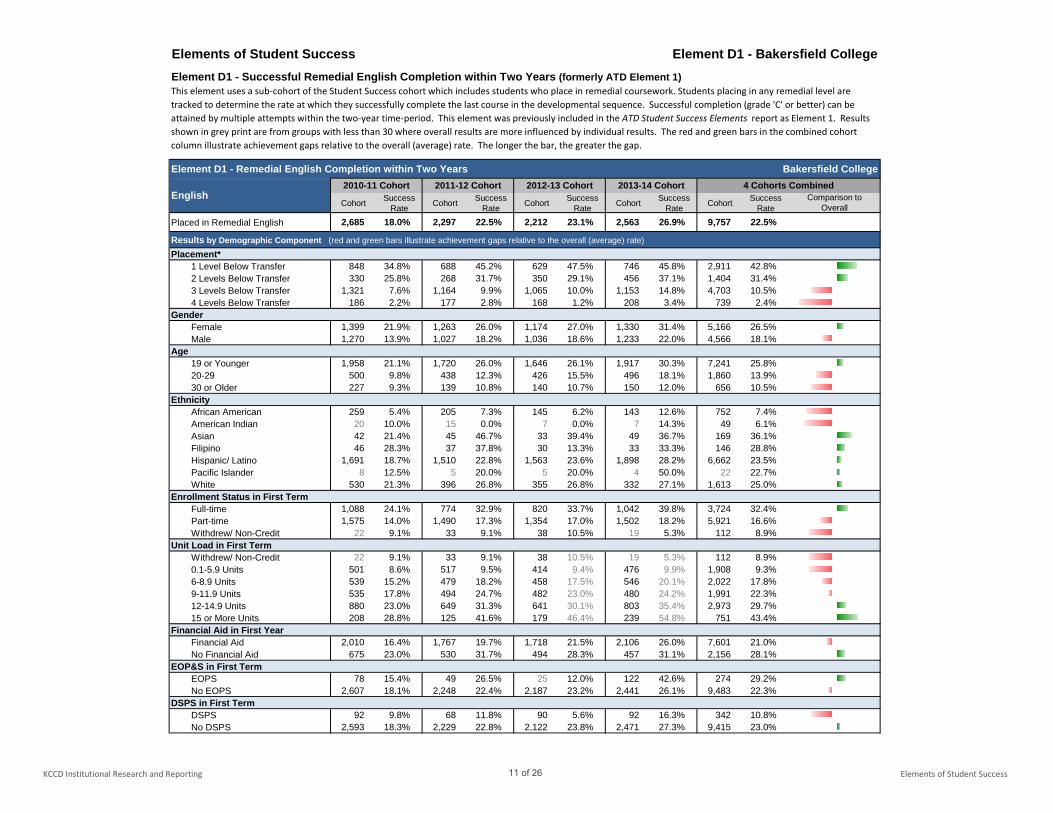
Element D1 and D2 – Successful Completion of Remedial Instruction within Two Years (formerly ATD Element 1)
This element uses a sub-cohort of the Student Success cohort which includes students who placed in remedial level coursework. Students placing in any remedial level were tracked for two years to determine the rate at which they successfully completed the last course in the developmental sequence. Successful completion (grade 'C' or better) could be attained by multiple attempts within the two-year time-period. There are two parts to this element: English and Math. This element was previously reported as Element 1 in the ATD Student Success Elements.
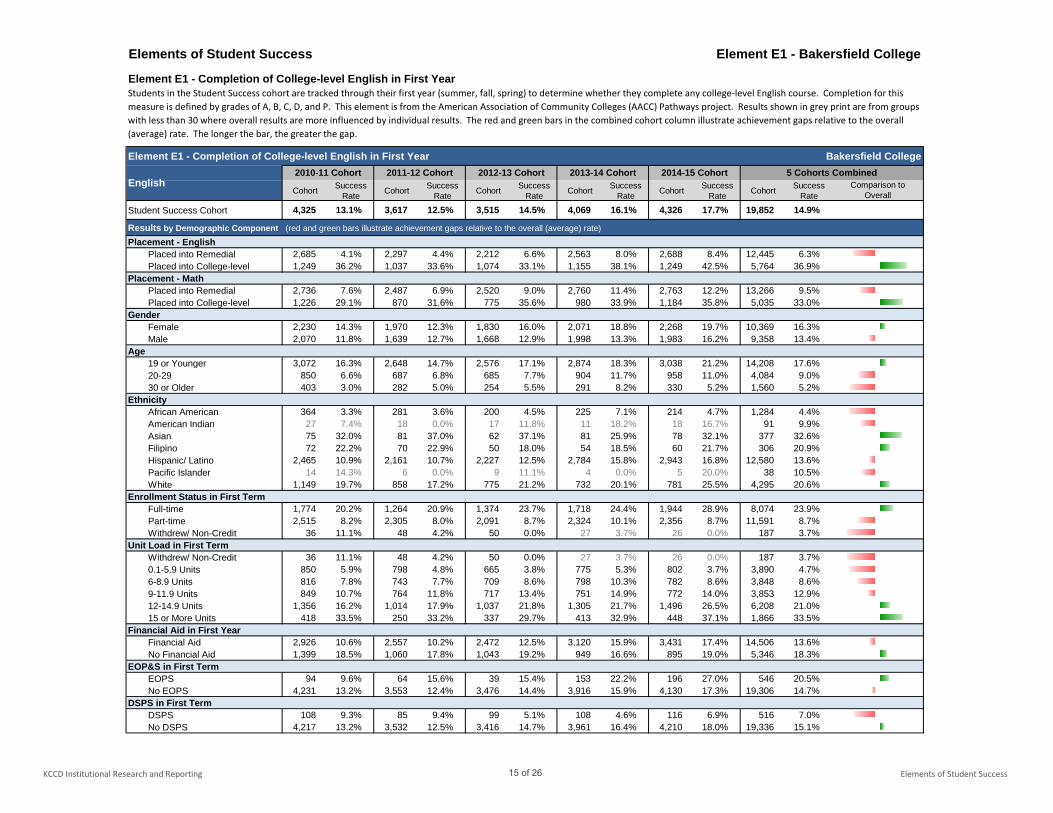
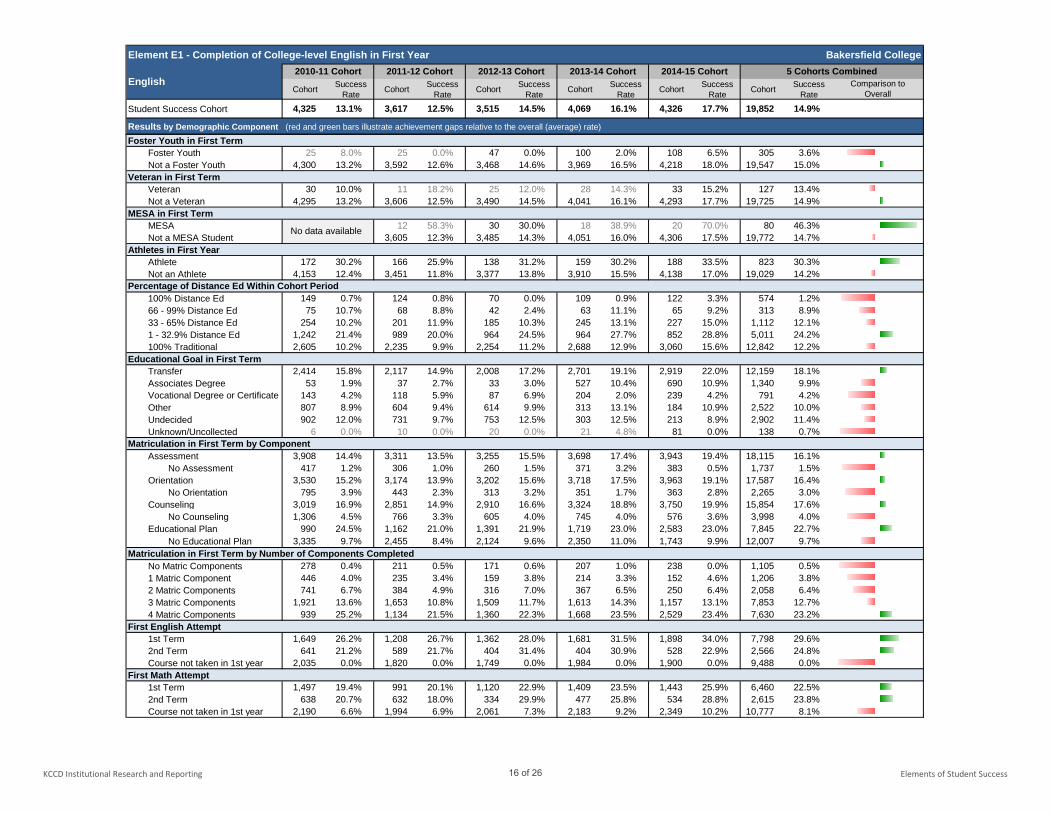
Element E1 and E2 – Completion of College-level English or Math in the First Year
Students in the Student Success cohort were tracked for one year to determine their course completion. Enrollments in any college-level English or Math during the first academic year were used (summer, fall and spring terms). Completion for this measure was defined by grades of A, B, C, D, and P. There are two parts to this element: English and Math. This element was added from the AACC Pathways Project.
Element F1 and F2 – Successful Completion of Gateway English or Math within Three Years (formerly ATD Element 2)
This element uses a sub-cohort of the Student Success cohort which includes students who placed in or below the gateway course. In this element, the gateway course is defined as the first college-level course in the English or Math sequence. Students were tracked for three years to determine if they successfully completed the course. Successful completion (grade 'C' or better) can be attained by multiple attempts within the three-year time period. There are two parts to this element: English and Math. This element was formerly reported as Element 2 in the ATD Student Success Elements.
KCCD Institutional Research and Reporting iv March 2016
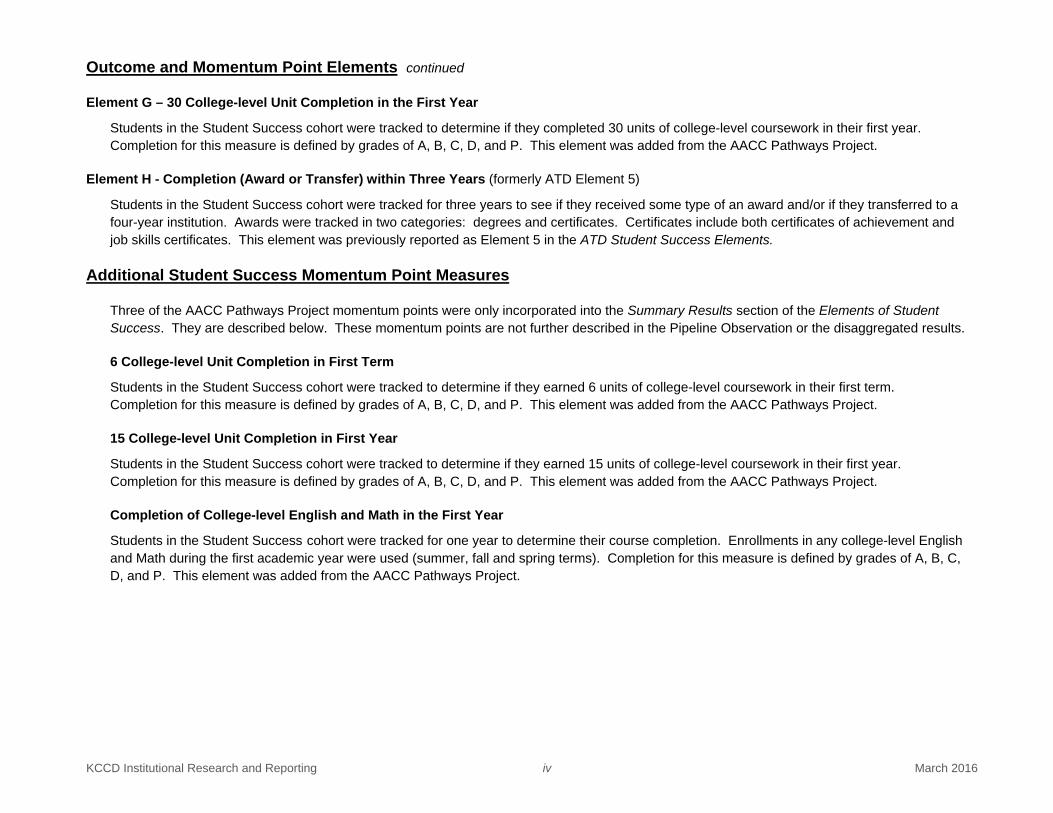
Outcome and Momentum Point Elements continued
Element G – 30 College-level Unit Completion in the First Year
Students in the Student Success cohort were tracked to determine if they completed 30 units of college-level coursework in their first year. Completion for this measure is defined by grades of A, B, C, D, and P. This element was added from the AACC Pathways Project.
Element H - Completion (Award or Transfer) within Three Years (formerly ATD Element 5)
Students in the Student Success cohort were tracked for three years to see if they received some type of an award and/or if they transferred to a four-year institution. Awards were tracked in two categories: degrees and certificates. Certificates include both certificates of achievement and job skills certificates. This element was previously reported as Element 5 in the ATD Student Success Elements.
Additional Student Success Momentum Point Measures
Three of the AACC Pathways Project momentum points were only incorporated into the Summary Results section of the Elements of Student Success. They are described below. These momentum points are not further described in the Pipeline Observation or the disaggregated results.
6 College-level Unit Completion in First Term
Students in the Student Success cohort were tracked to determine if they earned 6 units of college-level coursework in their first term. Completion for this measure is defined by grades of A, B, C, D, and P. This element was added from the AACC Pathways Project.
15 College-level Unit Completion in First Year
Students in the Student Success cohort were tracked to determine if they earned 15 units of college-level coursework in their first year. Completion for this measure is defined by grades of A, B, C, D, and P. This element was added from the AACC Pathways Project.
Completion of College-level English and Math in the First Year
Students in the Student Success cohort were tracked for one year to determine their course completion. Enrollments in any college-level English and Math during the first academic year were used (summer, fall and spring terms). Completion for this measure is defined by grades of A, B, C, D, and P. This element was added from the AACC Pathways Project.
KCCD Institutional Research and Reporting v March 2016
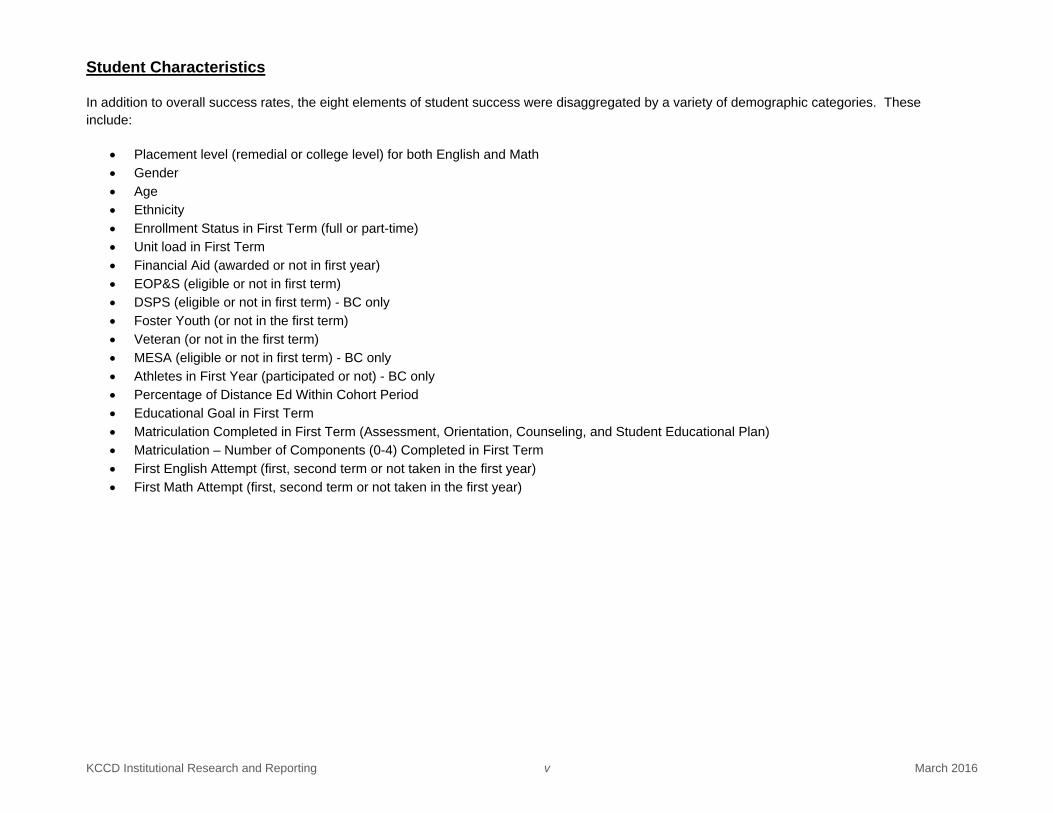
Student Characteristics
In addition to overall success rates, the eight elements of student success were disaggregated by a variety of demographic categories. These include:
Placement level (remedial or college level) for both English and Math Gender Age Ethnicity Enrollment Status in First Term (full or part-time) Unit load in First Term Financial Aid (awarded or not in first year) EOP&S (eligible or not in first term) DSPS (eligible or not in first term) - BC only Foster Youth (or not in the first term) Veteran (or not in the first term) MESA (eligible or not in first term) - BC only Athletes in First Year (participated or not) - BC only Percentage of Distance Ed Within Cohort Period Educational Goal in First Term Matriculation Completed in First Term (Assessment, Orientation, Counseling, and Student Educational Plan) Matriculation – Number of Components (0-4) Completed in First Term First English Attempt (first, second term or not taken in the first year) First Math Attempt (first, second term or not taken in the first year)
KCCD Institutional Research and Reporting vi March 2016
Notes on Cohort and Differences from the 2015 Report
Cohort Differences: The cohort definition stayed the same. But the number of cohorts shown has now increased to include later cohorts for the short-term momentum point elements. Thus depending on the length of time each element is tracked, results are shown for cohorts of first-time, degree-seeking students who started in the fall of 2010, 2011, 2012, 2013 and 2014.
Element Differences: Short-term momentum point elements were added to the previously reported 3-year ATD elements. The reference to the elements was changed to letters (A-H) rather than numbers to avoid confusion since the elements were re-organized. The elements formerly labeled as Elements 1, 2, 3, 4, and 5 in the ATD Student Success Elements have been relabeled as Elements D1/D2, F1/F2, C, B1/B2, and H respectively. Elements A, E1/E2, and G were added from the AACC Pathways Project. Element C – Persistence from Term to Term now includes “DR” grades. Students who were previously excluded if they only had DR grades in the term are now being counted as persisting. This change caused a slight increase in the persistence rate compared to the 2015 report. The time-period for Element D1 and D2 (formerly reported as Element 1 in the ATD Student Success Elements) cohorts was shortened from three years to two years to align with the ATD change. Three math placement tests that were not included previously are now included in 2016, slightly affecting results in Elements D2 and F2.
Demographic Differences: Three demographic characteristics were added to the 2016 report. These demographics were added in response to other reporting requirements or to inform interventions for specific groups of students. These new demographics include Foster Youth, Veterans, and MESA (Mathematics, Engineering and Science Achievement) students. Some changes were also made to previously reported demographic characteristics. Previously, Athlete participation (reported only at BC) was based on the first-term status (fall). Now it is based on the first-year status to include students who participated in spring sports. Enrollment Status in the First Term, Unit Load in the First Term and the Percentage of Distance Education now include “DR” grades which increased the number of units attempted. Three math placement tests that were not previously included are now included in the 2016 edition of the report, affecting the placement demographic component.
Notes on How to Interpret the Results
Results are presented in tables for each of the student success elements. Elements D, E, and F have two sets of tables: one for English, another for Math.
Up to five different cohorts representing separate time-periods are shown horizontally in columns across each page. The last set of columns on each page combine the results of all cohorts reported for the element, providing an alternative method of
evaluating areas with small numbers. Disaggregated results by student characteristics or demographics are shown in rows vertically down each page. Results displayed in grey print depict groups with less than 30 students, where overall results are more influenced by individual results. The number in the cohort (or sub-cohort) and each demographic category are listed as reference along with the percentage of students who
were successful in the element. The final column which combines all the cohorts includes a visual guide to illustrate achievement gaps in the form of red and green bars
growing from a central point. Red bars, progressing to the left, show areas where the success rate is lower than the overall average. Green bars, progressing to the right, show areas where the success rate is higher than the overall average. The bars are scaled to show the difference from the overall (average) rate relative to other values in the column. The longer the bar, the greater the gap.
KCCD Institutional Research and Reporting Elements of Student Success
Elements of Student Success Summary Results - Bakersfield College
Elements of Student Success: Success & Momentum Point Measures Bakersfield College
Cohort Success Rate Cohort Success
Rate Cohort Success Rate Cohort Success
Rate Cohort Success Rate Cohort Success
Rate Percentage of Students in the Student Success Cohort who Earned 12 College-level Units in their First Term
4,325 10.9% 3,617 10.9% 3,515 9.6% 4,069 10.0% 4,326 9.6% 19,852 10.2%
Percentage of Students in the Student Success Cohort who Persisted from Fall to Spring (sub-cohort)
4,303 72.9% 3,600 74.1% 3,497 72.4% 4,047 70.7% 4,310 70.2% 19,757 72.0%
Percentage of Students in the Student Success Cohort who Persisted from Fall to the following Fall (sub-cohort)
4,303 55.1% 3,600 55.8% 3,497 55.6% 4,047 53.0% 4,310 53.7% 19,757 54.6%
The First Year Successful Course Completion Rate of Students in the Student Success Cohort (Grade of 'C' or Better)
4,325 59.4% 3,617 62.6% 3,515 61.4% 4,069 61.0% 4,326 60.7% 19,852 60.9%
Percentage of Students in the Student Success Cohort who start in Remedial English (sub-cohort) and Complete the Highest Remedial Course in the Sequence within Two Years
2,685 18.0% 2,297 22.5% 2,212 23.1% 2,563 26.9% 9,757 22.5%
Percentage of Students in the Student Success Cohort who start in Remedial Math (sub-cohort) and Complete the Highest Remedial Course in the Sequence within Two Years
2,736 17.1% 2,487 20.1% 2,520 20.5% 2,760 23.0% 10,503 20.2%
Percentage of Students in the Student Success Cohort who complete a College-level English Course in their First Year
4,325 13.1% 3,617 12.5% 3,515 14.5% 4,069 16.1% 4,326 17.7% 19,852 14.9%
Percentage of Students in the Student Success Cohort who complete a College-level Math Course in their First Year
4,325 14.2% 3,617 13.3% 3,515 13.3% 4,069 12.7% 4,326 11.8% 19,852 13.1%
Element A 12 College-level Unit Completion in 1st Term
Element B1 (ATD) Persistence - Fall to Spring
Element B2 (ATD) Persistence - Fall to Fall
Element C (ATD) Successful Course Completion in 1st Year
Element D1 (ATD) Remedial English Completion within 2 Years
Element D2 (ATD) Remedial Math Completion within 2 Years
Element E1 Completion of College-level English in 1st Year
Element E2 Completion of College-level Math in 1st Year
The Elements of Student Success tracks cohorts of students for specific lengths of time to illustrate results for select momentum points and outcomes. These momentum points or outcomes are referred to as Elements. They are reported by letter (A-H). Some elements have two topics (e.g. Math and English) and are referred to by letter and number (e.g. Element B1 and B2). The report is presented in four parts: Methodology Notes, Summary Results, Pipeline Observation, and disaggregated results for each element.
These are the Summary Results which provide the overall or average results for each of the eight elements (A-H). Depending on the length of time each element is tracked, up to five different cohorts are depicted in each annual update. If an element has blank (greyed-out) spaces, sufficient passage of time has not yet occurred to report the results for that specific cohort.
Measures2010-11 Cohort 2011-12 Cohort 2012-13 Cohort 2013-14 Cohort 2014-15 Cohort All Cohorts Combined
1 of 26
KCCD Institutional Research and Reporting Elements of Student Success
Elements of Student Success: Success & Momentum Point Measures Bakersfield College
Cohort Success Rate Cohort Success
Rate Cohort Success Rate Cohort Success
Rate Cohort Success Rate Cohort Success
RateMeasures
2010-11 Cohort 2011-12 Cohort 2012-13 Cohort 2013-14 Cohort 2014-15 Cohort All Cohorts Combined
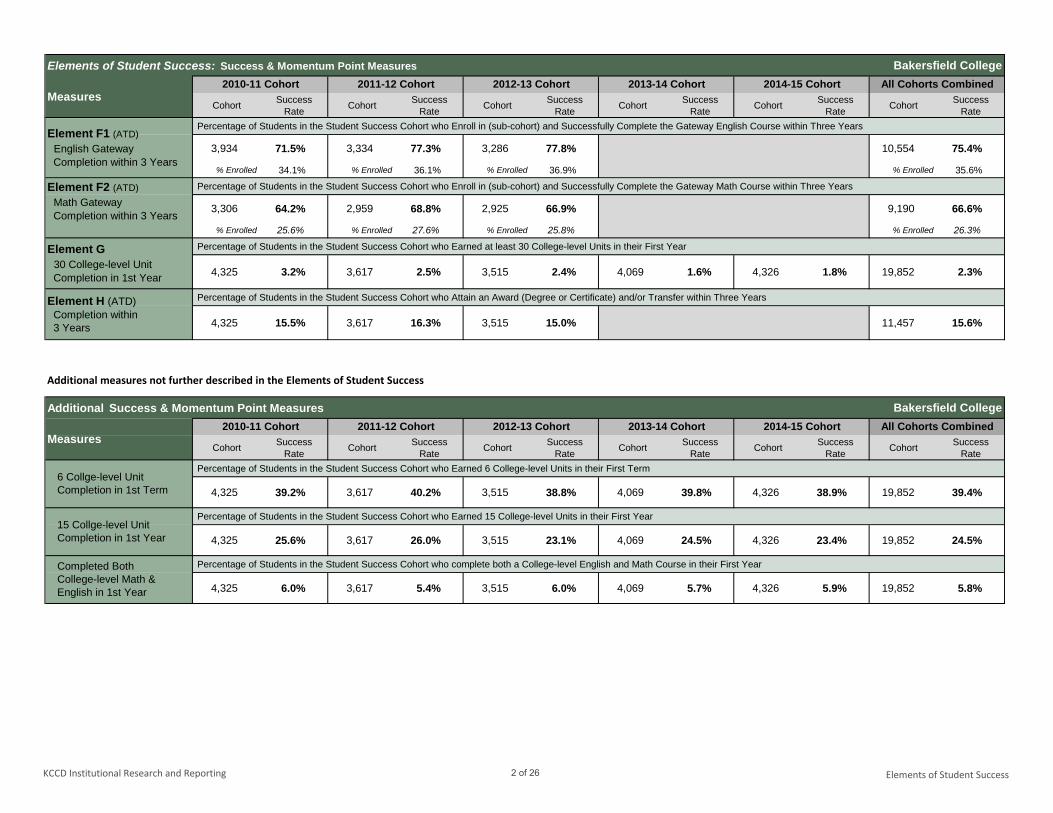
Percentage of Students in the Student Success Cohort who Enroll in (sub-cohort) and Successfully Complete the Gateway English Course within Three Years
3,934 71.5% 3,334 77.3% 3,286 77.8% 10,554 75.4%
% Enrolled 34.1% % Enrolled 36.1% % Enrolled 36.9% % Enrolled 35.6%
Percentage of Students in the Student Success Cohort who Enroll in (sub-cohort) and Successfully Complete the Gateway Math Course within Three Years
3,306 64.2% 2,959 68.8% 2,925 66.9% 9,190 66.6%
% Enrolled 25.6% % Enrolled 27.6% % Enrolled 25.8% % Enrolled 26.3%
Percentage of Students in the Student Success Cohort who Earned at least 30 College-level Units in their First Year
4,325 3.2% 3,617 2.5% 3,515 2.4% 4,069 1.6% 4,326 1.8% 19,852 2.3%
Percentage of Students in the Student Success Cohort who Attain an Award (Degree or Certificate) and/or Transfer within Three Years
4,325 15.5% 3,617 16.3% 3,515 15.0% 11,457 15.6%
Additional measures not further described in the Elements of Student Success
Additional Success & Momentum Point Measures Bakersfield College
Cohort Success Rate Cohort Success
Rate Cohort Success Rate Cohort Success
Rate Cohort Success Rate Cohort Success
Rate Percentage of Students in the Student Success Cohort who Earned 6 College-level Units in their First Term
4,325 39.2% 3,617 40.2% 3,515 38.8% 4,069 39.8% 4,326 38.9% 19,852 39.4%
Percentage of Students in the Student Success Cohort who Earned 15 College-level Units in their First Year
4,325 25.6% 3,617 26.0% 3,515 23.1% 4,069 24.5% 4,326 23.4% 19,852 24.5%
Percentage of Students in the Student Success Cohort who complete both a College-level English and Math Course in their First Year
4,325 6.0% 3,617 5.4% 3,515 6.0% 4,069 5.7% 4,326 5.9% 19,852 5.8%
All Cohorts Combined
6 Collge-level Unit Completion in 1st Term
15 Collge-level Unit Completion in 1st Year
Completed Both College-level Math & English in 1st Year
Measures2010-11 Cohort 2011-12 Cohort 2012-13 Cohort 2013-14 Cohort 2014-15 Cohort
Element H (ATD) Completion within 3 Years
Element F1 (ATD) English Gateway Completion within 3 Years
Element F2 (ATD) Math Gateway Completion within 3 Years
Element G 30 College-level Unit Completion in 1st Year
2 of 26
KCCD Institutional Research and Reporting Elements of Student Success
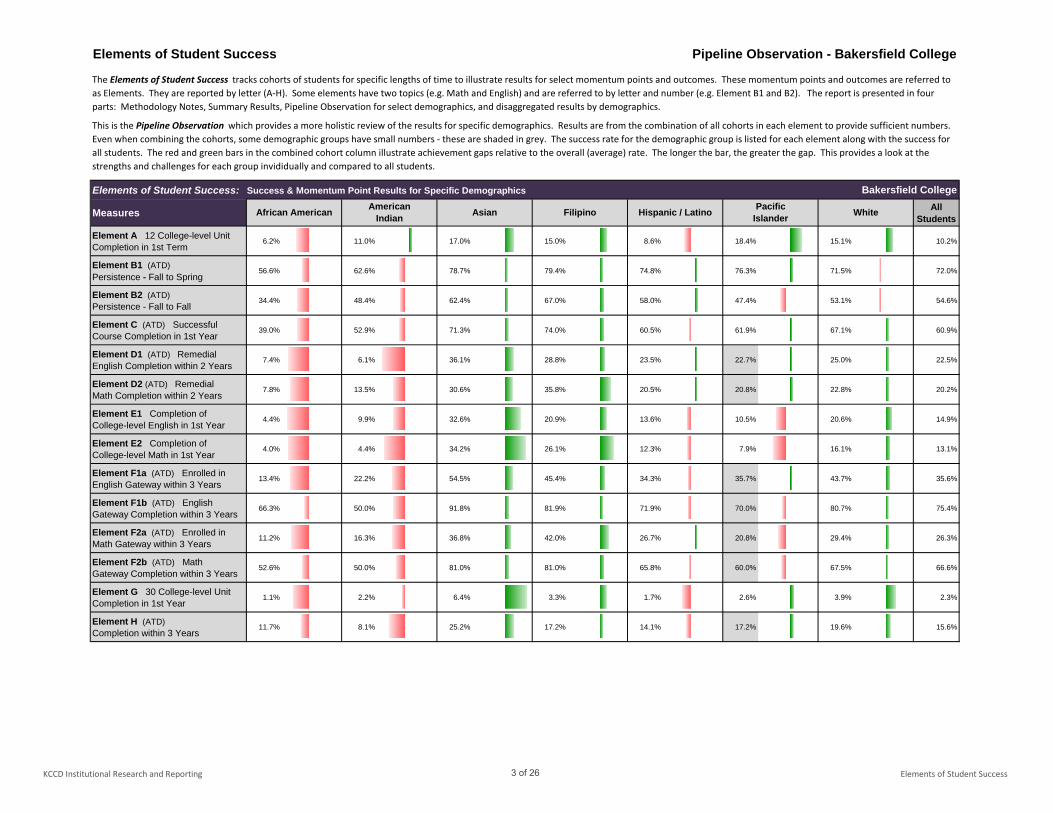
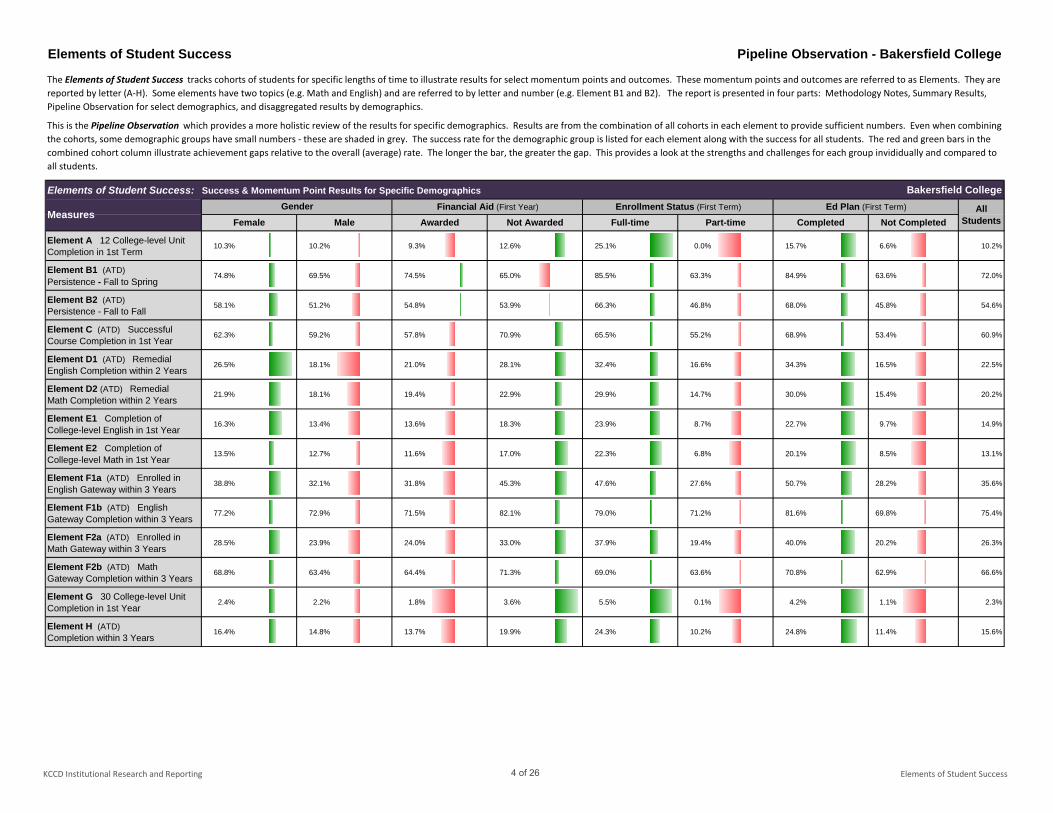
Elements of Student Success Pipeline Observation - Bakersfield College
Elements of Student Success: Success & Momentum Point Results for Specific Demographics Bakersfield College
Measures All Students
Element A 12 College-level Unit Completion in 1st Term
6.2% 11.0% 17.0% 15.0% 8.6% 18.4% 15.1% 10.2%
Element B1 (ATD)Persistence - Fall to Spring
56.6% 62.6% 78.7% 79.4% 74.8% 76.3% 71.5% 72.0%
Element B2 (ATD) Persistence - Fall to Fall
34.4% 48.4% 62.4% 67.0% 58.0% 47.4% 53.1% 54.6%
Element C (ATD) Successful Course Completion in 1st Year
39.0% 52.9% 71.3% 74.0% 60.5% 61.9% 67.1% 60.9%
Element D1 (ATD) Remedial English Completion within 2 Years
7.4% 6.1% 36.1% 28.8% 23.5% 22.7% 25.0% 22.5%
Element D2 (ATD) Remedial Math Completion within 2 Years
7.8% 13.5% 30.6% 35.8% 20.5% 20.8% 22.8% 20.2%
Element E1 Completion of College-level English in 1st Year
4.4% 9.9% 32.6% 20.9% 13.6% 10.5% 20.6% 14.9%
Element E2 Completion of College-level Math in 1st Year
4.0% 4.4% 34.2% 26.1% 12.3% 7.9% 16.1% 13.1%
Element F1a (ATD) Enrolled in English Gateway within 3 Years
13.4% 22.2% 54.5% 45.4% 34.3% 35.7% 43.7% 35.6%
Element F1b (ATD) English Gateway Completion within 3 Years
66.3% 50.0% 91.8% 81.9% 71.9% 70.0% 80.7% 75.4%
Element F2a (ATD) Enrolled in Math Gateway within 3 Years
11.2% 16.3% 36.8% 42.0% 26.7% 20.8% 29.4% 26.3%
Element F2b (ATD) Math Gateway Completion within 3 Years
52.6% 50.0% 81.0% 81.0% 65.8% 60.0% 67.5% 66.6%
Element G 30 College-level UnitCompletion in 1st Year
1.1% 2.2% 6.4% 3.3% 1.7% 2.6% 3.9% 2.3%
Element H (ATD) Completion within 3 Years
11.7% 8.1% 25.2% 17.2% 14.1% 17.2% 19.6% 15.6%
The Elements of Student Success tracks cohorts of students for specific lengths of time to illustrate results for select momentum points and outcomes. These momentum points and outcomes are referred to as Elements. They are reported by letter (A-H). Some elements have two topics (e.g. Math and English) and are referred to by letter and number (e.g. Element B1 and B2). The report is presented in four parts: Methodology Notes, Summary Results, Pipeline Observation for select demographics, and disaggregated results by demographics.
This is the Pipeline Observation which provides a more holistic review of the results for specific demographics. Results are from the combination of all cohorts in each element to provide sufficient numbers. Even when combining the cohorts, some demographic groups have small numbers - these are shaded in grey. The success rate for the demographic group is listed for each element along with the success for all students. The red and green bars in the combined cohort column illustrate achievement gaps relative to the overall (average) rate. The longer the bar, the greater the gap. This provides a look at the strengths and challenges for each group invididually and compared to all students.
African American American Indian Asian Filipino Hispanic / Latino Pacific
Islander White
3 of 26
KCCD Institutional Research and Reporting Elements of Student Success
Elements of Student Success Pipeline Observation - Bakersfield College
Elements of Student Success: Success & Momentum Point Results for Specific Demographics Bakersfield College
Element A 12 College-level Unit Completion in 1st Term
10.3% 10.2% 9.3% 12.6% 25.1% 0.0% 15.7% 6.6% 10.2%
Element B1 (ATD)Persistence - Fall to Spring
74.8% 69.5% 74.5% 65.0% 85.5% 63.3% 84.9% 63.6% 72.0%
Element B2 (ATD) Persistence - Fall to Fall
58.1% 51.2% 54.8% 53.9% 66.3% 46.8% 68.0% 45.8% 54.6%
Element C (ATD) Successful Course Completion in 1st Year
62.3% 59.2% 57.8% 70.9% 65.5% 55.2% 68.9% 53.4% 60.9%
Element D1 (ATD) Remedial English Completion within 2 Years
26.5% 18.1% 21.0% 28.1% 32.4% 16.6% 34.3% 16.5% 22.5%
Element D2 (ATD) Remedial Math Completion within 2 Years
21.9% 18.1% 19.4% 22.9% 29.9% 14.7% 30.0% 15.4% 20.2%
Element E1 Completion of College-level English in 1st Year
16.3% 13.4% 13.6% 18.3% 23.9% 8.7% 22.7% 9.7% 14.9%
Element E2 Completion of College-level Math in 1st Year
13.5% 12.7% 11.6% 17.0% 22.3% 6.8% 20.1% 8.5% 13.1%
Element F1a (ATD) Enrolled in English Gateway within 3 Years
38.8% 32.1% 31.8% 45.3% 47.6% 27.6% 50.7% 28.2% 35.6%
Element F1b (ATD) English Gateway Completion within 3 Years
77.2% 72.9% 71.5% 82.1% 79.0% 71.2% 81.6% 69.8% 75.4%
Element F2a (ATD) Enrolled in Math Gateway within 3 Years
28.5% 23.9% 24.0% 33.0% 37.9% 19.4% 40.0% 20.2% 26.3%
Element F2b (ATD) Math Gateway Completion within 3 Years
68.8% 63.4% 64.4% 71.3% 69.0% 63.6% 70.8% 62.9% 66.6%
Element G 30 College-level UnitCompletion in 1st Year
2.4% 2.2% 1.8% 3.6% 5.5% 0.1% 4.2% 1.1% 2.3%
Element H (ATD) Completion within 3 Years
16.4% 14.8% 13.7% 19.9% 24.3% 10.2% 24.8% 11.4% 15.6%
Measures
The Elements of Student Success tracks cohorts of students for specific lengths of time to illustrate results for select momentum points and outcomes. These momentum points and outcomes are referred to as Elements. They are reported by letter (A-H). Some elements have two topics (e.g. Math and English) and are referred to by letter and number (e.g. Element B1 and B2). The report is presented in four parts: Methodology Notes, Summary Results, Pipeline Observation for select demographics, and disaggregated results by demographics.
This is the Pipeline Observation which provides a more holistic review of the results for specific demographics. Results are from the combination of all cohorts in each element to provide sufficient numbers. Even when combining the cohorts, some demographic groups have small numbers - these are shaded in grey. The success rate for the demographic group is listed for each element along with the success for all students. The red and green bars in the combined cohort column illustrate achievement gaps relative to the overall (average) rate. The longer the bar, the greater the gap. This provides a look at the strengths and challenges for each group invididually and compared to all students.
Gender Financial Aid (First Year) Enrollment Status (First Term) Ed Plan (First Term) All StudentsFemale Male Awarded Not Awarded Full-time Part-time Completed Not Completed
4 of 26
KCCD Institutional Research and Reporting Elements of Student Success
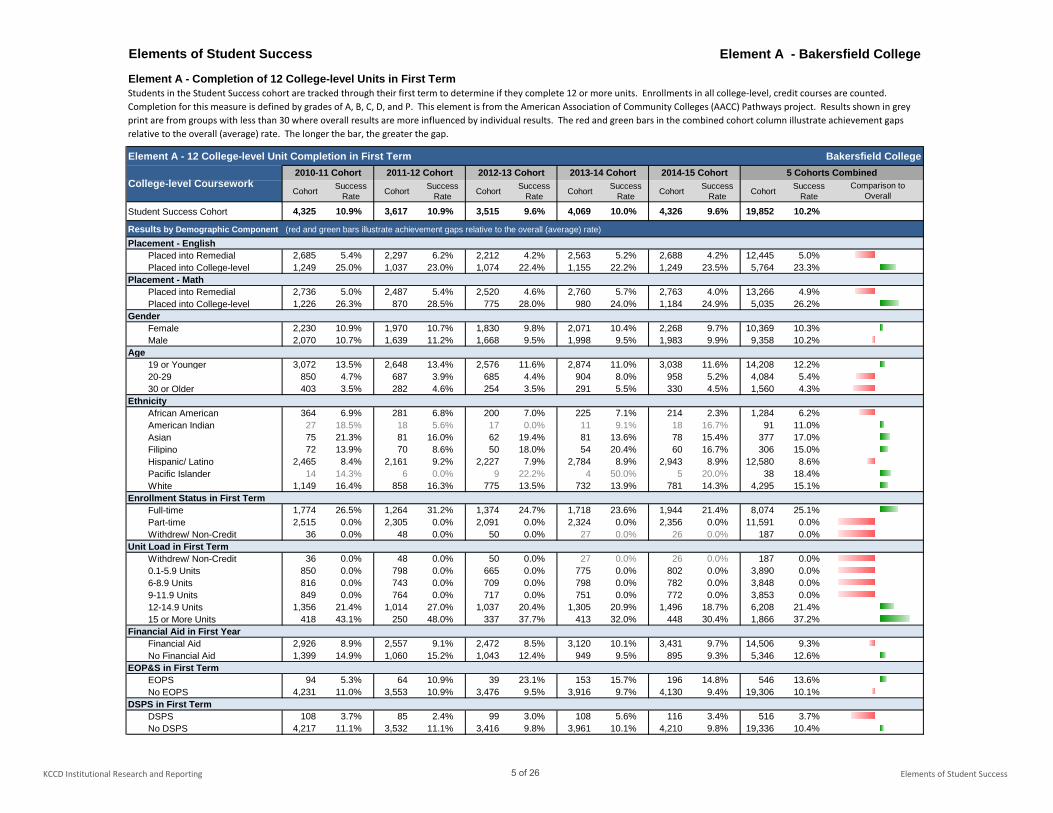
Elements of Student Success Element A - Bakersfield College
Element A - Completion of 12 College-level Units in First Term
Element A - 12 College-level Unit Completion in First Term Bakersfield College
Cohort Success Rate Cohort Success
Rate Cohort Success Rate Cohort Success
Rate Cohort Success Rate Cohort Success
Rate
Student Success Cohort 4,325 10.9% 3,617 10.9% 3,515 9.6% 4,069 10.0% 4,326 9.6% 19,852 10.2%
Results by Demographic Component (red and green bars illustrate achievement gaps relative to the overall (average) rate)
Placement - EnglishPlaced into Remedial 2,685 5.4% 2,297 6.2% 2,212 4.2% 2,563 5.2% 2,688 4.2% 12,445 5.0%Placed into College-level 1,249 25.0% 1,037 23.0% 1,074 22.4% 1,155 22.2% 1,249 23.5% 5,764 23.3%
Placement - MathPlaced into Remedial 2,736 5.0% 2,487 5.4% 2,520 4.6% 2,760 5.7% 2,763 4.0% 13,266 4.9%Placed into College-level 1,226 26.3% 870 28.5% 775 28.0% 980 24.0% 1,184 24.9% 5,035 26.2%
GenderFemale 2,230 10.9% 1,970 10.7% 1,830 9.8% 2,071 10.4% 2,268 9.7% 10,369 10.3%Male 2,070 10.7% 1,639 11.2% 1,668 9.5% 1,998 9.5% 1,983 9.9% 9,358 10.2%
Age19 or Younger 3,072 13.5% 2,648 13.4% 2,576 11.6% 2,874 11.0% 3,038 11.6% 14,208 12.2%20-29 850 4.7% 687 3.9% 685 4.4% 904 8.0% 958 5.2% 4,084 5.4%30 or Older 403 3.5% 282 4.6% 254 3.5% 291 5.5% 330 4.5% 1,560 4.3%
Ethnicity African American 364 6.9% 281 6.8% 200 7.0% 225 7.1% 214 2.3% 1,284 6.2%American Indian 27 18.5% 18 5.6% 17 0.0% 11 9.1% 18 16.7% 91 11.0%Asian 75 21.3% 81 16.0% 62 19.4% 81 13.6% 78 15.4% 377 17.0%Filipino 72 13.9% 70 8.6% 50 18.0% 54 20.4% 60 16.7% 306 15.0%Hispanic/ Latino 2,465 8.4% 2,161 9.2% 2,227 7.9% 2,784 8.9% 2,943 8.9% 12,580 8.6%Pacific Islander 14 14.3% 6 0.0% 9 22.2% 4 50.0% 5 20.0% 38 18.4%White 1,149 16.4% 858 16.3% 775 13.5% 732 13.9% 781 14.3% 4,295 15.1%
Enrollment Status in First TermFull-time 1,774 26.5% 1,264 31.2% 1,374 24.7% 1,718 23.6% 1,944 21.4% 8,074 25.1%Part-time 2,515 0.0% 2,305 0.0% 2,091 0.0% 2,324 0.0% 2,356 0.0% 11,591 0.0%Withdrew/ Non-Credit 36 0.0% 48 0.0% 50 0.0% 27 0.0% 26 0.0% 187 0.0%
Unit Load in First TermWithdrew/ Non-Credit 36 0.0% 48 0.0% 50 0.0% 27 0.0% 26 0.0% 187 0.0%0.1-5.9 Units 850 0.0% 798 0.0% 665 0.0% 775 0.0% 802 0.0% 3,890 0.0%6-8.9 Units 816 0.0% 743 0.0% 709 0.0% 798 0.0% 782 0.0% 3,848 0.0%9-11.9 Units 849 0.0% 764 0.0% 717 0.0% 751 0.0% 772 0.0% 3,853 0.0%12-14.9 Units 1,356 21.4% 1,014 27.0% 1,037 20.4% 1,305 20.9% 1,496 18.7% 6,208 21.4%15 or More Units 418 43.1% 250 48.0% 337 37.7% 413 32.0% 448 30.4% 1,866 37.2%
Financial Aid in First YearFinancial Aid 2,926 8.9% 2,557 9.1% 2,472 8.5% 3,120 10.1% 3,431 9.7% 14,506 9.3%No Financial Aid 1,399 14.9% 1,060 15.2% 1,043 12.4% 949 9.5% 895 9.3% 5,346 12.6%
EOP&S in First TermEOPS 94 5.3% 64 10.9% 39 23.1% 153 15.7% 196 14.8% 546 13.6%No EOPS 4,231 11.0% 3,553 10.9% 3,476 9.5% 3,916 9.7% 4,130 9.4% 19,306 10.1%
DSPS in First TermDSPS 108 3.7% 85 2.4% 99 3.0% 108 5.6% 116 3.4% 516 3.7%No DSPS 4,217 11.1% 3,532 11.1% 3,416 9.8% 3,961 10.1% 4,210 9.8% 19,336 10.4%
Students in the Student Success cohort are tracked through their first term to determine if they complete 12 or more units. Enrollments in all college-level, credit courses are counted. Completion for this measure is defined by grades of A, B, C, D, and P. This element is from the American Association of Community Colleges (AACC) Pathways project. Results shown in grey print are from groups with less than 30 where overall results are more influenced by individual results. The red and green bars in the combined cohort column illustrate achievement gaps relative to the overall (average) rate. The longer the bar, the greater the gap.
College-level Coursework2010-11 Cohort 2011-12 Cohort 2012-13 Cohort 2013-14 Cohort 2014-15 Cohort 5 Cohorts Combined
Comparison to Overall
5 of 26

KCCD Institutional Research and Reporting Elements of Student Success
Element A - 12 College-level Unit Completion in First Term Bakersfield College
Cohort Success Rate Cohort Success
Rate Cohort Success Rate Cohort Success
Rate Cohort Success Rate Cohort Success
Rate
Student Success Cohort 4,325 10.9% 3,617 10.9% 3,515 9.6% 4,069 10.0% 4,326 9.6% 19,852 10.2%
Results by Demographic Component (red and green bars illustrate achievement gaps relative to the overall (average) rate)
College-level Coursework2010-11 Cohort 2011-12 Cohort 2012-13 Cohort 2013-14 Cohort 2014-15 Cohort 5 Cohorts Combined
Comparison to Overall
Foster Youth in First TermFoster Youth 25 8.0% 25 16.0% 47 0.0% 100 5.0% 108 4.6% 305 5.2%Not a Foster Youth 4,300 10.9% 3,592 10.9% 3,468 9.8% 3,969 10.1% 4,218 9.7% 19,547 10.3%
Veteran in First TermVeteran 30 23.3% 11 18.2% 25 28.0% 28 21.4% 33 18.2% 127 22.0%Not a Veteran 4,295 10.8% 3,606 10.9% 3,490 9.5% 4,041 9.9% 4,293 9.6% 19,725 10.1%
MESA in First TermMESA 12 58.3% 30 46.7% 18 22.2% 20 55.0% 80 45.0%Not a MESA Student 3,605 10.7% 3,485 9.3% 4,051 9.9% 4,306 9.4% 19,772 10.1%
Athletes in First YearAthlete 172 50.6% 166 48.2% 138 42.0% 159 34.6% 188 29.8% 823 40.8%Not an Athlete 4,153 9.2% 3,451 9.1% 3,377 8.3% 3,910 9.0% 4,138 8.7% 19,029 8.9%
Percentage of Distance Ed Within Cohort Period100% Distance Ed 149 4.0% 124 2.4% 70 1.4% 109 0.0% 122 2.5% 574 2.3%66 - 99% Distance Ed 75 8.0% 68 10.3% 42 4.8% 63 14.3% 65 9.2% 313 9.6%33 - 65% Distance Ed 254 9.1% 201 11.9% 185 8.1% 245 9.4% 227 6.6% 1,112 9.0%1 - 32.9% Distance Ed 1,242 18.7% 989 19.0% 964 16.1% 964 17.8% 852 18.3% 5,011 18.0%100% Traditional 2,605 7.8% 2,235 7.7% 2,254 7.4% 2,688 7.5% 3,060 7.7% 12,842 7.6%
Educational Goal in First TermTransfer 2,414 13.3% 2,117 12.7% 2,008 11.2% 2,701 11.2% 2,919 11.5% 12,159 12.0%Associates Degree 53 13.2% 37 0.0% 33 3.0% 527 6.8% 690 6.1% 1,340 6.4%Vocational Degree or Certificate 143 4.9% 118 5.1% 87 5.7% 204 3.9% 239 4.6% 791 4.7%Other 807 5.9% 604 7.1% 614 6.8% 313 8.6% 184 7.6% 2,522 6.9%Undecided 902 9.5% 731 10.3% 753 8.8% 303 9.9% 213 6.1% 2,902 9.3%Unknown/Uncollected 6 0.0% 10 10.0% 20 0.0% 21 4.8% 81 0.0% 138 1.4%
Matriculation in First Term by ComponentAssessment 3,908 11.6% 3,311 11.5% 3,255 10.3% 3,698 10.5% 3,943 10.3% 18,115 10.8%
No Assessment 417 3.6% 306 4.2% 260 1.5% 371 4.6% 383 2.9% 1,737 3.5%Orientation 3,530 12.1% 3,174 11.9% 3,202 10.5% 3,718 10.5% 3,963 10.4% 17,587 11.1%
No Orientation 795 5.3% 443 3.6% 313 1.3% 351 4.0% 363 1.1% 2,265 3.5%Counseling 3,019 13.1% 2,851 12.6% 2,910 11.0% 3,324 11.1% 3,750 10.7% 15,854 11.6%
No Counseling 1,306 5.7% 766 4.6% 605 3.1% 745 4.7% 576 2.6% 3,998 4.5%Educational Plan 990 20.7% 1,162 19.2% 1,391 16.2% 1,719 14.5% 2,583 12.8% 7,845 15.7%
No Educational Plan 3,335 7.9% 2,455 7.0% 2,124 5.3% 2,350 6.6% 1,743 4.9% 12,007 6.6%Matriculation in First Term by Number of Components Completed
No Matric Components 278 2.5% 211 2.8% 171 0.6% 207 1.4% 238 0.8% 1,105 1.7%1 Matric Component 446 6.5% 235 4.7% 159 1.3% 214 5.1% 152 2.6% 1,206 4.7%2 Matric Components 741 5.8% 384 5.5% 316 5.7% 367 6.8% 250 4.8% 2,058 5.8%3 Matric Components 1,921 10.2% 1,653 8.2% 1,509 6.2% 1,613 7.9% 1,157 6.1% 7,853 7.9%4 Matric Components 939 20.8% 1,134 19.4% 1,360 16.5% 1,668 14.3% 2,529 12.9% 7,630 15.8%
First English Attempt1st Term 1,609 11.6% 1,184 10.7% 1,339 8.1% 1,641 8.4% 1,885 10.7% 7,658 10.0%2nd Term 641 17.8% 589 21.7% 404 25.7% 404 19.1% 528 17.0% 2,566 20.0%Course not taken in 1st year 2,075 8.1% 1,844 7.5% 1,772 7.1% 2,024 9.4% 1,913 6.5% 9,628 7.8%
First Math Attempt1st Term 1,497 12.1% 991 12.0% 1,120 11.3% 1,409 8.2% 1,443 10.1% 6,460 10.7%2nd Term 638 19.3% 632 19.6% 334 24.6% 477 21.4% 534 21.0% 2,615 20.8%Course not taken in 1st year 2,190 7.6% 1,994 7.6% 2,061 6.4% 2,183 8.6% 2,349 6.7% 10,777 7.4%
No data available
6 of 26
KCCD Institutional Research and Reporting Elements of Student Success
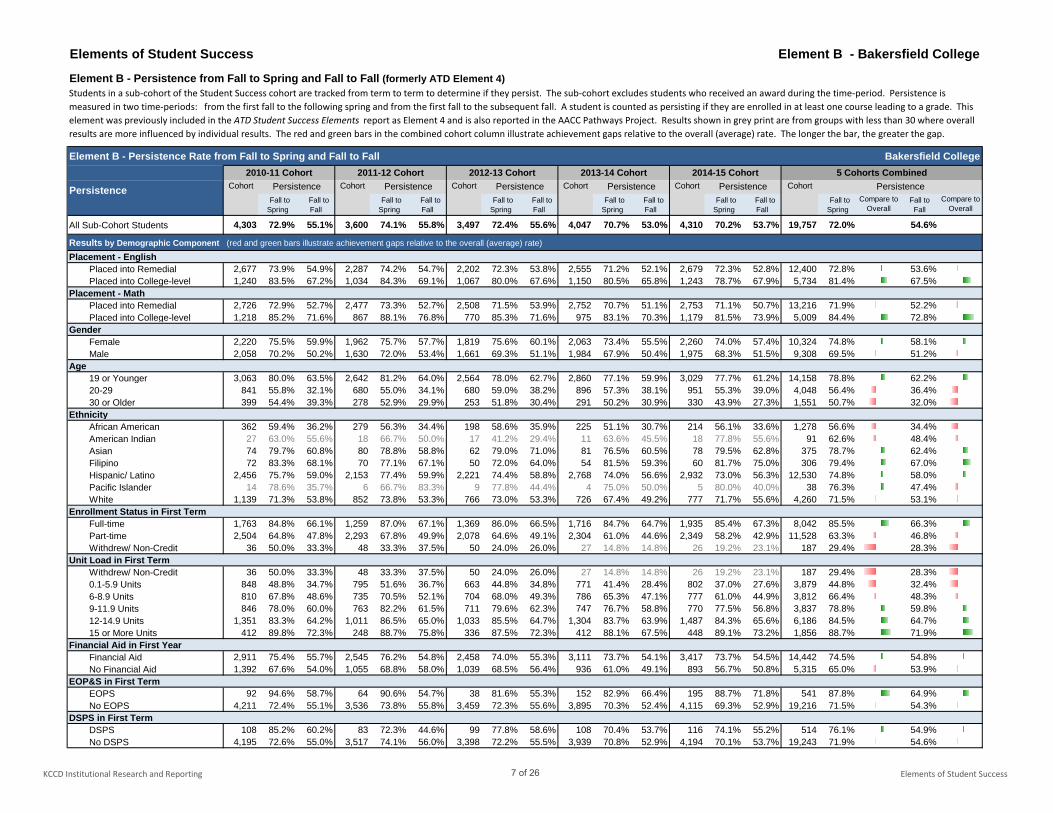
Elements of Student Success Element B - Bakersfield College
Element B - Persistence from Fall to Spring and Fall to Fall (formerly ATD Element 4)
Element B - Persistence Rate from Fall to Spring and Fall to Fall Bakersfield College
Fall to Spring
Fall to Fall
Fall to Spring
Fall to Fall
Fall to Spring
Fall to Fall
Fall to Spring
Fall to Fall
Fall to Spring
Fall to Fall
Fall to Spring
Fall to Fall
All Sub-Cohort Students 4,303 72.9% 55.1% 3,600 74.1% 55.8% 3,497 72.4% 55.6% 4,047 70.7% 53.0% 4,310 70.2% 53.7% 19,757 72.0% 54.6%
Results by Demographic Component (red and green bars illustrate achievement gaps relative to the overall (average) rate)
Placement - EnglishPlaced into Remedial 2,677 73.9% 54.9% 2,287 74.2% 54.7% 2,202 72.3% 53.8% 2,555 71.2% 52.1% 2,679 72.3% 52.8% 12,400 72.8% 53.6%Placed into College-level 1,240 83.5% 67.2% 1,034 84.3% 69.1% 1,067 80.0% 67.6% 1,150 80.5% 65.8% 1,243 78.7% 67.9% 5,734 81.4% 67.5%
Placement - MathPlaced into Remedial 2,726 72.9% 52.7% 2,477 73.3% 52.7% 2,508 71.5% 53.9% 2,752 70.7% 51.1% 2,753 71.1% 50.7% 13,216 71.9% 52.2%Placed into College-level 1,218 85.2% 71.6% 867 88.1% 76.8% 770 85.3% 71.6% 975 83.1% 70.3% 1,179 81.5% 73.9% 5,009 84.4% 72.8%
GenderFemale 2,220 75.5% 59.9% 1,962 75.7% 57.7% 1,819 75.6% 60.1% 2,063 73.4% 55.5% 2,260 74.0% 57.4% 10,324 74.8% 58.1%Male 2,058 70.2% 50.2% 1,630 72.0% 53.4% 1,661 69.3% 51.1% 1,984 67.9% 50.4% 1,975 68.3% 51.5% 9,308 69.5% 51.2%
Age19 or Younger 3,063 80.0% 63.5% 2,642 81.2% 64.0% 2,564 78.0% 62.7% 2,860 77.1% 59.9% 3,029 77.7% 61.2% 14,158 78.8% 62.2%20-29 841 55.8% 32.1% 680 55.0% 34.1% 680 59.0% 38.2% 896 57.3% 38.1% 951 55.3% 39.0% 4,048 56.4% 36.4%30 or Older 399 54.4% 39.3% 278 52.9% 29.9% 253 51.8% 30.4% 291 50.2% 30.9% 330 43.9% 27.3% 1,551 50.7% 32.0%
Ethnicity African American 362 59.4% 36.2% 279 56.3% 34.4% 198 58.6% 35.9% 225 51.1% 30.7% 214 56.1% 33.6% 1,278 56.6% 34.4%American Indian 27 63.0% 55.6% 18 66.7% 50.0% 17 41.2% 29.4% 11 63.6% 45.5% 18 77.8% 55.6% 91 62.6% 48.4%Asian 74 79.7% 60.8% 80 78.8% 58.8% 62 79.0% 71.0% 81 76.5% 60.5% 78 79.5% 62.8% 375 78.7% 62.4%Filipino 72 83.3% 68.1% 70 77.1% 67.1% 50 72.0% 64.0% 54 81.5% 59.3% 60 81.7% 75.0% 306 79.4% 67.0%Hispanic/ Latino 2,456 75.7% 59.0% 2,153 77.4% 59.9% 2,221 74.4% 58.8% 2,768 74.0% 56.6% 2,932 73.0% 56.3% 12,530 74.8% 58.0%Pacific Islander 14 78.6% 35.7% 6 66.7% 83.3% 9 77.8% 44.4% 4 75.0% 50.0% 5 80.0% 40.0% 38 76.3% 47.4%White 1,139 71.3% 53.8% 852 73.8% 53.3% 766 73.0% 53.3% 726 67.4% 49.2% 777 71.7% 55.6% 4,260 71.5% 53.1%
Enrollment Status in First TermFull-time 1,763 84.8% 66.1% 1,259 87.0% 67.1% 1,369 86.0% 66.5% 1,716 84.7% 64.7% 1,935 85.4% 67.3% 8,042 85.5% 66.3%Part-time 2,504 64.8% 47.8% 2,293 67.8% 49.9% 2,078 64.6% 49.1% 2,304 61.0% 44.6% 2,349 58.2% 42.9% 11,528 63.3% 46.8%Withdrew/ Non-Credit 36 50.0% 33.3% 48 33.3% 37.5% 50 24.0% 26.0% 27 14.8% 14.8% 26 19.2% 23.1% 187 29.4% 28.3%
Unit Load in First TermWithdrew/ Non-Credit 36 50.0% 33.3% 48 33.3% 37.5% 50 24.0% 26.0% 27 14.8% 14.8% 26 19.2% 23.1% 187 29.4% 28.3%0.1-5.9 Units 848 48.8% 34.7% 795 51.6% 36.7% 663 44.8% 34.8% 771 41.4% 28.4% 802 37.0% 27.6% 3,879 44.8% 32.4%6-8.9 Units 810 67.8% 48.6% 735 70.5% 52.1% 704 68.0% 49.3% 786 65.3% 47.1% 777 61.0% 44.9% 3,812 66.4% 48.3%9-11.9 Units 846 78.0% 60.0% 763 82.2% 61.5% 711 79.6% 62.3% 747 76.7% 58.8% 770 77.5% 56.8% 3,837 78.8% 59.8%12-14.9 Units 1,351 83.3% 64.2% 1,011 86.5% 65.0% 1,033 85.5% 64.7% 1,304 83.7% 63.9% 1,487 84.3% 65.6% 6,186 84.5% 64.7%15 or More Units 412 89.8% 72.3% 248 88.7% 75.8% 336 87.5% 72.3% 412 88.1% 67.5% 448 89.1% 73.2% 1,856 88.7% 71.9%
Financial Aid in First YearFinancial Aid 2,911 75.4% 55.7% 2,545 76.2% 54.8% 2,458 74.0% 55.3% 3,111 73.7% 54.1% 3,417 73.7% 54.5% 14,442 74.5% 54.8%No Financial Aid 1,392 67.6% 54.0% 1,055 68.8% 58.0% 1,039 68.5% 56.4% 936 61.0% 49.1% 893 56.7% 50.8% 5,315 65.0% 53.9%
EOP&S in First TermEOPS 92 94.6% 58.7% 64 90.6% 54.7% 38 81.6% 55.3% 152 82.9% 66.4% 195 88.7% 71.8% 541 87.8% 64.9%No EOPS 4,211 72.4% 55.1% 3,536 73.8% 55.8% 3,459 72.3% 55.6% 3,895 70.3% 52.4% 4,115 69.3% 52.9% 19,216 71.5% 54.3%
DSPS in First TermDSPS 108 85.2% 60.2% 83 72.3% 44.6% 99 77.8% 58.6% 108 70.4% 53.7% 116 74.1% 55.2% 514 76.1% 54.9%No DSPS 4,195 72.6% 55.0% 3,517 74.1% 56.0% 3,398 72.2% 55.5% 3,939 70.8% 52.9% 4,194 70.1% 53.7% 19,243 71.9% 54.6%
Students in a sub-cohort of the Student Success cohort are tracked from term to term to determine if they persist. The sub-cohort excludes students who received an award during the time-period. Persistence is measured in two time-periods: from the first fall to the following spring and from the first fall to the subsequent fall. A student is counted as persisting if they are enrolled in at least one course leading to a grade. This element was previously included in the ATD Student Success Elements report as Element 4 and is also reported in the AACC Pathways Project. Results shown in grey print are from groups with less than 30 where overall results are more influenced by individual results. The red and green bars in the combined cohort column illustrate achievement gaps relative to the overall (average) rate. The longer the bar, the greater the gap.
5 Cohorts Combined2013-14 CohortCohort Persistence
2014-15 CohortCohort Persistence
Compare to Overall
Compare to Overall
Persistence Cohort Persistence Cohort Persistence Cohort PersistencePersistence Cohort2010-11 Cohort 2011-12 Cohort 2012-13 Cohort
7 of 26
KCCD Institutional Research and Reporting Elements of Student Success
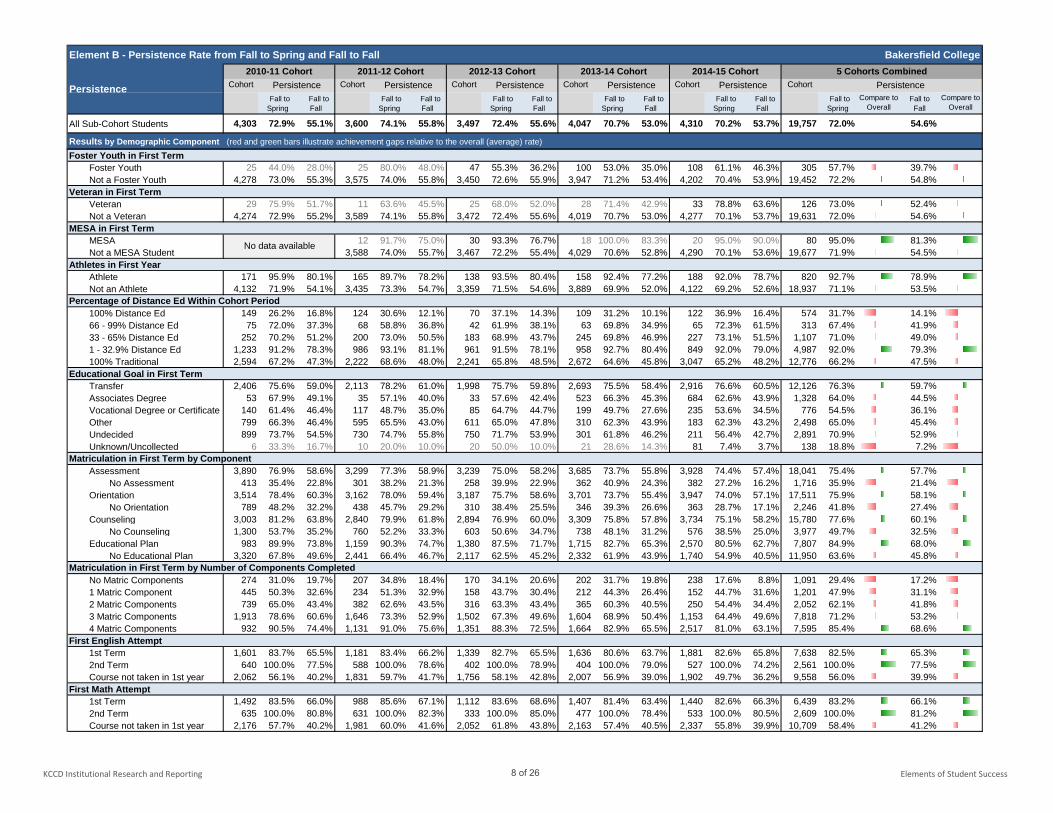
Element B - Persistence Rate from Fall to Spring and Fall to Fall Bakersfield College
Fall to Spring
Fall to Fall
Fall to Spring
Fall to Fall
Fall to Spring
Fall to Fall
Fall to Spring
Fall to Fall
Fall to Spring
Fall to Fall
Fall to Spring
Fall to Fall
All Sub-Cohort Students 4,303 72.9% 55.1% 3,600 74.1% 55.8% 3,497 72.4% 55.6% 4,047 70.7% 53.0% 4,310 70.2% 53.7% 19,757 72.0% 54.6%
Results by Demographic Component (red and green bars illustrate achievement gaps relative to the overall (average) rate)
5 Cohorts Combined2013-14 CohortCohort Persistence
2014-15 CohortCohort Persistence
Compare to Overall
Compare to Overall
Persistence Cohort Persistence Cohort Persistence Cohort PersistencePersistence Cohort2010-11 Cohort 2011-12 Cohort 2012-13 Cohort
Foster Youth in First TermFoster Youth 25 44.0% 28.0% 25 80.0% 48.0% 47 55.3% 36.2% 100 53.0% 35.0% 108 61.1% 46.3% 305 57.7% 39.7%Not a Foster Youth 4,278 73.0% 55.3% 3,575 74.0% 55.8% 3,450 72.6% 55.9% 3,947 71.2% 53.4% 4,202 70.4% 53.9% 19,452 72.2% 54.8%
Veteran in First TermVeteran 29 75.9% 51.7% 11 63.6% 45.5% 25 68.0% 52.0% 28 71.4% 42.9% 33 78.8% 63.6% 126 73.0% 52.4%Not a Veteran 4,274 72.9% 55.2% 3,589 74.1% 55.8% 3,472 72.4% 55.6% 4,019 70.7% 53.0% 4,277 70.1% 53.7% 19,631 72.0% 54.6%
MESA in First TermMESA 12 91.7% 75.0% 30 93.3% 76.7% 18 100.0% 83.3% 20 95.0% 90.0% 80 95.0% 81.3%Not a MESA Student 3,588 74.0% 55.7% 3,467 72.2% 55.4% 4,029 70.6% 52.8% 4,290 70.1% 53.6% 19,677 71.9% 54.5%
Athletes in First YearAthlete 171 95.9% 80.1% 165 89.7% 78.2% 138 93.5% 80.4% 158 92.4% 77.2% 188 92.0% 78.7% 820 92.7% 78.9%Not an Athlete 4,132 71.9% 54.1% 3,435 73.3% 54.7% 3,359 71.5% 54.6% 3,889 69.9% 52.0% 4,122 69.2% 52.6% 18,937 71.1% 53.5%
Percentage of Distance Ed Within Cohort Period100% Distance Ed 149 26.2% 16.8% 124 30.6% 12.1% 70 37.1% 14.3% 109 31.2% 10.1% 122 36.9% 16.4% 574 31.7% 14.1%66 - 99% Distance Ed 75 72.0% 37.3% 68 58.8% 36.8% 42 61.9% 38.1% 63 69.8% 34.9% 65 72.3% 61.5% 313 67.4% 41.9%33 - 65% Distance Ed 252 70.2% 51.2% 200 73.0% 50.5% 183 68.9% 43.7% 245 69.8% 46.9% 227 73.1% 51.5% 1,107 71.0% 49.0%1 - 32.9% Distance Ed 1,233 91.2% 78.3% 986 93.1% 81.1% 961 91.5% 78.1% 958 92.7% 80.4% 849 92.0% 79.0% 4,987 92.0% 79.3%100% Traditional 2,594 67.2% 47.3% 2,222 68.6% 48.0% 2,241 65.8% 48.5% 2,672 64.6% 45.8% 3,047 65.2% 48.2% 12,776 66.2% 47.5%
Educational Goal in First TermTransfer 2,406 75.6% 59.0% 2,113 78.2% 61.0% 1,998 75.7% 59.8% 2,693 75.5% 58.4% 2,916 76.6% 60.5% 12,126 76.3% 59.7%Associates Degree 53 67.9% 49.1% 35 57.1% 40.0% 33 57.6% 42.4% 523 66.3% 45.3% 684 62.6% 43.9% 1,328 64.0% 44.5%Vocational Degree or Certificate 140 61.4% 46.4% 117 48.7% 35.0% 85 64.7% 44.7% 199 49.7% 27.6% 235 53.6% 34.5% 776 54.5% 36.1%Other 799 66.3% 46.4% 595 65.5% 43.0% 611 65.0% 47.8% 310 62.3% 43.9% 183 62.3% 43.2% 2,498 65.0% 45.4%Undecided 899 73.7% 54.5% 730 74.7% 55.8% 750 71.7% 53.9% 301 61.8% 46.2% 211 56.4% 42.7% 2,891 70.9% 52.9%Unknown/Uncollected 6 33.3% 16.7% 10 20.0% 10.0% 20 50.0% 10.0% 21 28.6% 14.3% 81 7.4% 3.7% 138 18.8% 7.2%
Matriculation in First Term by ComponentAssessment 3,890 76.9% 58.6% 3,299 77.3% 58.9% 3,239 75.0% 58.2% 3,685 73.7% 55.8% 3,928 74.4% 57.4% 18,041 75.4% 57.7%
No Assessment 413 35.4% 22.8% 301 38.2% 21.3% 258 39.9% 22.9% 362 40.9% 24.3% 382 27.2% 16.2% 1,716 35.9% 21.4%Orientation 3,514 78.4% 60.3% 3,162 78.0% 59.4% 3,187 75.7% 58.6% 3,701 73.7% 55.4% 3,947 74.0% 57.1% 17,511 75.9% 58.1%
No Orientation 789 48.2% 32.2% 438 45.7% 29.2% 310 38.4% 25.5% 346 39.3% 26.6% 363 28.7% 17.1% 2,246 41.8% 27.4%Counseling 3,003 81.2% 63.8% 2,840 79.9% 61.8% 2,894 76.9% 60.0% 3,309 75.8% 57.8% 3,734 75.1% 58.2% 15,780 77.6% 60.1%
No Counseling 1,300 53.7% 35.2% 760 52.2% 33.3% 603 50.6% 34.7% 738 48.1% 31.2% 576 38.5% 25.0% 3,977 49.7% 32.5%Educational Plan 983 89.9% 73.8% 1,159 90.3% 74.7% 1,380 87.5% 71.7% 1,715 82.7% 65.3% 2,570 80.5% 62.7% 7,807 84.9% 68.0%
No Educational Plan 3,320 67.8% 49.6% 2,441 66.4% 46.7% 2,117 62.5% 45.2% 2,332 61.9% 43.9% 1,740 54.9% 40.5% 11,950 63.6% 45.8%Matriculation in First Term by Number of Components Completed
No Matric Components 274 31.0% 19.7% 207 34.8% 18.4% 170 34.1% 20.6% 202 31.7% 19.8% 238 17.6% 8.8% 1,091 29.4% 17.2%1 Matric Component 445 50.3% 32.6% 234 51.3% 32.9% 158 43.7% 30.4% 212 44.3% 26.4% 152 44.7% 31.6% 1,201 47.9% 31.1%2 Matric Components 739 65.0% 43.4% 382 62.6% 43.5% 316 63.3% 43.4% 365 60.3% 40.5% 250 54.4% 34.4% 2,052 62.1% 41.8%3 Matric Components 1,913 78.6% 60.6% 1,646 73.3% 52.9% 1,502 67.3% 49.6% 1,604 68.9% 50.4% 1,153 64.4% 49.6% 7,818 71.2% 53.2%4 Matric Components 932 90.5% 74.4% 1,131 91.0% 75.6% 1,351 88.3% 72.5% 1,664 82.9% 65.5% 2,517 81.0% 63.1% 7,595 85.4% 68.6%
First English Attempt1st Term 1,601 83.7% 65.5% 1,181 83.4% 66.2% 1,339 82.7% 65.5% 1,636 80.6% 63.7% 1,881 82.6% 65.8% 7,638 82.5% 65.3%2nd Term 640 100.0% 77.5% 588 100.0% 78.6% 402 100.0% 78.9% 404 100.0% 79.0% 527 100.0% 74.2% 2,561 100.0% 77.5%Course not taken in 1st year 2,062 56.1% 40.2% 1,831 59.7% 41.7% 1,756 58.1% 42.8% 2,007 56.9% 39.0% 1,902 49.7% 36.2% 9,558 56.0% 39.9%
First Math Attempt1st Term 1,492 83.5% 66.0% 988 85.6% 67.1% 1,112 83.6% 68.6% 1,407 81.4% 63.4% 1,440 82.6% 66.3% 6,439 83.2% 66.1%2nd Term 635 100.0% 80.8% 631 100.0% 82.3% 333 100.0% 85.0% 477 100.0% 78.4% 533 100.0% 80.5% 2,609 100.0% 81.2%Course not taken in 1st year 2,176 57.7% 40.2% 1,981 60.0% 41.6% 2,052 61.8% 43.8% 2,163 57.4% 40.5% 2,337 55.8% 39.9% 10,709 58.4% 41.2%
No data available
8 of 26
KCCD Institutional Research and Reporting Elements of Student Success
Elements of Student Success Element C - Bakersfield College
Element C - Successful Course Completion in First Year (formerly ATD Element 3)
Element C - Successful Course Completion Rate in First Year (Grade of 'C' or Better) Bakersfield College
Cohort Success Rate Cohort Success
Rate Cohort Success Rate Cohort Success
Rate Cohort Success Rate Cohort Success
Rate
Student Success Cohort 4,325 59.4% 3,617 62.6% 3,515 61.4% 4,069 61.0% 4,326 60.7% 19,852 60.9%
Results by Demographic Component (red and green bars illustrate achievement gaps relative to the overall (average) rate)
Placement - EnglishPlaced into Remedial 2,685 54.7% 2,297 58.6% 2,212 56.9% 2,563 57.5% 2,688 57.0% 12,445 56.8%Placed into College-level 1,249 70.1% 1,037 72.1% 1,074 69.9% 1,155 69.1% 1,249 69.5% 5,764 70.1%
Placement - MathPlaced into Remedial 2,736 53.0% 2,487 57.4% 2,520 55.8% 2,760 56.6% 2,763 55.6% 13,266 55.6%Placed into College-level 1,226 72.3% 870 76.2% 775 75.9% 980 73.0% 1,184 72.3% 5,035 73.6%
GenderFemale 2,230 61.4% 1,970 63.2% 1,830 63.5% 2,071 61.9% 2,268 62.1% 10,369 62.3%Male 2,070 57.1% 1,639 61.8% 1,668 58.9% 1,998 59.9% 1,983 58.8% 9,358 59.2%
Age19 or Younger 3,072 62.1% 2,648 64.8% 2,576 62.8% 2,874 62.0% 3,038 62.2% 14,208 62.7%20-29 850 48.5% 687 51.7% 685 55.2% 904 57.2% 958 56.1% 4,084 53.9%30 or Older 403 52.1% 282 56.5% 254 57.8% 291 58.2% 330 53.2% 1,560 55.1%
Ethnicity African American 364 36.3% 281 42.0% 200 39.1% 225 42.7% 214 36.7% 1,284 39.0%American Indian 27 47.0% 18 47.0% 17 42.6% 11 74.7% 18 57.4% 91 52.9%Asian 75 76.0% 81 71.5% 62 70.9% 81 71.5% 78 66.9% 377 71.3%Filipino 72 74.0% 70 69.2% 50 78.6% 54 76.6% 60 73.2% 306 74.0%Hispanic/ Latino 2,465 59.1% 2,161 62.2% 2,227 60.1% 2,784 60.9% 2,943 60.2% 12,580 60.5%Pacific Islander 14 62.6% 6 53.8% 9 61.8% 4 65.5% 5 66.7% 38 61.9%White 1,149 65.9% 858 69.3% 775 68.3% 732 64.9% 781 67.4% 4,295 67.1%
Enrollment Status in First TermFull-time 1,774 64.1% 1,264 68.2% 1,374 66.3% 1,718 65.3% 1,944 64.7% 8,074 65.5%Part-time 2,515 53.7% 2,305 57.3% 2,091 55.7% 2,324 55.0% 2,356 54.2% 11,591 55.2%Withdrew/ Non-Credit 36 34.1% 48 45.2% 50 37.2% 27 53.3% 26 54.2% 187 41.3%
Unit Load in First TermWithdrew/ Non-Credit 36 34.1% 48 45.2% 50 37.2% 27 53.3% 26 54.2% 187 41.3%0.1-5.9 Units 850 49.7% 798 51.4% 665 52.9% 775 48.7% 802 52.1% 3,890 50.8%6-8.9 Units 816 53.1% 743 58.2% 709 56.2% 798 57.2% 782 54.5% 3,848 55.8%9-11.9 Units 849 56.0% 764 59.5% 717 56.6% 751 56.1% 772 54.9% 3,853 56.6%12-14.9 Units 1,356 61.5% 1,014 65.8% 1,037 64.3% 1,305 62.9% 1,496 63.6% 6,208 63.5%15 or More Units 418 70.9% 250 75.8% 337 71.3% 413 71.3% 448 67.7% 1,866 71.0%
Financial Aid in First YearFinancial Aid 2,926 55.2% 2,557 58.4% 2,472 57.7% 3,120 58.8% 3,431 58.8% 14,506 57.8%No Financial Aid 1,399 69.5% 1,060 73.8% 1,043 71.6% 949 69.7% 895 69.9% 5,346 70.9%
EOP&S in First TermEOPS 94 53.1% 64 56.1% 39 58.2% 153 65.7% 196 66.3% 546 61.9%No EOPS 4,231 59.6% 3,553 62.7% 3,476 61.5% 3,916 60.7% 4,130 60.3% 19,306 60.9%
DSPS in First TermDSPS 108 55.7% 85 58.9% 99 52.0% 108 57.7% 116 55.7% 516 55.9%No DSPS 4,217 59.5% 3,532 62.7% 3,416 61.7% 3,961 61.0% 4,210 60.9% 19,336 61.1%
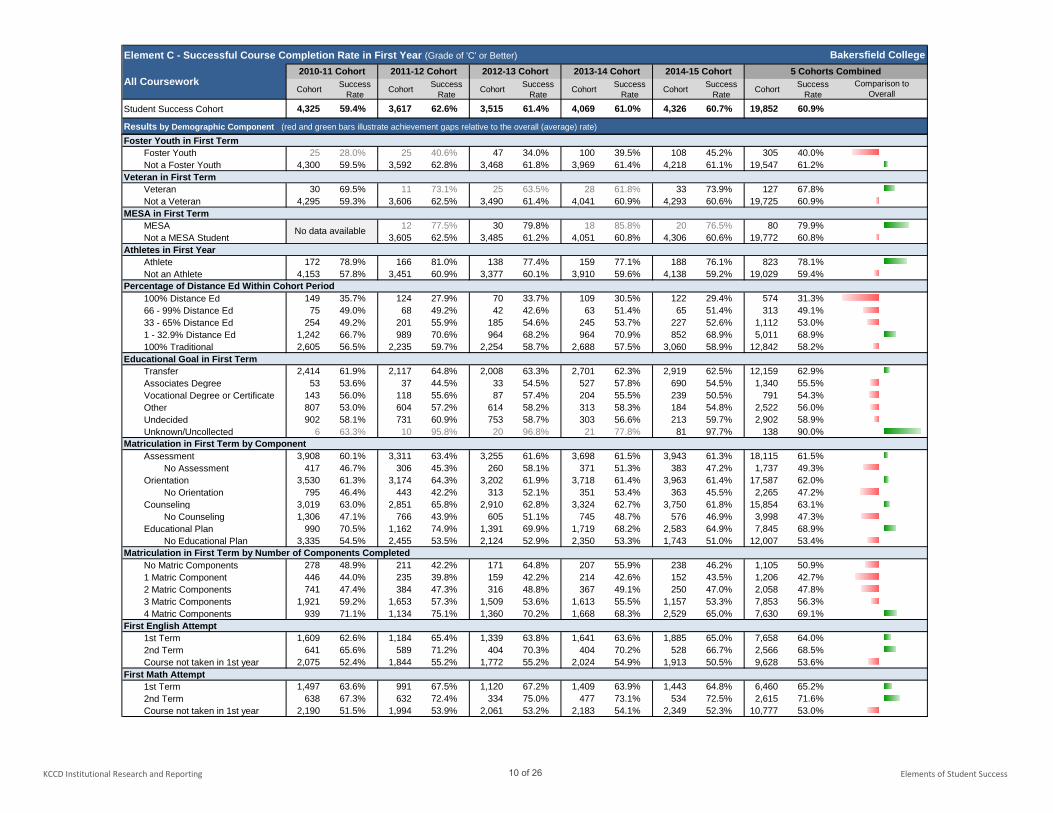
Students in the Student Success cohort are tracked for one year to determine their successful course completion rate. Enrollments in all credit courses during the summer, fall and spring terms are used. Successful course completion is determined using the following calculation: all grades of A, B, C, and P divided by all grades of A, B, C, P, D, F, I, NP, W, and DR. This element was previously included in the ATD Student Success Elements report as Element 3. Results shown in grey print are from groups with less than 30 where overall results are more influenced by individual results. The red and green bars in the combined cohort column illustrate achievement gaps relative to the overall (average) rate. The longer the bar, the greater the gap.
All Coursework2010-11 Cohort 2011-12 Cohort 2012-13 Cohort 2013-14 Cohort 2014-15 Cohort 5 Cohorts Combined
Comparison to Overall
9 of 26
KCCD Institutional Research and Reporting Elements of Student Success
Element C - Successful Course Completion Rate in First Year (Grade of 'C' or Better) Bakersfield College
Cohort Success Rate Cohort Success
Rate Cohort Success Rate Cohort Success
Rate Cohort Success Rate Cohort Success
Rate
Student Success Cohort 4,325 59.4% 3,617 62.6% 3,515 61.4% 4,069 61.0% 4,326 60.7% 19,852 60.9%
Results by Demographic Component (red and green bars illustrate achievement gaps relative to the overall (average) rate)
All Coursework2010-11 Cohort 2011-12 Cohort 2012-13 Cohort 2013-14 Cohort 2014-15 Cohort 5 Cohorts Combined
Comparison to Overall
Foster Youth in First TermFoster Youth 25 28.0% 25 40.6% 47 34.0% 100 39.5% 108 45.2% 305 40.0%Not a Foster Youth 4,300 59.5% 3,592 62.8% 3,468 61.8% 3,969 61.4% 4,218 61.1% 19,547 61.2%
Veteran in First TermVeteran 30 69.5% 11 73.1% 25 63.5% 28 61.8% 33 73.9% 127 67.8%Not a Veteran 4,295 59.3% 3,606 62.5% 3,490 61.4% 4,041 60.9% 4,293 60.6% 19,725 60.9%
MESA in First TermMESA 12 77.5% 30 79.8% 18 85.8% 20 76.5% 80 79.9%Not a MESA Student 3,605 62.5% 3,485 61.2% 4,051 60.8% 4,306 60.6% 19,772 60.8%
Athletes in First YearAthlete 172 78.9% 166 81.0% 138 77.4% 159 77.1% 188 76.1% 823 78.1%Not an Athlete 4,153 57.8% 3,451 60.9% 3,377 60.1% 3,910 59.6% 4,138 59.2% 19,029 59.4%
Percentage of Distance Ed Within Cohort Period100% Distance Ed 149 35.7% 124 27.9% 70 33.7% 109 30.5% 122 29.4% 574 31.3%66 - 99% Distance Ed 75 49.0% 68 49.2% 42 42.6% 63 51.4% 65 51.4% 313 49.1%33 - 65% Distance Ed 254 49.2% 201 55.9% 185 54.6% 245 53.7% 227 52.6% 1,112 53.0%1 - 32.9% Distance Ed 1,242 66.7% 989 70.6% 964 68.2% 964 70.9% 852 68.9% 5,011 68.9%100% Traditional 2,605 56.5% 2,235 59.7% 2,254 58.7% 2,688 57.5% 3,060 58.9% 12,842 58.2%
Educational Goal in First TermTransfer 2,414 61.9% 2,117 64.8% 2,008 63.3% 2,701 62.3% 2,919 62.5% 12,159 62.9%Associates Degree 53 53.6% 37 44.5% 33 54.5% 527 57.8% 690 54.5% 1,340 55.5%Vocational Degree or Certificate 143 56.0% 118 55.6% 87 57.4% 204 55.5% 239 50.5% 791 54.3%Other 807 53.0% 604 57.2% 614 58.2% 313 58.3% 184 54.8% 2,522 56.0%Undecided 902 58.1% 731 60.9% 753 58.7% 303 56.6% 213 59.7% 2,902 58.9%Unknown/Uncollected 6 63.3% 10 95.8% 20 96.8% 21 77.8% 81 97.7% 138 90.0%
Matriculation in First Term by ComponentAssessment 3,908 60.1% 3,311 63.4% 3,255 61.6% 3,698 61.5% 3,943 61.3% 18,115 61.5%
No Assessment 417 46.7% 306 45.3% 260 58.1% 371 51.3% 383 47.2% 1,737 49.3%Orientation 3,530 61.3% 3,174 64.3% 3,202 61.9% 3,718 61.4% 3,963 61.4% 17,587 62.0%
No Orientation 795 46.4% 443 42.2% 313 52.1% 351 53.4% 363 45.5% 2,265 47.2%Counseling 3,019 63.0% 2,851 65.8% 2,910 62.8% 3,324 62.7% 3,750 61.8% 15,854 63.1%
No Counseling 1,306 47.1% 766 43.9% 605 51.1% 745 48.7% 576 46.9% 3,998 47.3%Educational Plan 990 70.5% 1,162 74.9% 1,391 69.9% 1,719 68.2% 2,583 64.9% 7,845 68.9%
No Educational Plan 3,335 54.5% 2,455 53.5% 2,124 52.9% 2,350 53.3% 1,743 51.0% 12,007 53.4%Matriculation in First Term by Number of Components Completed
No Matric Components 278 48.9% 211 42.2% 171 64.8% 207 55.9% 238 46.2% 1,105 50.9%1 Matric Component 446 44.0% 235 39.8% 159 42.2% 214 42.6% 152 43.5% 1,206 42.7%2 Matric Components 741 47.4% 384 47.3% 316 48.8% 367 49.1% 250 47.0% 2,058 47.8%3 Matric Components 1,921 59.2% 1,653 57.3% 1,509 53.6% 1,613 55.5% 1,157 53.3% 7,853 56.3%4 Matric Components 939 71.1% 1,134 75.1% 1,360 70.2% 1,668 68.3% 2,529 65.0% 7,630 69.1%
First English Attempt1st Term 1,609 62.6% 1,184 65.4% 1,339 63.8% 1,641 63.6% 1,885 65.0% 7,658 64.0%2nd Term 641 65.6% 589 71.2% 404 70.3% 404 70.2% 528 66.7% 2,566 68.5%Course not taken in 1st year 2,075 52.4% 1,844 55.2% 1,772 55.2% 2,024 54.9% 1,913 50.5% 9,628 53.6%
First Math Attempt1st Term 1,497 63.6% 991 67.5% 1,120 67.2% 1,409 63.9% 1,443 64.8% 6,460 65.2%2nd Term 638 67.3% 632 72.4% 334 75.0% 477 73.1% 534 72.5% 2,615 71.6%Course not taken in 1st year 2,190 51.5% 1,994 53.9% 2,061 53.2% 2,183 54.1% 2,349 52.3% 10,777 53.0%
No data available
10 of 26
KCCD Institutional Research and Reporting Elements of Student Success
Elements of Student Success Element D1 - Bakersfield College
Element D1 - Remedial English Completion within Two Years Bakersfield College
Cohort Success Rate Cohort Success
Rate Cohort Success Rate Cohort Success
Rate Cohort Success Rate
Placed in Remedial English 2,685 18.0% 2,297 22.5% 2,212 23.1% 2,563 26.9% 9,757 22.5%
Results by Demographic Component (red and green bars illustrate achievement gaps relative to the overall (average) rate)
Placement*1 Level Below Transfer 848 34.8% 688 45.2% 629 47.5% 746 45.8% 2,911 42.8%2 Levels Below Transfer 330 25.8% 268 31.7% 350 29.1% 456 37.1% 1,404 31.4%3 Levels Below Transfer 1,321 7.6% 1,164 9.9% 1,065 10.0% 1,153 14.8% 4,703 10.5%4 Levels Below Transfer 186 2.2% 177 2.8% 168 1.2% 208 3.4% 739 2.4%
GenderFemale 1,399 21.9% 1,263 26.0% 1,174 27.0% 1,330 31.4% 5,166 26.5%Male 1,270 13.9% 1,027 18.2% 1,036 18.6% 1,233 22.0% 4,566 18.1%
Age19 or Younger 1,958 21.1% 1,720 26.0% 1,646 26.1% 1,917 30.3% 7,241 25.8%20-29 500 9.8% 438 12.3% 426 15.5% 496 18.1% 1,860 13.9%30 or Older 227 9.3% 139 10.8% 140 10.7% 150 12.0% 656 10.5%
Ethnicity African American 259 5.4% 205 7.3% 145 6.2% 143 12.6% 752 7.4%American Indian 20 10.0% 15 0.0% 7 0.0% 7 14.3% 49 6.1%Asian 42 21.4% 45 46.7% 33 39.4% 49 36.7% 169 36.1%Filipino 46 28.3% 37 37.8% 30 13.3% 33 33.3% 146 28.8%Hispanic/ Latino 1,691 18.7% 1,510 22.8% 1,563 23.6% 1,898 28.2% 6,662 23.5%Pacific Islander 8 12.5% 5 20.0% 5 20.0% 4 50.0% 22 22.7%White 530 21.3% 396 26.8% 355 26.8% 332 27.1% 1,613 25.0%
Enrollment Status in First TermFull-time 1,088 24.1% 774 32.9% 820 33.7% 1,042 39.8% 3,724 32.4%Part-time 1,575 14.0% 1,490 17.3% 1,354 17.0% 1,502 18.2% 5,921 16.6%Withdrew/ Non-Credit 22 9.1% 33 9.1% 38 10.5% 19 5.3% 112 8.9%
Unit Load in First TermWithdrew/ Non-Credit 22 9.1% 33 9.1% 38 10.5% 19 5.3% 112 8.9%0.1-5.9 Units 501 8.6% 517 9.5% 414 9.4% 476 9.9% 1,908 9.3%6-8.9 Units 539 15.2% 479 18.2% 458 17.5% 546 20.1% 2,022 17.8%9-11.9 Units 535 17.8% 494 24.7% 482 23.0% 480 24.2% 1,991 22.3%12-14.9 Units 880 23.0% 649 31.3% 641 30.1% 803 35.4% 2,973 29.7%15 or More Units 208 28.8% 125 41.6% 179 46.4% 239 54.8% 751 43.4%
Financial Aid in First YearFinancial Aid 2,010 16.4% 1,767 19.7% 1,718 21.5% 2,106 26.0% 7,601 21.0%No Financial Aid 675 23.0% 530 31.7% 494 28.3% 457 31.1% 2,156 28.1%
EOP&S in First TermEOPS 78 15.4% 49 26.5% 25 12.0% 122 42.6% 274 29.2%No EOPS 2,607 18.1% 2,248 22.4% 2,187 23.2% 2,441 26.1% 9,483 22.3%
DSPS in First TermDSPS 92 9.8% 68 11.8% 90 5.6% 92 16.3% 342 10.8%No DSPS 2,593 18.3% 2,229 22.8% 2,122 23.8% 2,471 27.3% 9,415 23.0%
Element D1 - Successful Remedial English Completion within Two Years (formerly ATD Element 1)
Comparison to Overall
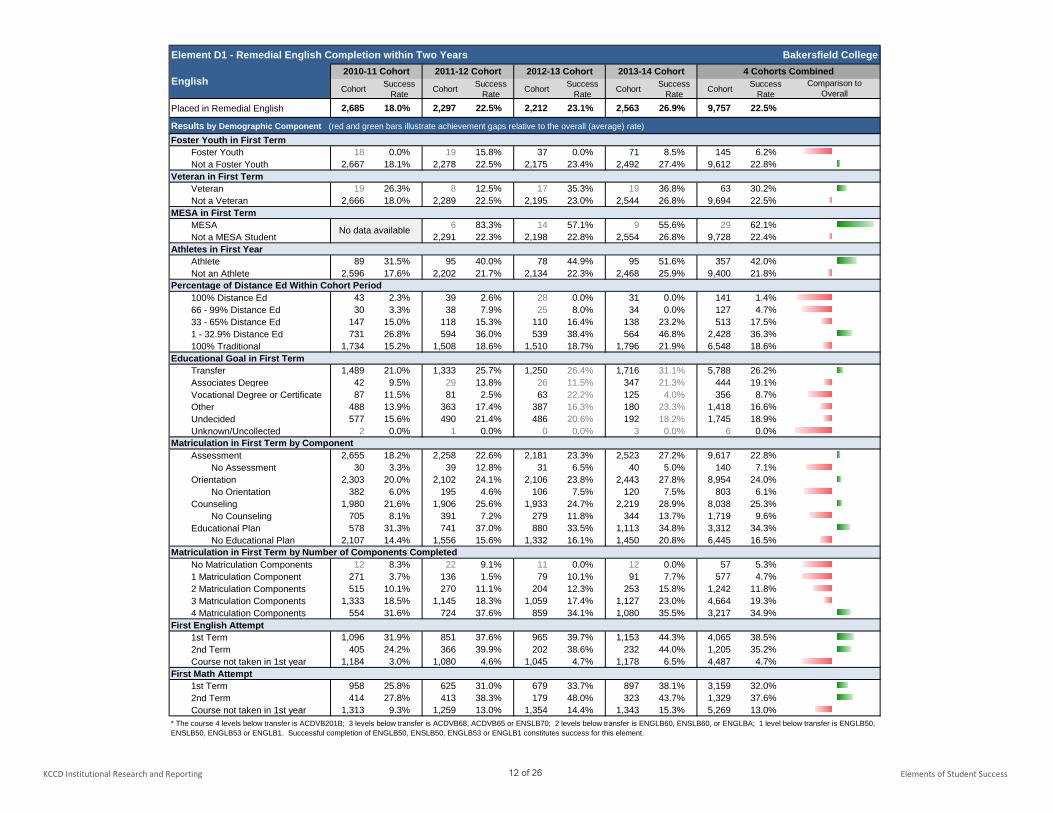
This element uses a sub-cohort of the Student Success cohort which includes students who place in remedial coursework. Students placing in any remedial level are tracked to determine the rate at which they successfully complete the last course in the developmental sequence. Successful completion (grade 'C' or better) can be attained by multiple attempts within the two-year time-period. This element was previously included in the ATD Student Success Elements report as Element 1. Results shown in grey print are from groups with less than 30 where overall results are more influenced by individual results. The red and green bars in the combined cohort column illustrate achievement gaps relative to the overall (average) rate. The longer the bar, the greater the gap.
English2010-11 Cohort 2011-12 Cohort 2012-13 Cohort 4 Cohorts Combined2013-14 Cohort
11 of 26
KCCD Institutional Research and Reporting Elements of Student Success
Element D1 - Remedial English Completion within Two Years Bakersfield College
Cohort Success Rate Cohort Success
Rate Cohort Success Rate Cohort Success
Rate Cohort Success Rate
Placed in Remedial English 2,685 18.0% 2,297 22.5% 2,212 23.1% 2,563 26.9% 9,757 22.5%
Results by Demographic Component (red and green bars illustrate achievement gaps relative to the overall (average) rate)
Comparison to Overall
English2010-11 Cohort 2011-12 Cohort 2012-13 Cohort 4 Cohorts Combined2013-14 Cohort
Foster Youth in First TermFoster Youth 18 0.0% 19 15.8% 37 0.0% 71 8.5% 145 6.2%Not a Foster Youth 2,667 18.1% 2,278 22.5% 2,175 23.4% 2,492 27.4% 9,612 22.8%
Veteran in First TermVeteran 19 26.3% 8 12.5% 17 35.3% 19 36.8% 63 30.2%Not a Veteran 2,666 18.0% 2,289 22.5% 2,195 23.0% 2,544 26.8% 9,694 22.5%
MESA in First TermMESA 6 83.3% 14 57.1% 9 55.6% 29 62.1%Not a MESA Student 2,291 22.3% 2,198 22.8% 2,554 26.8% 9,728 22.4%
Athletes in First YearAthlete 89 31.5% 95 40.0% 78 44.9% 95 51.6% 357 42.0%Not an Athlete 2,596 17.6% 2,202 21.7% 2,134 22.3% 2,468 25.9% 9,400 21.8%
Percentage of Distance Ed Within Cohort Period100% Distance Ed 43 2.3% 39 2.6% 28 0.0% 31 0.0% 141 1.4%66 - 99% Distance Ed 30 3.3% 38 7.9% 25 8.0% 34 0.0% 127 4.7%33 - 65% Distance Ed 147 15.0% 118 15.3% 110 16.4% 138 23.2% 513 17.5%1 - 32.9% Distance Ed 731 26.8% 594 36.0% 539 38.4% 564 46.8% 2,428 36.3%100% Traditional 1,734 15.2% 1,508 18.6% 1,510 18.7% 1,796 21.9% 6,548 18.6%
Educational Goal in First TermTransfer 1,489 21.0% 1,333 25.7% 1,250 26.4% 1,716 31.1% 5,788 26.2%Associates Degree 42 9.5% 29 13.8% 26 11.5% 347 21.3% 444 19.1%Vocational Degree or Certificate 87 11.5% 81 2.5% 63 22.2% 125 4.0% 356 8.7%Other 488 13.9% 363 17.4% 387 16.3% 180 23.3% 1,418 16.6%Undecided 577 15.6% 490 21.4% 486 20.6% 192 18.2% 1,745 18.9%Unknown/Uncollected 2 0.0% 1 0.0% 0 0.0% 3 0.0% 6 0.0%
Matriculation in First Term by ComponentAssessment 2,655 18.2% 2,258 22.6% 2,181 23.3% 2,523 27.2% 9,617 22.8%
No Assessment 30 3.3% 39 12.8% 31 6.5% 40 5.0% 140 7.1%Orientation 2,303 20.0% 2,102 24.1% 2,106 23.8% 2,443 27.8% 8,954 24.0%
No Orientation 382 6.0% 195 4.6% 106 7.5% 120 7.5% 803 6.1%Counseling 1,980 21.6% 1,906 25.6% 1,933 24.7% 2,219 28.9% 8,038 25.3%
No Counseling 705 8.1% 391 7.2% 279 11.8% 344 13.7% 1,719 9.6%Educational Plan 578 31.3% 741 37.0% 880 33.5% 1,113 34.8% 3,312 34.3%
No Educational Plan 2,107 14.4% 1,556 15.6% 1,332 16.1% 1,450 20.8% 6,445 16.5%Matriculation in First Term by Number of Components Completed
No Matriculation Components 12 8.3% 22 9.1% 11 0.0% 12 0.0% 57 5.3%1 Matriculation Component 271 3.7% 136 1.5% 79 10.1% 91 7.7% 577 4.7%2 Matriculation Components 515 10.1% 270 11.1% 204 12.3% 253 15.8% 1,242 11.8%3 Matriculation Components 1,333 18.5% 1,145 18.3% 1,059 17.4% 1,127 23.0% 4,664 19.3%4 Matriculation Components 554 31.6% 724 37.6% 859 34.1% 1,080 35.5% 3,217 34.9%
First English Attempt1st Term 1,096 31.9% 851 37.6% 965 39.7% 1,153 44.3% 4,065 38.5%2nd Term 405 24.2% 366 39.9% 202 38.6% 232 44.0% 1,205 35.2%Course not taken in 1st year 1,184 3.0% 1,080 4.6% 1,045 4.7% 1,178 6.5% 4,487 4.7%
First Math Attempt1st Term 958 25.8% 625 31.0% 679 33.7% 897 38.1% 3,159 32.0%2nd Term 414 27.8% 413 38.3% 179 48.0% 323 43.7% 1,329 37.6%Course not taken in 1st year 1,313 9.3% 1,259 13.0% 1,354 14.4% 1,343 15.3% 5,269 13.0%
* The course 4 levels below transfer is ACDVB201B; 3 levels below transfer is ACDVB68, ACDVB65 or ENSLB70; 2 levels below transfer is ENGLB60, ENSLB60, or ENGLBA; 1 level below transfer is ENGLB50, ENSLB50, ENGLB53 or ENGLB1. Successful completion of ENGLB50, ENSLB50, ENGLB53 or ENGLB1 constitutes success for this element.
No data available
12 of 26
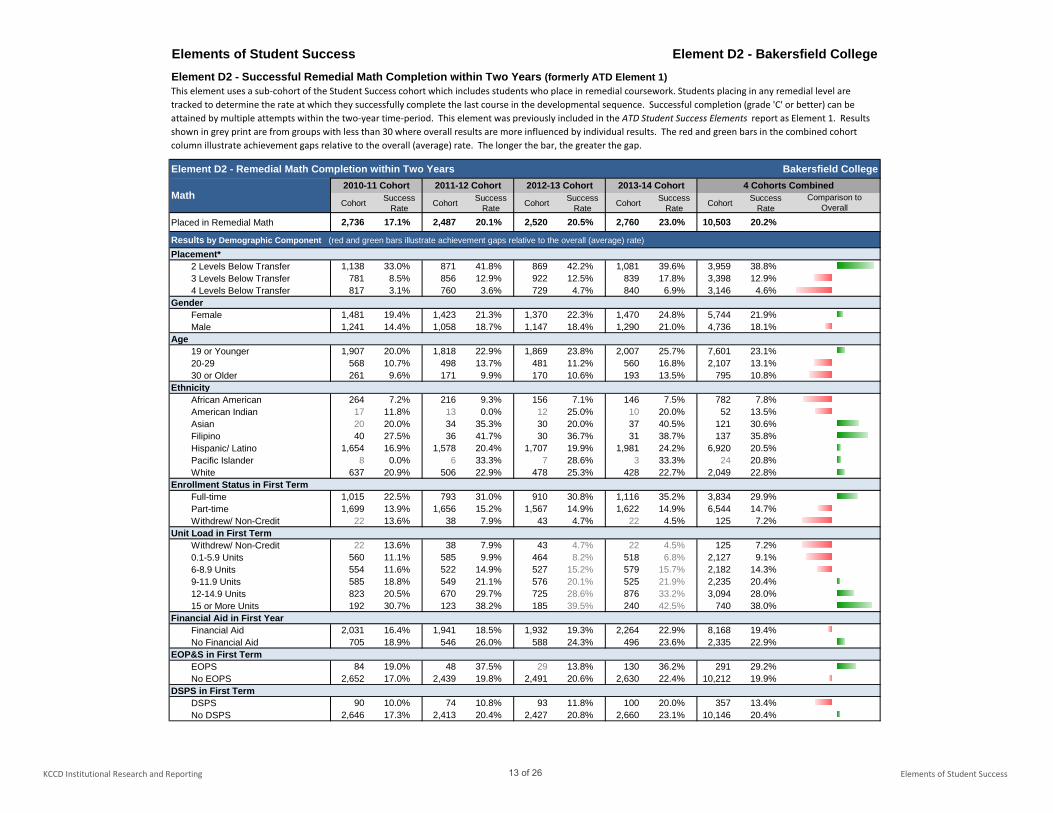
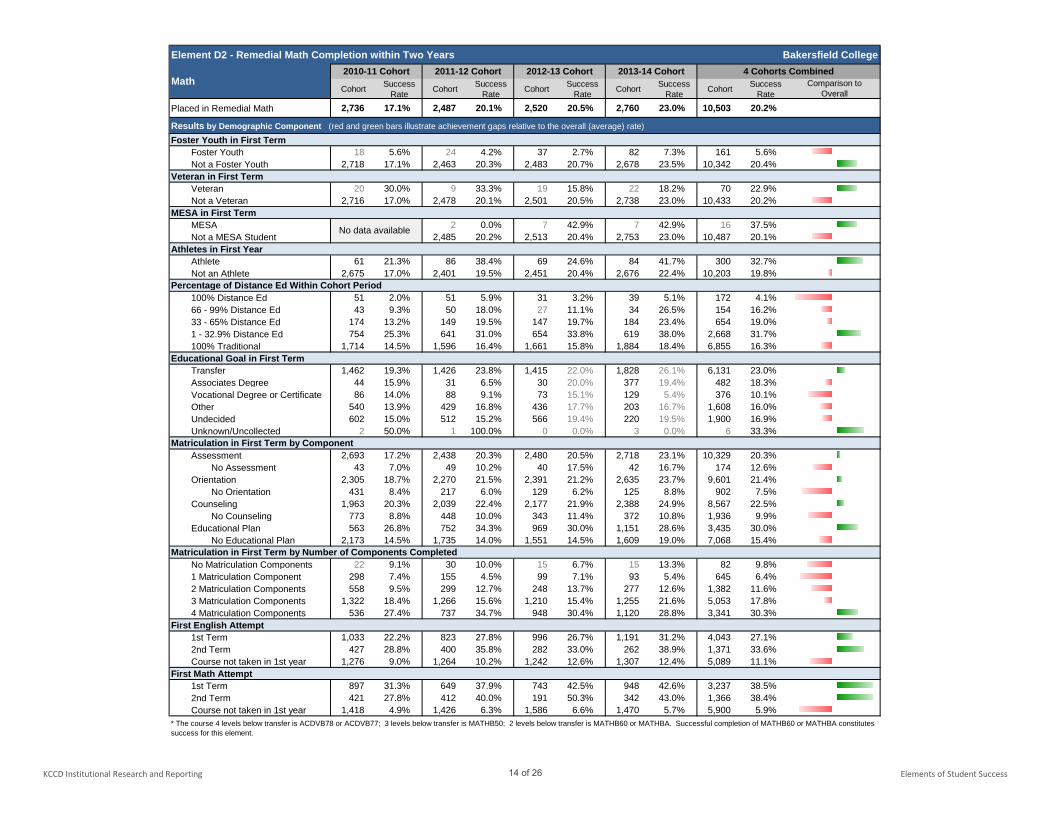
KCCD Institutional Research and Reporting Elements of Student Success
Elements of Student Success Element D2 - Bakersfield College
Element D2 - Remedial Math Completion within Two Years Bakersfield College
Cohort Success Rate Cohort Success
Rate Cohort Success Rate Cohort Success
Rate Cohort Success Rate
Placed in Remedial Math 2,736 17.1% 2,487 20.1% 2,520 20.5% 2,760 23.0% 10,503 20.2%
Results by Demographic Component (red and green bars illustrate achievement gaps relative to the overall (average) rate)
Placement*2 Levels Below Transfer 1,138 33.0% 871 41.8% 869 42.2% 1,081 39.6% 3,959 38.8%3 Levels Below Transfer 781 8.5% 856 12.9% 922 12.5% 839 17.8% 3,398 12.9%4 Levels Below Transfer 817 3.1% 760 3.6% 729 4.7% 840 6.9% 3,146 4.6%
GenderFemale 1,481 19.4% 1,423 21.3% 1,370 22.3% 1,470 24.8% 5,744 21.9%Male 1,241 14.4% 1,058 18.7% 1,147 18.4% 1,290 21.0% 4,736 18.1%
Age19 or Younger 1,907 20.0% 1,818 22.9% 1,869 23.8% 2,007 25.7% 7,601 23.1%20-29 568 10.7% 498 13.7% 481 11.2% 560 16.8% 2,107 13.1%30 or Older 261 9.6% 171 9.9% 170 10.6% 193 13.5% 795 10.8%
Ethnicity African American 264 7.2% 216 9.3% 156 7.1% 146 7.5% 782 7.8%American Indian 17 11.8% 13 0.0% 12 25.0% 10 20.0% 52 13.5%Asian 20 20.0% 34 35.3% 30 20.0% 37 40.5% 121 30.6%Filipino 40 27.5% 36 41.7% 30 36.7% 31 38.7% 137 35.8%Hispanic/ Latino 1,654 16.9% 1,578 20.4% 1,707 19.9% 1,981 24.2% 6,920 20.5%Pacific Islander 8 0.0% 6 33.3% 7 28.6% 3 33.3% 24 20.8%White 637 20.9% 506 22.9% 478 25.3% 428 22.7% 2,049 22.8%
Enrollment Status in First TermFull-time 1,015 22.5% 793 31.0% 910 30.8% 1,116 35.2% 3,834 29.9%Part-time 1,699 13.9% 1,656 15.2% 1,567 14.9% 1,622 14.9% 6,544 14.7%Withdrew/ Non-Credit 22 13.6% 38 7.9% 43 4.7% 22 4.5% 125 7.2%
Unit Load in First TermWithdrew/ Non-Credit 22 13.6% 38 7.9% 43 4.7% 22 4.5% 125 7.2%0.1-5.9 Units 560 11.1% 585 9.9% 464 8.2% 518 6.8% 2,127 9.1%6-8.9 Units 554 11.6% 522 14.9% 527 15.2% 579 15.7% 2,182 14.3%9-11.9 Units 585 18.8% 549 21.1% 576 20.1% 525 21.9% 2,235 20.4%12-14.9 Units 823 20.5% 670 29.7% 725 28.6% 876 33.2% 3,094 28.0%15 or More Units 192 30.7% 123 38.2% 185 39.5% 240 42.5% 740 38.0%
Financial Aid in First YearFinancial Aid 2,031 16.4% 1,941 18.5% 1,932 19.3% 2,264 22.9% 8,168 19.4%No Financial Aid 705 18.9% 546 26.0% 588 24.3% 496 23.6% 2,335 22.9%
EOP&S in First TermEOPS 84 19.0% 48 37.5% 29 13.8% 130 36.2% 291 29.2%No EOPS 2,652 17.0% 2,439 19.8% 2,491 20.6% 2,630 22.4% 10,212 19.9%
DSPS in First TermDSPS 90 10.0% 74 10.8% 93 11.8% 100 20.0% 357 13.4%No DSPS 2,646 17.3% 2,413 20.4% 2,427 20.8% 2,660 23.1% 10,146 20.4%
Element D2 - Successful Remedial Math Completion within Two Years (formerly ATD Element 1)This element uses a sub-cohort of the Student Success cohort which includes students who place in remedial coursework. Students placing in any remedial level are tracked to determine the rate at which they successfully complete the last course in the developmental sequence. Successful completion (grade 'C' or better) can be attained by multiple attempts within the two-year time-period. This element was previously included in the ATD Student Success Elements report as Element 1. Results shown in grey print are from groups with less than 30 where overall results are more influenced by individual results. The red and green bars in the combined cohort column illustrate achievement gaps relative to the overall (average) rate. The longer the bar, the greater the gap.
Math2010-11 Cohort 2011-12 Cohort 2012-13 Cohort 2013-14 Cohort 4 Cohorts Combined
Comparison to Overall
13 of 26
KCCD Institutional Research and Reporting Elements of Student Success
Element D2 - Remedial Math Completion within Two Years Bakersfield College
Cohort Success Rate Cohort Success
Rate Cohort Success Rate Cohort Success
Rate Cohort Success Rate
Placed in Remedial Math 2,736 17.1% 2,487 20.1% 2,520 20.5% 2,760 23.0% 10,503 20.2%
Results by Demographic Component (red and green bars illustrate achievement gaps relative to the overall (average) rate)
Math2010-11 Cohort 2011-12 Cohort 2012-13 Cohort 2013-14 Cohort 4 Cohorts Combined
Comparison to Overall
Foster Youth in First TermFoster Youth 18 5.6% 24 4.2% 37 2.7% 82 7.3% 161 5.6%Not a Foster Youth 2,718 17.1% 2,463 20.3% 2,483 20.7% 2,678 23.5% 10,342 20.4%
Veteran in First TermVeteran 20 30.0% 9 33.3% 19 15.8% 22 18.2% 70 22.9%Not a Veteran 2,716 17.0% 2,478 20.1% 2,501 20.5% 2,738 23.0% 10,433 20.2%
MESA in First TermMESA 2 0.0% 7 42.9% 7 42.9% 16 37.5%Not a MESA Student 2,485 20.2% 2,513 20.4% 2,753 23.0% 10,487 20.1%
Athletes in First YearAthlete 61 21.3% 86 38.4% 69 24.6% 84 41.7% 300 32.7%Not an Athlete 2,675 17.0% 2,401 19.5% 2,451 20.4% 2,676 22.4% 10,203 19.8%
Percentage of Distance Ed Within Cohort Period100% Distance Ed 51 2.0% 51 5.9% 31 3.2% 39 5.1% 172 4.1%66 - 99% Distance Ed 43 9.3% 50 18.0% 27 11.1% 34 26.5% 154 16.2%33 - 65% Distance Ed 174 13.2% 149 19.5% 147 19.7% 184 23.4% 654 19.0%1 - 32.9% Distance Ed 754 25.3% 641 31.0% 654 33.8% 619 38.0% 2,668 31.7%100% Traditional 1,714 14.5% 1,596 16.4% 1,661 15.8% 1,884 18.4% 6,855 16.3%
Educational Goal in First TermTransfer 1,462 19.3% 1,426 23.8% 1,415 22.0% 1,828 26.1% 6,131 23.0%Associates Degree 44 15.9% 31 6.5% 30 20.0% 377 19.4% 482 18.3%Vocational Degree or Certificate 86 14.0% 88 9.1% 73 15.1% 129 5.4% 376 10.1%Other 540 13.9% 429 16.8% 436 17.7% 203 16.7% 1,608 16.0%Undecided 602 15.0% 512 15.2% 566 19.4% 220 19.5% 1,900 16.9%Unknown/Uncollected 2 50.0% 1 100.0% 0 0.0% 3 0.0% 6 33.3%
Matriculation in First Term by ComponentAssessment 2,693 17.2% 2,438 20.3% 2,480 20.5% 2,718 23.1% 10,329 20.3%
No Assessment 43 7.0% 49 10.2% 40 17.5% 42 16.7% 174 12.6%Orientation 2,305 18.7% 2,270 21.5% 2,391 21.2% 2,635 23.7% 9,601 21.4%
No Orientation 431 8.4% 217 6.0% 129 6.2% 125 8.8% 902 7.5%Counseling 1,963 20.3% 2,039 22.4% 2,177 21.9% 2,388 24.9% 8,567 22.5%
No Counseling 773 8.8% 448 10.0% 343 11.4% 372 10.8% 1,936 9.9%Educational Plan 563 26.8% 752 34.3% 969 30.0% 1,151 28.6% 3,435 30.0%
No Educational Plan 2,173 14.5% 1,735 14.0% 1,551 14.5% 1,609 19.0% 7,068 15.4%Matriculation in First Term by Number of Components Completed
No Matriculation Components 22 9.1% 30 10.0% 15 6.7% 15 13.3% 82 9.8%1 Matriculation Component 298 7.4% 155 4.5% 99 7.1% 93 5.4% 645 6.4%2 Matriculation Components 558 9.5% 299 12.7% 248 13.7% 277 12.6% 1,382 11.6%3 Matriculation Components 1,322 18.4% 1,266 15.6% 1,210 15.4% 1,255 21.6% 5,053 17.8%4 Matriculation Components 536 27.4% 737 34.7% 948 30.4% 1,120 28.8% 3,341 30.3%
First English Attempt1st Term 1,033 22.2% 823 27.8% 996 26.7% 1,191 31.2% 4,043 27.1%2nd Term 427 28.8% 400 35.8% 282 33.0% 262 38.9% 1,371 33.6%Course not taken in 1st year 1,276 9.0% 1,264 10.2% 1,242 12.6% 1,307 12.4% 5,089 11.1%
First Math Attempt1st Term 897 31.3% 649 37.9% 743 42.5% 948 42.6% 3,237 38.5%2nd Term 421 27.8% 412 40.0% 191 50.3% 342 43.0% 1,366 38.4%Course not taken in 1st year 1,418 4.9% 1,426 6.3% 1,586 6.6% 1,470 5.7% 5,900 5.9%
* The course 4 levels below transfer is ACDVB78 or ACDVB77; 3 levels below transfer is MATHB50; 2 levels below transfer is MATHB60 or MATHBA. Successful completion of MATHB60 or MATHBA constitutes success for this element.
No data available
14 of 26
KCCD Institutional Research and Reporting Elements of Student Success
Elements of Student Success Element E1 - Bakersfield College
Element E1 - Completion of College-level English in First Year
Element E1 - Completion of College-level English in First Year Bakersfield College
Cohort Success Rate Cohort Success
Rate Cohort Success Rate Cohort Success
Rate Cohort Success Rate Cohort Success
Rate
Student Success Cohort 4,325 13.1% 3,617 12.5% 3,515 14.5% 4,069 16.1% 4,326 17.7% 19,852 14.9%
Results by Demographic Component (red and green bars illustrate achievement gaps relative to the overall (average) rate)
Placement - EnglishPlaced into Remedial 2,685 4.1% 2,297 4.4% 2,212 6.6% 2,563 8.0% 2,688 8.4% 12,445 6.3%Placed into College-level 1,249 36.2% 1,037 33.6% 1,074 33.1% 1,155 38.1% 1,249 42.5% 5,764 36.9%
Placement - MathPlaced into Remedial 2,736 7.6% 2,487 6.9% 2,520 9.0% 2,760 11.4% 2,763 12.2% 13,266 9.5%Placed into College-level 1,226 29.1% 870 31.6% 775 35.6% 980 33.9% 1,184 35.8% 5,035 33.0%
GenderFemale 2,230 14.3% 1,970 12.3% 1,830 16.0% 2,071 18.8% 2,268 19.7% 10,369 16.3%Male 2,070 11.8% 1,639 12.7% 1,668 12.9% 1,998 13.3% 1,983 16.2% 9,358 13.4%
Age19 or Younger 3,072 16.3% 2,648 14.7% 2,576 17.1% 2,874 18.3% 3,038 21.2% 14,208 17.6%20-29 850 6.6% 687 6.8% 685 7.7% 904 11.7% 958 11.0% 4,084 9.0%30 or Older 403 3.0% 282 5.0% 254 5.5% 291 8.2% 330 5.2% 1,560 5.2%
Ethnicity African American 364 3.3% 281 3.6% 200 4.5% 225 7.1% 214 4.7% 1,284 4.4%American Indian 27 7.4% 18 0.0% 17 11.8% 11 18.2% 18 16.7% 91 9.9%Asian 75 32.0% 81 37.0% 62 37.1% 81 25.9% 78 32.1% 377 32.6%Filipino 72 22.2% 70 22.9% 50 18.0% 54 18.5% 60 21.7% 306 20.9%Hispanic/ Latino 2,465 10.9% 2,161 10.7% 2,227 12.5% 2,784 15.8% 2,943 16.8% 12,580 13.6%Pacific Islander 14 14.3% 6 0.0% 9 11.1% 4 0.0% 5 20.0% 38 10.5%White 1,149 19.7% 858 17.2% 775 21.2% 732 20.1% 781 25.5% 4,295 20.6%
Enrollment Status in First TermFull-time 1,774 20.2% 1,264 20.9% 1,374 23.7% 1,718 24.4% 1,944 28.9% 8,074 23.9%Part-time 2,515 8.2% 2,305 8.0% 2,091 8.7% 2,324 10.1% 2,356 8.7% 11,591 8.7%Withdrew/ Non-Credit 36 11.1% 48 4.2% 50 0.0% 27 3.7% 26 0.0% 187 3.7%
Unit Load in First TermWithdrew/ Non-Credit 36 11.1% 48 4.2% 50 0.0% 27 3.7% 26 0.0% 187 3.7%0.1-5.9 Units 850 5.9% 798 4.8% 665 3.8% 775 5.3% 802 3.7% 3,890 4.7%6-8.9 Units 816 7.8% 743 7.7% 709 8.6% 798 10.3% 782 8.6% 3,848 8.6%9-11.9 Units 849 10.7% 764 11.8% 717 13.4% 751 14.9% 772 14.0% 3,853 12.9%12-14.9 Units 1,356 16.2% 1,014 17.9% 1,037 21.8% 1,305 21.7% 1,496 26.5% 6,208 21.0%15 or More Units 418 33.5% 250 33.2% 337 29.7% 413 32.9% 448 37.1% 1,866 33.5%
Financial Aid in First YearFinancial Aid 2,926 10.6% 2,557 10.2% 2,472 12.5% 3,120 15.9% 3,431 17.4% 14,506 13.6%No Financial Aid 1,399 18.5% 1,060 17.8% 1,043 19.2% 949 16.6% 895 19.0% 5,346 18.3%
EOP&S in First TermEOPS 94 9.6% 64 15.6% 39 15.4% 153 22.2% 196 27.0% 546 20.5%No EOPS 4,231 13.2% 3,553 12.4% 3,476 14.4% 3,916 15.9% 4,130 17.3% 19,306 14.7%
DSPS in First TermDSPS 108 9.3% 85 9.4% 99 5.1% 108 4.6% 116 6.9% 516 7.0%No DSPS 4,217 13.2% 3,532 12.5% 3,416 14.7% 3,961 16.4% 4,210 18.0% 19,336 15.1%
Students in the Student Success cohort are tracked through their first year (summer, fall, spring) to determine whether they complete any college-level English course. Completion for this measure is defined by grades of A, B, C, D, and P. This element is from the American Association of Community Colleges (AACC) Pathways project. Results shown in grey print are from groups with less than 30 where overall results are more influenced by individual results. The red and green bars in the combined cohort column illustrate achievement gaps relative to the overall (average) rate. The longer the bar, the greater the gap.
English2010-11 Cohort 2011-12 Cohort 2012-13 Cohort 2013-14 Cohort 2014-15 Cohort 5 Cohorts Combined
Comparison to Overall
15 of 26
KCCD Institutional Research and Reporting Elements of Student Success
Element E1 - Completion of College-level English in First Year Bakersfield College
Cohort Success Rate Cohort Success
Rate Cohort Success Rate Cohort Success
Rate Cohort Success Rate Cohort Success
Rate
Student Success Cohort 4,325 13.1% 3,617 12.5% 3,515 14.5% 4,069 16.1% 4,326 17.7% 19,852 14.9%
Results by Demographic Component (red and green bars illustrate achievement gaps relative to the overall (average) rate)
English2010-11 Cohort 2011-12 Cohort 2012-13 Cohort 2013-14 Cohort 2014-15 Cohort 5 Cohorts Combined
Comparison to Overall
Foster Youth in First TermFoster Youth 25 8.0% 25 0.0% 47 0.0% 100 2.0% 108 6.5% 305 3.6%Not a Foster Youth 4,300 13.2% 3,592 12.6% 3,468 14.6% 3,969 16.5% 4,218 18.0% 19,547 15.0%
Veteran in First TermVeteran 30 10.0% 11 18.2% 25 12.0% 28 14.3% 33 15.2% 127 13.4%Not a Veteran 4,295 13.2% 3,606 12.5% 3,490 14.5% 4,041 16.1% 4,293 17.7% 19,725 14.9%
MESA in First TermMESA 12 58.3% 30 30.0% 18 38.9% 20 70.0% 80 46.3%Not a MESA Student 3,605 12.3% 3,485 14.3% 4,051 16.0% 4,306 17.5% 19,772 14.7%
Athletes in First YearAthlete 172 30.2% 166 25.9% 138 31.2% 159 30.2% 188 33.5% 823 30.3%Not an Athlete 4,153 12.4% 3,451 11.8% 3,377 13.8% 3,910 15.5% 4,138 17.0% 19,029 14.2%
Percentage of Distance Ed Within Cohort Period100% Distance Ed 149 0.7% 124 0.8% 70 0.0% 109 0.9% 122 3.3% 574 1.2%66 - 99% Distance Ed 75 10.7% 68 8.8% 42 2.4% 63 11.1% 65 9.2% 313 8.9%33 - 65% Distance Ed 254 10.2% 201 11.9% 185 10.3% 245 13.1% 227 15.0% 1,112 12.1%1 - 32.9% Distance Ed 1,242 21.4% 989 20.0% 964 24.5% 964 27.7% 852 28.8% 5,011 24.2%100% Traditional 2,605 10.2% 2,235 9.9% 2,254 11.2% 2,688 12.9% 3,060 15.6% 12,842 12.2%
Educational Goal in First TermTransfer 2,414 15.8% 2,117 14.9% 2,008 17.2% 2,701 19.1% 2,919 22.0% 12,159 18.1%Associates Degree 53 1.9% 37 2.7% 33 3.0% 527 10.4% 690 10.9% 1,340 9.9%Vocational Degree or Certificate 143 4.2% 118 5.9% 87 6.9% 204 2.0% 239 4.2% 791 4.2%Other 807 8.9% 604 9.4% 614 9.9% 313 13.1% 184 10.9% 2,522 10.0%Undecided 902 12.0% 731 9.7% 753 12.5% 303 12.5% 213 8.9% 2,902 11.4%Unknown/Uncollected 6 0.0% 10 0.0% 20 0.0% 21 4.8% 81 0.0% 138 0.7%
Matriculation in First Term by ComponentAssessment 3,908 14.4% 3,311 13.5% 3,255 15.5% 3,698 17.4% 3,943 19.4% 18,115 16.1%
No Assessment 417 1.2% 306 1.0% 260 1.5% 371 3.2% 383 0.5% 1,737 1.5%Orientation 3,530 15.2% 3,174 13.9% 3,202 15.6% 3,718 17.5% 3,963 19.1% 17,587 16.4%
No Orientation 795 3.9% 443 2.3% 313 3.2% 351 1.7% 363 2.8% 2,265 3.0%Counseling 3,019 16.9% 2,851 14.9% 2,910 16.6% 3,324 18.8% 3,750 19.9% 15,854 17.6%
No Counseling 1,306 4.5% 766 3.3% 605 4.0% 745 4.0% 576 3.6% 3,998 4.0%Educational Plan 990 24.5% 1,162 21.0% 1,391 21.9% 1,719 23.0% 2,583 23.0% 7,845 22.7%
No Educational Plan 3,335 9.7% 2,455 8.4% 2,124 9.6% 2,350 11.0% 1,743 9.9% 12,007 9.7%Matriculation in First Term by Number of Components Completed
No Matric Components 278 0.4% 211 0.5% 171 0.6% 207 1.0% 238 0.0% 1,105 0.5%1 Matric Component 446 4.0% 235 3.4% 159 3.8% 214 3.3% 152 4.6% 1,206 3.8%2 Matric Components 741 6.7% 384 4.9% 316 7.0% 367 6.5% 250 6.4% 2,058 6.4%3 Matric Components 1,921 13.6% 1,653 10.8% 1,509 11.7% 1,613 14.3% 1,157 13.1% 7,853 12.7%4 Matric Components 939 25.2% 1,134 21.5% 1,360 22.3% 1,668 23.5% 2,529 23.4% 7,630 23.2%
First English Attempt1st Term 1,649 26.2% 1,208 26.7% 1,362 28.0% 1,681 31.5% 1,898 34.0% 7,798 29.6%2nd Term 641 21.2% 589 21.7% 404 31.4% 404 30.9% 528 22.9% 2,566 24.8%Course not taken in 1st year 2,035 0.0% 1,820 0.0% 1,749 0.0% 1,984 0.0% 1,900 0.0% 9,488 0.0%
First Math Attempt1st Term 1,497 19.4% 991 20.1% 1,120 22.9% 1,409 23.5% 1,443 25.9% 6,460 22.5%2nd Term 638 20.7% 632 18.0% 334 29.9% 477 25.8% 534 28.8% 2,615 23.8%Course not taken in 1st year 2,190 6.6% 1,994 6.9% 2,061 7.3% 2,183 9.2% 2,349 10.2% 10,777 8.1%
No data available
16 of 26

KCCD Institutional Research and Reporting Elements of Student Success
Elements of Student Success Element E2 - Bakersfield College
Element E2 - Completion of College-level Math in First Year
Element E2 - Completion of College-level Math in First Year Bakersfield College
Cohort Success Rate Cohort Success
Rate Cohort Success Rate Cohort Success
Rate Cohort Success Rate Cohort Success
Rate
Student Success Cohort 4,325 14.2% 3,617 13.3% 3,515 13.3% 4,069 12.7% 4,326 11.8% 19,852 13.1%
Results by Demographic Component (red and green bars illustrate achievement gaps relative to the overall (average) rate)
Placement - EnglishPlaced into Remedial 2,685 9.3% 2,297 9.8% 2,212 8.7% 2,563 8.7% 2,688 8.1% 12,445 8.9%Placed into College-level 1,249 28.6% 1,037 24.4% 1,074 25.4% 1,155 24.1% 1,249 23.1% 5,764 25.1%
Placement - MathPlaced into Remedial 2,736 4.4% 2,487 5.3% 2,520 4.8% 2,760 5.1% 2,763 4.0% 13,266 4.7%Placed into College-level 1,226 40.3% 870 40.0% 775 44.4% 980 37.4% 1,184 33.5% 5,035 38.7%
GenderFemale 2,230 15.0% 1,970 12.9% 1,830 14.0% 2,071 13.3% 2,268 12.3% 10,369 13.5%Male 2,070 13.6% 1,639 13.8% 1,668 12.7% 1,998 12.1% 1,983 11.7% 9,358 12.7%
Age19 or Younger 3,072 17.9% 2,648 15.8% 2,576 15.8% 2,874 14.5% 3,038 14.5% 14,208 15.7%20-29 850 6.5% 687 7.7% 685 8.0% 904 9.7% 958 6.5% 4,084 7.7%30 or Older 403 2.5% 282 3.5% 254 2.8% 291 3.8% 330 2.4% 1,560 2.9%
Ethnicity African American 364 3.8% 281 3.6% 200 5.5% 225 5.3% 214 2.3% 1,284 4.0%American Indian 27 3.7% 18 11.1% 17 0.0% 11 9.1% 18 0.0% 91 4.4%Asian 75 49.3% 81 33.3% 62 27.4% 81 32.1% 78 28.2% 377 34.2%Filipino 72 31.9% 70 27.1% 50 22.0% 54 18.5% 60 28.3% 306 26.1%Hispanic/ Latino 2,465 13.5% 2,161 12.5% 2,227 12.0% 2,784 12.1% 2,943 11.7% 12,580 12.3%Pacific Islander 14 21.4% 6 0.0% 9 0.0% 4 0.0% 5 0.0% 38 7.9%White 1,149 15.9% 858 16.2% 775 18.5% 732 16.0% 781 13.8% 4,295 16.1%
Enrollment Status in First TermFull-time 1,774 23.3% 1,264 25.5% 1,374 23.8% 1,718 20.3% 1,944 20.0% 8,074 22.3%Part-time 2,515 8.0% 2,305 6.8% 2,091 6.7% 2,324 7.3% 2,356 5.1% 11,591 6.8%Withdrew/ Non-Credit 36 5.6% 48 4.2% 50 4.0% 27 0.0% 26 7.7% 187 4.3%
Unit Load in First TermWithdrew/ Non-Credit 36 5.6% 48 4.2% 50 4.0% 27 0.0% 26 7.7% 187 4.3%0.1-5.9 Units 850 4.9% 798 3.9% 665 3.6% 775 4.8% 802 1.6% 3,890 3.8%6-8.9 Units 816 7.1% 743 5.8% 709 6.5% 798 5.5% 782 4.9% 3,848 6.0%9-11.9 Units 849 11.9% 764 10.9% 717 9.8% 751 11.7% 772 8.9% 3,853 10.7%12-14.9 Units 1,356 19.0% 1,014 22.7% 1,037 20.4% 1,305 17.0% 1,496 18.0% 6,208 19.2%15 or More Units 418 37.1% 250 36.8% 337 34.1% 413 30.5% 448 26.6% 1,866 32.5%
Financial Aid in First YearFinancial Aid 2,926 11.8% 2,557 11.1% 2,472 11.4% 3,120 11.9% 3,431 11.7% 14,506 11.6%No Financial Aid 1,399 19.3% 1,060 18.5% 1,043 18.0% 949 15.4% 895 12.3% 5,346 17.0%
EOP&S in First TermEOPS 94 7.4% 64 21.9% 39 15.4% 153 11.8% 196 24.5% 546 17.0%No EOPS 4,231 14.4% 3,553 13.1% 3,476 13.3% 3,916 12.7% 4,130 11.2% 19,306 13.0%
DSPS in First TermDSPS 108 7.4% 85 10.6% 99 5.1% 108 5.6% 116 5.2% 516 6.6%No DSPS 4,217 14.4% 3,532 13.4% 3,416 13.6% 3,961 12.9% 4,210 12.0% 19,336 13.2%
Comparison to Overall
Students in the Student Success cohort are tracked through their first year (summer, fall, spring) to determine whether they complete any college-level Math course. Completion for this measure is defined by grades of A, B, C, D, and P. This element is from the American Association of Community Colleges (AACC) Pathways project. Results shown in grey print are from groups with less than 30 where overall results are more influenced by individual results. The red and green bars in the combined cohort column illustrate achievement gaps relative to the overall (average) rate. The longer the bar, the greater the gap.
Math2010-11 Cohort 2011-12 Cohort 2012-13 Cohort 2013-14 Cohort 2014-15 Cohort 5 Cohorts Combined
17 of 26
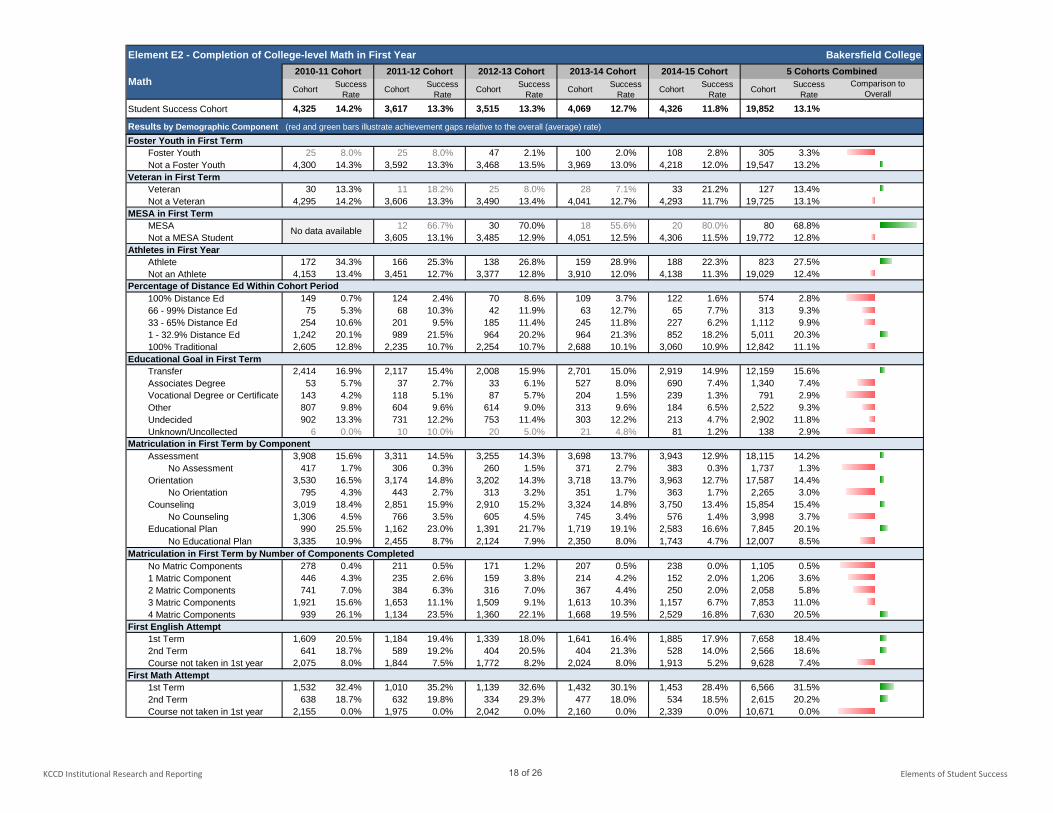
KCCD Institutional Research and Reporting Elements of Student Success
Element E2 - Completion of College-level Math in First Year Bakersfield College
Cohort Success Rate Cohort Success
Rate Cohort Success Rate Cohort Success
Rate Cohort Success Rate Cohort Success
Rate
Student Success Cohort 4,325 14.2% 3,617 13.3% 3,515 13.3% 4,069 12.7% 4,326 11.8% 19,852 13.1%
Results by Demographic Component (red and green bars illustrate achievement gaps relative to the overall (average) rate)
Comparison to Overall
Math2010-11 Cohort 2011-12 Cohort 2012-13 Cohort 2013-14 Cohort 2014-15 Cohort 5 Cohorts Combined
Foster Youth in First TermFoster Youth 25 8.0% 25 8.0% 47 2.1% 100 2.0% 108 2.8% 305 3.3%Not a Foster Youth 4,300 14.3% 3,592 13.3% 3,468 13.5% 3,969 13.0% 4,218 12.0% 19,547 13.2%
Veteran in First TermVeteran 30 13.3% 11 18.2% 25 8.0% 28 7.1% 33 21.2% 127 13.4%Not a Veteran 4,295 14.2% 3,606 13.3% 3,490 13.4% 4,041 12.7% 4,293 11.7% 19,725 13.1%
MESA in First TermMESA 12 66.7% 30 70.0% 18 55.6% 20 80.0% 80 68.8%Not a MESA Student 3,605 13.1% 3,485 12.9% 4,051 12.5% 4,306 11.5% 19,772 12.8%
Athletes in First YearAthlete 172 34.3% 166 25.3% 138 26.8% 159 28.9% 188 22.3% 823 27.5%Not an Athlete 4,153 13.4% 3,451 12.7% 3,377 12.8% 3,910 12.0% 4,138 11.3% 19,029 12.4%
Percentage of Distance Ed Within Cohort Period100% Distance Ed 149 0.7% 124 2.4% 70 8.6% 109 3.7% 122 1.6% 574 2.8%66 - 99% Distance Ed 75 5.3% 68 10.3% 42 11.9% 63 12.7% 65 7.7% 313 9.3%33 - 65% Distance Ed 254 10.6% 201 9.5% 185 11.4% 245 11.8% 227 6.2% 1,112 9.9%1 - 32.9% Distance Ed 1,242 20.1% 989 21.5% 964 20.2% 964 21.3% 852 18.2% 5,011 20.3%100% Traditional 2,605 12.8% 2,235 10.7% 2,254 10.7% 2,688 10.1% 3,060 10.9% 12,842 11.1%
Educational Goal in First TermTransfer 2,414 16.9% 2,117 15.4% 2,008 15.9% 2,701 15.0% 2,919 14.9% 12,159 15.6%Associates Degree 53 5.7% 37 2.7% 33 6.1% 527 8.0% 690 7.4% 1,340 7.4%Vocational Degree or Certificate 143 4.2% 118 5.1% 87 5.7% 204 1.5% 239 1.3% 791 2.9%Other 807 9.8% 604 9.6% 614 9.0% 313 9.6% 184 6.5% 2,522 9.3%Undecided 902 13.3% 731 12.2% 753 11.4% 303 12.2% 213 4.7% 2,902 11.8%Unknown/Uncollected 6 0.0% 10 10.0% 20 5.0% 21 4.8% 81 1.2% 138 2.9%
Matriculation in First Term by ComponentAssessment 3,908 15.6% 3,311 14.5% 3,255 14.3% 3,698 13.7% 3,943 12.9% 18,115 14.2%
No Assessment 417 1.7% 306 0.3% 260 1.5% 371 2.7% 383 0.3% 1,737 1.3%Orientation 3,530 16.5% 3,174 14.8% 3,202 14.3% 3,718 13.7% 3,963 12.7% 17,587 14.4%
No Orientation 795 4.3% 443 2.7% 313 3.2% 351 1.7% 363 1.7% 2,265 3.0%Counseling 3,019 18.4% 2,851 15.9% 2,910 15.2% 3,324 14.8% 3,750 13.4% 15,854 15.4%
No Counseling 1,306 4.5% 766 3.5% 605 4.5% 745 3.4% 576 1.4% 3,998 3.7%Educational Plan 990 25.5% 1,162 23.0% 1,391 21.7% 1,719 19.1% 2,583 16.6% 7,845 20.1%
No Educational Plan 3,335 10.9% 2,455 8.7% 2,124 7.9% 2,350 8.0% 1,743 4.7% 12,007 8.5%Matriculation in First Term by Number of Components Completed
No Matric Components 278 0.4% 211 0.5% 171 1.2% 207 0.5% 238 0.0% 1,105 0.5%1 Matric Component 446 4.3% 235 2.6% 159 3.8% 214 4.2% 152 2.0% 1,206 3.6%2 Matric Components 741 7.0% 384 6.3% 316 7.0% 367 4.4% 250 2.0% 2,058 5.8%3 Matric Components 1,921 15.6% 1,653 11.1% 1,509 9.1% 1,613 10.3% 1,157 6.7% 7,853 11.0%4 Matric Components 939 26.1% 1,134 23.5% 1,360 22.1% 1,668 19.5% 2,529 16.8% 7,630 20.5%
First English Attempt1st Term 1,609 20.5% 1,184 19.4% 1,339 18.0% 1,641 16.4% 1,885 17.9% 7,658 18.4%2nd Term 641 18.7% 589 19.2% 404 20.5% 404 21.3% 528 14.0% 2,566 18.6%Course not taken in 1st year 2,075 8.0% 1,844 7.5% 1,772 8.2% 2,024 8.0% 1,913 5.2% 9,628 7.4%
First Math Attempt1st Term 1,532 32.4% 1,010 35.2% 1,139 32.6% 1,432 30.1% 1,453 28.4% 6,566 31.5%2nd Term 638 18.7% 632 19.8% 334 29.3% 477 18.0% 534 18.5% 2,615 20.2%Course not taken in 1st year 2,155 0.0% 1,975 0.0% 2,042 0.0% 2,160 0.0% 2,339 0.0% 10,671 0.0%
No data available
18 of 26
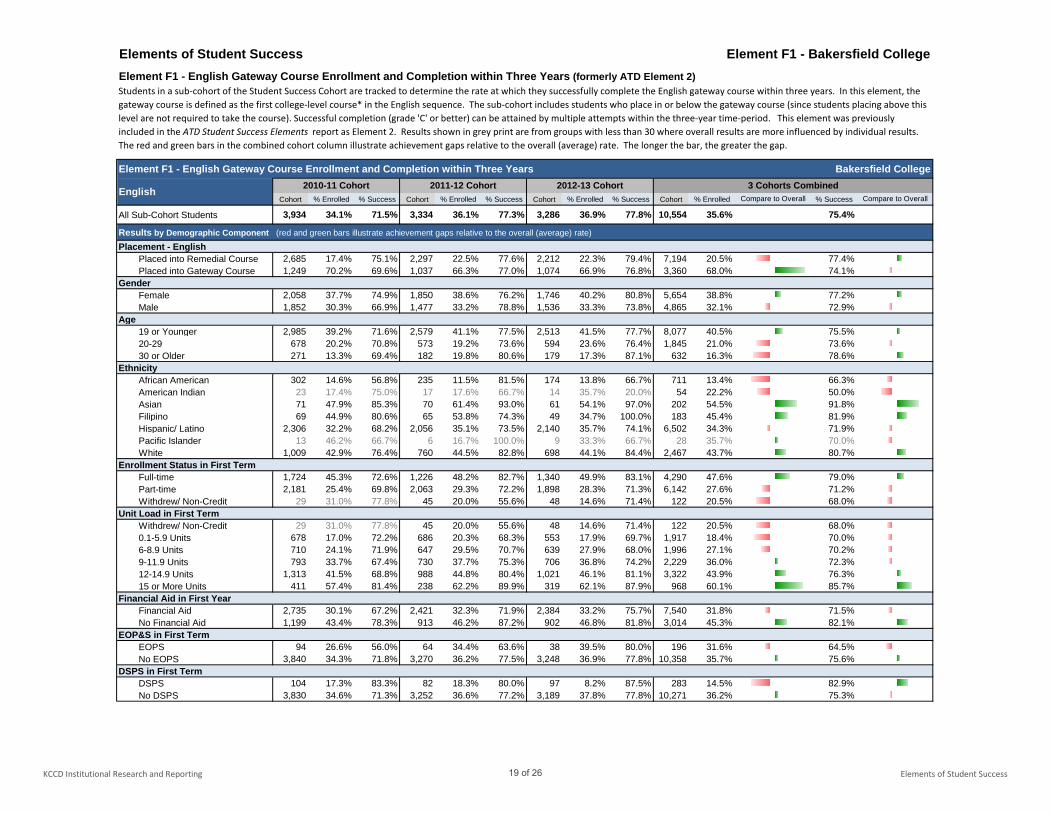
KCCD Institutional Research and Reporting Elements of Student Success
Elements of Student Success Element F1 - Bakersfield CollegeElement F1 - English Gateway Course Enrollment and Completion within Three Years (formerly ATD Element 2)
Element F1 - English Gateway Course Enrollment and Completion within Three Years Bakersfield College
Cohort % Enrolled % Success Cohort % Enrolled % Success Cohort % Enrolled % Success Cohort % Enrolled % Success
All Sub-Cohort Students 3,934 34.1% 71.5% 3,334 36.1% 77.3% 3,286 36.9% 77.8% 10,554 35.6% 75.4%
Results by Demographic Component (red and green bars illustrate achievement gaps relative to the overall (average) rate)
Placement - EnglishPlaced into Remedial Course 2,685 17.4% 75.1% 2,297 22.5% 77.6% 2,212 22.3% 79.4% 7,194 20.5% 77.4%Placed into Gateway Course 1,249 70.2% 69.6% 1,037 66.3% 77.0% 1,074 66.9% 76.8% 3,360 68.0% 74.1%
GenderFemale 2,058 37.7% 74.9% 1,850 38.6% 76.2% 1,746 40.2% 80.8% 5,654 38.8% 77.2%Male 1,852 30.3% 66.9% 1,477 33.2% 78.8% 1,536 33.3% 73.8% 4,865 32.1% 72.9%
Age19 or Younger 2,985 39.2% 71.6% 2,579 41.1% 77.5% 2,513 41.5% 77.7% 8,077 40.5% 75.5%20-29 678 20.2% 70.8% 573 19.2% 73.6% 594 23.6% 76.4% 1,845 21.0% 73.6%30 or Older 271 13.3% 69.4% 182 19.8% 80.6% 179 17.3% 87.1% 632 16.3% 78.6%
Ethnicity African American 302 14.6% 56.8% 235 11.5% 81.5% 174 13.8% 66.7% 711 13.4% 66.3%American Indian 23 17.4% 75.0% 17 17.6% 66.7% 14 35.7% 20.0% 54 22.2% 50.0%Asian 71 47.9% 85.3% 70 61.4% 93.0% 61 54.1% 97.0% 202 54.5% 91.8%Filipino 69 44.9% 80.6% 65 53.8% 74.3% 49 34.7% 100.0% 183 45.4% 81.9%Hispanic/ Latino 2,306 32.2% 68.2% 2,056 35.1% 73.5% 2,140 35.7% 74.1% 6,502 34.3% 71.9%Pacific Islander 13 46.2% 66.7% 6 16.7% 100.0% 9 33.3% 66.7% 28 35.7% 70.0%White 1,009 42.9% 76.4% 760 44.5% 82.8% 698 44.1% 84.4% 2,467 43.7% 80.7%
Enrollment Status in First TermFull-time 1,724 45.3% 72.6% 1,226 48.2% 82.7% 1,340 49.9% 83.1% 4,290 47.6% 79.0%Part-time 2,181 25.4% 69.8% 2,063 29.3% 72.2% 1,898 28.3% 71.3% 6,142 27.6% 71.2%Withdrew/ Non-Credit 29 31.0% 77.8% 45 20.0% 55.6% 48 14.6% 71.4% 122 20.5% 68.0%
Unit Load in First TermWithdrew/ Non-Credit 29 31.0% 77.8% 45 20.0% 55.6% 48 14.6% 71.4% 122 20.5% 68.0%0.1-5.9 Units 678 17.0% 72.2% 686 20.3% 68.3% 553 17.9% 69.7% 1,917 18.4% 70.0%6-8.9 Units 710 24.1% 71.9% 647 29.5% 70.7% 639 27.9% 68.0% 1,996 27.1% 70.2%9-11.9 Units 793 33.7% 67.4% 730 37.7% 75.3% 706 36.8% 74.2% 2,229 36.0% 72.3%12-14.9 Units 1,313 41.5% 68.8% 988 44.8% 80.4% 1,021 46.1% 81.1% 3,322 43.9% 76.3%15 or More Units 411 57.4% 81.4% 238 62.2% 89.9% 319 62.1% 87.9% 968 60.1% 85.7%
Financial Aid in First YearFinancial Aid 2,735 30.1% 67.2% 2,421 32.3% 71.9% 2,384 33.2% 75.7% 7,540 31.8% 71.5%No Financial Aid 1,199 43.4% 78.3% 913 46.2% 87.2% 902 46.8% 81.8% 3,014 45.3% 82.1%
EOP&S in First TermEOPS 94 26.6% 56.0% 64 34.4% 63.6% 38 39.5% 80.0% 196 31.6% 64.5%No EOPS 3,840 34.3% 71.8% 3,270 36.2% 77.5% 3,248 36.9% 77.8% 10,358 35.7% 75.6%
DSPS in First TermDSPS 104 17.3% 83.3% 82 18.3% 80.0% 97 8.2% 87.5% 283 14.5% 82.9%No DSPS 3,830 34.6% 71.3% 3,252 36.6% 77.2% 3,189 37.8% 77.8% 10,271 36.2% 75.3%
Compare to Overall Compare to Overall
Students in a sub-cohort of the Student Success Cohort are tracked to determine the rate at which they successfully complete the English gateway course within three years. In this element, the gateway course is defined as the first college-level course* in the English sequence. The sub-cohort includes students who place in or below the gateway course (since students placing above this level are not required to take the course). Successful completion (grade 'C' or better) can be attained by multiple attempts within the three-year time-period. This element was previously included in the ATD Student Success Elements report as Element 2. Results shown in grey print are from groups with less than 30 where overall results are more influenced by individual results. The red and green bars in the combined cohort column illustrate achievement gaps relative to the overall (average) rate. The longer the bar, the greater the gap.
English 2010-11 Cohort 2011-12 Cohort 2012-13 Cohort 3 Cohorts Combined
19 of 26
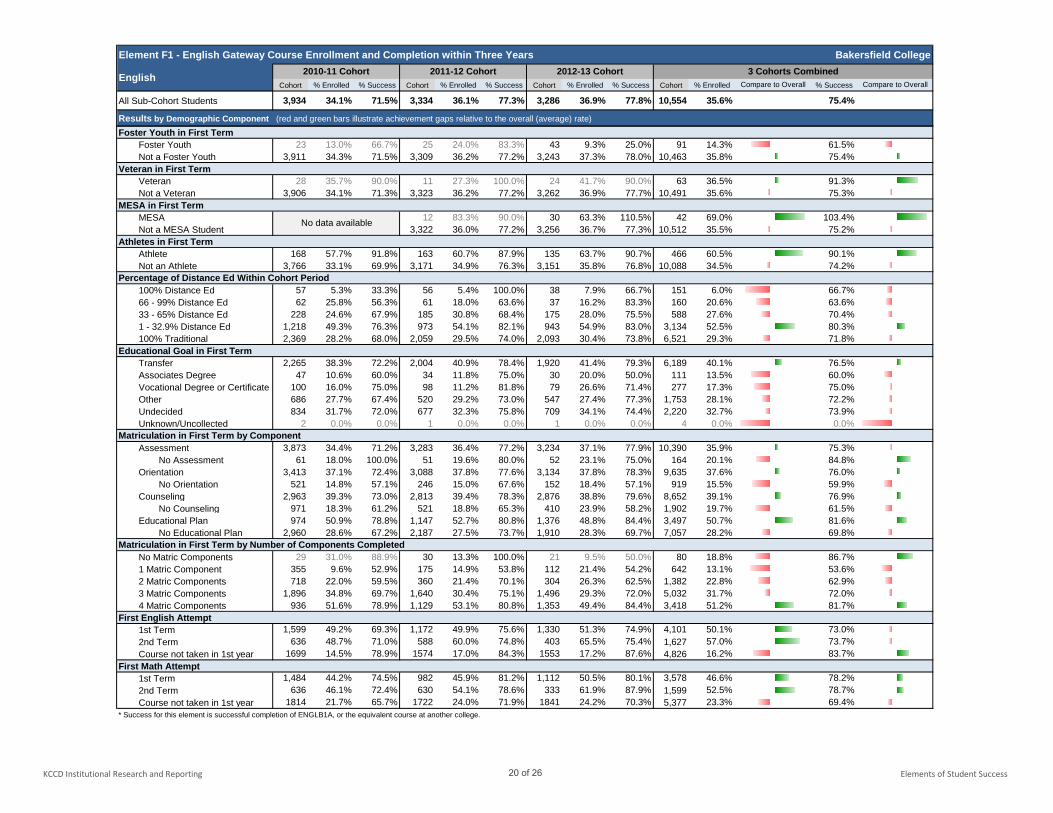
KCCD Institutional Research and Reporting Elements of Student Success
Element F1 - English Gateway Course Enrollment and Completion within Three Years Bakersfield College
Cohort % Enrolled % Success Cohort % Enrolled % Success Cohort % Enrolled % Success Cohort % Enrolled % Success
All Sub-Cohort Students 3,934 34.1% 71.5% 3,334 36.1% 77.3% 3,286 36.9% 77.8% 10,554 35.6% 75.4%
Results by Demographic Component (red and green bars illustrate achievement gaps relative to the overall (average) rate)
Compare to Overall Compare to OverallEnglish 2010-11 Cohort 2011-12 Cohort 2012-13 Cohort 3 Cohorts Combined
Foster Youth in First TermFoster Youth 23 13.0% 66.7% 25 24.0% 83.3% 43 9.3% 25.0% 91 14.3% 61.5%Not a Foster Youth 3,911 34.3% 71.5% 3,309 36.2% 77.2% 3,243 37.3% 78.0% 10,463 35.8% 75.4%
Veteran in First TermVeteran 28 35.7% 90.0% 11 27.3% 100.0% 24 41.7% 90.0% 63 36.5% 91.3%Not a Veteran 3,906 34.1% 71.3% 3,323 36.2% 77.2% 3,262 36.9% 77.7% 10,491 35.6% 75.3%
MESA in First TermMESA 12 83.3% 90.0% 30 63.3% 110.5% 42 69.0% 103.4%Not a MESA Student 3,322 36.0% 77.2% 3,256 36.7% 77.3% 10,512 35.5% 75.2%
Athletes in First TermAthlete 168 57.7% 91.8% 163 60.7% 87.9% 135 63.7% 90.7% 466 60.5% 90.1%Not an Athlete 3,766 33.1% 69.9% 3,171 34.9% 76.3% 3,151 35.8% 76.8% 10,088 34.5% 74.2%
Percentage of Distance Ed Within Cohort Period100% Distance Ed 57 5.3% 33.3% 56 5.4% 100.0% 38 7.9% 66.7% 151 6.0% 66.7%66 - 99% Distance Ed 62 25.8% 56.3% 61 18.0% 63.6% 37 16.2% 83.3% 160 20.6% 63.6%33 - 65% Distance Ed 228 24.6% 67.9% 185 30.8% 68.4% 175 28.0% 75.5% 588 27.6% 70.4%1 - 32.9% Distance Ed 1,218 49.3% 76.3% 973 54.1% 82.1% 943 54.9% 83.0% 3,134 52.5% 80.3%100% Traditional 2,369 28.2% 68.0% 2,059 29.5% 74.0% 2,093 30.4% 73.8% 6,521 29.3% 71.8%
Educational Goal in First TermTransfer 2,265 38.3% 72.2% 2,004 40.9% 78.4% 1,920 41.4% 79.3% 6,189 40.1% 76.5%Associates Degree 47 10.6% 60.0% 34 11.8% 75.0% 30 20.0% 50.0% 111 13.5% 60.0%Vocational Degree or Certificate 100 16.0% 75.0% 98 11.2% 81.8% 79 26.6% 71.4% 277 17.3% 75.0%Other 686 27.7% 67.4% 520 29.2% 73.0% 547 27.4% 77.3% 1,753 28.1% 72.2%Undecided 834 31.7% 72.0% 677 32.3% 75.8% 709 34.1% 74.4% 2,220 32.7% 73.9%Unknown/Uncollected 2 0.0% 0.0% 1 0.0% 0.0% 1 0.0% 0.0% 4 0.0% 0.0%
Matriculation in First Term by ComponentAssessment 3,873 34.4% 71.2% 3,283 36.4% 77.2% 3,234 37.1% 77.9% 10,390 35.9% 75.3%
No Assessment 61 18.0% 100.0% 51 19.6% 80.0% 52 23.1% 75.0% 164 20.1% 84.8%Orientation 3,413 37.1% 72.4% 3,088 37.8% 77.6% 3,134 37.8% 78.3% 9,635 37.6% 76.0%
No Orientation 521 14.8% 57.1% 246 15.0% 67.6% 152 18.4% 57.1% 919 15.5% 59.9%Counseling 2,963 39.3% 73.0% 2,813 39.4% 78.3% 2,876 38.8% 79.6% 8,652 39.1% 76.9%
No Counseling 971 18.3% 61.2% 521 18.8% 65.3% 410 23.9% 58.2% 1,902 19.7% 61.5%Educational Plan 974 50.9% 78.8% 1,147 52.7% 80.8% 1,376 48.8% 84.4% 3,497 50.7% 81.6%
No Educational Plan 2,960 28.6% 67.2% 2,187 27.5% 73.7% 1,910 28.3% 69.7% 7,057 28.2% 69.8%Matriculation in First Term by Number of Components Completed
No Matric Components 29 31.0% 88.9% 30 13.3% 100.0% 21 9.5% 50.0% 80 18.8% 86.7%1 Matric Component 355 9.6% 52.9% 175 14.9% 53.8% 112 21.4% 54.2% 642 13.1% 53.6%2 Matric Components 718 22.0% 59.5% 360 21.4% 70.1% 304 26.3% 62.5% 1,382 22.8% 62.9%3 Matric Components 1,896 34.8% 69.7% 1,640 30.4% 75.1% 1,496 29.3% 72.0% 5,032 31.7% 72.0%4 Matric Components 936 51.6% 78.9% 1,129 53.1% 80.8% 1,353 49.4% 84.4% 3,418 51.2% 81.7%
First English Attempt1st Term 1,599 49.2% 69.3% 1,172 49.9% 75.6% 1,330 51.3% 74.9% 4,101 50.1% 73.0%2nd Term 636 48.7% 71.0% 588 60.0% 74.8% 403 65.5% 75.4% 1,627 57.0% 73.7%Course not taken in 1st year 1699 14.5% 78.9% 1574 17.0% 84.3% 1553 17.2% 87.6% 4,826 16.2% 83.7%
First Math Attempt1st Term 1,484 44.2% 74.5% 982 45.9% 81.2% 1,112 50.5% 80.1% 3,578 46.6% 78.2%2nd Term 636 46.1% 72.4% 630 54.1% 78.6% 333 61.9% 87.9% 1,599 52.5% 78.7%Course not taken in 1st year 1814 21.7% 65.7% 1722 24.0% 71.9% 1841 24.2% 70.3% 5,377 23.3% 69.4%
* Success for this element is successful completion of ENGLB1A, or the equivalent course at another college.
No data available
20 of 26
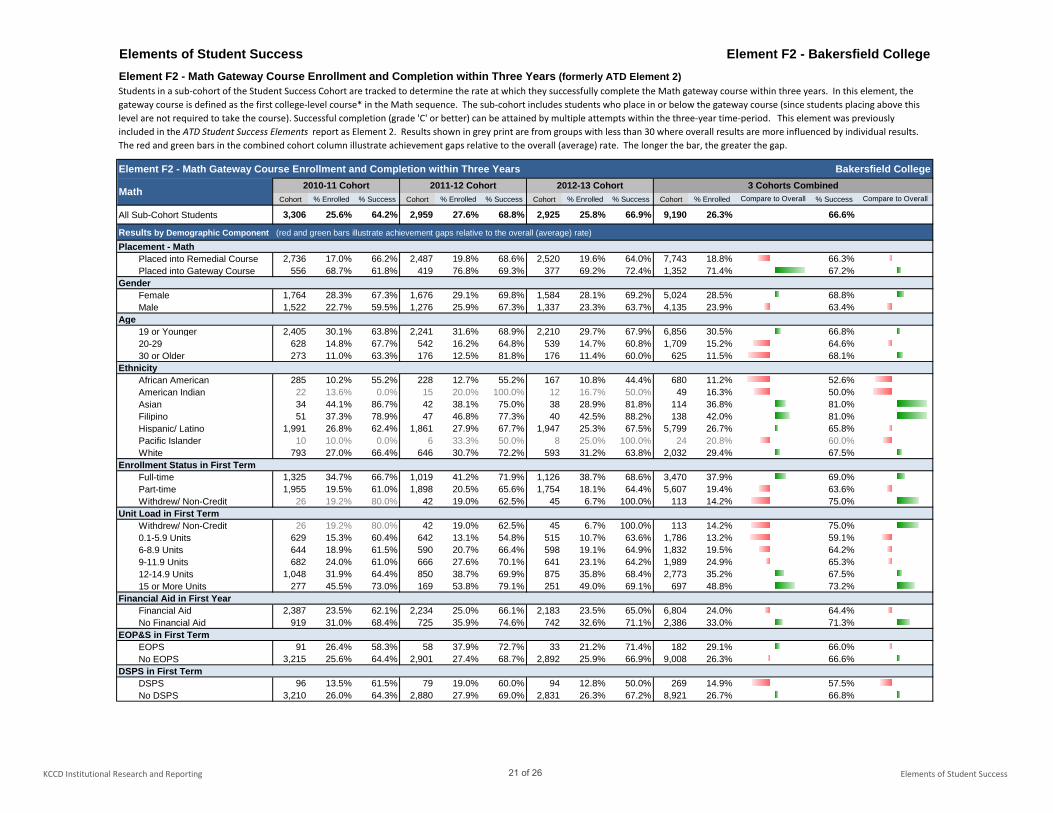
KCCD Institutional Research and Reporting Elements of Student Success
Elements of Student Success Element F2 - Bakersfield CollegeElement F2 - Math Gateway Course Enrollment and Completion within Three Years (formerly ATD Element 2)
Element F2 - Math Gateway Course Enrollment and Completion within Three Years Bakersfield College
Cohort % Enrolled % Success Cohort % Enrolled % Success Cohort % Enrolled % Success Cohort % Enrolled % Success
All Sub-Cohort Students 3,306 25.6% 64.2% 2,959 27.6% 68.8% 2,925 25.8% 66.9% 9,190 26.3% 66.6%
Results by Demographic Component (red and green bars illustrate achievement gaps relative to the overall (average) rate)
Placement - MathPlaced into Remedial Course 2,736 17.0% 66.2% 2,487 19.8% 68.6% 2,520 19.6% 64.0% 7,743 18.8% 66.3%Placed into Gateway Course 556 68.7% 61.8% 419 76.8% 69.3% 377 69.2% 72.4% 1,352 71.4% 67.2%
GenderFemale 1,764 28.3% 67.3% 1,676 29.1% 69.8% 1,584 28.1% 69.2% 5,024 28.5% 68.8%Male 1,522 22.7% 59.5% 1,276 25.9% 67.3% 1,337 23.3% 63.7% 4,135 23.9% 63.4%
Age19 or Younger 2,405 30.1% 63.8% 2,241 31.6% 68.9% 2,210 29.7% 67.9% 6,856 30.5% 66.8%20-29 628 14.8% 67.7% 542 16.2% 64.8% 539 14.7% 60.8% 1,709 15.2% 64.6%30 or Older 273 11.0% 63.3% 176 12.5% 81.8% 176 11.4% 60.0% 625 11.5% 68.1%
Ethnicity African American 285 10.2% 55.2% 228 12.7% 55.2% 167 10.8% 44.4% 680 11.2% 52.6%American Indian 22 13.6% 0.0% 15 20.0% 100.0% 12 16.7% 50.0% 49 16.3% 50.0%Asian 34 44.1% 86.7% 42 38.1% 75.0% 38 28.9% 81.8% 114 36.8% 81.0%Filipino 51 37.3% 78.9% 47 46.8% 77.3% 40 42.5% 88.2% 138 42.0% 81.0%Hispanic/ Latino 1,991 26.8% 62.4% 1,861 27.9% 67.7% 1,947 25.3% 67.5% 5,799 26.7% 65.8%Pacific Islander 10 10.0% 0.0% 6 33.3% 50.0% 8 25.0% 100.0% 24 20.8% 60.0%White 793 27.0% 66.4% 646 30.7% 72.2% 593 31.2% 63.8% 2,032 29.4% 67.5%
Enrollment Status in First TermFull-time 1,325 34.7% 66.7% 1,019 41.2% 71.9% 1,126 38.7% 68.6% 3,470 37.9% 69.0%Part-time 1,955 19.5% 61.0% 1,898 20.5% 65.6% 1,754 18.1% 64.4% 5,607 19.4% 63.6%Withdrew/ Non-Credit 26 19.2% 80.0% 42 19.0% 62.5% 45 6.7% 100.0% 113 14.2% 75.0%
Unit Load in First TermWithdrew/ Non-Credit 26 19.2% 80.0% 42 19.0% 62.5% 45 6.7% 100.0% 113 14.2% 75.0%0.1-5.9 Units 629 15.3% 60.4% 642 13.1% 54.8% 515 10.7% 63.6% 1,786 13.2% 59.1%6-8.9 Units 644 18.9% 61.5% 590 20.7% 66.4% 598 19.1% 64.9% 1,832 19.5% 64.2%9-11.9 Units 682 24.0% 61.0% 666 27.6% 70.1% 641 23.1% 64.2% 1,989 24.9% 65.3%12-14.9 Units 1,048 31.9% 64.4% 850 38.7% 69.9% 875 35.8% 68.4% 2,773 35.2% 67.5%15 or More Units 277 45.5% 73.0% 169 53.8% 79.1% 251 49.0% 69.1% 697 48.8% 73.2%
Financial Aid in First YearFinancial Aid 2,387 23.5% 62.1% 2,234 25.0% 66.1% 2,183 23.5% 65.0% 6,804 24.0% 64.4%No Financial Aid 919 31.0% 68.4% 725 35.9% 74.6% 742 32.6% 71.1% 2,386 33.0% 71.3%
EOP&S in First TermEOPS 91 26.4% 58.3% 58 37.9% 72.7% 33 21.2% 71.4% 182 29.1% 66.0%No EOPS 3,215 25.6% 64.4% 2,901 27.4% 68.7% 2,892 25.9% 66.9% 9,008 26.3% 66.6%
DSPS in First TermDSPS 96 13.5% 61.5% 79 19.0% 60.0% 94 12.8% 50.0% 269 14.9% 57.5%No DSPS 3,210 26.0% 64.3% 2,880 27.9% 69.0% 2,831 26.3% 67.2% 8,921 26.7% 66.8%
Compare to Overall Compare to Overall
Students in a sub-cohort of the Student Success Cohort are tracked to determine the rate at which they successfully complete the Math gateway course within three years. In this element, the gateway course is defined as the first college-level course* in the Math sequence. The sub-cohort includes students who place in or below the gateway course (since students placing above this level are not required to take the course). Successful completion (grade 'C' or better) can be attained by multiple attempts within the three-year time-period. This element was previously included in the ATD Student Success Elements report as Element 2. Results shown in grey print are from groups with less than 30 where overall results are more influenced by individual results. The red and green bars in the combined cohort column illustrate achievement gaps relative to the overall (average) rate. The longer the bar, the greater the gap.
Math 2010-11 Cohort 2011-12 Cohort 2012-13 Cohort 3 Cohorts Combined
21 of 26
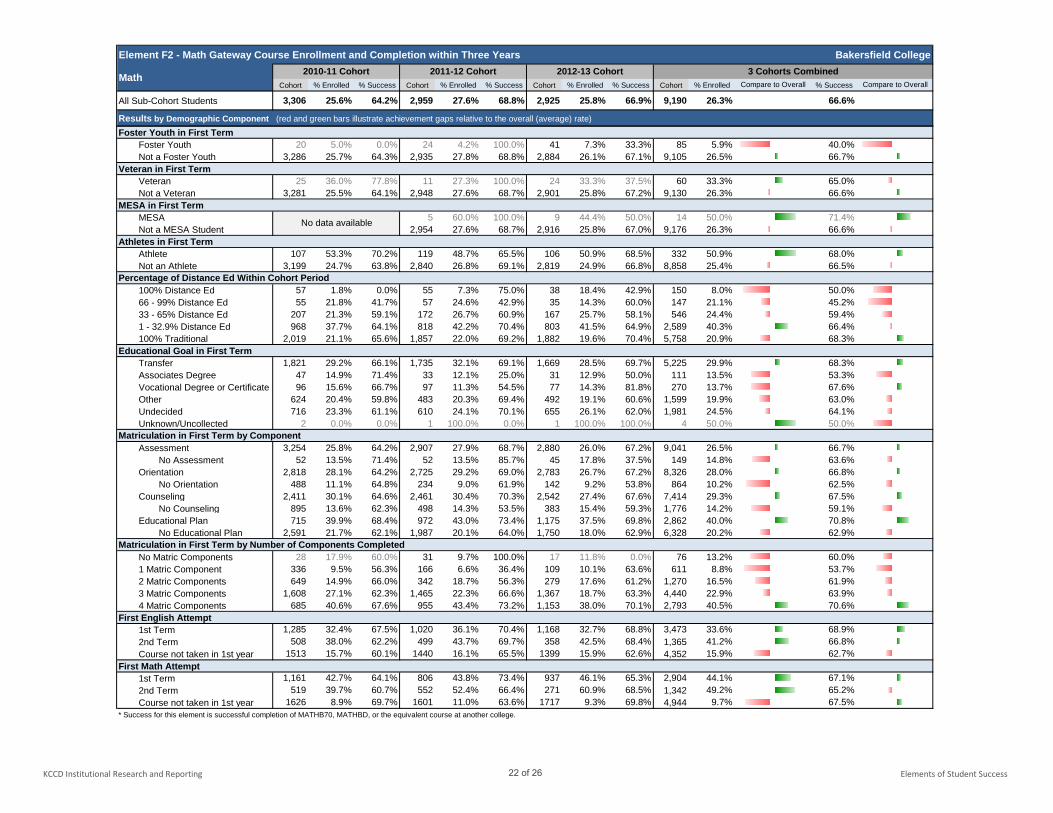
KCCD Institutional Research and Reporting Elements of Student Success
Element F2 - Math Gateway Course Enrollment and Completion within Three Years Bakersfield College
Cohort % Enrolled % Success Cohort % Enrolled % Success Cohort % Enrolled % Success Cohort % Enrolled % Success
All Sub-Cohort Students 3,306 25.6% 64.2% 2,959 27.6% 68.8% 2,925 25.8% 66.9% 9,190 26.3% 66.6%
Results by Demographic Component (red and green bars illustrate achievement gaps relative to the overall (average) rate)
Compare to Overall Compare to OverallMath 2010-11 Cohort 2011-12 Cohort 2012-13 Cohort 3 Cohorts Combined
Foster Youth in First TermFoster Youth 20 5.0% 0.0% 24 4.2% 100.0% 41 7.3% 33.3% 85 5.9% 40.0%Not a Foster Youth 3,286 25.7% 64.3% 2,935 27.8% 68.8% 2,884 26.1% 67.1% 9,105 26.5% 66.7%
Veteran in First TermVeteran 25 36.0% 77.8% 11 27.3% 100.0% 24 33.3% 37.5% 60 33.3% 65.0%Not a Veteran 3,281 25.5% 64.1% 2,948 27.6% 68.7% 2,901 25.8% 67.2% 9,130 26.3% 66.6%
MESA in First TermMESA 5 60.0% 100.0% 9 44.4% 50.0% 14 50.0% 71.4%Not a MESA Student 2,954 27.6% 68.7% 2,916 25.8% 67.0% 9,176 26.3% 66.6%
Athletes in First TermAthlete 107 53.3% 70.2% 119 48.7% 65.5% 106 50.9% 68.5% 332 50.9% 68.0%Not an Athlete 3,199 24.7% 63.8% 2,840 26.8% 69.1% 2,819 24.9% 66.8% 8,858 25.4% 66.5%
Percentage of Distance Ed Within Cohort Period100% Distance Ed 57 1.8% 0.0% 55 7.3% 75.0% 38 18.4% 42.9% 150 8.0% 50.0%66 - 99% Distance Ed 55 21.8% 41.7% 57 24.6% 42.9% 35 14.3% 60.0% 147 21.1% 45.2%33 - 65% Distance Ed 207 21.3% 59.1% 172 26.7% 60.9% 167 25.7% 58.1% 546 24.4% 59.4%1 - 32.9% Distance Ed 968 37.7% 64.1% 818 42.2% 70.4% 803 41.5% 64.9% 2,589 40.3% 66.4%100% Traditional 2,019 21.1% 65.6% 1,857 22.0% 69.2% 1,882 19.6% 70.4% 5,758 20.9% 68.3%
Educational Goal in First TermTransfer 1,821 29.2% 66.1% 1,735 32.1% 69.1% 1,669 28.5% 69.7% 5,225 29.9% 68.3%Associates Degree 47 14.9% 71.4% 33 12.1% 25.0% 31 12.9% 50.0% 111 13.5% 53.3%Vocational Degree or Certificate 96 15.6% 66.7% 97 11.3% 54.5% 77 14.3% 81.8% 270 13.7% 67.6%Other 624 20.4% 59.8% 483 20.3% 69.4% 492 19.1% 60.6% 1,599 19.9% 63.0%Undecided 716 23.3% 61.1% 610 24.1% 70.1% 655 26.1% 62.0% 1,981 24.5% 64.1%Unknown/Uncollected 2 0.0% 0.0% 1 100.0% 0.0% 1 100.0% 100.0% 4 50.0% 50.0%
Matriculation in First Term by ComponentAssessment 3,254 25.8% 64.2% 2,907 27.9% 68.7% 2,880 26.0% 67.2% 9,041 26.5% 66.7%
No Assessment 52 13.5% 71.4% 52 13.5% 85.7% 45 17.8% 37.5% 149 14.8% 63.6%Orientation 2,818 28.1% 64.2% 2,725 29.2% 69.0% 2,783 26.7% 67.2% 8,326 28.0% 66.8%
No Orientation 488 11.1% 64.8% 234 9.0% 61.9% 142 9.2% 53.8% 864 10.2% 62.5%Counseling 2,411 30.1% 64.6% 2,461 30.4% 70.3% 2,542 27.4% 67.6% 7,414 29.3% 67.5%
No Counseling 895 13.6% 62.3% 498 14.3% 53.5% 383 15.4% 59.3% 1,776 14.2% 59.1%Educational Plan 715 39.9% 68.4% 972 43.0% 73.4% 1,175 37.5% 69.8% 2,862 40.0% 70.8%
No Educational Plan 2,591 21.7% 62.1% 1,987 20.1% 64.0% 1,750 18.0% 62.9% 6,328 20.2% 62.9%Matriculation in First Term by Number of Components Completed
No Matric Components 28 17.9% 60.0% 31 9.7% 100.0% 17 11.8% 0.0% 76 13.2% 60.0%1 Matric Component 336 9.5% 56.3% 166 6.6% 36.4% 109 10.1% 63.6% 611 8.8% 53.7%2 Matric Components 649 14.9% 66.0% 342 18.7% 56.3% 279 17.6% 61.2% 1,270 16.5% 61.9%3 Matric Components 1,608 27.1% 62.3% 1,465 22.3% 66.6% 1,367 18.7% 63.3% 4,440 22.9% 63.9%4 Matric Components 685 40.6% 67.6% 955 43.4% 73.2% 1,153 38.0% 70.1% 2,793 40.5% 70.6%
First English Attempt1st Term 1,285 32.4% 67.5% 1,020 36.1% 70.4% 1,168 32.7% 68.8% 3,473 33.6% 68.9%2nd Term 508 38.0% 62.2% 499 43.7% 69.7% 358 42.5% 68.4% 1,365 41.2% 66.8%Course not taken in 1st year 1513 15.7% 60.1% 1440 16.1% 65.5% 1399 15.9% 62.6% 4,352 15.9% 62.7%
First Math Attempt1st Term 1,161 42.7% 64.1% 806 43.8% 73.4% 937 46.1% 65.3% 2,904 44.1% 67.1%2nd Term 519 39.7% 60.7% 552 52.4% 66.4% 271 60.9% 68.5% 1,342 49.2% 65.2%Course not taken in 1st year 1626 8.9% 69.7% 1601 11.0% 63.6% 1717 9.3% 69.8% 4,944 9.7% 67.5%
* Success for this element is successful completion of MATHB70, MATHBD, or the equivalent course at another college.
No data available
22 of 26
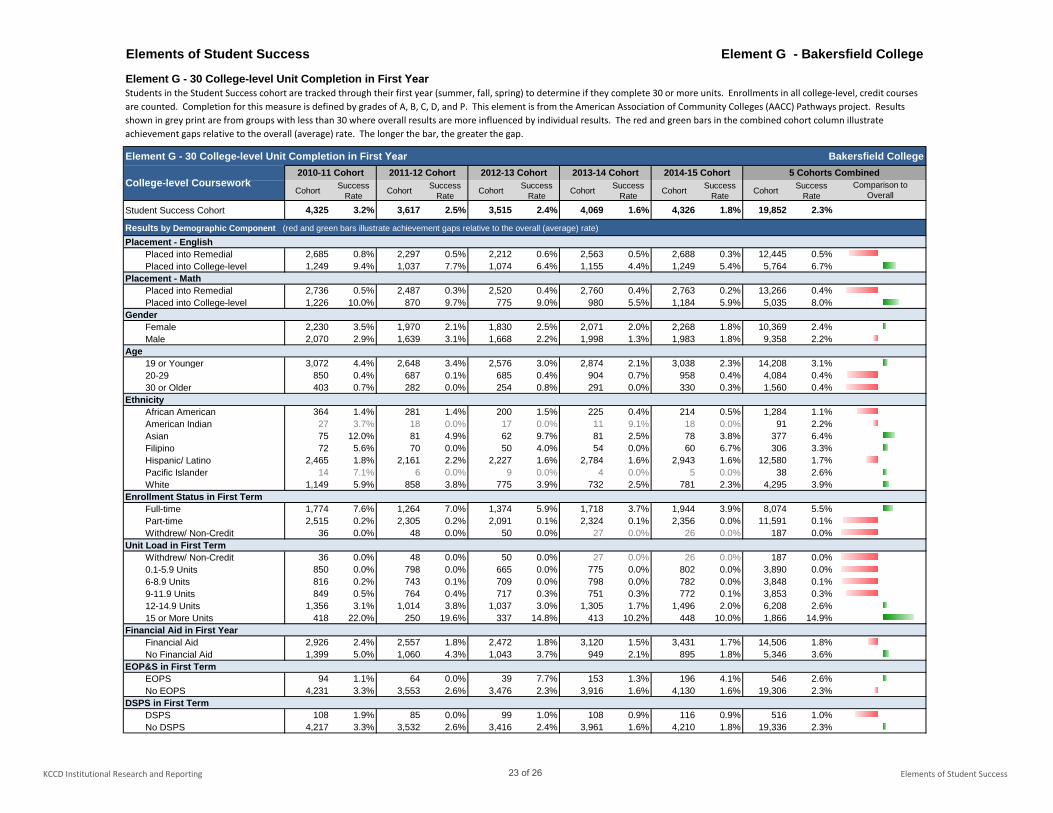
KCCD Institutional Research and Reporting Elements of Student Success
Elements of Student Success Element G - Bakersfield College
Element G - 30 College-level Unit Completion in First Year Bakersfield College
Cohort Success Rate Cohort Success
Rate Cohort Success Rate Cohort Success
Rate Cohort Success Rate Cohort Success
Rate
Student Success Cohort 4,325 3.2% 3,617 2.5% 3,515 2.4% 4,069 1.6% 4,326 1.8% 19,852 2.3%
Results by Demographic Component (red and green bars illustrate achievement gaps relative to the overall (average) rate)
Placement - EnglishPlaced into Remedial 2,685 0.8% 2,297 0.5% 2,212 0.6% 2,563 0.5% 2,688 0.3% 12,445 0.5%Placed into College-level 1,249 9.4% 1,037 7.7% 1,074 6.4% 1,155 4.4% 1,249 5.4% 5,764 6.7%
Placement - MathPlaced into Remedial 2,736 0.5% 2,487 0.3% 2,520 0.4% 2,760 0.4% 2,763 0.2% 13,266 0.4%Placed into College-level 1,226 10.0% 870 9.7% 775 9.0% 980 5.5% 1,184 5.9% 5,035 8.0%
GenderFemale 2,230 3.5% 1,970 2.1% 1,830 2.5% 2,071 2.0% 2,268 1.8% 10,369 2.4%Male 2,070 2.9% 1,639 3.1% 1,668 2.2% 1,998 1.3% 1,983 1.8% 9,358 2.2%
Age19 or Younger 3,072 4.4% 2,648 3.4% 2,576 3.0% 2,874 2.1% 3,038 2.3% 14,208 3.1%20-29 850 0.4% 687 0.1% 685 0.4% 904 0.7% 958 0.4% 4,084 0.4%30 or Older 403 0.7% 282 0.0% 254 0.8% 291 0.0% 330 0.3% 1,560 0.4%
Ethnicity African American 364 1.4% 281 1.4% 200 1.5% 225 0.4% 214 0.5% 1,284 1.1%American Indian 27 3.7% 18 0.0% 17 0.0% 11 9.1% 18 0.0% 91 2.2%Asian 75 12.0% 81 4.9% 62 9.7% 81 2.5% 78 3.8% 377 6.4%Filipino 72 5.6% 70 0.0% 50 4.0% 54 0.0% 60 6.7% 306 3.3%Hispanic/ Latino 2,465 1.8% 2,161 2.2% 2,227 1.6% 2,784 1.6% 2,943 1.6% 12,580 1.7%Pacific Islander 14 7.1% 6 0.0% 9 0.0% 4 0.0% 5 0.0% 38 2.6%White 1,149 5.9% 858 3.8% 775 3.9% 732 2.5% 781 2.3% 4,295 3.9%
Enrollment Status in First TermFull-time 1,774 7.6% 1,264 7.0% 1,374 5.9% 1,718 3.7% 1,944 3.9% 8,074 5.5%Part-time 2,515 0.2% 2,305 0.2% 2,091 0.1% 2,324 0.1% 2,356 0.0% 11,591 0.1%Withdrew/ Non-Credit 36 0.0% 48 0.0% 50 0.0% 27 0.0% 26 0.0% 187 0.0%
Unit Load in First TermWithdrew/ Non-Credit 36 0.0% 48 0.0% 50 0.0% 27 0.0% 26 0.0% 187 0.0%0.1-5.9 Units 850 0.0% 798 0.0% 665 0.0% 775 0.0% 802 0.0% 3,890 0.0%6-8.9 Units 816 0.2% 743 0.1% 709 0.0% 798 0.0% 782 0.0% 3,848 0.1%9-11.9 Units 849 0.5% 764 0.4% 717 0.3% 751 0.3% 772 0.1% 3,853 0.3%12-14.9 Units 1,356 3.1% 1,014 3.8% 1,037 3.0% 1,305 1.7% 1,496 2.0% 6,208 2.6%15 or More Units 418 22.0% 250 19.6% 337 14.8% 413 10.2% 448 10.0% 1,866 14.9%
Financial Aid in First YearFinancial Aid 2,926 2.4% 2,557 1.8% 2,472 1.8% 3,120 1.5% 3,431 1.7% 14,506 1.8%No Financial Aid 1,399 5.0% 1,060 4.3% 1,043 3.7% 949 2.1% 895 1.8% 5,346 3.6%
EOP&S in First TermEOPS 94 1.1% 64 0.0% 39 7.7% 153 1.3% 196 4.1% 546 2.6%No EOPS 4,231 3.3% 3,553 2.6% 3,476 2.3% 3,916 1.6% 4,130 1.6% 19,306 2.3%
DSPS in First TermDSPS 108 1.9% 85 0.0% 99 1.0% 108 0.9% 116 0.9% 516 1.0%No DSPS 4,217 3.3% 3,532 2.6% 3,416 2.4% 3,961 1.6% 4,210 1.8% 19,336 2.3%
Element G - 30 College-level Unit Completion in First YearStudents in the Student Success cohort are tracked through their first year (summer, fall, spring) to determine if they complete 30 or more units. Enrollments in all college-level, credit courses are counted. Completion for this measure is defined by grades of A, B, C, D, and P. This element is from the American Association of Community Colleges (AACC) Pathways project. Results shown in grey print are from groups with less than 30 where overall results are more influenced by individual results. The red and green bars in the combined cohort column illustrate achievement gaps relative to the overall (average) rate. The longer the bar, the greater the gap.
College-level Coursework2010-11 Cohort 2011-12 Cohort 2012-13 Cohort 2013-14 Cohort 2014-15 Cohort 5 Cohorts Combined
Comparison to Overall
23 of 26
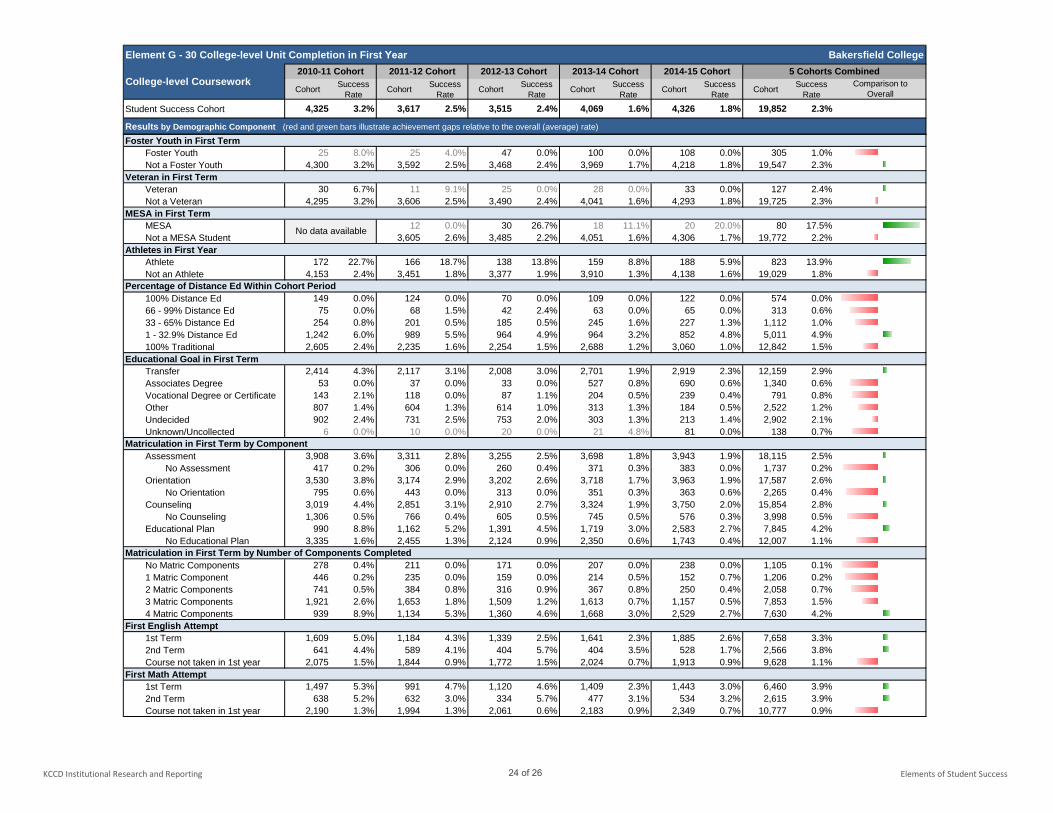
KCCD Institutional Research and Reporting Elements of Student Success
Element G - 30 College-level Unit Completion in First Year Bakersfield College
Cohort Success Rate Cohort Success
Rate Cohort Success Rate Cohort Success
Rate Cohort Success Rate Cohort Success
Rate
Student Success Cohort 4,325 3.2% 3,617 2.5% 3,515 2.4% 4,069 1.6% 4,326 1.8% 19,852 2.3%
Results by Demographic Component (red and green bars illustrate achievement gaps relative to the overall (average) rate)
College-level Coursework2010-11 Cohort 2011-12 Cohort 2012-13 Cohort 2013-14 Cohort 2014-15 Cohort 5 Cohorts Combined
Comparison to Overall
Foster Youth in First TermFoster Youth 25 8.0% 25 4.0% 47 0.0% 100 0.0% 108 0.0% 305 1.0%Not a Foster Youth 4,300 3.2% 3,592 2.5% 3,468 2.4% 3,969 1.7% 4,218 1.8% 19,547 2.3%
Veteran in First TermVeteran 30 6.7% 11 9.1% 25 0.0% 28 0.0% 33 0.0% 127 2.4%Not a Veteran 4,295 3.2% 3,606 2.5% 3,490 2.4% 4,041 1.6% 4,293 1.8% 19,725 2.3%
MESA in First TermMESA 12 0.0% 30 26.7% 18 11.1% 20 20.0% 80 17.5%Not a MESA Student 3,605 2.6% 3,485 2.2% 4,051 1.6% 4,306 1.7% 19,772 2.2%
Athletes in First YearAthlete 172 22.7% 166 18.7% 138 13.8% 159 8.8% 188 5.9% 823 13.9%Not an Athlete 4,153 2.4% 3,451 1.8% 3,377 1.9% 3,910 1.3% 4,138 1.6% 19,029 1.8%
Percentage of Distance Ed Within Cohort Period100% Distance Ed 149 0.0% 124 0.0% 70 0.0% 109 0.0% 122 0.0% 574 0.0%66 - 99% Distance Ed 75 0.0% 68 1.5% 42 2.4% 63 0.0% 65 0.0% 313 0.6%33 - 65% Distance Ed 254 0.8% 201 0.5% 185 0.5% 245 1.6% 227 1.3% 1,112 1.0%1 - 32.9% Distance Ed 1,242 6.0% 989 5.5% 964 4.9% 964 3.2% 852 4.8% 5,011 4.9%100% Traditional 2,605 2.4% 2,235 1.6% 2,254 1.5% 2,688 1.2% 3,060 1.0% 12,842 1.5%
Educational Goal in First TermTransfer 2,414 4.3% 2,117 3.1% 2,008 3.0% 2,701 1.9% 2,919 2.3% 12,159 2.9%Associates Degree 53 0.0% 37 0.0% 33 0.0% 527 0.8% 690 0.6% 1,340 0.6%Vocational Degree or Certificate 143 2.1% 118 0.0% 87 1.1% 204 0.5% 239 0.4% 791 0.8%Other 807 1.4% 604 1.3% 614 1.0% 313 1.3% 184 0.5% 2,522 1.2%Undecided 902 2.4% 731 2.5% 753 2.0% 303 1.3% 213 1.4% 2,902 2.1%Unknown/Uncollected 6 0.0% 10 0.0% 20 0.0% 21 4.8% 81 0.0% 138 0.7%
Matriculation in First Term by ComponentAssessment 3,908 3.6% 3,311 2.8% 3,255 2.5% 3,698 1.8% 3,943 1.9% 18,115 2.5%
No Assessment 417 0.2% 306 0.0% 260 0.4% 371 0.3% 383 0.0% 1,737 0.2%Orientation 3,530 3.8% 3,174 2.9% 3,202 2.6% 3,718 1.7% 3,963 1.9% 17,587 2.6%
No Orientation 795 0.6% 443 0.0% 313 0.0% 351 0.3% 363 0.6% 2,265 0.4%Counseling 3,019 4.4% 2,851 3.1% 2,910 2.7% 3,324 1.9% 3,750 2.0% 15,854 2.8%
No Counseling 1,306 0.5% 766 0.4% 605 0.5% 745 0.5% 576 0.3% 3,998 0.5%Educational Plan 990 8.8% 1,162 5.2% 1,391 4.5% 1,719 3.0% 2,583 2.7% 7,845 4.2%
No Educational Plan 3,335 1.6% 2,455 1.3% 2,124 0.9% 2,350 0.6% 1,743 0.4% 12,007 1.1%Matriculation in First Term by Number of Components Completed
No Matric Components 278 0.4% 211 0.0% 171 0.0% 207 0.0% 238 0.0% 1,105 0.1%1 Matric Component 446 0.2% 235 0.0% 159 0.0% 214 0.5% 152 0.7% 1,206 0.2%2 Matric Components 741 0.5% 384 0.8% 316 0.9% 367 0.8% 250 0.4% 2,058 0.7%3 Matric Components 1,921 2.6% 1,653 1.8% 1,509 1.2% 1,613 0.7% 1,157 0.5% 7,853 1.5%4 Matric Components 939 8.9% 1,134 5.3% 1,360 4.6% 1,668 3.0% 2,529 2.7% 7,630 4.2%
First English Attempt1st Term 1,609 5.0% 1,184 4.3% 1,339 2.5% 1,641 2.3% 1,885 2.6% 7,658 3.3%2nd Term 641 4.4% 589 4.1% 404 5.7% 404 3.5% 528 1.7% 2,566 3.8%Course not taken in 1st year 2,075 1.5% 1,844 0.9% 1,772 1.5% 2,024 0.7% 1,913 0.9% 9,628 1.1%
First Math Attempt1st Term 1,497 5.3% 991 4.7% 1,120 4.6% 1,409 2.3% 1,443 3.0% 6,460 3.9%2nd Term 638 5.2% 632 3.0% 334 5.7% 477 3.1% 534 3.2% 2,615 3.9%Course not taken in 1st year 2,190 1.3% 1,994 1.3% 2,061 0.6% 2,183 0.9% 2,349 0.7% 10,777 0.9%
No data available
24 of 26
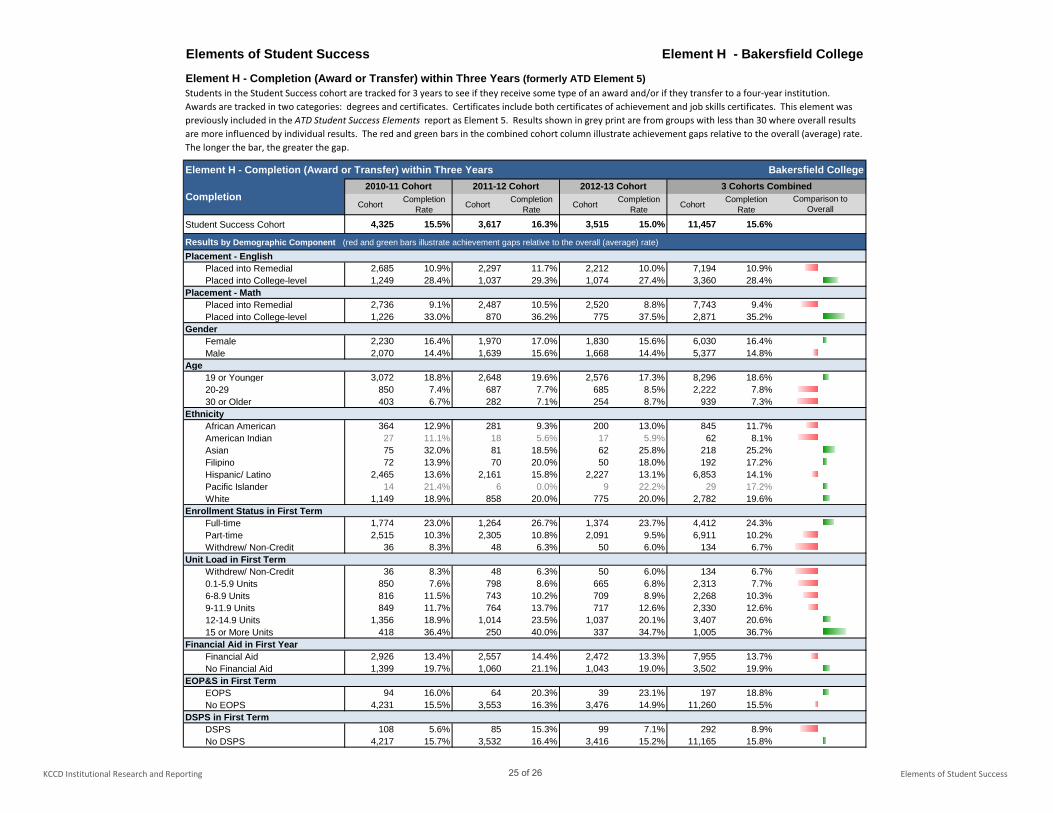
KCCD Institutional Research and Reporting Elements of Student Success
Elements of Student Success Element H - Bakersfield College
Element H - Completion (Award or Transfer) within Three Years (formerly ATD Element 5)
Element H - Completion (Award or Transfer) within Three Years Bakersfield College
Cohort Completion Rate Cohort Completion
Rate Cohort Completion Rate Cohort Completion
Rate
Student Success Cohort 4,325 15.5% 3,617 16.3% 3,515 15.0% 11,457 15.6%
Results by Demographic Component (red and green bars illustrate achievement gaps relative to the overall (average) rate)
Placement - EnglishPlaced into Remedial 2,685 10.9% 2,297 11.7% 2,212 10.0% 7,194 10.9%Placed into College-level 1,249 28.4% 1,037 29.3% 1,074 27.4% 3,360 28.4%
Placement - MathPlaced into Remedial 2,736 9.1% 2,487 10.5% 2,520 8.8% 7,743 9.4%Placed into College-level 1,226 33.0% 870 36.2% 775 37.5% 2,871 35.2%
GenderFemale 2,230 16.4% 1,970 17.0% 1,830 15.6% 6,030 16.4%Male 2,070 14.4% 1,639 15.6% 1,668 14.4% 5,377 14.8%
Age19 or Younger 3,072 18.8% 2,648 19.6% 2,576 17.3% 8,296 18.6%20-29 850 7.4% 687 7.7% 685 8.5% 2,222 7.8%30 or Older 403 6.7% 282 7.1% 254 8.7% 939 7.3%
EthnicityAfrican American 364 12.9% 281 9.3% 200 13.0% 845 11.7%American Indian 27 11.1% 18 5.6% 17 5.9% 62 8.1%Asian 75 32.0% 81 18.5% 62 25.8% 218 25.2%Filipino 72 13.9% 70 20.0% 50 18.0% 192 17.2%Hispanic/ Latino 2,465 13.6% 2,161 15.8% 2,227 13.1% 6,853 14.1%Pacific Islander 14 21.4% 6 0.0% 9 22.2% 29 17.2%White 1,149 18.9% 858 20.0% 775 20.0% 2,782 19.6%
Enrollment Status in First TermFull-time 1,774 23.0% 1,264 26.7% 1,374 23.7% 4,412 24.3%Part-time 2,515 10.3% 2,305 10.8% 2,091 9.5% 6,911 10.2%Withdrew/ Non-Credit 36 8.3% 48 6.3% 50 6.0% 134 6.7%
Unit Load in First TermWithdrew/ Non-Credit 36 8.3% 48 6.3% 50 6.0% 134 6.7%0.1-5.9 Units 850 7.6% 798 8.6% 665 6.8% 2,313 7.7%6-8.9 Units 816 11.5% 743 10.2% 709 8.9% 2,268 10.3%9-11.9 Units 849 11.7% 764 13.7% 717 12.6% 2,330 12.6%12-14.9 Units 1,356 18.9% 1,014 23.5% 1,037 20.1% 3,407 20.6%15 or More Units 418 36.4% 250 40.0% 337 34.7% 1,005 36.7%
Financial Aid in First YearFinancial Aid 2,926 13.4% 2,557 14.4% 2,472 13.3% 7,955 13.7%No Financial Aid 1,399 19.7% 1,060 21.1% 1,043 19.0% 3,502 19.9%
EOP&S in First TermEOPS 94 16.0% 64 20.3% 39 23.1% 197 18.8%No EOPS 4,231 15.5% 3,553 16.3% 3,476 14.9% 11,260 15.5%
DSPS in First TermDSPS 108 5.6% 85 15.3% 99 7.1% 292 8.9%No DSPS 4,217 15.7% 3,532 16.4% 3,416 15.2% 11,165 15.8%
Students in the Student Success cohort are tracked for 3 years to see if they receive some type of an award and/or if they transfer to a four-year institution. Awards are tracked in two categories: degrees and certificates. Certificates include both certificates of achievement and job skills certificates. This element was previously included in the ATD Student Success Elements report as Element 5. Results shown in grey print are from groups with less than 30 where overall results are more influenced by individual results. The red and green bars in the combined cohort column illustrate achievement gaps relative to the overall (average) rate. The longer the bar, the greater the gap.
Completion2010-11 Cohort 2011-12 Cohort 2012-13 Cohort 3 Cohorts Combined
Comparison to Overall
25 of 26
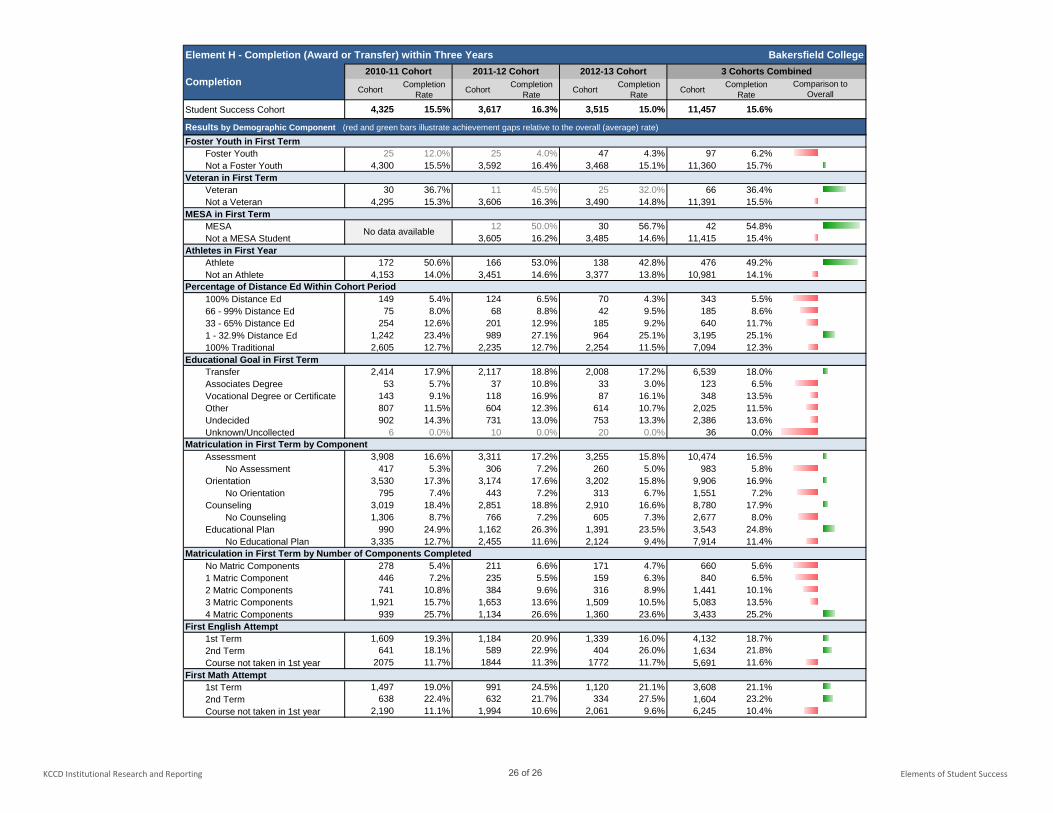
KCCD Institutional Research and Reporting Elements of Student Success
Element H - Completion (Award or Transfer) within Three Years Bakersfield College
Cohort Completion Rate Cohort Completion
Rate Cohort Completion Rate Cohort Completion
Rate
Student Success Cohort 4,325 15.5% 3,617 16.3% 3,515 15.0% 11,457 15.6%
Results by Demographic Component (red and green bars illustrate achievement gaps relative to the overall (average) rate)
Completion2010-11 Cohort 2011-12 Cohort 2012-13 Cohort 3 Cohorts Combined
Comparison to Overall
Foster Youth in First TermFoster Youth 25 12.0% 25 4.0% 47 4.3% 97 6.2%Not a Foster Youth 4,300 15.5% 3,592 16.4% 3,468 15.1% 11,360 15.7%
Veteran in First TermVeteran 30 36.7% 11 45.5% 25 32.0% 66 36.4%Not a Veteran 4,295 15.3% 3,606 16.3% 3,490 14.8% 11,391 15.5%
MESA in First TermMESA 12 50.0% 30 56.7% 42 54.8%Not a MESA Student 3,605 16.2% 3,485 14.6% 11,415 15.4%
Athletes in First YearAthlete 172 50.6% 166 53.0% 138 42.8% 476 49.2%Not an Athlete 4,153 14.0% 3,451 14.6% 3,377 13.8% 10,981 14.1%
Percentage of Distance Ed Within Cohort Period100% Distance Ed 149 5.4% 124 6.5% 70 4.3% 343 5.5%66 - 99% Distance Ed 75 8.0% 68 8.8% 42 9.5% 185 8.6%33 - 65% Distance Ed 254 12.6% 201 12.9% 185 9.2% 640 11.7%1 - 32.9% Distance Ed 1,242 23.4% 989 27.1% 964 25.1% 3,195 25.1%100% Traditional 2,605 12.7% 2,235 12.7% 2,254 11.5% 7,094 12.3%
Educational Goal in First TermTransfer 2,414 17.9% 2,117 18.8% 2,008 17.2% 6,539 18.0%Associates Degree 53 5.7% 37 10.8% 33 3.0% 123 6.5%Vocational Degree or Certificate 143 9.1% 118 16.9% 87 16.1% 348 13.5%Other 807 11.5% 604 12.3% 614 10.7% 2,025 11.5%Undecided 902 14.3% 731 13.0% 753 13.3% 2,386 13.6%Unknown/Uncollected 6 0.0% 10 0.0% 20 0.0% 36 0.0%
Matriculation in First Term by ComponentAssessment 3,908 16.6% 3,311 17.2% 3,255 15.8% 10,474 16.5%
No Assessment 417 5.3% 306 7.2% 260 5.0% 983 5.8%Orientation 3,530 17.3% 3,174 17.6% 3,202 15.8% 9,906 16.9%
No Orientation 795 7.4% 443 7.2% 313 6.7% 1,551 7.2%Counseling 3,019 18.4% 2,851 18.8% 2,910 16.6% 8,780 17.9%
No Counseling 1,306 8.7% 766 7.2% 605 7.3% 2,677 8.0%Educational Plan 990 24.9% 1,162 26.3% 1,391 23.5% 3,543 24.8%
No Educational Plan 3,335 12.7% 2,455 11.6% 2,124 9.4% 7,914 11.4%Matriculation in First Term by Number of Components Completed
No Matric Components 278 5.4% 211 6.6% 171 4.7% 660 5.6%1 Matric Component 446 7.2% 235 5.5% 159 6.3% 840 6.5%2 Matric Components 741 10.8% 384 9.6% 316 8.9% 1,441 10.1%3 Matric Components 1,921 15.7% 1,653 13.6% 1,509 10.5% 5,083 13.5%4 Matric Components 939 25.7% 1,134 26.6% 1,360 23.6% 3,433 25.2%
First English Attempt1st Term 1,609 19.3% 1,184 20.9% 1,339 16.0% 4,132 18.7%2nd Term 641 18.1% 589 22.9% 404 26.0% 1,634 21.8%Course not taken in 1st year 2075 11.7% 1844 11.3% 1772 11.7% 5,691 11.6%
First Math Attempt1st Term 1,497 19.0% 991 24.5% 1,120 21.1% 3,608 21.1%2nd Term 638 22.4% 632 21.7% 334 27.5% 1,604 23.2%Course not taken in 1st year 2,190 11.1% 1,994 10.6% 2,061 9.6% 6,245 10.4%
No data available
26 of 26