Embed Size (px)
Citation preview
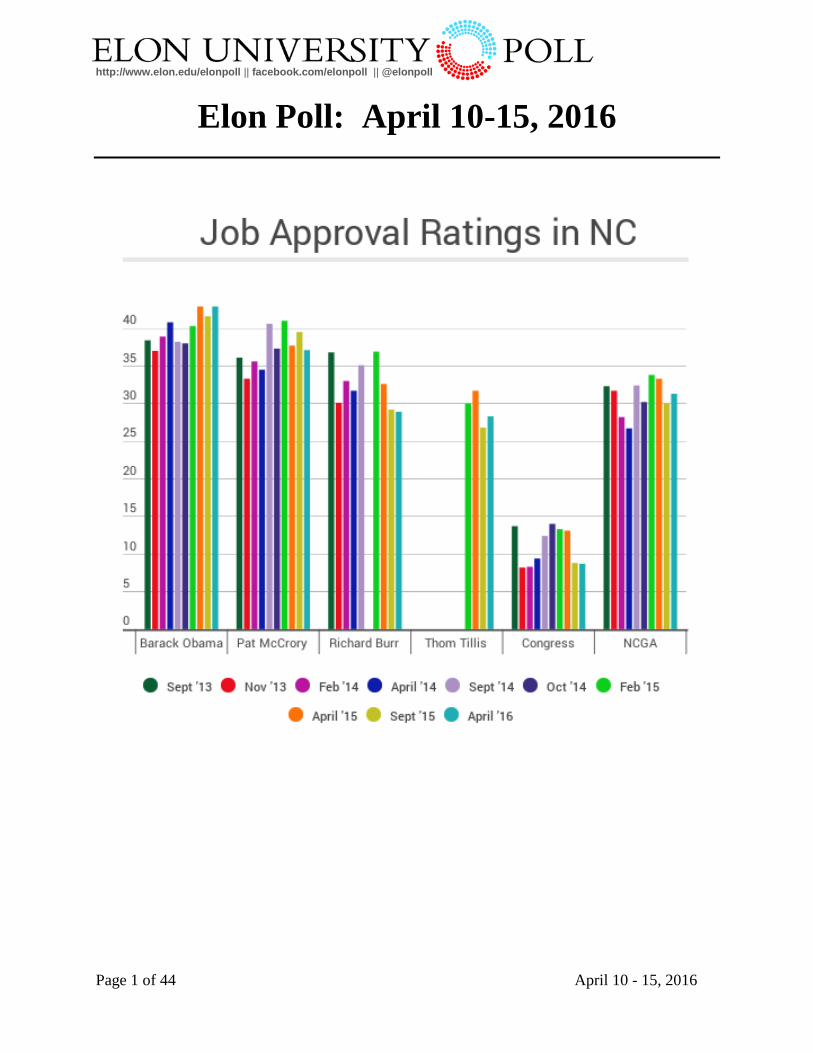
http://www.elon.edu/elonpoll || facebook.com/elonpoll || @elonpoll
Page 1 of 44 April 10 - 15, 2016
Elon Poll: April 10-15, 2016
http://www.elon.edu/elonpoll || facebook.com/elonpoll || @elonpoll
Page 2 of 44 April 10 - 15, 2016
TABLE OF CONTENTS Executive Summary ........................................................................................................................ 3
TOPLINE RESULTS...................................................................................................................... 6
Election 2016 .............................................................................................................................. 6
Approval Ratings ........................................................................................................................ 8
Issues, Policies, Opinions & Perceptions .................................................................................. 10
Demographics ........................................................................................................................... 19
Cross Tabulations.......................................................................................................................... 25
Cross-Tabs Approval ................................................................................................................ 25
Cross-Tabs Clinton vs. Trump .................................................................................................. 29
Cross-Tabs Clinton vs. Cruz ..................................................................................................... 30
Cross-Tabs Sanders vs. Trump ................................................................................................. 31
Cross-Tabs Sanders vs. Trump ................................................................................................. 32
Cross-Tabs: McCrory vs Cooper Head-to-Head....................................................................... 33
Cross-Tabs: Burr vs Ross Head-to-Head .................................................................................. 34
Cross-Tabs: HB2 ....................................................................................................................... 35
Question Ordering ......................................................................................................................... 36
Methodological Information ......................................................................................................... 39
The Elon University Poll Team .................................................................................................... 43
http://www.elon.edu/elonpoll || facebook.com/elonpoll || @elonpoll
Page 3 of 44 April 10 - 15, 2016
Executive Summary The Elon University Poll conducted a live-caller, dual frame (landline and cell phone) survey of 692 residents of North Carolina between April 10 and April 15, 2016. Of these respondents, 621 said they were registered to vote in the state of North Carolina. The survey reported here presents the results for registered voters and has a margin of error of +/- 3.93 percentage points.
THE 2016 ELECTION
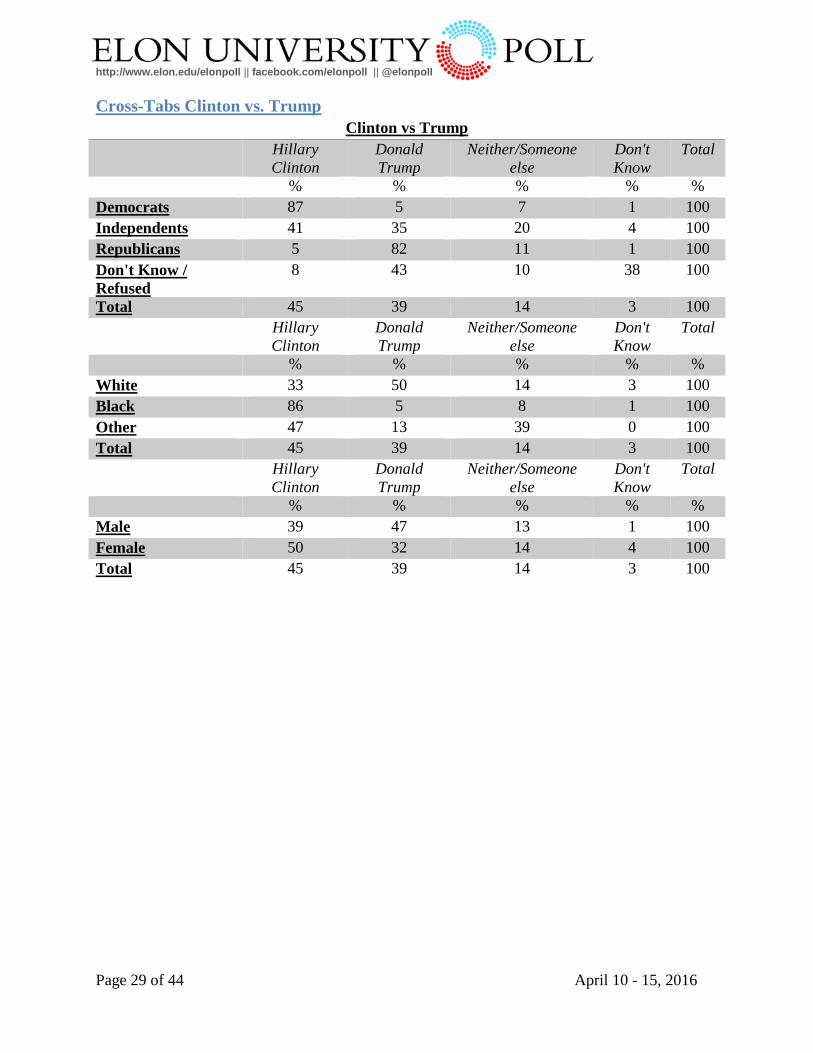
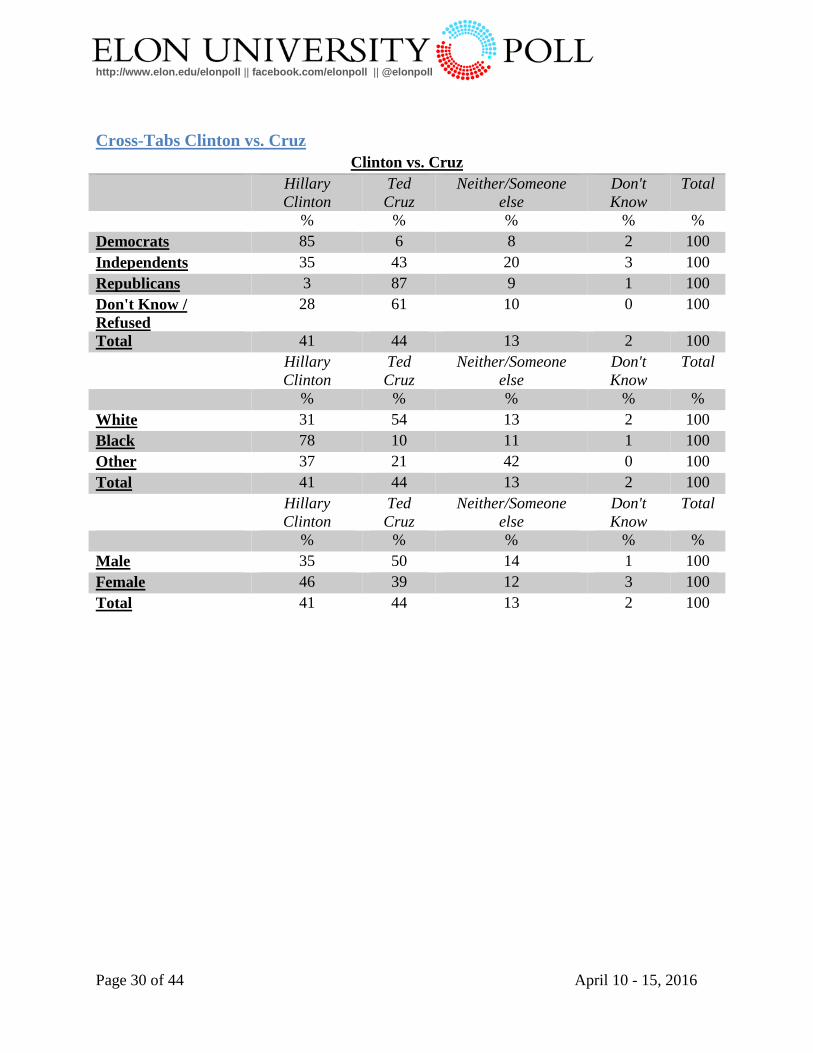
Clinton vs. Trump and Cruz Results from several hypothetical matchups shows that Hillary Clinton would likely defeat Donald Trump (45% to 39%). This was similar to a finding in February among likely voters which found Clinton beating Trump (47% to 41%). However, Clinton loses when matched-up against Ted Cruz (41% to 44%). This is a slight change since the February survey which found Clinton and Cruz neck and neck at 46% each.
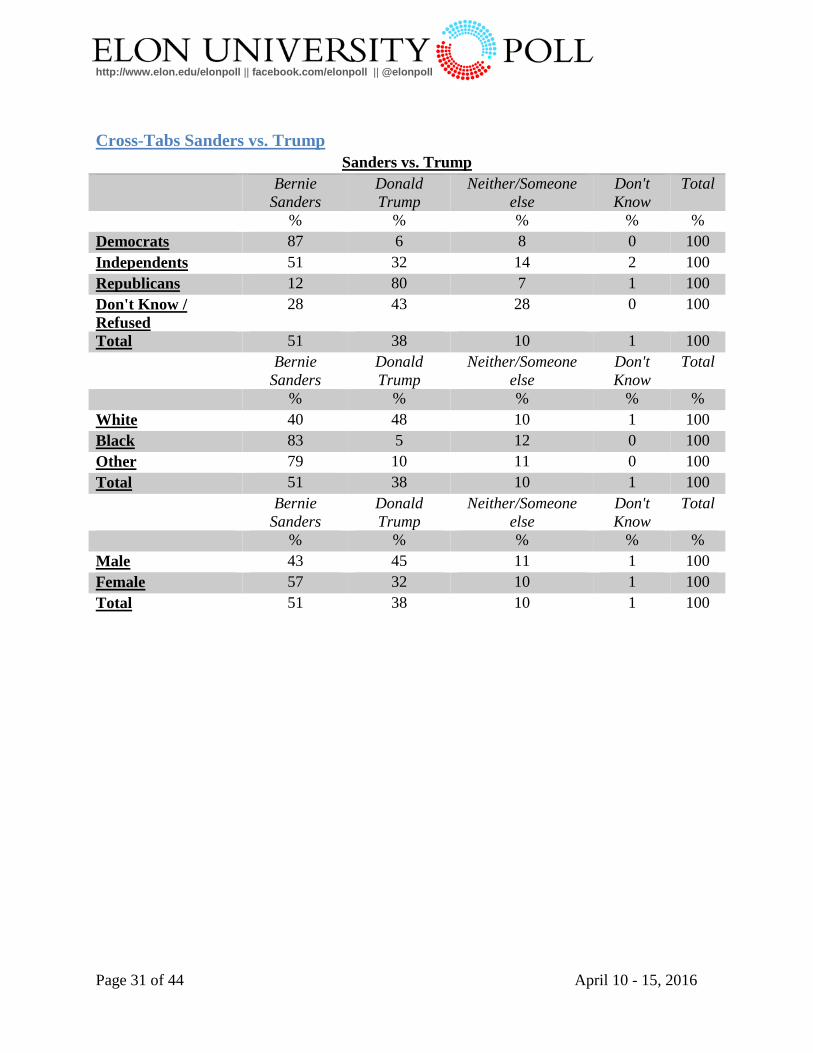
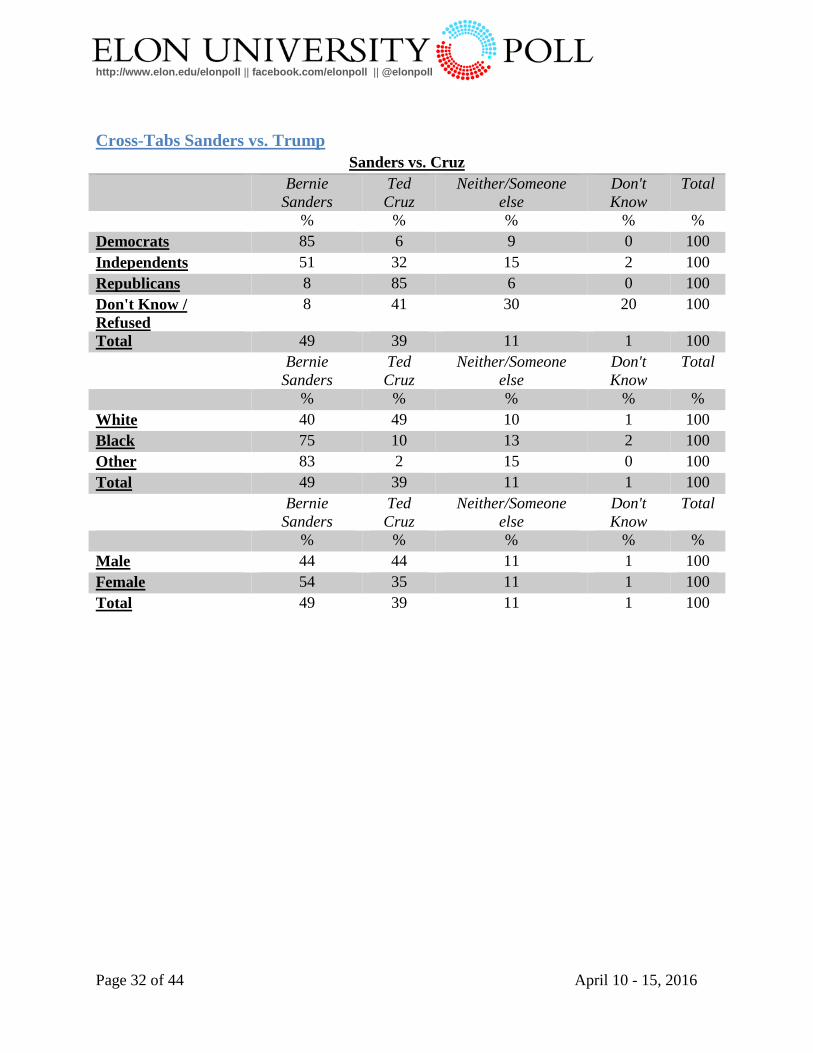
Sanders vs. Trump and Cruz Bernie Sanders also does very well against Donald Trump in a hypothetical matchup (51% to 38%). This is a larger lead than previously found in February where Sanders was beating Trump by 8 points (48% to 40%). Similarly, Sanders does well against Ted Cruz. Forty-nine percent of registered voters said they would support Sanders over Cruz, compared to 39 percent who would support Cruz. This is a larger lead for Sanders than found in the February likely voter survey which found Sanders beating Cruz 47% to 43%.
McCrory vs. Cooper Respondents were asked who they would vote for governor in 2016 if the election was held today. This is the fifth time the Elon Poll has asked about this matchup and in most cases the results have been very close. Currently, Cooper edges out McCrory by over 6 points (48% to 42%), the largest lead among the five Elon Poll surveys asking about the 2016 gubernatorial race.
Burr vs. Ross Both Richard Burr and Deborah Ross won their primary elections in March by large margins. This is the first opportunity that the Elon Poll has had to ask about this matchup and found that Republican Richard Burr leads Democrat Deborah Ross by 4 points (37% to 33%). Over 19 percent said they were planning on voting for someone else and 11 percent said they were still unsure of who'd they support. Sean Haugh, the Libertarian candidate who ran for the U.S. House of Representative in 2008 and for U.S. Senate in 2014, is also running for the U.S. Senate this year. Haugh received 3.74 percent of the vote in the 2014 midterm election.
http://www.elon.edu/elonpoll || facebook.com/elonpoll || @elonpoll
Page 4 of 44 April 10 - 15, 2016
APPROVAL RATINGS
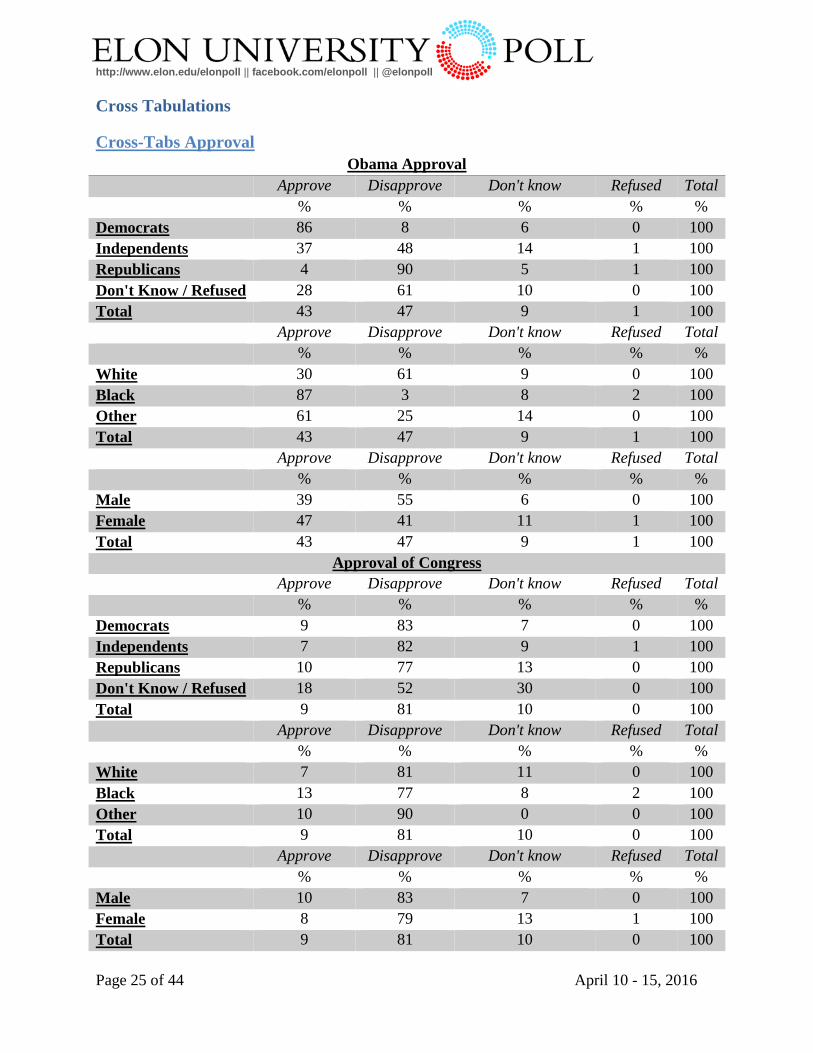
President Barack Obama Currently the President's approval rating is at 43 percent. This is a slight lower than the likely voter survey conducted in February. Just over 47 percent said they disapproved of the way Barack Obama is handling his job as president. Nine percent said they didn't know or were unsure. Only 4 respondents refused to provide an answer. Nearly half of Independents (48%) disapprove of the president's job performance. However, only 4 percent of African Americans disapprove of Barack Obama. Most men (55%) disapprove of the president's performance, compared to 45% of women.
Congress Approval for Congress remains low among registered voters in North Carolina. Only 8.7% of registered voters approve of the job Congress is doing, more than a 4-point drop in approval since April of last year (13.1%). This is the lowest approval ratings for Congress observed by the Elon Poll since February 2014.
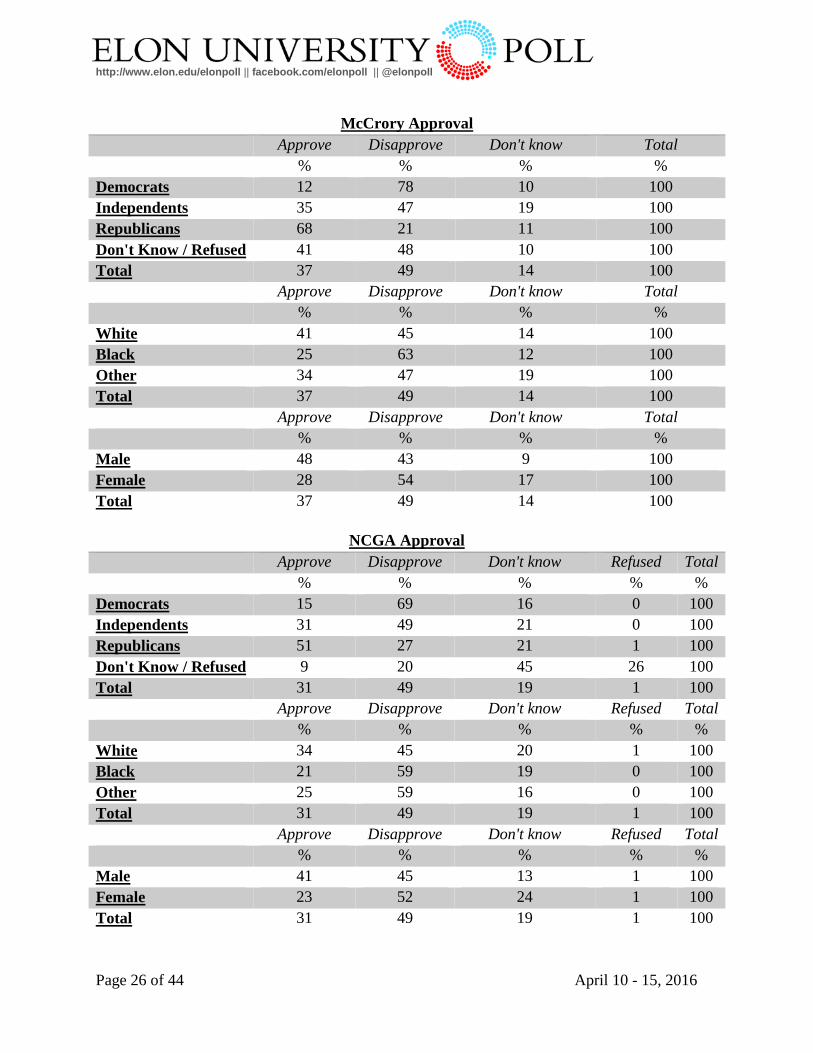
Governor Pat McCrory Approximately 37 percent of registered voters approve of the job the governor is doing, compared to 49 percent who said they disapprove of the way he is handling his job. Nearly 14 percent said they didn't know or were unsure of their assessment of the governor. This is the lowest approval rating for the governor observed by the Elon Poll since April 2014.
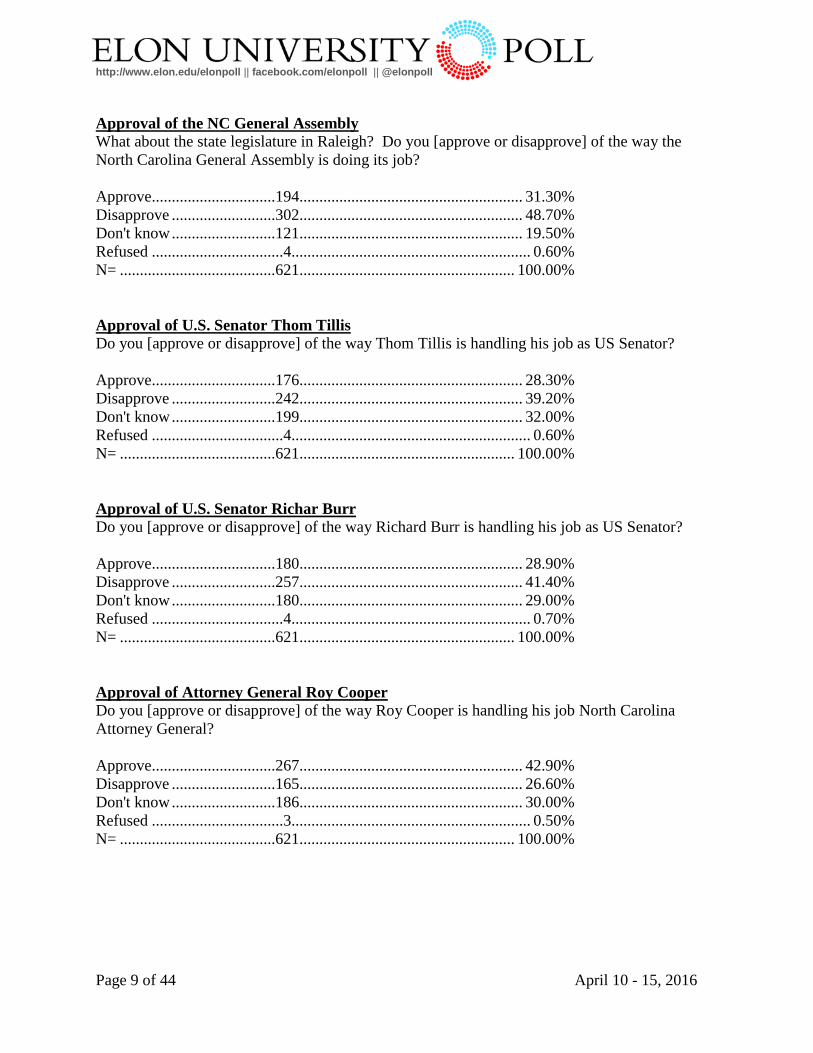
North Carolina General Assembly In April 2015, the approval rating of the North Carolina General Assembly was 33.3%. This dropped approximately 3 percentage point to 30.0% in September of 2015. In this current survey the Elon Poll found the NCGA had an approval rating of 31.3 percent. The lowest approval rating of the state legislature (among registered voters) occurred in April of 2014 (26.7%). Nearly 20 percent of registered voters in this currently survey said they didn't know or were unsure of the General Assembly's performance.
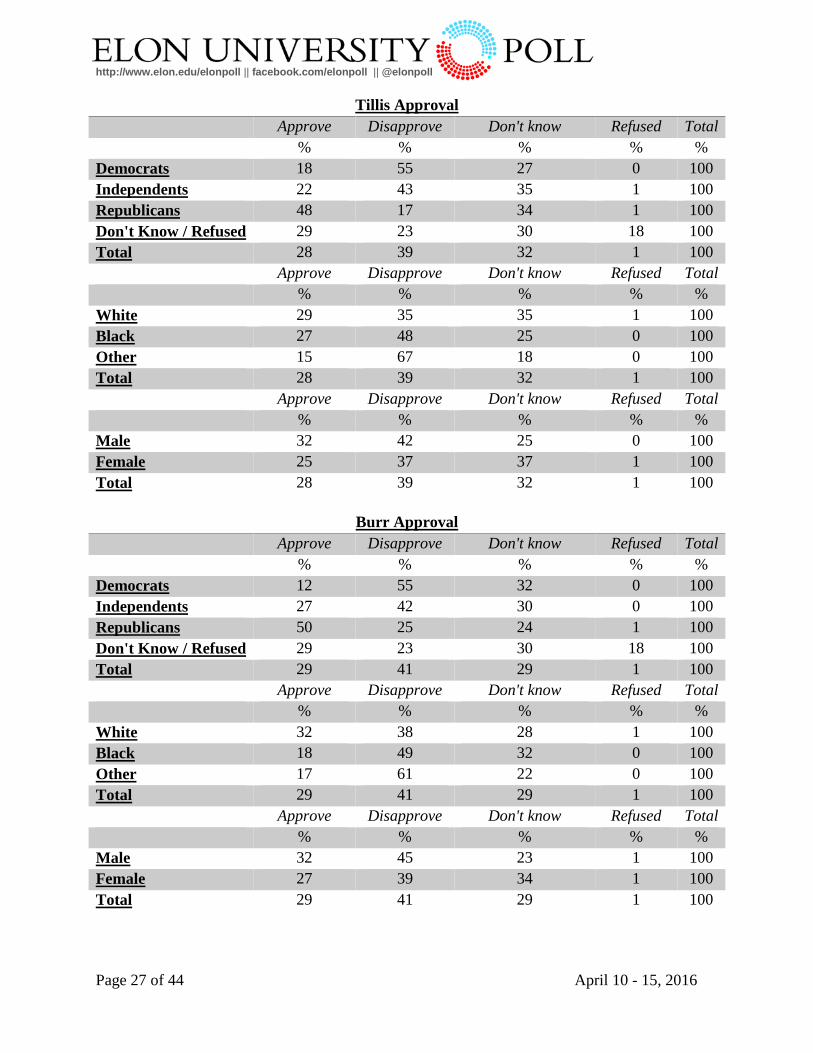
Senator Richard Burr Just under 29% of registered voters approve of the job the U.S. Senator Richard Burr is doing, compared to 41 percent who disapprove. This is the lowest approval rating ever recorded by the Elon Poll, either among registered voters or residents of North Carolina. Although Burr has served as U.S. Senator since 2005, twenty-nine percent of registered voters still said they didn't know or were unsure of the Senator's performance.
Senator Thom Tillis The approval rating for Senator Tillis was similar to that of Richard Burr's; just over 28 percent approve of Tillis's job performance. This result is actually a slight improvement since September of last year when the Senator's approval rating was under 27 percent. Almost a third of registered voters (32%) said they didn't know or were unsure of Tillis's performance.
http://www.elon.edu/elonpoll || facebook.com/elonpoll || @elonpoll
Page 5 of 44 April 10 - 15, 2016
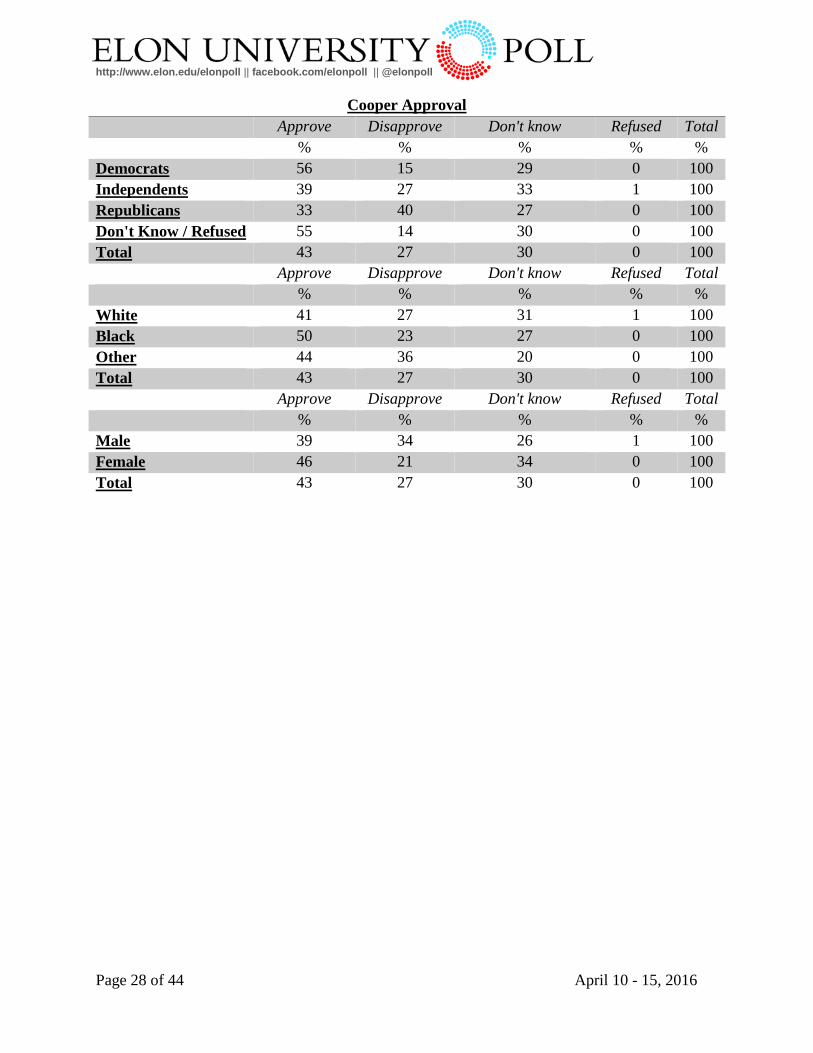
NC Attorney General Roy Cooper This is the first time the Elon University Poll has asked respondents about the job performance of Roy Cooper. Nearly 43 percent of registered voters said they approved of the job the Attorney General is doing, compared to almost 27 percent who disapprove. Thirty percent of respondents said they didn't know or were unsure about the job Cooper is doing.
ISSUES, POLICIES, OPINIONS & PERCEPTIONS
In this survey we asked respondents about their opinions and perceptions of a range of issues including the same-sex marriage, the economy, quality of life in the state, the role of government, and numerous other important topics [See the Topline Results below for a full list of questions and results].
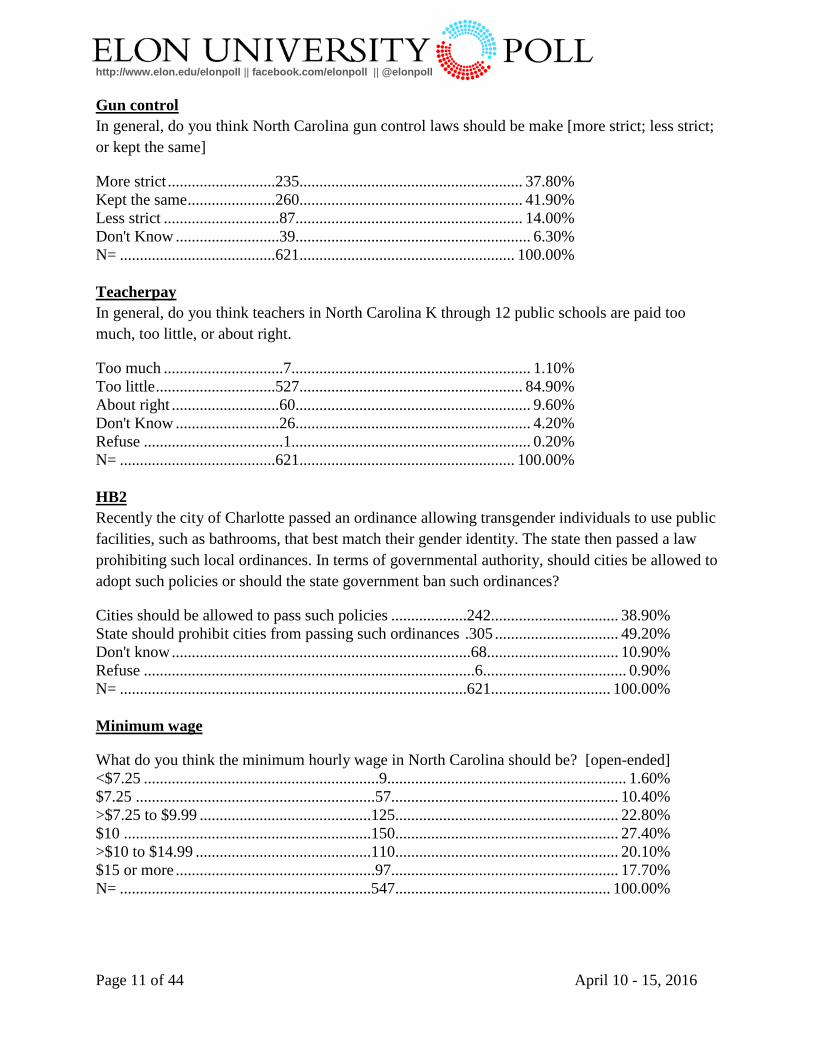
House Bill 2 (HB2) On March 23the North Carolina General Assembly passed HB2 during a special session of the state legislature. Governor Pat McCrory signed the bill into law that same day. Although the bill addresses several various issues, including the minimum wage, it has received national attention for overturning an ordinance passed by the Charlotte city council that allowed transgender individuals to use public facilities, such as bathrooms, that best match their identified gender. The Elon Poll asked respondents the following question: "Recently the city of Charlotte passed an ordinance allowing transgender individuals to use public facilities, such as bathrooms, that best match their gender identity. The state then passed a law prohibiting such local ordinances. In terms of governmental authority, should cities be allowed to adopt such policies or should the state government ban such ordinances?" Just over 49 percent said the state should ban such ordinances, 39 percent cities should be allowed to adopt such policies, and 11 percent said don't know.
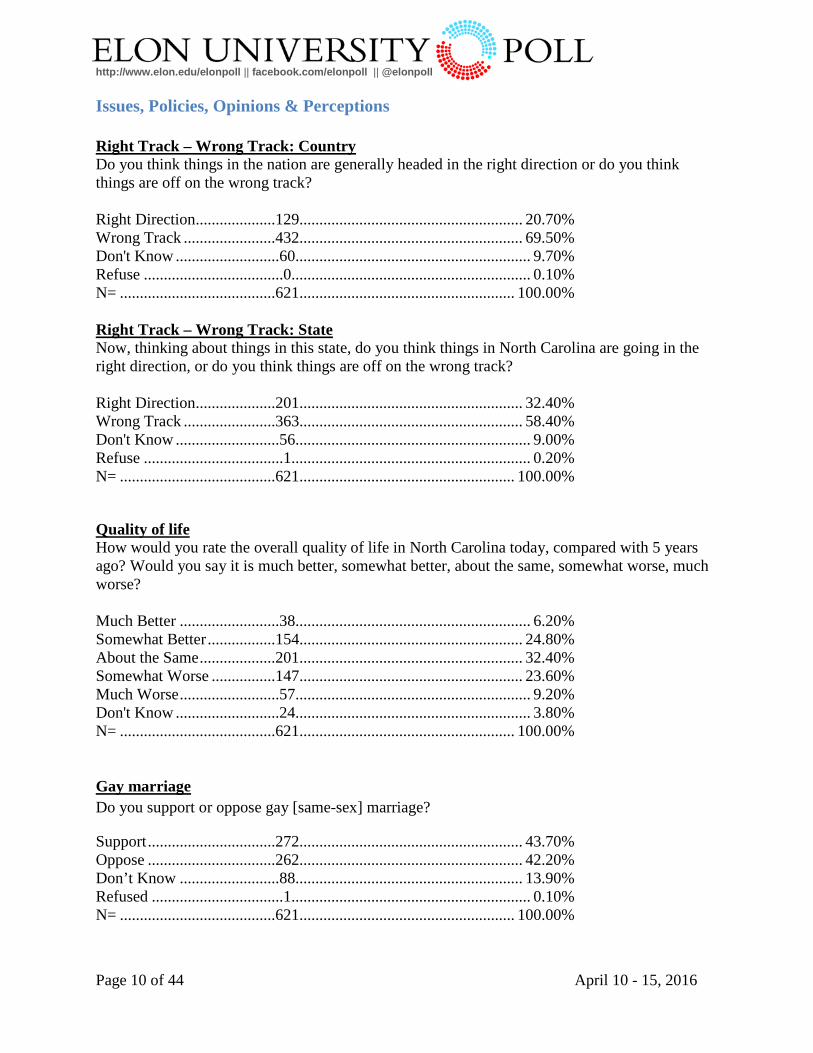
Same-Sex Marriage More registered voters in North Carolina support same-sex marriage than oppose it (44% to 42%), with 14 percent still unsure. In September of 2015, these numbers were almost reversed with 42% of registered voters supporting gay marriage and 46% opposing it.
Nation and State Going in the Right Direction or Off on the Wrong Track? Most registered voters feel that both the state and the nation are off on the wrong track, but far more feel that way about the country (70%) than the state (58%). In February of 2015, approximately 51 percent of registered voters felt the state was on the wrong track. In October of 2014, 68 percent of registered voters believed the nation was on the wrong track.
http://www.elon.edu/elonpoll || facebook.com/elonpoll || @elonpoll
Page 6 of 44 April 10 - 15, 2016
TOPLINE RESULTS
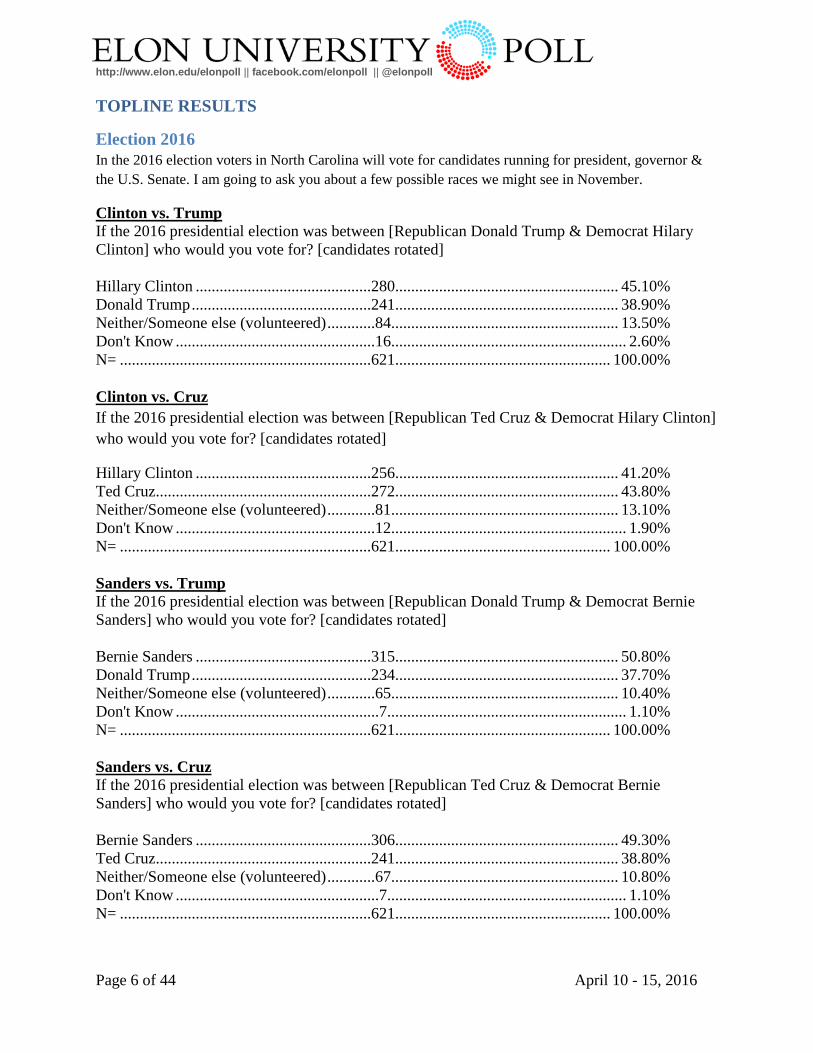
Election 2016 In the 2016 election voters in North Carolina will vote for candidates running for president, governor & the U.S. Senate. I am going to ask you about a few possible races we might see in November.
Clinton vs. Trump If the 2016 presidential election was between [Republican Donald Trump & Democrat Hilary Clinton] who would you vote for? [candidates rotated] Hillary Clinton ............................................280........................................................ 45.10% Donald Trump .............................................241........................................................ 38.90% Neither/Someone else (volunteered) ............84......................................................... 13.50% Don't Know ..................................................16........................................................... 2.60% N= ...............................................................621...................................................... 100.00% Clinton vs. Cruz If the 2016 presidential election was between [Republican Ted Cruz & Democrat Hilary Clinton] who would you vote for? [candidates rotated]
Hillary Clinton ............................................256........................................................ 41.20% Ted Cruz......................................................272........................................................ 43.80% Neither/Someone else (volunteered) ............81......................................................... 13.10% Don't Know ..................................................12........................................................... 1.90% N= ...............................................................621...................................................... 100.00% Sanders vs. Trump If the 2016 presidential election was between [Republican Donald Trump & Democrat Bernie Sanders] who would you vote for? [candidates rotated] Bernie Sanders ............................................315........................................................ 50.80% Donald Trump .............................................234........................................................ 37.70% Neither/Someone else (volunteered) ............65......................................................... 10.40% Don't Know ...................................................7............................................................ 1.10% N= ...............................................................621...................................................... 100.00% Sanders vs. Cruz If the 2016 presidential election was between [Republican Ted Cruz & Democrat Bernie Sanders] who would you vote for? [candidates rotated] Bernie Sanders ............................................306........................................................ 49.30% Ted Cruz......................................................241........................................................ 38.80% Neither/Someone else (volunteered) ............67......................................................... 10.80% Don't Know ...................................................7............................................................ 1.10% N= ...............................................................621...................................................... 100.00%
http://www.elon.edu/elonpoll || facebook.com/elonpoll || @elonpoll
Page 7 of 44 April 10 - 15, 2016
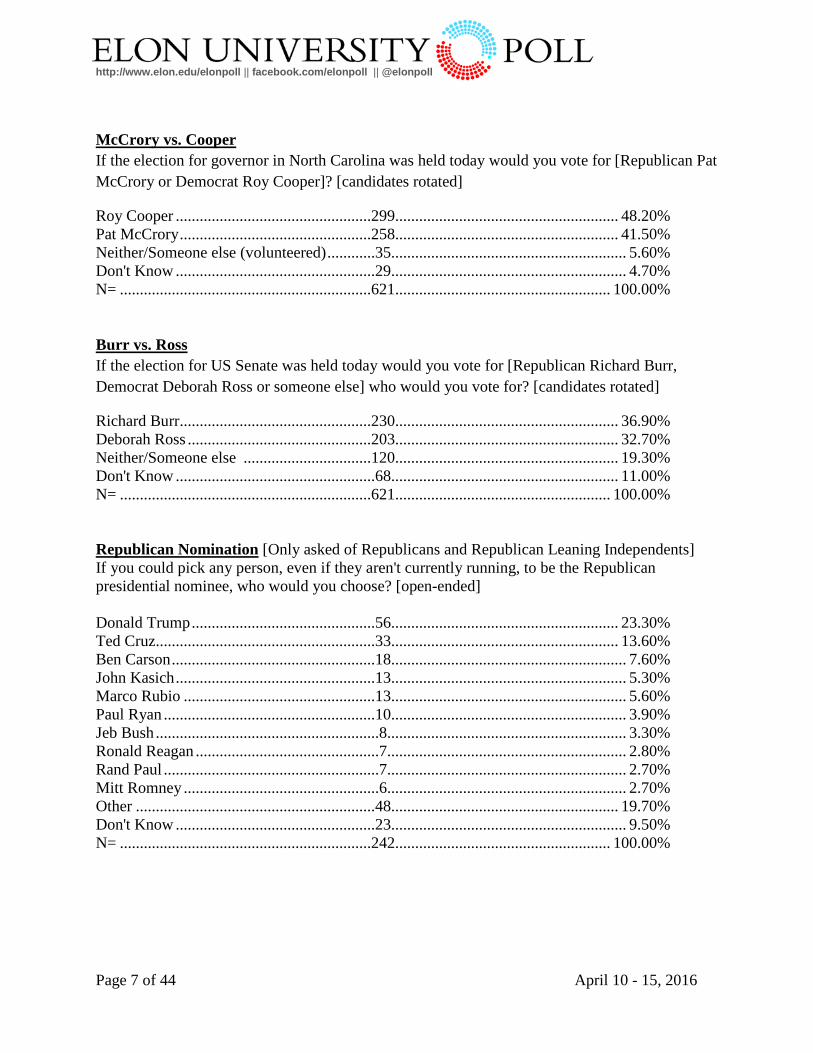
McCrory vs. Cooper If the election for governor in North Carolina was held today would you vote for [Republican Pat McCrory or Democrat Roy Cooper]? [candidates rotated]
Roy Cooper .................................................299........................................................ 48.20% Pat McCrory ................................................258........................................................ 41.50% Neither/Someone else (volunteered) ............35........................................................... 5.60% Don't Know ..................................................29........................................................... 4.70% N= ...............................................................621...................................................... 100.00% Burr vs. Ross If the election for US Senate was held today would you vote for [Republican Richard Burr, Democrat Deborah Ross or someone else] who would you vote for? [candidates rotated]
Richard Burr................................................230........................................................ 36.90% Deborah Ross ..............................................203........................................................ 32.70% Neither/Someone else ................................120........................................................ 19.30% Don't Know ..................................................68......................................................... 11.00% N= ...............................................................621...................................................... 100.00% Republican Nomination [Only asked of Republicans and Republican Leaning Independents] If you could pick any person, even if they aren't currently running, to be the Republican presidential nominee, who would you choose? [open-ended] Donald Trump ..............................................56......................................................... 23.30% Ted Cruz.......................................................33......................................................... 13.60% Ben Carson ...................................................18........................................................... 7.60% John Kasich ..................................................13........................................................... 5.30% Marco Rubio ................................................13........................................................... 5.60% Paul Ryan .....................................................10........................................................... 3.90% Jeb Bush ........................................................8............................................................ 3.30% Ronald Reagan ..............................................7............................................................ 2.80% Rand Paul ......................................................7............................................................ 2.70% Mitt Romney .................................................6............................................................ 2.70% Other ............................................................48......................................................... 19.70% Don't Know ..................................................23........................................................... 9.50% N= ...............................................................242...................................................... 100.00%
http://www.elon.edu/elonpoll || facebook.com/elonpoll || @elonpoll
Page 8 of 44 April 10 - 15, 2016
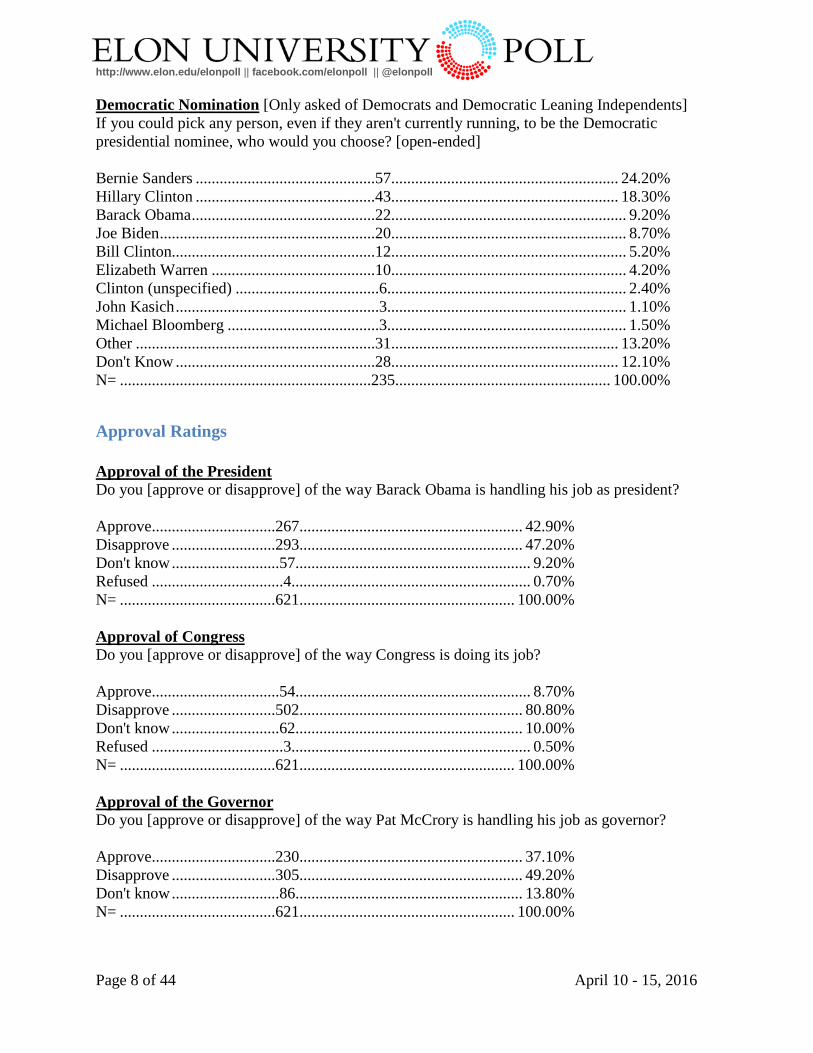
Democratic Nomination [Only asked of Democrats and Democratic Leaning Independents] If you could pick any person, even if they aren't currently running, to be the Democratic presidential nominee, who would you choose? [open-ended] Bernie Sanders .............................................57......................................................... 24.20% Hillary Clinton .............................................43......................................................... 18.30% Barack Obama ..............................................22........................................................... 9.20% Joe Biden ......................................................20........................................................... 8.70% Bill Clinton...................................................12........................................................... 5.20% Elizabeth Warren .........................................10........................................................... 4.20% Clinton (unspecified) ....................................6............................................................ 2.40% John Kasich ...................................................3............................................................ 1.10% Michael Bloomberg ......................................3............................................................ 1.50% Other ............................................................31......................................................... 13.20% Don't Know ..................................................28......................................................... 12.10% N= ...............................................................235...................................................... 100.00%
Approval Ratings Approval of the President Do you [approve or disapprove] of the way Barack Obama is handling his job as president? Approve...............................267........................................................ 42.90% Disapprove ..........................293........................................................ 47.20% Don't know ...........................57........................................................... 9.20% Refused .................................4............................................................ 0.70% N= .......................................621...................................................... 100.00% Approval of Congress Do you [approve or disapprove] of the way Congress is doing its job? Approve................................54........................................................... 8.70% Disapprove ..........................502........................................................ 80.80% Don't know ...........................62......................................................... 10.00% Refused .................................3............................................................ 0.50% N= .......................................621...................................................... 100.00% Approval of the Governor Do you [approve or disapprove] of the way Pat McCrory is handling his job as governor? Approve...............................230........................................................ 37.10% Disapprove ..........................305........................................................ 49.20% Don't know ...........................86......................................................... 13.80% N= .......................................621...................................................... 100.00%
http://www.elon.edu/elonpoll || facebook.com/elonpoll || @elonpoll
Page 9 of 44 April 10 - 15, 2016
Approval of the NC General Assembly What about the state legislature in Raleigh? Do you [approve or disapprove] of the way the North Carolina General Assembly is doing its job? Approve...............................194........................................................ 31.30% Disapprove ..........................302........................................................ 48.70% Don't know ..........................121........................................................ 19.50% Refused .................................4............................................................ 0.60% N= .......................................621...................................................... 100.00% Approval of U.S. Senator Thom Tillis Do you [approve or disapprove] of the way Thom Tillis is handling his job as US Senator? Approve...............................176........................................................ 28.30% Disapprove ..........................242........................................................ 39.20% Don't know ..........................199........................................................ 32.00% Refused .................................4............................................................ 0.60% N= .......................................621...................................................... 100.00% Approval of U.S. Senator Richar Burr Do you [approve or disapprove] of the way Richard Burr is handling his job as US Senator? Approve...............................180........................................................ 28.90% Disapprove ..........................257........................................................ 41.40% Don't know ..........................180........................................................ 29.00% Refused .................................4............................................................ 0.70% N= .......................................621...................................................... 100.00% Approval of Attorney General Roy Cooper Do you [approve or disapprove] of the way Roy Cooper is handling his job North Carolina Attorney General? Approve...............................267........................................................ 42.90% Disapprove ..........................165........................................................ 26.60% Don't know ..........................186........................................................ 30.00% Refused .................................3............................................................ 0.50% N= .......................................621...................................................... 100.00%
http://www.elon.edu/elonpoll || facebook.com/elonpoll || @elonpoll
Page 10 of 44 April 10 - 15, 2016
Issues, Policies, Opinions & Perceptions Right Track – Wrong Track: Country Do you think things in the nation are generally headed in the right direction or do you think things are off on the wrong track? Right Direction....................129........................................................ 20.70% Wrong Track .......................432........................................................ 69.50% Don't Know ..........................60........................................................... 9.70% Refuse ...................................0............................................................ 0.10% N= .......................................621...................................................... 100.00% Right Track – Wrong Track: State Now, thinking about things in this state, do you think things in North Carolina are going in the right direction, or do you think things are off on the wrong track? Right Direction....................201........................................................ 32.40% Wrong Track .......................363........................................................ 58.40% Don't Know ..........................56........................................................... 9.00% Refuse ...................................1............................................................ 0.20% N= .......................................621...................................................... 100.00%
Quality of life How would you rate the overall quality of life in North Carolina today, compared with 5 years ago? Would you say it is much better, somewhat better, about the same, somewhat worse, much worse? Much Better .........................38........................................................... 6.20% Somewhat Better .................154........................................................ 24.80% About the Same ...................201........................................................ 32.40% Somewhat Worse ................147........................................................ 23.60% Much Worse .........................57........................................................... 9.20% Don't Know ..........................24........................................................... 3.80% N= .......................................621...................................................... 100.00% Gay marriage Do you support or oppose gay [same-sex] marriage?
Support ................................272........................................................ 43.70% Oppose ................................262........................................................ 42.20% Don’t Know .........................88......................................................... 13.90% Refused .................................1............................................................ 0.10% N= .......................................621...................................................... 100.00%
http://www.elon.edu/elonpoll || facebook.com/elonpoll || @elonpoll
Page 11 of 44 April 10 - 15, 2016
Gun control In general, do you think North Carolina gun control laws should be make [more strict; less strict; or kept the same]
More strict ...........................235........................................................ 37.80% Kept the same ......................260........................................................ 41.90% Less strict .............................87......................................................... 14.00% Don't Know ..........................39........................................................... 6.30% N= .......................................621...................................................... 100.00% Teacherpay In general, do you think teachers in North Carolina K through 12 public schools are paid too much, too little, or about right.
Too much ..............................7............................................................ 1.10% Too little ..............................527........................................................ 84.90% About right ...........................60........................................................... 9.60% Don't Know ..........................26........................................................... 4.20% Refuse ...................................1............................................................ 0.20% N= .......................................621...................................................... 100.00% HB2 Recently the city of Charlotte passed an ordinance allowing transgender individuals to use public facilities, such as bathrooms, that best match their gender identity. The state then passed a law prohibiting such local ordinances. In terms of governmental authority, should cities be allowed to adopt such policies or should the state government ban such ordinances?
Cities should be allowed to pass such policies ...................242................................ 38.90% State should prohibit cities from passing such ordinances .305 ............................... 49.20% Don't know ...........................................................................68................................. 10.90% Refuse ...................................................................................6.................................... 0.90% N= .......................................................................................621.............................. 100.00% Minimum wage
What do you think the minimum hourly wage in North Carolina should be? [open-ended] <$7.25 ...........................................................9............................................................ 1.60% $7.25 ............................................................57......................................................... 10.40% >$7.25 to $9.99 ...........................................125........................................................ 22.80% $10 ..............................................................150........................................................ 27.40% >$10 to $14.99 ............................................110........................................................ 20.10% $15 or more ..................................................97......................................................... 17.70% N= ...............................................................547...................................................... 100.00%
http://www.elon.edu/elonpoll || facebook.com/elonpoll || @elonpoll
Page 12 of 44 April 10 - 15, 2016
Minimum wage 2 Should cities and municipalities in North Carolina be able to create a local minimum hourly wage that is above the state's minimum? Or should state law require all cities to have the same minimum wage?
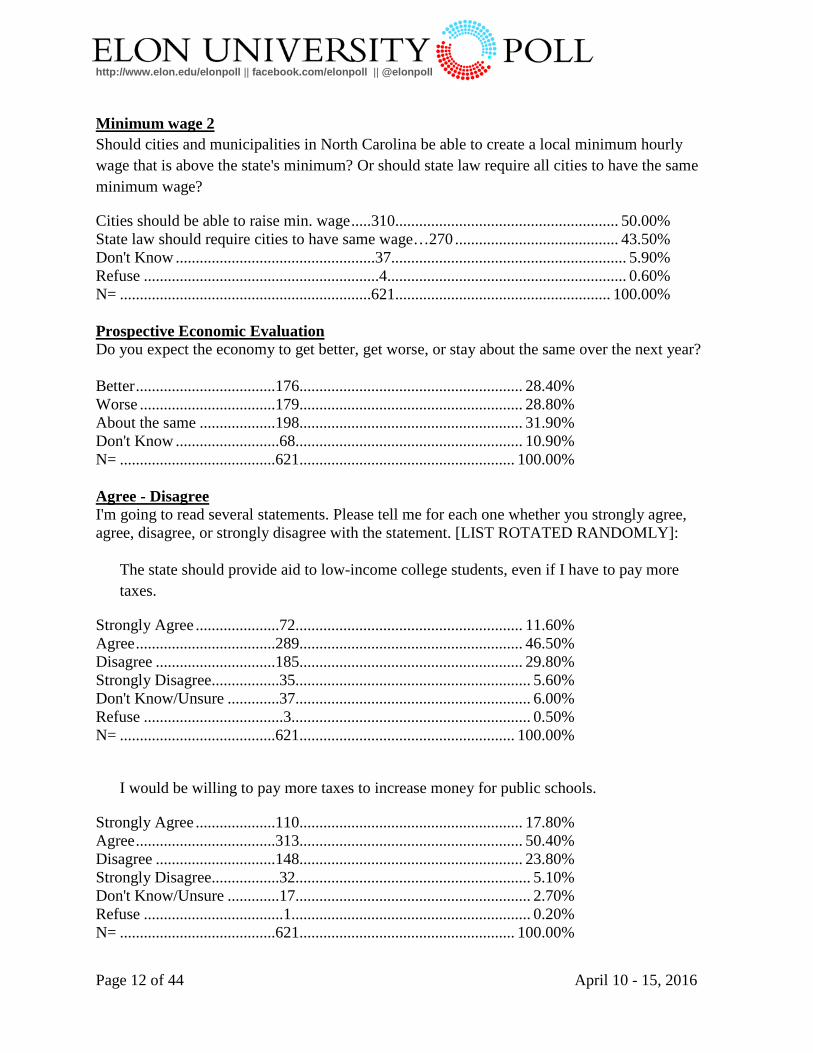
Cities should be able to raise min. wage .....310........................................................ 50.00% State law should require cities to have same wage…270 ......................................... 43.50% Don't Know ..................................................37........................................................... 5.90% Refuse ...........................................................4............................................................ 0.60% N= ...............................................................621...................................................... 100.00% Prospective Economic Evaluation Do you expect the economy to get better, get worse, or stay about the same over the next year? Better ...................................176........................................................ 28.40% Worse ..................................179........................................................ 28.80% About the same ...................198........................................................ 31.90% Don't Know ..........................68......................................................... 10.90% N= .......................................621...................................................... 100.00% Agree - Disagree I'm going to read several statements. Please tell me for each one whether you strongly agree, agree, disagree, or strongly disagree with the statement. [LIST ROTATED RANDOMLY]:
The state should provide aid to low-income college students, even if I have to pay more taxes.
Strongly Agree .....................72......................................................... 11.60% Agree ...................................289........................................................ 46.50% Disagree ..............................185........................................................ 29.80% Strongly Disagree.................35........................................................... 5.60% Don't Know/Unsure .............37........................................................... 6.00% Refuse ...................................3............................................................ 0.50% N= .......................................621...................................................... 100.00%
I would be willing to pay more taxes to increase money for public schools.
Strongly Agree ....................110........................................................ 17.80% Agree ...................................313........................................................ 50.40% Disagree ..............................148........................................................ 23.80% Strongly Disagree.................32........................................................... 5.10% Don't Know/Unsure .............17........................................................... 2.70% Refuse ...................................1............................................................ 0.20% N= .......................................621...................................................... 100.00%
http://www.elon.edu/elonpoll || facebook.com/elonpoll || @elonpoll
Page 13 of 44 April 10 - 15, 2016
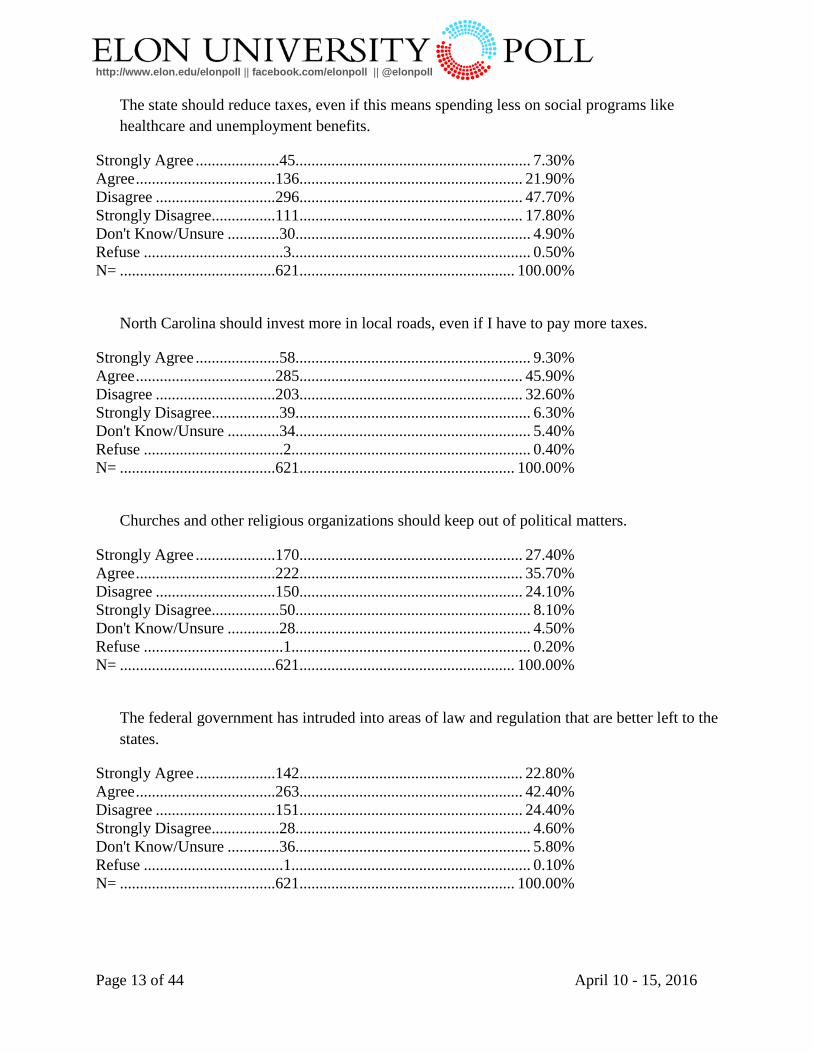
The state should reduce taxes, even if this means spending less on social programs like healthcare and unemployment benefits.
Strongly Agree .....................45........................................................... 7.30% Agree ...................................136........................................................ 21.90% Disagree ..............................296........................................................ 47.70% Strongly Disagree................111........................................................ 17.80% Don't Know/Unsure .............30........................................................... 4.90% Refuse ...................................3............................................................ 0.50% N= .......................................621...................................................... 100.00%
North Carolina should invest more in local roads, even if I have to pay more taxes.
Strongly Agree .....................58........................................................... 9.30% Agree ...................................285........................................................ 45.90% Disagree ..............................203........................................................ 32.60% Strongly Disagree.................39........................................................... 6.30% Don't Know/Unsure .............34........................................................... 5.40% Refuse ...................................2............................................................ 0.40% N= .......................................621...................................................... 100.00%
Churches and other religious organizations should keep out of political matters.
Strongly Agree ....................170........................................................ 27.40% Agree ...................................222........................................................ 35.70% Disagree ..............................150........................................................ 24.10% Strongly Disagree.................50........................................................... 8.10% Don't Know/Unsure .............28........................................................... 4.50% Refuse ...................................1............................................................ 0.20% N= .......................................621...................................................... 100.00%
The federal government has intruded into areas of law and regulation that are better left to the states.
Strongly Agree ....................142........................................................ 22.80% Agree ...................................263........................................................ 42.40% Disagree ..............................151........................................................ 24.40% Strongly Disagree.................28........................................................... 4.60% Don't Know/Unsure .............36........................................................... 5.80% Refuse ...................................1............................................................ 0.10% N= .......................................621...................................................... 100.00%
http://www.elon.edu/elonpoll || facebook.com/elonpoll || @elonpoll
Page 14 of 44 April 10 - 15, 2016
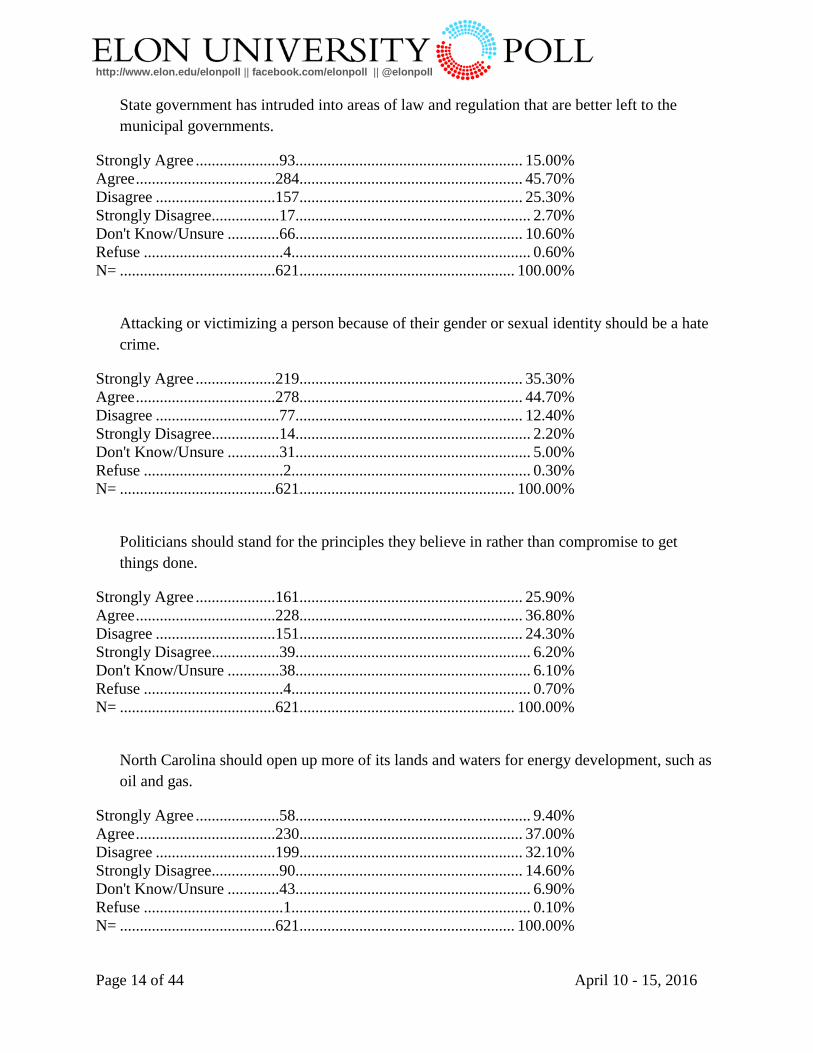
State government has intruded into areas of law and regulation that are better left to the municipal governments.
Strongly Agree .....................93......................................................... 15.00% Agree ...................................284........................................................ 45.70% Disagree ..............................157........................................................ 25.30% Strongly Disagree.................17........................................................... 2.70% Don't Know/Unsure .............66......................................................... 10.60% Refuse ...................................4............................................................ 0.60% N= .......................................621...................................................... 100.00%
Attacking or victimizing a person because of their gender or sexual identity should be a hate crime.
Strongly Agree ....................219........................................................ 35.30% Agree ...................................278........................................................ 44.70% Disagree ...............................77......................................................... 12.40% Strongly Disagree.................14........................................................... 2.20% Don't Know/Unsure .............31........................................................... 5.00% Refuse ...................................2............................................................ 0.30% N= .......................................621...................................................... 100.00%
Politicians should stand for the principles they believe in rather than compromise to get things done.
Strongly Agree ....................161........................................................ 25.90% Agree ...................................228........................................................ 36.80% Disagree ..............................151........................................................ 24.30% Strongly Disagree.................39........................................................... 6.20% Don't Know/Unsure .............38........................................................... 6.10% Refuse ...................................4............................................................ 0.70% N= .......................................621...................................................... 100.00%
North Carolina should open up more of its lands and waters for energy development, such as oil and gas.
Strongly Agree .....................58........................................................... 9.40% Agree ...................................230........................................................ 37.00% Disagree ..............................199........................................................ 32.10% Strongly Disagree.................90......................................................... 14.60% Don't Know/Unsure .............43........................................................... 6.90% Refuse ...................................1............................................................ 0.10% N= .......................................621...................................................... 100.00%
http://www.elon.edu/elonpoll || facebook.com/elonpoll || @elonpoll
Page 15 of 44 April 10 - 15, 2016
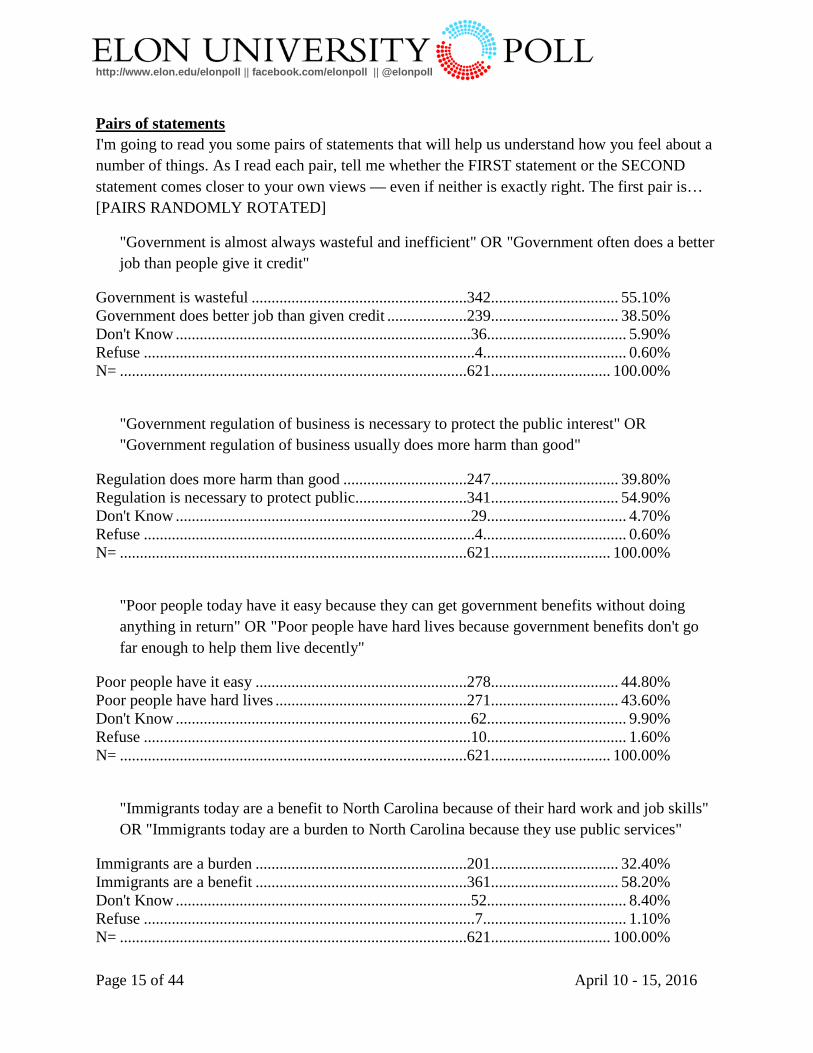
Pairs of statements I'm going to read you some pairs of statements that will help us understand how you feel about a number of things. As I read each pair, tell me whether the FIRST statement or the SECOND statement comes closer to your own views — even if neither is exactly right. The first pair is… [PAIRS RANDOMLY ROTATED]
"Government is almost always wasteful and inefficient" OR "Government often does a better job than people give it credit"
Government is wasteful ......................................................342................................ 55.10% Government does better job than given credit ....................239................................ 38.50% Don't Know ..........................................................................36................................... 5.90% Refuse ...................................................................................4.................................... 0.60% N= .......................................................................................621.............................. 100.00%
"Government regulation of business is necessary to protect the public interest" OR "Government regulation of business usually does more harm than good"
Regulation does more harm than good ...............................247................................ 39.80% Regulation is necessary to protect public............................341................................ 54.90% Don't Know ..........................................................................29................................... 4.70% Refuse ...................................................................................4.................................... 0.60% N= .......................................................................................621.............................. 100.00%
"Poor people today have it easy because they can get government benefits without doing anything in return" OR "Poor people have hard lives because government benefits don't go far enough to help them live decently"
Poor people have it easy .....................................................278................................ 44.80% Poor people have hard lives ................................................271................................ 43.60% Don't Know ..........................................................................62................................... 9.90% Refuse ..................................................................................10................................... 1.60% N= .......................................................................................621.............................. 100.00%
"Immigrants today are a benefit to North Carolina because of their hard work and job skills" OR "Immigrants today are a burden to North Carolina because they use public services"
Immigrants are a burden .....................................................201................................ 32.40% Immigrants are a benefit .....................................................361................................ 58.20% Don't Know ..........................................................................52................................... 8.40% Refuse ...................................................................................7.................................... 1.10% N= .......................................................................................621.............................. 100.00%
http://www.elon.edu/elonpoll || facebook.com/elonpoll || @elonpoll
Page 16 of 44 April 10 - 15, 2016
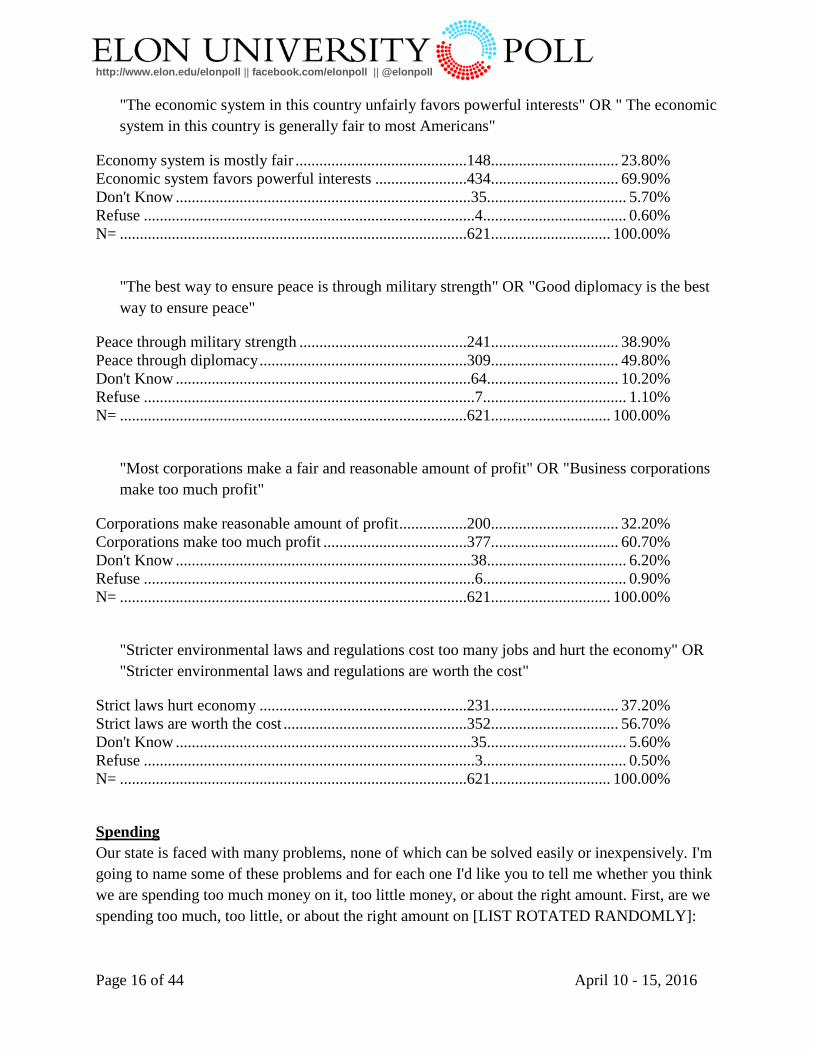
"The economic system in this country unfairly favors powerful interests" OR " The economic system in this country is generally fair to most Americans"
Economy system is mostly fair ...........................................148................................ 23.80% Economic system favors powerful interests .......................434................................ 69.90% Don't Know ..........................................................................35................................... 5.70% Refuse ...................................................................................4.................................... 0.60% N= .......................................................................................621.............................. 100.00%
"The best way to ensure peace is through military strength" OR "Good diplomacy is the best way to ensure peace"
Peace through military strength ..........................................241................................ 38.90% Peace through diplomacy ....................................................309................................ 49.80% Don't Know ..........................................................................64................................. 10.20% Refuse ...................................................................................7.................................... 1.10% N= .......................................................................................621.............................. 100.00%
"Most corporations make a fair and reasonable amount of profit" OR "Business corporations make too much profit"
Corporations make reasonable amount of profit .................200................................ 32.20% Corporations make too much profit ....................................377................................ 60.70% Don't Know ..........................................................................38................................... 6.20% Refuse ...................................................................................6.................................... 0.90% N= .......................................................................................621.............................. 100.00%
"Stricter environmental laws and regulations cost too many jobs and hurt the economy" OR "Stricter environmental laws and regulations are worth the cost"
Strict laws hurt economy ....................................................231................................ 37.20% Strict laws are worth the cost ..............................................352................................ 56.70% Don't Know ..........................................................................35................................... 5.60% Refuse ...................................................................................3.................................... 0.50% N= .......................................................................................621.............................. 100.00%
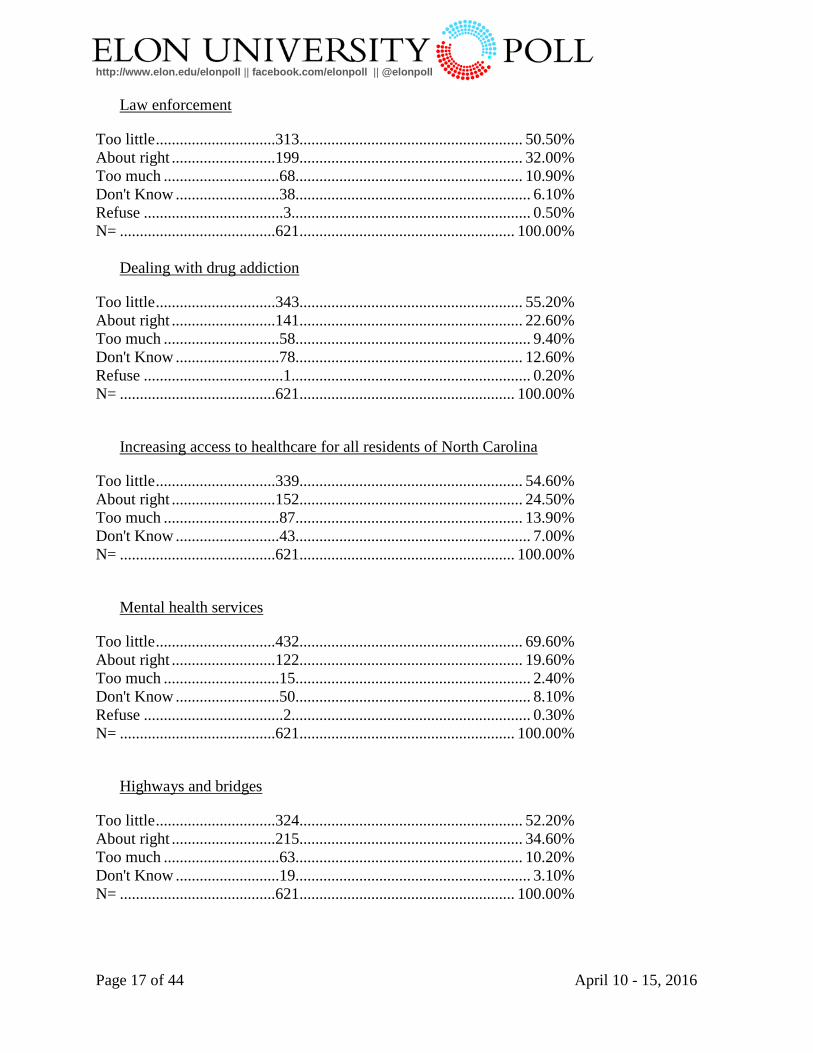
Spending Our state is faced with many problems, none of which can be solved easily or inexpensively. I'm going to name some of these problems and for each one I'd like you to tell me whether you think we are spending too much money on it, too little money, or about the right amount. First, are we spending too much, too little, or about the right amount on [LIST ROTATED RANDOMLY]:
http://www.elon.edu/elonpoll || facebook.com/elonpoll || @elonpoll
Page 17 of 44 April 10 - 15, 2016
Law enforcement
Too little ..............................313........................................................ 50.50% About right ..........................199........................................................ 32.00% Too much .............................68......................................................... 10.90% Don't Know ..........................38........................................................... 6.10% Refuse ...................................3............................................................ 0.50% N= .......................................621...................................................... 100.00%
Dealing with drug addiction
Too little ..............................343........................................................ 55.20% About right ..........................141........................................................ 22.60% Too much .............................58........................................................... 9.40% Don't Know ..........................78......................................................... 12.60% Refuse ...................................1............................................................ 0.20% N= .......................................621...................................................... 100.00%
Increasing access to healthcare for all residents of North Carolina
Too little ..............................339........................................................ 54.60% About right ..........................152........................................................ 24.50% Too much .............................87......................................................... 13.90% Don't Know ..........................43........................................................... 7.00% N= .......................................621...................................................... 100.00%
Mental health services
Too little ..............................432........................................................ 69.60% About right ..........................122........................................................ 19.60% Too much .............................15........................................................... 2.40% Don't Know ..........................50........................................................... 8.10% Refuse ...................................2............................................................ 0.30% N= .......................................621...................................................... 100.00%
Highways and bridges
Too little ..............................324........................................................ 52.20% About right ..........................215........................................................ 34.60% Too much .............................63......................................................... 10.20% Don't Know ..........................19........................................................... 3.10% N= .......................................621...................................................... 100.00%
http://www.elon.edu/elonpoll || facebook.com/elonpoll || @elonpoll
Page 18 of 44 April 10 - 15, 2016
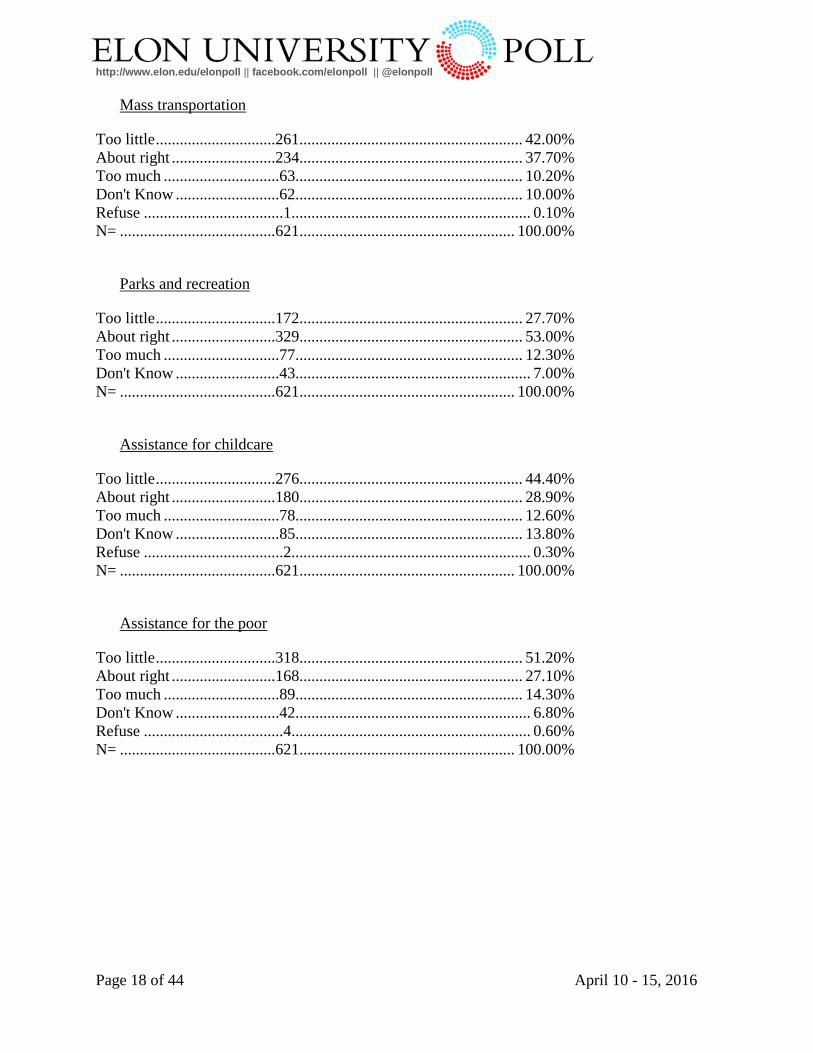
Mass transportation
Too little ..............................261........................................................ 42.00% About right ..........................234........................................................ 37.70% Too much .............................63......................................................... 10.20% Don't Know ..........................62......................................................... 10.00% Refuse ...................................1............................................................ 0.10% N= .......................................621...................................................... 100.00%
Parks and recreation
Too little ..............................172........................................................ 27.70% About right ..........................329........................................................ 53.00% Too much .............................77......................................................... 12.30% Don't Know ..........................43........................................................... 7.00% N= .......................................621...................................................... 100.00%
Assistance for childcare
Too little ..............................276........................................................ 44.40% About right ..........................180........................................................ 28.90% Too much .............................78......................................................... 12.60% Don't Know ..........................85......................................................... 13.80% Refuse ...................................2............................................................ 0.30% N= .......................................621...................................................... 100.00%
Assistance for the poor
Too little ..............................318........................................................ 51.20% About right ..........................168........................................................ 27.10% Too much .............................89......................................................... 14.30% Don't Know ..........................42........................................................... 6.80% Refuse ...................................4............................................................ 0.60% N= .......................................621...................................................... 100.00%
http://www.elon.edu/elonpoll || facebook.com/elonpoll || @elonpoll
Page 19 of 44 April 10 - 15, 2016
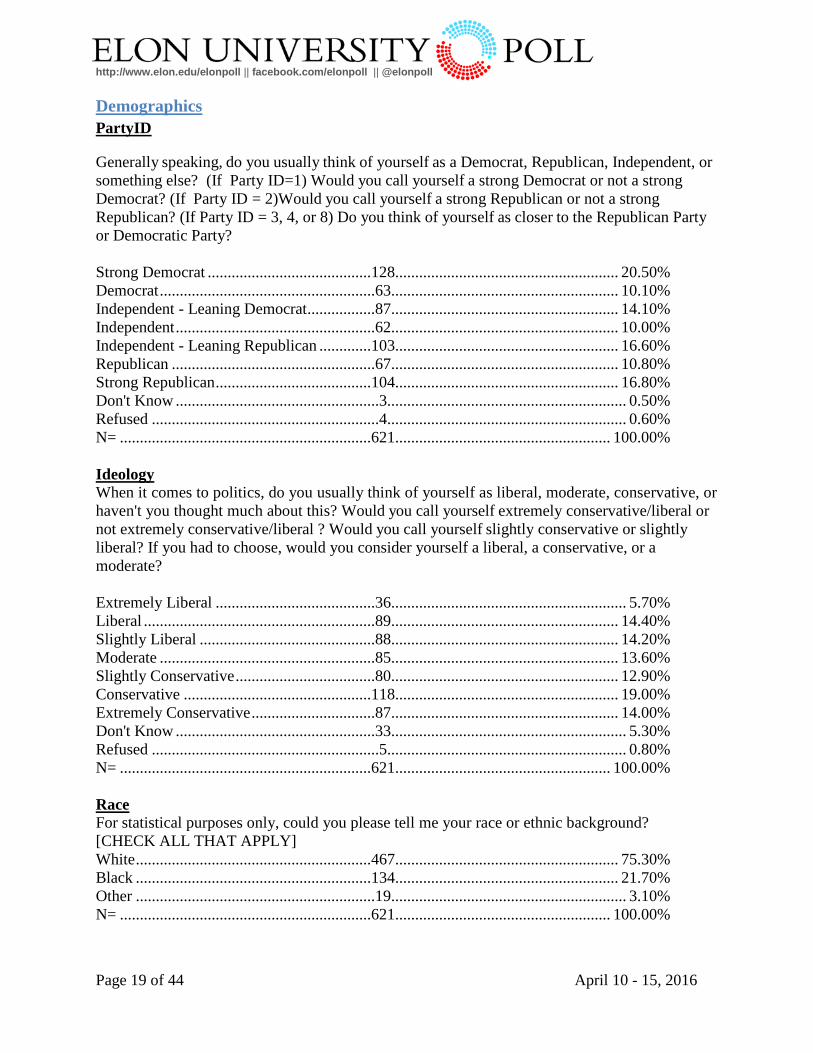
Demographics PartyID
Generally speaking, do you usually think of yourself as a Democrat, Republican, Independent, or something else? (If Party ID=1) Would you call yourself a strong Democrat or not a strong Democrat? (If Party ID = 2)Would you call yourself a strong Republican or not a strong Republican? (If Party ID = 3, 4, or 8) Do you think of yourself as closer to the Republican Party or Democratic Party? Strong Democrat .........................................128........................................................ 20.50% Democrat ......................................................63......................................................... 10.10% Independent - Leaning Democrat .................87......................................................... 14.10% Independent ..................................................62......................................................... 10.00% Independent - Leaning Republican .............103........................................................ 16.60% Republican ...................................................67......................................................... 10.80% Strong Republican .......................................104........................................................ 16.80% Don't Know ...................................................3............................................................ 0.50% Refused .........................................................4............................................................ 0.60% N= ...............................................................621...................................................... 100.00% Ideology When it comes to politics, do you usually think of yourself as liberal, moderate, conservative, or haven't you thought much about this? Would you call yourself extremely conservative/liberal or not extremely conservative/liberal ? Would you call yourself slightly conservative or slightly liberal? If you had to choose, would you consider yourself a liberal, a conservative, or a moderate? Extremely Liberal ........................................36........................................................... 5.70% Liberal ..........................................................89......................................................... 14.40% Slightly Liberal ............................................88......................................................... 14.20% Moderate ......................................................85......................................................... 13.60% Slightly Conservative ...................................80......................................................... 12.90% Conservative ...............................................118........................................................ 19.00% Extremely Conservative ...............................87......................................................... 14.00% Don't Know ..................................................33........................................................... 5.30% Refused .........................................................5............................................................ 0.80% N= ...............................................................621...................................................... 100.00% Race For statistical purposes only, could you please tell me your race or ethnic background? [CHECK ALL THAT APPLY] White ...........................................................467........................................................ 75.30% Black ...........................................................134........................................................ 21.70% Other ............................................................19........................................................... 3.10% N= ...............................................................621...................................................... 100.00%
http://www.elon.edu/elonpoll || facebook.com/elonpoll || @elonpoll
Page 20 of 44 April 10 - 15, 2016
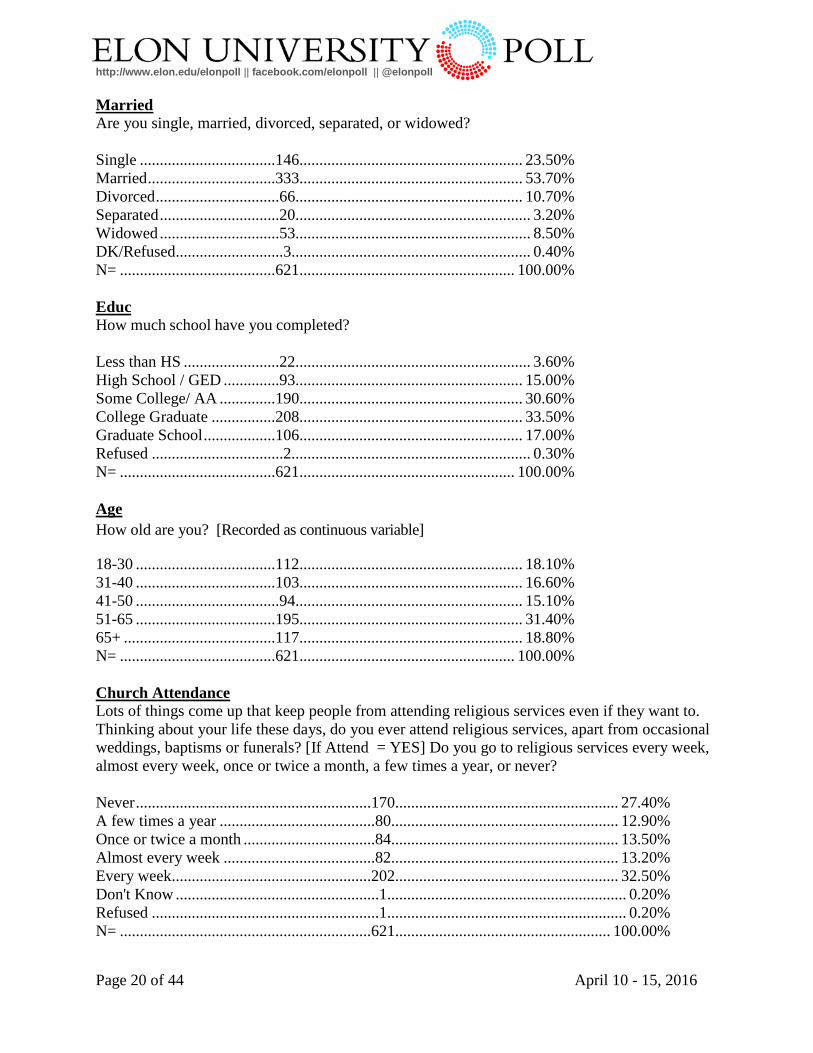
Married Are you single, married, divorced, separated, or widowed? Single ..................................146........................................................ 23.50% Married ................................333........................................................ 53.70% Divorced ...............................66......................................................... 10.70% Separated ..............................20........................................................... 3.20% Widowed ..............................53........................................................... 8.50% DK/Refused...........................3............................................................ 0.40% N= .......................................621...................................................... 100.00% Educ How much school have you completed? Less than HS ........................22........................................................... 3.60% High School / GED ..............93......................................................... 15.00% Some College/ AA ..............190........................................................ 30.60% College Graduate ................208........................................................ 33.50% Graduate School ..................106........................................................ 17.00% Refused .................................2............................................................ 0.30% N= .......................................621...................................................... 100.00% Age How old are you? [Recorded as continuous variable]
18-30 ...................................112........................................................ 18.10% 31-40 ...................................103........................................................ 16.60% 41-50 ....................................94......................................................... 15.10% 51-65 ...................................195........................................................ 31.40% 65+ ......................................117........................................................ 18.80% N= .......................................621...................................................... 100.00% Church Attendance Lots of things come up that keep people from attending religious services even if they want to. Thinking about your life these days, do you ever attend religious services, apart from occasional weddings, baptisms or funerals? [If Attend = YES] Do you go to religious services every week, almost every week, once or twice a month, a few times a year, or never? Never ...........................................................170........................................................ 27.40% A few times a year .......................................80......................................................... 12.90% Once or twice a month .................................84......................................................... 13.50% Almost every week ......................................82......................................................... 13.20% Every week..................................................202........................................................ 32.50% Don't Know ...................................................1............................................................ 0.20% Refused .........................................................1............................................................ 0.20% N= ...............................................................621...................................................... 100.00%
http://www.elon.edu/elonpoll || facebook.com/elonpoll || @elonpoll
Page 21 of 44 April 10 - 15, 2016
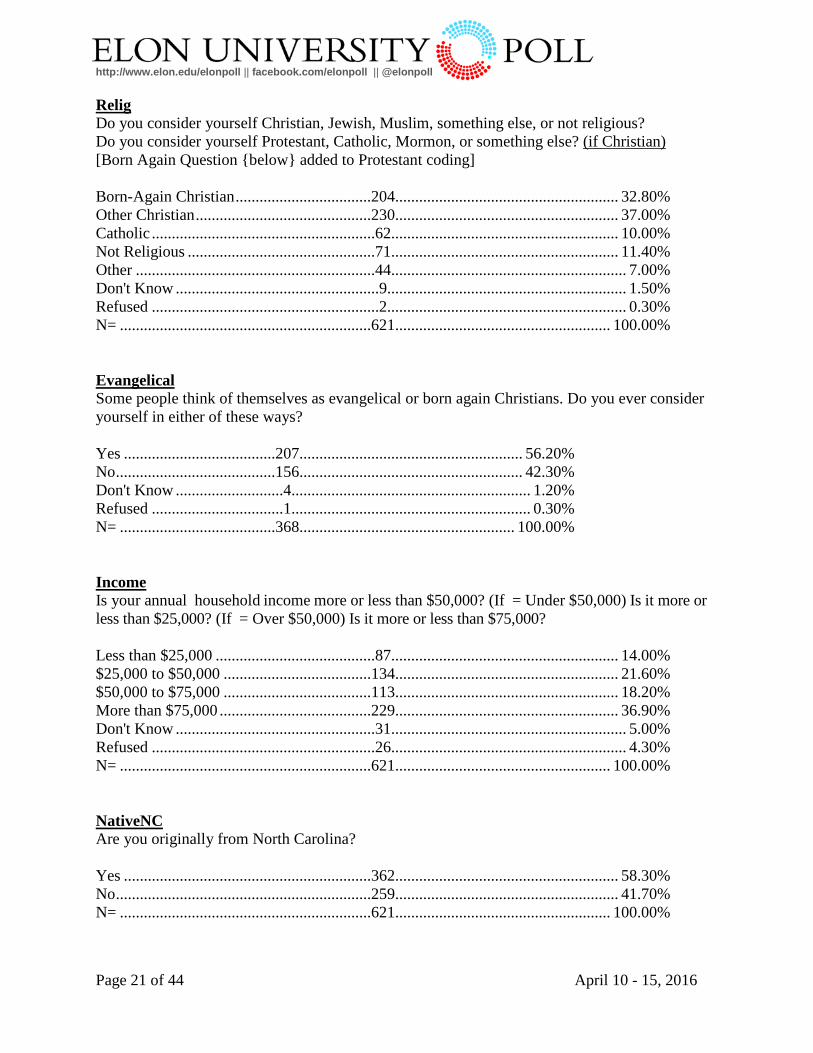
Relig Do you consider yourself Christian, Jewish, Muslim, something else, or not religious? Do you consider yourself Protestant, Catholic, Mormon, or something else? (if Christian) [Born Again Question {below} added to Protestant coding] Born-Again Christian ..................................204........................................................ 32.80% Other Christian ............................................230........................................................ 37.00% Catholic ........................................................62......................................................... 10.00% Not Religious ...............................................71......................................................... 11.40% Other ............................................................44........................................................... 7.00% Don't Know ...................................................9............................................................ 1.50% Refused .........................................................2............................................................ 0.30% N= ...............................................................621...................................................... 100.00% Evangelical Some people think of themselves as evangelical or born again Christians. Do you ever consider yourself in either of these ways? Yes ......................................207........................................................ 56.20% No ........................................156........................................................ 42.30% Don't Know ...........................4............................................................ 1.20% Refused .................................1............................................................ 0.30% N= .......................................368...................................................... 100.00% Income Is your annual household income more or less than $50,000? (If = Under $50,000) Is it more or less than $25,000? (If = Over $50,000) Is it more or less than $75,000? Less than $25,000 ........................................87......................................................... 14.00% $25,000 to $50,000 .....................................134........................................................ 21.60% $50,000 to $75,000 .....................................113........................................................ 18.20% More than $75,000 ......................................229........................................................ 36.90% Don't Know ..................................................31........................................................... 5.00% Refused ........................................................26........................................................... 4.30% N= ...............................................................621...................................................... 100.00% NativeNC Are you originally from North Carolina? Yes ..............................................................362........................................................ 58.30% No ................................................................259........................................................ 41.70% N= ...............................................................621...................................................... 100.00%
http://www.elon.edu/elonpoll || facebook.com/elonpoll || @elonpoll
Page 22 of 44 April 10 - 15, 2016
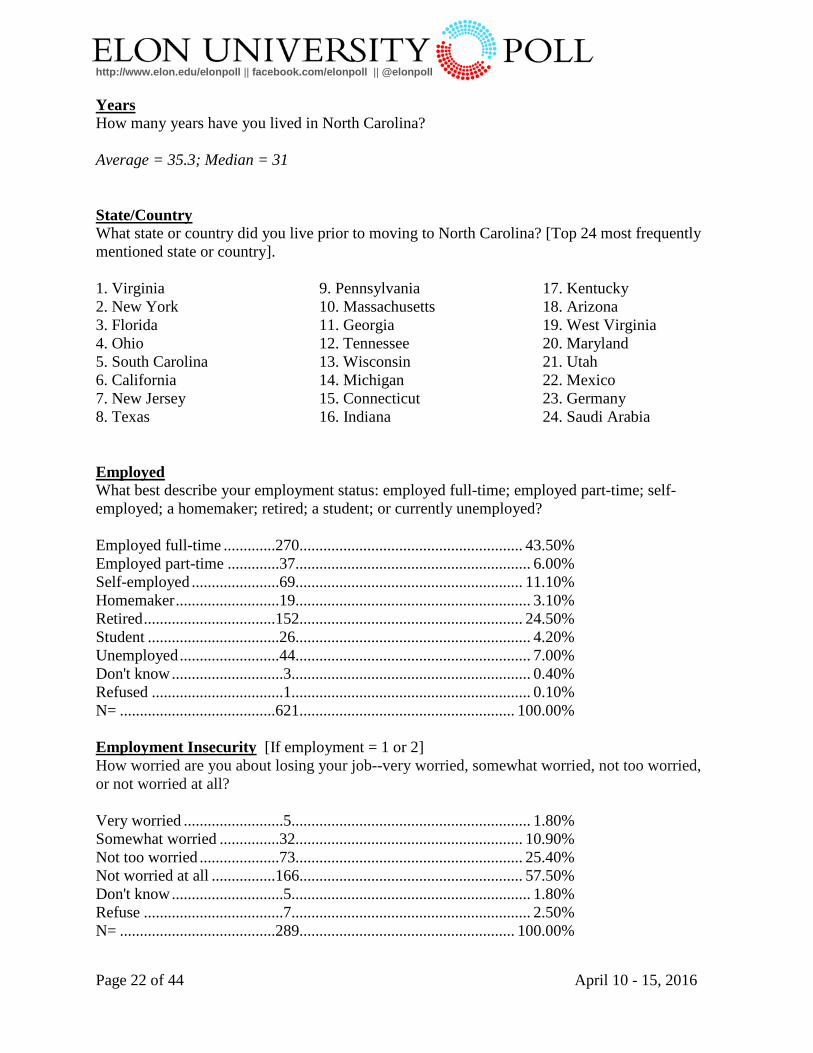
Years How many years have you lived in North Carolina? Average = 35.3; Median = 31 State/Country What state or country did you live prior to moving to North Carolina? [Top 24 most frequently mentioned state or country]. 1. Virginia 2. New York 3. Florida 4. Ohio 5. South Carolina 6. California 7. New Jersey 8. Texas
9. Pennsylvania 10. Massachusetts 11. Georgia 12. Tennessee 13. Wisconsin 14. Michigan 15. Connecticut 16. Indiana
17. Kentucky 18. Arizona 19. West Virginia 20. Maryland 21. Utah 22. Mexico 23. Germany 24. Saudi Arabia
Employed What best describe your employment status: employed full-time; employed part-time; self-employed; a homemaker; retired; a student; or currently unemployed? Employed full-time .............270........................................................ 43.50% Employed part-time .............37........................................................... 6.00% Self-employed ......................69......................................................... 11.10% Homemaker ..........................19........................................................... 3.10% Retired .................................152........................................................ 24.50% Student .................................26........................................................... 4.20% Unemployed .........................44........................................................... 7.00% Don't know ............................3............................................................ 0.40% Refused .................................1............................................................ 0.10% N= .......................................621...................................................... 100.00% Employment Insecurity [If employment = 1 or 2] How worried are you about losing your job--very worried, somewhat worried, not too worried, or not worried at all? Very worried .........................5............................................................ 1.80% Somewhat worried ...............32......................................................... 10.90% Not too worried ....................73......................................................... 25.40% Not worried at all ................166........................................................ 57.50% Don't know ............................5............................................................ 1.80% Refuse ...................................7............................................................ 2.50% N= .......................................289...................................................... 100.00%
http://www.elon.edu/elonpoll || facebook.com/elonpoll || @elonpoll
Page 23 of 44 April 10 - 15, 2016
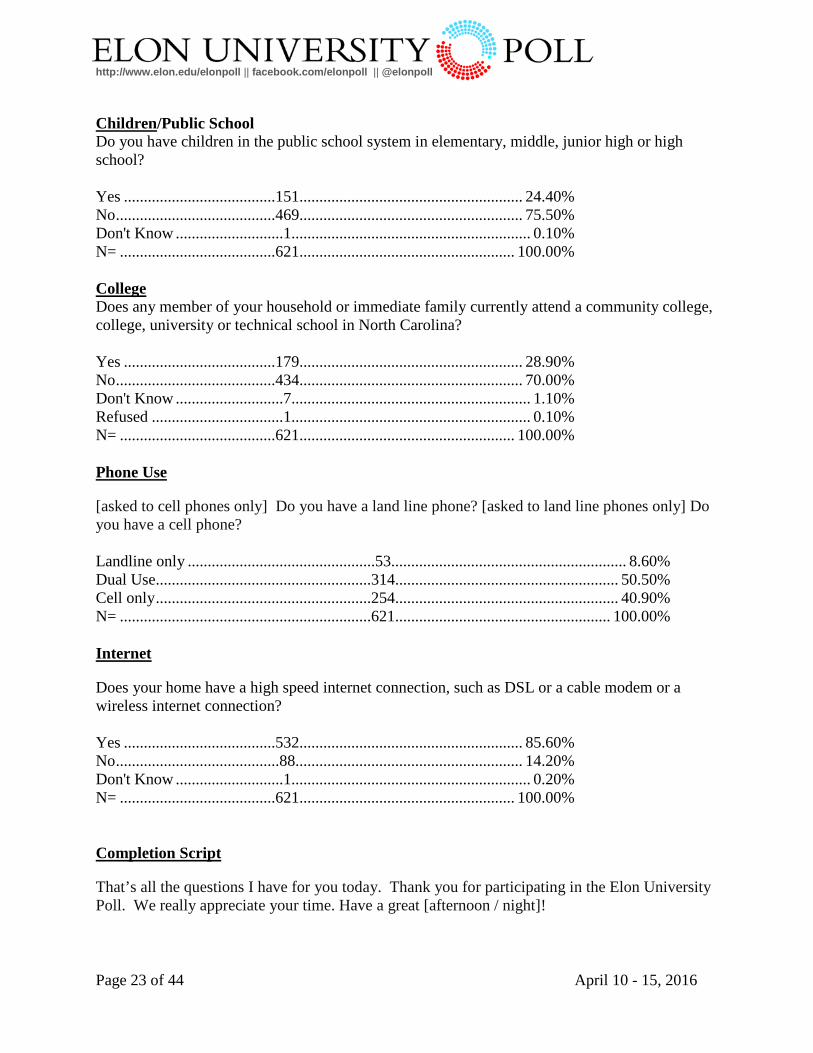
Children/Public School Do you have children in the public school system in elementary, middle, junior high or high school? Yes ......................................151........................................................ 24.40% No ........................................469........................................................ 75.50% Don't Know ...........................1............................................................ 0.10% N= .......................................621...................................................... 100.00% College Does any member of your household or immediate family currently attend a community college, college, university or technical school in North Carolina? Yes ......................................179........................................................ 28.90% No ........................................434........................................................ 70.00% Don't Know ...........................7............................................................ 1.10% Refused .................................1............................................................ 0.10% N= .......................................621...................................................... 100.00% Phone Use
[asked to cell phones only] Do you have a land line phone? [asked to land line phones only] Do you have a cell phone? Landline only ...............................................53........................................................... 8.60% Dual Use......................................................314........................................................ 50.50% Cell only ......................................................254........................................................ 40.90% N= ...............................................................621...................................................... 100.00% Internet
Does your home have a high speed internet connection, such as DSL or a cable modem or a wireless internet connection? Yes ......................................532........................................................ 85.60% No .........................................88......................................................... 14.20% Don't Know ...........................1............................................................ 0.20% N= .......................................621...................................................... 100.00% Completion Script
That’s all the questions I have for you today. Thank you for participating in the Elon University Poll. We really appreciate your time. Have a great [afternoon / night]!
http://www.elon.edu/elonpoll || facebook.com/elonpoll || @elonpoll
Page 24 of 44 April 10 - 15, 2016
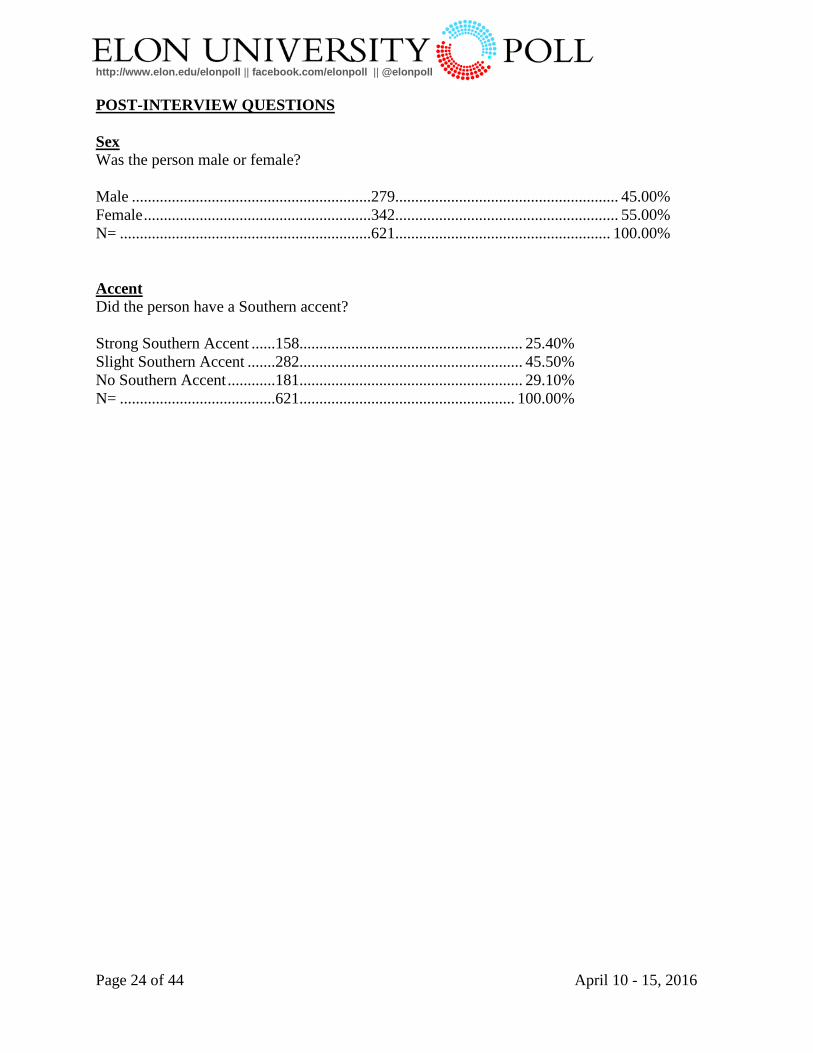
POST-INTERVIEW QUESTIONS Sex Was the person male or female? Male ............................................................279........................................................ 45.00% Female .........................................................342........................................................ 55.00% N= ...............................................................621...................................................... 100.00% Accent Did the person have a Southern accent? Strong Southern Accent ......158........................................................ 25.40% Slight Southern Accent .......282........................................................ 45.50% No Southern Accent ............181........................................................ 29.10% N= .......................................621...................................................... 100.00%
http://www.elon.edu/elonpoll || facebook.com/elonpoll || @elonpoll
Page 25 of 44 April 10 - 15, 2016
Cross Tabulations
Cross-Tabs Approval Obama Approval
Approve Disapprove Don't know Refused Total % % % % %
Democrats 86 8 6 0 100 Independents 37 48 14 1 100 Republicans 4 90 5 1 100 Don't Know / Refused 28 61 10 0 100 Total 43 47 9 1 100
Approve Disapprove Don't know Refused Total % % % % %
White 30 61 9 0 100 Black 87 3 8 2 100 Other 61 25 14 0 100 Total 43 47 9 1 100
Approve Disapprove Don't know Refused Total % % % % %
Male 39 55 6 0 100 Female 47 41 11 1 100 Total 43 47 9 1 100
Approval of Congress Approve Disapprove Don't know Refused Total % % % % %
Democrats 9 83 7 0 100 Independents 7 82 9 1 100 Republicans 10 77 13 0 100 Don't Know / Refused 18 52 30 0 100 Total 9 81 10 0 100
Approve Disapprove Don't know Refused Total % % % % %
White 7 81 11 0 100 Black 13 77 8 2 100 Other 10 90 0 0 100 Total 9 81 10 0 100
Approve Disapprove Don't know Refused Total % % % % %
Male 10 83 7 0 100 Female 8 79 13 1 100 Total 9 81 10 0 100
http://www.elon.edu/elonpoll || facebook.com/elonpoll || @elonpoll
Page 26 of 44 April 10 - 15, 2016
McCrory Approval
Approve Disapprove Don't know Total % % % %
Democrats 12 78 10 100 Independents 35 47 19 100 Republicans 68 21 11 100 Don't Know / Refused 41 48 10 100 Total 37 49 14 100
Approve Disapprove Don't know Total % % % %
White 41 45 14 100 Black 25 63 12 100 Other 34 47 19 100 Total 37 49 14 100
Approve Disapprove Don't know Total % % % %
Male 48 43 9 100 Female 28 54 17 100 Total 37 49 14 100
NCGA Approval Approve Disapprove Don't know Refused Total % % % % %
Democrats 15 69 16 0 100 Independents 31 49 21 0 100 Republicans 51 27 21 1 100 Don't Know / Refused 9 20 45 26 100 Total 31 49 19 1 100
Approve Disapprove Don't know Refused Total % % % % %
White 34 45 20 1 100 Black 21 59 19 0 100 Other 25 59 16 0 100 Total 31 49 19 1 100
Approve Disapprove Don't know Refused Total % % % % %
Male 41 45 13 1 100 Female 23 52 24 1 100 Total 31 49 19 1 100
http://www.elon.edu/elonpoll || facebook.com/elonpoll || @elonpoll
Page 27 of 44 April 10 - 15, 2016
Tillis Approval Approve Disapprove Don't know Refused Total % % % % %
Democrats 18 55 27 0 100 Independents 22 43 35 1 100 Republicans 48 17 34 1 100 Don't Know / Refused 29 23 30 18 100 Total 28 39 32 1 100
Approve Disapprove Don't know Refused Total % % % % %
White 29 35 35 1 100 Black 27 48 25 0 100 Other 15 67 18 0 100 Total 28 39 32 1 100
Approve Disapprove Don't know Refused Total % % % % %
Male 32 42 25 0 100 Female 25 37 37 1 100 Total 28 39 32 1 100
Burr Approval Approve Disapprove Don't know Refused Total % % % % %
Democrats 12 55 32 0 100 Independents 27 42 30 0 100 Republicans 50 25 24 1 100 Don't Know / Refused 29 23 30 18 100 Total 29 41 29 1 100
Approve Disapprove Don't know Refused Total % % % % %
White 32 38 28 1 100 Black 18 49 32 0 100 Other 17 61 22 0 100 Total 29 41 29 1 100
Approve Disapprove Don't know Refused Total % % % % %
Male 32 45 23 1 100 Female 27 39 34 1 100 Total 29 41 29 1 100
http://www.elon.edu/elonpoll || facebook.com/elonpoll || @elonpoll
Page 28 of 44 April 10 - 15, 2016
Cooper Approval Approve Disapprove Don't know Refused Total % % % % %
Democrats 56 15 29 0 100 Independents 39 27 33 1 100 Republicans 33 40 27 0 100 Don't Know / Refused 55 14 30 0 100 Total 43 27 30 0 100
Approve Disapprove Don't know Refused Total % % % % %
White 41 27 31 1 100 Black 50 23 27 0 100 Other 44 36 20 0 100 Total 43 27 30 0 100
Approve Disapprove Don't know Refused Total % % % % %
Male 39 34 26 1 100 Female 46 21 34 0 100 Total 43 27 30 0 100
http://www.elon.edu/elonpoll || facebook.com/elonpoll || @elonpoll
Page 29 of 44 April 10 - 15, 2016
Cross-Tabs Clinton vs. Trump Clinton vs Trump
Hillary Clinton
Donald Trump
Neither/Someone else
Don't Know
Total
% % % % % Democrats 87 5 7 1 100 Independents 41 35 20 4 100 Republicans 5 82 11 1 100 Don't Know / Refused
8 43 10 38 100
Total 45 39 14 3 100 Hillary
Clinton Donald Trump
Neither/Someone else
Don't Know
Total
% % % % % White 33 50 14 3 100 Black 86 5 8 1 100 Other 47 13 39 0 100 Total 45 39 14 3 100
Hillary Clinton
Donald Trump
Neither/Someone else
Don't Know
Total
% % % % % Male 39 47 13 1 100 Female 50 32 14 4 100 Total 45 39 14 3 100
http://www.elon.edu/elonpoll || facebook.com/elonpoll || @elonpoll
Page 30 of 44 April 10 - 15, 2016
Cross-Tabs Clinton vs. Cruz Clinton vs. Cruz
Hillary Clinton
Ted Cruz
Neither/Someone else
Don't Know
Total
% % % % % Democrats 85 6 8 2 100 Independents 35 43 20 3 100 Republicans 3 87 9 1 100 Don't Know / Refused
28 61 10 0 100
Total 41 44 13 2 100 Hillary
Clinton Ted Cruz
Neither/Someone else
Don't Know
Total
% % % % % White 31 54 13 2 100 Black 78 10 11 1 100 Other 37 21 42 0 100 Total 41 44 13 2 100
Hillary Clinton
Ted Cruz
Neither/Someone else
Don't Know
Total
% % % % % Male 35 50 14 1 100 Female 46 39 12 3 100 Total 41 44 13 2 100
http://www.elon.edu/elonpoll || facebook.com/elonpoll || @elonpoll
Page 31 of 44 April 10 - 15, 2016
Cross-Tabs Sanders vs. Trump Sanders vs. Trump
Bernie Sanders
Donald Trump
Neither/Someone else
Don't Know
Total
% % % % % Democrats 87 6 8 0 100 Independents 51 32 14 2 100 Republicans 12 80 7 1 100 Don't Know / Refused
28 43 28 0 100
Total 51 38 10 1 100 Bernie
Sanders Donald Trump
Neither/Someone else
Don't Know
Total
% % % % % White 40 48 10 1 100 Black 83 5 12 0 100 Other 79 10 11 0 100 Total 51 38 10 1 100
Bernie Sanders
Donald Trump
Neither/Someone else
Don't Know
Total
% % % % % Male 43 45 11 1 100 Female 57 32 10 1 100 Total 51 38 10 1 100
http://www.elon.edu/elonpoll || facebook.com/elonpoll || @elonpoll
Page 32 of 44 April 10 - 15, 2016
Cross-Tabs Sanders vs. Trump Sanders vs. Cruz
Bernie Sanders
Ted Cruz
Neither/Someone else
Don't Know
Total
% % % % % Democrats 85 6 9 0 100 Independents 51 32 15 2 100 Republicans 8 85 6 0 100 Don't Know / Refused
8 41 30 20 100
Total 49 39 11 1 100 Bernie
Sanders Ted Cruz
Neither/Someone else
Don't Know
Total
% % % % % White 40 49 10 1 100 Black 75 10 13 2 100 Other 83 2 15 0 100 Total 49 39 11 1 100
Bernie Sanders
Ted Cruz
Neither/Someone else
Don't Know
Total
% % % % % Male 44 44 11 1 100 Female 54 35 11 1 100 Total 49 39 11 1 100

http://www.elon.edu/elonpoll || facebook.com/elonpoll || @elonpoll
Page 33 of 44 April 10 - 15, 2016
Cross-Tabs: McCrory vs Cooper Head-to-Head Cooper vs McCrory
Roy Cooper Pat McCrory Neither/Someone else
Don't Know
Total
% % % % % Democrats 89 5 4 3 100 Independents 44 41 7 7 100 Republicans 11 83 4 3 100 Don't Know / Refused
8 41 30 20 100
Total 48 41 6 5 100 Roy Cooper Pat McCrory Neither/Someone
else Don't Know
Total
% % % % % White 40 51 4 5 100 Black 74 12 11 4 100 Other 62 30 4 4 100 Total 48 41 6 5 100
Roy Cooper Pat McCrory Neither/Someone else
Don't Know
Total
% % % % % Male 41 51 4 3 100 Female 54 34 7 6 100 Total 48 41 6 5 100
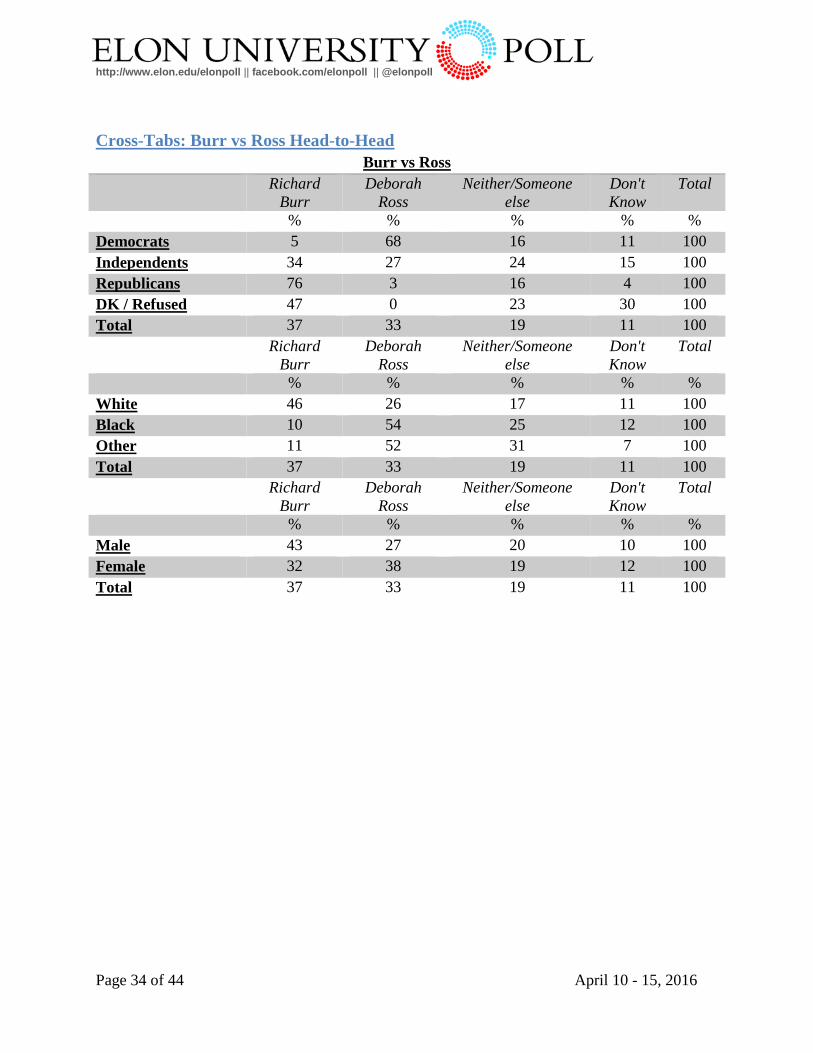
http://www.elon.edu/elonpoll || facebook.com/elonpoll || @elonpoll
Page 34 of 44 April 10 - 15, 2016
Cross-Tabs: Burr vs Ross Head-to-Head Burr vs Ross
Richard Burr
Deborah Ross
Neither/Someone else
Don't Know
Total
% % % % % Democrats 5 68 16 11 100 Independents 34 27 24 15 100 Republicans 76 3 16 4 100 DK / Refused 47 0 23 30 100 Total 37 33 19 11 100
Richard Burr
Deborah Ross
Neither/Someone else
Don't Know
Total
% % % % % White 46 26 17 11 100 Black 10 54 25 12 100 Other 11 52 31 7 100 Total 37 33 19 11 100
Richard Burr
Deborah Ross
Neither/Someone else
Don't Know
Total
% % % % % Male 43 27 20 10 100 Female 32 38 19 12 100 Total 37 33 19 11 100
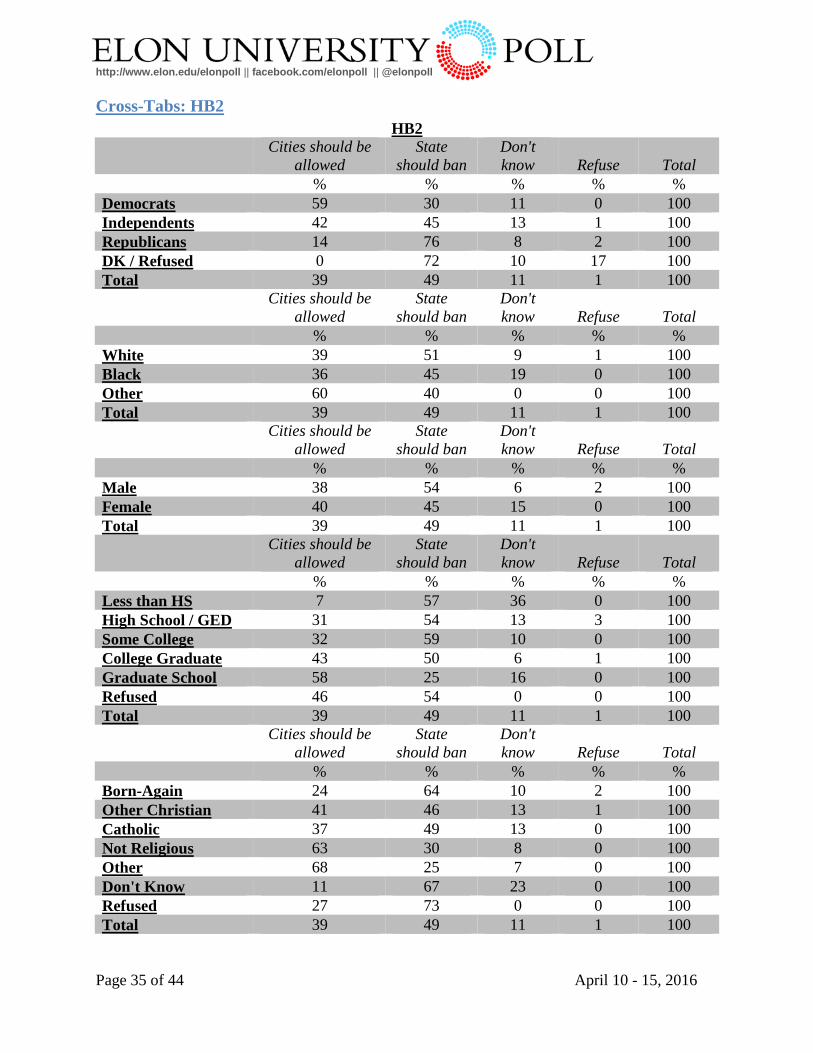
http://www.elon.edu/elonpoll || facebook.com/elonpoll || @elonpoll
Page 35 of 44 April 10 - 15, 2016
Cross-Tabs: HB2 HB2
Cities should be allowed
State should ban
Don't know Refuse Total
% % % % %
Democrats 59 30 11 0 100 Independents 42 45 13 1 100 Republicans 14 76 8 2 100 DK / Refused 0 72 10 17 100 Total 39 49 11 1 100
Cities should be allowed
State should ban
Don't know Refuse Total
% % % % %
White 39 51 9 1 100 Black 36 45 19 0 100 Other 60 40 0 0 100 Total 39 49 11 1 100
Cities should be allowed
State should ban
Don't know Refuse Total
% % % % %
Male 38 54 6 2 100 Female 40 45 15 0 100 Total 39 49 11 1 100
Cities should be allowed
State should ban
Don't know Refuse Total
% % % % %
Less than HS 7 57 36 0 100 High School / GED 31 54 13 3 100 Some College 32 59 10 0 100 College Graduate 43 50 6 1 100 Graduate School 58 25 16 0 100 Refused 46 54 0 0 100 Total 39 49 11 1 100
Cities should be allowed
State should ban
Don't know Refuse Total
% % % % %
Born-Again 24 64 10 2 100 Other Christian 41 46 13 1 100 Catholic 37 49 13 0 100 Not Religious 63 30 8 0 100 Other 68 25 7 0 100 Don't Know 11 67 23 0 100 Refused 27 73 0 0 100 Total 39 49 11 1 100
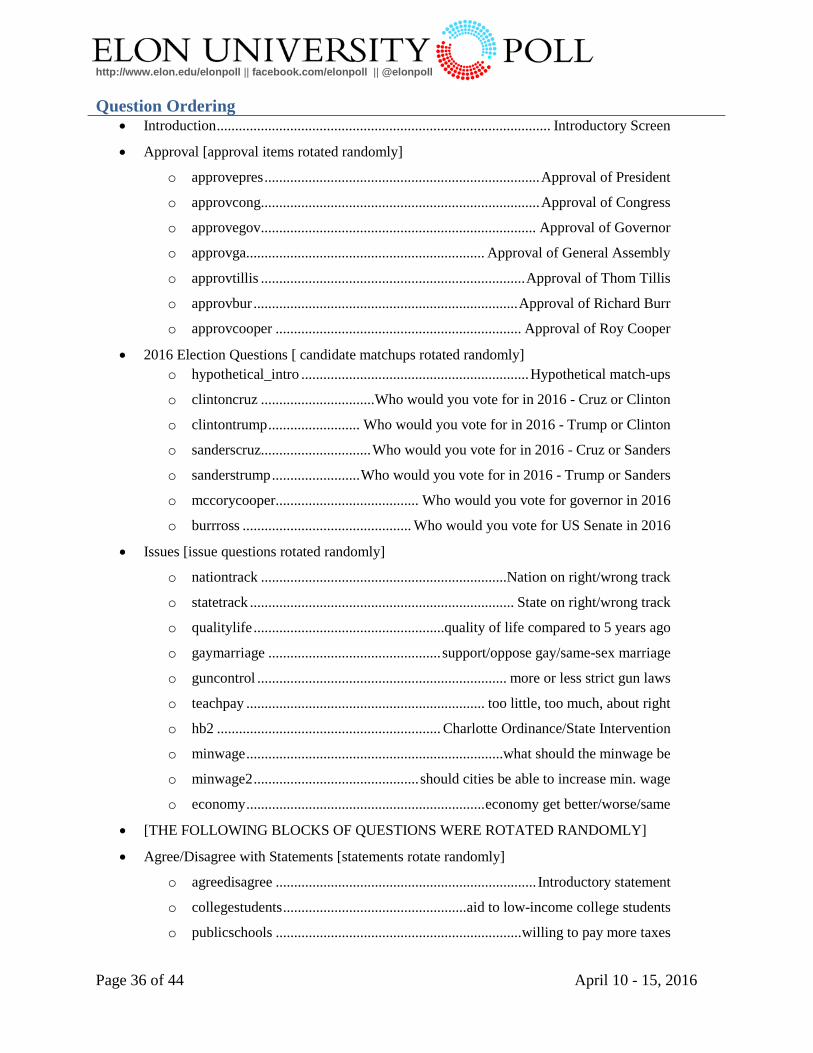
http://www.elon.edu/elonpoll || facebook.com/elonpoll || @elonpoll
Page 36 of 44 April 10 - 15, 2016
Question Ordering • Introduction ........................................................................................... Introductory Screen
• Approval [approval items rotated randomly]
o approvepres ........................................................................... Approval of President
o approvcong............................................................................ Approval of Congress
o approvegov........................................................................... Approval of Governor
o approvga................................................................. Approval of General Assembly
o approvtillis ........................................................................ Approval of Thom Tillis
o approvbur ........................................................................ Approval of Richard Burr
o approvcooper ................................................................... Approval of Roy Cooper
• 2016 Election Questions [ candidate matchups rotated randomly] o hypothetical_intro .............................................................. Hypothetical match-ups
o clintoncruz ............................... Who would you vote for in 2016 - Cruz or Clinton
o clintontrump ......................... Who would you vote for in 2016 - Trump or Clinton
o sanderscruz.............................. Who would you vote for in 2016 - Cruz or Sanders
o sanderstrump ........................ Who would you vote for in 2016 - Trump or Sanders
o mccorycooper ....................................... Who would you vote for governor in 2016
o burrross .............................................. Who would you vote for US Senate in 2016
• Issues [issue questions rotated randomly]
o nationtrack ...................................................................Nation on right/wrong track
o statetrack ........................................................................ State on right/wrong track
o qualitylife ....................................................quality of life compared to 5 years ago
o gaymarriage ............................................... support/oppose gay/same-sex marriage
o guncontrol .................................................................... more or less strict gun laws
o teachpay ................................................................. too little, too much, about right
o hb2 ............................................................. Charlotte Ordinance/State Intervention
o minwage ......................................................................what should the minwage be
o minwage2 ............................................. should cities be able to increase min. wage
o economy ................................................................. economy get better/worse/same
• [THE FOLLOWING BLOCKS OF QUESTIONS WERE ROTATED RANDOMLY]
• Agree/Disagree with Statements [statements rotate randomly]
o agreedisagree ....................................................................... Introductory statement
o collegestudents .................................................. aid to low-income college students
o publicschools ................................................................... willing to pay more taxes
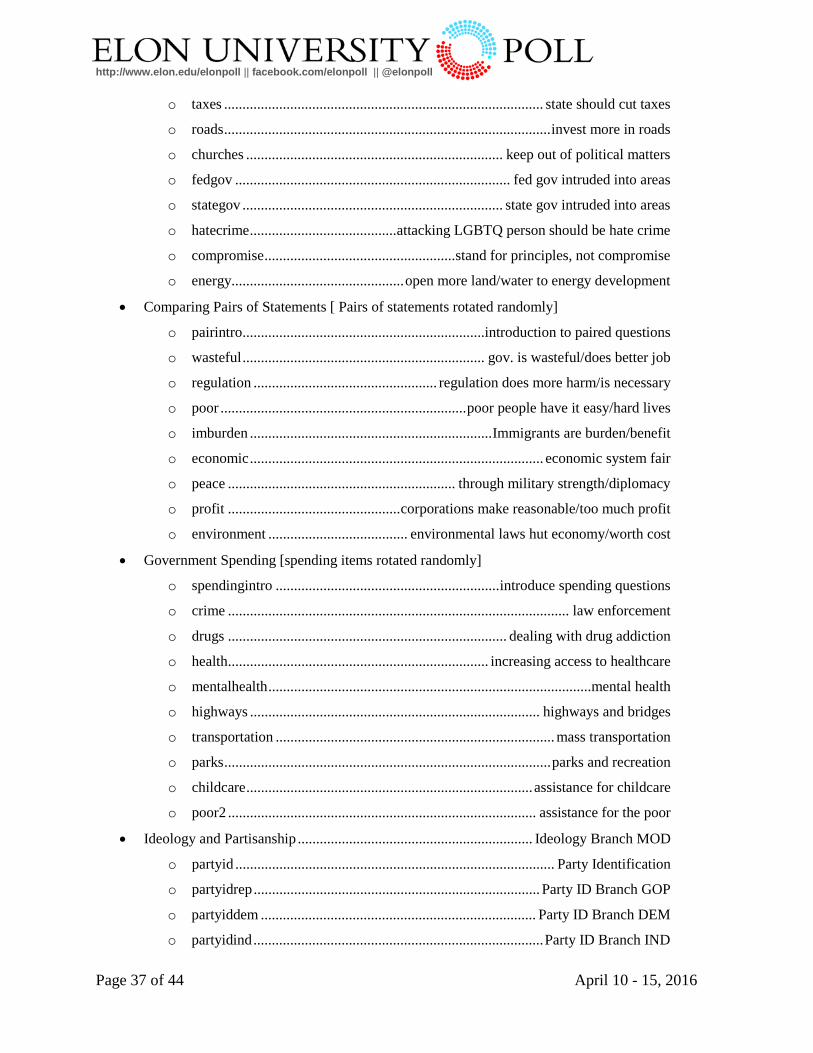
http://www.elon.edu/elonpoll || facebook.com/elonpoll || @elonpoll
Page 37 of 44 April 10 - 15, 2016
o taxes ....................................................................................... state should cut taxes
o roads ......................................................................................... invest more in roads
o churches ...................................................................... keep out of political matters
o fedgov ........................................................................... fed gov intruded into areas
o stategov ....................................................................... state gov intruded into areas
o hatecrime ........................................ attacking LGBTQ person should be hate crime
o compromise .................................................... stand for principles, not compromise
o energy............................................... open more land/water to energy development
• Comparing Pairs of Statements [ Pairs of statements rotated randomly]
o pairintro ..................................................................introduction to paired questions
o wasteful .................................................................. gov. is wasteful/does better job
o regulation .................................................. regulation does more harm/is necessary
o poor ................................................................... poor people have it easy/hard lives
o imburden .................................................................. Immigrants are burden/benefit
o economic ................................................................................ economic system fair
o peace .............................................................. through military strength/diplomacy
o profit ............................................... corporations make reasonable/too much profit
o environment ...................................... environmental laws hut economy/worth cost
• Government Spending [spending items rotated randomly]
o spendingintro ............................................................. introduce spending questions
o crime ............................................................................................. law enforcement
o drugs ............................................................................ dealing with drug addiction
o health ....................................................................... increasing access to healthcare
o mentalhealth ........................................................................................ mental health
o highways ............................................................................... highways and bridges
o transportation ............................................................................ mass transportation
o parks ......................................................................................... parks and recreation
o childcare .............................................................................. assistance for childcare
o poor2 .................................................................................... assistance for the poor
• Ideology and Partisanship ................................................................ Ideology Branch MOD
o partyid ....................................................................................... Party Identification
o partyidrep .............................................................................. Party ID Branch GOP
o partyiddem ........................................................................... Party ID Branch DEM
o partyidind ............................................................................... Party ID Branch IND
http://www.elon.edu/elonpoll || facebook.com/elonpoll || @elonpoll
Page 38 of 44 April 10 - 15, 2016
o Nomination1 ............................................................................... Nominee for GOP
o Nomination2 ...................................................................... Nominee for Dem Party
o ideo ............................................................................................................ Ideology
o ideocon ................................................................................. Ideology Branch CON
o ideolib .................................................................................... Ideology Branch LIB
o ideomod .............................................................................. Ideology Branch MOD
o ideodk ..................................................................................... Ideology Branch DK
• Demographics
o married .......................................................... Married, Single, Divorced, Widowed
o educ .......................................................................................................... Education
o inc ................................................................................................................ Income
o inc_high .................................................................................... Income High Probe
o inc_low....................................................................................... Income Low Probe
o attend ......................................................................................... Church Attendance
o attendfreq ........................................................................ Church Attendance Probe
o relig ............................................................................................................ Religion
o christian .......................................... Protestant, Catholic, Mormon, Something else
o evangelical .................................................... do you consider yourself evangelical
o age ..................................................................................................................... Age
o race ................................................................................................................... Race
o nativenc ..................................................................................... originally from NC
o state ................................................................................. what state originally from
o years .................................................... how many years have you lived in the state
o zipcode .................................................................................... what is your zipcode
o employed .................................................................................... employment status
o jobinsecurity...................................................................... worried about losing job
o children ....................................................... do you have children in public schools
o college ...................................................... members of family/household in college
o landline..................................................... own landline phone [cell phone #s only]
o cellphone ............................................................. own cell phone [landline #s only]
o internet .......................................................................................... access to internet
• Post-interview
o sex ................................................................................................................ Gender
o accent ........................................................... does respondent have southern accent
http://www.elon.edu/elonpoll || facebook.com/elonpoll || @elonpoll
Page 39 of 44 April 10 - 15, 2016
Methodological Information Mode: Live Interviewer RDD Telephone Interviews
(Dual Frame: Cell Phone and Landlines) Population & Sample Area North Carolina; Adults, Registered Voters
(English Speakers)
Dates in the field: April 10-15, 2016
Registered Voter Sample Size 621 Registered Voter Margin of Error +/-3.93
Confidence Level 95% Weighting Variables Age , Race, Gender, & Phone Ownership The Elon University Poll uses a stratified random sample of households with telephones and wireless (cell) telephone numbers. Please direct questions about the Elon University Poll’s methodology to the Director of the Elon University Poll, Dr. Kenneth Fernandez at 336-278-6438 or [email protected]. Procedures Used for Conducting the Poll The Elon University Poll uses CATI system software (Computer Assisted Telephone Interviewing) for the administration of surveys. We attempt to reach each working telephone number in the sample up to five times. We only interview residents of North Carolina who are over 18. The Elon University Poll conducted the survey in English. Live interviewers called from 4:30 pm to 9:30 pm Sunday 4/10/2016 through Thursday 4/14/2016; and 3:00 pm to 8:00 pm on Friday 4/15/2016.
http://www.elon.edu/elonpoll || facebook.com/elonpoll || @elonpoll
Page 40 of 44 April 10 - 15, 2016
Additional Methodological Decisions Branching Questions For many questions with multiple response options, we program our surveys to branch into a secondary probing question. “Don’t Know” & “Refused” Response Options All questions include an option for respondents to volunteer “don’t know” or to refuse. In the vast majority of questions, interviewers do not prompt “don’t know” responses. Weighting We typically weight results from the Elon University Poll on multiple demographic characteristics: race, gender, phone use/type and age. Weighting rarely leads to substantial changes in results. We use iterative raking, adjusting one dimension at a time. The standard error of an estimate for a simple random sample is different from the standard error of an estimate based on a weighted sample. This is referred to as a design effect. For example the overall design effect for the final weights for the sample of Registered Voters in North Carolina was 1.20. So an adjusted margin of error for that sample would be +/- 3.93 instead of +/- 4.31. Within Household Randomization For landlines, we use the common “oldest-youngest” technique to ensure within household randomization. We assume cellphones belong to an individual rather than a household. Thus, we do not conduct within-household randomization within our cellphone sample. Completion Criteria An interview is a complete only if a respondent progresses through the entire survey. Respondents who hang up before completing the last question or who refuse to more than 10 % of the questions are incompletes. Support for Transparency The Elon University Poll supports transparency in survey research and is a charter member of the American Association for Public Opinion Research Transparency Initiative, which is a program promoting openness and transparency about survey research methods and operations among survey research professionals and the industry. All information about the Elon University Poll that we released to the public conforms to reporting conventions recommended by the American Association for Public Opinion Research and the National Council on Public Polls. Question Construction and Question Order In releasing survey results, the Elon University Poll provides the questions as worded and the order in which respondents receive these questions. In some cases question ordering rotates to avoid biases. In an effort to provide neutral, non-biased questions, we attempt to observe conventional question wording and question order protocols in all of our polls. In order to avoid recency or primacy effects, we randomize candidate names and directional response options (e.g. support / oppose) within the text of each question. We pretest every questionnaire multiple times before entering the field.
http://www.elon.edu/elonpoll || facebook.com/elonpoll || @elonpoll
Page 41 of 44 April 10 - 15, 2016
Sampling Survey Sampling International, LLC, provide samples of telephone numbers. To equalize the probability of telephone selection, sample telephone numbers are systematically stratified according to subpopulation strata (e.g., a zip code, a county, etc.), which yields a sample from telephone exchanges in proportion to each exchange's share of telephone households in the population of interest. Estimates of telephone households in the population of interest are generally obtained from several databases. Samples of household telephone numbers are distributed across all eligible blocks of numbers in proportion to the density of listed households assigned in the population of interest according to a specified subpopulation stratum. Upon determining the projected (or preferred) sample size, a sampling interval is calculated by summing the number of listed residential numbers in each eligible block within the population of interest and dividing that sum by the number of sampling points assigned to the population. From a random start between zero and the sampling interval, blocks are selected systematically in proportion to the density of listed household "working blocks." A block (also known as a bank) is a set of contiguous numbers identified by the first two digits of the last four digits of a telephone number. A working block contains three or more working telephone numbers. Exchanges are assigned to a population on the basis of all eligible blocks in proportion to the density of working telephone households. Once each population's proportion of telephone households is determined, then a sampling interval, based on that proportion, is calculated and specific exchanges and numbers are randomly selected. The wireless component of the study sample starts with determining which area code-exchange combinations in North Carolina are included in the wireless or shared Telcordia types. Similar to the process for selecting household telephone numbers, wireless numbers involve a multi-step process in which blocks of numbers are determined for each area code-exchange combination in the Telcordia types. From a random start within the first sampling interval, a systematic nth selection of each block of numbers is performed and a two-digit random number between 00 and 99 is appended to each selected nth block stem. The intent is to provide a stratification that will yield a sample that is representative both geographically and by large and small carrier. From these, a random sample is generated. Because exchanges and numbers are randomly selected, unlisted as well as listed numbers are included in the sample. Thus, the sample of numbers generated for the population of interest constitutes a random sample of telephone households and wireless numbers of the population. Frequently Asked Questions about our Methodology
1. Who pays for the Elon University Poll? Elon University fully funds the Elon University Poll.
2. Does the Elon University Poll favor a certain party? The Elon University Poll is an academic, non-partisan survey. We do not engage or work with any political candidates or parties. We employ best practices to ensure the results are not biased.
http://www.elon.edu/elonpoll || facebook.com/elonpoll || @elonpoll
Page 42 of 44 April 10 - 15, 2016
3. Where do you get your numbers? We obtain samples of randomized phone numbers from Survey Sample International.
4. How many times do you call a number before giving up? We will attempt to call each working number up to five times before removing it from the sample.
5. Do you call both cell phones and land lines? Yes. We use a mixed sample of both cell phones and landlines. We weight on phone ownership to adjust for the higher probability of selection of those who own both cell phones and landline phones.
6. Does the Elon University Poll do IVR surveys or automated “robopolls”?
No. Well-trained students at Elon University conduct all our interviewers.
7. Do you report non-response rates? Yes. We report non-response rates based on AAPOR guidelines. The response rate for the April 2016 poll was 7.6% which approximates the national average response rates of other high quality survey organizations. The response rate is calculated using the American Association of Public Opinion Research (AAPOR) formula RR4.
8. Do you weight the data?
Yes. We apply weights to the data. An iterative proportional fitting algorithm generates weights based on Census and CDC population parameters of residents in North Carolina. Registered voter screens sometimes cause final weighted variables to not match those parameters exactly- which is intended.
9. Do you randomize response options? Yes. We rotate the order of candidate names in all applicable questions. We also rotate order of text for other questions, such as those that include response options such as “more” and “less.” Furthermore, we rotate the order of some questions themselves if we suspect the order of a question could bias results.
10. Do you conduct within-household randomization?
Yes. For landlines, we use the common “oldest-youngest” rotation to ensure within household randomization. We assume cellphones belong to an individual rather than a household. Thus, we do not conduct within-household randomization within our cellphone sample.
http://www.elon.edu/elonpoll || facebook.com/elonpoll || @elonpoll
Page 43 of 44 April 10 - 15, 2016
The Elon University Poll Team • Dr. Kenneth Fernandez is the Director of the Elon University
Poll. Dr. Fernandez holds a Ph.D. in Political Science from University of California – Riverside. Dr. Fernandez is Assistant Professor of Political Science and Policy Studies at Elon University.
• Dr. Jason Husser is the Assistant director. Dr. Husser is also Assistant Professor of Political Science at Elon University and Faculty Fellow for Civic Engagement. Dr. Husser holds a Ph.D. in Political Science from Vanderbilt University.
• Daniel Anderson is Vice President of Elon University Communications. Eric Townsend is Director of the Elon University News Bureau. Both work very closely with the directors in communicating results of the poll.
Faculty members in the Department of Political Science are also involved in advising the directors. The poll operates under the auspices of the College of Arts and Sciences at Elon University, led by Dean Gabie Smith. The Elon University administration, led by Dr. Leo Lambert, president of the university, fully supports the Elon University Poll as part of its service commitment to state, regional, and national constituents. Elon University fully funds the Elon University Poll. Because of this generous support, the Elon University poll does not engage in any contract work. This permits the Elon University Poll to operate as a neutral, non-biased, non-partisan resource. Elon University students administer the survey as part of the University’s commitment to civic engagement and experiential learning where “students learn through doing.” Student interviewers receive extensive training prior to engaging in interviewing. A team of student supervisors (led by Jeremy Revelise ‘16) assists the directors with quality control and monitoring.
Fernandez
Husser
http://www.elon.edu/elonpoll || facebook.com/elonpoll || @elonpoll
Page 44 of 44 April 10 - 15, 2016
For more information on the Elon University Poll and this survey, visit http://www.elon.edu/elonpoll or Contact: Kenneth E. Fernandez, Ph.D. Director of the Elon University Poll Assistant Professor of Political Science [email protected] (336) 278-6438 @ElonFernandez Jason A. Husser, Ph.D. Assistant Director of the Elon University Poll Assistant Professor of Political Science Faculty Fellow for Civic Engagement [email protected] (336) 278-5239 @JasonHusser Follow us on Twitter @elonpoll