Embed Size (px)
Citation preview
Grant agreement no.: 2012-2948/001-001
This project has been funded with support from the European Commission. This communication reflects the views only of the
author, and the Commission cannot be held responsible for any use which may be made of the information contained therein.
Mateja Melink, Tomaž Pušnik and Samo Pavlin
University of Ljubljana, Faculty of Social Sciences
Emerging Modes of Cooperation between Private Enterprises and
Universities – Insights of European Enterprises and Employers
Organisations
This project has been funded with support from the European Commission. This communication reflects the views only of the
author, and the Commission cannot be held responsible for any use which may be made of the information contained therein.
Authors: Mateja Melink, Tomaž Pušnik and Samo Pavlin
Proof-read by: Murray Bales
EMCOSU project report, 2014 (December).
The authors would like to acknowledge the indispensable support received from all partners in
the participating countries of the EMCOSU project. Our thank goes to:
- Andrej Brvar, Mojca Osojnik (Slovenian Chamber of Commerce, Slovenia)
- Gergana Rakovska (Business Foundation for Education, Bulgaria)
- Ren|ta Fullérné Verger, Erika Sim|n (Chamber of Commerce and Industry of County
Zala, Hungary)
- Mieczysław Bąk, Agnieszka Buze (Polish Chamber of Commerce, Poland)
- Edurne Bartolome, Pablo Javier Beneitone, Gipson Varghese (University of Deusto,
Spain)
- Raúl Mínguez, Manuel Valero (Official Chamber of Commerce, Industry, Services and
Navigation of Spain, Spain)

3
Table of Contents
1 Introduction .............................................................................................................................................. 7
1.1 Background ....................................................................................................................................................... 7
1.2 Structure of the report ............................................................................................................................... 11
1.3 Methodology .................................................................................................................................................. 12
2 Modes and Activities of University-Business Cooperation ................................................... 19
3 Drivers and Barriers of University-Business Cooperation ................................................... 27
4 Outcomes and Impacts of University-Business Cooperation ............................................... 33
5 Companies’ Perceptions on Universities and University-Business Cooperation .......... 38
6 University-Business Cooperation and Employability: Acquired Competencies and
Recruitment Mechanisms .......................................................................................................................... 42
7 University-Business Cooperation on the EU level .................................................................... 46
7.1 Selection of the countries/regions and approach .......................................................................... 46
7.2 Modes of University-Business Cooperation ...................................................................................... 47
7.3 Barriers to the University-Business Cooperation .......................................................................... 49
7.4 Developmental Needs and Drivers and Impacts of University-Business Cooperation ... 51
7.5 Employability of the graduates .............................................................................................................. 55
7.6 Case Studies of University-Business Cooperation .......................................................................... 56
8 Employers' Associations and University-Business Cooperation......................................... 60
9 Specific Sector Experts' Views on University-Business Cooperation ................................ 65
10 Comparative analysis of university-business cooperation between representatives of
companies, employers’ associations and specific sector experts ................................................ 72
11 Conclusions and Policy Implications ............................................................................................. 77
Sources .............................................................................................................................................................. 85
Appendix .......................................................................................................................................................... 89
4
Tables
Table 1.1: Number of responding representatives of companies, employers’ association
representative or specific sector experts per country ......................................................................... 18
Table 2.1: Comparison ranks of UBC modes among employers, academics and HEI representatives
............................................................................................................................................................... 20
Table 2.2: Comparison ranks of extent of UBC activities among employers and HEI representatives
............................................................................................................................................................... 23
Table 3.1: Comparison ranks of drivers of UBC among employers, academics and HEI
representatives ..................................................................................................................................... 27
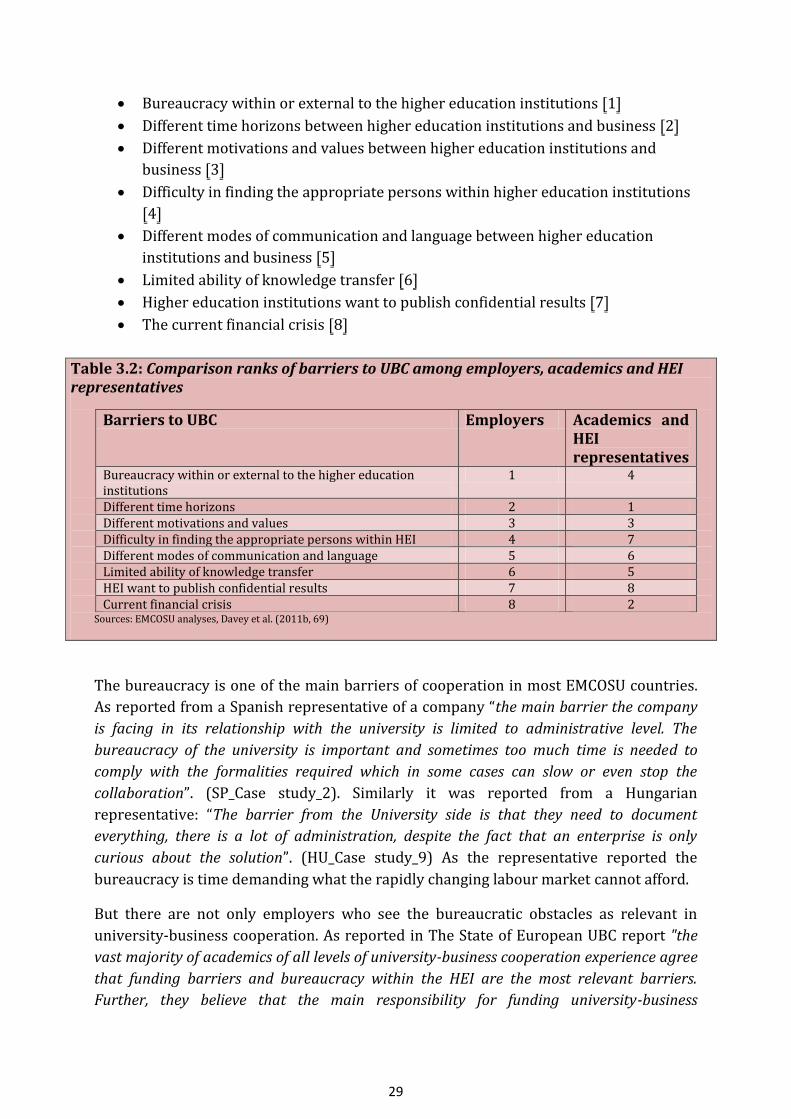
Table 3.2: Comparison ranks of barriers to UBC among employers, academics and HEI
representatives ..................................................................................................................................... 29
Table 4.1: Comparison ranks of UBC benefits among employers, academics and HEI representatives
............................................................................................................................................................... 33
Table 5.1: Development needs of universities (ranks and means) ..................................................... 40
Table 8.1: Most common modes of university-business cooperation (ranks and means) ................. 60
Table 8.2: Most frequent modes of engagement in the activities in relation to universities (ranks
and means) ........................................................................................................................................... 61
Table 8.3: Future developmental needs of universities (ranks and means) ....................................... 62
Table 8.4: Relevance of the barriers to university-business cooperation (ranks and means) .......... 62
Table 8.5: Benefits of university-business cooperation (ranks and means) ....................................... 63
Table 9.1: Most common modes of university-business cooperation (ranks and means) ................. 66
Figures
Figure 1.1: Distribution of companies by their size per country (in per cent) ................................... 16
Figure 1.2: Distribution of companies by economic sector per country (in per cent) ....................... 17
Figure 2.1: Distribution of companies with university-business cooperation per country (in per
cent) ...................................................................................................................................................... 19
Figure 2.2: Companies with high extent of cooperation with universities in research and
development, by sectors (in per cent) .................................................................................................. 21
Figure 2.3: Companies with high extent of cooperation with universities in research and
development, by size of the company (in per cent) ............................................................................. 21
Figure 2.4: Companies with high extent of cooperation with universities in mobility of students, by
size of the company (in per cent) ......................................................................................................... 22
Figure 2.5: Companies cooperating with HE career offices, by sector (in per cent) .......................... 25
Figure 2.6: Participation of business people in HE study, teaching and research activities, by sector
(in per cent) .......................................................................................................................................... 26
Figure 3.1: Existence of mutual trust and commitment as facilitating factor of cooperation between
company and HE institutions, by size of the company (in per cent) ................................................... 28
Figure 3.2: Bureaucracy within or external to the HE institutions as a barrier to cooperation with
HE institutions, by sector (in per cent) ................................................................................................ 30
Figure 3.3: Bureaucracy within or external to the HE institutions as a barrier to cooperation with
HE institutions, by size of the company (in per cent) .......................................................................... 31
5
Figure 4.1: Improvement of the skills of students relevant to the labour market careers through
university-business cooperation, by the extent of UBC (in per cent) .................................................. 34
Figure 4.2: Improvement of the innovative capacities of the company through university-business
cooperation, by size of the company (in per cent)............................................................................... 35
Figure 5.1: Orientation of companies on university-business cooperation (in per cent) .................. 38
Figure 5.2: Orientation of the company to upgrade the university-business cooperation for
application and commercial exploitation, by the extent of UBC (in per cent) ................................... 39
Figure 5.3: Orientation of the company to upgrade the university-business cooperation for
application and commercial exploitation, by sector (in per cent) ...................................................... 39
Figure 6.1: Internet as a mechanism for hiring higher education graduates, by size of the company
(in per cent) .......................................................................................................................................... 43
Figure 6.2: Internship placement as a mechanism for hiring higher education graduates, by extent
of UBC (in per cent) .............................................................................................................................. 44
Figure 6.3: Public employment agencies as a mechanism for hiring higher education graduates, by
size of company (in per cent) ............................................................................................................... 44
Figure 6.4: Possession of skills by the graduates (in per cent) ........................................................... 45
Figure 7.1: Number of responding companies per country ................................................................ 46
Figure 7.2: Distribution of companies by economic sector (in per cent) ........................................... 47
Figure A.0.1: High extent of university-business cooperation regarding different activities (in
percent) ................................................................................................................................................. 89
Figure A.0.2: Frequent engagement in different activities in relation to higher education
institutions (in percent)........................................................................................................................ 89
Figure A.0.3: Factors facilitating cooperation with higher education institutions (in percent) ...... 90
Figure A.0.4: High relevance of different barriers to higher education institutions-business
cooperation (in percent) ...................................................................................................................... 90
Figure A.0.5: Strong positive influence of higher education institutions-business cooperation on
different attributes (in percent) ........................................................................................................... 91
Figure A.0.6: High extent of agreement with the necessity of different changes in higher education
institutions (in percent)........................................................................................................................ 91
Figure A.0.7: Most often used recruitment mechanisms for hiring higher education graduates in the
last five years (in percent) .................................................................................................................... 92
Figure A.0.8: High extent of new graduates’ possession of different skills (in percent) .................... 92
Figure A.0.9: High extent of university-business cooperation regarding different activities (in
percent, by economic sectors) .............................................................................................................. 93
Figure A.0.10: Frequent engagement in different activities in relation to higher education
institutions (in percent, by economic sector) ...................................................................................... 94
6
Figure A.0.11: Factors facilitating cooperation with higher education institutions (in percent, by
economic sector) ................................................................................................................................... 95
Figure A.0.12: High relevance of different barriers to higher education institutions-business
cooperation (in percent, by economic sector) ..................................................................................... 96
Figure A.0.13: Strong positive influence of higher education institutions-business cooperation on
different attributes (in percent, by economic sector) .......................................................................... 97
Figure A.0.14: High extent of agreement with the necessity of different changes in higher education
institutions (in percent, by economic sector) ...................................................................................... 98
Figure A.0.15: Most often used recruitment mechanisms for hiring higher education graduates in
the last five years (in percent, by economic sector) ............................................................................ 99
Figure A.0.16: High extent of new graduates’ possession of different skills (in percent, by economic
sector) ................................................................................................................................................. 100
Figure A.0.17: High extent of university-business cooperation regarding different activities (in
percent, by size of company) .............................................................................................................. 101
Figure A.0.18: Frequent engagement in different activities in relation to higher education
institutions (in percent, by size of company) ..................................................................................... 102
Figure A.0.19: Factors facilitating cooperation with higher education institutions (in percent, by
size of company) ................................................................................................................................. 103
Figure A.0.20: High relevance of different barriers to higher education institutions-business
cooperation (in percent, by size of company) .................................................................................... 104
Figure A.0.21: Strong positive influence of higher education institutions-business cooperation on
different attributes (in percent, by size of company) ........................................................................ 105
Figure A.0.22: High extent of agreement with the necessity of different changes in higher education
institutions (in percent, by size of company) ..................................................................................... 106
Figure A.0.23: Most often used recruitment mechanisms for hiring higher education graduates in
the last five years (in percent, by size of company) ........................................................................... 107
Figure A.0.24: High extent of new graduates’ possession of different skills (in percent, by economic
sector) ................................................................................................................................................. 108
Figure A.0.25: High extent of university-business cooperation regarding different activities (in
percent, by extent of U-B cooperation) .............................................................................................. 109
Figure A.0.26: Frequent engagement in different activities in relation to higher education
institutions (in percent, by extent of U-B cooperation) ..................................................................... 110
Figure A.0.27: Factors facilitating cooperation with higher education institutions (in percent, by
extent of U-B cooperation) ................................................................................................................. 111
Figure A.0.28: High relevance of different barriers to higher education institutions-business
cooperation (in percent, by extent of U-B cooperation).................................................................... 112
Figure A.0.29: Strong positive influence of higher education institutions-business cooperation on
different attributes (in percent, by extent of U-B cooperation) ........................................................ 113
Figure A.0.30: High extent of agreement with the necessity of different changes in higher education
institutions (in percent, by extent of U-B cooperation) ..................................................................... 114
Figure A.0.31: Most often used recruitment mechanisms for hiring higher education graduates in
the last five years (in percent, by extent of U-B cooperation) ........................................................... 115
Figure A.0.32: High extent of new graduates’ possession of different skills (in percent, by extent of
U-B cooperation) ................................................................................................................................ 116

7
1 Introduction
Samo Pavlin and Mateja Melink
1.1 Background
Current major European policy concerns related to establishing the European Higher
Education Area are closely related to supporting graduates’ career success, international
mobility, cooperation among higher education institutions and among universities and
business. The report focuses on the last mentioned dimension. It looks at how three
general questions in the area of university-business cooperation – i) which are the most
relevant modes of cooperation between universities and business; ii) what are the
determinants of cooperation modes and their future developmental needs; and iii)
which are the key developmental drivers and barriers to cooperation on the side of
universities and business? – are linked to the issue of graduates’ transition from
education to the labour market. In the context of the general interdisciplinary
conceptualisation of knowledge creation processes and the shift from a linear to an
interactive knowledge cycle (Nonaka and Takeuchi, 1995; Boisot, 2002; Lundvall, 2001),
these questions relate to the functions of professional groups (e.g. Abbott, 1988), the
overall goal of interaction between the academic sphere, business and society (e.g.
Etzkowitz & Leydesdorff, 2000) and the transition of graduates from education to the
labour market (e.g. Allen, Pavlin and Van der Velden, 2011).
Already the HEGESCO project (Pavlin et al., 2009) indicates that most modes of
cooperation between business and universities are perceived to be in the service of
supporting graduates’ careers, although some have shorter rather than longer term
perspectives – as certain determinants of the development of competencies fall within
the direct jurisdiction of higher education, while others go beyond the borders of higher
education institutions. The need to further explore and improve knowledge in the
interrelated areas of graduates’ careers and cooperation between universities and
business is clear. According to the HEGESCO project’s findings, employers have very
little knowledge of what to expect from graduates, and higher education institutions
have a similar low level of knowledge concerning employers’ needs. This problem is
particularly relevant in the private sector which often has, compared to state-regulated
professional education and certification, more blurred links with education.
With the area of the ‘knowledge-based society’ characterised by increasing globalisation
processes, the value of services and intangibles, networking organisations and digital
technologies, university-business cooperation has been described using distinct

8
concepts such as “national innovation systems” (Nelson, 1993), a “new mode of
knowledge production” (Gibbons et al., 1994), “entrepreneurial university” (Clark,
1998) and “the triple helix model” (Etzkowitz & Leydesdorff, 2000; Etzkowitz, 2008).
These concepts have gradually been reflecting the call for the ‘third mission’ of
universities – from teaching and research towards community engagement – via
technology transfer, trans-disciplinarity, regional development and living laboratories
(e.g. Trencher et al., 2013, 4). The so-called Wilson’s review (Wilson, 2012), in the case
of the UK, explains well which actions drive university-business and foster students’
careers. Examples include setting enterprises by graduates, the enhancement of study
relevant work experience through apprenticeship and qualifications, the recognition of
informal learning and recognition, lifelong learning activities, implementation of an
innovation voucher scheme, support for graduates’ career services and alumni etc.
Moreover, this review indicates that cooperation between universities and industry is
supposed to cause paradigmatic shifts (Wilson, 2012: 23-24) like, for example: “from
future‐oriented research in advanced technologies, to in‐house up skilling of
employees”, “from university science park developments, to support for entrepreneurial
research students finding their way in the business world”, “from improving business
skills amongst undergraduates, to enabling small companies to recognise the value of
employing a first graduate”, “from supporting spin‐out companies from research teams,
to helping government agencies attract major employers to invest…”.
Related to this, the Organisation for Economic Cooperation and Development and the
European Commission (OECD & EC, 2012) have also recently promoted guidelines for
how universities can become more “entrepreneurial”. The areas they identify relate to
leadership and governance, organisational capacities with a strong stress on acquiring
new financial sources and cooperation with business, the promotion of entrepreneurial
principles and innovation through the curriculum, promoting start-ups,
internationalisation and the development of measurement principles. These
“recommendations” are accompanied by the latest economic necessity to “do more with
less” (OECD, 2010). In this context, several authors question this convergence from the
traditional towards an entrepreneurial university and do not regard it as a positive
development (e.g. Hackett, 2005), particularly due to the proletarisation,
deprofessionalisation and hybridisation of academic roles (Henkel, 2009; Kogan, 2009)
as well as the decline of the traditional social function of higher education to give equal
opportunities and citizenship (Zgaga, 2009). Moreover, intensified collaboration
between industry and the academic sphere is leading to the segmentation and
trivialisation of disciplinary areas (Becher, 1989), modified or even polarised relations
between research and teaching (Elton, 1986) and the precarisation of academic
institutions (Musselin, 2009).
Few studies have tried to explain the principles of university-business cooperation in
relation to disciplinary differences. Existing literature (e.g. Kolb, 1981; Neumann, 2009)
differentiates between hard-pure (e.g. natural sciences and mathematics), soft-pure (the
9
humanities and the social sciences), hard-applied (e.g. medicine) or soft-applied (e.g.
social work) categories and explain what this implies for the vocational focus and
professionalisation scope of graduates’ careers. Moreover, Pavlin and Svetlik (2008)
described the principles of how these different disciplines interact with the world of
work, particularly when it comes to the creation of study programmes, (re)accreditation
of study programmes and implementation of practicums. The variety of disciplinary
areas importantly determines what applied potential for the world of work a particular
higher education institution offers due to the capabilities of its academics and students
which are determined by (Teichler, 2011: 403):
“
a professionally geared composition of knowledge within a study programme
(e.g. mechanical engineering) versus an academically determined composition of
knowledge of a study programme (e.g. philosophy);
an academic versus applied emphasis of teaching and learning, i.e. an emphasis
on understanding the logic of the knowledge system versus and emphasis on the
transfer of knowledge to practical problem-solving;
academic orientation versus orientation towards practice, i.e. pursuit of
knowledge for its own sake versus learning to understand the tensions between
theory and practice during the course of study;
preparing students to be able to become scholars versus preparing students to
under-stand and utilize the results of academic work in their subsequent
professional work outside academia;
prime emphasis on the understanding and the ability to handle conventional
wisdom versus prime emphasis on sceptical and critical views as well as on
coping with indeterminate work tasks and innovation;
emphasis on conveying foundation of knowledge relevant for professional
practice versus preparing students directly to master all the relevant knowledge;
emphasis on general knowledge and competences versus emphasis on specific
academic or professional knowledge and competences, and
disciplinary versus interdisciplinary approaches.”
These particularities significantly determine the prevailing orientation of academics
towards industry cooperation. Lam (2010), for example, developed a typology that
describes the traditional academic who believes the academic sector and industry
should be separate, the traditional hybrid and the entrepreneurial hybrid who believe
some form of cooperation should exist and the entrepreneurial type who believes in the
fundamental importance of science and business collaboration. Lam further explored to
what extent different factors – increasing funding and other research resources,
application & exploitation of research results, creation of opportunities for knowledge
exchange/transfer, building personal and professional networks, enhancing the visibility
of research and an increase in personal income – motivate particular academic types for
cooperation with business. These elements also hold important implications for the
10
development of curricula, interdisciplinary development, the integration of learning
with research, the organisation of problem-based learning and student practices
(Palmer et al., 2010). On this basis various actors have developed frameworks on
university-business cooperation.
Although several projects have started to develop indicators that measure cooperation
such as number of patents, spin-offs and contract value of contracts with external
stakeholders (e.g. SIAMPI from 7FP), “…there is still no comparative information as to
which universities are among the world's major providers of science-based information
and services to the business sector in general, and research-active industry in
particular” (Tijssen et al., 2009). It is thus no surprise that there is a wide diversity of
university-business cooperation modes that in recent times have been extracted from
the best case studies. A report of the Technopolis organisation (2011), for example,
presents a review of 15 countries that identified best practices of university-business
cooperation, including practice-oriented teaching methods, problem-based learning in
interaction with industry, decentralised management in cooperation with SMEs,
autonomous management of business cooperation at the university level, compulsory
placements with industry, common laboratories etc. Davey et al. (2011a) also conducted
a similar survey on 30 European case studies related to entrepreneurial training,
international MBA programmes, state-of-the-art R&D with industry, adult education,
start-ups, accelerating apprenticeships, empowering science-society linkages or
generating living laboratories.
The search for drivers and barriers is another area that has recently been attracting
significant attention. While the set of drivers (e.g. better employability of graduates,
curriculum improvements, spin-offs and financial measurements) can be classified
according to a particular beneficiary (e.g. higher education institutions, academics,
students, the community etc.), the set of barriers has traditionally been classified as
restrictions imposed by a company, problems related to the appropriation of results,
communication problems, duration of the research and cultural differences (Mora-
Valentin & Ortiz-de-Urbina-Criado, 2009: 396). Based on the results of an Imperial
College survey, Wilson (2012: 28) conceptualised major barriers to business university
cooperation in the UK and to different degrees the results can be generalised across
European countries. In the report, he stressed: “i) the needs of the business do not align
with the mission and strategy of the university, ii) time scale and capacity mismatch (a
university has already committed its resources and does not have the available capacity
to meet the timescale that the business needs, iii) capability mismatch (a university does
not have the skill set or the facilities to meet the needs of the business), iv) the cycle of
bureaucracy (where external funding is required, the bidding cycle does not meet the
timescale the business needs), v) financial constraints (a university is unable to provide
the service required for the price the company is willing to pay), vi) sustainability: the
investment required by the university to provide the service does not have an
acceptable payback period, vii) mismatch in expectations and objectives (expectations of
11
outcomes from collaboration are not mutually recognised), viii) agreement on the future
of the intellectual property that may be generated”.
Some other reports have in recent years presented a general picture of university-
business cooperation in Europe. For example, with a large-scale survey among over
4,000 enterprises Davey et al. (2011b) explored how eight EC pillars of business-
university collaboration (research and development, mobility of academics, mobility of
students, commercialisation of R&D results, curriculum development and delivery,
lifelong learning, entrepreneurship and governance) are practiced by academics and
what determines these cooperation aspects. The authors found there is a high statistical
correlation among these types and measurable modes are perceived to be more
important than more tacit ones. The study also found the strong effect of influencing
factors that were classified as action processes (mechanisms that support university-
business cooperation, strategies, structures and approaches, activities and framework
conditions), motives, drivers and barriers. Interestingly, the results show that academics
believe their institutes, students and employers benefit from cooperation much more
than they do. They see the funding system and bureaucracy within higher education
institutions as the main barriers to cooperation. This is the reason, according to the
report, that almost every second academic is not involved in any way in cooperation
with industry.
1.2 Structure of the report
The main part of the report focuses on the detailed analyses of the university-business
cooperation from the perspective of employers (chapters 2-6). Firstly, the report
provides analyses of the most frequent means of cooperation with higher educational
institutions, following by identification of drivers and motives which lead to this
cooperation as well as the barriers of this cooperation the companies are facing with.
The report also provides the quantitative analyses of the outcomes and impact of the
university-business cooperation and companies’ perceptions on universities and
cooperation with them as well as qualitative analyses of the companies’ own
experiences of university-business cooperation. Regarding the issues of the
employability the report provides an insight into the acquired competences of the
graduates from employers’ perspective and the recruitment mechanisms they use to
hire new employees. The quantitative and qualitative analyses of university-business
cooperation from the perspective of the employers in the first place provide policy
implications.
Chapter 7 includes analyses on university-business cooperation among employers on
the EU level. Besides EMCOSU countries the analyses also include responses of
employers from several other countries and regions that were involved in the large scale
12
survey. Among the countries the survey was focused to Croatia, Czech Republic, Slovakia
and Italy with additional regions comprising several countries: continental, ex-YU
countries, Scandinavia and Russia.
Chapter 8 comprises additional analyses among employers’ associations in EMCOSU
countries and on EU level (few countries outside of the project consortium) from which
the majority of them are chambers of commerce and industry. Chapter 9 includes
analyses of survey responses among experts of specific economic sectors. It focuses on
three major sectors, namely industry, services and ICT. The employers’ associations’
representatives provided responses on their institutional cooperation with universities,
but specific sector experts provided their views on the university-business cooperation
of companies from their sector of expertise.
All analyses provide results that can bring a great contribution to university-business
cooperation in EMCOSU countries, but also on a broader EU level. The conclusions and
policy implications are available in Chapter 10.
1.3 Methodology
General approach
After the review of existing sources several interviews with experts in the area of higher
education and university business cooperation has been implemented. On this basis
further elaboration of the approach has been conducted including i) more detailed
elaboration of the key survey items and concepts, ii) sample design and preparation of
the road map, iii) development of survey guidelines and documentation and iv)
finalisation and translation of the questionnaires. The main goals of the survey remained
unchanged, and were related to the following three questions:
a) Which are the most relevant modes of cooperation between universities and
enterprises and why?
b) What are current characteristics of cooperation modes and their future
developmental needs?; and
c) Which are key developmental drivers and motives on cooperation on the side of
universities and enterprises?
These questions provided the basis for exploring relations among different modes of
cooperation between universities and business (UBC) and identification of factors that
trigger UBC. Better understanding of enterprises expectations from universities has also
been one of the key research goals. The EMCOSU consortium agreed that tentative goals
of UBC should be studied in addition to existing ones because this is the better way to
seek for improvement possibilities. This is particularly the case in SMEs where UBC has
more limited space for development as this is the case in larger enterprises. Therefore
13
an important issue in the questionnaire is related to distinguishing between experiences
with university collaboration versus expectations from universities. The survey also
encountered principles of hard elements of UBC such as are contracts, patents, licences
and publications and other more tacit dimensions. Hence the main areas included in the
survey were the following:
a) Organisational profile and recruitment practices
b) Assessment of acquired graduates’ competencies
c) Modes of university business cooperation
d) Attitude towards university business cooperation
e) Believes about the future changes of higher education institutions
f) Practices of university business cooperation
g) Drivers and barriers of university business cooperation
h) Outcomes of university business cooperation
i) Case descriptions
Main part of the questionnaire is based on closed questions with open question at the
end. The questionnaire has been designed in the way that some broader comparison is
possible with other earlier surveys such as for example the HEGESCO Survey or Survey
on the cooperation between Higher Education Institutions and public and private
organisations in Europe (Davey at all, 2011). Each EMCOSU partner also surveyed ten
case studies with more in-depth approach. In this way the survey of enterprises in the
EMCOSU project explores both – successful cooperation but also cases where university-
business cooperation exists only marginally. In order to gain better understanding in the
are the survey has been designed for enterprises, enterprises’ associations and experts.
These called for adaptation of the questionnaire for different target groups. The main
emphasis, however, was given to employers.
Sampling
The approach to sampling has been in the EMCOSU project based on the concept of
triangulation or mixed methods principles that seeking complementarities between
qualitative and quantitative research (Denzin, 1978/1989). This has been reflected in
combination of open and closed questions in various steps of the project. In the survey
we used nonprobability sampling, implementing principles of quota, purposive and
convenience sampling approaches (Battaglia, 2008/2011; Upprichard, 2011). Choice of
sampling class and mixed methods has been based on research goal to gain a holistic
understanding of the phenomenon, adding to the knowledge base of past surveys,
gaining organizational impact and above all to understand and generate new complex
phenomena and explore complexity of relations with open questions what is in line with
common mix method practices (Onwuegbuzie & Houston, 2007). In this was the
sampling has not only been designed to enable comparison similarities and differences
14
between main research units (enterprises, enterprises associations and UBC experts)
but also, as elaborated earlier, with unites explored in other surveys (higher education
institutions).
EMCOSU partners first provided information of relevant data bases out of which they
selected about 85 enterprises and 15 enterprises associations or experts (see table 1.1).
The selection of enterprises’ in the country sample sought for the following distribution:
a) assumption on university business cooperation: for more than half of selected
enterprises partners presumed they cooperate with universities. All enterprises in the
sample gravitated towards sectors that were earlier recognised as strategic for
university business cooperation;
b) sector of operation: about 20 per cent of enterprises were supposed to be selected
from ICT, 40 per cent from services and 40 per cent from industry;
c) size of a company: about one third of enterprises were large companies and the
remaining small and medium or micro companies.
When designing country samples, EMCOSU partners also considered technology level
and geographical scope of operation. Envisaged respondents within the enterprises
were managers, human resources experts and specialist managers (e.g. head of
departments) who were the most knowledgeable on university business cooperation.
EMCOSU partners in Bulgaria, Hungary, Poland, Slovenia and Spain ran the survey from
November 2013 until June 2014. They used e-mails, internet, phone and in some cases
also in person. In order to improve the response each partner send from one to two
reminders. Project partners reported they have gained a response rate from 10 % to 20
% of all companies included in the road maps.
The survey implementation on the EU level (countries outside the project consortium)
was run in a slightly different way and was implemented by the two universities
participating in the EMCOSU project. After the questionnaire has been translated into
target EU languages partners used their own contacts mostly within higher education
institutions and other research networks from different EU countries with a request to
pass motivation letters and questionnaires to relevant representatives of companies and
associations, what can be labelled as a snowball approach (Onwuegbuzie & Houston,
2007). Since there was (in most cases) no direct approach, expectedly also the response
rate was lower and it gained around 5 per cent.
Information on survey respondents
Survey addressed enterprises in the five EMCOSU countries, namely Bulgaria, Hungary,
Poland, Slovenia, Spain (the EMCOSU countries), and also other European countries (non
EMCOSU countries). As explained earlier the selection of the companies in the survey
followed the agreed criteria on the sector distribution, size of the company and
15
existence of the university-business cooperation (UBC). The total number of companies
included in the large scale survey was 397 and the number of participating companies
throughout the countries range from 70 in Poland to 98 in Bulgaria. However, the large
scale survey included also companies from countries outside the project consortium,
employers’ associations and responses of specific sector experts which are further
analysed in this report (see table 1.1).
Survey among enterprises
The empirical analyses in the report are done on the basis of data obtained through a
large scale survey among employers in the five EMCOSU countries, namely Bulgaria,
Hungary, Poland, Slovenia and Spain. The selection of the companies to be included in
the survey followed the agreed criteria on the sector distribution, size of the company
and existence of the university-business cooperation (UBC).
The total number of companies included in the large scale survey was 397 and the
number of participating companies throughout the countries range from 70 in Poland to
98 in Bulgaria. However, the large scale survey included also companies from countries
outside the project consortium, employers’ associations and responses of specific sector
experts which are further analysed.
The questionnaire of the large scale survey was mostly targeted to representatives of the
companies who have an insight into their own university-business cooperation or are
actively involved in that kind of cooperation. The majority of the respondents are
managers (for example CEOs, directors, executive directors, general managers), around
one third of the respondents are human resources experts, following by specialist
managers, for example head of departments.
The vast majority of the responding companies are private profit organisations. In all
EMCOSU countries this number overreached three quarters of the included companies,
from 77 per cents in Poland to 95 per cents in Spain, and the total average is 88 per cent
of companies with private profit structure.
The sample includes also public companies and organisations and private non-profit
organisations, however their number is comparing to private profit organisations quite
low – the lowest in Spain and the highest in Poland. In total there are seven per cent
public companies and organisations and three per cent private non-profit organisations.
The numbers of the employees in the responding companies are categorized in the three
main categories – if there are ten or less employees the company is recognized as micro,
companies with more than 10 and up to 250 employees are marked as small and
16
medium enterprises (SME), and companies with more than 250 employees are
considered as large.
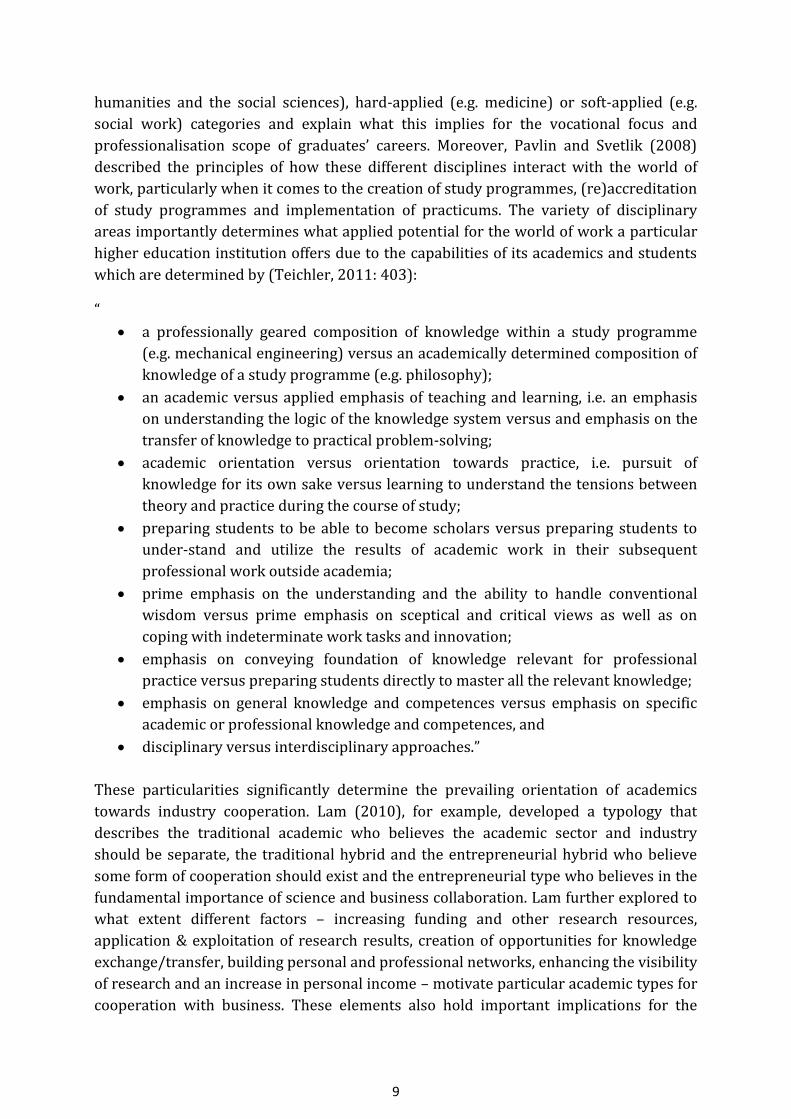
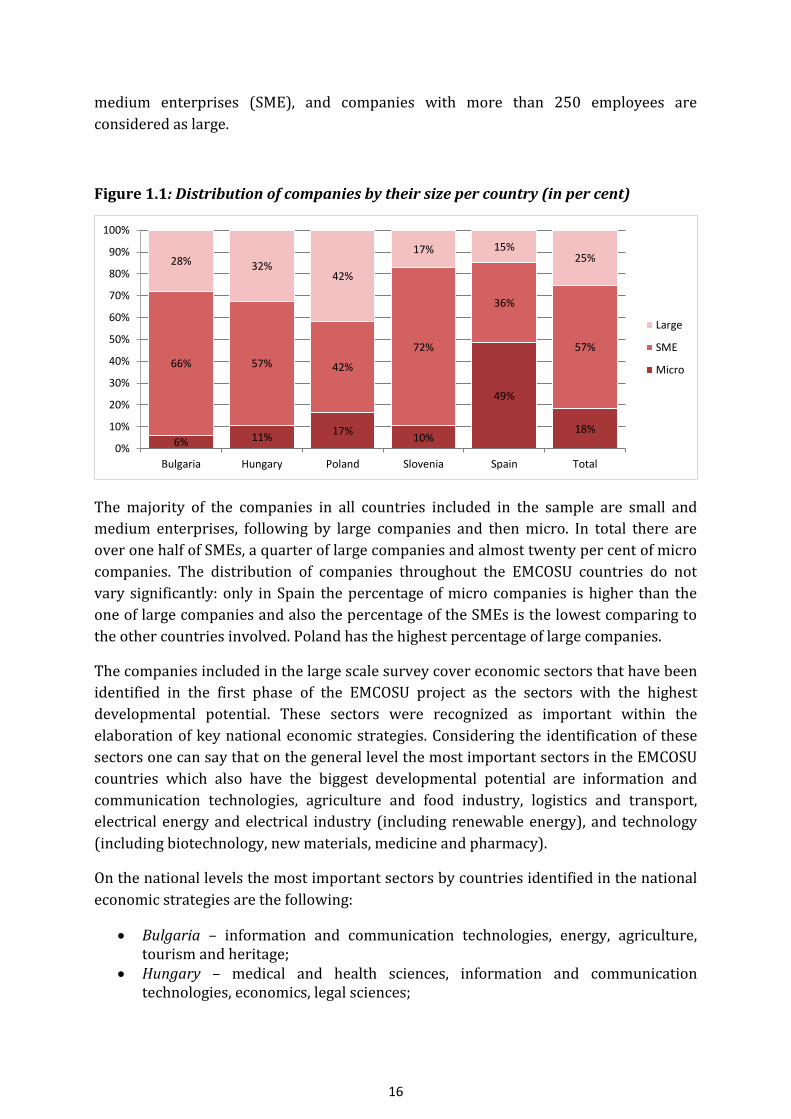
Figure 1.1: Distribution of companies by their size per country (in per cent)
The majority of the companies in all countries included in the sample are small and
medium enterprises, following by large companies and then micro. In total there are
over one half of SMEs, a quarter of large companies and almost twenty per cent of micro
companies. The distribution of companies throughout the EMCOSU countries do not
vary significantly: only in Spain the percentage of micro companies is higher than the
one of large companies and also the percentage of the SMEs is the lowest comparing to
the other countries involved. Poland has the highest percentage of large companies.
The companies included in the large scale survey cover economic sectors that have been
identified in the first phase of the EMCOSU project as the sectors with the highest
developmental potential. These sectors were recognized as important within the
elaboration of key national economic strategies. Considering the identification of these
sectors one can say that on the general level the most important sectors in the EMCOSU
countries which also have the biggest developmental potential are information and
communication technologies, agriculture and food industry, logistics and transport,
electrical energy and electrical industry (including renewable energy), and technology
(including biotechnology, new materials, medicine and pharmacy).
On the national levels the most important sectors by countries identified in the national
economic strategies are the following:
Bulgaria – information and communication technologies, energy, agriculture, tourism and heritage;
Hungary – medical and health sciences, information and communication technologies, economics, legal sciences;
6% 11% 17%
10%
49%
18%
66% 57% 42%
72%
36%
57%
28% 32% 42%
17% 15% 25%
0%
10%
20%
30%
40%
50%
60%
70%
80%
90%
100%
Bulgaria Hungary Poland Slovenia Spain Total
Large
SME
Micro

17
Poland - information and communication technologies, pharmacy, energy, transport and storage;
Slovenia - information and communication technologies, life sciences (including biotechnology, medicine, pharmacy, food processing), advanced materials and nanotechnology, electrical and electronics industry;
Spain – automotive industry, renewable energy, technology sector, consulting services.
The economic sectors of the companies that have been selected for the participation in
the large scale survey have been in line with the identified key sectors and are
categorised in the three broad categories of economic sectors: industry, service and
information and communication technologies. The large scale survey was targeted to
reach 40 per cent of the companies from the industry, 40 per cent from the services and
20 per cent of the companies from the ICT sector, however the national particularities of
the key sectors have also not been omitted.
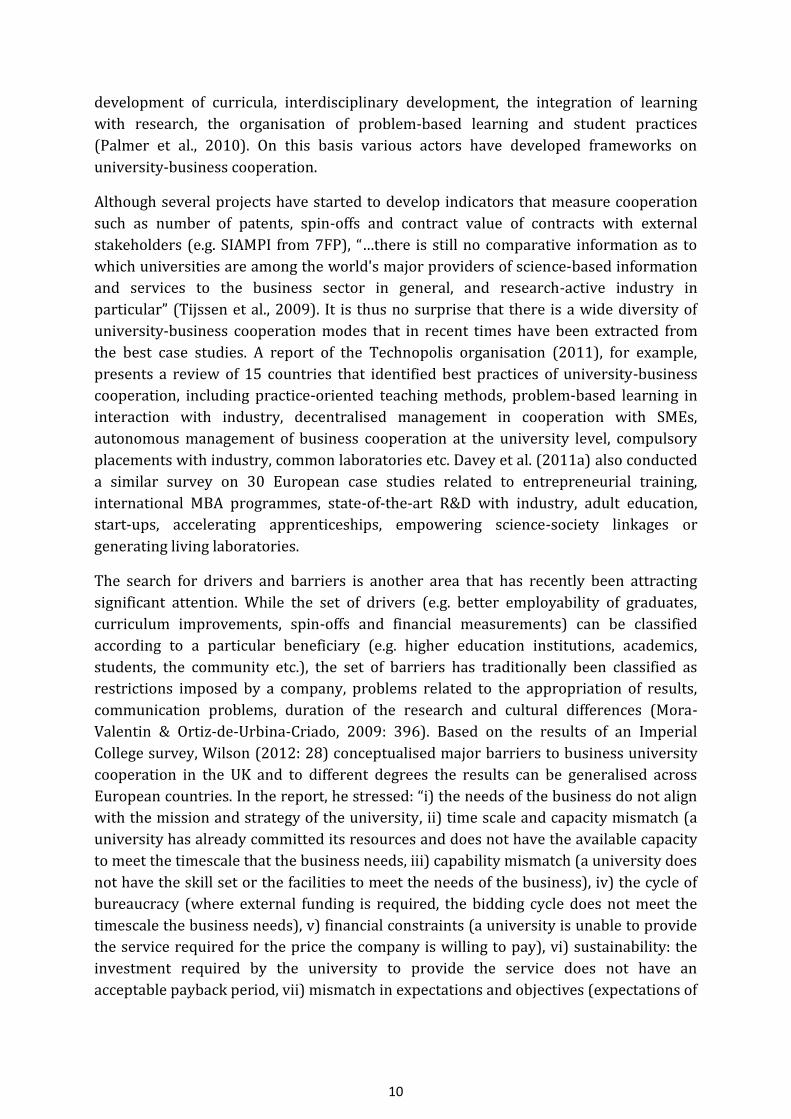
Figure 1.2: Distribution of companies by economic sector per country (in per cent)
In total the proportion of responding companies from the industry sectors reaches the
highest level, which is 40 per cent, followed by companies in service sector with 35 per
cent and ICT companies with 25 per cent. The highest proportions of the companies
from industry sector are in Hungary and in Slovenia, and consequently, the lowest
proportions of companies from the service sector are to be found in those two countries.
Bulgaria has the lowest proportion of companies from the industry sector and the
highest from the service sector. Regarding the ICT sector the proportion among the
countries is similar; however the lowest is in Hungary and the highest in Bulgaria.
To sum – the following empirical analyses are based on the data obtained through a
large scale survey among almost 400 companies in five EU countries. The large majority
of the companies are private profit organisations and most of them can be identified as
small and medium enterprises. The companies are categorized into three broad
19%
60%
34%
60%
32% 40%
47%
28%
43%
16%
39% 35%
34%
12% 23% 24% 28% 25%
0%
10%
20%
30%
40%
50%
60%
70%
80%
90%
100%
Bulgaria Hungary Poland Slovenia Spain Total
IT
Service
Industry
18
economic sectors: industry, service and ICT and were selected upon the elaboration of
the key economic sectors with the highest developmental potential.
Additional to the analyses among companies’ representatives in five EMCOSU countries,
one chapter of the report includes also an analyses of 89 responses of companies’
representatives from countries and regions outside the project consortium, namely from
Croatia, Czech Republic and Slovakia, Italy, Ex-YU countries, Scandinavia, Continental
region, Russia.
As mentioned earlier the analyses include also the responses of representatives of
employers’ associations and specific sector experts. In Bulgaria, Poland, Slovenia and
few non-EMCOSU countries the project partners implemented a survey among
employers’ associations, but in Hungary, Spain and also few non-EMCOSU countries the
project partners implemented a part of the large scale survey among sector experts.
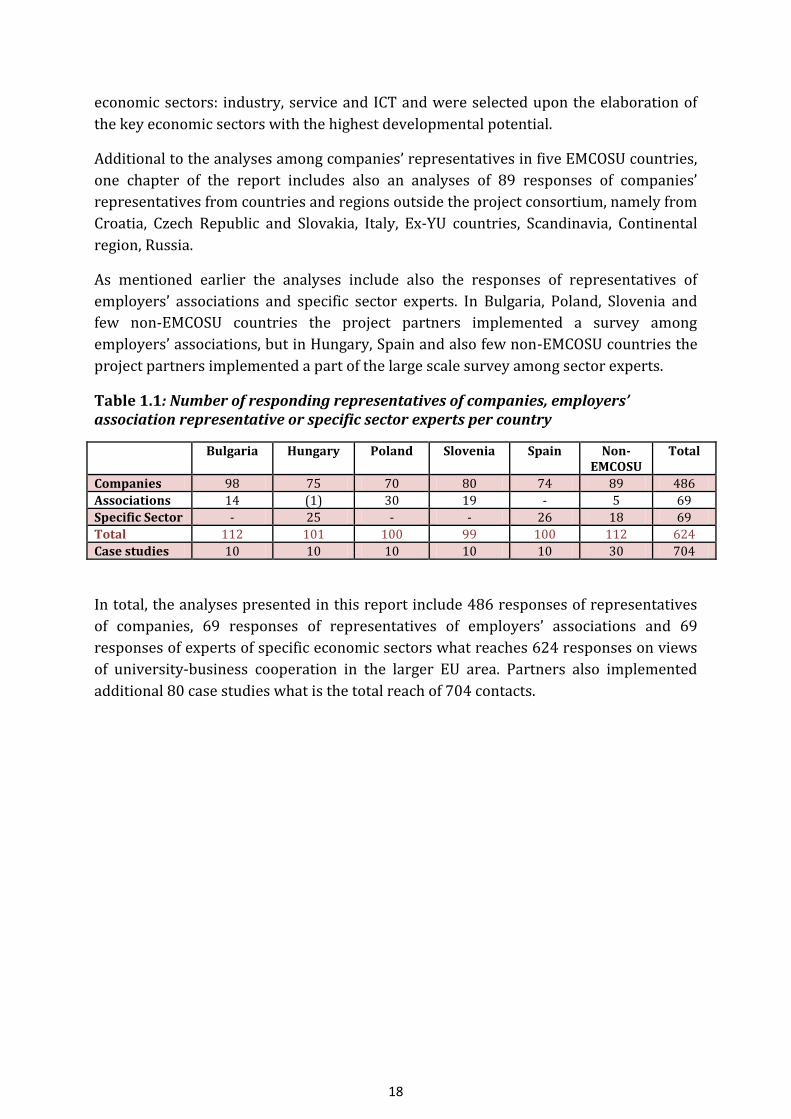
Table 1.1: Number of responding representatives of companies, employers’ association representative or specific sector experts per country
Bulgaria Hungary Poland Slovenia Spain Non-EMCOSU
Total
Companies 98 75 70 80 74 89 486
Associations 14 (1) 30 19 - 5 69
Specific Sector - 25 - - 26 18 69
Total 112 101 100 99 100 112 624
Case studies 10 10 10 10 10 30 704
In total, the analyses presented in this report include 486 responses of representatives
of companies, 69 responses of representatives of employers’ associations and 69
responses of experts of specific economic sectors what reaches 624 responses on views
of university-business cooperation in the larger EU area. Partners also implemented
additional 80 case studies what is the total reach of 704 contacts.

19
2 Modes and Activities of University-Business Cooperation
Mateja Melink and Samo Pavlin
In order to follow the EMCOSU project’s main objectives the sampling plan of the large
scale survey envisaged the inclusion of the companies which have already developed
modes of cooperation with higher education institutions. However, the selection
included also the companies without UBC in order to identify the major barriers,
challenges and motives of possible future cooperation1.
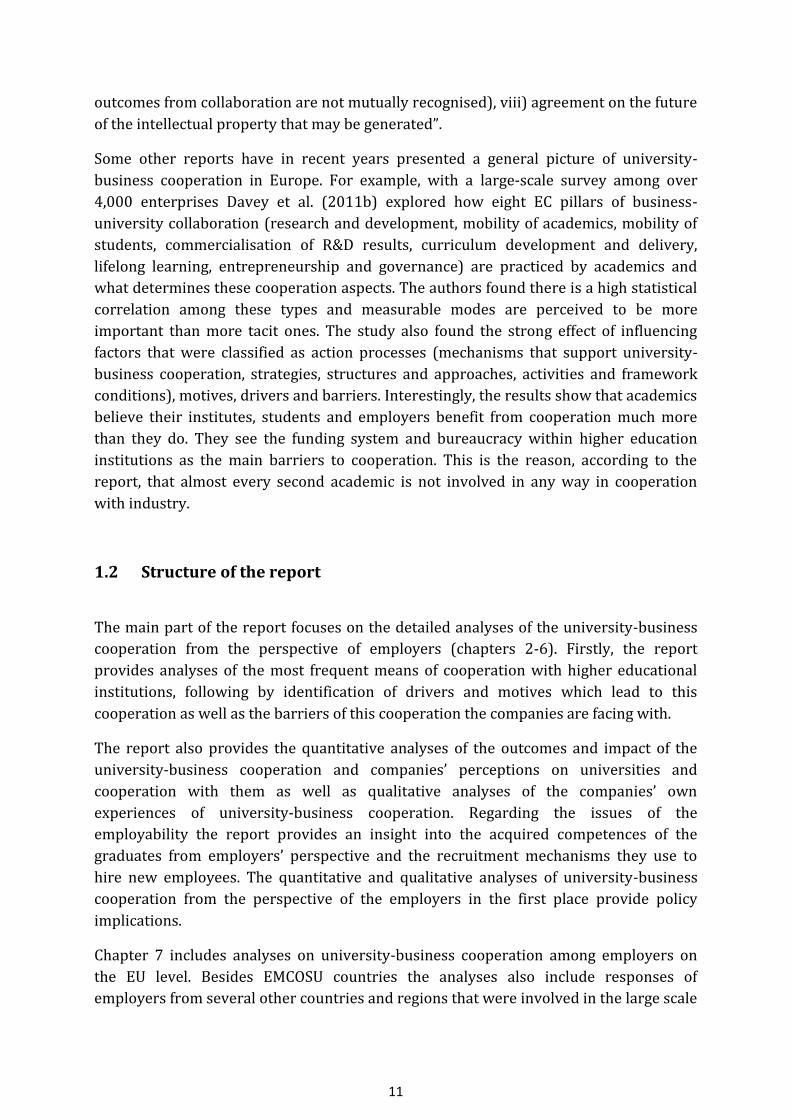
Figure 2.1: Distribution of companies with university-business cooperation per country (in per cent)
In total there is around one third of companies with no or minor extent of university-
business cooperation with the highest percentage in Hungary where over half of the
approached companies does not have developed university-business cooperation and
Poland with around 40 per cent of companies with low extent of cooperation with
universities. Consequently those two countries reach the lowest percentage of
companies with high extent of university-business cooperation, along with Spain.
Meanwhile in Slovenia there are more than one third of companies with high extent of
1 The distribution of the companies into the categories related to the extent of the university-business cooperation was prepared on a basis of
the responses of the companies to the question to what extent they cooperate with higher education institutions regarding the activities listed
in a questionnaire. Five variables each with a value from 1 (not at all) to 7 (to a very high extent) were computed into one common variable
and the newly computed values later divided into three parts: a) no or minor extent of university-business cooperation; b) medium extent of
university-business cooperation; c) high extent of university-business cooperation. Point a) includes computed values from 5 to 11, what
means that the equal distribution of the company’s responses would include values 1 and 2. Point b) includes computed values from 12-19
and point c) includes computed values from 20 to 35.
23%
52%
41%
28% 32% 34%
47%
35%
38%
36%
46% 41%
30%
13% 22%
36%
21% 25%
0%
10%
20%
30%
40%
50%
60%
70%
80%
90%
100%
Bulgaria Hungary Poland Slovenia Spain Total
High extent of UBC
Medium extent of UBC
No or minor extent of UBC

20
cooperation. The majority of companies reported that the extent of their cooperation
with universities reaches medium level.
In the total average of all EMCOSU countries the most common activity of the university-
business cooperation are the following:
Mobility of students ⦋1⦌
Research and development ⦋2⦌
Curriculum development ⦋3⦌
Adult learning* ⦋4⦌
Mobility of academics ⦋5⦌ *Comment: This average excludes Bulgaria due to exceptional high value of this activity in this country.
Table 2.1: Comparison ranks of UBC modes among employers, academics and HEI representatives
UBC activities Employers Academics HEI representatives
Mobility of students 1 2 2 R&D 2 1 1 Curriculum development 3 4 4 Adult learning, lifelong learning
4 3 3
Mobility of academics 5 5 5
Sources: EMCOSU analyses, Davey et al. (2011b, 45-46)
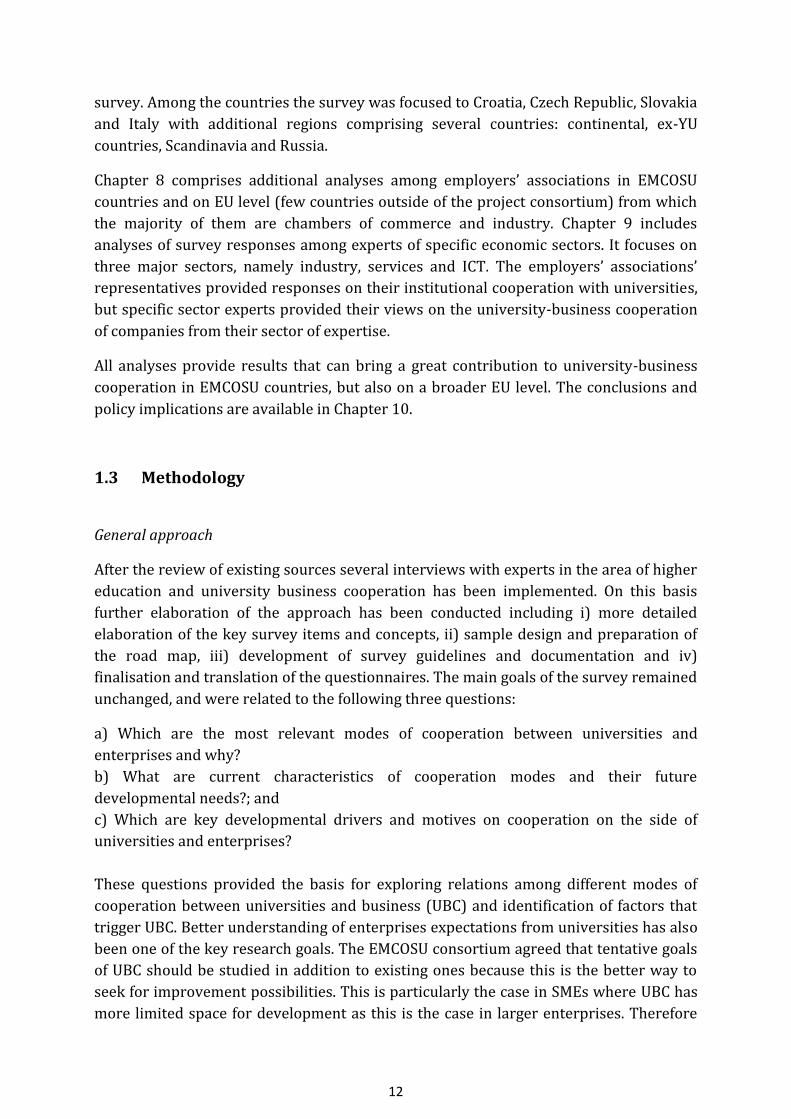
The highest percentage of companies with cooperation in research and development can
be found in Slovenia and in Spain and the lowest in Bulgaria. Cooperation in research
and development is on average the highest in the industry sector, however the sectors of
service and IT gain approximately the same percentage. A representative of a Slovenian
company from the industry sector reported that the output of the cooperation with a
faculty of mechanical engineering resulted into the “improvement of the current
manufacturing technologies of the company”. Comparing to other two sectors in Poland
and Slovenia the research and development cooperation is quite low in IT sector, and in
Spain in the sector of services. Slovenia is also the only country where the highest
percentage of this cooperation is in services sector and Bulgaria the only country where
the highest percentage of cooperation is in IT.
21
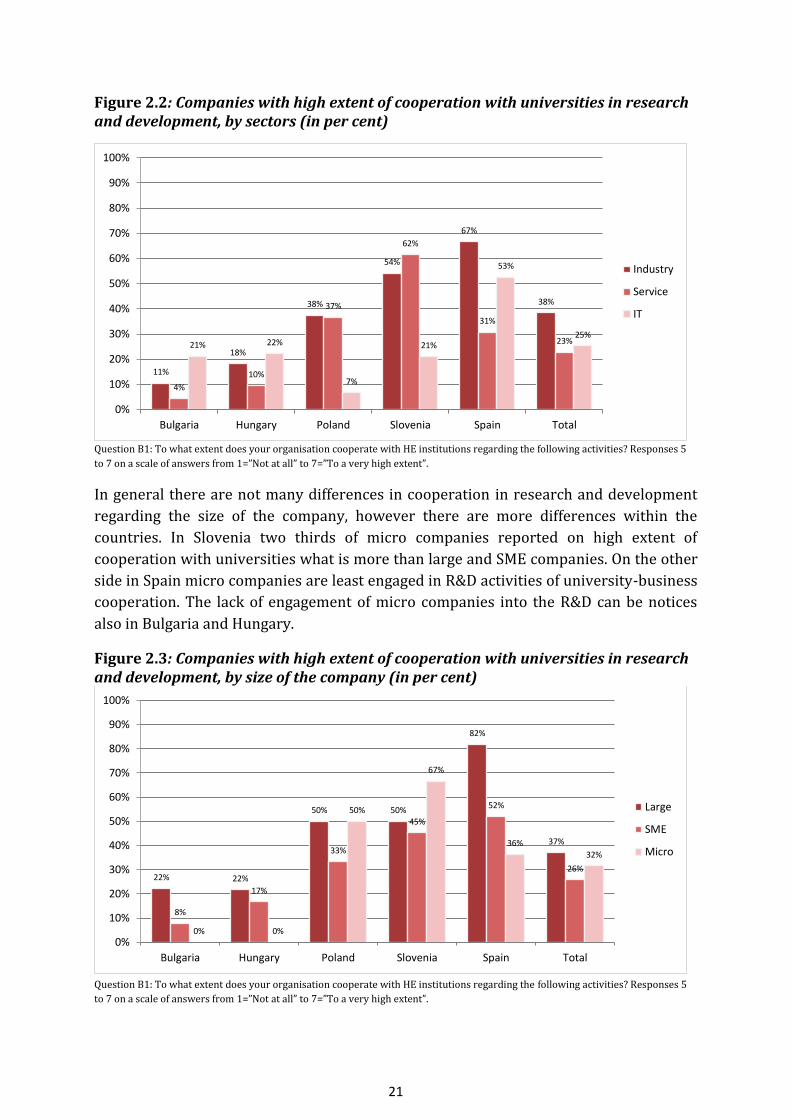
Figure 2.2: Companies with high extent of cooperation with universities in research and development, by sectors (in per cent)
Question B1: To what extent does your organisation cooperate with HE institutions regarding the following activities? Responses 5
to 7 on a scale of answers from 1=”Not at all” to 7=”To a very high extent”.
In general there are not many differences in cooperation in research and development
regarding the size of the company, however there are more differences within the
countries. In Slovenia two thirds of micro companies reported on high extent of
cooperation with universities what is more than large and SME companies. On the other
side in Spain micro companies are least engaged in R&D activities of university-business
cooperation. The lack of engagement of micro companies into the R&D can be notices
also in Bulgaria and Hungary.
Figure 2.3: Companies with high extent of cooperation with universities in research and development, by size of the company (in per cent)
Question B1: To what extent does your organisation cooperate with HE institutions regarding the following activities? Responses 5
to 7 on a scale of answers from 1=”Not at all” to 7=”To a very high extent”.
11%
18%
38%
54%
67%
38%
4%
10%
37%
62%
31%
23% 21% 22%
7%
21%
53%
25%
0%
10%
20%
30%
40%
50%
60%
70%
80%
90%
100%
Bulgaria Hungary Poland Slovenia Spain Total
Industry
Service
IT
22% 22%
50% 50%
82%
37%
8%
17%
33%
45%
52%
26%
0% 0%
50%
67%
36%
32%
0%
10%
20%
30%
40%
50%
60%
70%
80%
90%
100%
Bulgaria Hungary Poland Slovenia Spain Total
Large
SME
Micro
22
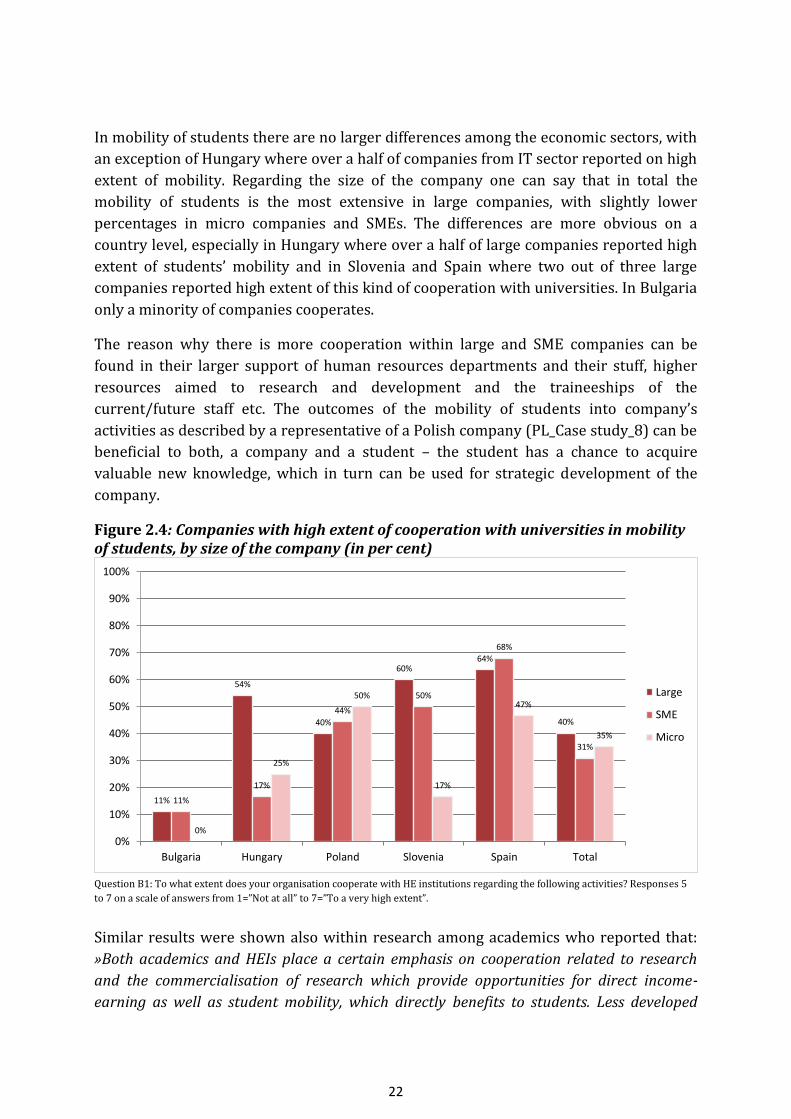
In mobility of students there are no larger differences among the economic sectors, with
an exception of Hungary where over a half of companies from IT sector reported on high
extent of mobility. Regarding the size of the company one can say that in total the
mobility of students is the most extensive in large companies, with slightly lower
percentages in micro companies and SMEs. The differences are more obvious on a
country level, especially in Hungary where over a half of large companies reported high
extent of students’ mobility and in Slovenia and Spain where two out of three large
companies reported high extent of this kind of cooperation with universities. In Bulgaria
only a minority of companies cooperates.
The reason why there is more cooperation within large and SME companies can be
found in their larger support of human resources departments and their stuff, higher
resources aimed to research and development and the traineeships of the
current/future staff etc. The outcomes of the mobility of students into company’s
activities as described by a representative of a Polish company (PL_Case study_8) can be
beneficial to both, a company and a student – the student has a chance to acquire
valuable new knowledge, which in turn can be used for strategic development of the
company.
Figure 2.4: Companies with high extent of cooperation with universities in mobility of students, by size of the company (in per cent)
Question B1: To what extent does your organisation cooperate with HE institutions regarding the following activities? Responses 5
to 7 on a scale of answers from 1=”Not at all” to 7=”To a very high extent”.
Similar results were shown also within research among academics who reported that:
»Both academics and HEIs place a certain emphasis on cooperation related to research
and the commercialisation of research which provide opportunities for direct income-
earning as well as student mobility, which directly benefits to students. Less developed
11%
54%
40%
60% 64%
40%
11%
17%
44%
50%
68%
31%
0%
25%
50%
17%
47%
35%
0%
10%
20%
30%
40%
50%
60%
70%
80%
90%
100%
Bulgaria Hungary Poland Slovenia Spain Total
Large
SME
Micro

23
cooperation can be found in more academic cooperation types (i.e. lifelong learning and
curriculum development), whilst other less measurable cooperation types that provide a
more indirect benefit and little ability to promote (governance and mobility of academics),
are the least developed types of university-business cooperation« (Source: Science-to-
Business Marketing Research Centre, 2012).
Companies were also asked to report how often they engage in the activities of
university-business cooperation listed in the questionnaire. The list below provides the
activities from most often to the least often:
• Participation of business people in study, teaching and research activities ⦋1⦌
• Cooperation with HEI’s career offices ⦋2⦌
• Cooperation with institutes focused on UBC ⦋3⦌
• Cooperation with incubators for the development of new businesses ⦋4⦌
• Participation in the activities of alumni networks ⦋5⦌
• Participation of business people on HEI boards ⦋6⦌
• Participation of academics on company boards ⦋7⦌
Table 2.2: Comparison ranks of extent of UBC activities among employers and HEI representatives
UBC activities Employers HEI representatives
Participation of business people in study, teaching and research activities
1 4
Cooperation with HEI’s career offices 2 1 Cooperation with institutes focused on UBC 3 5 Cooperation with incubators for the development of new businesses
4 6
Participation in the activities of alumni networks 5 2 Participation of business people on HEI boards 6 3 Participation of academics on company boards 7 7 Sources: EMCOSU analyses, Davey et al. (2011b, 81)
In total they most often engage in the study, teaching and research activities, followed by
cooperation with career offices. We can assume that company representatives are often
invited to participate in educational processes as invited lecturers and researchers. The
case from Bulgaria (a company from the sector of food production) (BG_Case study_4)
shows an example of a company-delivered course: “Throughout the years our company
has worked with different universities on various projects but the most significant is the
academic course delivered by our employees named ‘Skills for negotiations’ which was a
part of the Master’s program in Business at the university. The course comprised five
lectures delivered by our specialists in sales, purchase, finance, human resources, quality,
new products development and others.« However, regarding the responses from the
representatives of companies, company-based courses are still very rare, but it is more
common to be invited as guest lecturers.
24
Regarding the cooperation with career offices the companies are often participating on
career offices’ job fairs and related employment event etc. The representative of a
marketing company from Bulgaria emphasised that the goal of the company’s
presentation at the career office event is to present new marketing concepts to students
and to motivate them to pursue careers in online marketing. Very often the most inspired
students contact us after such events. We are glad to offer them internships if they are
interested” (BG_Case study_9).
Companies are least often engaged in higher education boards and also academics are
least often engaged on company boards. Even though the inclusion of academics on
company boards is least often, a representative from Poland reported on the benefits of
participation of academics in a private sector: “This facilitates contacts at the individual
level with researchers at universities and allows presenting an offer to the university in a
way attractive for it. With researchers in the management structures dialogue with
universities is easier. Employment of university staff allows the company to have indirectly
impact on the development of the university, including e.g. investment in rigging
laboratory chemicals. This symbiosis allows the university to effectively spend resources to
equip and educate graduates ready to enter the labour market in the region. Also the
problem of inadequate communication between the university and the company has been
eliminated” (PL_Case study_9). Also the results of DEHEMS project show that employers
would like to participate in higher education on more formal bases, for example by
creation of a robust mechanism for adapting study programmes to their needs what can
be best achieved by being involved in all aspects of curriculum development (Melink,
Pavlin; 2012).
The figure below shows that in general the companies from IT sector are most often
engaged in the cooperation with career offices, around half of them, however only in
Slovenia they are engaged to a quite lower extent – around one company out of ten. If we
compare the engagement among the countries, one can see that Bulgarian companies
from all sector reach over 60 per cent, as in the other countries the percentages of often
engagement in the cooperation with career offices is below 50 per cent in all sectors.
Regarding the size of the companies large companies are those which are more often
engaged into the cooperation with the career offices comparing to small and medium
enterprises and micro companies. As it has been already pointed out in the paragraphs
above, large companies have usually larger and stronger support from their
departments (HR, R&D) to get involved with the universities and on the other side they
usually carry higher social awareness and responsibility for the local/regional/national
development. The future development of university-business cooperation should
provide more incentives for the inclusion of micro companies and SMEs into higher
education activities, especially if taken into the account that two thirds of the companies
belong to a category of micro and small and medium companies.

25
Figure 2.5: Companies cooperating with HE career offices, by sector (in per cent)
Question B5: How often does your organisation engage in the following activities in relation to HE institutions? Responses 5 to 7 on a
scale of answers from 1=”Not at all” to 7=”Very often”.
One of the most often activity of cooperation between companies and the universities is
also the participation of business people in higher education’s study, teaching and
research activities what it should not be surprising since also research and development
is one of the mode of cooperation between the two stakeholders that is used to a high
extent.
From the point of view of different economic sectors the business people from IT sector
are most often involved in the teaching and research activities of the universities (more
than a half), with industry and service sectors sharing almost the same but lower
percentage (around one third). Regarding the size of the companies the differences
among large, SME and micro companies are in general also not so big.
It is interesting to note that there are more differences among the countries. The
participation of business people from the industry sector in the universities’ activities is
most frequent in Bulgaria and in Spain, in Slovenia this percentage is the highest in the
sector of services, and in Hungary and Poland in the sector of IT. There are also obvious
differences among countries regarding the size of the companies. On one side around
two thirds of the micro companies from Bulgaria, Hungary and Spain reported they
often participate in the universities’ teaching and research activities, while on the other
side this percentage is significantly lower in Poland and Slovenia.
95%
24% 29%
13%
32% 31%
67%
29%
17%
46%
29%
41%
88%
33%
47%
11%
22%
48%
0%
10%
20%
30%
40%
50%
60%
70%
80%
90%
100%
Bulgaria Hungary Poland Slovenia Spain Total
Industry
Services
IT

26
Figure 2.6: Participation of business people in HE study, teaching and research activities, by sector (in per cent)
Question B5: How often does your organisation engage in the following activities in relation to HE institutions? Responses 5 to 7 on a
scale of answers from 1=”Not at all” to 7=”Very often”.
In a nutshell, companies are most often and to a larger extent included in research and
development and teaching activities at the universities in almost all EMCOSU countries.
Throughout the cooperation with the universities they are also looking for the
opportunities to approach the students as their potential future employees in a form of
mobilisation of students into their environment and their presentation to students on
career events.
In total picture there are no major differences among companies of different sizes or of
different economic sectors, but are these differences more obviously shown within each
of the EMCOSU country and also in comparison of one country to another. However, we
can still point out that larger companies are usually more involved into the cooperation
with higher education institutions, assumable due to a larger support they have within
their own company, especially regarding the broader activities of human resources
departments and larger staff needs. Taking into the account that national economies
consist of a high share of micro and small-medium companies the future emphasis of the
university-business cooperation should also target to them.
The next chapter of this report focuses on the drivers and barriers of the cooperation
between universities and companies.
79%
27%
33%
19%
64%
37% 35%
14%
30%
54% 52%
35%
70% 67%
47%
32% 35%
52%
0%
10%
20%
30%
40%
50%
60%
70%
80%
90%
100%
Bulgaria Hungary Poland Slovenia Spain Total
Industry
Services
IT

27
3 Drivers and Barriers of University-Business Cooperation
Samo Pavlin
The representatives of the companies were also asked to provide information on the
factors that facilitate their cooperation with higher education institutions and the
barriers to university-business cooperation. The general list of drivers of university-
business cooperation is the following, with the most common driver on the top:
• Existence of mutual trust and commitment ⦋1⦌
• Existence of shared motives ⦋2⦌
• Prior relationship with HEI ⦋3⦌
• Interest of HEI in accessing practical knowledge ⦋4⦌
• Close geographical distance of HEI ⦋5⦌
• Access to HEI's R&D facilities ⦋6⦌
• Financial resources for working with HEI ⦋7⦌
• Flexibility of HEI ⦋8⦌
Table 3.1: Comparison ranks of drivers of UBC among employers, academics and HEI representatives
Drivers of UBC Employers Academics and HEI representatives
Existence of mutual trust and commitment
1 1
Existence of shared motives 2 2 Prior relationship with HEI 3 3 Interest of HEI in accessing practical knowledge
4 4 (Interest of business in accessing scientific knowledge)
Close geographical distance of HEI 5 6 Access to HEI's R&D facilities 6 8 (Access to business-sector
research and development facilities) Financial resources for working with HEI
7 5
Flexibility of HEI 8 7 Sources: EMCOSU analyses, Davey et al. (2011b, 67)
However, there are few differences among EMCOSU countries. In Hungary the prevailing
factor is interest of higher education institutions in accessing practical knowledge and in
Bulgaria the existence of shared motives. Besides those two facilitating factors the
companies reported quite to a large extent that the driver for their cooperation with
universities is also prior relationships with them. The least often factors that were
reported as facilitating factors of university-business cooperation are of a financial
nature and the flexibility of higher education institutions, however one cannot say

28
whether they are meant also as barriers. It is interesting to note that the results of a
research among academics on the most important drivers for university-business
cooperation are the same. They rated the existence of mutual trust, mutual commitment
and shared goals as essential drivers of cooperation (Davey and others edt. 2011).
Figure 3.1: Existence of mutual trust and commitment as facilitating factor of cooperation between company and HE institutions, by size of the company (in per cent)
Question B6: How much do the following statements facilitate your organisation’s cooperation with HE institutions? Responses 5 to
7 on a scale of answers from 1=”Not at all” to 7=”To a very high extent”.
In general the existence of mutual trust as a driver for university-business cooperation
is higher in large companies than in SMEs and micro companies. This can be explained
by the fact that as seen from the results above large companies are also more willing to
cooperate with higher education institutions and their cooperation is often already long-
lasting what allows that the trust and commitment between the two stakeholders is
built.
Not surprisingly the mutual trust and commitment is the factor that promotes the
cooperation with universities to a high extent among those companies which already
have high extent of university-business cooperation, followed by companies with
medium extent of cooperation and minor or non-extent. Regarding the economic sector
of companies' activities there are no major differences among them.
The companies were also requested to identify the main barriers they are facing when it
comes to the cooperation with the higher education institutions. The barriers listed from
the most relevant to the least are the following:
44%
75%
90%
60%
82%
66%
44%
39%
78%
60%
76%
52%
17%
63%
100%
50%
63%
59%
0%
10%
20%
30%
40%
50%
60%
70%
80%
90%
100%
Bulgaria Hungary Poland Slovenia Spain Total
Large
SME
Micro
29
Bureaucracy within or external to the higher education institutions ⦋1⦌
Different time horizons between higher education institutions and business ⦋2⦌
Different motivations and values between higher education institutions and
business ⦋3⦌
Difficulty in finding the appropriate persons within higher education institutions
⦋4⦌
Different modes of communication and language between higher education
institutions and business ⦋5⦌
Limited ability of knowledge transfer ⦋6⦌
Higher education institutions want to publish confidential results ⦋7⦌
The current financial crisis ⦋8⦌
Table 3.2: Comparison ranks of barriers to UBC among employers, academics and HEI representatives
Barriers to UBC Employers Academics and HEI representatives
Bureaucracy within or external to the higher education institutions
1 4
Different time horizons 2 1 Different motivations and values 3 3 Difficulty in finding the appropriate persons within HEI 4 7 Different modes of communication and language 5 6 Limited ability of knowledge transfer 6 5 HEI want to publish confidential results 7 8 Current financial crisis 8 2
Sources: EMCOSU analyses, Davey et al. (2011b, 69)
The bureaucracy is one of the main barriers of cooperation in most EMCOSU countries.
As reported from a Spanish representative of a company “the main barrier the company
is facing in its relationship with the university is limited to administrative level. The
bureaucracy of the university is important and sometimes too much time is needed to
comply with the formalities required which in some cases can slow or even stop the
collaboration”. (SP_Case study_2). Similarly it was reported from a Hungarian
representative: “The barrier from the University side is that they need to document
everything, there is a lot of administration, despite the fact that an enterprise is only
curious about the solution”. (HU_Case study_9) As the representative reported the
bureaucracy is time demanding what the rapidly changing labour market cannot afford.
But there are not only employers who see the bureaucratic obstacles as relevant in
university-business cooperation. As reported in The State of European UBC report "the
vast majority of academics of all levels of university-business cooperation experience agree
that funding barriers and bureaucracy within the HEI are the most relevant barriers.
Further, they believe that the main responsibility for funding university-business

30
cooperation rests with the HEI, thus seeing the main barriers to university-business
cooperation within the HEI" (Davey and others; 2011).
In Bulgaria the main barrier is difficulty in finding the appropriate persons within HE
institutions and in Poland different motivations and values between higher education
institutions and business or as one of the interviewees reported: “Obstacle to mutual
cooperation are divergent methods of communication and language barrier between the
two sectors. A different time perspective and different motivations parties are undoubtedly
perceived as obstacle to conducting cross-sector cooperation “. (PL_Case study_2). Few
respondents from Poland also additionally mentioned the universities are not willing to
cooperate with business.
Throughout different sectors there are no major differences regarding marking
bureaucracy as a relevant barrier to university-business cooperation, with industry and
services sectors even with equal percentages. However there are larger differences
within particular country. In Hungary almost 90 per cent of companies from the IT
sector reported the bureaucracy within or external to the HE institutions means a
barrier to cooperation with them, comparing to around 50 per cents of responses from
industry and service, and in Spain this percentage is the highest in the industry sector
but in Polish industry sector is the lowest.
Figure 3.2: Bureaucracy within or external to the HE institutions as a barrier to cooperation with HE institutions, by sector (in per cent)
Question B7: How relevant are the following barriers to HE institutions-business cooperation? Responses 5 to 7 on a scale of
answers from 1=”Not at all” to 7=”To a very high extent”.
Regarding the size of the companies there are also no major differences within different
sizes. However, expectedly this percentage is the highest among micro companies and is
getting lower towards large companies. As was already explained in the chapter 4 of this
report, it is more likely that the large companies have more support in the
implementation of cooperation with universities, therefore it is also easier to overcome
68%
50%
29%
65%
90%
59% 59%
48%
63%
46%
67%
58% 58%
89%
53%
74% 74%
66%
0%
10%
20%
30%
40%
50%
60%
70%
80%
90%
100%
Bulgaria Hungary Poland Slovenia Spain Total
Industry
Services
IT
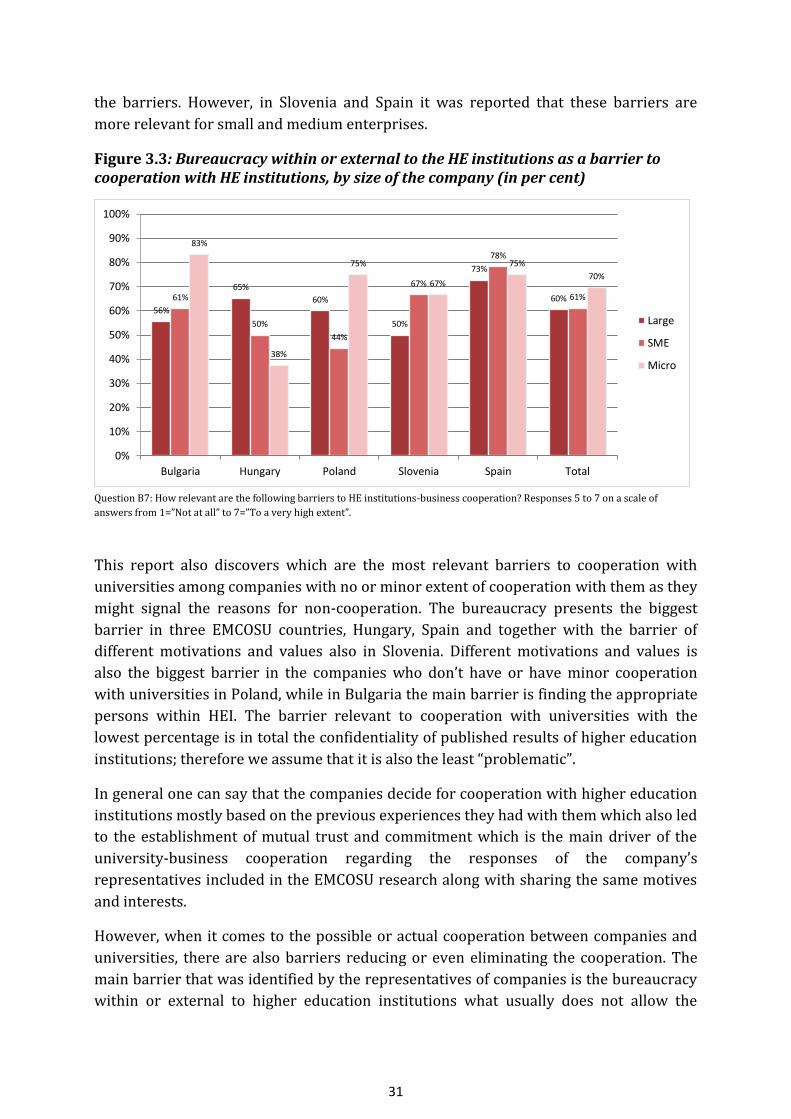
31
the barriers. However, in Slovenia and Spain it was reported that these barriers are
more relevant for small and medium enterprises.
Figure 3.3: Bureaucracy within or external to the HE institutions as a barrier to cooperation with HE institutions, by size of the company (in per cent)
Question B7: How relevant are the following barriers to HE institutions-business cooperation? Responses 5 to 7 on a scale of
answers from 1=”Not at all” to 7=”To a very high extent”.
This report also discovers which are the most relevant barriers to cooperation with
universities among companies with no or minor extent of cooperation with them as they
might signal the reasons for non-cooperation. The bureaucracy presents the biggest
barrier in three EMCOSU countries, Hungary, Spain and together with the barrier of
different motivations and values also in Slovenia. Different motivations and values is
also the biggest barrier in the companies who don’t have or have minor cooperation
with universities in Poland, while in Bulgaria the main barrier is finding the appropriate
persons within HEI. The barrier relevant to cooperation with universities with the
lowest percentage is in total the confidentiality of published results of higher education
institutions; therefore we assume that it is also the least “problematic”.
In general one can say that the companies decide for cooperation with higher education
institutions mostly based on the previous experiences they had with them which also led
to the establishment of mutual trust and commitment which is the main driver of the
university-business cooperation regarding the responses of the company’s
representatives included in the EMCOSU research along with sharing the same motives
and interests.
However, when it comes to the possible or actual cooperation between companies and
universities, there are also barriers reducing or even eliminating the cooperation. The
main barrier that was identified by the representatives of companies is the bureaucracy
within or external to higher education institutions what usually does not allow the
56%
65%
60%
50%
73%
60% 61%
50%
44%
67%
78%
61%
83%
38%
75%
67%
75%
70%
0%
10%
20%
30%
40%
50%
60%
70%
80%
90%
100%
Bulgaria Hungary Poland Slovenia Spain Total
Large
SME
Micro

32
flexibility of the cooperation that is required in the private sector. Thus, one of the main
challenges of the higher education systems and also other stakeholders, most notably
policy makers, will be to adapt, reduce and/or eliminate bureaucratic obstacles to the
establishment and implementation of university-business education.
Among the barriers to this cooperation we can include also different motivation and
values or as one representative of a Spanish company explained: “The activity of research
groups at universities and technology centres are far from the needs of businesses. For the
companies the most important is the generation of patents for commercial exploitation,
but the priority for universities is to publish the results of research. There is little market
orientation in the research activity of the universities. The work of researchers is measured
by the number of publications they do, not by its practical outcome”. Since sharing
motives, interests and values is one of the main drivers that facilitates university-
business cooperation but at the same time also one of the main barriers to it there
should be made several considerations whether the universities and their academic and
research staff should become more market oriented, what takes into the account also
the reorganisation of habilitation processes of the academics.
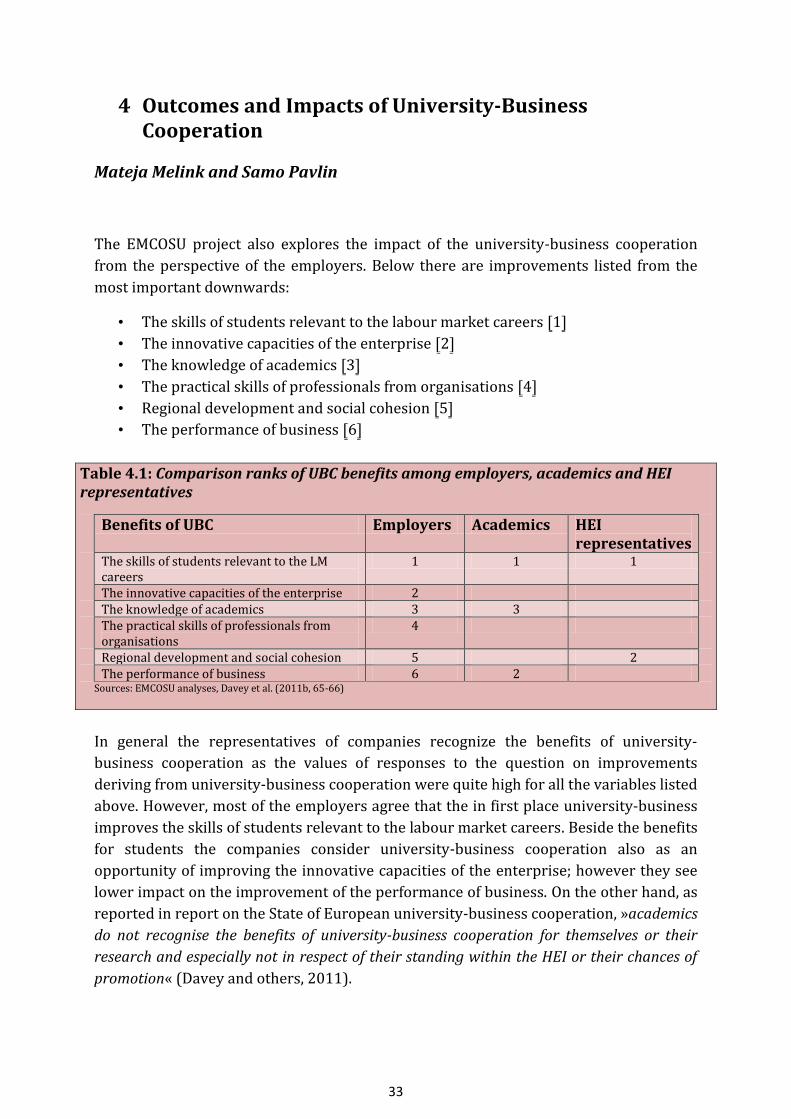
33
4 Outcomes and Impacts of University-Business Cooperation
Mateja Melink and Samo Pavlin
The EMCOSU project also explores the impact of the university-business cooperation
from the perspective of the employers. Below there are improvements listed from the
most important downwards:
• The skills of students relevant to the labour market careers ⦋1⦌
• The innovative capacities of the enterprise ⦋2⦌
• The knowledge of academics ⦋3⦌
• The practical skills of professionals from organisations ⦋4⦌
• Regional development and social cohesion ⦋5⦌
• The performance of business ⦋6⦌
Table 4.1: Comparison ranks of UBC benefits among employers, academics and HEI representatives
Benefits of UBC Employers Academics HEI representatives
The skills of students relevant to the LM careers
1 1 1
The innovative capacities of the enterprise 2 The knowledge of academics 3 3 The practical skills of professionals from organisations
4
Regional development and social cohesion 5 2 The performance of business 6 2
Sources: EMCOSU analyses, Davey et al. (2011b, 65-66)
In general the representatives of companies recognize the benefits of university-
business cooperation as the values of responses to the question on improvements
deriving from university-business cooperation were quite high for all the variables listed
above. However, most of the employers agree that the in first place university-business
improves the skills of students relevant to the labour market careers. Beside the benefits
for students the companies consider university-business cooperation also as an
opportunity of improving the innovative capacities of the enterprise; however they see
lower impact on the improvement of the performance of business. On the other hand, as
reported in report on the State of European university-business cooperation, »academics
do not recognise the benefits of university-business cooperation for themselves or their
research and especially not in respect of their standing within the HEI or their chances of
promotion« (Davey and others, 2011).

34
There are no major changes in the responses regarding sector division or the division of
the companies by their size where in total more than three quarters of respondents
reported that university-business cooperation improves students’ skills relevant for
their labour market careers. However, in Hungary the percentages are lower in services
sector and among small and medium companies. There is also an exception of the IT
sector in Slovenia and in Spain with smaller percentages of respondents comparing to
other two sectors. These percentages are significantly lower in Poland comparing to
other EMCOSU countries in both, economic sector and size of the companies.
The figure below shows shares of respondents from companies reporting the
improvement of skills of students through university-business cooperation that relevant
to the labour market careers. In almost all EMCOSU countries, except Spain, the
percentages among companies with high extent of cooperation are higher comparing to
companies with none or minor extent of university-business cooperation. These
percentages are again lower in Poland.
Figure 4.1: Improvement of the skills of students relevant to the labour market careers through university-business cooperation, by the extent of UBC (in per cent)
Question B9: Please indicate to what extent you agree with the following statements: HEI-business cooperation importantly
improves…? Responses 5 to 7 on a scale of answers from 1=”Not at all” to 7=”To a very high extent”.
According to the respondents the university-business cooperation also boosts the
innovative capacities of the companies. The majority of respondents who reported that
this cooperation improves innovative capacities to a high or very high extent are coming
from Slovenian and Spanish services sector and Bulgarian industry and IT sector.
Comparing to other EMCOSU countries Hungary and Poland hold lower percentages
what means that employers from those two countries see a potential of innovation
deriving from university-business cooperation to a smaller extent.
100% 100%
60%
97%
79%
89%
98%
77%
62%
76%
82% 81%
91%
79%
43%
82% 81%
74%
0%
10%
20%
30%
40%
50%
60%
70%
80%
90%
100%
Bulgaria Hungary Poland Slovenia Spain Total
High extent of UBC
Medium extent of UBC
Non or minor extent of UBC
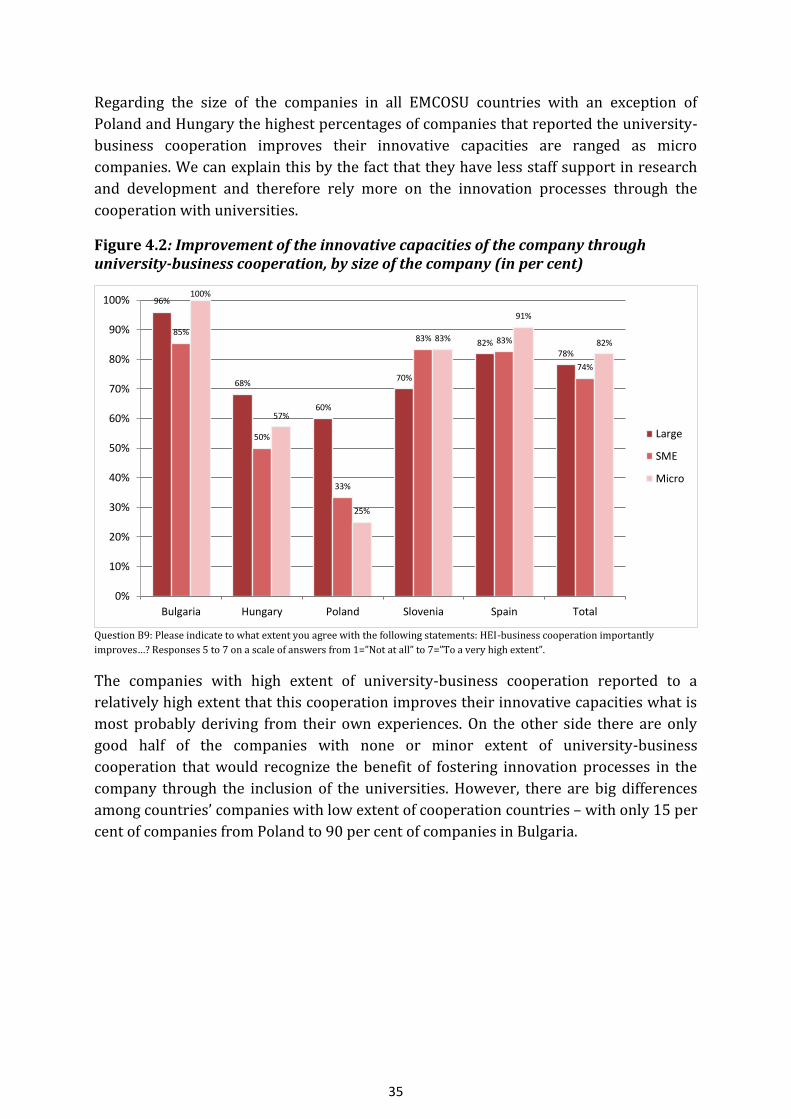
35
Regarding the size of the companies in all EMCOSU countries with an exception of
Poland and Hungary the highest percentages of companies that reported the university-
business cooperation improves their innovative capacities are ranged as micro
companies. We can explain this by the fact that they have less staff support in research
and development and therefore rely more on the innovation processes through the
cooperation with universities.
Figure 4.2: Improvement of the innovative capacities of the company through university-business cooperation, by size of the company (in per cent)
Question B9: Please indicate to what extent you agree with the following statements: HEI-business cooperation importantly
improves…? Responses 5 to 7 on a scale of answers from 1=”Not at all” to 7=”To a very high extent”.
The companies with high extent of university-business cooperation reported to a
relatively high extent that this cooperation improves their innovative capacities what is
most probably deriving from their own experiences. On the other side there are only
good half of the companies with none or minor extent of university-business
cooperation that would recognize the benefit of fostering innovation processes in the
company through the inclusion of the universities. However, there are big differences
among countries’ companies with low extent of cooperation countries – with only 15 per
cent of companies from Poland to 90 per cent of companies in Bulgaria.
96%
68%
60%
70%
82% 78%
85%
50%
33%
83% 83%
74%
100%
57%
25%
83%
91%
82%
0%
10%
20%
30%
40%
50%
60%
70%
80%
90%
100%
Bulgaria Hungary Poland Slovenia Spain Total
Large
SME
Micro

36
Figure 4.3: Improvement of the innovative capacities of the company through university-business cooperation, by the extent of cooperation (in per cent)
Question B9: Please indicate to what extent you agree with the following statements: HEI-business cooperation importantly
improves…? Responses 5 to 7 on a scale of answers from 1=”Not at all” to 7=”To a very high extent”.
Most of the variables that were available to the employers to evaluate the benefits of
university-business cooperation received high rates and one can say that in general the
employers recognize the benefits of cooperation with universities. The cooperation
should be mostly beneficial for students as it allows them to gain the practical skills that
are needed on the labour market and it also shows them an insight into the employers’
needs. But at the same time it provides the skills to the companies’ future employees,
therefore the cooperation is not just one-sided or as a Polish company representative
pointed out: “This form of cooperation has a direct tangible benefits to both the company
and the student. What is important for the company is that students have the chance to
acquire valuable new knowledge, which in turn can be used for strategic development of
the company” (PL_Case study_8). The two-sided benefit of university-business
cooperation was also stressed by a Spanish respondent: The main UBC benefits that the
company has obtained are related to student mobility. The company offers internships to
students and recent graduates. At the end of the traineeships, the students are usually
integrated into the business. This is a beneficial policy for the company because the costs
associated with recruitment are minimized. First, the training provided to the students is
essential for the performance of his/her job when he/she was hired. In addition, risks are
minimized because the company hires a person who has already had a background in the
business, for a time long enough to know if he or she fits for work.” Thus, we can conclude
that university-business cooperation not only that it provides good knowledge to the
students before entering the labour market but usually these students and their
internships are also a good investment for the company itself.
According to the reported responses the university-business cooperation also improves
the innovative capacities of the companies, where we suppose that the innovative
processes are run mostly through the research and development. The future
100%
90%
60%
90% 93%
89%
82%
56%
46%
72%
91%
72%
90%
49%
15%
77% 75%
57%
0%
10%
20%
30%
40%
50%
60%
70%
80%
90%
100%
Bulgaria Hungary Poland Slovenia Spain Total
High extent of UBC
Medium extent of UBC
Non or minor extent of UBC

37
development on this field could thus also include the presentation of good practices to
companies with weak cooperation with universities and their benefits.

38
5 Companies’ Perceptions on Universities and University-Business Cooperation
Mateja Melink and Samo Pavlin
The employers were also asked to report their opinion on the future developmental
needs in order to increase the university-business cooperation. The majority of the
companies believe that university-business cooperation should be upgraded for
application and commercial exploitation, approximately one out of three companies
believes in fundamental importance of university-business cooperation for research and
development and just minor shares of companies believe that this cooperation should
remain separated or limited to basic academic research. Only in Bulgaria the majority of
companies, that is two out of three, believe that university-business cooperation
provides fundamental importance for research and development. According to the share
of companies which believe the universities and companies should remain separate, we
can say that they are in favour of cooperation, however they strive towards the
commercialisation of this cooperation or at least to the common research and
developmental activities.
Figure 5.1: Orientation of companies on university-business cooperation (in per cent)
It is interesting to note from the figure below that in general and specifically in Slovenia,
Spain and Bulgaria the share of companies which are in favour of commercialisation of
the cooperation are those with non or minor extent of university-business cooperation
what can also mean that nonexistence of application and commercial oriented
cooperation is a barrier, but could also be a driver for those companies to engage in the
cooperation if it would follow those goals.
11% 2% 2% 2%
4%
4% 2%
66%
19%
21% 16%
47% 37%
32%
65% 77% 80%
53% 59%
0%
10%
20%
30%
40%
50%
60%
70%
80%
90%
100%
Bulgaria Hungary Poland Slovenia Spain Total
UBC should be upgraded forapplication and commercialexploitation
Fundamental importance ofUBC for research anddevelopment
Cooperation with HEIsshould be limited to basicacademic research
HEIs and industry shouldremain separate

39
Figure 5.2: Orientation of the company to upgrade the university-business cooperation for application and commercial exploitation, by the extent of UBC (in per cent)
Question B3: Please indicate which statement describes the orientation of your enterprise. Responses: “We believe HE institutions-
business cooperation should be upgraded for application and commercial exploitation
If we take a look at the results among different economic sectors and different sizes of
the companies in general the differences are not significantly obvious. But there are
more differences among countries. In Bulgaria, the share of companies which agree that
university-business cooperation should be upgraded for application and commercial
exploitation is significantly lower than in other countries. These percentages are the
highest in Slovenia where more than three out of four companies agree that university-
business cooperation should get more commercialised.
Figure 5.3: Orientation of the company to upgrade the university-business cooperation for application and commercial exploitation, by sector (in per cent)
Question B3: Please indicate which statement describes the orientation of your enterprise. Responses: “We believe HE institutions-
business cooperation should be upgraded for application and commercial exploitation
14%
80%
90%
83%
40%
55%
33%
81% 85%
69%
48%
58%
52% 50%
65%
91%
65% 63%
0%
10%
20%
30%
40%
50%
60%
70%
80%
90%
100%
Bulgaria Hungary Poland Slovenia Spain Total
High extent of UBC
Medium extent of UBC
Non or minor extent of UBC
32%
58%
71%
77%
59% 63%
33%
71%
83%
77%
48%
55%
30%
88%
75%
89%
52%
58%
0%
10%
20%
30%
40%
50%
60%
70%
80%
90%
100%
Bulgaria Hungary Poland Slovenia Spain Total
Industry
Service
IT
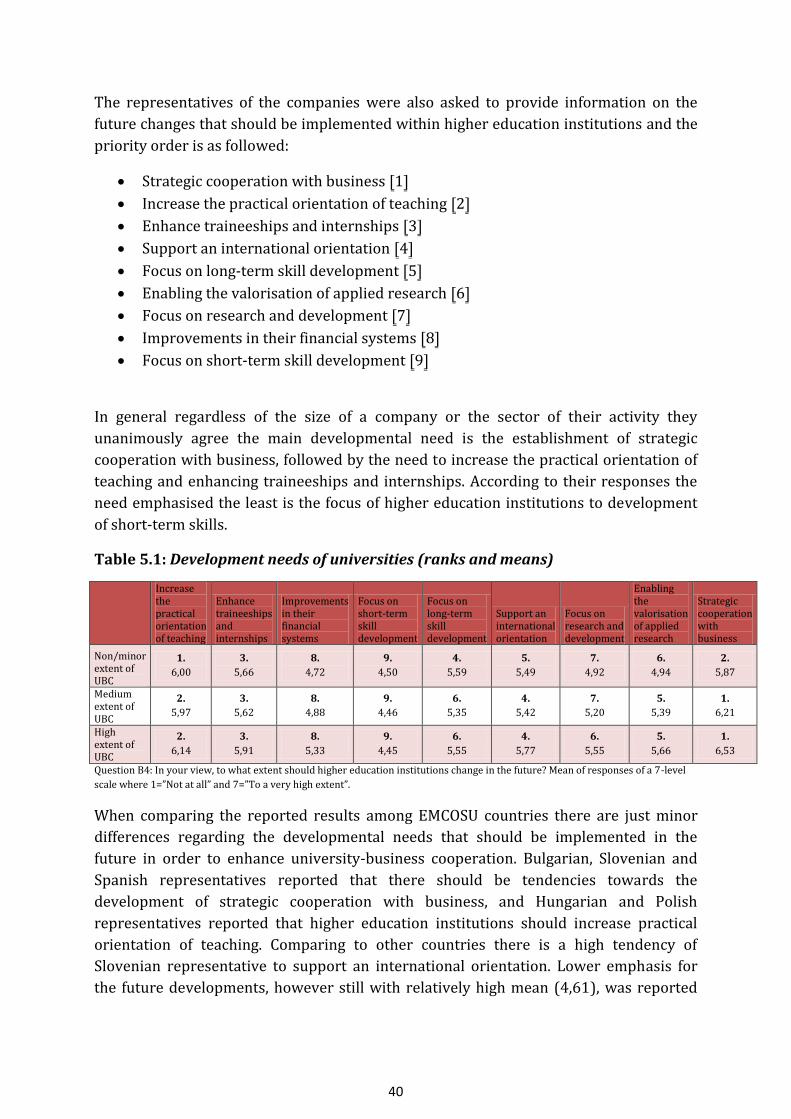
40
The representatives of the companies were also asked to provide information on the
future changes that should be implemented within higher education institutions and the
priority order is as followed:
Strategic cooperation with business ⦋1⦌
Increase the practical orientation of teaching ⦋2⦌
Enhance traineeships and internships ⦋3⦌
Support an international orientation ⦋4⦌
Focus on long-term skill development ⦋5⦌
Enabling the valorisation of applied research ⦋6⦌
Focus on research and development ⦋7⦌
Improvements in their financial systems ⦋8⦌
Focus on short-term skill development ⦋9⦌
In general regardless of the size of a company or the sector of their activity they
unanimously agree the main developmental need is the establishment of strategic
cooperation with business, followed by the need to increase the practical orientation of
teaching and enhancing traineeships and internships. According to their responses the
need emphasised the least is the focus of higher education institutions to development
of short-term skills.
Table 5.1: Development needs of universities (ranks and means)
Increase the practical orientation of teaching
Enhance traineeships and internships
Improvements in their financial systems
Focus on short-term skill development
Focus on long-term skill development
Support an international orientation
Focus on research and development
Enabling the valorisation of applied research
Strategic cooperation with business
Non/minor extent of UBC
1.
6,00
3.
5,66
8.
4,72
9.
4,50
4.
5,59
5.
5,49
7.
4,92
6.
4,94
2.
5,87
Medium extent of UBC
2.
5,97
3.
5,62
8.
4,88
9.
4,46
6.
5,35
4.
5,42
7.
5,20
5.
5,39
1.
6,21
High extent of UBC
2.
6,14
3.
5,91
8.
5,33
9.
4,45
6.
5,55
4.
5,77
6.
5,55
5.
5,66
1.
6,53
Question B4: In your view, to what extent should higher education institutions change in the future? Mean of responses of a 7-level
scale where 1=”Not at all” and 7=”To a very high extent”.
When comparing the reported results among EMCOSU countries there are just minor
differences regarding the developmental needs that should be implemented in the
future in order to enhance university-business cooperation. Bulgarian, Slovenian and
Spanish representatives reported that there should be tendencies towards the
development of strategic cooperation with business, and Hungarian and Polish
representatives reported that higher education institutions should increase practical
orientation of teaching. Comparing to other countries there is a high tendency of
Slovenian representative to support an international orientation. Lower emphasis for
the future developments, however still with relatively high mean (4,61), was reported

41
for focus on short-term skill development and improvements of the higher education
financial systems (mean in total 4,99).
42
6 University-Business Cooperation and Employability: Acquired Competencies and Recruitment Mechanisms
Mateja Melink and Samo Pavlin
It is not surprising that nowadays companies hire their new employee mostly through
the internet and this was confirmed also by the reports from the employers. Here it
needs to be pointed out that the questionnaire did not contain information what are the
internet tools that the companies use, whether these are job-seeking web sites, their
own web sites or even social networks. The companies are also hiring the graduates
through internship placements and private contacts, but to a quite smaller extent
through employment agencies:
• Through the internet ⦋1⦌
• Through an internship placement ⦋2⦌
• Through private contacts ⦋3⦌
• Through the help of HE institution ⦋4⦌
• Through a private employment agency ⦋5⦌
• Through a public employment agency ⦋6⦌
• Through an advertisement in a newspaper ⦋7⦌
In general there are no major differences regarding sector activities of the companies
when it comes to the recruitment of new employees though the internet, but the
differences are more obvious regarding the size of the company. On-line tools are the
recruitment mechanism that is used much more often in large companies than in small
and medium and micro companies in all EMCOSU countries except Bulgaria, where all
responding micro companies use it often and large companies use it to a much lower
extent. We can assume that usually large companies have more or less constant job
vacancies, and on the other side micro companies have less vacancies and assumable
hire more employees through personal contacts and/or internships.

43
Figure 6.1: Internet as a mechanism for hiring higher education graduates, by size of the company (in per cent)
Question A5: How often does your organisation use the following recruitment mechanism for hiring higher education graduates in
the last five years? Responses 5 to 7 on a scale of answers from 1=”Not at all” to 7=”Very often”.
Companies with high extent of university-business cooperation more often hire new
employees through internship placements than the others. Internship placements
usually provide opportunities for the students to get familiar with the work, but at the
same time they also provide opportunities for employer to recognize the abilities of
students and their knowledge or as Slovenian representative of a company described:
“We cooperate with two faculties, organising work placement arrangements for students
throughout the year. If a student proves herself/himself as a good worker at the first
selection, she/he can do her/his pre graduate internship in our firm. After taking a degree,
she/he becomes regularly employed with us. By then the work habits, responsiveness,
communication skills and adaptability to the working environment and the co-workers
have become manifest. The most successful ones also get additional training and are
directed to the areas that in our view are the most appropriate for them.” Therefore one
can say that internship is a reciprocal process where a graduate attains skills and
knowledge necessary for his future work, and on the other side an employer gets an
employee that already possesses required job-specific knowledge.
78%
92% 90%
70%
82% 83% 85%
55%
67% 67%
46%
68%
100%
50%
75%
50%
33%
50%
0%
10%
20%
30%
40%
50%
60%
70%
80%
90%
100%
Bulgaria Hungary Poland Slovenia Spain Total
Large
SME
Micro

44
Figure 6.2: Internship placement as a mechanism for hiring higher education graduates, by extent of UBC (in per cent)
Question A5: How often does your organisation use the following recruitment mechanism for hiring higher education graduates in
the last five years? Responses 5 to 7 on a scale of answers from 1=”Not at all” to 7=”Very often”.
The least used mechanism for hiring new employers are public employment agencies,
where not even one out of four employers uses this way of finding new staff often or
very often. This is especially true in the IT sector. Regarding the results the majority of
the companies, with an exception of the IT sector, which use the public employment
agency for hiring graduates often or very often are coming from Slovenia, followed by
Hungary. We can assume that public employment agencies are being replaced with
other ways of hiring new employees.
Figure 6.3: Public employment agencies as a mechanism for hiring higher education graduates, by size of company (in per cent)
Question A5: How often does your organisation use the following recruitment mechanism for hiring higher education graduates in
the last five years? Responses 5 to 7 on a scale of answers from 1=”Not at all” to 7=”Very often”.
83% 80%
73%
79% 79% 79% 80%
62%
33%
69% 70%
66%
35%
21%
32%
55%
43%
34%
0%
10%
20%
30%
40%
50%
60%
70%
80%
90%
100%
Bulgaria Hungary Poland Slovenia Spain Total
High extent of UBC
Medium extent of UBC
Non or minor extent of UBC
0%
24%
8%
40%
0%
21%
7%
20%
13%
31%
8% 13%
7% 11%
0% 0%
10%
5%
0%
10%
20%
30%
40%
50%
60%
70%
80%
90%
100%
Bulgaria Hungary Poland Slovenia Spain Total
Industry
Service
IT

45
The employers in EMCOSU countries were also asked to provide to what extent the
higher education graduates possess different knowledge and skills. According to Allen,
Pavlin and Van der Velden’s (2011) study “Competencies and Early Labour Market
Careers of Higher Education Graduates in Europe” »in the world of work, graduates are
expected to be competent in a broad range of areas, comprising both field-specific and
generic skills, as well as technical abilities in the areas of computer and internet usage. The
competences that are most often required are the ability to use computers and the internet,
the ability to use time efficiently, and the ability to work productively with others. Most
graduates are highly competent in these areas, particularly with respect to the ability to
use computers and the internet, but there are some shortages, of these and other
competences, notably the mastery of one's own field or discipline and the ability to perform
well under pressure«.
Polish representative of a company pointed out that “for the company, it is important
that person has specific knowledge of the industry, speaks a foreign language (including
technical language that is specific to industry) and has the ability to propose new solutions
and ideas.” (PL_Case study_4) The results of survey show that approximately three out of
four graduates have a high ability to acquire new knowledge, followed by the ability to
come up with new ideas and solutions and the ability to work in a foreign language. The
employers reported that the graduates are the least skilled in the efficient use of time,
mastery in their field of discipline and work in the stressful situations where the
percentages of graduates with none or minor possession of these skills are the highest.
Figure 6.4: Possession of skills by the graduates (in per cent)
Question A6: Please provide information to what extent new graduates in your experience possess these skills? Responses 5 to 7 on a
scale of answers from 1=”Not at all” to 7=”Very often”.
39,7%
78,0%
40,0% 32,6%
51,9% 55,8% 53,4%
0%
10%
20%
30%
40%
50%
60%
70%
80%
90%
100%
Mastery intheir field or
discipline
The ability toacquire newknowledge
The ability toperform well
under pressure
The ability touse time
efficiently
The ability toproductively
work withothers
The ability tocome up withnew ideas and
solutions
The ability towork in aforeign
language
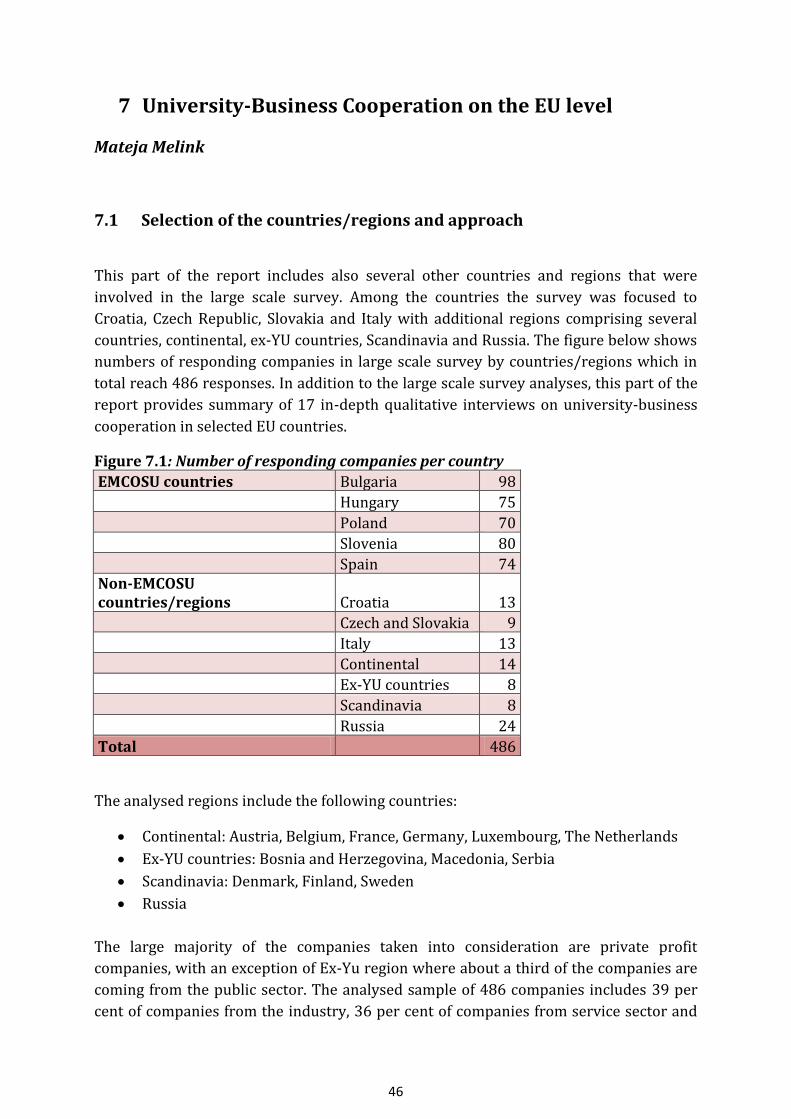
46
7 University-Business Cooperation on the EU level
Mateja Melink
7.1 Selection of the countries/regions and approach
This part of the report includes also several other countries and regions that were
involved in the large scale survey. Among the countries the survey was focused to
Croatia, Czech Republic, Slovakia and Italy with additional regions comprising several
countries, continental, ex-YU countries, Scandinavia and Russia. The figure below shows
numbers of responding companies in large scale survey by countries/regions which in
total reach 486 responses. In addition to the large scale survey analyses, this part of the
report provides summary of 17 in-depth qualitative interviews on university-business
cooperation in selected EU countries.
Figure 7.1: Number of responding companies per country
EMCOSU countries Bulgaria 98
Hungary 75
Poland 70
Slovenia 80
Spain 74
Non-EMCOSU countries/regions Croatia 13
Czech and Slovakia 9
Italy 13
Continental 14
Ex-YU countries 8
Scandinavia 8
Russia 24
Total
486
The analysed regions include the following countries:
Continental: Austria, Belgium, France, Germany, Luxembourg, The Netherlands
Ex-YU countries: Bosnia and Herzegovina, Macedonia, Serbia
Scandinavia: Denmark, Finland, Sweden
Russia
The large majority of the companies taken into consideration are private profit
companies, with an exception of Ex-Yu region where about a third of the companies are
coming from the public sector. The analysed sample of 486 companies includes 39 per
cent of companies from the industry, 36 per cent of companies from service sector and

47
one quarter of companies from ICT sector. In most of the countries the distribution of
companies by economic sector is similar to the total, however Croatian sample includes
around two thirds of companies from ICT and in Slovakia and Czech Republic the same
share in services sector.
Regarding the size of companies included in the survey one half of them are small and
medium enterprises, following by over one third of large companies, and around 10 per
cent of micro companies.
Figure 7.2: Distribution of companies by economic sector (in per cent)
7.2 Modes of University-Business Cooperation
Most of the employers cooperate with the universities by the mobility of students what
is usually performed in a form of practical training and internships. This mode of
cooperation ranks as the first one in most of the countries included in the large scale
survey, with the exceptions of Czech and Slovakia and Scandinavia where it ranks as the
third, and Bulgaria and Ex-YU countries where the most common mode of activity of
cooperation with universities is adult education, training and short courses.
The mobility of students is followed by the research and development activities and
adult education and training. The research and development is most common activity in
Scandinavian countries, but not used to a very large extent in Croatia. However, the
Croatian employer described one of the research and development cooperation modes:
19
60
34
60
32 23
11
31
46 50 43
23
39
47
28
43
16
39
15
67
46
31
38 43
50
36
34
12 23 24
28
62
22 23 23 13 14
27 25
ICT
Service
Industry
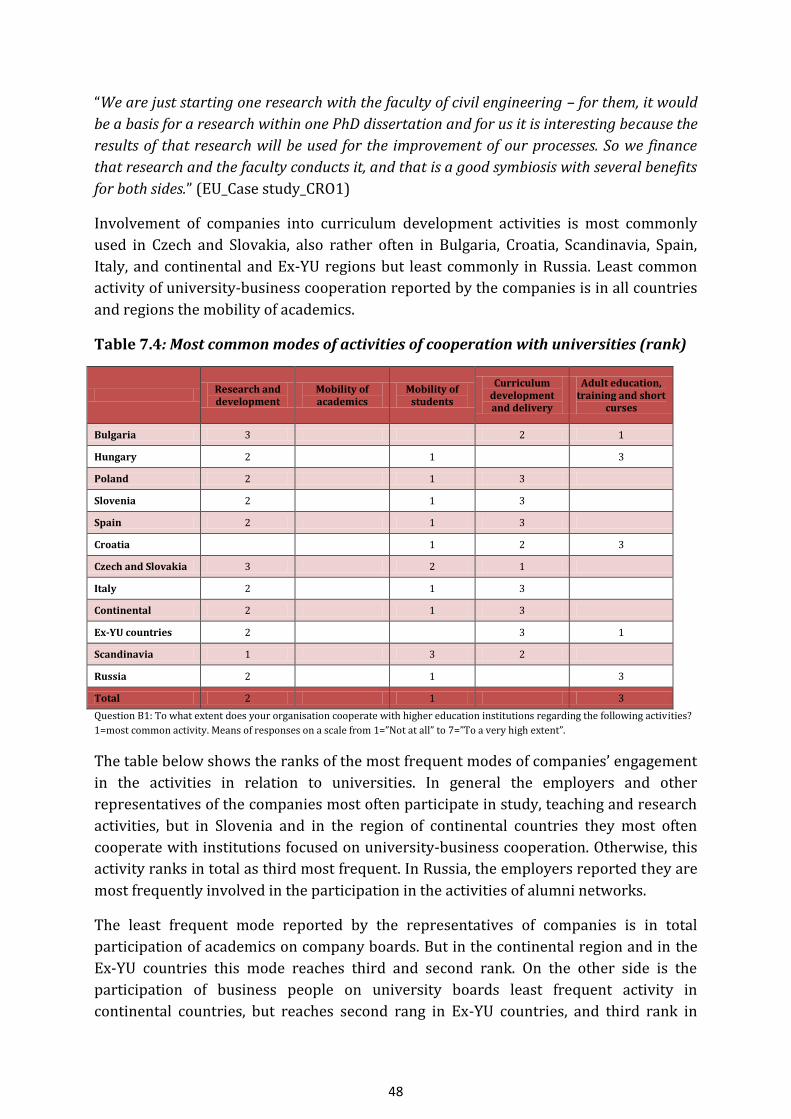
48
“We are just starting one research with the faculty of civil engineering – for them, it would
be a basis for a research within one PhD dissertation and for us it is interesting because the
results of that research will be used for the improvement of our processes. So we finance
that research and the faculty conducts it, and that is a good symbiosis with several benefits
for both sides.” (EU_Case study_CRO1)
Involvement of companies into curriculum development activities is most commonly
used in Czech and Slovakia, also rather often in Bulgaria, Croatia, Scandinavia, Spain,
Italy, and continental and Ex-YU regions but least commonly in Russia. Least common
activity of university-business cooperation reported by the companies is in all countries
and regions the mobility of academics.
Table 7.4: Most common modes of activities of cooperation with universities (rank)
Research and development
Mobility of academics
Mobility of students
Curriculum development and delivery
Adult education, training and short
curses
Bulgaria 3 2 1
Hungary 2 1 3
Poland 2 1 3
Slovenia 2 1 3
Spain 2 1 3
Croatia 1 2 3
Czech and Slovakia 3 2 1
Italy 2 1 3
Continental 2 1 3
Ex-YU countries 2 3 1
Scandinavia 1 3 2
Russia 2 1 3
Total 2 1 3
Question B1: To what extent does your organisation cooperate with higher education institutions regarding the following activities?
1=most common activity. Means of responses on a scale from 1=”Not at all” to 7=”To a very high extent”.
The table below shows the ranks of the most frequent modes of companies’ engagement
in the activities in relation to universities. In general the employers and other
representatives of the companies most often participate in study, teaching and research
activities, but in Slovenia and in the region of continental countries they most often
cooperate with institutions focused on university-business cooperation. Otherwise, this
activity ranks in total as third most frequent. In Russia, the employers reported they are
most frequently involved in the participation in the activities of alumni networks.
The least frequent mode reported by the representatives of companies is in total
participation of academics on company boards. But in the continental region and in the
Ex-YU countries this mode reaches third and second rank. On the other side is the
participation of business people on university boards least frequent activity in
continental countries, but reaches second rang in Ex-YU countries, and third rank in
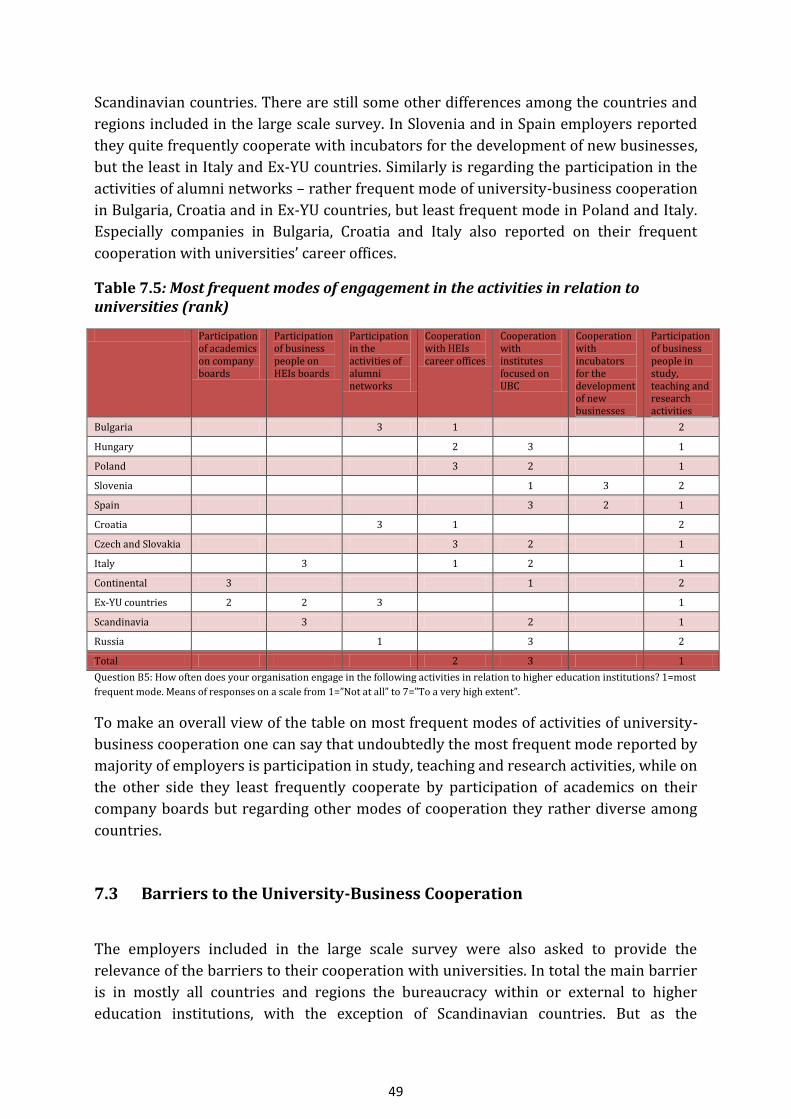
49
Scandinavian countries. There are still some other differences among the countries and
regions included in the large scale survey. In Slovenia and in Spain employers reported
they quite frequently cooperate with incubators for the development of new businesses,
but the least in Italy and Ex-YU countries. Similarly is regarding the participation in the
activities of alumni networks – rather frequent mode of university-business cooperation
in Bulgaria, Croatia and in Ex-YU countries, but least frequent mode in Poland and Italy.
Especially companies in Bulgaria, Croatia and Italy also reported on their frequent
cooperation with universities’ career offices.
Table 7.5: Most frequent modes of engagement in the activities in relation to universities (rank)
Participation of academics on company boards
Participation of business people on HEIs boards
Participation in the activities of alumni networks
Cooperation with HEIs career offices
Cooperation with institutes focused on UBC
Cooperation with incubators for the development of new businesses
Participation of business people in study, teaching and research activities
Bulgaria 3 1 2
Hungary 2 3 1
Poland 3 2 1
Slovenia 1 3 2
Spain 3 2 1
Croatia 3 1 2
Czech and Slovakia 3 2 1
Italy 3 1 2 1
Continental 3 1 2
Ex-YU countries 2 2 3 1
Scandinavia 3 2 1
Russia 1 3 2
Total 2 3 1
Question B5: How often does your organisation engage in the following activities in relation to higher education institutions? 1=most
frequent mode. Means of responses on a scale from 1=”Not at all” to 7=”To a very high extent”.
To make an overall view of the table on most frequent modes of activities of university-
business cooperation one can say that undoubtedly the most frequent mode reported by
majority of employers is participation in study, teaching and research activities, while on
the other side they least frequently cooperate by participation of academics on their
company boards but regarding other modes of cooperation they rather diverse among
countries.
7.3 Barriers to the University-Business Cooperation
The employers included in the large scale survey were also asked to provide the
relevance of the barriers to their cooperation with universities. In total the main barrier
is in mostly all countries and regions the bureaucracy within or external to higher
education institutions, with the exception of Scandinavian countries. But as the

50
Slovakian employer emphasised, also the companies are facing the bureaucratic
processes within their own companies: “Since our company is large, the approval
processes for cooperation are rather long and several people from different departments
need to be involved. On the other side the universities are mostly public what means they
have to respect the state regulations and have for example public procurement when
purchasing some equipment” (EU_Case study_SK2).
The second most relevant barrier to cooperation with higher education institutions are
different time horizons as the dynamic business environment acquires flexibility and
rapid response or as reported from Croatian IT employer: “Very often an industry or
business comes with some concrete problem and requires a solution in a very short time
but university is not always ready to do that in such a way. They need some time to
understand the problem, to solve the problem and they are not, and cannot be fully
dedicated to solving such industry problems and fulfil the time requirements” (EU_Case
study_CRO3).
The bureaucratic obstacles to university-business cooperation and different time
horizons are followed by different motivation and values and as the previous table
showed the common motives is one of the main drivers to university-business
cooperation.
In Hungary, Czech and Slovakia, Italy, continental countries, Scandinavia and Russia the
employers also reported that among the most relevant barriers to university-business
cooperation are different modes of communication and language between the two
actors, but this is the least relevant barrier in Slovenia. The barriers of
misunderstanding between companies and universities was described also by Swedish
employer: “I think the biggest barrier is that we really haven’t reached the full
understanding of the different types of environments that universities live in, compared to
business and vice versa. We put a lot of focus on having strategic discussions, learning how
to understand each other. I’ll give you one experience: universities sometimes, when being
approached or when they approach us, only think that we are a source of money. They
think that we will provide money to the universities. We do that in a number of cases and
with a fair amount of money, but this is not really the big issue for us. We want to have
common projects that our researchers are engaged with the academic research and we run
common projects, which is both based on the research challenge and the business
challenge” (EU_Case study_SW1). This case can also show as that the elimination of one
barrier enhances the important drivers which lead to the university-business
cooperation.
The employers from Bulgaria, Hungary, Croatia, Czech and Slovakia, Ex-YU countries and
Russia also reported they have difficulties in finding the appropriate persons within the
universities for the aims of cooperation, but it is the least relevant barrier in
Scandinavia. Otherwise, the least relevant barrier to university-business cooperation in
total is the current financial crisis but also the tendency of universities for publishing
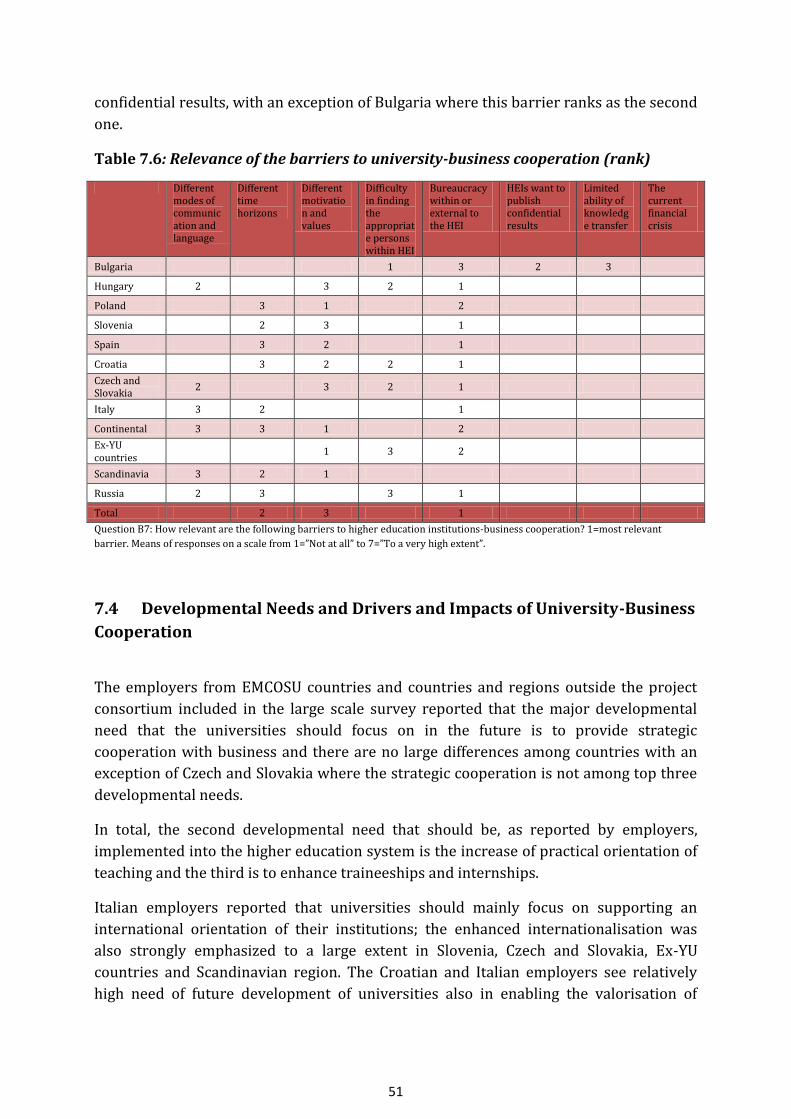
51
confidential results, with an exception of Bulgaria where this barrier ranks as the second
one.
Table 7.6: Relevance of the barriers to university-business cooperation (rank)
Different modes of communication and language
Different time horizons
Different motivation and values
Difficulty in finding the appropriate persons within HEI
Bureaucracy within or external to the HEI
HEIs want to publish confidential results
Limited ability of knowledge transfer
The current financial crisis
Bulgaria 1 3 2 3
Hungary 2 3 2 1
Poland 3 1 2
Slovenia 2 3 1
Spain 3 2 1
Croatia 3 2 2 1
Czech and Slovakia
2 3 2 1
Italy 3 2 1
Continental 3 3 1 2
Ex-YU countries
1 3 2
Scandinavia 3 2 1
Russia 2 3 3 1
Total 2 3 1
Question B7: How relevant are the following barriers to higher education institutions-business cooperation? 1=most relevant
barrier. Means of responses on a scale from 1=”Not at all” to 7=”To a very high extent”.
7.4 Developmental Needs and Drivers and Impacts of University-Business
Cooperation
The employers from EMCOSU countries and countries and regions outside the project
consortium included in the large scale survey reported that the major developmental
need that the universities should focus on in the future is to provide strategic
cooperation with business and there are no large differences among countries with an
exception of Czech and Slovakia where the strategic cooperation is not among top three
developmental needs.
In total, the second developmental need that should be, as reported by employers,
implemented into the higher education system is the increase of practical orientation of
teaching and the third is to enhance traineeships and internships.
Italian employers reported that universities should mainly focus on supporting an
international orientation of their institutions; the enhanced internationalisation was
also strongly emphasized to a large extent in Slovenia, Czech and Slovakia, Ex-YU
countries and Scandinavian region. The Croatian and Italian employers see relatively
high need of future development of universities also in enabling the valorisation of
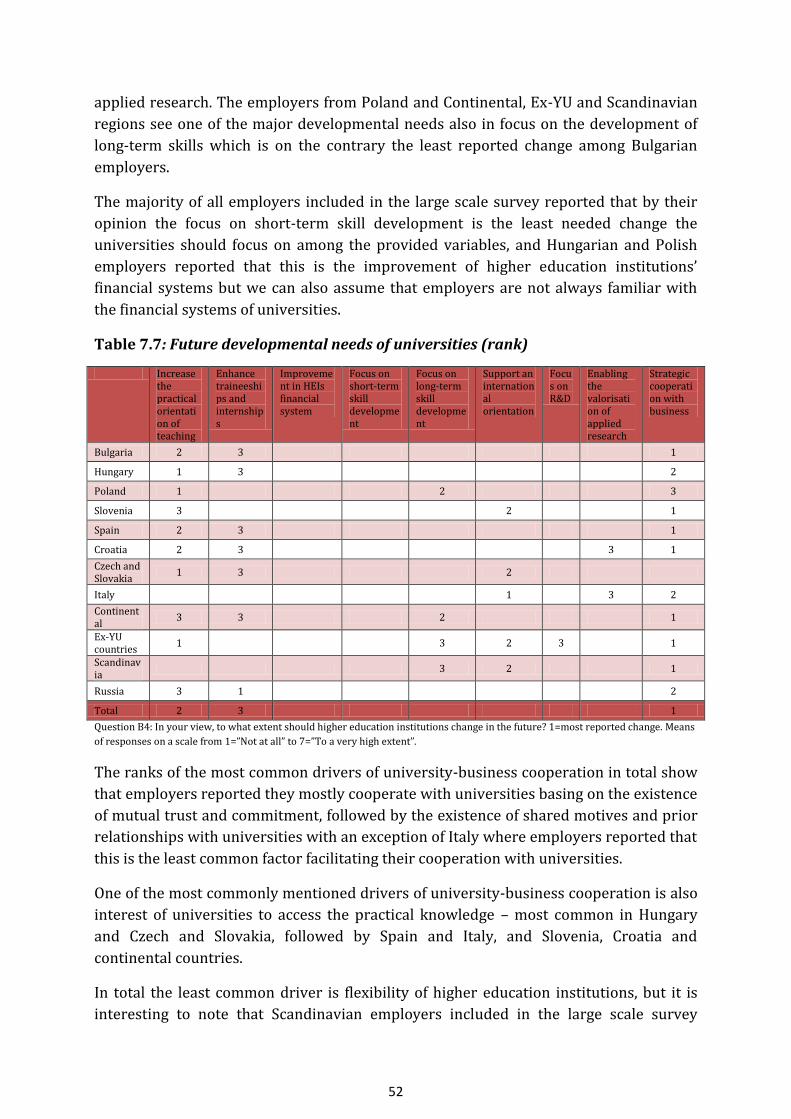
52
applied research. The employers from Poland and Continental, Ex-YU and Scandinavian
regions see one of the major developmental needs also in focus on the development of
long-term skills which is on the contrary the least reported change among Bulgarian
employers.
The majority of all employers included in the large scale survey reported that by their
opinion the focus on short-term skill development is the least needed change the
universities should focus on among the provided variables, and Hungarian and Polish
employers reported that this is the improvement of higher education institutions’
financial systems but we can also assume that employers are not always familiar with
the financial systems of universities.
Table 7.7: Future developmental needs of universities (rank)
Increase the practical orientation of teaching
Enhance traineeships and internships
Improvement in HEIs financial system
Focus on short-term skill development
Focus on long-term skill development
Support an international orientation
Focus on R&D
Enabling the valorisation of applied research
Strategic cooperation with business
Bulgaria 2 3 1
Hungary 1 3 2
Poland 1 2 3
Slovenia 3 2 1
Spain 2 3 1
Croatia 2 3 3 1
Czech and Slovakia
1 3 2
Italy 1 3 2
Continental
3 3 2 1
Ex-YU countries
1 3 2 3 1
Scandinavia
3 2 1
Russia 3 1 2
Total 2 3 1
Question B4: In your view, to what extent should higher education institutions change in the future? 1=most reported change. Means
of responses on a scale from 1=”Not at all” to 7=”To a very high extent”.
The ranks of the most common drivers of university-business cooperation in total show
that employers reported they mostly cooperate with universities basing on the existence
of mutual trust and commitment, followed by the existence of shared motives and prior
relationships with universities with an exception of Italy where employers reported that
this is the least common factor facilitating their cooperation with universities.
One of the most commonly mentioned drivers of university-business cooperation is also
interest of universities to access the practical knowledge – most common in Hungary
and Czech and Slovakia, followed by Spain and Italy, and Slovenia, Croatia and
continental countries.
In total the least common driver is flexibility of higher education institutions, but it is
interesting to note that Scandinavian employers included in the large scale survey
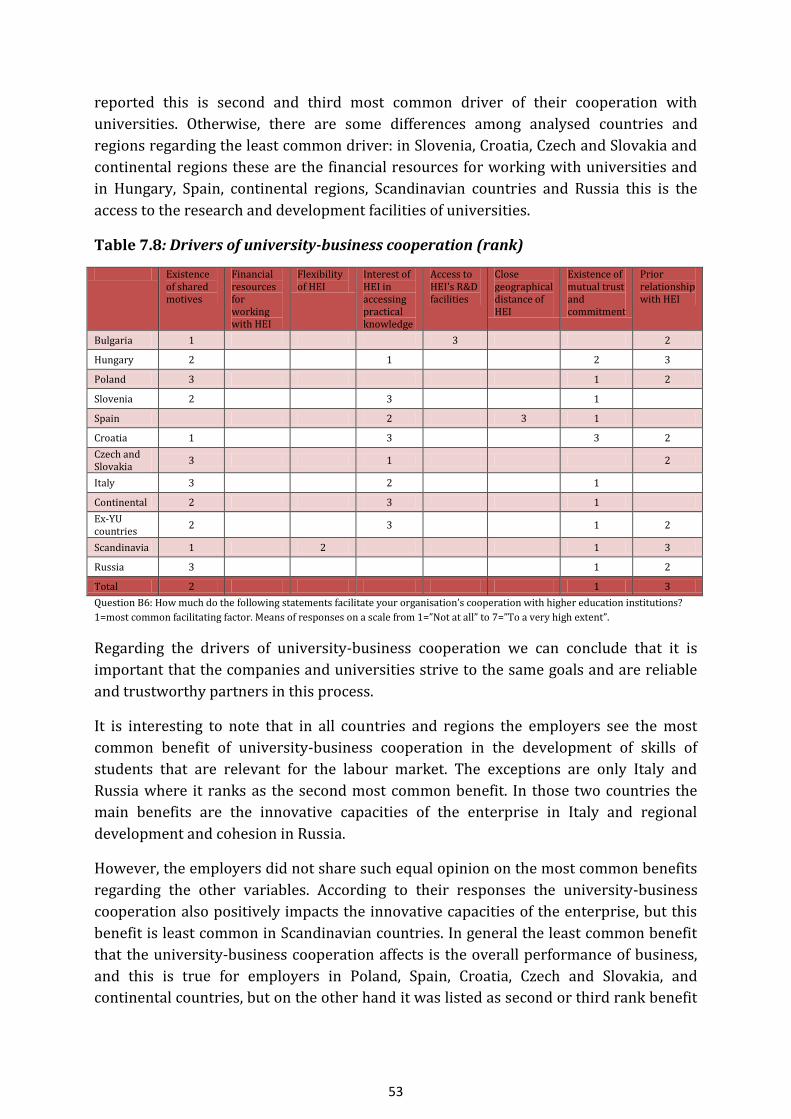
53
reported this is second and third most common driver of their cooperation with
universities. Otherwise, there are some differences among analysed countries and
regions regarding the least common driver: in Slovenia, Croatia, Czech and Slovakia and
continental regions these are the financial resources for working with universities and
in Hungary, Spain, continental regions, Scandinavian countries and Russia this is the
access to the research and development facilities of universities.
Table 7.8: Drivers of university-business cooperation (rank)
Existence of shared motives
Financial resources for working with HEI
Flexibility of HEI
Interest of HEI in accessing practical knowledge
Access to HEI's R&D facilities
Close geographical distance of HEI
Existence of mutual trust and commitment
Prior relationship with HEI
Bulgaria 1 3 2
Hungary 2 1 2 3
Poland 3 1 2
Slovenia 2 3 1
Spain 2 3 1
Croatia 1 3 3 2
Czech and Slovakia
3 1 2
Italy 3 2 1
Continental 2 3 1
Ex-YU countries
2 3 1 2
Scandinavia 1 2 1 3
Russia 3 1 2
Total 2 1 3
Question B6: How much do the following statements facilitate your organisation’s cooperation with higher education institutions?
1=most common facilitating factor. Means of responses on a scale from 1=”Not at all” to 7=”To a very high extent”.
Regarding the drivers of university-business cooperation we can conclude that it is
important that the companies and universities strive to the same goals and are reliable
and trustworthy partners in this process.
It is interesting to note that in all countries and regions the employers see the most
common benefit of university-business cooperation in the development of skills of
students that are relevant for the labour market. The exceptions are only Italy and
Russia where it ranks as the second most common benefit. In those two countries the
main benefits are the innovative capacities of the enterprise in Italy and regional
development and cohesion in Russia.
However, the employers did not share such equal opinion on the most common benefits
regarding the other variables. According to their responses the university-business
cooperation also positively impacts the innovative capacities of the enterprise, but this
benefit is least common in Scandinavian countries. In general the least common benefit
that the university-business cooperation affects is the overall performance of business,
and this is true for employers in Poland, Spain, Croatia, Czech and Slovakia, and
continental countries, but on the other hand it was listed as second or third rank benefit
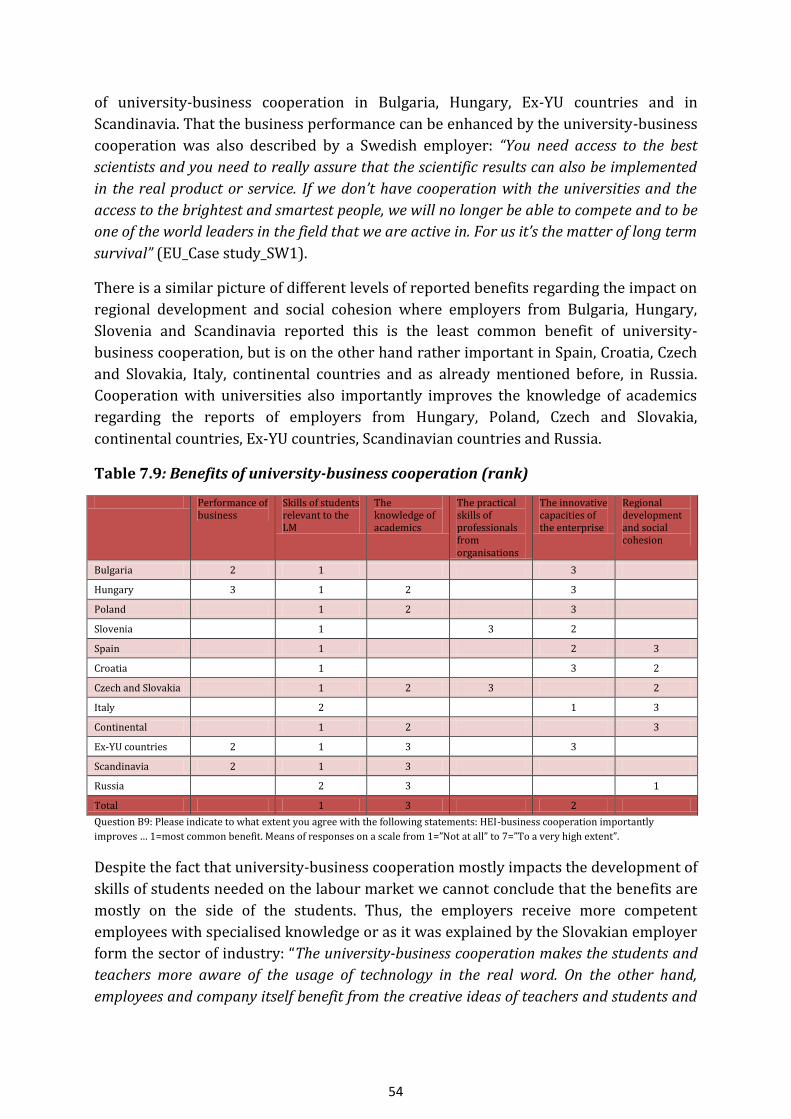
54
of university-business cooperation in Bulgaria, Hungary, Ex-YU countries and in
Scandinavia. That the business performance can be enhanced by the university-business
cooperation was also described by a Swedish employer: “You need access to the best
scientists and you need to really assure that the scientific results can also be implemented
in the real product or service. If we don’t have cooperation with the universities and the
access to the brightest and smartest people, we will no longer be able to compete and to be
one of the world leaders in the field that we are active in. For us it’s the matter of long term
survival” (EU_Case study_SW1).
There is a similar picture of different levels of reported benefits regarding the impact on
regional development and social cohesion where employers from Bulgaria, Hungary,
Slovenia and Scandinavia reported this is the least common benefit of university-
business cooperation, but is on the other hand rather important in Spain, Croatia, Czech
and Slovakia, Italy, continental countries and as already mentioned before, in Russia.
Cooperation with universities also importantly improves the knowledge of academics
regarding the reports of employers from Hungary, Poland, Czech and Slovakia,
continental countries, Ex-YU countries, Scandinavian countries and Russia.
Table 7.9: Benefits of university-business cooperation (rank)
Performance of business
Skills of students relevant to the LM
The knowledge of academics
The practical skills of professionals from organisations
The innovative capacities of the enterprise
Regional development and social cohesion
Bulgaria 2 1 3
Hungary 3 1 2 3
Poland 1 2 3
Slovenia 1 3 2
Spain 1 2 3
Croatia 1 3 2
Czech and Slovakia 1 2 3 2
Italy 2 1 3
Continental 1 2 3
Ex-YU countries 2 1 3 3
Scandinavia 2 1 3
Russia 2 3 1
Total 1 3 2
Question B9: Please indicate to what extent you agree with the following statements: HEI-business cooperation importantly
improves … 1=most common benefit. Means of responses on a scale from 1=”Not at all” to 7=”To a very high extent”.
Despite the fact that university-business cooperation mostly impacts the development of
skills of students needed on the labour market we cannot conclude that the benefits are
mostly on the side of the students. Thus, the employers receive more competent
employees with specialised knowledge or as it was explained by the Slovakian employer
form the sector of industry: “The university-business cooperation makes the students and
teachers more aware of the usage of technology in the real word. On the other hand,
employees and company itself benefit from the creative ideas of teachers and students and
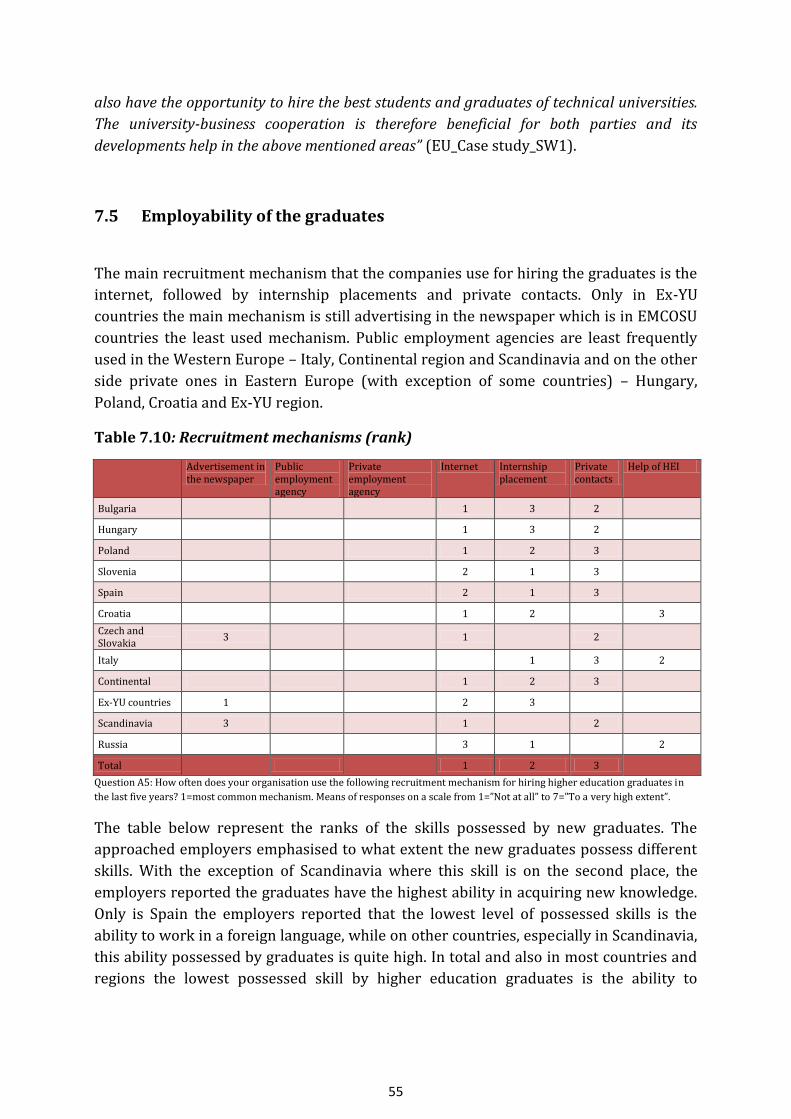
55
also have the opportunity to hire the best students and graduates of technical universities.
The university-business cooperation is therefore beneficial for both parties and its
developments help in the above mentioned areas” (EU_Case study_SW1).
7.5 Employability of the graduates
The main recruitment mechanism that the companies use for hiring the graduates is the
internet, followed by internship placements and private contacts. Only in Ex-YU
countries the main mechanism is still advertising in the newspaper which is in EMCOSU
countries the least used mechanism. Public employment agencies are least frequently
used in the Western Europe – Italy, Continental region and Scandinavia and on the other
side private ones in Eastern Europe (with exception of some countries) – Hungary,
Poland, Croatia and Ex-YU region.
Table 7.10: Recruitment mechanisms (rank)
Advertisement in the newspaper
Public employment agency
Private employment agency
Internet Internship placement
Private contacts
Help of HEI
Bulgaria
1 3 2
Hungary
1 3 2
Poland
1 2 3
Slovenia
2 1 3
Spain
2 1 3
Croatia
1 2
3
Czech and Slovakia
3
1
2
Italy
1 3 2
Continental
1 2 3
Ex-YU countries 1
2 3
Scandinavia 3
1
2
Russia 3 1 2
Total
1 2 3
Question A5: How often does your organisation use the following recruitment mechanism for hiring higher education graduates in
the last five years? 1=most common mechanism. Means of responses on a scale from 1=”Not at all” to 7=”To a very high extent”.
The table below represent the ranks of the skills possessed by new graduates. The
approached employers emphasised to what extent the new graduates possess different
skills. With the exception of Scandinavia where this skill is on the second place, the
employers reported the graduates have the highest ability in acquiring new knowledge.
Only is Spain the employers reported that the lowest level of possessed skills is the
ability to work in a foreign language, while on other countries, especially in Scandinavia,
this ability possessed by graduates is quite high. In total and also in most countries and
regions the lowest possessed skill by higher education graduates is the ability to

56
efficiently use the time, but in Czech and Slovakia, Italy and Ex-YU region this is the
mastery in the field or discipline.
Table 7.11: Possession of skills by HE graduates (rank)
Mastery in the field or discipline
Ability to acquire new knowledge
Ability to perform well
under pressure
Ability to use time
efficiently
Ability to productively
work with others
Ability to come up with new ideas and solutions
The ability to work in a
foreign language
Bulgaria 1 2 3
Hungary 1 2 3
Poland 1 2 3
Slovenia 1 3 2
Spain 1 2 3
Croatia 1 3 2
Czech and Slovakia 1 2 3
Italy 1 3 2
Continental 1 2 3
Ex-YU countries 1 3 2
Scandinavia 3 2 1
Russia 1 3 2
Total 1 3 2
Question A6: Please provide information to what extent new graduates in your experience possess these skills? 1=most commonly
possessed. Means of responses on a scale from 1=”Not at all” to 7=”To a very high extent”.
7.6 Case Studies of University-Business Cooperation
Within the project there were conducted 17 in-depth interviews among employers from
different EU countries in order to gather examples of the good practices of university-
business cooperation and thorough view of the employers' perspective on the
cooperation with universities. Among the selected companies there are six of them from
the industry sector, three from the services sector and three from the IT sector.
Modes of cooperation
The analyses of the interviews implemented among the representative of different
companies from various EU countries shows that the companies cooperate with the
universities mostly in the following activities: mobility of students, research and
development, engagement in educational process, mobility of academics and other,
more company-specific modes.
Mobility of students: Most often the companies provide internship placements for
students with duration of several weeks up to one year. Within the internships students
are involved in the research projects or they perform usual work tasks and most often
are supervised by the senior mentor who is an employee of a company. One company
described they invite to their internship placements also international students for work

57
in internationally oriented activities of the company and one company keeps continuous
relations with universities and their placement offices to recruit the best students.
Several companies reported that internship placements often lead also to the full
employment. Companies also organise summer camps with an aim of participation on a
special project (for example with an aim to develop new software together with a
mentor) or they recruit students to help and cooperate with senior employees in
research projects. Regarding the mobility of students several companies also reported
they provide funding for PhD candidates who perform researches that are of an interest
for the companies.
Research and development: The representatives of selected companies described
different modes of cooperation with universities regarding the research and
development activities. Most often they approach university staff in order to discuss the
developmental and technological issues they are facing with what can often lead also to
the implementation of research projects that envisage involvement of both sides:
company and university, often also with a support of students. One company reported
they yearly provide funding for selected university research project and one company
reported they have long-term contracts with universities regarding the research
activities (and also education processes) – however they select the strong
areas/departments of specific universities and cooperate only in these areas.
Engagement in education process: There have been several cases described from the
selected representatives of companies on the participation of their employees into the
university lectures as invited speakers what is most common engagement of business
people into the teaching processes. Two representatives reported their staff engages
also in the curriculum development of the study programmes and one of them also
participates in the services of accreditation of study programmes. One company also
reported they share the implementation of the elective course at one university together
with five more companies where they provide lectures to students on different business
models.
Mobility of academics: The inclusion of academics into university-business activities is
two folded: some representatives of selected companies reported they provide
academics with training courses in order to acquaint them with their technology and
business processes and on the other side they invite academics of specific expertise to
provide lectures and training courses to their employees.
Others: Representatives of selected companies reported also about other modes of
cooperation they have with universities. Two of them are regularly participating on
universities’ career days presenting their company and jobs they offer, they provide
advice, consultation and support to students who are preparing their theses, they
provide special foundation for supporting students activities (for example student
research project etc.), and they offer seminars and courses in a form of non-formal
education.
58
Barriers to cooperation
The representatives of different EU companies reported on various barriers that they
face with when cooperating with the universities. Even though there are a large variety
of reported barriers, their responses mostly refer to the differences among universities
and companies and their working environments and bureaucratic obstacles.
One of the biggest barriers to university-business cooperation that was reported by the
employers was different motives, interests, and therefore different goals on the both
sides. By their opinion the academics are not interested to a large extent to practical
issues and applied research. Academics should also lack of business thinking and real
business experiences what would encourage and motivate them to cooperate with
business.
Representative of companies also pointed out the non-flexibility of higher education
institutions, especially regarding regular adaptations and changes into the curricula by
following new technologies and new trends in the area. In this respect students would
also gain more adequate knowledge that employers expect from them. The respondents
also emphasized that the universities expect financing of the cooperation, however they
do not have clear ideas what this cooperation should be.
Regarding the bureaucracy the respondents reported on several different barriers,
especially the documentation that is needed to establish any kind of cooperation. One of
the respondents reported that even the internships for the mobility of students demand
a lot of paperwork. The employers also referred to university-business cooperation
within EU funded projects, however the amount of documentation needed for the
application is rather time consuming, since they are not part of regular schedule and
they are not enough market and profit oriented. A representative of a large
multinational also reported that cooperation with universities demands inclusion of
several company’s departments what extents the formal processes, and on the other
side state regulations for public universities are too rigid.
Several employers reported on the issues regarding the “time”. Two respondents stated
the university-business cooperation is not structured within the company; therefore the
cooperation depends on the voluntary will of the employees outside the regular working
time. In the employers’ responses it was also emphasized that the fact that universities
use academic year may mean an obstacle to planning activities of cooperation. One
company also reported that their business is mostly seasonal; therefore it is also difficult
to get support from universities throughout the summer. The representative of the
companies also reported that universities often cannot follow the need for rapid and
immediate problem solving and response to the market flows.
Benefits of cooperation
59
The representatives of selected companies agree that the benefits of university-business
cooperation are mutual. By their opinion the academics hold pioneer knowledge in very
specific areas that can be further developed in products and /or services. Universities
also receive input and examples from practice and on the other side, the companies get
support in research and development. In this respect companies can become more
competitive and access to the academic knowledge, and universities can provide more
practical knowledge to their students and get an access to the top technologies. And
what is more, the university-business cooperation allows share use of financial and
infrastructural resources and the development of new ideas.
The benefits of university-business cooperation also refer to the development of skills
and knowledge of the graduates that are needed for the successful entrance to the
labour market. Internship placements also help employers to find the best and most
adequate graduates for the possible later recruitment into the company.
Conclusion
The selected companies that provided an insight into their university-business
cooperation described several modes of cooperation where the most common one is the
mobility of students, especially in a form of internship placement. Companies have also
established cooperation in research and development where they use the knowledge
and resources of both, academics staff as well as students. However, the representatives
of companies are also often engaged into the educational processes at the universities.
The employers emphasise the mutual benefits of the cooperation, especially regarding
the knowledge transfer, however they pointed out also the barriers to their cooperation
that can be of a very bureaucratic nature to more personal, such as sharing common
interests and motives. But to enhance the university-business cooperation it is
important to establish a regular communication to understand each other and to come
to common understanding what the needs are and what are the potentials of the
successful cooperation.

60
8 Employers' Associations and University-Business Cooperation
Mateja Melink
The EMCOSU large scale survey includes also responses from employers’ associations
which are mostly chambers of commerce and industry. A majority of associations covers
all economic sectors and are private non-profit. The analyses include 14 employers’
associations from Bulgaria, 30 from Poland, 19 from Slovenia, and 6 from EU countries
that are not partners in EMCOSU project (non-EMCOSU countries). The employers’
associations thus reported on their cooperation with higher education institutions.
As shown in the table below the employers’ associations mostly cooperate with
universities in adult education and lifelong learning programmes, followed by the
research and development activities and mobility of students. Cooperation of employers’
associations in lifelong learning programmes reaches the highest rank in all countries
with an exception of Slovenia where activities of research and development presents
most common mode of cooperation but are closely followed by the adult education and
lifelong learning programmes. On the other hand the least common modes of
cooperation of employers’ associations with universities are mobility of academics and
curriculum development. The reported values on the extent of cooperation with
universities are significantly low in Bulgaria, followed by Poland, while the highest
extent of cooperation was reported by the non-EMCOSU countries, followed by Slovenia.
Table 8.1: Most common modes of university-business cooperation (ranks and means)
Research and
development
Mobility of
academics
Mobility of
students
Curriculum
development Adult education, LLL
Bulgaria 3 (1,7) 3 (1,7) 2 (2,3) 1 (3,6)
Poland 2 (3,5)
3 (2,9) 1 (3,7)
Slovenia 1 (4,8) 3 (4,3) 2 (4,4)
Non_EMCOSU
2 (4,8) 3 (4,7) 1 (5,2)
Total 2 (3,6) 3 (3,1) 1 (4)
Question B1: To what extent does your organisation cooperate with HE institutions regarding the following activities? Means of
responses on a scale from 1=”Not at all” to 7=”To a very high extent”.
In total the representatives of employers’ associations reported that they and their
member organisations most often participate in study, teaching and research activities
of higher education institutions closely followed by cooperation with institutes focused
on university-business cooperation and with incubators for development of business.

61
Least often they are engaged in the activities of alumni networks and higher education
boards and vice-versa – the academics least often participate on companies’ boards.
The modes of engagement in university-business activities however differ among
countries. The mean values of most frequent modes of engagement of employers’
associations in the activities in relation to university are much higher in Bulgaria than in
other countries in which values are slightly above of a medium level. Bulgarian
representatives of employers’ associations reported that they cooperate to a very large
extent with universities’ career offices, activities of alumni networks and also participate
in the study, teaching and research activities. It is interesting to note that one of the most
frequent modes of cooperation with universities among surveyed Polish and non-
EMCOSU representatives are participation of academics on company boards and
participation of business people on higher education boards, while in other countries
those two modes are not frequent.
Table 8.2: Most frequent modes of engagement in the activities in relation to universities (ranks and means)
Participation of academics on company boards
Participation of business people on HE boards
Participation in the activities of alumni networks
Cooperation with HEI's career offices
Cooperation with institutes focused on UBC
Cooperation with incubators for development of business
Participation of business people in study, teaching, research activities
Bulgaria 3 (6,3) 1 (6,5) 2 (6,4)
Poland 2 (3,7) 3 (3,6) 1 (3,8)
Slovenia 2 (4,4) 1 (4,6) 3 (3,7)
Non_EMCOSU 2 (4,5) 2 (4,5) 3 (4,3) 2 (4,5) 1 (5,7) 1 (5,7) 1 (5,7)
Total 2 (4,1) 3 (4) 1 (4,3)
Question B5: How often does your organisation engage in the following activities in relation to HE institutions? Means of responses
on a scale from 1=”Not at all” to 7=”To a very high extent”.
Regarding the future developmental needs of universities the employers’ associations’
representatives reported that universities should put more focus to increase practical
orientation of teaching, develop strategic cooperation with business and enhance
traineeships and internships. All these future developmental needs gained high mean
values in all countries thus meaning that these future developmental needs occur in
majority of national systems regarding university-business cooperation and that
representatives of employers’ associations perceive those changes at universities as
necessary. In Bulgaria and non-EMCOSU countries valorisation of applied research and
focus on research and development were also perceived important future
developmental needs of universities and thus ranked high. Moreover Bulgarian
representatives exposed that future developmental needs of universities should focus on
short-term skill development and improvements in financial systems of universities,
while Polish representatives of employers’ associations ranked high long term skill
development.
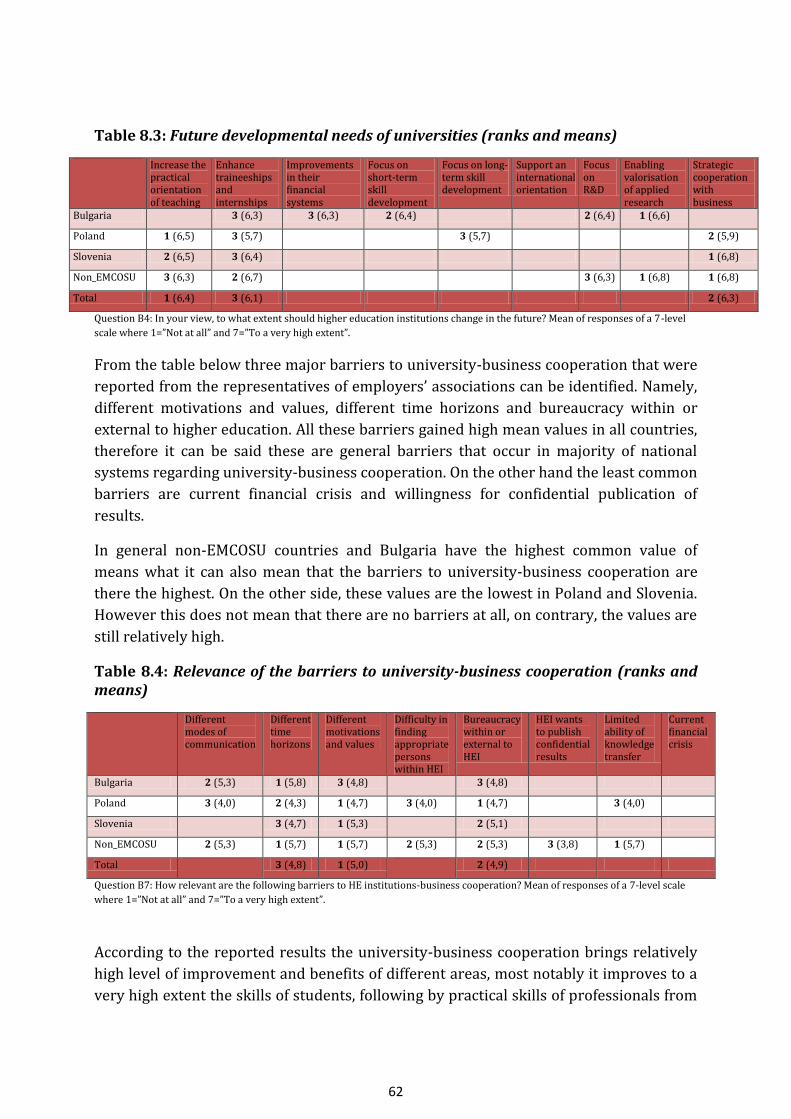
62
Table 8.3: Future developmental needs of universities (ranks and means)
Increase the practical orientation of teaching
Enhance traineeships and internships
Improvements in their financial systems
Focus on short-term skill development
Focus on long-term skill development
Support an international orientation
Focus on R&D
Enabling valorisation of applied research
Strategic cooperation with business
Bulgaria 3 (6,3) 3 (6,3) 2 (6,4) 2 (6,4) 1 (6,6)
Poland 1 (6,5) 3 (5,7) 3 (5,7) 2 (5,9)
Slovenia 2 (6,5) 3 (6,4) 1 (6,8)
Non_EMCOSU 3 (6,3) 2 (6,7) 3 (6,3) 1 (6,8) 1 (6,8)
Total 1 (6,4) 3 (6,1) 2 (6,3)
Question B4: In your view, to what extent should higher education institutions change in the future? Mean of responses of a 7-level
scale where 1=”Not at all” and 7=”To a very high extent”.
From the table below three major barriers to university-business cooperation that were
reported from the representatives of employers’ associations can be identified. Namely,
different motivations and values, different time horizons and bureaucracy within or
external to higher education. All these barriers gained high mean values in all countries,
therefore it can be said these are general barriers that occur in majority of national
systems regarding university-business cooperation. On the other hand the least common
barriers are current financial crisis and willingness for confidential publication of
results.
In general non-EMCOSU countries and Bulgaria have the highest common value of
means what it can also mean that the barriers to university-business cooperation are
there the highest. On the other side, these values are the lowest in Poland and Slovenia.
However this does not mean that there are no barriers at all, on contrary, the values are
still relatively high.
Table 8.4: Relevance of the barriers to university-business cooperation (ranks and means)
Different modes of communication
Different time horizons
Different motivations and values
Difficulty in finding appropriate persons within HEI
Bureaucracy within or external to HEI
HEI wants to publish confidential results
Limited ability of knowledge transfer
Current financial crisis
Bulgaria 2 (5,3) 1 (5,8) 3 (4,8) 3 (4,8)
Poland 3 (4,0) 2 (4,3) 1 (4,7) 3 (4,0) 1 (4,7) 3 (4,0)
Slovenia 3 (4,7) 1 (5,3) 2 (5,1)
Non_EMCOSU 2 (5,3) 1 (5,7) 1 (5,7) 2 (5,3) 2 (5,3) 3 (3,8) 1 (5,7)
Total 3 (4,8) 1 (5,0) 2 (4,9)
Question B7: How relevant are the following barriers to HE institutions-business cooperation? Mean of responses of a 7-level scale
where 1=”Not at all” and 7=”To a very high extent”.
According to the reported results the university-business cooperation brings relatively
high level of improvement and benefits of different areas, most notably it improves to a
very high extent the skills of students, following by practical skills of professionals from
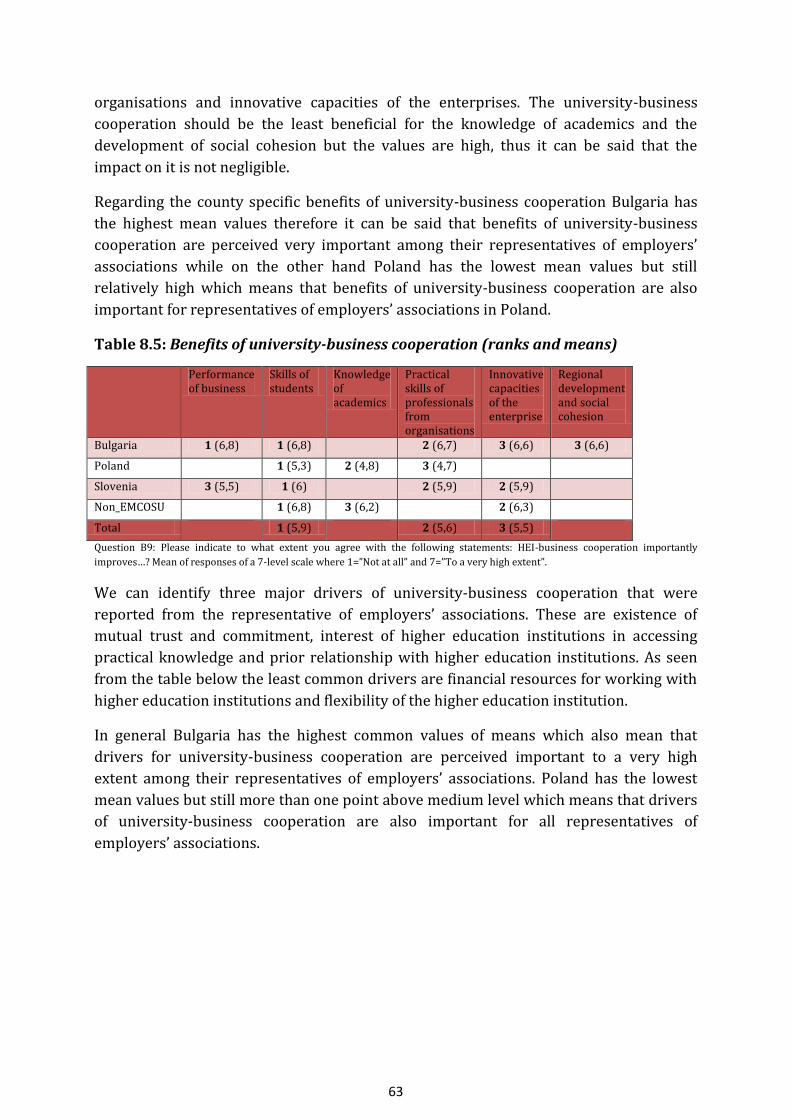
63
organisations and innovative capacities of the enterprises. The university-business
cooperation should be the least beneficial for the knowledge of academics and the
development of social cohesion but the values are high, thus it can be said that the
impact on it is not negligible.
Regarding the county specific benefits of university-business cooperation Bulgaria has
the highest mean values therefore it can be said that benefits of university-business
cooperation are perceived very important among their representatives of employers’
associations while on the other hand Poland has the lowest mean values but still
relatively high which means that benefits of university-business cooperation are also
important for representatives of employers’ associations in Poland.
Table 8.5: Benefits of university-business cooperation (ranks and means)
Performance of business
Skills of students
Knowledge of academics
Practical skills of professionals from organisations
Innovative capacities of the enterprise
Regional development and social cohesion
Bulgaria 1 (6,8) 1 (6,8) 2 (6,7) 3 (6,6) 3 (6,6)
Poland 1 (5,3) 2 (4,8) 3 (4,7)
Slovenia 3 (5,5) 1 (6) 2 (5,9) 2 (5,9)
Non_EMCOSU 1 (6,8) 3 (6,2) 2 (6,3)
Total 1 (5,9) 2 (5,6) 3 (5,5)
Question B9: Please indicate to what extent you agree with the following statements: HEI-business cooperation importantly
improves…? Mean of responses of a 7-level scale where 1=”Not at all” and 7=”To a very high extent”.
We can identify three major drivers of university-business cooperation that were
reported from the representative of employers’ associations. These are existence of
mutual trust and commitment, interest of higher education institutions in accessing
practical knowledge and prior relationship with higher education institutions. As seen
from the table below the least common drivers are financial resources for working with
higher education institutions and flexibility of the higher education institution.
In general Bulgaria has the highest common values of means which also mean that
drivers for university-business cooperation are perceived important to a very high
extent among their representatives of employers’ associations. Poland has the lowest
mean values but still more than one point above medium level which means that drivers
of university-business cooperation are also important for all representatives of
employers’ associations.
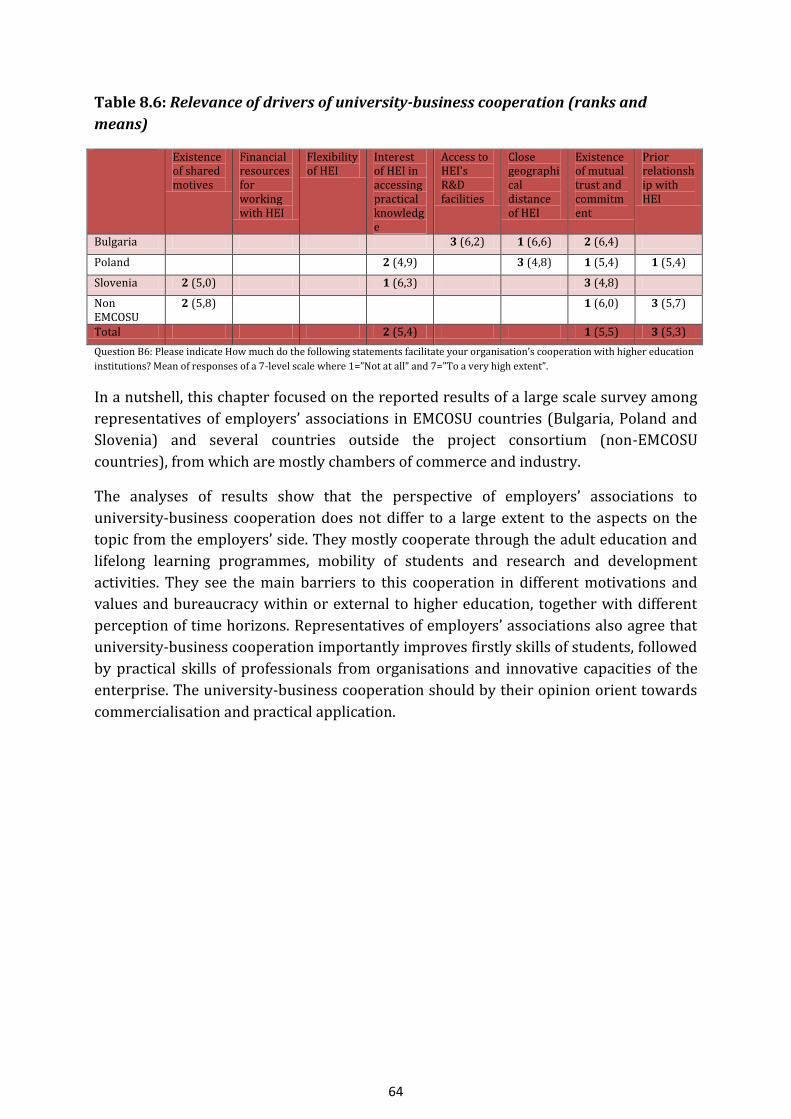
64
Table 8.6: Relevance of drivers of university-business cooperation (ranks and
means)
Existence of shared motives
Financial resources for working with HEI
Flexibility of HEI
Interest of HEI in accessing practical knowledge
Access to HEI's R&D facilities
Close geographical distance of HEI
Existence of mutual trust and commitment
Prior relationship with HEI
Bulgaria 3 (6,2) 1 (6,6) 2 (6,4)
Poland 2 (4,9) 3 (4,8) 1 (5,4) 1 (5,4)
Slovenia 2 (5,0) 1 (6,3) 3 (4,8)
Non EMCOSU
2 (5,8) 1 (6,0) 3 (5,7)
Total 2 (5,4) 1 (5,5) 3 (5,3)
Question B6: Please indicate How much do the following statements facilitate your organisation’s cooperation with higher education
institutions? Mean of responses of a 7-level scale where 1=”Not at all” and 7=”To a very high extent”.
In a nutshell, this chapter focused on the reported results of a large scale survey among
representatives of employers’ associations in EMCOSU countries (Bulgaria, Poland and
Slovenia) and several countries outside the project consortium (non-EMCOSU
countries), from which are mostly chambers of commerce and industry.
The analyses of results show that the perspective of employers’ associations to
university-business cooperation does not differ to a large extent to the aspects on the
topic from the employers’ side. They mostly cooperate through the adult education and
lifelong learning programmes, mobility of students and research and development
activities. They see the main barriers to this cooperation in different motivations and
values and bureaucracy within or external to higher education, together with different
perception of time horizons. Representatives of employers’ associations also agree that
university-business cooperation importantly improves firstly skills of students, followed
by practical skills of professionals from organisations and innovative capacities of the
enterprise. The university-business cooperation should by their opinion orient towards
commercialisation and practical application.
65
9 Specific Sector Experts' Views on University-Business Cooperation
Tomaž Pušnik
The EMCOSU large scale survey includes also responses from experts of particular
branch in the observed economic sectors of industry, services and information and
communication technology who were mostly representatives of different employers’
associations. The survey among specific sector experts focused on the university-
business cooperation in the sector itself and not within the association of the
respondent. The analyses include responses of 25 specific sector experts from Hungary,
26 from Spain and 18 from non-EMCOSU countries.
As shown in the table below the specific sector experts of industry, services and IT in
general reported that university-business cooperation is mostly developed regarding
the research and development activities, mobility of students and adult education and
lifelong learning programmes. The least common modes of cooperation in specific
sectors are curriculum development and mobility of academics. Nevertheless the mean
value of mobility of academics as reported by specific sector experts in industry and IT is
slightly above medium level which means that the mobility of academics should also be
identified as the mode of cooperation.
Comparison between specific sectors shows that research and development is the most
common mode of cooperation in sectors of industry and IT while specific sector experts
in services reported that most common mode of cooperation with universities in their
sector is mobility of students, closely followed by the research and development. The
mean values of those activities are in all three sectors above medium level by almost one
point or more, which means that they are identified to a high extent as common modes
of university-business cooperation. Curriculum development and delivery is identified
by specific sector experts in all sectors as the least common mode of cooperation.
Regarding the country specific sector experts in Spain and non-EMCOSU countries
reported that research and development is the most common mode while Hungarian
representatives ranked mobility of students the highest. In general the highest mean
values of the most common modes of university-business cooperation are in non-
EMCOSU countries, closely followed by Hungary and Spain. It is interestingly to note that
the reported mean values in IT sector in Spain are significantly low, which means that
cooperation between universities and business as stated by the representatives of
employers’ associations is modest.
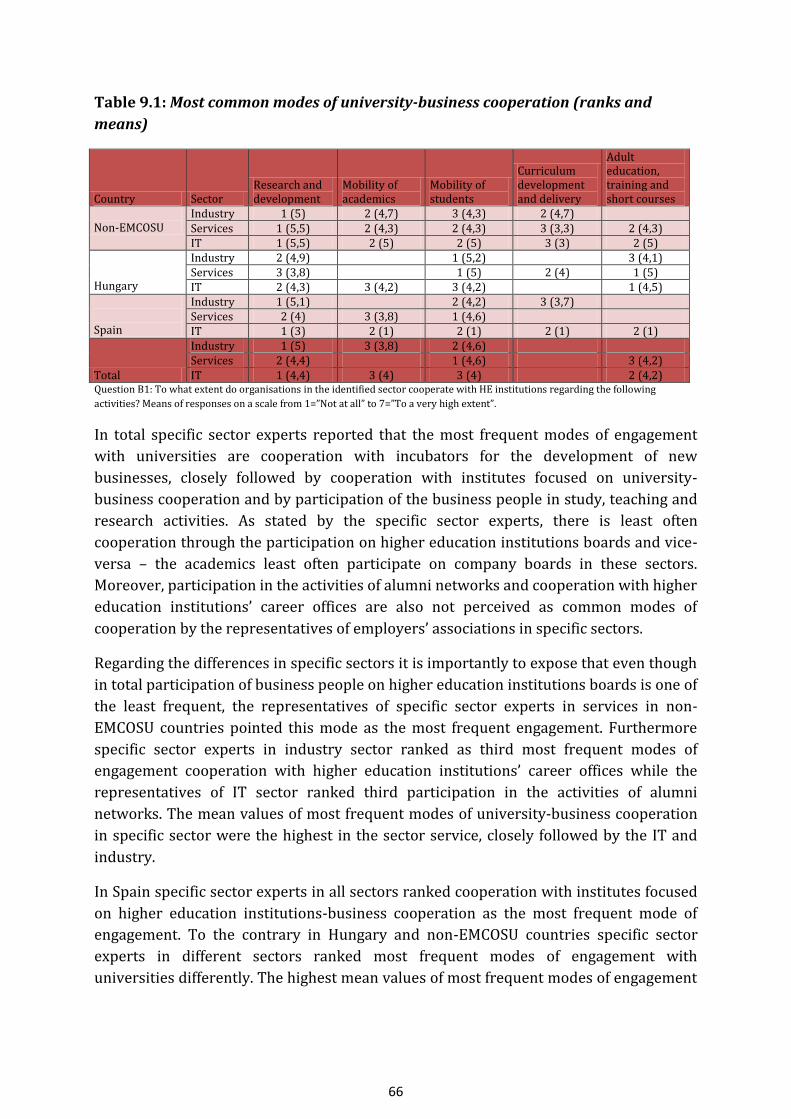
66
Table 9.1: Most common modes of university-business cooperation (ranks and
means)
Country Sector Research and development
Mobility of academics
Mobility of students
Curriculum development and delivery
Adult education, training and short courses
Non-EMCOSU
Industry 1 (5) 2 (4,7) 3 (4,3) 2 (4,7) Services 1 (5,5) 2 (4,3) 2 (4,3) 3 (3,3) 2 (4,3) IT 1 (5,5) 2 (5) 2 (5) 3 (3) 2 (5)
Hungary
Industry 2 (4,9) 1 (5,2) 3 (4,1) Services 3 (3,8) 1 (5) 2 (4) 1 (5) IT 2 (4,3) 3 (4,2) 3 (4,2) 1 (4,5)
Spain
Industry 1 (5,1) 2 (4,2) 3 (3,7) Services 2 (4) 3 (3,8) 1 (4,6) IT 1 (3) 2 (1) 2 (1) 2 (1) 2 (1)
Total
Industry 1 (5) 3 (3,8) 2 (4,6) Services 2 (4,4) 1 (4,6) 3 (4,2) IT 1 (4,4) 3 (4) 3 (4) 2 (4,2)
Question B1: To what extent do organisations in the identified sector cooperate with HE institutions regarding the following
activities? Means of responses on a scale from 1=”Not at all” to 7=”To a very high extent”.
In total specific sector experts reported that the most frequent modes of engagement
with universities are cooperation with incubators for the development of new
businesses, closely followed by cooperation with institutes focused on university-
business cooperation and by participation of the business people in study, teaching and
research activities. As stated by the specific sector experts, there is least often
cooperation through the participation on higher education institutions boards and vice-
versa – the academics least often participate on company boards in these sectors.
Moreover, participation in the activities of alumni networks and cooperation with higher
education institutions’ career offices are also not perceived as common modes of
cooperation by the representatives of employers’ associations in specific sectors.
Regarding the differences in specific sectors it is importantly to expose that even though
in total participation of business people on higher education institutions boards is one of
the least frequent, the representatives of specific sector experts in services in non-
EMCOSU countries pointed this mode as the most frequent engagement. Furthermore
specific sector experts in industry sector ranked as third most frequent modes of
engagement cooperation with higher education institutions’ career offices while the
representatives of IT sector ranked third participation in the activities of alumni
networks. The mean values of most frequent modes of university-business cooperation
in specific sector were the highest in the sector service, closely followed by the IT and
industry.
In Spain specific sector experts in all sectors ranked cooperation with institutes focused
on higher education institutions-business cooperation as the most frequent mode of
engagement. To the contrary in Hungary and non-EMCOSU countries specific sector
experts in different sectors ranked most frequent modes of engagement with
universities differently. The highest mean values of most frequent modes of engagement

67
are in non-EMCOSU countries, followed by Hungary and Spain. Once again Spain has the
lowest mean values in IT sector, all bellow medium level.
Table 9.2: Most frequent modes of engagement in the activities in relation to
universities (ranks and means)
Country Sector
Participation of academics on company boards
Participation of business people on higher education institutions boards
Participation in the activities of alumni networks
Cooperation with higher education institutions’ career offices
Cooperation with institutes focused on higher education institutions-business cooperation
Cooperation with incubators for the development of new businesses
Participation of business people in study, teaching and research activities
Non-EMCOSU
Industry 2 (5,3) 3 (4,3) 1 (5,7)
Services 1 (5) 3 (3,7) 2 (4,3) 2 (4,3)
IT 3 (5) 1 (6,5) 2 (5,5) Hungary
Industry 1 (4,2) 3 (3,8) 2 (4,1) 2 (4,1)
Services 2 (4,4) 3 (4,2) 1 (4,6)
IT 2 (3,8) 2 (3,8) 3 (3,7) 1 (4,2) 3 (3,7)
Spain
Industry 3 (3,5) 1 (3,9) 2 (3,8)
Services 3 (2,8) 2 (3) 3 (2,8) 1 (4,5) 1 (4,5) 3 (2,8)
IT 2 (2) 2 (2) 2 (2) 2 (2) 1 (3) 1 (3) 2 (2)
Total
Industry 3 (3,7) 1 (4) 1 (4) 2 (3,8)
Services 2 (4,3) 1 (4,3) 3 (3,9)
IT 3 (3,9) 2 (4,1) 1 (4,2)
Question B5: How often do organisations in the identified sector engage in the following activities in relation to HE institutions?
Means of responses on a scale from 1=”Not at all” to 7=”To a very high extent”.
We can identify two major drivers of university-business cooperation that were
reported from the specific sector experts for their own sectors. These are existence of
mutual trust and commitment and prior relationship with higher education institutions.
The reported values on the extent of relevance of these two drivers are very high, more
than two points above the medium level. Nevertheless also existence of shared motives,
financial resources for working with HE institutions, interests of HE institutions in
accessing practical knowledge and access to HE institutions’ research and development
facilities were exposed as important drivers. As seen from the table below the least
common drivers are close geographical distance of HE institutions and their flexibility.
Important differences are also between specific sectors. For the IT sector the most
relevant drivers are existence of shared motives and mutual trust and commitment. The
most relevant driver for the sector of industry is prior relationship with HE institutions
while for the services sector existence of mutual trust and commitment. Specific sector
experts in the services also ranked high interest of HE institutions in accessing practical
knowledge and access to higher education institutions’ research and development
facilities while in the sector of industry and IT these two drivers were not indicated as
relevant to a high extent.
In Hungary and to some extent also in Spain financial resources for working with HE
institutions is one of the most relevant drivers while in non-EMCOSU countries with an

68
exception of industry sector this driver is not relevant to a high extent. Especially in
Spain and non-EMCOSU countries the existence of mutual trust and commitment is one
of most relevant drivers for specific sector experts in all observed sectors.
Table 9.3: Relevance of drivers of university-business cooperation (ranks and
means)
Country Sector
Existence of shared motives
Financial resources for working with higher education institutions
Flexibility of higher education institutions
Interest of higher education institutions in accessing practical knowledge
Access to higher education institutions' research and development facilities
Close geographical distance of higher education institutions
Existence of mutual trust and commitment
Prior relationship with higher education institutions
Non-EMCOSU
Industry 2 (5) 3 (4,7) 3 (4,7) 1 (6) 1 (6) Services 3 (5,5) 1 (6,3) 2 (6) IT 3 (5,5) 2 (6) 1 (6,5) 1 (6,5) 2 (6) 1 (6,5)
Hungary
Industry 1 (6,1) 2 (5,9) 3 (5,7) 1 (6,1) Services 3 (5,2) 2 (5,6) 3 (5,2) 1 (5,8) 2 (5,6) IT 2 (5,7) 1 (5,8) 2 (5,7) 3 (5,3)
Spain
Industry 3 (5,1) 2 (5,5) 1 (5,7) 1 (5,7) Services 3 (5,3) 2 (6) 1 (6,3) 2 (6) IT 1 (7) 3 (4) 3 (4) 3 (4) 2 (5) 2 (5) 2 (5) 2 (5)
Total
Industry 3 (5,4) 2 (5,7) 1 (5,9) Services 3 (4,8) 2 (5,5) 3 (4,8) 1 (6) 2 (5,5) IT 1 (5,7) 3 (5,4) 1 (5,7) 2 (5,6)
Question B6: Please indicate How much do the following statements facilitate e cooperation of organisations in the identified sector
with higher education institutions? Mean of responses of a 7-level scale where 1=”Not at all” and 7=”To a very high extent”.
From the table below three major barriers to university-business cooperation that were
reported from the specific sector experts can be identified. Namely, different
motivations and values, different time horizons and bureaucracy within or external to
higher education. In general all these barriers gained high mean values therefore it can
be said that these are common barriers that occur in majority of national systems and in
all specific economic sectors. Different modes of communication and language between
higher education institutions and business can also be identified as a relevant barrier
but to a lower extent. On the other hand the least common barriers are limited ability of
knowledge transfer, publishing of confidential result by the HE institutions, difficulty in
finding the appropriate persons within HE institutions and current financial crisis.
Comparison between specific sectors shows that the most relevant barriers as reported
by the specific sector experts in the services are different time horizons between higher
education institutions and business, while in the sector of industry and the IT the major
barriers to university-business cooperation are different motivations and values
between higher education institutions and business and additionally for the IT also
bureaucracy within or external to the higher education institutions. The mean values are
the highest in the sector of industry, closely followed by the IT sector, meaning that the
representatives in these two sectors perceive barriers to university-business
cooperation to a very high extent. Also in the services sector the mean values are more
than one point above medium level which is only slightly lower than in other two
sectors.
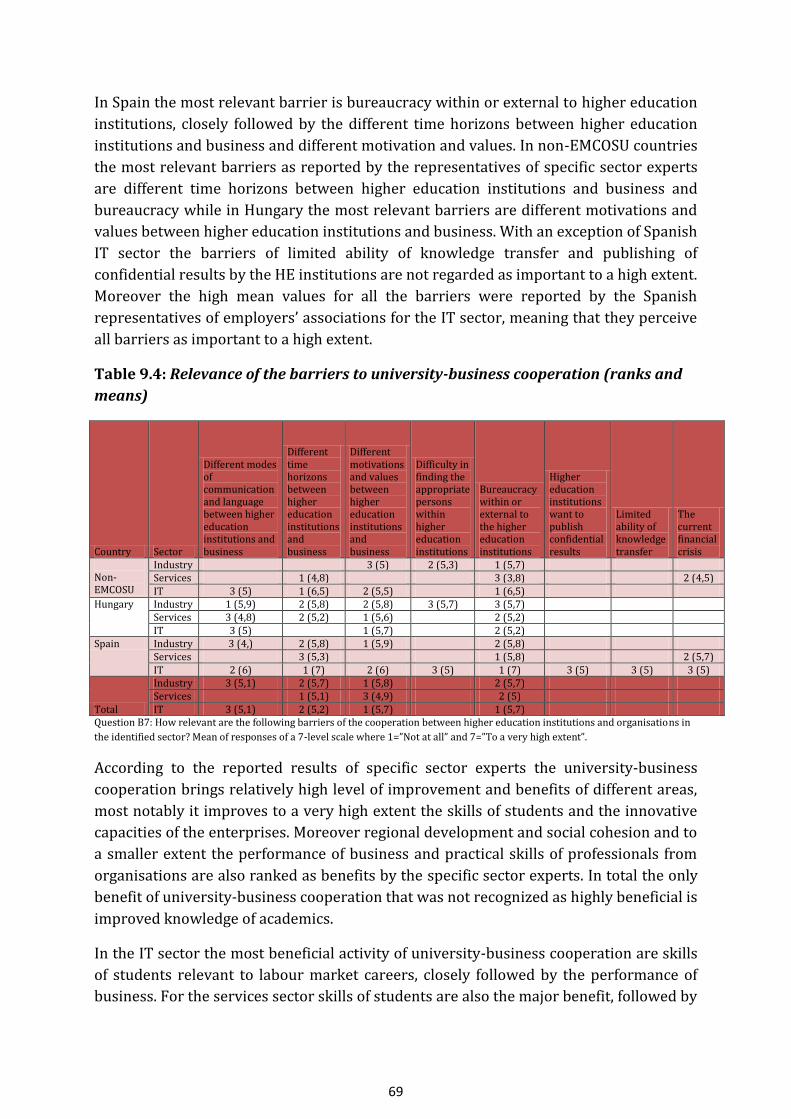
69
In Spain the most relevant barrier is bureaucracy within or external to higher education
institutions, closely followed by the different time horizons between higher education
institutions and business and different motivation and values. In non-EMCOSU countries
the most relevant barriers as reported by the representatives of specific sector experts
are different time horizons between higher education institutions and business and
bureaucracy while in Hungary the most relevant barriers are different motivations and
values between higher education institutions and business. With an exception of Spanish
IT sector the barriers of limited ability of knowledge transfer and publishing of
confidential results by the HE institutions are not regarded as important to a high extent.
Moreover the high mean values for all the barriers were reported by the Spanish
representatives of employers’ associations for the IT sector, meaning that they perceive
all barriers as important to a high extent.
Table 9.4: Relevance of the barriers to university-business cooperation (ranks and
means)
Country Sector
Different modes of communication and language between higher education institutions and business
Different time horizons between higher education institutions and business
Different motivations and values between higher education institutions and business
Difficulty in finding the appropriate persons within higher education institutions
Bureaucracy within or external to the higher education institutions
Higher education institutions want to publish confidential results
Limited ability of knowledge transfer
The current financial crisis
Non-EMCOSU
Industry 3 (5) 2 (5,3) 1 (5,7) Services 1 (4,8) 3 (3,8) 2 (4,5) IT 3 (5) 1 (6,5) 2 (5,5) 1 (6,5)
Hungary Industry 1 (5,9) 2 (5,8) 2 (5,8) 3 (5,7) 3 (5,7) Services 3 (4,8) 2 (5,2) 1 (5,6) 2 (5,2) IT 3 (5) 1 (5,7) 2 (5,2)
Spain Industry 3 (4,) 2 (5,8) 1 (5,9) 2 (5,8) Services 3 (5,3) 1 (5,8) 2 (5,7) IT 2 (6) 1 (7) 2 (6) 3 (5) 1 (7) 3 (5) 3 (5) 3 (5)
Total
Industry 3 (5,1) 2 (5,7) 1 (5,8) 2 (5,7) Services 1 (5,1) 3 (4,9) 2 (5) IT 3 (5,1) 2 (5,2) 1 (5,7) 1 (5,7)
Question B7: How relevant are the following barriers of the cooperation between higher education institutions and organisations in
the identified sector? Mean of responses of a 7-level scale where 1=”Not at all” and 7=”To a very high extent”.
According to the reported results of specific sector experts the university-business
cooperation brings relatively high level of improvement and benefits of different areas,
most notably it improves to a very high extent the skills of students and the innovative
capacities of the enterprises. Moreover regional development and social cohesion and to
a smaller extent the performance of business and practical skills of professionals from
organisations are also ranked as benefits by the specific sector experts. In total the only
benefit of university-business cooperation that was not recognized as highly beneficial is
improved knowledge of academics.
In the IT sector the most beneficial activity of university-business cooperation are skills
of students relevant to labour market careers, closely followed by the performance of
business. For the services sector skills of students are also the major benefit, followed by

70
the practical skills of professionals from organisation. The specific sector experts
reported for the sector of industry that the innovative capacities of the enterprise are
the most important benefit. In general in all sectors the mean values of highly ranked
benefits of university-business cooperation are high which means that specific sector
experts perceive those benefits as important improvements of UBC.
In Hungary the skills of students relevant to labour market careers were ranked the
highest while the regional development and social cohesion was not perceived as an
important benefit by the Hungarian representative of specific sectors. In non-EMCOSU
countries specific sector experts of all sectors ranked innovative capacities of the
enterprise as the most important benefit for their sectors and also the mean value was
very high, meaning that they see benefits of the UBC for innovative capacities of the
enterprise to a high extent. In the non-EMCOSU countries representatives of the IT
sector valued almost all benefits very high and quite the opposite in the IT sector in
Spain all the benefits were valued quite low, just slightly above the medium level.
Table 9.5: Benefits of university-business cooperation (ranks and means)
Country Sector The performance of business
The skills of students relevant to labour market careers
The knowledge of academics
The practical skills of professionals from organisations
The innovative capacities of the enterprise
Regional development and social cohesion
Non-EMCOSU
Industry 2 (5,7) 3 (5,3) 3 (5,3) 2 (5,7) 1 (6) 1 (6)
Services 2 (5,5) 3 (5,3) 1 (6)
IT 1 (6,5) 2 (6) 3 (5,5) 1 (6,5) 3 (5,5)
Hungary
Industry 1 (6) 3 (5,7) 2 (5,8)
Services 1 (5,6) 3 (5) 2 (5,4)
IT 2 (5,7) 1 (6) 2 (5,7) 3 (5,5)
Spain
Industry 2 (5,5) 3 (5,4) 1 (5,8)
Services 1 (6,4) 3 (5,8) 3 (5,8) 2 (6,2)
IT 2 (4) 1 (5) 1 (5) 2 (4) 2 (4) 2 (4)
Total
Industry 2 (5,6) 1 (5,8) 3 (5,4)
Services 1 (5,9) 2 (5,4) 2 (5,4) 3 (5,2)
IT 2 (5,7) 1 (5,9) 3 (5,6)
Question B9: Please indicate to what extent you agree with the following statements: HEI-business cooperation importantly
improves…? Mean of responses of a 7-level scale where 1=”Not at all” and 7=”To a very high extent”.
Regarding the future developmental needs of universities the specific sector experts
reported that universities should put more focus to increase practical orientation of
teaching in order to enhance cooperation with business in all three economic sectors.
Strategic cooperation with business, support an international orientation, enabling the
valorisation of applied research, focus on research and development and enhancing
traineeships and internship were also identified as important future developmental
needs of universities by specific sector experts. All these future developmental needs
gained high mean values thus meaning that representatives of employers’ associations
perceive those changes at universities as necessary for enhancing cooperation with
companies in specific sector that they represent. In general the only two future
developmental needs that were not recognized as important to a high extent were

71
improvements in financial systems of universities and focus on short-term skill
development.
As shown in the table below the specific sector experts in all three economic sectors
ranked the highest the need to increase of practical orientation of teaching. Specific
sector experts in industry also ranked the highest support an international orientation
which were not recognized by the services and IT sectors experts as important future
developmental needs.
Table 9.6: Future developmental needs of universities (ranks and means)
Country Sector
Increase the practical orientation of teaching
Enhance traineeships and internships
Improvements in their financial systems
Focus on short-term skill development
Support an international orientation
Focus on research and development
Enabling the valorisation of applied research
Strategic cooperation with business
Non-EMCOSU
Industry 3 (5) 2 (5,3) 1 (5,7) 1 (5,7) 2 (5,3)
Services 3 (5,3) 3 (6) 2 (6,3) 1 (6,7)
IT 3 (5,5) 1 (6,5) 3 (5,5) 3 (5,5) 2 (6)
Hungary
Industry 2 (6) 3 (5,9) 1 (6,3)
Services 1 (6,2) 2 (5,4) 3 (5) 2 (5,4) 3 (5)
IT 1 (6,3) 2 (6,2) 3 (5,8)
Spain
Industry 2 (6) 2 (6) 3 (5,8) 1 (6,2)
Services 2 (6,4) 2 (6,4) 3 (6) 3 (6) 1 (6,6)
IT 1 (7) 1 (7) 3 (4) 2 (5) 3 (4) 1 (7) 1 (7) 1 (7)
Total
Industry 1 (5,9) 1 (5,9) 3 (5,5) 2 (5,8) 1 (5,9)
Services 1 (6) 3 (5,8) 2 (5,9)
IT 1 (6,2) 3 (6) 2 (6,1)
Question B4: In your view, to what extent should higher education institutions change in the future to enhance cooperation with
organisations from identified sector? Mean of responses of a 7-level scale where 1=”Not at all” and 7=”To a very high extent”.
Regarding the country specifics it is interesting to note that the reported mean values in
IT sector in Spain are significantly high. Five out of eight future developmental needs
were valued by the highest mean value while also other three were above the medium
level. This means that future developmental needs of universities are highly important
to enhance cooperation with the IT sector in Spain. In Hungary the most important
future developmental need is to increase practical orientation of teaching while in Spain
experts of all three economic sectors stated that strategic cooperation is the most
important to enhance cooperation with organisations in these sectors. Improvement in
the financial systems of universities and focus on short-term skill development were
perceived as important future developmental needs of universities only by specific
sector experts in Spain and not by representatives from other countries.
72
10 Comparative analysis of university-business cooperation between representatives of companies, employers’ associations and specific sector experts
Tomaž Pušnik
In the following section we will compare university-business cooperation between
companies, employers’ associations and specific sectors. Representatives of companies
and employers’ associations reported how their company or employers association is
involved in the UBC and how they cooperate with universities while the specific sector
experts on the basis of their experiences and expertise reported how they perceive that
companies in the specific sector where they work cooperate with universities. The
analyses include 397 companies, 70 employers’ associations and 69 specific sector
experts from Poland, Bulgaria, Slovenia, Hungary, Spain as well as from non-EMCOSU
countries.
As analyses show the highest extent of university-business cooperation is reported by
the specific sector experts. For four out of five modes of UBC the reported mean values
are thus the highest in specific sector. Only adult education and lifelong learning was
reported as more common mode of UBC for employers’ associations then by the specific
sector experts. In general the most common mode of university-business cooperation is
research and development. Especially experts in specific sectors perceive that
companies in the sectors they represent cooperate the most with universities in R&D. On
the other side the least common mode of UBC in general is mobility of academics.
Specifically for representatives of companies and employers’ associations mobility of
academics is identified as the least frequent mode of cooperation.
For companies the most common mode of UBC is mobility of students, followed by the
adult education and lifelong learning, research and development as well as curriculum
development. Representatives of employers’ associations reported that the most
frequent modes of cooperation are adult education and lifelong learning, followed by the
research and development, while specific sector experts stated that they perceive as
most common modes research and development closely followed by the mobility of
students. The least common mode of UBC for companies is mobility of academics. In
addition to the mobility of academics representatives of employers’ association reported
also that mobility of students and curriculum development are not so common. Specific
sector experts perceive that in the sector they work, the least common modes are
curriculum development, closely followed by the mobility of academics and adult
education and the lifelong learning. The highest differences in the mean values are seen
for the mobility of academics and mobility of students. Thus the mobility of academics is
perceived as a more common mode of UBC for specific sector experts than for the
representatives of companies. The same applies for mobility of students, where specific

73
sector experts perceive this mode of UBC as more frequent in comparison to the
representatives of employers’ associations.
Regarding the future developmental needs of universities in general the mean values in
all three sectors are high. More specifically, mean values are in all three sectors and for
almost all developmental needs one point or more above the medium level. Thus
meaning that they all perceive that higher education institutions should change in the
future. In general increasing the practical orientation of teaching and strategic
cooperation with business are regarded as most important developmental needs.
Nevertheless also enhancing traineeships and internships, support an international
orientation, enabling valorisation of applied research and focus on R&D are exposed as
important future developmental needs. In general the least important developmental
needs are focus on short term skill development and improvements in the financial
systems of universities. Still the mean values are beyond the medium level and therefore
regarded as valuable and needed changes of higher education institutions.
Representatives of employers’ associations perceive future developmental needs of
universities as slightly higher extent than representatives of companies and experts in
specific sector. For companies the most crucial developmental needs of universities are
strategic cooperation with business closely followed by increase of the practical
orientation of teaching. For employer’ association it is just reversed. They perceive
increasing of the practical orientation in teaching as the most important, followed by the
strategic cooperation with business and also enhancing traineeships and internships. In
the opinion of experts for specific sector the most important future developmental
needs of universities for their sector are increasing the practical orientation of teaching,
while strategic cooperation with business, support of international orientation, enabling
valorisation of applied research, enhancing traineeships and internships and focus on
R&D are regarded almost as equally important. On the other hand experts in specific
sector reported that the least important developmental need of universities from the
perspective of their sector is focus on short-term skill development which is also the
lowest value for companies and employers’ associations.
According to the results of the most frequent modes of engagement with universities as
reported by the representatives of companies, employers’ associations and the experts
in specific sectors we can acknowledge that the level of engagement is relatively low.
Most of the mean values are around the medium level and almost never exceed this level
for more than one point above or below.
In general the least frequent modes are participation of academics on company boards
and vice versa, participation of business people on HE boards. Participation in the
activities of alumni networks was also identified as not so common mode of engagement
in relation to universities. On the other hand the most frequent modes of engagement
are participation of business people in study, teaching and research activities and
cooperation with institutes focused on UBC.

74
The analyses show that the lowest values of engagement in the activities in relation to
universities were reported from representatives of companies. Especially participation
of academics on company boards, participation of business people on HE boards,
participation in the activities of alumni networks and cooperation with incubators for
development of business are identified as less frequent modes of engagements. For
companies the most frequent modes of engagement are participation of business people
in study, teaching and research activities and cooperation with HEI’s career offices.
Experts for specific sector reported that they perceive as the most common mode for
their sector the cooperation with institutes focused on the UBC, closely followed by the
cooperation with incubators for development of business. Representatives of employers’
association identified as the most common modes of engagement participation of
business representatives in study, teaching and research activities and cooperation with
incubators for development of business. On the other hand the least frequent modes of
engagement for employers’ associations are participation of academics on company
boards and vice versa, participation of business people on HE boards. Besides those two
modes, experts for specific sectors also reported that on the basis of their experiences
companies in their sectors also don’t participate commonly in the activities of alumni
networks.
Comparison between companies, employers’ associations and specific sector shows that
the highest difference in mean values are in the participation of academics on company
boards and cooperation with incubators for development of business. For
representatives of companies those two modes are identified as less common then for
the representatives of employers’ association and for the experts in specific sectors. The
difference in mean values is thus one point or more. On the other side the minimum
difference in the mean values between all three sectors is in the cooperation with HEI’s
career offices. For all three sectors the mean value is slightly above the medium level.
In general reported mean values are relatively high for all three sectors, which means
that drivers of UBC are perceived as relevant to a high extent. They are the highest for
specific sectors and employers’ associations and a bit lower for companies. In general
existence of mutual trust and commitment, prior relationship with HEI and interest of
HEI in accessing practical knowledge are perceived as the most relevant drivers, while
flexibility of HEI and financial resources for working with HEI are least relevant but still
above the medium level.
As stated above the lowest reported values were reported by the representatives of
companies, moreover mean values are the lowest for all eight drivers. Besides financial
resources for working with HEI and flexibility of HEI also access to HEI’s research and
development facilities and close geographical distance of HEI were not perceived as the
most relevant drivers by representatives of companies. For employers’ associations all
drivers are almost equally important with exceptions of financial resources for working
with HEI and flexibility of HEI. Practically the same assessment of the relevance of
75
drivers can be seen for the experts from specific sectors. All drivers are nearly equally
important, just close geographical distance of HEI and flexibility of HEI can be seen as
slightly less relevant.
For barriers to university-business cooperation we can see bigger difference than for
drivers. In general the most relevant barriers as reported by the representatives of
companies, employers’ associations and by the experts in specific sectors are
bureaucracy within or external to HEI, different time horizons between business and
universities and different motivations and values. On the other hand the least important
barriers are publishing of confidential results by the HEI, current financial crisis and
limited ability of knowledge transfer. Once again the mean values of the barriers to UBC
are the highest in specific sector, meaning that experts in specific sector perceive
relevance of barriers to a higher extent than representatives of companies and
employers’ associations.
For companies the most important barriers are bureaucracy within or external to HEI,
different time horizons and different motivations and values but also difficulty in finding
appropriate persons within HEI and different modes of communication. Current
financial crisis and publishing of confidential results by the HEI on the other hand are
perceived as least common barriers. For representatives of employers’ associations the
most relevant barriers are different motivation and values, bureaucracy within or
external to HEI, different time horizons and also different modes of communication. The
least relevant barriers are the same as for companies, publishing of confidential results
by the HEI and the current financial crisis. Experts in the specific sectors reported that
they perceive that the most relevant barriers for their sectors are bureaucracy within or
external to HEI, different time horizons and different motivations and values. High mean
values have also different modes of communication and difficulty in finding appropriate
persons within HEI thus meaning that those barriers are also relevant for experts in
specific sectors.
According to the reported results the university-business cooperation brings relatively
high level of improvement and benefits for all three sectors. Most notably it improves
skills of students, innovative capacities of the enterprises, practical skills of
professionals and organisations as well as knowledge of the academics. Performance of
business and regional development and social cohesion have in general the lowest mean
values but are still regarded as important benefits of UBC. Differences in mean values
are low, meaning that all three sectors perceive benefits of UBC almost equally.
For companies the biggest benefits of UBC are improvement of students’ skills, followed
by the innovative capacities of the enterprises. In addition to those two benefits
representatives of employers’ associations perceive highly beneficial also practical skills
of professionals from organisations and knowledge of academics. Experts for specific
sector stated that the biggest benefits of university-business cooperation are

76
improvement of student skills and innovative capacities of the enterprises while all
other benefits were regarded almost as equally important.
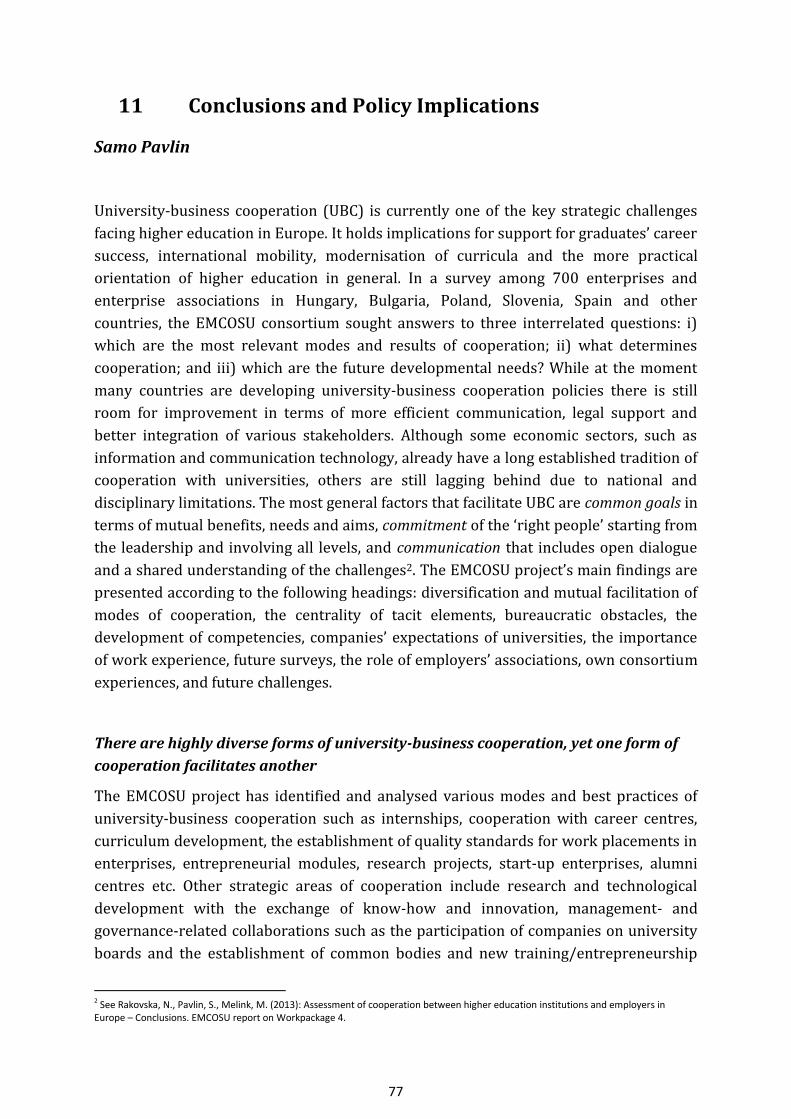
77
11 Conclusions and Policy Implications
Samo Pavlin
University-business cooperation (UBC) is currently one of the key strategic challenges
facing higher education in Europe. It holds implications for support for graduates’ career
success, international mobility, modernisation of curricula and the more practical
orientation of higher education in general. In a survey among 700 enterprises and
enterprise associations in Hungary, Bulgaria, Poland, Slovenia, Spain and other
countries, the EMCOSU consortium sought answers to three interrelated questions: i)
which are the most relevant modes and results of cooperation; ii) what determines
cooperation; and iii) which are the future developmental needs? While at the moment
many countries are developing university-business cooperation policies there is still
room for improvement in terms of more efficient communication, legal support and
better integration of various stakeholders. Although some economic sectors, such as
information and communication technology, already have a long established tradition of
cooperation with universities, others are still lagging behind due to national and
disciplinary limitations. The most general factors that facilitate UBC are common goals in
terms of mutual benefits, needs and aims, commitment of the ‘right people’ starting from
the leadership and involving all levels, and communication that includes open dialogue
and a shared understanding of the challenges2. The EMCOSU project’s main findings are
presented according to the following headings: diversification and mutual facilitation of
modes of cooperation, the centrality of tacit elements, bureaucratic obstacles, the
development of competencies, companies’ expectations of universities, the importance
of work experience, future surveys, the role of employers’ associations, own consortium
experiences, and future challenges.
There are highly diverse forms of university-business cooperation, yet one form of
cooperation facilitates another
The EMCOSU project has identified and analysed various modes and best practices of
university-business cooperation such as internships, cooperation with career centres,
curriculum development, the establishment of quality standards for work placements in
enterprises, entrepreneurial modules, research projects, start-up enterprises, alumni
centres etc. Other strategic areas of cooperation include research and technological
development with the exchange of know-how and innovation, management- and
governance-related collaborations such as the participation of companies on university
boards and the establishment of common bodies and new training/entrepreneurship
2 See Rakovska, N., Pavlin, S., Melink, M. (2013): Assessment of cooperation between higher education institutions and employers in Europe – Conclusions. EMCOSU report on Workpackage 4.
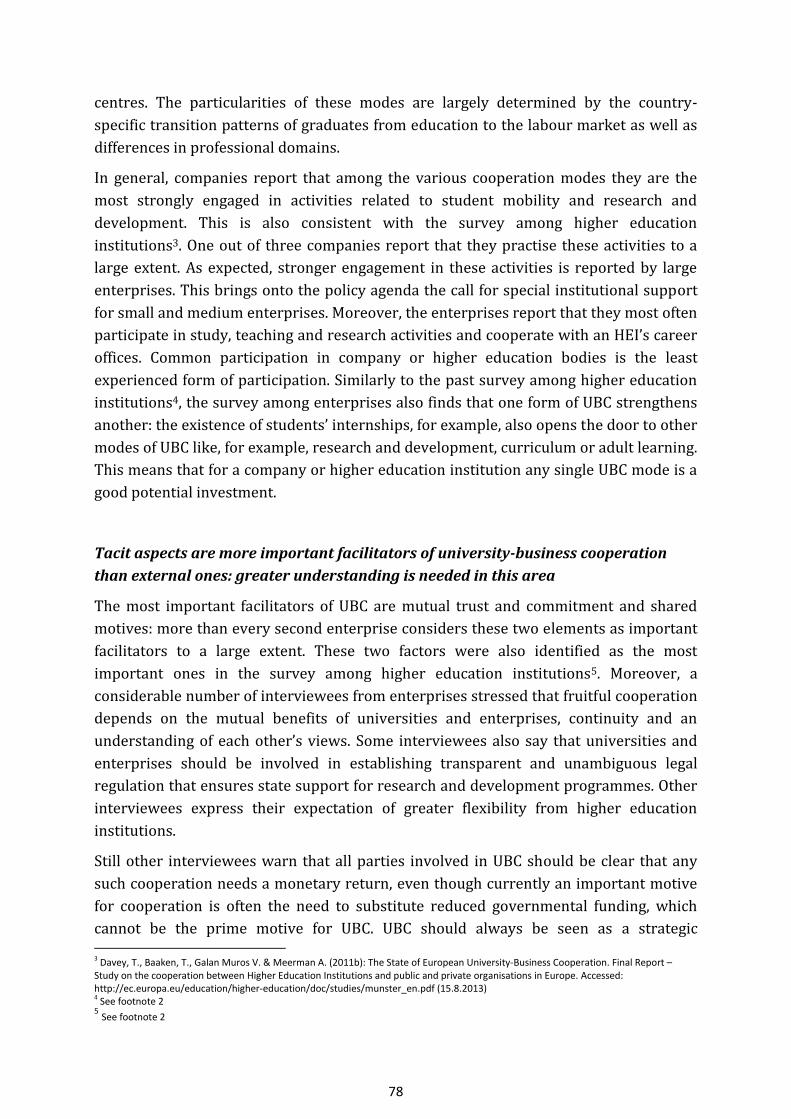
78
centres. The particularities of these modes are largely determined by the country-
specific transition patterns of graduates from education to the labour market as well as
differences in professional domains.
In general, companies report that among the various cooperation modes they are the
most strongly engaged in activities related to student mobility and research and
development. This is also consistent with the survey among higher education
institutions3. One out of three companies report that they practise these activities to a
large extent. As expected, stronger engagement in these activities is reported by large
enterprises. This brings onto the policy agenda the call for special institutional support
for small and medium enterprises. Moreover, the enterprises report that they most often
participate in study, teaching and research activities and cooperate with an HEI’s career
offices. Common participation in company or higher education bodies is the least
experienced form of participation. Similarly to the past survey among higher education
institutions4, the survey among enterprises also finds that one form of UBC strengthens
another: the existence of students’ internships, for example, also opens the door to other
modes of UBC like, for example, research and development, curriculum or adult learning.
This means that for a company or higher education institution any single UBC mode is a
good potential investment.
Tacit aspects are more important facilitators of university-business cooperation
than external ones: greater understanding is needed in this area
The most important facilitators of UBC are mutual trust and commitment and shared
motives: more than every second enterprise considers these two elements as important
facilitators to a large extent. These two factors were also identified as the most
important ones in the survey among higher education institutions5. Moreover, a
considerable number of interviewees from enterprises stressed that fruitful cooperation
depends on the mutual benefits of universities and enterprises, continuity and an
understanding of each other’s views. Some interviewees also say that universities and
enterprises should be involved in establishing transparent and unambiguous legal
regulation that ensures state support for research and development programmes. Other
interviewees express their expectation of greater flexibility from higher education
institutions.
Still other interviewees warn that all parties involved in UBC should be clear that any
such cooperation needs a monetary return, even though currently an important motive
for cooperation is often the need to substitute reduced governmental funding, which
cannot be the prime motive for UBC. UBC should always be seen as a strategic 3 Davey, T., Baaken, T., Galan Muros V. & Meerman A. (2011b): The State of European University-Business Cooperation. Final Report – Study on the cooperation between Higher Education Institutions and public and private organisations in Europe. Accessed: http://ec.europa.eu/education/higher-education/doc/studies/munster_en.pdf (15.8.2013) 4 See footnote 2 5 See footnote 2
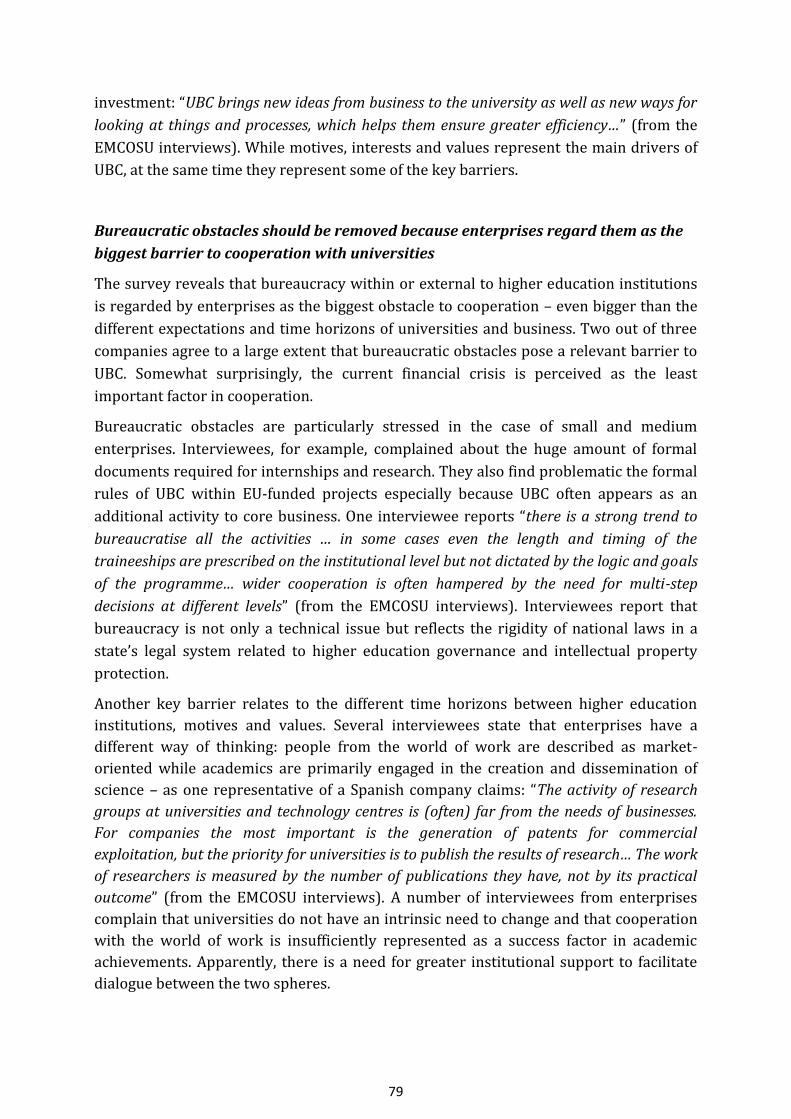
79
investment: “UBC brings new ideas from business to the university as well as new ways for
looking at things and processes, which helps them ensure greater efficiency…” (from the
EMCOSU interviews). While motives, interests and values represent the main drivers of
UBC, at the same time they represent some of the key barriers.
Bureaucratic obstacles should be removed because enterprises regard them as the
biggest barrier to cooperation with universities
The survey reveals that bureaucracy within or external to higher education institutions
is regarded by enterprises as the biggest obstacle to cooperation – even bigger than the
different expectations and time horizons of universities and business. Two out of three
companies agree to a large extent that bureaucratic obstacles pose a relevant barrier to
UBC. Somewhat surprisingly, the current financial crisis is perceived as the least
important factor in cooperation.
Bureaucratic obstacles are particularly stressed in the case of small and medium
enterprises. Interviewees, for example, complained about the huge amount of formal
documents required for internships and research. They also find problematic the formal
rules of UBC within EU-funded projects especially because UBC often appears as an
additional activity to core business. One interviewee reports “there is a strong trend to
bureaucratise all the activities … in some cases even the length and timing of the
traineeships are prescribed on the institutional level but not dictated by the logic and goals
of the programme… wider cooperation is often hampered by the need for multi-step
decisions at different levels” (from the EMCOSU interviews). Interviewees report that
bureaucracy is not only a technical issue but reflects the rigidity of national laws in a
state’s legal system related to higher education governance and intellectual property
protection.
Another key barrier relates to the different time horizons between higher education
institutions, motives and values. Several interviewees state that enterprises have a
different way of thinking: people from the world of work are described as market-
oriented while academics are primarily engaged in the creation and dissemination of
science – as one representative of a Spanish company claims: “The activity of research
groups at universities and technology centres is (often) far from the needs of businesses.
For companies the most important is the generation of patents for commercial
exploitation, but the priority for universities is to publish the results of research… The work
of researchers is measured by the number of publications they have, not by its practical
outcome” (from the EMCOSU interviews). A number of interviewees from enterprises
complain that universities do not have an intrinsic need to change and that cooperation
with the world of work is insufficiently represented as a success factor in academic
achievements. Apparently, there is a need for greater institutional support to facilitate
dialogue between the two spheres.
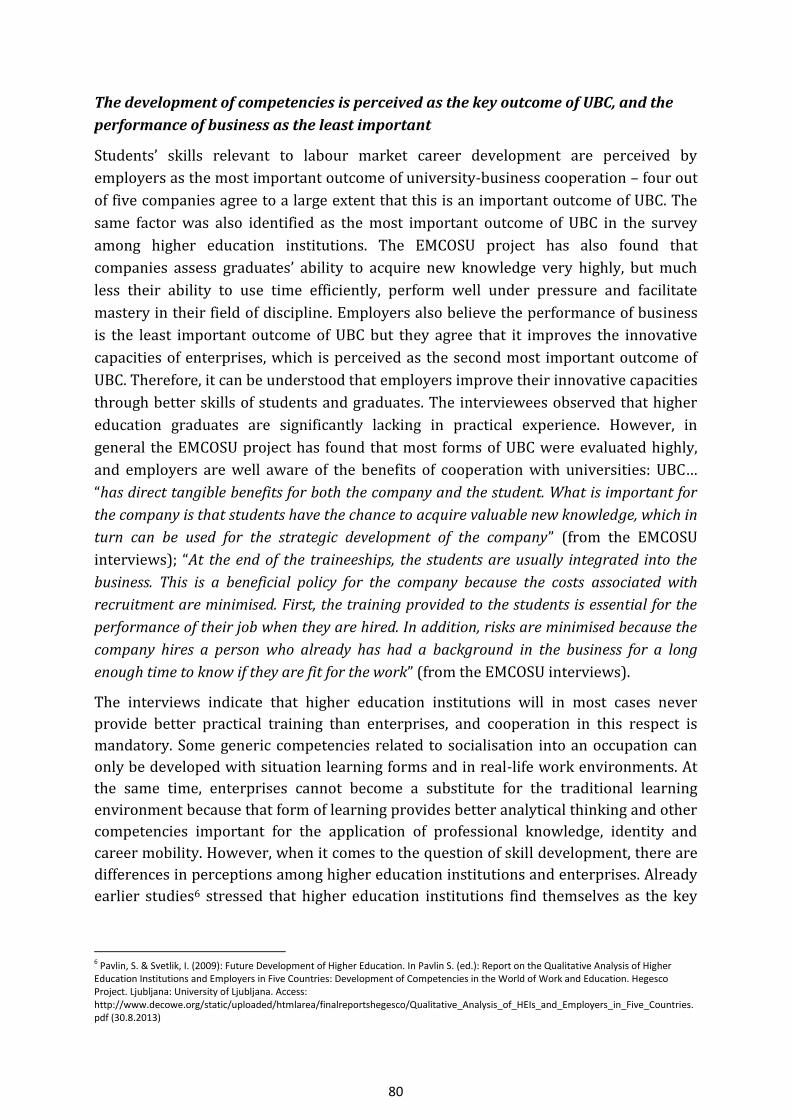
80
The development of competencies is perceived as the key outcome of UBC, and the
performance of business as the least important
Students’ skills relevant to labour market career development are perceived by
employers as the most important outcome of university-business cooperation – four out
of five companies agree to a large extent that this is an important outcome of UBC. The
same factor was also identified as the most important outcome of UBC in the survey
among higher education institutions. The EMCOSU project has also found that
companies assess graduates’ ability to acquire new knowledge very highly, but much
less their ability to use time efficiently, perform well under pressure and facilitate
mastery in their field of discipline. Employers also believe the performance of business
is the least important outcome of UBC but they agree that it improves the innovative
capacities of enterprises, which is perceived as the second most important outcome of
UBC. Therefore, it can be understood that employers improve their innovative capacities
through better skills of students and graduates. The interviewees observed that higher
education graduates are significantly lacking in practical experience. However, in
general the EMCOSU project has found that most forms of UBC were evaluated highly,
and employers are well aware of the benefits of cooperation with universities: UBC…
“has direct tangible benefits for both the company and the student. What is important for
the company is that students have the chance to acquire valuable new knowledge, which in
turn can be used for the strategic development of the company” (from the EMCOSU
interviews); “At the end of the traineeships, the students are usually integrated into the
business. This is a beneficial policy for the company because the costs associated with
recruitment are minimised. First, the training provided to the students is essential for the
performance of their job when they are hired. In addition, risks are minimised because the
company hires a person who already has had a background in the business for a long
enough time to know if they are fit for the work” (from the EMCOSU interviews).
The interviews indicate that higher education institutions will in most cases never
provide better practical training than enterprises, and cooperation in this respect is
mandatory. Some generic competencies related to socialisation into an occupation can
only be developed with situation learning forms and in real-life work environments. At
the same time, enterprises cannot become a substitute for the traditional learning
environment because that form of learning provides better analytical thinking and other
competencies important for the application of professional knowledge, identity and
career mobility. However, when it comes to the question of skill development, there are
differences in perceptions among higher education institutions and enterprises. Already
earlier studies6 stressed that higher education institutions find themselves as the key
6 Pavlin, S. & Svetlik, I. (2009): Future Development of Higher Education. In Pavlin S. (ed.): Report on the Qualitative Analysis of Higher Education Institutions and Employers in Five Countries: Development of Competencies in the World of Work and Education. Hegesco Project. Ljubljana: University of Ljubljana. Access: http://www.decowe.org/static/uploaded/htmlarea/finalreportshegesco/Qualitative_Analysis_of_HEIs_and_Employers_in_Five_Countries.pdf (30.8.2013)
81
actor in the development of professional competencies, while employers consider that
their own role is just as important as that of universities.
Companies do not agree with the idea that university-business cooperation should
be limited to basic research or even remain separate from industry
In the EMCOSU survey only a few enterprises report that UBC should be limited to basic
research or even remain separate from industry. In general, two out of three companies
claim UBC should be upgraded for application and commercial exploitation and one out
of three that UBC is fundamentally important for research and development with some
differences among countries. According to the EMCOSU survey, the opinions of
enterprises on UBC are much more homogenous than is the case with universities. Other
studies7 among higher education institutions have found that academics hold a wider
range of positions on UBC like, for example, the traditional academic who believes the
academic sector and industry should be separate or those who believe that only some
form of cooperation should exist. As one interviewee reported, “I would like to emphasise
the poor treatment of academic entrepreneurship as one of the most conspicuous negative
indicators. Academic entrepreneurship is not perceived as something positive; moreover,
there is a great amount of new legislation at the national level which is preventing its
development” (from the EMCOSU interviews).
Enterprises believe higher education should increase the practical orientation of
teaching and enhance traineeships and internships – both processes have been
identified as the main strategic developmental path
In contrast to the common belief that enterprises’ foremost preference vis-{-vis higher
education is the production of ready-made skills, the EMCOSU survey finds that this is
not the case. Above all, employers believe universities should develop strategic
cooperation with business, particularly the practical orientation of teaching, and
enhance traineeships and internships. As found in the survey, in addition to the Internet,
internships are reported to be the central recruitment mechanism used by three out of
four large companies and approximately every second SME. This means they would like
to develop a much more integral approach to training young graduates. In this context, it
is important to stress that higher education institutions and employers perceive the
centrality of practical learning very differently. An earlier study8 reported that almost
every second employer sees the practical orientation of study programmes as one of the
7 …for example Lam, A. (2010): From 'Ivory Tower Traditionalists' to 'Entrepreneurial Scientists'? Academic Scientists in Fuzzy University-Industry Boundaries, Social Studies of Science, vol. 40 no. 2, pp. 307-340. 8 Pavlin, S. & Svetlik, I. (2009): Future Development of Higher Education. In Pavlin S. (ed.): Report on the Qualitative Analysis of Higher
Education Institutions and Employers in Five Countries: Development of Competencies in the World of Work and Education. Hegesco Project. Ljubljana: University of Ljubljana. Access: http://www.decowe.org/static/uploaded/htmlarea/finalreportshegesco/Qualitative_Analysis_of_HEIs_and_Employers_in_Five_Countries.pdf (30.8.2013)
82
most obvious developmental trends in higher education, yet this is only recognised by
one out of ten academics. As one interviewee notes: “In the past, universities created
curricula by themselves, with no consideration of the practical needs of employers. They
took into account what the students required plus what capacities they had” (from the
EMCOSU interviews). In order to facilitate better cooperation, several interviewees
stress that improvements should be made to the culture of UBC among researchers and
policies developed “to make UBC outcomes as important as research outcomes for career
progress purposes” (from the EMCOSU interviews). Hence, big challenges are entailed in
making further improvements to the development of the professional relevance of
higher education. Based on the EMCOSU survey, as well as the earlier DEHEMS project9,
employers are calling for the recognition of work experience in terms of traineeships
and internships. An interviewee even suggests that one of the priorities in the academic
community is to create lifelong learning programmes which are needed by industry.
“The current situation is that industry is more oriented to different industrial certificates
and academic institutions offer broad lifelong learning programmes. It is the responsibility
of academic institutions to create and offer lifelong learning programmes that would be
recognised by industry” (from the EMCOSU interviews).
Further work
Considering future comparative surveys on similarities and differences among a larger
group of countries
Among other factors, the similarities and differences among countries are rooted in
historical traditions of relations between education and employers, including
established human resources and training practices and general qualification and legal
frameworks. The EMCOSU project has given most attention to four EU transition
countries – Bulgaria, Hungary, Poland and Slovenia – and Spain (“EMCOSU countries”)
but has also considered other EU countries, particularly Croatia, Germany, France, Czech
Republic, Slovakia, Italy, ex-Yugoslav countries, Sweden and Russia. The number of cases
in the other countries was significantly lower than with the EMCOSU countries yet the
consortium was able to develop a hypothesis on how certain countries can be different
from all others. For example, it presumed that in Croatia, and the Czech and Slovak
Republics research and development is less developed compared to other UBC factors
relative to other countries under observation. Bureaucracy is not such a concern in
Scandinavian countries. Italian companies do not consider that their universities need a
practical orientation as much as elsewhere. The list of these insights stemming from
different EU countries is long and requires further investigation.
9 Pavlin, S. (ed.) (2012): Employability of graduates and higher education management systems: Conference proceedings, Vienna and Ljubljana; September 2011 and 2012 [Ljubljana]: Faculty of Social Sciences, cop. 2012. http://www.dehems-project.eu/static/uploaded/files/files/deliverables/Conference_Proceedings_Part_I_-_Vienna.pdf.
83
Employers’ associations have the potential to become stronger promoters of UBC
The EMCOSU project shows that employers’ associations in some countries hold
relatively limited systematic knowledge regarding UBC. However, at the same time the
results indicate that the perspective of employers’ associations on UBC does not vary
much from the employers’ side. Employers’ associations also cooperate in the mobility
of students and research and development activities. Similarly to employers, they find
bureaucracy and different motives and values to be the key barriers to cooperation and
also complain that universities have a different perception of time horizons. In general,
they believe that UBC should be oriented towards commercialisation and practical
application. Based on the outcomes of the EMCOSU project, employers’ associations have
good operational potential to become supporters of UBC – particularly in representing
the interests of SMEs. If the political idea is that employers are expected to become a
driver of UBC that is equal to universities, then special attention and support would have
to be provided to support special bodies that would include representatives of
universities, employers and associations.
The EMCOSU project is an excellent example of raising awareness of university-business
cooperation among employers
The EMCOSU partners believe the project is an example of a UBC success story. In two
and a half years, all of the partners have appreciated working together in a European
partnership: although the findings indicate that universities and enterprises are often
two separate worlds, the support the consortium received from the European
community has enabled the development of team building and strong mutual respect
among the members. University representatives have appreciated the excellent
responsiveness and on-time delivery of the deliverables and process execution of
partners from the world of work, while the employers’ representatives have appreciated
the research qualities of their partners. The consortium has learned to understand
intercultural and interorganisational diversity, and also the particular expertise of
individual members in terms of discipline-specific knowledge, methodological skills and
efficiency at meetings and the overall approach.
Future challenges
First, it would be very valuable to examine how mutual trust among employers and
academics is developed: this process contains many other elements that have been
investigated in the EMCOSU project such as national legislation, governance, barriers to
UBC cooperation, or outcomes. Second, much of the attention has recently been placed
on case studies of large multinational companies and very well-known universities, but
UBC cooperation with SMEs and NGOs is not so much promoted. It would be especially
valuable to establish common bodies and institutions that would facilitate

84
communication among both parties. This is particularly important because the emerging
practical orientation of higher education is increasingly leading to the hybridisation of
academic roles and the nature of academic certificates. In this respect, the consortium
has proposed framework for the development of new policy tools.
85
Sources
Abbott, A. D. (1988): The System of Professions: An Essay on the Division of Expert Labor.
Chicago, London, University of Chicago Press.
Allen, J., Pavlin, S. and Van der Velden, R. (eds.) (2011): Competencies and Early Labour
Market Careers of Higher Education Graduates in Europe. University of Ljubljana:
Faculty of Social Sciences.
Battaglia, M. P. (2008/2011): Nonprobability Sampling. Encyclopedia of Survey Research
Methods. Sage Publications.
Becher, T. (1989): Academic Tribes and Territories: Intellectual Enquiry and the Culture of
Disciplines. Buckingham, Open University Press.
Boisot, M. (2002): The Creation and Sharing of Knowledge. In Choo C. W., Bontis N. (eds):
The Strategic Management of Intellectual Capital and Organisational Knowledge.
Oxforfd–New York, Oxford University Press, 65–78.
Clark, B. R. (1998): Creating Entrepreneurial Universities: Organizational Pathways of
Transformation. Pergamon, IAU Press : Elsevier Science.
Collins, R. (1979): The Credential Society: An Historical Sociology of Education and
Stratification. New York: Academic Press.
Davey, T., Baaken, T., Deery, M. & Galan Muros, V. (eds) (2011a): 30 Good Practice Case
Studies in University-Business cooperation. Science to Business Research Centre &
European Commission, DG for Education and Culture. Münster. Accessed:
http://ec.europa.eu/education/higher-
education/doc/studies/munstercase_en.pdf (15.8.2013)
Davey, T., Baaken, T., Galan Muros V. & Meerman A. (2011b): The State of European
University- Business Cooperation. Final Report - Study on the cooperation between
Higher Education Institutions and public and private organisations in Europe.
Accessed:http://ec.europa.eu/education/higher-
education/doc/studies/munster_en.pdf (15.8.2013)
Denzin, N.K. (1978/1989): The Research Act. 3th edition. Englewood Cliffs: Prentice Hall.
Elton, L. (1986): Research and teaching: symbiosis or conflict Lewis, Higher Education,
Vol. 15, Issue 3-4, pp. 299-304.
Etzkowitz, H., & Leydesdorff, L. (2000): The Dynamics of Innovation: From National
Systems and ‘Mode 2’ to a Triple Helix of University-Industry-Government
Relations, Research Policy, 29, 2, pp. 109-123.
86
Etzkowitz, H. (2008): The Triple Helix: University-Industry-Government Innovation in
Action, Routledge.
Hackett, E. J. (2005): Essential Tensions: Identity, Control, and Risk in Research, Social
Studies of Science, 35(5), pp. 787–826.
HEGESCO (2013-): Project HEGESCO – Higher Education as a Generator of Strategic
Competences. Source: http://www.hegesco.org/. (15.8.2013)
Henkel, M. (2007): Shifting Boundaries and the Academic Profession. In Kogan M.,
Teichler, U. (eds): Key Challenges to the Academic Profession. Paris and Kassel.
UNESCO Forum on Higher Education. pp. 191–204.
Kolb, D. A. (1981): Learning styles and disciplinary differences. in A. W. Chickering (ed.)
The Modern American College, San Francisco: Jossey-Bass.
Lam, A. (2010): From 'Ivory Tower Traditionalists' to 'Entrepreneurial Scientists'?
Academic Scientists in Fuzzy University-Industry Boundaries, Social Studies of
Science, vol. 40 no. 2, pp. 307-340.
Lundvall, B.-Å. (2001): The Learning Economy: Some Implications for the Knowledge Base
of Health and Education Systems. In Knowledge Management in the Learning
Society. OECD, Paris.
Melink, M and S. Pavlin (2012): Employability of Graduates and Higher Education
Management Systems (Final report of DEHEMS project).
Mora-Valentin, E. V., Ortiz-de-Urbina-Criado, M., (2009): Improving the effectiveness of
academic-business models: an analysis of obstacles in R&D activities in service
industries, Service Business, December 2009, Volume 3, Issue 4, pp 395-413.
Musselin, C. (2009): The market of academics. New York, Routledge.
Neumann, R. (2009): Disciplinarity. In Tight, M., Mok, K.H., Huisman, J., and Morphew C.
(eds) The Routledge International Handbook of Higher Education. Routledge, pp.
487-501.
Nelson, R. (ed.) (1993): National innovation systems. A comparative analysis. New
York/Oxford: Oxford University Press.
Nonaka, I. & Hirotaka T. (1995): The Knowledge–Creating Company: How Japanese
Companies Create the Dynamics of Innovation. Oxford University Press.
OECD (2010): Higher Education in a World Changed Utterly - Doing More with Less, OECD
Paris, 13-15 September 2010, available at:
http://www.oecd.org/site/eduimhe10/ (accessed on 15 April 2013).

87
OECD & EC (2012): A Guiding Framework for Entrepreneurial Universities. Final version
18th December 2012. Source:http://www.oecd.org/site/cfecpr/ECOECD%20
Entrepreneurial%20Universities%20Framework.pdf (accessed 15.8.2013)
Onwuegbuzie, A. J., Houston, S. (2007): A Typology of Mixed Methods Sampling Designs
in Social Science Research. The Qualitative Report. Volume 12. Number 2. 281-
316.
Palmer, P. J., Zajonc, A. & Scribner. M. (2010): The Heart of Higher Education: A Call to
Renewal. John Wiley and Sons.
Pavlin S. (ed), Akkuyunlu, A., Kovačič, H. & Svetlik, I. (ed.) (2009): Report on the
Qualitative Analysis of Higher Education Institutions and Employers in Five
Countries: Development of Competencies in the World of Work and Education.
Hegesco Project. Ljubljana: University of Ljubljana. Access:
http://www.decowe.org/static/uploaded/htmlarea/finalreportshegesco/Qualita
tive_Analysis_of_HEIs_and_Employers_in_Five_Countries.pdf (30.8.2013)
Pavlin, S. & Svetlik, I. (2008): Razvoj profesionalnih kompetenc v slovenskem
visokošolskem prostoru : elementi in izhodišča. [Development of professional
Competencies in Slovenian Higher Education: Elements and Prigines]. Ljubljana:
Fakulteta za družbene vede.
Technopolis Organisation (2011): University Business Cooperation – 15 Institutional
Case Studies on the Links Between Higher Education Institutions and Business.
European Commission, DG for Education and Culture. Accessed:
http://ec.europa.eu/education/highereducation/doc/studies/technopolis_en.pdf
(15.8.2013)
Teichler, U. (2011): Universities between the Expectations to Generate Professionally
Relevant Competences and Academic Freedom: Experiences from Europe. In Cheng,
Yuzhui und Gu, Xue (Eds.) The Harmoy of Civilisatons and Prosperity for All.
Commitments and Responsibilities for a Better World. Select Papers of Beijing
Forum 2010. Beijing: Peking Universitiy Press, pp. 400- 414.
Tijssen, R., Leeuwen, van T., & Wijk, van E. (2009): Benchmarking university-industry
research cooperation worldwide: performance measurements and indicators
based on co-authorship data for the world's largest universities, Research
Evaluation, 18 (1), pp. 13-24.
Trencher G., Yarime M., McCormick K-B., Doll, C. & Kraines S. B. (2013): Beyond the third
mission: Exploring the emerging university function of co-creation for
sustainability, Science and Public Policy, (published online August 11).
Uprichard, E. (2011): Sampling: bridging probability and non-probability designs.
International Journal of Social Research Methodology, Vol. 16, No. 1, 1–11.
88
Wilson, T. (2012): A Review of Business–University Collaboration. Higher Education
Funding Council for England & University of Hertfordshire. Accessed:
https://www.gov.uk/government/uploads/system/uploads/attachment_data/fil
e/32383/12-610-wilson-review-business-university-collaboration.pdf
(15.8.2013)
Zgaga, P. (2009): Higher education and citizenship : "the full range of purposes",
European educational research journal, 8, 2. Didcot–Oxford, 175–188.
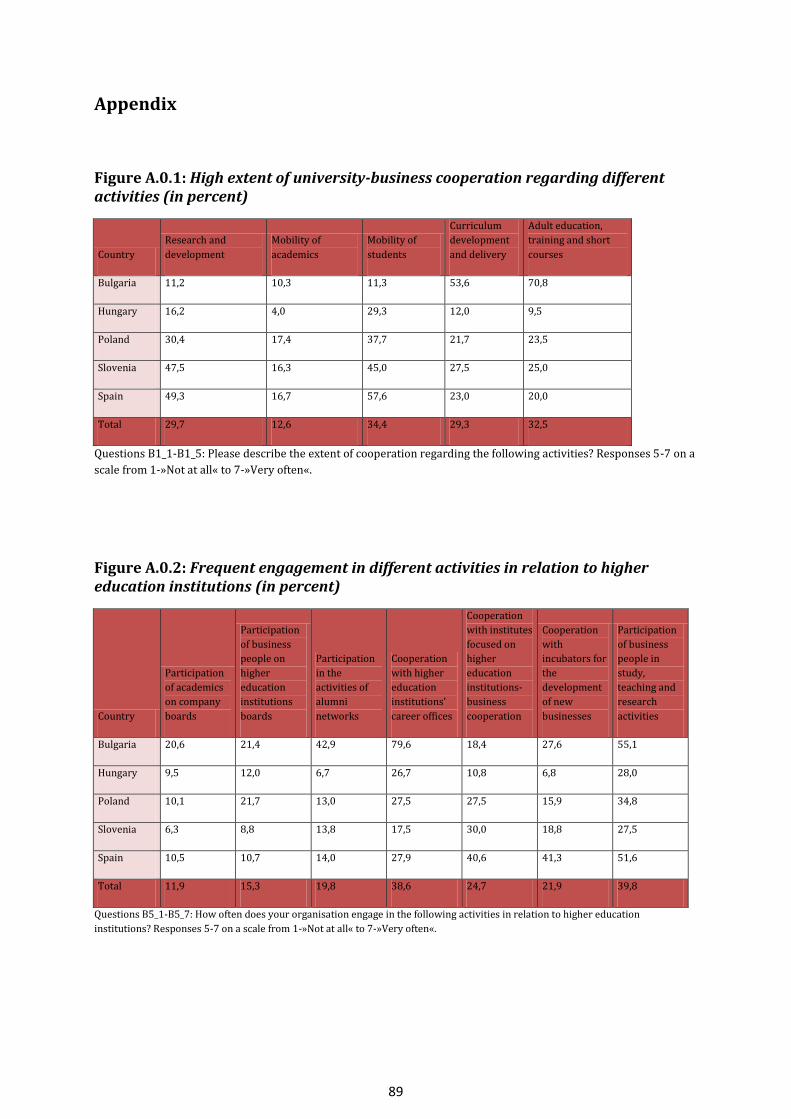
89
Appendix
Figure A.0.1: High extent of university-business cooperation regarding different activities (in percent)
Country
Research and
development
Mobility of
academics
Mobility of
students
Curriculum
development
and delivery
Adult education,
training and short
courses
Bulgaria 11,2 10,3 11,3 53,6 70,8
Hungary 16,2 4,0 29,3 12,0 9,5
Poland 30,4 17,4 37,7 21,7 23,5
Slovenia 47,5 16,3 45,0 27,5 25,0
Spain 49,3 16,7 57,6 23,0 20,0
Total 29,7 12,6 34,4 29,3 32,5
Questions B1_1-B1_5: Please describe the extent of cooperation regarding the following activities? Responses 5-7 on a
scale from 1-»Not at all« to 7-»Very often«.
Figure A.0.2: Frequent engagement in different activities in relation to higher education institutions (in percent)
Country
Participation
of academics
on company
boards
Participation
of business
people on
higher
education
institutions
boards
Participation
in the
activities of
alumni
networks
Cooperation
with higher
education
institutions’
career offices
Cooperation
with institutes
focused on
higher
education
institutions-
business
cooperation
Cooperation
with
incubators for
the
development
of new
businesses
Participation
of business
people in
study,
teaching and
research
activities
Bulgaria 20,6 21,4 42,9 79,6 18,4 27,6 55,1
Hungary 9,5 12,0 6,7 26,7 10,8 6,8 28,0
Poland 10,1 21,7 13,0 27,5 27,5 15,9 34,8
Slovenia 6,3 8,8 13,8 17,5 30,0 18,8 27,5
Spain 10,5 10,7 14,0 27,9 40,6 41,3 51,6
Total 11,9 15,3 19,8 38,6 24,7 21,9 39,8
Questions B5_1-B5_7: How often does your organisation engage in the following activities in relation to higher education
institutions? Responses 5-7 on a scale from 1-»Not at all« to 7-»Very often«.

90
Figure A.0.3: Factors facilitating cooperation with higher education institutions (in percent)
Country
Existence of
shared
motives
Financial
resources for
working with
higher
education
institutions
Flexibility of
higher
education
institutions
Interest of
higher
education
institutions in
accessing
practical
knowledge
Access to
higher
education
institutions'
research and
development
facilities
Close
geographical
distance of
higher
education
institutions
Existence of
mutual trust
and
commitment
Prior
relationship
with higher
education
institutions
Bulgaria 60,2 22,9 6,1 28,6 42,9 33,7 41,8 44,9
Hungary 50,0 35,1 44,6 53,3 36,5 30,7 52,7 52,7
Poland 56,5 39,1 43,3 50,7 36,2 53,6 67,6 58,0
Slovenia 56,3 38,8 42,5 52,5 40,0 40,0 63,8 52,5
Spain 61,0 48,2 50,0 61,0 46,8 57,4 71,0 56,7
Total 56,8 35,5 34,7 47,5 40,5 41,8 57,9 52,2
Questions B6_1-B6_8: How much do the following statements facilitate your organisation’s cooperation with higher education
institutions? Responses 5-7 on a scale from 1-»Not at all« to 7-»To a very high extent«.
Figure A.0.4: High relevance of different barriers to higher education institutions-business cooperation (in percent)
Country
Different
modes of
communication
and language
between
higher
education
institutions
and business
Different time
horizons
between
higher
education
institutions
and business
Different
motivations
and values
between
higher
education
institutions
and business
Difficulty in
finding the
appropriate
persons
within higher
education
institutions
Bureaucracy
within or
external to
the higher
education
institutions
Higher
education
institutions
want to
publish
confidential
results
Limited
ability of
knowledge
transfer
The current
financial
crisis
Bulgaria 57,1 57,1 39,6 74,0 60,2 68,4 61,2 32,7
Hungary 53,3 41,9 44,6 44,0 54,1 25,7 40,0 32,9
Poland 41,4 42,9 55,7 41,4 49,3 34,8 34,8 20,0
Slovenia 35,0 57,5 57,5 40,0 63,8 33,8 38,8 45,0
Spain 59,4 77,6 78,5 34,8 75,8 27,9 35,5 57,4
Total 49,4 55,3 53,8 48,6 60,5 40,3 43,5 37,1
Questions B7_1-B7_8: How relevant are the following barriers to higher education institutions-business cooperation? Responses 5-7
on a scale from 1-»Not at all« to 7-»To a very high extent«.
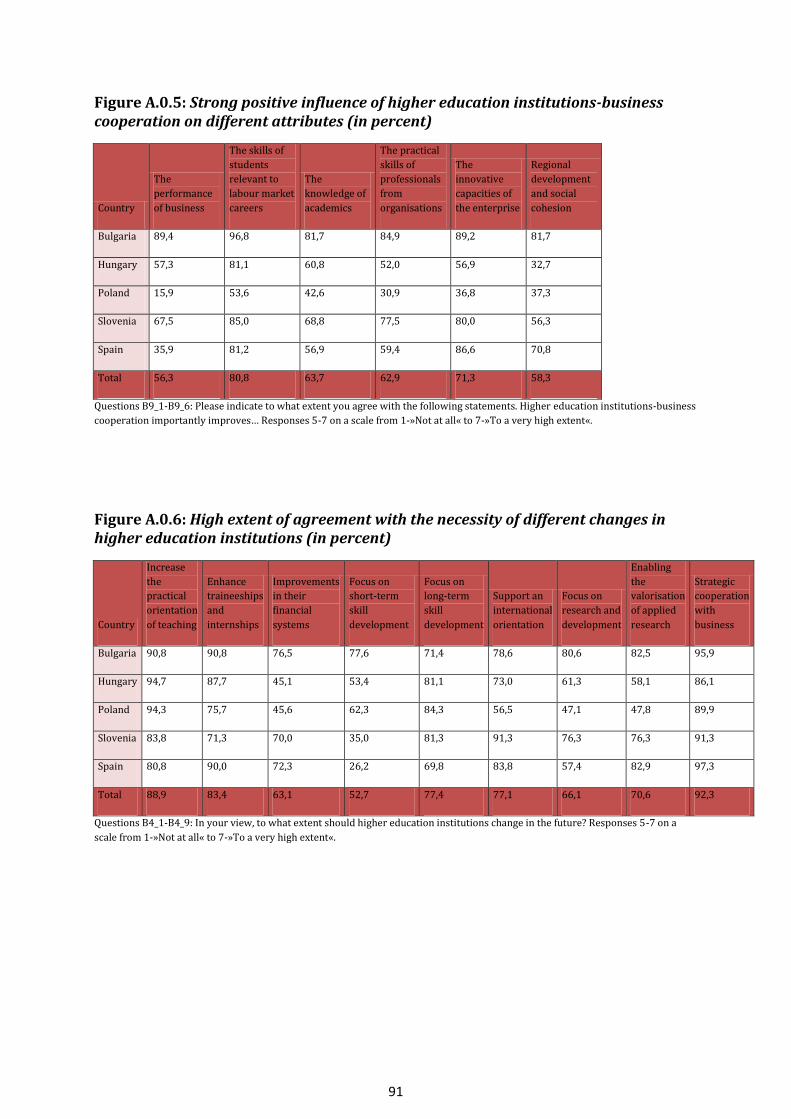
91
Figure A.0.5: Strong positive influence of higher education institutions-business cooperation on different attributes (in percent)
Country
The
performance
of business
The skills of
students
relevant to
labour market
careers
The
knowledge of
academics
The practical
skills of
professionals
from
organisations
The
innovative
capacities of
the enterprise
Regional
development
and social
cohesion
Bulgaria 89,4 96,8 81,7 84,9 89,2 81,7
Hungary 57,3 81,1 60,8 52,0 56,9 32,7
Poland 15,9 53,6 42,6 30,9 36,8 37,3
Slovenia 67,5 85,0 68,8 77,5 80,0 56,3
Spain 35,9 81,2 56,9 59,4 86,6 70,8
Total 56,3 80,8 63,7 62,9 71,3 58,3
Questions B9_1-B9_6: Please indicate to what extent you agree with the following statements. Higher education institutions-business
cooperation importantly improves… Responses 5-7 on a scale from 1-»Not at all« to 7-»To a very high extent«.
Figure A.0.6: High extent of agreement with the necessity of different changes in higher education institutions (in percent)
Country
Increase
the
practical
orientation
of teaching
Enhance
traineeships
and
internships
Improvements
in their
financial
systems
Focus on
short-term
skill
development
Focus on
long-term
skill
development
Support an
international
orientation
Focus on
research and
development
Enabling
the
valorisation
of applied
research
Strategic
cooperation
with
business
Bulgaria 90,8 90,8 76,5 77,6 71,4 78,6 80,6 82,5 95,9
Hungary 94,7 87,7 45,1 53,4 81,1 73,0 61,3 58,1 86,1
Poland 94,3 75,7 45,6 62,3 84,3 56,5 47,1 47,8 89,9
Slovenia 83,8 71,3 70,0 35,0 81,3 91,3 76,3 76,3 91,3
Spain 80,8 90,0 72,3 26,2 69,8 83,8 57,4 82,9 97,3
Total 88,9 83,4 63,1 52,7 77,4 77,1 66,1 70,6 92,3
Questions B4_1-B4_9: In your view, to what extent should higher education institutions change in the future? Responses 5-7 on a
scale from 1-»Not at all« to 7-»To a very high extent«.

92
Figure A.0.7: Most often used recruitment mechanisms for hiring higher education graduates in the last five years (in percent)
Country
Through an
advertisement
in a
newspaper
Through a
public
employment
agency
Through a
private
employment
agency
Through the
Internet
Through an
internship
placement
Through
private
contacts
Through the
help of a
higher
education
institution
Bulgaria 5,4 5,4 59,6 84,4 71,3 79,4 38,9
Hungary 31,1 21,1 21,9 67,1 42,7 45,2 36,5
Poland 20,0 8,7 10,1 58,0 41,8 34,8 29,0
Slovenia 25,0 28,8 28,8 56,3 68,8 60,0 27,5
Spain 6,0 5,8 13,7 47,5 66,1 42,1 41,3
Total 17,8 14,3 29,7 64,5 58,9 54,8 34,6
Questions A5_1-A5_7: How often does your organisation use the following recruitment mechanisms for hiring higher education
graduates in the last five years? Responses 5-7 on a scale from 1-»Not at all« to 7-»Very often«.
Figure A.0.8: High extent of new graduates’ possession of different skills (in percent)
Country
Mastery in
their field or
discipline
The ability to
acquire new
knowledge
The ability to
perform well
under
pressure
The ability to
use time
efficiently
The ability to
productively
work with
others
The ability to
come up with
new ideas and
solutions
The ability to
work in a
foreign
language
Bulgaria 37,1 73,5 36,7 22,7 24,5 54,1 54,1
Hungary 26,7 84,0 57,3 36,0 74,7 67,6 49,3
Poland 21,7 67,1 24,3 28,6 44,3 37,1 42,9
Slovenia 58,8 83,8 41,3 36,3 55,0 66,3 75,0
Spain 52,8 81,9 40,3 42,3 69,4 52,8 42,9
Total 39,7 78,0 40,0 32,6 51,9 55,8 53,4
Questions A6_1-A6_7: Below is a list of skills. Please provide information to what extent new graduates in your experience possess
these skills? Responses 5-7 on a scale from 1-»Not at all« to 7-»Very high«.

93
Figure A.0.9: High extent of university-business cooperation regarding different activities (in percent, by economic sectors)
Country Sector
Research and
development
Mobility of
academics
Mobility of
students
Curriculum
development
and delivery
Adult
education,
training and
short courses
Bulgaria Industry 10,5 5,6 5,6 66,7 83,3
Service 4,3 4,3 8,7 47,8 71,7
IT 21,2 21,2 18,2 54,5 62,5
Hungary Industry 18,2 6,7 33,3 13,3 9,1
Service 9,5 0,0 9,5 9,5 14,3
IT 22,2 0,0 55,6 11,1 0,0
Poland Industry 37,5 12,5 45,8 12,5 33,3
Service 36,7 23,3 30,0 16,7 13,8
IT 6,7 13,3 40,0 46,7 26,7
Slovenia Industry 54,2 12,5 47,9 22,9 27,1
Service 61,5 38,5 38,5 53,8 30,8
IT 21,1 10,5 42,1 21,1 15,8
Spain Industry 66,7 23,8 56,5 20,0 23,8
Service 30,8 13,0 60,0 29,2 21,7
IT 52,6 12,5 55,6 17,6 12,5
Total Industry 38,4 11,5 39,9 23,2 29,0
Service 22,8 12,8 25,9 32,1 37,1
IT 25,3 14,1 37,2 35,5 31,9
Questions B1_1-B1_5: Please describe the extent of cooperation regarding the following activities? Responses 5-7 on a scale from 1-
»Not at all« to 7-»Very often«.
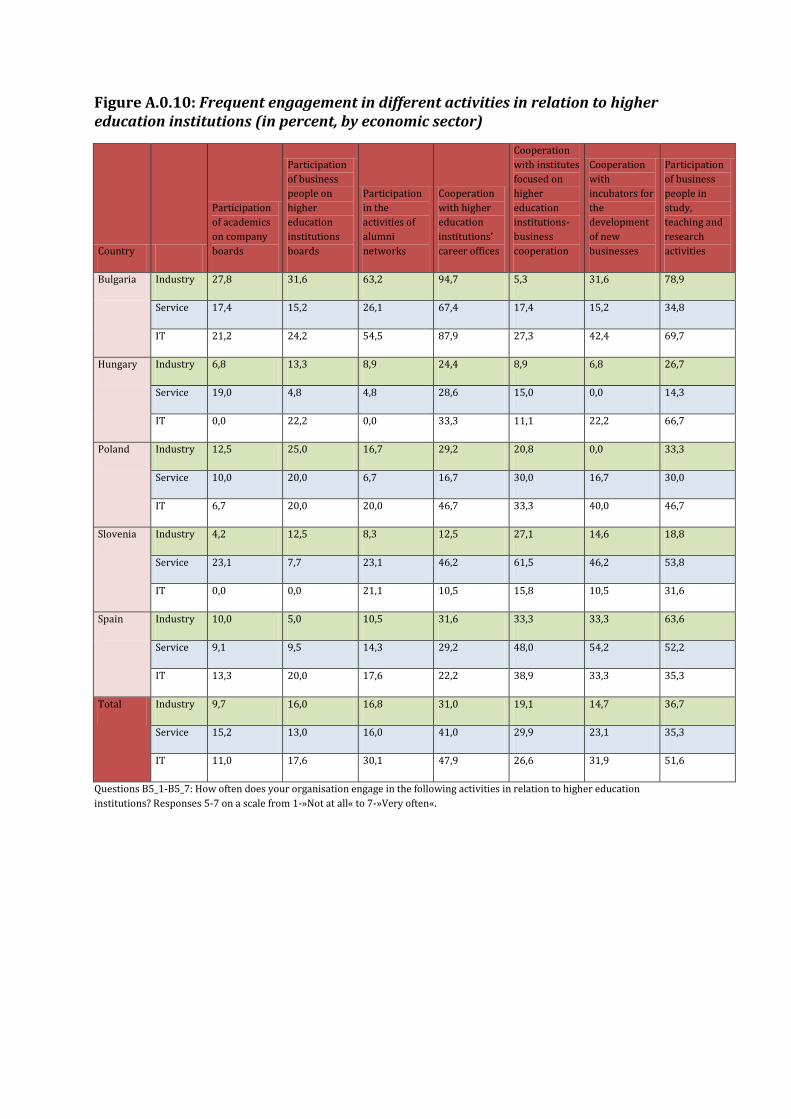
Figure A.0.10: Frequent engagement in different activities in relation to higher education institutions (in percent, by economic sector)
Country
Participation
of academics
on company
boards
Participation
of business
people on
higher
education
institutions
boards
Participation
in the
activities of
alumni
networks
Cooperation
with higher
education
institutions’
career offices
Cooperation
with institutes
focused on
higher
education
institutions-
business
cooperation
Cooperation
with
incubators for
the
development
of new
businesses
Participation
of business
people in
study,
teaching and
research
activities
Bulgaria Industry 27,8 31,6 63,2 94,7 5,3 31,6 78,9
Service 17,4 15,2 26,1 67,4 17,4 15,2 34,8
IT 21,2 24,2 54,5 87,9 27,3 42,4 69,7
Hungary Industry 6,8 13,3 8,9 24,4 8,9 6,8 26,7
Service 19,0 4,8 4,8 28,6 15,0 0,0 14,3
IT 0,0 22,2 0,0 33,3 11,1 22,2 66,7
Poland Industry 12,5 25,0 16,7 29,2 20,8 0,0 33,3
Service 10,0 20,0 6,7 16,7 30,0 16,7 30,0
IT 6,7 20,0 20,0 46,7 33,3 40,0 46,7
Slovenia Industry 4,2 12,5 8,3 12,5 27,1 14,6 18,8
Service 23,1 7,7 23,1 46,2 61,5 46,2 53,8
IT 0,0 0,0 21,1 10,5 15,8 10,5 31,6
Spain Industry 10,0 5,0 10,5 31,6 33,3 33,3 63,6
Service 9,1 9,5 14,3 29,2 48,0 54,2 52,2
IT 13,3 20,0 17,6 22,2 38,9 33,3 35,3
Total Industry 9,7 16,0 16,8 31,0 19,1 14,7 36,7
Service 15,2 13,0 16,0 41,0 29,9 23,1 35,3
IT 11,0 17,6 30,1 47,9 26,6 31,9 51,6
Questions B5_1-B5_7: How often does your organisation engage in the following activities in relation to higher education
institutions? Responses 5-7 on a scale from 1-»Not at all« to 7-»Very often«.

95
Figure A.0.11: Factors facilitating cooperation with higher education institutions (in percent, by economic sector)
Country
Existence
of shared
motives
Financial
resources
for working
with higher
education
institutions
Flexibility of
higher
education
institutions
Interest of
higher
education
institutions
in accessing
practical
knowledge
Access to
higher
education
institutions'
research and
development
facilities
Close
geographical
distance of
higher
education
institutions
Existence of
mutual trust
and
commitment
Prior
relationship
with higher
education
institutions
Bulgaria Industry 63,2 31,6 0,0 42,1 68,4 42,1 63,2 52,6
Service 58,7 6,7 2,2 19,6 32,6 28,3 32,6 39,1
IT 60,6 40,6 15,2 33,3 42,4 36,4 42,4 48,5
Hungary Industry 48,9 42,2 51,1 55,6 42,2 33,3 61,4 60,0
Service 45,0 20,0 25,0 42,9 20,0 28,6 33,3 30,0
IT 66,7 33,3 55,6 66,7 44,4 22,2 55,6 66,7
Poland Industry 50,0 37,5 30,4 41,7 45,8 66,7 62,5 66,7
Service 62,1 41,4 48,3 53,3 37,9 43,3 69,0 46,7
IT 56,3 37,5 53,3 60,0 18,8 53,3 73,3 66,7
Slovenia Industry 52,1 45,8 43,8 52,1 47,9 37,5 64,6 60,4
Service 61,5 30,8 38,5 61,5 53,8 46,2 61,5 69,2
IT 63,2 26,3 42,1 47,4 10,5 42,1 63,2 21,1
Spain Industry 63,2 50,0 35,3 38,9 57,1 55,0 70,0 57,9
Service 63,6 54,5 68,2 82,6 39,1 60,9 83,3 56,5
IT 55,6 37,5 41,2 55,6 44,4 55,6 55,6 55,6
Total Industry 53,5 42,2 37,5 48,7 49,7 43,6 63,9 60,0
Service 58,5 27,1 30,8 45,9 35,1 39,1 52,6 45,5
IT 60,0 35,9 35,5 47,9 32,6 42,6 55,3 48,9
Questions B6_1-B6_8: How much do the following statements facilitate your organisation’s cooperation with higher education
institutions? Responses 5-7 on a scale from 1-»Not at all« to 7-»To a very high extent«.
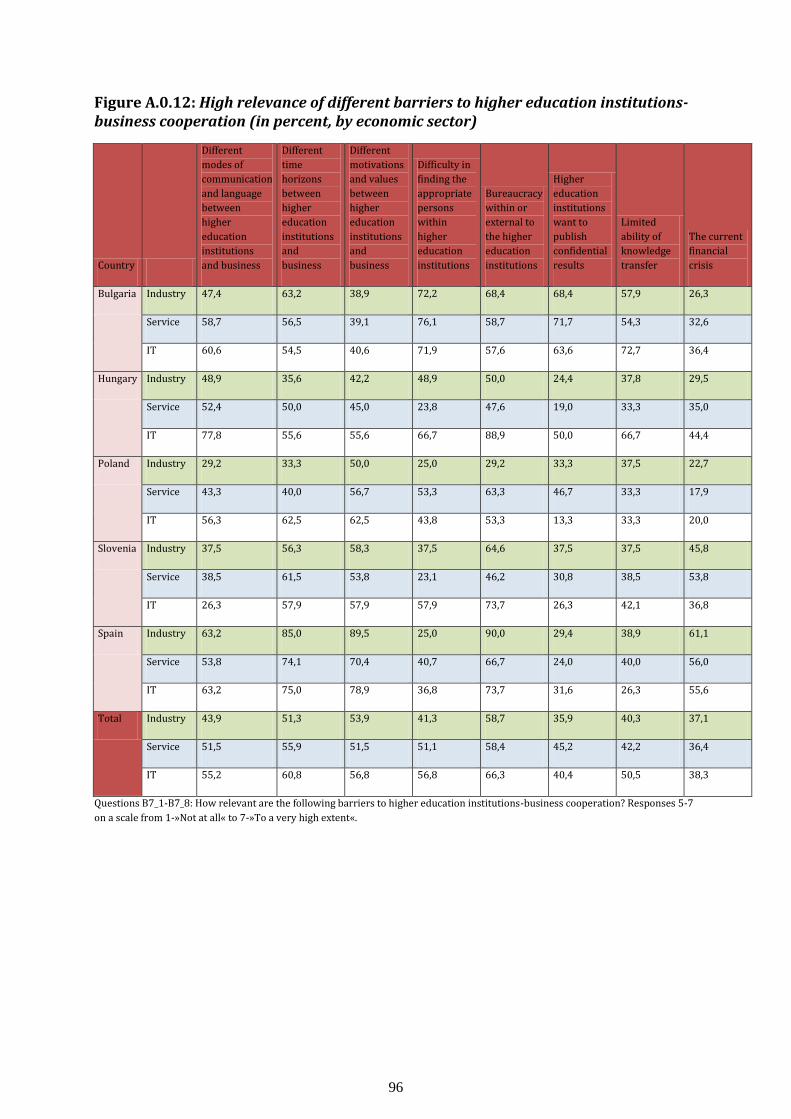
96
Figure A.0.12: High relevance of different barriers to higher education institutions-business cooperation (in percent, by economic sector)
Country
Different
modes of
communication
and language
between
higher
education
institutions
and business
Different
time
horizons
between
higher
education
institutions
and
business
Different
motivations
and values
between
higher
education
institutions
and
business
Difficulty in
finding the
appropriate
persons
within
higher
education
institutions
Bureaucracy
within or
external to
the higher
education
institutions
Higher
education
institutions
want to
publish
confidential
results
Limited
ability of
knowledge
transfer
The current
financial
crisis
Bulgaria Industry 47,4 63,2 38,9 72,2 68,4 68,4 57,9 26,3
Service 58,7 56,5 39,1 76,1 58,7 71,7 54,3 32,6
IT 60,6 54,5 40,6 71,9 57,6 63,6 72,7 36,4
Hungary Industry 48,9 35,6 42,2 48,9 50,0 24,4 37,8 29,5
Service 52,4 50,0 45,0 23,8 47,6 19,0 33,3 35,0
IT 77,8 55,6 55,6 66,7 88,9 50,0 66,7 44,4
Poland Industry 29,2 33,3 50,0 25,0 29,2 33,3 37,5 22,7
Service 43,3 40,0 56,7 53,3 63,3 46,7 33,3 17,9
IT 56,3 62,5 62,5 43,8 53,3 13,3 33,3 20,0
Slovenia Industry 37,5 56,3 58,3 37,5 64,6 37,5 37,5 45,8
Service 38,5 61,5 53,8 23,1 46,2 30,8 38,5 53,8
IT 26,3 57,9 57,9 57,9 73,7 26,3 42,1 36,8
Spain Industry 63,2 85,0 89,5 25,0 90,0 29,4 38,9 61,1
Service 53,8 74,1 70,4 40,7 66,7 24,0 40,0 56,0
IT 63,2 75,0 78,9 36,8 73,7 31,6 26,3 55,6
Total Industry 43,9 51,3 53,9 41,3 58,7 35,9 40,3 37,1
Service 51,5 55,9 51,5 51,1 58,4 45,2 42,2 36,4
IT 55,2 60,8 56,8 56,8 66,3 40,4 50,5 38,3
Questions B7_1-B7_8: How relevant are the following barriers to higher education institutions-business cooperation? Responses 5-7
on a scale from 1-»Not at all« to 7-»To a very high extent«.
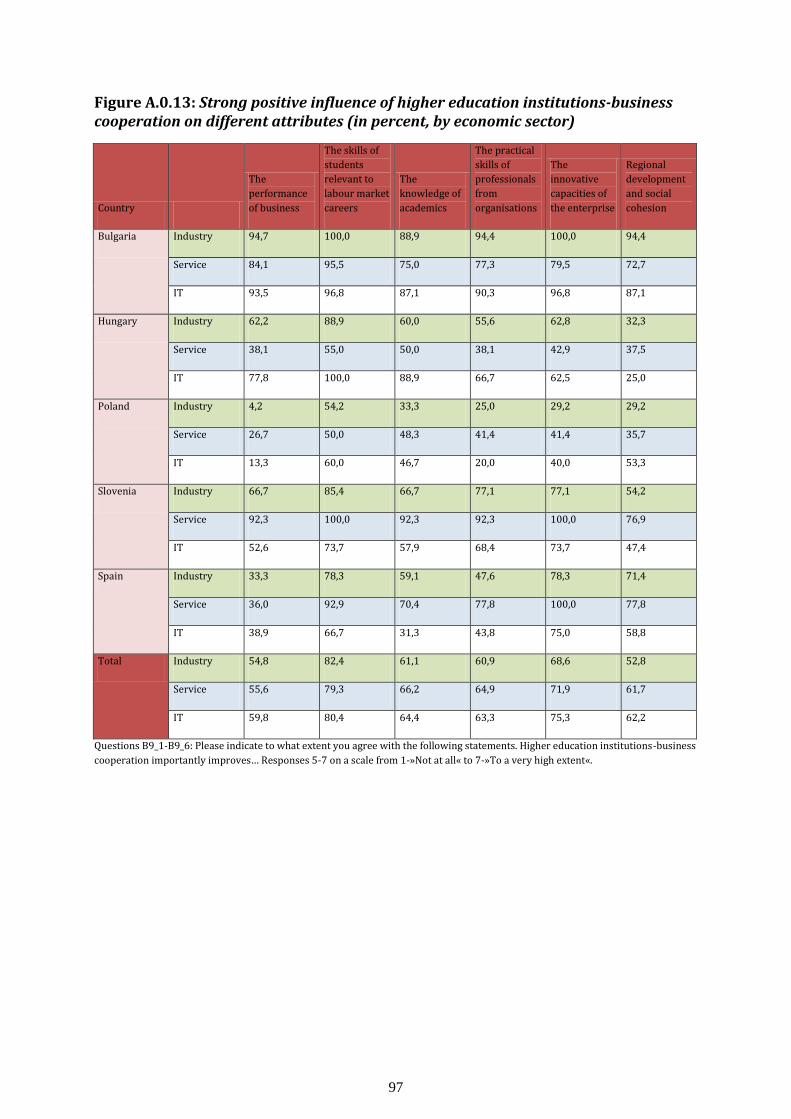
97
Figure A.0.13: Strong positive influence of higher education institutions-business cooperation on different attributes (in percent, by economic sector)
Country
The
performance
of business
The skills of
students
relevant to
labour market
careers
The
knowledge of
academics
The practical
skills of
professionals
from
organisations
The
innovative
capacities of
the enterprise
Regional
development
and social
cohesion
Bulgaria Industry 94,7 100,0 88,9 94,4 100,0 94,4
Service 84,1 95,5 75,0 77,3 79,5 72,7
IT 93,5 96,8 87,1 90,3 96,8 87,1
Hungary Industry 62,2 88,9 60,0 55,6 62,8 32,3
Service 38,1 55,0 50,0 38,1 42,9 37,5
IT 77,8 100,0 88,9 66,7 62,5 25,0
Poland Industry 4,2 54,2 33,3 25,0 29,2 29,2
Service 26,7 50,0 48,3 41,4 41,4 35,7
IT 13,3 60,0 46,7 20,0 40,0 53,3
Slovenia Industry 66,7 85,4 66,7 77,1 77,1 54,2
Service 92,3 100,0 92,3 92,3 100,0 76,9
IT 52,6 73,7 57,9 68,4 73,7 47,4
Spain Industry 33,3 78,3 59,1 47,6 78,3 71,4
Service 36,0 92,9 70,4 77,8 100,0 77,8
IT 38,9 66,7 31,3 43,8 75,0 58,8
Total Industry 54,8 82,4 61,1 60,9 68,6 52,8
Service 55,6 79,3 66,2 64,9 71,9 61,7
IT 59,8 80,4 64,4 63,3 75,3 62,2
Questions B9_1-B9_6: Please indicate to what extent you agree with the following statements. Higher education institutions-business
cooperation importantly improves… Responses 5-7 on a scale from 1-»Not at all« to 7-»To a very high extent«.

98
Figure A.0.14: High extent of agreement with the necessity of different changes in higher education institutions (in percent, by economic sector)
Country
Increase the
practical
orientation
of teaching
Enhance
traineeshi
ps and
internshi
ps
Improve
ments in
their
financial
systems
Focus on
short-
term skill
developm
ent
Focus on
long-term
skill
developm
ent
Support an
internationa
l orientation
Focus on
research
and
developm
ent
Enabling
the
valorisati
on of
applied
research
Strategic
cooperati
on with
business
Bulgaria Industry 94,7 100,0 73,7 68,4 73,7 78,9 89,5 73,7 94,7
Service 91,3 87,0 71,7 76,1 69,6 69,6 69,6 87,0 95,7
IT 87,9 90,9 84,8 84,8 72,7 90,9 90,9 81,3 97,0
Hungary Industry 91,1 86,7 35,7 46,7 82,2 77,8 66,7 64,4 90,7
Service 100,0 84,2 47,6 57,9 70,0 55,0 42,9 35,0 70,0
IT 100,0 100,0 87,5 77,8 100,0 88,9 77,8 77,8 100,0
Poland Industry 91,7 62,5 41,7 66,7 79,2 58,3 41,7 37,5 83,3
Service 93,3 86,7 58,6 56,7 90,0 55,2 55,2 55,2 93,1
IT 100,0 75,0 26,7 66,7 81,3 56,3 40,0 50,0 93,8
Slovenia Industry 79,2 68,8 58,3 37,5 75,0 89,6 72,9 70,8 91,7
Service 92,3 92,3 100,0 30,8 92,3 100,0 84,6 84,6 92,3
IT 89,5 63,2 78,9 31,6 89,5 89,5 78,9 84,2 89,5
Spain Industry 83,3 87,0 73,7 30,0 78,9 90,0 59,1 95,8 95,8
Service 86,2 92,9 70,4 19,2 76,9 89,3 53,6 75,0 96,6
IT 70,0 89,5 73,7 31,6 50,0 70,0 61,1 77,8 100,0
Total Industry 86,9 79,2 53,3 47,4 78,1 80,1 66,5 68,1 91,1
Service 92,1 88,2 67,6 53,7 77,8 71,3 60,6 69,9 91,2
IT 87,6 83,3 72,3 60,0 75,8 80,4 73,4 76,1 95,9
Questions B4_1-B4_9: In your view, to what extent should higher education institutions change in the future? Responses 5-7 on a
scale from 1-»Not at all« to 7-»To a very high extent«.
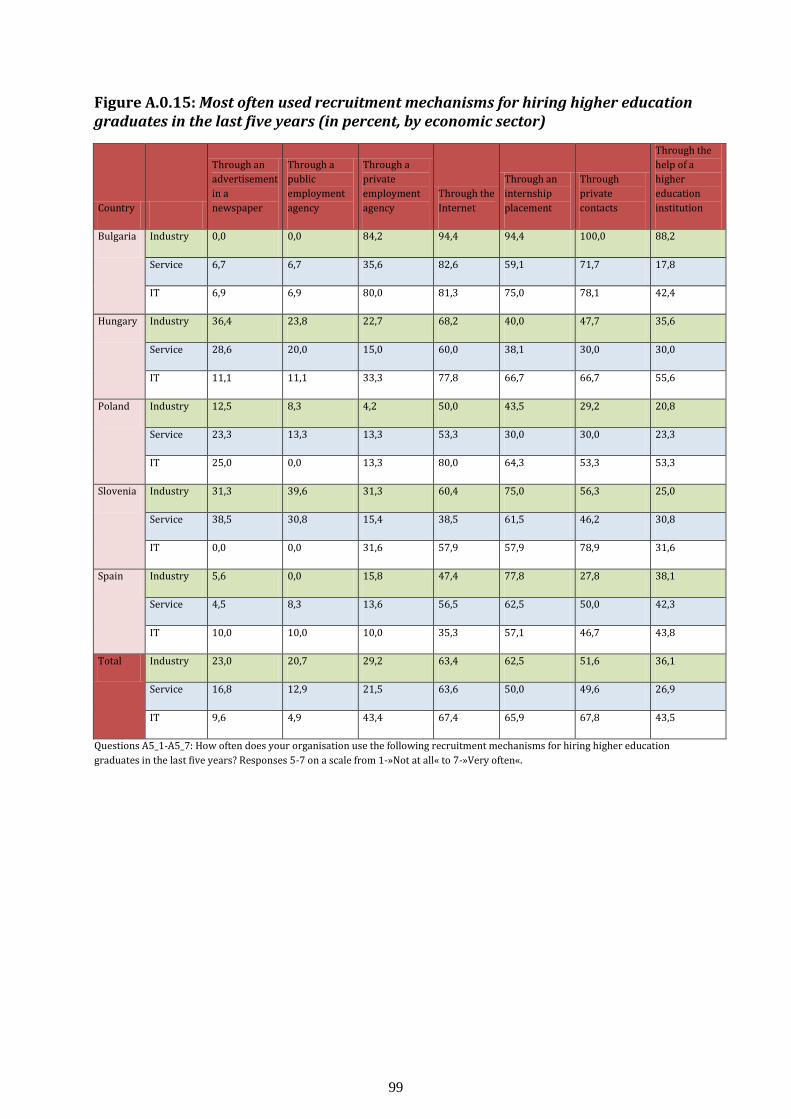
99
Figure A.0.15: Most often used recruitment mechanisms for hiring higher education graduates in the last five years (in percent, by economic sector)
Country
Through an
advertisement
in a
newspaper
Through a
public
employment
agency
Through a
private
employment
agency
Through the
Internet
Through an
internship
placement
Through
private
contacts
Through the
help of a
higher
education
institution
Bulgaria Industry 0,0 0,0 84,2 94,4 94,4 100,0 88,2
Service 6,7 6,7 35,6 82,6 59,1 71,7 17,8
IT 6,9 6,9 80,0 81,3 75,0 78,1 42,4
Hungary Industry 36,4 23,8 22,7 68,2 40,0 47,7 35,6
Service 28,6 20,0 15,0 60,0 38,1 30,0 30,0
IT 11,1 11,1 33,3 77,8 66,7 66,7 55,6
Poland Industry 12,5 8,3 4,2 50,0 43,5 29,2 20,8
Service 23,3 13,3 13,3 53,3 30,0 30,0 23,3
IT 25,0 0,0 13,3 80,0 64,3 53,3 53,3
Slovenia Industry 31,3 39,6 31,3 60,4 75,0 56,3 25,0
Service 38,5 30,8 15,4 38,5 61,5 46,2 30,8
IT 0,0 0,0 31,6 57,9 57,9 78,9 31,6
Spain Industry 5,6 0,0 15,8 47,4 77,8 27,8 38,1
Service 4,5 8,3 13,6 56,5 62,5 50,0 42,3
IT 10,0 10,0 10,0 35,3 57,1 46,7 43,8
Total Industry 23,0 20,7 29,2 63,4 62,5 51,6 36,1
Service 16,8 12,9 21,5 63,6 50,0 49,6 26,9
IT 9,6 4,9 43,4 67,4 65,9 67,8 43,5
Questions A5_1-A5_7: How often does your organisation use the following recruitment mechanisms for hiring higher education
graduates in the last five years? Responses 5-7 on a scale from 1-»Not at all« to 7-»Very often«.

100
Figure A.0.16: High extent of new graduates’ possession of different skills (in percent, by economic sector)
Country
Mastery in
their field
or
discipline
The ability to
acquire new
knowledge
The ability to
perform well
under
pressure
The ability
to use time
efficiently
The ability to
productively
work with
others
The ability to
come up with
new ideas and
solutions
The ability to
work in a
foreign
language
Bulgaria Industry 5,6 84,2 31,6 16,7 21,1 68,4 63,2
Service 56,5 71,7 39,1 28,3 30,4 54,3 47,8
IT 27,3 69,7 36,4 18,2 18,2 45,5 57,6
Hungary Industry 24,4 84,4 60,0 31,1 73,3 65,9 40,0
Service 23,8 76,2 47,6 38,1 71,4 57,1 61,9
IT 44,4 100,0 66,7 55,6 88,9 100,0 66,7
Poland Industry 13,0 75,0 16,7 33,3 54,2 25,0 37,5
Service 20,0 60,0 36,7 36,7 40,0 46,7 36,7
IT 37,5 68,8 12,5 6,3 37,5 37,5 62,5
Slovenia Industry 58,3 87,5 39,6 35,4 54,2 72,9 81,3
Service 61,5 76,9 61,5 46,2 61,5 61,5 69,2
IT 57,9 78,9 31,6 31,6 52,6 52,6 63,2
Spain Industry 60,9 78,3 47,8 43,5 60,9 39,1 34,8
Service 46,4 78,6 32,1 32,1 67,9 57,1 53,8
IT 52,4 90,5 42,9 55,0 81,0 61,9 38,1
Total Industry 36,3 83,0 42,1 32,9 56,6 58,2 54,1
Service 42,0 71,7 40,6 34,1 49,3 54,3 50,7
IT 41,8 78,6 35,7 29,9 48,0 54,1 56,1
Questions A6_1-A6_7: Below is a list of skills. Please provide information to what extent new graduates in your experience possess
these skills? Responses 5-7 on a scale from 1-»Not at all« to 7-»Very high«.
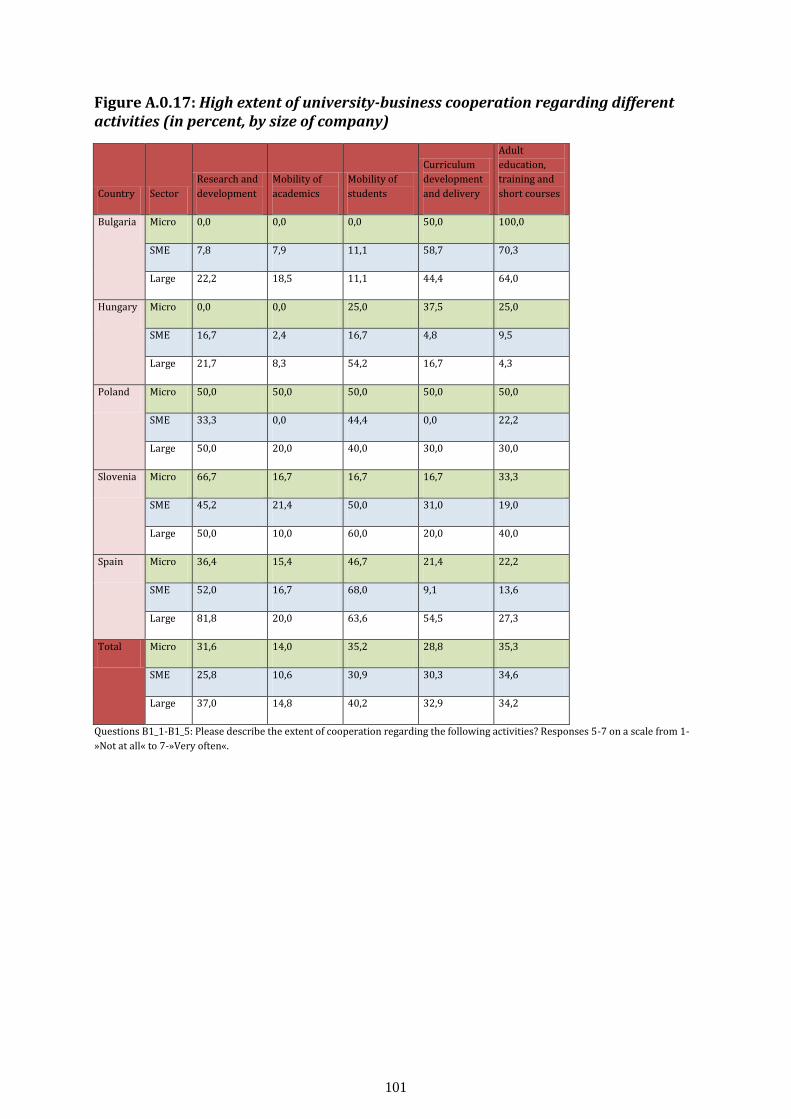
101
Figure A.0.17: High extent of university-business cooperation regarding different activities (in percent, by size of company)
Country Sector
Research and
development
Mobility of
academics
Mobility of
students
Curriculum
development
and delivery
Adult
education,
training and
short courses
Bulgaria Micro 0,0 0,0 0,0 50,0 100,0
SME 7,8 7,9 11,1 58,7 70,3
Large 22,2 18,5 11,1 44,4 64,0
Hungary Micro 0,0 0,0 25,0 37,5 25,0
SME 16,7 2,4 16,7 4,8 9,5
Large 21,7 8,3 54,2 16,7 4,3
Poland Micro 50,0 50,0 50,0 50,0 50,0
SME 33,3 0,0 44,4 0,0 22,2
Large 50,0 20,0 40,0 30,0 30,0
Slovenia Micro 66,7 16,7 16,7 16,7 33,3
SME 45,2 21,4 50,0 31,0 19,0
Large 50,0 10,0 60,0 20,0 40,0
Spain Micro 36,4 15,4 46,7 21,4 22,2
SME 52,0 16,7 68,0 9,1 13,6
Large 81,8 20,0 63,6 54,5 27,3
Total Micro 31,6 14,0 35,2 28,8 35,3
SME 25,8 10,6 30,9 30,3 34,6
Large 37,0 14,8 40,2 32,9 34,2
Questions B1_1-B1_5: Please describe the extent of cooperation regarding the following activities? Responses 5-7 on a scale from 1-
»Not at all« to 7-»Very often«.

102
Figure A.0.18: Frequent engagement in different activities in relation to higher education institutions (in percent, by size of company)
Country
Participation
of academics
on company
boards
Participation
of business
people on
higher
education
institutions
boards
Participation
in the
activities of
alumni
networks
Cooperation
with higher
education
institutions’
career offices
Cooperation
with institutes
focused on
higher
education
institutions-
business
cooperation
Cooperation
with
incubators for
the
development
of new
businesses
Participation
of business
people in
study,
teaching and
research
activities
Bulgaria Micro 0,0 0,0 16,7 100,0 33,3 50,0 66,7
SME 20,3 20,3 48,4 75,0 18,8 26,6 48,4
Large 23,1 25,9 33,3 85,2 14,8 25,9 66,7
Hungary Micro 37,5 37,5 12,5 25,0 25,0 12,5 75,0
SME 7,3 4,8 4,8 16,7 7,3 7,3 19,0
Large 4,2 16,7 4,2 41,7 12,5 4,2 29,2
Poland Micro 25,0 25,0 25,0 50,0 75,0 25,0 100,0
SME 11,1 11,1 11,1 22,2 33,3 11,1 33,3
Large 10,0 40,0 20,0 40,0 30,0 30,0 40,0
Slovenia Micro 33,3 16,7 16,7 0,0 16,7 16,7 16,7
SME 2,4 7,1 14,3 14,3 19,0 19,0 31,0
Large 0,0 10,0 0,0 10,0 40,0 10,0 30,0
Spain Micro 16,0 4,0 7,7 28,6 40,0 41,4 58,6
SME 4,8 4,8 19,0 22,7 39,1 45,8 39,1
Large 9,1 40,0 20,0 36,4 45,5 30,0 60,0
Total Micro 20,4 12,2 12,0 34,6 37,0 34,0 60,4
SME 10,7 11,2 24,7 38,0 19,6 22,2 35,6
Large 11,1 24,7 17,3 51,2 23,2 18,5 46,9
Questions B5_1-B5_7: How often does your organisation engage in the following activities in relation to higher education
institutions? Responses 5-7 on a scale from 1-»Not at all« to 7-»Very often«.
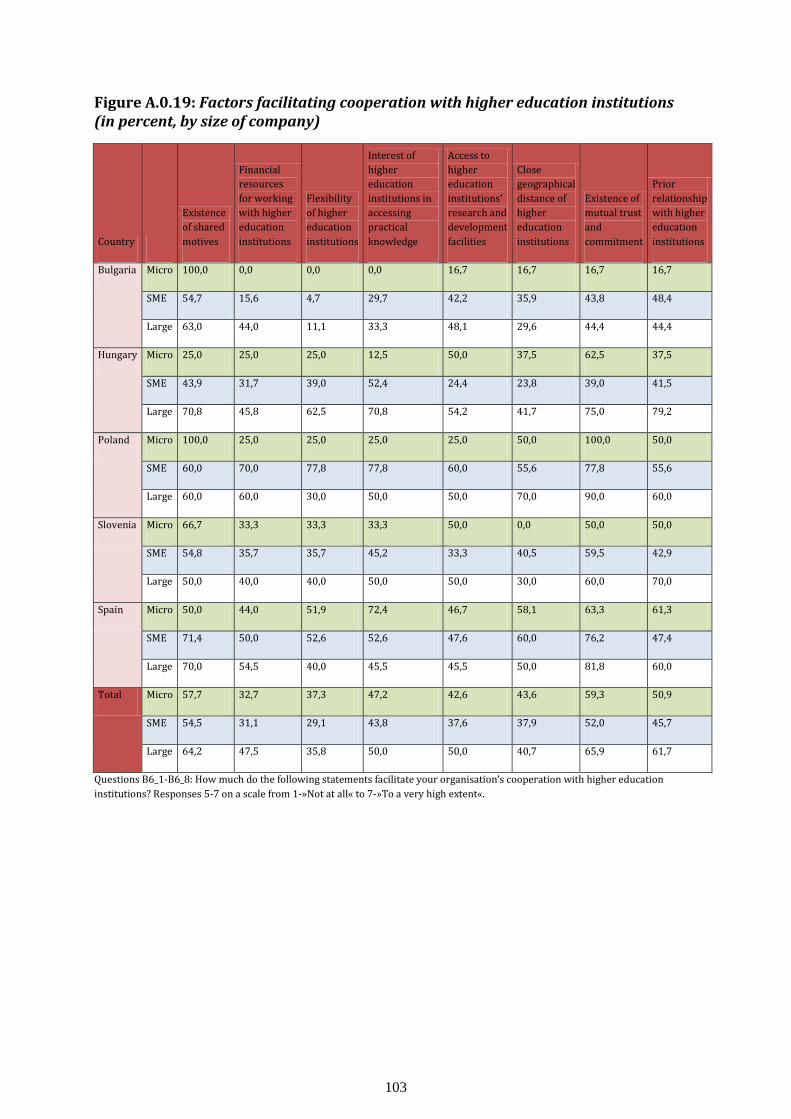
103
Figure A.0.19: Factors facilitating cooperation with higher education institutions (in percent, by size of company)
Country
Existence
of shared
motives
Financial
resources
for working
with higher
education
institutions
Flexibility
of higher
education
institutions
Interest of
higher
education
institutions in
accessing
practical
knowledge
Access to
higher
education
institutions'
research and
development
facilities
Close
geographical
distance of
higher
education
institutions
Existence of
mutual trust
and
commitment
Prior
relationship
with higher
education
institutions
Bulgaria Micro 100,0 0,0 0,0 0,0 16,7 16,7 16,7 16,7
SME 54,7 15,6 4,7 29,7 42,2 35,9 43,8 48,4
Large 63,0 44,0 11,1 33,3 48,1 29,6 44,4 44,4
Hungary Micro 25,0 25,0 25,0 12,5 50,0 37,5 62,5 37,5
SME 43,9 31,7 39,0 52,4 24,4 23,8 39,0 41,5
Large 70,8 45,8 62,5 70,8 54,2 41,7 75,0 79,2
Poland Micro 100,0 25,0 25,0 25,0 25,0 50,0 100,0 50,0
SME 60,0 70,0 77,8 77,8 60,0 55,6 77,8 55,6
Large 60,0 60,0 30,0 50,0 50,0 70,0 90,0 60,0
Slovenia Micro 66,7 33,3 33,3 33,3 50,0 0,0 50,0 50,0
SME 54,8 35,7 35,7 45,2 33,3 40,5 59,5 42,9
Large 50,0 40,0 40,0 50,0 50,0 30,0 60,0 70,0
Spain Micro 50,0 44,0 51,9 72,4 46,7 58,1 63,3 61,3
SME 71,4 50,0 52,6 52,6 47,6 60,0 76,2 47,4
Large 70,0 54,5 40,0 45,5 45,5 50,0 81,8 60,0
Total Micro 57,7 32,7 37,3 47,2 42,6 43,6 59,3 50,9
SME 54,5 31,1 29,1 43,8 37,6 37,9 52,0 45,7
Large 64,2 47,5 35,8 50,0 50,0 40,7 65,9 61,7
Questions B6_1-B6_8: How much do the following statements facilitate your organisation’s cooperation with higher education
institutions? Responses 5-7 on a scale from 1-»Not at all« to 7-»To a very high extent«.
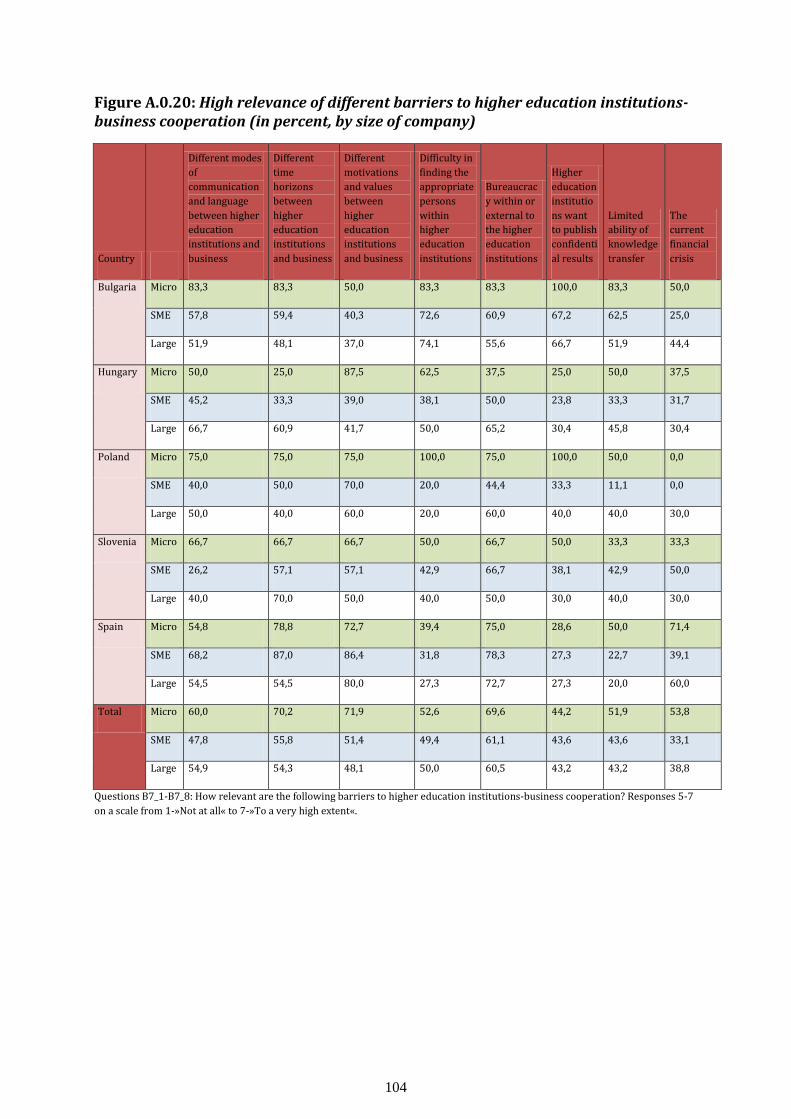
104
Figure A.0.20: High relevance of different barriers to higher education institutions-business cooperation (in percent, by size of company)
Country
Different modes
of
communication
and language
between higher
education
institutions and
business
Different
time
horizons
between
higher
education
institutions
and business
Different
motivations
and values
between
higher
education
institutions
and business
Difficulty in
finding the
appropriate
persons
within
higher
education
institutions
Bureaucrac
y within or
external to
the higher
education
institutions
Higher
education
institutio
ns want
to publish
confidenti
al results
Limited
ability of
knowledge
transfer
The
current
financial
crisis
Bulgaria Micro 83,3 83,3 50,0 83,3 83,3 100,0 83,3 50,0
SME 57,8 59,4 40,3 72,6 60,9 67,2 62,5 25,0
Large 51,9 48,1 37,0 74,1 55,6 66,7 51,9 44,4
Hungary Micro 50,0 25,0 87,5 62,5 37,5 25,0 50,0 37,5
SME 45,2 33,3 39,0 38,1 50,0 23,8 33,3 31,7
Large 66,7 60,9 41,7 50,0 65,2 30,4 45,8 30,4
Poland Micro 75,0 75,0 75,0 100,0 75,0 100,0 50,0 0,0
SME 40,0 50,0 70,0 20,0 44,4 33,3 11,1 0,0
Large 50,0 40,0 60,0 20,0 60,0 40,0 40,0 30,0
Slovenia Micro 66,7 66,7 66,7 50,0 66,7 50,0 33,3 33,3
SME 26,2 57,1 57,1 42,9 66,7 38,1 42,9 50,0
Large 40,0 70,0 50,0 40,0 50,0 30,0 40,0 30,0
Spain Micro 54,8 78,8 72,7 39,4 75,0 28,6 50,0 71,4
SME 68,2 87,0 86,4 31,8 78,3 27,3 22,7 39,1
Large 54,5 54,5 80,0 27,3 72,7 27,3 20,0 60,0
Total Micro 60,0 70,2 71,9 52,6 69,6 44,2 51,9 53,8
SME 47,8 55,8 51,4 49,4 61,1 43,6 43,6 33,1
Large 54,9 54,3 48,1 50,0 60,5 43,2 43,2 38,8
Questions B7_1-B7_8: How relevant are the following barriers to higher education institutions-business cooperation? Responses 5-7
on a scale from 1-»Not at all« to 7-»To a very high extent«.
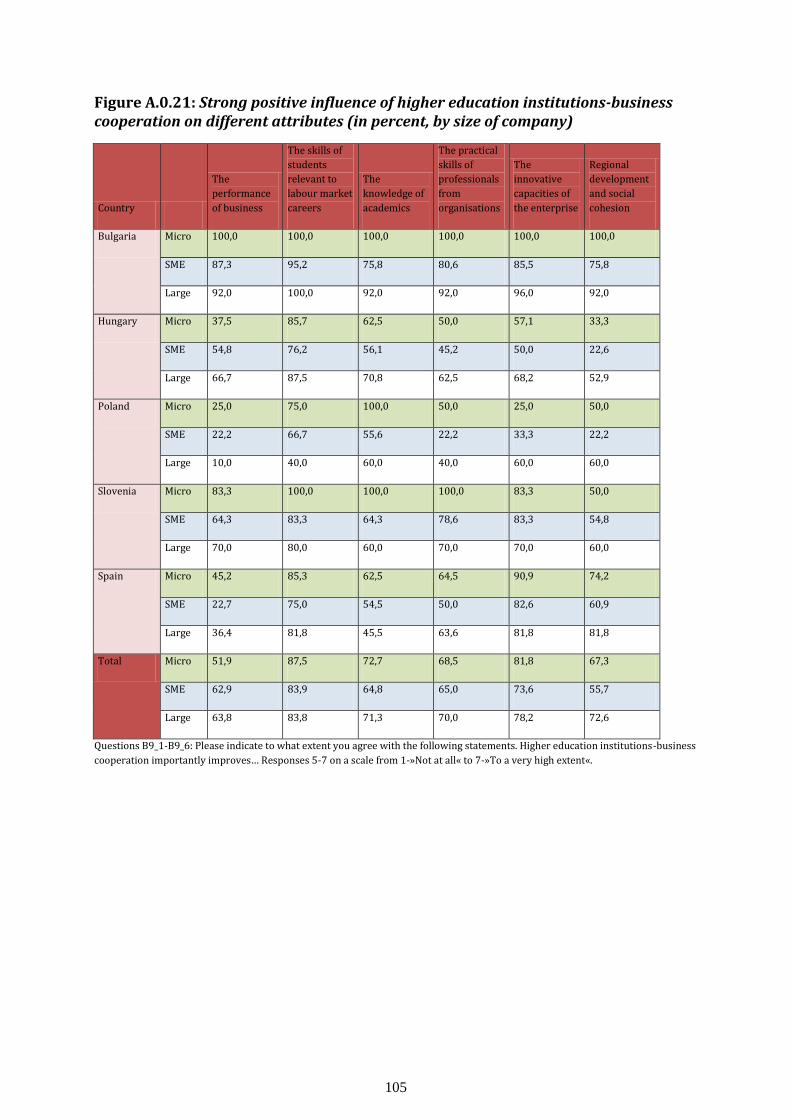
105
Figure A.0.21: Strong positive influence of higher education institutions-business cooperation on different attributes (in percent, by size of company)
Country
The
performance
of business
The skills of
students
relevant to
labour market
careers
The
knowledge of
academics
The practical
skills of
professionals
from
organisations
The
innovative
capacities of
the enterprise
Regional
development
and social
cohesion
Bulgaria Micro 100,0 100,0 100,0 100,0 100,0 100,0
SME 87,3 95,2 75,8 80,6 85,5 75,8
Large 92,0 100,0 92,0 92,0 96,0 92,0
Hungary Micro 37,5 85,7 62,5 50,0 57,1 33,3
SME 54,8 76,2 56,1 45,2 50,0 22,6
Large 66,7 87,5 70,8 62,5 68,2 52,9
Poland Micro 25,0 75,0 100,0 50,0 25,0 50,0
SME 22,2 66,7 55,6 22,2 33,3 22,2
Large 10,0 40,0 60,0 40,0 60,0 60,0
Slovenia Micro 83,3 100,0 100,0 100,0 83,3 50,0
SME 64,3 83,3 64,3 78,6 83,3 54,8
Large 70,0 80,0 60,0 70,0 70,0 60,0
Spain Micro 45,2 85,3 62,5 64,5 90,9 74,2
SME 22,7 75,0 54,5 50,0 82,6 60,9
Large 36,4 81,8 45,5 63,6 81,8 81,8
Total Micro 51,9 87,5 72,7 68,5 81,8 67,3
SME 62,9 83,9 64,8 65,0 73,6 55,7
Large 63,8 83,8 71,3 70,0 78,2 72,6
Questions B9_1-B9_6: Please indicate to what extent you agree with the following statements. Higher education institutions-business
cooperation importantly improves… Responses 5-7 on a scale from 1-»Not at all« to 7-»To a very high extent«.

106
Figure A.0.22: High extent of agreement with the necessity of different changes in higher education institutions (in percent, by size of company)
Country
Increase
the
practical
orientati
on of
teaching
Enhance
traineeships
and
internships
Improveme
nts in their
financial
systems
Focus on
short-term
skill
developme
nt
Focus on
long-term
skill
developme
nt
Support an
international
orientation
Focus on
research
and
developme
nt
Enabling
the
valorisati
on of
applied
research
Strategic
cooperati
on with
business
Bulgaria Micro 100,0 100,0 100,0 100,0 66,7 66,7 66,7 100,0 100,0
SME 95,3 95,3 76,6 79,7 67,2 81,3 84,4 84,4 96,9
Large 81,5 81,5 70,4 70,4 81,5 74,1 74,1 73,1 92,6
Hungary Micro 87,5 85,7 37,5 25,0 100,0 71,4 87,5 57,1 87,5
SME 95,2 88,1 48,8 50,0 71,4 69,0 61,9 57,1 80,5
Large 95,8 87,0 40,9 68,2 91,3 79,2 54,2 58,3 95,5
Poland Micro 100,0 100,0 100,0 75,0 100,0 100,0 100,0 100,0 100,0
SME 100,0 90,0 44,4 55,6 80,0 70,0 60,0 55,6 90,0
Large 100,0 50,0 40,0 80,0 90,0 50,0 70,0 70,0 100,0
Slovenia Micro 83,3 100,0 83,3 33,3 100,0 100,0 83,3 66,7 83,3
SME 88,1 69,0 69,0 40,5 81,0 95,2 83,3 78,6 90,5
Large 80,0 50,0 60,0 10,0 70,0 90,0 50,0 50,0 90,0
Spain Micro 83,3 91,2 74,2 23,3 73,3 84,4 53,1 76,5 97,2
SME 73,1 96,0 79,2 32,0 73,9 88,0 68,0 88,0 100,0
Large 90,9 72,7 50,0 20,0 50,0 72,7 45,5 90,9 90,9
Total Micro 86,7 93,0 74,5 37,0 81,5 83,6 66,1 77,2 95,0
SME 90,8 87,4 67,2 56,0 72,9 82,0 75,4 75,8 91,8
Large 89,0 74,1 54,4 57,0 80,0 74,4 61,0 67,9 93,8
Questions B4_1-B4_9: In your view, to what extent should higher education institutions change in the future? Responses 5-7 on a
scale from 1-»Not at all« to 7-»To a very high extent«.

107
Figure A.0.23: Most often used recruitment mechanisms for hiring higher education graduates in the last five years (in percent, by size of company)
Country
Through an
advertisement
in a
newspaper
Through a
public
employment
agency
Through a
private
employment
agency
Through
the Internet
Through an
internship
placement
Through
private
contacts
Through
the help of
a higher
education
institution
Bulgaria Micro 0,0 0,0 33,3 100,0 66,7 66,7 16,7
SME 3,4 1,7 60,7 85,5 63,3 76,6 37,7
Large 11,5 15,4 65,4 77,8 88,9 88,5 48,1
Hungary Micro 25,0 12,5 12,5 50,0 25,0 25,0 12,5
SME 33,3 20,0 19,5 55,0 33,3 45,0 26,8
Large 30,4 27,3 30,4 91,7 62,5 50,0 58,3
Poland Micro 50,0 0,0 0,0 75,0 50,0 50,0 50,0
SME 10,0 0,0 11,1 66,7 44,4 44,4 30,0
Large 10,0 10,0 20,0 90,0 60,0 20,0 50,0
Slovenia Micro 16,7 33,3 0,0 50,0 83,3 66,7 50,0
SME 21,4 23,8 31,0 66,7 71,4 69,0 28,6
Large 60,0 30,0 30,0 70,0 60,0 30,0 10,0
Spain Micro 0,0 4,8 15,0 33,3 60,9 40,0 44,4
SME 10,0 0,0 5,0 45,8 59,1 42,9 36,0
Large 9,1 18,2 27,3 81,8 90,9 45,5 45,5
Total Micro 11,6 8,9 13,6 50,0 57,4 44,9 37,3
SME 16,2 11,1 34,7 67,8 56,6 61,9 32,4
Large 22,5 20,3 40,0 82,9 74,4 55,6 46,3
Questions A5_1-A5_7: How often does your organisation use the following recruitment mechanisms for hiring higher education
graduates in the last five years? Responses 5-7 on a scale from 1-»Not at all« to 7-»Very often«.
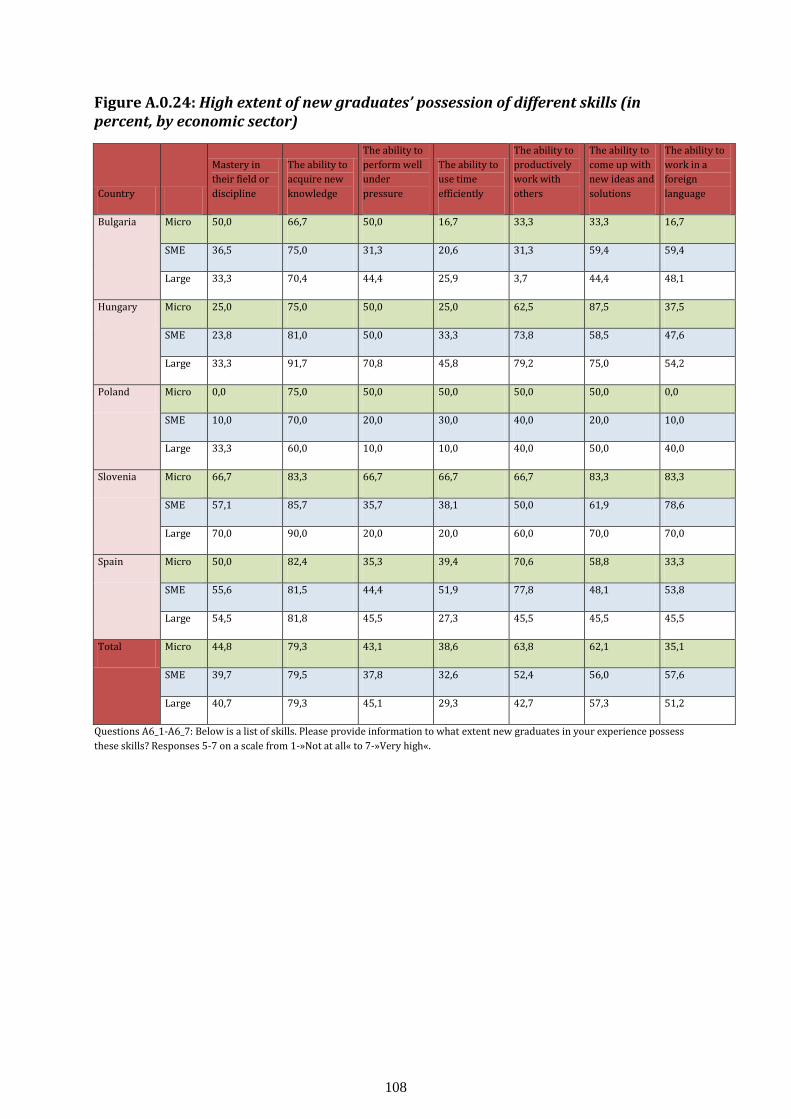
108
Figure A.0.24: High extent of new graduates’ possession of different skills (in percent, by economic sector)
Country
Mastery in
their field or
discipline
The ability to
acquire new
knowledge
The ability to
perform well
under
pressure
The ability to
use time
efficiently
The ability to
productively
work with
others
The ability to
come up with
new ideas and
solutions
The ability to
work in a
foreign
language
Bulgaria Micro 50,0 66,7 50,0 16,7 33,3 33,3 16,7
SME 36,5 75,0 31,3 20,6 31,3 59,4 59,4
Large 33,3 70,4 44,4 25,9 3,7 44,4 48,1
Hungary Micro 25,0 75,0 50,0 25,0 62,5 87,5 37,5
SME 23,8 81,0 50,0 33,3 73,8 58,5 47,6
Large 33,3 91,7 70,8 45,8 79,2 75,0 54,2
Poland Micro 0,0 75,0 50,0 50,0 50,0 50,0 0,0
SME 10,0 70,0 20,0 30,0 40,0 20,0 10,0
Large 33,3 60,0 10,0 10,0 40,0 50,0 40,0
Slovenia Micro 66,7 83,3 66,7 66,7 66,7 83,3 83,3
SME 57,1 85,7 35,7 38,1 50,0 61,9 78,6
Large 70,0 90,0 20,0 20,0 60,0 70,0 70,0
Spain Micro 50,0 82,4 35,3 39,4 70,6 58,8 33,3
SME 55,6 81,5 44,4 51,9 77,8 48,1 53,8
Large 54,5 81,8 45,5 27,3 45,5 45,5 45,5
Total Micro 44,8 79,3 43,1 38,6 63,8 62,1 35,1
SME 39,7 79,5 37,8 32,6 52,4 56,0 57,6
Large 40,7 79,3 45,1 29,3 42,7 57,3 51,2
Questions A6_1-A6_7: Below is a list of skills. Please provide information to what extent new graduates in your experience possess
these skills? Responses 5-7 on a scale from 1-»Not at all« to 7-»Very high«.
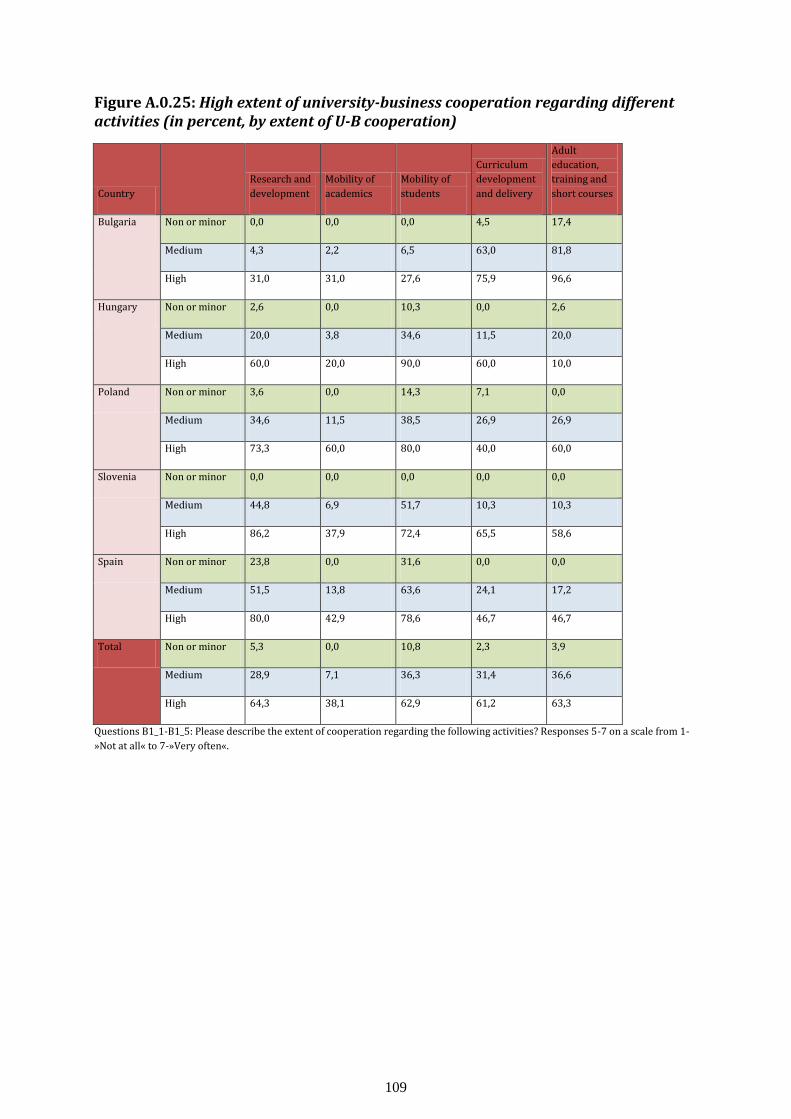
109
Figure A.0.25: High extent of university-business cooperation regarding different activities (in percent, by extent of U-B cooperation)
Country
Research and
development
Mobility of
academics
Mobility of
students
Curriculum
development
and delivery
Adult
education,
training and
short courses
Bulgaria Non or minor 0,0 0,0 0,0 4,5 17,4
Medium 4,3 2,2 6,5 63,0 81,8
High 31,0 31,0 27,6 75,9 96,6
Hungary Non or minor 2,6 0,0 10,3 0,0 2,6
Medium 20,0 3,8 34,6 11,5 20,0
High 60,0 20,0 90,0 60,0 10,0
Poland Non or minor 3,6 0,0 14,3 7,1 0,0
Medium 34,6 11,5 38,5 26,9 26,9
High 73,3 60,0 80,0 40,0 60,0
Slovenia Non or minor 0,0 0,0 0,0 0,0 0,0
Medium 44,8 6,9 51,7 10,3 10,3
High 86,2 37,9 72,4 65,5 58,6
Spain Non or minor 23,8 0,0 31,6 0,0 0,0
Medium 51,5 13,8 63,6 24,1 17,2
High 80,0 42,9 78,6 46,7 46,7
Total Non or minor 5,3 0,0 10,8 2,3 3,9
Medium 28,9 7,1 36,3 31,4 36,6
High 64,3 38,1 62,9 61,2 63,3
Questions B1_1-B1_5: Please describe the extent of cooperation regarding the following activities? Responses 5-7 on a scale from 1-
»Not at all« to 7-»Very often«.
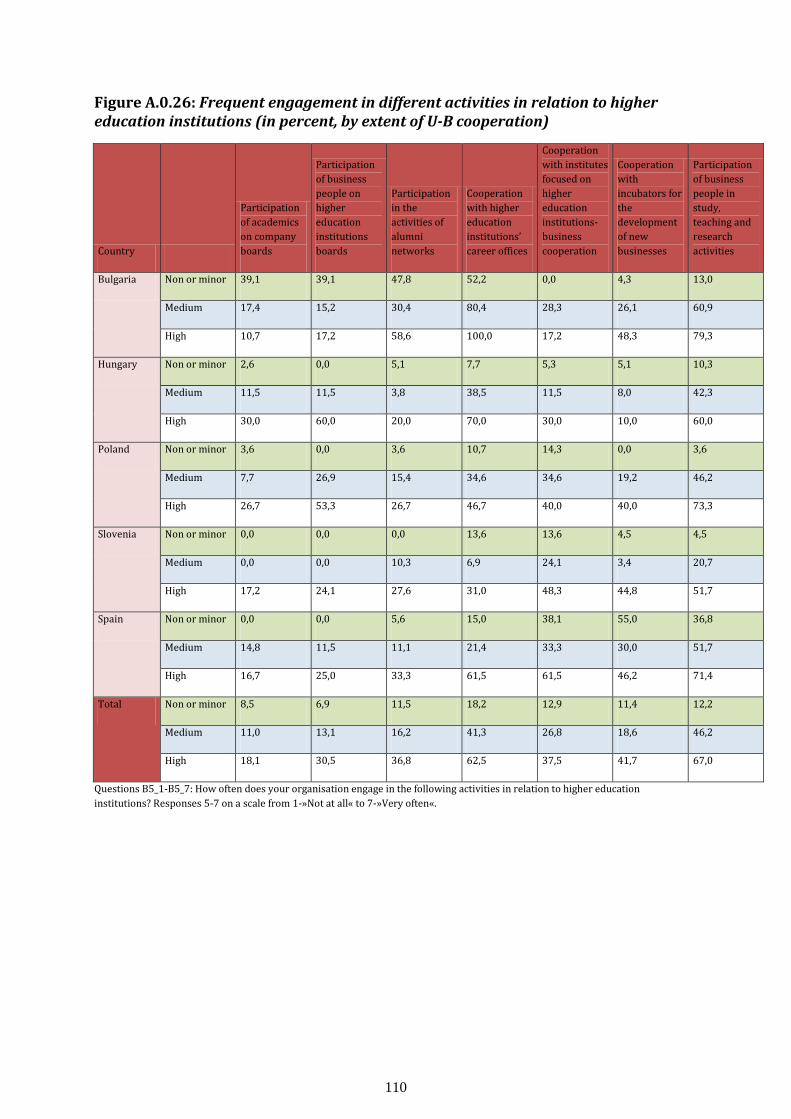
110
Figure A.0.26: Frequent engagement in different activities in relation to higher education institutions (in percent, by extent of U-B cooperation)
Country
Participation
of academics
on company
boards
Participation
of business
people on
higher
education
institutions
boards
Participation
in the
activities of
alumni
networks
Cooperation
with higher
education
institutions’
career offices
Cooperation
with institutes
focused on
higher
education
institutions-
business
cooperation
Cooperation
with
incubators for
the
development
of new
businesses
Participation
of business
people in
study,
teaching and
research
activities
Bulgaria Non or minor 39,1 39,1 47,8 52,2 0,0 4,3 13,0
Medium 17,4 15,2 30,4 80,4 28,3 26,1 60,9
High 10,7 17,2 58,6 100,0 17,2 48,3 79,3
Hungary Non or minor 2,6 0,0 5,1 7,7 5,3 5,1 10,3
Medium 11,5 11,5 3,8 38,5 11,5 8,0 42,3
High 30,0 60,0 20,0 70,0 30,0 10,0 60,0
Poland Non or minor 3,6 0,0 3,6 10,7 14,3 0,0 3,6
Medium 7,7 26,9 15,4 34,6 34,6 19,2 46,2
High 26,7 53,3 26,7 46,7 40,0 40,0 73,3
Slovenia Non or minor 0,0 0,0 0,0 13,6 13,6 4,5 4,5
Medium 0,0 0,0 10,3 6,9 24,1 3,4 20,7
High 17,2 24,1 27,6 31,0 48,3 44,8 51,7
Spain Non or minor 0,0 0,0 5,6 15,0 38,1 55,0 36,8
Medium 14,8 11,5 11,1 21,4 33,3 30,0 51,7
High 16,7 25,0 33,3 61,5 61,5 46,2 71,4
Total Non or minor 8,5 6,9 11,5 18,2 12,9 11,4 12,2
Medium 11,0 13,1 16,2 41,3 26,8 18,6 46,2
High 18,1 30,5 36,8 62,5 37,5 41,7 67,0
Questions B5_1-B5_7: How often does your organisation engage in the following activities in relation to higher education
institutions? Responses 5-7 on a scale from 1-»Not at all« to 7-»Very often«.
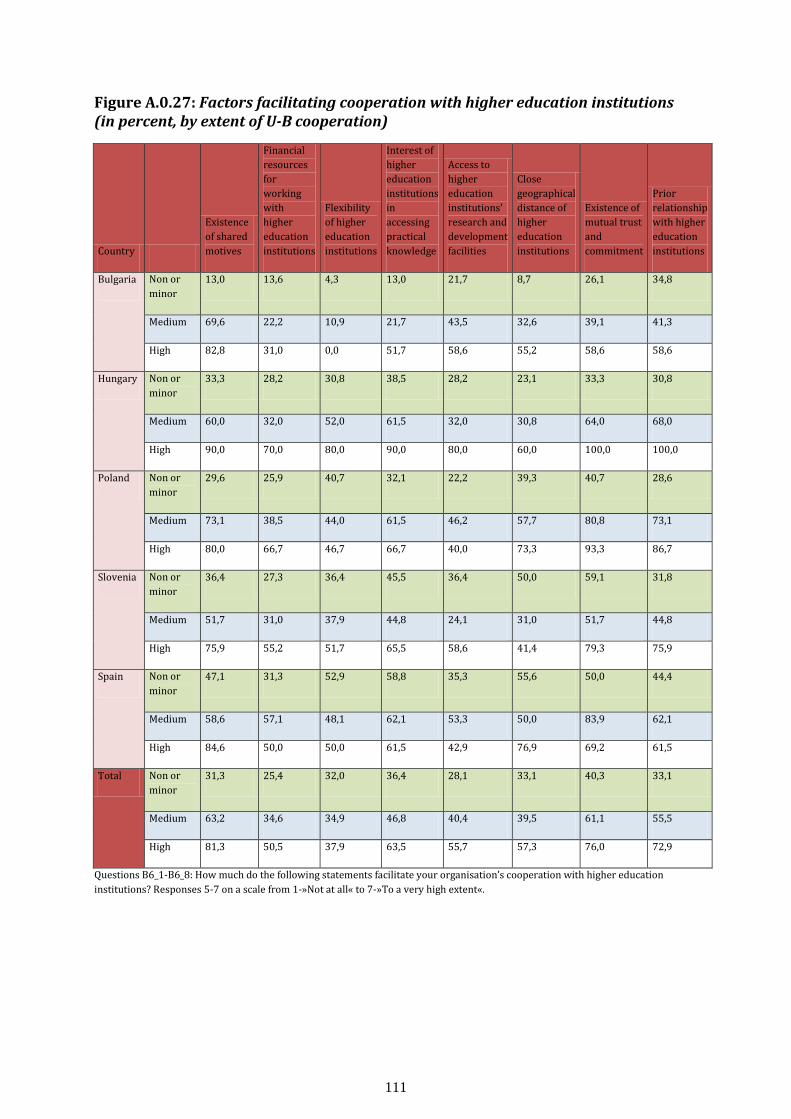
111
Figure A.0.27: Factors facilitating cooperation with higher education institutions (in percent, by extent of U-B cooperation)
Country
Existence
of shared
motives
Financial
resources
for
working
with
higher
education
institutions
Flexibility
of higher
education
institutions
Interest of
higher
education
institutions
in
accessing
practical
knowledge
Access to
higher
education
institutions'
research and
development
facilities
Close
geographical
distance of
higher
education
institutions
Existence of
mutual trust
and
commitment
Prior
relationship
with higher
education
institutions
Bulgaria Non or
minor
13,0 13,6 4,3 13,0 21,7 8,7 26,1 34,8
Medium 69,6 22,2 10,9 21,7 43,5 32,6 39,1 41,3
High 82,8 31,0 0,0 51,7 58,6 55,2 58,6 58,6
Hungary Non or
minor
33,3 28,2 30,8 38,5 28,2 23,1 33,3 30,8
Medium 60,0 32,0 52,0 61,5 32,0 30,8 64,0 68,0
High 90,0 70,0 80,0 90,0 80,0 60,0 100,0 100,0
Poland Non or
minor
29,6 25,9 40,7 32,1 22,2 39,3 40,7 28,6
Medium 73,1 38,5 44,0 61,5 46,2 57,7 80,8 73,1
High 80,0 66,7 46,7 66,7 40,0 73,3 93,3 86,7
Slovenia Non or
minor
36,4 27,3 36,4 45,5 36,4 50,0 59,1 31,8
Medium 51,7 31,0 37,9 44,8 24,1 31,0 51,7 44,8
High 75,9 55,2 51,7 65,5 58,6 41,4 79,3 75,9
Spain Non or
minor
47,1 31,3 52,9 58,8 35,3 55,6 50,0 44,4
Medium 58,6 57,1 48,1 62,1 53,3 50,0 83,9 62,1
High 84,6 50,0 50,0 61,5 42,9 76,9 69,2 61,5
Total Non or
minor
31,3 25,4 32,0 36,4 28,1 33,1 40,3 33,1
Medium 63,2 34,6 34,9 46,8 40,4 39,5 61,1 55,5
High 81,3 50,5 37,9 63,5 55,7 57,3 76,0 72,9
Questions B6_1-B6_8: How much do the following statements facilitate your organisation’s cooperation with higher education
institutions? Responses 5-7 on a scale from 1-»Not at all« to 7-»To a very high extent«.
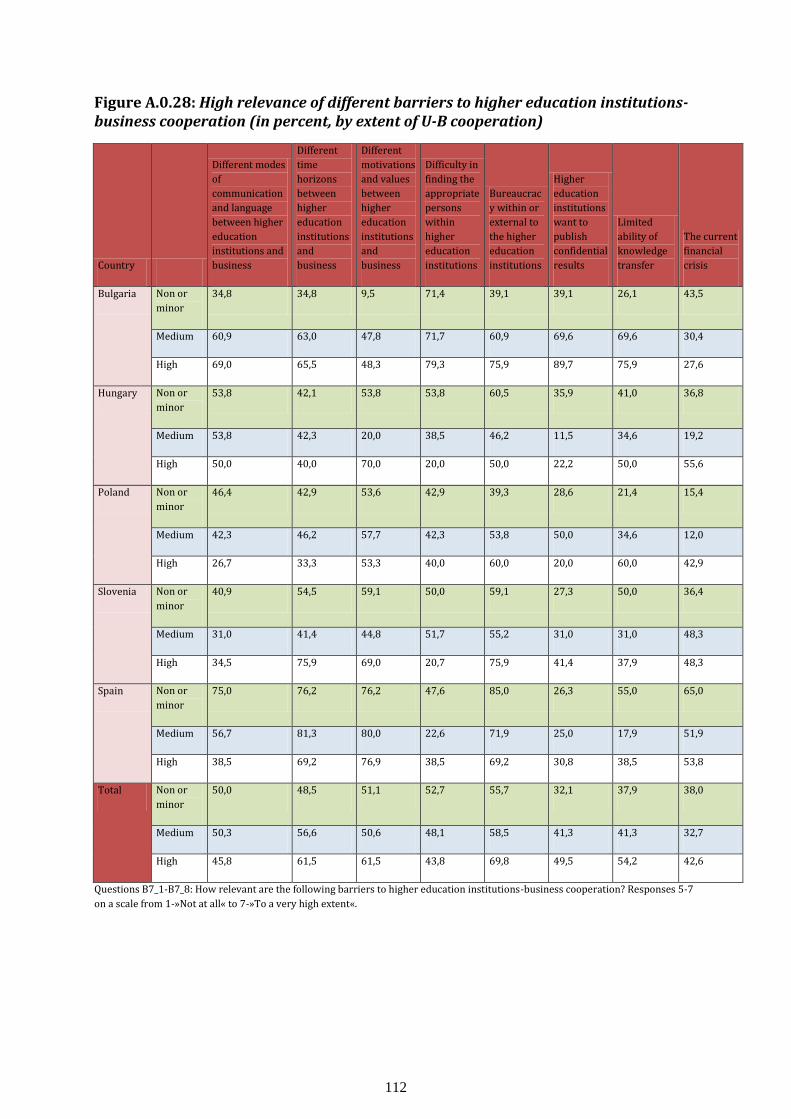
112
Figure A.0.28: High relevance of different barriers to higher education institutions-business cooperation (in percent, by extent of U-B cooperation)
Country
Different modes
of
communication
and language
between higher
education
institutions and
business
Different
time
horizons
between
higher
education
institutions
and
business
Different
motivations
and values
between
higher
education
institutions
and
business
Difficulty in
finding the
appropriate
persons
within
higher
education
institutions
Bureaucrac
y within or
external to
the higher
education
institutions
Higher
education
institutions
want to
publish
confidential
results
Limited
ability of
knowledge
transfer
The current
financial
crisis
Bulgaria Non or
minor
34,8 34,8 9,5 71,4 39,1 39,1 26,1 43,5
Medium 60,9 63,0 47,8 71,7 60,9 69,6 69,6 30,4
High 69,0 65,5 48,3 79,3 75,9 89,7 75,9 27,6
Hungary Non or
minor
53,8 42,1 53,8 53,8 60,5 35,9 41,0 36,8
Medium 53,8 42,3 20,0 38,5 46,2 11,5 34,6 19,2
High 50,0 40,0 70,0 20,0 50,0 22,2 50,0 55,6
Poland Non or
minor
46,4 42,9 53,6 42,9 39,3 28,6 21,4 15,4
Medium 42,3 46,2 57,7 42,3 53,8 50,0 34,6 12,0
High 26,7 33,3 53,3 40,0 60,0 20,0 60,0 42,9
Slovenia Non or
minor
40,9 54,5 59,1 50,0 59,1 27,3 50,0 36,4
Medium 31,0 41,4 44,8 51,7 55,2 31,0 31,0 48,3
High 34,5 75,9 69,0 20,7 75,9 41,4 37,9 48,3
Spain Non or
minor
75,0 76,2 76,2 47,6 85,0 26,3 55,0 65,0
Medium 56,7 81,3 80,0 22,6 71,9 25,0 17,9 51,9
High 38,5 69,2 76,9 38,5 69,2 30,8 38,5 53,8
Total Non or
minor
50,0 48,5 51,1 52,7 55,7 32,1 37,9 38,0
Medium 50,3 56,6 50,6 48,1 58,5 41,3 41,3 32,7
High 45,8 61,5 61,5 43,8 69,8 49,5 54,2 42,6
Questions B7_1-B7_8: How relevant are the following barriers to higher education institutions-business cooperation? Responses 5-7
on a scale from 1-»Not at all« to 7-»To a very high extent«.
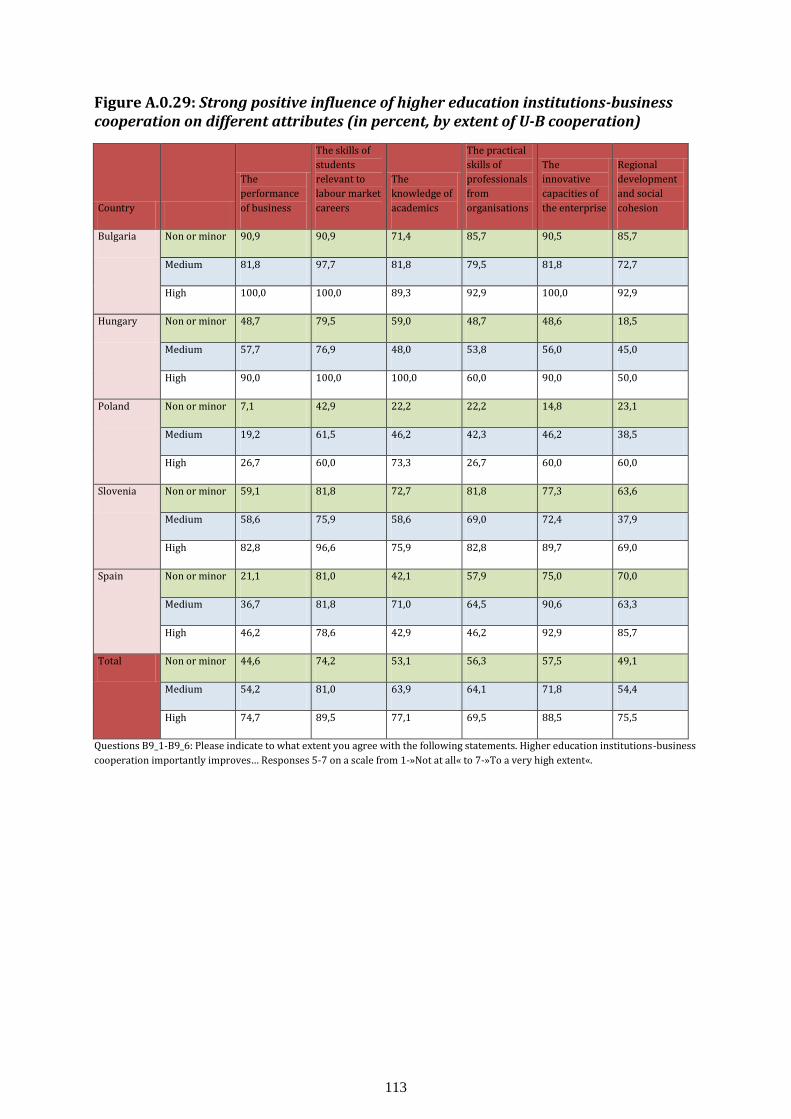
113
Figure A.0.29: Strong positive influence of higher education institutions-business cooperation on different attributes (in percent, by extent of U-B cooperation)
Country
The
performance
of business
The skills of
students
relevant to
labour market
careers
The
knowledge of
academics
The practical
skills of
professionals
from
organisations
The
innovative
capacities of
the enterprise
Regional
development
and social
cohesion
Bulgaria Non or minor 90,9 90,9 71,4 85,7 90,5 85,7
Medium 81,8 97,7 81,8 79,5 81,8 72,7
High 100,0 100,0 89,3 92,9 100,0 92,9
Hungary Non or minor 48,7 79,5 59,0 48,7 48,6 18,5
Medium 57,7 76,9 48,0 53,8 56,0 45,0
High 90,0 100,0 100,0 60,0 90,0 50,0
Poland Non or minor 7,1 42,9 22,2 22,2 14,8 23,1
Medium 19,2 61,5 46,2 42,3 46,2 38,5
High 26,7 60,0 73,3 26,7 60,0 60,0
Slovenia Non or minor 59,1 81,8 72,7 81,8 77,3 63,6
Medium 58,6 75,9 58,6 69,0 72,4 37,9
High 82,8 96,6 75,9 82,8 89,7 69,0
Spain Non or minor 21,1 81,0 42,1 57,9 75,0 70,0
Medium 36,7 81,8 71,0 64,5 90,6 63,3
High 46,2 78,6 42,9 46,2 92,9 85,7
Total Non or minor 44,6 74,2 53,1 56,3 57,5 49,1
Medium 54,2 81,0 63,9 64,1 71,8 54,4
High 74,7 89,5 77,1 69,5 88,5 75,5
Questions B9_1-B9_6: Please indicate to what extent you agree with the following statements. Higher education institutions-business
cooperation importantly improves… Responses 5-7 on a scale from 1-»Not at all« to 7-»To a very high extent«.
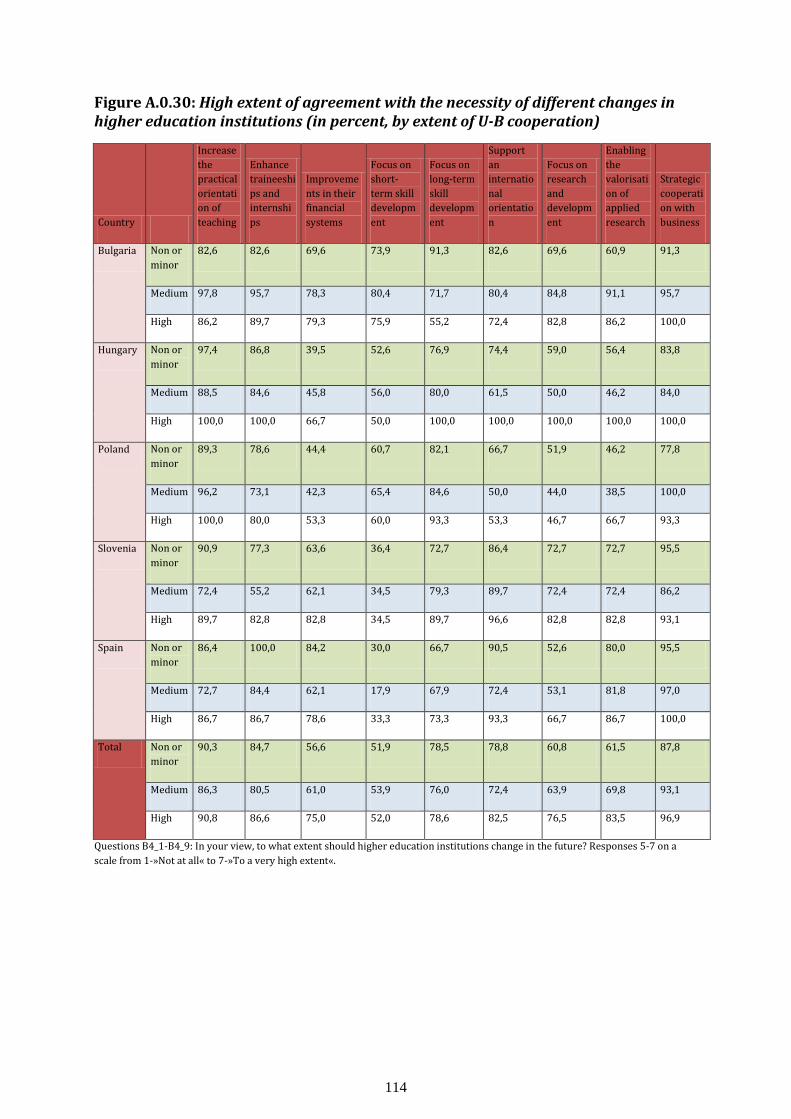
114
Figure A.0.30: High extent of agreement with the necessity of different changes in higher education institutions (in percent, by extent of U-B cooperation)
Country
Increase
the
practical
orientati
on of
teaching
Enhance
traineeshi
ps and
internshi
ps
Improveme
nts in their
financial
systems
Focus on
short-
term skill
developm
ent
Focus on
long-term
skill
developm
ent
Support
an
internatio
nal
orientatio
n
Focus on
research
and
developm
ent
Enabling
the
valorisati
on of
applied
research
Strategic
cooperati
on with
business
Bulgaria Non or
minor
82,6 82,6 69,6 73,9 91,3 82,6 69,6 60,9 91,3
Medium 97,8 95,7 78,3 80,4 71,7 80,4 84,8 91,1 95,7
High 86,2 89,7 79,3 75,9 55,2 72,4 82,8 86,2 100,0
Hungary Non or
minor
97,4 86,8 39,5 52,6 76,9 74,4 59,0 56,4 83,8
Medium 88,5 84,6 45,8 56,0 80,0 61,5 50,0 46,2 84,0
High 100,0 100,0 66,7 50,0 100,0 100,0 100,0 100,0 100,0
Poland Non or
minor
89,3 78,6 44,4 60,7 82,1 66,7 51,9 46,2 77,8
Medium 96,2 73,1 42,3 65,4 84,6 50,0 44,0 38,5 100,0
High 100,0 80,0 53,3 60,0 93,3 53,3 46,7 66,7 93,3
Slovenia Non or
minor
90,9 77,3 63,6 36,4 72,7 86,4 72,7 72,7 95,5
Medium 72,4 55,2 62,1 34,5 79,3 89,7 72,4 72,4 86,2
High 89,7 82,8 82,8 34,5 89,7 96,6 82,8 82,8 93,1
Spain Non or
minor
86,4 100,0 84,2 30,0 66,7 90,5 52,6 80,0 95,5
Medium 72,7 84,4 62,1 17,9 67,9 72,4 53,1 81,8 97,0
High 86,7 86,7 78,6 33,3 73,3 93,3 66,7 86,7 100,0
Total Non or
minor
90,3 84,7 56,6 51,9 78,5 78,8 60,8 61,5 87,8
Medium 86,3 80,5 61,0 53,9 76,0 72,4 63,9 69,8 93,1
High 90,8 86,6 75,0 52,0 78,6 82,5 76,5 83,5 96,9
Questions B4_1-B4_9: In your view, to what extent should higher education institutions change in the future? Responses 5-7 on a
scale from 1-»Not at all« to 7-»To a very high extent«.

115
Figure A.0.31: Most often used recruitment mechanisms for hiring higher education graduates in the last five years (in percent, by extent of U-B cooperation)
Country
Through an
advertisement
in a
newspaper
Through a
public
employment
agency
Through a
private
employment
agency
Through the
Internet
Through an
internship
placement
Through
private
contacts
Through the
help of a
higher
education
institution
Bulgaria Non or minor 21,1 15,8 23,8 72,7 35,0 72,7 15,0
Medium 2,2 0,0 64,4 84,8 80,0 82,6 43,5
High 0,0 7,1 78,6 92,9 82,8 79,3 48,3
Hungary Non or minor 33,3 35,1 21,1 55,3 20,5 52,6 10,5
Medium 28,0 4,0 16,0 76,9 61,5 42,3 53,8
High 30,0 11,1 40,0 88,9 80,0 22,2 90,0
Poland Non or minor 17,9 10,7 0,0 50,0 32,1 17,9 7,1
Medium 23,1 8,0 11,5 65,4 33,3 42,3 32,0
High 13,3 6,7 26,7 60,0 73,3 53,3 66,7
Slovenia Non or minor 22,7 18,2 22,7 45,5 54,5 59,1 9,1
Medium 20,7 27,6 37,9 69,0 69,0 62,1 20,7
High 31,0 37,9 24,1 51,7 79,3 58,6 48,3
Spain Non or minor 0,0 0,0 7,1 41,2 42,9 21,4 35,0
Medium 4,5 4,2 16,7 55,6 70,4 40,7 28,6
High 14,3 7,1 15,4 42,9 78,6 57,1 73,3
Total Non or minor 22,1 19,3 15,4 53,5 34,1 46,0 14,1
Medium 14,3 8,1 34,2 72,1 65,6 57,8 36,4
High 16,7 16,8 41,1 67,4 79,4 60,4 59,2
Questions A5_1-A5_7: How often does your organisation use the following recruitment mechanisms for hiring higher education
graduates in the last five years? Responses 5-7 on a scale from 1-»Not at all« to 7-»Very often«.

116
Figure A.0.32: High extent of new graduates’ possession of different skills (in percent, by extent of U-B cooperation)
Country
Mastery in
their field
or discipline
The ability to
acquire new
knowledge
The ability to
perform well
under
pressure
The ability
to use time
efficiently
The ability to
productively
work with
others
The ability to
come up with
new ideas and
solutions
The ability to
work in a
foreign
language
Bulgaria Non or minor 36,4 60,9 21,7 22,7 30,4 39,1 73,9
Medium 47,8 82,6 39,1 17,4 21,7 60,9 45,7
High 20,7 69,0 44,8 31,0 24,1 55,2 51,7
Hungary Non or minor 28,2 79,5 59,0 41,0 71,8 68,4 48,7
Medium 30,8 84,6 50,0 34,6 76,9 61,5 50,0
High 10,0 100,0 70,0 20,0 80,0 80,0 50,0
Poland Non or minor 28,6 71,4 28,6 35,7 57,1 39,3 46,4
Medium 15,4 53,8 15,4 23,1 30,8 34,6 34,6
High 21,4 80,0 33,3 26,7 46,7 40,0 53,3
Slovenia Non or minor 36,4 63,6 36,4 27,3 40,9 54,5 63,6
Medium 69,0 93,1 34,5 34,5 41,4 51,7 75,9
High 65,5 89,7 51,7 44,8 79,3 89,7 82,8
Spain Non or minor 45,5 72,7 40,9 57,1 72,7 54,5 50,0
Medium 59,4 84,4 34,4 34,4 56,3 43,8 35,5
High 53,3 100,0 60,0 46,7 93,3 73,3 50,0
Total Non or minor 33,8 70,9 39,6 37,1 56,7 52,6 55,2
Medium 45,9 80,5 35,2 27,7 42,8 51,6 48,1
High 38,1 84,7 50,0 35,7 60,2 68,4 60,8
Questions A6_1-A6_7: Below is a list of skills. Please provide information to what extent new graduates in your experience possess
these skills? Responses 5-7 on a scale from 1-»Not at all« to 7-»Very high«.