Embed Size (px)
Citation preview

0

1
EMES60 is a combined echosounder and speed log, providing both
speed and water depth from the same unit.
This manual gives the information necessary to install, use and
maintain the system.
Introduction
Issue 009.01 15-10-06 Copyright © Northern Solutions AS

1
Introduction ....................................................................................................... 1
Table of Contents ............................................................................................. 1
About this Manual ........................................................................................ 5
1.1 Glossary ................................................................................................ 5
1.2 Parts of the Manual ............................................................................ 7
2 Introduction to EMES60............................................................................. 8
2.1 Summary .............................................................................................. 8
2.2 Highlights .............................................................................................. 8
2.3 System Structure .................................................................................. 5
3 Operation ................................................................................................... 6
3.1 HMI Touch-Screen Controls ............................................................... 6
3.1.1 Structure of the screen .............................................................. 6
3.1.2 Summary data ............................................................................ 7
3.1.3 Changing display units .............................................................. 7
3.1.4 Control buttons ........................................................................... 8
3.1.5 Printing and screen snapshots ................................................. 8
3.1.6 Setting the time .......................................................................... 9
3.1.7 Alarms .......................................................................................... 9
3.1.8 Setting alarm limits ..................................................................... 9
3.1.9 Window navigation .................................................................. 10
3.1.10 Home screens ........................................................................... 11
3.1.11 Control buttons ......................................................................... 12
3.1.12 Brightness control ..................................................................... 13
3.1.13 Administrator mode ................................................................. 13
3.1.14 Hardware interface setup ...................................................... 14
3.1.15 Demo and Simulation modes................................................. 16
3.2 Echosounder ...................................................................................... 18
3.2.1 Saving files to USB key .............................................................. 18
3.2.2 Echosounder Home screen .................................................... 19
3.2.3 Echosounder main operational screen ................................ 20
3.2.4 Changing depth scale ............................................................ 21
3.2.5 Changing scroll speed ............................................................ 21
3.2.6 Setting the transceiver gain .................................................... 21
3.2.7 Setting the time-varying gain ................................................. 21
3.2.8 Setting the transmitter power ................................................. 21
3.2.9 Gain, TVG and Power slider .................................................... 22
Northern Solutions
Steinalderveien 2E
1407 Vinterbro
Norway
Org: 912 403 653
+47 90 16 72 84
Table of Contents
Org: 912 403 653
+47 90 16 72 84
2
3.2.10 Setting the draft offset ............................................................. 22
3.2.11 Echosounder digital indicator ................................................ 23
3.2.12 Echosounder communication screen .................................. 24
3.2.13 Saving communications data to file ..................................... 25
3.2.14 Communications port controls .............................................. 26
3.2.15 Echosounder alarm configuration screen ........................... 27
3.2.16 Echosounder hardware Interface screen ............................ 29
3.2.17 Echosounder history screen .................................................... 30
3.2.18 Echosounder oscilloscope screen ......................................... 31
3.2.19 Echosounder test and troubleshooting screen ................... 32
3.3 Speed log ........................................................................................... 33
3.3.1 Speed log Home screen ......................................................... 33
3.3.2 Speed log main operational screen ..................................... 34
3.3.3 Setting alarm speeds ............................................................... 35
3.3.4 Speed log single axis indicator .............................................. 35
3.3.5 Speed log communication screen ....................................... 36
3.3.6 Speed log alarm screen .......................................................... 37
3.3.7 Speed log hardware interface screen ................................. 38
3.3.8 Speed log history screen ......................................................... 39
3.3.9 Speed log oscilloscope screen .............................................. 40
3.3.10 Speed log test and troubleshooting screen ........................ 41
3.3.11 Speed log calibration screen ................................................. 42
4 Maintenance ........................................................................................... 43
4.1 Precautions ........................................................................................ 43
4.1.1 Operation in Air ........................................................................ 43
4.1.2 Sensor Head .............................................................................. 43
4.2 Tests and Checks .............................................................................. 43
4.2.1 Safety check ............................................................................. 43
4.2.2 Connector checks ................................................................... 43
4.2.3 Electronic Unit Checks ............................................................. 43
4.2.4 Inspect transducer for marine growth .................................. 44
4.2.5 Corrosion check ....................................................................... 44
4.2.6 Cleaning .................................................................................... 44
4.2.7 Functional checks .................................................................... 44
4.2.8 Routine Tests .............................................................................. 45
4.3 Troubleshooting ................................................................................. 47
5 Installation ................................................................................................ 49
5.1 Parts of the System ............................................................................ 49
5.1.1 HMI Units ..................................................................................... 49
5.1.2 Electronic Units and Cabling .................................................. 49
5.1.3 Sensor Head Assembly ............................................................ 50
5.1.4 Ball Valve Assembly ................................................................. 51
5.2 Mounting the Sensor on the Vessel ................................................ 52
5.3 Sensor Deployed and Inboard ....................................................... 53
5.3.1 Installing the sensor in the valve ............................................ 54
5.3.2 Cautions ..................................................................................... 54
5.3.3 Fitting the Bottom Flange to the hull ..................................... 54
3
5.3.4 Assembling the Sensor Head Assembly ................................ 55
5.3.5 Assembling the Ball Valve Assembly ..................................... 57
5.3.6 Fitting the Assembly to the Bottom Flange .......................... 58
5.3.7 Checks after assembly ............................................................ 59
5.3.8 When the vessel is afloat ......................................................... 59
5.3.9 Removing the sensor while the vessel is afloat .................... 60
5.3.10 Re-fitting the sensor while the vessel is afloat ...................... 60
5.3.11 Preparing for dry dock............................................................. 60
5.3.12 Cathodic protection................................................................ 61
5.4 Mounting Electrical Components .................................................. 62
5.4.1 Mounting the HMI units ............................................................ 62
5.4.2 Mounting Electronic Units ........................................................ 64
5.5 Electrical Installation ......................................................................... 65
5.5.1 Block Diagram .......................................................................... 65
5.5.2 Electronic Unit Layouts ............................................................ 66
5.5.3 Cable Diagram ......................................................................... 66
5.5.4 Cable Types .............................................................................. 67
5.5.5 Cable List ................................................................................... 67
5.5.6 Pluggable Terminal Block connectors .................................. 68
5.5.7 Connection Notes .................................................................... 68
5.5.8 Connecting to Electronic Unites ............................................ 69
5.5.9 Cable Wiring Schedules .......................................................... 70
5.5.10 Power ......................................................................................... 75
5.5.11 Signal Connections .................................................................. 76
5.6 Set-Up ................................................................................................. 76
5.6.1 Set Up the Hardware Interface .............................................. 76
5.7 Calibration ......................................................................................... 76
5.7.1 Calibrating the HMI touch-screen ......................................... 76
5.7.2 Water temperature calibration .............................................. 77
5.7.3 Speed log Calibration ............................................................. 77
6 Technical Details ..................................................................................... 82
6.1 Specifications .................................................................................... 82
6.2 Circuit board layouts ........................................................................ 84
6.2.1 Power Board Layout ................................................................ 84
6.2.2 Power Board LEDs ..................................................................... 85
6.2.3 Power Board Test Points .......................................................... 85
6.2.4 I/O Board Layout ...................................................................... 86
6.2.5 I/O Board LEDs .......................................................................... 87
6.2.6 I/O Board Test Points ................................................................ 88
6.3 Wiring Diagrams ................................................................................ 89
6.3.1 EMES Sensor Wiring ................................................................... 89
6.3.2 Speed Log Sensor Power Unit Wiring ..................................... 89
6.3.3 Echo Sounder Sensor Power Unit Wiring ............................... 90
6.3.4 Speed Log Interface Unit Wiring ............................................ 90
6.3.5 Echo Sounder Interface Unit Wiring ....................................... 91
6.4 System Drawings ............................................................................... 92
6.4.1 Bottom Flange .......................................................................... 92
4
6.5 Data Output and Input Formats ..................................................... 93
6.5.1 NMEA 0183/IEC61162-1 Messages ......................................... 93
6.5.2 Output Message Summary ..................................................... 93
6.5.3 Input Message Summary ......................................................... 94
6.5.4 DPT – Depth ............................................................................... 95
6.5.5 VBW – Dual ground/water speed .......................................... 95
6.5.6 VHW – Water Speed and heading ........................................ 95
6.5.7 VLW – Dual ground/water distance ...................................... 96
6.5.8 DPT - Depth................................................................................ 96
6.5.9 DBT – Depth below transducer .............................................. 96
6.5.10 DBS – Depth below surface .................................................... 96
6.5.11 DBK – Depth below keel .......................................................... 97
6.5.12 ALA – Report detailed alarm conditions .............................. 98
6.5.13 HBT – Heartbeat supervision sentence .................................. 98
6.5.14 MTW-Water temperature ........................................................ 99
6.5.15 ALR – Set alarm state ............................................................... 99
6.5.16 ACK – Acknowledge alarm .................................................... 99
6.5.17 AKD – Acknowledge detail alarm condition ..................... 100
6.5.18 HDT – Heading true ................................................................ 100
6.5.19 HDG – Deviation and variation ............................................ 100
6.5.20 THS – True heading and status.............................................. 101
6.5.21 ROT – Rate of turn ................................................................... 101
6.5.22 VTG – Course over ground and ground speed ................. 101
6.5.23 GLL – Geographic position latitude/longitude .................. 102
6.5.24 GGA – Global positioning system (GPS) fix data .............. 102
6.5.25 GXP – Transit determined position ....................................... 103
6.5.26 GLP – Loran-C determined position .................................... 103
6.5.27 RMC – Recommended minimum specific GNSS data ..... 103
6.5.28 RMA- Recommended minimum specific Loran-C data .. 105
6.5.29 DDC –Display dimming control ............................................ 106
6.5.30 ZDA – Time and date ............................................................. 106
7 Northern Solutions ................................................................................. 107
7.1 The Company .................................................................................. 107
7.2 Contacting Northern Solutions...................................................... 107
5
About this Manual
1.1 Glossary
Terms used in this manual include:
echo sounder A device that measures the depth of water
under a ship, by measuring the time between
sending a sound pulse and receiving its echo
from the seabed
electromagnetic
log
A type of speed log that uses electromagnetic
measurements to calculate the speed of a
vessel through water. Compare with acoustic
Doppler log, which calculates the speed
through the water or relative to the seabed by
detecting shifts in frequency of acoustic
echoes. EMES60 uses an electromagnetic log.
HMI Human-machine interface: screen units that
give readouts of speed and depth, and allow
the user to control and set up the system
IMO International Maritime Organization
Interface Unit EMES60 electronic unit that connects sensor,
Sensor Power Unit and ship’s power
longitudinal
speed
Speed in the aft-fore direction of the vessel
opto Short for “opto-isolated”
opto-isolated An electrical input that is separated electrically
from the inputting device using an optical
converter circuit
Sensor Power
Unit
EMES60 electronic unit that connects HMI units,
external equipment and Interface Unit
speed log A device that measures the speed of a ship
relative to the water around it and the seabed
under it
transducer A device that converts electrical signals to
sound and back again

6
transverse
speed
Speed in the port-starboard direction of the
vessel
7
1.2 Parts of the Manual
Section 1, About this Manual, introduces this manual.
Section 2, Introduction to EMES60, provides an overview of
the system.
Section 3, Operation, describes the day-to-day operation of
the system, including how to use the information and
control screens.
Section 4, Maintenance, describes the maintenance
procedures that are necessary to keep the system in full
working order, including the regular tests that should be
done.
Section 5, Installation, gives instructions on installing the
system, including fitting the sensor unit in the hull, manual
installation of the other components, running cables
between them, and setting up the system through its control
screens.
Section 6, Technical Details, provides technical details of the
system, including tables of specifications, drawings, output
formats, etc.
Section 7, Northern Solutions, gives more information about
the company, with details of how to contact for more
information.

8
2 Introduction to EMES60
2.1 Summary
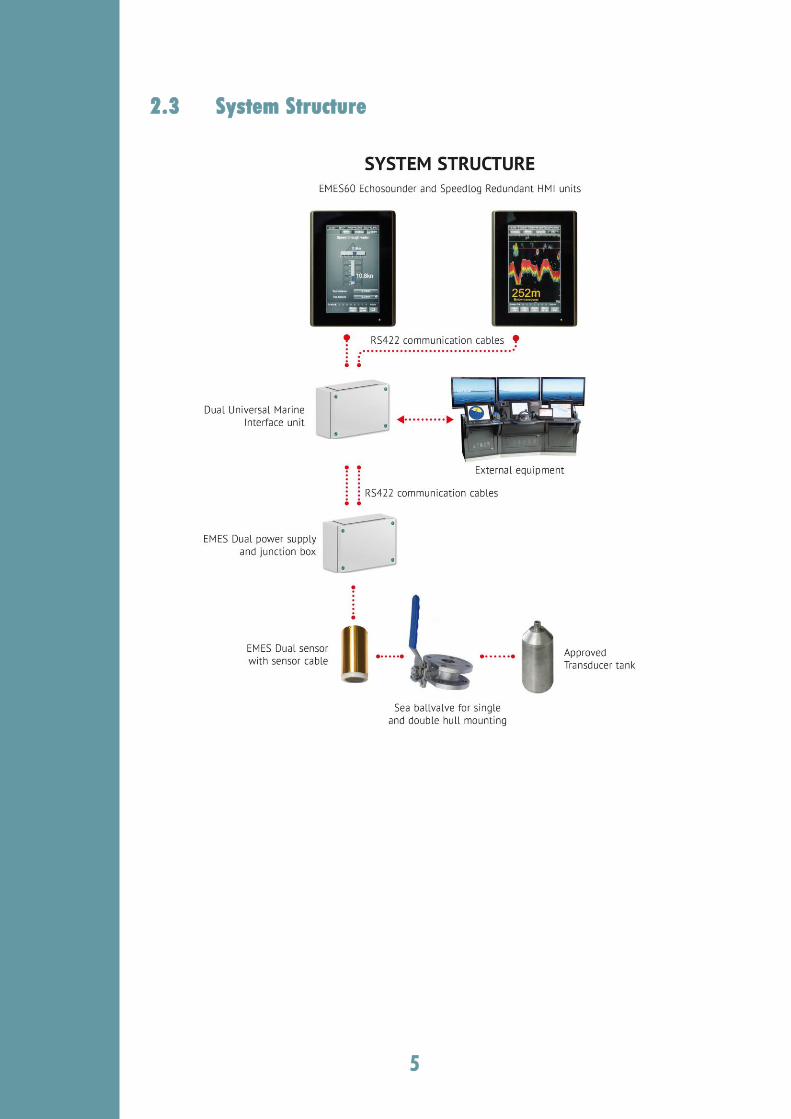
EMES60 is a combined electromagnetic speed log and
echosounder navigation system. It is a single sensor with two
transducers in one housing.
Both parts have been designed to meet the relevant international
standards and provide all the modern and legacy input-output
interfaces that are specified by the IMO standards.
As required by the relevant regulations, the two parts are totally
separated internally.
The main advantage of this arrangement is that the system only
needs one hull penetration, and one set of mounting hardware,
thus increasing reliability and reducing costs of installation and
maintenance.
The size and weight of the sensor is significantly less than other
systems on the market, which greatly facilitates installation and
handling.
2.2 Highlights
Only one hull penetration, which increases safety of
navigation
Small overall diameter of sensor, requiring small hull
penetration, which minimizes the risk of mechanical
damage
Sophisticated analog and digital signal processing, which
provides reliable data in any navigation conditions
All modern and legacy input-output interfaces are
supported, including IEC61162-1/1 and IEC61162-450 (Light
Weight Ethernet)
Sound speed calibration based on temperature, which
provides accurate depth measurements in different
conditions without the need for manual adjustments
Includes water temperature sensor, accurate to 1°C
Optimized electromagnetic log operational parameters,
which provides accurate speed through water
measurements in different water conditions, such as sea
water, river water, and brackish water
5
2.3 System Structure
6
3 Operation
3.1 HMI Touch-Screen Controls
Reading the speed and depth information from the system, and
configuring the system for use, is done through the touch-screen
display units, called “human-machine interface” (HMI) units.
Data is also sent to external equipment using a range of standard
communication protocols and data formats.
Two HMI Units are usually fitted, both of which can run both the
echosounder and speed log parts of the system, but typically one
is configured to run the echosounder, and the other is configured
to run the speed log.
The HMI Units use touch-screen technology, so that controlling the
system is done by touching the relevant part of the HMI Unit
screen.
The structure and operation of both HMI units is similar. The
examples below are from the speed log, but the principles are the
same for the echosounder.
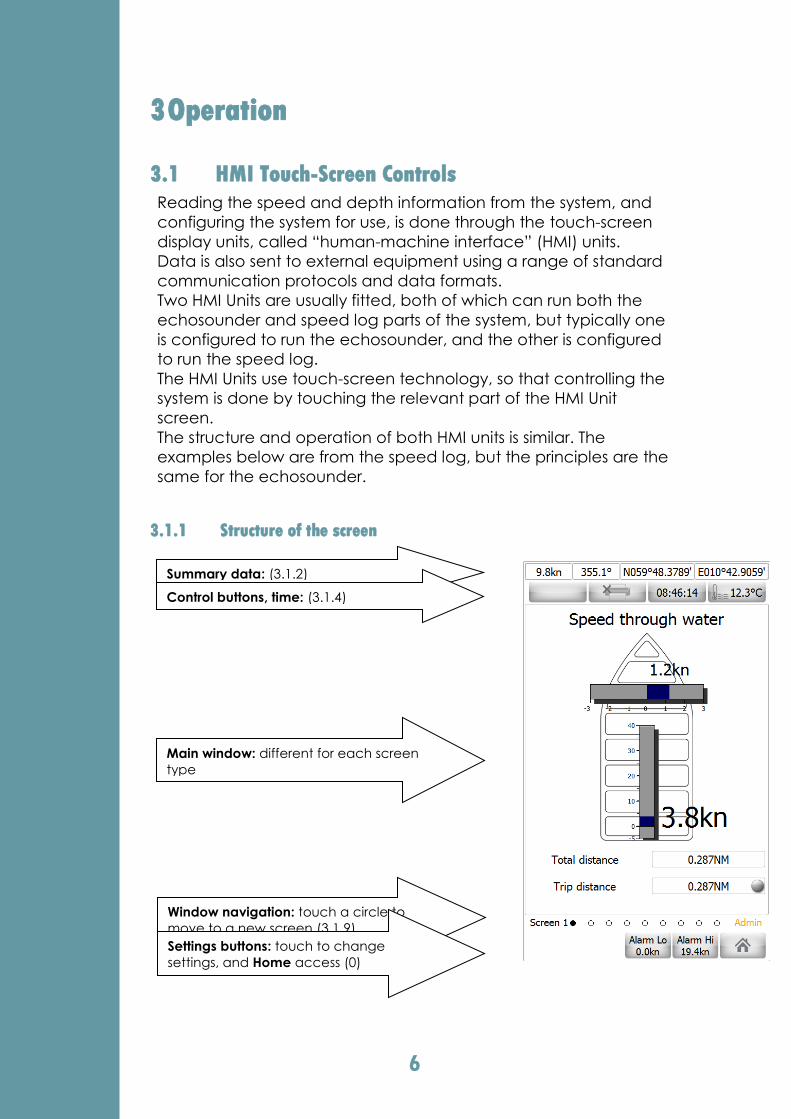
3.1.1 Structure of the screen
Summary data: (3.1.2)
Control buttons, time: (3.1.4)
Main window: different for each screen
type
Window navigation: touch a circle to
move to a new screen (3.1.9)
Settings buttons: touch to change
settings, and Home access (0)
7
The exact contents of the parts of the screen are different for
each screen type; see the section for each screen for detailed
information.
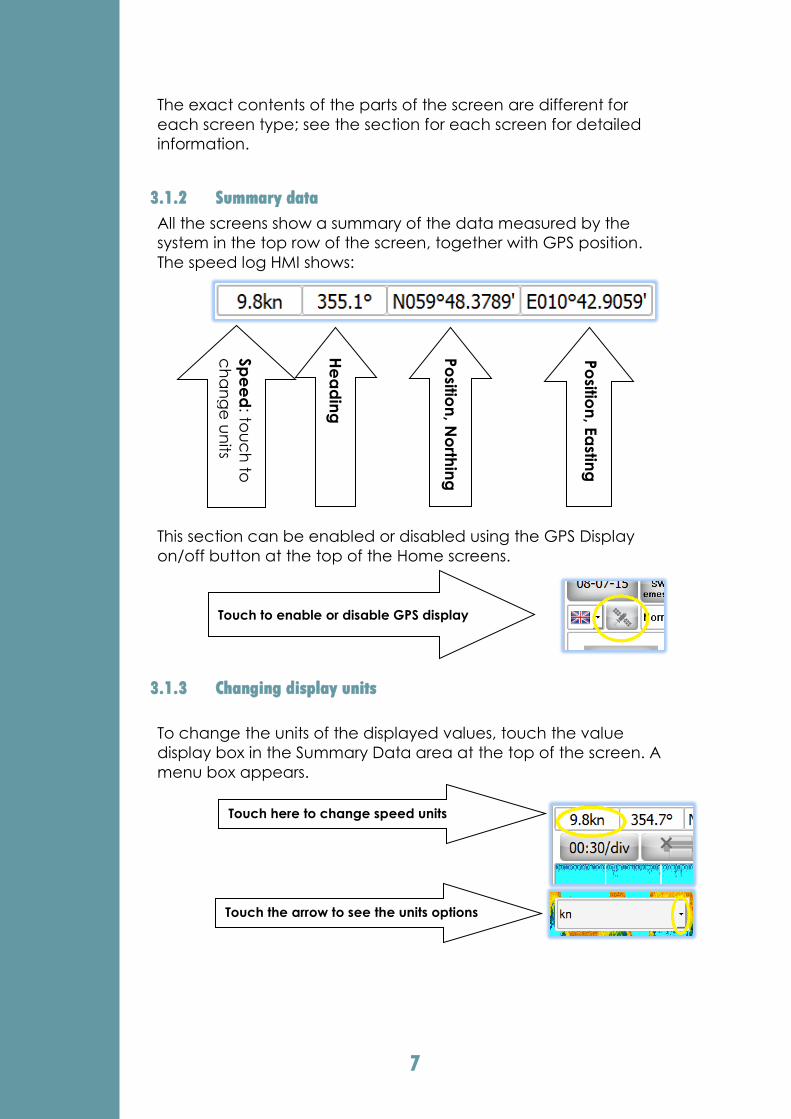
3.1.2 Summary data
All the screens show a summary of the data measured by the
system in the top row of the screen, together with GPS position.
The speed log HMI shows:
This section can be enabled or disabled using the GPS Display
on/off button at the top of the Home screens.
3.1.3 Changing display units
To change the units of the displayed values, touch the value
display box in the Summary Data area at the top of the screen. A
menu box appears.
Sp
ee
d: to
uc
h to
ch
an
ge
un
its
He
ad
ing
Po
sition
, No
rthin
g
Po
sition
, Ea
sting
Touch here to change speed units
Touch to enable or disable GPS display
Touch the arrow to see the units options

8
Options for the speed log are:
“mph”: miles per hour
“kn”: knots
“mph” is statute miles per hour (the measure of speed commonly
used for land speeds in some countries). “Knots” are nautical miles
per hour.
Most of the other displayed values have similar controls that are
accessed by touching their display box.
3.1.4 Control buttons
The second row has a set of buttons, which provide numerical
outputs as well as controls for the system. Each screen type is
slightly different, but a typical one is as follows.
3.1.5 Printing and screen snapshots
Touch the Print Screen button to send data
from the screen to a printer.
In Echosounder mode, this will start a
continuous printout of the echogram and the
GPS position data.
In Speed log mode, it makes a copy of the
screen for debug and maintenance purposes.
The function of this button is controlled by the
selection of the Screen copy selection in the
Hardware Interface Selection screen (section
3.1.14).
Win
do
w-sp
ec
ific
co
ntro
l
Prin
t scre
en
Time
disp
lay
: tou
ch
to c
ha
ng
e th
e tim
e
Wa
ter Te
mp
era
ture
disp
lay
: tou
ch
to
ca
libra
te
9
The printer used can be selected from the list
of system printers in the Hardware Interface
Selection screen.
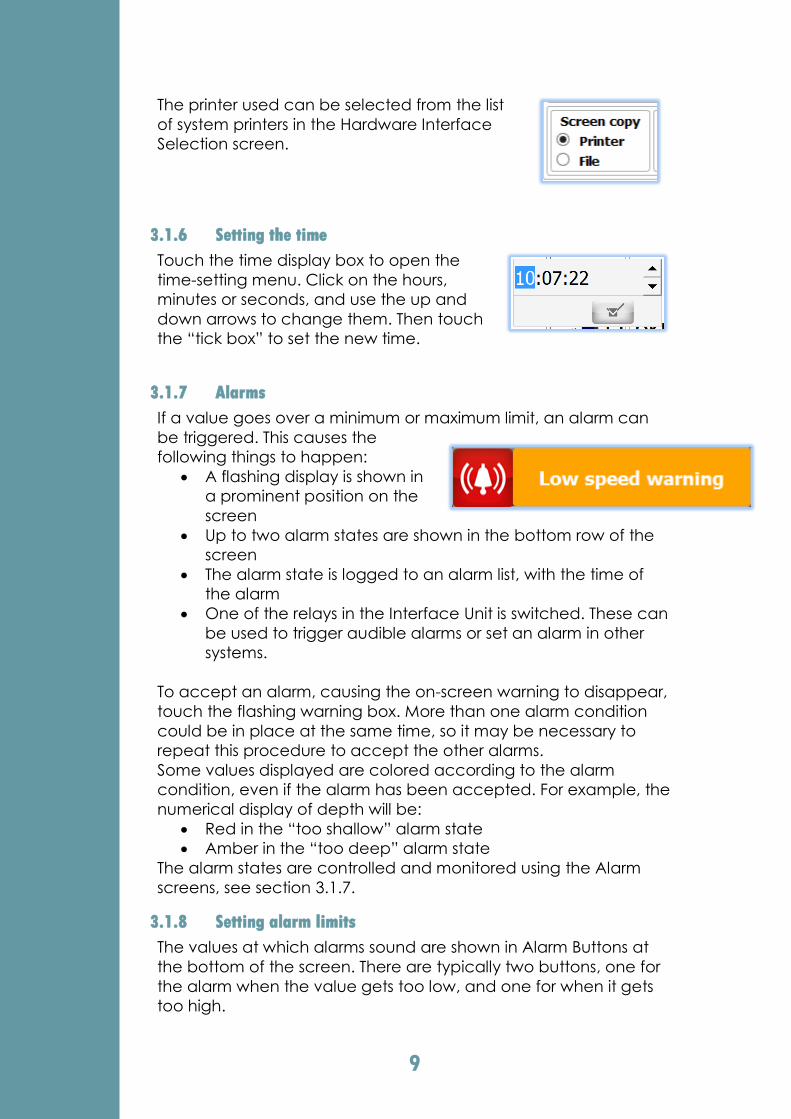
3.1.6 Setting the time
Touch the time display box to open the
time-setting menu. Click on the hours,
minutes or seconds, and use the up and
down arrows to change them. Then touch
the “tick box” to set the new time.
3.1.7 Alarms
If a value goes over a minimum or maximum limit, an alarm can
be triggered. This causes the
following things to happen:
A flashing display is shown in
a prominent position on the
screen
Up to two alarm states are shown in the bottom row of the
screen
The alarm state is logged to an alarm list, with the time of
the alarm
One of the relays in the Interface Unit is switched. These can
be used to trigger audible alarms or set an alarm in other
systems.
To accept an alarm, causing the on-screen warning to disappear,
touch the flashing warning box. More than one alarm condition
could be in place at the same time, so it may be necessary to
repeat this procedure to accept the other alarms.
Some values displayed are colored according to the alarm
condition, even if the alarm has been accepted. For example, the
numerical display of depth will be:
Red in the “too shallow” alarm state
Amber in the “too deep” alarm state
The alarm states are controlled and monitored using the Alarm
screens, see section 3.1.7.
3.1.8 Setting alarm limits
The values at which alarms sound are shown in Alarm Buttons at
the bottom of the screen. There are typically two buttons, one for
the alarm when the value gets too low, and one for when it gets
too high.
10
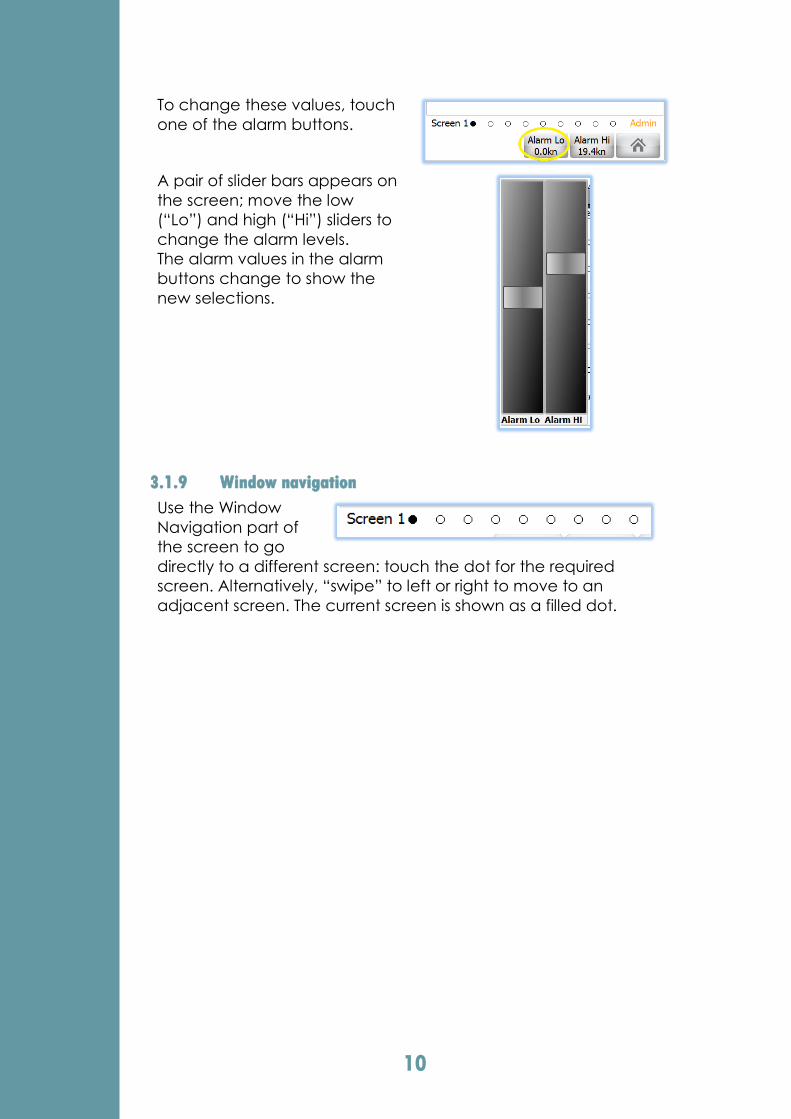
To change these values, touch
one of the alarm buttons.
A pair of slider bars appears on
the screen; move the low
(“Lo”) and high (“Hi”) sliders to
change the alarm levels.
The alarm values in the alarm
buttons change to show the
new selections.
3.1.9 Window navigation
Use the Window
Navigation part of
the screen to go
directly to a different screen: touch the dot for the required
screen. Alternatively, “swipe” to left or right to move to an
adjacent screen. The current screen is shown as a filled dot.
11
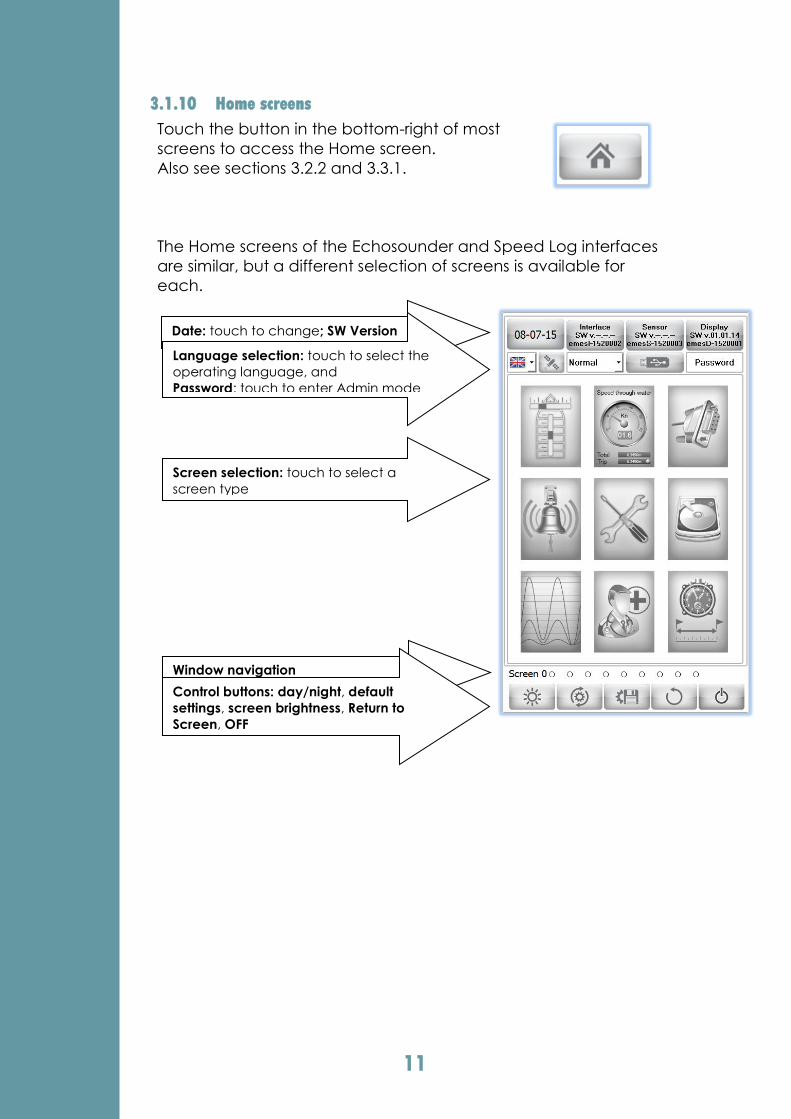
3.1.10 Home screens
Touch the button in the bottom-right of most
screens to access the Home screen.
Also see sections 3.2.2 and 3.3.1.
The Home screens of the Echosounder and Speed Log interfaces
are similar, but a different selection of screens is available for
each.
Date: touch to change; SW Version
Language selection: touch to select the
operating language, and
Password: touch to enter Admin mode
Screen selection: touch to select a
screen type
Window navigation
Control buttons: day/night, default
settings, screen brightness, Return to
Screen, OFF
12
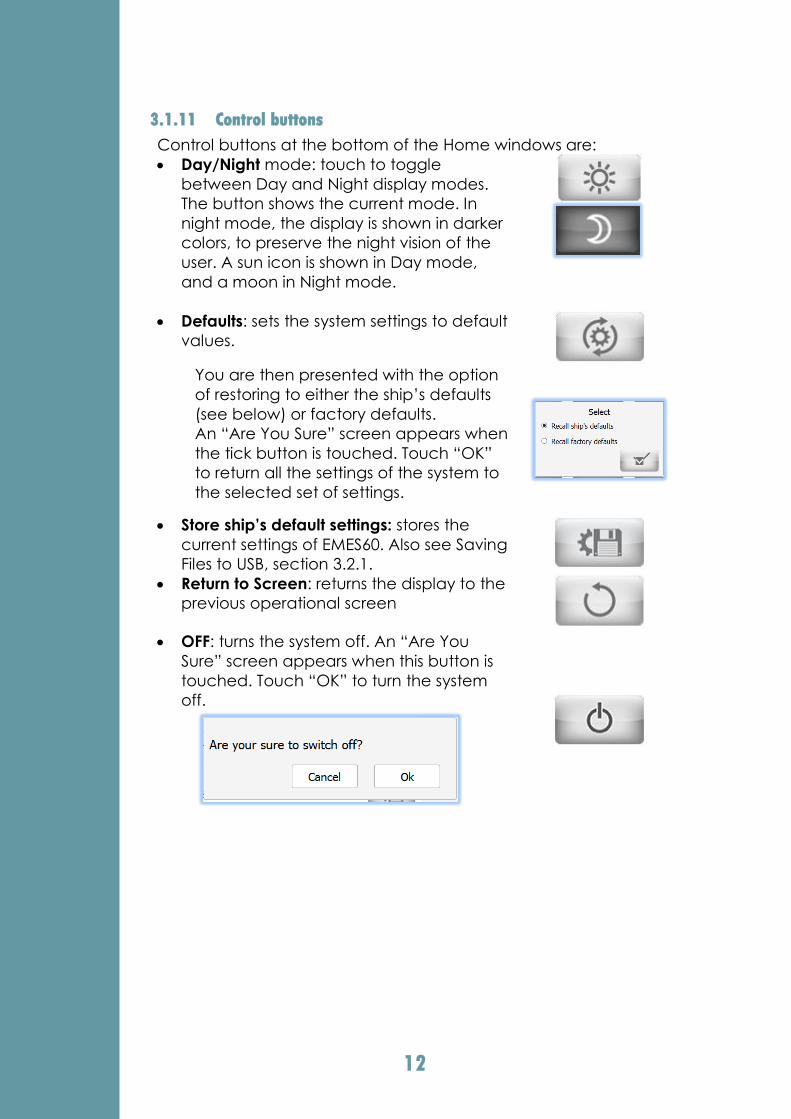
3.1.11 Control buttons
Control buttons at the bottom of the Home windows are:
Day/Night mode: touch to toggle
between Day and Night display modes.
The button shows the current mode. In
night mode, the display is shown in darker
colors, to preserve the night vision of the
user. A sun icon is shown in Day mode,
and a moon in Night mode.
Defaults: sets the system settings to default
values.
You are then presented with the option
of restoring to either the ship’s defaults
(see below) or factory defaults.
An “Are You Sure” screen appears when
the tick button is touched. Touch “OK”
to return all the settings of the system to
the selected set of settings.
Store ship’s default settings: stores the
current settings of EMES60. Also see Saving
Files to USB, section 3.2.1.
Return to Screen: returns the display to the
previous operational screen
OFF: turns the system off. An “Are You
Sure” screen appears when this button is
touched. Touch “OK” to turn the system
off.
13
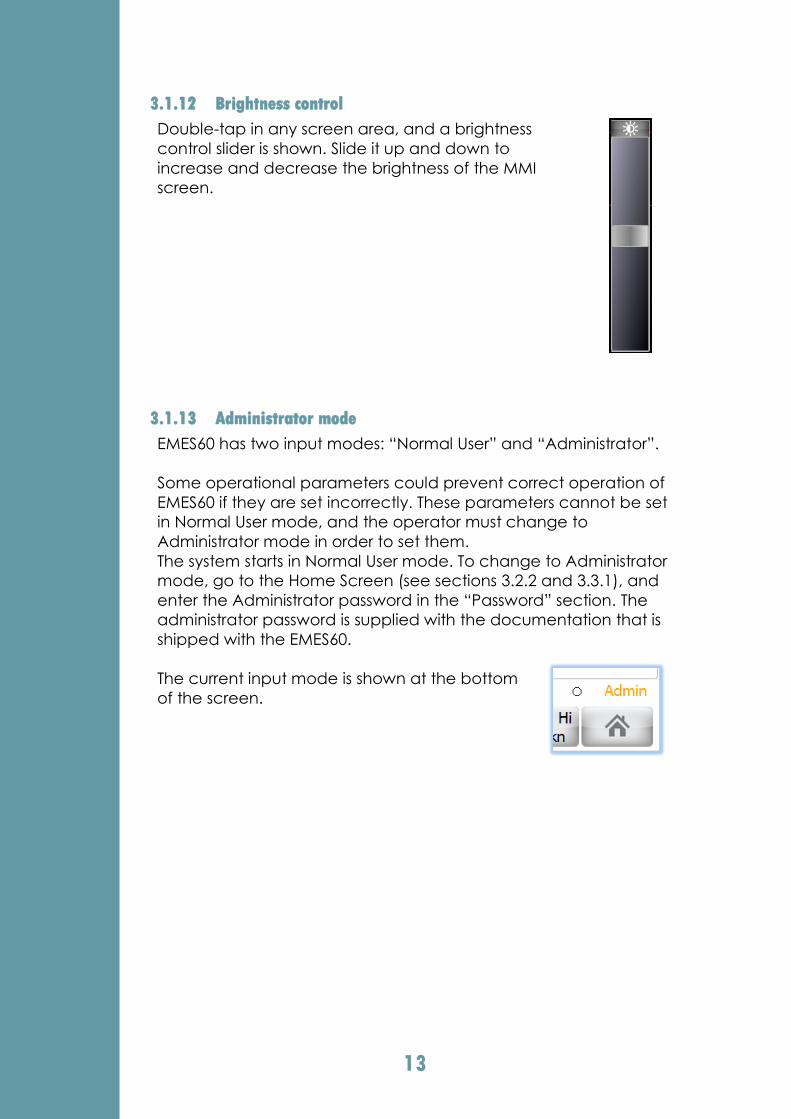
3.1.12 Brightness control
Double-tap in any screen area, and a brightness
control slider is shown. Slide it up and down to
increase and decrease the brightness of the MMI
screen.
3.1.13 Administrator mode
EMES60 has two input modes: “Normal User” and “Administrator”.
Some operational parameters could prevent correct operation of
EMES60 if they are set incorrectly. These parameters cannot be set
in Normal User mode, and the operator must change to
Administrator mode in order to set them.
The system starts in Normal User mode. To change to Administrator
mode, go to the Home Screen (see sections 3.2.2 and 3.3.1), and
enter the Administrator password in the “Password” section. The
administrator password is supplied with the documentation that is
shipped with the EMES60.
The current input mode is shown at the bottom
of the screen.
14
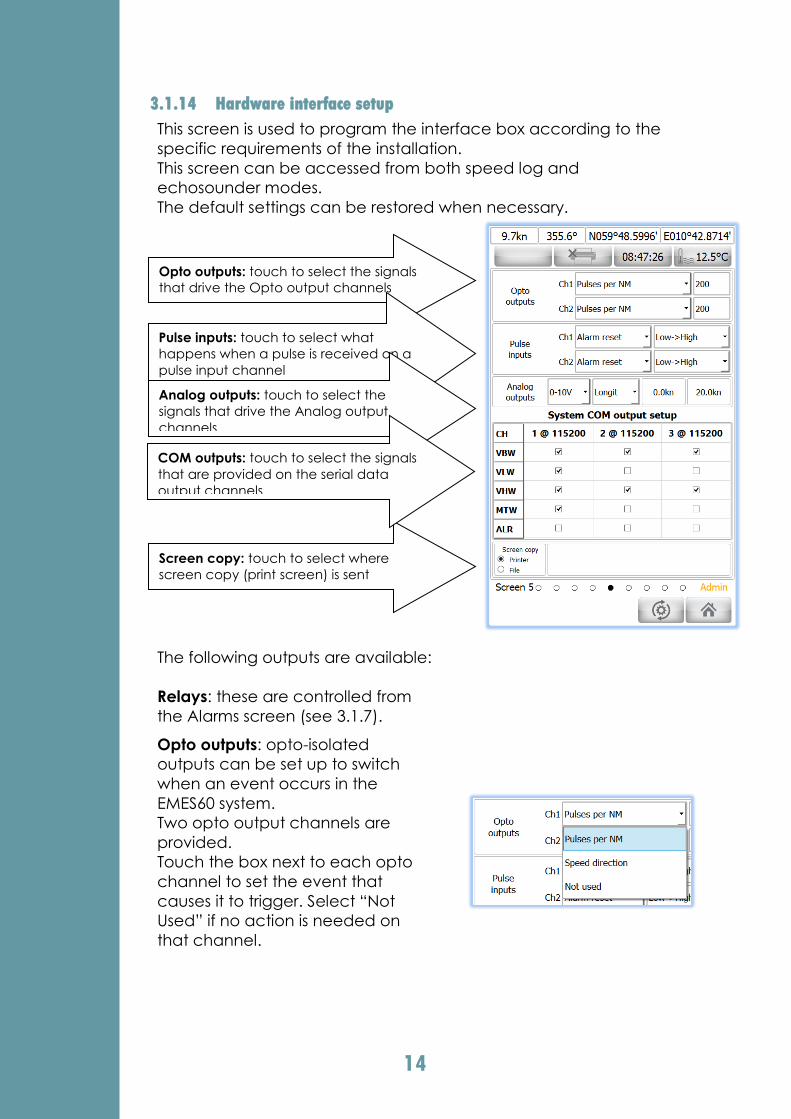
3.1.14 Hardware interface setup
This screen is used to program the interface box according to the
specific requirements of the installation.
This screen can be accessed from both speed log and
echosounder modes.
The default settings can be restored when necessary.
The following outputs are available:
Relays: these are controlled from
the Alarms screen (see 3.1.7).
Opto outputs: opto-isolated
outputs can be set up to switch
when an event occurs in the
EMES60 system.
Two opto output channels are
provided.
Touch the box next to each opto
channel to set the event that
causes it to trigger. Select “Not
Used” if no action is needed on
that channel.
Opto outputs: touch to select the signals
that drive the Opto output channels
Pulse inputs: touch to select what
happens when a pulse is received on a
pulse input channel
Analog outputs: touch to select the
signals that drive the Analog output
channels
Screen copy: touch to select where
screen copy (print screen) is sent
COM outputs: touch to select the signals
that are provided on the serial data
output channels
15
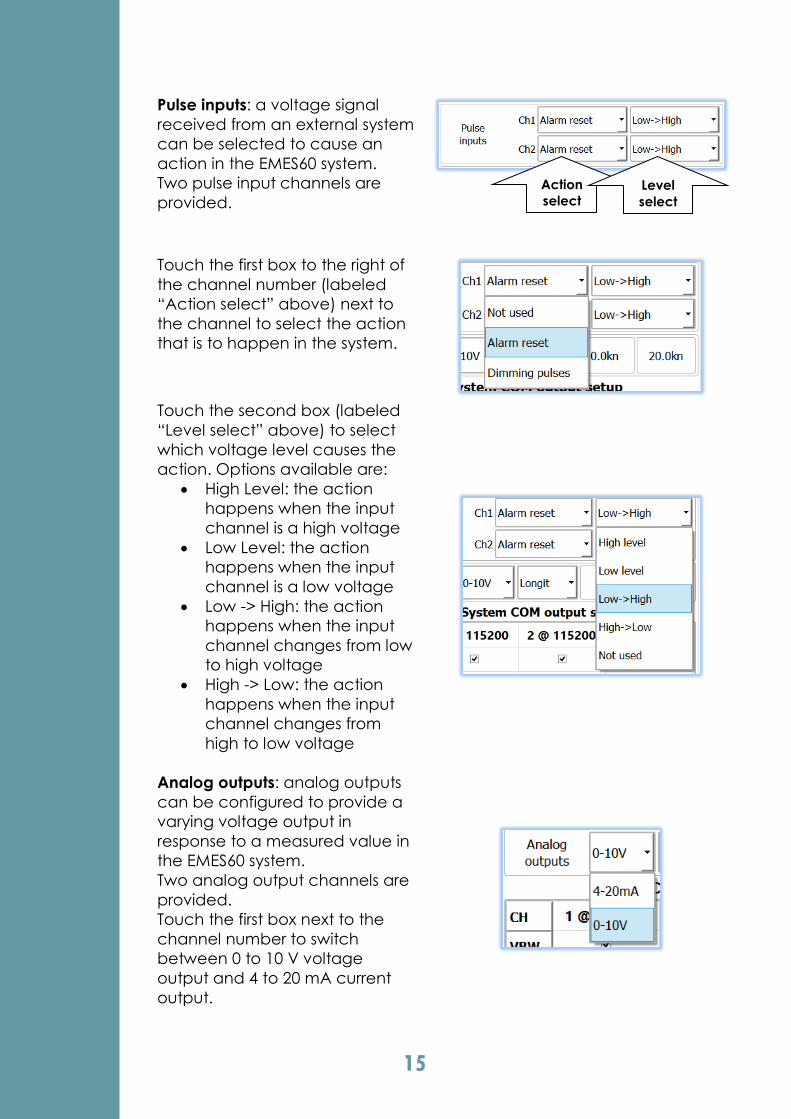
Pulse inputs: a voltage signal
received from an external system
can be selected to cause an
action in the EMES60 system.
Two pulse input channels are
provided.
Touch the first box to the right of
the channel number (labeled
“Action select” above) next to
the channel to select the action
that is to happen in the system.
Touch the second box (labeled
“Level select” above) to select
which voltage level causes the
action. Options available are:
High Level: the action
happens when the input
channel is a high voltage
Low Level: the action
happens when the input
channel is a low voltage
Low -> High: the action
happens when the input
channel changes from low
to high voltage
High -> Low: the action
happens when the input
channel changes from
high to low voltage
Analog outputs: analog outputs
can be configured to provide a
varying voltage output in
response to a measured value in
the EMES60 system.
Two analog output channels are
provided.
Touch the first box next to the
channel number to switch
between 0 to 10 V voltage
output and 4 to 20 mA current
output.
Action
select Level
select
16
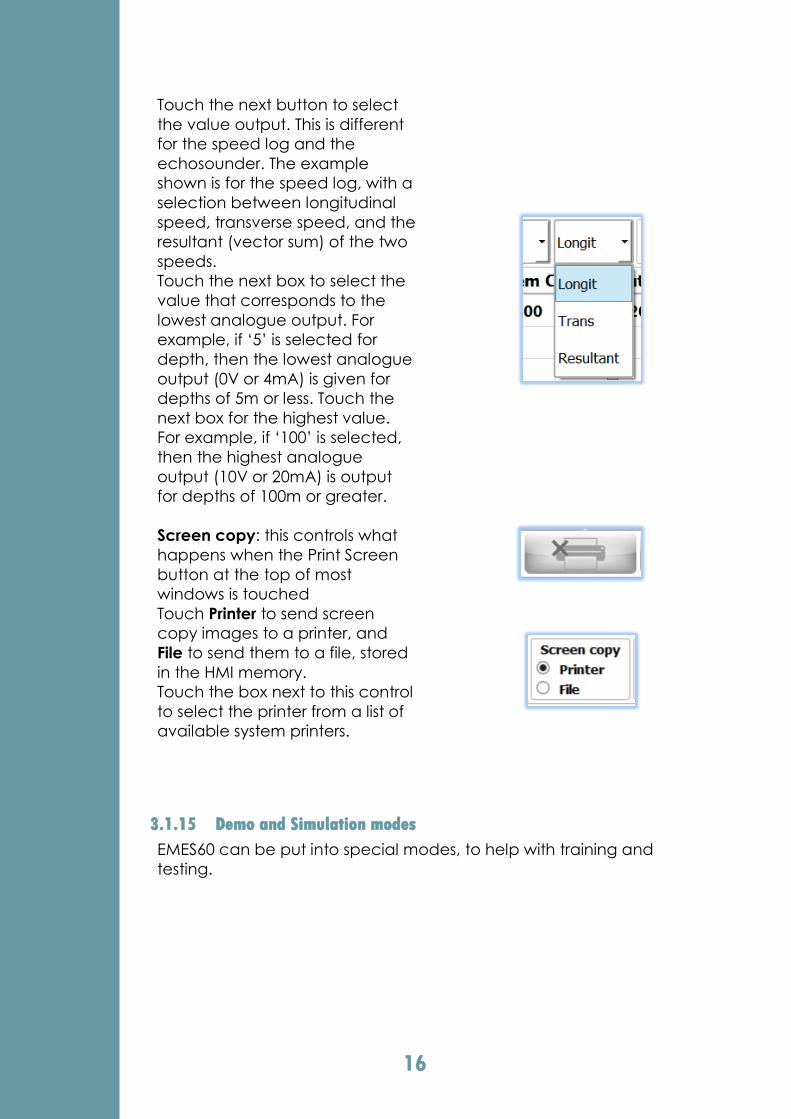
Touch the next button to select
the value output. This is different
for the speed log and the
echosounder. The example
shown is for the speed log, with a
selection between longitudinal
speed, transverse speed, and the
resultant (vector sum) of the two
speeds.
Touch the next box to select the
value that corresponds to the
lowest analogue output. For
example, if ‘5’ is selected for
depth, then the lowest analogue
output (0V or 4mA) is given for
depths of 5m or less. Touch the
next box for the highest value.
For example, if ‘100’ is selected,
then the highest analogue
output (10V or 20mA) is output
for depths of 100m or greater.
Screen copy: this controls what
happens when the Print Screen
button at the top of most
windows is touched
Touch Printer to send screen
copy images to a printer, and
File to send them to a file, stored
in the HMI memory.
Touch the box next to this control
to select the printer from a list of
available system printers.
3.1.15 Demo and Simulation modes
EMES60 can be put into special modes, to help with training and
testing.
17
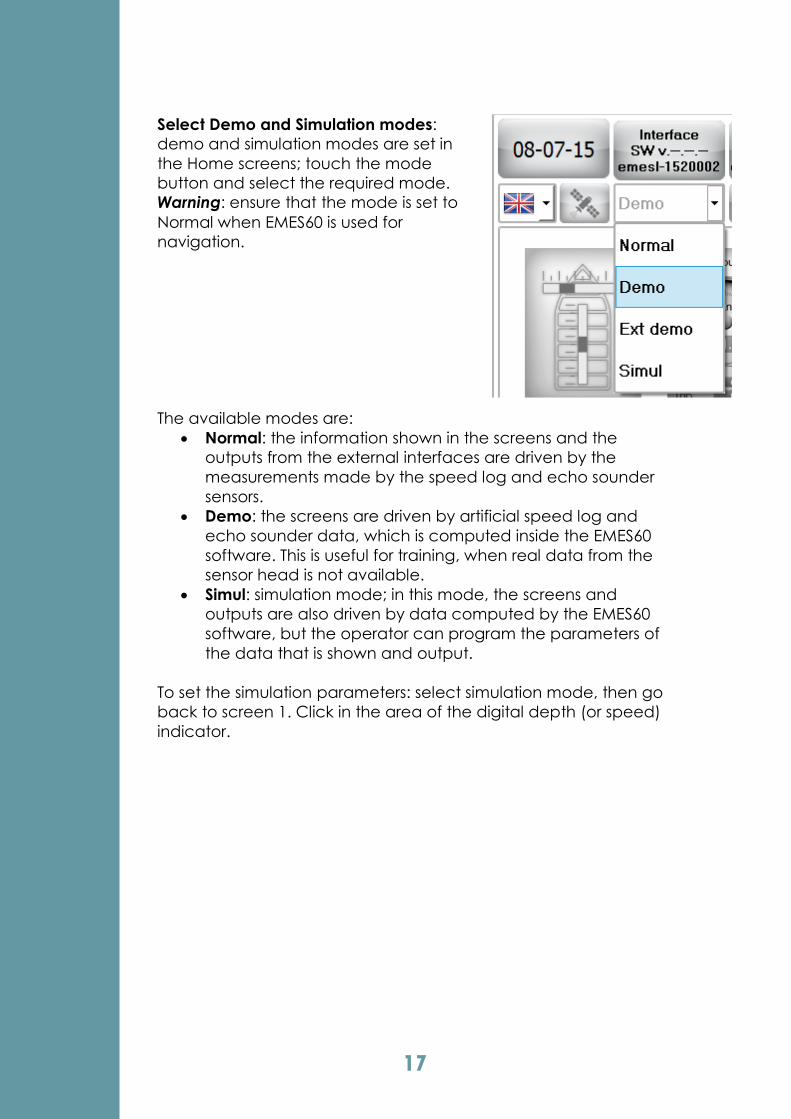
Select Demo and Simulation modes:
demo and simulation modes are set in
the Home screens; touch the mode
button and select the required mode.
Warning: ensure that the mode is set to
Normal when EMES60 is used for
navigation.
The available modes are:
Normal: the information shown in the screens and the
outputs from the external interfaces are driven by the
measurements made by the speed log and echo sounder
sensors.
Demo: the screens are driven by artificial speed log and
echo sounder data, which is computed inside the EMES60
software. This is useful for training, when real data from the
sensor head is not available.
Simul: simulation mode; in this mode, the screens and
outputs are also driven by data computed by the EMES60
software, but the operator can program the parameters of
the data that is shown and output.
To set the simulation parameters: select simulation mode, then go
back to screen 1. Click in the area of the digital depth (or speed)
indicator.
18
3.2 Echosounder
The echosounder function measures the depth of water under the
vessel.
3.2.1 Saving files to USB key
Data can be transferred to and from the
EMES60 MMI units using the USB Key
control, for maintenance and
troubleshooting.
Remove the MMI unit from the mounting
panel, and insert a USB key drive into the
USB port.
Touch the USB Key button in the Home
screen.
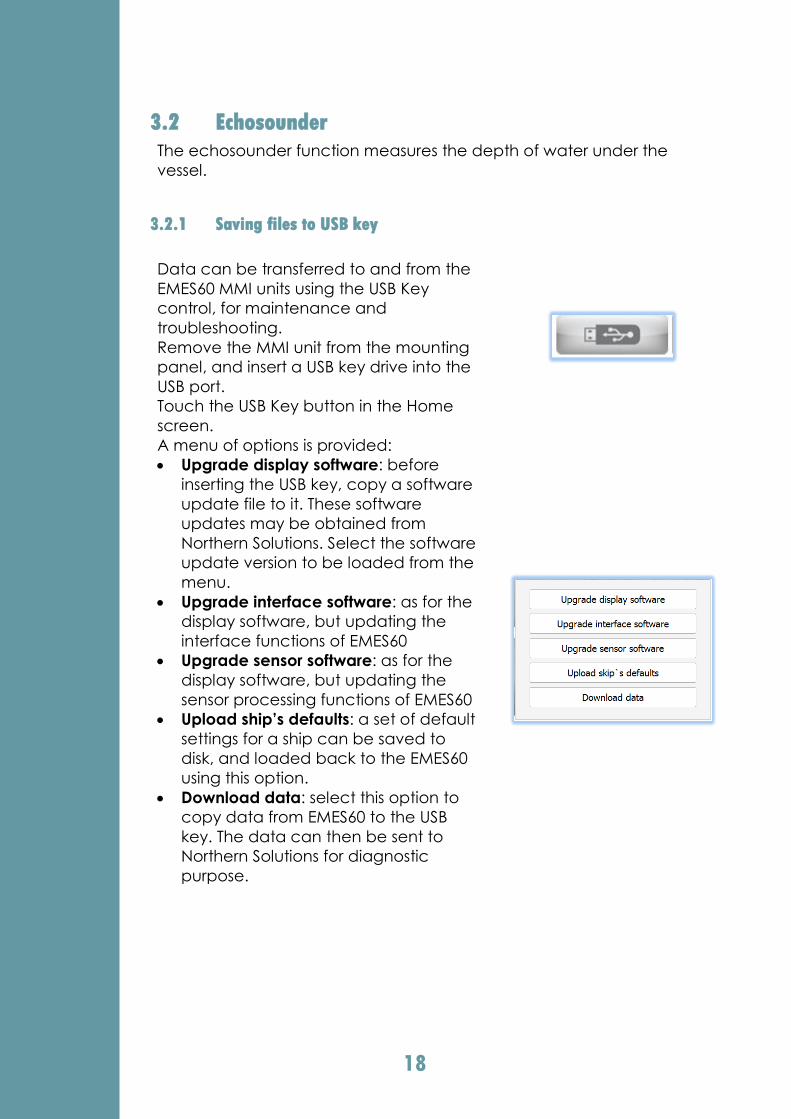
A menu of options is provided:
Upgrade display software: before
inserting the USB key, copy a software
update file to it. These software
updates may be obtained from
Northern Solutions. Select the software
update version to be loaded from the
menu.
Upgrade interface software: as for the
display software, but updating the
interface functions of EMES60
Upgrade sensor software: as for the
display software, but updating the
sensor processing functions of EMES60
Upload ship’s defaults: a set of default
settings for a ship can be saved to
disk, and loaded back to the EMES60
using this option.
Download data: select this option to
copy data from EMES60 to the USB
key. The data can then be sent to
Northern Solutions for diagnostic
purpose.
19
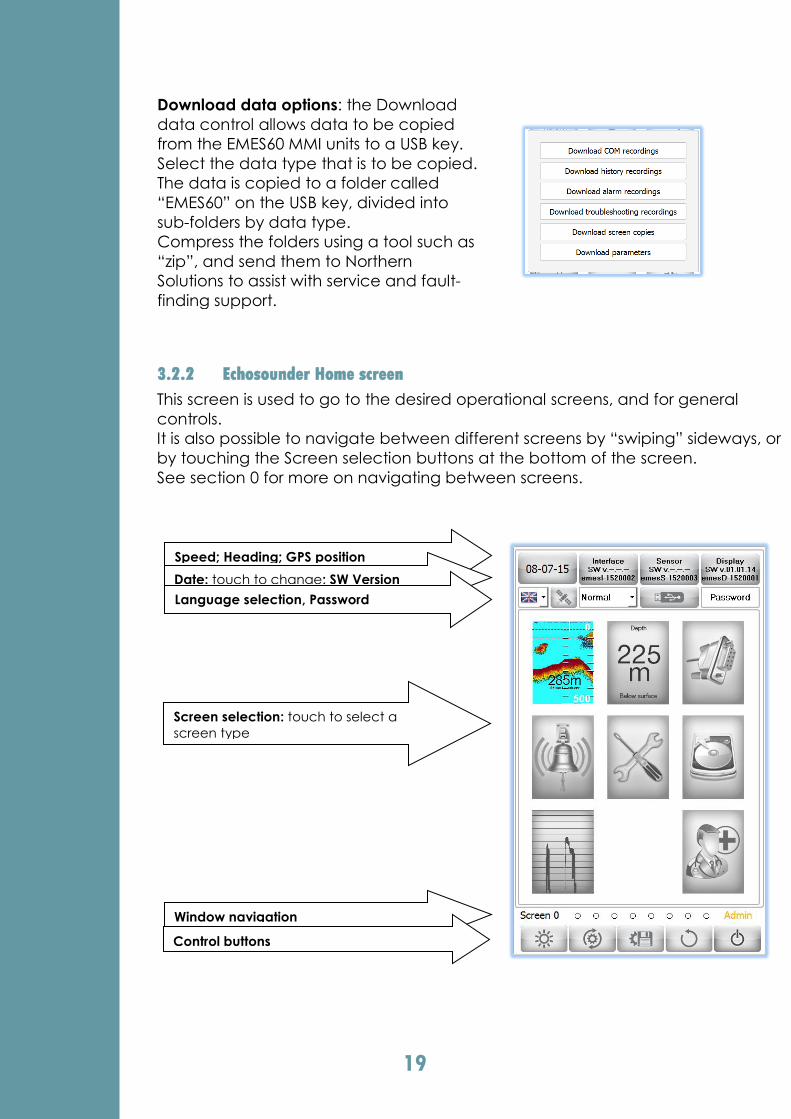
Download data options: the Download
data control allows data to be copied
from the EMES60 MMI units to a USB key.
Select the data type that is to be copied.
The data is copied to a folder called
“EMES60” on the USB key, divided into
sub-folders by data type.
Compress the folders using a tool such as
“zip”, and send them to Northern
Solutions to assist with service and fault-
finding support.
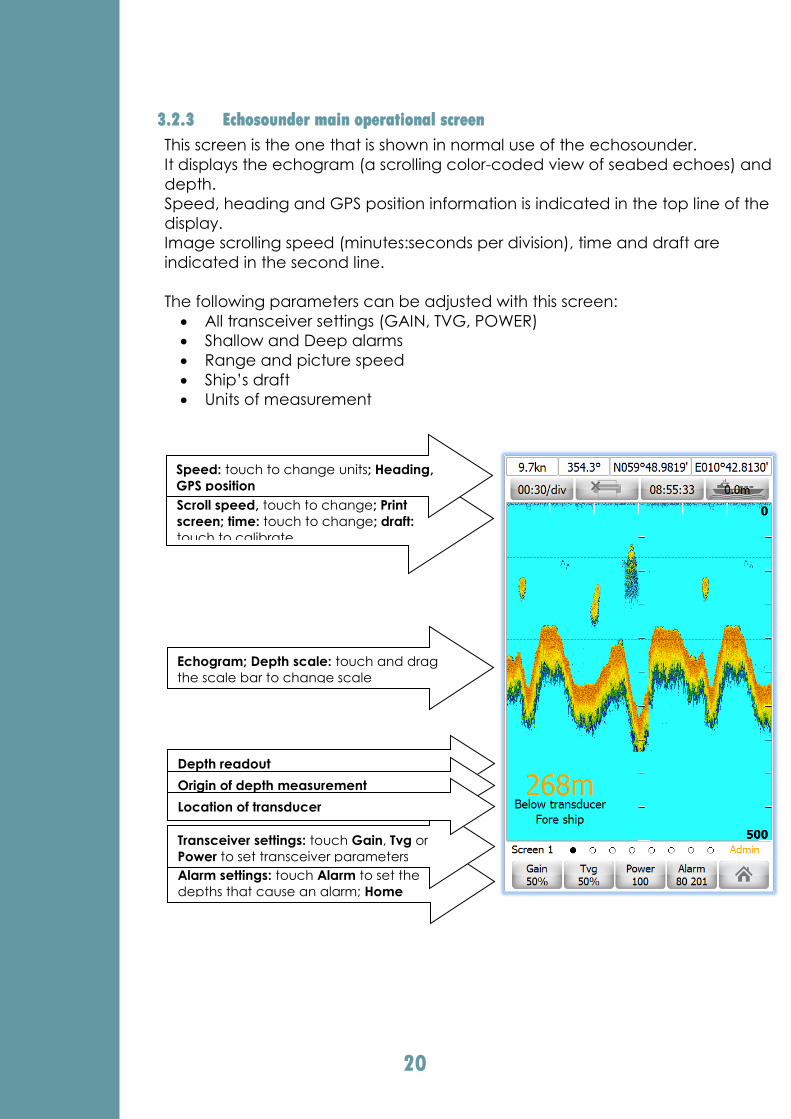
3.2.2 Echosounder Home screen
This screen is used to go to the desired operational screens, and for general
controls.
It is also possible to navigate between different screens by “swiping” sideways, or
by touching the Screen selection buttons at the bottom of the screen.
See section 0 for more on navigating between screens.
Speed; Heading; GPS position
Date: touch to change; SW Version
Language selection, Password
Screen selection: touch to select a
screen type
Window navigation
Control buttons
20
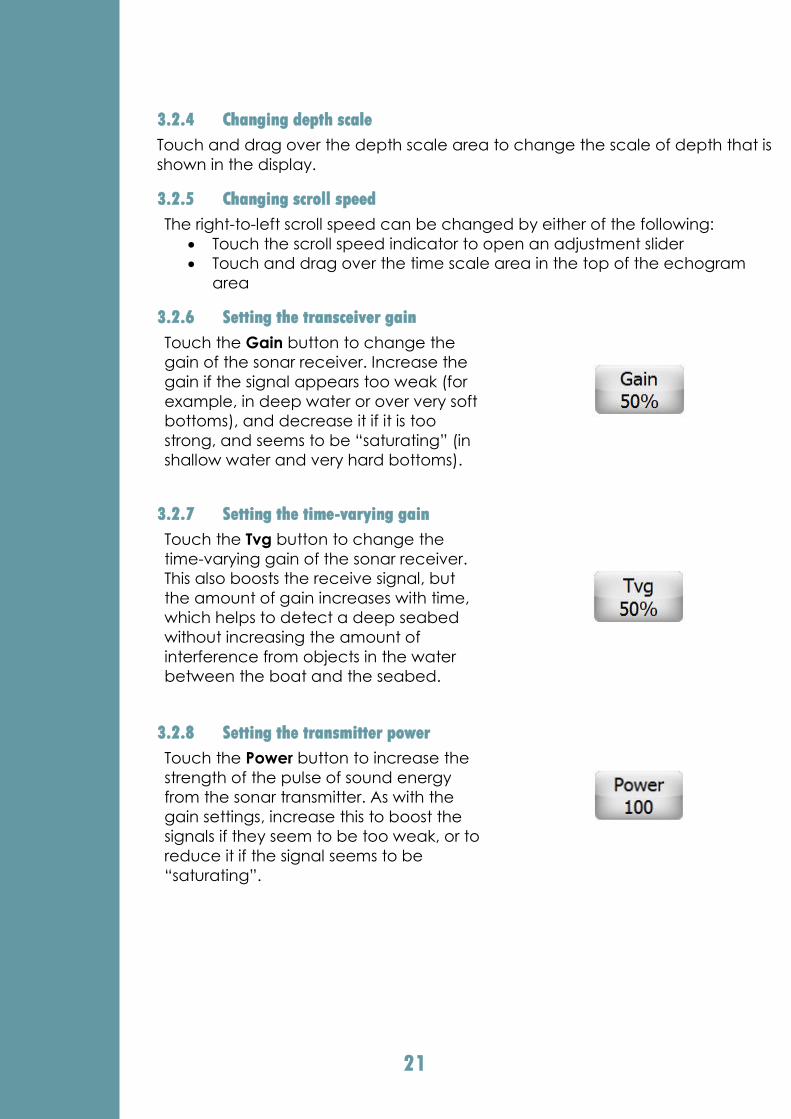
3.2.3 Echosounder main operational screen
This screen is the one that is shown in normal use of the echosounder.
It displays the echogram (a scrolling color-coded view of seabed echoes) and
depth.
Speed, heading and GPS position information is indicated in the top line of the
display.
Image scrolling speed (minutes:seconds per division), time and draft are
indicated in the second line.
The following parameters can be adjusted with this screen:
All transceiver settings (GAIN, TVG, POWER)
Shallow and Deep alarms
Range and picture speed
Ship’s draft
Units of measurement
Alarm settings: touch Alarm to set the
depths that cause an alarm; Home
Scroll speed, touch to change; Print
screen; time: touch to change; draft:
touch to calibrate
Speed: touch to change units; Heading,
GPS position
Transceiver settings: touch Gain, Tvg or
Power to set transceiver parameters
Echogram; Depth scale: touch and drag
the scale bar to change scale
Depth readout
Origin of depth measurement
Location of transducer
21
3.2.4 Changing depth scale
Touch and drag over the depth scale area to change the scale of depth that is
shown in the display.
3.2.5 Changing scroll speed
The right-to-left scroll speed can be changed by either of the following:
Touch the scroll speed indicator to open an adjustment slider
Touch and drag over the time scale area in the top of the echogram
area
3.2.6 Setting the transceiver gain
Touch the Gain button to change the
gain of the sonar receiver. Increase the
gain if the signal appears too weak (for
example, in deep water or over very soft
bottoms), and decrease it if it is too
strong, and seems to be “saturating” (in
shallow water and very hard bottoms).
3.2.7 Setting the time-varying gain
Touch the Tvg button to change the
time-varying gain of the sonar receiver.
This also boosts the receive signal, but
the amount of gain increases with time,
which helps to detect a deep seabed
without increasing the amount of
interference from objects in the water
between the boat and the seabed.
3.2.8 Setting the transmitter power
Touch the Power button to increase the
strength of the pulse of sound energy
from the sonar transmitter. As with the
gain settings, increase this to boost the
signals if they seem to be too weak, or to
reduce it if the signal seems to be
“saturating”.
22
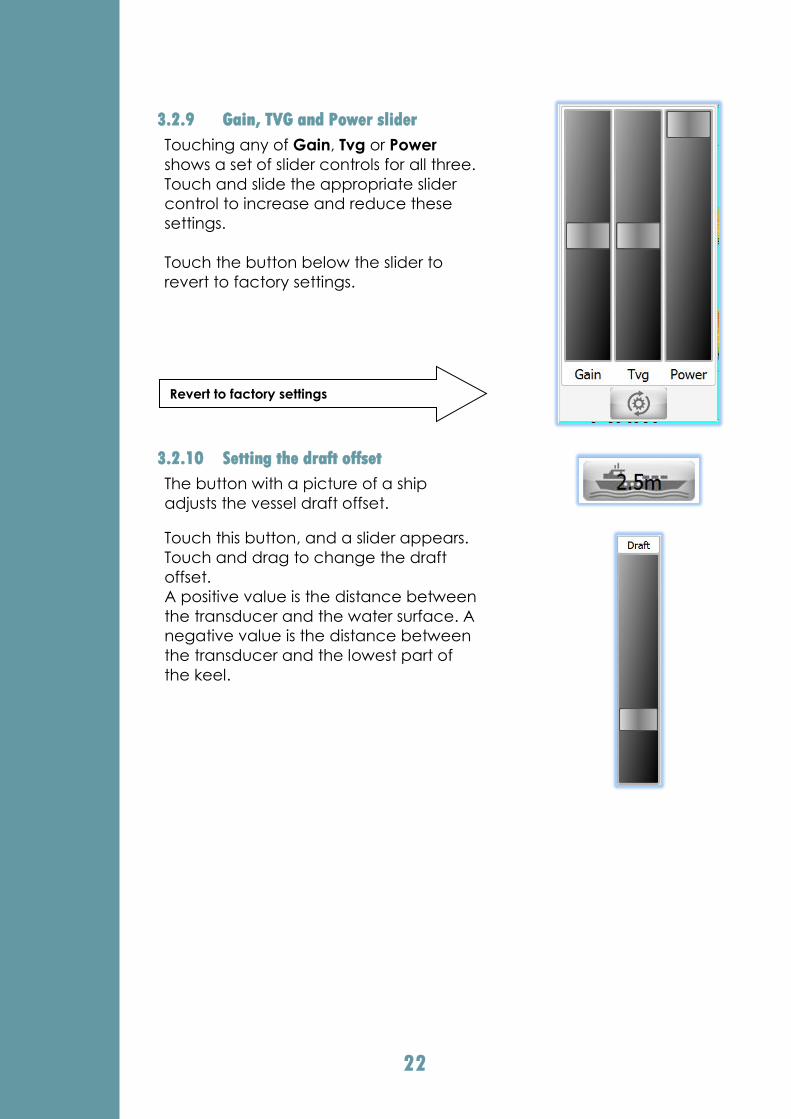
3.2.9 Gain, TVG and Power slider
Touching any of Gain, Tvg or Power
shows a set of slider controls for all three.
Touch and slide the appropriate slider
control to increase and reduce these
settings.
Touch the button below the slider to
revert to factory settings.
3.2.10 Setting the draft offset
The button with a picture of a ship
adjusts the vessel draft offset.
Touch this button, and a slider appears.
Touch and drag to change the draft
offset.
A positive value is the distance between
the transducer and the water surface. A
negative value is the distance between
the transducer and the lowest part of
the keel.
Revert to factory settings
23
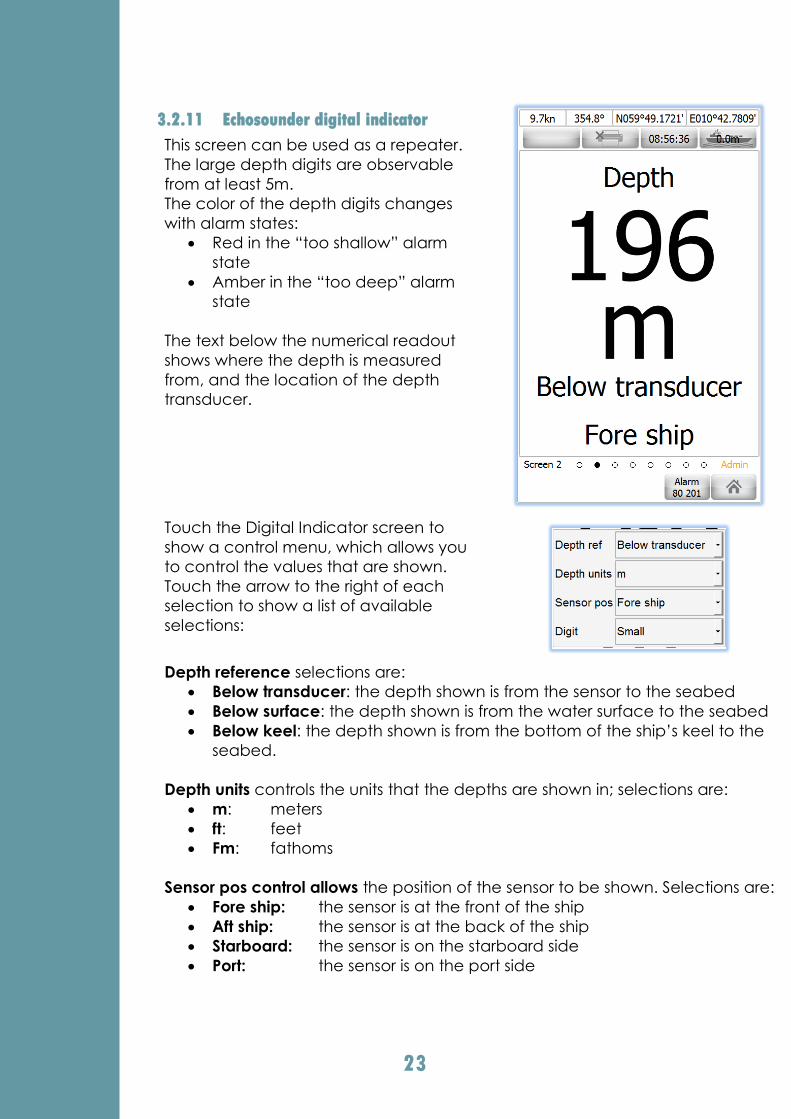
3.2.11 Echosounder digital indicator
This screen can be used as a repeater.
The large depth digits are observable
from at least 5m.
The color of the depth digits changes
with alarm states:
Red in the “too shallow” alarm
state
Amber in the “too deep” alarm
state
The text below the numerical readout
shows where the depth is measured
from, and the location of the depth
transducer.
Touch the Digital Indicator screen to
show a control menu, which allows you
to control the values that are shown.
Touch the arrow to the right of each
selection to show a list of available
selections:
Depth reference selections are:
Below transducer: the depth shown is from the sensor to the seabed
Below surface: the depth shown is from the water surface to the seabed
Below keel: the depth shown is from the bottom of the ship’s keel to the
seabed.
Depth units controls the units that the depths are shown in; selections are:
m: meters
ft: feet
Fm: fathoms
Sensor pos control allows the position of the sensor to be shown. Selections are:
Fore ship: the sensor is at the front of the ship
Aft ship: the sensor is at the back of the ship
Starboard: the sensor is on the starboard side
Port: the sensor is on the port side
24
Digit controls the size of the text that shows the depths; selections are:
small: depth is shown in a small font
large: depth is shown in a large font
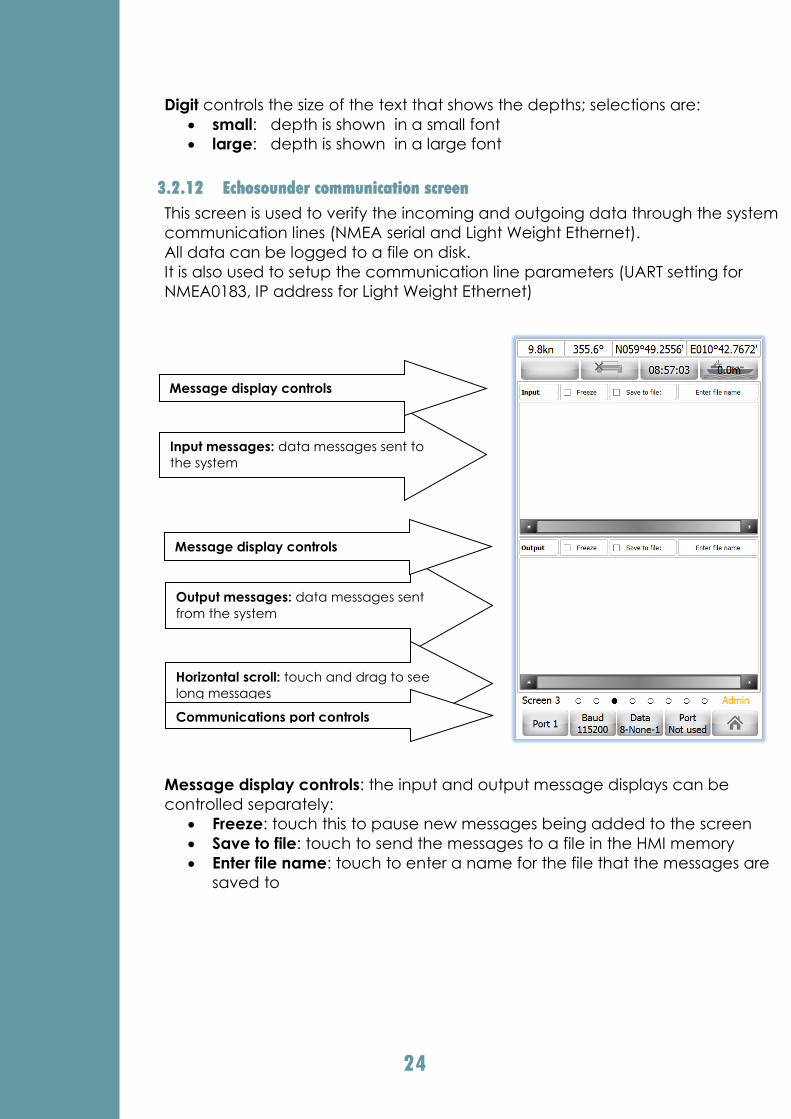
3.2.12 Echosounder communication screen
This screen is used to verify the incoming and outgoing data through the system
communication lines (NMEA serial and Light Weight Ethernet).
All data can be logged to a file on disk.
It is also used to setup the communication line parameters (UART setting for
NMEA0183, IP address for Light Weight Ethernet)
Message display controls: the input and output message displays can be
controlled separately:
Freeze: touch this to pause new messages being added to the screen
Save to file: touch to send the messages to a file in the HMI memory
Enter file name: touch to enter a name for the file that the messages are
saved to
Input messages: data messages sent to
the system
Output messages: data messages sent
from the system
Message display controls
Message display controls
Horizontal scroll: touch and drag to see
long messages
Communications port controls
25
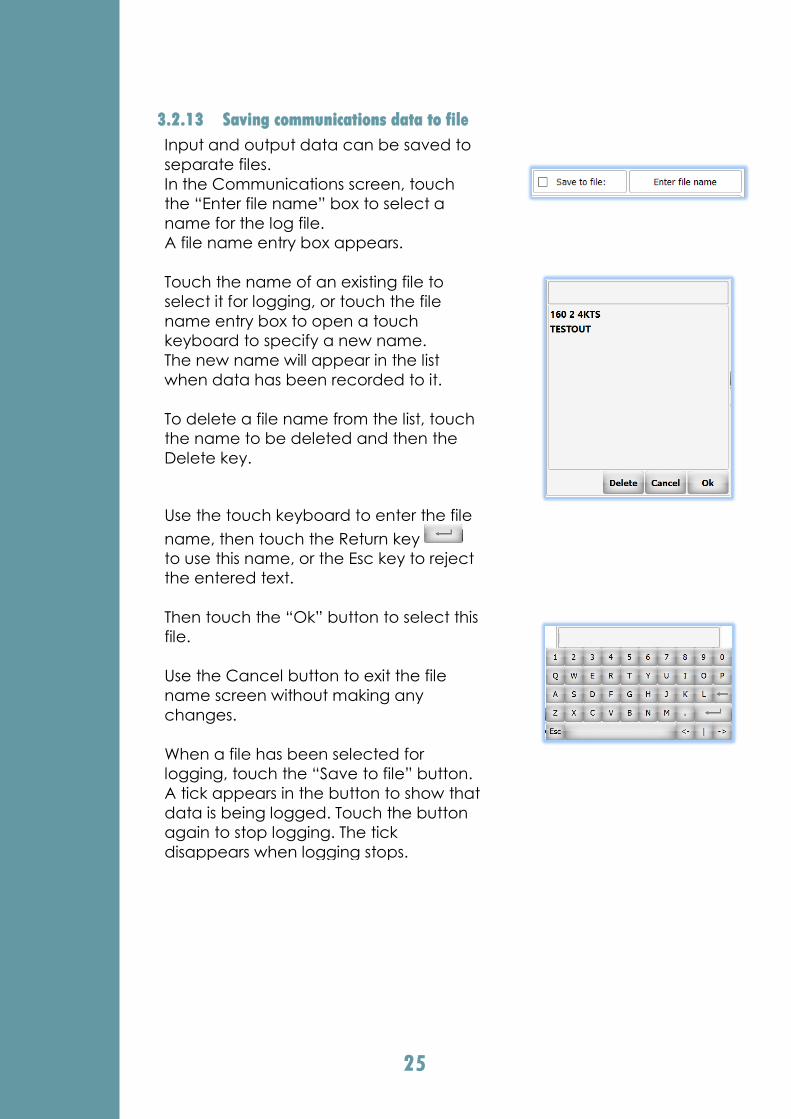
3.2.13 Saving communications data to file
Input and output data can be saved to
separate files.
In the Communications screen, touch
the “Enter file name” box to select a
name for the log file.
A file name entry box appears.
Touch the name of an existing file to
select it for logging, or touch the file
name entry box to open a touch
keyboard to specify a new name.
The new name will appear in the list
when data has been recorded to it.
To delete a file name from the list, touch
the name to be deleted and then the
Delete key.
Use the touch keyboard to enter the file
name, then touch the Return key
to use this name, or the Esc key to reject
the entered text.
Then touch the “Ok” button to select this
file.
Use the Cancel button to exit the file
name screen without making any
changes.
When a file has been selected for
logging, touch the “Save to file” button.
A tick appears in the button to show that
data is being logged. Touch the button
again to stop logging. The tick
disappears when logging stops.
26
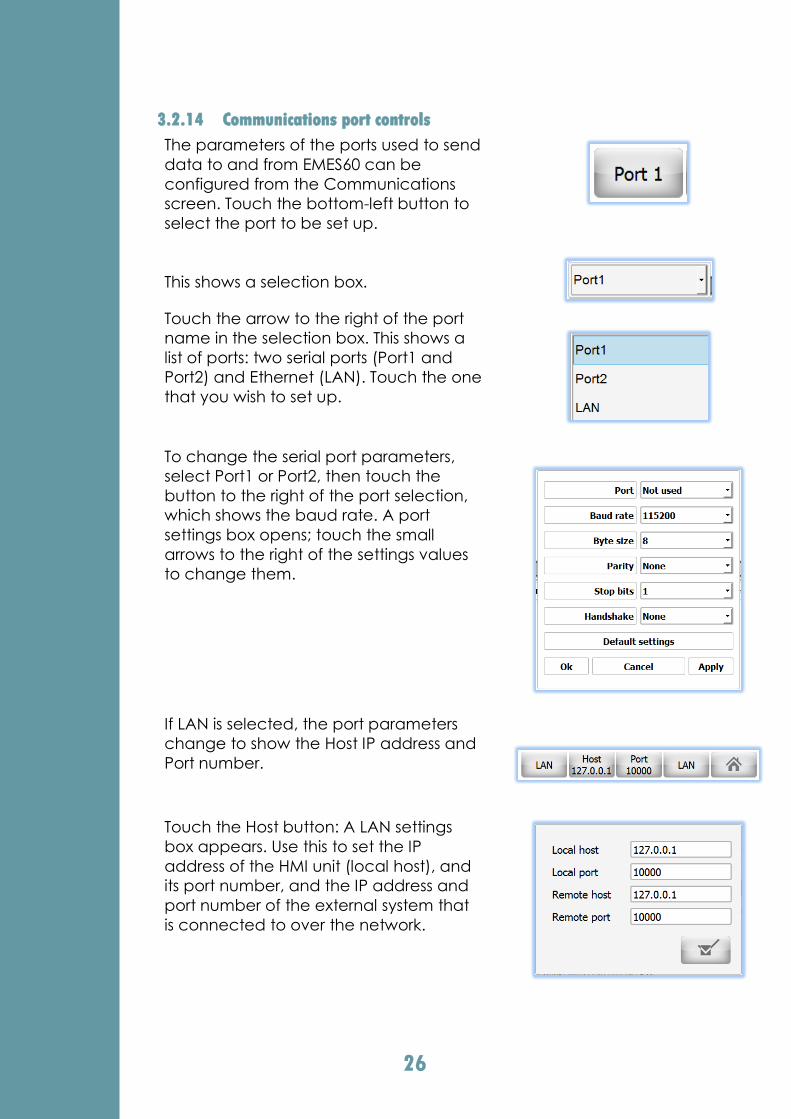
3.2.14 Communications port controls
The parameters of the ports used to send
data to and from EMES60 can be
configured from the Communications
screen. Touch the bottom-left button to
select the port to be set up.
This shows a selection box.
Touch the arrow to the right of the port
name in the selection box. This shows a
list of ports: two serial ports (Port1 and
Port2) and Ethernet (LAN). Touch the one
that you wish to set up.
To change the serial port parameters,
select Port1 or Port2, then touch the
button to the right of the port selection,
which shows the baud rate. A port
settings box opens; touch the small
arrows to the right of the settings values
to change them.
If LAN is selected, the port parameters
change to show the Host IP address and
Port number.
Touch the Host button: A LAN settings
box appears. Use this to set the IP
address of the HMI unit (local host), and
its port number, and the IP address and
port number of the external system that
is connected to over the network.

27
3.2.15 Echosounder alarm configuration screen
This screen allows the system alarms to be configured.
When a value that is measured by the system goes out of limits, an alarm is
issued. This screen allows the alarm limit, and what happens when the alarm is
triggered, to be set.
When an alarm occurs, it is associated
with an ID number.
To set an alarm ID, touch the value box
next to the alarm type text. This opens a
number touch keyboard. Enter the ID
number and touch the “Return” key, or
“Esc” to leave the value unchanged.
Alarm ID and Relay controls
Freeze alarm display and last alarm
Alarm history
Horizontal scroll bar

28
When an alarm is triggered, it is possible
to trigger a relay in the Interface Unit,
which can be used to trigger audible
alarms or set an alarm in other systems.
Touch the “Relay Num” button next to
the relevant alarm type, and select the
number of the relay to trigger, or “Not
Used” to disable relay operation for that
alarm type.
A scrolling history of alarms is shown in the bottom half of the display. Use the
vertical scroll bar to look through all of the alarms in the system memory, and
the horizontal scroll bar to read alarm messages that do not fit in the display
window.
Touch the Freeze button to stop new messages being shown in the window. A
tick appears in the button when the alarm display is frozen.
The shallow and deep alarm depths are
shown in the Alarm button at the bottom
of the screen. If the depth is shallower
than the shallow alarm depth, or deeper
than the deep alarm depth, an alarm is
triggered.
Touch the Alarm button to change the
shallow and deep alarm depths.
This shows a slider control, with Shallow
and Deep settings. Touch and slide to
change the alarm depths.
29
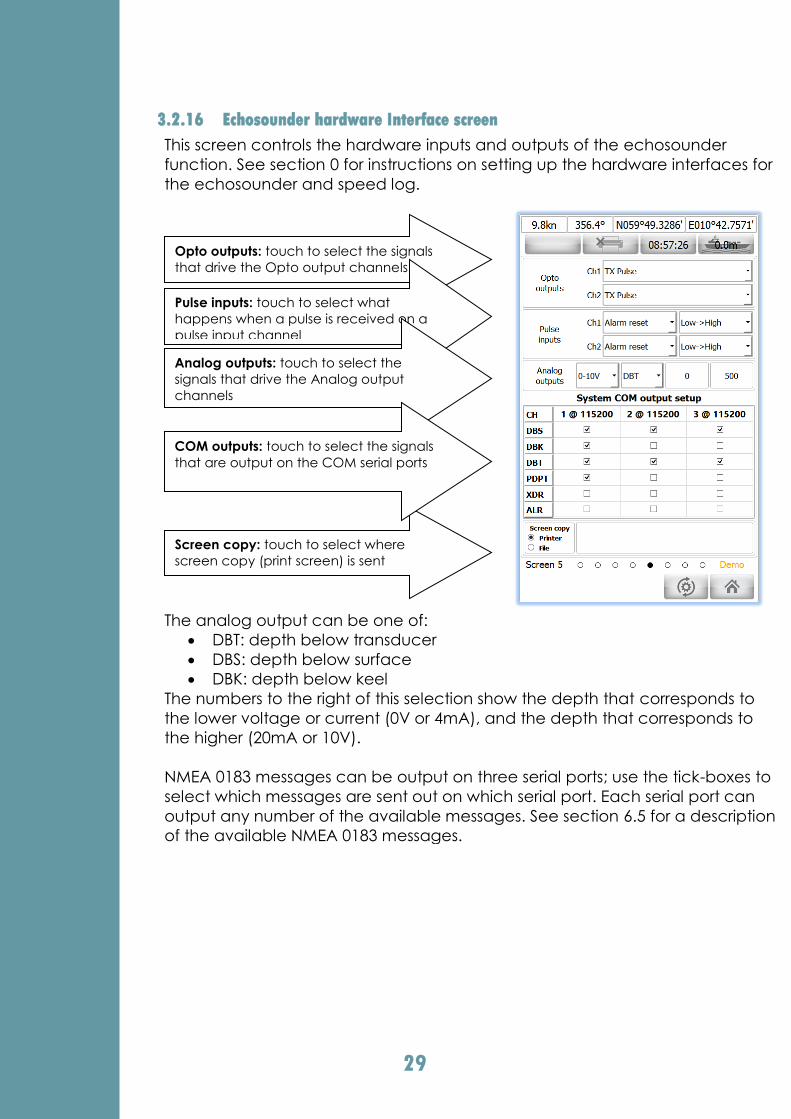
3.2.16 Echosounder hardware Interface screen
This screen controls the hardware inputs and outputs of the echosounder
function. See section 0 for instructions on setting up the hardware interfaces for
the echosounder and speed log.
The analog output can be one of:
DBT: depth below transducer
DBS: depth below surface
DBK: depth below keel
The numbers to the right of this selection show the depth that corresponds to
the lower voltage or current (0V or 4mA), and the depth that corresponds to
the higher (20mA or 10V).
NMEA 0183 messages can be output on three serial ports; use the tick-boxes to
select which messages are sent out on which serial port. Each serial port can
output any number of the available messages. See section 6.5 for a description
of the available NMEA 0183 messages.
Opto outputs: touch to select the signals
that drive the Opto output channels
Pulse inputs: touch to select what
happens when a pulse is received on a
pulse input channel
Analog outputs: touch to select the
signals that drive the Analog output
channels
Screen copy: touch to select where
screen copy (print screen) is sent
COM outputs: touch to select the signals
that are output on the COM serial ports
30
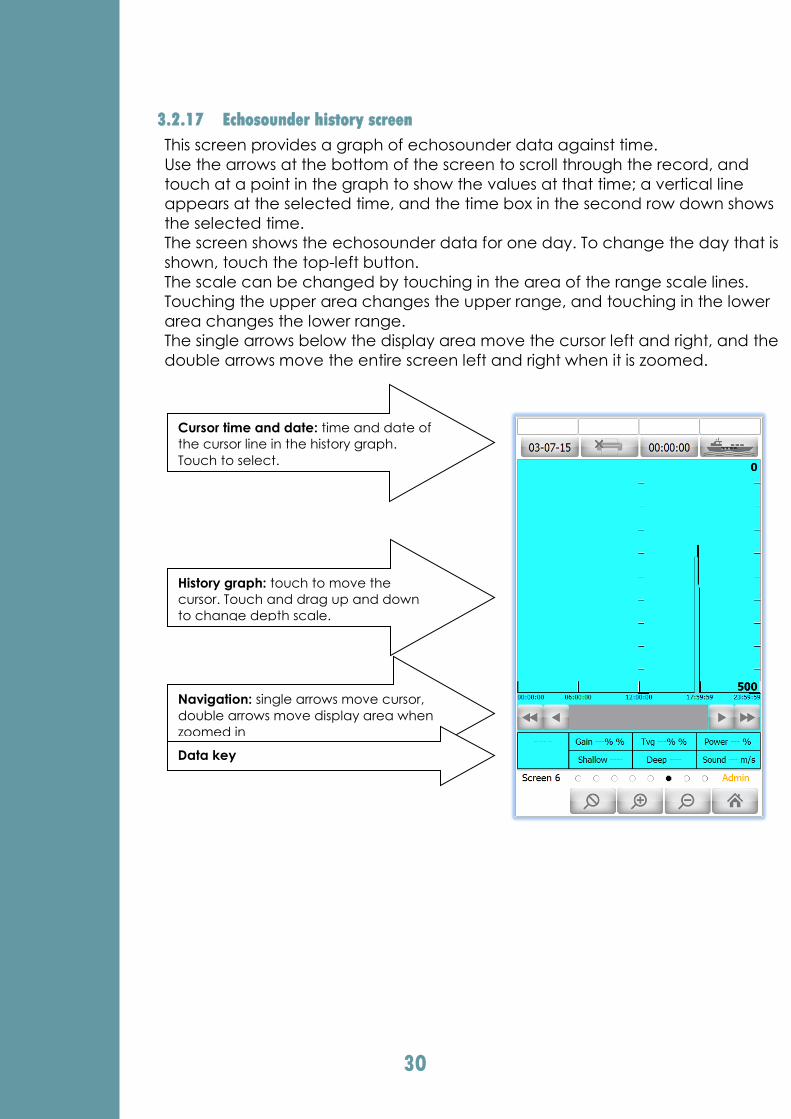
3.2.17 Echosounder history screen
This screen provides a graph of echosounder data against time.
Use the arrows at the bottom of the screen to scroll through the record, and
touch at a point in the graph to show the values at that time; a vertical line
appears at the selected time, and the time box in the second row down shows
the selected time.
The screen shows the echosounder data for one day. To change the day that is
shown, touch the top-left button.
The scale can be changed by touching in the area of the range scale lines.
Touching the upper area changes the upper range, and touching in the lower
area changes the lower range.
The single arrows below the display area move the cursor left and right, and the
double arrows move the entire screen left and right when it is zoomed.
Cursor time and date: time and date of
the cursor line in the history graph.
Touch to select.
History graph: touch to move the
cursor. Touch and drag up and down
to change depth scale.
Navigation: single arrows move cursor,
double arrows move display area when
zoomed in
Data key
31
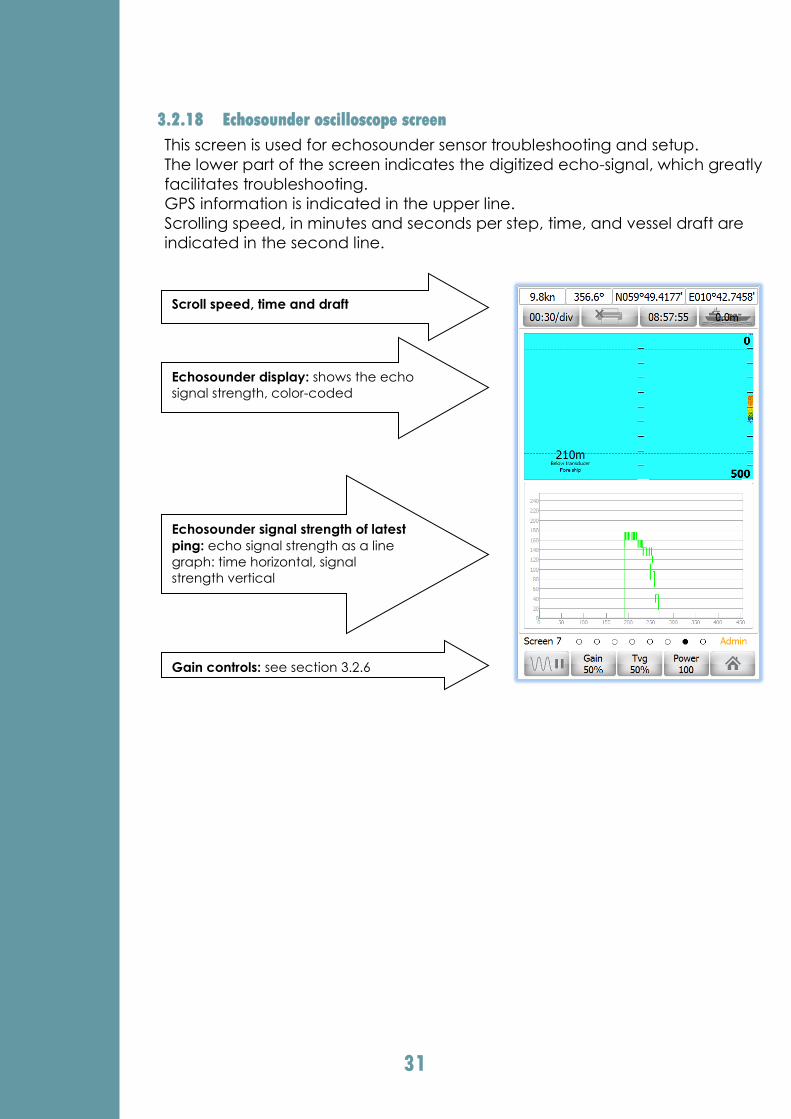
3.2.18 Echosounder oscilloscope screen
This screen is used for echosounder sensor troubleshooting and setup.
The lower part of the screen indicates the digitized echo-signal, which greatly
facilitates troubleshooting.
GPS information is indicated in the upper line.
Scrolling speed, in minutes and seconds per step, time, and vessel draft are
indicated in the second line.
Echosounder display: shows the echo
signal strength, color-coded
Scroll speed, time and draft
Echosounder signal strength of latest
ping: echo signal strength as a line
graph: time horizontal, signal
strength vertical
Gain controls: see section 3.2.6
32
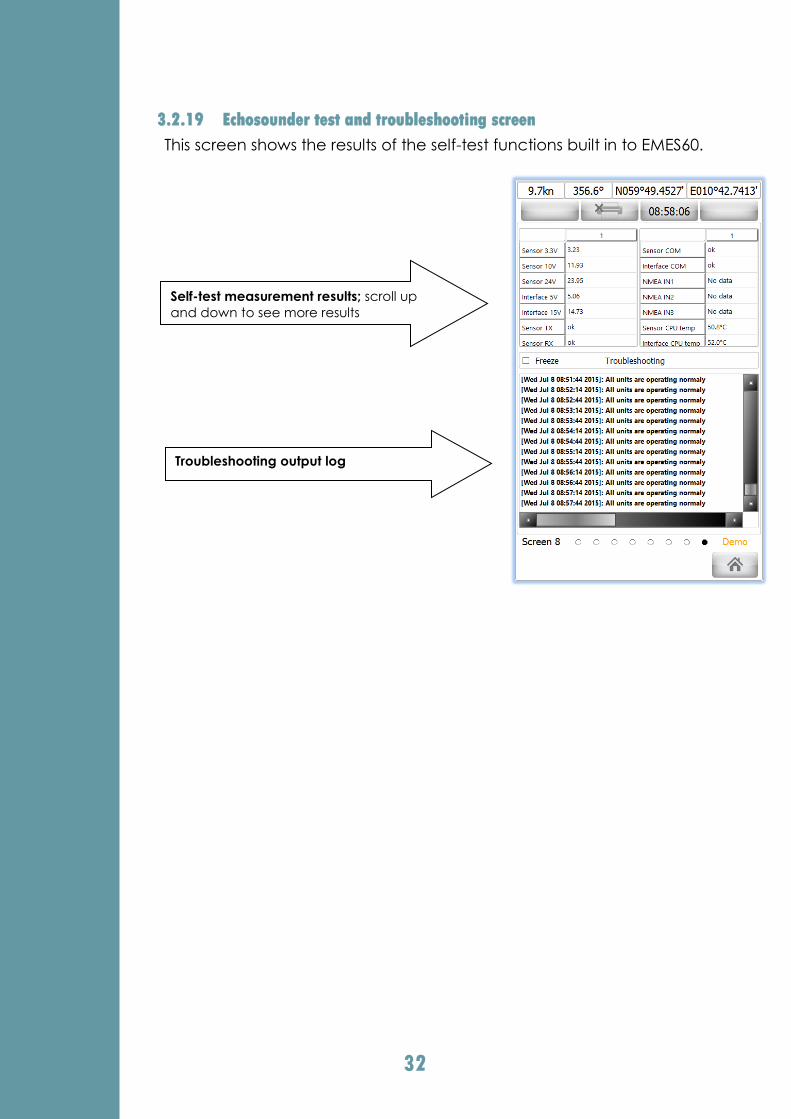
3.2.19 Echosounder test and troubleshooting screen
This screen shows the results of the self-test functions built in to EMES60.
Self-test measurement results; scroll up
and down to see more results
Troubleshooting output log
33
3.3 Speed log
The speed log measures the speed of the vessel through the
water.
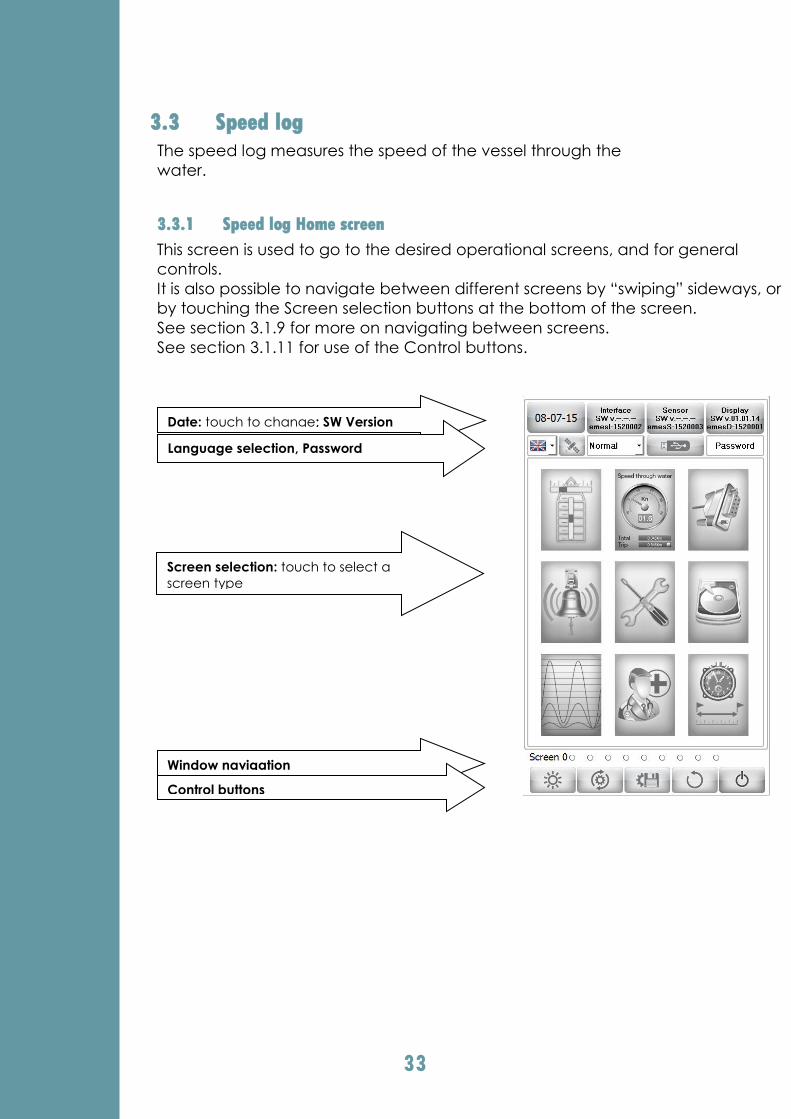
3.3.1 Speed log Home screen
This screen is used to go to the desired operational screens, and for general
controls.
It is also possible to navigate between different screens by “swiping” sideways, or
by touching the Screen selection buttons at the bottom of the screen.
See section 3.1.9 for more on navigating between screens.
See section 3.1.11 for use of the Control buttons.
Date: touch to change; SW Version
Language selection, Password
Screen selection: touch to select a
screen type
Window navigation
Control buttons
34
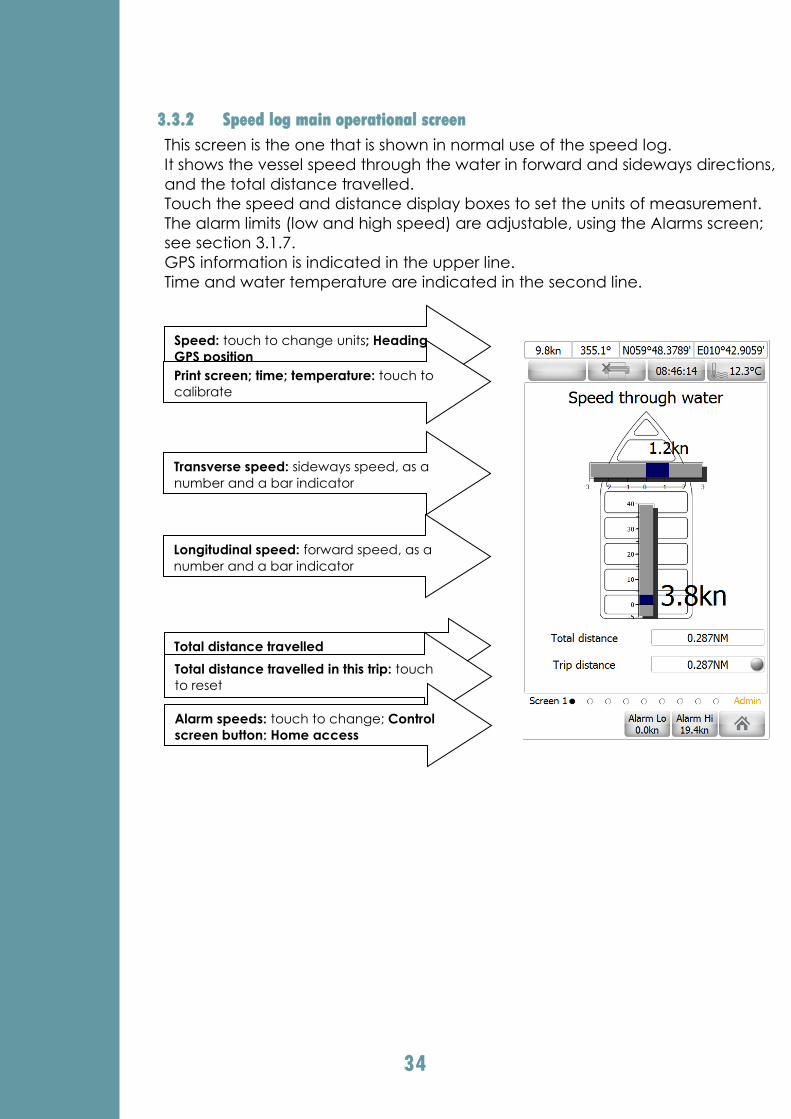
3.3.2 Speed log main operational screen
This screen is the one that is shown in normal use of the speed log.
It shows the vessel speed through the water in forward and sideways directions,
and the total distance travelled.
Touch the speed and distance display boxes to set the units of measurement.
The alarm limits (low and high speed) are adjustable, using the Alarms screen;
see section 3.1.7.
GPS information is indicated in the upper line.
Time and water temperature are indicated in the second line.
Speed: touch to change units; Heading,
GPS position
Print screen; time; temperature: touch to
calibrate
Transverse speed: sideways speed, as a
number and a bar indicator
Longitudinal speed: forward speed, as a
number and a bar indicator
Total distance travelled
Total distance travelled in this trip: touch
to reset
Alarm speeds: touch to change; Control
screen button; Home access
35
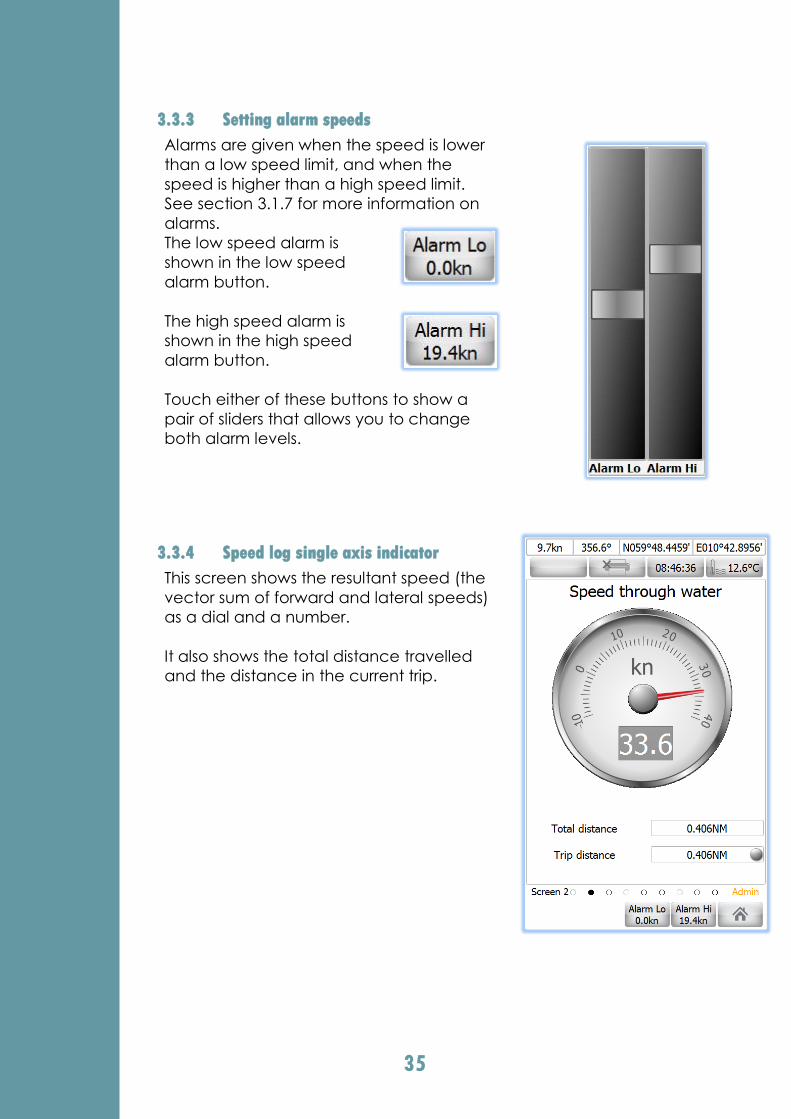
3.3.3 Setting alarm speeds
Alarms are given when the speed is lower
than a low speed limit, and when the
speed is higher than a high speed limit.
See section 3.1.7 for more information on
alarms.
The low speed alarm is
shown in the low speed
alarm button.
The high speed alarm is
shown in the high speed
alarm button.
Touch either of these buttons to show a
pair of sliders that allows you to change
both alarm levels.
3.3.4 Speed log single axis indicator
This screen shows the resultant speed (the
vector sum of forward and lateral speeds)
as a dial and a number.
It also shows the total distance travelled
and the distance in the current trip.

36
3.3.5 Speed log communication screen
This screen is used to verify the incoming and outgoing data through the system
communication lines (NMEA serial and Light Weight Ethernet).
All data can be logged to a file on disk.
It is also used to setup the communication line parameters (UART setting for
NMEA0183, IP address for Light Weight Ethernet).
See section 3.2.13 for details of saving communications data to file.
See section 3.2.14 for details of setting the communications port settings.
Input messages: data messages sent to
the system
Output messages: data messages sent
from the system
Message display controls
Message display controls
Horizontal scroll: touch and drag to see
long messages
Communications port controls
37
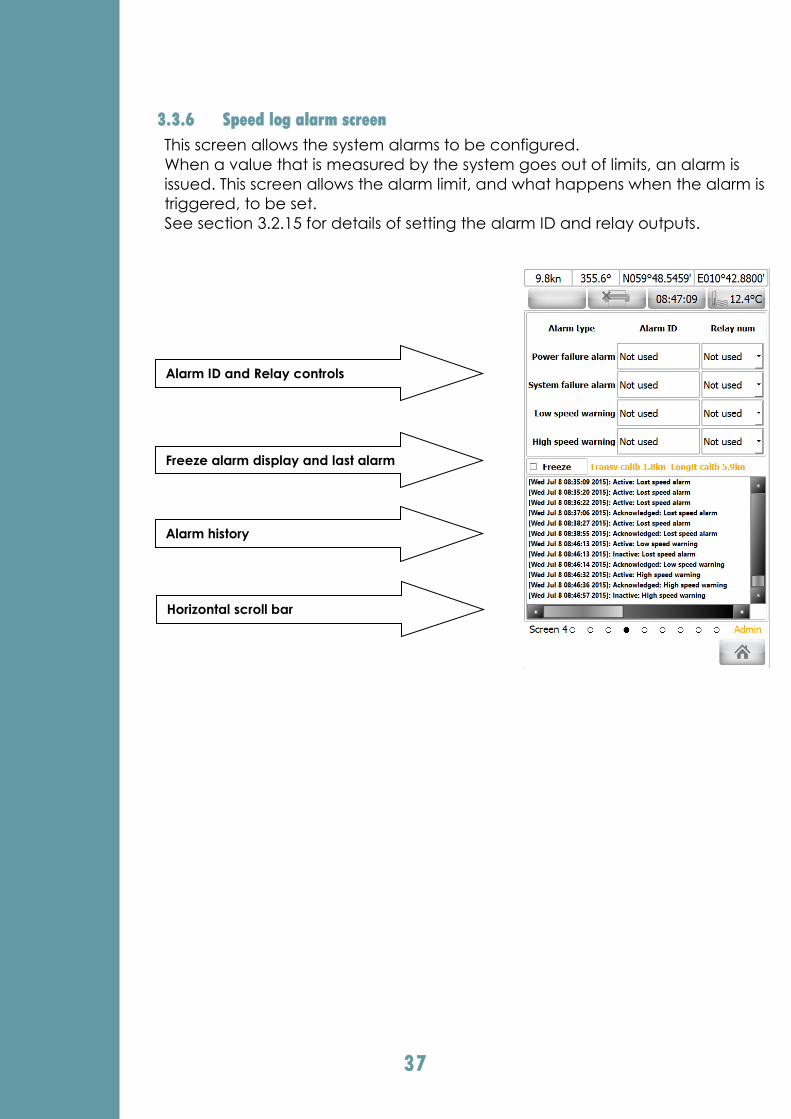
3.3.6 Speed log alarm screen
This screen allows the system alarms to be configured.
When a value that is measured by the system goes out of limits, an alarm is
issued. This screen allows the alarm limit, and what happens when the alarm is
triggered, to be set.
See section 3.2.15 for details of setting the alarm ID and relay outputs.
Alarm ID and Relay controls
Freeze alarm display and last alarm
Alarm history
Horizontal scroll bar
38
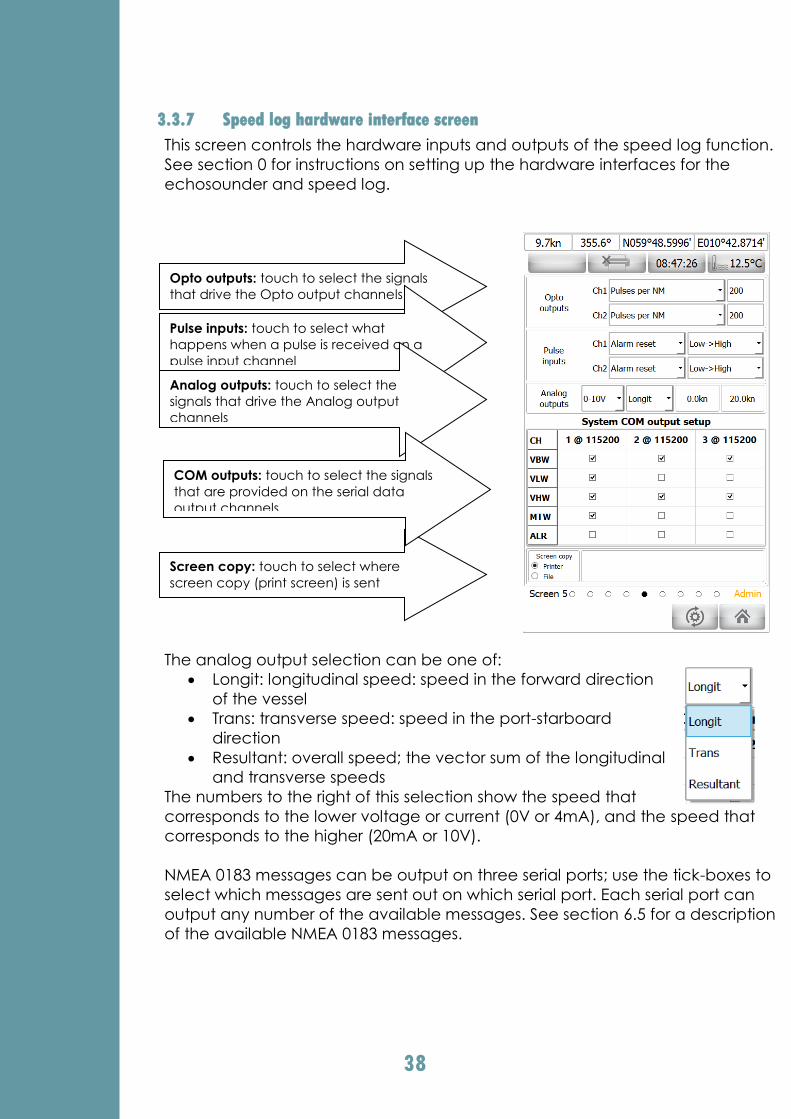
3.3.7 Speed log hardware interface screen
This screen controls the hardware inputs and outputs of the speed log function.
See section 0 for instructions on setting up the hardware interfaces for the
echosounder and speed log.
The analog output selection can be one of:
Longit: longitudinal speed: speed in the forward direction
of the vessel
Trans: transverse speed: speed in the port-starboard
direction
Resultant: overall speed; the vector sum of the longitudinal
and transverse speeds
The numbers to the right of this selection show the speed that
corresponds to the lower voltage or current (0V or 4mA), and the speed that
corresponds to the higher (20mA or 10V).
NMEA 0183 messages can be output on three serial ports; use the tick-boxes to
select which messages are sent out on which serial port. Each serial port can
output any number of the available messages. See section 6.5 for a description
of the available NMEA 0183 messages.
Opto outputs: touch to select the signals
that drive the Opto output channels
Pulse inputs: touch to select what
happens when a pulse is received on a
pulse input channel
Analog outputs: touch to select the
signals that drive the Analog output
channels
Screen copy: touch to select where
screen copy (print screen) is sent
COM outputs: touch to select the signals
that are provided on the serial data
output channels
39
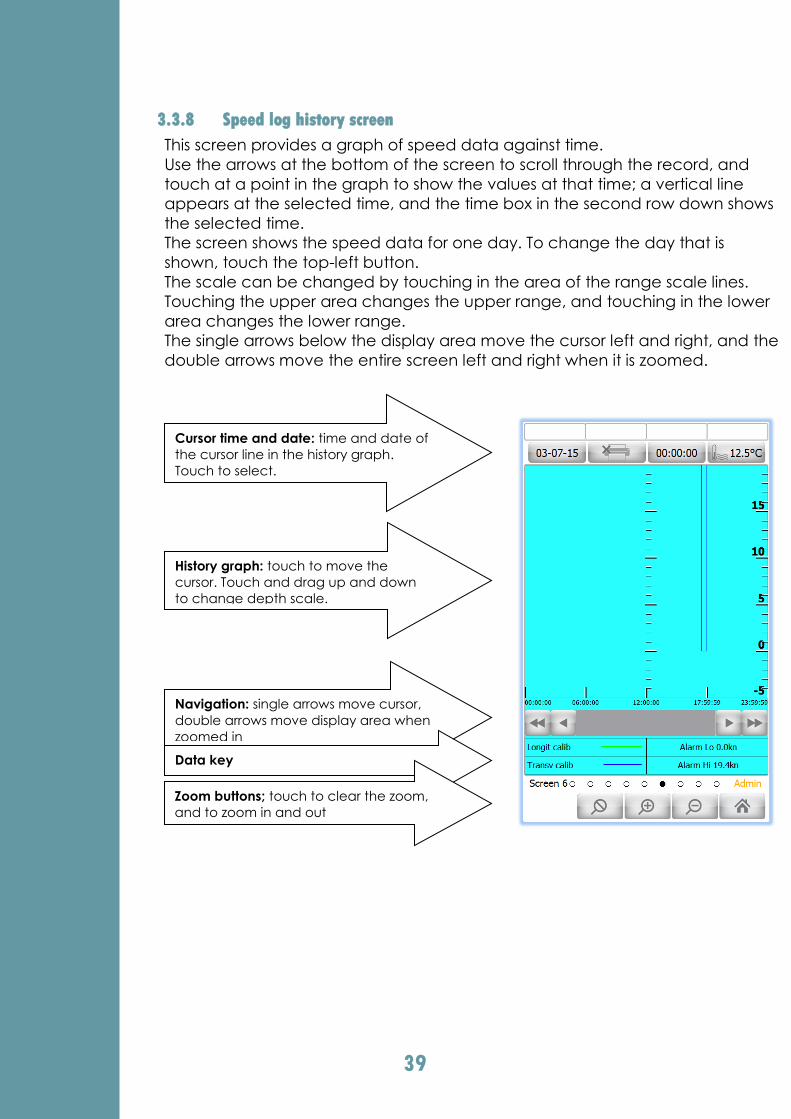
3.3.8 Speed log history screen
This screen provides a graph of speed data against time.
Use the arrows at the bottom of the screen to scroll through the record, and
touch at a point in the graph to show the values at that time; a vertical line
appears at the selected time, and the time box in the second row down shows
the selected time.
The screen shows the speed data for one day. To change the day that is
shown, touch the top-left button.
The scale can be changed by touching in the area of the range scale lines.
Touching the upper area changes the upper range, and touching in the lower
area changes the lower range.
The single arrows below the display area move the cursor left and right, and the
double arrows move the entire screen left and right when it is zoomed.
Cursor time and date: time and date of
the cursor line in the history graph.
Touch to select.
History graph: touch to move the
cursor. Touch and drag up and down
to change depth scale.
Navigation: single arrows move cursor,
double arrows move display area when
zoomed in
Data key
Zoom buttons; touch to clear the zoom,
and to zoom in and out
40
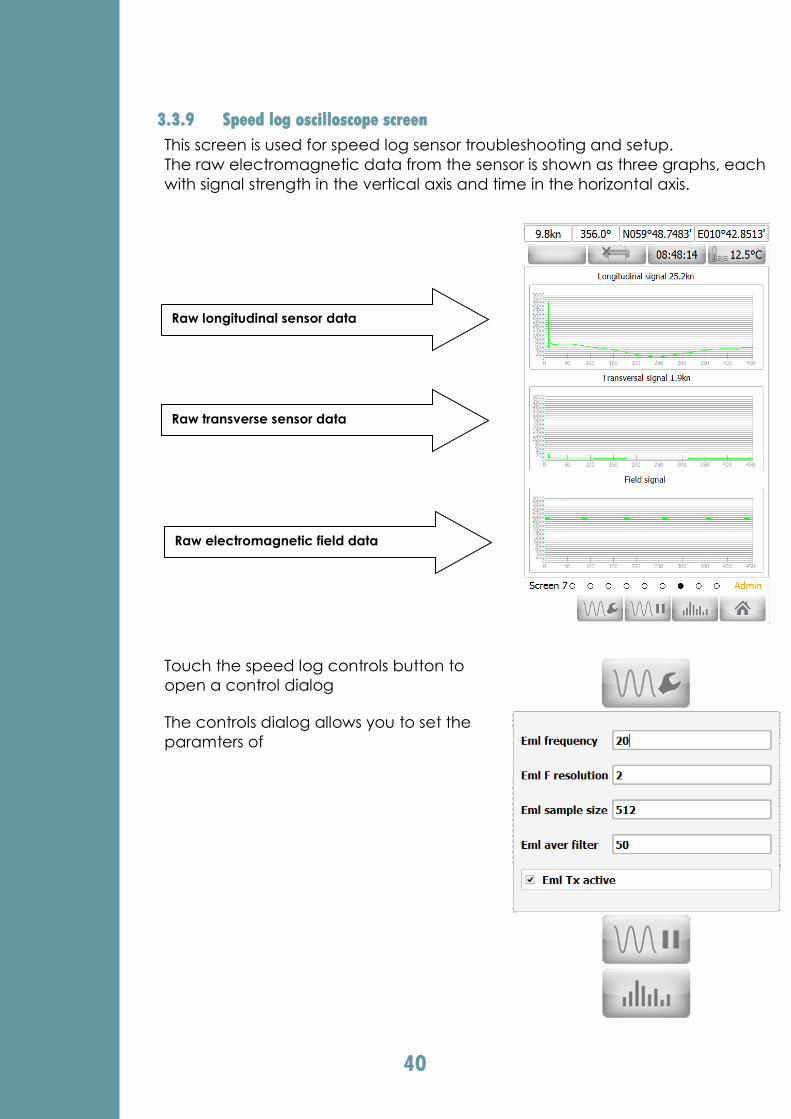
3.3.9 Speed log oscilloscope screen
This screen is used for speed log sensor troubleshooting and setup.
The raw electromagnetic data from the sensor is shown as three graphs, each
with signal strength in the vertical axis and time in the horizontal axis.
Touch the speed log controls button to
open a control dialog
The controls dialog allows you to set the
paramters of
Raw longitudinal sensor data
Raw transverse sensor data
Raw electromagnetic field data

41
3.3.10 Speed log test and troubleshooting screen
This screen shows the results of the self-test functions built in to EMES60.
Self-test measurement results; scroll up
and down to see more results
Troubleshooting output log
42
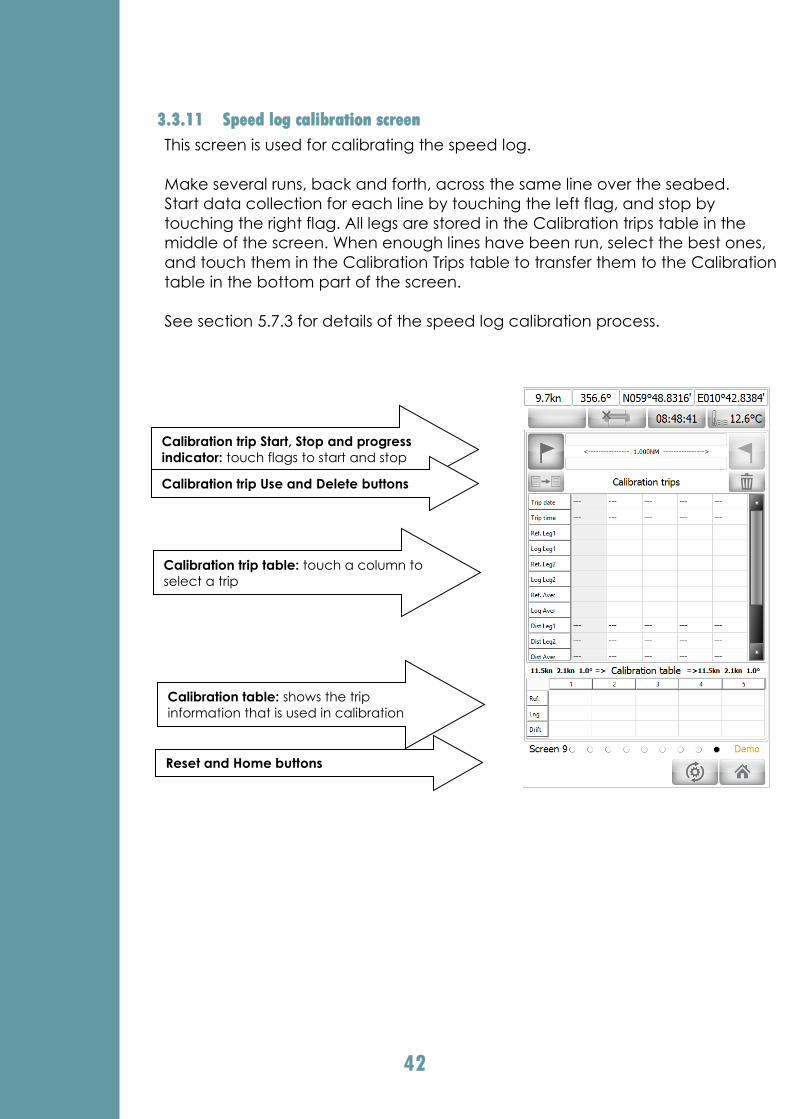
3.3.11 Speed log calibration screen
This screen is used for calibrating the speed log.
Make several runs, back and forth, across the same line over the seabed.
Start data collection for each line by touching the left flag, and stop by
touching the right flag. All legs are stored in the Calibration trips table in the
middle of the screen. When enough lines have been run, select the best ones,
and touch them in the Calibration Trips table to transfer them to the Calibration
table in the bottom part of the screen.
See section 5.7.3 for details of the speed log calibration process.
Calibration trip Start, Stop and progress
indicator: touch flags to start and stop
Calibration trip table: touch a column to
select a trip
Calibration trip Use and Delete buttons
Calibration table: shows the trip
information that is used in calibration
Reset and Home buttons
43
4 Maintenance
EMES60 is very simple and robust, and needs very little regular
maintenance. However, the following instructions should help to
keep an EMES60 system accurate and operational.
4.1 Precautions
4.1.1 Operation in Air
The transducer may be damaged by prolonged operation in air.
After the initial dockyard installation tests, and before dry-docking,
make sure that the system is disconnected from the electrical
power supply.
4.1.2 Sensor Head
Do not open the sensor head. There are no user-serviceable parts
inside.
4.2 Tests and Checks
Run the following tests and checks after Installation and at regular
test intervals.
4.2.1 Safety check
Inspect all components of the system for safety, including:
Ensure that all electrical supplies are intact and
undamaged
Ensure that all cables are properly fixed down
Check for water leaks around the valve assembly
4.2.2 Connector checks
Check the state of all cables and connectors. Loose or damaged
cables and connectors are probably the most common source of
system problems.
4.2.3 Electronic Unit Checks
Check the state of the electronic unites.
Ensure that the electronic unites are firmly fixed in place
Check that the cable glands are still holding the cables
firmly and that their rubber seals are intact, undamaged
and not starting to “perish”
Check for corrosion inside and out
Check that all the pluggable terminal blocks are still firmly in
place
Check that all of the terminal block screws that hold the
wires in place are still done up tightly
44
Check and replace if necessary the silica gel packs inside
the electronic unites
4.2.4 Inspect transducer for marine growth
Marine growth on the surface of the transducer will reduce its
efficiency and degrade the accuracy. All such marine growth
should be removed as gently as possible: do not use sharp tools or
mechanical grinders; otherwise, the transducer face can be
damaged.
Pay particular attention to the electromagnetic speed log
electrodes, which are small steel fixings in the face of the
transducer head; they must be clean and untarnished. Carefully
remove any tarnishing, corrosion, or marine growth from these
electrodes using fine abrasive sheet or wire wool, making sure not
to damage the surrounding plastic of the sonar transducer.
4.2.5 Corrosion check
Check all items for corrosion.
4.2.6 Cleaning
Clean the HMI screens and electronics systems:
Electronic unites: use a damp cloth, no solvents.
Display screens: use a soft cloth lightly moistened with a mild
detergent solution, then wipe clean with a soft dry cloth. Do
not use tissue paper, which could scratch the screens.
Sonar assembly: wipe over with a soft cloth lightly moistened
with a mild detergent solution.
4.2.7 Functional checks
The following tests check the function and correct connection of
the EMES60 system.
The LEDs and test points are described in section 6.2.
Test Procedure Checks
for
Expected
Result Sensor Power Unit
Power LEDs
Open the Sensor Power Unit and check
that the power LEDs are lit on both
boards, depending on where the
power source comes from: LD100 (24V
from AC), LD101 (24V from DC). See
section 6.2.2.
Sensor
Power Unit
power
supply
LEDs lit
Sensor Power Unit
Power Test Points
Open the Sensor Power Unit and use a
voltmeter to check the voltage at the
following test points: on both boards:
TP100 (Main 24V Internal Bus), TP10
(Local 5V). See 6.2.3.
Sensor
Power Unit
power
supply
Voltages are
within
permitted
ranges
45
Test Procedure Checks
for
Expected
Result Interface Unit
Power LEDs
Open the Interface Unit and check
that the following LEDs are lit,
depending on which power sources
are connected: LD100 (power from AC
mains), LD101 (power from DC). See
6.2.5.
IU power
supply
LEDs lit
Interface Unit
Power Test Points
Open the Interface Unit and use a
voltmeter to check the voltage at the
following test points: TP100 (24V), TP101
(3.3V), TP102 (5V). See 6.2.6.
Interface
Unit power
supply
Voltages are
within
permitted
ranges
Compass input Start up one of the HMI screens. Look
at the Summary Data items at the top
of the screen (3.1.2). Check that the
heading shown matches the
heading shown by another reliable
heading source on the vessel.
Repeat with the other HMI.
Heading
input
Heading shown
matches that
from another
heading
source within 2°
Position input Start up one of the HMI screens. Look
at the Summary Data items at the top
of the screen (3.1.2). Check that the
position shown matches the
position shown by another reliable
heading source on the vessel.
Repeat with the other HMI.
Heading
input
Heading shown
matches that
from another
heading
source within 2°
4.2.8 Routine Tests
The following tests and observations help you to be confident that
the system is working correctly:
HMI Screens
o Put the system into Demo mode (an option in the
Home screens, section 0), and check that the screens
update regularly with the Demo data. Remember to
disable Demo mode after this test.
NMEA data input
o Input NMEA data is echoed to the communications
screens (3.2.12 and 3.3.5); use this screen to check
that the data is being correctly received.
Echosounder
o Compare the echosounder depth with the depth that
you expect from the chart, accounting for tide
o Look at the Echosounder oscilloscope screen (section
3.2.18) to check that the history of echosounder
values looks reasonable for the seabed type, and the
echo strengths are neither too weak nor too strong.
o Inspect the results of the self-test processes provided
in the Echosounder test and troubleshooting screen,
(3.2.19)
Speed log

46
o Compare the speed log speed with the GPS speed,
which is shown in the top-left corner of most HMI
screens. Any difference in the two speeds should be
related to water currents.
o Check that the history of speeds in the speed log
history screen (3.3.8) matches what you know of the
recent movements of the vessel
o Inspect the results of the self-test processes provided
in the speed log test and troubleshooting screen
(3.3.10).

47
4.3 Troubleshooting
The following suggestions may help to cure any problems with the
system.
Problem Possible
Cause
Test Cure
No GPS or heading
information in the
top bar of the HMI
screens. (No data
from ship’s GPS or
compass).
No output data Inspect communication
screens for input data
(3.2.12).
Turn on ship’s
outputs.
Loose input
wiring
Check input wiring and
ship’s GPS and compass
output
Fix loose cabling.
Input data rate
and format
settings wrong
Check communications
port protocols in
communication screens
(3.2.12 and 3.3.5)
Enter correct
port protocols
Display units are
wrong (e.g. mph
instead of knots)
Wrong units
selected
Touch the value affected
on the screen. A units
selection box should
appear.
Select the
correct units.
False alarms
generated
Alarm limits are
too tight
Check the alarm limits
(3.1.8)
Set correct
alarm limits
HMI displays too dim
or too bright
Day or night
mode selected
at the wrong
time
Go to the Home screen
(0) and select the required
day/night display mode in
the bottom-left corner of
the screen
Correct
day/night mode
used
Can’t set some of
the operation
parameters
Unit is not in
Administrator
mode
Some settings can only be
changed in Administrator
mode. See 3.1.13.
Set Administrator
mode to
change settings.
Echosounder depth
wrong
Wrong depth
origin selected
Check the depth origin
(e.g. “Below Transducer”)
shown in the echosounder
displays. Touch this to
change the origin. See
3.2.11.
Depth origin set
to the value that
you expect.
Draft offset
wrong
See 3.2.10 to inspect and
set the offset
Correct draft
offset used
Transmitter
power and
gains too weak
or strong
See 3.2.9. Correct power
and gains used
for the current
conditions
Sound speed
wrong: sound
speed problem
Check water temperature
in the speed log screens
Problem with
sound speed
identified
Sound speed
wrong: sound
speed not
corrected
Touch the sound speed
display, and use the slider
that appears to enter the
sound speed measured
by another sensor
Sound speed
calibrated
against an
external sensor
Marine growth
on sensor head
Inspect the face of the
sensor (requires dry dock
removal of sensor head, or
diver). See 4.2.4.
Clean sensor
surface gives
best results
Other problem
with the
echosounder
Look at the echosounder
self-test results screen
(3.2.19)
Helps to identify
problems

48
Problem Possible
Cause
Test Cure
Speed log speeds
wrong
Speed log not
calibrated or
calibrated
wrongly
See section for 5.7.3 for
the speed log calibration
process
Speed log is
correctly
calibrated
Other problem
with the speed
log
Look at the speed log self-
test results screen (3.3.10)
Helps to identify
problems
Speed log
electrodes
tarnished or
corroded
Inspect the face of the
sensor (requires dry dock
removal of sensor head, or
diver). See 4.2.4.
Clean
electrodes give
best results

49
5 Installation
5.1 Parts of the System
Qty Image
5.1.1 HMI Units
HMI touch-screen panel 2
HMI panel fixings 8
HMI panel terminal blocks, 3-way 2
5.1.2 Electronic Units and Cabling
Interface Unit 1
Interface Unit pluggable terminal
blocks
Sensor Power Unit 1
Electronic unit fixing lugs 8
Sensor Power Unit pluggable
terminal blocks
50
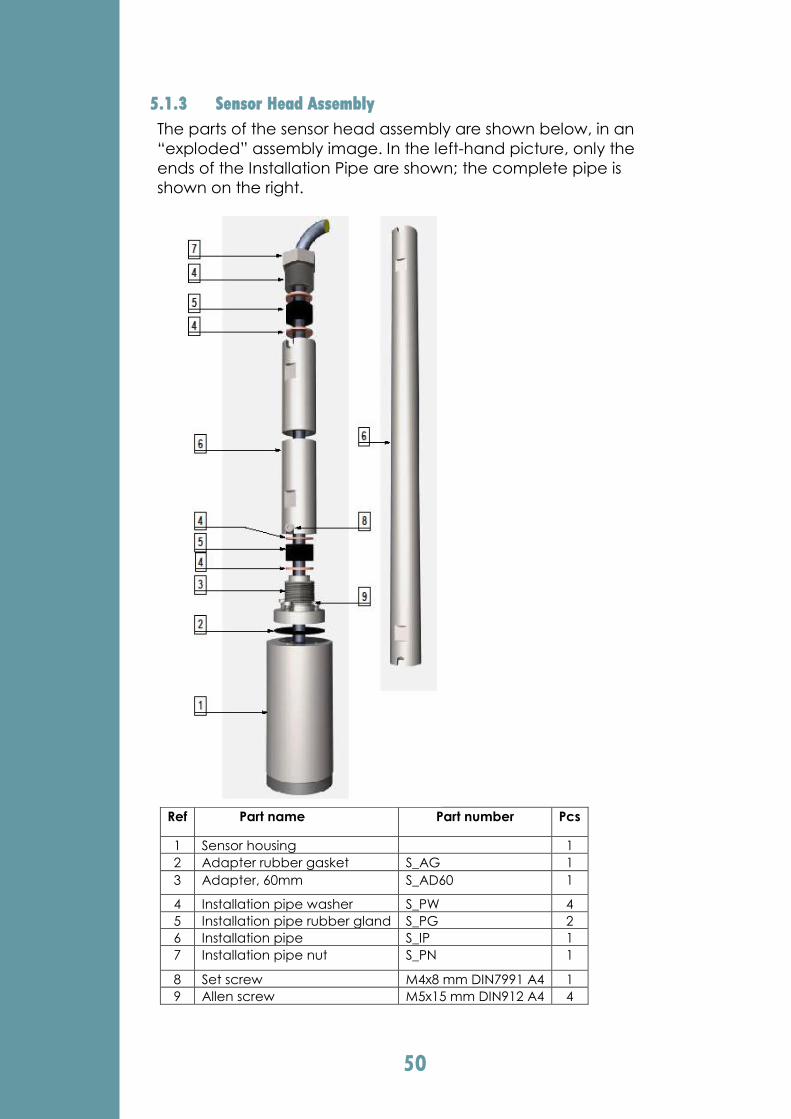
5.1.3 Sensor Head Assembly
The parts of the sensor head assembly are shown below, in an
“exploded” assembly image. In the left-hand picture, only the
ends of the Installation Pipe are shown; the complete pipe is
shown on the right.
Ref Part name Part number Pcs
1 Sensor housing 1
2 Adapter rubber gasket S_AG 1
3 Adapter, 60mm S_AD60 1
4 Installation pipe washer S_PW 4
5 Installation pipe rubber gland S_PG 2
6 Installation pipe S_IP 1
7 Installation pipe nut S_PN 1
8 Set screw M4x8 mm DIN7991 A4 1
9 Allen screw M5x15 mm DIN912 A4 4
51
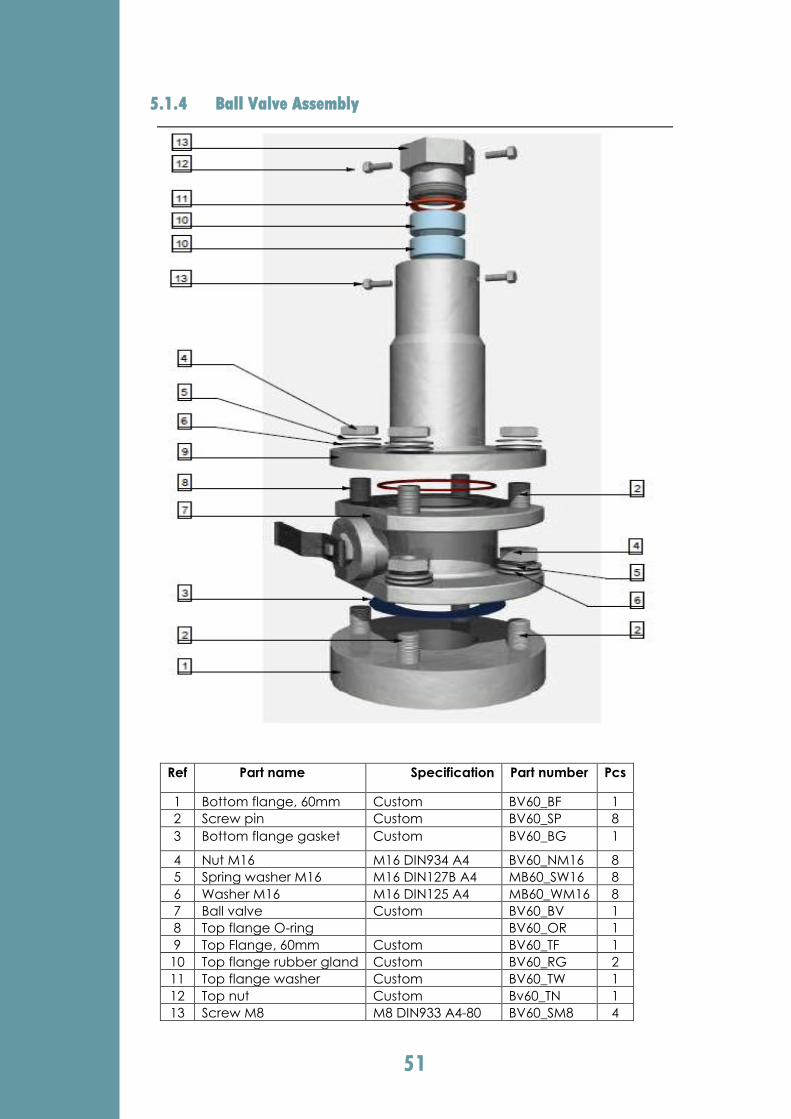
5.1.4 Ball Valve Assembly
Ref Part name Specification Part number Pcs
1 Bottom flange, 60mm Custom BV60_BF 1
2 Screw pin Custom BV60_SP 8
3 Bottom flange gasket Custom BV60_BG 1
4 Nut M16 M16 DIN934 A4 BV60_NM16 8
5 Spring washer M16 M16 DIN127B A4 MB60_SW16 8
6 Washer M16 M16 DIN125 A4 MB60_WM16 8
7 Ball valve Custom BV60_BV 1
8 Top flange O-ring BV60_OR 1
9 Top Flange, 60mm Custom BV60_TF 1
10 Top flange rubber gland Custom BV60_RG 2
11 Top flange washer Custom BV60_TW 1
12 Top nut Custom Bv60_TN 1
13 Screw M8 M8 DIN933 A4-80 BV60_SM8 4
52
5.2 Mounting the Sensor on the Vessel
The sensor must be mounted in a water-tight valve or tank, so that
the face of the sensor is flush with the surface of the hull. This is
important in order to minimize turbulence around the sensor face.
The sensor should be mounted:
Where there is space on the inside of the hull to access the
unit for installation and maintenance of the sensor
On a section of the hull that is flat and horizontal, and large
enough to ensure laminar flow over the sensor face
With the transducer face as horizontal as possible: within ±1°
As close to the vessel’s centerline as possible
As far forward on the vessel as possible, ideally just behind
the bulbous bow, and always in the front half of the vessel
As deep as possible, where it remains underwater at all
speeds, conditions and vessel loadings
Away from sources of turbulence or entrained air bubbles in
all weathers, speeds and vessel loadings. Avoid:
o Bow thrusters
o Objects that protrude from the hull
Where risk of damage, for example from anchor chains, is
minimized
It may be necessary to modify the hull to provide a horizontal
mounting surface. If this is done, make sure that any welds are
smoothed off to minimize turbulence.
Make sure that the direction markings on the sensor match the
forward direction of the vessel.
Before any welding:
Remove O-rings and any parts that may be damaged by
heat
After welding:
Grind down to ensure a flush finish
Paint the fitting and hull with anti-corrosion and anti-fouling paint,
but do not paint the active surface of the sensor.
53
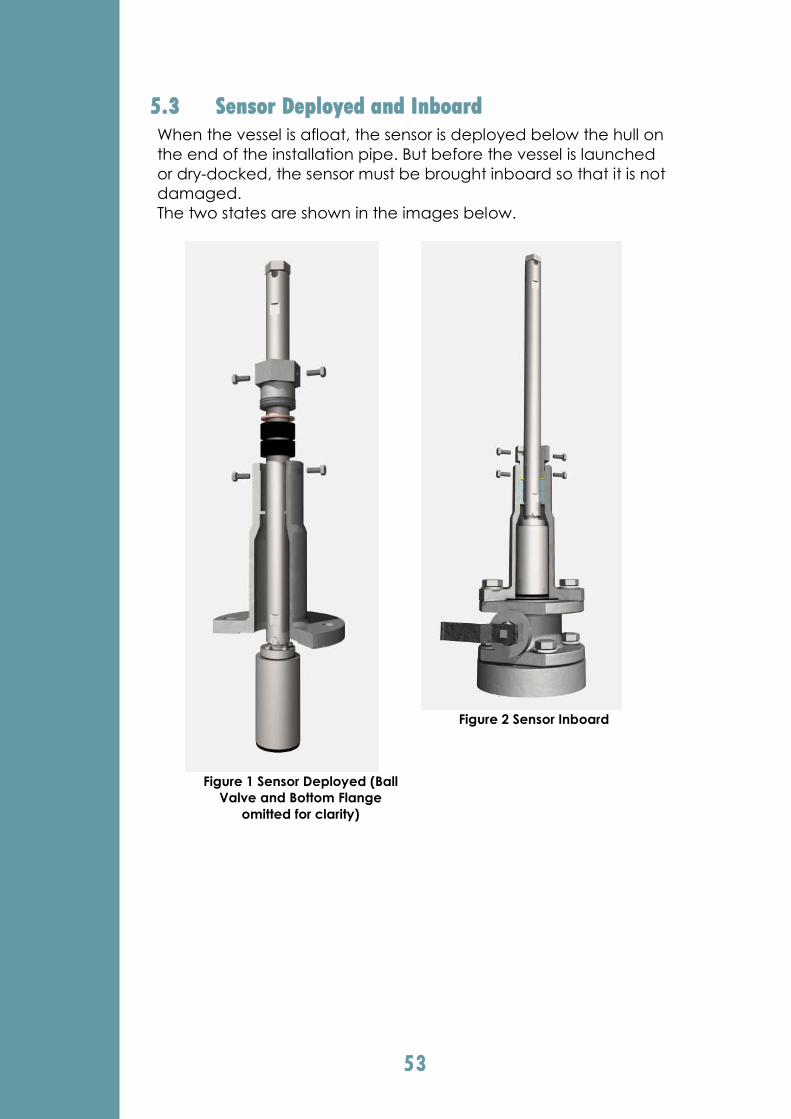
5.3 Sensor Deployed and Inboard
When the vessel is afloat, the sensor is deployed below the hull on
the end of the installation pipe. But before the vessel is launched
or dry-docked, the sensor must be brought inboard so that it is not
damaged.
The two states are shown in the images below.
Figure 1 Sensor Deployed (Ball
Valve and Bottom Flange
omitted for clarity)
Figure 2 Sensor Inboard

54
5.3.1 Installing the sensor in the valve
EMES60 is usually mounted in the Sensor Head Assembly, (shown in
5.1.3 above), which is then fitted into the Ball Valve Assembly
(5.1.4).
5.3.2 Cautions
Take care not to damage the inner surfaces of the valve; do
not attempt to lift the valve by passing rope, strops or chain
through the valve.
Do not paint the surface of the sensor.
Any modifications made to the vessel to fit the valve may
require approval of the appropriate classification body.
5.3.3 Fitting the Bottom Flange to the hull
The Bottom Flange is welded to the hull, and the rest of the
assembly is fixed to the Bottom Flange. See section 6.4.1 for a
drawing of the Bottom Flange.
To fit the Bottom Flange to the hull:
Disassemble the Bottom Flange from the valve assembly
Cut a 187mm diameter hole in the hull
Weld the flange to the hull
Grind down the weld to ensure a flush finish
Paint the flange and hull with anti-corrosion and anti-fouling
paint
Check that the inner and top surfaces of the Bottom Flange
are free from dirt, swarf, paint, etc.
Caution: when welding the bottom flange to the hull:
Protect the machined bottom and inner surfaces from
damage and debris. Damaged or dirty surfaces may not
give a good water seal.

55
Do not allow the flange to over-heat; allow cooling time,
particularly when welding to thick hull plates or stainless
steel parts.
Ensure that the welder is suitably qualified and certified.
5.3.4 Assembling the Sensor Head Assembly
The Sensor Head Assembly is deployed inside the Ball Valve
Assembly. The Sensor Head Assembly must be assembled first.
An exploded view of the Sensor Head Assembly is shown in 5.1.3
above, and it is shown in cross-section below.
The Sensor Cable is supplied fixed to the top of the Sensor
Housing. Take care not to damage the seal and connection

56
of the cable to the housing; do not lift the housing by the
cable.
Pass the following components over the length of the Sensor
Cable, in the following order, referring to the diagram
above to check which way round the parts are fitted:
o Adapter Rubber Gasket [2]
o Adapter, 60mm [3]
o Installation Pipe Washer [4]
o Installation Pipe Rubber Gland [5]
o Installation Pipe Washer [4]
o The Installation Pipe [6]
o Installation Pipe Washer [4]
o Installation Pipe Rubber Gland [5]
o Installation Pipe Washer [4]
o Installation Pipe Nut [7]
Place the Adapter Rubber Gasket on top of the Sensor
Housing.
Place the Sensor Head Adaptor (60mm) on top of the
Adaptor Rubber Gasket, and fix it to the Sensor Housing
using 4 M5X15mm socket head screws.
Grease the Installation Pipe Washers with silicone grease
type 6014 or equivalent.
Fit the first Installation Pipe Washer on top of the Sensor
Head Adaptor, then the Installation Pipe Rubber Gland, and
finally another Installation Pipe Washer.
Offer the Sensor Head Adaptor, with Sensor Housing fitted to
it, to the end of the Installation Pipe. Carefully turn the pipe
so that the Sensor Head Adaptor screws into the end of the
Pipe. Note that the top Installation Pipe Washer is pushed
against the step inside the pipe, so that the Adaptor Rubber
Gasket is compressed when the pipe is screwed down onto
the Adaptor, thus causing it to bulge outwards and form a
seal against the pipe. This requires 40-50Nm torque.
When the Installation Pipe is fully screwed home over the
Adaptor, lock it in place with an M4x8 mm Set Screw [8],
using 1.5Nm torque, fixed with Loctite 222.
Grease the remaining two Installation Pipe Washers with
silicone grease type 6014 or equivalent.
At the top of the Installation Pipe, fit the Installation Pipe
Washer, Installation Pipe Rubber Gland and the last
Installation Pipe Washer into the end of the Installation Pipe.
Carefully insert the Installation Pipe Nut into the top of the
Installation Pipe, and rotate it so that it screws into the Pipe
and seals the cable at the top of the pipe.
The Sensor Head Assembly is now ready to be fitted into the Ball
Valve Assembly.
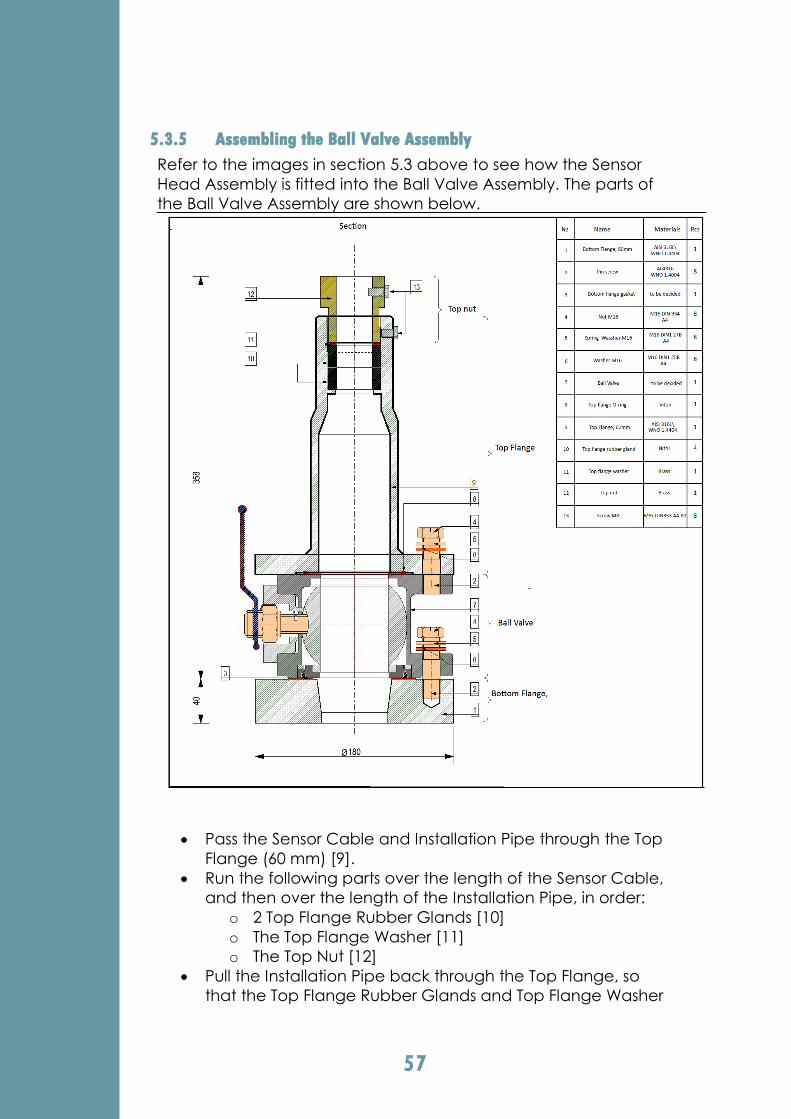
57
5.3.5 Assembling the Ball Valve Assembly
Refer to the images in section 5.3 above to see how the Sensor
Head Assembly is fitted into the Ball Valve Assembly. The parts of
the Ball Valve Assembly are shown below.
Pass the Sensor Cable and Installation Pipe through the Top
Flange (60 mm) [9].
Run the following parts over the length of the Sensor Cable,
and then over the length of the Installation Pipe, in order:
o 2 Top Flange Rubber Glands [10]
o The Top Flange Washer [11]
o The Top Nut [12]
Pull the Installation Pipe back through the Top Flange, so
that the Top Flange Rubber Glands and Top Flange Washer
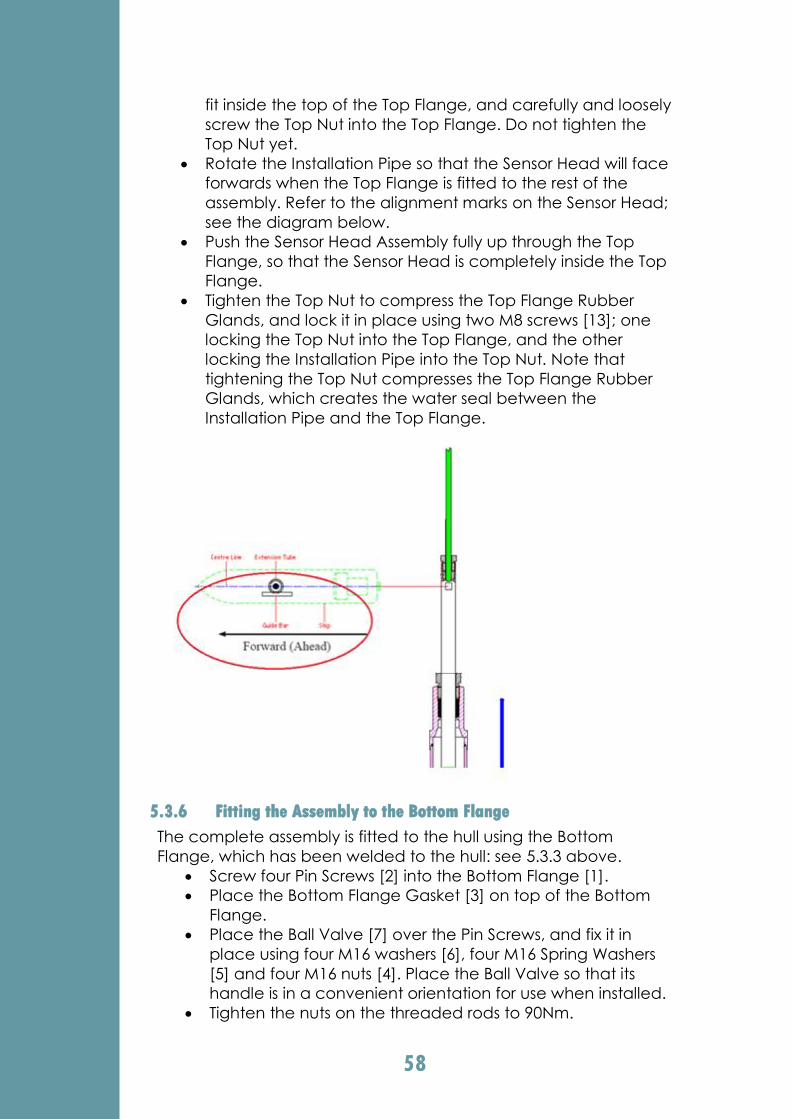
58
fit inside the top of the Top Flange, and carefully and loosely
screw the Top Nut into the Top Flange. Do not tighten the
Top Nut yet.
Rotate the Installation Pipe so that the Sensor Head will face
forwards when the Top Flange is fitted to the rest of the
assembly. Refer to the alignment marks on the Sensor Head;
see the diagram below.
Push the Sensor Head Assembly fully up through the Top
Flange, so that the Sensor Head is completely inside the Top
Flange.
Tighten the Top Nut to compress the Top Flange Rubber
Glands, and lock it in place using two M8 screws [13]; one
locking the Top Nut into the Top Flange, and the other
locking the Installation Pipe into the Top Nut. Note that
tightening the Top Nut compresses the Top Flange Rubber
Glands, which creates the water seal between the
Installation Pipe and the Top Flange.
5.3.6 Fitting the Assembly to the Bottom Flange
The complete assembly is fitted to the hull using the Bottom
Flange, which has been welded to the hull: see 5.3.3 above.
Screw four Pin Screws [2] into the Bottom Flange [1].
Place the Bottom Flange Gasket [3] on top of the Bottom
Flange.
Place the Ball Valve [7] over the Pin Screws, and fix it in
place using four M16 washers [6], four M16 Spring Washers
[5] and four M16 nuts [4]. Place the Ball Valve so that its
handle is in a convenient orientation for use when installed.
Tighten the nuts on the threaded rods to 90Nm.

59
Screw four Pin Screws [2] into the top of the Ball Valve.
Place the Gasket [3] on top of the Ball Valve
Check that the Sensor Head will face forwards when the
Top Flange is fitted to the Ball Valve; if necessary, loosen the
Top Nut and locking screws to allow the Installation Pipe to
be rotated.
Place the Top Flange, with the Sensor Head Assembly inside
it, over the Pin Screws on the top of the Ball Valve, and fix it
in place using four M16 washers [6], four M16 Spring
Washers [5] and four M16 nuts [4]. Take care not to
damage the sensor’s active surface when lowering the
assembly onto the Ball Valve.
Tighten the nuts on the threaded rods to 95Nm.
Loosen the Top Nut and locking screws to free the Sensor
Head Assembly, but take care that the Sensor Head
assembly does not fall.
Carefully lower the Sensor Head using the Installation Pipe
until it stops. Check that it is flush with the hull, and facing
forwards.
Lift the Installation Pipe again until it stops, so that the Sensor
Head is inside the Top Flange.
Tighten the Top Nut and locking screws to hold the Sensor
Head Assembly in place.
Turn the handle on the Ball Valve to close it. This will protect
the Sensor Head when the vessel is launched.
5.3.7 Checks after assembly
Visually check the assembly for water-tightness.
Check that there are no particles of dirt, metal swarf, etc.,
inside the assembly. These could affect water-tightness.
5.3.8 When the vessel is afloat
Prepare the system for operation when the vessel is afloat after
dry-docking as follows.
Turn the handle on the Ball Valve to open it.
Loosen the Top Nut and locking screws to free the Sensor
Head Assembly. This will also allow any air inside the
assembly to be expelled; look out for water leaking
between the Installation Pipe and Top Nut when the air has
all been driven out; re-tighten the Top Nut a little if
necessary.
Carefully lower the Sensor Head using the Installation Pipe
until it stops. Take care not to rotate the Installation Pipe, so
that the Sensor Head continues to face forwards.

60
Tighten the Top Nut (to 75Nm) and locking screws to hold
the Sensor Head Assembly in place. Use 1.5Nm torque, and
fix with Loctite 222.
5.3.9 Removing the sensor while the vessel is afloat
The sensor can be removed from the valve while the vessel is
afloat, as follows.
Caution: loosen nuts gradually, as water pressure may exert large
forces on the sensor assembly. Proceed carefully and look out for
water leaks.
Loosen the Top Nut and locking screws to free the Sensor
Head Assembly.
Lift the Installation Pipe until it stops, so that the Sensor Head
is inside the Top Flange.
Re-tighten the Top Nut and locking screws.
Turn the handle on the Ball Valve to close it.
Remove the M16 nuts and washers that are holding the Top
Flange to Ball Valve.
Carefully lift the Top Flange, with the Sensor Head inside it,
from the top of the Ball Valve.
The Sensor Head can now be accessed by loosening the
Top Nut and locking screws and pushing on the Installation
Pipe.
5.3.10 Re-fitting the sensor while the vessel is afloat
Re-fitting the sensor is very similar to the initial installation (see 5.3.4
above).
Assemble the Sensor Head to the Installation Pipe and Top
Flange with the Sensor Head fully raised, as described
above.
Fit the Top Flange to the Ball Valve, and tighten the Top Nut
and locking screws.
Make sure that the assembly is re-fitted so that the Sensor
Head faces forwards; check the mark on the Sensor Head.
Use the valve handle to let water into the valve.
Carefully undo the Top Nut until water starts to seep out,
and then fully lower the Sensor Head.
Re-tighten the Top Nut (75Nm) and locking screws.
5.3.11 Preparing for dry dock
If the vessel needs to be dry-docked again, loosen the Top
Nut and locking screws, and lift the Sensor Head by 50mm
to protect its active surface.

61
5.3.12 Cathodic protection
Minimize corrosion of the sensor head by fitting a sacrificial anode.
Suitable anode types include SAF24 and SAF12 on steel hulls, and
AG4 or AG4 MC on aluminum hulls.
Regularly inspect the anode and replace it when necessary.
62
5.4 Mounting Electrical Components
The electrical components of the system are:
Sensor Power Unit
o This supplies power to the sensor head and
communicates with the Interface Unit.
o It should be mounted in the forepeak, close to the
sensor, where the cable lengths are no more than 30
meters from the sensor (40 meter cables are available
on request) and no more than 600 meters from the
Interface Unit.
Interface Unit
o This connects the system to the HMI Units and any
other external equipment that needs the speed log or
echosounder information.
o It should be mounted in the bridge area, where the
cable lengths are no more than 600 meters from the
Sensor Power Unit and no more than 100m meters
from the HMI Units and connected external
equipment.
HMI Units
o These provide graphical and numerical readouts of
the speed and depth information from the sensors,
and allow the user to set the control parameters of
the system.
o Two units are provided, both of which can control
and monitor both echosounder and speed log, thus
providing redundancy.
o The HMI units should be mounted in the bridge or
overhead console, where the cable lengths are no
more than 100 meters from the Interface Unit.
External equipment
o EMES60 can be connected to external equipment,
not supplied by Northern Solutions, using standard
data communications protocols and data formats.
o The maximum distance from the Interface Unit to the
external equipment is 500 meters.
5.4.1 Mounting the HMI units
The HMI units need to be mounted in a panel. Prepare a
rectangular hole 138.0 mm wide and 192.0 mm high. The exterior
dimensions of the unit are 149 x 202mm.
33mm depth is needed behind the panel, plus at least 20mm to
allow for air cooling and for the NMEA Adaptor Board.
Note that the HMI unit is used in “portrait” mode, with the long side
vertical.
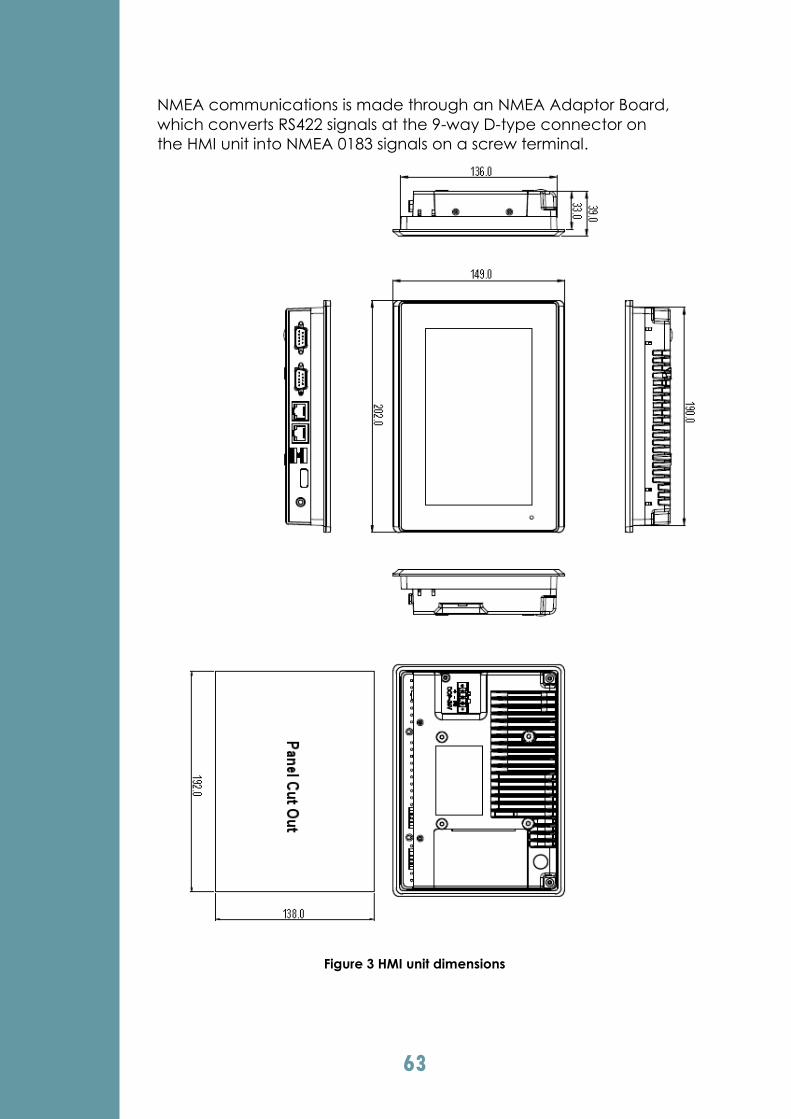
63
NMEA communications is made through an NMEA Adaptor Board,
which converts RS422 signals at the 9-way D-type connector on
the HMI unit into NMEA 0183 signals on a screw terminal.
Figure 3 HMI unit dimensions

64
5.4.2 Mounting Electronic Units
Mount the electronic units with the glands facing downwards, to
minimize the risk of water ingress and ease cable routing.
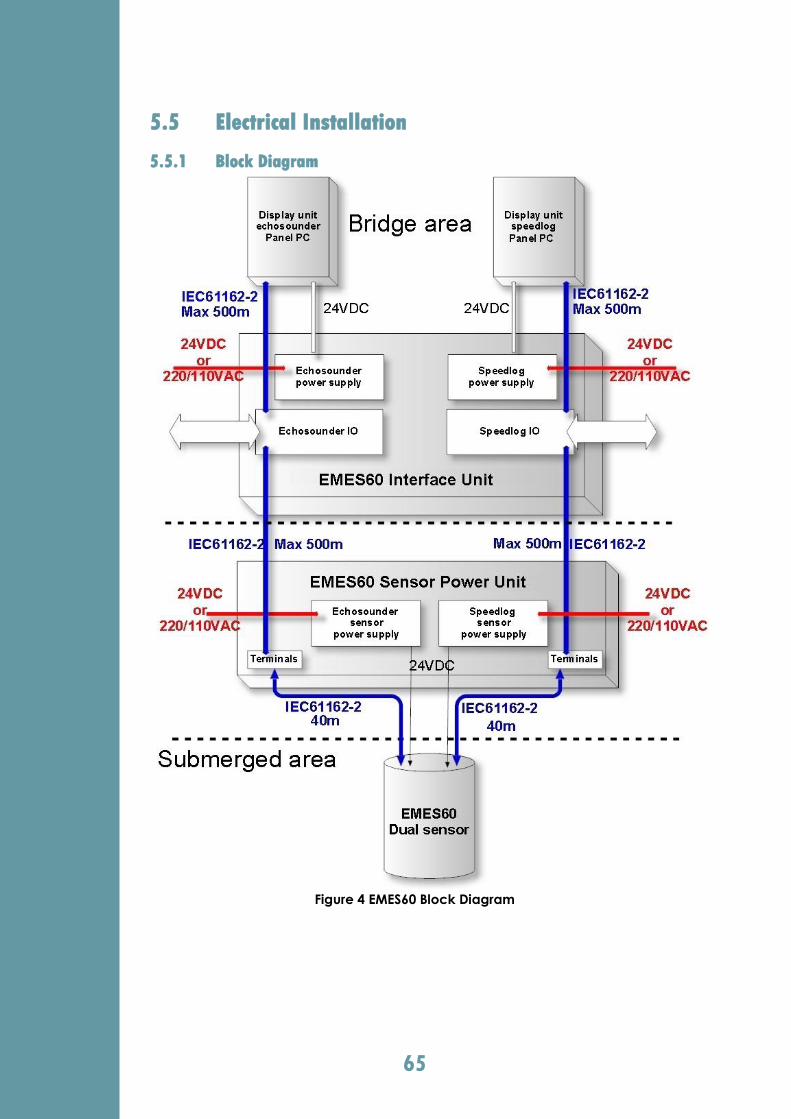
65
5.5 Electrical Installation
5.5.1 Block Diagram
Figure 4 EMES60 Block Diagram

66
5.5.2 Electronic Unit Layouts
In both the Sensor Power Unit and the Interface Unit, the board
handling the echosounder is on the left, and the board handling
the speed log is on the right.
Echo sounder Power Board
Speed log Power Board
Figure 5 Sensor Power Unit boards
Echo sounder Power Board
Speed log Power Board
Figure 6 Interface Unit boards
5.5.3 Cable Diagram
The cables used in the system, with their names, are shown in the
diagram below.

67
The number of cables leading to external equipment depends on
the number of external systems that are required to be connected
to EMES60. In the diagram, IU-Ext1-* means IU-Ext1-1, IU-Ext1-2, IU-
Ext1-3, etc.
Regulations require that the speed log and echosounder sides of
the system must be independent of each other, so they have
separate power and communications connection cables.
HMI 1 HMI 2
Interface Unit
Sensor Power Unit
Sensor
External equipment
External equipment
IU-HMI1 IU-HMI2
IU-Ext1-* IU-Ext2-*SPU-IU
SPU-Sensor
AC PowerSPU-AC-Power1
DC PowerSPU-DC-Power1
AC PowerSPU-AC-Power2
DC PowerSPU-DC-Power2
AC PowerIU-AC-Power1
DC PowerIU-DC-Power1
AC PowerIU-AC-Power2
DC PowerIU-DC-Power2
5.5.4 Cable Types
The types of cable used are: Name Use Construction Supplied
By Power1 Power from ship’s power to
EMES units
Conductor size: 2.5mm2
Configuration: 2 twisted pairs with
individual screens and outer
shield.
Shield type: Overall braided with
drain wire.
Installer
Comms3 Communication signals, 3
twisted pairs
Conductor size: 22 to 18AWG or
0.33 to 0.78mm2 (typical 0.5mm2)
Configuration: 3 twisted pairs with
individual screens and outer
shield.
Shield type: Overall braided with
drain wire.
Capacitance wire to shield <
150pF/m
Installer
Comms4 Communication signals, 4
twisted pairs
As Comms3, but 4 twisted pairs Installer
EMESSensor Custom EMES sensor cable,
supplied with the system
Custom-made
In EMES60
system kit
5.5.5 Cable List
This table lists the cables that are used to connect up the parts of
an EMES60 system.

68
Name From To Cable Max Length
SPU-
Sensor Sensor Sensor Power Unit
EMESSensor: Custom
EMES sensor cable,
supplied with the
system
30m provided as
standard, 40m
available on
request
SPU-DC-
Power1 Power 24VDC
Sensor Power Unit,
side 1 Power1
SPU-AC-
Power1
Power
110/230VAC
Sensor Power Unit,
side 2 Power1
SPU-DC-
Power2 Power 24VDC
Sensor Power Unit,
side 1 Power1
SPU-AC-
Power2
Power
110/230VAC
Sensor Power Unit,
side 2 Power1
SPU-IU Sensor Power
Unit Interface Unit Comms4 600m
IU-DC-
Power1 Power 24VDC Interface Unit, side 1 Power1
IU-AC-
Power1
Power
110/230VAC Interface Unit, side 2 Power1
IU-Ext1-* Interface Unit,
side 1
External equipment
(as many
connections as
required)
Comms4 45m (NMEA 0183
maximum)
IU-Ext2-* Interface Unit,
side 2
External equipment
(as many
connections as
required)
Comms4 45m (NMEA 0183
maximum)
IU-HMI1 Interface Unit HMI unit 1 Comms3 100m
IU-HMI2 Interface Unit HMI unit 2 Comms3 100m
Avoid running communications cables close to electrically noisy
systems and cables.
5.5.6 Pluggable Terminal Block connectors
All cable terminations are made using pluggable
terminal block connectors.
To terminate a cable, simply strip and twist the ends,
insert into the screw terminal, and tighten the screw.
These connectors are supplied with the EMES60 system.
5.5.7 Connection Notes
The following instructions must be followed when connecting up
the EMES60 electronic unites. Failure to do this may reduce the
integrity and robustness of navigation measurements.
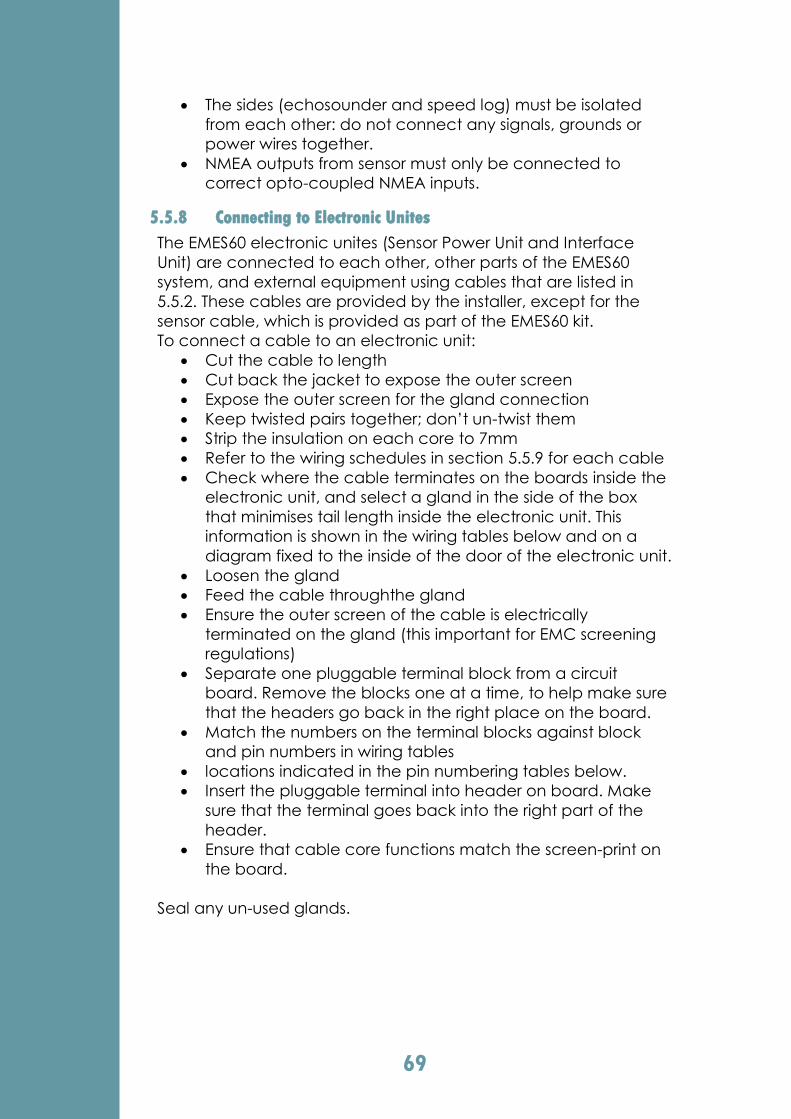
69
The sides (echosounder and speed log) must be isolated
from each other: do not connect any signals, grounds or
power wires together.
NMEA outputs from sensor must only be connected to
correct opto-coupled NMEA inputs.
5.5.8 Connecting to Electronic Unites
The EMES60 electronic unites (Sensor Power Unit and Interface
Unit) are connected to each other, other parts of the EMES60
system, and external equipment using cables that are listed in
5.5.2. These cables are provided by the installer, except for the
sensor cable, which is provided as part of the EMES60 kit.
To connect a cable to an electronic unit:
Cut the cable to length
Cut back the jacket to expose the outer screen
Expose the outer screen for the gland connection
Keep twisted pairs together; don’t un-twist them
Strip the insulation on each core to 7mm
Refer to the wiring schedules in section 5.5.9 for each cable
Check where the cable terminates on the boards inside the
electronic unit, and select a gland in the side of the box
that minimises tail length inside the electronic unit. This
information is shown in the wiring tables below and on a
diagram fixed to the inside of the door of the electronic unit.
Loosen the gland
Feed the cable throughthe gland
Ensure the outer screen of the cable is electrically
terminated on the gland (this important for EMC screening
regulations)
Separate one pluggable terminal block from a circuit
board. Remove the blocks one at a time, to help make sure
that the headers go back in the right place on the board.
Match the numbers on the terminal blocks against block
and pin numbers in wiring tables
locations indicated in the pin numbering tables below.
Insert the pluggable terminal into header on board. Make
sure that the terminal goes back into the right part of the
header.
Ensure that cable core functions match the screen-print on
the board.
Seal any un-used glands.

70
5.5.9 Cable Wiring Schedules
Connect the external cables to the Pluggable Terminal Block
Connectors as follows.
SPU-Sensor
Sensor Power Unit Cable
Core Use
Board Header Terminal
Number
Right-
hand J200
7 orange Log power +
8 black Log power -
9 screen
4 blue Log NMEA out +
5 white Log NMEA out -
6 screen
1 brown Log NMEA in +
2 yellow Log NMEA in -
3 screen
Left-
Hand J200
7 red Echosounder power +
8 black Echosounder power -
9 screen
4 green Echosounder NMEA out
+
5 white Echosounder NMEA out
-
6 screen
1 purple Echosounder NMEA in +
2 yellow Echosounder NMEA in -
3 screen
SPU-DC-Power1
Power
Supply
Sensor Power Unit Cable
Core Use
Board Header Terminal
Number
24V + Left-
hand J101
1 1 24V +
24V - 2 2 24V -
Ground None screen screen
There is no distinction made between AC power “live” and
“neutral”; AC power can be connected either way round.
SPU-AC-Power1
Power
Supply
Sensor Power Unit
Cable Core Use Board Header
Terminal
Number
AC Left-
hand J100
1 1 AC power
Ground 2 yellow/green Ground
AC 3 2 AC power
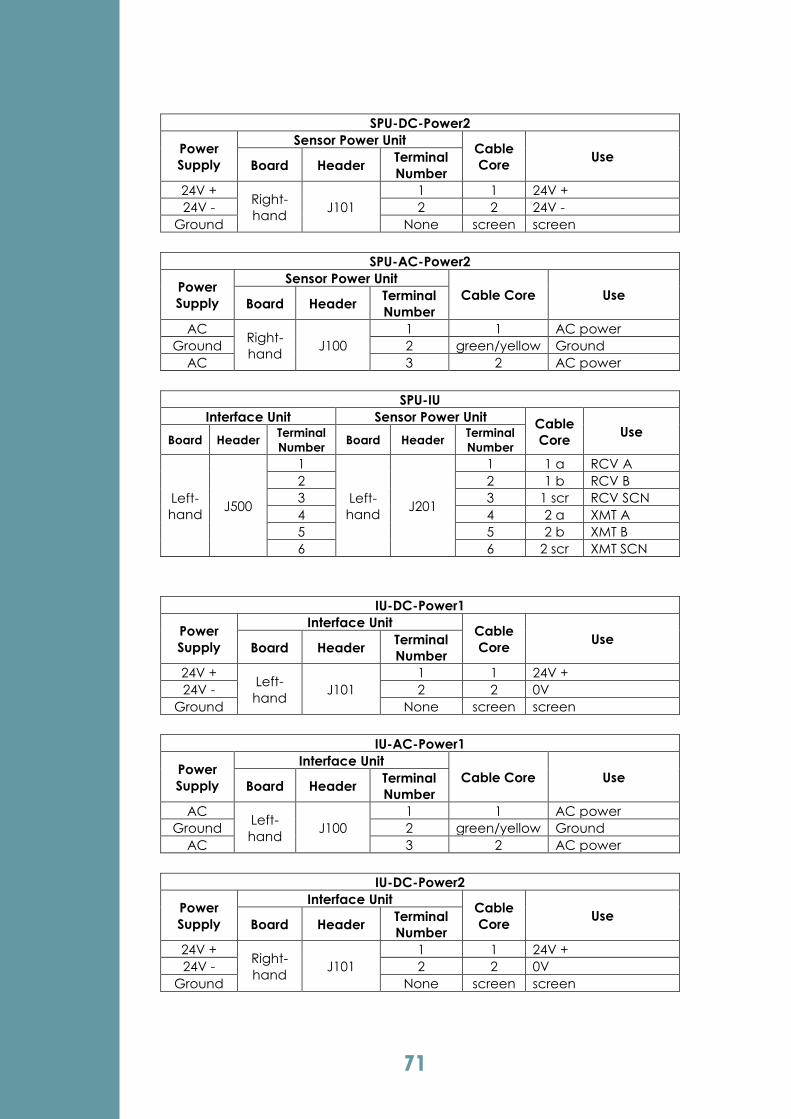
71
SPU-DC-Power2
Power
Supply
Sensor Power Unit Cable
Core Use
Board Header Terminal
Number
24V + Right-
hand J101
1 1 24V +
24V - 2 2 24V -
Ground None screen screen
SPU-AC-Power2
Power
Supply
Sensor Power Unit
Cable Core Use Board Header
Terminal
Number
AC Right-
hand J100
1 1 AC power
Ground 2 green/yellow Ground
AC 3 2 AC power
SPU-IU
Interface Unit Sensor Power Unit Cable
Core Use
Board Header Terminal
Number Board Header
Terminal
Number
Left-
hand J500
1
Left-
hand J201
1 1 a RCV A
2 2 1 b RCV B
3 3 1 scr RCV SCN
4 4 2 a XMT A
5 5 2 b XMT B
6 6 2 scr XMT SCN
IU-DC-Power1
Power
Supply
Interface Unit Cable
Core Use
Board Header Terminal
Number
24V + Left-
hand J101
1 1 24V +
24V - 2 2 0V
Ground None screen screen
IU-AC-Power1
Power
Supply
Interface Unit
Cable Core Use Board Header
Terminal
Number
AC Left-
hand J100
1 1 AC power
Ground 2 green/yellow Ground
AC 3 2 AC power
IU-DC-Power2
Power
Supply
Interface Unit Cable
Core Use
Board Header Terminal
Number
24V + Right-
hand J101
1 1 24V +
24V - 2 2 0V
Ground None screen screen

72
IU-AC-Power2
Power
Supply
Interface Unit
Cable Core Use Board Header
Terminal
Number
AC Right-
hand J100
1 1 AC power
Ground 2 green/yellow Ground
AC 3 2 AC power
IU-HMI1
HMI1 Interface Unit Cable
Core Use
Connector Terminal
Number Board Header
Terminal
Number
Converter
board
Left-hand J400
1 1 a RCVA
2 1 b RCVB
3 1
screen
RCVSCN
4 2 a XMTA
5 2 b XMTB
6 2
screen
XMTSCN
Power
connector
+ 7 3 a +24V
- 8 3 b -24V
9 3
screen
POWSCN
IU-HMI2
HMI2 Interface Unit Cable
Core Use
Connector Terminal
Number Board Header
Terminal
Number
Converter
board
Right-
hand J400
1 1 a RCVA
2 1 b RCVB
3 1
screen
RCVSCN
4 2 a XMTA
5 2 b XMTB
6 2
screen
XMTSCN
Power
connector
+ 7 3 a +24V
- 8 3 b -24V
9 3
screen
POWSCN
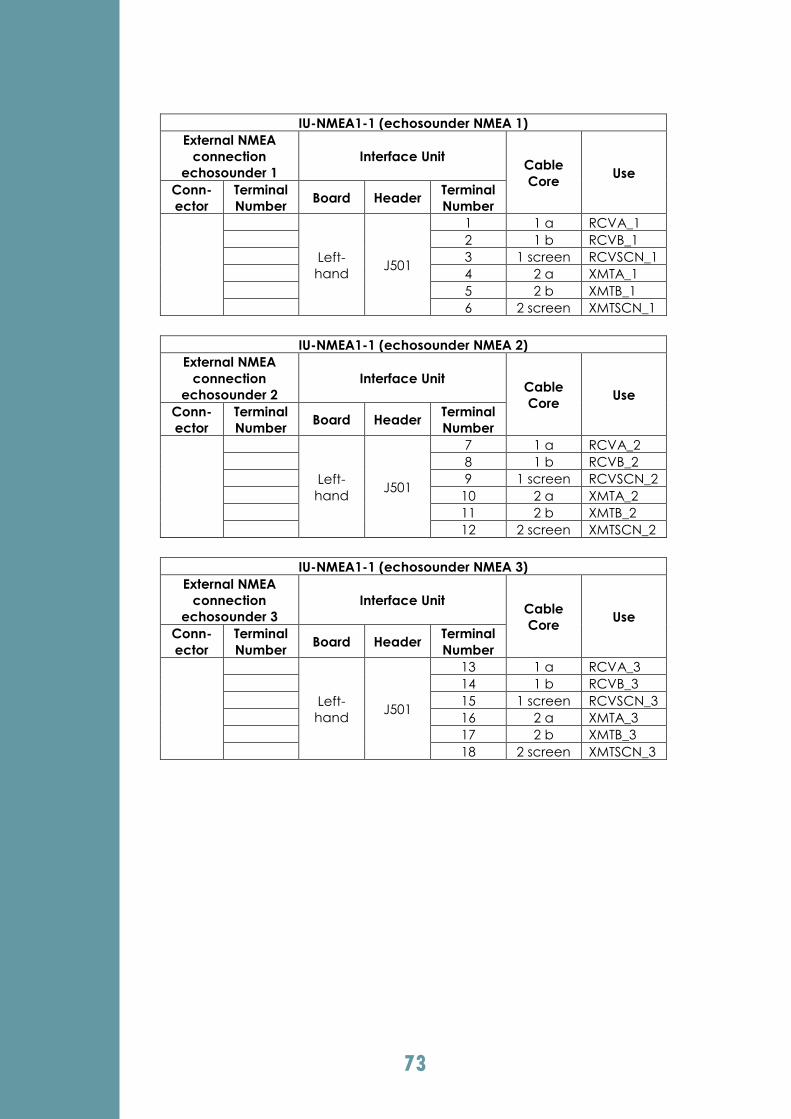
73
IU-NMEA1-1 (echosounder NMEA 1)
External NMEA
connection
echosounder 1
Interface Unit Cable
Core Use
Conn-
ector
Terminal
Number Board Header
Terminal
Number
Left-
hand J501
1 1 a RCVA_1
2 1 b RCVB_1
3 1 screen RCVSCN_1
4 2 a XMTA_1
5 2 b XMTB_1
6 2 screen XMTSCN_1
IU-NMEA1-1 (echosounder NMEA 2)
External NMEA
connection
echosounder 2
Interface Unit Cable
Core Use
Conn-
ector
Terminal
Number Board Header
Terminal
Number
Left-
hand J501
7 1 a RCVA_2
8 1 b RCVB_2
9 1 screen RCVSCN_2
10 2 a XMTA_2
11 2 b XMTB_2
12 2 screen XMTSCN_2
IU-NMEA1-1 (echosounder NMEA 3)
External NMEA
connection
echosounder 3
Interface Unit Cable
Core Use
Conn-
ector
Terminal
Number Board Header
Terminal
Number
Left-
hand J501
13 1 a RCVA_3
14 1 b RCVB_3
15 1 screen RCVSCN_3
16 2 a XMTA_3
17 2 b XMTB_3
18 2 screen XMTSCN_3
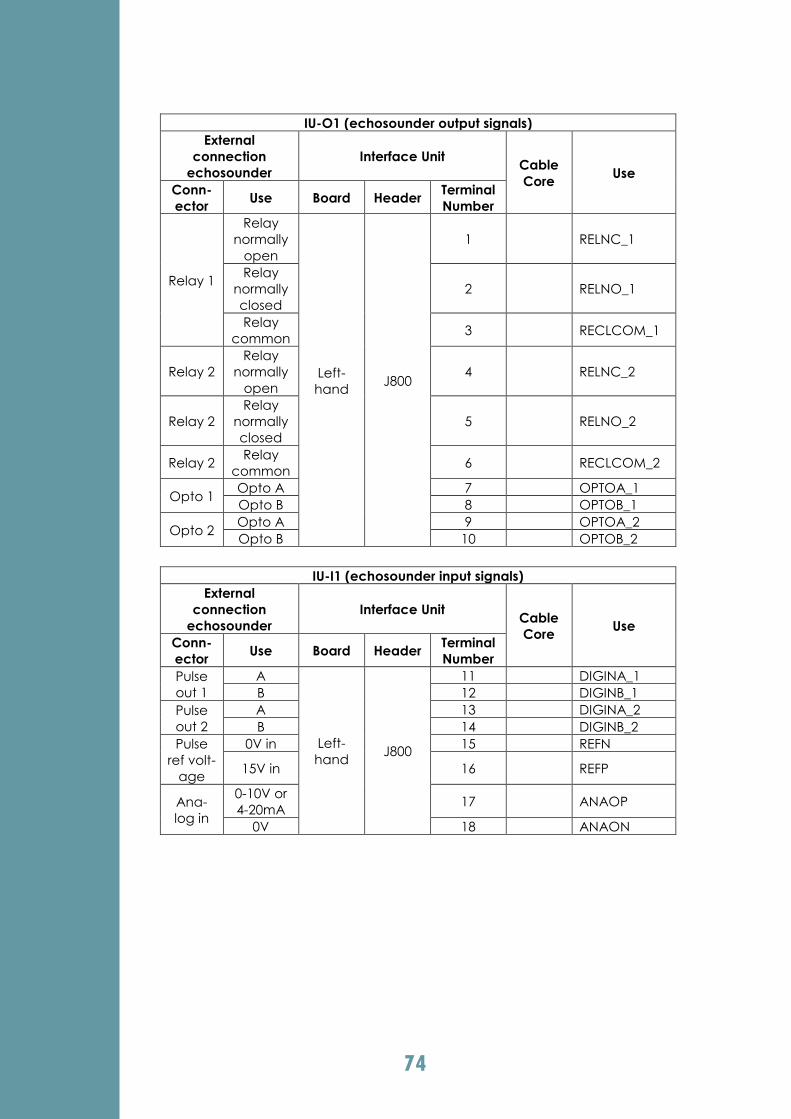
74
IU-O1 (echosounder output signals)
External
connection
echosounder
Interface Unit Cable
Core Use
Conn-
ector Use Board Header
Terminal
Number
Relay 1
Relay
normally
open
Left-
hand J800
1 RELNC_1
Relay
normally
closed
2 RELNO_1
Relay
common 3 RECLCOM_1
Relay 2
Relay
normally
open
4 RELNC_2
Relay 2
Relay
normally
closed
5 RELNO_2
Relay 2 Relay
common 6 RECLCOM_2
Opto 1 Opto A 7 OPTOA_1
Opto B 8 OPTOB_1
Opto 2 Opto A 9 OPTOA_2
Opto B 10 OPTOB_2
IU-I1 (echosounder input signals)
External
connection
echosounder
Interface Unit Cable
Core Use
Conn-
ector Use Board Header
Terminal
Number
Pulse
out 1
A
Left-
hand J800
11 DIGINA_1
B 12 DIGINB_1
Pulse
out 2
A 13 DIGINA_2
B 14 DIGINB_2
Pulse
ref volt-
age
0V in 15 REFN
15V in 16 REFP
Ana-
log in
0-10V or
4-20mA 17 ANAOP
0V 18 ANAON
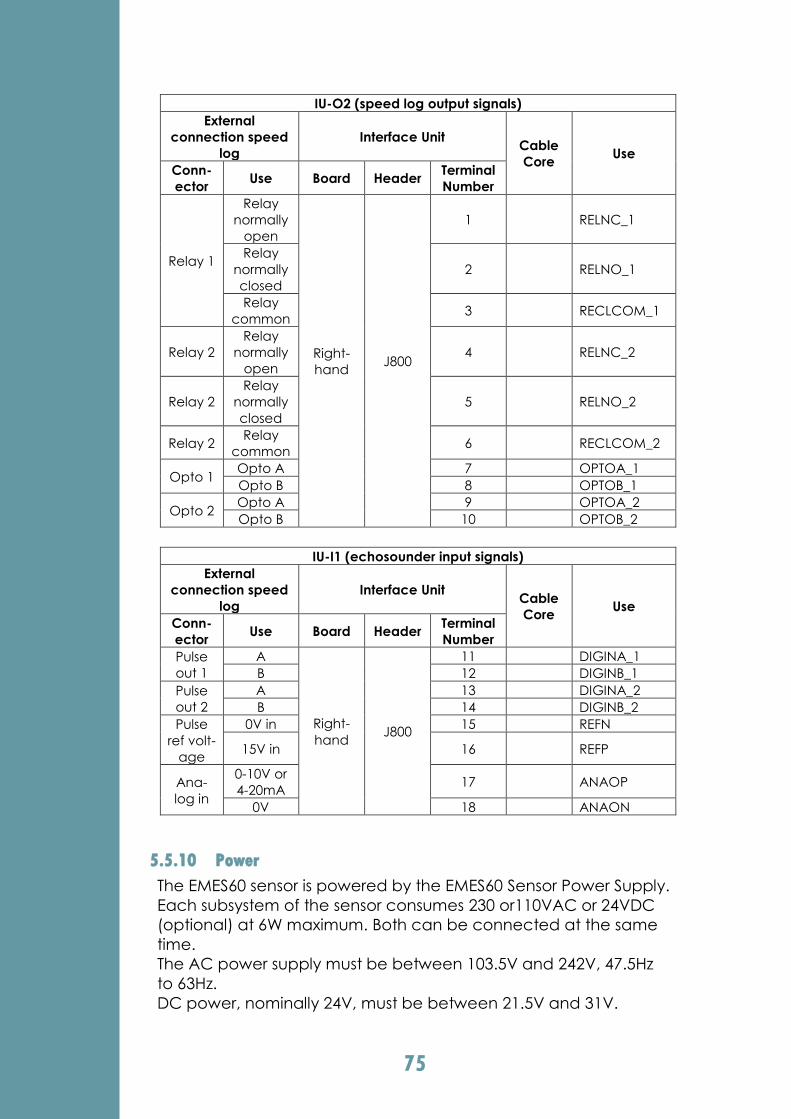
75
IU-O2 (speed log output signals)
External
connection speed
log
Interface Unit Cable
Core Use
Conn-
ector Use Board Header
Terminal
Number
Relay 1
Relay
normally
open
Right-
hand J800
1 RELNC_1
Relay
normally
closed
2 RELNO_1
Relay
common 3 RECLCOM_1
Relay 2
Relay
normally
open
4 RELNC_2
Relay 2
Relay
normally
closed
5 RELNO_2
Relay 2 Relay
common 6 RECLCOM_2
Opto 1 Opto A 7 OPTOA_1
Opto B 8 OPTOB_1
Opto 2 Opto A 9 OPTOA_2
Opto B 10 OPTOB_2
IU-I1 (echosounder input signals)
External
connection speed
log
Interface Unit Cable
Core Use
Conn-
ector Use Board Header
Terminal
Number
Pulse
out 1
A
Right-
hand J800
11 DIGINA_1
B 12 DIGINB_1
Pulse
out 2
A 13 DIGINA_2
B 14 DIGINB_2
Pulse
ref volt-
age
0V in 15 REFN
15V in 16 REFP
Ana-
log in
0-10V or
4-20mA 17 ANAOP
0V 18 ANAON
5.5.10 Power
The EMES60 sensor is powered by the EMES60 Sensor Power Supply.
Each subsystem of the sensor consumes 230 or110VAC or 24VDC
(optional) at 6W maximum. Both can be connected at the same
time.
The AC power supply must be between 103.5V and 242V, 47.5Hz
to 63Hz.
DC power, nominally 24V, must be between 21.5V and 31V.
76
The HMI units require DC power, 24VDC at 12.8W maximum each.
The HMI units are powered from the Interface Unit.
The total consumption of each subsystem is 230/110VAC or 24VDC
at 16 W maximum.
5.5.11 Signal Connections
EMES60 supports the following signal output types:
Relay: maximum external connection 30V, 1A
Opto-coupler: maximum external connection 60V, 0.5A
4-20mA: output level 10V, load resistance must be less than
500Ω
0-10V: load resistance must be more than 500Ω
EMES60 supports the following signal input types:
Pulse inputs: 5 to 24V; high- or low-going pulses can be used
A 15V reference voltage is available in the EMES60 terminals for
use with the pulse inputs if required with voltage-free sources.
See section 3.1.3 for instructions on configuring the inputs and
outputs in the HMI interfaces.
5.6 Set-Up
The system is set up using the HMI Units. See section 3 for details of
the HMI screens.
5.6.1 Set Up the Hardware Interface
The Hardware Interface screens of the HMI (see 0) allow you to set
up:
The opto-isolated output channels
The pulse input channels
The analog output channels
The relay switches
The printer
5.7 Calibration
5.7.1 Calibrating the HMI touch-screen
The pointer on the HMI touch screen should appear exactly where
it is touched. If not, run the touch-screen calibration procedure.
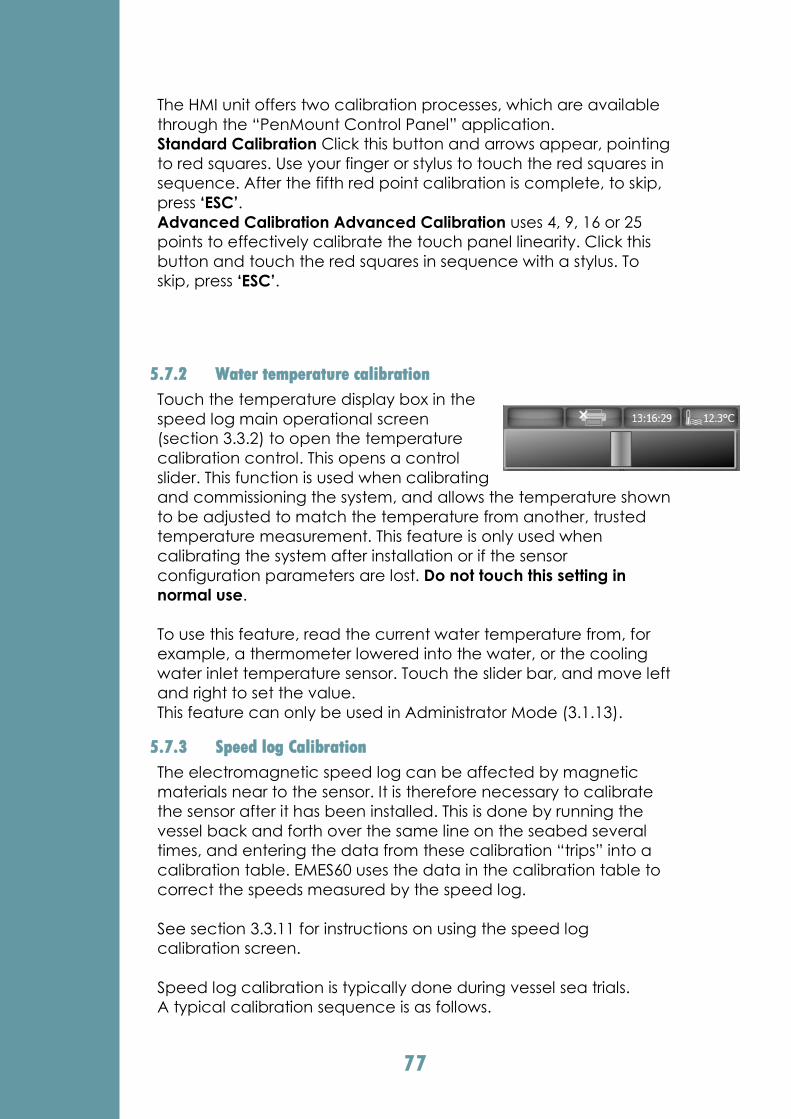
77
The HMI unit offers two calibration processes, which are available
through the “PenMount Control Panel” application.
Standard Calibration Click this button and arrows appear, pointing
to red squares. Use your finger or stylus to touch the red squares in
sequence. After the fifth red point calibration is complete, to skip,
press ‘ESC’.
Advanced Calibration Advanced Calibration uses 4, 9, 16 or 25
points to effectively calibrate the touch panel linearity. Click this
button and touch the red squares in sequence with a stylus. To
skip, press ‘ESC’.
5.7.2 Water temperature calibration
Touch the temperature display box in the
speed log main operational screen
(section 3.3.2) to open the temperature
calibration control. This opens a control
slider. This function is used when calibrating
and commissioning the system, and allows the temperature shown
to be adjusted to match the temperature from another, trusted
temperature measurement. This feature is only used when
calibrating the system after installation or if the sensor
configuration parameters are lost. Do not touch this setting in
normal use.
To use this feature, read the current water temperature from, for
example, a thermometer lowered into the water, or the cooling
water inlet temperature sensor. Touch the slider bar, and move left
and right to set the value.
This feature can only be used in Administrator Mode (3.1.13).
5.7.3 Speed log Calibration
The electromagnetic speed log can be affected by magnetic
materials near to the sensor. It is therefore necessary to calibrate
the sensor after it has been installed. This is done by running the
vessel back and forth over the same line on the seabed several
times, and entering the data from these calibration “trips” into a
calibration table. EMES60 uses the data in the calibration table to
correct the speeds measured by the speed log.
See section 3.3.11 for instructions on using the speed log
calibration screen.
Speed log calibration is typically done during vessel sea trials.
A typical calibration sequence is as follows.
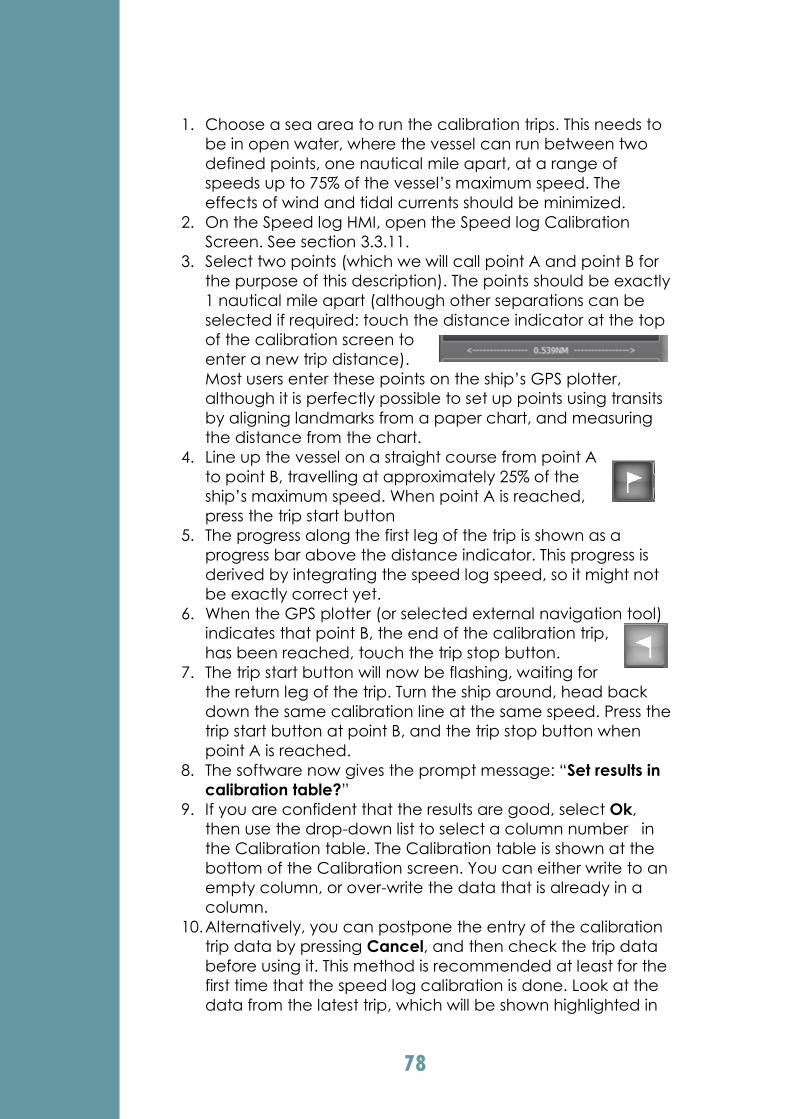
78
1. Choose a sea area to run the calibration trips. This needs to
be in open water, where the vessel can run between two
defined points, one nautical mile apart, at a range of
speeds up to 75% of the vessel’s maximum speed. The
effects of wind and tidal currents should be minimized.
2. On the Speed log HMI, open the Speed log Calibration
Screen. See section 3.3.11.
3. Select two points (which we will call point A and point B for
the purpose of this description). The points should be exactly
1 nautical mile apart (although other separations can be
selected if required: touch the distance indicator at the top
of the calibration screen to
enter a new trip distance).
Most users enter these points on the ship’s GPS plotter,
although it is perfectly possible to set up points using transits
by aligning landmarks from a paper chart, and measuring
the distance from the chart.
4. Line up the vessel on a straight course from point A
to point B, travelling at approximately 25% of the
ship’s maximum speed. When point A is reached,
press the trip start button
5. The progress along the first leg of the trip is shown as a
progress bar above the distance indicator. This progress is
derived by integrating the speed log speed, so it might not
be exactly correct yet.
6. When the GPS plotter (or selected external navigation tool)
indicates that point B, the end of the calibration trip,
has been reached, touch the trip stop button.
7. The trip start button will now be flashing, waiting for
the return leg of the trip. Turn the ship around, head back
down the same calibration line at the same speed. Press the
trip start button at point B, and the trip stop button when
point A is reached.
8. The software now gives the prompt message: “Set results in
calibration table?”
9. If you are confident that the results are good, select Ok,
then use the drop-down list to select a column number in
the Calibration table. The Calibration table is shown at the
bottom of the Calibration screen. You can either write to an
empty column, or over-write the data that is already in a
column.
10. Alternatively, you can postpone the entry of the calibration
trip data by pressing Cancel, and then check the trip data
before using it. This method is recommended at least for the
first time that the speed log calibration is done. Look at the
data from the latest trip, which will be shown highlighted in
79
the Calibration trips table. Look at the following values, and
check that they are within the limits of what you would
expect:
a. Trip time and Trip date, which should match the time
that the trip was run
b. Ref. Leg1 shows the speed of the first leg of the trip
(from A to B) calculated from the distance that was
entered in step 3 above and the time taken to run the
leg.
c. Log Leg1 shows the speed of the first leg of the trip as
measured by the speed log.
d. Ref. Leg2 and Log Leg2 show the same information for
the second leg of the calibration trip.
e. Ref. Aver and Log Aver show the reference and
speed log speeds, averaged between the two legs of
the trip
f. Dist Leg1, Dist Leg2, and Dist Aver show the distances
for the two legs, and the average, as computed from
the speed log speed.
g. Drift shows the angle between the forward and
sideways velocity, again for the two legs and the
average between them.
11. If these values all seem to be acceptable,
touch the column to select it, and touch the
Calibration Trip Use button.
12. You will be given the prompt message: “Set results in
calibration table?”, just as in step 8 above. As described in
step 9 above, you can put the values into a selected
column of the Calibration table.
13. Check that the values in the calibration table match what
you expect for the calibration trip:
a. Ref. shows the reference speed for the trip, computed
from time and distance
b. Log shows the speed from the trip as measured by the
speed log before calibration
c. Drift shows the angle between forward and sideways
speed components for the trip.
14. Repeat the process, from steps 4 to 13, A to B and back
again, this time at 50% of the ship’s maximum speed, and
again for 75% of the maximum speed. Enter all of the values
into the Calibration table. The table has five columns,
allowing you to run two more lines at different speeds if you
wish.
The Calibration table shows un-calibrated forward and sideways
speeds on the left of “Calibration table” and the calibrated results

80
on the right, so that you can see what the effect of the table is at
any time during the process.
If one of the calibration trips doesn’t work well, select it
by touching it, and press the Delete button to remove it
from the table.
If one of the columns in the Calibration table is bad, you can:
Over-write it from one of the columns in the Calibration trips
table (see step 9 above), or
Stop is being used in calibration calculations by selecting
any one (or all) of the values in the column by touching it,
and using the “backspace” key to delete the value.
Columns with any one of the three values blank are not
used; or
Touch a value in a table to edit it (see below to see how this
might be used).
When the calibration process is complete, if there is a printer fitted
to the system, use the Print button to make a print-
out of the calibration data as a record of the
process.
It is strongly recommended that the full calibration process is
followed as described above. However, alternative methods are
possible:
One-way trips: if it is certain that there is no effect on water
speed from wind or tide, you can use the results from one
direction only:
o At the end of the first run (A to B) touch the
end run button as usual, and then use the
Calibration Trip Use button to use the data
from the run so far.
o The Start button will now be flashing, waiting for you to
do the return (B to A) trip. You can clear this flashing
as follows: touch it, to start a “dummy” trip, then
touch the End button, and select “Cancel” from the
“Set results in calibration table?” prompt.
Use GPS speed data; this is ground speed, so only matches
the true water speed if there is no tidal current. But if this is
the case, then you could create a column in the Calibration
table as follows:
o Touch the Ref. field and use the keypad to enter the
GPS speed that is shown in the top-left of the window
o Touch the Log field and enter the raw value from the
speed log: this is shown to the left of the Calibration
table header.

81
o Enter zero (or a true value if known) into the Drift field.
Blanks in any of the fields cause the column to be
ignored in the calibration calculations.

82
6 Technical Details
6.1 Specifications
Performance
Echosounder Speed log
Accuracy 0.05m or 0.5% of depth, whatever is
greater 0.1kn or 1% of speed, whatever is greater
Resolution digital out 0.01m 0.01knots
Resolution screen
presentation
Depth < 100m : 0.1mDepth >=100m :
1.0m 0.1knots
Range of measured
values 0.7m-500m +/- 40 knots on all axis
Temperature Accuracy Temperature sensor accurate to 1° C
Display Unit (separate unit for each sub-system)
Resolution 800x480, 7” WVGA
Operator interface Touch screen, tap & swipe operation
Communication line RS422, Optional RS232
Day/Night modes Full range of backlight adjustment day/night color themes selection.
Software upgrade
means USB line, USB flash device, Ethernet
Supported languages English, Norwegian, German, French, Spanish, Russian, Chinese
Calendar, clock Real time clock support or GPS time reference.
Environmental IP68, front panel only
Cutout dimensions 137x185mm, depth 36mm
Operating T° -15 - +55° C (storage -20 -+60°C )
Weight 0.7kg
Echosounder Speed log
Range user adjustable: 0-10m to 0-500m,
auto -5 /+40 knots, +/-5 knots
Presentation units meters, feet, fathoms knots, mi/h
Alarms Shallow and deep alarms adjustable
limits Low and high speed alarms
Interface Unit (separate PCB for each sub-system)
External communication
line
NMEA0183 rev4, /IEC 61162-1/ IEC 61162-2 2inputs/3 outputs,
IEC 61162-4 ( Light Weight Ethernet) 1input/1 output
Analog 1 output, 10Vpp or 4-20mA, fully programmable
Alarm relays 2 Mechanical relays, one dedicated system power failure alarm
General purpose Input 2 digital inputs (for synchronization, slave mode), fully programmable
General purpose Output 2 optocoupler outputs, fully programmable
Software upgrade
means USB line, USB flash device, Ethernet
Environmental IP55
Operating T° -15-+60°
Dimensions, mm 150x300x120
Weight 4kg
Dual Sensor with Cable
Cable length 30m (optional 40m)
Communication link IEC 61162-1/2
Environmental IP68, 6 bar continuous immersion in water
Operating T° -5-+60°
Sensor Dimensions H = 124mm, D = 60.2mm
Weight (with cable) 7kg

83
Hull fitting unit (ball valve)
Hull type Single and double
Body material Stainless steel
Pressure rating 10 bar
Operating T° -5-+60°
Weight 18kg
System Power Requirement
Mains Nominal 115V to 230V:103.5V to 242V, 47.5Hz to 63Hz
DC Nominal 24V: 21.5V to 31V
Power Echosounder: 6W, speed log: 6 W, HMI units: 12.8W maximum each
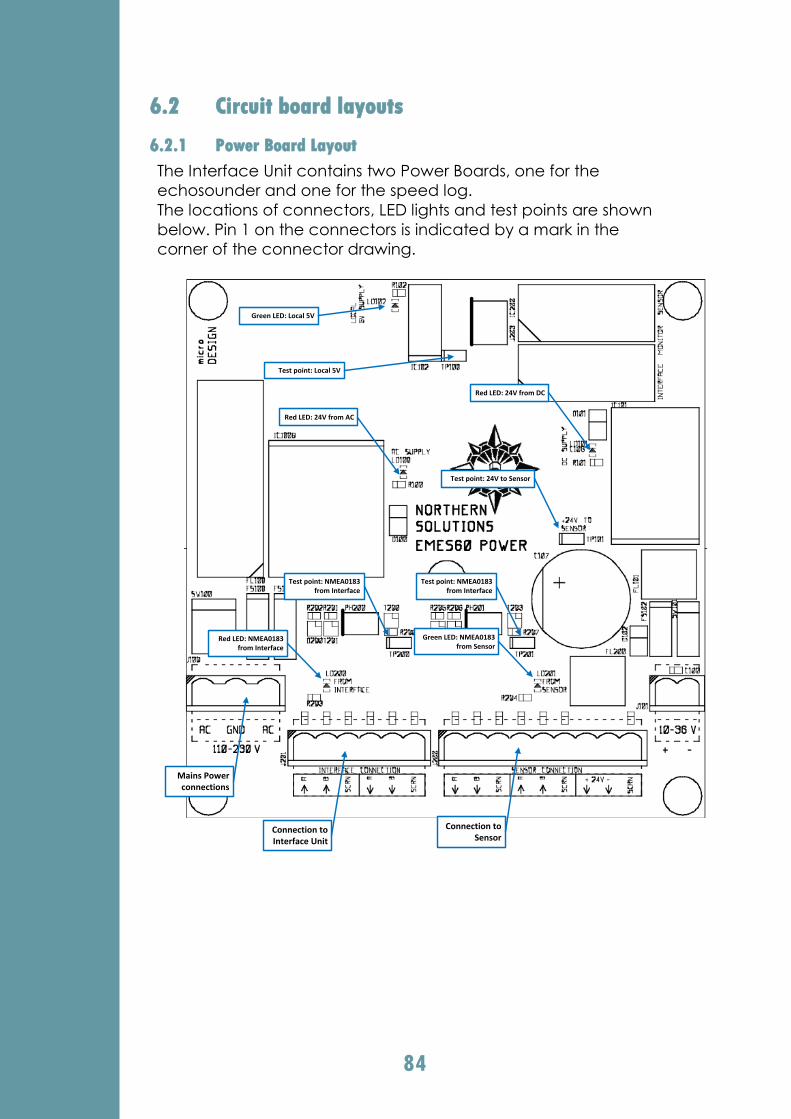
84
6.2 Circuit board layouts
6.2.1 Power Board Layout
The Interface Unit contains two Power Boards, one for the
echosounder and one for the speed log.
The locations of connectors, LED lights and test points are shown
below. Pin 1 on the connectors is indicated by a mark in the
corner of the connector drawing.
Mains Power connections
Connection to Sensor
Connection to Interface Unit
Test point: Local 5V
Red LED: 24V from AC
Red LED: 24V from DC
Green LED: Local 5V
Red LED: NMEA0183 from Interface
Green LED: NMEA0183 from Sensor
Test point: 24V to Sensor
Test point: NMEA0183 from Interface
Test point: NMEA0183 from Interface
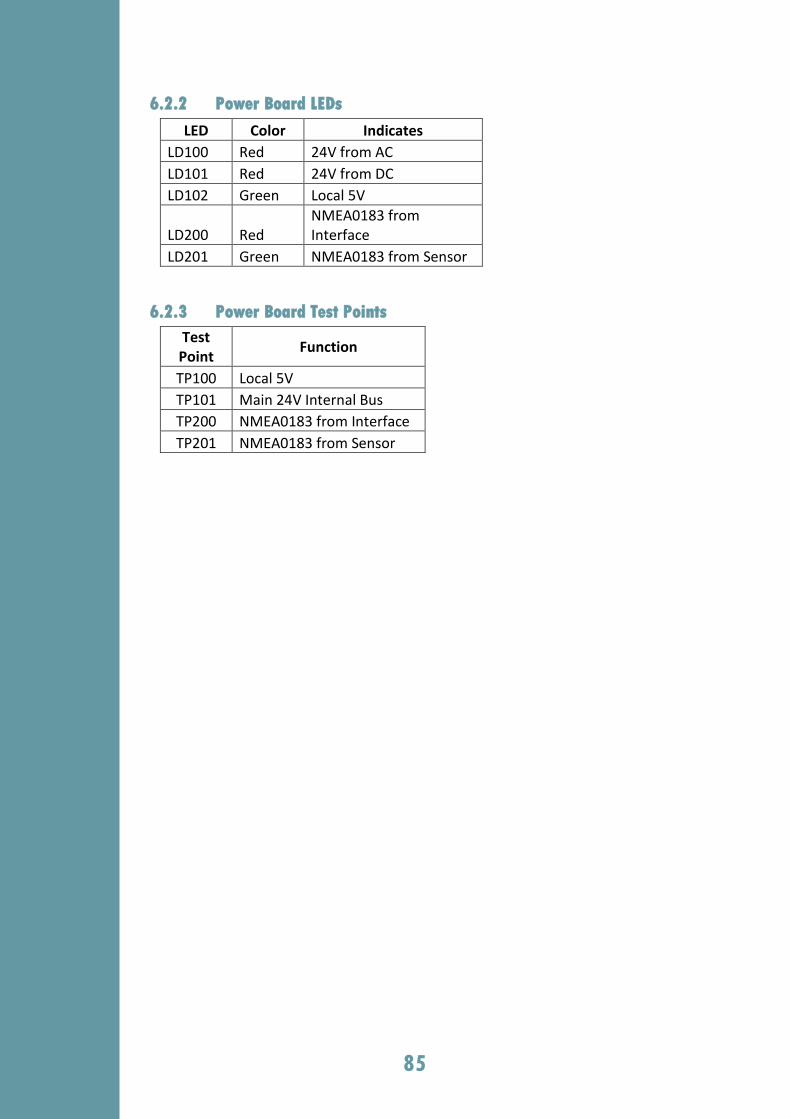
85
6.2.2 Power Board LEDs
LED Color Indicates
LD100 Red 24V from AC
LD101 Red 24V from DC
LD102 Green Local 5V
LD200 Red NMEA0183 from Interface
LD201 Green NMEA0183 from Sensor
6.2.3 Power Board Test Points
Test Point
Function
TP100 Local 5V
TP101 Main 24V Internal Bus
TP200 NMEA0183 from Interface
TP201 NMEA0183 from Sensor
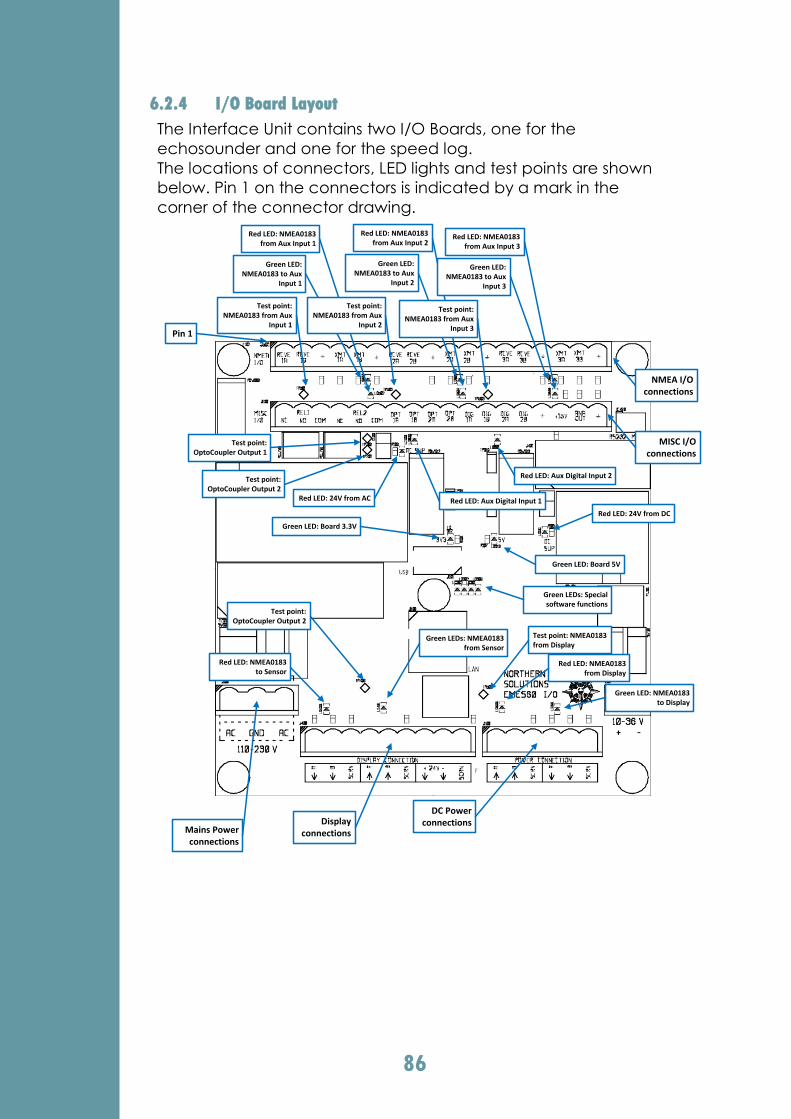
86
6.2.4 I/O Board Layout
The Interface Unit contains two I/O Boards, one for the
echosounder and one for the speed log.
The locations of connectors, LED lights and test points are shown
below. Pin 1 on the connectors is indicated by a mark in the
corner of the connector drawing.
Pin 1
NMEA I/O connections
MISC I/O connections
Display connections
DC Power connections
Mains Power connections
Test point: NMEA0183 from Aux
Input 1
Green LED: NMEA0183 to Aux
Input 1
Red LED: NMEA0183 from Aux Input 1
Green LED: NMEA0183 to Aux
Input 2
Red LED: NMEA0183 from Aux Input 2
Test point: NMEA0183 from Aux
Input 2
Green LED: NMEA0183 to Aux
Input 3
Red LED: NMEA0183 from Aux Input 3
Test point: NMEA0183 from Aux
Input 3
Test point: OptoCoupler Output 1
Test point: OptoCoupler Output 2
Red LED: 24V from AC Red LED: Aux Digital Input 1
Red LED: Aux Digital Input 2
Green LED: Board 3.3V
Green LED: Board 5V
Red LED: 24V from DC
Green LEDs: Special software functions
Test point: OptoCoupler Output 2
Red LED: NMEA0183 to Sensor
Green LEDs: NMEA0183 from Sensor
Test point: NMEA0183 from Display
Red LED: NMEA0183 from Display
Green LED: NMEA0183 to Display
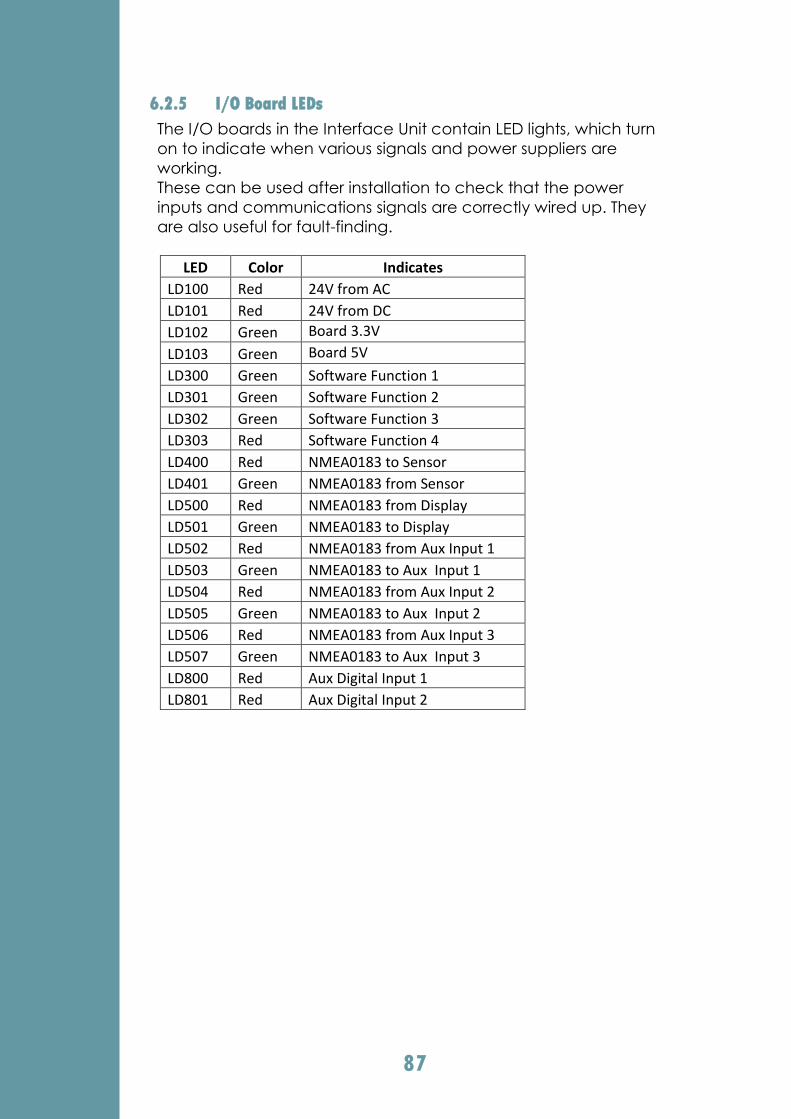
87
6.2.5 I/O Board LEDs
The I/O boards in the Interface Unit contain LED lights, which turn
on to indicate when various signals and power suppliers are
working.
These can be used after installation to check that the power
inputs and communications signals are correctly wired up. They
are also useful for fault-finding.
LED Color Indicates
LD100 Red 24V from AC
LD101 Red 24V from DC
LD102 Green Board 3.3V
LD103 Green Board 5V
LD300 Green Software Function 1
LD301 Green Software Function 2
LD302 Green Software Function 3
LD303 Red Software Function 4
LD400 Red NMEA0183 to Sensor
LD401 Green NMEA0183 from Sensor
LD500 Red NMEA0183 from Display
LD501 Green NMEA0183 to Display
LD502 Red NMEA0183 from Aux Input 1
LD503 Green NMEA0183 to Aux Input 1
LD504 Red NMEA0183 from Aux Input 2
LD505 Green NMEA0183 to Aux Input 2
LD506 Red NMEA0183 from Aux Input 3
LD507 Green NMEA0183 to Aux Input 3
LD800 Red Aux Digital Input 1
LD801 Red Aux Digital Input 2
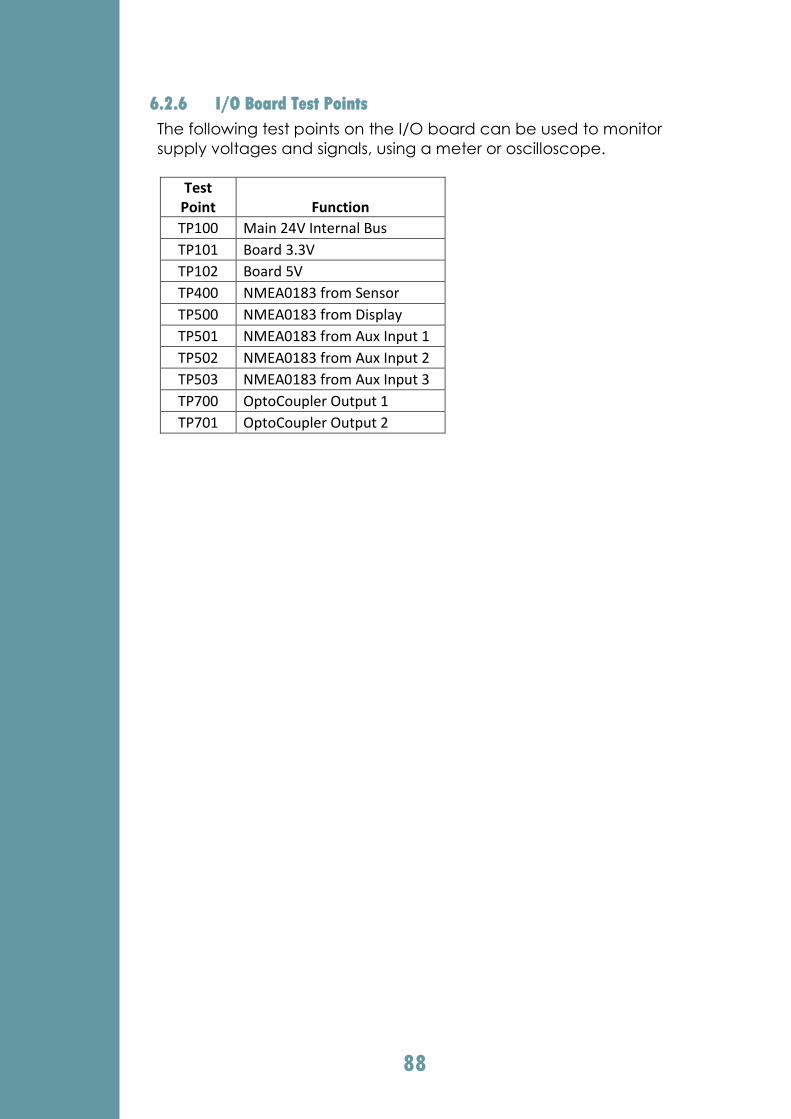
88
6.2.6 I/O Board Test Points
The following test points on the I/O board can be used to monitor
supply voltages and signals, using a meter or oscilloscope.
Test
Point Function
TP100 Main 24V Internal Bus
TP101 Board 3.3V
TP102 Board 5V
TP400 NMEA0183 from Sensor
TP500 NMEA0183 from Display
TP501 NMEA0183 from Aux Input 1
TP502 NMEA0183 from Aux Input 2
TP503 NMEA0183 from Aux Input 3
TP700 OptoCoupler Output 1
TP701 OptoCoupler Output 2
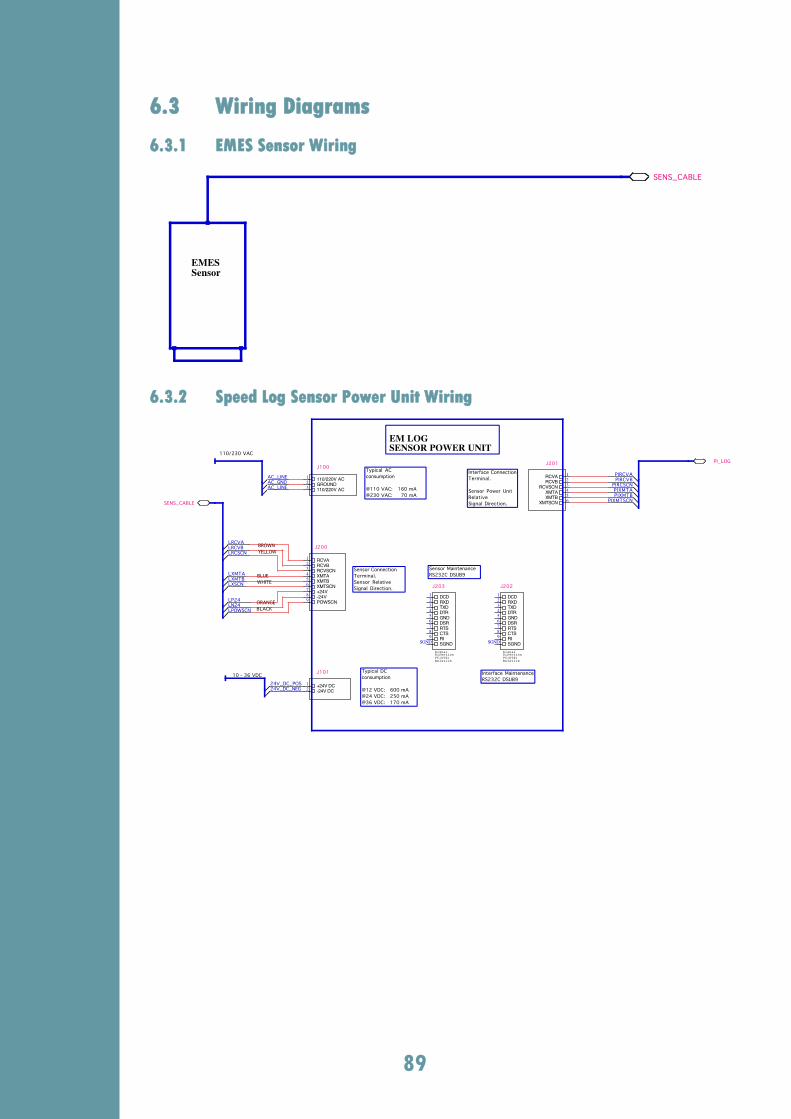
89
6.3 Wiring Diagrams
6.3.1 EMES Sensor Wiring
6.3.2 Speed Log Sensor Power Unit Wiring
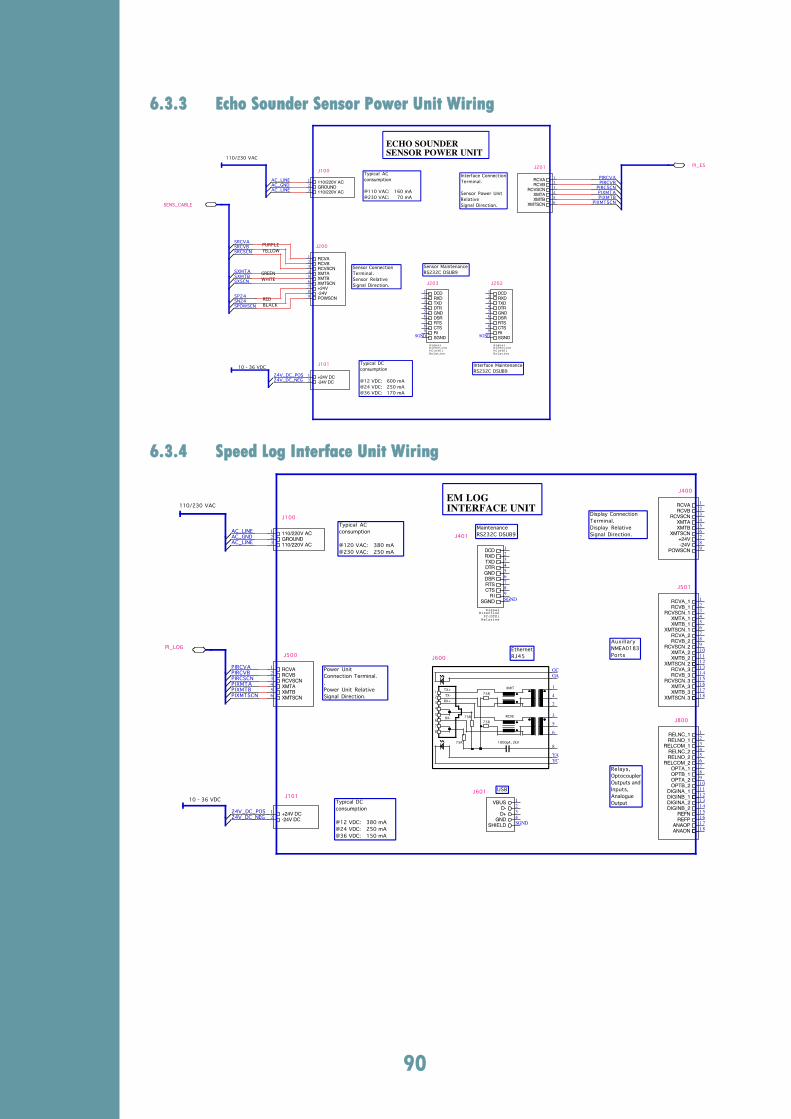
90
6.3.3 Echo Sounder Sensor Power Unit Wiring
6.3.4 Speed Log Interface Unit Wiring
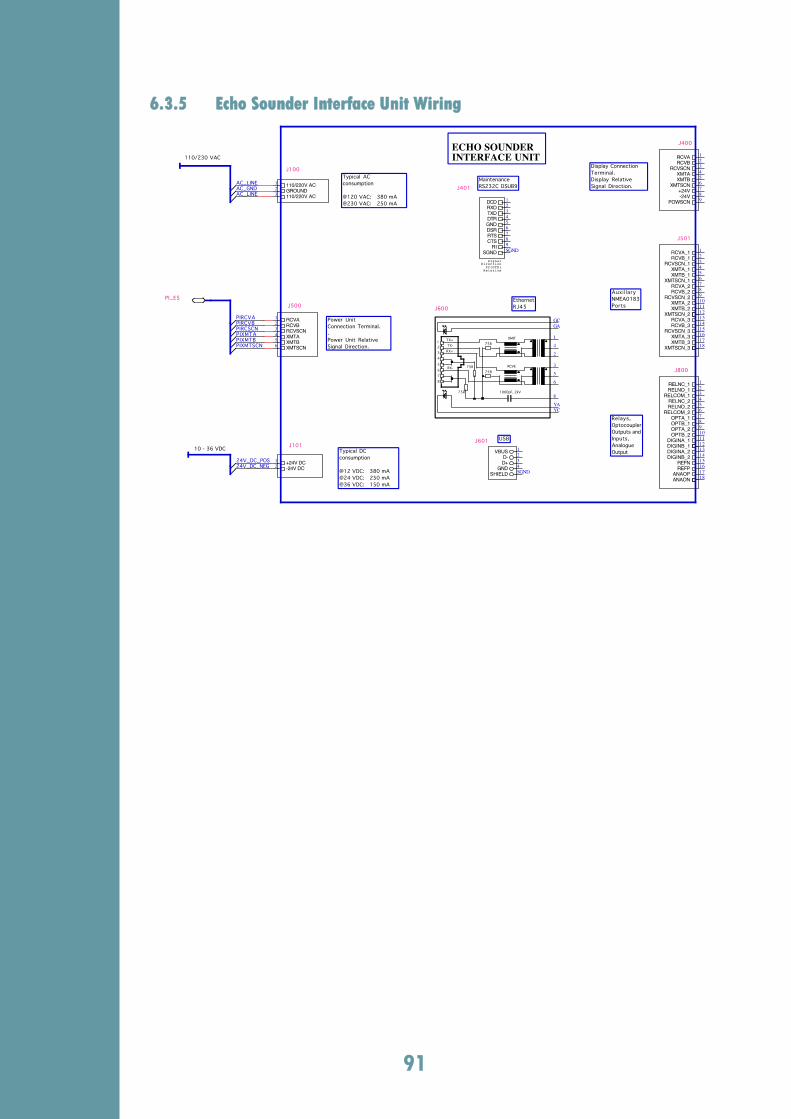
91
6.3.5 Echo Sounder Interface Unit Wiring
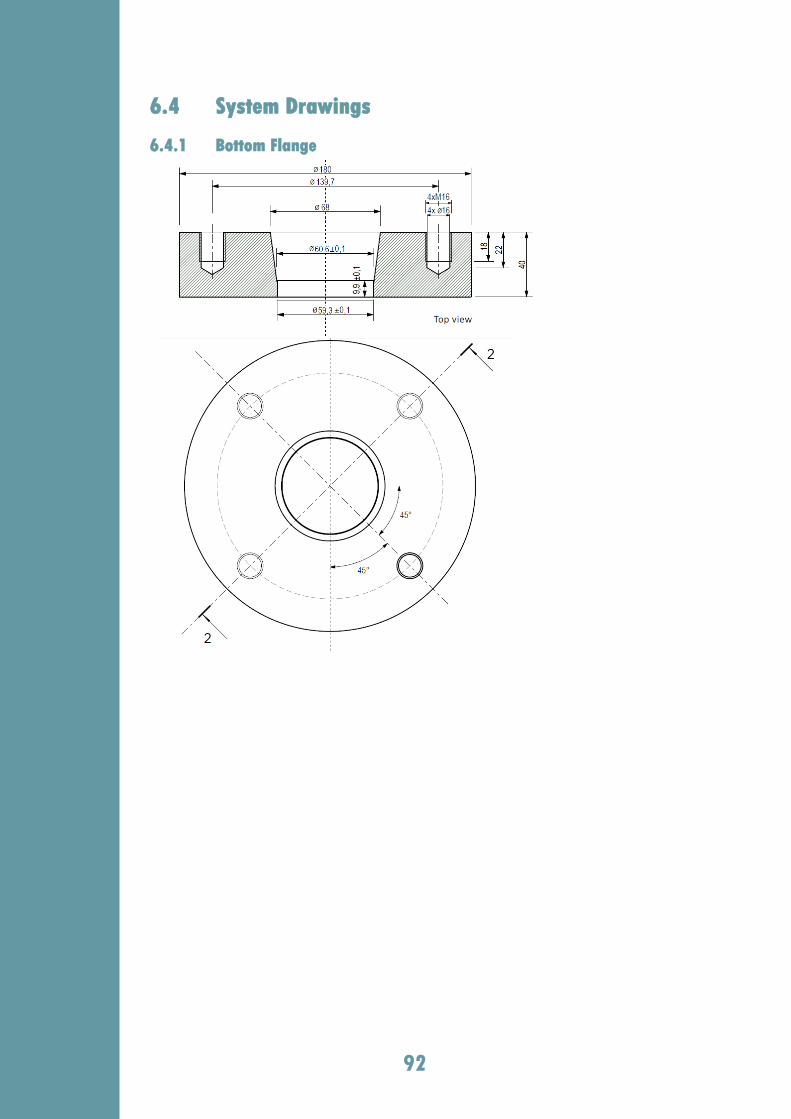
92
6.4 System Drawings
6.4.1 Bottom Flange
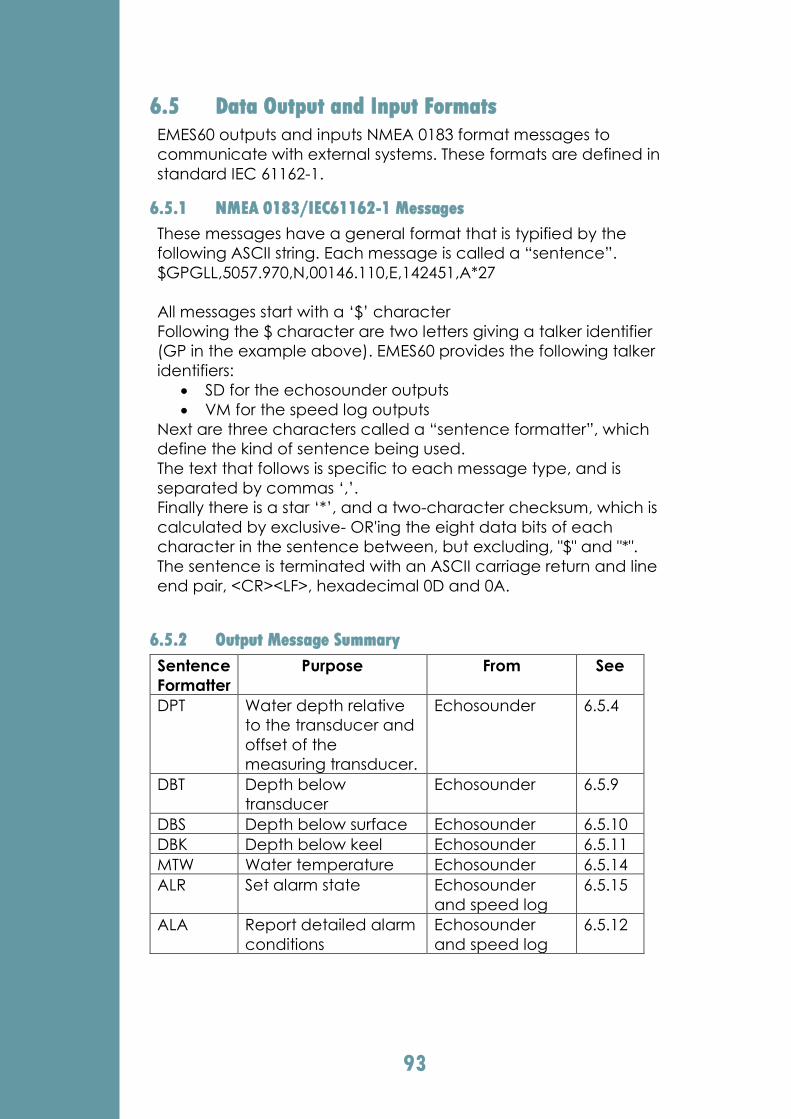
93
6.5 Data Output and Input Formats
EMES60 outputs and inputs NMEA 0183 format messages to
communicate with external systems. These formats are defined in
standard IEC 61162-1.
6.5.1 NMEA 0183/IEC61162-1 Messages
These messages have a general format that is typified by the
following ASCII string. Each message is called a “sentence”.
$GPGLL,5057.970,N,00146.110,E,142451,A*27
All messages start with a ‘$’ character
Following the $ character are two letters giving a talker identifier
(GP in the example above). EMES60 provides the following talker
identifiers:
SD for the echosounder outputs
VM for the speed log outputs
Next are three characters called a “sentence formatter”, which
define the kind of sentence being used.
The text that follows is specific to each message type, and is
separated by commas ‘,’.
Finally there is a star ‘*’, and a two-character checksum, which is
calculated by exclusive- OR'ing the eight data bits of each
character in the sentence between, but excluding, "$" and "*".
The sentence is terminated with an ASCII carriage return and line
end pair, <CR><LF>, hexadecimal 0D and 0A.
6.5.2 Output Message Summary
Sentence
Formatter
Purpose From See
DPT Water depth relative
to the transducer and
offset of the
measuring transducer.
Echosounder 6.5.4
DBT Depth below
transducer
Echosounder 6.5.9
DBS Depth below surface Echosounder 6.5.10
DBK Depth below keel Echosounder 6.5.11
MTW Water temperature Echosounder 6.5.14
ALR Set alarm state Echosounder
and speed log
6.5.15
ALA Report detailed alarm
conditions
Echosounder
and speed log
6.5.12
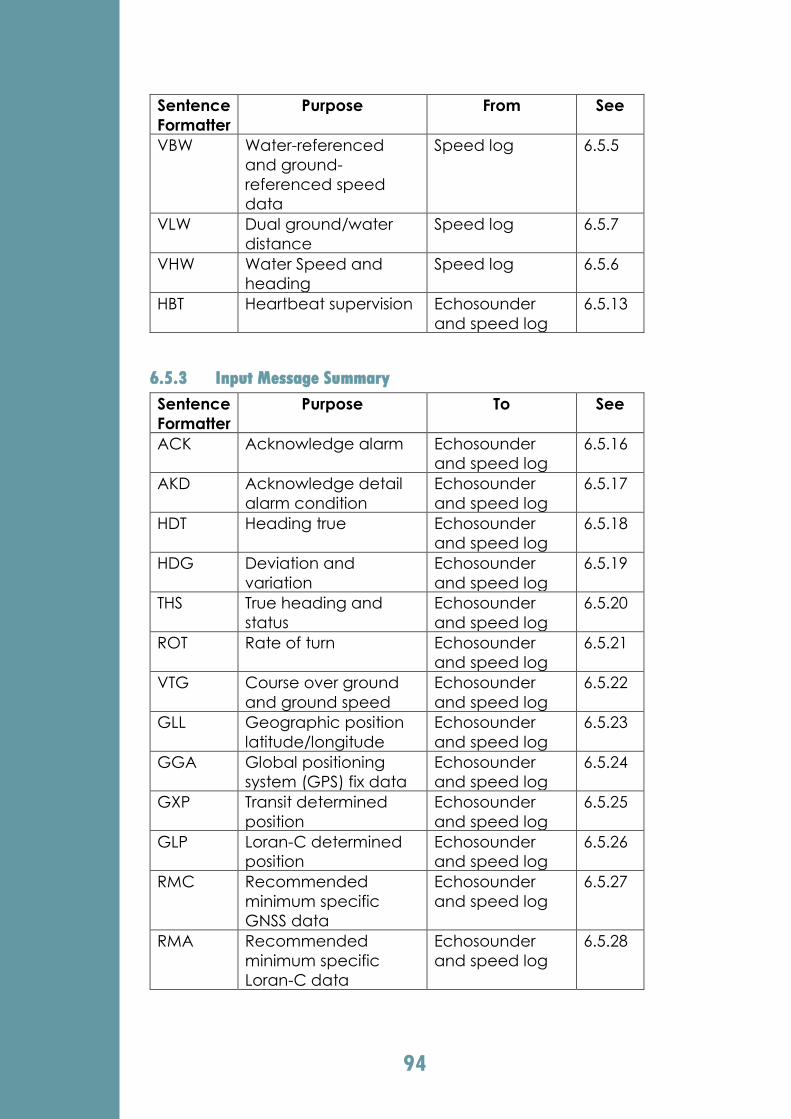
94
Sentence
Formatter
Purpose From See
VBW Water-referenced
and ground-
referenced speed
data
Speed log 6.5.5
VLW Dual ground/water
distance
Speed log 6.5.7
VHW Water Speed and
heading
Speed log 6.5.6
HBT Heartbeat supervision Echosounder
and speed log
6.5.13
6.5.3 Input Message Summary
Sentence
Formatter
Purpose To See
ACK Acknowledge alarm Echosounder
and speed log
6.5.16
AKD Acknowledge detail
alarm condition
Echosounder
and speed log
6.5.17
HDT Heading true Echosounder
and speed log
6.5.18
HDG Deviation and
variation
Echosounder
and speed log
6.5.19
THS True heading and
status
Echosounder
and speed log
6.5.20
ROT Rate of turn Echosounder
and speed log
6.5.21
VTG Course over ground
and ground speed
Echosounder
and speed log
6.5.22
GLL Geographic position
latitude/longitude
Echosounder
and speed log
6.5.23
GGA Global positioning
system (GPS) fix data
Echosounder
and speed log
6.5.24
GXP Transit determined
position
Echosounder
and speed log
6.5.25
GLP Loran-C determined
position
Echosounder
and speed log
6.5.26
RMC Recommended
minimum specific
GNSS data
Echosounder
and speed log
6.5.27
RMA Recommended
minimum specific
Loran-C data
Echosounder
and speed log
6.5.28
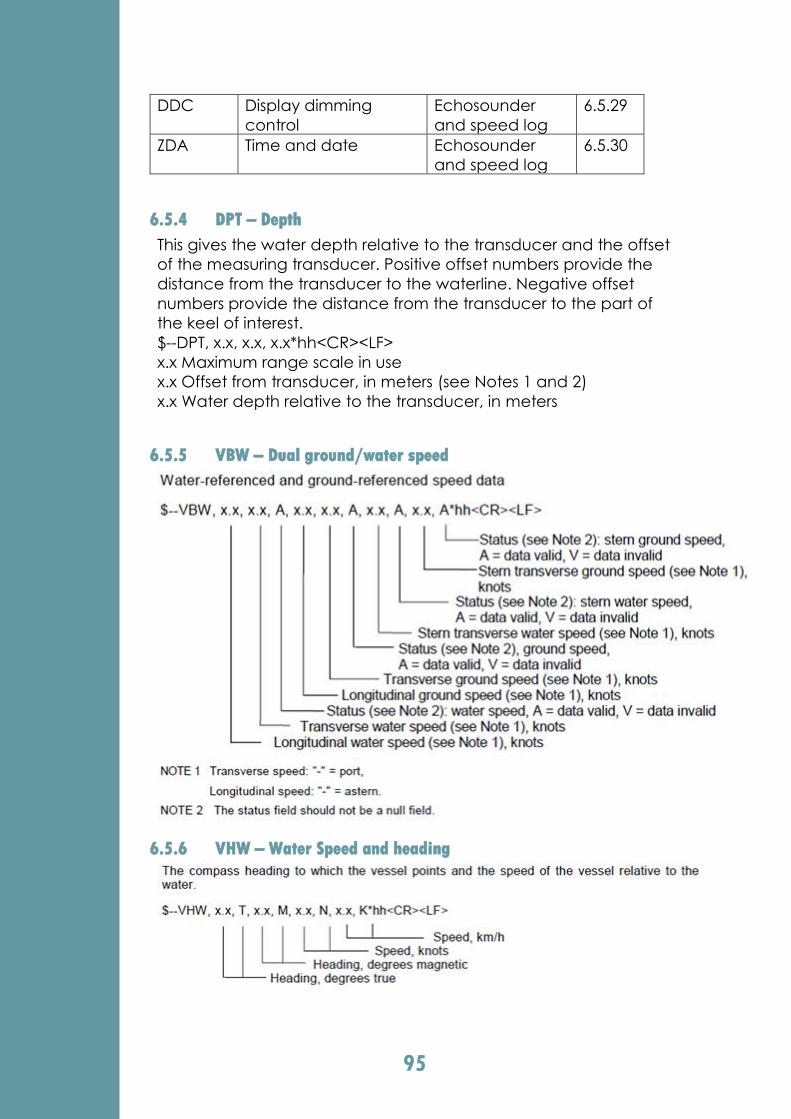
95
DDC Display dimming
control
Echosounder
and speed log
6.5.29
ZDA Time and date Echosounder
and speed log
6.5.30
6.5.4 DPT – Depth
This gives the water depth relative to the transducer and the offset
of the measuring transducer. Positive offset numbers provide the
distance from the transducer to the waterline. Negative offset
numbers provide the distance from the transducer to the part of
the keel of interest.
$--DPT, x.x, x.x, x.x*hh<CR><LF>
x.x Maximum range scale in use
x.x Offset from transducer, in meters (see Notes 1 and 2)
x.x Water depth relative to the transducer, in meters
6.5.5 VBW – Dual ground/water speed
6.5.6 VHW – Water Speed and heading
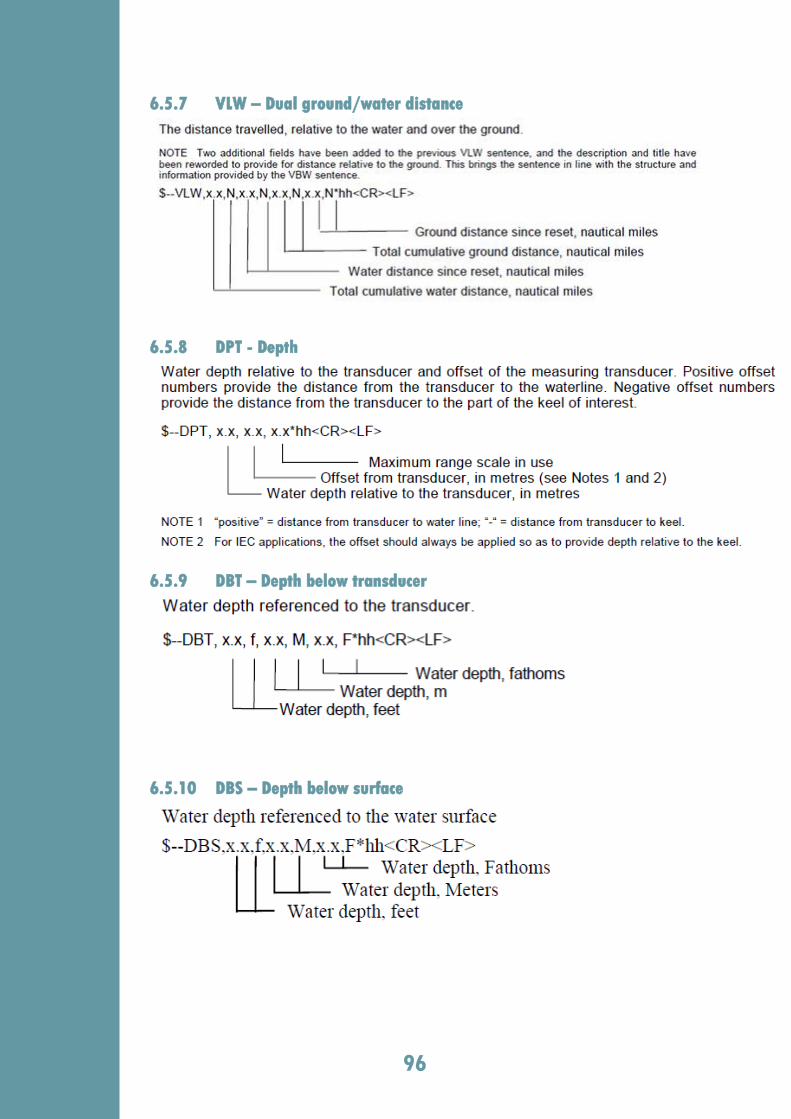
96
6.5.7 VLW – Dual ground/water distance
6.5.8 DPT - Depth
6.5.9 DBT – Depth below transducer
6.5.10 DBS – Depth below surface

97
6.5.11 DBK – Depth below keel

98
6.5.12 ALA – Report detailed alarm conditions
This sentence permits the alarm and alarm acknowledges
condition of systems to be reported. Unlike ALR this sentence
supports reporting multiple system and sub-system alarm
conditions.
6.5.13 HBT – Heartbeat supervision sentence
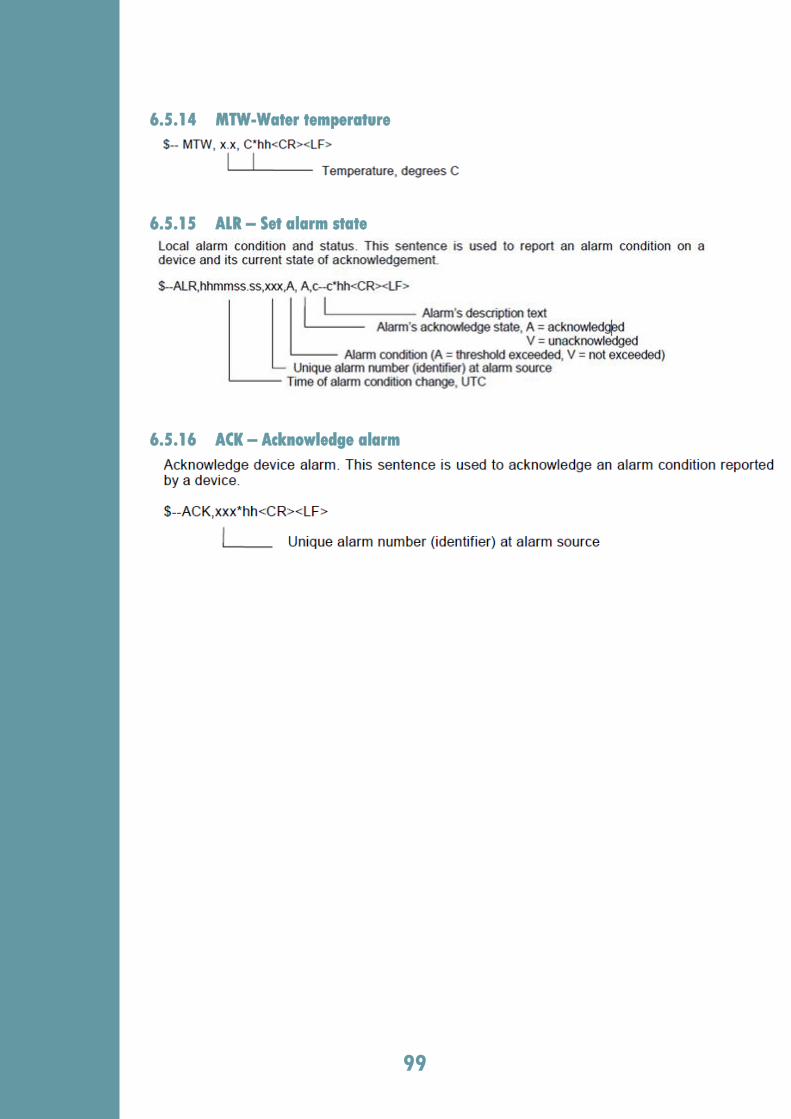
99
6.5.14 MTW-Water temperature
6.5.15 ALR – Set alarm state
6.5.16 ACK – Acknowledge alarm

100
6.5.17 AKD – Acknowledge detail alarm condition
6.5.18 HDT – Heading true
6.5.19 HDG – Deviation and variation

101
6.5.20 THS – True heading and status
6.5.21 ROT – Rate of turn
6.5.22 VTG – Course over ground and ground speed
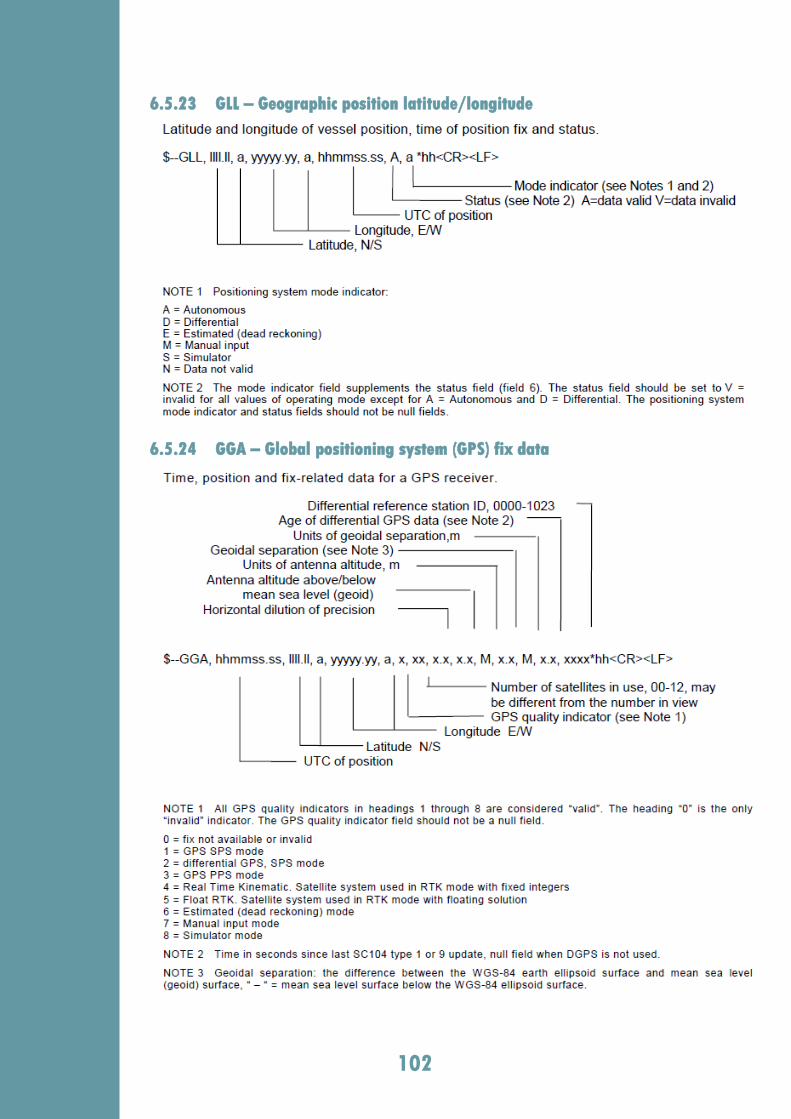
102
6.5.23 GLL – Geographic position latitude/longitude
6.5.24 GGA – Global positioning system (GPS) fix data
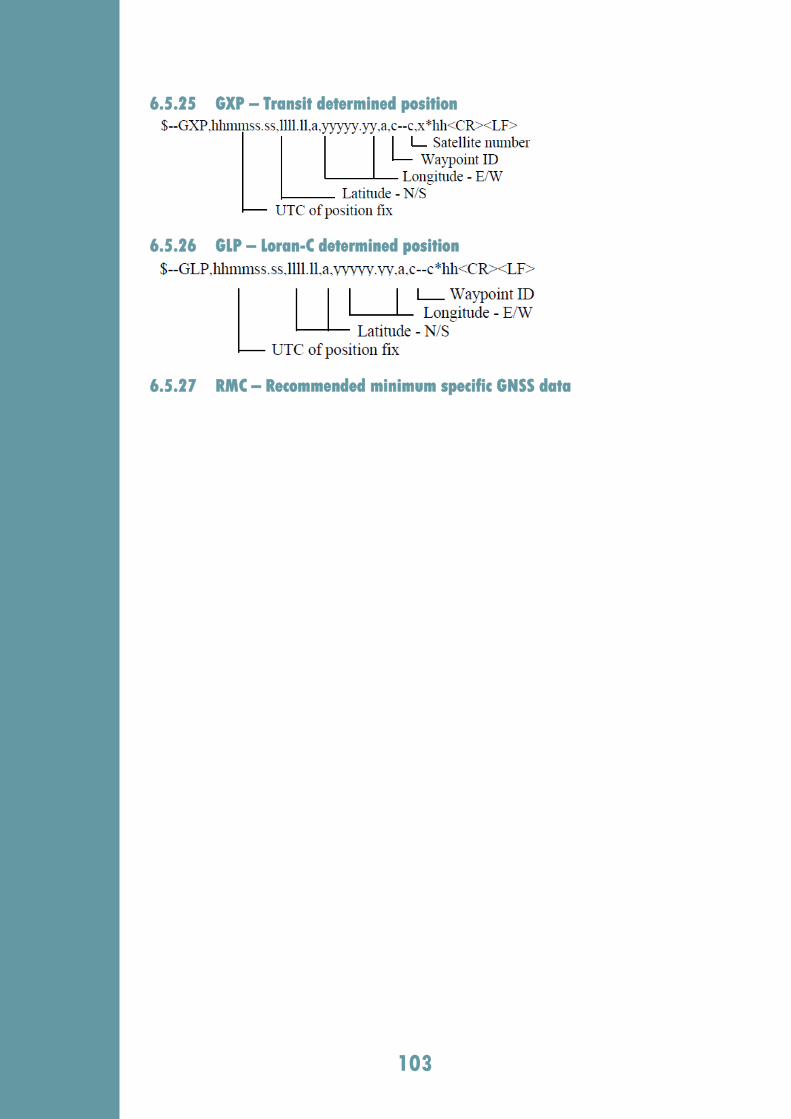
103
6.5.25 GXP – Transit determined position
6.5.26 GLP – Loran-C determined position
6.5.27 RMC – Recommended minimum specific GNSS data
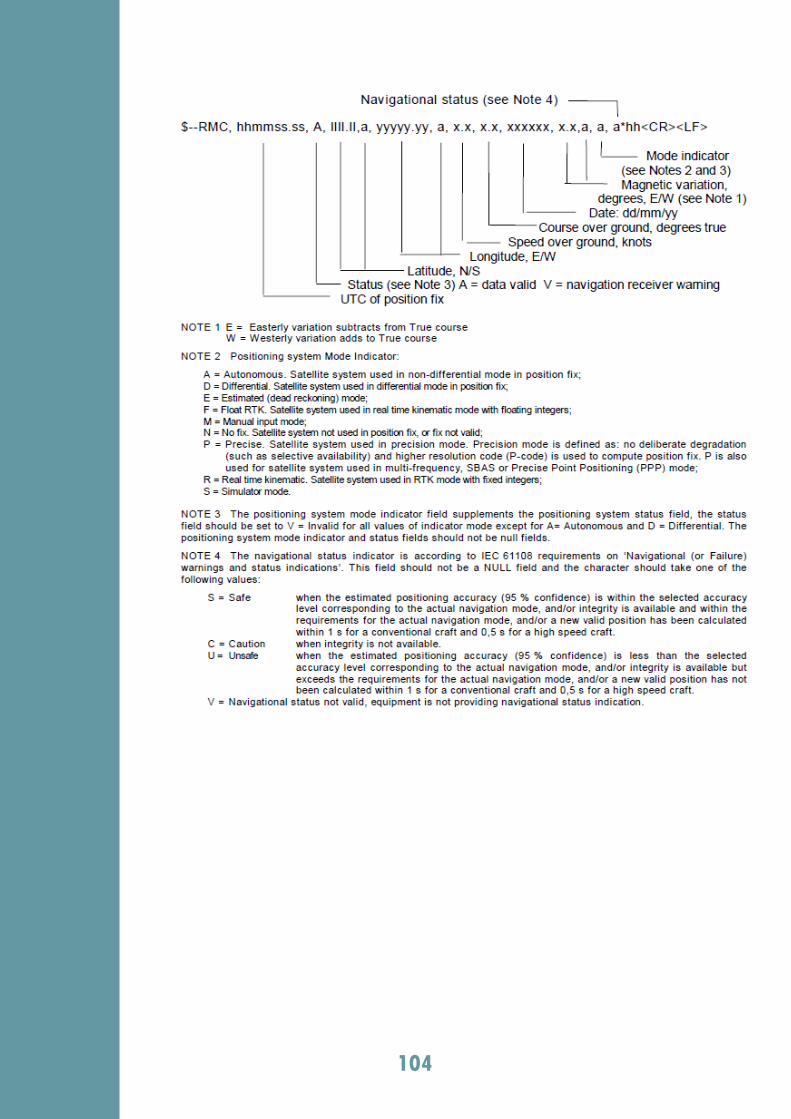
104
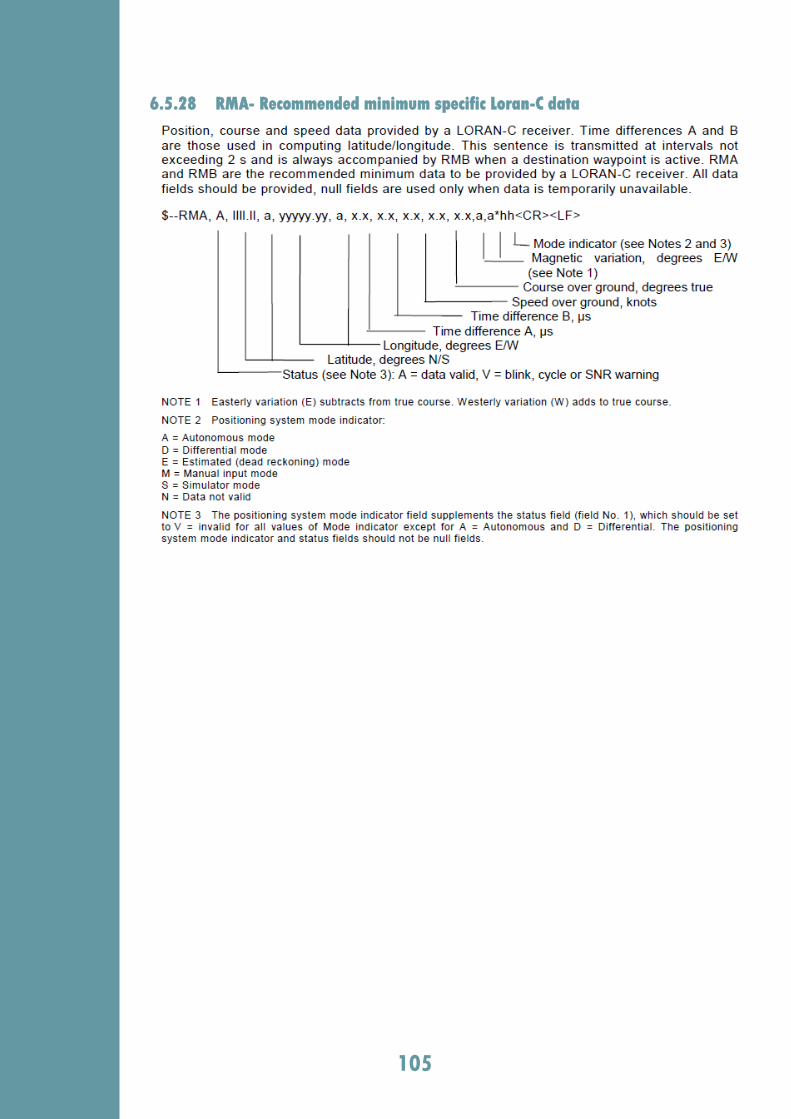
105
6.5.28 RMA- Recommended minimum specific Loran-C data
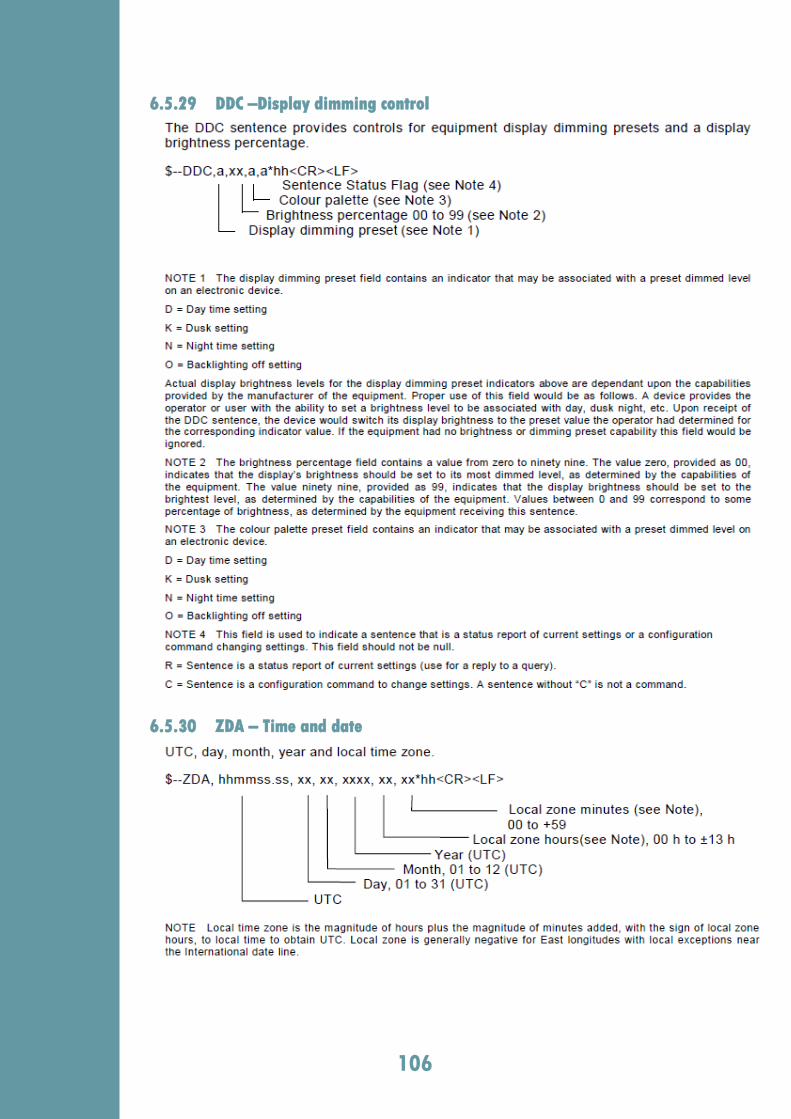
106
6.5.29 DDC –Display dimming control
6.5.30 ZDA – Time and date

107
7 Northern Solutions
7.1 The Company
Northern Solutions AS, based in Norway, is based on a group of
experienced and committed engineers and project managers.
The development team has over 20 years’ experience in
designing and supporting the products for the merchant fleet,
hydrographic market and fisheries. Products developed to date,
including single/dual channel and multi beam echosounders,
acoustic and electromagnetic speed logs, and different kinds of
operator and interfacing units, have an excellent reputation in the
worldwide navigation market.
The main scope of interest of the company is hydroacoustic and
electromagnetic instruments, including sensors, processing units
and man-machine interface for the marine equipment.
The company experience is built not only based on the design “in
front of the drawing board”, but also on many weeks on board
different kind of vessels, ranging from small size fishing boats up to
super tankers and container ships. This allows the designers to listen
to the opinion of a very important group of customers: the end-
users.
The company philosophy is very simple: to supply reliable products
and services at a competitive price, and to provide customers
with slightly more than they expected.
7.2 Contacting Northern Solutions
email [email protected]
web http://www.nor-solutions.com
telephone +47 90 16 72 84
post Northern Solutions AS, Steinalderveien, 2E 1407,
Vinterbro, Norway

108
Northern Solutions
Steinalderveien 2E
1407 Vinterbro
Norway
Org: 912 403 653
+47 90 16 72 84