Embed Size (px)
Citation preview
® Employee Benefit Research Institute 2016 ® Employee Benefit Research Institute 201 1
Employee Engagement in Health and Retirement Challenges and Reforms
EBRI-ERF Policy Forum #78 Thursday, May12, 2016

® Employee Benefit Research Institute 2016 ® Employee Benefit Research Institute 201 2
EBRI-ERF Policy Forum #78 Thursday, May 12, 2016
Innovations in Employee Engagement in Health

® Employee Benefit Research Institute 2016 ® Employee Benefit Research Institute 201 3
EBRI-ERF Policy Forum #78 Thursday, May 12, 2016
IBM's Commitment to a Culture of Health and Watson Health
® Employee Benefit Research Institute 2016 ® Employee Benefit Research Institute 201 4
EBRI-ERF Policy Forum #78 Thursday, May 12, 2016
Behavioral Economics and Employee Engagement – Carrots, Sticks or Something
Else?
Copyright © 2016 by The Segal Group, Inc. All rights reserved.
BEHAVIORAL ECONOMICS AND EMPLOYEE ENGAGEMENT
Carrots, Sticks or Something Else?
May 12, 2016
J. David Johnson, MBA Vice President, Senior Consultant [email protected] 202.833.6482
6
Understanding the Challenge
Leveraging Behavioral Economics to Drive Employee Engagement
Establishing a Framework for Effective Incentive Design
Some Practical Tips
For Additional Information
Discussion Overview
7
Understanding the Challenge
8
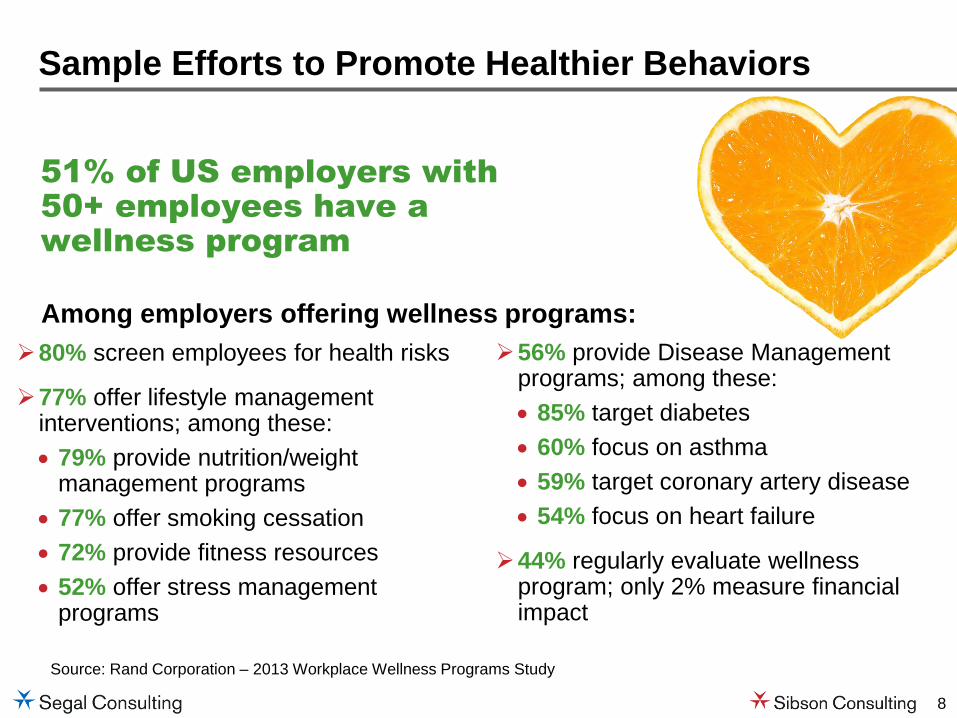
Source: Rand Corporation – 2013 Workplace Wellness Programs Study
51% of US employers with
50+ employees have a
wellness program
Sample Efforts to Promote Healthier Behaviors
Among employers offering wellness programs:
56% provide Disease Management programs; among these:
85% target diabetes
60% focus on asthma
59% target coronary artery disease
54% focus on heart failure
44% regularly evaluate wellness program; only 2% measure financial impact
80% screen employees for health risks
77% offer lifestyle management interventions; among these:
79% provide nutrition/weight management programs
77% offer smoking cessation
72% provide fitness resources
52% offer stress management programs
9
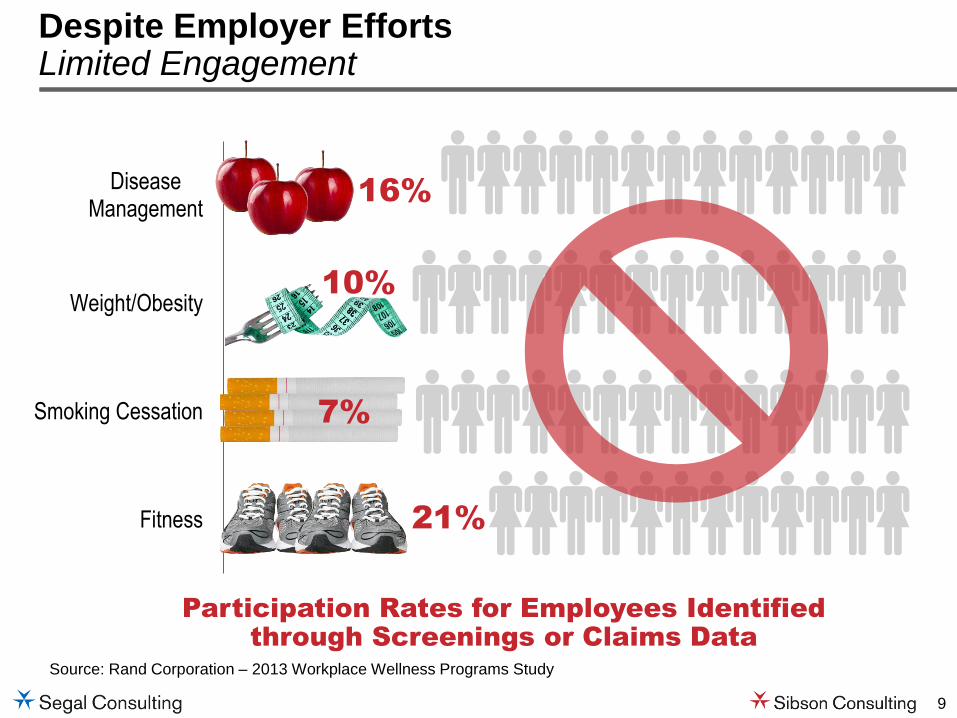
Despite Employer Efforts Limited Engagement
Source: Rand Corporation – 2013 Workplace Wellness Programs Study
21%
10%
16%
Fitness
Smoking Cessation
Weight/Obesity
DiseaseManagement
Participation Rates for Employees Identified
through Screenings or Claims Data
7%
10
Leveraging Behavioral Economics to Drive Employee Engagement in Health Improvement
11
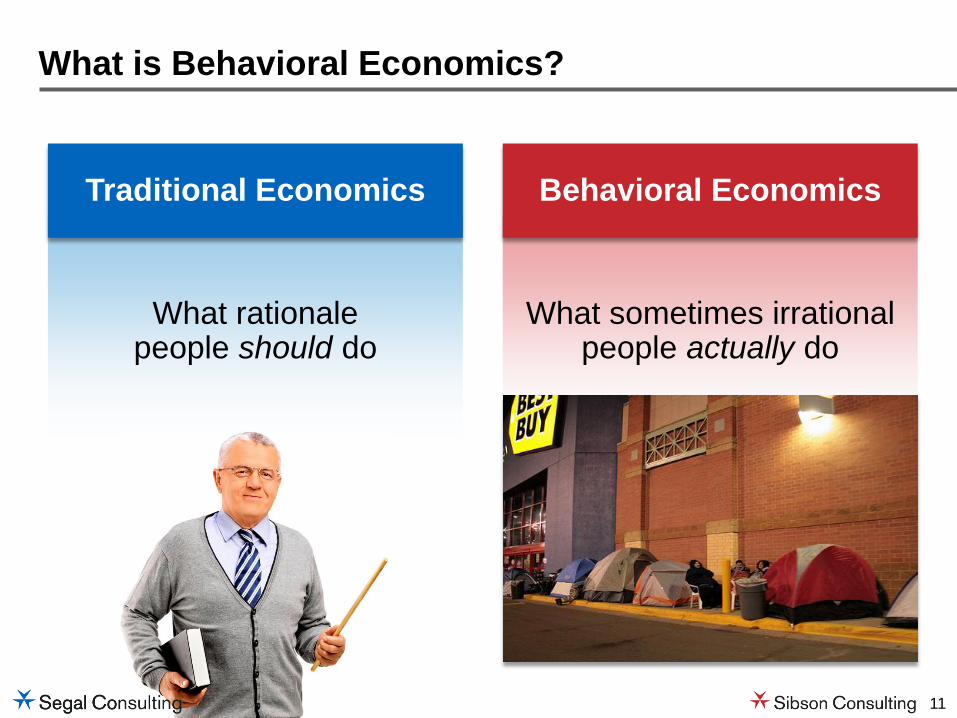
What is Behavioral Economics?
What rationale people should do
What sometimes irrational people actually do
Traditional Economics Behavioral Economics
12
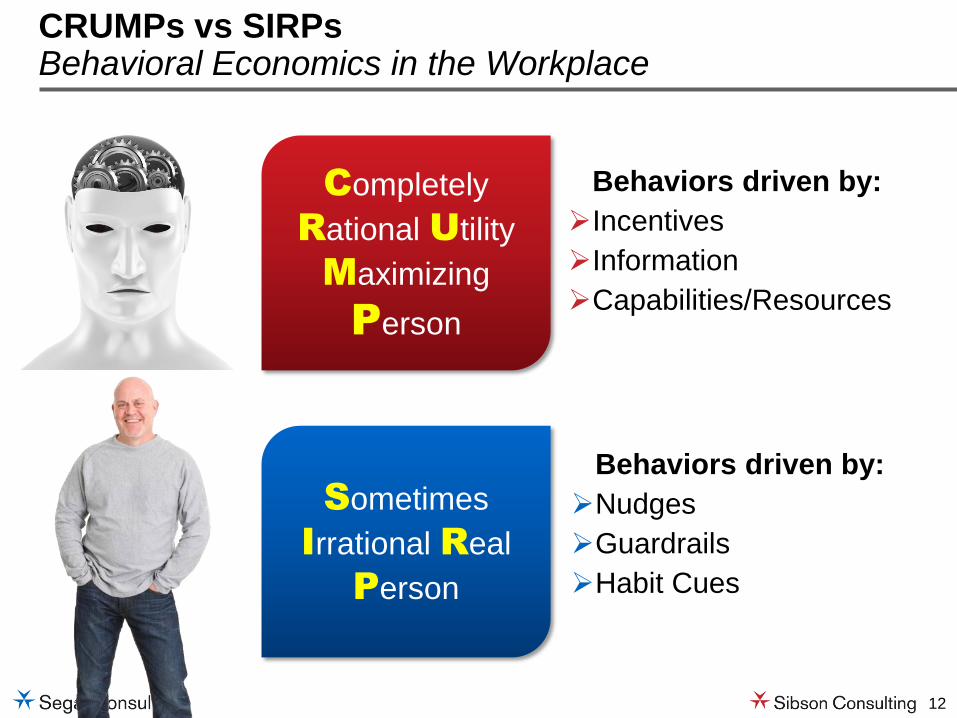
Completely
Rational Utility
Maximizing
Person
Behaviors driven by:
Incentives
Information
Capabilities/Resources
CRUMPs vs SIRPs Behavioral Economics in the Workplace
Sometimes
Irrational Real
Person
Behaviors driven by:
Nudges
Guardrails
Habit Cues
13
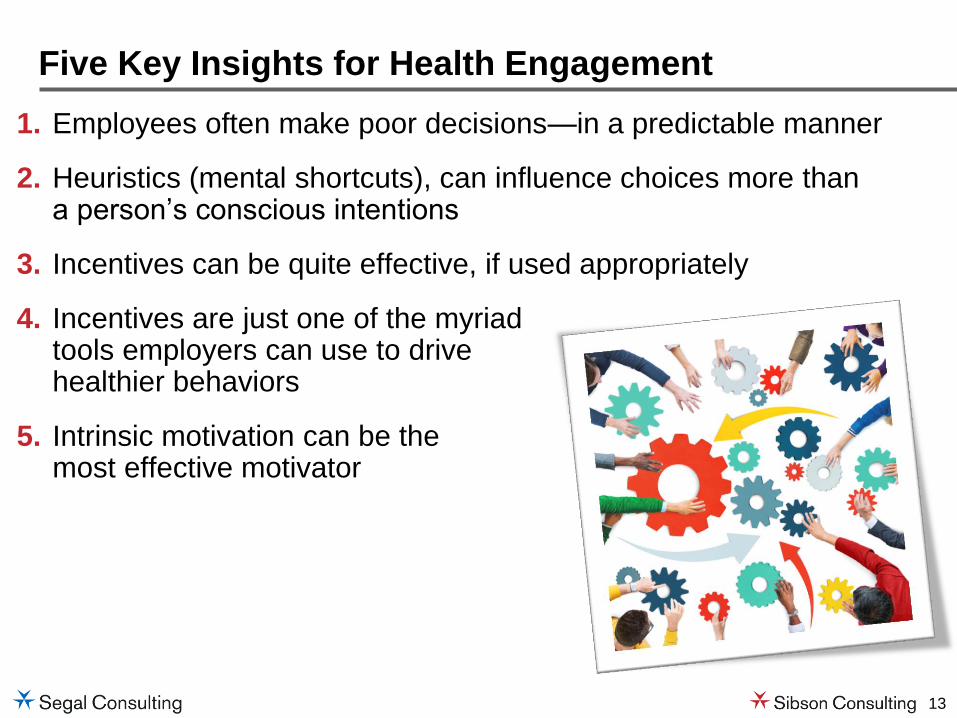
1. Employees often make poor decisions—in a predictable manner
2. Heuristics (mental shortcuts), can influence choices more than a person’s conscious intentions
3. Incentives can be quite effective, if used appropriately
4. Incentives are just one of the myriad tools employers can use to drive healthier behaviors
5. Intrinsic motivation can be the most effective motivator
Five Key Insights for Health Engagement
14
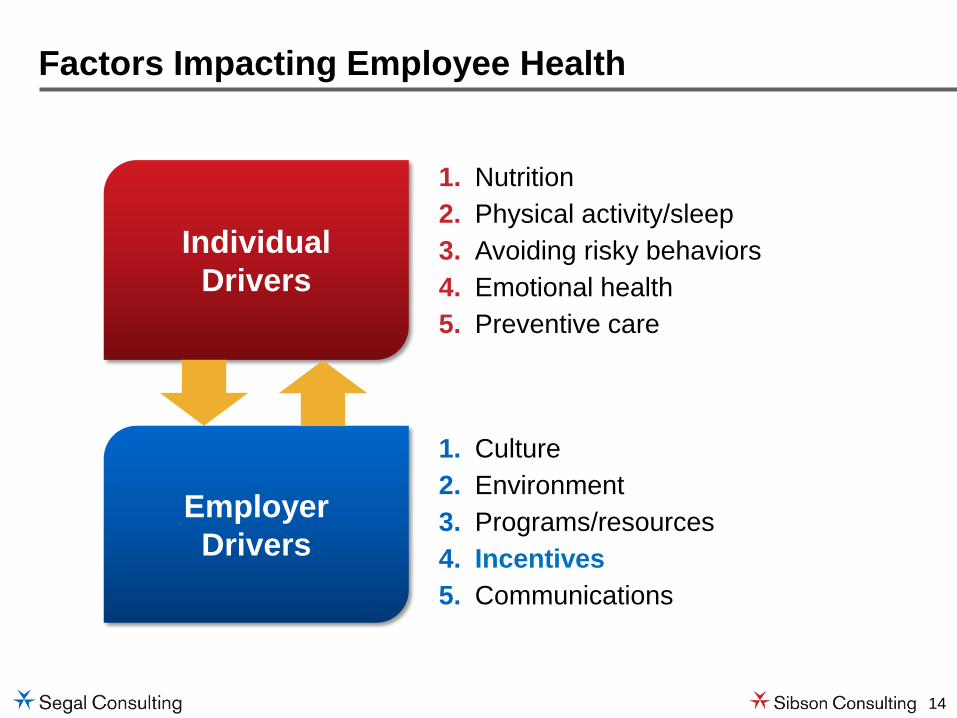
Factors Impacting Employee Health
Individual
Drivers
1. Nutrition
2. Physical activity/sleep
3. Avoiding risky behaviors
4. Emotional health
5. Preventive care
Employer
Drivers
1. Culture
2. Environment
3. Programs/resources
4. Incentives
5. Communications
15
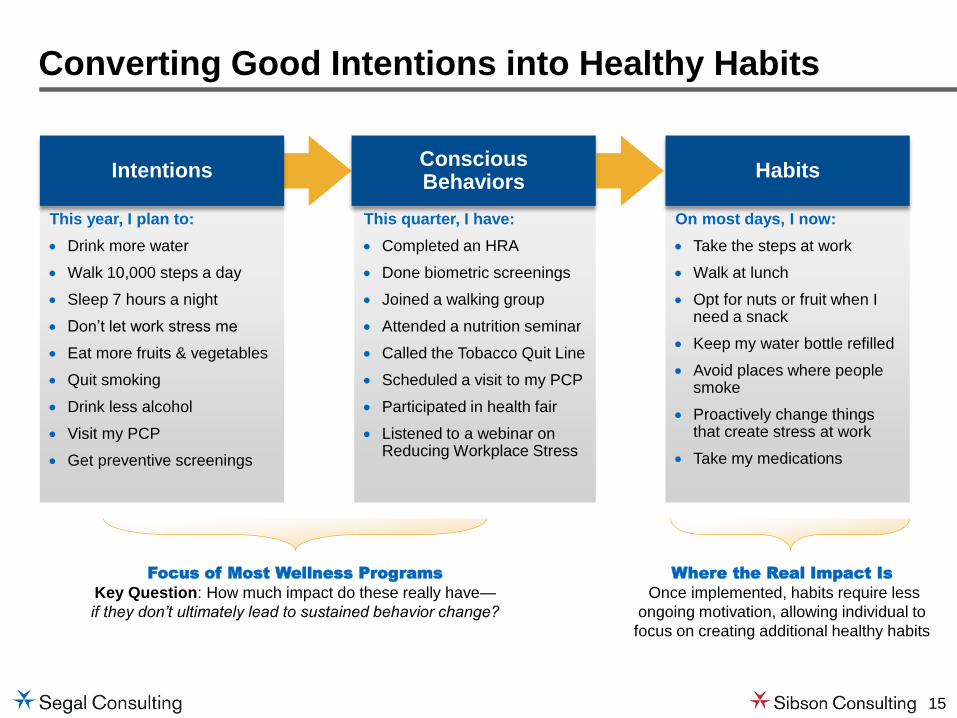
Converting Good Intentions into Healthy Habits
This year, I plan to:
Drink more water
Walk 10,000 steps a day
Sleep 7 hours a night
Don’t let work stress me
Eat more fruits & vegetables
Quit smoking
Drink less alcohol
Visit my PCP
Get preventive screenings
This quarter, I have:
Completed an HRA
Done biometric screenings
Joined a walking group
Attended a nutrition seminar
Called the Tobacco Quit Line
Scheduled a visit to my PCP
Participated in health fair
Listened to a webinar on Reducing Workplace Stress
On most days, I now:
Take the steps at work
Walk at lunch
Opt for nuts or fruit when I need a snack
Keep my water bottle refilled
Avoid places where people smoke
Proactively change things that create stress at work
Take my medications
Focus of Most Wellness Programs
Key Question: How much impact do these really have—
if they don’t ultimately lead to sustained behavior change?
Where the Real Impact Is
Once implemented, habits require less
ongoing motivation, allowing individual to
focus on creating additional healthy habits
Intentions Conscious Behaviors
Habits

16
Factors Impacting Sustained Behavior Change
Intentions Conscious Behaviors Habits Coaching
Attitudes2
Self-Efficacy2
Perceived Norms2
Motivation3
Ability3
Repetition in a Stable Context4
Convenience
Readiness to Change1
Coaching
Sources 1 Transtheoretical Model developed by James Prochaska, PhD, Carlo DiClemente, PhD, and John Norcross, PhD 2 Theory of Planned Behavior developed by Icek Ajzen, PhD 3 Fogg Behavioral Model developed by B.J. Fogg, PhD 4 Research in habit formation developed by Wendy Wood, PhD
17
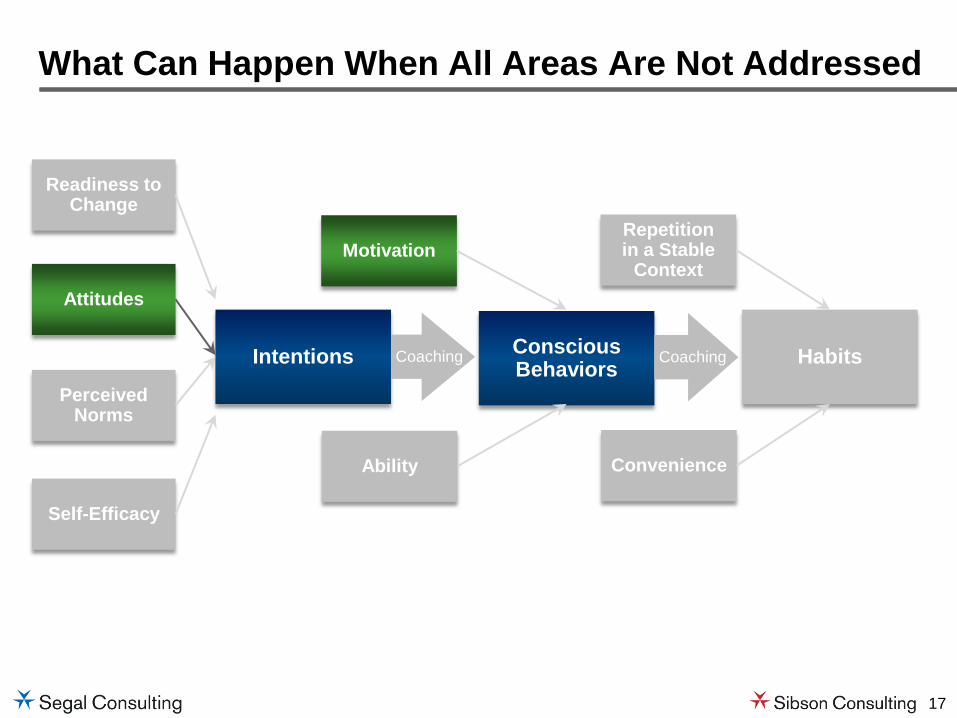
What Can Happen When All Areas Are Not Addressed
Intentions Conscious Behaviors Habits Coaching
Attitudes
Self-Efficacy
Perceived Norms
Motivation
Ability
Repetition in a Stable
Context
Convenience
Readiness to Change
Coaching
18
Establishing a Framework for Effective Incentive Design
19
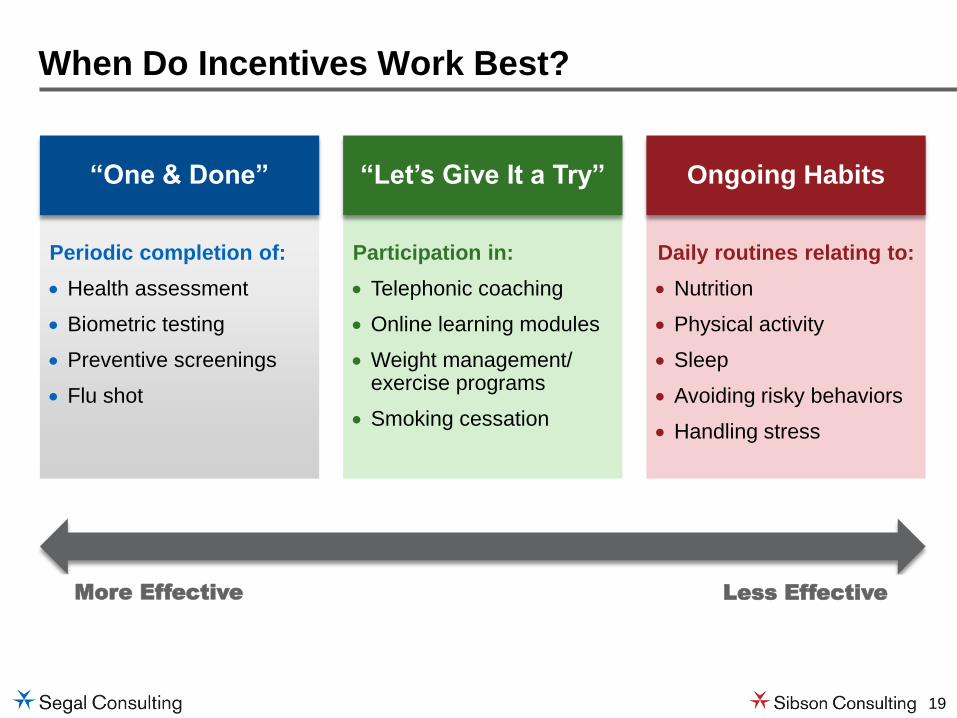
When Do Incentives Work Best?
More Effective
Less Effective
Periodic completion of:
Health assessment
Biometric testing
Preventive screenings
Flu shot
Participation in:
Telephonic coaching
Online learning modules
Weight management/ exercise programs
Smoking cessation
Daily routines relating to:
Nutrition
Physical activity
Sleep
Avoiding risky behaviors
Handling stress
“One & Done” “Let’s Give It a Try” Ongoing Habits

20
Intrinsic Motivation
Low
High
Ability/Convenience
Low High
Employee D lacks motivation and ability, but would be willing to complete task for $200
Establishing the Optimal Incentive Amount
Employee A lack’s intrinsic motivation, but finds task is relatively easy to do, so $150 incentive is enough to drive compliance
Employee B finds task difficult to complete, but has high intrinsic motivation to do it, so the $150 incentive drives compliance
Employee C would have completed task for <$150
$150
21
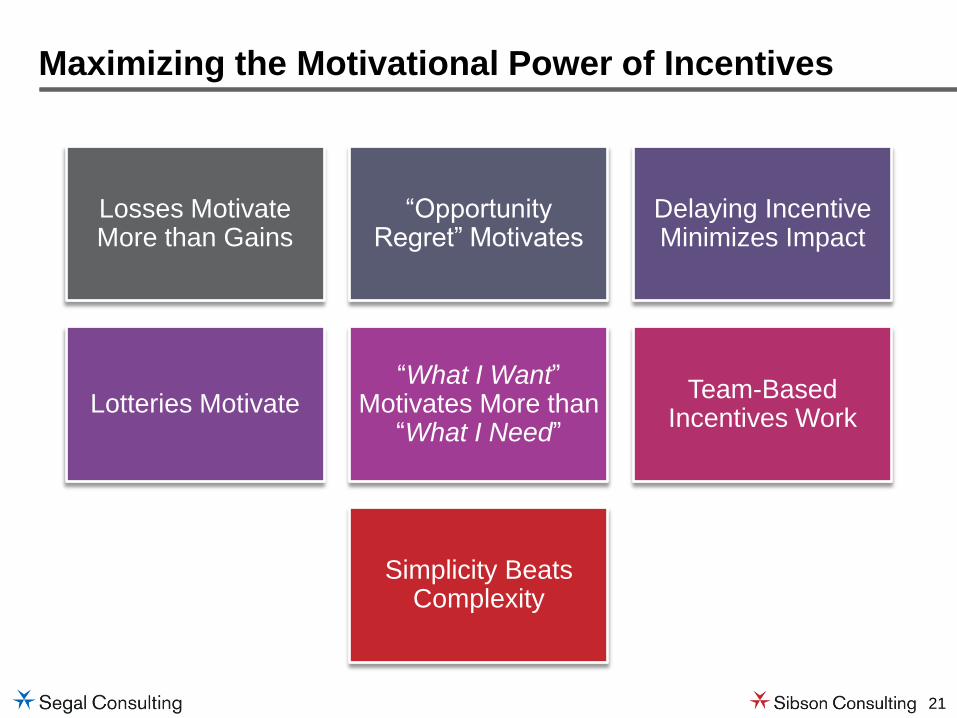
Maximizing the Motivational Power of Incentives
Losses Motivate More than Gains
“Opportunity Regret” Motivates
Delaying Incentive Minimizes Impact
Lotteries Motivate “What I Want”
Motivates More than “What I Need”
Team-Based Incentives Work
Simplicity Beats Complexity
22
Some Practical Tips from Experiments in Behavioral Economics
23
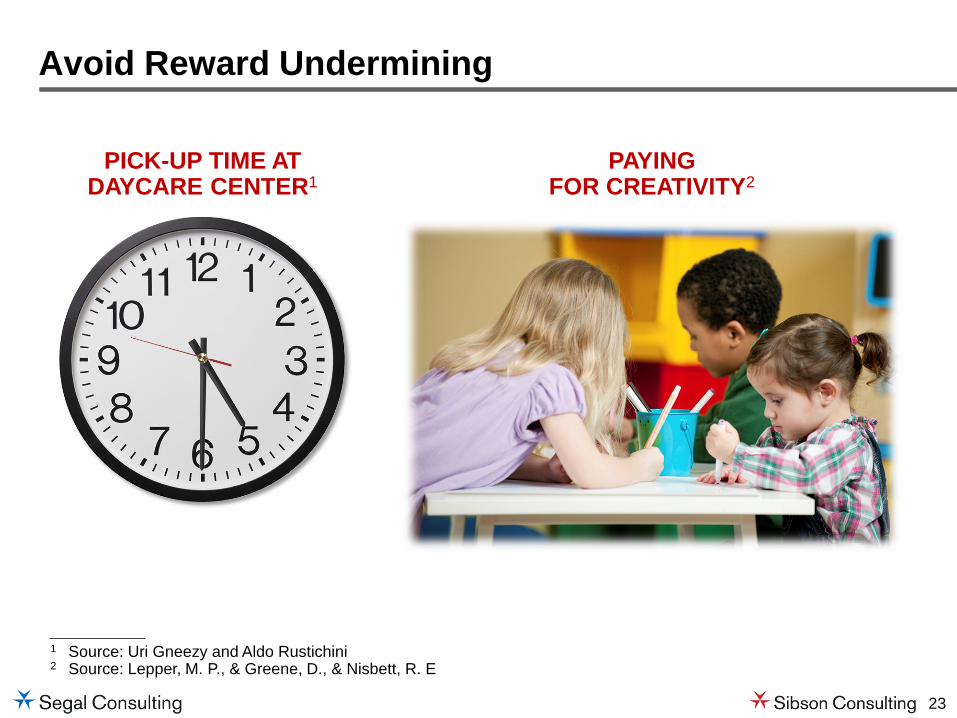
Avoid Reward Undermining
PICK-UP TIME AT DAYCARE CENTER1
PAYING FOR CREATIVITY2
1 Source: Uri Gneezy and Aldo Rustichini 2 Source: Lepper, M. P., & Greene, D., & Nisbett, R. E
24
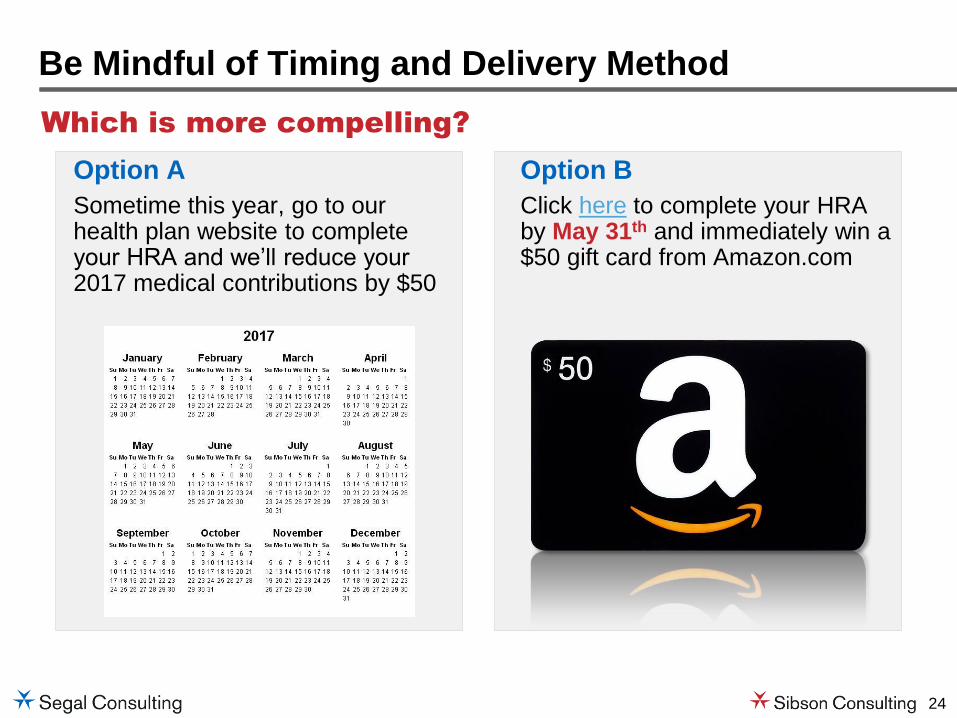
Which is more compelling?
Be Mindful of Timing and Delivery Method
Option B
Click here to complete your HRA by May 31th and immediately win a $50 gift card from Amazon.com
Option A
Sometime this year, go to our health plan website to complete your HRA and we’ll reduce your 2017 medical contributions by $50
25
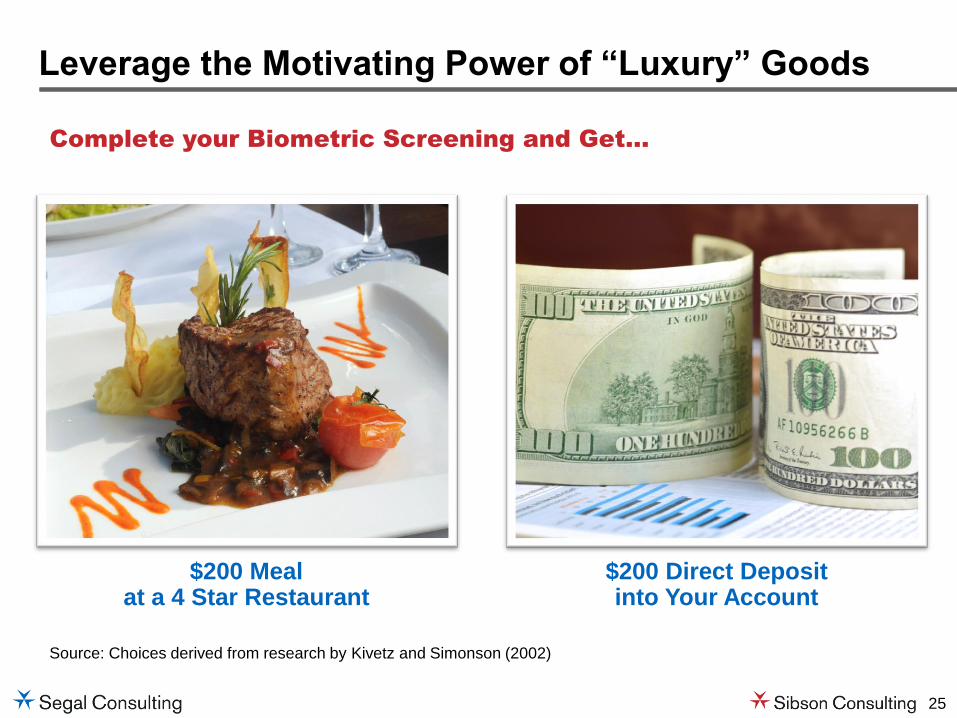
Leverage the Motivating Power of “Luxury” Goods
Complete your Biometric Screening and Get…
$200 Meal at a 4 Star Restaurant
$200 Direct Deposit into Your Account
Source: Choices derived from research by Kivetz and Simonson (2002)
26
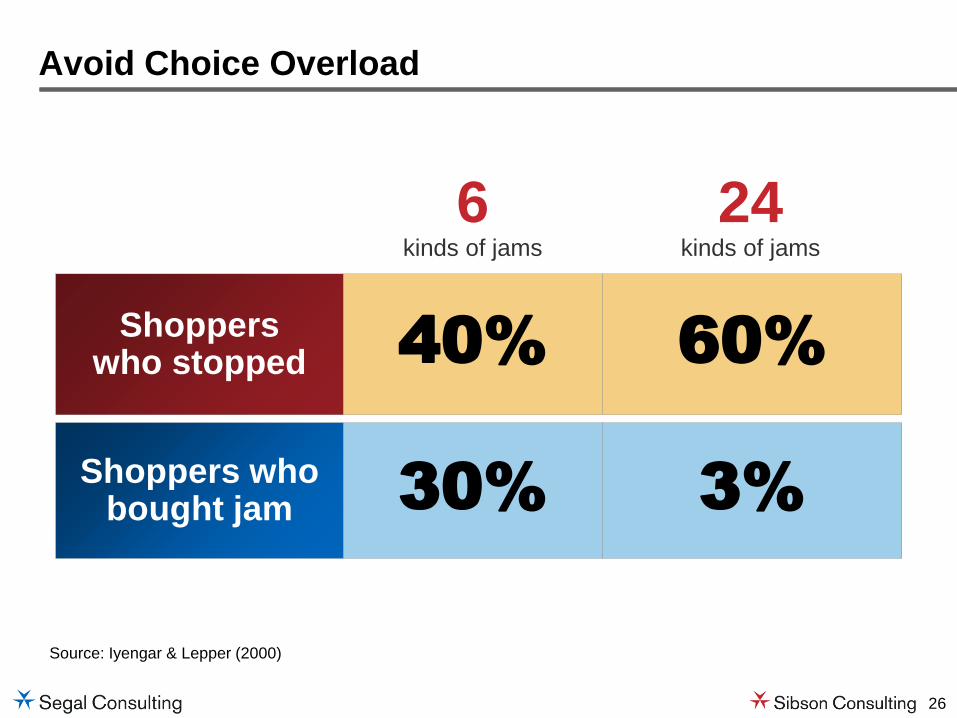
Avoid Choice Overload
Shoppers who stopped 40% 60%
6 kinds of jams
24 kinds of jams
Shoppers who bought jam 30% 3%
Source: Iyengar & Lepper (2000)
27
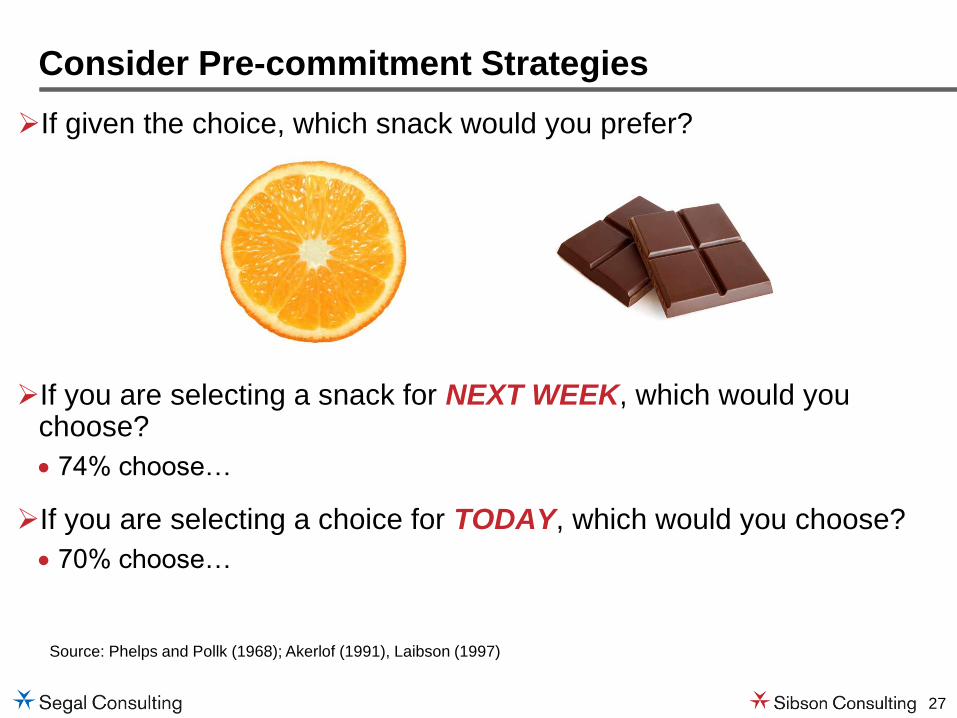
If you are selecting a snack for NEXT WEEK, which would you choose?
74% choose…
If you are selecting a choice for TODAY, which would you choose?
70% choose…
Consider Pre-commitment Strategies
Source: Phelps and Pollk (1968); Akerlof (1991), Laibson (1997)
If given the choice, which snack would you prefer?

28
Think about how Americans die from Heart Disease each year. Is it more or less than 5 million?
How many Americans die of heart disease annually?
Be Careful Setting Anchors

29
How many of you set the clock
on your DVD player?
Keep it Simple
30
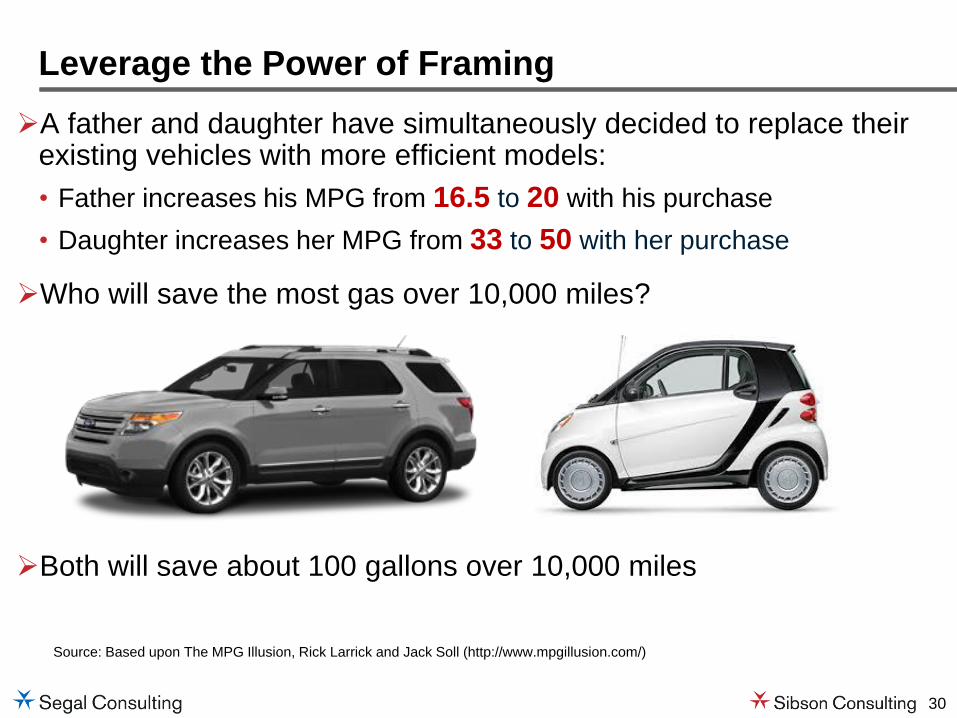
A father and daughter have simultaneously decided to replace their existing vehicles with more efficient models:
• Father increases his MPG from 16.5 to 20 with his purchase
• Daughter increases her MPG from 33 to 50 with her purchase
Who will save the most gas over 10,000 miles?
Leverage the Power of Framing
Both will save about 100 gallons over 10,000 miles
Source: Based upon The MPG Illusion, Rick Larrick and Jack Soll (http://www.mpgillusion.com/)
31
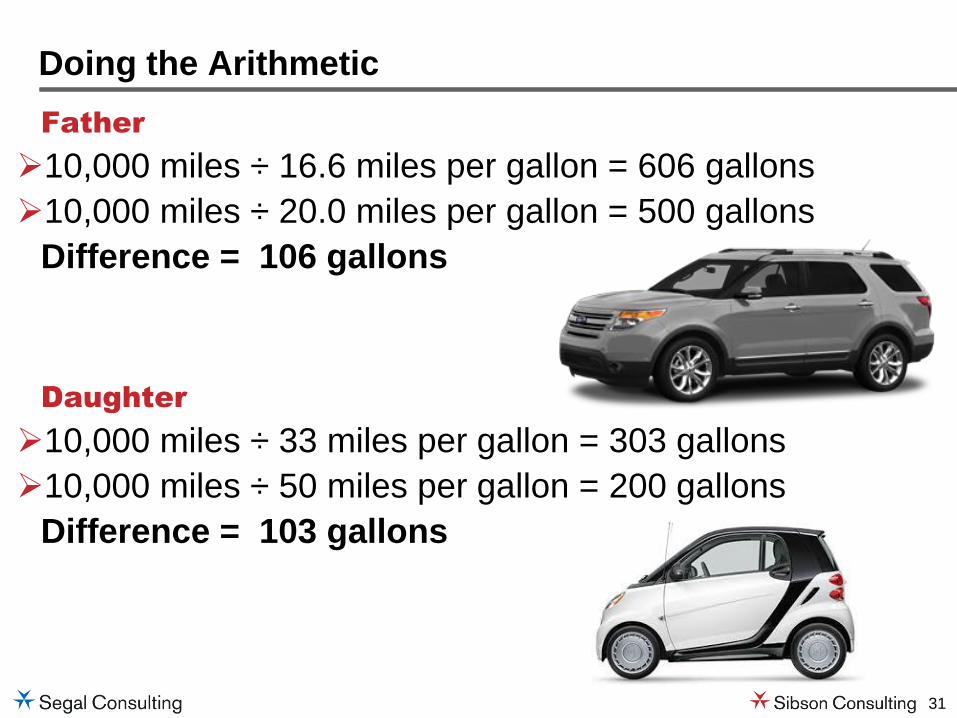
Father
10,000 miles ÷ 16.6 miles per gallon = 606 gallons
10,000 miles ÷ 20.0 miles per gallon = 500 gallons
Difference = 106 gallons
Daughter
10,000 miles ÷ 33 miles per gallon = 303 gallons
10,000 miles ÷ 50 miles per gallon = 200 gallons
Difference = 103 gallons
Doing the Arithmetic

32
For Additional Information…
33
Some Good Reading on Behavioral Economics
34
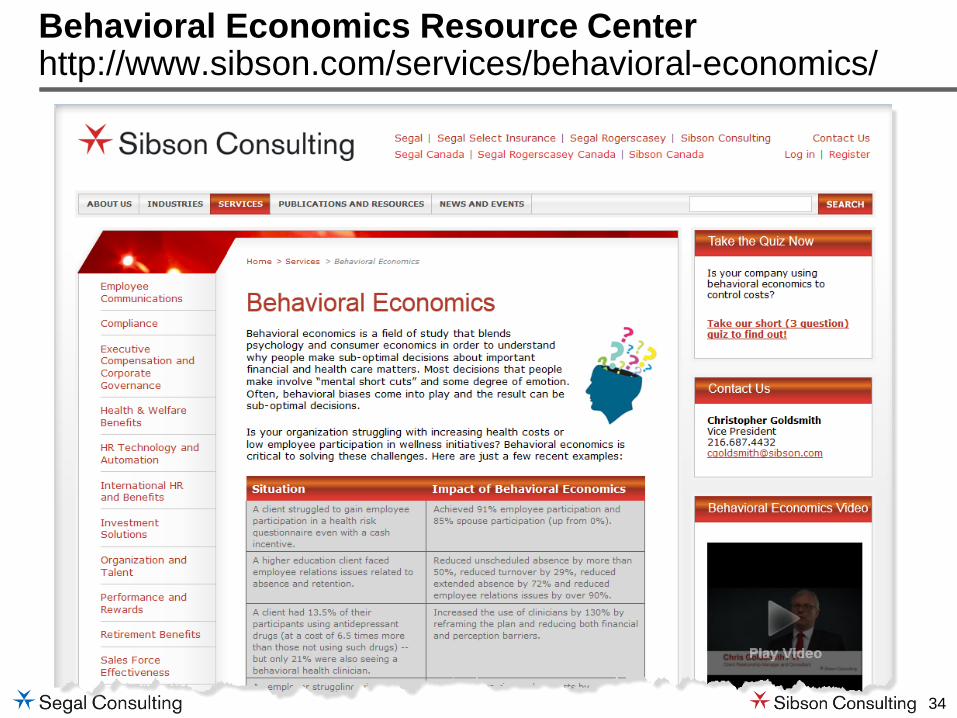
Behavioral Economics Resource Center http://www.sibson.com/services/behavioral-economics/
35
Thank you
J. David Johnson Vice President, Senior Consultant [email protected] 202.833.6482 www.sibson.com
Using the Affordable Care Act
to Convert Healthcare to Wellness
February 2, 2016
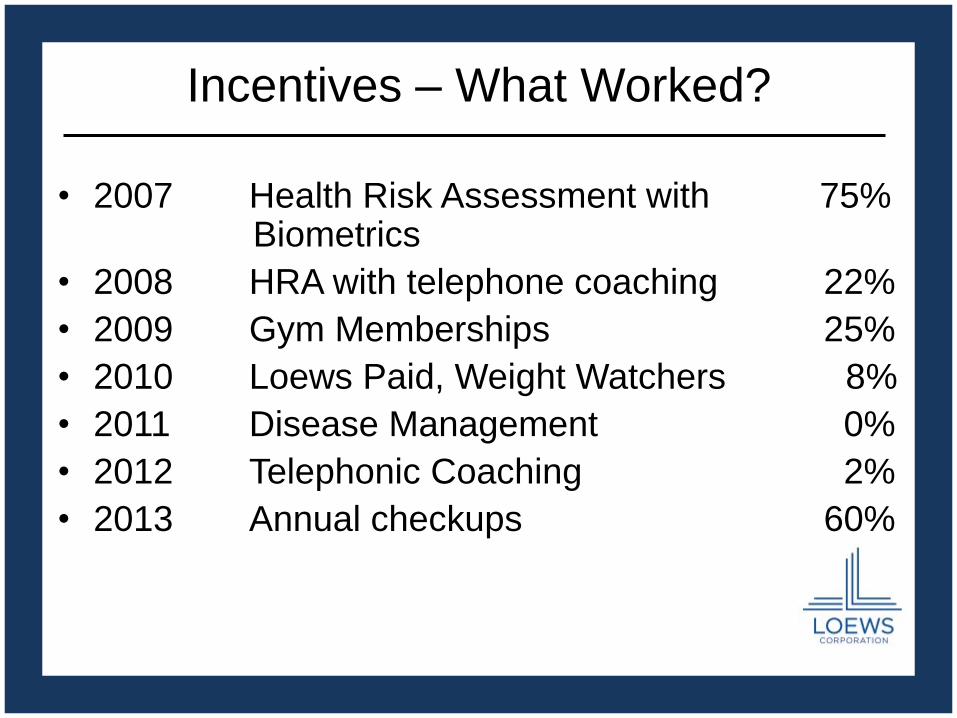
Incentives – What Worked?
• 2007 Health Risk Assessment with 75% Biometrics
• 2008 HRA with telephone coaching 22%
• 2009 Gym Memberships 25%
• 2010 Loews Paid, Weight Watchers 8%
• 2011 Disease Management 0%
• 2012 Telephonic Coaching 2%
• 2013 Annual checkups 60%
39
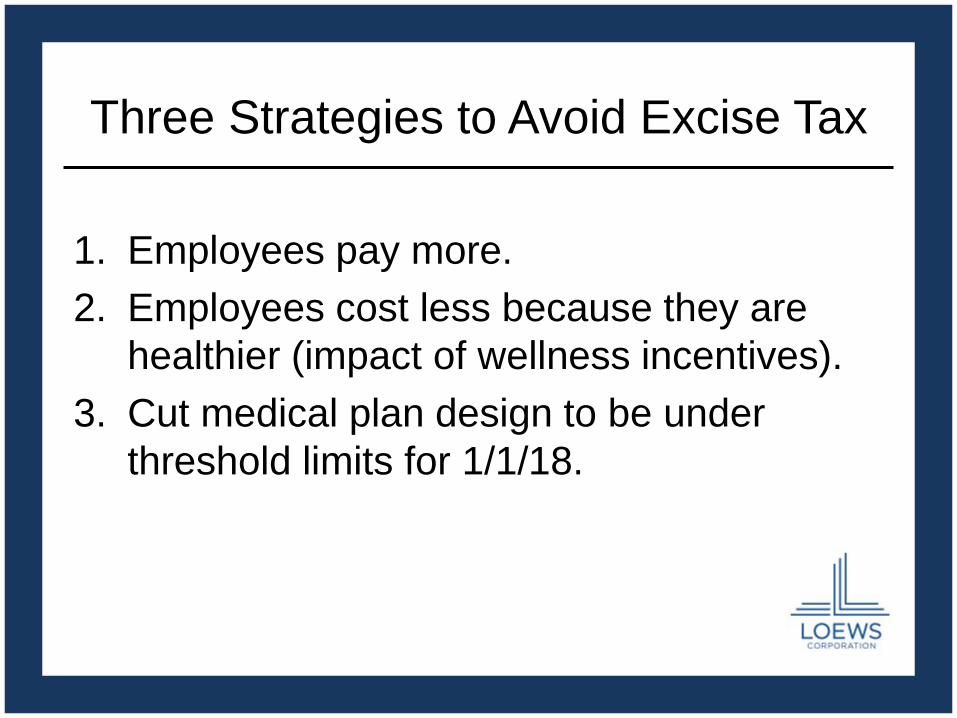
Three Strategies to Avoid Excise Tax
1. Employees pay more.
2. Employees cost less because they are
healthier (impact of wellness incentives).
3. Cut medical plan design to be under
threshold limits for 1/1/18.
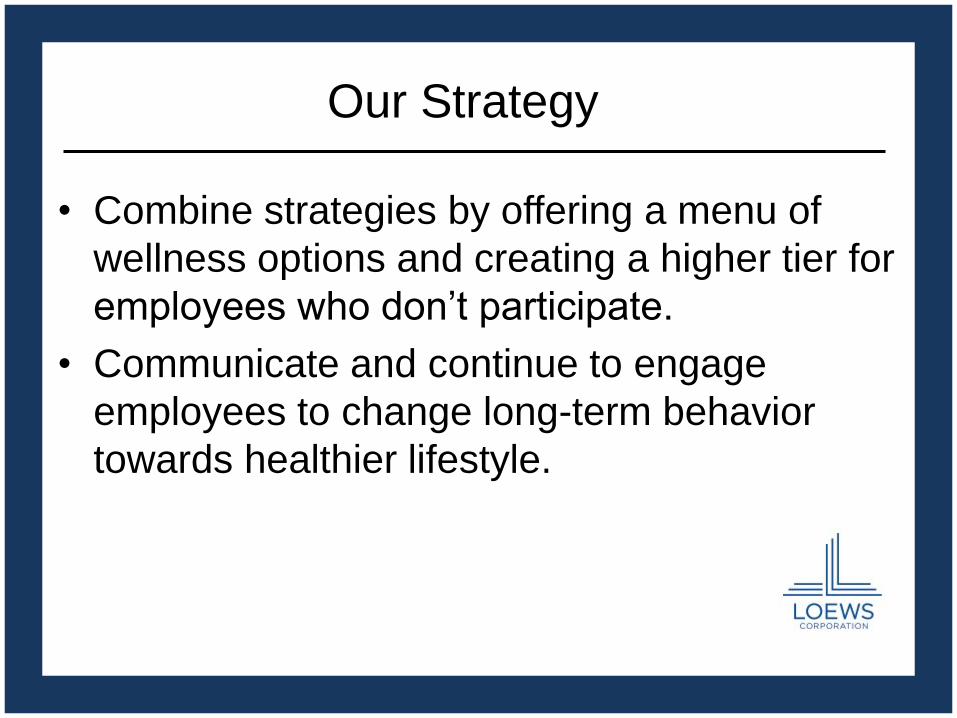
Our Strategy
• Combine strategies by offering a menu of
wellness options and creating a higher tier for
employees who don’t participate.
• Communicate and continue to engage
employees to change long-term behavior
towards healthier lifestyle.

What Works?
Carrot

What Works?
Carrot AND Stick
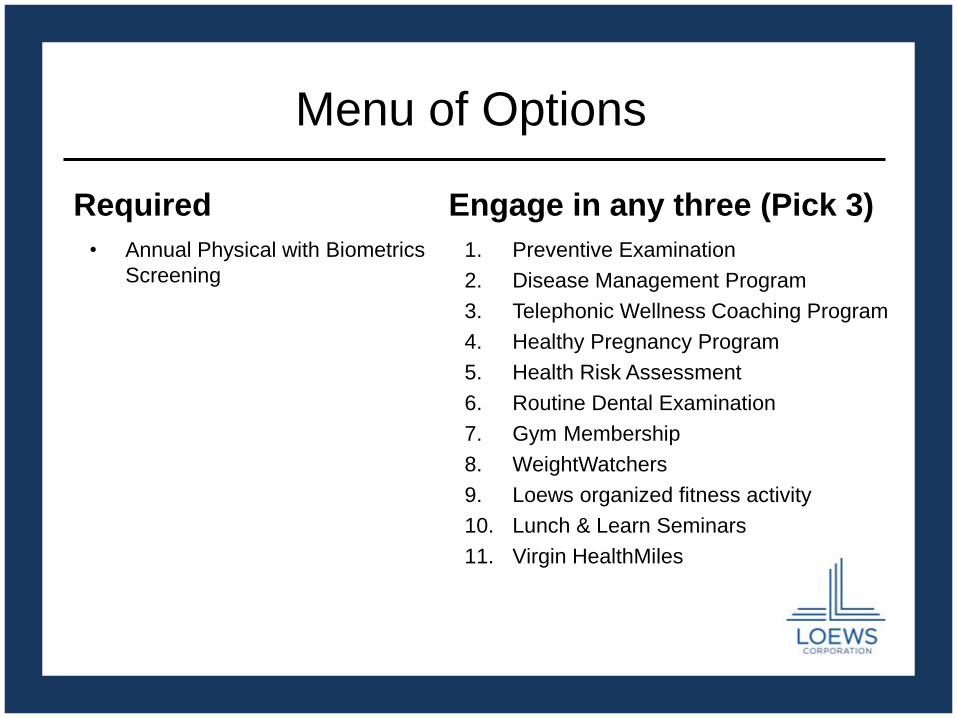
Menu of Options
Required
• Annual Physical with Biometrics
Screening
Engage in any three (Pick 3)
1. Preventive Examination
2. Disease Management Program
3. Telephonic Wellness Coaching Program
4. Healthy Pregnancy Program
5. Health Risk Assessment
6. Routine Dental Examination
7. Gym Membership
8. WeightWatchers
9. Loews organized fitness activity
10. Lunch & Learn Seminars
11. Virgin HealthMiles
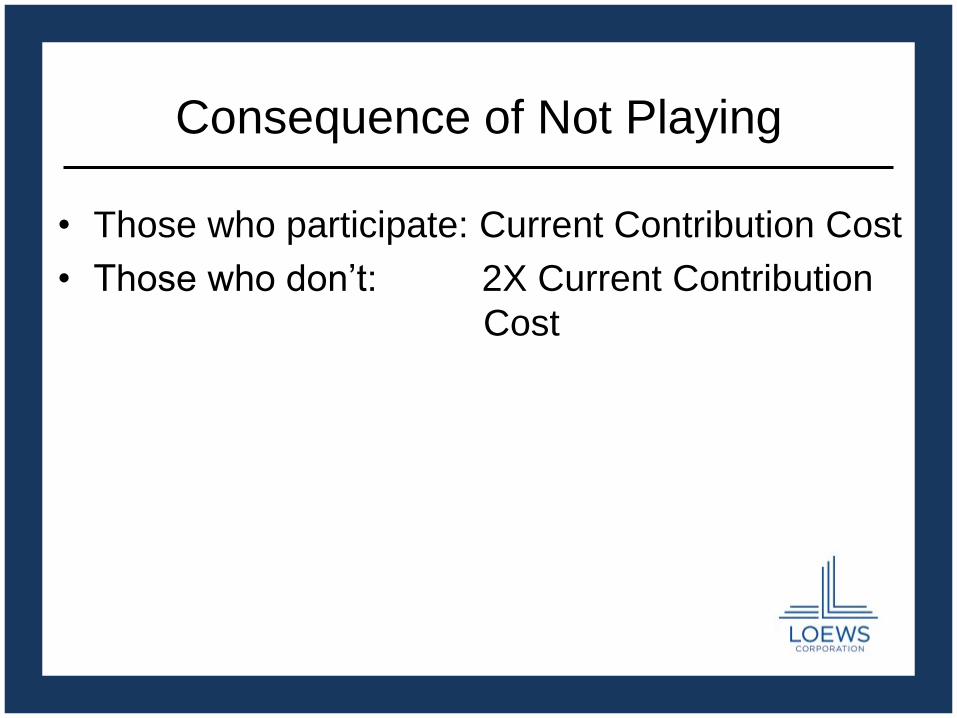
Consequence of Not Playing
• Those who participate: Current Contribution Cost
• Those who don’t: 2X Current Contribution
Cost

Results
500 Employees

485 Participants!
® Employee Benefit Research Institute 2016 ® Employee Benefit Research Institute 201 48
EBRI-ERF Policy Forum #78 Thursday, May 12, 2016
Innovation to Improve Health, Well-Being and Value
Employee Benefits Research Institute
Innovations around
Health, Well-being & Value
May, 2016
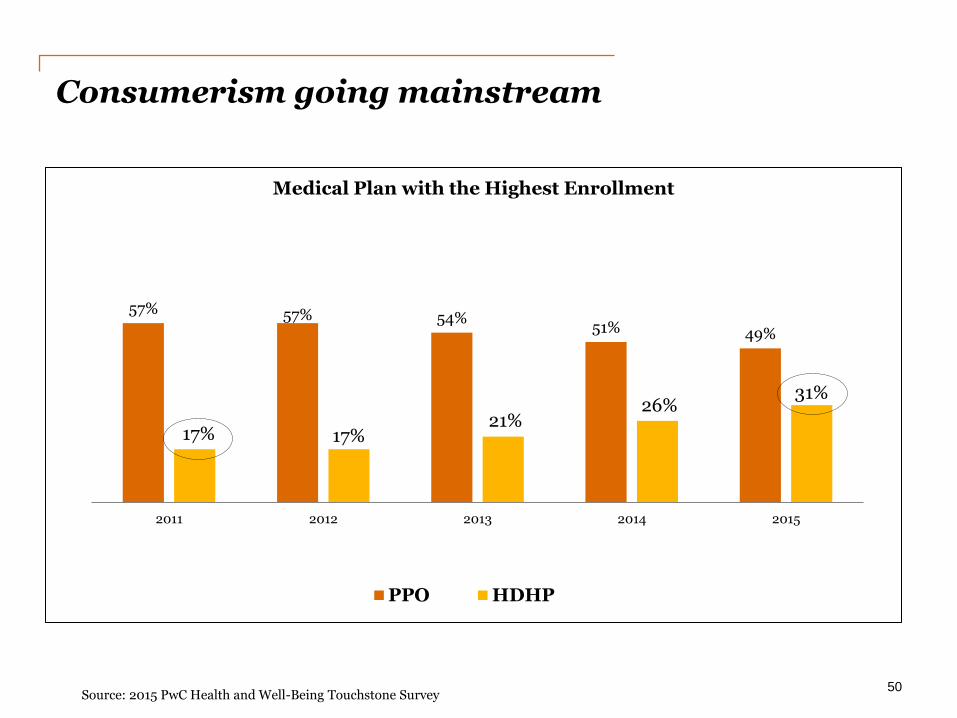
Consumerism going mainstream
50 Source: 2015 PwC Health and Well-Being Touchstone Survey
57% 57% 54% 51% 49%
17% 17% 21%
26% 31%
2011 2012 2013 2014 2015
Medical Plan with the Highest Enrollment
PPO HDHP
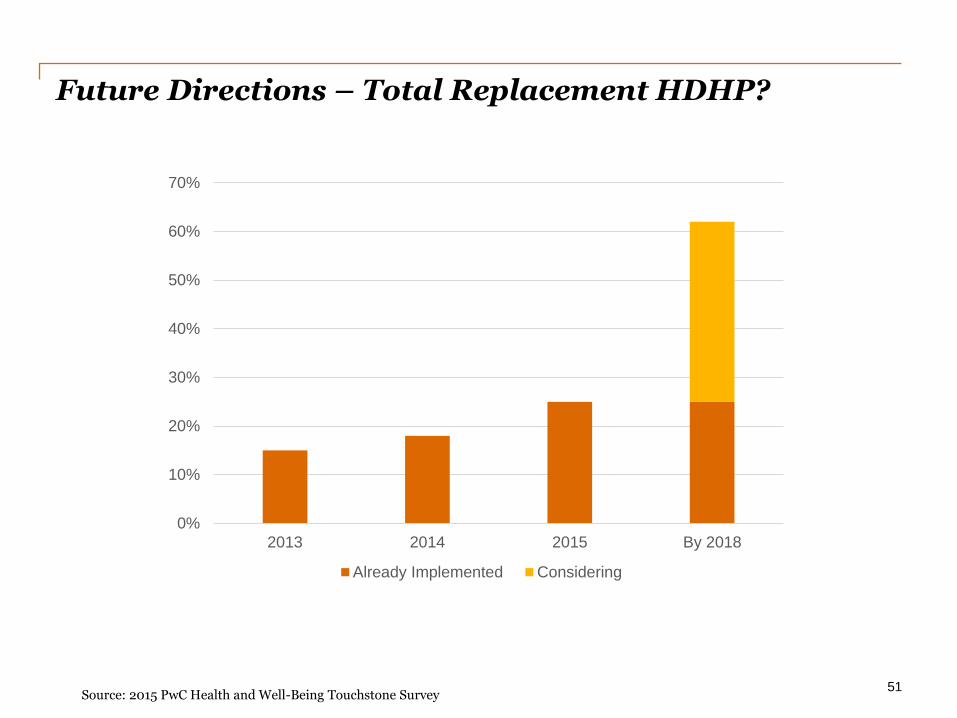
Future Directions – Total Replacement HDHP?
51
Source: 2015 PwC Health and Well-Being Touchstone Survey
0%
10%
20%
30%
40%
50%
60%
70%
2013 2014 2015 By 2018
Already Implemented Considering
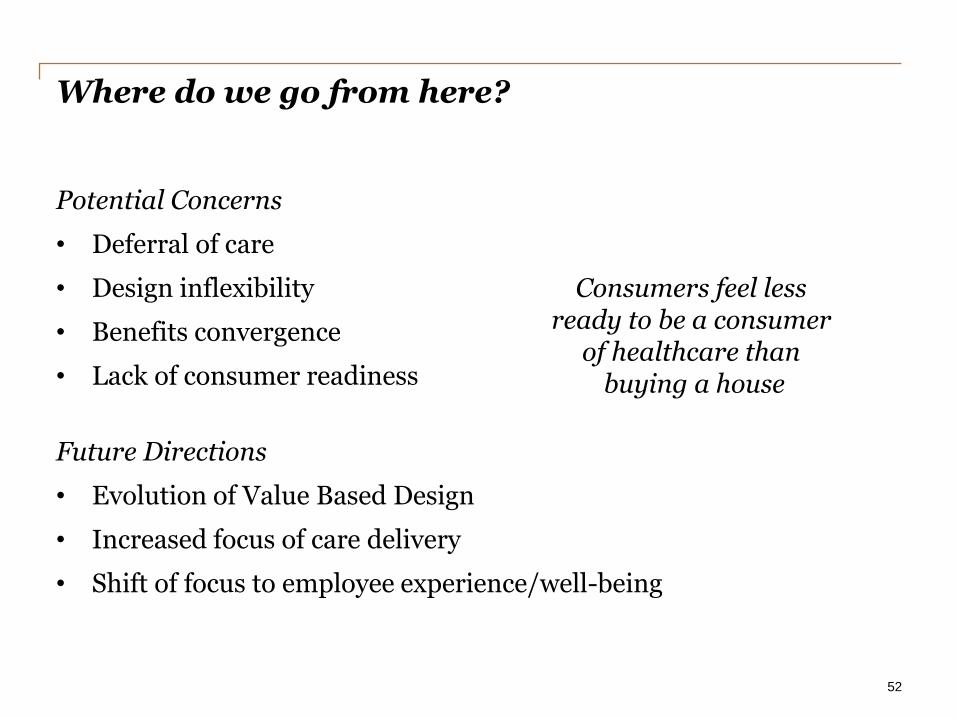
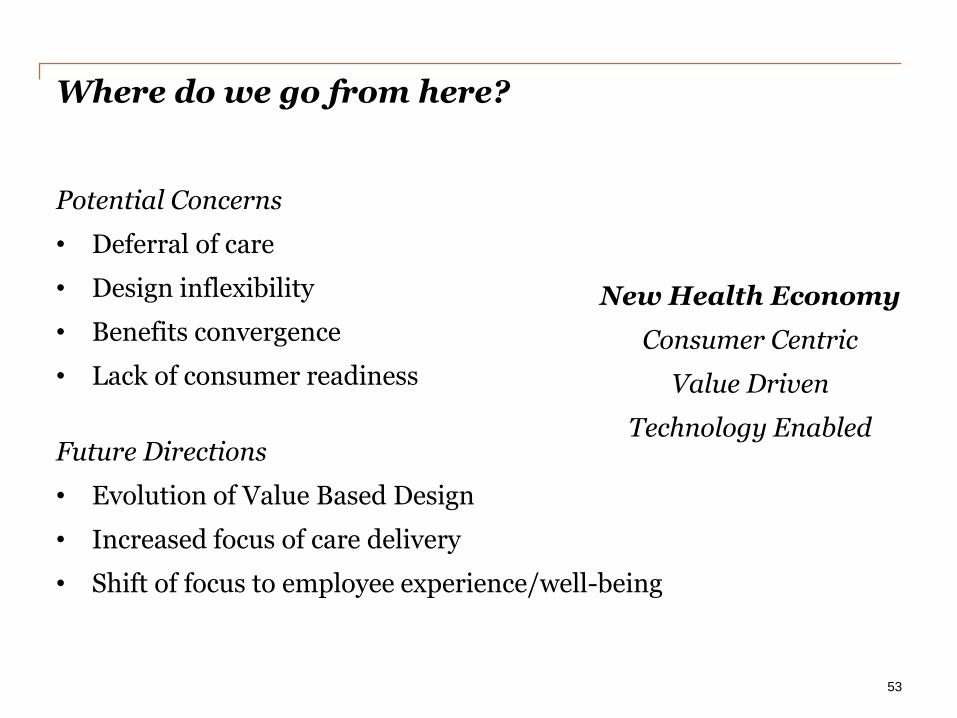
Where do we go from here?
Potential Concerns
• Deferral of care
• Design inflexibility
• Benefits convergence
• Lack of consumer readiness
Future Directions
• Evolution of Value Based Design
• Increased focus of care delivery
• Shift of focus to employee experience/well-being
52
Consumers feel less ready to be a consumer
of healthcare than buying a house
Where do we go from here?
Potential Concerns
• Deferral of care
• Design inflexibility
• Benefits convergence
• Lack of consumer readiness
Future Directions
• Evolution of Value Based Design
• Increased focus of care delivery
• Shift of focus to employee experience/well-being
53
New Health Economy
Consumer Centric
Value Driven
Technology Enabled

Innovators Proliferate
54
Advocacy
Telehealth
Second Opinion
Health Literacy
Social Networks
Well-being
Population Health
Health Savings Accounts
Transparency
Onsite/Near Site
Concierge
>100,000
Health Apps
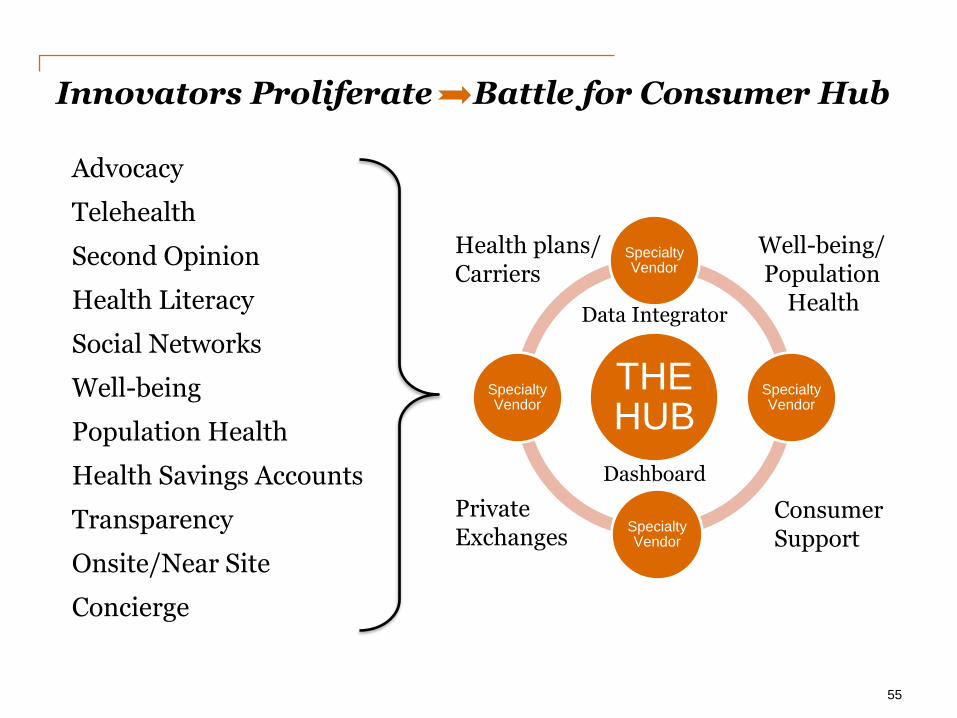
Innovators Proliferate Battle for Consumer Hub
55
Advocacy
Telehealth
Second Opinion
Health Literacy
Social Networks
Well-being
Population Health
Health Savings Accounts
Transparency
Onsite/Near Site
Concierge
THE HUB
Specialty Vendor
Specialty Vendor
Specialty Vendor
Specialty Vendor
Health plans/ Carriers
Well-being/ Population Health
Private Exchanges
Consumer Support
Data Integrator
Dashboard
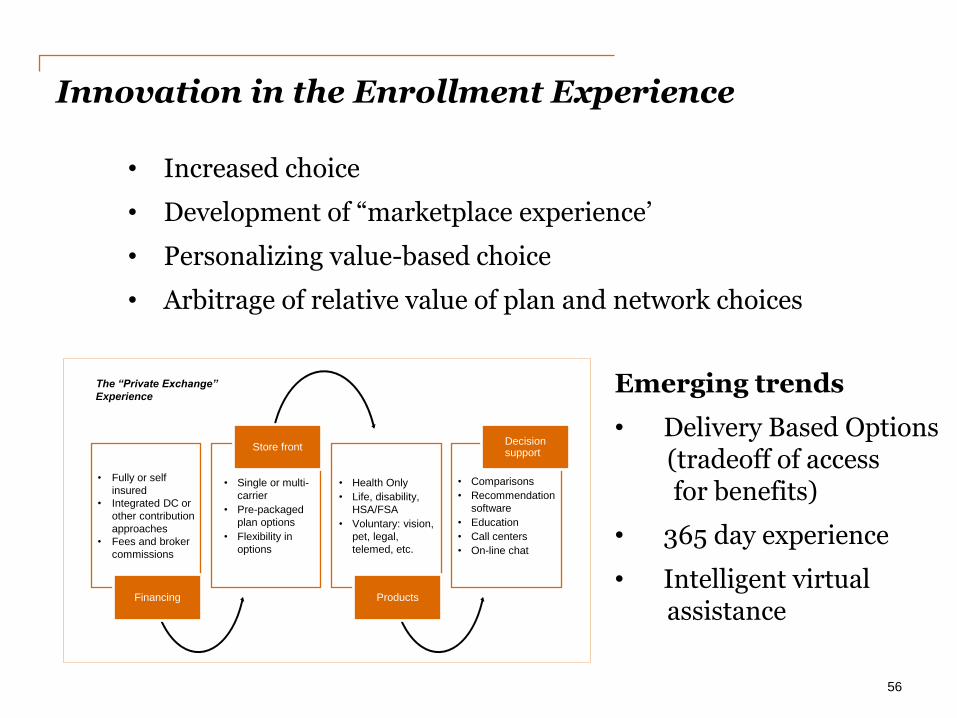
Innovation in the Enrollment Experience
56
• Increased choice
• Development of “marketplace experience’
• Personalizing value-based choice
• Arbitrage of relative value of plan and network choices
Emerging trends
• Delivery Based Options (tradeoff of access for benefits)
• 365 day experience
• Intelligent virtual assistance
The “Private Exchange”
Experience
• Fully or self
insured
• Integrated DC or
other contribution
approaches
• Fees and broker
commissions
Financing
• Single or multi-
carrier
• Pre-packaged
plan options
• Flexibility in
options
Store front
• Health Only
• Life, disability,
HSA/FSA
• Voluntary: vision,
pet, legal,
telemed, etc.
Products
• Comparisons
• Recommendation
software
• Education
• Call centers
• On-line chat
Decision support
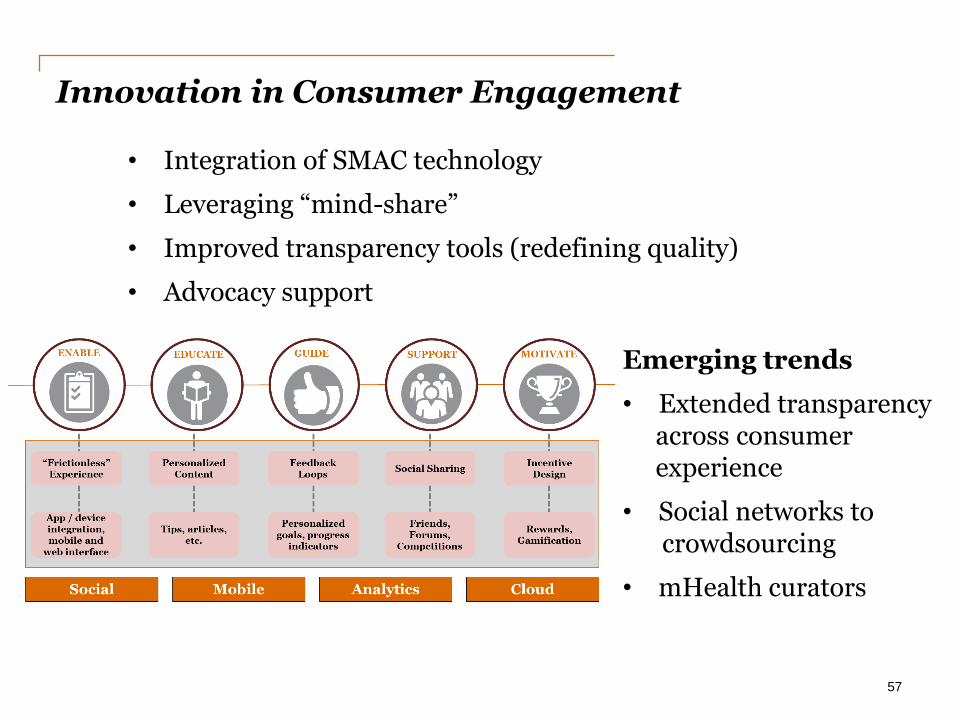
Innovation in Consumer Engagement
57
• Integration of SMAC technology
• Leveraging “mind-share”
• Improved transparency tools (redefining quality)
• Advocacy support
Emerging trends
• Extended transparency across consumer experience
• Social networks to crowdsourcing
• mHealth curators
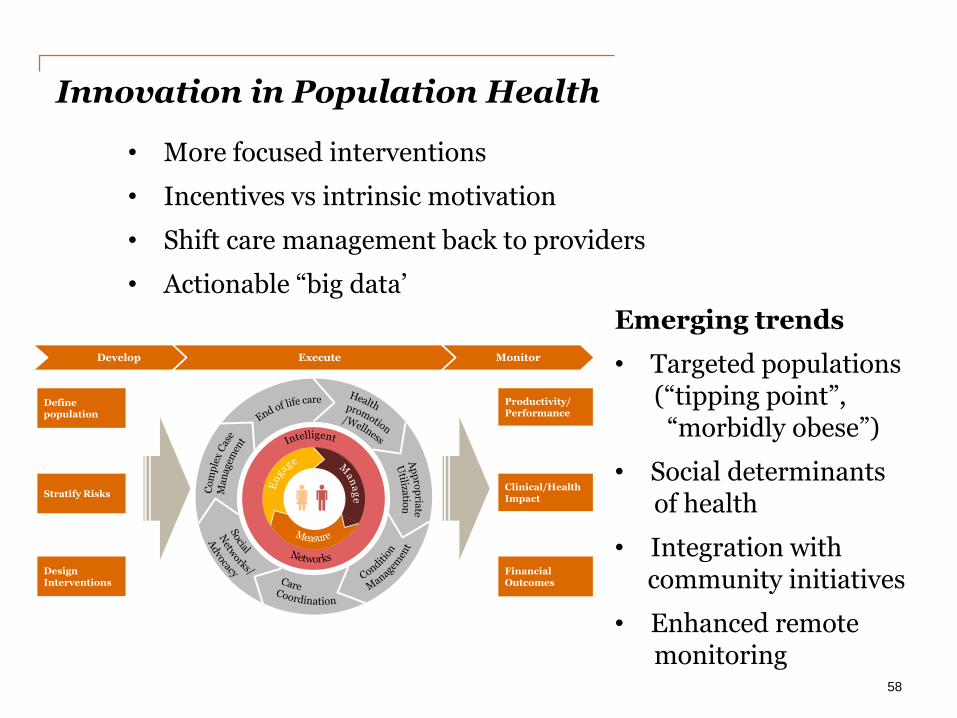
Innovation in Population Health
58
• More focused interventions
• Incentives vs intrinsic motivation
• Shift care management back to providers
• Actionable “big data’
Emerging trends
• Targeted populations (“tipping point”, “morbidly obese”)
• Social determinants of health
• Integration with community initiatives
• Enhanced remote monitoring
Develop Execute Monitor
Networks
Define population
Stratify Risks
Design Interventions
Productivity/Performance
Clinical/Health Impact
Financial Outcomes
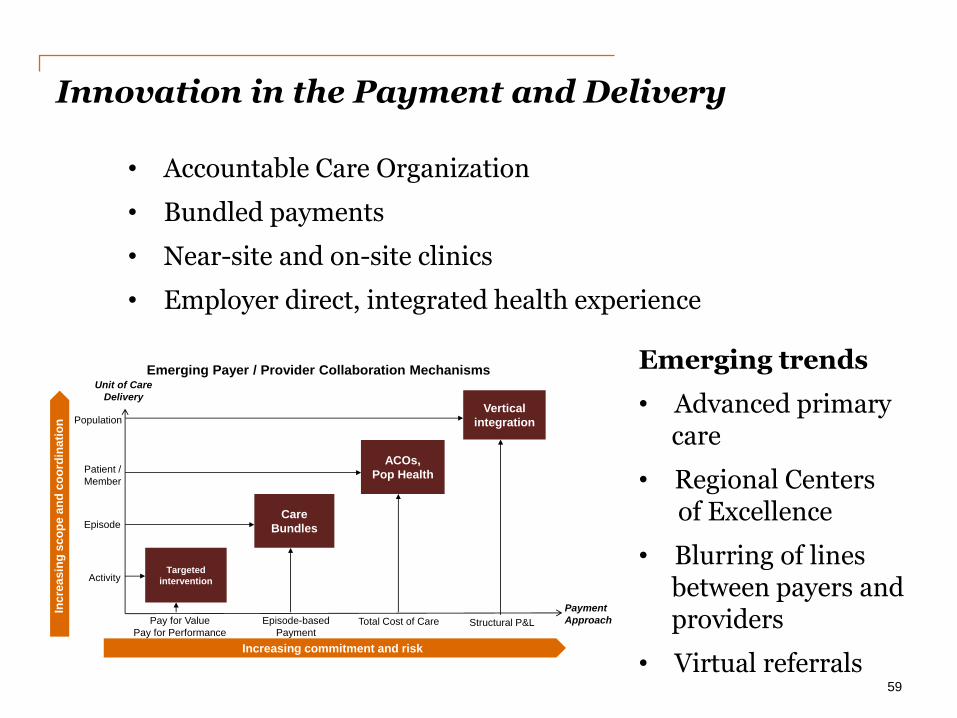
Innovation in the Payment and Delivery
59
Emerging Payer / Provider Collaboration Mechanisms
Pay for Value
Pay for PerformanceTotal Cost of Care
Episode
Activity
Patient /
Member
Episode-based
Payment
Increasing commitment and risk
Unit of Care
Delivery
Inc
rea
sin
g s
co
pe
an
d c
oo
rdin
ati
on
Targeted
intervention
Care
Bundles
Payment
Approach
ACOs,
Pop Health
Vertical
integrationPopulation
Structural P&L
• Accountable Care Organization
• Bundled payments
• Near-site and on-site clinics
• Employer direct, integrated health experience
Emerging trends
• Advanced primary care
• Regional Centers of Excellence
• Blurring of lines between payers and providers
• Virtual referrals
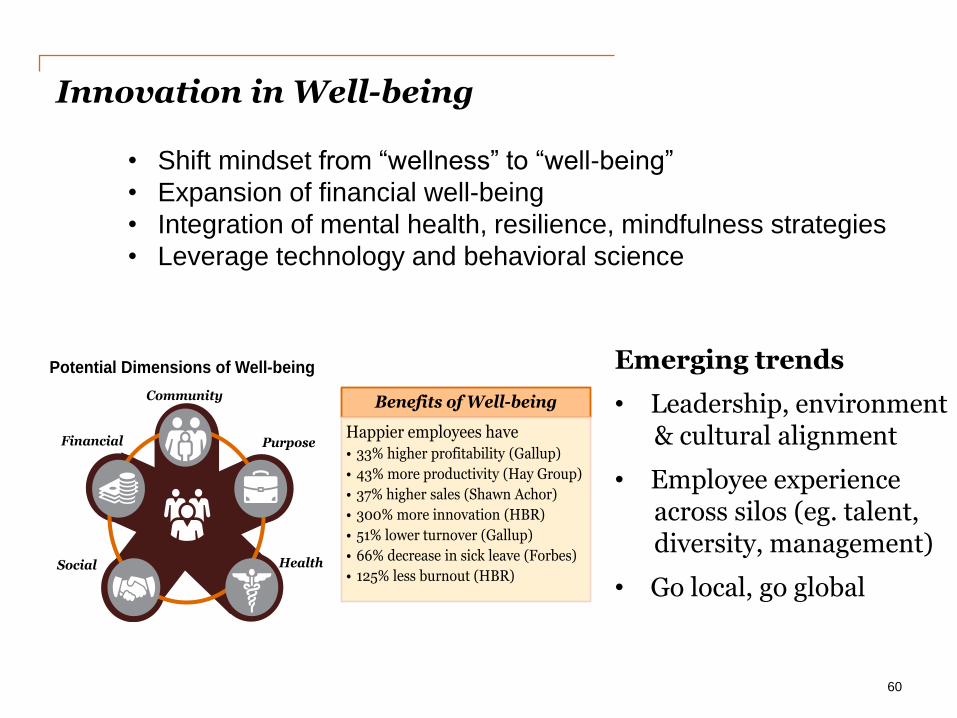
Innovation in Well-being
60
Benefits of Well-being
Happier employees have • 33% higher profitability (Gallup)
• 43% more productivity (Hay Group)
• 37% higher sales (Shawn Achor)
• 300% more innovation (HBR)
• 51% lower turnover (Gallup)
• 66% decrease in sick leave (Forbes)
• 125% less burnout (HBR)
Community
PurposeFinancial
HealthSocial
Potential Dimensions of Well-being
• Shift mindset from “wellness” to “well-being”
• Expansion of financial well-being
• Integration of mental health, resilience, mindfulness strategies
• Leverage technology and behavioral science
Emerging trends
• Leadership, environment & cultural alignment
• Employee experience across silos (eg. talent, diversity, management)
• Go local, go global
For more innovation…
Contact Michael Thompson
11
© 2015 PricewaterhouseCoopers LLP, a Delaware limited liability partnership. All rights reserved. PwC refers to the US member firm, and may sometimes refer to the PwC network. Each member firm is a separate legal entity. Please see www.pwc.com/structure for further details.
Through May 646-471-0720
Starting June 973-464-1530
• Innovator Hall
• Well-being Institute
www.pwc.com/us/the3rdthursday

Care Pathways: Insights from a Clinical Analytic
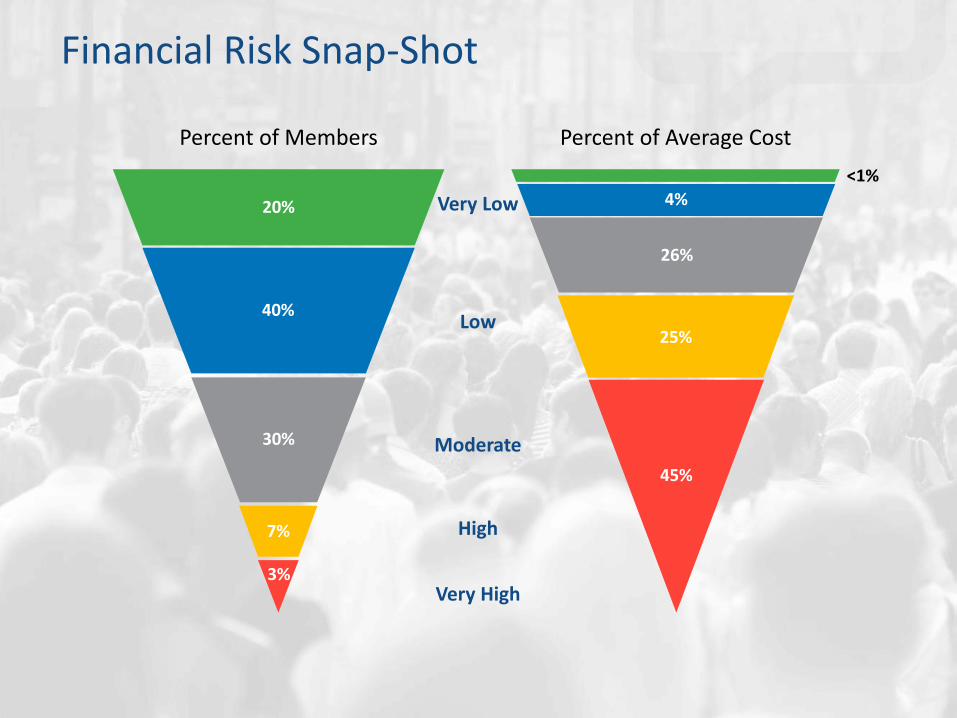
Financial Risk Snap-Shot
Percent of Members
Very Low
Low
Moderate
Very High
High
20%
40%
30%
7%
3%
<1%
4%
26%
25%
45%
Percent of Average Cost
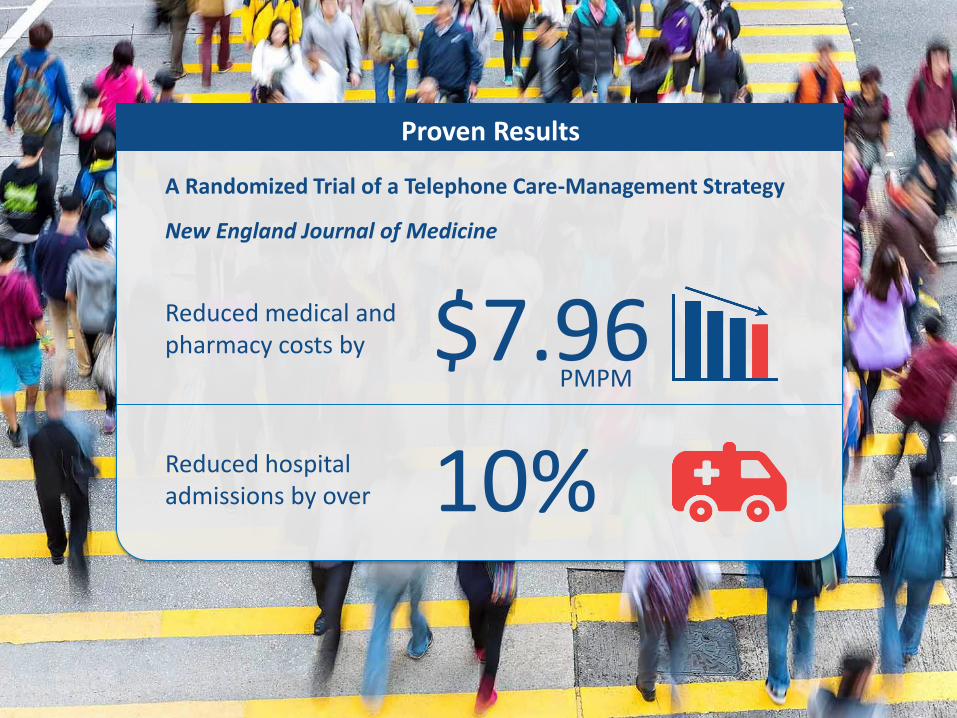
A Randomized Trial of a Telephone Care-Management Strategy
New England Journal of Medicine
$7.96 Reduced medical and pharmacy costs by
PMPM
10% Reduced hospital admissions by over
Proven Results

Financial Risk: Migration Out of High Risk (one-year)
Percent of Members 78% of Very High Risk members migrate to a lower level of financial risk
42%
18% 4%
64% of High Risk members migrate to a lower level of financial risk
22%
35%
10%
2%
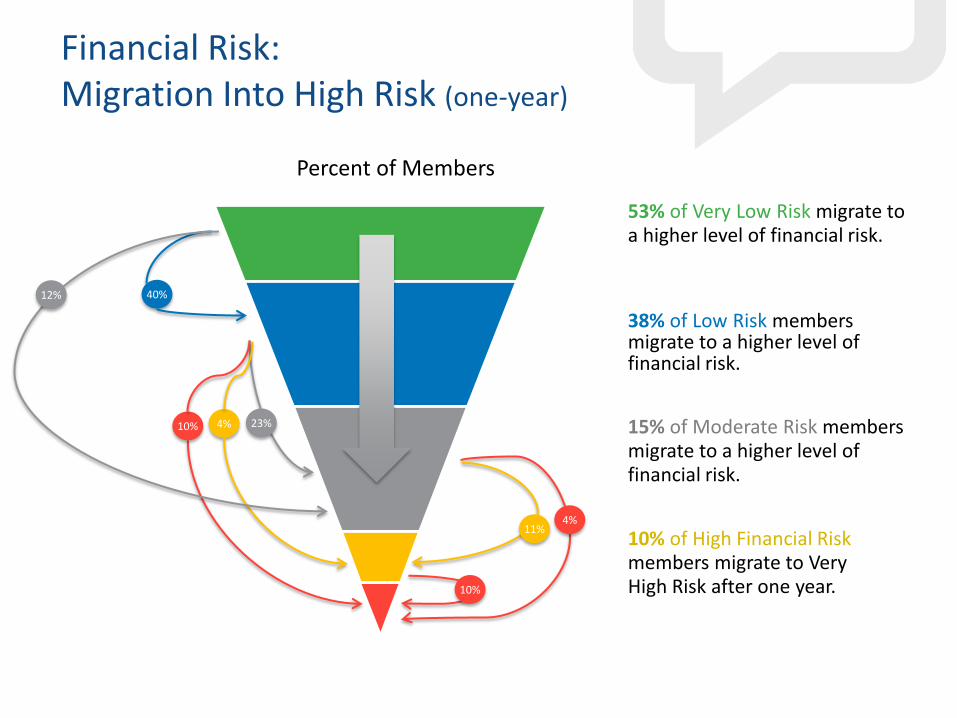
Financial Risk: Migration Into High Risk (one-year)
Percent of Members
11% 4%
15% of Moderate Risk members migrate to a higher level of financial risk.
53% of Very Low Risk migrate to a higher level of financial risk.
10% 23% 4%
38% of Low Risk members migrate to a higher level of financial risk.
10% of High Financial Risk members migrate to Very High Risk after one year. 10%
40% 12%
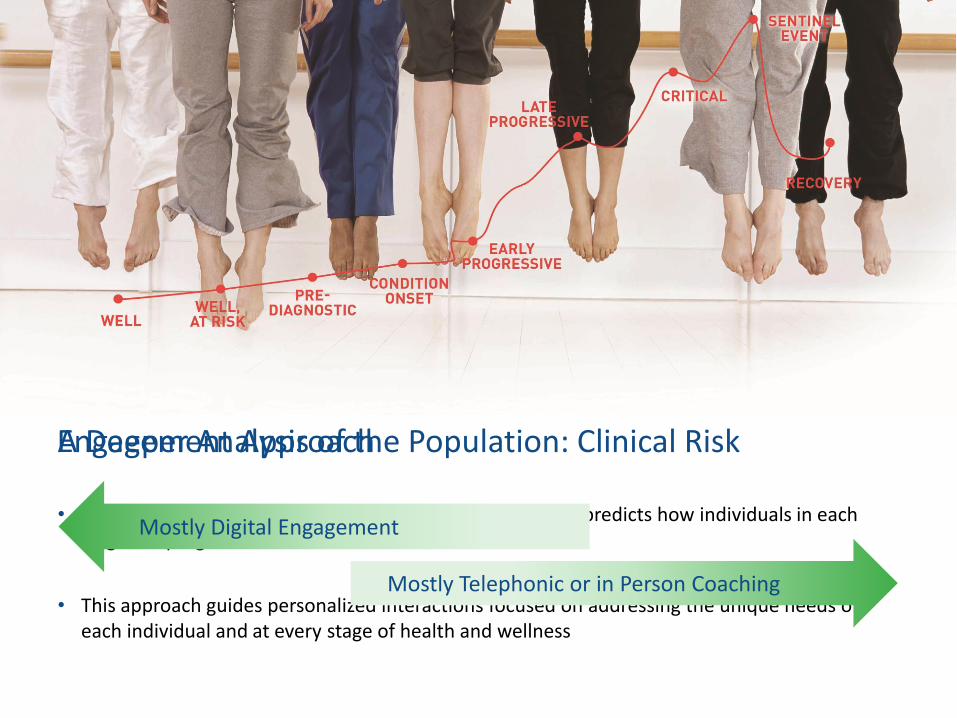
A Deeper Analysis of the Population: Clinical Risk
• Care Pathways stratifies populations into 9 risk stages and predicts how individuals in each stage will progress into riskier cohorts
• This approach guides personalized interactions focused on addressing the unique needs of each individual and at every stage of health and wellness
Mostly Digital Engagement
Mostly Telephonic or in Person Coaching
Engagement Approach
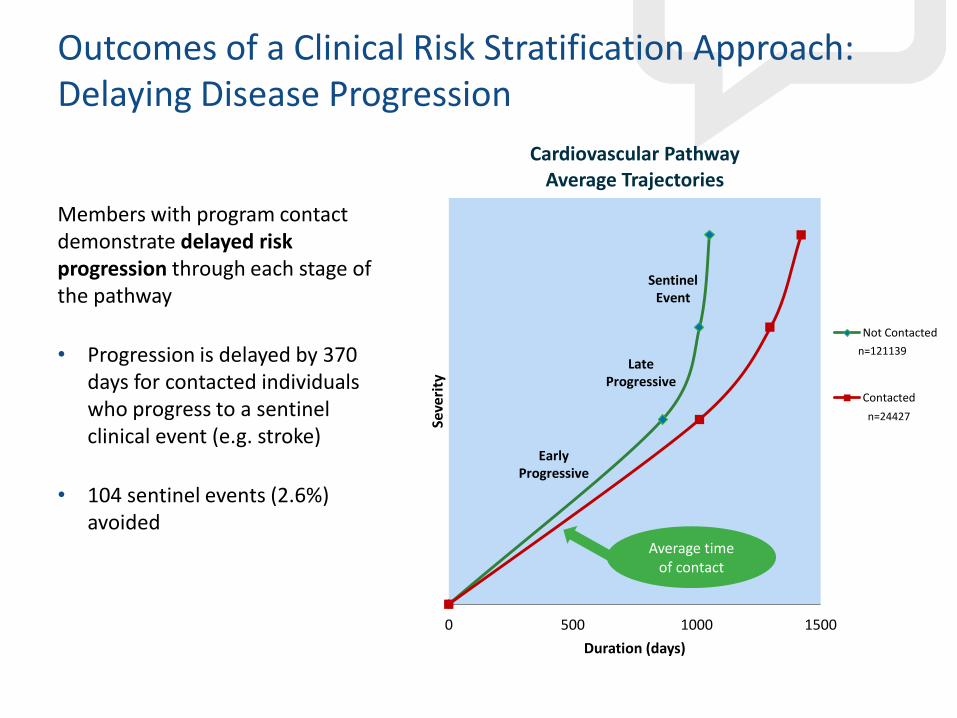
Outcomes of a Clinical Risk Stratification Approach: Delaying Disease Progression
Members with program contact demonstrate delayed risk progression through each stage of the pathway
• Progression is delayed by 370 days for contacted individuals who progress to a sentinel clinical event (e.g. stroke)
• 104 sentinel events (2.6%) avoided
0 500 1000 1500
Seve
rity
Duration (days)
Cardiovascular Pathway Average Trajectories
Not Contacted
Contacted
n=121139
n=24427
Sentinel Event
Late Progressive
Early Progressive
Average time of contact
10
100
1,000
10,000
100,000
0 2 4 6 8 10
Pri
or
12
-Mo
nth
Co
st
Disease Stage (as of January 2015)
Five Year Cohort Follow-Up: Distribution of Disease Stage and Average Cost (January 2015)
Well
At-Risk
Pre-Diagnostic
Onset
Early-Progressive
Late-Progressive
Critical
Sentinel
Recovery
Other Major Cond.
10
100
1,000
10,000
100,000
0 2 4 6 8 10
Pri
or
12
-Mo
nth
Co
st
Disease Stage (as of January 2010)
Five Year Cohort Follow-Up: Distribution of Disease Stage and Average Cost (January 2010)
Well
At-Risk
Pre-Diagnostic
Onset
Early-Progressive
Late-Progressive
Critical
Sentinel
Recovery
Other Major Cond.
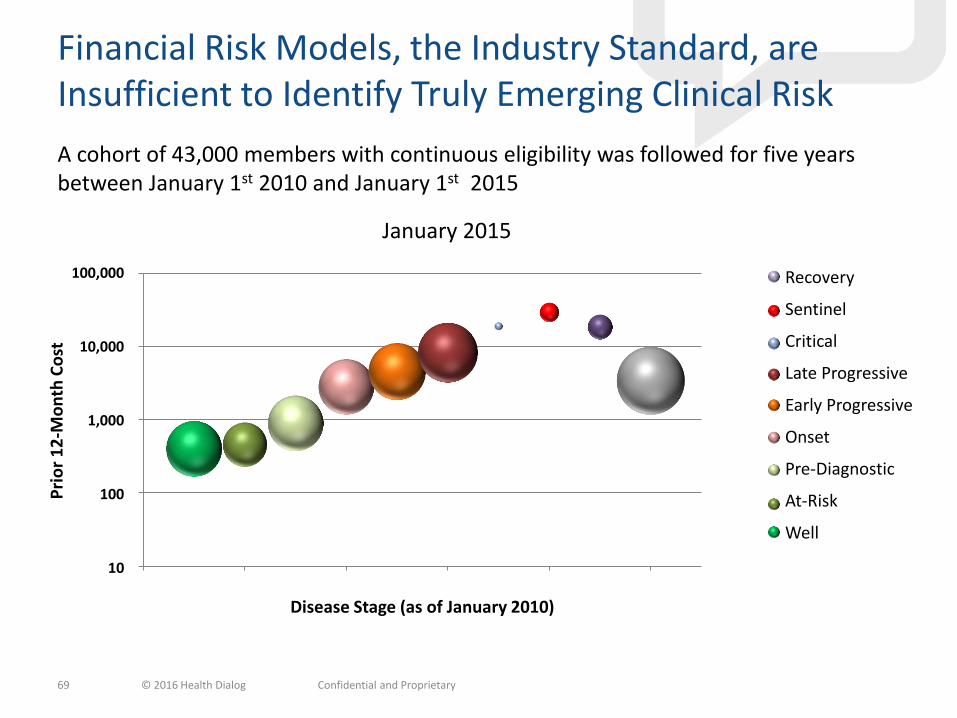
Financial Risk Models, the Industry Standard, are Insufficient to Identify Truly Emerging Clinical Risk
69
A cohort of 43,000 members with continuous eligibility was followed for five years between January 1st 2010 and January 1st 2015
© 2016 Health Dialog Confidential and Proprietary
1,228 1,081
9,910
5,522
4,519
17,086
173
917
1,661
Jan 2015
Well
At-Risk
Pre-Diagnostic
Onset
Early Progressive
Late Progresive
Critical
Sentinel
Recovery
1,228 1,081
9,910
5,522
4,519
17,086
173
917
1,661
Jan 2015
Well
At-Risk
Pre-Diagnostic
Onset
Early Progressive
Late Progresive
Critical
Sentinel
Recovery
1,228 1,081
9,910
5,522
4,519
17,086
173
917
1,661
Jan 2015
Well
At-Risk
Pre-Diagnostic
Onset
Early Progressive
Late Progresive
Critical
Sentinel
Recovery
1,228 1,081
9,910
5,522
4,519
17,086
173
917
1,661
Jan 2015
Well
At-Risk
Pre-Diagnostic
Onset
Early Progressive
Late Progresive
Critical
Sentinel
Recovery
1,228 1,081
9,910
5,522
4,519
17,086
173
917
1,661
Jan 2015
Well
At-Risk
Pre-Diagnostic
Onset
Early Progressive
Late Progresive
Critical
Sentinel
Recovery
1,228 1,081
9,910
5,522
4,519
17,086
173
917
1,661
Jan 2015
Well
At-Risk
Pre-Diagnostic
Onset
Early Progressive
Late Progresive
Critical
Sentinel
Recovery
1,228 1,081
9,910
5,522
4,519
17,086
173
917
1,661
Jan 2015
Well
At-Risk
Pre-Diagnostic
Onset
Early Progressive
Late Progresive
Critical
Sentinel
Recovery
1,228 1,081
9,910
5,522
4,519
17,086
173
917
1,661
Jan 2015
Well
At-Risk
Pre-Diagnostic
Onset
Early Progressive
Late Progresive
Critical
Sentinel
Recovery
1,228 1,081
9,910
5,522
4,519
17,086
173
917
1,661
Jan 2015
Well
At-Risk
Pre-Diagnostic
Onset
Early Progressive
Late Progresive
Critical
Sentinel
RecoveryRecovery
Sentinel
Critical
Late Progressive
Early Progressive
Onset
Pre-Diagnostic
At-Risk
Well
January 2010 January 2015
Who Makes Up the Silent Population?
Some have conditions that cannot be predicted
• E.g. cancer, accidents, major mental illness
Many have conditions that can be predicted and that rapidly lead to disease
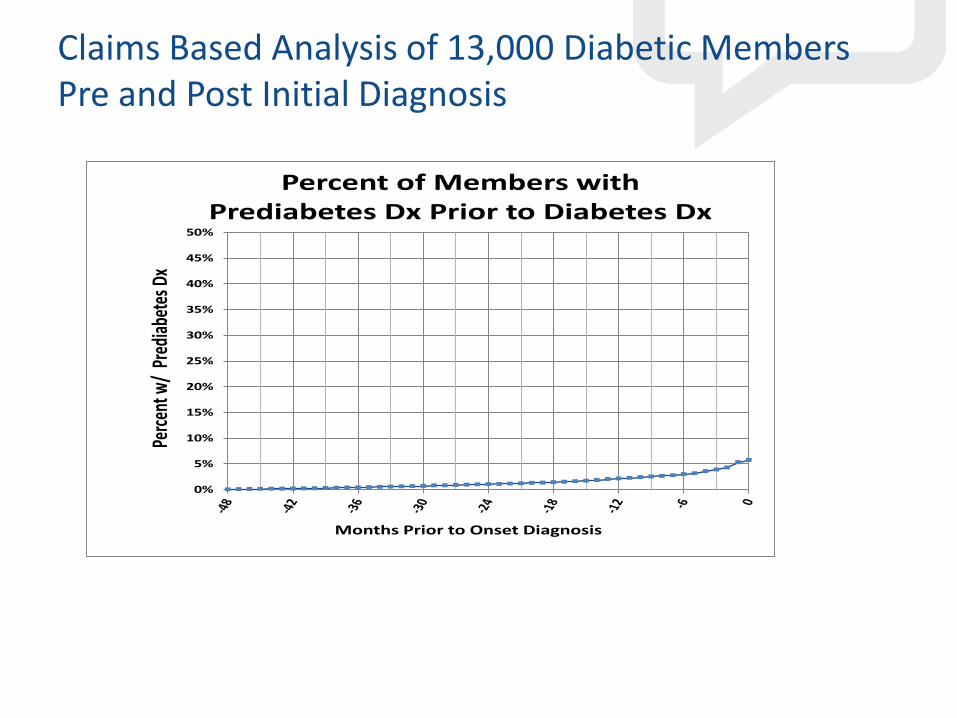
• 37% of Americans are pre-diabetics
• 97% of pre-diabetics are not diagnosed
• 23% of diabetics are not diagnosed
• 31% if adult Americans have pre-hypertension
• Half of people with hypertension fail to control their BP

The Good News
Type 2 diabetes can be prevented.
Loosing just 7% of your body weight and exercising moderately can reduce your risk by 58%
Feds mull Medicare changes after big success in YMCA's diabetes program
“People at high risk of developing diabetes lost about 5% of their body weight in a YMCA program …
…CMS' actuaries certified the YMCA's Diabetes Prevention Program would more than pay for itself for Medicare if the YMCA program was expanded, saving $2,650 per participant over 15 months…
…The Diabetes Prevention Program can reduce the number of new cases of Type 2 diabetes by 58% and 71% for those over age 60, according to the YMCA”
Source: http://www.usatoday.com/story/news/world/2016/03/23/details-emerge-victims-brussels-attacks/82153552/
0%
5%
10%
15%
20%
25%
30%
35%
40%
45%
50%
Perc
ent w
/ Pr
edia
bete
s Dx
Months Prior to Onset Diagnosis
Percent of Members with Prediabetes Dx Prior to Diabetes Dx
Claims Based Analysis of 13,000 Diabetic Members Pre and Post Initial Diagnosis
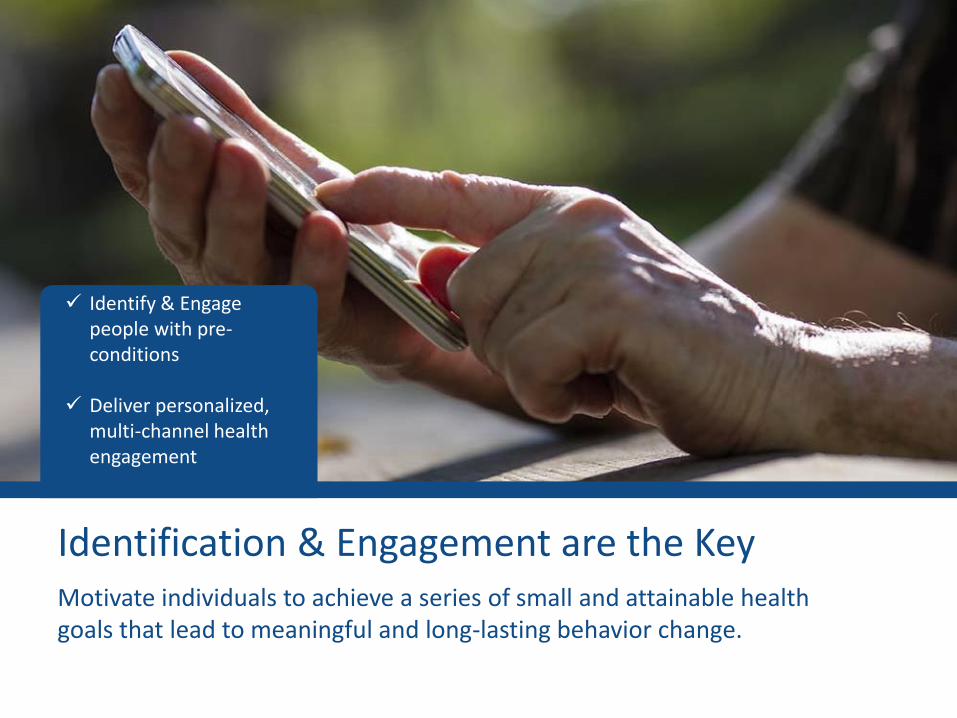
Motivate individuals to achieve a series of small and attainable health goals that lead to meaningful and long-lasting behavior change.
Identification & Engagement are the Key
Identify & Engage people with pre-conditions
Deliver personalized,
multi-channel health engagement
Final Thoughts
• Disease management efforts focus on the very sick
• Clinical analytics can target the “soon to be sick” segments of your population
• Digital technology can help to identify and serve the entire population with personalized programs
® Employee Benefit Research Institute 2016 ® Employee Benefit Research Institute 201 76
EBRI-ERF Policy Forum #78 Thursday, May 12, 2016
Retirement Challenges and Reforms

® Employee Benefit Research Institute 2016 ® Employee Benefit Research Institute 201 77
EBRI-ERF Policy Forum #78 Thursday, May 12, 2016
Bipartisan Policy Center Commission on Retirement Security and Personal Savings
® Employee Benefit Research Institute 2016 ® Employee Benefit Research Institute 201 78
EBRI-ERF Policy Forum #78 Thursday, May 12, 2016
Who’s In, Who’s Out – A Look at Access to Employer-Based Retirement Plans and
Participation in the States
Who’s In, Who’s Out A discussion about state and federal proposals to boost access to private sector retirement plans
May 12, 2016 EBRI Policy Forum #78
#PewRetirement www.pewtrusts.org/retirementsavings [email protected] 80
Overview • Background
• Retirement savings across the states
• State policy approaches
• Small employer views

• Longevity: additional years of life at age 65
– 1950: 14 years
– 2013: 19 years
• Annual cost of long term care
– Adult day health care: $17,904
– Assisted living: $43,200
– Nursing home: $80,300
#PewRetirement www.pewtrusts.org/retirementsavings [email protected] 81
Why retirement savings is important
Source: National Center for Health Statistics. Health, United States, 2014: With Special Feature on Adults Aged 55–64. Hyattsville, MD. 2015; Table 16, available at http://www.cdc.gov/nchs/data/hus/hus14.pdf#016.

82
Current Savings Situation • “Rule of thumb” for retiree income: live on 4 percent
of accounts per year or save 10 times their annual income.
• Median income for households between 55 and 64 is $56,575
• Median DC savings accounts for persons between the ages of 55 and 64 is approximately $76,000.
#PewRetirement www.pewtrusts.org/retirementsavings [email protected]
83
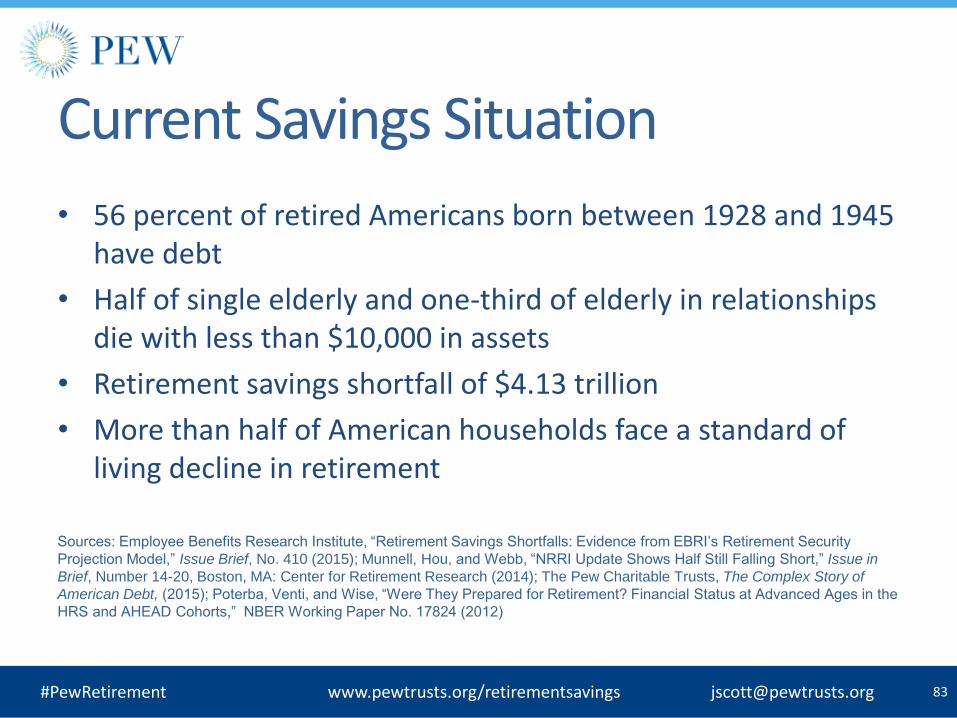
Current Savings Situation
• 56 percent of retired Americans born between 1928 and 1945 have debt
• Half of single elderly and one-third of elderly in relationships die with less than $10,000 in assets
• Retirement savings shortfall of $4.13 trillion
• More than half of American households face a standard of living decline in retirement
Sources: Employee Benefits Research Institute, “Retirement Savings Shortfalls: Evidence from EBRI’s Retirement Security
Projection Model,” Issue Brief, No. 410 (2015); Munnell, Hou, and Webb, “NRRI Update Shows Half Still Falling Short,” Issue in
Brief, Number 14-20, Boston, MA: Center for Retirement Research (2014); The Pew Charitable Trusts, The Complex Story of
American Debt, (2015); Poterba, Venti, and Wise, “Were They Prepared for Retirement? Financial Status at Advanced Ages in the
HRS and AHEAD Cohorts,” NBER Working Paper No. 17824 (2012)
#PewRetirement www.pewtrusts.org/retirementsavings [email protected]
84
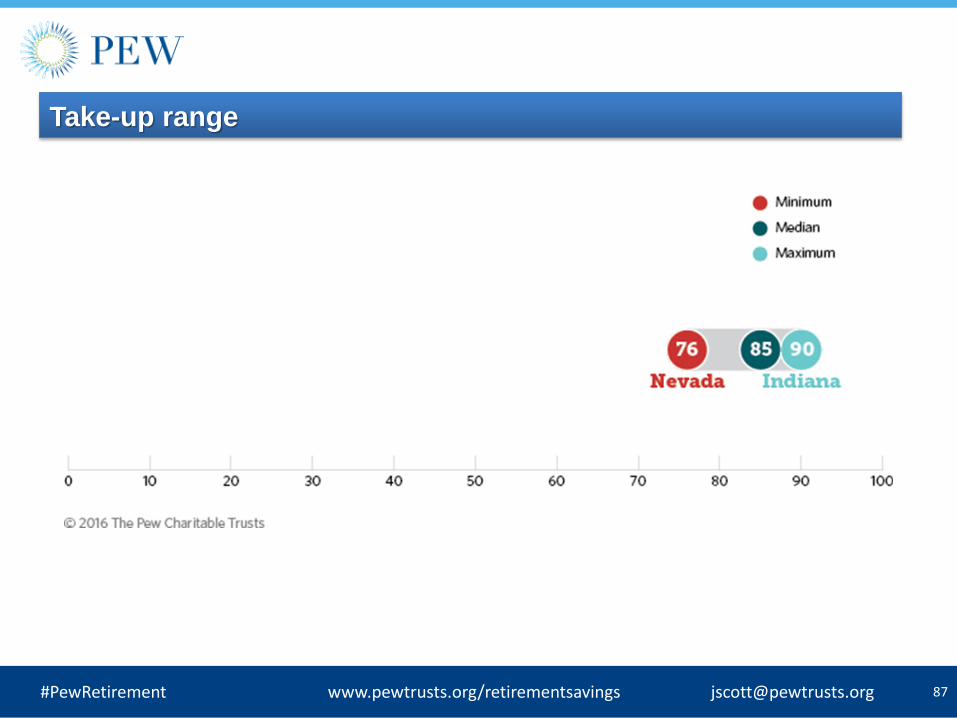
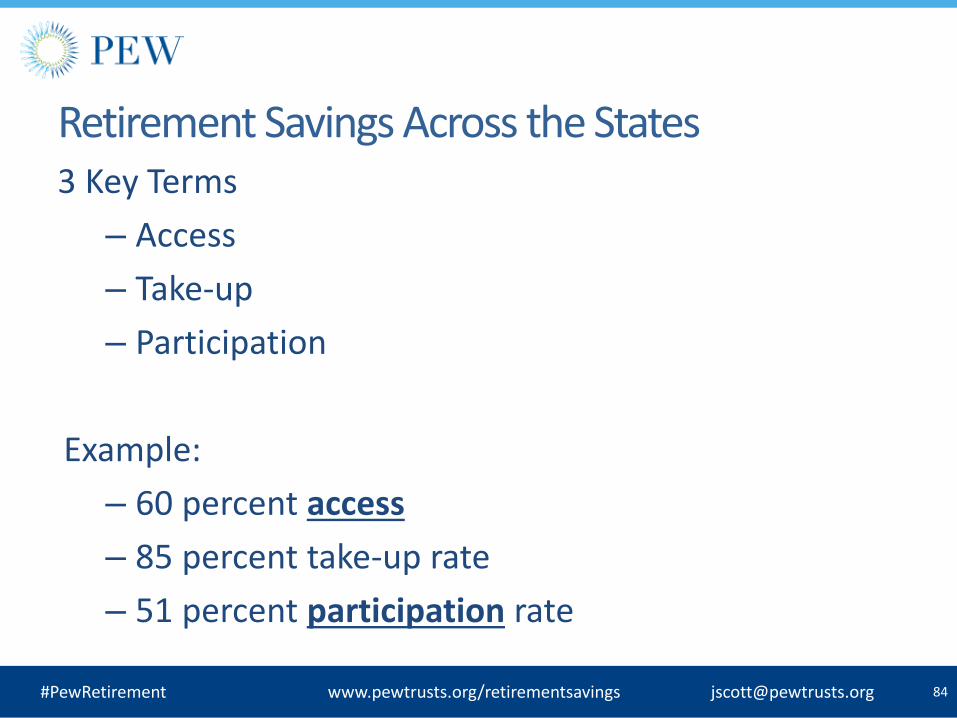
Retirement Savings Across the States 3 Key Terms
– Access
– Take-up
– Participation
Example:
– 60 percent access
– 85 percent take-up rate
– 51 percent participation rate
#PewRetirement www.pewtrusts.org/retirementsavings [email protected]
86
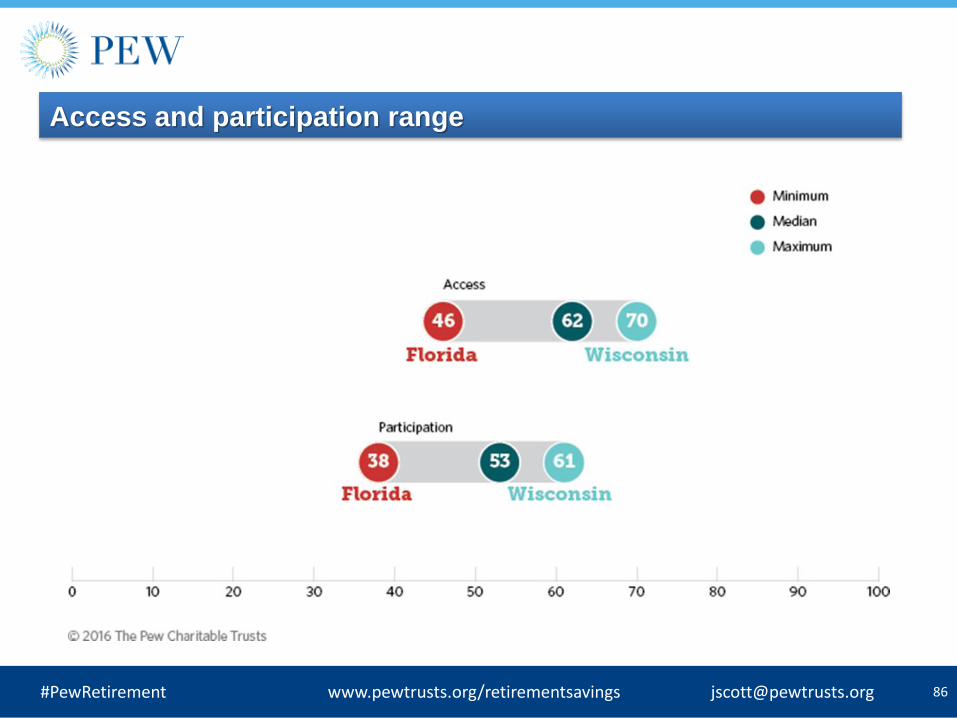
Access and participation range
#PewRetirement www.pewtrusts.org/retirementsavings [email protected]
88
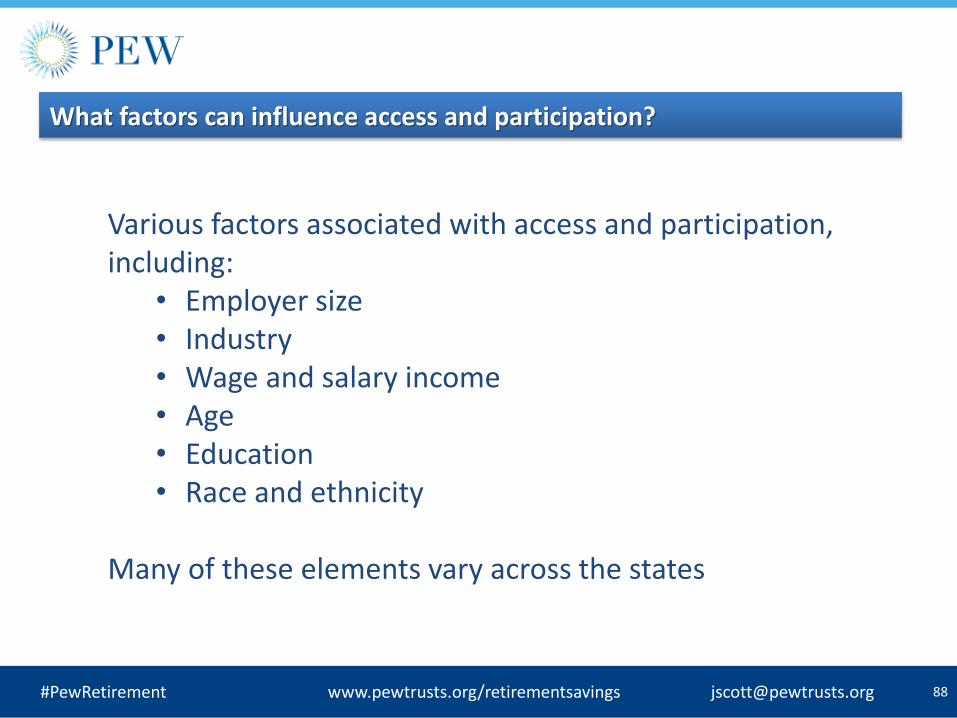
What factors can influence access and participation?
Various factors associated with access and participation, including:
• Employer size • Industry • Wage and salary income • Age • Education • Race and ethnicity
Many of these elements vary across the states
#PewRetirement www.pewtrusts.org/retirementsavings [email protected]
89
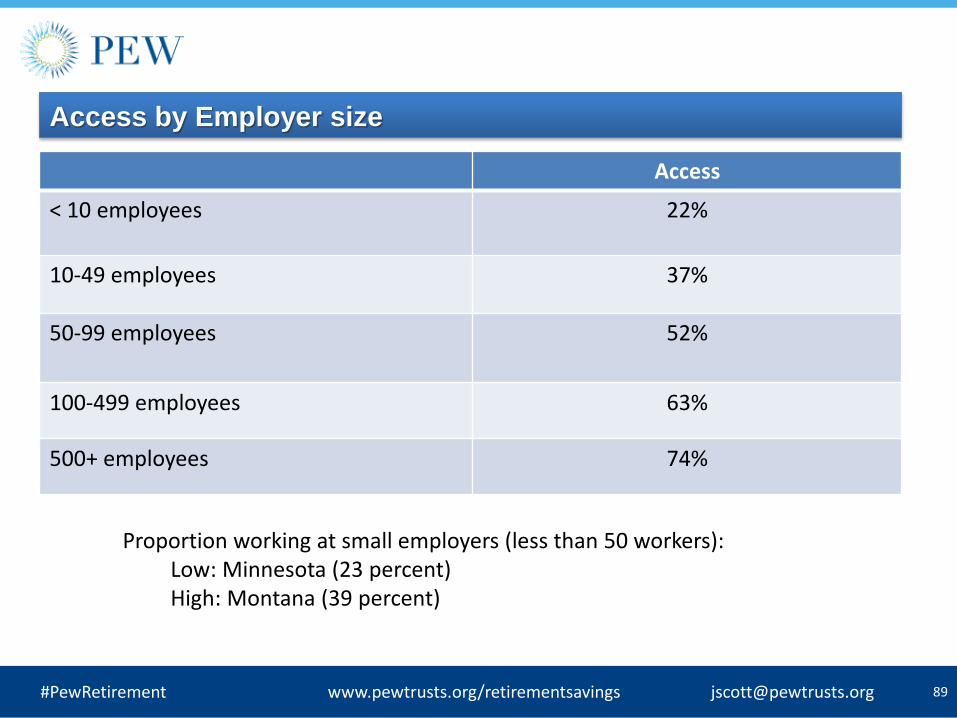
Access by Employer size
Access
< 10 employees 22%
10-49 employees 37%
50-99 employees 52%
100-499 employees 63%
500+ employees 74%
Proportion working at small employers (less than 50 workers): Low: Minnesota (23 percent) High: Montana (39 percent)
#PewRetirement www.pewtrusts.org/retirementsavings [email protected]
90
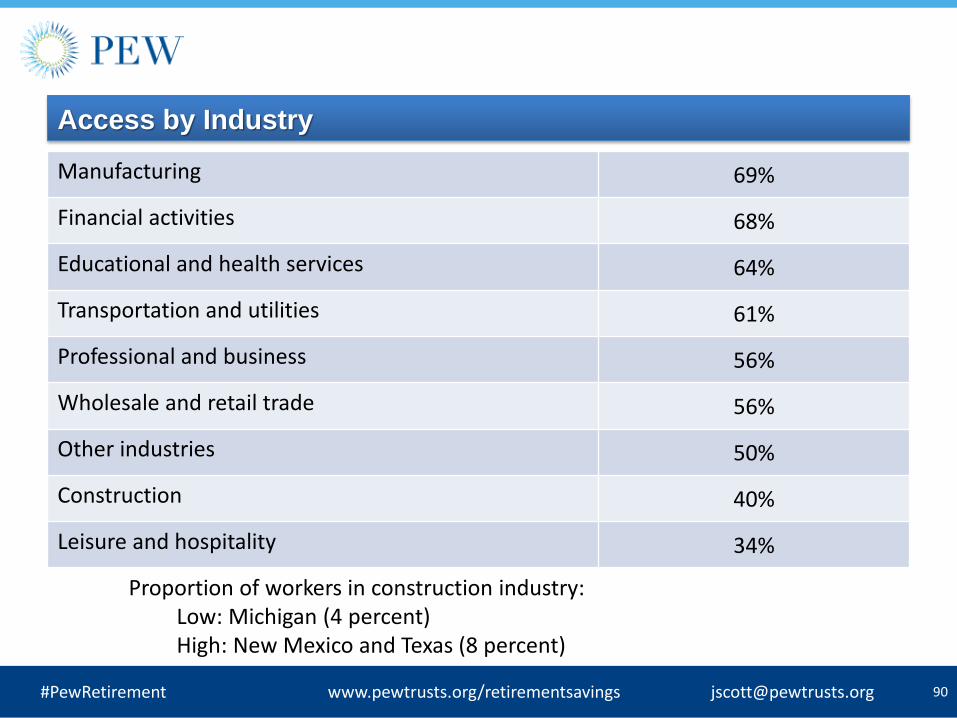
Access by Industry
Manufacturing 69%
Financial activities 68%
Educational and health services 64%
Transportation and utilities 61%
Professional and business 56%
Wholesale and retail trade 56%
Other industries 50%
Construction 40%
Leisure and hospitality 34%
Proportion of workers in construction industry: Low: Michigan (4 percent) High: New Mexico and Texas (8 percent)
#PewRetirement www.pewtrusts.org/retirementsavings [email protected]
91
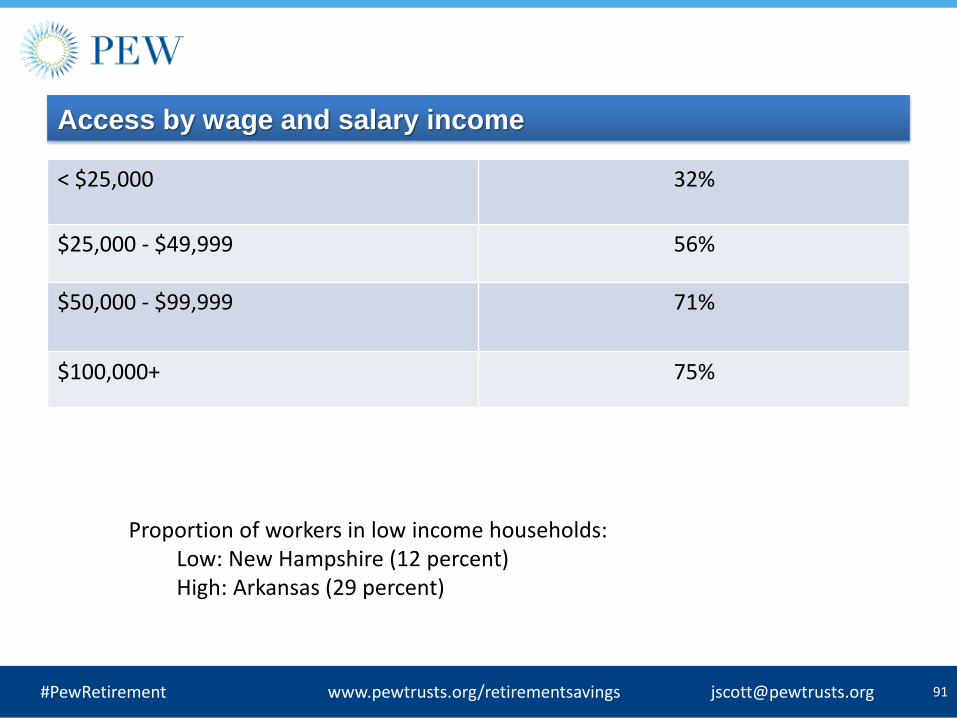
Access by wage and salary income
< $25,000 32%
$25,000 - $49,999 56%
$50,000 - $99,999 71%
$100,000+ 75%
Proportion of workers in low income households: Low: New Hampshire (12 percent) High: Arkansas (29 percent)
#PewRetirement www.pewtrusts.org/retirementsavings [email protected]

92
Access by Race and ethnicity
White non-Hispanic 63%
Black non-Hispanic 56%
Asian non-Hispanic 55%
Other non-Hispanic 59%
Hispanic 38%
Proportion of Hispanic workers: Low: Vermont (1 percent) High: New Mexico (52 percent)
#PewRetirement www.pewtrusts.org/retirementsavings [email protected]
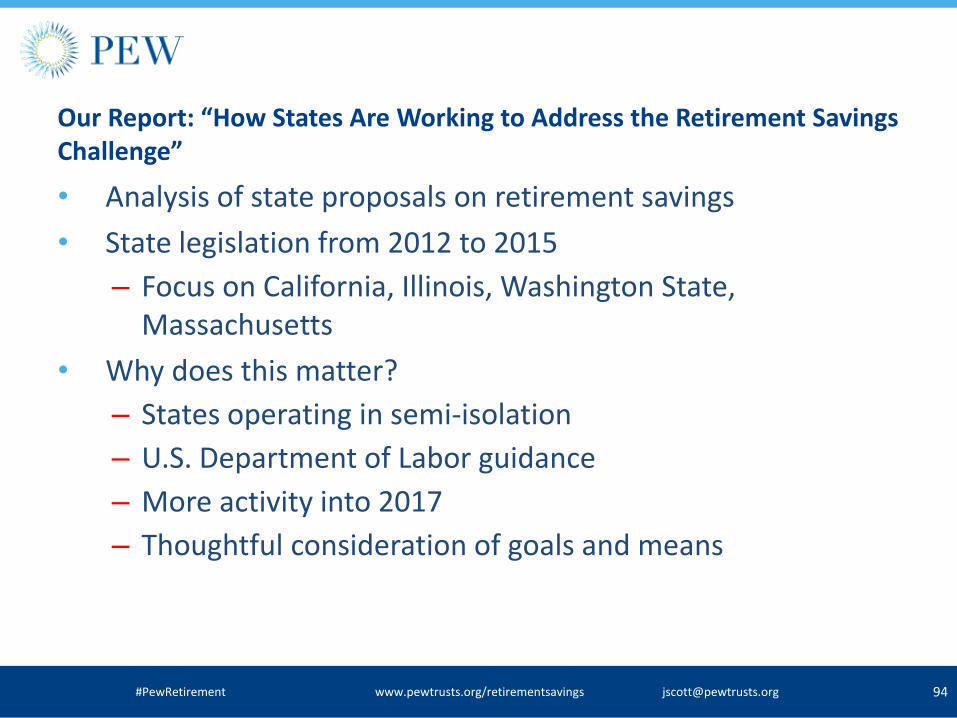
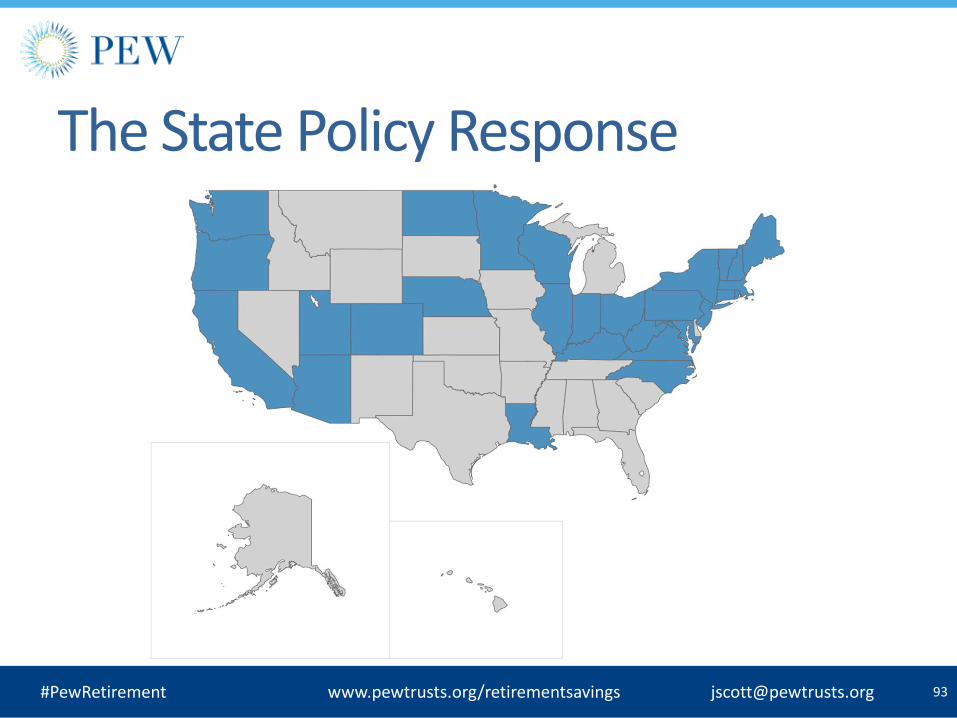
Our Report: “How States Are Working to Address the Retirement Savings Challenge”
• Analysis of state proposals on retirement savings
• State legislation from 2012 to 2015
– Focus on California, Illinois, Washington State, Massachusetts
• Why does this matter?
– States operating in semi-isolation
– U.S. Department of Labor guidance
– More activity into 2017
– Thoughtful consideration of goals and means
94 #PewRetirement www.pewtrusts.org/retirementsavings [email protected]

95
3 public policy goals:
– Increasing retirement savings
– Minimizing burdens for employers
– Managing legal and financial risk for states
Tradeoffs among these goals?
#PewRetirement www.pewtrusts.org/retirementsavings [email protected]
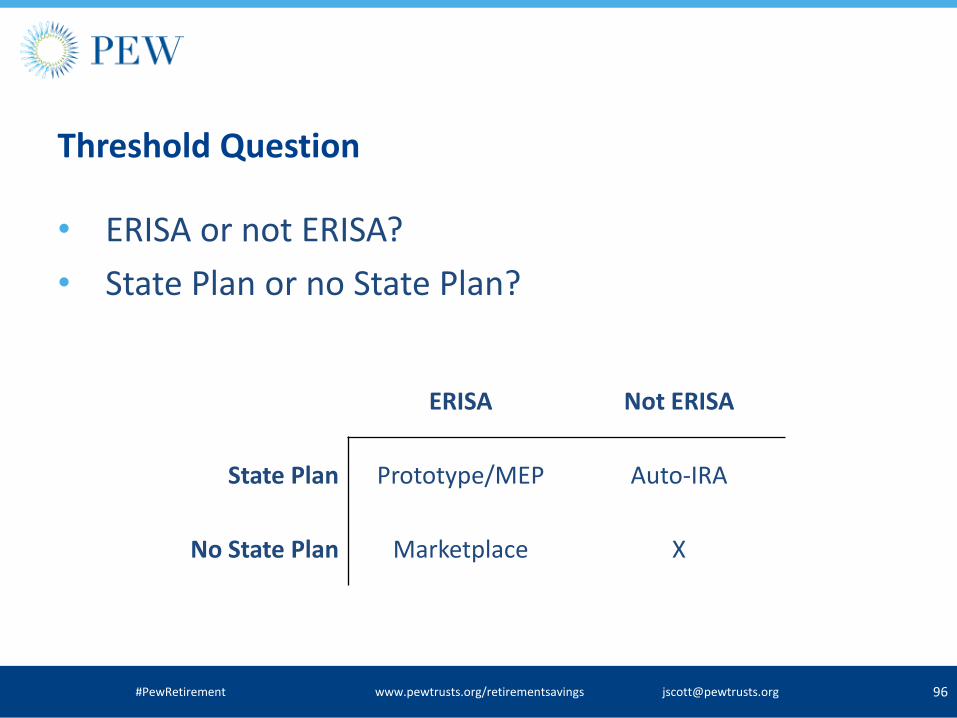
Threshold Question
• ERISA or not ERISA?
• State Plan or no State Plan?
96 #PewRetirement www.pewtrusts.org/retirementsavings [email protected]
ERISA Not ERISA
State Plan Prototype/MEP Auto-IRA
No State Plan Marketplace X
97
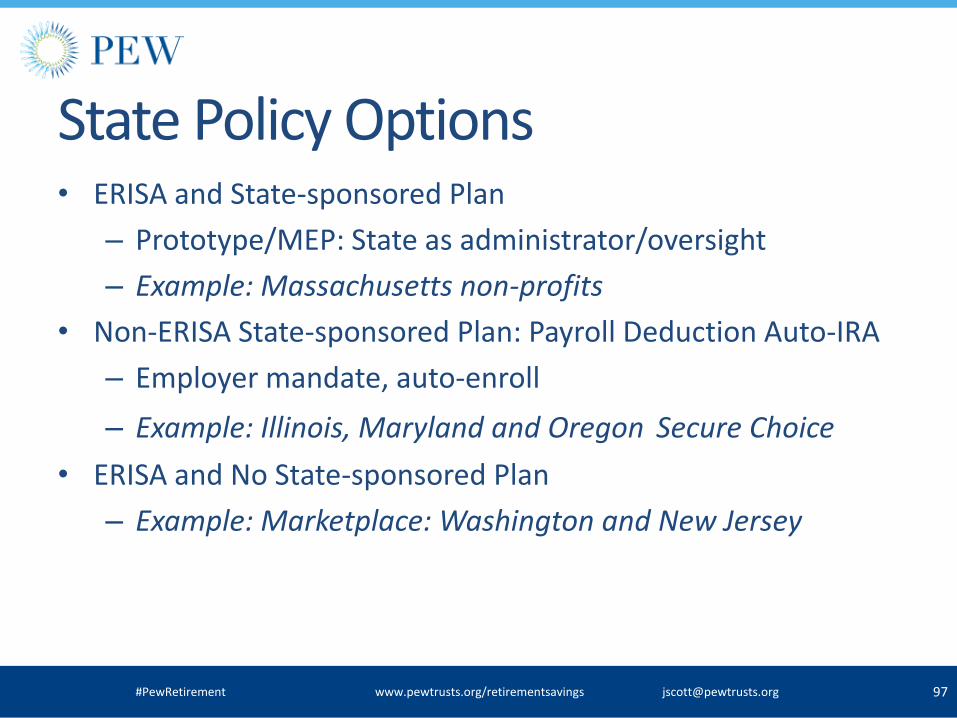
State Policy Options • ERISA and State-sponsored Plan
– Prototype/MEP: State as administrator/oversight
– Example: Massachusetts non-profits
• Non-ERISA State-sponsored Plan: Payroll Deduction Auto-IRA
– Employer mandate, auto-enroll
– Example: Illinois, Maryland and Oregon Secure Choice
• ERISA and No State-sponsored Plan
– Example: Marketplace: Washington and New Jersey
#PewRetirement www.pewtrusts.org/retirementsavings [email protected]
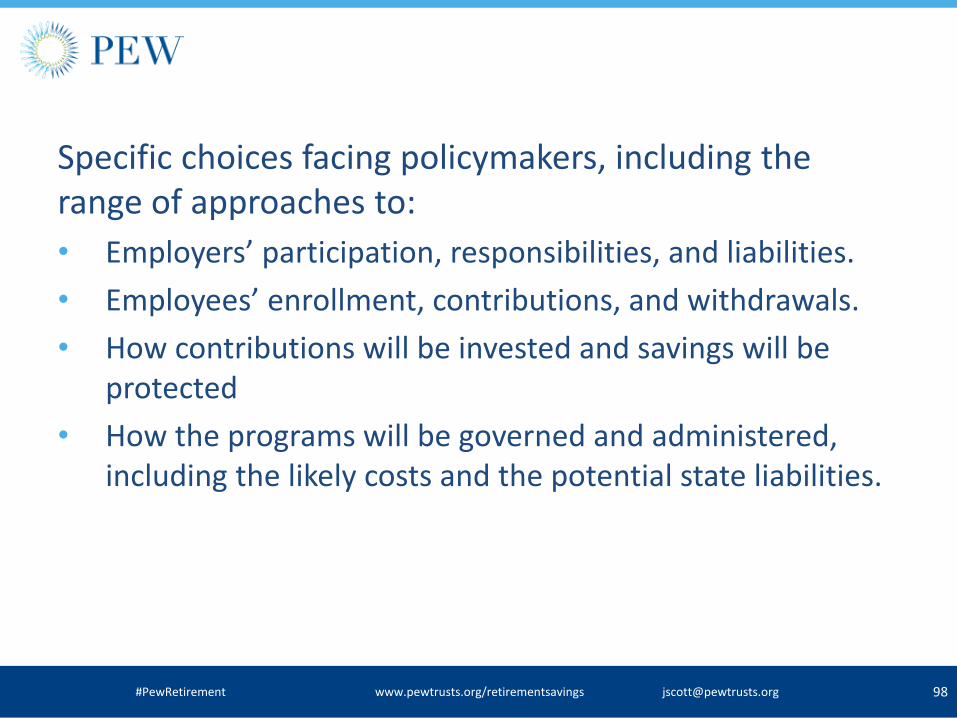
Specific choices facing policymakers, including the range of approaches to:
• Employers’ participation, responsibilities, and liabilities.
• Employees’ enrollment, contributions, and withdrawals.
• How contributions will be invested and savings will be protected
• How the programs will be governed and administered, including the likely costs and the potential state liabilities.
98 #PewRetirement www.pewtrusts.org/retirementsavings [email protected]
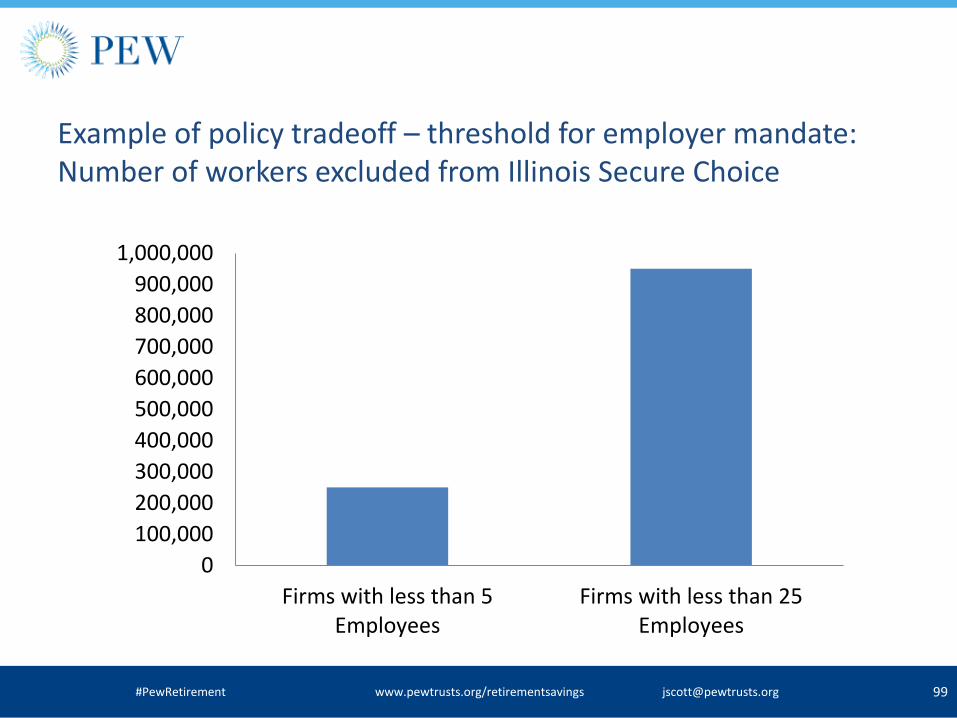
Example of policy tradeoff – threshold for employer mandate: Number of workers excluded from Illinois Secure Choice
99 #PewRetirement www.pewtrusts.org/retirementsavings [email protected]
0
100,000
200,000
300,000
400,000
500,000
600,000
700,000
800,000
900,000
1,000,000
Firms with less than 5Employees
Firms with less than 25Employees

Small employer views on state policy initiatives • Pew conducted focus groups of small to mid-sized
businesses, 8 total across the country
• Plan sponsors and non-sponsors
• Questions on offering retirement plan, Secure Choice and marketplace exchange approaches
100 #PewRetirement www.pewtrusts.org/retirementsavings [email protected]
Small Company
(5-49 employees)
Mid-Sized Company
(50-249 employees) TOTAL
No retirement
plan offered
1 Philadelphia group
1 Dallas group
1 Chicago group
1 Los Angeles group 4 groups
Retirement plan
offered
1 Chicago group
1 Los Angeles group
1 Philadelphia group
1 Dallas group 4 groups
TOTAL 4 groups 4 groups 8 groups

Small employers on ‘Secure Choice’ approach • “And it doesn’t matter what state because if I need to talk to somebody,
what red tape am I going to have to go through because you’re talking about millions of people, probably, that are going to be enrolled in this. And so if I have an immediate personal issue, am I going to be able to talk to somebody? Or am I go through what I go through if I have to call the city for anything? Or the state for anything? Which is a nightmare.”
• “We don't have a state that is organized enough to handle its own future. We're in really big trouble, and you're talking about they're going to organize a retirement plan?”
Deep skepticism about government capability beyond ideology
Employers without retirement plans more open to Secure Choice approach
101 #PewRetirement www.pewtrusts.org/retirementsavings [email protected]
Small employers on automatic enrollment • “I think it's very un-American. I don't like it. I don't want someone telling
me or my employees they're automatically enrolled, and then now you have to figure out a way, you have to call somebody, you have to get on the computer, you have to do something to get out of it.”
• “[I]t’s like you’ve been forced. You’ve been tricked. You know, you haven’t been treated as an adult that’s able to make their own decision.”
• But…
• “I think it would be a good thing for certain people. Some employees might like that because they won't take the time to actually sign up for it, and if they want, they can actually just go in there and deny it, so they would probably benefit either which way it goes.”
Automatic enrollment and Secure Choice approaches pose a communications challenge for employers and for low income employees
102 #PewRetirement www.pewtrusts.org/retirementsavings [email protected]

Small employers on marketplace exchanges • “That’s redundant. My investment company already does that, and I
don’t want my tax dollars going into this particular program. That money could be better spent someplace else.”
• “I think you can do that now on Google.”
• “You could do this on your own! [laughs] You get on the website, go online. Why do you need the government to give you a list?”
Without a corresponding financial education effort, a marketplace will not reduce the retirement plan coverage gap.
If cost is a major issue, a marketplace would need to increase competition among providers.
103 #PewRetirement www.pewtrusts.org/retirementsavings [email protected]
Thank you! John Scott, Director, Retirement Savings Project The Pew Charitable Trusts Project page: http://www.pewtrusts.org/en/projects/retirementsavings Email: [email protected]

® Employee Benefit Research Institute 2016 ® Employee Benefit Research Institute 201 10
5
EBRI-ERF Policy Forum #78 Thursday, May 12, 2016
Research and Perspectives on Turning Savings Plans into Retirement Plans
® Employee Benefit Research Institute 2016 ® Employee Benefit Research Institute 201 10
6
EBRI-ERF Policy Forum #78 Thursday, May 12, 2016
Reducing Leakage & Incubating Savings
® Employee Benefit Research Institute 2016 ® Employee Benefit Research Institute 201 10
7
Employee Engagement in Health and Retirement Challenges and Reforms
EBRI-ERF Policy Forum #78 Thursday, May12, 2016