Embed Size (px)
Citation preview

National Compensation Survey ● www.bls.gov/ect ● [email protected] ● 202.691.6199
Employer Costs for Employee CompensationHistorical Supplementary Tables National Compensation Survey
December 2006 – March 2017
Table Page
Private industry workers:
Goods-producing industries 1 by occupational group ................................. 3
Manufacturing industries 2 by occupational group ............................... 27 3 by establishment size ................................ 49 4 by bargaining status .................................. 61
Service-providing industries 5 by occupational group ............................... 65
Trade, transportation, and utilities industries 6 by occupational group ............................... 91 7 by establishment size .............................. 115 8 by bargaining status ................................ 127
Wholesale trade industries 9 by occupational group ............................. 131
10 by establishment size .............................. 141
Retail trade industries 11 by occupational group ............................. 149 12 by establishment size .............................. 161 13 by bargaining status ................................ 171
Transportation and warehousing industries 14 by all workers .......................................... 175 15 by establishment size .............................. 177 16 by bargaining status ................................ 185
Table Page
Private industry workers, cont’d:
Information industries 17 by occupational group ............................. 189 18 by establishment size .............................. 197
Financial activities industries 19 by occupational group ............................. 205 20 by establishment size .............................. 219
Professional and business services industries 21 by occupational group ............................. 229 22 by establishment size .............................. 247
Education and health services industries 23 by occupational group ............................. 259 24 by establishment size .............................. 273 25 by bargaining status ................................ 285
Educational services industries 26 by occupational group ............................. 289 27 by establishment size .............................. 303
Health care and social assistance industries 28 by occupational group ............................. 311 29 by establishment size .............................. 323 30 by bargaining status ................................ 335
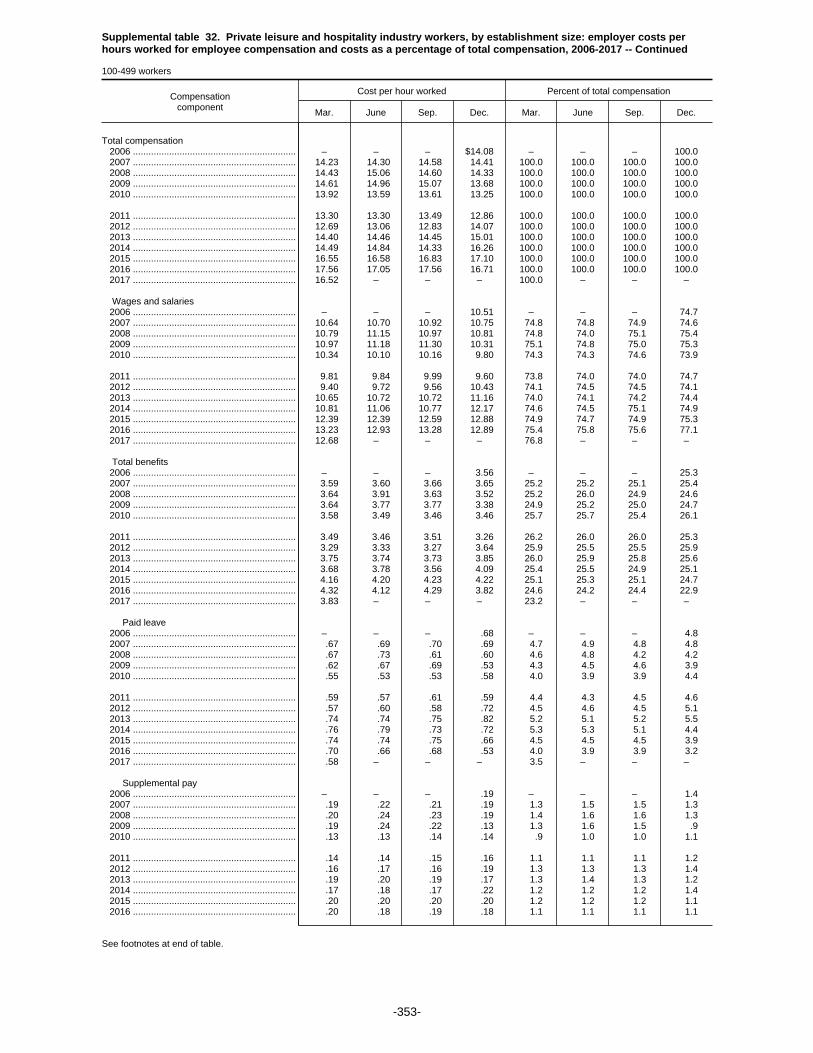
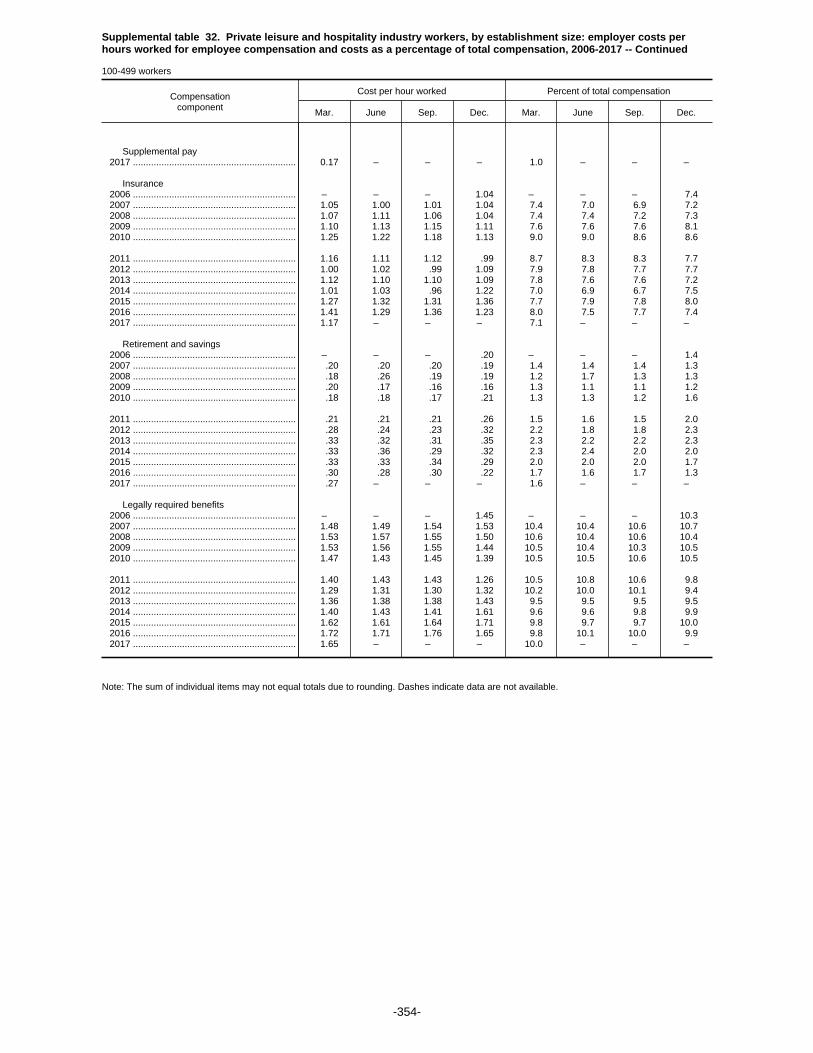
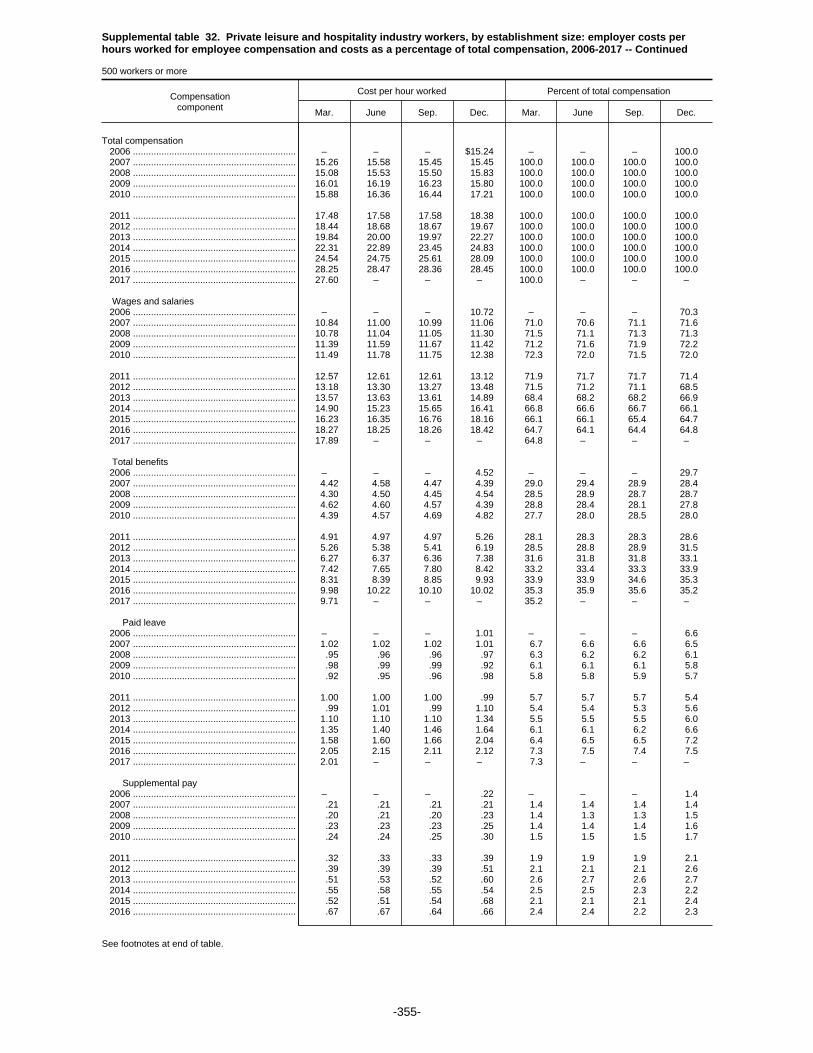
Leisure and hospitality industries 31 by occupational group ............................. 339 32 by establishment size .............................. 345
Supplemental table 1. Private goods-producing industry workers, by occupational group: employer costs per hoursworked for employee compensation and costs as a percentage of total compensation, 2006-2017
All workers
Compensationcomponent
Cost per hour worked Percent of total compensation
Mar. June Sep. Dec. Mar. June Sep. Dec.
Total compensation 2006 ............................................................... – – – $30.02 – – – 100.0 2007 ............................................................... 30.12 30.41 30.68 30.94 100.0 100.0 100.0 100.0 2008 ............................................................... 31.38 31.58 31.78 32.14 100.0 100.0 100.0 100.0 2009 ............................................................... 32.29 32.29 32.32 32.14 100.0 100.0 100.0 100.0 2010 ............................................................... 32.42 32.56 32.83 32.50 100.0 100.0 100.0 100.0
2011 ............................................................... 32.91 33.26 33.30 33.64 100.0 100.0 100.0 100.0 2012 ............................................................... 33.76 33.88 34.03 34.14 100.0 100.0 100.0 100.0 2013 ............................................................... 34.55 34.57 34.57 35.57 100.0 100.0 100.0 100.0 2014 ............................................................... 35.95 36.18 36.34 37.21 100.0 100.0 100.0 100.0 2015 ............................................................... 37.24 37.39 37.68 38.18 100.0 100.0 100.0 100.0 2016 ............................................................... 38.36 38.59 38.99 39.03 100.0 100.0 100.0 100.0 2017 ............................................................... 39.42 – – – 100.0 – – –
Wages and salaries 2006 ............................................................... – – – 19.92 – – – 66.4 2007 ............................................................... 20.11 20.26 20.49 20.62 66.8 66.6 66.8 66.7 2008 ............................................................... 20.93 21.09 21.24 21.54 66.7 66.8 66.8 67.0 2009 ............................................................... 21.62 21.63 21.67 21.60 66.9 67.0 67.1 67.2 2010 ............................................................... 21.64 21.73 21.87 21.73 66.7 66.7 66.6 66.9
2011 ............................................................... 21.88 22.02 22.10 22.40 66.5 66.2 66.4 66.6 2012 ............................................................... 22.51 22.60 22.72 22.85 66.7 66.7 66.8 66.9 2013 ............................................................... 23.08 23.12 23.14 23.60 66.8 66.9 67.0 66.3 2014 ............................................................... 23.77 23.97 24.06 24.61 66.1 66.2 66.2 66.1 2015 ............................................................... 24.66 24.78 25.01 25.31 66.2 66.3 66.4 66.3 2016 ............................................................... 25.45 25.64 25.90 25.94 66.3 66.4 66.4 66.5 2017 ............................................................... 26.22 – – – 66.5 – – –
Total benefits 2006 ............................................................... – – – 10.10 – – – 33.6 2007 ............................................................... 10.01 10.15 10.19 10.32 33.2 33.4 33.2 33.3 2008 ............................................................... 10.45 10.49 10.54 10.59 33.3 33.2 33.2 33.0 2009 ............................................................... 10.67 10.66 10.65 10.54 33.1 33.0 32.9 32.8 2010 ............................................................... 10.78 10.84 10.96 10.77 33.3 33.3 33.4 33.1
2011 ............................................................... 11.03 11.24 11.21 11.24 33.5 33.8 33.6 33.4 2012 ............................................................... 11.25 11.28 11.31 11.29 33.3 33.3 33.2 33.1 2013 ............................................................... 11.48 11.44 11.42 11.97 33.2 33.1 33.0 33.7 2014 ............................................................... 12.18 12.21 12.27 12.60 33.9 33.8 33.8 33.9 2015 ............................................................... 12.58 12.61 12.67 12.87 33.8 33.7 33.6 33.7 2016 ............................................................... 12.92 12.95 13.09 13.09 33.7 33.6 33.6 33.5 2017 ............................................................... 13.20 – – – 33.5 – – –
Paid leave 2006 ............................................................... – – – 1.92 – – – 6.4 2007 ............................................................... 1.95 1.96 1.95 1.97 6.5 6.4 6.4 6.4 2008 ............................................................... 1.98 1.98 1.99 2.05 6.3 6.3 6.3 6.4 2009 ............................................................... 2.08 2.07 2.08 2.08 6.4 6.4 6.4 6.5 2010 ............................................................... 2.10 2.09 2.10 2.11 6.5 6.4 6.4 6.5
2011 ............................................................... 2.13 2.10 2.11 2.19 6.5 6.3 6.3 6.5 2012 ............................................................... 2.21 2.20 2.20 2.23 6.6 6.5 6.5 6.5 2013 ............................................................... 2.27 2.26 2.26 2.34 6.6 6.5 6.5 6.6 2014 ............................................................... 2.37 2.37 2.37 2.44 6.6 6.5 6.5 6.6 2015 ............................................................... 2.46 2.43 2.46 2.47 6.6 6.5 6.5 6.5 2016 ............................................................... 2.49 2.50 2.52 2.54 6.5 6.5 6.5 6.5 2017 ............................................................... 2.57 – – – 6.5 – – –
Supplemental pay 2006 ............................................................... – – – 1.17 – – – 3.9 2007 ............................................................... 1.20 1.23 1.21 1.27 4.0 4.0 3.9 4.1 2008 ............................................................... 1.30 1.31 1.32 1.27 4.1 4.1 4.2 3.9 2009 ............................................................... 1.21 1.20 1.21 1.21 3.7 3.7 3.7 3.8 2010 ............................................................... 1.21 1.20 1.19 1.17 3.7 3.7 3.6 3.6
2011 ............................................................... 1.27 1.32 1.31 1.34 3.9 4.0 3.9 4.0 2012 ............................................................... 1.36 1.34 1.33 1.35 4.0 4.0 3.9 3.9 2013 ............................................................... 1.35 1.31 1.31 1.41 3.9 3.8 3.8 4.0 2014 ............................................................... 1.42 1.42 1.42 1.49 3.9 3.9 3.9 4.0 2015 ............................................................... 1.43 1.43 1.42 1.49 3.8 3.8 3.8 3.9 2016 ............................................................... 1.50 1.50 1.50 1.51 3.9 3.9 3.8 3.9
See footnotes at end of table.
-3-
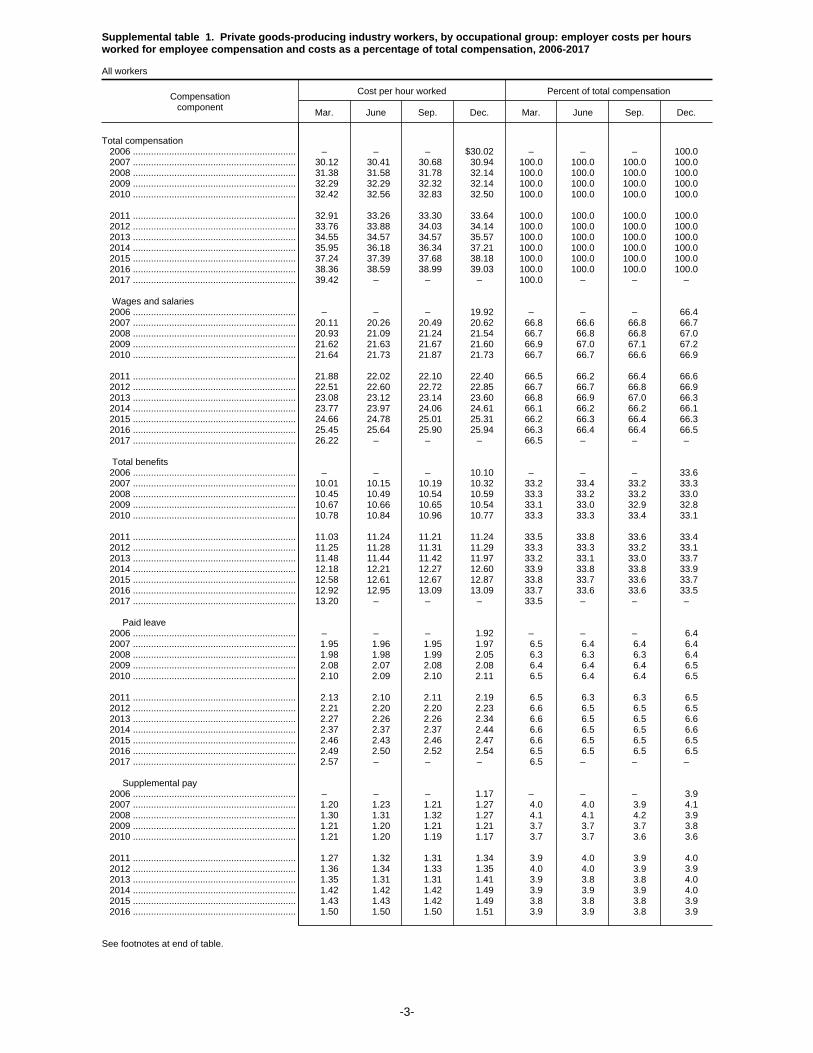
Supplemental table 1. Private goods-producing industry workers, by occupational group: employer costs per hoursworked for employee compensation and costs as a percentage of total compensation, 2006-2017
All workers
Compensationcomponent
Cost per hour worked Percent of total compensation
Mar. June Sep. Dec. Mar. June Sep. Dec.
Supplemental pay 2017 ............................................................... 1.48 – – – 3.8 – – –
Insurance 2006 ............................................................... – – – 2.66 – – – 8.9 2007 ............................................................... 2.72 2.77 2.79 2.82 9.0 9.1 9.1 9.1 2008 ............................................................... 2.88 2.88 2.90 2.91 9.2 9.1 9.1 9.0 2009 ............................................................... 3.00 3.01 3.02 3.00 9.3 9.3 9.3 9.3 2010 ............................................................... 3.08 3.09 3.11 3.07 9.5 9.5 9.5 9.4
2011 ............................................................... 3.13 3.14 3.16 3.15 9.5 9.5 9.5 9.4 2012 ............................................................... 3.19 3.21 3.22 3.22 9.4 9.5 9.5 9.4 2013 ............................................................... 3.29 3.28 3.27 3.36 9.5 9.5 9.5 9.5 2014 ............................................................... 3.42 3.43 3.44 3.46 9.5 9.5 9.5 9.3 2015 ............................................................... 3.51 3.52 3.55 3.55 9.4 9.4 9.4 9.3 2016 ............................................................... 3.59 3.59 3.65 3.64 9.3 9.3 9.4 9.3 2017 ............................................................... 3.68 – – – 9.3 – – –
Retirement and savings 2006 ............................................................... – – – 1.54 – – – 5.1 2007 ............................................................... 1.33 1.38 1.41 1.43 4.4 4.5 4.6 4.6 2008 ............................................................... 1.45 1.45 1.45 1.47 4.6 4.6 4.5 4.6 2009 ............................................................... 1.47 1.46 1.43 1.36 4.6 4.5 4.4 4.2 2010 ............................................................... 1.46 1.50 1.59 1.53 4.5 4.6 4.8 4.7
2011 ............................................................... 1.56 1.70 1.65 1.64 4.7 5.1 5.0 4.9 2012 ............................................................... 1.53 1.54 1.55 1.51 4.5 4.5 4.5 4.4 2013 ............................................................... 1.56 1.57 1.54 1.77 4.5 4.5 4.5 5.0 2014 ............................................................... 1.87 1.88 1.92 2.02 5.2 5.2 5.3 5.4 2015 ............................................................... 2.01 2.04 2.04 2.11 5.4 5.5 5.4 5.5 2016 ............................................................... 2.08 2.09 2.12 2.14 5.4 5.4 5.4 5.5 2017 ............................................................... 2.17 – – – 5.5 – – –
Legally required benefits 2006 ............................................................... – – – 2.81 – – – 9.4 2007 ............................................................... 2.81 2.82 2.83 2.83 9.3 9.3 9.2 9.2 2008 ............................................................... 2.85 2.87 2.88 2.90 9.1 9.1 9.1 9.0 2009 ............................................................... 2.91 2.92 2.92 2.89 9.0 9.0 9.0 9.0 2010 ............................................................... 2.92 2.95 2.97 2.90 9.0 9.1 9.1 8.9
2011 ............................................................... 2.94 2.98 2.97 2.92 8.9 8.9 8.9 8.7 2012 ............................................................... 2.96 2.99 3.01 2.98 8.8 8.8 8.8 8.7 2013 ............................................................... 3.00 3.02 3.03 3.09 8.7 8.7 8.8 8.7 2014 ............................................................... 3.10 3.11 3.12 3.19 8.6 8.6 8.6 8.6 2015 ............................................................... 3.17 3.19 3.20 3.25 8.5 8.5 8.5 8.5 2016 ............................................................... 3.26 3.26 3.29 3.26 8.5 8.5 8.4 8.3 2017 ............................................................... 3.30 – – – 8.4 – – –
Note: The sum of individual items may not equal totals due to rounding. Dashes indicate data are not available.
-4-
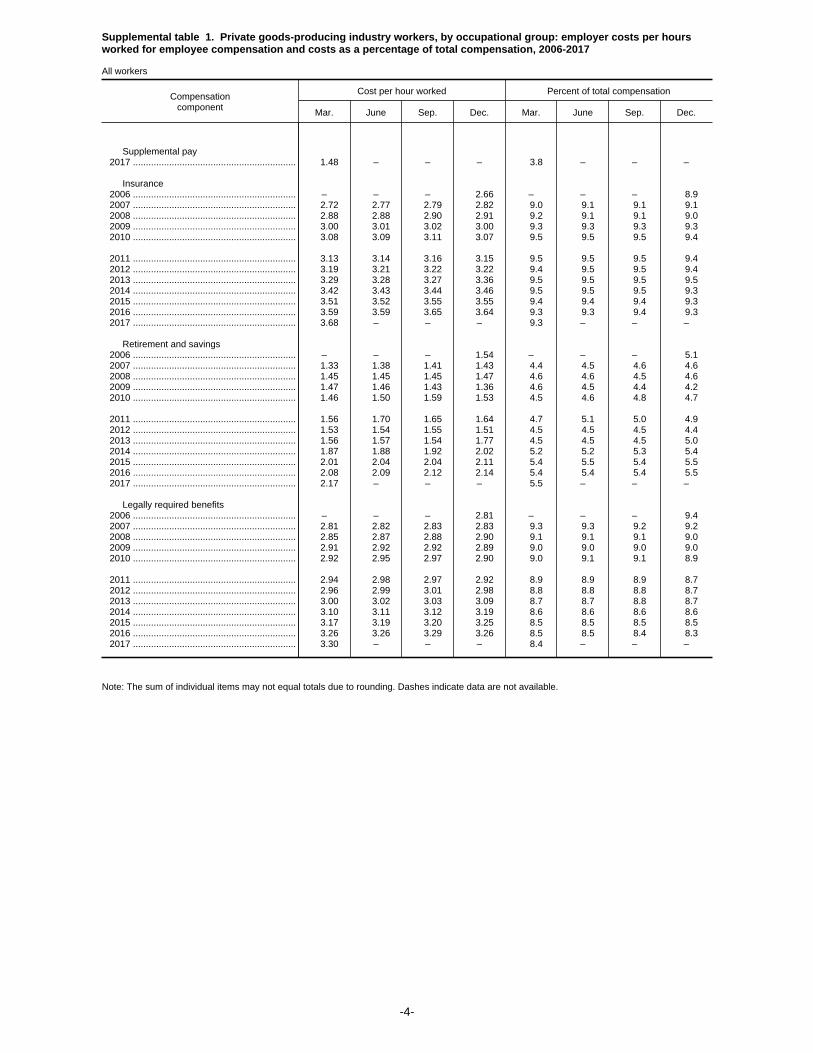
Supplemental table 1. Private goods-producing industry workers, by occupational group: employer costs per hoursworked for employee compensation and costs as a percentage of total compensation, 2006-2017 -- Continued
Management, professional, and related occupations1
Compensationcomponent
Cost per hour worked Percent of total compensation
Mar. June Sep. Dec. Mar. June Sep. Dec.
Total compensation 2006 ............................................................... – – – $52.02 – – – 100.0 2007 ............................................................... 52.36 52.82 53.09 53.63 100.0 100.0 100.0 100.0 2008 ............................................................... 54.68 55.02 54.88 56.91 100.0 100.0 100.0 100.0 2009 ............................................................... 57.35 57.22 56.93 56.13 100.0 100.0 100.0 100.0 2010 ............................................................... 57.04 57.29 57.81 58.18 100.0 100.0 100.0 100.0
2011 ............................................................... 59.18 59.95 59.63 61.24 100.0 100.0 100.0 100.0 2012 ............................................................... 61.64 61.75 61.96 61.06 100.0 100.0 100.0 100.0 2013 ............................................................... 61.80 61.80 61.74 64.12 100.0 100.0 100.0 100.0 2014 ............................................................... 65.08 65.73 65.62 66.55 100.0 100.0 100.0 100.0 2015 ............................................................... 66.96 67.22 67.56 68.37 100.0 100.0 100.0 100.0 2016 ............................................................... 68.67 69.19 69.14 70.11 100.0 100.0 100.0 100.0 2017 ............................................................... 70.55 – – – 100.0 – – –
Wages and salaries 2006 ............................................................... – – – 34.74 – – – 66.8 2007 ............................................................... 35.28 35.46 35.81 36.05 67.4 67.1 67.4 67.2 2008 ............................................................... 36.75 37.00 36.96 38.66 67.2 67.2 67.3 67.9 2009 ............................................................... 39.03 39.02 38.96 38.50 68.1 68.2 68.4 68.6 2010 ............................................................... 38.87 38.99 39.23 39.46 68.1 68.1 67.9 67.8
2011 ............................................................... 39.77 40.08 40.03 41.39 67.2 66.9 67.1 67.6 2012 ............................................................... 41.67 41.91 42.05 41.53 67.6 67.9 67.9 68.0 2013 ............................................................... 42.01 42.18 42.05 42.82 68.0 68.3 68.1 66.8 2014 ............................................................... 43.24 43.74 43.57 44.31 66.4 66.6 66.4 66.6 2015 ............................................................... 44.70 44.90 45.31 45.50 66.8 66.8 67.1 66.6 2016 ............................................................... 45.77 46.13 46.31 46.90 66.6 66.7 67.0 66.9 2017 ............................................................... 47.21 – – – 66.9 – – –
Total benefits 2006 ............................................................... – – – 17.28 – – – 33.2 2007 ............................................................... 17.08 17.36 17.28 17.58 32.6 32.9 32.6 32.8 2008 ............................................................... 17.93 18.02 17.92 18.25 32.8 32.8 32.7 32.1 2009 ............................................................... 18.31 18.20 17.97 17.64 31.9 31.8 31.6 31.4 2010 ............................................................... 18.18 18.30 18.58 18.72 31.9 31.9 32.1 32.2
2011 ............................................................... 19.41 19.87 19.60 19.86 32.8 33.1 32.9 32.4 2012 ............................................................... 19.97 19.84 19.91 19.53 32.4 32.1 32.1 32.0 2013 ............................................................... 19.79 19.62 19.69 21.31 32.0 31.7 31.9 33.2 2014 ............................................................... 21.84 21.98 22.05 22.24 33.6 33.4 33.6 33.4 2015 ............................................................... 22.26 22.32 22.25 22.87 33.2 33.2 32.9 33.4 2016 ............................................................... 22.90 23.06 22.83 23.21 33.4 33.3 33.0 33.1 2017 ............................................................... 23.34 – – – 33.1 – – –
Paid leave 2006 ............................................................... – – – 4.61 – – – 8.9 2007 ............................................................... 4.69 4.74 4.70 4.74 9.0 9.0 8.9 8.8 2008 ............................................................... 4.82 4.84 4.82 5.09 8.8 8.8 8.8 8.9 2009 ............................................................... 5.15 5.16 5.15 5.04 9.0 9.0 9.0 9.0 2010 ............................................................... 5.08 5.10 5.15 5.17 8.9 8.9 8.9 8.9
2011 ............................................................... 5.22 5.22 5.20 5.32 8.8 8.7 8.7 8.7 2012 ............................................................... 5.38 5.39 5.42 5.33 8.7 8.7 8.7 8.7 2013 ............................................................... 5.40 5.41 5.39 5.55 8.7 8.7 8.7 8.6 2014 ............................................................... 5.62 5.66 5.63 5.70 8.6 8.6 8.6 8.6 2015 ............................................................... 5.75 5.77 5.81 5.86 8.6 8.6 8.6 8.6 2016 ............................................................... 5.92 6.02 5.96 6.05 8.6 8.7 8.6 8.6 2017 ............................................................... 6.10 – – – 8.6 – – –
Supplemental pay 2006 ............................................................... – – – 2.15 – – – 4.1 2007 ............................................................... 2.28 2.36 2.25 2.40 4.4 4.5 4.2 4.5 2008 ............................................................... 2.43 2.45 2.46 2.20 4.4 4.5 4.5 3.9 2009 ............................................................... 2.00 2.00 2.00 2.01 3.5 3.5 3.5 3.6 2010 ............................................................... 2.13 2.13 2.07 2.13 3.7 3.7 3.6 3.7
2011 ............................................................... 2.51 2.79 2.75 2.78 4.2 4.6 4.6 4.5 2012 ............................................................... 2.75 2.63 2.62 2.61 4.5 4.3 4.2 4.3 2013 ............................................................... 2.61 2.48 2.49 2.73 4.2 4.0 4.0 4.3 2014 ............................................................... 2.73 2.74 2.71 2.79 4.2 4.2 4.1 4.2 2015 ............................................................... 2.59 2.63 2.57 2.65 3.9 3.9 3.8 3.9 2016 ............................................................... 2.58 2.58 2.53 2.59 3.8 3.7 3.7 3.7
See footnotes at end of table.
-5-

Supplemental table 1. Private goods-producing industry workers, by occupational group: employer costs per hoursworked for employee compensation and costs as a percentage of total compensation, 2006-2017 -- Continued
Management, professional, and related occupations1
Compensationcomponent
Cost per hour worked Percent of total compensation
Mar. June Sep. Dec. Mar. June Sep. Dec.
Supplemental pay 2017 ............................................................... 2.52 – – – 3.6 – – –
Insurance 2006 ............................................................... – – – 3.58 – – – 6.9 2007 ............................................................... 3.72 3.76 3.78 3.83 7.1 7.1 7.1 7.1 2008 ............................................................... 3.95 3.98 3.99 4.02 7.2 7.2 7.3 7.1 2009 ............................................................... 4.15 4.16 4.17 4.14 7.2 7.3 7.3 7.4 2010 ............................................................... 4.23 4.26 4.27 4.28 7.4 7.4 7.4 7.4
2011 ............................................................... 4.42 4.45 4.46 4.39 7.5 7.4 7.5 7.2 2012 ............................................................... 4.49 4.52 4.53 4.45 7.3 7.3 7.3 7.3 2013 ............................................................... 4.55 4.55 4.55 4.70 7.4 7.4 7.4 7.3 2014 ............................................................... 4.76 4.78 4.76 4.80 7.3 7.3 7.3 7.2 2015 ............................................................... 4.86 4.85 4.87 5.07 7.3 7.2 7.2 7.4 2016 ............................................................... 5.15 5.18 5.15 5.19 7.5 7.5 7.4 7.4 2017 ............................................................... 5.24 – – – 7.4 – – –
Retirement and savings 2006 ............................................................... – – – 3.29 – – – 6.3 2007 ............................................................... 2.69 2.81 2.85 2.91 5.1 5.3 5.4 5.4 2008 ............................................................... 2.99 2.99 2.90 3.06 5.5 5.4 5.3 5.4 2009 ............................................................... 3.10 2.96 2.74 2.57 5.4 5.2 4.8 4.6 2010 ............................................................... 2.82 2.88 3.14 3.20 4.9 5.0 5.4 5.5
2011 ............................................................... 3.25 3.38 3.16 3.27 5.5 5.6 5.3 5.3 2012 ............................................................... 3.20 3.13 3.17 3.00 5.2 5.1 5.1 4.9 2013 ............................................................... 3.05 2.99 3.05 4.07 4.9 4.8 4.9 6.3 2014 ............................................................... 4.42 4.47 4.62 4.60 6.8 6.8 7.0 6.9 2015 ............................................................... 4.69 4.68 4.60 4.88 7.0 7.0 6.8 7.1 2016 ............................................................... 4.82 4.81 4.72 4.86 7.0 6.9 6.8 6.9 2017 ............................................................... 4.88 – – – 6.9 – – –
Legally required benefits 2006 ............................................................... – – – 3.65 – – – 7.0 2007 ............................................................... 3.70 3.69 3.70 3.70 7.1 7.0 7.0 6.9 2008 ............................................................... 3.74 3.76 3.76 3.88 6.8 6.8 6.9 6.8 2009 ............................................................... 3.92 3.91 3.91 3.87 6.8 6.8 6.9 6.9 2010 ............................................................... 3.91 3.93 3.95 3.94 6.9 6.9 6.8 6.8
2011 ............................................................... 4.00 4.03 4.03 4.09 6.8 6.7 6.8 6.7 2012 ............................................................... 4.14 4.17 4.18 4.14 6.7 6.8 6.8 6.8 2013 ............................................................... 4.18 4.19 4.22 4.26 6.8 6.8 6.8 6.6 2014 ............................................................... 4.31 4.33 4.32 4.35 6.6 6.6 6.6 6.5 2015 ............................................................... 4.38 4.38 4.40 4.41 6.5 6.5 6.5 6.4 2016 ............................................................... 4.43 4.47 4.47 4.50 6.5 6.5 6.5 6.4 2017 ............................................................... 4.60 – – – 6.5 – – –
1 Estimates from December 2013 to March 2014 for this series were corrected, details are available atwww.bls.gov/bls/ecec_correction_091014.htm.
Note: The sum of individual items may not equal totals due to rounding. Dashes indicate data are not available.
-6-

Supplemental table 1. Private goods-producing industry workers, by occupational group: employer costs per hoursworked for employee compensation and costs as a percentage of total compensation, 2006-2017 -- Continued
Management, business, and financial occcupations1
Compensationcomponent
Cost per hour worked Percent of total compensation
Mar. June Sep. Dec. Mar. June Sep. Dec.
Total compensation 2006 ............................................................... – – – $56.77 – – – 100.0 2007 ............................................................... 57.50 58.15 58.61 59.63 100.0 100.0 100.0 100.0 2008 ............................................................... 61.06 61.38 61.42 60.94 100.0 100.0 100.0 100.0 2009 ............................................................... 61.60 61.31 60.78 59.40 100.0 100.0 100.0 100.0 2010 ............................................................... 60.38 60.58 60.95 60.86 100.0 100.0 100.0 100.0
2011 ............................................................... 62.20 62.76 62.29 62.94 100.0 100.0 100.0 100.0 2012 ............................................................... 63.17 62.85 63.14 62.98 100.0 100.0 100.0 100.0 2013 ............................................................... 63.67 63.89 63.64 66.30 100.0 100.0 100.0 100.0 2014 ............................................................... 67.21 67.43 67.46 67.22 100.0 100.0 100.0 100.0 2015 ............................................................... 67.71 67.85 68.58 69.36 100.0 100.0 100.0 100.0 2016 ............................................................... 69.51 69.94 69.70 70.64 100.0 100.0 100.0 100.0 2017 ............................................................... 70.98 – – – 100.0 – – –
Wages and salaries 2006 ............................................................... – – – 38.61 – – – 68.0 2007 ............................................................... 39.35 39.53 40.03 40.58 68.4 68.0 68.3 68.1 2008 ............................................................... 41.48 41.73 41.80 42.25 67.9 68.0 68.1 69.3 2009 ............................................................... 42.81 42.59 42.33 41.49 69.5 69.5 69.6 69.8 2010 ............................................................... 42.01 42.12 42.35 42.15 69.6 69.5 69.5 69.3
2011 ............................................................... 42.71 42.96 42.77 43.59 68.7 68.4 68.7 69.3 2012 ............................................................... 43.76 43.67 43.87 43.86 69.3 69.5 69.5 69.6 2013 ............................................................... 44.35 44.65 44.27 45.10 69.6 69.9 69.6 68.0 2014 ............................................................... 45.54 45.69 45.61 45.69 67.8 67.8 67.6 68.0 2015 ............................................................... 46.28 46.38 47.11 47.42 68.4 68.4 68.7 68.4 2016 ............................................................... 47.63 47.97 48.06 48.63 68.5 68.6 68.9 68.8 2017 ............................................................... 48.87 – – – 68.9 – – –
Total benefits 2006 ............................................................... – – – 18.16 – – – 32.0 2007 ............................................................... 18.15 18.62 18.58 19.05 31.6 32.0 31.7 31.9 2008 ............................................................... 19.58 19.65 19.62 18.69 32.1 32.0 31.9 30.7 2009 ............................................................... 18.79 18.72 18.45 17.91 30.5 30.5 30.4 30.2 2010 ............................................................... 18.36 18.46 18.60 18.71 30.4 30.5 30.5 30.7
2011 ............................................................... 19.49 19.80 19.53 19.35 31.3 31.6 31.3 30.7 2012 ............................................................... 19.42 19.18 19.27 19.12 30.7 30.5 30.5 30.4 2013 ............................................................... 19.33 19.24 19.36 21.20 30.4 30.1 30.4 32.0 2014 ............................................................... 21.67 21.74 21.85 21.53 32.2 32.2 32.4 32.0 2015 ............................................................... 21.43 21.47 21.47 21.94 31.6 31.6 31.3 31.6 2016 ............................................................... 21.89 21.97 21.65 22.00 31.5 31.4 31.1 31.2 2017 ............................................................... 22.11 – – – 31.1 – – –
Paid leave 2006 ............................................................... – – – 4.98 – – – 8.8 2007 ............................................................... 5.09 5.20 5.14 5.22 8.9 8.9 8.8 8.8 2008 ............................................................... 5.33 5.36 5.34 5.40 8.7 8.7 8.7 8.9 2009 ............................................................... 5.49 5.46 5.41 5.25 8.9 8.9 8.9 8.8 2010 ............................................................... 5.31 5.34 5.39 5.39 8.8 8.8 8.8 8.9
2011 ............................................................... 5.49 5.46 5.41 5.38 8.8 8.7 8.7 8.6 2012 ............................................................... 5.43 5.40 5.45 5.46 8.6 8.6 8.6 8.7 2013 ............................................................... 5.53 5.53 5.48 5.70 8.7 8.7 8.6 8.6 2014 ............................................................... 5.78 5.76 5.75 5.73 8.6 8.5 8.5 8.5 2015 ............................................................... 5.80 5.77 5.85 5.98 8.6 8.5 8.5 8.6 2016 ............................................................... 6.04 6.10 6.03 6.16 8.7 8.7 8.7 8.7 2017 ............................................................... 6.18 – – – 8.7 – – –
Supplemental pay 2006 ............................................................... – – – 2.72 – – – 4.8 2007 ............................................................... 2.87 3.01 2.96 3.20 5.0 5.2 5.0 5.4 2008 ............................................................... 3.28 3.29 3.34 2.44 5.4 5.4 5.4 4.0 2009 ............................................................... 2.22 2.24 2.22 2.12 3.6 3.6 3.7 3.6 2010 ............................................................... 2.19 2.20 2.14 2.16 3.6 3.6 3.5 3.5
2011 ............................................................... 2.57 2.80 2.72 2.68 4.1 4.5 4.4 4.3 2012 ............................................................... 2.50 2.42 2.45 2.52 4.0 3.9 3.9 4.0 2013 ............................................................... 2.51 2.42 2.45 2.77 3.9 3.8 3.8 4.2 2014 ............................................................... 2.70 2.74 2.73 2.63 4.0 4.1 4.1 3.9 2015 ............................................................... 2.28 2.37 2.33 2.42 3.4 3.5 3.4 3.5 2016 ............................................................... 2.32 2.30 2.19 2.23 3.3 3.3 3.1 3.2
See footnotes at end of table.
-7-

Supplemental table 1. Private goods-producing industry workers, by occupational group: employer costs per hoursworked for employee compensation and costs as a percentage of total compensation, 2006-2017 -- Continued
Management, business, and financial occcupations1
Compensationcomponent
Cost per hour worked Percent of total compensation
Mar. June Sep. Dec. Mar. June Sep. Dec.
Supplemental pay 2017 ............................................................... 2.15 – – – 3.0 – – –
Insurance 2006 ............................................................... – – – 3.53 – – – 6.2 2007 ............................................................... 3.67 3.71 3.72 3.76 6.4 6.4 6.3 6.3 2008 ............................................................... 3.92 3.92 3.92 3.92 6.4 6.4 6.4 6.4 2009 ............................................................... 4.06 4.06 4.07 4.10 6.6 6.6 6.7 6.9 2010 ............................................................... 4.19 4.19 4.20 4.19 6.9 6.9 6.9 6.9
2011 ............................................................... 4.30 4.32 4.34 4.26 6.9 6.9 7.0 6.8 2012 ............................................................... 4.39 4.40 4.41 4.27 6.9 7.0 7.0 6.8 2013 ............................................................... 4.36 4.34 4.33 4.56 6.8 6.8 6.8 6.9 2014 ............................................................... 4.62 4.63 4.63 4.64 6.9 6.9 6.9 6.9 2015 ............................................................... 4.69 4.65 4.69 4.81 6.9 6.9 6.8 6.9 2016 ............................................................... 4.87 4.89 4.85 4.89 7.0 7.0 7.0 6.9 2017 ............................................................... 4.95 – – – 7.0 – – –
Retirement and savings 2006 ............................................................... – – – 2.97 – – – 5.2 2007 ............................................................... 2.52 2.71 2.76 2.84 4.4 4.7 4.7 4.8 2008 ............................................................... 2.98 2.99 2.90 2.82 4.9 4.9 4.7 4.6 2009 ............................................................... 2.85 2.81 2.62 2.35 4.6 4.6 4.3 4.0 2010 ............................................................... 2.55 2.57 2.71 2.85 4.2 4.2 4.5 4.7
2011 ............................................................... 2.93 3.01 2.84 2.80 4.7 4.8 4.6 4.4 2012 ............................................................... 2.81 2.66 2.67 2.57 4.4 4.2 4.2 4.1 2013 ............................................................... 2.60 2.59 2.73 3.77 4.1 4.1 4.3 5.7 2014 ............................................................... 4.12 4.14 4.28 4.10 6.1 6.1 6.3 6.1 2015 ............................................................... 4.20 4.22 4.10 4.20 6.2 6.2 6.0 6.1 2016 ............................................................... 4.10 4.09 3.99 4.11 5.9 5.9 5.7 5.8 2017 ............................................................... 4.10 – – – 5.8 – – –
Legally required benefits 2006 ............................................................... – – – 3.95 – – – 7.0 2007 ............................................................... 4.00 3.99 4.00 4.03 7.0 6.9 6.8 6.8 2008 ............................................................... 4.08 4.09 4.12 4.12 6.7 6.7 6.7 6.8 2009 ............................................................... 4.17 4.16 4.13 4.09 6.8 6.8 6.8 6.9 2010 ............................................................... 4.14 4.16 4.17 4.12 6.9 6.9 6.8 6.8
2011 ............................................................... 4.19 4.21 4.21 4.23 6.7 6.7 6.8 6.7 2012 ............................................................... 4.29 4.29 4.30 4.30 6.8 6.8 6.8 6.8 2013 ............................................................... 4.33 4.36 4.38 4.41 6.8 6.8 6.9 6.6 2014 ............................................................... 4.45 4.47 4.46 4.43 6.6 6.6 6.6 6.6 2015 ............................................................... 4.46 4.46 4.49 4.53 6.6 6.6 6.6 6.5 2016 ............................................................... 4.55 4.59 4.58 4.61 6.5 6.6 6.6 6.5 2017 ............................................................... 4.72 – – – 6.6 – – –
1 Estimates from December 2013 to March 2014 for this series were corrected, details are available atwww.bls.gov/bls/ecec_correction_091014.htm.
Note: The sum of individual items may not equal totals due to rounding. Dashes indicate data are not available.
-8-

Supplemental table 1. Private goods-producing industry workers, by occupational group: employer costs per hoursworked for employee compensation and costs as a percentage of total compensation, 2006-2017 -- Continued
Professional and related occupations1
Compensationcomponent
Cost per hour worked Percent of total compensation
Mar. June Sep. Dec. Mar. June Sep. Dec.
Total compensation 2006 ............................................................... – – – $48.38 – – – 100.0 2007 ............................................................... 48.44 48.82 48.94 49.09 100.0 100.0 100.0 100.0 2008 ............................................................... 50.00 50.39 50.19 53.45 100.0 100.0 100.0 100.0 2009 ............................................................... 53.75 53.74 53.67 53.33 100.0 100.0 100.0 100.0 2010 ............................................................... 54.24 54.44 55.11 55.93 100.0 100.0 100.0 100.0
2011 ............................................................... 56.71 57.67 57.44 59.74 100.0 100.0 100.0 100.0 2012 ............................................................... 60.32 60.78 60.91 59.37 100.0 100.0 100.0 100.0 2013 ............................................................... 60.17 59.95 60.07 62.11 100.0 100.0 100.0 100.0 2014 ............................................................... 63.15 64.11 63.90 65.88 100.0 100.0 100.0 100.0 2015 ............................................................... 66.23 66.58 66.52 67.43 100.0 100.0 100.0 100.0 2016 ............................................................... 67.88 68.50 68.62 69.62 100.0 100.0 100.0 100.0 2017 ............................................................... 70.15 – – – 100.0 – – –
Wages and salaries 2006 ............................................................... – – – 31.77 – – – 65.7 2007 ............................................................... 32.18 32.41 32.63 32.62 66.4 66.4 66.7 66.5 2008 ............................................................... 33.28 33.56 33.48 35.58 66.6 66.6 66.7 66.6 2009 ............................................................... 35.83 35.99 36.11 35.93 66.7 67.0 67.3 67.4 2010 ............................................................... 36.22 36.29 36.56 37.20 66.8 66.7 66.3 66.5
2011 ............................................................... 37.37 37.75 37.79 39.44 65.9 65.5 65.8 66.0 2012 ............................................................... 39.88 40.34 40.44 39.49 66.1 66.4 66.4 66.5 2013 ............................................................... 39.98 40.01 40.09 40.70 66.4 66.7 66.7 65.5 2014 ............................................................... 41.15 41.90 41.66 42.92 65.2 65.3 65.2 65.2 2015 ............................................................... 43.14 43.42 43.48 43.68 65.1 65.2 65.4 64.8 2016 ............................................................... 44.02 44.43 44.67 45.32 64.8 64.9 65.1 65.1 2017 ............................................................... 45.70 – – – 65.1 – – –
Total benefits 2006 ............................................................... – – – 16.61 – – – 34.3 2007 ............................................................... 16.26 16.42 16.30 16.47 33.6 33.6 33.3 33.5 2008 ............................................................... 16.71 16.83 16.70 17.87 33.4 33.4 33.3 33.4 2009 ............................................................... 17.91 17.76 17.56 17.40 33.3 33.0 32.7 32.6 2010 ............................................................... 18.02 18.15 18.55 18.74 33.2 33.3 33.7 33.5
2011 ............................................................... 19.34 19.92 19.66 20.30 34.1 34.5 34.2 34.0 2012 ............................................................... 20.44 20.43 20.48 19.88 33.9 33.6 33.6 33.5 2013 ............................................................... 20.19 19.95 19.98 21.41 33.6 33.3 33.3 34.5 2014 ............................................................... 22.00 22.22 22.24 22.96 34.8 34.7 34.8 34.8 2015 ............................................................... 23.09 23.16 23.05 23.75 34.9 34.8 34.6 35.2 2016 ............................................................... 23.86 24.07 23.95 24.31 35.2 35.1 34.9 34.9 2017 ............................................................... 24.45 – – – 34.9 – – –
Paid leave 2006 ............................................................... – – – 4.33 – – – 9.0 2007 ............................................................... 4.38 4.40 4.38 4.37 9.0 9.0 8.9 8.9 2008 ............................................................... 4.45 4.47 4.44 4.82 8.9 8.9 8.9 9.0 2009 ............................................................... 4.87 4.91 4.93 4.86 9.1 9.1 9.2 9.1 2010 ............................................................... 4.88 4.89 4.94 4.98 9.0 9.0 9.0 8.9
2011 ............................................................... 5.00 5.02 5.03 5.27 8.8 8.7 8.8 8.8 2012 ............................................................... 5.33 5.38 5.39 5.22 8.8 8.9 8.8 8.8 2013 ............................................................... 5.29 5.30 5.31 5.41 8.8 8.8 8.8 8.7 2014 ............................................................... 5.46 5.57 5.53 5.67 8.7 8.7 8.7 8.6 2015 ............................................................... 5.70 5.76 5.77 5.75 8.6 8.7 8.7 8.5 2016 ............................................................... 5.81 5.94 5.89 5.96 8.6 8.7 8.6 8.6 2017 ............................................................... 6.02 – – – 8.6 – – –
Supplemental pay 2006 ............................................................... – – – 1.70 – – – 3.5 2007 ............................................................... 1.83 1.87 1.71 1.80 3.8 3.8 3.5 3.7 2008 ............................................................... 1.80 1.84 1.83 1.99 3.6 3.6 3.6 3.7 2009 ............................................................... 1.81 1.81 1.82 1.92 3.4 3.4 3.4 3.6 2010 ............................................................... 2.08 2.07 2.02 2.11 3.8 3.8 3.7 3.8
2011 ............................................................... 2.46 2.78 2.77 2.88 4.3 4.8 4.8 4.8 2012 ............................................................... 2.97 2.81 2.77 2.68 4.9 4.6 4.5 4.5 2013 ............................................................... 2.69 2.53 2.53 2.70 4.5 4.2 4.2 4.3 2014 ............................................................... 2.77 2.74 2.69 2.95 4.4 4.3 4.2 4.5 2015 ............................................................... 2.90 2.90 2.80 2.87 4.4 4.4 4.2 4.3 2016 ............................................................... 2.83 2.85 2.84 2.93 4.2 4.2 4.1 4.2
See footnotes at end of table.
-9-

Supplemental table 1. Private goods-producing industry workers, by occupational group: employer costs per hoursworked for employee compensation and costs as a percentage of total compensation, 2006-2017 -- Continued
Professional and related occupations1
Compensationcomponent
Cost per hour worked Percent of total compensation
Mar. June Sep. Dec. Mar. June Sep. Dec.
Supplemental pay 2017 ............................................................... 2.85 – – – 4.1 – – –
Insurance 2006 ............................................................... – – – 3.62 – – – 7.5 2007 ............................................................... 3.76 3.80 3.83 3.88 7.8 7.8 7.8 7.9 2008 ............................................................... 3.97 4.02 4.04 4.10 7.9 8.0 8.0 7.7 2009 ............................................................... 4.22 4.25 4.25 4.18 7.9 7.9 7.9 7.8 2010 ............................................................... 4.27 4.31 4.33 4.36 7.9 7.9 7.9 7.8
2011 ............................................................... 4.53 4.56 4.56 4.51 8.0 7.9 7.9 7.5 2012 ............................................................... 4.58 4.63 4.63 4.61 7.6 7.6 7.6 7.8 2013 ............................................................... 4.72 4.73 4.74 4.82 7.9 7.9 7.9 7.8 2014 ............................................................... 4.89 4.93 4.89 4.96 7.8 7.7 7.7 7.5 2015 ............................................................... 5.03 5.05 5.06 5.31 7.6 7.6 7.6 7.9 2016 ............................................................... 5.41 5.44 5.43 5.46 8.0 7.9 7.9 7.8 2017 ............................................................... 5.51 – – – 7.8 – – –
Retirement and savings 2006 ............................................................... – – – 3.54 – – – 7.3 2007 ............................................................... 2.82 2.88 2.92 2.97 5.8 5.9 6.0 6.0 2008 ............................................................... 3.01 3.00 2.90 3.28 6.0 5.9 5.8 6.1 2009 ............................................................... 3.31 3.08 2.84 2.76 6.2 5.7 5.3 5.2 2010 ............................................................... 3.05 3.14 3.50 3.49 5.6 5.8 6.4 6.2
2011 ............................................................... 3.51 3.67 3.42 3.68 6.2 6.4 6.0 6.2 2012 ............................................................... 3.53 3.55 3.61 3.37 5.9 5.8 5.9 5.7 2013 ............................................................... 3.43 3.34 3.32 4.35 5.7 5.6 5.5 7.0 2014 ............................................................... 4.70 4.78 4.94 5.11 7.4 7.5 7.7 7.7 2015 ............................................................... 5.17 5.15 5.11 5.53 7.8 7.7 7.7 8.2 2016 ............................................................... 5.49 5.47 5.41 5.55 8.1 8.0 7.9 8.0 2017 ............................................................... 5.59 – – – 8.0 – – –
Legally required benefits 2006 ............................................................... – – – 3.43 – – – 7.1 2007 ............................................................... 3.47 3.47 3.46 3.45 7.2 7.1 7.1 7.0 2008 ............................................................... 3.48 3.51 3.50 3.68 7.0 7.0 7.0 6.9 2009 ............................................................... 3.70 3.71 3.72 3.68 6.9 6.9 6.9 6.9 2010 ............................................................... 3.72 3.73 3.76 3.80 6.9 6.9 6.8 6.8
2011 ............................................................... 3.84 3.88 3.88 3.97 6.8 6.7 6.8 6.6 2012 ............................................................... 4.02 4.06 4.08 4.01 6.7 6.7 6.7 6.7 2013 ............................................................... 4.05 4.05 4.08 4.13 6.7 6.8 6.8 6.6 2014 ............................................................... 4.18 4.20 4.19 4.28 6.6 6.6 6.6 6.5 2015 ............................................................... 4.30 4.31 4.30 4.29 6.5 6.5 6.5 6.4 2016 ............................................................... 4.32 4.37 4.37 4.41 6.4 6.4 6.4 6.3 2017 ............................................................... 4.49 – – – 6.4 – – –
1 Estimates from December 2013 to March 2014 for this series were corrected, details are available atwww.bls.gov/bls/ecec_correction_091014.htm.
Note: The sum of individual items may not equal totals due to rounding. Dashes indicate data are not available.
-10-

Supplemental table 1. Private goods-producing industry workers, by occupational group: employer costs per hoursworked for employee compensation and costs as a percentage of total compensation, 2006-2017 -- Continued
Sales and office occupations
Compensationcomponent
Cost per hour worked Percent of total compensation
Mar. June Sep. Dec. Mar. June Sep. Dec.
Total compensation 2006 ............................................................... – – – $25.87 – – – 100.0 2007 ............................................................... 25.89 26.09 26.42 26.61 100.0 100.0 100.0 100.0 2008 ............................................................... 26.83 26.99 27.14 27.49 100.0 100.0 100.0 100.0 2009 ............................................................... 27.61 27.62 27.78 27.44 100.0 100.0 100.0 100.0 2010 ............................................................... 27.65 27.75 28.00 27.87 100.0 100.0 100.0 100.0
2011 ............................................................... 27.98 28.23 28.36 27.33 100.0 100.0 100.0 100.0 2012 ............................................................... 27.55 27.64 27.92 27.12 100.0 100.0 100.0 100.0 2013 ............................................................... 27.44 27.66 27.71 29.24 100.0 100.0 100.0 100.0 2014 ............................................................... 29.43 29.48 29.90 30.09 100.0 100.0 100.0 100.0 2015 ............................................................... 30.19 30.52 30.79 32.82 100.0 100.0 100.0 100.0 2016 ............................................................... 33.02 33.29 33.30 33.53 100.0 100.0 100.0 100.0 2017 ............................................................... 33.58 – – – 100.0 – – –
Wages and salaries 2006 ............................................................... – – – 17.93 – – – 69.3 2007 ............................................................... 17.95 18.11 18.39 18.51 69.3 69.4 69.6 69.5 2008 ............................................................... 18.68 18.83 18.95 19.15 69.6 69.7 69.8 69.7 2009 ............................................................... 19.20 19.24 19.34 19.24 69.5 69.7 69.6 70.1 2010 ............................................................... 19.22 19.31 19.56 19.49 69.5 69.6 69.8 69.9
2011 ............................................................... 19.39 19.56 19.67 19.20 69.3 69.3 69.4 70.3 2012 ............................................................... 19.31 19.38 19.62 19.00 70.1 70.1 70.2 70.1 2013 ............................................................... 19.11 19.35 19.37 20.36 69.6 69.9 69.9 69.7 2014 ............................................................... 20.43 20.51 20.80 20.91 69.4 69.6 69.6 69.5 2015 ............................................................... 20.94 21.22 21.44 22.64 69.4 69.5 69.6 69.0 2016 ............................................................... 22.74 22.98 22.94 23.12 68.9 69.0 68.9 69.0 2017 ............................................................... 23.20 – – – 69.1 – – –
Total benefits 2006 ............................................................... – – – 7.94 – – – 30.7 2007 ............................................................... 7.94 7.98 8.03 8.10 30.7 30.6 30.4 30.5 2008 ............................................................... 8.16 8.17 8.19 8.34 30.4 30.3 30.2 30.3 2009 ............................................................... 8.41 8.38 8.44 8.20 30.5 30.3 30.4 29.9 2010 ............................................................... 8.43 8.45 8.44 8.38 30.5 30.4 30.2 30.1
2011 ............................................................... 8.59 8.67 8.69 8.13 30.7 30.7 30.6 29.7 2012 ............................................................... 8.24 8.25 8.31 8.11 29.9 29.9 29.8 29.9 2013 ............................................................... 8.33 8.31 8.34 8.87 30.4 30.1 30.1 30.3 2014 ............................................................... 8.99 8.97 9.09 9.18 30.6 30.4 30.4 30.5 2015 ............................................................... 9.25 9.29 9.35 10.18 30.6 30.5 30.4 31.0 2016 ............................................................... 10.28 10.31 10.35 10.41 31.1 31.0 31.1 31.0 2017 ............................................................... 10.38 – – – 30.9 – – –
Paid leave 2006 ............................................................... – – – 1.74 – – – 6.7 2007 ............................................................... 1.76 1.78 1.80 1.80 6.8 6.8 6.8 6.7 2008 ............................................................... 1.82 1.82 1.85 1.90 6.8 6.7 6.8 6.9 2009 ............................................................... 1.91 1.90 1.92 1.88 6.9 6.9 6.9 6.8 2010 ............................................................... 1.90 1.90 1.90 1.88 6.9 6.8 6.8 6.7
2011 ............................................................... 1.91 1.92 1.93 1.80 6.8 6.8 6.8 6.6 2012 ............................................................... 1.84 1.83 1.84 1.76 6.7 6.6 6.6 6.5 2013 ............................................................... 1.79 1.80 1.81 1.98 6.5 6.5 6.5 6.8 2014 ............................................................... 2.00 1.99 2.03 2.05 6.8 6.8 6.8 6.8 2015 ............................................................... 2.06 2.06 2.08 2.25 6.8 6.7 6.7 6.9 2016 ............................................................... 2.30 2.32 2.31 2.35 7.0 7.0 6.9 7.0 2017 ............................................................... 2.36 – – – 7.0 – – –
Supplemental pay 2006 ............................................................... – – – .84 – – – 3.2 2007 ............................................................... .87 .86 .84 .87 3.3 3.3 3.2 3.3 2008 ............................................................... .85 .86 .86 .88 3.2 3.2 3.2 3.2 2009 ............................................................... .83 .84 .84 .77 3.0 3.0 3.0 2.8 2010 ............................................................... .77 .75 .70 .63 2.8 2.7 2.5 2.3
2011 ............................................................... .69 .71 .71 .63 2.5 2.5 2.5 2.3 2012 ............................................................... .63 .63 .62 .68 2.3 2.3 2.2 2.5 2013 ............................................................... .72 .69 .69 .78 2.6 2.5 2.5 2.7 2014 ............................................................... .73 .75 .75 .80 2.5 2.5 2.5 2.6 2015 ............................................................... .78 .79 .79 1.02 2.6 2.6 2.6 3.1 2016 ............................................................... 1.01 1.01 1.03 1.03 3.1 3.0 3.1 3.1
See footnotes at end of table.
-11-

Supplemental table 1. Private goods-producing industry workers, by occupational group: employer costs per hoursworked for employee compensation and costs as a percentage of total compensation, 2006-2017 -- Continued
Sales and office occupations
Compensationcomponent
Cost per hour worked Percent of total compensation
Mar. June Sep. Dec. Mar. June Sep. Dec.
Supplemental pay 2017 ............................................................... 1.02 – – – 3.0 – – –
Insurance 2006 ............................................................... – – – 2.28 – – – 8.8 2007 ............................................................... 2.34 2.34 2.34 2.36 9.0 9.0 8.9 8.9 2008 ............................................................... 2.41 2.41 2.43 2.48 9.0 8.9 9.0 9.0 2009 ............................................................... 2.56 2.55 2.57 2.53 9.3 9.2 9.3 9.2 2010 ............................................................... 2.63 2.64 2.65 2.75 9.5 9.5 9.5 9.9
2011 ............................................................... 2.79 2.79 2.79 2.65 10.0 9.9 9.9 9.7 2012 ............................................................... 2.69 2.73 2.71 2.66 9.8 9.9 9.7 9.8 2013 ............................................................... 2.78 2.75 2.79 2.92 10.1 9.9 10.1 10.0 2014 ............................................................... 3.00 2.99 3.03 2.99 10.2 10.1 10.1 10.0 2015 ............................................................... 3.05 3.06 3.07 3.14 10.1 10.0 10.0 9.6 2016 ............................................................... 3.20 3.21 3.21 3.21 9.7 9.6 9.6 9.6 2017 ............................................................... 3.20 – – – 9.5 – – –
Retirement and savings 2006 ............................................................... – – – .99 – – – 3.8 2007 ............................................................... .90 .91 .94 .95 3.5 3.5 3.6 3.6 2008 ............................................................... .96 .96 .93 .91 3.6 3.6 3.4 3.3 2009 ............................................................... .93 .92 .92 .84 3.4 3.3 3.3 3.0 2010 ............................................................... .90 .91 .93 .89 3.3 3.3 3.3 3.2
2011 ............................................................... .91 .94 .94 .81 3.3 3.3 3.3 3.0 2012 ............................................................... .82 .80 .81 .73 3.0 2.9 2.9 2.7 2013 ............................................................... .75 .77 .75 .82 2.7 2.8 2.7 2.8 2014 ............................................................... .87 .87 .90 .94 2.9 3.0 3.0 3.1 2015 ............................................................... .96 .97 .98 1.19 3.2 3.2 3.2 3.6 2016 ............................................................... 1.19 1.18 1.21 1.22 3.6 3.5 3.6 3.6 2017 ............................................................... 1.18 – – – 3.5 – – –
Legally required benefits 2006 ............................................................... – – – 2.08 – – – 8.0 2007 ............................................................... 2.08 2.09 2.11 2.12 8.0 8.0 8.0 8.0 2008 ............................................................... 2.12 2.13 2.13 2.17 7.9 7.9 7.8 7.9 2009 ............................................................... 2.17 2.17 2.18 2.19 7.9 7.9 7.9 8.0 2010 ............................................................... 2.23 2.25 2.26 2.23 8.1 8.1 8.1 8.0
2011 ............................................................... 2.28 2.31 2.31 2.24 8.2 8.2 8.1 8.2 2012 ............................................................... 2.26 2.26 2.33 2.27 8.2 8.2 8.3 8.4 2013 ............................................................... 2.28 2.30 2.30 2.38 8.3 8.3 8.3 8.1 2014 ............................................................... 2.39 2.37 2.39 2.40 8.1 8.0 8.0 8.0 2015 ............................................................... 2.41 2.42 2.43 2.57 8.0 7.9 7.9 7.8 2016 ............................................................... 2.58 2.59 2.59 2.60 7.8 7.8 7.8 7.8 2017 ............................................................... 2.61 – – – 7.8 – – –
Note: The sum of individual items may not equal totals due to rounding. Dashes indicate data are not available.
-12-

Supplemental table 1. Private goods-producing industry workers, by occupational group: employer costs per hoursworked for employee compensation and costs as a percentage of total compensation, 2006-2017 -- Continued
Office and administrative support occupations
Compensationcomponent
Cost per hour worked Percent of total compensation
Mar. June Sep. Dec. Mar. June Sep. Dec.
Total compensation 2006 ............................................................... – – – $23.68 – – – 100.0 2007 ............................................................... 23.91 24.09 24.18 24.31 100.0 100.0 100.0 100.0 2008 ............................................................... 24.55 24.80 24.94 25.12 100.0 100.0 100.0 100.0 2009 ............................................................... 25.26 25.28 25.42 24.94 100.0 100.0 100.0 100.0 2010 ............................................................... 25.17 25.17 25.31 25.36 100.0 100.0 100.0 100.0
2011 ............................................................... 25.75 25.90 25.97 25.52 100.0 100.0 100.0 100.0 2012 ............................................................... 25.79 25.81 25.92 25.63 100.0 100.0 100.0 100.0 2013 ............................................................... 26.00 26.07 26.22 26.25 100.0 100.0 100.0 100.0 2014 ............................................................... 26.52 26.50 26.75 27.22 100.0 100.0 100.0 100.0 2015 ............................................................... 27.39 27.53 27.70 28.67 100.0 100.0 100.0 100.0 2016 ............................................................... 28.84 28.96 29.18 29.33 100.0 100.0 100.0 100.0 2017 ............................................................... 29.41 – – – 100.0 – – –
Wages and salaries 2006 ............................................................... – – – 15.99 – – – 67.5 2007 ............................................................... 16.19 16.33 16.42 16.50 67.7 67.8 67.9 67.9 2008 ............................................................... 16.72 16.93 17.05 17.23 68.1 68.3 68.4 68.6 2009 ............................................................... 17.29 17.34 17.43 17.20 68.5 68.6 68.5 69.0 2010 ............................................................... 17.19 17.19 17.29 17.27 68.3 68.3 68.3 68.1
2011 ............................................................... 17.51 17.60 17.66 17.54 68.0 67.9 68.0 68.8 2012 ............................................................... 17.68 17.69 17.78 17.67 68.6 68.6 68.6 68.9 2013 ............................................................... 17.85 17.92 18.01 17.97 68.6 68.7 68.7 68.5 2014 ............................................................... 18.07 18.09 18.26 18.61 68.1 68.3 68.3 68.4 2015 ............................................................... 18.69 18.83 18.97 19.46 68.3 68.4 68.5 67.9 2016 ............................................................... 19.55 19.66 19.77 19.90 67.8 67.9 67.8 67.8 2017 ............................................................... 20.03 – – – 68.1 – – –
Total benefits 2006 ............................................................... – – – 7.69 – – – 32.5 2007 ............................................................... 7.72 7.76 7.76 7.82 32.3 32.2 32.1 32.1 2008 ............................................................... 7.83 7.87 7.89 7.89 31.9 31.7 31.6 31.4 2009 ............................................................... 7.96 7.94 8.00 7.74 31.5 31.4 31.5 31.0 2010 ............................................................... 7.98 7.98 8.02 8.08 31.7 31.7 31.7 31.9
2011 ............................................................... 8.24 8.30 8.31 7.97 32.0 32.1 32.0 31.2 2012 ............................................................... 8.10 8.12 8.14 7.97 31.4 31.4 31.4 31.1 2013 ............................................................... 8.15 8.15 8.20 8.28 31.4 31.3 31.3 31.5 2014 ............................................................... 8.45 8.41 8.49 8.62 31.9 31.7 31.7 31.6 2015 ............................................................... 8.69 8.70 8.72 9.21 31.7 31.6 31.5 32.1 2016 ............................................................... 9.29 9.30 9.41 9.43 32.2 32.1 32.2 32.2 2017 ............................................................... 9.38 – – – 31.9 – – –
Paid leave 2006 ............................................................... – – – 1.62 – – – 6.9 2007 ............................................................... 1.64 1.66 1.66 1.67 6.9 6.9 6.9 6.8 2008 ............................................................... 1.67 1.69 1.71 1.73 6.8 6.8 6.8 6.9 2009 ............................................................... 1.74 1.74 1.76 1.71 6.9 6.9 6.9 6.8 2010 ............................................................... 1.72 1.72 1.72 1.73 6.8 6.8 6.8 6.8
2011 ............................................................... 1.76 1.76 1.77 1.70 6.8 6.8 6.8 6.6 2012 ............................................................... 1.72 1.72 1.72 1.68 6.7 6.7 6.6 6.6 2013 ............................................................... 1.71 1.71 1.73 1.72 6.6 6.6 6.6 6.5 2014 ............................................................... 1.74 1.73 1.75 1.76 6.6 6.5 6.5 6.5 2015 ............................................................... 1.77 1.76 1.77 1.83 6.5 6.4 6.4 6.4 2016 ............................................................... 1.86 1.88 1.90 1.92 6.5 6.5 6.5 6.5 2017 ............................................................... 1.93 – – – 6.6 – – –
Supplemental pay 2006 ............................................................... – – – .86 – – – 3.6 2007 ............................................................... .89 .89 .87 .88 3.7 3.7 3.6 3.6 2008 ............................................................... .87 .87 .87 .84 3.5 3.5 3.5 3.3 2009 ............................................................... .79 .79 .79 .71 3.1 3.1 3.1 2.8 2010 ............................................................... .72 .69 .68 .66 2.8 2.7 2.7 2.6
2011 ............................................................... .71 .74 .74 .65 2.8 2.9 2.9 2.6 2012 ............................................................... .66 .65 .65 .66 2.5 2.5 2.5 2.6 2013 ............................................................... .67 .67 .68 .69 2.6 2.6 2.6 2.6 2014 ............................................................... .68 .70 .70 .77 2.6 2.6 2.6 2.8 2015 ............................................................... .75 .76 .75 .91 2.7 2.7 2.7 3.2 2016 ............................................................... .91 .90 .94 .94 3.1 3.1 3.2 3.2
See footnotes at end of table.
-13-

Supplemental table 1. Private goods-producing industry workers, by occupational group: employer costs per hoursworked for employee compensation and costs as a percentage of total compensation, 2006-2017 -- Continued
Office and administrative support occupations
Compensationcomponent
Cost per hour worked Percent of total compensation
Mar. June Sep. Dec. Mar. June Sep. Dec.
Supplemental pay 2017 ............................................................... 0.92 – – – 3.1 – – –
Insurance 2006 ............................................................... – – – 2.31 – – – 9.8 2007 ............................................................... 2.38 2.38 2.37 2.39 10.0 9.9 9.8 9.8 2008 ............................................................... 2.42 2.43 2.47 2.48 9.8 9.8 9.9 9.9 2009 ............................................................... 2.56 2.55 2.57 2.55 10.1 10.1 10.1 10.2 2010 ............................................................... 2.64 2.66 2.67 2.79 10.5 10.6 10.6 11.0
2011 ............................................................... 2.81 2.79 2.80 2.71 10.9 10.8 10.8 10.6 2012 ............................................................... 2.77 2.80 2.77 2.72 10.8 10.9 10.7 10.6 2013 ............................................................... 2.83 2.81 2.85 2.92 10.9 10.8 10.9 11.1 2014 ............................................................... 3.01 2.99 3.01 2.99 11.4 11.3 11.3 11.0 2015 ............................................................... 3.04 3.04 3.05 3.04 11.1 11.1 11.0 10.6 2016 ............................................................... 3.09 3.09 3.11 3.10 10.7 10.7 10.7 10.6 2017 ............................................................... 3.09 – – – 10.5 – – –
Retirement and savings 2006 ............................................................... – – – .97 – – – 4.1 2007 ............................................................... .87 .88 .92 .92 3.6 3.7 3.8 3.8 2008 ............................................................... .91 .91 .87 .84 3.7 3.7 3.5 3.3 2009 ............................................................... .86 .85 .86 .77 3.4 3.4 3.4 3.1 2010 ............................................................... .85 .85 .88 .83 3.4 3.4 3.5 3.3
2011 ............................................................... .83 .86 .86 .83 3.2 3.3 3.3 3.2 2012 ............................................................... .83 .82 .81 .73 3.2 3.2 3.1 2.9 2013 ............................................................... .75 .77 .75 .76 2.9 3.0 2.9 2.9 2014 ............................................................... .83 .83 .85 .89 3.1 3.1 3.2 3.3 2015 ............................................................... .91 .92 .92 1.11 3.3 3.3 3.3 3.9 2016 ............................................................... 1.11 1.10 1.13 1.14 3.9 3.8 3.9 3.9 2017 ............................................................... 1.09 – – – 3.7 – – –
Legally required benefits 2006 ............................................................... – – – 1.92 – – – 8.1 2007 ............................................................... 1.93 1.95 1.95 1.96 8.1 8.1 8.1 8.1 2008 ............................................................... 1.96 1.97 1.98 2.01 8.0 7.9 7.9 8.0 2009 ............................................................... 2.01 2.01 2.02 2.01 8.0 8.0 7.9 8.1 2010 ............................................................... 2.05 2.06 2.07 2.07 8.1 8.2 8.2 8.1
2011 ............................................................... 2.12 2.15 2.14 2.08 8.3 8.3 8.2 8.2 2012 ............................................................... 2.12 2.12 2.19 2.17 8.2 8.2 8.4 8.5 2013 ............................................................... 2.18 2.19 2.20 2.18 8.4 8.4 8.4 8.3 2014 ............................................................... 2.20 2.16 2.17 2.21 8.3 8.2 8.1 8.1 2015 ............................................................... 2.22 2.22 2.23 2.31 8.1 8.1 8.0 8.1 2016 ............................................................... 2.31 2.32 2.33 2.34 8.0 8.0 8.0 8.0 2017 ............................................................... 2.35 – – – 8.0 – – –
Note: The sum of individual items may not equal totals due to rounding. Dashes indicate data are not available.
-14-

Supplemental table 1. Private goods-producing industry workers, by occupational group: employer costs per hoursworked for employee compensation and costs as a percentage of total compensation, 2006-2017 -- Continued
Natural resources, construction, and maintenance occupations
Compensationcomponent
Cost per hour worked Percent of total compensation
Mar. June Sep. Dec. Mar. June Sep. Dec.
Total compensation 2006 ............................................................... – – – $29.22 – – – 100.0 2007 ............................................................... 29.40 29.86 30.12 30.50 100.0 100.0 100.0 100.0 2008 ............................................................... 30.99 31.16 31.51 31.72 100.0 100.0 100.0 100.0 2009 ............................................................... 31.83 31.87 32.04 31.52 100.0 100.0 100.0 100.0 2010 ............................................................... 31.74 31.86 32.03 31.52 100.0 100.0 100.0 100.0
2011 ............................................................... 31.90 32.14 32.30 32.43 100.0 100.0 100.0 100.0 2012 ............................................................... 32.43 32.57 32.78 32.94 100.0 100.0 100.0 100.0 2013 ............................................................... 33.54 33.40 33.46 34.16 100.0 100.0 100.0 100.0 2014 ............................................................... 34.33 34.59 34.65 35.59 100.0 100.0 100.0 100.0 2015 ............................................................... 35.26 35.63 36.05 35.99 100.0 100.0 100.0 100.0 2016 ............................................................... 36.22 36.39 37.02 36.70 100.0 100.0 100.0 100.0 2017 ............................................................... 37.33 – – – 100.0 – – –
Wages and salaries 2006 ............................................................... – – – 19.69 – – – 67.4 2007 ............................................................... 19.89 20.15 20.36 20.63 67.7 67.5 67.6 67.6 2008 ............................................................... 20.96 21.08 21.32 21.49 67.7 67.6 67.7 67.7 2009 ............................................................... 21.48 21.48 21.60 21.27 67.5 67.4 67.4 67.5 2010 ............................................................... 21.27 21.36 21.46 21.26 67.0 67.1 67.0 67.5
2011 ............................................................... 21.46 21.58 21.70 21.70 67.3 67.1 67.2 66.9 2012 ............................................................... 21.70 21.77 21.92 22.10 66.9 66.8 66.9 67.1 2013 ............................................................... 22.37 22.24 22.37 22.66 66.7 66.6 66.9 66.3 2014 ............................................................... 22.71 22.93 22.99 23.45 66.2 66.3 66.4 65.9 2015 ............................................................... 23.32 23.51 23.80 23.99 66.1 66.0 66.0 66.7 2016 ............................................................... 24.17 24.36 24.60 24.45 66.7 66.9 66.5 66.6 2017 ............................................................... 24.86 – – – 66.6 – – –
Total benefits 2006 ............................................................... – – – 9.53 – – – 32.6 2007 ............................................................... 9.51 9.72 9.76 9.87 32.3 32.5 32.4 32.4 2008 ............................................................... 10.02 10.09 10.19 10.24 32.3 32.4 32.3 32.3 2009 ............................................................... 10.35 10.39 10.44 10.26 32.5 32.6 32.6 32.5 2010 ............................................................... 10.46 10.50 10.57 10.26 33.0 32.9 33.0 32.5
2011 ............................................................... 10.44 10.56 10.60 10.74 32.7 32.9 32.8 33.1 2012 ............................................................... 10.73 10.81 10.86 10.84 33.1 33.2 33.1 32.9 2013 ............................................................... 11.17 11.17 11.09 11.50 33.3 33.4 33.1 33.7 2014 ............................................................... 11.61 11.66 11.65 12.14 33.8 33.7 33.6 34.1 2015 ............................................................... 11.94 12.12 12.25 12.00 33.9 34.0 34.0 33.3 2016 ............................................................... 12.05 12.03 12.42 12.25 33.3 33.1 33.5 33.4 2017 ............................................................... 12.48 – – – 33.4 – – –
Paid leave 2006 ............................................................... – – – 1.15 – – – 3.9 2007 ............................................................... 1.16 1.17 1.17 1.19 3.9 3.9 3.9 3.9 2008 ............................................................... 1.20 1.21 1.20 1.22 3.9 3.9 3.8 3.8 2009 ............................................................... 1.24 1.23 1.24 1.24 3.9 3.9 3.9 3.9 2010 ............................................................... 1.26 1.24 1.24 1.24 4.0 3.9 3.9 3.9
2011 ............................................................... 1.24 1.23 1.23 1.33 3.9 3.8 3.8 4.1 2012 ............................................................... 1.35 1.34 1.35 1.39 4.2 4.1 4.1 4.2 2013 ............................................................... 1.44 1.43 1.44 1.47 4.3 4.3 4.3 4.3 2014 ............................................................... 1.48 1.47 1.45 1.52 4.3 4.2 4.2 4.3 2015 ............................................................... 1.52 1.48 1.52 1.49 4.3 4.1 4.2 4.1 2016 ............................................................... 1.49 1.48 1.52 1.53 4.1 4.1 4.1 4.2 2017 ............................................................... 1.56 – – – 4.2 – – –
Supplemental pay 2006 ............................................................... – – – 1.00 – – – 3.4 2007 ............................................................... 1.04 1.08 1.08 1.12 3.5 3.6 3.6 3.7 2008 ............................................................... 1.16 1.16 1.17 1.13 3.7 3.7 3.7 3.6 2009 ............................................................... 1.13 1.12 1.13 1.14 3.6 3.5 3.5 3.6 2010 ............................................................... 1.13 1.10 1.10 1.05 3.6 3.5 3.4 3.3
2011 ............................................................... 1.05 1.06 1.06 1.06 3.3 3.3 3.3 3.3 2012 ............................................................... 1.08 1.10 1.10 1.07 3.3 3.4 3.3 3.3 2013 ............................................................... 1.08 1.05 1.06 1.14 3.2 3.2 3.2 3.3 2014 ............................................................... 1.15 1.15 1.15 1.17 3.4 3.3 3.3 3.3 2015 ............................................................... 1.15 1.14 1.15 1.19 3.3 3.2 3.2 3.3 2016 ............................................................... 1.20 1.20 1.22 1.23 3.3 3.3 3.3 3.4
See footnotes at end of table.
-15-
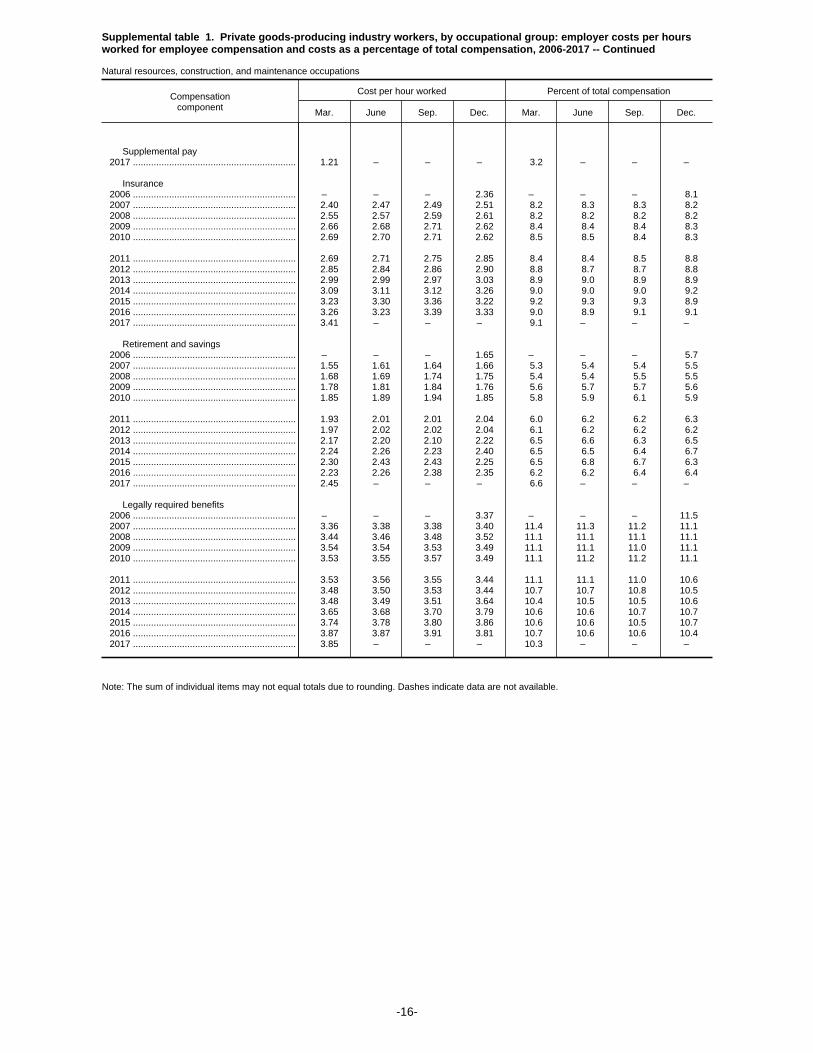
Supplemental table 1. Private goods-producing industry workers, by occupational group: employer costs per hoursworked for employee compensation and costs as a percentage of total compensation, 2006-2017 -- Continued
Natural resources, construction, and maintenance occupations
Compensationcomponent
Cost per hour worked Percent of total compensation
Mar. June Sep. Dec. Mar. June Sep. Dec.
Supplemental pay 2017 ............................................................... 1.21 – – – 3.2 – – –
Insurance 2006 ............................................................... – – – 2.36 – – – 8.1 2007 ............................................................... 2.40 2.47 2.49 2.51 8.2 8.3 8.3 8.2 2008 ............................................................... 2.55 2.57 2.59 2.61 8.2 8.2 8.2 8.2 2009 ............................................................... 2.66 2.68 2.71 2.62 8.4 8.4 8.4 8.3 2010 ............................................................... 2.69 2.70 2.71 2.62 8.5 8.5 8.4 8.3
2011 ............................................................... 2.69 2.71 2.75 2.85 8.4 8.4 8.5 8.8 2012 ............................................................... 2.85 2.84 2.86 2.90 8.8 8.7 8.7 8.8 2013 ............................................................... 2.99 2.99 2.97 3.03 8.9 9.0 8.9 8.9 2014 ............................................................... 3.09 3.11 3.12 3.26 9.0 9.0 9.0 9.2 2015 ............................................................... 3.23 3.30 3.36 3.22 9.2 9.3 9.3 8.9 2016 ............................................................... 3.26 3.23 3.39 3.33 9.0 8.9 9.1 9.1 2017 ............................................................... 3.41 – – – 9.1 – – –
Retirement and savings 2006 ............................................................... – – – 1.65 – – – 5.7 2007 ............................................................... 1.55 1.61 1.64 1.66 5.3 5.4 5.4 5.5 2008 ............................................................... 1.68 1.69 1.74 1.75 5.4 5.4 5.5 5.5 2009 ............................................................... 1.78 1.81 1.84 1.76 5.6 5.7 5.7 5.6 2010 ............................................................... 1.85 1.89 1.94 1.85 5.8 5.9 6.1 5.9
2011 ............................................................... 1.93 2.01 2.01 2.04 6.0 6.2 6.2 6.3 2012 ............................................................... 1.97 2.02 2.02 2.04 6.1 6.2 6.2 6.2 2013 ............................................................... 2.17 2.20 2.10 2.22 6.5 6.6 6.3 6.5 2014 ............................................................... 2.24 2.26 2.23 2.40 6.5 6.5 6.4 6.7 2015 ............................................................... 2.30 2.43 2.43 2.25 6.5 6.8 6.7 6.3 2016 ............................................................... 2.23 2.26 2.38 2.35 6.2 6.2 6.4 6.4 2017 ............................................................... 2.45 – – – 6.6 – – –
Legally required benefits 2006 ............................................................... – – – 3.37 – – – 11.5 2007 ............................................................... 3.36 3.38 3.38 3.40 11.4 11.3 11.2 11.1 2008 ............................................................... 3.44 3.46 3.48 3.52 11.1 11.1 11.1 11.1 2009 ............................................................... 3.54 3.54 3.53 3.49 11.1 11.1 11.0 11.1 2010 ............................................................... 3.53 3.55 3.57 3.49 11.1 11.2 11.2 11.1
2011 ............................................................... 3.53 3.56 3.55 3.44 11.1 11.1 11.0 10.6 2012 ............................................................... 3.48 3.50 3.53 3.44 10.7 10.7 10.8 10.5 2013 ............................................................... 3.48 3.49 3.51 3.64 10.4 10.5 10.5 10.6 2014 ............................................................... 3.65 3.68 3.70 3.79 10.6 10.6 10.7 10.7 2015 ............................................................... 3.74 3.78 3.80 3.86 10.6 10.6 10.5 10.7 2016 ............................................................... 3.87 3.87 3.91 3.81 10.7 10.6 10.6 10.4 2017 ............................................................... 3.85 – – – 10.3 – – –
Note: The sum of individual items may not equal totals due to rounding. Dashes indicate data are not available.
-16-
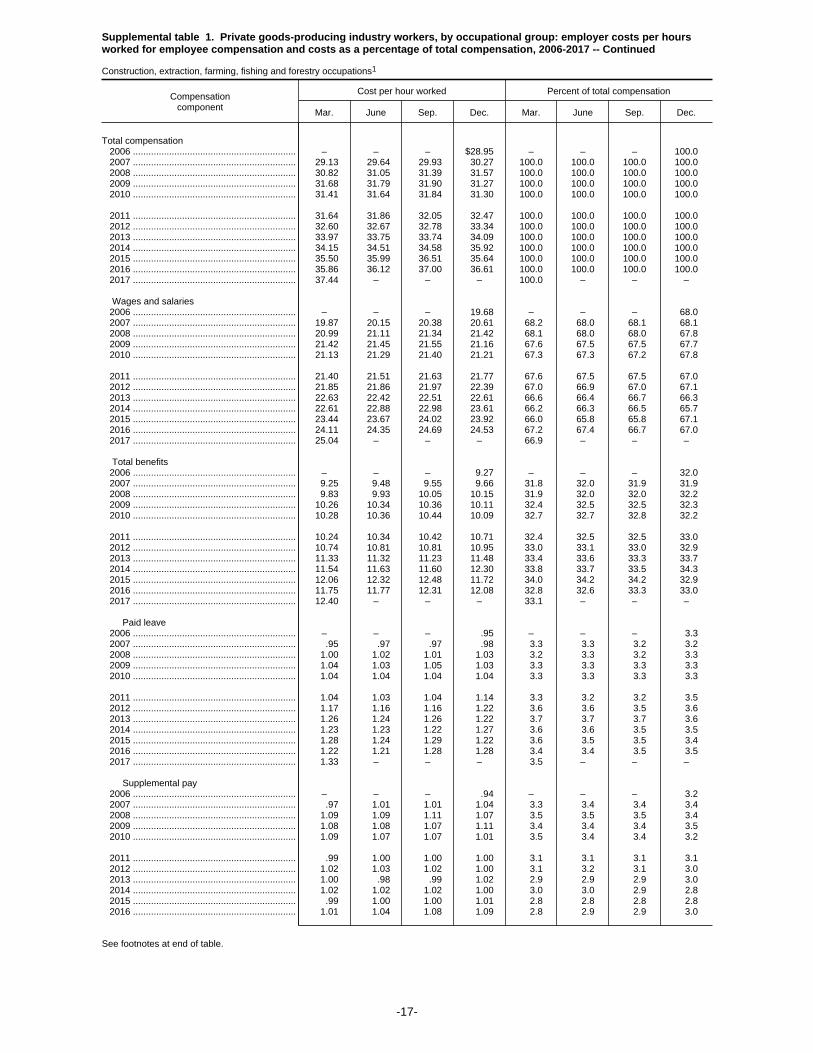
Supplemental table 1. Private goods-producing industry workers, by occupational group: employer costs per hoursworked for employee compensation and costs as a percentage of total compensation, 2006-2017 -- Continued
Construction, extraction, farming, fishing and forestry occupations1
Compensationcomponent
Cost per hour worked Percent of total compensation
Mar. June Sep. Dec. Mar. June Sep. Dec.
Total compensation 2006 ............................................................... – – – $28.95 – – – 100.0 2007 ............................................................... 29.13 29.64 29.93 30.27 100.0 100.0 100.0 100.0 2008 ............................................................... 30.82 31.05 31.39 31.57 100.0 100.0 100.0 100.0 2009 ............................................................... 31.68 31.79 31.90 31.27 100.0 100.0 100.0 100.0 2010 ............................................................... 31.41 31.64 31.84 31.30 100.0 100.0 100.0 100.0
2011 ............................................................... 31.64 31.86 32.05 32.47 100.0 100.0 100.0 100.0 2012 ............................................................... 32.60 32.67 32.78 33.34 100.0 100.0 100.0 100.0 2013 ............................................................... 33.97 33.75 33.74 34.09 100.0 100.0 100.0 100.0 2014 ............................................................... 34.15 34.51 34.58 35.92 100.0 100.0 100.0 100.0 2015 ............................................................... 35.50 35.99 36.51 35.64 100.0 100.0 100.0 100.0 2016 ............................................................... 35.86 36.12 37.00 36.61 100.0 100.0 100.0 100.0 2017 ............................................................... 37.44 – – – 100.0 – – –
Wages and salaries 2006 ............................................................... – – – 19.68 – – – 68.0 2007 ............................................................... 19.87 20.15 20.38 20.61 68.2 68.0 68.1 68.1 2008 ............................................................... 20.99 21.11 21.34 21.42 68.1 68.0 68.0 67.8 2009 ............................................................... 21.42 21.45 21.55 21.16 67.6 67.5 67.5 67.7 2010 ............................................................... 21.13 21.29 21.40 21.21 67.3 67.3 67.2 67.8
2011 ............................................................... 21.40 21.51 21.63 21.77 67.6 67.5 67.5 67.0 2012 ............................................................... 21.85 21.86 21.97 22.39 67.0 66.9 67.0 67.1 2013 ............................................................... 22.63 22.42 22.51 22.61 66.6 66.4 66.7 66.3 2014 ............................................................... 22.61 22.88 22.98 23.61 66.2 66.3 66.5 65.7 2015 ............................................................... 23.44 23.67 24.02 23.92 66.0 65.8 65.8 67.1 2016 ............................................................... 24.11 24.35 24.69 24.53 67.2 67.4 66.7 67.0 2017 ............................................................... 25.04 – – – 66.9 – – –
Total benefits 2006 ............................................................... – – – 9.27 – – – 32.0 2007 ............................................................... 9.25 9.48 9.55 9.66 31.8 32.0 31.9 31.9 2008 ............................................................... 9.83 9.93 10.05 10.15 31.9 32.0 32.0 32.2 2009 ............................................................... 10.26 10.34 10.36 10.11 32.4 32.5 32.5 32.3 2010 ............................................................... 10.28 10.36 10.44 10.09 32.7 32.7 32.8 32.2
2011 ............................................................... 10.24 10.34 10.42 10.71 32.4 32.5 32.5 33.0 2012 ............................................................... 10.74 10.81 10.81 10.95 33.0 33.1 33.0 32.9 2013 ............................................................... 11.33 11.32 11.23 11.48 33.4 33.6 33.3 33.7 2014 ............................................................... 11.54 11.63 11.60 12.30 33.8 33.7 33.5 34.3 2015 ............................................................... 12.06 12.32 12.48 11.72 34.0 34.2 34.2 32.9 2016 ............................................................... 11.75 11.77 12.31 12.08 32.8 32.6 33.3 33.0 2017 ............................................................... 12.40 – – – 33.1 – – –
Paid leave 2006 ............................................................... – – – .95 – – – 3.3 2007 ............................................................... .95 .97 .97 .98 3.3 3.3 3.2 3.2 2008 ............................................................... 1.00 1.02 1.01 1.03 3.2 3.3 3.2 3.3 2009 ............................................................... 1.04 1.03 1.05 1.03 3.3 3.3 3.3 3.3 2010 ............................................................... 1.04 1.04 1.04 1.04 3.3 3.3 3.3 3.3
2011 ............................................................... 1.04 1.03 1.04 1.14 3.3 3.2 3.2 3.5 2012 ............................................................... 1.17 1.16 1.16 1.22 3.6 3.6 3.5 3.6 2013 ............................................................... 1.26 1.24 1.26 1.22 3.7 3.7 3.7 3.6 2014 ............................................................... 1.23 1.23 1.22 1.27 3.6 3.6 3.5 3.5 2015 ............................................................... 1.28 1.24 1.29 1.22 3.6 3.5 3.5 3.4 2016 ............................................................... 1.22 1.21 1.28 1.28 3.4 3.4 3.5 3.5 2017 ............................................................... 1.33 – – – 3.5 – – –
Supplemental pay 2006 ............................................................... – – – .94 – – – 3.2 2007 ............................................................... .97 1.01 1.01 1.04 3.3 3.4 3.4 3.4 2008 ............................................................... 1.09 1.09 1.11 1.07 3.5 3.5 3.5 3.4 2009 ............................................................... 1.08 1.08 1.07 1.11 3.4 3.4 3.4 3.5 2010 ............................................................... 1.09 1.07 1.07 1.01 3.5 3.4 3.4 3.2
2011 ............................................................... .99 1.00 1.00 1.00 3.1 3.1 3.1 3.1 2012 ............................................................... 1.02 1.03 1.02 1.00 3.1 3.2 3.1 3.0 2013 ............................................................... 1.00 .98 .99 1.02 2.9 2.9 2.9 3.0 2014 ............................................................... 1.02 1.02 1.02 1.00 3.0 3.0 2.9 2.8 2015 ............................................................... .99 1.00 1.00 1.01 2.8 2.8 2.8 2.8 2016 ............................................................... 1.01 1.04 1.08 1.09 2.8 2.9 2.9 3.0
See footnotes at end of table.
-17-

Supplemental table 1. Private goods-producing industry workers, by occupational group: employer costs per hoursworked for employee compensation and costs as a percentage of total compensation, 2006-2017 -- Continued
Construction, extraction, farming, fishing and forestry occupations1
Compensationcomponent
Cost per hour worked Percent of total compensation
Mar. June Sep. Dec. Mar. June Sep. Dec.
Supplemental pay 2017 ............................................................... 1.07 – – – 2.9 – – –
Insurance 2006 ............................................................... – – – 2.25 – – – 7.8 2007 ............................................................... 2.28 2.35 2.37 2.40 7.8 7.9 7.9 7.9 2008 ............................................................... 2.43 2.46 2.50 2.51 7.9 7.9 8.0 8.0 2009 ............................................................... 2.55 2.59 2.60 2.46 8.0 8.2 8.1 7.9 2010 ............................................................... 2.52 2.55 2.57 2.46 8.0 8.1 8.1 7.9
2011 ............................................................... 2.50 2.56 2.61 2.72 7.9 8.0 8.2 8.4 2012 ............................................................... 2.69 2.69 2.71 2.82 8.2 8.2 8.3 8.5 2013 ............................................................... 2.94 2.94 2.92 2.94 8.7 8.7 8.6 8.6 2014 ............................................................... 2.98 3.02 3.03 3.24 8.7 8.7 8.8 9.0 2015 ............................................................... 3.18 3.28 3.35 3.01 9.0 9.1 9.2 8.4 2016 ............................................................... 3.04 3.01 3.22 3.13 8.5 8.3 8.7 8.5 2017 ............................................................... 3.24 – – – 8.6 – – –
Retirement and savings 2006 ............................................................... – – – 1.67 – – – 5.8 2007 ............................................................... 1.60 1.67 1.71 1.74 5.5 5.6 5.7 5.8 2008 ............................................................... 1.76 1.78 1.84 1.88 5.7 5.7 5.9 5.9 2009 ............................................................... 1.90 1.97 1.99 1.89 6.0 6.2 6.2 6.0 2010 ............................................................... 1.97 2.01 2.04 1.95 6.3 6.3 6.4 6.2
2011 ............................................................... 2.05 2.07 2.09 2.24 6.5 6.5 6.5 6.9 2012 ............................................................... 2.20 2.26 2.24 2.31 6.8 6.9 6.8 6.9 2013 ............................................................... 2.48 2.51 2.40 2.50 7.3 7.4 7.1 7.3 2014 ............................................................... 2.51 2.52 2.47 2.77 7.4 7.3 7.2 7.7 2015 ............................................................... 2.64 2.80 2.80 2.43 7.4 7.8 7.7 6.8 2016 ............................................................... 2.41 2.44 2.60 2.58 6.7 6.8 7.0 7.0 2017 ............................................................... 2.71 – – – 7.2 – – –
Legally required benefits 2006 ............................................................... – – – 3.47 – – – 12.0 2007 ............................................................... 3.45 3.48 3.48 3.50 11.9 11.8 11.6 11.6 2008 ............................................................... 3.55 3.58 3.60 3.67 11.5 11.5 11.5 11.6 2009 ............................................................... 3.69 3.67 3.66 3.63 11.6 11.5 11.5 11.6 2010 ............................................................... 3.67 3.69 3.72 3.63 11.7 11.7 11.7 11.6
2011 ............................................................... 3.66 3.68 3.68 3.61 11.6 11.5 11.5 11.1 2012 ............................................................... 3.66 3.66 3.69 3.60 11.2 11.2 11.2 10.8 2013 ............................................................... 3.64 3.65 3.67 3.79 10.7 10.8 10.9 11.1 2014 ............................................................... 3.80 3.83 3.85 4.02 11.1 11.1 11.1 11.2 2015 ............................................................... 3.97 4.00 4.03 4.05 11.2 11.1 11.1 11.4 2016 ............................................................... 4.07 4.07 4.12 4.01 11.3 11.3 11.1 10.9 2017 ............................................................... 4.05 – – – 10.8 – – –
1 Farming, fishing, and forestry occupations were combined with construction and extraction occupational group as of December 2006.
Note: The sum of individual items may not equal totals due to rounding. Dashes indicate data are not available.
-18-

Supplemental table 1. Private goods-producing industry workers, by occupational group: employer costs per hoursworked for employee compensation and costs as a percentage of total compensation, 2006-2017 -- Continued
Installation, maintenance, and repair occupations
Compensationcomponent
Cost per hour worked Percent of total compensation
Mar. June Sep. Dec. Mar. June Sep. Dec.
Total compensation 2006 ............................................................... – – – $30.23 – – – 100.0 2007 ............................................................... 30.48 30.75 30.86 31.37 100.0 100.0 100.0 100.0 2008 ............................................................... 31.59 31.60 31.97 32.24 100.0 100.0 100.0 100.0 2009 ............................................................... 32.30 32.16 32.50 32.35 100.0 100.0 100.0 100.0 2010 ............................................................... 32.79 32.60 32.66 32.28 100.0 100.0 100.0 100.0
2011 ............................................................... 32.77 33.13 33.19 32.31 100.0 100.0 100.0 100.0 2012 ............................................................... 31.96 32.27 32.79 31.69 100.0 100.0 100.0 100.0 2013 ............................................................... 32.27 32.37 32.60 34.37 100.0 100.0 100.0 100.0 2014 ............................................................... 34.81 34.83 34.83 34.78 100.0 100.0 100.0 100.0 2015 ............................................................... 34.69 34.71 34.91 36.92 100.0 100.0 100.0 100.0 2016 ............................................................... 37.17 37.12 37.07 36.94 100.0 100.0 100.0 100.0 2017 ............................................................... 37.06 – – – 100.0 – – –
Wages and salaries 2006 ............................................................... – – – 19.71 – – – 65.2 2007 ............................................................... 19.98 20.13 20.29 20.71 65.6 65.5 65.8 66.0 2008 ............................................................... 20.88 20.94 21.27 21.72 66.1 66.3 66.6 67.4 2009 ............................................................... 21.67 21.60 21.77 21.62 67.1 67.2 67.0 66.8 2010 ............................................................... 21.74 21.63 21.66 21.47 66.3 66.4 66.3 66.5
2011 ............................................................... 21.67 21.81 21.94 21.49 66.1 65.8 66.1 66.5 2012 ............................................................... 21.25 21.47 21.78 21.21 66.5 66.5 66.4 66.9 2013 ............................................................... 21.60 21.68 21.95 22.81 66.9 67.0 67.3 66.4 2014 ............................................................... 22.99 23.07 23.03 23.04 66.1 66.2 66.1 66.2 2015 ............................................................... 23.03 23.10 23.24 24.19 66.4 66.5 66.6 65.5 2016 ............................................................... 24.32 24.39 24.36 24.24 65.4 65.7 65.7 65.6 2017 ............................................................... 24.38 – – – 65.8 – – –
Total benefits 2006 ............................................................... – – – 10.52 – – – 34.8 2007 ............................................................... 10.50 10.62 10.57 10.66 34.4 34.5 34.2 34.0 2008 ............................................................... 10.71 10.66 10.69 10.52 33.9 33.7 33.4 32.6 2009 ............................................................... 10.64 10.56 10.73 10.73 32.9 32.8 33.0 33.2 2010 ............................................................... 11.05 10.97 11.00 10.81 33.7 33.6 33.7 33.5
2011 ............................................................... 11.09 11.32 11.25 10.82 33.9 34.2 33.9 33.5 2012 ............................................................... 10.70 10.80 11.01 10.49 33.5 33.5 33.6 33.1 2013 ............................................................... 10.67 10.69 10.65 11.56 33.1 33.0 32.7 33.6 2014 ............................................................... 11.81 11.76 11.80 11.74 33.9 33.8 33.9 33.8 2015 ............................................................... 11.66 11.61 11.67 12.73 33.6 33.5 33.4 34.5 2016 ............................................................... 12.85 12.72 12.72 12.70 34.6 34.3 34.3 34.4 2017 ............................................................... 12.68 – – – 34.2 – – –
Paid leave 2006 ............................................................... – – – 1.91 – – – 6.3 2007 ............................................................... 1.95 1.96 1.94 1.95 6.4 6.4 6.3 6.2 2008 ............................................................... 1.92 1.90 1.92 1.86 6.1 6.0 6.0 5.8 2009 ............................................................... 1.90 1.90 1.90 1.93 5.9 5.9 5.8 6.0 2010 ............................................................... 1.96 1.94 1.94 1.91 6.0 5.9 5.9 5.9
2011 ............................................................... 1.93 1.90 1.91 1.90 5.9 5.7 5.7 5.9 2012 ............................................................... 1.87 1.90 1.93 1.90 5.9 5.9 5.9 6.0 2013 ............................................................... 1.99 1.98 1.99 2.15 6.2 6.1 6.1 6.2 2014 ............................................................... 2.17 2.15 2.11 2.12 6.2 6.2 6.1 6.1 2015 ............................................................... 2.08 2.07 2.09 2.19 6.0 6.0 6.0 5.9 2016 ............................................................... 2.21 2.18 2.19 2.19 5.9 5.9 5.9 5.9 2017 ............................................................... 2.19 – – – 5.9 – – –
Supplemental pay 2006 ............................................................... – – – 1.25 – – – 4.1 2007 ............................................................... 1.33 1.37 1.34 1.38 4.4 4.5 4.4 4.4 2008 ............................................................... 1.41 1.41 1.41 1.36 4.5 4.5 4.4 4.2 2009 ............................................................... 1.29 1.27 1.30 1.26 4.0 4.0 4.0 3.9 2010 ............................................................... 1.27 1.23 1.21 1.17 3.9 3.8 3.7 3.6
2011 ............................................................... 1.27 1.27 1.27 1.24 3.9 3.8 3.8 3.8 2012 ............................................................... 1.27 1.32 1.33 1.30 4.0 4.1 4.1 4.1 2013 ............................................................... 1.31 1.28 1.27 1.45 4.0 4.0 3.9 4.2 2014 ............................................................... 1.51 1.50 1.52 1.59 4.3 4.3 4.4 4.6 2015 ............................................................... 1.53 1.52 1.52 1.66 4.4 4.4 4.3 4.5 2016 ............................................................... 1.70 1.63 1.62 1.60 4.6 4.4 4.4 4.3
See footnotes at end of table.
-19-
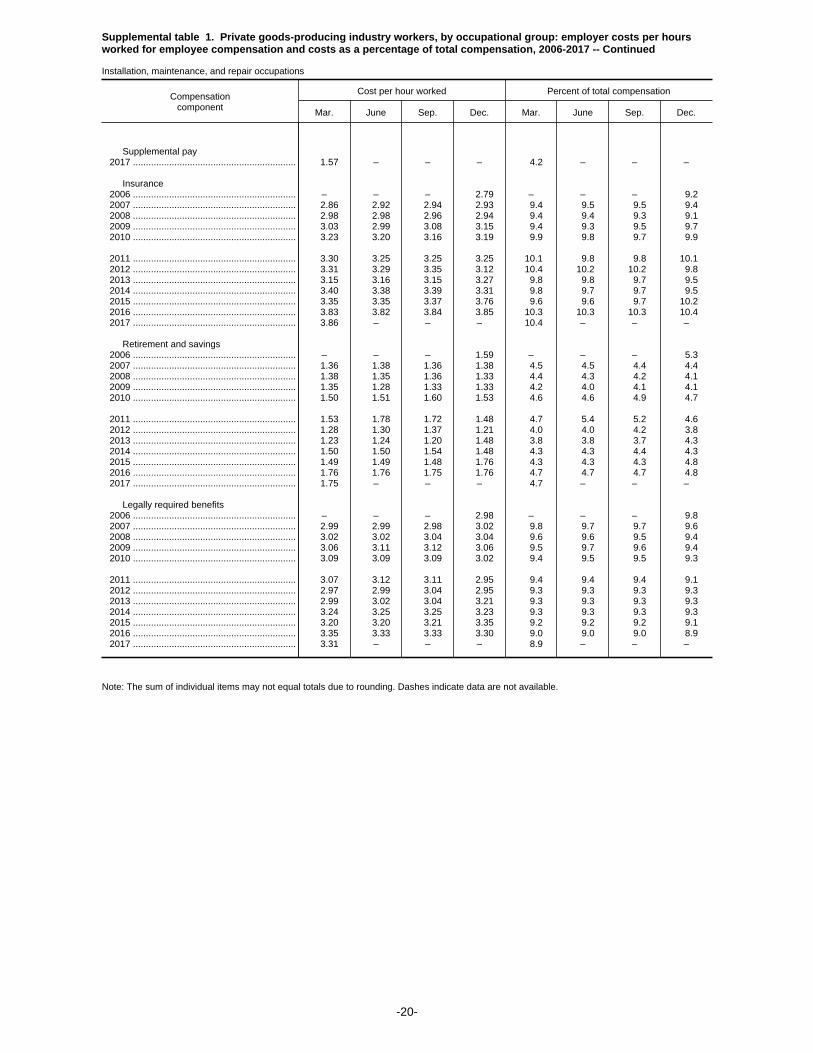
Supplemental table 1. Private goods-producing industry workers, by occupational group: employer costs per hoursworked for employee compensation and costs as a percentage of total compensation, 2006-2017 -- Continued
Installation, maintenance, and repair occupations
Compensationcomponent
Cost per hour worked Percent of total compensation
Mar. June Sep. Dec. Mar. June Sep. Dec.
Supplemental pay 2017 ............................................................... 1.57 – – – 4.2 – – –
Insurance 2006 ............................................................... – – – 2.79 – – – 9.2 2007 ............................................................... 2.86 2.92 2.94 2.93 9.4 9.5 9.5 9.4 2008 ............................................................... 2.98 2.98 2.96 2.94 9.4 9.4 9.3 9.1 2009 ............................................................... 3.03 2.99 3.08 3.15 9.4 9.3 9.5 9.7 2010 ............................................................... 3.23 3.20 3.16 3.19 9.9 9.8 9.7 9.9
2011 ............................................................... 3.30 3.25 3.25 3.25 10.1 9.8 9.8 10.1 2012 ............................................................... 3.31 3.29 3.35 3.12 10.4 10.2 10.2 9.8 2013 ............................................................... 3.15 3.16 3.15 3.27 9.8 9.8 9.7 9.5 2014 ............................................................... 3.40 3.38 3.39 3.31 9.8 9.7 9.7 9.5 2015 ............................................................... 3.35 3.35 3.37 3.76 9.6 9.6 9.7 10.2 2016 ............................................................... 3.83 3.82 3.84 3.85 10.3 10.3 10.3 10.4 2017 ............................................................... 3.86 – – – 10.4 – – –
Retirement and savings 2006 ............................................................... – – – 1.59 – – – 5.3 2007 ............................................................... 1.36 1.38 1.36 1.38 4.5 4.5 4.4 4.4 2008 ............................................................... 1.38 1.35 1.36 1.33 4.4 4.3 4.2 4.1 2009 ............................................................... 1.35 1.28 1.33 1.33 4.2 4.0 4.1 4.1 2010 ............................................................... 1.50 1.51 1.60 1.53 4.6 4.6 4.9 4.7
2011 ............................................................... 1.53 1.78 1.72 1.48 4.7 5.4 5.2 4.6 2012 ............................................................... 1.28 1.30 1.37 1.21 4.0 4.0 4.2 3.8 2013 ............................................................... 1.23 1.24 1.20 1.48 3.8 3.8 3.7 4.3 2014 ............................................................... 1.50 1.50 1.54 1.48 4.3 4.3 4.4 4.3 2015 ............................................................... 1.49 1.49 1.48 1.76 4.3 4.3 4.3 4.8 2016 ............................................................... 1.76 1.76 1.75 1.76 4.7 4.7 4.7 4.8 2017 ............................................................... 1.75 – – – 4.7 – – –
Legally required benefits 2006 ............................................................... – – – 2.98 – – – 9.8 2007 ............................................................... 2.99 2.99 2.98 3.02 9.8 9.7 9.7 9.6 2008 ............................................................... 3.02 3.02 3.04 3.04 9.6 9.6 9.5 9.4 2009 ............................................................... 3.06 3.11 3.12 3.06 9.5 9.7 9.6 9.4 2010 ............................................................... 3.09 3.09 3.09 3.02 9.4 9.5 9.5 9.3
2011 ............................................................... 3.07 3.12 3.11 2.95 9.4 9.4 9.4 9.1 2012 ............................................................... 2.97 2.99 3.04 2.95 9.3 9.3 9.3 9.3 2013 ............................................................... 2.99 3.02 3.04 3.21 9.3 9.3 9.3 9.3 2014 ............................................................... 3.24 3.25 3.25 3.23 9.3 9.3 9.3 9.3 2015 ............................................................... 3.20 3.20 3.21 3.35 9.2 9.2 9.2 9.1 2016 ............................................................... 3.35 3.33 3.33 3.30 9.0 9.0 9.0 8.9 2017 ............................................................... 3.31 – – – 8.9 – – –
Note: The sum of individual items may not equal totals due to rounding. Dashes indicate data are not available.
-20-
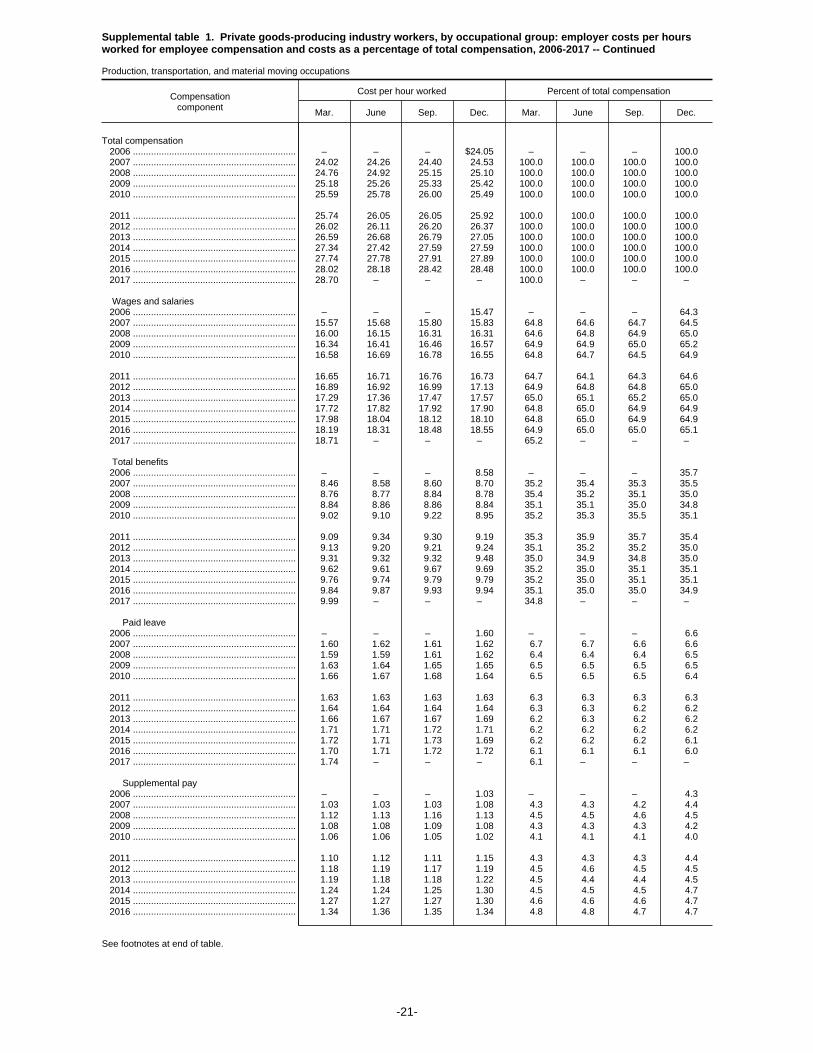
Supplemental table 1. Private goods-producing industry workers, by occupational group: employer costs per hoursworked for employee compensation and costs as a percentage of total compensation, 2006-2017 -- Continued
Production, transportation, and material moving occupations
Compensationcomponent
Cost per hour worked Percent of total compensation
Mar. June Sep. Dec. Mar. June Sep. Dec.
Total compensation 2006 ............................................................... – – – $24.05 – – – 100.0 2007 ............................................................... 24.02 24.26 24.40 24.53 100.0 100.0 100.0 100.0 2008 ............................................................... 24.76 24.92 25.15 25.10 100.0 100.0 100.0 100.0 2009 ............................................................... 25.18 25.26 25.33 25.42 100.0 100.0 100.0 100.0 2010 ............................................................... 25.59 25.78 26.00 25.49 100.0 100.0 100.0 100.0
2011 ............................................................... 25.74 26.05 26.05 25.92 100.0 100.0 100.0 100.0 2012 ............................................................... 26.02 26.11 26.20 26.37 100.0 100.0 100.0 100.0 2013 ............................................................... 26.59 26.68 26.79 27.05 100.0 100.0 100.0 100.0 2014 ............................................................... 27.34 27.42 27.59 27.59 100.0 100.0 100.0 100.0 2015 ............................................................... 27.74 27.78 27.91 27.89 100.0 100.0 100.0 100.0 2016 ............................................................... 28.02 28.18 28.42 28.48 100.0 100.0 100.0 100.0 2017 ............................................................... 28.70 – – – 100.0 – – –
Wages and salaries 2006 ............................................................... – – – 15.47 – – – 64.3 2007 ............................................................... 15.57 15.68 15.80 15.83 64.8 64.6 64.7 64.5 2008 ............................................................... 16.00 16.15 16.31 16.31 64.6 64.8 64.9 65.0 2009 ............................................................... 16.34 16.41 16.46 16.57 64.9 64.9 65.0 65.2 2010 ............................................................... 16.58 16.69 16.78 16.55 64.8 64.7 64.5 64.9
2011 ............................................................... 16.65 16.71 16.76 16.73 64.7 64.1 64.3 64.6 2012 ............................................................... 16.89 16.92 16.99 17.13 64.9 64.8 64.8 65.0 2013 ............................................................... 17.29 17.36 17.47 17.57 65.0 65.1 65.2 65.0 2014 ............................................................... 17.72 17.82 17.92 17.90 64.8 65.0 64.9 64.9 2015 ............................................................... 17.98 18.04 18.12 18.10 64.8 65.0 64.9 64.9 2016 ............................................................... 18.19 18.31 18.48 18.55 64.9 65.0 65.0 65.1 2017 ............................................................... 18.71 – – – 65.2 – – –
Total benefits 2006 ............................................................... – – – 8.58 – – – 35.7 2007 ............................................................... 8.46 8.58 8.60 8.70 35.2 35.4 35.3 35.5 2008 ............................................................... 8.76 8.77 8.84 8.78 35.4 35.2 35.1 35.0 2009 ............................................................... 8.84 8.86 8.86 8.84 35.1 35.1 35.0 34.8 2010 ............................................................... 9.02 9.10 9.22 8.95 35.2 35.3 35.5 35.1
2011 ............................................................... 9.09 9.34 9.30 9.19 35.3 35.9 35.7 35.4 2012 ............................................................... 9.13 9.20 9.21 9.24 35.1 35.2 35.2 35.0 2013 ............................................................... 9.31 9.32 9.32 9.48 35.0 34.9 34.8 35.0 2014 ............................................................... 9.62 9.61 9.67 9.69 35.2 35.0 35.1 35.1 2015 ............................................................... 9.76 9.74 9.79 9.79 35.2 35.0 35.1 35.1 2016 ............................................................... 9.84 9.87 9.93 9.94 35.1 35.0 35.0 34.9 2017 ............................................................... 9.99 – – – 34.8 – – –
Paid leave 2006 ............................................................... – – – 1.60 – – – 6.6 2007 ............................................................... 1.60 1.62 1.61 1.62 6.7 6.7 6.6 6.6 2008 ............................................................... 1.59 1.59 1.61 1.62 6.4 6.4 6.4 6.5 2009 ............................................................... 1.63 1.64 1.65 1.65 6.5 6.5 6.5 6.5 2010 ............................................................... 1.66 1.67 1.68 1.64 6.5 6.5 6.5 6.4
2011 ............................................................... 1.63 1.63 1.63 1.63 6.3 6.3 6.3 6.3 2012 ............................................................... 1.64 1.64 1.64 1.64 6.3 6.3 6.2 6.2 2013 ............................................................... 1.66 1.67 1.67 1.69 6.2 6.3 6.2 6.2 2014 ............................................................... 1.71 1.71 1.72 1.71 6.2 6.2 6.2 6.2 2015 ............................................................... 1.72 1.71 1.73 1.69 6.2 6.2 6.2 6.1 2016 ............................................................... 1.70 1.71 1.72 1.72 6.1 6.1 6.1 6.0 2017 ............................................................... 1.74 – – – 6.1 – – –
Supplemental pay 2006 ............................................................... – – – 1.03 – – – 4.3 2007 ............................................................... 1.03 1.03 1.03 1.08 4.3 4.3 4.2 4.4 2008 ............................................................... 1.12 1.13 1.16 1.13 4.5 4.5 4.6 4.5 2009 ............................................................... 1.08 1.08 1.09 1.08 4.3 4.3 4.3 4.2 2010 ............................................................... 1.06 1.06 1.05 1.02 4.1 4.1 4.1 4.0
2011 ............................................................... 1.10 1.12 1.11 1.15 4.3 4.3 4.3 4.4 2012 ............................................................... 1.18 1.19 1.17 1.19 4.5 4.6 4.5 4.5 2013 ............................................................... 1.19 1.18 1.18 1.22 4.5 4.4 4.4 4.5 2014 ............................................................... 1.24 1.24 1.25 1.30 4.5 4.5 4.5 4.7 2015 ............................................................... 1.27 1.27 1.27 1.30 4.6 4.6 4.6 4.7 2016 ............................................................... 1.34 1.36 1.35 1.34 4.8 4.8 4.7 4.7
See footnotes at end of table.
-21-

Supplemental table 1. Private goods-producing industry workers, by occupational group: employer costs per hoursworked for employee compensation and costs as a percentage of total compensation, 2006-2017 -- Continued
Production, transportation, and material moving occupations
Compensationcomponent
Cost per hour worked Percent of total compensation
Mar. June Sep. Dec. Mar. June Sep. Dec.
Supplemental pay 2017 ............................................................... 1.31 – – – 4.6 – – –
Insurance 2006 ............................................................... – – – 2.66 – – – 11.1 2007 ............................................................... 2.71 2.78 2.80 2.82 11.3 11.5 11.5 11.5 2008 ............................................................... 2.87 2.87 2.88 2.86 11.6 11.5 11.5 11.4 2009 ............................................................... 2.97 2.98 2.97 2.97 11.8 11.8 11.7 11.7 2010 ............................................................... 3.04 3.08 3.11 3.01 11.9 11.9 12.0 11.8
2011 ............................................................... 3.05 3.07 3.07 3.00 11.8 11.8 11.8 11.6 2012 ............................................................... 3.04 3.07 3.10 3.08 11.7 11.8 11.8 11.7 2013 ............................................................... 3.11 3.11 3.11 3.17 11.7 11.7 11.6 11.7 2014 ............................................................... 3.21 3.22 3.23 3.17 11.8 11.7 11.7 11.5 2015 ............................................................... 3.24 3.24 3.25 3.24 11.7 11.7 11.7 11.6 2016 ............................................................... 3.25 3.26 3.31 3.31 11.6 11.6 11.7 11.6 2017 ............................................................... 3.34 – – – 11.6 – – –
Retirement and savings 2006 ............................................................... – – – .98 – – – 4.1 2007 ............................................................... .81 .84 .85 .86 3.4 3.5 3.5 3.5 2008 ............................................................... .86 .85 .86 .86 3.5 3.4 3.4 3.4 2009 ............................................................... .84 .83 .82 .80 3.3 3.3 3.2 3.2 2010 ............................................................... .88 .90 .96 .90 3.5 3.5 3.7 3.5
2011 ............................................................... .91 1.11 1.07 1.03 3.5 4.2 4.1 4.0 2012 ............................................................... .85 .85 .85 .85 3.3 3.3 3.3 3.2 2013 ............................................................... .87 .87 .85 .88 3.3 3.2 3.2 3.3 2014 ............................................................... .93 .92 .95 .97 3.4 3.4 3.4 3.5 2015 ............................................................... .98 .97 .99 1.03 3.5 3.5 3.6 3.7 2016 ............................................................... 1.02 1.03 1.02 1.03 3.6 3.6 3.6 3.6 2017 ............................................................... 1.04 – – – 3.6 – – –
Legally required benefits 2006 ............................................................... – – – 2.31 – – – 9.6 2007 ............................................................... 2.30 2.30 2.31 2.32 9.6 9.5 9.5 9.4 2008 ............................................................... 2.31 2.32 2.33 2.32 9.3 9.3 9.3 9.2 2009 ............................................................... 2.32 2.33 2.34 2.34 9.2 9.2 9.2 9.2 2010 ............................................................... 2.37 2.40 2.41 2.36 9.3 9.3 9.3 9.3
2011 ............................................................... 2.40 2.42 2.41 2.38 9.3 9.3 9.3 9.2 2012 ............................................................... 2.42 2.44 2.45 2.48 9.3 9.4 9.4 9.4 2013 ............................................................... 2.48 2.49 2.51 2.52 9.3 9.3 9.4 9.3 2014 ............................................................... 2.52 2.51 2.52 2.54 9.2 9.2 9.2 9.2 2015 ............................................................... 2.54 2.54 2.54 2.52 9.2 9.2 9.1 9.0 2016 ............................................................... 2.52 2.51 2.53 2.53 9.0 8.9 8.9 8.9 2017 ............................................................... 2.56 – – – 8.9 – – –
Note: The sum of individual items may not equal totals due to rounding. Dashes indicate data are not available.
-22-
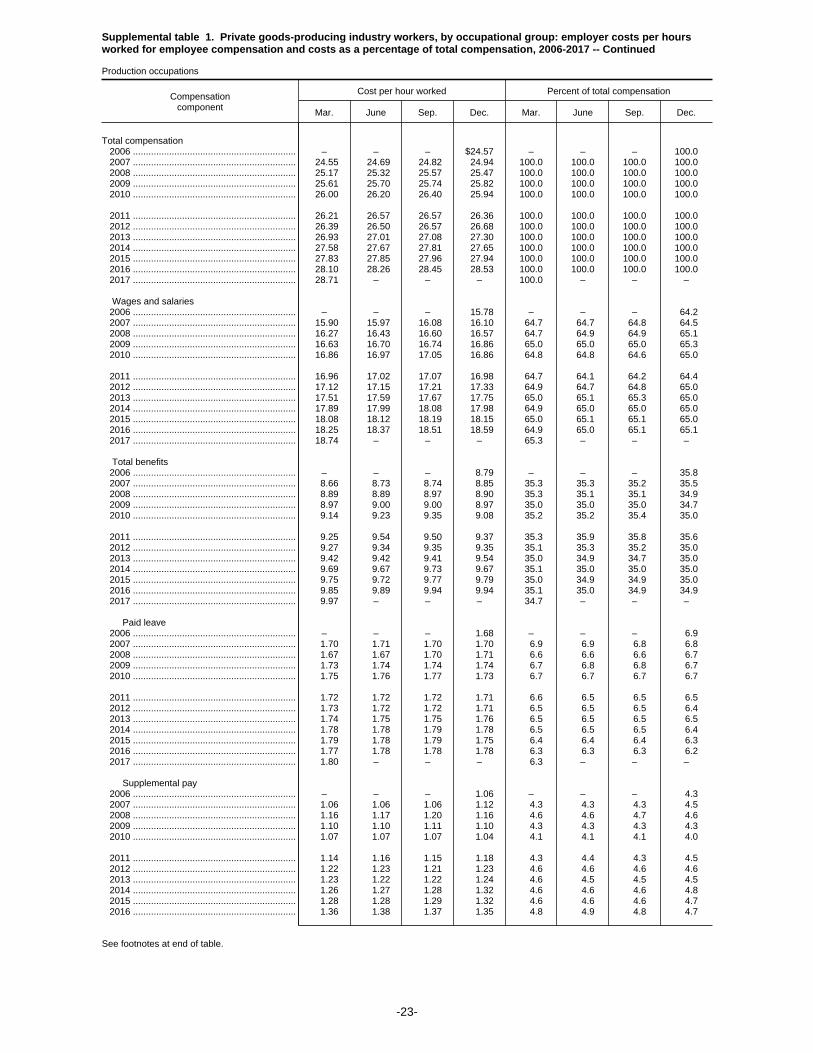
Supplemental table 1. Private goods-producing industry workers, by occupational group: employer costs per hoursworked for employee compensation and costs as a percentage of total compensation, 2006-2017 -- Continued
Production occupations
Compensationcomponent
Cost per hour worked Percent of total compensation
Mar. June Sep. Dec. Mar. June Sep. Dec.
Total compensation 2006 ............................................................... – – – $24.57 – – – 100.0 2007 ............................................................... 24.55 24.69 24.82 24.94 100.0 100.0 100.0 100.0 2008 ............................................................... 25.17 25.32 25.57 25.47 100.0 100.0 100.0 100.0 2009 ............................................................... 25.61 25.70 25.74 25.82 100.0 100.0 100.0 100.0 2010 ............................................................... 26.00 26.20 26.40 25.94 100.0 100.0 100.0 100.0
2011 ............................................................... 26.21 26.57 26.57 26.36 100.0 100.0 100.0 100.0 2012 ............................................................... 26.39 26.50 26.57 26.68 100.0 100.0 100.0 100.0 2013 ............................................................... 26.93 27.01 27.08 27.30 100.0 100.0 100.0 100.0 2014 ............................................................... 27.58 27.67 27.81 27.65 100.0 100.0 100.0 100.0 2015 ............................................................... 27.83 27.85 27.96 27.94 100.0 100.0 100.0 100.0 2016 ............................................................... 28.10 28.26 28.45 28.53 100.0 100.0 100.0 100.0 2017 ............................................................... 28.71 – – – 100.0 – – –
Wages and salaries 2006 ............................................................... – – – 15.78 – – – 64.2 2007 ............................................................... 15.90 15.97 16.08 16.10 64.7 64.7 64.8 64.5 2008 ............................................................... 16.27 16.43 16.60 16.57 64.7 64.9 64.9 65.1 2009 ............................................................... 16.63 16.70 16.74 16.86 65.0 65.0 65.0 65.3 2010 ............................................................... 16.86 16.97 17.05 16.86 64.8 64.8 64.6 65.0
2011 ............................................................... 16.96 17.02 17.07 16.98 64.7 64.1 64.2 64.4 2012 ............................................................... 17.12 17.15 17.21 17.33 64.9 64.7 64.8 65.0 2013 ............................................................... 17.51 17.59 17.67 17.75 65.0 65.1 65.3 65.0 2014 ............................................................... 17.89 17.99 18.08 17.98 64.9 65.0 65.0 65.0 2015 ............................................................... 18.08 18.12 18.19 18.15 65.0 65.1 65.1 65.0 2016 ............................................................... 18.25 18.37 18.51 18.59 64.9 65.0 65.1 65.1 2017 ............................................................... 18.74 – – – 65.3 – – –
Total benefits 2006 ............................................................... – – – 8.79 – – – 35.8 2007 ............................................................... 8.66 8.73 8.74 8.85 35.3 35.3 35.2 35.5 2008 ............................................................... 8.89 8.89 8.97 8.90 35.3 35.1 35.1 34.9 2009 ............................................................... 8.97 9.00 9.00 8.97 35.0 35.0 35.0 34.7 2010 ............................................................... 9.14 9.23 9.35 9.08 35.2 35.2 35.4 35.0
2011 ............................................................... 9.25 9.54 9.50 9.37 35.3 35.9 35.8 35.6 2012 ............................................................... 9.27 9.34 9.35 9.35 35.1 35.3 35.2 35.0 2013 ............................................................... 9.42 9.42 9.41 9.54 35.0 34.9 34.7 35.0 2014 ............................................................... 9.69 9.67 9.73 9.67 35.1 35.0 35.0 35.0 2015 ............................................................... 9.75 9.72 9.77 9.79 35.0 34.9 34.9 35.0 2016 ............................................................... 9.85 9.89 9.94 9.94 35.1 35.0 34.9 34.9 2017 ............................................................... 9.97 – – – 34.7 – – –
Paid leave 2006 ............................................................... – – – 1.68 – – – 6.9 2007 ............................................................... 1.70 1.71 1.70 1.70 6.9 6.9 6.8 6.8 2008 ............................................................... 1.67 1.67 1.70 1.71 6.6 6.6 6.6 6.7 2009 ............................................................... 1.73 1.74 1.74 1.74 6.7 6.8 6.8 6.7 2010 ............................................................... 1.75 1.76 1.77 1.73 6.7 6.7 6.7 6.7
2011 ............................................................... 1.72 1.72 1.72 1.71 6.6 6.5 6.5 6.5 2012 ............................................................... 1.73 1.72 1.72 1.71 6.5 6.5 6.5 6.4 2013 ............................................................... 1.74 1.75 1.75 1.76 6.5 6.5 6.5 6.5 2014 ............................................................... 1.78 1.78 1.79 1.78 6.5 6.5 6.5 6.4 2015 ............................................................... 1.79 1.78 1.79 1.75 6.4 6.4 6.4 6.3 2016 ............................................................... 1.77 1.78 1.78 1.78 6.3 6.3 6.3 6.2 2017 ............................................................... 1.80 – – – 6.3 – – –
Supplemental pay 2006 ............................................................... – – – 1.06 – – – 4.3 2007 ............................................................... 1.06 1.06 1.06 1.12 4.3 4.3 4.3 4.5 2008 ............................................................... 1.16 1.17 1.20 1.16 4.6 4.6 4.7 4.6 2009 ............................................................... 1.10 1.10 1.11 1.10 4.3 4.3 4.3 4.3 2010 ............................................................... 1.07 1.07 1.07 1.04 4.1 4.1 4.1 4.0
2011 ............................................................... 1.14 1.16 1.15 1.18 4.3 4.4 4.3 4.5 2012 ............................................................... 1.22 1.23 1.21 1.23 4.6 4.6 4.6 4.6 2013 ............................................................... 1.23 1.22 1.22 1.24 4.6 4.5 4.5 4.5 2014 ............................................................... 1.26 1.27 1.28 1.32 4.6 4.6 4.6 4.8 2015 ............................................................... 1.28 1.28 1.29 1.32 4.6 4.6 4.6 4.7 2016 ............................................................... 1.36 1.38 1.37 1.35 4.8 4.9 4.8 4.7
See footnotes at end of table.
-23-

Supplemental table 1. Private goods-producing industry workers, by occupational group: employer costs per hoursworked for employee compensation and costs as a percentage of total compensation, 2006-2017 -- Continued
Production occupations
Compensationcomponent
Cost per hour worked Percent of total compensation
Mar. June Sep. Dec. Mar. June Sep. Dec.
Supplemental pay 2017 ............................................................... 1.32 – – – 4.6 – – –
Insurance 2006 ............................................................... – – – 2.75 – – – 11.2 2007 ............................................................... 2.78 2.83 2.85 2.87 11.3 11.5 11.5 11.5 2008 ............................................................... 2.92 2.92 2.92 2.89 11.6 11.5 11.4 11.4 2009 ............................................................... 3.02 3.02 3.03 3.02 11.8 11.8 11.8 11.7 2010 ............................................................... 3.08 3.12 3.15 3.05 11.9 11.9 11.9 11.7
2011 ............................................................... 3.08 3.11 3.12 3.04 11.8 11.7 11.7 11.5 2012 ............................................................... 3.07 3.11 3.13 3.12 11.6 11.7 11.8 11.7 2013 ............................................................... 3.15 3.15 3.14 3.19 11.7 11.6 11.6 11.7 2014 ............................................................... 3.24 3.23 3.24 3.14 11.7 11.7 11.7 11.4 2015 ............................................................... 3.23 3.22 3.24 3.23 11.6 11.6 11.6 11.6 2016 ............................................................... 3.25 3.27 3.32 3.31 11.6 11.6 11.7 11.6 2017 ............................................................... 3.33 – – – 11.6 – – –
Retirement and savings 2006 ............................................................... – – – 1.00 – – – 4.1 2007 ............................................................... .82 .83 .84 .85 3.3 3.4 3.4 3.4 2008 ............................................................... .85 .83 .83 .84 3.4 3.3 3.3 3.3 2009 ............................................................... .82 .81 .79 .77 3.2 3.1 3.1 3.0 2010 ............................................................... .86 .87 .94 .89 3.3 3.3 3.6 3.4
2011 ............................................................... .90 1.14 1.09 1.07 3.4 4.3 4.1 4.0 2012 ............................................................... .84 .84 .84 .82 3.2 3.2 3.2 3.1 2013 ............................................................... .84 .83 .82 .85 3.1 3.1 3.0 3.1 2014 ............................................................... .91 .90 .92 .95 3.3 3.3 3.3 3.4 2015 ............................................................... .97 .95 .97 1.02 3.5 3.4 3.5 3.7 2016 ............................................................... 1.01 1.02 1.01 1.03 3.6 3.6 3.6 3.6 2017 ............................................................... 1.04 – – – 3.6 – – –
Legally required benefits 2006 ............................................................... – – – 2.30 – – – 9.4 2007 ............................................................... 2.30 2.29 2.30 2.31 9.3 9.3 9.3 9.2 2008 ............................................................... 2.30 2.30 2.32 2.30 9.1 9.1 9.1 9.0 2009 ............................................................... 2.32 2.33 2.34 2.34 9.0 9.1 9.1 9.0 2010 ............................................................... 2.38 2.40 2.42 2.37 9.1 9.2 9.2 9.1
2011 ............................................................... 2.40 2.42 2.42 2.38 9.2 9.1 9.1 9.0 2012 ............................................................... 2.41 2.44 2.45 2.46 9.1 9.2 9.2 9.2 2013 ............................................................... 2.47 2.48 2.48 2.50 9.2 9.2 9.2 9.1 2014 ............................................................... 2.49 2.48 2.49 2.48 9.0 9.0 9.0 9.0 2015 ............................................................... 2.49 2.48 2.48 2.46 8.9 8.9 8.9 8.8 2016 ............................................................... 2.46 2.44 2.46 2.46 8.7 8.6 8.7 8.6 2017 ............................................................... 2.48 – – – 8.6 – – –
Note: The sum of individual items may not equal totals due to rounding. Dashes indicate data are not available.
-24-
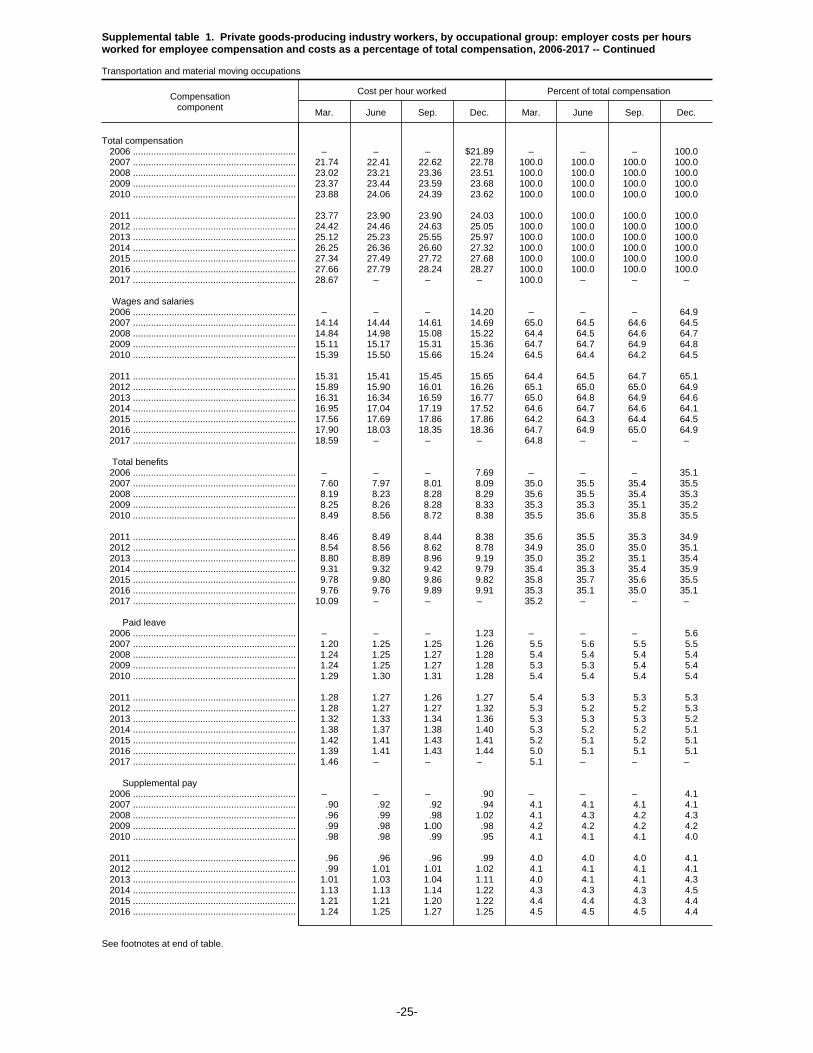
Supplemental table 1. Private goods-producing industry workers, by occupational group: employer costs per hoursworked for employee compensation and costs as a percentage of total compensation, 2006-2017 -- Continued
Transportation and material moving occupations
Compensationcomponent
Cost per hour worked Percent of total compensation
Mar. June Sep. Dec. Mar. June Sep. Dec.
Total compensation 2006 ............................................................... – – – $21.89 – – – 100.0 2007 ............................................................... 21.74 22.41 22.62 22.78 100.0 100.0 100.0 100.0 2008 ............................................................... 23.02 23.21 23.36 23.51 100.0 100.0 100.0 100.0 2009 ............................................................... 23.37 23.44 23.59 23.68 100.0 100.0 100.0 100.0 2010 ............................................................... 23.88 24.06 24.39 23.62 100.0 100.0 100.0 100.0
2011 ............................................................... 23.77 23.90 23.90 24.03 100.0 100.0 100.0 100.0 2012 ............................................................... 24.42 24.46 24.63 25.05 100.0 100.0 100.0 100.0 2013 ............................................................... 25.12 25.23 25.55 25.97 100.0 100.0 100.0 100.0 2014 ............................................................... 26.25 26.36 26.60 27.32 100.0 100.0 100.0 100.0 2015 ............................................................... 27.34 27.49 27.72 27.68 100.0 100.0 100.0 100.0 2016 ............................................................... 27.66 27.79 28.24 28.27 100.0 100.0 100.0 100.0 2017 ............................................................... 28.67 – – – 100.0 – – –
Wages and salaries 2006 ............................................................... – – – 14.20 – – – 64.9 2007 ............................................................... 14.14 14.44 14.61 14.69 65.0 64.5 64.6 64.5 2008 ............................................................... 14.84 14.98 15.08 15.22 64.4 64.5 64.6 64.7 2009 ............................................................... 15.11 15.17 15.31 15.36 64.7 64.7 64.9 64.8 2010 ............................................................... 15.39 15.50 15.66 15.24 64.5 64.4 64.2 64.5
2011 ............................................................... 15.31 15.41 15.45 15.65 64.4 64.5 64.7 65.1 2012 ............................................................... 15.89 15.90 16.01 16.26 65.1 65.0 65.0 64.9 2013 ............................................................... 16.31 16.34 16.59 16.77 65.0 64.8 64.9 64.6 2014 ............................................................... 16.95 17.04 17.19 17.52 64.6 64.7 64.6 64.1 2015 ............................................................... 17.56 17.69 17.86 17.86 64.2 64.3 64.4 64.5 2016 ............................................................... 17.90 18.03 18.35 18.36 64.7 64.9 65.0 64.9 2017 ............................................................... 18.59 – – – 64.8 – – –
Total benefits 2006 ............................................................... – – – 7.69 – – – 35.1 2007 ............................................................... 7.60 7.97 8.01 8.09 35.0 35.5 35.4 35.5 2008 ............................................................... 8.19 8.23 8.28 8.29 35.6 35.5 35.4 35.3 2009 ............................................................... 8.25 8.26 8.28 8.33 35.3 35.3 35.1 35.2 2010 ............................................................... 8.49 8.56 8.72 8.38 35.5 35.6 35.8 35.5
2011 ............................................................... 8.46 8.49 8.44 8.38 35.6 35.5 35.3 34.9 2012 ............................................................... 8.54 8.56 8.62 8.78 34.9 35.0 35.0 35.1 2013 ............................................................... 8.80 8.89 8.96 9.19 35.0 35.2 35.1 35.4 2014 ............................................................... 9.31 9.32 9.42 9.79 35.4 35.3 35.4 35.9 2015 ............................................................... 9.78 9.80 9.86 9.82 35.8 35.7 35.6 35.5 2016 ............................................................... 9.76 9.76 9.89 9.91 35.3 35.1 35.0 35.1 2017 ............................................................... 10.09 – – – 35.2 – – –
Paid leave 2006 ............................................................... – – – 1.23 – – – 5.6 2007 ............................................................... 1.20 1.25 1.25 1.26 5.5 5.6 5.5 5.5 2008 ............................................................... 1.24 1.25 1.27 1.28 5.4 5.4 5.4 5.4 2009 ............................................................... 1.24 1.25 1.27 1.28 5.3 5.3 5.4 5.4 2010 ............................................................... 1.29 1.30 1.31 1.28 5.4 5.4 5.4 5.4
2011 ............................................................... 1.28 1.27 1.26 1.27 5.4 5.3 5.3 5.3 2012 ............................................................... 1.28 1.27 1.27 1.32 5.3 5.2 5.2 5.3 2013 ............................................................... 1.32 1.33 1.34 1.36 5.3 5.3 5.3 5.2 2014 ............................................................... 1.38 1.37 1.38 1.40 5.3 5.2 5.2 5.1 2015 ............................................................... 1.42 1.41 1.43 1.41 5.2 5.1 5.2 5.1 2016 ............................................................... 1.39 1.41 1.43 1.44 5.0 5.1 5.1 5.1 2017 ............................................................... 1.46 – – – 5.1 – – –
Supplemental pay 2006 ............................................................... – – – .90 – – – 4.1 2007 ............................................................... .90 .92 .92 .94 4.1 4.1 4.1 4.1 2008 ............................................................... .96 .99 .98 1.02 4.1 4.3 4.2 4.3 2009 ............................................................... .99 .98 1.00 .98 4.2 4.2 4.2 4.2 2010 ............................................................... .98 .98 .99 .95 4.1 4.1 4.1 4.0
2011 ............................................................... .96 .96 .96 .99 4.0 4.0 4.0 4.1 2012 ............................................................... .99 1.01 1.01 1.02 4.1 4.1 4.1 4.1 2013 ............................................................... 1.01 1.03 1.04 1.11 4.0 4.1 4.1 4.3 2014 ............................................................... 1.13 1.13 1.14 1.22 4.3 4.3 4.3 4.5 2015 ............................................................... 1.21 1.21 1.20 1.22 4.4 4.4 4.3 4.4 2016 ............................................................... 1.24 1.25 1.27 1.25 4.5 4.5 4.5 4.4
See footnotes at end of table.
-25-

Supplemental table 1. Private goods-producing industry workers, by occupational group: employer costs per hoursworked for employee compensation and costs as a percentage of total compensation, 2006-2017 -- Continued
Transportation and material moving occupations
Compensationcomponent
Cost per hour worked Percent of total compensation
Mar. June Sep. Dec. Mar. June Sep. Dec.
Supplemental pay 2017 ............................................................... 1.27 – – – 4.4 – – –
Insurance 2006 ............................................................... – – – 2.32 – – – 10.6 2007 ............................................................... 2.42 2.57 2.56 2.62 11.1 11.5 11.3 11.5 2008 ............................................................... 2.69 2.68 2.70 2.70 11.7 11.5 11.6 11.5 2009 ............................................................... 2.76 2.77 2.73 2.79 11.8 11.8 11.6 11.8 2010 ............................................................... 2.89 2.89 2.97 2.85 12.1 12.0 12.2 12.1
2011 ............................................................... 2.90 2.89 2.88 2.87 12.2 12.1 12.1 11.9 2012 ............................................................... 2.92 2.92 2.95 2.92 11.9 11.9 12.0 11.7 2013 ............................................................... 2.93 2.95 2.96 3.07 11.7 11.7 11.6 11.8 2014 ............................................................... 3.11 3.15 3.19 3.27 11.8 11.9 12.0 12.0 2015 ............................................................... 3.32 3.31 3.33 3.31 12.1 12.0 12.0 12.0 2016 ............................................................... 3.26 3.23 3.28 3.31 11.8 11.6 11.6 11.7 2017 ............................................................... 3.36 – – – 11.7 – – –
Retirement and savings 2006 ............................................................... – – – .90 – – – 4.1 2007 ............................................................... .76 .89 .90 .90 3.5 4.0 4.0 4.0 2008 ............................................................... .93 .93 .95 .94 4.0 4.0 4.1 4.0 2009 ............................................................... .91 .93 .93 .92 3.9 4.0 3.9 3.9 2010 ............................................................... .98 1.01 1.05 .96 4.1 4.2 4.3 4.1
2011 ............................................................... .95 .98 .96 .87 4.0 4.1 4.0 3.6 2012 ............................................................... .88 .88 .89 .99 3.6 3.6 3.6 3.9 2013 ............................................................... .98 1.00 1.01 1.02 3.9 4.0 3.9 3.9 2014 ............................................................... 1.04 1.03 1.05 1.08 4.0 3.9 4.0 3.9 2015 ............................................................... 1.04 1.07 1.09 1.06 3.8 3.9 3.9 3.8 2016 ............................................................... 1.03 1.05 1.05 1.06 3.7 3.8 3.7 3.7 2017 ............................................................... 1.08 – – – 3.8 – – –
Legally required benefits 2006 ............................................................... – – – 2.34 – – – 10.7 2007 ............................................................... 2.31 2.33 2.38 2.37 10.6 10.4 10.5 10.4 2008 ............................................................... 2.37 2.38 2.38 2.37 10.3 10.3 10.2 10.1 2009 ............................................................... 2.34 2.33 2.35 2.35 10.0 9.9 10.0 9.9 2010 ............................................................... 2.36 2.38 2.40 2.35 9.9 9.9 9.9 10.0
2011 ............................................................... 2.37 2.39 2.39 2.39 10.0 10.0 10.0 9.9 2012 ............................................................... 2.46 2.48 2.50 2.54 10.1 10.1 10.1 10.1 2013 ............................................................... 2.55 2.57 2.61 2.63 10.1 10.2 10.2 10.1 2014 ............................................................... 2.64 2.64 2.66 2.81 10.1 10.0 10.0 10.3 2015 ............................................................... 2.79 2.80 2.81 2.83 10.2 10.2 10.2 10.2 2016 ............................................................... 2.85 2.81 2.86 2.86 10.3 10.1 10.1 10.1 2017 ............................................................... 2.91 – – – 10.2 – – –
Note: The sum of individual items may not equal totals due to rounding. Dashes indicate data are not available.
-26-
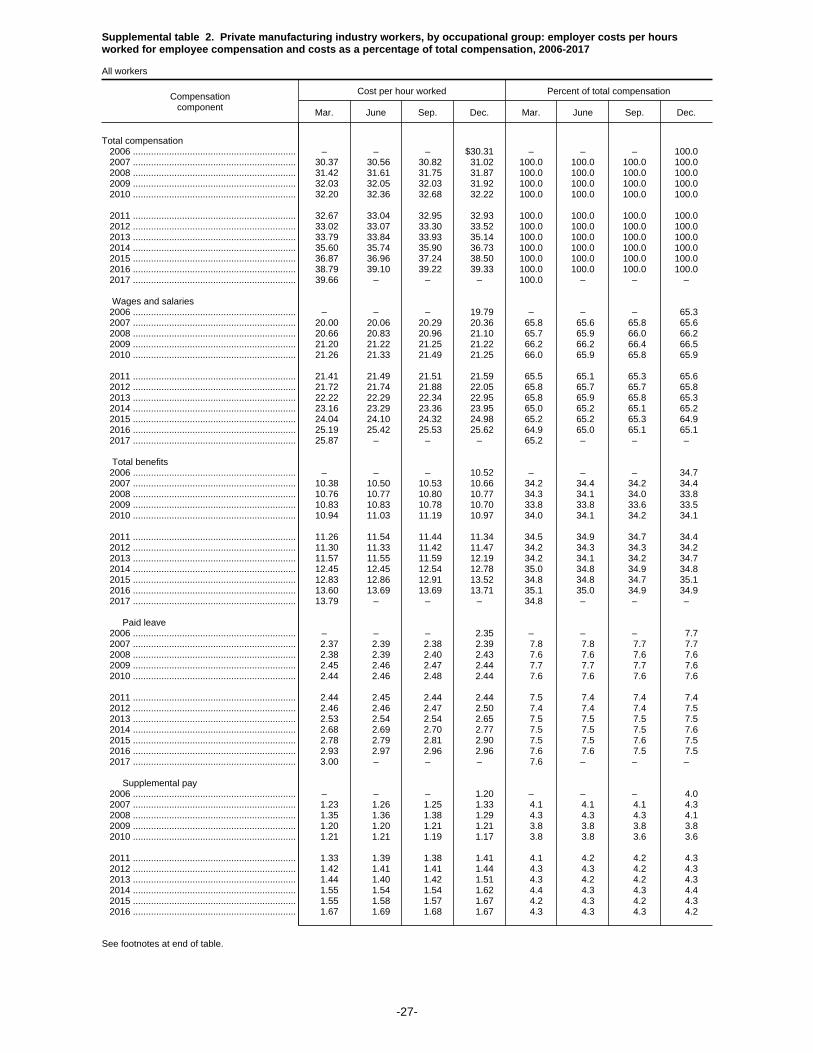
Supplemental table 2. Private manufacturing industry workers, by occupational group: employer costs per hoursworked for employee compensation and costs as a percentage of total compensation, 2006-2017
All workers
Compensationcomponent
Cost per hour worked Percent of total compensation
Mar. June Sep. Dec. Mar. June Sep. Dec.
Total compensation 2006 ............................................................... – – – $30.31 – – – 100.0 2007 ............................................................... 30.37 30.56 30.82 31.02 100.0 100.0 100.0 100.0 2008 ............................................................... 31.42 31.61 31.75 31.87 100.0 100.0 100.0 100.0 2009 ............................................................... 32.03 32.05 32.03 31.92 100.0 100.0 100.0 100.0 2010 ............................................................... 32.20 32.36 32.68 32.22 100.0 100.0 100.0 100.0
2011 ............................................................... 32.67 33.04 32.95 32.93 100.0 100.0 100.0 100.0 2012 ............................................................... 33.02 33.07 33.30 33.52 100.0 100.0 100.0 100.0 2013 ............................................................... 33.79 33.84 33.93 35.14 100.0 100.0 100.0 100.0 2014 ............................................................... 35.60 35.74 35.90 36.73 100.0 100.0 100.0 100.0 2015 ............................................................... 36.87 36.96 37.24 38.50 100.0 100.0 100.0 100.0 2016 ............................................................... 38.79 39.10 39.22 39.33 100.0 100.0 100.0 100.0 2017 ............................................................... 39.66 – – – 100.0 – – –
Wages and salaries 2006 ............................................................... – – – 19.79 – – – 65.3 2007 ............................................................... 20.00 20.06 20.29 20.36 65.8 65.6 65.8 65.6 2008 ............................................................... 20.66 20.83 20.96 21.10 65.7 65.9 66.0 66.2 2009 ............................................................... 21.20 21.22 21.25 21.22 66.2 66.2 66.4 66.5 2010 ............................................................... 21.26 21.33 21.49 21.25 66.0 65.9 65.8 65.9
2011 ............................................................... 21.41 21.49 21.51 21.59 65.5 65.1 65.3 65.6 2012 ............................................................... 21.72 21.74 21.88 22.05 65.8 65.7 65.7 65.8 2013 ............................................................... 22.22 22.29 22.34 22.95 65.8 65.9 65.8 65.3 2014 ............................................................... 23.16 23.29 23.36 23.95 65.0 65.2 65.1 65.2 2015 ............................................................... 24.04 24.10 24.32 24.98 65.2 65.2 65.3 64.9 2016 ............................................................... 25.19 25.42 25.53 25.62 64.9 65.0 65.1 65.1 2017 ............................................................... 25.87 – – – 65.2 – – –
Total benefits 2006 ............................................................... – – – 10.52 – – – 34.7 2007 ............................................................... 10.38 10.50 10.53 10.66 34.2 34.4 34.2 34.4 2008 ............................................................... 10.76 10.77 10.80 10.77 34.3 34.1 34.0 33.8 2009 ............................................................... 10.83 10.83 10.78 10.70 33.8 33.8 33.6 33.5 2010 ............................................................... 10.94 11.03 11.19 10.97 34.0 34.1 34.2 34.1
2011 ............................................................... 11.26 11.54 11.44 11.34 34.5 34.9 34.7 34.4 2012 ............................................................... 11.30 11.33 11.42 11.47 34.2 34.3 34.3 34.2 2013 ............................................................... 11.57 11.55 11.59 12.19 34.2 34.1 34.2 34.7 2014 ............................................................... 12.45 12.45 12.54 12.78 35.0 34.8 34.9 34.8 2015 ............................................................... 12.83 12.86 12.91 13.52 34.8 34.8 34.7 35.1 2016 ............................................................... 13.60 13.69 13.69 13.71 35.1 35.0 34.9 34.9 2017 ............................................................... 13.79 – – – 34.8 – – –
Paid leave 2006 ............................................................... – – – 2.35 – – – 7.7 2007 ............................................................... 2.37 2.39 2.38 2.39 7.8 7.8 7.7 7.7 2008 ............................................................... 2.38 2.39 2.40 2.43 7.6 7.6 7.6 7.6 2009 ............................................................... 2.45 2.46 2.47 2.44 7.7 7.7 7.7 7.6 2010 ............................................................... 2.44 2.46 2.48 2.44 7.6 7.6 7.6 7.6
2011 ............................................................... 2.44 2.45 2.44 2.44 7.5 7.4 7.4 7.4 2012 ............................................................... 2.46 2.46 2.47 2.50 7.4 7.4 7.4 7.5 2013 ............................................................... 2.53 2.54 2.54 2.65 7.5 7.5 7.5 7.5 2014 ............................................................... 2.68 2.69 2.70 2.77 7.5 7.5 7.5 7.6 2015 ............................................................... 2.78 2.79 2.81 2.90 7.5 7.5 7.6 7.5 2016 ............................................................... 2.93 2.97 2.96 2.96 7.6 7.6 7.5 7.5 2017 ............................................................... 3.00 – – – 7.6 – – –
Supplemental pay 2006 ............................................................... – – – 1.20 – – – 4.0 2007 ............................................................... 1.23 1.26 1.25 1.33 4.1 4.1 4.1 4.3 2008 ............................................................... 1.35 1.36 1.38 1.29 4.3 4.3 4.3 4.1 2009 ............................................................... 1.20 1.20 1.21 1.21 3.8 3.8 3.8 3.8 2010 ............................................................... 1.21 1.21 1.19 1.17 3.8 3.8 3.6 3.6
2011 ............................................................... 1.33 1.39 1.38 1.41 4.1 4.2 4.2 4.3 2012 ............................................................... 1.42 1.41 1.41 1.44 4.3 4.3 4.2 4.3 2013 ............................................................... 1.44 1.40 1.42 1.51 4.3 4.2 4.2 4.3 2014 ............................................................... 1.55 1.54 1.54 1.62 4.4 4.3 4.3 4.4 2015 ............................................................... 1.55 1.58 1.57 1.67 4.2 4.3 4.2 4.3 2016 ............................................................... 1.67 1.69 1.68 1.67 4.3 4.3 4.3 4.2
See footnotes at end of table.
-27-
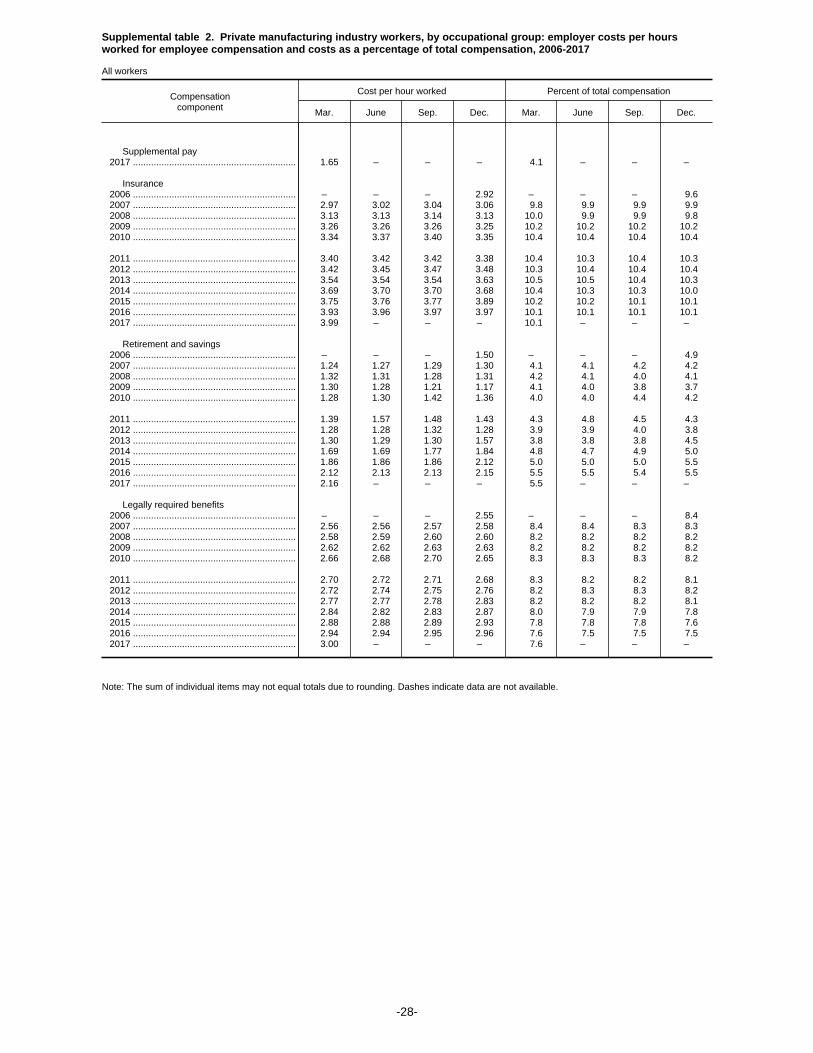
Supplemental table 2. Private manufacturing industry workers, by occupational group: employer costs per hoursworked for employee compensation and costs as a percentage of total compensation, 2006-2017
All workers
Compensationcomponent
Cost per hour worked Percent of total compensation
Mar. June Sep. Dec. Mar. June Sep. Dec.
Supplemental pay 2017 ............................................................... 1.65 – – – 4.1 – – –
Insurance 2006 ............................................................... – – – 2.92 – – – 9.6 2007 ............................................................... 2.97 3.02 3.04 3.06 9.8 9.9 9.9 9.9 2008 ............................................................... 3.13 3.13 3.14 3.13 10.0 9.9 9.9 9.8 2009 ............................................................... 3.26 3.26 3.26 3.25 10.2 10.2 10.2 10.2 2010 ............................................................... 3.34 3.37 3.40 3.35 10.4 10.4 10.4 10.4
2011 ............................................................... 3.40 3.42 3.42 3.38 10.4 10.3 10.4 10.3 2012 ............................................................... 3.42 3.45 3.47 3.48 10.3 10.4 10.4 10.4 2013 ............................................................... 3.54 3.54 3.54 3.63 10.5 10.5 10.4 10.3 2014 ............................................................... 3.69 3.70 3.70 3.68 10.4 10.3 10.3 10.0 2015 ............................................................... 3.75 3.76 3.77 3.89 10.2 10.2 10.1 10.1 2016 ............................................................... 3.93 3.96 3.97 3.97 10.1 10.1 10.1 10.1 2017 ............................................................... 3.99 – – – 10.1 – – –
Retirement and savings 2006 ............................................................... – – – 1.50 – – – 4.9 2007 ............................................................... 1.24 1.27 1.29 1.30 4.1 4.1 4.2 4.2 2008 ............................................................... 1.32 1.31 1.28 1.31 4.2 4.1 4.0 4.1 2009 ............................................................... 1.30 1.28 1.21 1.17 4.1 4.0 3.8 3.7 2010 ............................................................... 1.28 1.30 1.42 1.36 4.0 4.0 4.4 4.2
2011 ............................................................... 1.39 1.57 1.48 1.43 4.3 4.8 4.5 4.3 2012 ............................................................... 1.28 1.28 1.32 1.28 3.9 3.9 4.0 3.8 2013 ............................................................... 1.30 1.29 1.30 1.57 3.8 3.8 3.8 4.5 2014 ............................................................... 1.69 1.69 1.77 1.84 4.8 4.7 4.9 5.0 2015 ............................................................... 1.86 1.86 1.86 2.12 5.0 5.0 5.0 5.5 2016 ............................................................... 2.12 2.13 2.13 2.15 5.5 5.5 5.4 5.5 2017 ............................................................... 2.16 – – – 5.5 – – –
Legally required benefits 2006 ............................................................... – – – 2.55 – – – 8.4 2007 ............................................................... 2.56 2.56 2.57 2.58 8.4 8.4 8.3 8.3 2008 ............................................................... 2.58 2.59 2.60 2.60 8.2 8.2 8.2 8.2 2009 ............................................................... 2.62 2.62 2.63 2.63 8.2 8.2 8.2 8.2 2010 ............................................................... 2.66 2.68 2.70 2.65 8.3 8.3 8.3 8.2
2011 ............................................................... 2.70 2.72 2.71 2.68 8.3 8.2 8.2 8.1 2012 ............................................................... 2.72 2.74 2.75 2.76 8.2 8.3 8.3 8.2 2013 ............................................................... 2.77 2.77 2.78 2.83 8.2 8.2 8.2 8.1 2014 ............................................................... 2.84 2.82 2.83 2.87 8.0 7.9 7.9 7.8 2015 ............................................................... 2.88 2.88 2.89 2.93 7.8 7.8 7.8 7.6 2016 ............................................................... 2.94 2.94 2.95 2.96 7.6 7.5 7.5 7.5 2017 ............................................................... 3.00 – – – 7.6 – – –
Note: The sum of individual items may not equal totals due to rounding. Dashes indicate data are not available.
-28-
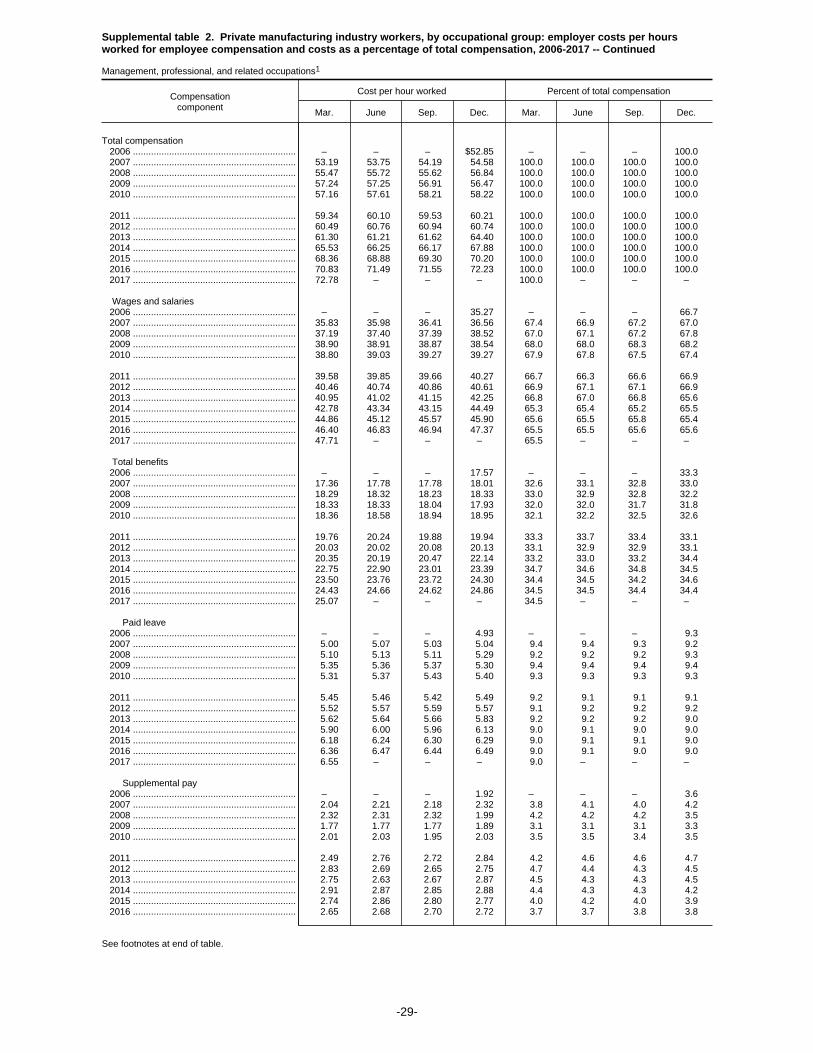
Supplemental table 2. Private manufacturing industry workers, by occupational group: employer costs per hoursworked for employee compensation and costs as a percentage of total compensation, 2006-2017 -- Continued
Management, professional, and related occupations1
Compensationcomponent
Cost per hour worked Percent of total compensation
Mar. June Sep. Dec. Mar. June Sep. Dec.
Total compensation 2006 ............................................................... – – – $52.85 – – – 100.0 2007 ............................................................... 53.19 53.75 54.19 54.58 100.0 100.0 100.0 100.0 2008 ............................................................... 55.47 55.72 55.62 56.84 100.0 100.0 100.0 100.0 2009 ............................................................... 57.24 57.25 56.91 56.47 100.0 100.0 100.0 100.0 2010 ............................................................... 57.16 57.61 58.21 58.22 100.0 100.0 100.0 100.0
2011 ............................................................... 59.34 60.10 59.53 60.21 100.0 100.0 100.0 100.0 2012 ............................................................... 60.49 60.76 60.94 60.74 100.0 100.0 100.0 100.0 2013 ............................................................... 61.30 61.21 61.62 64.40 100.0 100.0 100.0 100.0 2014 ............................................................... 65.53 66.25 66.17 67.88 100.0 100.0 100.0 100.0 2015 ............................................................... 68.36 68.88 69.30 70.20 100.0 100.0 100.0 100.0 2016 ............................................................... 70.83 71.49 71.55 72.23 100.0 100.0 100.0 100.0 2017 ............................................................... 72.78 – – – 100.0 – – –
Wages and salaries 2006 ............................................................... – – – 35.27 – – – 66.7 2007 ............................................................... 35.83 35.98 36.41 36.56 67.4 66.9 67.2 67.0 2008 ............................................................... 37.19 37.40 37.39 38.52 67.0 67.1 67.2 67.8 2009 ............................................................... 38.90 38.91 38.87 38.54 68.0 68.0 68.3 68.2 2010 ............................................................... 38.80 39.03 39.27 39.27 67.9 67.8 67.5 67.4
2011 ............................................................... 39.58 39.85 39.66 40.27 66.7 66.3 66.6 66.9 2012 ............................................................... 40.46 40.74 40.86 40.61 66.9 67.1 67.1 66.9 2013 ............................................................... 40.95 41.02 41.15 42.25 66.8 67.0 66.8 65.6 2014 ............................................................... 42.78 43.34 43.15 44.49 65.3 65.4 65.2 65.5 2015 ............................................................... 44.86 45.12 45.57 45.90 65.6 65.5 65.8 65.4 2016 ............................................................... 46.40 46.83 46.94 47.37 65.5 65.5 65.6 65.6 2017 ............................................................... 47.71 – – – 65.5 – – –
Total benefits 2006 ............................................................... – – – 17.57 – – – 33.3 2007 ............................................................... 17.36 17.78 17.78 18.01 32.6 33.1 32.8 33.0 2008 ............................................................... 18.29 18.32 18.23 18.33 33.0 32.9 32.8 32.2 2009 ............................................................... 18.33 18.33 18.04 17.93 32.0 32.0 31.7 31.8 2010 ............................................................... 18.36 18.58 18.94 18.95 32.1 32.2 32.5 32.6
2011 ............................................................... 19.76 20.24 19.88 19.94 33.3 33.7 33.4 33.1 2012 ............................................................... 20.03 20.02 20.08 20.13 33.1 32.9 32.9 33.1 2013 ............................................................... 20.35 20.19 20.47 22.14 33.2 33.0 33.2 34.4 2014 ............................................................... 22.75 22.90 23.01 23.39 34.7 34.6 34.8 34.5 2015 ............................................................... 23.50 23.76 23.72 24.30 34.4 34.5 34.2 34.6 2016 ............................................................... 24.43 24.66 24.62 24.86 34.5 34.5 34.4 34.4 2017 ............................................................... 25.07 – – – 34.5 – – –
Paid leave 2006 ............................................................... – – – 4.93 – – – 9.3 2007 ............................................................... 5.00 5.07 5.03 5.04 9.4 9.4 9.3 9.2 2008 ............................................................... 5.10 5.13 5.11 5.29 9.2 9.2 9.2 9.3 2009 ............................................................... 5.35 5.36 5.37 5.30 9.4 9.4 9.4 9.4 2010 ............................................................... 5.31 5.37 5.43 5.40 9.3 9.3 9.3 9.3
2011 ............................................................... 5.45 5.46 5.42 5.49 9.2 9.1 9.1 9.1 2012 ............................................................... 5.52 5.57 5.59 5.57 9.1 9.2 9.2 9.2 2013 ............................................................... 5.62 5.64 5.66 5.83 9.2 9.2 9.2 9.0 2014 ............................................................... 5.90 6.00 5.96 6.13 9.0 9.1 9.0 9.0 2015 ............................................................... 6.18 6.24 6.30 6.29 9.0 9.1 9.1 9.0 2016 ............................................................... 6.36 6.47 6.44 6.49 9.0 9.1 9.0 9.0 2017 ............................................................... 6.55 – – – 9.0 – – –
Supplemental pay 2006 ............................................................... – – – 1.92 – – – 3.6 2007 ............................................................... 2.04 2.21 2.18 2.32 3.8 4.1 4.0 4.2 2008 ............................................................... 2.32 2.31 2.32 1.99 4.2 4.2 4.2 3.5 2009 ............................................................... 1.77 1.77 1.77 1.89 3.1 3.1 3.1 3.3 2010 ............................................................... 2.01 2.03 1.95 2.03 3.5 3.5 3.4 3.5
2011 ............................................................... 2.49 2.76 2.72 2.84 4.2 4.6 4.6 4.7 2012 ............................................................... 2.83 2.69 2.65 2.75 4.7 4.4 4.3 4.5 2013 ............................................................... 2.75 2.63 2.67 2.87 4.5 4.3 4.3 4.5 2014 ............................................................... 2.91 2.87 2.85 2.88 4.4 4.3 4.3 4.2 2015 ............................................................... 2.74 2.86 2.80 2.77 4.0 4.2 4.0 3.9 2016 ............................................................... 2.65 2.68 2.70 2.72 3.7 3.7 3.8 3.8
See footnotes at end of table.
-29-

Supplemental table 2. Private manufacturing industry workers, by occupational group: employer costs per hoursworked for employee compensation and costs as a percentage of total compensation, 2006-2017 -- Continued
Management, professional, and related occupations1
Compensationcomponent
Cost per hour worked Percent of total compensation
Mar. June Sep. Dec. Mar. June Sep. Dec.
Supplemental pay 2017 ............................................................... 2.72 – – – 3.7 – – –
Insurance 2006 ............................................................... – – – 3.71 – – – 7.0 2007 ............................................................... 3.85 3.91 3.94 3.98 7.2 7.3 7.3 7.3 2008 ............................................................... 4.08 4.11 4.11 4.15 7.4 7.4 7.4 7.3 2009 ............................................................... 4.29 4.31 4.31 4.30 7.5 7.5 7.6 7.6 2010 ............................................................... 4.39 4.44 4.46 4.47 7.7 7.7 7.7 7.7
2011 ............................................................... 4.61 4.64 4.64 4.61 7.8 7.7 7.8 7.7 2012 ............................................................... 4.69 4.73 4.73 4.79 7.8 7.8 7.8 7.9 2013 ............................................................... 4.91 4.92 4.94 5.02 8.0 8.0 8.0 7.8 2014 ............................................................... 5.08 5.10 5.07 5.16 7.7 7.7 7.7 7.6 2015 ............................................................... 5.24 5.26 5.28 5.45 7.7 7.6 7.6 7.8 2016 ............................................................... 5.57 5.60 5.59 5.62 7.9 7.8 7.8 7.8 2017 ............................................................... 5.66 – – – 7.8 – – –
Retirement and savings 2006 ............................................................... – – – 3.38 – – – 6.4 2007 ............................................................... 2.79 2.91 2.94 2.99 5.2 5.4 5.4 5.5 2008 ............................................................... 3.06 3.04 2.95 3.07 5.5 5.5 5.3 5.4 2009 ............................................................... 3.06 3.03 2.73 2.61 5.4 5.3 4.8 4.6 2010 ............................................................... 2.77 2.84 3.18 3.14 4.8 4.9 5.5 5.4
2011 ............................................................... 3.23 3.38 3.10 2.99 5.4 5.6 5.2 5.0 2012 ............................................................... 2.92 2.94 3.01 2.93 4.8 4.8 4.9 4.8 2013 ............................................................... 2.95 2.90 3.05 4.22 4.8 4.7 4.9 6.6 2014 ............................................................... 4.60 4.68 4.88 4.90 7.0 7.1 7.4 7.2 2015 ............................................................... 4.98 5.04 4.98 5.42 7.3 7.3 7.2 7.7 2016 ............................................................... 5.44 5.46 5.45 5.56 7.7 7.6 7.6 7.7 2017 ............................................................... 5.58 – – – 7.7 – – –
Legally required benefits 2006 ............................................................... – – – 3.63 – – – 6.9 2007 ............................................................... 3.68 3.68 3.69 3.69 6.9 6.9 6.8 6.8 2008 ............................................................... 3.73 3.74 3.74 3.82 6.7 6.7 6.7 6.7 2009 ............................................................... 3.86 3.86 3.86 3.83 6.8 6.7 6.8 6.8 2010 ............................................................... 3.88 3.90 3.91 3.91 6.8 6.8 6.7 6.7
2011 ............................................................... 3.97 4.00 3.99 4.01 6.7 6.7 6.7 6.7 2012 ............................................................... 4.06 4.09 4.10 4.09 6.7 6.7 6.7 6.7 2013 ............................................................... 4.11 4.11 4.14 4.21 6.7 6.7 6.7 6.5 2014 ............................................................... 4.25 4.26 4.24 4.31 6.5 6.4 6.4 6.4 2015 ............................................................... 4.35 4.35 4.36 4.37 6.4 6.3 6.3 6.2 2016 ............................................................... 4.40 4.45 4.44 4.47 6.2 6.2 6.2 6.2 2017 ............................................................... 4.57 – – – 6.3 – – –
1 Estimates from December 2013 to March 2014 for this series were corrected, details are available atwww.bls.gov/bls/ecec_correction_091014.htm.
Note: The sum of individual items may not equal totals due to rounding. Dashes indicate data are not available.
-30-

Supplemental table 2. Private manufacturing industry workers, by occupational group: employer costs per hoursworked for employee compensation and costs as a percentage of total compensation, 2006-2017 -- Continued
Management, business, and financial occcupations1
Compensationcomponent
Cost per hour worked Percent of total compensation
Mar. June Sep. Dec. Mar. June Sep. Dec.
Total compensation 2006 ............................................................... – – – $58.61 – – – 100.0 2007 ............................................................... 59.21 60.14 61.14 62.08 100.0 100.0 100.0 100.0 2008 ............................................................... 63.33 63.35 63.56 62.68 100.0 100.0 100.0 100.0 2009 ............................................................... 63.27 63.07 62.46 61.04 100.0 100.0 100.0 100.0 2010 ............................................................... 61.77 62.37 62.80 62.46 100.0 100.0 100.0 100.0
2011 ............................................................... 63.62 64.37 63.49 63.42 100.0 100.0 100.0 100.0 2012 ............................................................... 63.74 63.92 64.08 65.41 100.0 100.0 100.0 100.0 2013 ............................................................... 65.86 65.95 66.66 69.91 100.0 100.0 100.0 100.0 2014 ............................................................... 71.43 71.75 72.00 72.08 100.0 100.0 100.0 100.0 2015 ............................................................... 72.79 73.49 74.48 72.91 100.0 100.0 100.0 100.0 2016 ............................................................... 73.74 74.57 74.48 74.74 100.0 100.0 100.0 100.0 2017 ............................................................... 75.19 – – – 100.0 – – –
Wages and salaries 2006 ............................................................... – – – 39.77 – – – 67.9 2007 ............................................................... 40.53 40.66 41.40 41.93 68.4 67.6 67.7 67.5 2008 ............................................................... 42.76 42.81 42.98 43.22 67.5 67.6 67.6 68.9 2009 ............................................................... 43.72 43.57 43.33 42.36 69.1 69.1 69.4 69.4 2010 ............................................................... 42.72 43.06 43.27 42.82 69.2 69.0 68.9 68.6
2011 ............................................................... 43.11 43.43 42.97 43.01 67.7 67.5 67.7 67.8 2012 ............................................................... 43.21 43.39 43.51 43.95 67.8 67.9 67.9 67.2 2013 ............................................................... 44.24 44.40 44.63 46.21 67.2 67.3 67.0 66.1 2014 ............................................................... 47.02 47.30 47.31 47.90 65.8 65.9 65.7 66.5 2015 ............................................................... 48.54 48.82 49.78 48.66 66.7 66.4 66.8 66.7 2016 ............................................................... 49.32 49.92 49.98 50.09 66.9 66.9 67.1 67.0 2017 ............................................................... 50.35 – – – 67.0 – – –
Total benefits 2006 ............................................................... – – – 18.83 – – – 32.1 2007 ............................................................... 18.68 19.47 19.74 20.15 31.6 32.4 32.3 32.5 2008 ............................................................... 20.57 20.55 20.58 19.46 32.5 32.4 32.4 31.1 2009 ............................................................... 19.54 19.50 19.13 18.68 30.9 30.9 30.6 30.6 2010 ............................................................... 19.06 19.31 19.53 19.64 30.8 31.0 31.1 31.4
2011 ............................................................... 20.52 20.94 20.52 20.40 32.3 32.5 32.3 32.2 2012 ............................................................... 20.53 20.53 20.57 21.45 32.2 32.1 32.1 32.8 2013 ............................................................... 21.62 21.56 22.02 23.70 32.8 32.7 33.0 33.9 2014 ............................................................... 24.41 24.45 24.68 24.18 34.2 34.1 34.3 33.5 2015 ............................................................... 24.25 24.66 24.70 24.25 33.3 33.6 33.2 33.3 2016 ............................................................... 24.42 24.65 24.50 24.65 33.1 33.1 32.9 33.0 2017 ............................................................... 24.84 – – – 33.0 – – –
Paid leave 2006 ............................................................... – – – 5.50 – – – 9.4 2007 ............................................................... 5.60 5.74 5.69 5.75 9.5 9.5 9.3 9.3 2008 ............................................................... 5.83 5.84 5.84 5.86 9.2 9.2 9.2 9.4 2009 ............................................................... 5.94 5.92 5.89 5.74 9.4 9.4 9.4 9.4 2010 ............................................................... 5.76 5.86 5.91 5.85 9.3 9.4 9.4 9.4
2011 ............................................................... 5.92 5.92 5.81 5.78 9.3 9.2 9.2 9.1 2012 ............................................................... 5.82 5.86 5.89 6.09 9.1 9.2 9.2 9.3 2013 ............................................................... 6.12 6.14 6.19 6.47 9.3 9.3 9.3 9.2 2014 ............................................................... 6.60 6.65 6.64 6.72 9.2 9.3 9.2 9.3 2015 ............................................................... 6.81 6.84 6.96 6.80 9.4 9.3 9.3 9.3 2016 ............................................................... 6.89 6.98 6.98 7.01 9.3 9.4 9.4 9.4 2017 ............................................................... 7.06 – – – 9.4 – – –
Supplemental pay 2006 ............................................................... – – – 2.33 – – – 4.0 2007 ............................................................... 2.42 2.81 3.03 3.24 4.1 4.7 5.0 5.2 2008 ............................................................... 3.26 3.26 3.34 2.23 5.2 5.1 5.3 3.6 2009 ............................................................... 1.98 1.98 1.97 1.99 3.1 3.1 3.2 3.3 2010 ............................................................... 2.05 2.08 1.98 2.09 3.3 3.3 3.1 3.3
2011 ............................................................... 2.66 2.92 2.85 2.95 4.2 4.5 4.5 4.6 2012 ............................................................... 2.87 2.78 2.77 3.18 4.5 4.3 4.3 4.9 2013 ............................................................... 3.18 3.09 3.17 3.32 4.8 4.7 4.8 4.7 2014 ............................................................... 3.31 3.26 3.26 2.99 4.6 4.5 4.5 4.1 2015 ............................................................... 2.71 2.94 2.92 2.59 3.7 4.0 3.9 3.6 2016 ............................................................... 2.44 2.43 2.35 2.36 3.3 3.3 3.2 3.2
See footnotes at end of table.
-31-

Supplemental table 2. Private manufacturing industry workers, by occupational group: employer costs per hoursworked for employee compensation and costs as a percentage of total compensation, 2006-2017 -- Continued
Management, business, and financial occcupations1
Compensationcomponent
Cost per hour worked Percent of total compensation
Mar. June Sep. Dec. Mar. June Sep. Dec.
Supplemental pay 2017 ............................................................... 2.36 – – – 3.1 – – –
Insurance 2006 ............................................................... – – – 3.78 – – – 6.5 2007 ............................................................... 3.91 3.98 4.01 4.05 6.6 6.6 6.6 6.5 2008 ............................................................... 4.17 4.16 4.17 4.17 6.6 6.6 6.6 6.7 2009 ............................................................... 4.33 4.34 4.34 4.37 6.8 6.9 6.9 7.2 2010 ............................................................... 4.45 4.49 4.52 4.55 7.2 7.2 7.2 7.3
2011 ............................................................... 4.62 4.63 4.64 4.65 7.3 7.2 7.3 7.3 2012 ............................................................... 4.76 4.79 4.78 4.94 7.5 7.5 7.5 7.5 2013 ............................................................... 5.04 5.05 5.09 5.19 7.7 7.7 7.6 7.4 2014 ............................................................... 5.24 5.25 5.25 5.27 7.3 7.3 7.3 7.3 2015 ............................................................... 5.36 5.38 5.41 5.39 7.4 7.3 7.3 7.4 2016 ............................................................... 5.53 5.56 5.54 5.56 7.5 7.5 7.4 7.4 2017 ............................................................... 5.60 – – – 7.4 – – –
Retirement and savings 2006 ............................................................... – – – 3.32 – – – 5.7 2007 ............................................................... 2.79 2.97 3.02 3.10 4.7 4.9 4.9 5.0 2008 ............................................................... 3.24 3.23 3.14 3.11 5.1 5.1 4.9 5.0 2009 ............................................................... 3.15 3.13 2.82 2.52 5.0 5.0 4.5 4.1 2010 ............................................................... 2.68 2.74 2.97 3.02 4.3 4.4 4.7 4.8
2011 ............................................................... 3.14 3.25 3.01 2.85 4.9 5.1 4.7 4.5 2012 ............................................................... 2.85 2.86 2.88 2.95 4.5 4.5 4.5 4.5 2013 ............................................................... 2.95 2.96 3.20 4.29 4.5 4.5 4.8 6.1 2014 ............................................................... 4.77 4.83 5.07 4.74 6.7 6.7 7.0 6.6 2015 ............................................................... 4.85 4.99 4.86 4.97 6.7 6.8 6.5 6.8 2016 ............................................................... 5.02 5.08 5.02 5.12 6.8 6.8 6.7 6.9 2017 ............................................................... 5.10 – – – 6.8 – – –
Legally required benefits 2006 ............................................................... – – – 3.91 – – – 6.7 2007 ............................................................... 3.96 3.98 3.99 4.01 6.7 6.6 6.5 6.5 2008 ............................................................... 4.07 4.07 4.09 4.09 6.4 6.4 6.4 6.5 2009 ............................................................... 4.15 4.13 4.12 4.07 6.6 6.6 6.6 6.7 2010 ............................................................... 4.11 4.14 4.15 4.13 6.7 6.6 6.6 6.6
2011 ............................................................... 4.18 4.22 4.21 4.18 6.6 6.6 6.6 6.6 2012 ............................................................... 4.24 4.24 4.25 4.31 6.6 6.6 6.6 6.6 2013 ............................................................... 4.32 4.32 4.36 4.44 6.6 6.6 6.5 6.3 2014 ............................................................... 4.49 4.47 4.46 4.46 6.3 6.2 6.2 6.2 2015 ............................................................... 4.51 4.52 4.55 4.50 6.2 6.1 6.1 6.2 2016 ............................................................... 4.55 4.60 4.59 4.60 6.2 6.2 6.2 6.2 2017 ............................................................... 4.71 – – – 6.3 – – –
1 Estimates from December 2013 to March 2014 for this series were corrected, details are available atwww.bls.gov/bls/ecec_correction_091014.htm.
Note: The sum of individual items may not equal totals due to rounding. Dashes indicate data are not available.
-32-
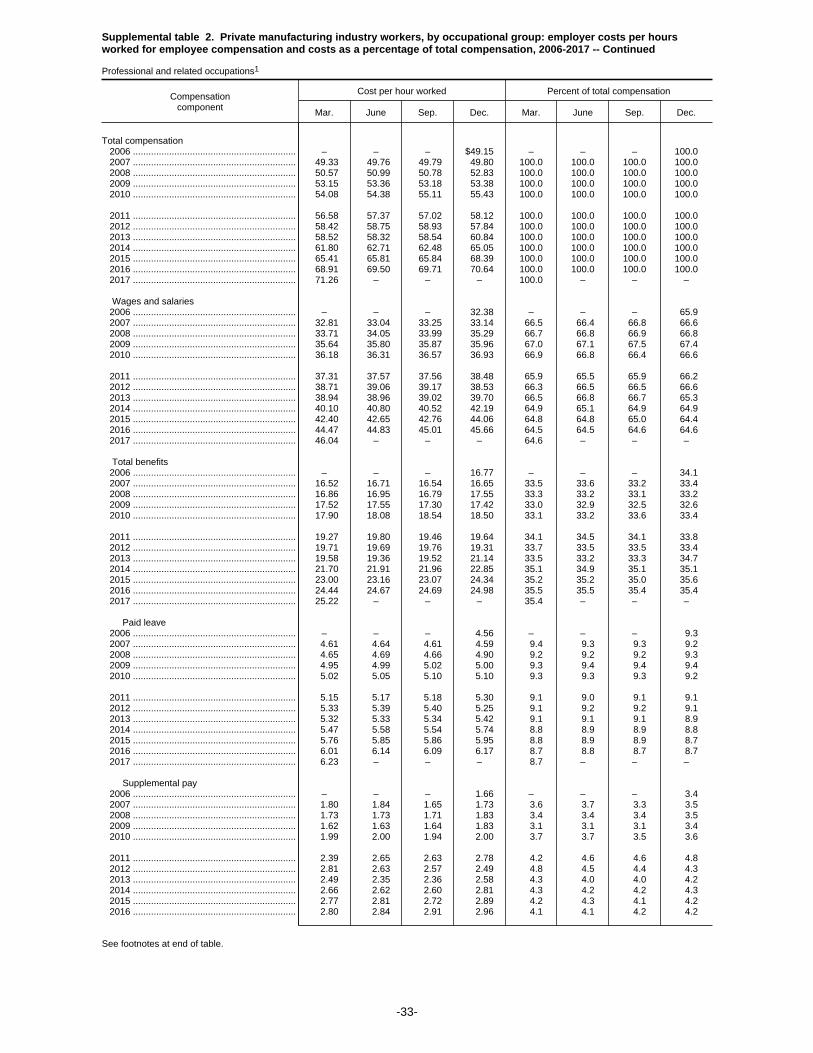
Supplemental table 2. Private manufacturing industry workers, by occupational group: employer costs per hoursworked for employee compensation and costs as a percentage of total compensation, 2006-2017 -- Continued
Professional and related occupations1
Compensationcomponent
Cost per hour worked Percent of total compensation
Mar. June Sep. Dec. Mar. June Sep. Dec.
Total compensation 2006 ............................................................... – – – $49.15 – – – 100.0 2007 ............................................................... 49.33 49.76 49.79 49.80 100.0 100.0 100.0 100.0 2008 ............................................................... 50.57 50.99 50.78 52.83 100.0 100.0 100.0 100.0 2009 ............................................................... 53.15 53.36 53.18 53.38 100.0 100.0 100.0 100.0 2010 ............................................................... 54.08 54.38 55.11 55.43 100.0 100.0 100.0 100.0
2011 ............................................................... 56.58 57.37 57.02 58.12 100.0 100.0 100.0 100.0 2012 ............................................................... 58.42 58.75 58.93 57.84 100.0 100.0 100.0 100.0 2013 ............................................................... 58.52 58.32 58.54 60.84 100.0 100.0 100.0 100.0 2014 ............................................................... 61.80 62.71 62.48 65.05 100.0 100.0 100.0 100.0 2015 ............................................................... 65.41 65.81 65.84 68.39 100.0 100.0 100.0 100.0 2016 ............................................................... 68.91 69.50 69.71 70.64 100.0 100.0 100.0 100.0 2017 ............................................................... 71.26 – – – 100.0 – – –
Wages and salaries 2006 ............................................................... – – – 32.38 – – – 65.9 2007 ............................................................... 32.81 33.04 33.25 33.14 66.5 66.4 66.8 66.6 2008 ............................................................... 33.71 34.05 33.99 35.29 66.7 66.8 66.9 66.8 2009 ............................................................... 35.64 35.80 35.87 35.96 67.0 67.1 67.5 67.4 2010 ............................................................... 36.18 36.31 36.57 36.93 66.9 66.8 66.4 66.6
2011 ............................................................... 37.31 37.57 37.56 38.48 65.9 65.5 65.9 66.2 2012 ............................................................... 38.71 39.06 39.17 38.53 66.3 66.5 66.5 66.6 2013 ............................................................... 38.94 38.96 39.02 39.70 66.5 66.8 66.7 65.3 2014 ............................................................... 40.10 40.80 40.52 42.19 64.9 65.1 64.9 64.9 2015 ............................................................... 42.40 42.65 42.76 44.06 64.8 64.8 65.0 64.4 2016 ............................................................... 44.47 44.83 45.01 45.66 64.5 64.5 64.6 64.6 2017 ............................................................... 46.04 – – – 64.6 – – –
Total benefits 2006 ............................................................... – – – 16.77 – – – 34.1 2007 ............................................................... 16.52 16.71 16.54 16.65 33.5 33.6 33.2 33.4 2008 ............................................................... 16.86 16.95 16.79 17.55 33.3 33.2 33.1 33.2 2009 ............................................................... 17.52 17.55 17.30 17.42 33.0 32.9 32.5 32.6 2010 ............................................................... 17.90 18.08 18.54 18.50 33.1 33.2 33.6 33.4
2011 ............................................................... 19.27 19.80 19.46 19.64 34.1 34.5 34.1 33.8 2012 ............................................................... 19.71 19.69 19.76 19.31 33.7 33.5 33.5 33.4 2013 ............................................................... 19.58 19.36 19.52 21.14 33.5 33.2 33.3 34.7 2014 ............................................................... 21.70 21.91 21.96 22.85 35.1 34.9 35.1 35.1 2015 ............................................................... 23.00 23.16 23.07 24.34 35.2 35.2 35.0 35.6 2016 ............................................................... 24.44 24.67 24.69 24.98 35.5 35.5 35.4 35.4 2017 ............................................................... 25.22 – – – 35.4 – – –
Paid leave 2006 ............................................................... – – – 4.56 – – – 9.3 2007 ............................................................... 4.61 4.64 4.61 4.59 9.4 9.3 9.3 9.2 2008 ............................................................... 4.65 4.69 4.66 4.90 9.2 9.2 9.2 9.3 2009 ............................................................... 4.95 4.99 5.02 5.00 9.3 9.4 9.4 9.4 2010 ............................................................... 5.02 5.05 5.10 5.10 9.3 9.3 9.3 9.2
2011 ............................................................... 5.15 5.17 5.18 5.30 9.1 9.0 9.1 9.1 2012 ............................................................... 5.33 5.39 5.40 5.25 9.1 9.2 9.2 9.1 2013 ............................................................... 5.32 5.33 5.34 5.42 9.1 9.1 9.1 8.9 2014 ............................................................... 5.47 5.58 5.54 5.74 8.8 8.9 8.9 8.8 2015 ............................................................... 5.76 5.85 5.86 5.95 8.8 8.9 8.9 8.7 2016 ............................................................... 6.01 6.14 6.09 6.17 8.7 8.8 8.7 8.7 2017 ............................................................... 6.23 – – – 8.7 – – –
Supplemental pay 2006 ............................................................... – – – 1.66 – – – 3.4 2007 ............................................................... 1.80 1.84 1.65 1.73 3.6 3.7 3.3 3.5 2008 ............................................................... 1.73 1.73 1.71 1.83 3.4 3.4 3.4 3.5 2009 ............................................................... 1.62 1.63 1.64 1.83 3.1 3.1 3.1 3.4 2010 ............................................................... 1.99 2.00 1.94 2.00 3.7 3.7 3.5 3.6
2011 ............................................................... 2.39 2.65 2.63 2.78 4.2 4.6 4.6 4.8 2012 ............................................................... 2.81 2.63 2.57 2.49 4.8 4.5 4.4 4.3 2013 ............................................................... 2.49 2.35 2.36 2.58 4.3 4.0 4.0 4.2 2014 ............................................................... 2.66 2.62 2.60 2.81 4.3 4.2 4.2 4.3 2015 ............................................................... 2.77 2.81 2.72 2.89 4.2 4.3 4.1 4.2 2016 ............................................................... 2.80 2.84 2.91 2.96 4.1 4.1 4.2 4.2
See footnotes at end of table.
-33-

Supplemental table 2. Private manufacturing industry workers, by occupational group: employer costs per hoursworked for employee compensation and costs as a percentage of total compensation, 2006-2017 -- Continued
Professional and related occupations1
Compensationcomponent
Cost per hour worked Percent of total compensation
Mar. June Sep. Dec. Mar. June Sep. Dec.
Supplemental pay 2017 ............................................................... 2.94 – – – 4.1 – – –
Insurance 2006 ............................................................... – – – 3.67 – – – 7.5 2007 ............................................................... 3.81 3.87 3.89 3.94 7.7 7.8 7.8 7.9 2008 ............................................................... 4.03 4.07 4.08 4.13 8.0 8.0 8.0 7.8 2009 ............................................................... 4.26 4.29 4.29 4.25 8.0 8.0 8.1 8.0 2010 ............................................................... 4.35 4.40 4.43 4.42 8.0 8.1 8.0 8.0
2011 ............................................................... 4.61 4.66 4.64 4.58 8.1 8.1 8.1 7.9 2012 ............................................................... 4.65 4.69 4.70 4.70 8.0 8.0 8.0 8.1 2013 ............................................................... 4.83 4.84 4.85 4.92 8.2 8.3 8.3 8.1 2014 ............................................................... 4.98 5.00 4.96 5.08 8.1 8.0 7.9 7.8 2015 ............................................................... 5.16 5.18 5.20 5.49 7.9 7.9 7.9 8.0 2016 ............................................................... 5.59 5.62 5.62 5.65 8.1 8.1 8.1 8.0 2017 ............................................................... 5.69 – – – 8.0 – – –
Retirement and savings 2006 ............................................................... – – – 3.42 – – – 7.0 2007 ............................................................... 2.79 2.87 2.89 2.91 5.7 5.8 5.8 5.9 2008 ............................................................... 2.95 2.93 2.83 3.04 5.8 5.7 5.6 5.8 2009 ............................................................... 3.00 2.96 2.67 2.68 5.7 5.5 5.0 5.0 2010 ............................................................... 2.82 2.90 3.32 3.22 5.2 5.3 6.0 5.8
2011 ............................................................... 3.29 3.45 3.16 3.08 5.8 6.0 5.5 5.3 2012 ............................................................... 2.97 2.99 3.09 2.91 5.1 5.1 5.2 5.0 2013 ............................................................... 2.96 2.86 2.95 4.17 5.1 4.9 5.0 6.9 2014 ............................................................... 4.49 4.58 4.77 5.01 7.3 7.3 7.6 7.7 2015 ............................................................... 5.07 5.08 5.05 5.71 7.8 7.7 7.7 8.4 2016 ............................................................... 5.73 5.71 5.71 5.83 8.3 8.2 8.2 8.3 2017 ............................................................... 5.88 – – – 8.2 – – –
Legally required benefits 2006 ............................................................... – – – 3.46 – – – 7.0 2007 ............................................................... 3.50 3.50 3.50 3.48 7.1 7.0 7.0 7.0 2008 ............................................................... 3.51 3.53 3.52 3.64 6.9 6.9 6.9 6.9 2009 ............................................................... 3.67 3.68 3.69 3.67 6.9 6.9 6.9 6.9 2010 ............................................................... 3.72 3.73 3.75 3.77 6.9 6.9 6.8 6.8
2011 ............................................................... 3.83 3.86 3.86 3.90 6.8 6.7 6.8 6.7 2012 ............................................................... 3.95 3.99 4.00 3.95 6.8 6.8 6.8 6.8 2013 ............................................................... 3.98 3.98 4.01 4.06 6.8 6.8 6.8 6.7 2014 ............................................................... 4.10 4.13 4.11 4.21 6.6 6.6 6.6 6.5 2015 ............................................................... 4.23 4.24 4.24 4.29 6.5 6.4 6.4 6.3 2016 ............................................................... 4.31 4.36 4.35 4.38 6.3 6.3 6.2 6.2 2017 ............................................................... 4.48 – – – 6.3 – – –
1 Estimates from December 2013 to March 2014 for this series were corrected, details are available atwww.bls.gov/bls/ecec_correction_091014.htm.
Note: The sum of individual items may not equal totals due to rounding. Dashes indicate data are not available.
-34-
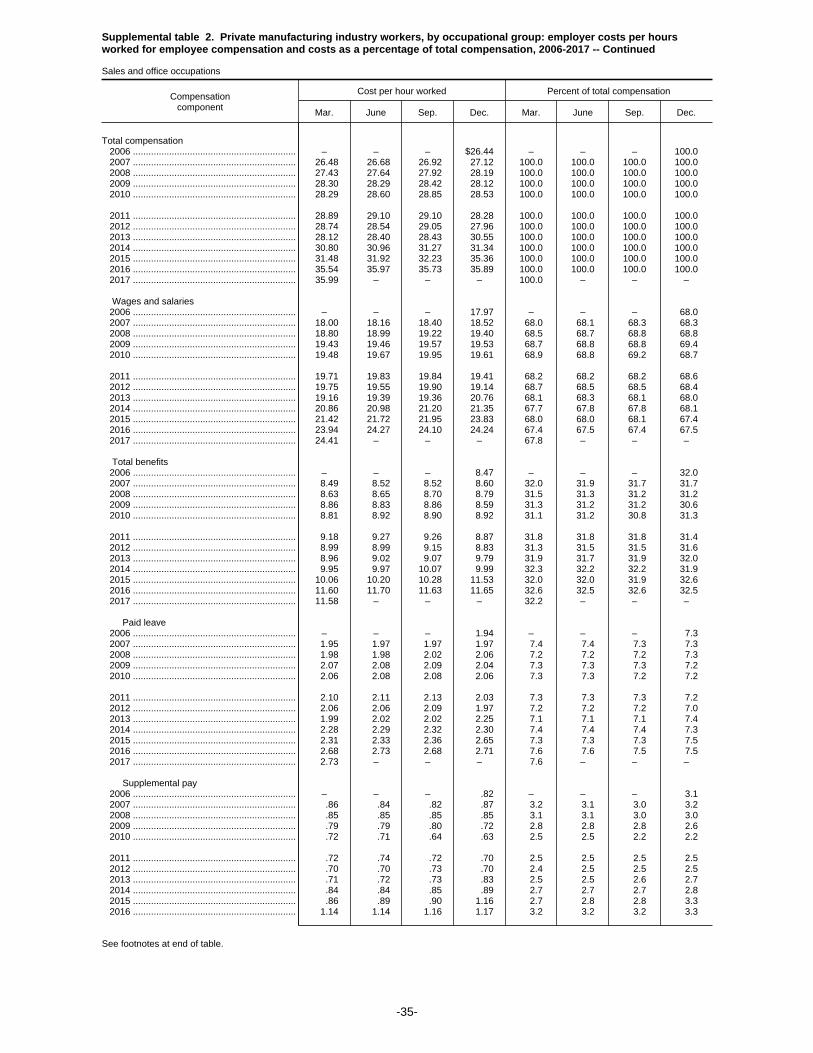
Supplemental table 2. Private manufacturing industry workers, by occupational group: employer costs per hoursworked for employee compensation and costs as a percentage of total compensation, 2006-2017 -- Continued
Sales and office occupations
Compensationcomponent
Cost per hour worked Percent of total compensation
Mar. June Sep. Dec. Mar. June Sep. Dec.
Total compensation 2006 ............................................................... – – – $26.44 – – – 100.0 2007 ............................................................... 26.48 26.68 26.92 27.12 100.0 100.0 100.0 100.0 2008 ............................................................... 27.43 27.64 27.92 28.19 100.0 100.0 100.0 100.0 2009 ............................................................... 28.30 28.29 28.42 28.12 100.0 100.0 100.0 100.0 2010 ............................................................... 28.29 28.60 28.85 28.53 100.0 100.0 100.0 100.0
2011 ............................................................... 28.89 29.10 29.10 28.28 100.0 100.0 100.0 100.0 2012 ............................................................... 28.74 28.54 29.05 27.96 100.0 100.0 100.0 100.0 2013 ............................................................... 28.12 28.40 28.43 30.55 100.0 100.0 100.0 100.0 2014 ............................................................... 30.80 30.96 31.27 31.34 100.0 100.0 100.0 100.0 2015 ............................................................... 31.48 31.92 32.23 35.36 100.0 100.0 100.0 100.0 2016 ............................................................... 35.54 35.97 35.73 35.89 100.0 100.0 100.0 100.0 2017 ............................................................... 35.99 – – – 100.0 – – –
Wages and salaries 2006 ............................................................... – – – 17.97 – – – 68.0 2007 ............................................................... 18.00 18.16 18.40 18.52 68.0 68.1 68.3 68.3 2008 ............................................................... 18.80 18.99 19.22 19.40 68.5 68.7 68.8 68.8 2009 ............................................................... 19.43 19.46 19.57 19.53 68.7 68.8 68.8 69.4 2010 ............................................................... 19.48 19.67 19.95 19.61 68.9 68.8 69.2 68.7
2011 ............................................................... 19.71 19.83 19.84 19.41 68.2 68.2 68.2 68.6 2012 ............................................................... 19.75 19.55 19.90 19.14 68.7 68.5 68.5 68.4 2013 ............................................................... 19.16 19.39 19.36 20.76 68.1 68.3 68.1 68.0 2014 ............................................................... 20.86 20.98 21.20 21.35 67.7 67.8 67.8 68.1 2015 ............................................................... 21.42 21.72 21.95 23.83 68.0 68.0 68.1 67.4 2016 ............................................................... 23.94 24.27 24.10 24.24 67.4 67.5 67.4 67.5 2017 ............................................................... 24.41 – – – 67.8 – – –
Total benefits 2006 ............................................................... – – – 8.47 – – – 32.0 2007 ............................................................... 8.49 8.52 8.52 8.60 32.0 31.9 31.7 31.7 2008 ............................................................... 8.63 8.65 8.70 8.79 31.5 31.3 31.2 31.2 2009 ............................................................... 8.86 8.83 8.86 8.59 31.3 31.2 31.2 30.6 2010 ............................................................... 8.81 8.92 8.90 8.92 31.1 31.2 30.8 31.3
2011 ............................................................... 9.18 9.27 9.26 8.87 31.8 31.8 31.8 31.4 2012 ............................................................... 8.99 8.99 9.15 8.83 31.3 31.5 31.5 31.6 2013 ............................................................... 8.96 9.02 9.07 9.79 31.9 31.7 31.9 32.0 2014 ............................................................... 9.95 9.97 10.07 9.99 32.3 32.2 32.2 31.9 2015 ............................................................... 10.06 10.20 10.28 11.53 32.0 32.0 31.9 32.6 2016 ............................................................... 11.60 11.70 11.63 11.65 32.6 32.5 32.6 32.5 2017 ............................................................... 11.58 – – – 32.2 – – –
Paid leave 2006 ............................................................... – – – 1.94 – – – 7.3 2007 ............................................................... 1.95 1.97 1.97 1.97 7.4 7.4 7.3 7.3 2008 ............................................................... 1.98 1.98 2.02 2.06 7.2 7.2 7.2 7.3 2009 ............................................................... 2.07 2.08 2.09 2.04 7.3 7.3 7.3 7.2 2010 ............................................................... 2.06 2.08 2.08 2.06 7.3 7.3 7.2 7.2
2011 ............................................................... 2.10 2.11 2.13 2.03 7.3 7.3 7.3 7.2 2012 ............................................................... 2.06 2.06 2.09 1.97 7.2 7.2 7.2 7.0 2013 ............................................................... 1.99 2.02 2.02 2.25 7.1 7.1 7.1 7.4 2014 ............................................................... 2.28 2.29 2.32 2.30 7.4 7.4 7.4 7.3 2015 ............................................................... 2.31 2.33 2.36 2.65 7.3 7.3 7.3 7.5 2016 ............................................................... 2.68 2.73 2.68 2.71 7.6 7.6 7.5 7.5 2017 ............................................................... 2.73 – – – 7.6 – – –
Supplemental pay 2006 ............................................................... – – – .82 – – – 3.1 2007 ............................................................... .86 .84 .82 .87 3.2 3.1 3.0 3.2 2008 ............................................................... .85 .85 .85 .85 3.1 3.1 3.0 3.0 2009 ............................................................... .79 .79 .80 .72 2.8 2.8 2.8 2.6 2010 ............................................................... .72 .71 .64 .63 2.5 2.5 2.2 2.2
2011 ............................................................... .72 .74 .72 .70 2.5 2.5 2.5 2.5 2012 ............................................................... .70 .70 .73 .70 2.4 2.5 2.5 2.5 2013 ............................................................... .71 .72 .73 .83 2.5 2.5 2.6 2.7 2014 ............................................................... .84 .84 .85 .89 2.7 2.7 2.7 2.8 2015 ............................................................... .86 .89 .90 1.16 2.7 2.8 2.8 3.3 2016 ............................................................... 1.14 1.14 1.16 1.17 3.2 3.2 3.2 3.3
See footnotes at end of table.
-35-

Supplemental table 2. Private manufacturing industry workers, by occupational group: employer costs per hoursworked for employee compensation and costs as a percentage of total compensation, 2006-2017 -- Continued
Sales and office occupations
Compensationcomponent
Cost per hour worked Percent of total compensation
Mar. June Sep. Dec. Mar. June Sep. Dec.
Supplemental pay 2017 ............................................................... 1.15 – – – 3.2 – – –
Insurance 2006 ............................................................... – – – 2.58 – – – 9.8 2007 ............................................................... 2.63 2.64 2.61 2.62 9.9 9.9 9.7 9.7 2008 ............................................................... 2.67 2.68 2.69 2.73 9.7 9.7 9.6 9.7 2009 ............................................................... 2.83 2.81 2.82 2.77 10.0 9.9 9.9 9.9 2010 ............................................................... 2.88 2.93 2.93 3.04 10.2 10.3 10.1 10.7
2011 ............................................................... 3.08 3.08 3.08 3.00 10.7 10.6 10.6 10.6 2012 ............................................................... 3.01 3.05 3.06 3.05 10.5 10.7 10.5 10.9 2013 ............................................................... 3.16 3.13 3.19 3.37 11.2 11.0 11.2 11.0 2014 ............................................................... 3.43 3.44 3.44 3.36 11.1 11.1 11.0 10.7 2015 ............................................................... 3.41 3.46 3.47 3.64 10.8 10.8 10.8 10.3 2016 ............................................................... 3.69 3.71 3.68 3.66 10.4 10.3 10.3 10.2 2017 ............................................................... 3.62 – – – 10.1 – – –
Retirement and savings 2006 ............................................................... – – – 1.01 – – – 3.8 2007 ............................................................... .93 .95 .98 .98 3.5 3.6 3.6 3.6 2008 ............................................................... .98 .98 .96 .96 3.6 3.5 3.5 3.4 2009 ............................................................... .97 .96 .94 .85 3.4 3.4 3.3 3.0 2010 ............................................................... .91 .93 .97 .95 3.2 3.2 3.4 3.3
2011 ............................................................... .98 1.01 1.01 .90 3.4 3.5 3.5 3.2 2012 ............................................................... .93 .91 .93 .84 3.2 3.2 3.2 3.0 2013 ............................................................... .85 .88 .87 .96 3.0 3.1 3.1 3.2 2014 ............................................................... 1.02 1.04 1.09 1.08 3.3 3.4 3.5 3.4 2015 ............................................................... 1.10 1.12 1.13 1.46 3.5 3.5 3.5 4.1 2016 ............................................................... 1.46 1.48 1.49 1.49 4.1 4.1 4.2 4.1 2017 ............................................................... 1.43 – – – 4.0 – – –
Legally required benefits 2006 ............................................................... – – – 2.12 – – – 8.0 2007 ............................................................... 2.12 2.13 2.14 2.16 8.0 8.0 7.9 8.0 2008 ............................................................... 2.15 2.16 2.18 2.19 7.8 7.8 7.8 7.8 2009 ............................................................... 2.20 2.20 2.20 2.21 7.8 7.8 7.7 7.9 2010 ............................................................... 2.24 2.27 2.28 2.24 7.9 7.9 7.9 7.8
2011 ............................................................... 2.30 2.33 2.32 2.24 8.0 8.0 8.0 7.9 2012 ............................................................... 2.28 2.27 2.33 2.26 7.9 7.9 8.0 8.1 2013 ............................................................... 2.24 2.26 2.26 2.37 8.0 7.9 7.9 7.8 2014 ............................................................... 2.39 2.36 2.37 2.37 7.7 7.6 7.6 7.6 2015 ............................................................... 2.38 2.40 2.42 2.61 7.6 7.5 7.5 7.4 2016 ............................................................... 2.62 2.64 2.62 2.63 7.4 7.3 7.3 7.3 2017 ............................................................... 2.65 – – – 7.4 – – –
Note: The sum of individual items may not equal totals due to rounding. Dashes indicate data are not available.
-36-

Supplemental table 2. Private manufacturing industry workers, by occupational group: employer costs per hoursworked for employee compensation and costs as a percentage of total compensation, 2006-2017 -- Continued
Office and administrative support occupations
Compensationcomponent
Cost per hour worked Percent of total compensation
Mar. June Sep. Dec. Mar. June Sep. Dec.
Total compensation 2006 ............................................................... – – – $24.27 – – – 100.0 2007 ............................................................... 24.50 24.63 24.68 24.79 100.0 100.0 100.0 100.0 2008 ............................................................... 24.95 25.32 25.45 25.55 100.0 100.0 100.0 100.0 2009 ............................................................... 25.70 25.74 25.79 25.38 100.0 100.0 100.0 100.0 2010 ............................................................... 25.57 25.76 25.85 26.03 100.0 100.0 100.0 100.0
2011 ............................................................... 26.46 26.57 26.59 26.62 100.0 100.0 100.0 100.0 2012 ............................................................... 26.90 26.91 27.12 26.51 100.0 100.0 100.0 100.0 2013 ............................................................... 26.78 26.89 27.07 27.28 100.0 100.0 100.0 100.0 2014 ............................................................... 27.60 27.65 27.85 28.08 100.0 100.0 100.0 100.0 2015 ............................................................... 28.22 28.45 28.65 30.28 100.0 100.0 100.0 100.0 2016 ............................................................... 30.43 30.65 30.70 30.81 100.0 100.0 100.0 100.0 2017 ............................................................... 30.80 – – – 100.0 – – –
Wages and salaries 2006 ............................................................... – – – 16.07 – – – 66.2 2007 ............................................................... 16.25 16.35 16.40 16.47 66.3 66.4 66.5 66.4 2008 ............................................................... 16.67 16.95 17.06 17.22 66.8 67.0 67.0 67.4 2009 ............................................................... 17.30 17.36 17.40 17.21 67.3 67.4 67.4 67.8 2010 ............................................................... 17.19 17.27 17.33 17.36 67.2 67.1 67.0 66.7
2011 ............................................................... 17.61 17.65 17.70 17.69 66.5 66.4 66.5 66.5 2012 ............................................................... 17.87 17.85 17.97 17.64 66.4 66.3 66.3 66.5 2013 ............................................................... 17.82 17.86 17.94 18.05 66.5 66.4 66.3 66.2 2014 ............................................................... 18.18 18.24 18.36 18.68 65.9 65.9 65.9 66.5 2015 ............................................................... 18.75 18.87 19.04 19.91 66.4 66.3 66.4 65.7 2016 ............................................................... 19.97 20.13 20.16 20.29 65.6 65.7 65.7 65.9 2017 ............................................................... 20.42 – – – 66.3 – – –
Total benefits 2006 ............................................................... – – – 8.20 – – – 33.8 2007 ............................................................... 8.25 8.28 8.28 8.32 33.7 33.6 33.5 33.6 2008 ............................................................... 8.28 8.37 8.39 8.33 33.2 33.0 33.0 32.6 2009 ............................................................... 8.40 8.38 8.40 8.17 32.7 32.6 32.6 32.2 2010 ............................................................... 8.38 8.48 8.52 8.67 32.8 32.9 33.0 33.3
2011 ............................................................... 8.86 8.93 8.90 8.93 33.5 33.6 33.5 33.5 2012 ............................................................... 9.03 9.06 9.14 8.87 33.6 33.7 33.7 33.5 2013 ............................................................... 8.97 9.03 9.13 9.24 33.5 33.6 33.7 33.8 2014 ............................................................... 9.42 9.42 9.49 9.40 34.1 34.1 34.1 33.5 2015 ............................................................... 9.47 9.58 9.61 10.37 33.6 33.7 33.6 34.3 2016 ............................................................... 10.46 10.52 10.54 10.52 34.4 34.3 34.3 34.1 2017 ............................................................... 10.38 – – – 33.7 – – –
Paid leave 2006 ............................................................... – – – 1.78 – – – 7.3 2007 ............................................................... 1.80 1.81 1.81 1.82 7.3 7.4 7.3 7.3 2008 ............................................................... 1.81 1.84 1.86 1.86 7.2 7.3 7.3 7.3 2009 ............................................................... 1.88 1.89 1.89 1.85 7.3 7.3 7.3 7.3 2010 ............................................................... 1.85 1.87 1.87 1.90 7.2 7.3 7.2 7.3
2011 ............................................................... 1.93 1.93 1.93 1.93 7.3 7.3 7.3 7.2 2012 ............................................................... 1.95 1.96 1.95 1.89 7.2 7.3 7.2 7.1 2013 ............................................................... 1.92 1.92 1.95 1.94 7.2 7.1 7.2 7.1 2014 ............................................................... 1.96 1.97 1.99 1.95 7.1 7.1 7.1 6.9 2015 ............................................................... 1.96 1.98 1.99 2.09 7.0 6.9 6.9 6.9 2016 ............................................................... 2.12 2.15 2.13 2.14 7.0 7.0 6.9 6.9 2017 ............................................................... 2.16 – – – 7.0 – – –
Supplemental pay 2006 ............................................................... – – – .87 – – – 3.6 2007 ............................................................... .91 .89 .87 .90 3.7 3.6 3.5 3.6 2008 ............................................................... .88 .89 .88 .84 3.5 3.5 3.5 3.3 2009 ............................................................... .78 .78 .78 .71 3.0 3.0 3.0 2.8 2010 ............................................................... .71 .71 .70 .68 2.8 2.7 2.7 2.6
2011 ............................................................... .77 .80 .79 .77 2.9 3.0 3.0 2.9 2012 ............................................................... .77 .77 .77 .73 2.9 2.8 2.8 2.8 2013 ............................................................... .74 .75 .77 .77 2.8 2.8 2.8 2.8 2014 ............................................................... .78 .79 .80 .86 2.8 2.9 2.9 3.0 2015 ............................................................... .83 .85 .85 1.03 2.9 3.0 3.0 3.4 2016 ............................................................... 1.00 1.01 1.04 1.04 3.3 3.3 3.4 3.4
See footnotes at end of table.
-37-

Supplemental table 2. Private manufacturing industry workers, by occupational group: employer costs per hoursworked for employee compensation and costs as a percentage of total compensation, 2006-2017 -- Continued
Office and administrative support occupations
Compensationcomponent
Cost per hour worked Percent of total compensation
Mar. June Sep. Dec. Mar. June Sep. Dec.
Supplemental pay 2017 ............................................................... 1.00 – – – 3.3 – – –
Insurance 2006 ............................................................... – – – 2.64 – – – 10.9 2007 ............................................................... 2.69 2.70 2.68 2.69 11.0 11.0 10.9 10.8 2008 ............................................................... 2.71 2.74 2.77 2.77 10.9 10.8 10.9 10.8 2009 ............................................................... 2.86 2.84 2.86 2.86 11.1 11.0 11.1 11.3 2010 ............................................................... 2.96 3.01 3.01 3.16 11.6 11.7 11.6 12.1
2011 ............................................................... 3.17 3.15 3.14 3.22 12.0 11.9 11.8 12.1 2012 ............................................................... 3.23 3.28 3.28 3.25 12.0 12.2 12.1 12.3 2013 ............................................................... 3.32 3.32 3.39 3.47 12.4 12.3 12.5 12.7 2014 ............................................................... 3.53 3.54 3.52 3.43 12.8 12.8 12.6 12.2 2015 ............................................................... 3.48 3.53 3.54 3.61 12.3 12.4 12.4 11.9 2016 ............................................................... 3.66 3.68 3.65 3.62 12.0 12.0 11.9 11.7 2017 ............................................................... 3.57 – – – 11.6 – – –
Retirement and savings 2006 ............................................................... – – – .96 – – – 3.9 2007 ............................................................... .88 .90 .94 .93 3.6 3.7 3.8 3.7 2008 ............................................................... .91 .90 .87 .85 3.6 3.6 3.4 3.3 2009 ............................................................... .87 .85 .85 .76 3.4 3.3 3.3 3.0 2010 ............................................................... .82 .83 .88 .87 3.2 3.2 3.4 3.3
2011 ............................................................... .86 .90 .89 .93 3.3 3.4 3.3 3.5 2012 ............................................................... .96 .94 .95 .86 3.6 3.5 3.5 3.2 2013 ............................................................... .86 .90 .88 .91 3.2 3.3 3.2 3.3 2014 ............................................................... .99 1.01 1.06 1.03 3.6 3.7 3.8 3.7 2015 ............................................................... 1.05 1.06 1.07 1.38 3.7 3.7 3.7 4.6 2016 ............................................................... 1.40 1.41 1.43 1.41 4.6 4.6 4.6 4.6 2017 ............................................................... 1.34 – – – 4.4 – – –
Legally required benefits 2006 ............................................................... – – – 1.95 – – – 8.0 2007 ............................................................... 1.97 1.97 1.98 1.99 8.0 8.0 8.0 8.0 2008 ............................................................... 1.98 1.99 2.01 2.01 7.9 7.9 7.9 7.9 2009 ............................................................... 2.02 2.02 2.02 2.00 7.8 7.8 7.8 7.9 2010 ............................................................... 2.04 2.06 2.07 2.06 8.0 8.0 8.0 7.9
2011 ............................................................... 2.13 2.15 2.14 2.09 8.0 8.1 8.0 7.8 2012 ............................................................... 2.12 2.12 2.19 2.14 7.9 7.9 8.1 8.1 2013 ............................................................... 2.14 2.14 2.15 2.14 8.0 8.0 7.9 7.9 2014 ............................................................... 2.16 2.12 2.11 2.14 7.8 7.7 7.6 7.6 2015 ............................................................... 2.15 2.16 2.17 2.27 7.6 7.6 7.6 7.5 2016 ............................................................... 2.28 2.29 2.29 2.30 7.5 7.5 7.5 7.5 2017 ............................................................... 2.31 – – – 7.5 – – –
Note: The sum of individual items may not equal totals due to rounding. Dashes indicate data are not available.
-38-
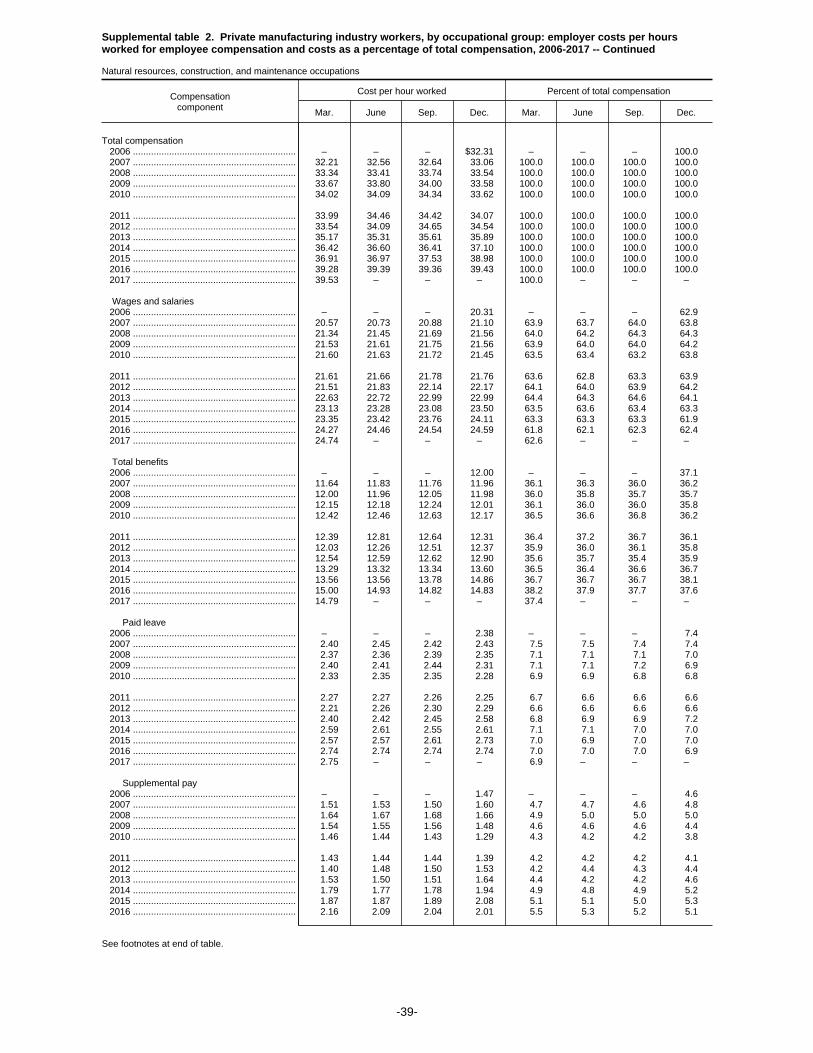
Supplemental table 2. Private manufacturing industry workers, by occupational group: employer costs per hoursworked for employee compensation and costs as a percentage of total compensation, 2006-2017 -- Continued
Natural resources, construction, and maintenance occupations
Compensationcomponent
Cost per hour worked Percent of total compensation
Mar. June Sep. Dec. Mar. June Sep. Dec.
Total compensation 2006 ............................................................... – – – $32.31 – – – 100.0 2007 ............................................................... 32.21 32.56 32.64 33.06 100.0 100.0 100.0 100.0 2008 ............................................................... 33.34 33.41 33.74 33.54 100.0 100.0 100.0 100.0 2009 ............................................................... 33.67 33.80 34.00 33.58 100.0 100.0 100.0 100.0 2010 ............................................................... 34.02 34.09 34.34 33.62 100.0 100.0 100.0 100.0
2011 ............................................................... 33.99 34.46 34.42 34.07 100.0 100.0 100.0 100.0 2012 ............................................................... 33.54 34.09 34.65 34.54 100.0 100.0 100.0 100.0 2013 ............................................................... 35.17 35.31 35.61 35.89 100.0 100.0 100.0 100.0 2014 ............................................................... 36.42 36.60 36.41 37.10 100.0 100.0 100.0 100.0 2015 ............................................................... 36.91 36.97 37.53 38.98 100.0 100.0 100.0 100.0 2016 ............................................................... 39.28 39.39 39.36 39.43 100.0 100.0 100.0 100.0 2017 ............................................................... 39.53 – – – 100.0 – – –
Wages and salaries 2006 ............................................................... – – – 20.31 – – – 62.9 2007 ............................................................... 20.57 20.73 20.88 21.10 63.9 63.7 64.0 63.8 2008 ............................................................... 21.34 21.45 21.69 21.56 64.0 64.2 64.3 64.3 2009 ............................................................... 21.53 21.61 21.75 21.56 63.9 64.0 64.0 64.2 2010 ............................................................... 21.60 21.63 21.72 21.45 63.5 63.4 63.2 63.8
2011 ............................................................... 21.61 21.66 21.78 21.76 63.6 62.8 63.3 63.9 2012 ............................................................... 21.51 21.83 22.14 22.17 64.1 64.0 63.9 64.2 2013 ............................................................... 22.63 22.72 22.99 22.99 64.4 64.3 64.6 64.1 2014 ............................................................... 23.13 23.28 23.08 23.50 63.5 63.6 63.4 63.3 2015 ............................................................... 23.35 23.42 23.76 24.11 63.3 63.3 63.3 61.9 2016 ............................................................... 24.27 24.46 24.54 24.59 61.8 62.1 62.3 62.4 2017 ............................................................... 24.74 – – – 62.6 – – –
Total benefits 2006 ............................................................... – – – 12.00 – – – 37.1 2007 ............................................................... 11.64 11.83 11.76 11.96 36.1 36.3 36.0 36.2 2008 ............................................................... 12.00 11.96 12.05 11.98 36.0 35.8 35.7 35.7 2009 ............................................................... 12.15 12.18 12.24 12.01 36.1 36.0 36.0 35.8 2010 ............................................................... 12.42 12.46 12.63 12.17 36.5 36.6 36.8 36.2
2011 ............................................................... 12.39 12.81 12.64 12.31 36.4 37.2 36.7 36.1 2012 ............................................................... 12.03 12.26 12.51 12.37 35.9 36.0 36.1 35.8 2013 ............................................................... 12.54 12.59 12.62 12.90 35.6 35.7 35.4 35.9 2014 ............................................................... 13.29 13.32 13.34 13.60 36.5 36.4 36.6 36.7 2015 ............................................................... 13.56 13.56 13.78 14.86 36.7 36.7 36.7 38.1 2016 ............................................................... 15.00 14.93 14.82 14.83 38.2 37.9 37.7 37.6 2017 ............................................................... 14.79 – – – 37.4 – – –
Paid leave 2006 ............................................................... – – – 2.38 – – – 7.4 2007 ............................................................... 2.40 2.45 2.42 2.43 7.5 7.5 7.4 7.4 2008 ............................................................... 2.37 2.36 2.39 2.35 7.1 7.1 7.1 7.0 2009 ............................................................... 2.40 2.41 2.44 2.31 7.1 7.1 7.2 6.9 2010 ............................................................... 2.33 2.35 2.35 2.28 6.9 6.9 6.8 6.8
2011 ............................................................... 2.27 2.27 2.26 2.25 6.7 6.6 6.6 6.6 2012 ............................................................... 2.21 2.26 2.30 2.29 6.6 6.6 6.6 6.6 2013 ............................................................... 2.40 2.42 2.45 2.58 6.8 6.9 6.9 7.2 2014 ............................................................... 2.59 2.61 2.55 2.61 7.1 7.1 7.0 7.0 2015 ............................................................... 2.57 2.57 2.61 2.73 7.0 6.9 7.0 7.0 2016 ............................................................... 2.74 2.74 2.74 2.74 7.0 7.0 7.0 6.9 2017 ............................................................... 2.75 – – – 6.9 – – –
Supplemental pay 2006 ............................................................... – – – 1.47 – – – 4.6 2007 ............................................................... 1.51 1.53 1.50 1.60 4.7 4.7 4.6 4.8 2008 ............................................................... 1.64 1.67 1.68 1.66 4.9 5.0 5.0 5.0 2009 ............................................................... 1.54 1.55 1.56 1.48 4.6 4.6 4.6 4.4 2010 ............................................................... 1.46 1.44 1.43 1.29 4.3 4.2 4.2 3.8
2011 ............................................................... 1.43 1.44 1.44 1.39 4.2 4.2 4.2 4.1 2012 ............................................................... 1.40 1.48 1.50 1.53 4.2 4.4 4.3 4.4 2013 ............................................................... 1.53 1.50 1.51 1.64 4.4 4.2 4.2 4.6 2014 ............................................................... 1.79 1.77 1.78 1.94 4.9 4.8 4.9 5.2 2015 ............................................................... 1.87 1.87 1.89 2.08 5.1 5.1 5.0 5.3 2016 ............................................................... 2.16 2.09 2.04 2.01 5.5 5.3 5.2 5.1
See footnotes at end of table.
-39-
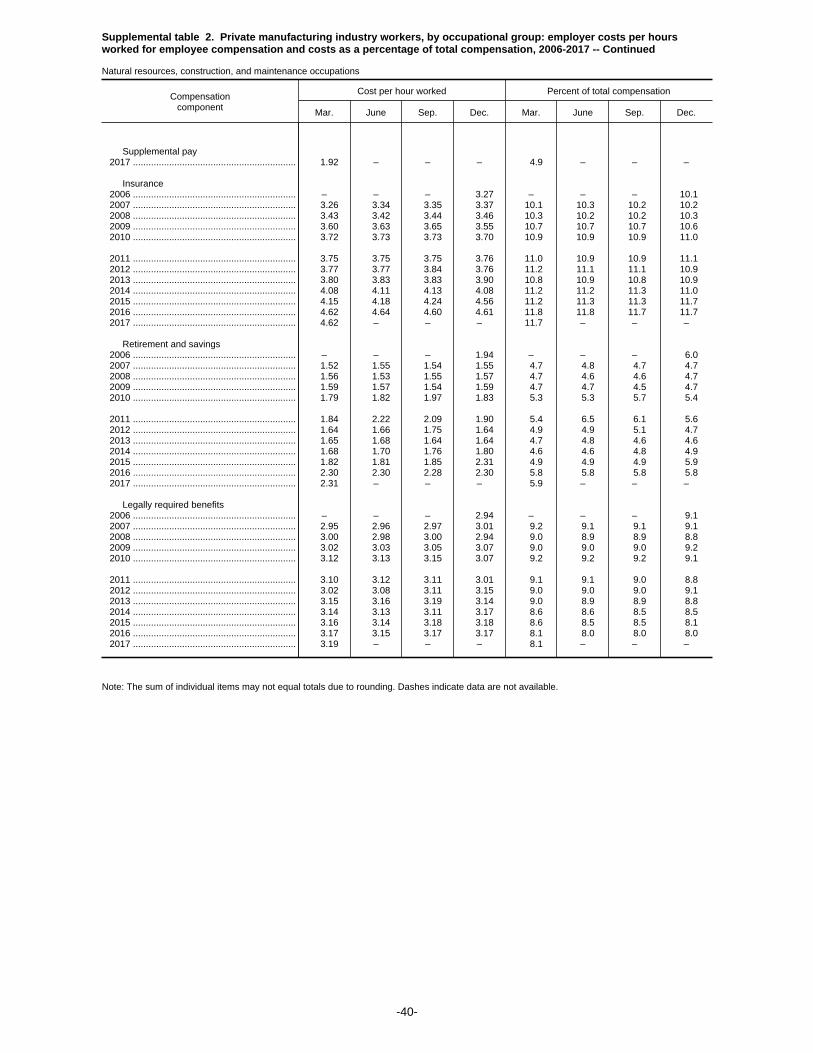
Supplemental table 2. Private manufacturing industry workers, by occupational group: employer costs per hoursworked for employee compensation and costs as a percentage of total compensation, 2006-2017 -- Continued
Natural resources, construction, and maintenance occupations
Compensationcomponent
Cost per hour worked Percent of total compensation
Mar. June Sep. Dec. Mar. June Sep. Dec.
Supplemental pay 2017 ............................................................... 1.92 – – – 4.9 – – –
Insurance 2006 ............................................................... – – – 3.27 – – – 10.1 2007 ............................................................... 3.26 3.34 3.35 3.37 10.1 10.3 10.2 10.2 2008 ............................................................... 3.43 3.42 3.44 3.46 10.3 10.2 10.2 10.3 2009 ............................................................... 3.60 3.63 3.65 3.55 10.7 10.7 10.7 10.6 2010 ............................................................... 3.72 3.73 3.73 3.70 10.9 10.9 10.9 11.0
2011 ............................................................... 3.75 3.75 3.75 3.76 11.0 10.9 10.9 11.1 2012 ............................................................... 3.77 3.77 3.84 3.76 11.2 11.1 11.1 10.9 2013 ............................................................... 3.80 3.83 3.83 3.90 10.8 10.9 10.8 10.9 2014 ............................................................... 4.08 4.11 4.13 4.08 11.2 11.2 11.3 11.0 2015 ............................................................... 4.15 4.18 4.24 4.56 11.2 11.3 11.3 11.7 2016 ............................................................... 4.62 4.64 4.60 4.61 11.8 11.8 11.7 11.7 2017 ............................................................... 4.62 – – – 11.7 – – –
Retirement and savings 2006 ............................................................... – – – 1.94 – – – 6.0 2007 ............................................................... 1.52 1.55 1.54 1.55 4.7 4.8 4.7 4.7 2008 ............................................................... 1.56 1.53 1.55 1.57 4.7 4.6 4.6 4.7 2009 ............................................................... 1.59 1.57 1.54 1.59 4.7 4.7 4.5 4.7 2010 ............................................................... 1.79 1.82 1.97 1.83 5.3 5.3 5.7 5.4
2011 ............................................................... 1.84 2.22 2.09 1.90 5.4 6.5 6.1 5.6 2012 ............................................................... 1.64 1.66 1.75 1.64 4.9 4.9 5.1 4.7 2013 ............................................................... 1.65 1.68 1.64 1.64 4.7 4.8 4.6 4.6 2014 ............................................................... 1.68 1.70 1.76 1.80 4.6 4.6 4.8 4.9 2015 ............................................................... 1.82 1.81 1.85 2.31 4.9 4.9 4.9 5.9 2016 ............................................................... 2.30 2.30 2.28 2.30 5.8 5.8 5.8 5.8 2017 ............................................................... 2.31 – – – 5.9 – – –
Legally required benefits 2006 ............................................................... – – – 2.94 – – – 9.1 2007 ............................................................... 2.95 2.96 2.97 3.01 9.2 9.1 9.1 9.1 2008 ............................................................... 3.00 2.98 3.00 2.94 9.0 8.9 8.9 8.8 2009 ............................................................... 3.02 3.03 3.05 3.07 9.0 9.0 9.0 9.2 2010 ............................................................... 3.12 3.13 3.15 3.07 9.2 9.2 9.2 9.1
2011 ............................................................... 3.10 3.12 3.11 3.01 9.1 9.1 9.0 8.8 2012 ............................................................... 3.02 3.08 3.11 3.15 9.0 9.0 9.0 9.1 2013 ............................................................... 3.15 3.16 3.19 3.14 9.0 8.9 8.9 8.8 2014 ............................................................... 3.14 3.13 3.11 3.17 8.6 8.6 8.5 8.5 2015 ............................................................... 3.16 3.14 3.18 3.18 8.6 8.5 8.5 8.1 2016 ............................................................... 3.17 3.15 3.17 3.17 8.1 8.0 8.0 8.0 2017 ............................................................... 3.19 – – – 8.1 – – –
Note: The sum of individual items may not equal totals due to rounding. Dashes indicate data are not available.
-40-

Supplemental table 2. Private manufacturing industry workers, by occupational group: employer costs per hoursworked for employee compensation and costs as a percentage of total compensation, 2006-2017 -- Continued
Installation, maintenance, and repair occupations
Compensationcomponent
Cost per hour worked Percent of total compensation
Mar. June Sep. Dec. Mar. June Sep. Dec.
Total compensation 2006 ............................................................... – – – $33.17 – – – 100.0 2007 ............................................................... 33.07 33.38 33.41 33.97 100.0 100.0 100.0 100.0 2008 ............................................................... 34.22 34.30 34.67 34.40 100.0 100.0 100.0 100.0 2009 ............................................................... 34.55 34.70 34.85 34.01 100.0 100.0 100.0 100.0 2010 ............................................................... 34.50 34.63 34.81 34.18 100.0 100.0 100.0 100.0
2011 ............................................................... 34.59 35.19 35.14 34.67 100.0 100.0 100.0 100.0 2012 ............................................................... 34.00 34.69 35.38 34.54 100.0 100.0 100.0 100.0 2013 ............................................................... 35.37 35.55 35.77 36.85 100.0 100.0 100.0 100.0 2014 ............................................................... 37.48 37.70 37.47 37.94 100.0 100.0 100.0 100.0 2015 ............................................................... 37.66 37.77 38.12 39.40 100.0 100.0 100.0 100.0 2016 ............................................................... 39.64 39.74 39.70 39.76 100.0 100.0 100.0 100.0 2017 ............................................................... 39.88 – – – 100.0 – – –
Wages and salaries 2006 ............................................................... – – – 20.66 – – – 62.3 2007 ............................................................... 20.93 21.07 21.23 21.55 63.3 63.1 63.5 63.4 2008 ............................................................... 21.73 21.83 22.10 22.04 63.5 63.7 63.8 64.1 2009 ............................................................... 22.04 22.11 22.23 21.94 63.8 63.7 63.8 64.5 2010 ............................................................... 22.02 22.05 22.13 21.84 63.8 63.7 63.6 63.9
2011 ............................................................... 21.98 22.10 22.21 22.16 63.5 62.8 63.2 63.9 2012 ............................................................... 21.87 22.31 22.69 22.37 64.3 64.3 64.1 64.8 2013 ............................................................... 23.00 23.11 23.38 23.61 65.0 65.0 65.4 64.1 2014 ............................................................... 23.79 23.97 23.70 24.03 63.5 63.6 63.3 63.3 2015 ............................................................... 23.84 23.93 24.14 24.38 63.3 63.4 63.3 61.9 2016 ............................................................... 24.50 24.68 24.77 24.82 61.8 62.1 62.4 62.4 2017 ............................................................... 24.99 – – – 62.7 – – –
Total benefits 2006 ............................................................... – – – 12.52 – – – 37.7 2007 ............................................................... 12.14 12.30 12.18 12.42 36.7 36.9 36.5 36.6 2008 ............................................................... 12.49 12.46 12.57 12.36 36.5 36.3 36.2 35.9 2009 ............................................................... 12.51 12.59 12.61 12.07 36.2 36.3 36.2 35.5 2010 ............................................................... 12.48 12.57 12.68 12.34 36.2 36.3 36.4 36.1
2011 ............................................................... 12.61 13.09 12.93 12.51 36.5 37.2 36.8 36.1 2012 ............................................................... 12.14 12.38 12.69 12.17 35.7 35.7 35.9 35.2 2013 ............................................................... 12.36 12.44 12.39 13.24 35.0 35.0 34.6 35.9 2014 ............................................................... 13.69 13.74 13.76 13.91 36.5 36.4 36.7 36.7 2015 ............................................................... 13.82 13.84 13.98 15.02 36.7 36.6 36.7 38.1 2016 ............................................................... 15.13 15.06 14.93 14.94 38.2 37.9 37.6 37.6 2017 ............................................................... 14.89 – – – 37.3 – – –
Paid leave 2006 ............................................................... – – – 2.56 – – – 7.7 2007 ............................................................... 2.59 2.63 2.59 2.62 7.8 7.9 7.7 7.7 2008 ............................................................... 2.55 2.56 2.59 2.53 7.5 7.5 7.5 7.4 2009 ............................................................... 2.58 2.59 2.61 2.51 7.5 7.5 7.5 7.4 2010 ............................................................... 2.53 2.56 2.56 2.50 7.3 7.4 7.4 7.3
2011 ............................................................... 2.49 2.50 2.49 2.47 7.2 7.1 7.1 7.1 2012 ............................................................... 2.41 2.49 2.54 2.46 7.1 7.2 7.2 7.1 2013 ............................................................... 2.59 2.61 2.62 2.72 7.3 7.3 7.3 7.4 2014 ............................................................... 2.74 2.77 2.70 2.74 7.3 7.3 7.2 7.2 2015 ............................................................... 2.68 2.68 2.70 2.80 7.1 7.1 7.1 7.1 2016 ............................................................... 2.82 2.81 2.81 2.81 7.1 7.1 7.1 7.1 2017 ............................................................... 2.82 – – – 7.1 – – –
Supplemental pay 2006 ............................................................... – – – 1.47 – – – 4.4 2007 ............................................................... 1.50 1.52 1.46 1.54 4.5 4.6 4.4 4.5 2008 ............................................................... 1.60 1.63 1.63 1.60 4.7 4.7 4.7 4.7 2009 ............................................................... 1.51 1.54 1.55 1.50 4.4 4.4 4.5 4.4 2010 ............................................................... 1.48 1.47 1.45 1.36 4.3 4.3 4.2 4.0
2011 ............................................................... 1.52 1.54 1.54 1.47 4.4 4.4 4.4 4.2 2012 ............................................................... 1.48 1.56 1.58 1.53 4.4 4.5 4.5 4.4 2013 ............................................................... 1.51 1.49 1.49 1.62 4.3 4.2 4.2 4.4 2014 ............................................................... 1.80 1.80 1.83 1.97 4.8 4.8 4.9 5.2 2015 ............................................................... 1.88 1.87 1.88 2.14 5.0 5.0 4.9 5.4 2016 ............................................................... 2.20 2.11 2.06 2.04 5.6 5.3 5.2 5.1
See footnotes at end of table.
-41-

Supplemental table 2. Private manufacturing industry workers, by occupational group: employer costs per hoursworked for employee compensation and costs as a percentage of total compensation, 2006-2017 -- Continued
Installation, maintenance, and repair occupations
Compensationcomponent
Cost per hour worked Percent of total compensation
Mar. June Sep. Dec. Mar. June Sep. Dec.
Supplemental pay 2017 ............................................................... 1.96 – – – 4.9 – – –
Insurance 2006 ............................................................... – – – 3.50 – – – 10.5 2007 ............................................................... 3.48 3.55 3.55 3.59 10.5 10.6 10.6 10.6 2008 ............................................................... 3.67 3.67 3.70 3.71 10.7 10.7 10.7 10.8 2009 ............................................................... 3.83 3.88 3.88 3.67 11.1 11.2 11.1 10.8 2010 ............................................................... 3.82 3.84 3.80 3.83 11.1 11.1 10.9 11.2
2011 ............................................................... 3.91 3.89 3.88 3.91 11.3 11.1 11.1 11.3 2012 ............................................................... 3.93 3.92 4.01 3.80 11.6 11.3 11.3 11.0 2013 ............................................................... 3.82 3.85 3.82 4.05 10.8 10.8 10.7 11.0 2014 ............................................................... 4.24 4.27 4.30 4.19 11.3 11.3 11.5 11.1 2015 ............................................................... 4.27 4.30 4.35 4.61 11.3 11.4 11.4 11.7 2016 ............................................................... 4.67 4.70 4.65 4.66 11.8 11.8 11.7 11.7 2017 ............................................................... 4.66 – – – 11.7 – – –
Retirement and savings 2006 ............................................................... – – – 2.10 – – – 6.3 2007 ............................................................... 1.68 1.69 1.66 1.69 5.1 5.1 5.0 5.0 2008 ............................................................... 1.70 1.67 1.69 1.63 5.0 4.9 4.9 4.7 2009 ............................................................... 1.66 1.62 1.59 1.45 4.8 4.7 4.6 4.3 2010 ............................................................... 1.66 1.70 1.84 1.71 4.8 4.9 5.3 5.0
2011 ............................................................... 1.69 2.14 2.01 1.75 4.9 6.1 5.7 5.0 2012 ............................................................... 1.40 1.41 1.53 1.37 4.1 4.1 4.3 4.0 2013 ............................................................... 1.40 1.45 1.37 1.71 4.0 4.1 3.8 4.6 2014 ............................................................... 1.74 1.74 1.81 1.83 4.6 4.6 4.8 4.8 2015 ............................................................... 1.84 1.84 1.87 2.32 4.9 4.9 4.9 5.9 2016 ............................................................... 2.29 2.30 2.27 2.29 5.8 5.8 5.7 5.7 2017 ............................................................... 2.30 – – – 5.8 – – –
Legally required benefits 2006 ............................................................... – – – 2.89 – – – 8.7 2007 ............................................................... 2.90 2.91 2.91 2.97 8.8 8.7 8.7 8.8 2008 ............................................................... 2.96 2.94 2.95 2.89 8.7 8.6 8.5 8.4 2009 ............................................................... 2.94 2.96 2.98 2.94 8.5 8.5 8.6 8.6 2010 ............................................................... 2.98 3.00 3.02 2.95 8.6 8.7 8.7 8.6
2011 ............................................................... 2.99 3.01 3.00 2.92 8.6 8.6 8.5 8.4 2012 ............................................................... 2.91 2.99 3.04 3.00 8.6 8.6 8.6 8.7 2013 ............................................................... 3.04 3.05 3.08 3.14 8.6 8.6 8.6 8.5 2014 ............................................................... 3.16 3.16 3.13 3.18 8.4 8.4 8.3 8.4 2015 ............................................................... 3.16 3.14 3.18 3.16 8.4 8.3 8.3 8.0 2016 ............................................................... 3.15 3.13 3.14 3.14 8.0 7.9 7.9 7.9 2017 ............................................................... 3.15 – – – 7.9 – – –
Note: The sum of individual items may not equal totals due to rounding. Dashes indicate data are not available.
-42-
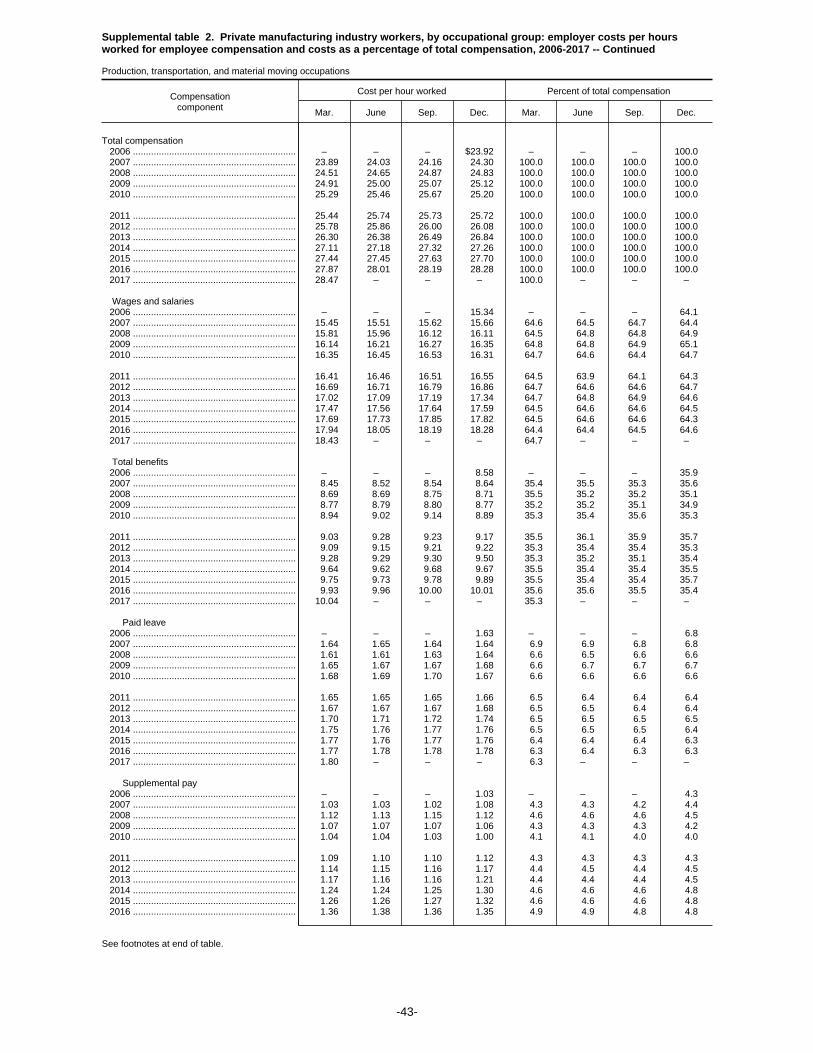
Supplemental table 2. Private manufacturing industry workers, by occupational group: employer costs per hoursworked for employee compensation and costs as a percentage of total compensation, 2006-2017 -- Continued
Production, transportation, and material moving occupations
Compensationcomponent
Cost per hour worked Percent of total compensation
Mar. June Sep. Dec. Mar. June Sep. Dec.
Total compensation 2006 ............................................................... – – – $23.92 – – – 100.0 2007 ............................................................... 23.89 24.03 24.16 24.30 100.0 100.0 100.0 100.0 2008 ............................................................... 24.51 24.65 24.87 24.83 100.0 100.0 100.0 100.0 2009 ............................................................... 24.91 25.00 25.07 25.12 100.0 100.0 100.0 100.0 2010 ............................................................... 25.29 25.46 25.67 25.20 100.0 100.0 100.0 100.0
2011 ............................................................... 25.44 25.74 25.73 25.72 100.0 100.0 100.0 100.0 2012 ............................................................... 25.78 25.86 26.00 26.08 100.0 100.0 100.0 100.0 2013 ............................................................... 26.30 26.38 26.49 26.84 100.0 100.0 100.0 100.0 2014 ............................................................... 27.11 27.18 27.32 27.26 100.0 100.0 100.0 100.0 2015 ............................................................... 27.44 27.45 27.63 27.70 100.0 100.0 100.0 100.0 2016 ............................................................... 27.87 28.01 28.19 28.28 100.0 100.0 100.0 100.0 2017 ............................................................... 28.47 – – – 100.0 – – –
Wages and salaries 2006 ............................................................... – – – 15.34 – – – 64.1 2007 ............................................................... 15.45 15.51 15.62 15.66 64.6 64.5 64.7 64.4 2008 ............................................................... 15.81 15.96 16.12 16.11 64.5 64.8 64.8 64.9 2009 ............................................................... 16.14 16.21 16.27 16.35 64.8 64.8 64.9 65.1 2010 ............................................................... 16.35 16.45 16.53 16.31 64.7 64.6 64.4 64.7
2011 ............................................................... 16.41 16.46 16.51 16.55 64.5 63.9 64.1 64.3 2012 ............................................................... 16.69 16.71 16.79 16.86 64.7 64.6 64.6 64.7 2013 ............................................................... 17.02 17.09 17.19 17.34 64.7 64.8 64.9 64.6 2014 ............................................................... 17.47 17.56 17.64 17.59 64.5 64.6 64.6 64.5 2015 ............................................................... 17.69 17.73 17.85 17.82 64.5 64.6 64.6 64.3 2016 ............................................................... 17.94 18.05 18.19 18.28 64.4 64.4 64.5 64.6 2017 ............................................................... 18.43 – – – 64.7 – – –
Total benefits 2006 ............................................................... – – – 8.58 – – – 35.9 2007 ............................................................... 8.45 8.52 8.54 8.64 35.4 35.5 35.3 35.6 2008 ............................................................... 8.69 8.69 8.75 8.71 35.5 35.2 35.2 35.1 2009 ............................................................... 8.77 8.79 8.80 8.77 35.2 35.2 35.1 34.9 2010 ............................................................... 8.94 9.02 9.14 8.89 35.3 35.4 35.6 35.3
2011 ............................................................... 9.03 9.28 9.23 9.17 35.5 36.1 35.9 35.7 2012 ............................................................... 9.09 9.15 9.21 9.22 35.3 35.4 35.4 35.3 2013 ............................................................... 9.28 9.29 9.30 9.50 35.3 35.2 35.1 35.4 2014 ............................................................... 9.64 9.62 9.68 9.67 35.5 35.4 35.4 35.5 2015 ............................................................... 9.75 9.73 9.78 9.89 35.5 35.4 35.4 35.7 2016 ............................................................... 9.93 9.96 10.00 10.01 35.6 35.6 35.5 35.4 2017 ............................................................... 10.04 – – – 35.3 – – –
Paid leave 2006 ............................................................... – – – 1.63 – – – 6.8 2007 ............................................................... 1.64 1.65 1.64 1.64 6.9 6.9 6.8 6.8 2008 ............................................................... 1.61 1.61 1.63 1.64 6.6 6.5 6.6 6.6 2009 ............................................................... 1.65 1.67 1.67 1.68 6.6 6.7 6.7 6.7 2010 ............................................................... 1.68 1.69 1.70 1.67 6.6 6.6 6.6 6.6
2011 ............................................................... 1.65 1.65 1.65 1.66 6.5 6.4 6.4 6.4 2012 ............................................................... 1.67 1.67 1.67 1.68 6.5 6.5 6.4 6.4 2013 ............................................................... 1.70 1.71 1.72 1.74 6.5 6.5 6.5 6.5 2014 ............................................................... 1.75 1.76 1.77 1.76 6.5 6.5 6.5 6.4 2015 ............................................................... 1.77 1.76 1.77 1.76 6.4 6.4 6.4 6.3 2016 ............................................................... 1.77 1.78 1.78 1.78 6.3 6.4 6.3 6.3 2017 ............................................................... 1.80 – – – 6.3 – – –
Supplemental pay 2006 ............................................................... – – – 1.03 – – – 4.3 2007 ............................................................... 1.03 1.03 1.02 1.08 4.3 4.3 4.2 4.4 2008 ............................................................... 1.12 1.13 1.15 1.12 4.6 4.6 4.6 4.5 2009 ............................................................... 1.07 1.07 1.07 1.06 4.3 4.3 4.3 4.2 2010 ............................................................... 1.04 1.04 1.03 1.00 4.1 4.1 4.0 4.0
2011 ............................................................... 1.09 1.10 1.10 1.12 4.3 4.3 4.3 4.3 2012 ............................................................... 1.14 1.15 1.16 1.17 4.4 4.5 4.4 4.5 2013 ............................................................... 1.17 1.16 1.16 1.21 4.4 4.4 4.4 4.5 2014 ............................................................... 1.24 1.24 1.25 1.30 4.6 4.6 4.6 4.8 2015 ............................................................... 1.26 1.26 1.27 1.32 4.6 4.6 4.6 4.8 2016 ............................................................... 1.36 1.38 1.36 1.35 4.9 4.9 4.8 4.8
See footnotes at end of table.
-43-

Supplemental table 2. Private manufacturing industry workers, by occupational group: employer costs per hoursworked for employee compensation and costs as a percentage of total compensation, 2006-2017 -- Continued
Production, transportation, and material moving occupations
Compensationcomponent
Cost per hour worked Percent of total compensation
Mar. June Sep. Dec. Mar. June Sep. Dec.
Supplemental pay 2017 ............................................................... 1.32 – – – 4.6 – – –
Insurance 2006 ............................................................... – – – 2.71 – – – 11.3 2007 ............................................................... 2.74 2.80 2.81 2.84 11.5 11.7 11.6 11.7 2008 ............................................................... 2.89 2.89 2.89 2.87 11.8 11.7 11.6 11.6 2009 ............................................................... 2.99 3.00 2.99 2.99 12.0 12.0 11.9 11.9 2010 ............................................................... 3.07 3.10 3.13 3.05 12.1 12.2 12.2 12.1
2011 ............................................................... 3.07 3.10 3.10 3.05 12.1 12.0 12.0 11.9 2012 ............................................................... 3.09 3.12 3.15 3.14 12.0 12.1 12.1 12.0 2013 ............................................................... 3.17 3.18 3.17 3.24 12.1 12.0 12.0 12.1 2014 ............................................................... 3.28 3.29 3.30 3.21 12.1 12.1 12.1 11.8 2015 ............................................................... 3.30 3.30 3.31 3.33 12.0 12.0 12.0 12.0 2016 ............................................................... 3.34 3.36 3.40 3.39 12.0 12.0 12.1 12.0 2017 ............................................................... 3.41 – – – 12.0 – – –
Retirement and savings 2006 ............................................................... – – – .95 – – – 4.0 2007 ............................................................... .78 .79 .80 .81 3.3 3.3 3.3 3.3 2008 ............................................................... .81 .79 .79 .81 3.3 3.2 3.2 3.3 2009 ............................................................... .79 .78 .76 .74 3.2 3.1 3.0 3.0 2010 ............................................................... .83 .84 .90 .85 3.3 3.3 3.5 3.4
2011 ............................................................... .86 1.06 1.02 1.00 3.4 4.1 4.0 3.9 2012 ............................................................... .81 .81 .83 .81 3.1 3.1 3.2 3.1 2013 ............................................................... .83 .83 .81 .85 3.1 3.1 3.1 3.2 2014 ............................................................... .91 .89 .92 .95 3.3 3.3 3.4 3.5 2015 ............................................................... .96 .95 .97 1.02 3.5 3.5 3.5 3.7 2016 ............................................................... 1.01 1.02 1.01 1.03 3.6 3.6 3.6 3.6 2017 ............................................................... 1.03 – – – 3.6 – – –
Legally required benefits 2006 ............................................................... – – – 2.26 – – – 9.5 2007 ............................................................... 2.26 2.25 2.26 2.27 9.4 9.4 9.4 9.3 2008 ............................................................... 2.26 2.26 2.28 2.27 9.2 9.2 9.2 9.1 2009 ............................................................... 2.28 2.29 2.30 2.29 9.1 9.1 9.2 9.1 2010 ............................................................... 2.33 2.35 2.37 2.32 9.2 9.2 9.2 9.2
2011 ............................................................... 2.36 2.37 2.37 2.34 9.3 9.2 9.2 9.1 2012 ............................................................... 2.38 2.40 2.41 2.41 9.2 9.3 9.3 9.3 2013 ............................................................... 2.41 2.42 2.43 2.46 9.2 9.2 9.2 9.2 2014 ............................................................... 2.46 2.44 2.45 2.46 9.1 9.0 9.0 9.0 2015 ............................................................... 2.47 2.46 2.47 2.45 9.0 8.9 8.9 8.9 2016 ............................................................... 2.45 2.43 2.45 2.46 8.8 8.7 8.7 8.7 2017 ............................................................... 2.48 – – – 8.7 – – –
Note: The sum of individual items may not equal totals due to rounding. Dashes indicate data are not available.
-44-

Supplemental table 2. Private manufacturing industry workers, by occupational group: employer costs per hoursworked for employee compensation and costs as a percentage of total compensation, 2006-2017 -- Continued
Production occupations
Compensationcomponent
Cost per hour worked Percent of total compensation
Mar. June Sep. Dec. Mar. June Sep. Dec.
Total compensation 2006 ............................................................... – – – $24.46 – – – 100.0 2007 ............................................................... 24.42 24.55 24.68 24.79 100.0 100.0 100.0 100.0 2008 ............................................................... 24.98 25.14 25.39 25.28 100.0 100.0 100.0 100.0 2009 ............................................................... 25.42 25.52 25.57 25.66 100.0 100.0 100.0 100.0 2010 ............................................................... 25.83 26.02 26.21 25.77 100.0 100.0 100.0 100.0
2011 ............................................................... 26.02 26.37 26.38 26.18 100.0 100.0 100.0 100.0 2012 ............................................................... 26.20 26.28 26.42 26.51 100.0 100.0 100.0 100.0 2013 ............................................................... 26.75 26.82 26.89 27.17 100.0 100.0 100.0 100.0 2014 ............................................................... 27.44 27.51 27.65 27.49 100.0 100.0 100.0 100.0 2015 ............................................................... 27.67 27.67 27.83 27.86 100.0 100.0 100.0 100.0 2016 ............................................................... 28.07 28.23 28.41 28.48 100.0 100.0 100.0 100.0 2017 ............................................................... 28.65 – – – 100.0 – – –
Wages and salaries 2006 ............................................................... – – – 15.70 – – – 64.2 2007 ............................................................... 15.81 15.87 15.98 15.99 64.7 64.6 64.8 64.5 2008 ............................................................... 16.14 16.31 16.49 16.45 64.6 64.9 64.9 65.1 2009 ............................................................... 16.50 16.58 16.62 16.74 64.9 65.0 65.0 65.2 2010 ............................................................... 16.73 16.84 16.91 16.72 64.8 64.7 64.5 64.9
2011 ............................................................... 16.82 16.86 16.92 16.86 64.6 64.0 64.1 64.4 2012 ............................................................... 17.00 17.02 17.10 17.17 64.9 64.8 64.7 64.8 2013 ............................................................... 17.34 17.42 17.50 17.61 64.8 65.0 65.1 64.8 2014 ............................................................... 17.74 17.83 17.91 17.81 64.7 64.8 64.8 64.8 2015 ............................................................... 17.90 17.93 18.05 17.97 64.7 64.8 64.8 64.5 2016 ............................................................... 18.11 18.23 18.37 18.45 64.5 64.6 64.7 64.8 2017 ............................................................... 18.60 – – – 64.9 – – –
Total benefits 2006 ............................................................... – – – 8.76 – – – 35.8 2007 ............................................................... 8.61 8.68 8.69 8.80 35.3 35.4 35.2 35.5 2008 ............................................................... 8.84 8.83 8.91 8.83 35.4 35.1 35.1 34.9 2009 ............................................................... 8.91 8.94 8.95 8.92 35.1 35.0 35.0 34.8 2010 ............................................................... 9.10 9.18 9.30 9.05 35.2 35.3 35.5 35.1
2011 ............................................................... 9.20 9.50 9.46 9.32 35.4 36.0 35.9 35.6 2012 ............................................................... 9.20 9.26 9.32 9.34 35.1 35.2 35.3 35.2 2013 ............................................................... 9.40 9.40 9.39 9.56 35.2 35.0 34.9 35.2 2014 ............................................................... 9.70 9.68 9.74 9.69 35.3 35.2 35.2 35.2 2015 ............................................................... 9.77 9.74 9.78 9.89 35.3 35.2 35.2 35.5 2016 ............................................................... 9.96 10.00 10.04 10.03 35.5 35.4 35.3 35.2 2017 ............................................................... 10.05 – – – 35.1 – – –
Paid leave 2006 ............................................................... – – – 1.69 – – – 6.9 2007 ............................................................... 1.70 1.71 1.70 1.70 7.0 7.0 6.9 6.9 2008 ............................................................... 1.66 1.67 1.69 1.70 6.7 6.6 6.7 6.7 2009 ............................................................... 1.72 1.73 1.73 1.74 6.8 6.8 6.8 6.8 2010 ............................................................... 1.74 1.76 1.77 1.73 6.7 6.7 6.7 6.7
2011 ............................................................... 1.71 1.72 1.72 1.71 6.6 6.5 6.5 6.5 2012 ............................................................... 1.73 1.72 1.72 1.73 6.6 6.6 6.5 6.5 2013 ............................................................... 1.75 1.76 1.76 1.78 6.5 6.6 6.6 6.6 2014 ............................................................... 1.80 1.80 1.81 1.79 6.5 6.6 6.6 6.5 2015 ............................................................... 1.80 1.80 1.81 1.79 6.5 6.5 6.5 6.4 2016 ............................................................... 1.80 1.81 1.82 1.81 6.4 6.4 6.4 6.4 2017 ............................................................... 1.83 – – – 6.4 – – –
Supplemental pay 2006 ............................................................... – – – 1.06 – – – 4.3 2007 ............................................................... 1.06 1.06 1.05 1.11 4.3 4.3 4.3 4.5 2008 ............................................................... 1.16 1.17 1.20 1.16 4.6 4.6 4.7 4.6 2009 ............................................................... 1.09 1.10 1.10 1.09 4.3 4.3 4.3 4.3 2010 ............................................................... 1.07 1.07 1.06 1.03 4.1 4.1 4.0 4.0
2011 ............................................................... 1.13 1.15 1.14 1.15 4.3 4.4 4.3 4.4 2012 ............................................................... 1.18 1.19 1.19 1.21 4.5 4.5 4.5 4.6 2013 ............................................................... 1.20 1.19 1.19 1.23 4.5 4.4 4.4 4.5 2014 ............................................................... 1.25 1.26 1.27 1.31 4.6 4.6 4.6 4.8 2015 ............................................................... 1.28 1.28 1.29 1.34 4.6 4.6 4.6 4.8 2016 ............................................................... 1.38 1.40 1.38 1.37 4.9 5.0 4.9 4.8
See footnotes at end of table.
-45-

Supplemental table 2. Private manufacturing industry workers, by occupational group: employer costs per hoursworked for employee compensation and costs as a percentage of total compensation, 2006-2017 -- Continued
Production occupations
Compensationcomponent
Cost per hour worked Percent of total compensation
Mar. June Sep. Dec. Mar. June Sep. Dec.
Supplemental pay 2017 ............................................................... 1.34 – – – 4.7 – – –
Insurance 2006 ............................................................... – – – 2.76 – – – 11.3 2007 ............................................................... 2.78 2.84 2.85 2.87 11.4 11.6 11.6 11.6 2008 ............................................................... 2.92 2.91 2.92 2.88 11.7 11.6 11.5 11.4 2009 ............................................................... 3.01 3.02 3.03 3.02 11.8 11.8 11.8 11.8 2010 ............................................................... 3.09 3.13 3.16 3.07 12.0 12.0 12.0 11.9
2011 ............................................................... 3.09 3.12 3.13 3.06 11.9 11.8 11.9 11.7 2012 ............................................................... 3.09 3.12 3.14 3.15 11.8 11.9 11.9 11.9 2013 ............................................................... 3.19 3.19 3.18 3.23 11.9 11.9 11.8 11.9 2014 ............................................................... 3.28 3.27 3.28 3.19 11.9 11.9 11.9 11.6 2015 ............................................................... 3.27 3.27 3.27 3.30 11.8 11.8 11.8 11.8 2016 ............................................................... 3.32 3.35 3.39 3.38 11.8 11.9 11.9 11.9 2017 ............................................................... 3.40 – – – 11.9 – – –
Retirement and savings 2006 ............................................................... – – – .97 – – – 4.0 2007 ............................................................... .79 .80 .81 .83 3.2 3.3 3.3 3.3 2008 ............................................................... .82 .80 .80 .81 3.3 3.2 3.2 3.2 2009 ............................................................... .79 .78 .76 .75 3.1 3.0 3.0 2.9 2010 ............................................................... .84 .85 .92 .87 3.2 3.3 3.5 3.4
2011 ............................................................... .88 1.12 1.07 1.04 3.4 4.2 4.1 4.0 2012 ............................................................... .81 .80 .83 .81 3.1 3.1 3.2 3.1 2013 ............................................................... .83 .83 .81 .84 3.1 3.1 3.0 3.1 2014 ............................................................... .90 .89 .92 .95 3.3 3.2 3.3 3.4 2015 ............................................................... .96 .95 .97 1.03 3.5 3.4 3.5 3.7 2016 ............................................................... 1.02 1.03 1.02 1.04 3.6 3.6 3.6 3.6 2017 ............................................................... 1.04 – – – 3.6 – – –
Legally required benefits 2006 ............................................................... – – – 2.28 – – – 9.3 2007 ............................................................... 2.28 2.27 2.28 2.29 9.3 9.3 9.2 9.2 2008 ............................................................... 2.28 2.28 2.30 2.29 9.1 9.1 9.0 9.0 2009 ............................................................... 2.30 2.32 2.32 2.32 9.1 9.1 9.1 9.0 2010 ............................................................... 2.36 2.38 2.40 2.35 9.1 9.2 9.2 9.1
2011 ............................................................... 2.38 2.40 2.40 2.36 9.2 9.1 9.1 9.0 2012 ............................................................... 2.39 2.42 2.43 2.43 9.1 9.2 9.2 9.2 2013 ............................................................... 2.43 2.44 2.45 2.47 9.1 9.1 9.1 9.1 2014 ............................................................... 2.47 2.45 2.46 2.45 9.0 8.9 8.9 8.9 2015 ............................................................... 2.46 2.45 2.45 2.43 8.9 8.8 8.8 8.7 2016 ............................................................... 2.43 2.41 2.43 2.43 8.6 8.5 8.5 8.5 2017 ............................................................... 2.45 – – – 8.5 – – –
Note: The sum of individual items may not equal totals due to rounding. Dashes indicate data are not available.
-46-

Supplemental table 2. Private manufacturing industry workers, by occupational group: employer costs per hoursworked for employee compensation and costs as a percentage of total compensation, 2006-2017 -- Continued
Transportation and material moving occupations
Compensationcomponent
Cost per hour worked Percent of total compensation
Mar. June Sep. Dec. Mar. June Sep. Dec.
Total compensation 2006 ............................................................... – – – $20.94 – – – 100.0 2007 ............................................................... 20.95 21.13 21.28 21.54 100.0 100.0 100.0 100.0 2008 ............................................................... 21.83 21.91 21.99 22.35 100.0 100.0 100.0 100.0 2009 ............................................................... 22.16 22.19 22.35 22.20 100.0 100.0 100.0 100.0 2010 ............................................................... 22.42 22.53 22.83 22.26 100.0 100.0 100.0 100.0
2011 ............................................................... 22.41 22.45 22.36 23.20 100.0 100.0 100.0 100.0 2012 ............................................................... 23.53 23.56 23.72 23.66 100.0 100.0 100.0 100.0 2013 ............................................................... 23.75 23.92 24.21 24.97 100.0 100.0 100.0 100.0 2014 ............................................................... 25.20 25.28 25.43 25.89 100.0 100.0 100.0 100.0 2015 ............................................................... 26.12 26.14 26.45 26.69 100.0 100.0 100.0 100.0 2016 ............................................................... 26.58 26.63 26.83 26.98 100.0 100.0 100.0 100.0 2017 ............................................................... 27.26 – – – 100.0 – – –
Wages and salaries 2006 ............................................................... – – – 13.38 – – – 63.9 2007 ............................................................... 13.42 13.50 13.62 13.77 64.0 63.9 64.0 63.9 2008 ............................................................... 13.94 14.03 14.12 14.29 63.8 64.0 64.2 63.9 2009 ............................................................... 14.15 14.19 14.35 14.27 63.9 63.9 64.2 64.3 2010 ............................................................... 14.33 14.39 14.53 14.22 63.9 63.8 63.6 63.9
2011 ............................................................... 14.29 14.33 14.33 14.85 63.8 63.8 64.1 64.0 2012 ............................................................... 15.01 15.00 15.09 15.12 63.8 63.7 63.6 63.9 2013 ............................................................... 15.19 15.23 15.45 15.81 64.0 63.7 63.8 63.3 2014 ............................................................... 15.93 15.99 16.06 16.32 63.2 63.3 63.2 63.0 2015 ............................................................... 16.46 16.49 16.68 16.82 63.0 63.1 63.0 63.0 2016 ............................................................... 16.81 16.89 17.07 17.15 63.3 63.4 63.6 63.6 2017 ............................................................... 17.34 – – – 63.6 – – –
Total benefits 2006 ............................................................... – – – 7.56 – – – 36.1 2007 ............................................................... 7.54 7.64 7.66 7.77 36.0 36.1 36.0 36.1 2008 ............................................................... 7.89 7.89 7.87 8.06 36.2 36.0 35.8 36.1 2009 ............................................................... 8.01 8.01 8.00 7.93 36.1 36.1 35.8 35.7 2010 ............................................................... 8.09 8.15 8.30 8.04 36.1 36.2 36.4 36.1
2011 ............................................................... 8.12 8.12 8.03 8.35 36.2 36.2 35.9 36.0 2012 ............................................................... 8.52 8.56 8.63 8.53 36.2 36.3 36.4 36.1 2013 ............................................................... 8.56 8.69 8.77 9.16 36.0 36.3 36.2 36.7 2014 ............................................................... 9.27 9.29 9.37 9.57 36.8 36.7 36.8 37.0 2015 ............................................................... 9.66 9.66 9.78 9.87 37.0 36.9 37.0 37.0 2016 ............................................................... 9.77 9.73 9.76 9.83 36.7 36.6 36.4 36.4 2017 ............................................................... 9.92 – – – 36.4 – – –
Paid leave 2006 ............................................................... – – – 1.31 – – – 6.2 2007 ............................................................... 1.30 1.32 1.31 1.32 6.2 6.2 6.2 6.1 2008 ............................................................... 1.30 1.31 1.32 1.35 5.9 6.0 6.0 6.0 2009 ............................................................... 1.31 1.32 1.34 1.34 5.9 6.0 6.0 6.0 2010 ............................................................... 1.34 1.36 1.38 1.33 6.0 6.0 6.0 6.0
2011 ............................................................... 1.33 1.33 1.31 1.37 5.9 5.9 5.9 5.9 2012 ............................................................... 1.38 1.38 1.38 1.42 5.9 5.9 5.8 6.0 2013 ............................................................... 1.42 1.45 1.46 1.49 6.0 6.0 6.0 6.0 2014 ............................................................... 1.52 1.51 1.52 1.53 6.0 6.0 6.0 5.9 2015 ............................................................... 1.54 1.54 1.57 1.56 5.9 5.9 5.9 5.9 2016 ............................................................... 1.54 1.56 1.57 1.58 5.8 5.9 5.8 5.8 2017 ............................................................... 1.60 – – – 5.9 – – –
Supplemental pay 2006 ............................................................... – – – .85 – – – 4.0 2007 ............................................................... .85 .86 .85 .88 4.1 4.1 4.0 4.1 2008 ............................................................... .89 .92 .91 .93 4.1 4.2 4.1 4.1 2009 ............................................................... .91 .90 .92 .90 4.1 4.1 4.1 4.0 2010 ............................................................... .88 .88 .89 .84 3.9 3.9 3.9 3.8
2011 ............................................................... .86 .85 .85 .92 3.8 3.8 3.8 3.9 2012 ............................................................... .94 .95 .95 .97 4.0 4.0 4.0 4.1 2013 ............................................................... .96 .99 1.00 1.10 4.1 4.1 4.1 4.4 2014 ............................................................... 1.13 1.13 1.12 1.18 4.5 4.5 4.4 4.6 2015 ............................................................... 1.15 1.15 1.15 1.17 4.4 4.4 4.4 4.4 2016 ............................................................... 1.18 1.21 1.18 1.18 4.5 4.5 4.4 4.4
See footnotes at end of table.
-47-
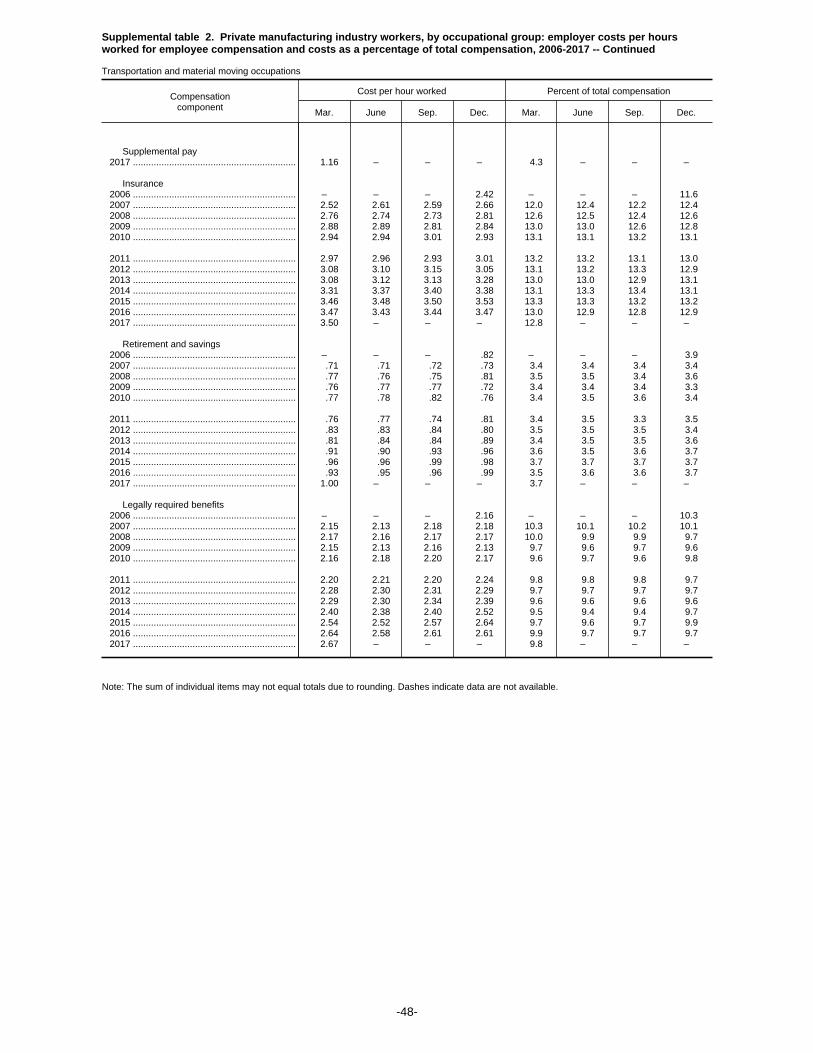
Supplemental table 2. Private manufacturing industry workers, by occupational group: employer costs per hoursworked for employee compensation and costs as a percentage of total compensation, 2006-2017 -- Continued
Transportation and material moving occupations
Compensationcomponent
Cost per hour worked Percent of total compensation
Mar. June Sep. Dec. Mar. June Sep. Dec.
Supplemental pay 2017 ............................................................... 1.16 – – – 4.3 – – –
Insurance 2006 ............................................................... – – – 2.42 – – – 11.6 2007 ............................................................... 2.52 2.61 2.59 2.66 12.0 12.4 12.2 12.4 2008 ............................................................... 2.76 2.74 2.73 2.81 12.6 12.5 12.4 12.6 2009 ............................................................... 2.88 2.89 2.81 2.84 13.0 13.0 12.6 12.8 2010 ............................................................... 2.94 2.94 3.01 2.93 13.1 13.1 13.2 13.1
2011 ............................................................... 2.97 2.96 2.93 3.01 13.2 13.2 13.1 13.0 2012 ............................................................... 3.08 3.10 3.15 3.05 13.1 13.2 13.3 12.9 2013 ............................................................... 3.08 3.12 3.13 3.28 13.0 13.0 12.9 13.1 2014 ............................................................... 3.31 3.37 3.40 3.38 13.1 13.3 13.4 13.1 2015 ............................................................... 3.46 3.48 3.50 3.53 13.3 13.3 13.2 13.2 2016 ............................................................... 3.47 3.43 3.44 3.47 13.0 12.9 12.8 12.9 2017 ............................................................... 3.50 – – – 12.8 – – –
Retirement and savings 2006 ............................................................... – – – .82 – – – 3.9 2007 ............................................................... .71 .71 .72 .73 3.4 3.4 3.4 3.4 2008 ............................................................... .77 .76 .75 .81 3.5 3.5 3.4 3.6 2009 ............................................................... .76 .77 .77 .72 3.4 3.4 3.4 3.3 2010 ............................................................... .77 .78 .82 .76 3.4 3.5 3.6 3.4
2011 ............................................................... .76 .77 .74 .81 3.4 3.5 3.3 3.5 2012 ............................................................... .83 .83 .84 .80 3.5 3.5 3.5 3.4 2013 ............................................................... .81 .84 .84 .89 3.4 3.5 3.5 3.6 2014 ............................................................... .91 .90 .93 .96 3.6 3.5 3.6 3.7 2015 ............................................................... .96 .96 .99 .98 3.7 3.7 3.7 3.7 2016 ............................................................... .93 .95 .96 .99 3.5 3.6 3.6 3.7 2017 ............................................................... 1.00 – – – 3.7 – – –
Legally required benefits 2006 ............................................................... – – – 2.16 – – – 10.3 2007 ............................................................... 2.15 2.13 2.18 2.18 10.3 10.1 10.2 10.1 2008 ............................................................... 2.17 2.16 2.17 2.17 10.0 9.9 9.9 9.7 2009 ............................................................... 2.15 2.13 2.16 2.13 9.7 9.6 9.7 9.6 2010 ............................................................... 2.16 2.18 2.20 2.17 9.6 9.7 9.6 9.8
2011 ............................................................... 2.20 2.21 2.20 2.24 9.8 9.8 9.8 9.7 2012 ............................................................... 2.28 2.30 2.31 2.29 9.7 9.7 9.7 9.7 2013 ............................................................... 2.29 2.30 2.34 2.39 9.6 9.6 9.6 9.6 2014 ............................................................... 2.40 2.38 2.40 2.52 9.5 9.4 9.4 9.7 2015 ............................................................... 2.54 2.52 2.57 2.64 9.7 9.6 9.7 9.9 2016 ............................................................... 2.64 2.58 2.61 2.61 9.9 9.7 9.7 9.7 2017 ............................................................... 2.67 – – – 9.8 – – –
Note: The sum of individual items may not equal totals due to rounding. Dashes indicate data are not available.
-48-
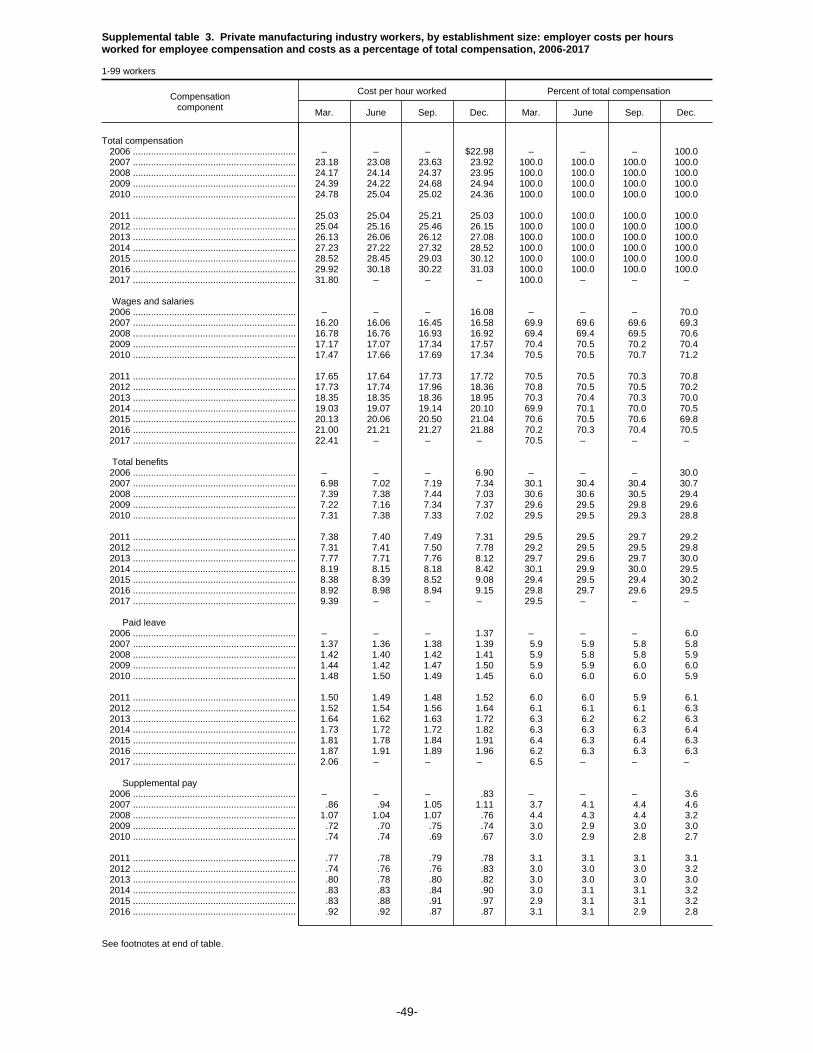
Supplemental table 3. Private manufacturing industry workers, by establishment size: employer costs per hoursworked for employee compensation and costs as a percentage of total compensation, 2006-2017
1-99 workers
Compensationcomponent
Cost per hour worked Percent of total compensation
Mar. June Sep. Dec. Mar. June Sep. Dec.
Total compensation 2006 ............................................................... – – – $22.98 – – – 100.0 2007 ............................................................... 23.18 23.08 23.63 23.92 100.0 100.0 100.0 100.0 2008 ............................................................... 24.17 24.14 24.37 23.95 100.0 100.0 100.0 100.0 2009 ............................................................... 24.39 24.22 24.68 24.94 100.0 100.0 100.0 100.0 2010 ............................................................... 24.78 25.04 25.02 24.36 100.0 100.0 100.0 100.0
2011 ............................................................... 25.03 25.04 25.21 25.03 100.0 100.0 100.0 100.0 2012 ............................................................... 25.04 25.16 25.46 26.15 100.0 100.0 100.0 100.0 2013 ............................................................... 26.13 26.06 26.12 27.08 100.0 100.0 100.0 100.0 2014 ............................................................... 27.23 27.22 27.32 28.52 100.0 100.0 100.0 100.0 2015 ............................................................... 28.52 28.45 29.03 30.12 100.0 100.0 100.0 100.0 2016 ............................................................... 29.92 30.18 30.22 31.03 100.0 100.0 100.0 100.0 2017 ............................................................... 31.80 – – – 100.0 – – –
Wages and salaries 2006 ............................................................... – – – 16.08 – – – 70.0 2007 ............................................................... 16.20 16.06 16.45 16.58 69.9 69.6 69.6 69.3 2008 ............................................................... 16.78 16.76 16.93 16.92 69.4 69.4 69.5 70.6 2009 ............................................................... 17.17 17.07 17.34 17.57 70.4 70.5 70.2 70.4 2010 ............................................................... 17.47 17.66 17.69 17.34 70.5 70.5 70.7 71.2
2011 ............................................................... 17.65 17.64 17.73 17.72 70.5 70.5 70.3 70.8 2012 ............................................................... 17.73 17.74 17.96 18.36 70.8 70.5 70.5 70.2 2013 ............................................................... 18.35 18.35 18.36 18.95 70.3 70.4 70.3 70.0 2014 ............................................................... 19.03 19.07 19.14 20.10 69.9 70.1 70.0 70.5 2015 ............................................................... 20.13 20.06 20.50 21.04 70.6 70.5 70.6 69.8 2016 ............................................................... 21.00 21.21 21.27 21.88 70.2 70.3 70.4 70.5 2017 ............................................................... 22.41 – – – 70.5 – – –
Total benefits 2006 ............................................................... – – – 6.90 – – – 30.0 2007 ............................................................... 6.98 7.02 7.19 7.34 30.1 30.4 30.4 30.7 2008 ............................................................... 7.39 7.38 7.44 7.03 30.6 30.6 30.5 29.4 2009 ............................................................... 7.22 7.16 7.34 7.37 29.6 29.5 29.8 29.6 2010 ............................................................... 7.31 7.38 7.33 7.02 29.5 29.5 29.3 28.8
2011 ............................................................... 7.38 7.40 7.49 7.31 29.5 29.5 29.7 29.2 2012 ............................................................... 7.31 7.41 7.50 7.78 29.2 29.5 29.5 29.8 2013 ............................................................... 7.77 7.71 7.76 8.12 29.7 29.6 29.7 30.0 2014 ............................................................... 8.19 8.15 8.18 8.42 30.1 29.9 30.0 29.5 2015 ............................................................... 8.38 8.39 8.52 9.08 29.4 29.5 29.4 30.2 2016 ............................................................... 8.92 8.98 8.94 9.15 29.8 29.7 29.6 29.5 2017 ............................................................... 9.39 – – – 29.5 – – –
Paid leave 2006 ............................................................... – – – 1.37 – – – 6.0 2007 ............................................................... 1.37 1.36 1.38 1.39 5.9 5.9 5.8 5.8 2008 ............................................................... 1.42 1.40 1.42 1.41 5.9 5.8 5.8 5.9 2009 ............................................................... 1.44 1.42 1.47 1.50 5.9 5.9 6.0 6.0 2010 ............................................................... 1.48 1.50 1.49 1.45 6.0 6.0 6.0 5.9
2011 ............................................................... 1.50 1.49 1.48 1.52 6.0 6.0 5.9 6.1 2012 ............................................................... 1.52 1.54 1.56 1.64 6.1 6.1 6.1 6.3 2013 ............................................................... 1.64 1.62 1.63 1.72 6.3 6.2 6.2 6.3 2014 ............................................................... 1.73 1.72 1.72 1.82 6.3 6.3 6.3 6.4 2015 ............................................................... 1.81 1.78 1.84 1.91 6.4 6.3 6.4 6.3 2016 ............................................................... 1.87 1.91 1.89 1.96 6.2 6.3 6.3 6.3 2017 ............................................................... 2.06 – – – 6.5 – – –
Supplemental pay 2006 ............................................................... – – – .83 – – – 3.6 2007 ............................................................... .86 .94 1.05 1.11 3.7 4.1 4.4 4.6 2008 ............................................................... 1.07 1.04 1.07 .76 4.4 4.3 4.4 3.2 2009 ............................................................... .72 .70 .75 .74 3.0 2.9 3.0 3.0 2010 ............................................................... .74 .74 .69 .67 3.0 2.9 2.8 2.7
2011 ............................................................... .77 .78 .79 .78 3.1 3.1 3.1 3.1 2012 ............................................................... .74 .76 .76 .83 3.0 3.0 3.0 3.2 2013 ............................................................... .80 .78 .80 .82 3.0 3.0 3.0 3.0 2014 ............................................................... .83 .83 .84 .90 3.0 3.1 3.1 3.2 2015 ............................................................... .83 .88 .91 .97 2.9 3.1 3.1 3.2 2016 ............................................................... .92 .92 .87 .87 3.1 3.1 2.9 2.8
See footnotes at end of table.
-49-

Supplemental table 3. Private manufacturing industry workers, by establishment size: employer costs per hoursworked for employee compensation and costs as a percentage of total compensation, 2006-2017
1-99 workers
Compensationcomponent
Cost per hour worked Percent of total compensation
Mar. June Sep. Dec. Mar. June Sep. Dec.
Supplemental pay 2017 ............................................................... 0.88 – – – 2.8 – – –
Insurance 2006 ............................................................... – – – 1.99 – – – 8.6 2007 ............................................................... 2.03 2.03 2.03 2.06 8.8 8.8 8.6 8.6 2008 ............................................................... 2.11 2.16 2.17 2.14 8.7 8.9 8.9 8.9 2009 ............................................................... 2.24 2.25 2.28 2.28 9.2 9.3 9.2 9.1 2010 ............................................................... 2.23 2.24 2.23 2.16 9.0 9.0 8.9 8.9
2011 ............................................................... 2.26 2.27 2.29 2.22 9.0 9.1 9.1 8.8 2012 ............................................................... 2.21 2.26 2.27 2.37 8.8 9.0 8.9 9.0 2013 ............................................................... 2.39 2.35 2.36 2.51 9.1 9.0 9.0 9.3 2014 ............................................................... 2.55 2.53 2.55 2.52 9.4 9.3 9.3 8.8 2015 ............................................................... 2.56 2.56 2.57 2.69 9.0 9.0 8.8 8.9 2016 ............................................................... 2.63 2.64 2.64 2.67 8.8 8.7 8.7 8.6 2017 ............................................................... 2.77 – – – 8.7 – – –
Retirement and savings 2006 ............................................................... – – – .51 – – – 2.2 2007 ............................................................... .51 .52 .54 .56 2.2 2.3 2.3 2.3 2008 ............................................................... .58 .58 .58 .50 2.4 2.4 2.4 2.1 2009 ............................................................... .55 .53 .55 .56 2.3 2.2 2.2 2.2 2010 ............................................................... .54 .55 .57 .47 2.2 2.2 2.3 1.9
2011 ............................................................... .49 .50 .54 .47 2.0 2.0 2.1 1.9 2012 ............................................................... .48 .49 .49 .53 1.9 1.9 1.9 2.0 2013 ............................................................... .54 .55 .55 .60 2.1 2.1 2.1 2.2 2014 ............................................................... .62 .61 .63 .66 2.3 2.2 2.3 2.3 2015 ............................................................... .65 .66 .66 .88 2.3 2.3 2.3 2.9 2016 ............................................................... .85 .87 .88 .95 2.9 2.9 2.9 3.1 2017 ............................................................... .94 – – – 3.0 – – –
Legally required benefits 2006 ............................................................... – – – 2.21 – – – 9.6 2007 ............................................................... 2.20 2.17 2.20 2.22 9.5 9.4 9.3 9.3 2008 ............................................................... 2.21 2.20 2.20 2.21 9.2 9.1 9.0 9.2 2009 ............................................................... 2.26 2.25 2.30 2.30 9.3 9.3 9.3 9.2 2010 ............................................................... 2.32 2.35 2.35 2.28 9.4 9.4 9.4 9.3
2011 ............................................................... 2.35 2.36 2.38 2.33 9.4 9.4 9.4 9.3 2012 ............................................................... 2.36 2.38 2.41 2.41 9.4 9.5 9.5 9.2 2013 ............................................................... 2.40 2.40 2.43 2.47 9.2 9.2 9.3 9.1 2014 ............................................................... 2.47 2.45 2.45 2.53 9.1 9.0 9.0 8.9 2015 ............................................................... 2.53 2.51 2.54 2.64 8.9 8.8 8.8 8.8 2016 ............................................................... 2.64 2.63 2.65 2.69 8.8 8.7 8.8 8.7 2017 ............................................................... 2.74 – – – 8.6 – – –
Note: The sum of individual items may not equal totals due to rounding. Dashes indicate data are not available.
-50-

Supplemental table 3. Private manufacturing industry workers, by establishment size: employer costs per hoursworked for employee compensation and costs as a percentage of total compensation, 2006-2017 -- Continued
1-49 workers
Compensationcomponent
Cost per hour worked Percent of total compensation
Mar. June Sep. Dec. Mar. June Sep. Dec.
Total compensation 2006 ............................................................... – – – $21.80 – – – 100.0 2007 ............................................................... 22.31 22.12 22.89 23.08 100.0 100.0 100.0 100.0 2008 ............................................................... 23.05 23.19 23.07 23.01 100.0 100.0 100.0 100.0 2009 ............................................................... 23.14 22.75 23.02 23.58 100.0 100.0 100.0 100.0 2010 ............................................................... 23.33 23.62 23.60 23.17 100.0 100.0 100.0 100.0
2011 ............................................................... 23.50 23.96 24.26 23.00 100.0 100.0 100.0 100.0 2012 ............................................................... 22.73 22.82 23.11 23.41 100.0 100.0 100.0 100.0 2013 ............................................................... 23.85 23.96 23.93 25.20 100.0 100.0 100.0 100.0 2014 ............................................................... 25.33 25.50 25.37 27.08 100.0 100.0 100.0 100.0 2015 ............................................................... 27.10 26.81 27.23 28.76 100.0 100.0 100.0 100.0 2016 ............................................................... 29.07 29.17 29.19 30.53 100.0 100.0 100.0 100.0 2017 ............................................................... 30.99 – – – 100.0 – – –
Wages and salaries 2006 ............................................................... – – – 15.68 – – – 71.9 2007 ............................................................... 15.81 15.62 16.09 16.13 70.9 70.6 70.3 69.9 2008 ............................................................... 16.24 16.31 16.25 16.56 70.4 70.3 70.4 71.9 2009 ............................................................... 16.67 16.41 16.64 16.98 72.1 72.1 72.3 72.0 2010 ............................................................... 16.79 17.00 16.95 16.74 72.0 72.0 71.8 72.3
2011 ............................................................... 16.85 17.17 17.38 16.60 71.7 71.7 71.7 72.2 2012 ............................................................... 16.42 16.43 16.68 16.74 72.2 72.0 72.2 71.5 2013 ............................................................... 17.04 17.18 17.17 17.97 71.4 71.7 71.8 71.3 2014 ............................................................... 18.01 18.10 18.01 19.39 71.1 71.0 71.0 71.6 2015 ............................................................... 19.45 19.26 19.61 20.45 71.8 71.8 72.0 71.1 2016 ............................................................... 20.65 20.77 20.81 21.77 71.0 71.2 71.3 71.3 2017 ............................................................... 22.21 – – – 71.7 – – –
Total benefits 2006 ............................................................... – – – 6.12 – – – 28.1 2007 ............................................................... 6.50 6.50 6.79 6.94 29.1 29.4 29.7 30.1 2008 ............................................................... 6.82 6.88 6.82 6.46 29.6 29.7 29.6 28.1 2009 ............................................................... 6.47 6.34 6.38 6.59 27.9 27.9 27.7 28.0 2010 ............................................................... 6.54 6.62 6.65 6.43 28.0 28.0 28.2 27.7
2011 ............................................................... 6.65 6.79 6.88 6.40 28.3 28.3 28.3 27.8 2012 ............................................................... 6.31 6.39 6.42 6.67 27.8 28.0 27.8 28.5 2013 ............................................................... 6.81 6.77 6.76 7.23 28.6 28.3 28.2 28.7 2014 ............................................................... 7.32 7.39 7.36 7.69 28.9 29.0 29.0 28.4 2015 ............................................................... 7.64 7.55 7.62 8.31 28.2 28.2 28.0 28.9 2016 ............................................................... 8.42 8.40 8.39 8.76 29.0 28.8 28.7 28.7 2017 ............................................................... 8.77 – – – 28.3 – – –
Paid leave 2006 ............................................................... – – – 1.19 – – – 5.4 2007 ............................................................... 1.22 1.19 1.22 1.22 5.5 5.4 5.3 5.3 2008 ............................................................... 1.23 1.21 1.20 1.26 5.3 5.2 5.2 5.5 2009 ............................................................... 1.26 1.21 1.25 1.32 5.4 5.3 5.4 5.6 2010 ............................................................... 1.31 1.33 1.34 1.30 5.6 5.6 5.7 5.6
2011 ............................................................... 1.32 1.33 1.36 1.29 5.6 5.6 5.6 5.6 2012 ............................................................... 1.25 1.27 1.29 1.32 5.5 5.6 5.6 5.6 2013 ............................................................... 1.37 1.38 1.37 1.45 5.8 5.8 5.7 5.8 2014 ............................................................... 1.46 1.47 1.44 1.60 5.8 5.7 5.7 5.9 2015 ............................................................... 1.60 1.56 1.61 1.75 5.9 5.8 5.9 6.1 2016 ............................................................... 1.77 1.77 1.75 1.89 6.1 6.1 6.0 6.2 2017 ............................................................... 1.94 – – – 6.3 – – –
Supplemental pay 2006 ............................................................... – – – .80 – – – 3.7 2007 ............................................................... .85 .94 1.11 1.19 3.8 4.3 4.9 5.1 2008 ............................................................... 1.07 1.09 1.09 .65 4.6 4.7 4.7 2.8 2009 ............................................................... .60 .60 .61 .63 2.6 2.6 2.6 2.7 2010 ............................................................... .63 .63 .63 .61 2.7 2.7 2.7 2.6
2011 ............................................................... .66 .72 .72 .71 2.8 3.0 3.0 3.1 2012 ............................................................... .65 .65 .66 .75 2.9 2.9 2.9 3.2 2013 ............................................................... .72 .73 .77 .82 3.0 3.1 3.2 3.3 2014 ............................................................... .83 .85 .84 .84 3.3 3.3 3.3 3.1 2015 ............................................................... .70 .78 .78 .84 2.6 2.9 2.9 2.9 2016 ............................................................... .83 .82 .77 .78 2.8 2.8 2.6 2.6
See footnotes at end of table.
-51-

Supplemental table 3. Private manufacturing industry workers, by establishment size: employer costs per hoursworked for employee compensation and costs as a percentage of total compensation, 2006-2017 -- Continued
1-49 workers
Compensationcomponent
Cost per hour worked Percent of total compensation
Mar. June Sep. Dec. Mar. June Sep. Dec.
Supplemental pay 2017 ............................................................... 0.76 – – – 2.5 – – –
Insurance 2006 ............................................................... – – – 1.63 – – – 7.5 2007 ............................................................... 1.83 1.80 1.84 1.88 8.2 8.1 8.0 8.1 2008 ............................................................... 1.87 1.90 1.88 1.93 8.1 8.2 8.2 8.4 2009 ............................................................... 1.98 1.98 1.91 1.96 8.6 8.7 8.3 8.3 2010 ............................................................... 1.91 1.91 1.93 1.91 8.2 8.1 8.2 8.2
2011 ............................................................... 1.97 1.99 2.04 1.86 8.4 8.3 8.4 8.1 2012 ............................................................... 1.84 1.88 1.86 1.96 8.1 8.2 8.0 8.4 2013 ............................................................... 2.03 1.95 1.89 2.08 8.5 8.1 7.9 8.3 2014 ............................................................... 2.11 2.18 2.18 2.21 8.3 8.5 8.6 8.1 2015 ............................................................... 2.24 2.22 2.22 2.40 8.3 8.3 8.2 8.3 2016 ............................................................... 2.35 2.33 2.37 2.42 8.1 8.0 8.1 7.9 2017 ............................................................... 2.41 – – – 7.8 – – –
Retirement and savings 2006 ............................................................... – – – .37 – – – 1.7 2007 ............................................................... .43 .44 .45 .46 1.9 2.0 2.0 2.0 2008 ............................................................... .46 .49 .47 .41 2.0 2.1 2.0 1.8 2009 ............................................................... .40 .36 .40 .44 1.7 1.6 1.7 1.9 2010 ............................................................... .42 .43 .44 .36 1.8 1.8 1.9 1.6
2011 ............................................................... .40 .41 .42 .32 1.7 1.7 1.7 1.4 2012 ............................................................... .32 .32 .33 .37 1.4 1.4 1.4 1.6 2013 ............................................................... .39 .40 .41 .49 1.6 1.7 1.7 1.9 2014 ............................................................... .53 .54 .55 .56 2.1 2.1 2.2 2.1 2015 ............................................................... .62 .53 .53 .72 2.3 2.0 1.9 2.5 2016 ............................................................... .86 .86 .86 .97 2.9 2.9 3.0 3.2 2017 ............................................................... .91 – – – 2.9 – – –
Legally required benefits 2006 ............................................................... – – – 2.13 – – – 9.8 2007 ............................................................... 2.17 2.13 2.17 2.19 9.7 9.6 9.5 9.5 2008 ............................................................... 2.18 2.18 2.18 2.21 9.5 9.4 9.4 9.6 2009 ............................................................... 2.23 2.19 2.22 2.25 9.6 9.6 9.6 9.5 2010 ............................................................... 2.27 2.31 2.31 2.24 9.7 9.8 9.8 9.7
2011 ............................................................... 2.30 2.33 2.34 2.23 9.8 9.7 9.6 9.7 2012 ............................................................... 2.24 2.26 2.30 2.28 9.9 9.9 9.9 9.7 2013 ............................................................... 2.31 2.31 2.33 2.38 9.7 9.6 9.7 9.4 2014 ............................................................... 2.39 2.36 2.35 2.49 9.4 9.3 9.3 9.2 2015 ............................................................... 2.48 2.46 2.48 2.60 9.1 9.2 9.1 9.0 2016 ............................................................... 2.62 2.61 2.64 2.70 9.0 9.0 9.0 8.9 2017 ............................................................... 2.74 – – – 8.8 – – –
Note: The sum of individual items may not equal totals due to rounding. Dashes indicate data are not available.
-52-

Supplemental table 3. Private manufacturing industry workers, by establishment size: employer costs per hoursworked for employee compensation and costs as a percentage of total compensation, 2006-2017 -- Continued
50-99 workers
Compensationcomponent
Cost per hour worked Percent of total compensation
Mar. June Sep. Dec. Mar. June Sep. Dec.
Total compensation 2006 ............................................................... – – – $24.75 – – – 100.0 2007 ............................................................... 24.64 24.71 25.02 25.36 100.0 100.0 100.0 100.0 2008 ............................................................... 26.08 25.67 26.53 25.44 100.0 100.0 100.0 100.0 2009 ............................................................... 26.49 26.81 27.30 27.20 100.0 100.0 100.0 100.0 2010 ............................................................... 27.14 27.42 27.35 26.47 100.0 100.0 100.0 100.0
2011 ............................................................... 27.55 26.92 26.81 28.55 100.0 100.0 100.0 100.0 2012 ............................................................... 28.91 28.87 29.23 30.88 100.0 100.0 100.0 100.0 2013 ............................................................... 30.08 29.97 29.67 30.07 100.0 100.0 100.0 100.0 2014 ............................................................... 30.19 30.06 30.56 30.89 100.0 100.0 100.0 100.0 2015 ............................................................... 30.85 31.19 31.86 32.55 100.0 100.0 100.0 100.0 2016 ............................................................... 31.42 31.97 32.13 31.96 100.0 100.0 100.0 100.0 2017 ............................................................... 33.25 – – – 100.0 – – –
Wages and salaries 2006 ............................................................... – – – 16.68 – – – 67.4 2007 ............................................................... 16.86 16.80 17.09 17.34 68.4 68.0 68.3 68.4 2008 ............................................................... 17.72 17.49 18.07 17.50 67.9 68.1 68.1 68.8 2009 ............................................................... 18.00 18.21 18.43 18.54 68.0 67.9 67.5 68.2 2010 ............................................................... 18.57 18.77 18.91 18.40 68.4 68.4 69.1 69.5
2011 ............................................................... 18.98 18.46 18.31 19.67 68.9 68.6 68.3 68.9 2012 ............................................................... 19.92 19.83 20.00 21.17 68.9 68.7 68.4 68.6 2013 ............................................................... 20.64 20.53 20.29 20.52 68.6 68.5 68.4 68.2 2014 ............................................................... 20.63 20.65 21.01 21.26 68.3 68.7 68.8 68.8 2015 ............................................................... 21.25 21.40 21.91 22.09 68.9 68.6 68.8 67.8 2016 ............................................................... 21.62 21.97 22.14 22.07 68.8 68.7 68.9 69.1 2017 ............................................................... 22.77 – – – 68.5 – – –
Total benefits 2006 ............................................................... – – – 8.08 – – – 32.6 2007 ............................................................... 7.79 7.91 7.92 8.03 31.6 32.0 31.7 31.6 2008 ............................................................... 8.36 8.18 8.46 7.94 32.1 31.9 31.9 31.2 2009 ............................................................... 8.49 8.60 8.87 8.66 32.0 32.1 32.5 31.8 2010 ............................................................... 8.56 8.65 8.44 8.08 31.6 31.6 30.9 30.5
2011 ............................................................... 8.58 8.46 8.50 8.88 31.1 31.4 31.7 31.1 2012 ............................................................... 8.99 9.05 9.23 9.71 31.1 31.3 31.6 31.4 2013 ............................................................... 9.44 9.44 9.38 9.55 31.4 31.5 31.6 31.8 2014 ............................................................... 9.56 9.41 9.55 9.63 31.7 31.3 31.2 31.2 2015 ............................................................... 9.60 9.79 9.95 10.47 31.1 31.4 31.2 32.2 2016 ............................................................... 9.81 10.00 9.99 9.89 31.2 31.3 31.1 30.9 2017 ............................................................... 10.48 – – – 31.5 – – –
Paid leave 2006 ............................................................... – – – 1.65 – – – 6.7 2007 ............................................................... 1.63 1.65 1.68 1.68 6.6 6.7 6.7 6.6 2008 ............................................................... 1.74 1.70 1.79 1.66 6.7 6.6 6.7 6.5 2009 ............................................................... 1.76 1.79 1.83 1.80 6.6 6.7 6.7 6.6 2010 ............................................................... 1.76 1.78 1.75 1.71 6.5 6.5 6.4 6.4
2011 ............................................................... 1.81 1.77 1.70 1.92 6.6 6.6 6.3 6.7 2012 ............................................................... 1.97 1.96 2.01 2.20 6.8 6.8 6.9 7.1 2013 ............................................................... 2.12 2.06 2.05 2.14 7.0 6.9 6.9 7.1 2014 ............................................................... 2.15 2.15 2.17 2.18 7.1 7.2 7.1 7.1 2015 ............................................................... 2.17 2.16 2.22 2.19 7.0 6.9 7.0 6.7 2016 ............................................................... 2.05 2.15 2.16 2.11 6.5 6.7 6.7 6.6 2017 ............................................................... 2.25 – – – 6.8 – – –
Supplemental pay 2006 ............................................................... – – – .87 – – – 3.5 2007 ............................................................... .88 .94 .93 .98 3.6 3.8 3.7 3.9 2008 ............................................................... 1.05 .96 1.03 .93 4.0 3.7 3.9 3.7 2009 ............................................................... .93 .89 .97 .91 3.5 3.3 3.5 3.3 2010 ............................................................... .92 .91 .79 .76 3.4 3.3 2.9 2.9
2011 ............................................................... .96 .88 .91 .89 3.5 3.3 3.4 3.1 2012 ............................................................... .88 .92 .92 .98 3.0 3.2 3.2 3.2 2013 ............................................................... .93 .88 .85 .82 3.1 2.9 2.9 2.7 2014 ............................................................... .83 .81 .83 1.00 2.7 2.7 2.7 3.2 2015 ............................................................... 1.05 1.03 1.11 1.20 3.4 3.3 3.5 3.7 2016 ............................................................... 1.10 1.10 1.07 1.04 3.5 3.4 3.3 3.3
See footnotes at end of table.
-53-

Supplemental table 3. Private manufacturing industry workers, by establishment size: employer costs per hoursworked for employee compensation and costs as a percentage of total compensation, 2006-2017 -- Continued
50-99 workers
Compensationcomponent
Cost per hour worked Percent of total compensation
Mar. June Sep. Dec. Mar. June Sep. Dec.
Supplemental pay 2017 ............................................................... 1.09 – – – 3.3 – – –
Insurance 2006 ............................................................... – – – 2.52 – – – 10.2 2007 ............................................................... 2.38 2.43 2.37 2.38 9.7 9.9 9.5 9.4 2008 ............................................................... 2.53 2.57 2.64 2.48 9.7 10.0 9.9 9.7 2009 ............................................................... 2.67 2.71 2.86 2.81 10.1 10.1 10.5 10.3 2010 ............................................................... 2.76 2.80 2.71 2.61 10.2 10.2 9.9 9.9
2011 ............................................................... 2.74 2.75 2.71 2.84 9.9 10.2 10.1 9.9 2012 ............................................................... 2.84 2.86 2.94 3.07 9.8 9.9 10.1 9.9 2013 ............................................................... 3.02 3.10 3.12 3.19 10.0 10.4 10.5 10.6 2014 ............................................................... 3.24 3.13 3.17 3.03 10.7 10.4 10.4 9.8 2015 ............................................................... 3.09 3.12 3.11 3.20 10.0 10.0 9.8 9.8 2016 ............................................................... 3.13 3.18 3.16 3.13 10.0 9.9 9.8 9.8 2017 ............................................................... 3.40 – – – 10.2 – – –
Retirement and savings 2006 ............................................................... – – – .72 – – – 2.9 2007 ............................................................... .64 .66 .70 .72 2.6 2.7 2.8 2.9 2008 ............................................................... .77 .71 .76 .65 3.0 2.8 2.9 2.5 2009 ............................................................... .81 .84 .80 .75 3.1 3.1 2.9 2.8 2010 ............................................................... .73 .74 .79 .66 2.7 2.7 2.9 2.5
2011 ............................................................... .64 .65 .74 .73 2.3 2.4 2.7 2.6 2012 ............................................................... .75 .74 .76 .82 2.6 2.6 2.6 2.6 2013 ............................................................... .80 .82 .78 .78 2.7 2.7 2.6 2.6 2014 ............................................................... .74 .72 .76 .83 2.5 2.4 2.5 2.7 2015 ............................................................... .69 .88 .87 1.15 2.2 2.8 2.7 3.5 2016 ............................................................... .85 .90 .92 .94 2.7 2.8 2.8 2.9 2017 ............................................................... .99 – – – 3.0 – – –
Legally required benefits 2006 ............................................................... – – – 2.32 – – – 9.4 2007 ............................................................... 2.25 2.23 2.25 2.26 9.1 9.0 9.0 8.9 2008 ............................................................... 2.27 2.23 2.25 2.22 8.7 8.7 8.5 8.7 2009 ............................................................... 2.32 2.36 2.42 2.39 8.8 8.8 8.8 8.8 2010 ............................................................... 2.40 2.42 2.41 2.34 8.8 8.8 8.8 8.8
2011 ............................................................... 2.44 2.41 2.45 2.50 8.8 8.9 9.2 8.8 2012 ............................................................... 2.55 2.57 2.60 2.64 8.8 8.9 8.9 8.6 2013 ............................................................... 2.57 2.58 2.59 2.61 8.5 8.6 8.7 8.7 2014 ............................................................... 2.60 2.60 2.62 2.59 8.6 8.6 8.6 8.4 2015 ............................................................... 2.60 2.60 2.64 2.72 8.4 8.3 8.3 8.4 2016 ............................................................... 2.68 2.67 2.69 2.67 8.5 8.4 8.4 8.4 2017 ............................................................... 2.75 – – – 8.3 – – –
Note: The sum of individual items may not equal totals due to rounding. Dashes indicate data are not available.
-54-
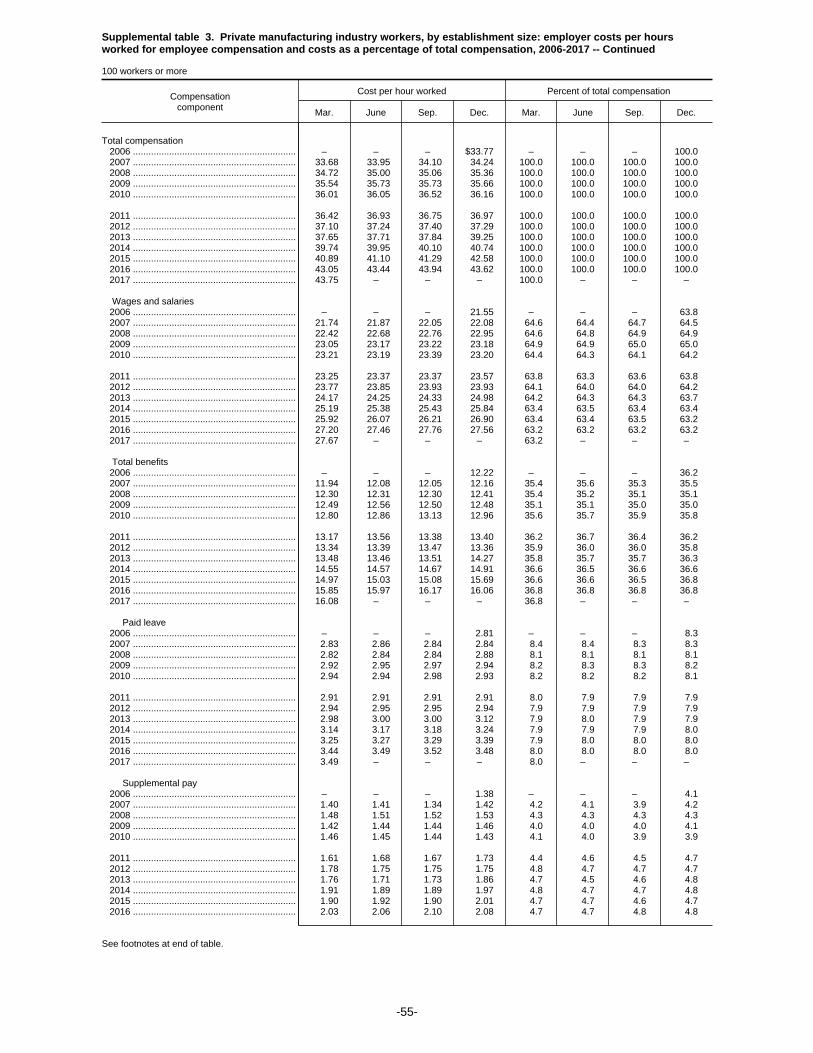
Supplemental table 3. Private manufacturing industry workers, by establishment size: employer costs per hoursworked for employee compensation and costs as a percentage of total compensation, 2006-2017 -- Continued
100 workers or more
Compensationcomponent
Cost per hour worked Percent of total compensation
Mar. June Sep. Dec. Mar. June Sep. Dec.
Total compensation 2006 ............................................................... – – – $33.77 – – – 100.0 2007 ............................................................... 33.68 33.95 34.10 34.24 100.0 100.0 100.0 100.0 2008 ............................................................... 34.72 35.00 35.06 35.36 100.0 100.0 100.0 100.0 2009 ............................................................... 35.54 35.73 35.73 35.66 100.0 100.0 100.0 100.0 2010 ............................................................... 36.01 36.05 36.52 36.16 100.0 100.0 100.0 100.0
2011 ............................................................... 36.42 36.93 36.75 36.97 100.0 100.0 100.0 100.0 2012 ............................................................... 37.10 37.24 37.40 37.29 100.0 100.0 100.0 100.0 2013 ............................................................... 37.65 37.71 37.84 39.25 100.0 100.0 100.0 100.0 2014 ............................................................... 39.74 39.95 40.10 40.74 100.0 100.0 100.0 100.0 2015 ............................................................... 40.89 41.10 41.29 42.58 100.0 100.0 100.0 100.0 2016 ............................................................... 43.05 43.44 43.94 43.62 100.0 100.0 100.0 100.0 2017 ............................................................... 43.75 – – – 100.0 – – –
Wages and salaries 2006 ............................................................... – – – 21.55 – – – 63.8 2007 ............................................................... 21.74 21.87 22.05 22.08 64.6 64.4 64.7 64.5 2008 ............................................................... 22.42 22.68 22.76 22.95 64.6 64.8 64.9 64.9 2009 ............................................................... 23.05 23.17 23.22 23.18 64.9 64.9 65.0 65.0 2010 ............................................................... 23.21 23.19 23.39 23.20 64.4 64.3 64.1 64.2
2011 ............................................................... 23.25 23.37 23.37 23.57 63.8 63.3 63.6 63.8 2012 ............................................................... 23.77 23.85 23.93 23.93 64.1 64.0 64.0 64.2 2013 ............................................................... 24.17 24.25 24.33 24.98 64.2 64.3 64.3 63.7 2014 ............................................................... 25.19 25.38 25.43 25.84 63.4 63.5 63.4 63.4 2015 ............................................................... 25.92 26.07 26.21 26.90 63.4 63.4 63.5 63.2 2016 ............................................................... 27.20 27.46 27.76 27.56 63.2 63.2 63.2 63.2 2017 ............................................................... 27.67 – – – 63.2 – – –
Total benefits 2006 ............................................................... – – – 12.22 – – – 36.2 2007 ............................................................... 11.94 12.08 12.05 12.16 35.4 35.6 35.3 35.5 2008 ............................................................... 12.30 12.31 12.30 12.41 35.4 35.2 35.1 35.1 2009 ............................................................... 12.49 12.56 12.50 12.48 35.1 35.1 35.0 35.0 2010 ............................................................... 12.80 12.86 13.13 12.96 35.6 35.7 35.9 35.8
2011 ............................................................... 13.17 13.56 13.38 13.40 36.2 36.7 36.4 36.2 2012 ............................................................... 13.34 13.39 13.47 13.36 35.9 36.0 36.0 35.8 2013 ............................................................... 13.48 13.46 13.51 14.27 35.8 35.7 35.7 36.3 2014 ............................................................... 14.55 14.57 14.67 14.91 36.6 36.5 36.6 36.6 2015 ............................................................... 14.97 15.03 15.08 15.69 36.6 36.6 36.5 36.8 2016 ............................................................... 15.85 15.97 16.17 16.06 36.8 36.8 36.8 36.8 2017 ............................................................... 16.08 – – – 36.8 – – –
Paid leave 2006 ............................................................... – – – 2.81 – – – 8.3 2007 ............................................................... 2.83 2.86 2.84 2.84 8.4 8.4 8.3 8.3 2008 ............................................................... 2.82 2.84 2.84 2.88 8.1 8.1 8.1 8.1 2009 ............................................................... 2.92 2.95 2.97 2.94 8.2 8.3 8.3 8.2 2010 ............................................................... 2.94 2.94 2.98 2.93 8.2 8.2 8.2 8.1
2011 ............................................................... 2.91 2.91 2.91 2.91 8.0 7.9 7.9 7.9 2012 ............................................................... 2.94 2.95 2.95 2.94 7.9 7.9 7.9 7.9 2013 ............................................................... 2.98 3.00 3.00 3.12 7.9 8.0 7.9 7.9 2014 ............................................................... 3.14 3.17 3.18 3.24 7.9 7.9 7.9 8.0 2015 ............................................................... 3.25 3.27 3.29 3.39 7.9 8.0 8.0 8.0 2016 ............................................................... 3.44 3.49 3.52 3.48 8.0 8.0 8.0 8.0 2017 ............................................................... 3.49 – – – 8.0 – – –
Supplemental pay 2006 ............................................................... – – – 1.38 – – – 4.1 2007 ............................................................... 1.40 1.41 1.34 1.42 4.2 4.1 3.9 4.2 2008 ............................................................... 1.48 1.51 1.52 1.53 4.3 4.3 4.3 4.3 2009 ............................................................... 1.42 1.44 1.44 1.46 4.0 4.0 4.0 4.1 2010 ............................................................... 1.46 1.45 1.44 1.43 4.1 4.0 3.9 3.9
2011 ............................................................... 1.61 1.68 1.67 1.73 4.4 4.6 4.5 4.7 2012 ............................................................... 1.78 1.75 1.75 1.75 4.8 4.7 4.7 4.7 2013 ............................................................... 1.76 1.71 1.73 1.86 4.7 4.5 4.6 4.8 2014 ............................................................... 1.91 1.89 1.89 1.97 4.8 4.7 4.7 4.8 2015 ............................................................... 1.90 1.92 1.90 2.01 4.7 4.7 4.6 4.7 2016 ............................................................... 2.03 2.06 2.10 2.08 4.7 4.7 4.8 4.8
See footnotes at end of table.
-55-

Supplemental table 3. Private manufacturing industry workers, by establishment size: employer costs per hoursworked for employee compensation and costs as a percentage of total compensation, 2006-2017 -- Continued
100 workers or more
Compensationcomponent
Cost per hour worked Percent of total compensation
Mar. June Sep. Dec. Mar. June Sep. Dec.
Supplemental pay 2017 ............................................................... 2.05 – – – 4.7 – – –
Insurance 2006 ............................................................... – – – 3.36 – – – 9.9 2007 ............................................................... 3.40 3.47 3.50 3.52 10.1 10.2 10.3 10.3 2008 ............................................................... 3.59 3.57 3.57 3.57 10.3 10.2 10.2 10.1 2009 ............................................................... 3.72 3.74 3.75 3.77 10.5 10.5 10.5 10.6 2010 ............................................................... 3.91 3.94 3.98 3.94 10.8 10.9 10.9 10.9
2011 ............................................................... 3.96 3.98 3.98 3.98 10.9 10.8 10.8 10.8 2012 ............................................................... 4.03 4.07 4.10 4.05 10.9 10.9 11.0 10.9 2013 ............................................................... 4.11 4.13 4.14 4.20 10.9 10.9 10.9 10.7 2014 ............................................................... 4.25 4.27 4.26 4.24 10.7 10.7 10.6 10.4 2015 ............................................................... 4.32 4.34 4.37 4.48 10.6 10.6 10.6 10.5 2016 ............................................................... 4.56 4.60 4.67 4.64 10.6 10.6 10.6 10.6 2017 ............................................................... 4.62 – – – 10.6 – – –
Retirement and savings 2006 ............................................................... – – – 1.96 – – – 5.8 2007 ............................................................... 1.57 1.61 1.63 1.64 4.7 4.7 4.8 4.8 2008 ............................................................... 1.66 1.64 1.60 1.66 4.8 4.7 4.6 4.7 2009 ............................................................... 1.64 1.63 1.54 1.51 4.6 4.6 4.3 4.2 2010 ............................................................... 1.66 1.68 1.85 1.81 4.6 4.6 5.1 5.0
2011 ............................................................... 1.83 2.10 1.95 1.91 5.0 5.7 5.3 5.2 2012 ............................................................... 1.69 1.69 1.75 1.67 4.6 4.5 4.7 4.5 2013 ............................................................... 1.68 1.66 1.68 2.07 4.5 4.4 4.4 5.3 2014 ............................................................... 2.23 2.23 2.33 2.41 5.6 5.6 5.8 5.9 2015 ............................................................... 2.44 2.44 2.45 2.73 6.0 5.9 5.9 6.4 2016 ............................................................... 2.73 2.74 2.78 2.77 6.3 6.3 6.3 6.3 2017 ............................................................... 2.80 – – – 6.4 – – –
Legally required benefits 2006 ............................................................... – – – 2.72 – – – 8.0 2007 ............................................................... 2.73 2.73 2.74 2.74 8.1 8.1 8.0 8.0 2008 ............................................................... 2.75 2.76 2.77 2.77 7.9 7.9 7.9 7.8 2009 ............................................................... 2.78 2.80 2.80 2.80 7.8 7.8 7.8 7.9 2010 ............................................................... 2.84 2.85 2.88 2.84 7.9 7.9 7.9 7.9
2011 ............................................................... 2.86 2.89 2.87 2.86 7.9 7.8 7.8 7.7 2012 ............................................................... 2.90 2.92 2.93 2.94 7.8 7.9 7.8 7.9 2013 ............................................................... 2.95 2.95 2.96 3.01 7.8 7.8 7.8 7.7 2014 ............................................................... 3.02 3.01 3.02 3.04 7.6 7.5 7.5 7.5 2015 ............................................................... 3.06 3.05 3.06 3.08 7.5 7.4 7.4 7.2 2016 ............................................................... 3.09 3.09 3.11 3.09 7.2 7.1 7.1 7.1 2017 ............................................................... 3.13 – – – 7.2 – – –
Note: The sum of individual items may not equal totals due to rounding. Dashes indicate data are not available.
-56-
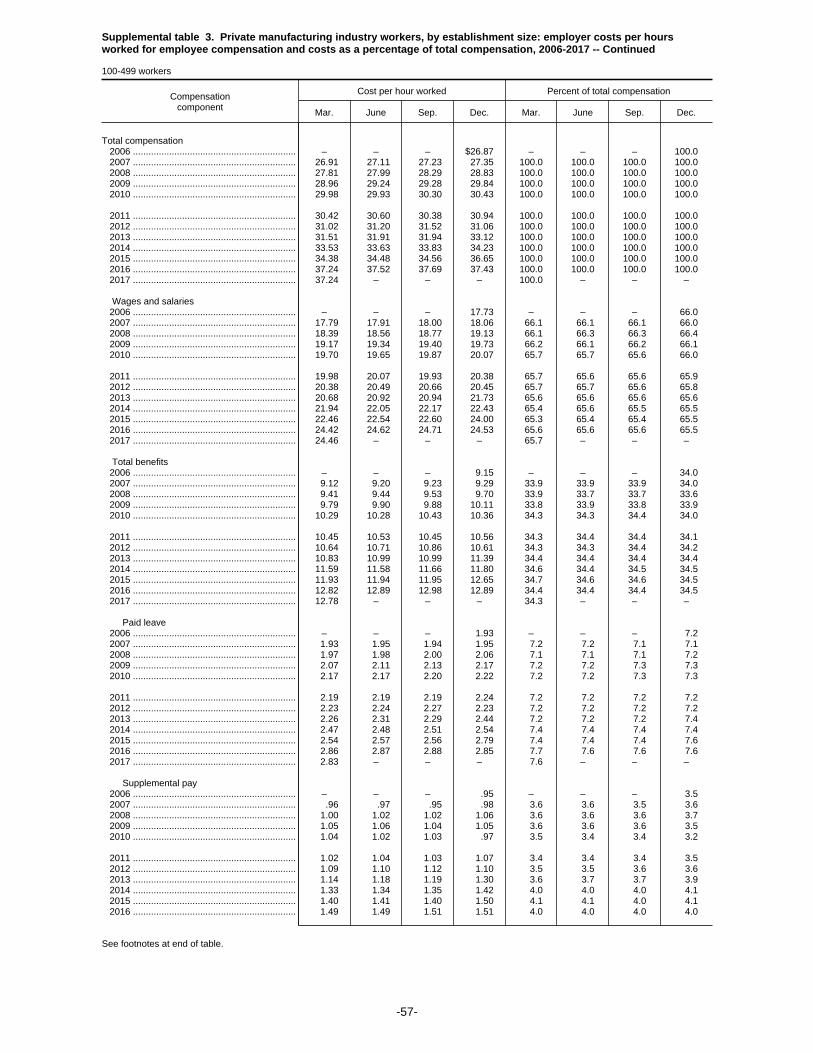
Supplemental table 3. Private manufacturing industry workers, by establishment size: employer costs per hoursworked for employee compensation and costs as a percentage of total compensation, 2006-2017 -- Continued
100-499 workers
Compensationcomponent
Cost per hour worked Percent of total compensation
Mar. June Sep. Dec. Mar. June Sep. Dec.
Total compensation 2006 ............................................................... – – – $26.87 – – – 100.0 2007 ............................................................... 26.91 27.11 27.23 27.35 100.0 100.0 100.0 100.0 2008 ............................................................... 27.81 27.99 28.29 28.83 100.0 100.0 100.0 100.0 2009 ............................................................... 28.96 29.24 29.28 29.84 100.0 100.0 100.0 100.0 2010 ............................................................... 29.98 29.93 30.30 30.43 100.0 100.0 100.0 100.0
2011 ............................................................... 30.42 30.60 30.38 30.94 100.0 100.0 100.0 100.0 2012 ............................................................... 31.02 31.20 31.52 31.06 100.0 100.0 100.0 100.0 2013 ............................................................... 31.51 31.91 31.94 33.12 100.0 100.0 100.0 100.0 2014 ............................................................... 33.53 33.63 33.83 34.23 100.0 100.0 100.0 100.0 2015 ............................................................... 34.38 34.48 34.56 36.65 100.0 100.0 100.0 100.0 2016 ............................................................... 37.24 37.52 37.69 37.43 100.0 100.0 100.0 100.0 2017 ............................................................... 37.24 – – – 100.0 – – –
Wages and salaries 2006 ............................................................... – – – 17.73 – – – 66.0 2007 ............................................................... 17.79 17.91 18.00 18.06 66.1 66.1 66.1 66.0 2008 ............................................................... 18.39 18.56 18.77 19.13 66.1 66.3 66.3 66.4 2009 ............................................................... 19.17 19.34 19.40 19.73 66.2 66.1 66.2 66.1 2010 ............................................................... 19.70 19.65 19.87 20.07 65.7 65.7 65.6 66.0
2011 ............................................................... 19.98 20.07 19.93 20.38 65.7 65.6 65.6 65.9 2012 ............................................................... 20.38 20.49 20.66 20.45 65.7 65.7 65.6 65.8 2013 ............................................................... 20.68 20.92 20.94 21.73 65.6 65.6 65.6 65.6 2014 ............................................................... 21.94 22.05 22.17 22.43 65.4 65.6 65.5 65.5 2015 ............................................................... 22.46 22.54 22.60 24.00 65.3 65.4 65.4 65.5 2016 ............................................................... 24.42 24.62 24.71 24.53 65.6 65.6 65.6 65.5 2017 ............................................................... 24.46 – – – 65.7 – – –
Total benefits 2006 ............................................................... – – – 9.15 – – – 34.0 2007 ............................................................... 9.12 9.20 9.23 9.29 33.9 33.9 33.9 34.0 2008 ............................................................... 9.41 9.44 9.53 9.70 33.9 33.7 33.7 33.6 2009 ............................................................... 9.79 9.90 9.88 10.11 33.8 33.9 33.8 33.9 2010 ............................................................... 10.29 10.28 10.43 10.36 34.3 34.3 34.4 34.0
2011 ............................................................... 10.45 10.53 10.45 10.56 34.3 34.4 34.4 34.1 2012 ............................................................... 10.64 10.71 10.86 10.61 34.3 34.3 34.4 34.2 2013 ............................................................... 10.83 10.99 10.99 11.39 34.4 34.4 34.4 34.4 2014 ............................................................... 11.59 11.58 11.66 11.80 34.6 34.4 34.5 34.5 2015 ............................................................... 11.93 11.94 11.95 12.65 34.7 34.6 34.6 34.5 2016 ............................................................... 12.82 12.89 12.98 12.89 34.4 34.4 34.4 34.5 2017 ............................................................... 12.78 – – – 34.3 – – –
Paid leave 2006 ............................................................... – – – 1.93 – – – 7.2 2007 ............................................................... 1.93 1.95 1.94 1.95 7.2 7.2 7.1 7.1 2008 ............................................................... 1.97 1.98 2.00 2.06 7.1 7.1 7.1 7.2 2009 ............................................................... 2.07 2.11 2.13 2.17 7.2 7.2 7.3 7.3 2010 ............................................................... 2.17 2.17 2.20 2.22 7.2 7.2 7.3 7.3
2011 ............................................................... 2.19 2.19 2.19 2.24 7.2 7.2 7.2 7.2 2012 ............................................................... 2.23 2.24 2.27 2.23 7.2 7.2 7.2 7.2 2013 ............................................................... 2.26 2.31 2.29 2.44 7.2 7.2 7.2 7.4 2014 ............................................................... 2.47 2.48 2.51 2.54 7.4 7.4 7.4 7.4 2015 ............................................................... 2.54 2.57 2.56 2.79 7.4 7.4 7.4 7.6 2016 ............................................................... 2.86 2.87 2.88 2.85 7.7 7.6 7.6 7.6 2017 ............................................................... 2.83 – – – 7.6 – – –
Supplemental pay 2006 ............................................................... – – – .95 – – – 3.5 2007 ............................................................... .96 .97 .95 .98 3.6 3.6 3.5 3.6 2008 ............................................................... 1.00 1.02 1.02 1.06 3.6 3.6 3.6 3.7 2009 ............................................................... 1.05 1.06 1.04 1.05 3.6 3.6 3.6 3.5 2010 ............................................................... 1.04 1.02 1.03 .97 3.5 3.4 3.4 3.2
2011 ............................................................... 1.02 1.04 1.03 1.07 3.4 3.4 3.4 3.5 2012 ............................................................... 1.09 1.10 1.12 1.10 3.5 3.5 3.6 3.6 2013 ............................................................... 1.14 1.18 1.19 1.30 3.6 3.7 3.7 3.9 2014 ............................................................... 1.33 1.34 1.35 1.42 4.0 4.0 4.0 4.1 2015 ............................................................... 1.40 1.41 1.40 1.50 4.1 4.1 4.0 4.1 2016 ............................................................... 1.49 1.49 1.51 1.51 4.0 4.0 4.0 4.0
See footnotes at end of table.
-57-
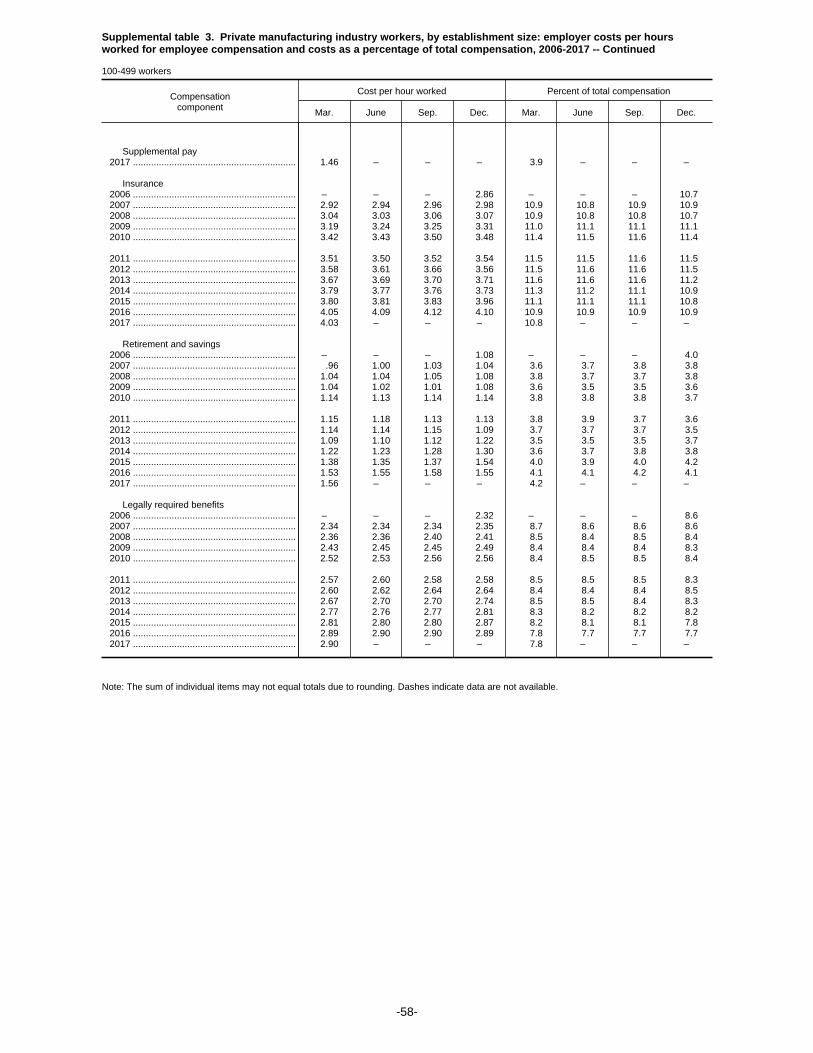
Supplemental table 3. Private manufacturing industry workers, by establishment size: employer costs per hoursworked for employee compensation and costs as a percentage of total compensation, 2006-2017 -- Continued
100-499 workers
Compensationcomponent
Cost per hour worked Percent of total compensation
Mar. June Sep. Dec. Mar. June Sep. Dec.
Supplemental pay 2017 ............................................................... 1.46 – – – 3.9 – – –
Insurance 2006 ............................................................... – – – 2.86 – – – 10.7 2007 ............................................................... 2.92 2.94 2.96 2.98 10.9 10.8 10.9 10.9 2008 ............................................................... 3.04 3.03 3.06 3.07 10.9 10.8 10.8 10.7 2009 ............................................................... 3.19 3.24 3.25 3.31 11.0 11.1 11.1 11.1 2010 ............................................................... 3.42 3.43 3.50 3.48 11.4 11.5 11.6 11.4
2011 ............................................................... 3.51 3.50 3.52 3.54 11.5 11.5 11.6 11.5 2012 ............................................................... 3.58 3.61 3.66 3.56 11.5 11.6 11.6 11.5 2013 ............................................................... 3.67 3.69 3.70 3.71 11.6 11.6 11.6 11.2 2014 ............................................................... 3.79 3.77 3.76 3.73 11.3 11.2 11.1 10.9 2015 ............................................................... 3.80 3.81 3.83 3.96 11.1 11.1 11.1 10.8 2016 ............................................................... 4.05 4.09 4.12 4.10 10.9 10.9 10.9 10.9 2017 ............................................................... 4.03 – – – 10.8 – – –
Retirement and savings 2006 ............................................................... – – – 1.08 – – – 4.0 2007 ............................................................... .96 1.00 1.03 1.04 3.6 3.7 3.8 3.8 2008 ............................................................... 1.04 1.04 1.05 1.08 3.8 3.7 3.7 3.8 2009 ............................................................... 1.04 1.02 1.01 1.08 3.6 3.5 3.5 3.6 2010 ............................................................... 1.14 1.13 1.14 1.14 3.8 3.8 3.8 3.7
2011 ............................................................... 1.15 1.18 1.13 1.13 3.8 3.9 3.7 3.6 2012 ............................................................... 1.14 1.14 1.15 1.09 3.7 3.7 3.7 3.5 2013 ............................................................... 1.09 1.10 1.12 1.22 3.5 3.5 3.5 3.7 2014 ............................................................... 1.22 1.23 1.28 1.30 3.6 3.7 3.8 3.8 2015 ............................................................... 1.38 1.35 1.37 1.54 4.0 3.9 4.0 4.2 2016 ............................................................... 1.53 1.55 1.58 1.55 4.1 4.1 4.2 4.1 2017 ............................................................... 1.56 – – – 4.2 – – –
Legally required benefits 2006 ............................................................... – – – 2.32 – – – 8.6 2007 ............................................................... 2.34 2.34 2.34 2.35 8.7 8.6 8.6 8.6 2008 ............................................................... 2.36 2.36 2.40 2.41 8.5 8.4 8.5 8.4 2009 ............................................................... 2.43 2.45 2.45 2.49 8.4 8.4 8.4 8.3 2010 ............................................................... 2.52 2.53 2.56 2.56 8.4 8.5 8.5 8.4
2011 ............................................................... 2.57 2.60 2.58 2.58 8.5 8.5 8.5 8.3 2012 ............................................................... 2.60 2.62 2.64 2.64 8.4 8.4 8.4 8.5 2013 ............................................................... 2.67 2.70 2.70 2.74 8.5 8.5 8.4 8.3 2014 ............................................................... 2.77 2.76 2.77 2.81 8.3 8.2 8.2 8.2 2015 ............................................................... 2.81 2.80 2.80 2.87 8.2 8.1 8.1 7.8 2016 ............................................................... 2.89 2.90 2.90 2.89 7.8 7.7 7.7 7.7 2017 ............................................................... 2.90 – – – 7.8 – – –
Note: The sum of individual items may not equal totals due to rounding. Dashes indicate data are not available.
-58-
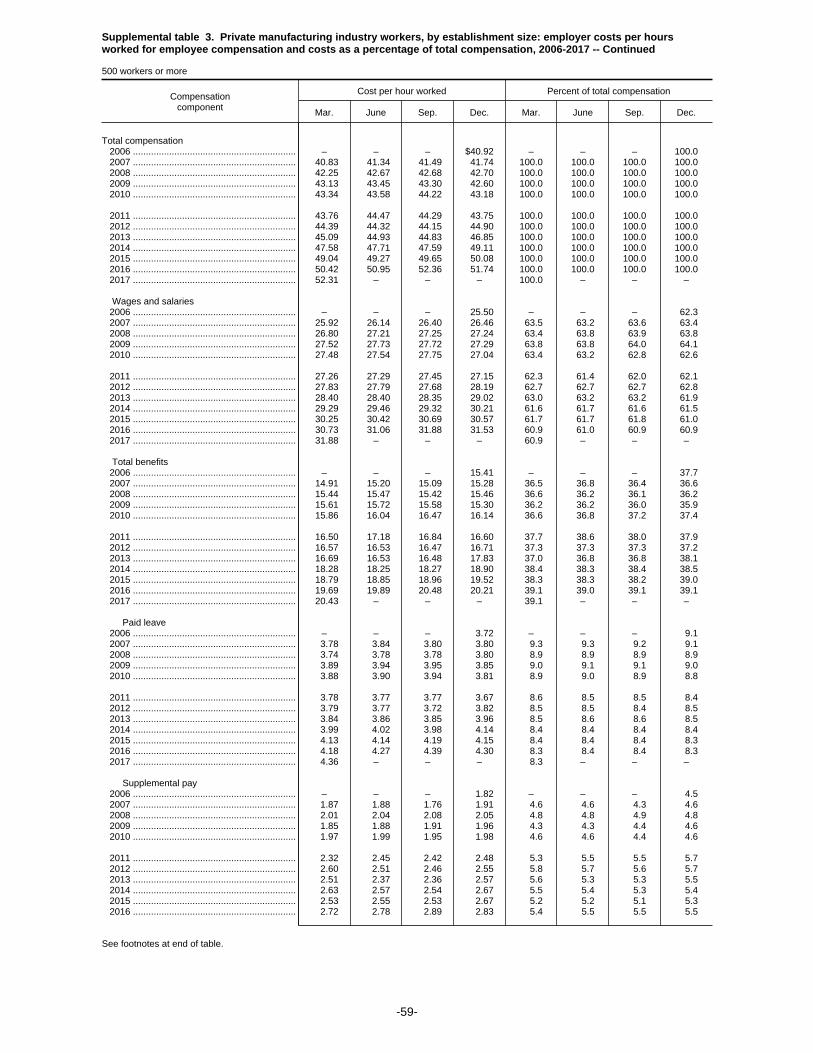
Supplemental table 3. Private manufacturing industry workers, by establishment size: employer costs per hoursworked for employee compensation and costs as a percentage of total compensation, 2006-2017 -- Continued
500 workers or more
Compensationcomponent
Cost per hour worked Percent of total compensation
Mar. June Sep. Dec. Mar. June Sep. Dec.
Total compensation 2006 ............................................................... – – – $40.92 – – – 100.0 2007 ............................................................... 40.83 41.34 41.49 41.74 100.0 100.0 100.0 100.0 2008 ............................................................... 42.25 42.67 42.68 42.70 100.0 100.0 100.0 100.0 2009 ............................................................... 43.13 43.45 43.30 42.60 100.0 100.0 100.0 100.0 2010 ............................................................... 43.34 43.58 44.22 43.18 100.0 100.0 100.0 100.0
2011 ............................................................... 43.76 44.47 44.29 43.75 100.0 100.0 100.0 100.0 2012 ............................................................... 44.39 44.32 44.15 44.90 100.0 100.0 100.0 100.0 2013 ............................................................... 45.09 44.93 44.83 46.85 100.0 100.0 100.0 100.0 2014 ............................................................... 47.58 47.71 47.59 49.11 100.0 100.0 100.0 100.0 2015 ............................................................... 49.04 49.27 49.65 50.08 100.0 100.0 100.0 100.0 2016 ............................................................... 50.42 50.95 52.36 51.74 100.0 100.0 100.0 100.0 2017 ............................................................... 52.31 – – – 100.0 – – –
Wages and salaries 2006 ............................................................... – – – 25.50 – – – 62.3 2007 ............................................................... 25.92 26.14 26.40 26.46 63.5 63.2 63.6 63.4 2008 ............................................................... 26.80 27.21 27.25 27.24 63.4 63.8 63.9 63.8 2009 ............................................................... 27.52 27.73 27.72 27.29 63.8 63.8 64.0 64.1 2010 ............................................................... 27.48 27.54 27.75 27.04 63.4 63.2 62.8 62.6
2011 ............................................................... 27.26 27.29 27.45 27.15 62.3 61.4 62.0 62.1 2012 ............................................................... 27.83 27.79 27.68 28.19 62.7 62.7 62.7 62.8 2013 ............................................................... 28.40 28.40 28.35 29.02 63.0 63.2 63.2 61.9 2014 ............................................................... 29.29 29.46 29.32 30.21 61.6 61.7 61.6 61.5 2015 ............................................................... 30.25 30.42 30.69 30.57 61.7 61.7 61.8 61.0 2016 ............................................................... 30.73 31.06 31.88 31.53 60.9 61.0 60.9 60.9 2017 ............................................................... 31.88 – – – 60.9 – – –
Total benefits 2006 ............................................................... – – – 15.41 – – – 37.7 2007 ............................................................... 14.91 15.20 15.09 15.28 36.5 36.8 36.4 36.6 2008 ............................................................... 15.44 15.47 15.42 15.46 36.6 36.2 36.1 36.2 2009 ............................................................... 15.61 15.72 15.58 15.30 36.2 36.2 36.0 35.9 2010 ............................................................... 15.86 16.04 16.47 16.14 36.6 36.8 37.2 37.4
2011 ............................................................... 16.50 17.18 16.84 16.60 37.7 38.6 38.0 37.9 2012 ............................................................... 16.57 16.53 16.47 16.71 37.3 37.3 37.3 37.2 2013 ............................................................... 16.69 16.53 16.48 17.83 37.0 36.8 36.8 38.1 2014 ............................................................... 18.28 18.25 18.27 18.90 38.4 38.3 38.4 38.5 2015 ............................................................... 18.79 18.85 18.96 19.52 38.3 38.3 38.2 39.0 2016 ............................................................... 19.69 19.89 20.48 20.21 39.1 39.0 39.1 39.1 2017 ............................................................... 20.43 – – – 39.1 – – –
Paid leave 2006 ............................................................... – – – 3.72 – – – 9.1 2007 ............................................................... 3.78 3.84 3.80 3.80 9.3 9.3 9.2 9.1 2008 ............................................................... 3.74 3.78 3.78 3.80 8.9 8.9 8.9 8.9 2009 ............................................................... 3.89 3.94 3.95 3.85 9.0 9.1 9.1 9.0 2010 ............................................................... 3.88 3.90 3.94 3.81 8.9 9.0 8.9 8.8
2011 ............................................................... 3.78 3.77 3.77 3.67 8.6 8.5 8.5 8.4 2012 ............................................................... 3.79 3.77 3.72 3.82 8.5 8.5 8.4 8.5 2013 ............................................................... 3.84 3.86 3.85 3.96 8.5 8.6 8.6 8.5 2014 ............................................................... 3.99 4.02 3.98 4.14 8.4 8.4 8.4 8.4 2015 ............................................................... 4.13 4.14 4.19 4.15 8.4 8.4 8.4 8.3 2016 ............................................................... 4.18 4.27 4.39 4.30 8.3 8.4 8.4 8.3 2017 ............................................................... 4.36 – – – 8.3 – – –
Supplemental pay 2006 ............................................................... – – – 1.82 – – – 4.5 2007 ............................................................... 1.87 1.88 1.76 1.91 4.6 4.6 4.3 4.6 2008 ............................................................... 2.01 2.04 2.08 2.05 4.8 4.8 4.9 4.8 2009 ............................................................... 1.85 1.88 1.91 1.96 4.3 4.3 4.4 4.6 2010 ............................................................... 1.97 1.99 1.95 1.98 4.6 4.6 4.4 4.6
2011 ............................................................... 2.32 2.45 2.42 2.48 5.3 5.5 5.5 5.7 2012 ............................................................... 2.60 2.51 2.46 2.55 5.8 5.7 5.6 5.7 2013 ............................................................... 2.51 2.37 2.36 2.57 5.6 5.3 5.3 5.5 2014 ............................................................... 2.63 2.57 2.54 2.67 5.5 5.4 5.3 5.4 2015 ............................................................... 2.53 2.55 2.53 2.67 5.2 5.2 5.1 5.3 2016 ............................................................... 2.72 2.78 2.89 2.83 5.4 5.5 5.5 5.5
See footnotes at end of table.
-59-

Supplemental table 3. Private manufacturing industry workers, by establishment size: employer costs per hoursworked for employee compensation and costs as a percentage of total compensation, 2006-2017 -- Continued
500 workers or more
Compensationcomponent
Cost per hour worked Percent of total compensation
Mar. June Sep. Dec. Mar. June Sep. Dec.
Supplemental pay 2017 ............................................................... 2.81 – – – 5.4 – – –
Insurance 2006 ............................................................... – – – 3.87 – – – 9.5 2007 ............................................................... 3.91 4.05 4.08 4.10 9.6 9.8 9.8 9.8 2008 ............................................................... 4.19 4.16 4.14 4.13 9.9 9.8 9.7 9.7 2009 ............................................................... 4.34 4.33 4.35 4.31 10.1 10.0 10.0 10.1 2010 ............................................................... 4.50 4.57 4.58 4.51 10.4 10.5 10.4 10.4
2011 ............................................................... 4.52 4.55 4.52 4.47 10.3 10.2 10.2 10.2 2012 ............................................................... 4.58 4.62 4.59 4.66 10.3 10.4 10.4 10.4 2013 ............................................................... 4.65 4.67 4.66 4.82 10.3 10.4 10.4 10.3 2014 ............................................................... 4.83 4.89 4.86 4.90 10.2 10.2 10.2 10.0 2015 ............................................................... 4.98 5.00 5.04 5.14 10.1 10.1 10.2 10.3 2016 ............................................................... 5.21 5.24 5.42 5.35 10.3 10.3 10.3 10.3 2017 ............................................................... 5.40 – – – 10.3 – – –
Retirement and savings 2006 ............................................................... – – – 2.88 – – – 7.0 2007 ............................................................... 2.22 2.26 2.27 2.30 5.4 5.5 5.5 5.5 2008 ............................................................... 2.33 2.29 2.22 2.32 5.5 5.4 5.2 5.4 2009 ............................................................... 2.34 2.36 2.17 2.01 5.4 5.4 5.0 4.7 2010 ............................................................... 2.29 2.34 2.73 2.63 5.3 5.4 6.2 6.1
2011 ............................................................... 2.66 3.18 2.91 2.80 6.1 7.2 6.6 6.4 2012 ............................................................... 2.34 2.34 2.43 2.37 5.3 5.3 5.5 5.3 2013 ............................................................... 2.40 2.36 2.33 3.13 5.3 5.3 5.2 6.7 2014 ............................................................... 3.49 3.46 3.58 3.83 7.3 7.2 7.5 7.8 2015 ............................................................... 3.78 3.79 3.80 4.22 7.7 7.7 7.7 8.4 2016 ............................................................... 4.25 4.26 4.40 4.37 8.4 8.4 8.4 8.4 2017 ............................................................... 4.43 – – – 8.5 – – –
Legally required benefits 2006 ............................................................... – – – 3.12 – – – 7.6 2007 ............................................................... 3.14 3.17 3.17 3.17 7.7 7.7 7.6 7.6 2008 ............................................................... 3.17 3.19 3.19 3.17 7.5 7.5 7.5 7.4 2009 ............................................................... 3.18 3.21 3.21 3.17 7.4 7.4 7.4 7.4 2010 ............................................................... 3.23 3.24 3.27 3.20 7.4 7.4 7.4 7.4
2011 ............................................................... 3.22 3.23 3.22 3.18 7.4 7.3 7.3 7.3 2012 ............................................................... 3.26 3.28 3.27 3.32 7.3 7.4 7.4 7.4 2013 ............................................................... 3.28 3.27 3.28 3.36 7.3 7.3 7.3 7.2 2014 ............................................................... 3.34 3.32 3.31 3.35 7.0 7.0 7.0 6.8 2015 ............................................................... 3.37 3.36 3.39 3.34 6.9 6.8 6.8 6.7 2016 ............................................................... 3.34 3.33 3.39 3.36 6.6 6.5 6.5 6.5 2017 ............................................................... 3.44 – – – 6.6 – – –
Note: The sum of individual items may not equal totals due to rounding. Dashes indicate data are not available.
-60-

Supplemental table 4. Private manufacturing industry workers, by bargaining status: employer costs per hours workedfor employee compensation and costs as a percentage of total compensation, 2006-2017
Union workers
Compensationcomponent
Cost per hour worked Percent of total compensation
Mar. June Sep. Dec. Mar. June Sep. Dec.
Total compensation 2006 ............................................................... – – – $34.05 – – – 100.0 2007 ............................................................... 33.29 33.61 33.77 34.08 100.0 100.0 100.0 100.0 2008 ............................................................... 34.17 34.30 34.17 33.56 100.0 100.0 100.0 100.0 2009 ............................................................... 33.74 34.04 34.12 34.10 100.0 100.0 100.0 100.0 2010 ............................................................... 34.73 34.83 35.44 35.01 100.0 100.0 100.0 100.0
2011 ............................................................... 35.12 35.87 35.48 35.43 100.0 100.0 100.0 100.0 2012 ............................................................... 34.99 35.16 35.42 35.60 100.0 100.0 100.0 100.0 2013 ............................................................... 35.72 35.69 35.71 37.88 100.0 100.0 100.0 100.0 2014 ............................................................... 38.37 38.62 39.16 39.91 100.0 100.0 100.0 100.0 2015 ............................................................... 40.11 40.16 40.52 43.24 100.0 100.0 100.0 100.0 2016 ............................................................... 43.53 43.79 41.54 41.83 100.0 100.0 100.0 100.0 2017 ............................................................... 41.81 – – – 100.0 – – –
Wages and salaries 2006 ............................................................... – – – 20.03 – – – 58.8 2007 ............................................................... 20.05 20.17 20.37 20.32 60.2 60.0 60.3 59.6 2008 ............................................................... 20.46 20.66 20.64 20.25 59.9 60.2 60.4 60.3 2009 ............................................................... 20.22 20.39 20.46 20.41 59.9 59.9 60.0 59.9 2010 ............................................................... 20.48 20.55 20.68 20.51 59.0 59.0 58.4 58.6
2011 ............................................................... 20.61 20.66 20.74 20.62 58.7 57.6 58.4 58.2 2012 ............................................................... 20.75 20.76 20.81 20.87 59.3 59.0 58.8 58.6 2013 ............................................................... 21.08 21.12 21.27 22.31 59.0 59.2 59.6 58.9 2014 ............................................................... 22.46 22.63 22.85 23.06 58.5 58.6 58.4 57.8 2015 ............................................................... 23.18 23.25 23.38 24.41 57.8 57.9 57.7 56.5 2016 ............................................................... 24.52 24.65 23.57 23.75 56.3 56.3 56.7 56.8 2017 ............................................................... 23.82 – – – 57.0 – – –
Total benefits 2006 ............................................................... – – – 14.02 – – – 41.2 2007 ............................................................... 13.24 13.44 13.40 13.76 39.8 40.0 39.7 40.4 2008 ............................................................... 13.72 13.64 13.54 13.31 40.1 39.8 39.6 39.7 2009 ............................................................... 13.51 13.66 13.67 13.68 40.1 40.1 40.0 40.1 2010 ............................................................... 14.24 14.28 14.76 14.50 41.0 41.0 41.6 41.4
2011 ............................................................... 14.51 15.21 14.75 14.81 41.3 42.4 41.6 41.8 2012 ............................................................... 14.24 14.40 14.61 14.73 40.7 41.0 41.2 41.4 2013 ............................................................... 14.64 14.57 14.44 15.58 41.0 40.8 40.4 41.1 2014 ............................................................... 15.91 15.99 16.31 16.85 41.5 41.4 41.6 42.2 2015 ............................................................... 16.93 16.91 17.14 18.83 42.2 42.1 42.3 43.5 2016 ............................................................... 19.01 19.14 17.97 18.08 43.7 43.7 43.3 43.2 2017 ............................................................... 17.99 – – – 43.0 – – –
Paid leave 2006 ............................................................... – – – 2.84 – – – 8.3 2007 ............................................................... 2.83 2.89 2.86 2.87 8.5 8.6 8.5 8.4 2008 ............................................................... 2.71 2.69 2.69 2.60 7.9 7.9 7.9 7.8 2009 ............................................................... 2.66 2.71 2.73 2.68 7.9 8.0 8.0 7.9 2010 ............................................................... 2.71 2.74 2.75 2.68 7.8 7.9 7.8 7.6
2011 ............................................................... 2.59 2.60 2.56 2.49 7.4 7.2 7.2 7.0 2012 ............................................................... 2.50 2.49 2.47 2.50 7.1 7.1 7.0 7.0 2013 ............................................................... 2.55 2.57 2.58 2.76 7.1 7.2 7.2 7.3 2014 ............................................................... 2.77 2.80 2.84 2.92 7.2 7.2 7.3 7.3 2015 ............................................................... 2.93 2.93 2.95 3.09 7.3 7.3 7.3 7.2 2016 ............................................................... 3.13 3.21 2.95 2.96 7.2 7.3 7.1 7.1 2017 ............................................................... 2.95 – – – 7.1 – – –
Supplemental pay 2006 ............................................................... – – – 1.64 – – – 4.8 2007 ............................................................... 1.62 1.60 1.55 1.78 4.9 4.8 4.6 5.2 2008 ............................................................... 1.90 1.95 1.98 1.79 5.5 5.7 5.8 5.3 2009 ............................................................... 1.64 1.65 1.68 1.63 4.9 4.8 4.9 4.8 2010 ............................................................... 1.53 1.49 1.48 1.46 4.4 4.3 4.2 4.2
2011 ............................................................... 1.66 1.65 1.64 1.71 4.7 4.6 4.6 4.8 2012 ............................................................... 1.78 1.84 1.85 1.83 5.1 5.2 5.2 5.2 2013 ............................................................... 1.78 1.71 1.72 1.80 5.0 4.8 4.8 4.8 2014 ............................................................... 1.89 1.92 1.93 2.00 4.9 5.0 4.9 5.0 2015 ............................................................... 1.88 1.91 1.93 2.13 4.7 4.8 4.8 4.9 2016 ............................................................... 2.32 2.37 2.38 2.38 5.3 5.4 5.7 5.7
See footnotes at end of table.
-61-
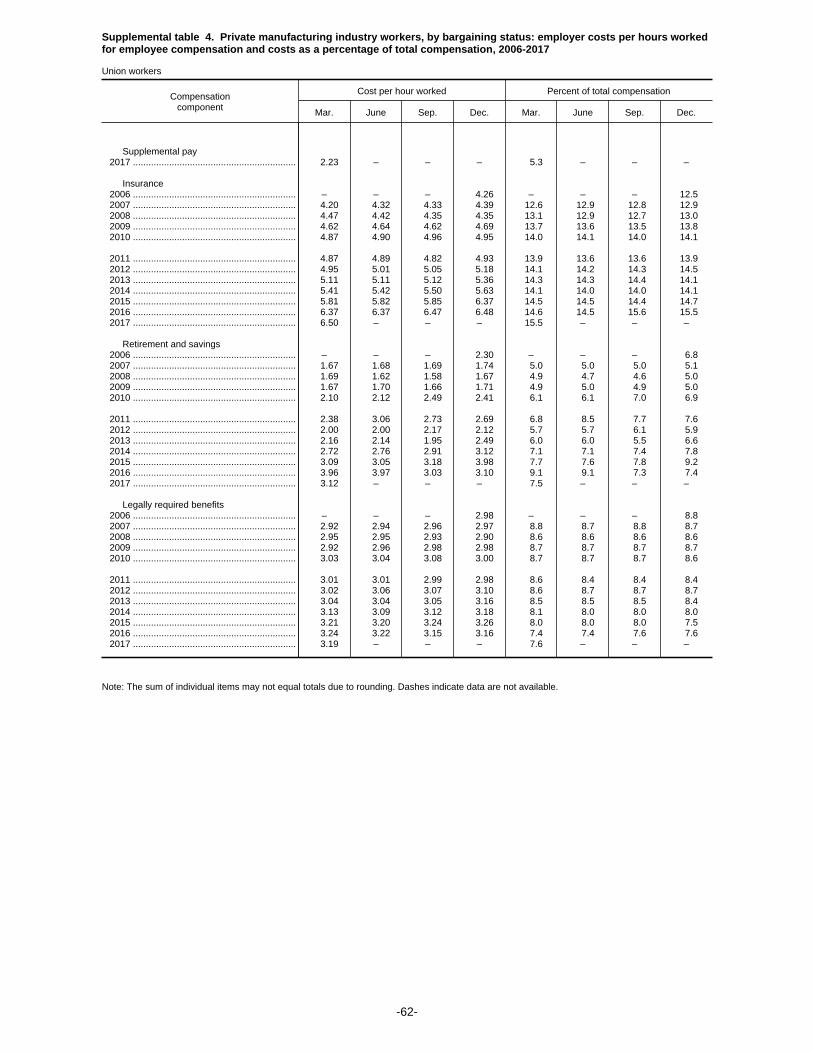
Supplemental table 4. Private manufacturing industry workers, by bargaining status: employer costs per hours workedfor employee compensation and costs as a percentage of total compensation, 2006-2017
Union workers
Compensationcomponent
Cost per hour worked Percent of total compensation
Mar. June Sep. Dec. Mar. June Sep. Dec.
Supplemental pay 2017 ............................................................... 2.23 – – – 5.3 – – –
Insurance 2006 ............................................................... – – – 4.26 – – – 12.5 2007 ............................................................... 4.20 4.32 4.33 4.39 12.6 12.9 12.8 12.9 2008 ............................................................... 4.47 4.42 4.35 4.35 13.1 12.9 12.7 13.0 2009 ............................................................... 4.62 4.64 4.62 4.69 13.7 13.6 13.5 13.8 2010 ............................................................... 4.87 4.90 4.96 4.95 14.0 14.1 14.0 14.1
2011 ............................................................... 4.87 4.89 4.82 4.93 13.9 13.6 13.6 13.9 2012 ............................................................... 4.95 5.01 5.05 5.18 14.1 14.2 14.3 14.5 2013 ............................................................... 5.11 5.11 5.12 5.36 14.3 14.3 14.4 14.1 2014 ............................................................... 5.41 5.42 5.50 5.63 14.1 14.0 14.0 14.1 2015 ............................................................... 5.81 5.82 5.85 6.37 14.5 14.5 14.4 14.7 2016 ............................................................... 6.37 6.37 6.47 6.48 14.6 14.5 15.6 15.5 2017 ............................................................... 6.50 – – – 15.5 – – –
Retirement and savings 2006 ............................................................... – – – 2.30 – – – 6.8 2007 ............................................................... 1.67 1.68 1.69 1.74 5.0 5.0 5.0 5.1 2008 ............................................................... 1.69 1.62 1.58 1.67 4.9 4.7 4.6 5.0 2009 ............................................................... 1.67 1.70 1.66 1.71 4.9 5.0 4.9 5.0 2010 ............................................................... 2.10 2.12 2.49 2.41 6.1 6.1 7.0 6.9
2011 ............................................................... 2.38 3.06 2.73 2.69 6.8 8.5 7.7 7.6 2012 ............................................................... 2.00 2.00 2.17 2.12 5.7 5.7 6.1 5.9 2013 ............................................................... 2.16 2.14 1.95 2.49 6.0 6.0 5.5 6.6 2014 ............................................................... 2.72 2.76 2.91 3.12 7.1 7.1 7.4 7.8 2015 ............................................................... 3.09 3.05 3.18 3.98 7.7 7.6 7.8 9.2 2016 ............................................................... 3.96 3.97 3.03 3.10 9.1 9.1 7.3 7.4 2017 ............................................................... 3.12 – – – 7.5 – – –
Legally required benefits 2006 ............................................................... – – – 2.98 – – – 8.8 2007 ............................................................... 2.92 2.94 2.96 2.97 8.8 8.7 8.8 8.7 2008 ............................................................... 2.95 2.95 2.93 2.90 8.6 8.6 8.6 8.6 2009 ............................................................... 2.92 2.96 2.98 2.98 8.7 8.7 8.7 8.7 2010 ............................................................... 3.03 3.04 3.08 3.00 8.7 8.7 8.7 8.6
2011 ............................................................... 3.01 3.01 2.99 2.98 8.6 8.4 8.4 8.4 2012 ............................................................... 3.02 3.06 3.07 3.10 8.6 8.7 8.7 8.7 2013 ............................................................... 3.04 3.04 3.05 3.16 8.5 8.5 8.5 8.4 2014 ............................................................... 3.13 3.09 3.12 3.18 8.1 8.0 8.0 8.0 2015 ............................................................... 3.21 3.20 3.24 3.26 8.0 8.0 8.0 7.5 2016 ............................................................... 3.24 3.22 3.15 3.16 7.4 7.4 7.6 7.6 2017 ............................................................... 3.19 – – – 7.6 – – –
Note: The sum of individual items may not equal totals due to rounding. Dashes indicate data are not available.
-62-

Supplemental table 4. Private manufacturing industry workers, by bargaining status: employer costs per hours workedfor employee compensation and costs as a percentage of total compensation, 2006-2017 -- Continued
Nonunion workers
Compensationcomponent
Cost per hour worked Percent of total compensation
Mar. June Sep. Dec. Mar. June Sep. Dec.
Total compensation 2006 ............................................................... – – – $29.38 – – – 100.0 2007 ............................................................... 29.66 29.82 30.11 30.30 100.0 100.0 100.0 100.0 2008 ............................................................... 30.77 30.97 31.15 31.46 100.0 100.0 100.0 100.0 2009 ............................................................... 31.61 31.57 31.52 31.39 100.0 100.0 100.0 100.0 2010 ............................................................... 31.58 31.75 32.00 31.55 100.0 100.0 100.0 100.0
2011 ............................................................... 32.08 32.35 32.33 32.33 100.0 100.0 100.0 100.0 2012 ............................................................... 32.53 32.56 32.77 33.07 100.0 100.0 100.0 100.0 2013 ............................................................... 33.37 33.43 33.53 34.59 100.0 100.0 100.0 100.0 2014 ............................................................... 35.04 35.15 35.25 36.19 100.0 100.0 100.0 100.0 2015 ............................................................... 36.31 36.41 36.66 37.72 100.0 100.0 100.0 100.0 2016 ............................................................... 38.00 38.32 38.86 38.94 100.0 100.0 100.0 100.0 2017 ............................................................... 39.32 – – – 100.0 – – –
Wages and salaries 2006 ............................................................... – – – 19.74 – – – 67.2 2007 ............................................................... 19.99 20.03 20.28 20.37 67.4 67.2 67.3 67.2 2008 ............................................................... 20.70 20.87 21.04 21.32 67.3 67.4 67.5 67.8 2009 ............................................................... 21.43 21.42 21.45 21.42 67.8 67.9 68.1 68.2 2010 ............................................................... 21.45 21.53 21.69 21.42 67.9 67.8 67.8 67.9
2011 ............................................................... 21.60 21.69 21.70 21.83 67.3 67.1 67.1 67.5 2012 ............................................................... 21.96 21.99 22.14 22.31 67.5 67.5 67.6 67.5 2013 ............................................................... 22.48 22.55 22.58 23.08 67.4 67.5 67.3 66.7 2014 ............................................................... 23.30 23.42 23.46 24.11 66.5 66.6 66.6 66.6 2015 ............................................................... 24.19 24.25 24.49 25.07 66.6 66.6 66.8 66.5 2016 ............................................................... 25.30 25.54 25.84 25.92 66.6 66.7 66.5 66.5 2017 ............................................................... 26.19 – – – 66.6 – – –
Total benefits 2006 ............................................................... – – – 9.65 – – – 32.8 2007 ............................................................... 9.67 9.79 9.83 9.93 32.6 32.8 32.7 32.8 2008 ............................................................... 10.06 10.09 10.12 10.14 32.7 32.6 32.5 32.2 2009 ............................................................... 10.18 10.14 10.07 9.97 32.2 32.1 31.9 31.8 2010 ............................................................... 10.13 10.22 10.32 10.13 32.1 32.2 32.2 32.1
2011 ............................................................... 10.48 10.66 10.64 10.50 32.7 32.9 32.9 32.5 2012 ............................................................... 10.57 10.57 10.63 10.76 32.5 32.5 32.4 32.5 2013 ............................................................... 10.89 10.88 10.95 11.51 32.6 32.5 32.7 33.3 2014 ............................................................... 11.74 11.73 11.79 12.08 33.5 33.4 33.4 33.4 2015 ............................................................... 12.12 12.16 12.17 12.64 33.4 33.4 33.2 33.5 2016 ............................................................... 12.70 12.78 13.01 13.03 33.4 33.3 33.5 33.5 2017 ............................................................... 13.13 – – – 33.4 – – –
Paid leave 2006 ............................................................... – – – 2.23 – – – 7.6 2007 ............................................................... 2.26 2.27 2.27 2.27 7.6 7.6 7.5 7.5 2008 ............................................................... 2.30 2.32 2.33 2.39 7.5 7.5 7.5 7.6 2009 ............................................................... 2.40 2.40 2.40 2.38 7.6 7.6 7.6 7.6 2010 ............................................................... 2.38 2.39 2.41 2.38 7.5 7.5 7.5 7.5
2011 ............................................................... 2.41 2.41 2.41 2.43 7.5 7.5 7.5 7.5 2012 ............................................................... 2.45 2.45 2.47 2.50 7.5 7.5 7.5 7.6 2013 ............................................................... 2.53 2.53 2.53 2.62 7.6 7.6 7.6 7.6 2014 ............................................................... 2.66 2.67 2.67 2.75 7.6 7.6 7.6 7.6 2015 ............................................................... 2.76 2.76 2.79 2.87 7.6 7.6 7.6 7.6 2016 ............................................................... 2.90 2.93 2.96 2.96 7.6 7.6 7.6 7.6 2017 ............................................................... 3.00 – – – 7.6 – – –
Supplemental pay 2006 ............................................................... – – – 1.09 – – – 3.7 2007 ............................................................... 1.14 1.18 1.18 1.22 3.8 4.0 3.9 4.0 2008 ............................................................... 1.22 1.22 1.23 1.17 4.0 3.9 3.9 3.7 2009 ............................................................... 1.09 1.09 1.09 1.11 3.5 3.5 3.5 3.5 2010 ............................................................... 1.14 1.15 1.12 1.10 3.6 3.6 3.5 3.5
2011 ............................................................... 1.25 1.33 1.31 1.34 3.9 4.1 4.1 4.1 2012 ............................................................... 1.34 1.30 1.30 1.36 4.1 4.0 4.0 4.1 2013 ............................................................... 1.36 1.34 1.35 1.45 4.1 4.0 4.0 4.2 2014 ............................................................... 1.48 1.46 1.47 1.55 4.2 4.2 4.2 4.3 2015 ............................................................... 1.50 1.52 1.51 1.60 4.1 4.2 4.1 4.2 2016 ............................................................... 1.56 1.57 1.56 1.56 4.1 4.1 4.0 4.0
See footnotes at end of table.
-63-

Supplemental table 4. Private manufacturing industry workers, by bargaining status: employer costs per hours workedfor employee compensation and costs as a percentage of total compensation, 2006-2017 -- Continued
Nonunion workers
Compensationcomponent
Cost per hour worked Percent of total compensation
Mar. June Sep. Dec. Mar. June Sep. Dec.
Supplemental pay 2017 ............................................................... 1.55 – – – 4.0 – – –
Insurance 2006 ............................................................... – – – 2.58 – – – 8.8 2007 ............................................................... 2.67 2.71 2.72 2.75 9.0 9.1 9.0 9.1 2008 ............................................................... 2.81 2.82 2.84 2.84 9.1 9.1 9.1 9.0 2009 ............................................................... 2.92 2.93 2.93 2.90 9.2 9.3 9.3 9.2 2010 ............................................................... 2.97 2.99 3.02 2.97 9.4 9.4 9.4 9.4
2011 ............................................................... 3.05 3.06 3.09 3.01 9.5 9.5 9.5 9.3 2012 ............................................................... 3.04 3.06 3.08 3.11 9.3 9.4 9.4 9.4 2013 ............................................................... 3.19 3.19 3.19 3.28 9.5 9.5 9.5 9.5 2014 ............................................................... 3.34 3.35 3.34 3.34 9.5 9.5 9.5 9.2 2015 ............................................................... 3.39 3.40 3.41 3.48 9.3 9.3 9.3 9.2 2016 ............................................................... 3.53 3.56 3.58 3.58 9.3 9.3 9.2 9.2 2017 ............................................................... 3.59 – – – 9.1 – – –
Retirement and savings 2006 ............................................................... – – – 1.30 – – – 4.4 2007 ............................................................... 1.13 1.17 1.19 1.20 3.8 3.9 3.9 4.0 2008 ............................................................... 1.23 1.23 1.21 1.22 4.0 4.0 3.9 3.9 2009 ............................................................... 1.21 1.18 1.10 1.04 3.8 3.7 3.5 3.3 2010 ............................................................... 1.08 1.09 1.16 1.11 3.4 3.4 3.6 3.5
2011 ............................................................... 1.15 1.21 1.18 1.12 3.6 3.7 3.7 3.5 2012 ............................................................... 1.10 1.10 1.11 1.10 3.4 3.4 3.4 3.3 2013 ............................................................... 1.11 1.11 1.16 1.39 3.3 3.3 3.4 4.0 2014 ............................................................... 1.48 1.48 1.54 1.62 4.2 4.2 4.4 4.5 2015 ............................................................... 1.65 1.65 1.63 1.81 4.5 4.5 4.5 4.8 2016 ............................................................... 1.81 1.83 1.98 2.00 4.8 4.8 5.1 5.1 2017 ............................................................... 2.01 – – – 5.1 – – –
Legally required benefits 2006 ............................................................... – – – 2.45 – – – 8.3 2007 ............................................................... 2.47 2.46 2.48 2.49 8.3 8.3 8.2 8.2 2008 ............................................................... 2.49 2.50 2.51 2.52 8.1 8.1 8.1 8.0 2009 ............................................................... 2.55 2.54 2.55 2.54 8.1 8.1 8.1 8.1 2010 ............................................................... 2.57 2.59 2.61 2.57 8.2 8.2 8.1 8.1
2011 ............................................................... 2.62 2.65 2.64 2.61 8.2 8.2 8.2 8.1 2012 ............................................................... 2.64 2.66 2.68 2.69 8.1 8.2 8.2 8.1 2013 ............................................................... 2.71 2.71 2.72 2.76 8.1 8.1 8.1 8.0 2014 ............................................................... 2.78 2.77 2.77 2.82 7.9 7.9 7.9 7.8 2015 ............................................................... 2.83 2.82 2.83 2.88 7.8 7.7 7.7 7.6 2016 ............................................................... 2.89 2.90 2.92 2.92 7.6 7.6 7.5 7.5 2017 ............................................................... 2.97 – – – 7.5 – – –
Note: The sum of individual items may not equal totals due to rounding. Dashes indicate data are not available.
-64-
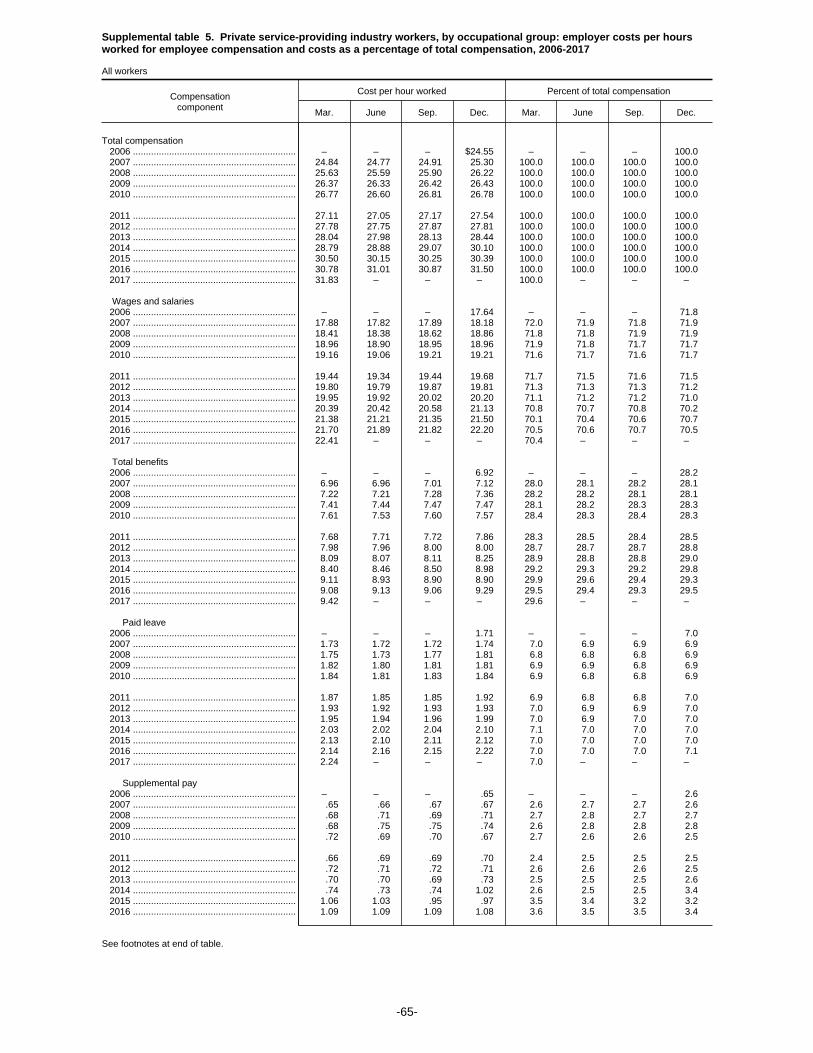
Supplemental table 5. Private service-providing industry workers, by occupational group: employer costs per hoursworked for employee compensation and costs as a percentage of total compensation, 2006-2017
All workers
Compensationcomponent
Cost per hour worked Percent of total compensation
Mar. June Sep. Dec. Mar. June Sep. Dec.
Total compensation 2006 ............................................................... – – – $24.55 – – – 100.0 2007 ............................................................... 24.84 24.77 24.91 25.30 100.0 100.0 100.0 100.0 2008 ............................................................... 25.63 25.59 25.90 26.22 100.0 100.0 100.0 100.0 2009 ............................................................... 26.37 26.33 26.42 26.43 100.0 100.0 100.0 100.0 2010 ............................................................... 26.77 26.60 26.81 26.78 100.0 100.0 100.0 100.0
2011 ............................................................... 27.11 27.05 27.17 27.54 100.0 100.0 100.0 100.0 2012 ............................................................... 27.78 27.75 27.87 27.81 100.0 100.0 100.0 100.0 2013 ............................................................... 28.04 27.98 28.13 28.44 100.0 100.0 100.0 100.0 2014 ............................................................... 28.79 28.88 29.07 30.10 100.0 100.0 100.0 100.0 2015 ............................................................... 30.50 30.15 30.25 30.39 100.0 100.0 100.0 100.0 2016 ............................................................... 30.78 31.01 30.87 31.50 100.0 100.0 100.0 100.0 2017 ............................................................... 31.83 – – – 100.0 – – –
Wages and salaries 2006 ............................................................... – – – 17.64 – – – 71.8 2007 ............................................................... 17.88 17.82 17.89 18.18 72.0 71.9 71.8 71.9 2008 ............................................................... 18.41 18.38 18.62 18.86 71.8 71.8 71.9 71.9 2009 ............................................................... 18.96 18.90 18.95 18.96 71.9 71.8 71.7 71.7 2010 ............................................................... 19.16 19.06 19.21 19.21 71.6 71.7 71.6 71.7
2011 ............................................................... 19.44 19.34 19.44 19.68 71.7 71.5 71.6 71.5 2012 ............................................................... 19.80 19.79 19.87 19.81 71.3 71.3 71.3 71.2 2013 ............................................................... 19.95 19.92 20.02 20.20 71.1 71.2 71.2 71.0 2014 ............................................................... 20.39 20.42 20.58 21.13 70.8 70.7 70.8 70.2 2015 ............................................................... 21.38 21.21 21.35 21.50 70.1 70.4 70.6 70.7 2016 ............................................................... 21.70 21.89 21.82 22.20 70.5 70.6 70.7 70.5 2017 ............................................................... 22.41 – – – 70.4 – – –
Total benefits 2006 ............................................................... – – – 6.92 – – – 28.2 2007 ............................................................... 6.96 6.96 7.01 7.12 28.0 28.1 28.2 28.1 2008 ............................................................... 7.22 7.21 7.28 7.36 28.2 28.2 28.1 28.1 2009 ............................................................... 7.41 7.44 7.47 7.47 28.1 28.2 28.3 28.3 2010 ............................................................... 7.61 7.53 7.60 7.57 28.4 28.3 28.4 28.3
2011 ............................................................... 7.68 7.71 7.72 7.86 28.3 28.5 28.4 28.5 2012 ............................................................... 7.98 7.96 8.00 8.00 28.7 28.7 28.7 28.8 2013 ............................................................... 8.09 8.07 8.11 8.25 28.9 28.8 28.8 29.0 2014 ............................................................... 8.40 8.46 8.50 8.98 29.2 29.3 29.2 29.8 2015 ............................................................... 9.11 8.93 8.90 8.90 29.9 29.6 29.4 29.3 2016 ............................................................... 9.08 9.13 9.06 9.29 29.5 29.4 29.3 29.5 2017 ............................................................... 9.42 – – – 29.6 – – –
Paid leave 2006 ............................................................... – – – 1.71 – – – 7.0 2007 ............................................................... 1.73 1.72 1.72 1.74 7.0 6.9 6.9 6.9 2008 ............................................................... 1.75 1.73 1.77 1.81 6.8 6.8 6.8 6.9 2009 ............................................................... 1.82 1.80 1.81 1.81 6.9 6.9 6.8 6.9 2010 ............................................................... 1.84 1.81 1.83 1.84 6.9 6.8 6.8 6.9
2011 ............................................................... 1.87 1.85 1.85 1.92 6.9 6.8 6.8 7.0 2012 ............................................................... 1.93 1.92 1.93 1.93 7.0 6.9 6.9 7.0 2013 ............................................................... 1.95 1.94 1.96 1.99 7.0 6.9 7.0 7.0 2014 ............................................................... 2.03 2.02 2.04 2.10 7.1 7.0 7.0 7.0 2015 ............................................................... 2.13 2.10 2.11 2.12 7.0 7.0 7.0 7.0 2016 ............................................................... 2.14 2.16 2.15 2.22 7.0 7.0 7.0 7.1 2017 ............................................................... 2.24 – – – 7.0 – – –
Supplemental pay 2006 ............................................................... – – – .65 – – – 2.6 2007 ............................................................... .65 .66 .67 .67 2.6 2.7 2.7 2.6 2008 ............................................................... .68 .71 .69 .71 2.7 2.8 2.7 2.7 2009 ............................................................... .68 .75 .75 .74 2.6 2.8 2.8 2.8 2010 ............................................................... .72 .69 .70 .67 2.7 2.6 2.6 2.5
2011 ............................................................... .66 .69 .69 .70 2.4 2.5 2.5 2.5 2012 ............................................................... .72 .71 .72 .71 2.6 2.6 2.6 2.5 2013 ............................................................... .70 .70 .69 .73 2.5 2.5 2.5 2.6 2014 ............................................................... .74 .73 .74 1.02 2.6 2.5 2.5 3.4 2015 ............................................................... 1.06 1.03 .95 .97 3.5 3.4 3.2 3.2 2016 ............................................................... 1.09 1.09 1.09 1.08 3.6 3.5 3.5 3.4
See footnotes at end of table.
-65-

Supplemental table 5. Private service-providing industry workers, by occupational group: employer costs per hoursworked for employee compensation and costs as a percentage of total compensation, 2006-2017
All workers
Compensationcomponent
Cost per hour worked Percent of total compensation
Mar. June Sep. Dec. Mar. June Sep. Dec.
Supplemental pay 2017 ............................................................... 1.11 – – – 3.5 – – –
Insurance 2006 ............................................................... – – – 1.73 – – – 7.0 2007 ............................................................... 1.78 1.77 1.78 1.81 7.1 7.1 7.2 7.1 2008 ............................................................... 1.85 1.85 1.87 1.90 7.2 7.2 7.2 7.2 2009 ............................................................... 1.95 1.94 1.96 1.97 7.4 7.4 7.4 7.5 2010 ............................................................... 2.04 2.03 2.05 2.04 7.6 7.6 7.6 7.6
2011 ............................................................... 2.08 2.09 2.10 2.14 7.7 7.7 7.7 7.8 2012 ............................................................... 2.17 2.16 2.17 2.17 7.8 7.8 7.8 7.8 2013 ............................................................... 2.22 2.20 2.21 2.26 7.9 7.9 7.9 8.0 2014 ............................................................... 2.31 2.30 2.31 2.34 8.0 8.0 7.9 7.8 2015 ............................................................... 2.39 2.37 2.39 2.34 7.8 7.9 7.9 7.7 2016 ............................................................... 2.39 2.38 2.37 2.43 7.8 7.7 7.7 7.7 2017 ............................................................... 2.45 – – – 7.7 – – –
Retirement and savings 2006 ............................................................... – – – .79 – – – 3.2 2007 ............................................................... .75 .75 .79 .84 3.0 3.0 3.2 3.3 2008 ............................................................... .84 .83 .85 .85 3.3 3.2 3.3 3.2 2009 ............................................................... .84 .83 .83 .83 3.2 3.2 3.1 3.1 2010 ............................................................... .86 .85 .87 .86 3.2 3.2 3.2 3.2
2011 ............................................................... .88 .89 .88 .90 3.3 3.3 3.2 3.3 2012 ............................................................... .92 .91 .93 .94 3.3 3.3 3.3 3.4 2013 ............................................................... .96 .97 .98 .97 3.4 3.4 3.5 3.4 2014 ............................................................... 1.01 1.09 1.09 1.16 3.5 3.8 3.7 3.8 2015 ............................................................... 1.17 1.08 1.08 1.08 3.8 3.6 3.6 3.6 2016 ............................................................... 1.06 1.10 1.06 1.15 3.4 3.5 3.4 3.6 2017 ............................................................... 1.17 – – – 3.7 – – –
Legally required benefits 2006 ............................................................... – – – 2.04 – – – 8.3 2007 ............................................................... 2.05 2.05 2.06 2.07 8.2 8.3 8.3 8.2 2008 ............................................................... 2.09 2.09 2.10 2.11 8.1 8.2 8.1 8.0 2009 ............................................................... 2.12 2.12 2.12 2.12 8.0 8.0 8.0 8.0 2010 ............................................................... 2.15 2.15 2.16 2.15 8.0 8.1 8.1 8.0
2011 ............................................................... 2.18 2.19 2.20 2.21 8.1 8.1 8.1 8.0 2012 ............................................................... 2.24 2.24 2.25 2.25 8.1 8.1 8.1 8.1 2013 ............................................................... 2.26 2.26 2.27 2.29 8.1 8.1 8.1 8.1 2014 ............................................................... 2.30 2.30 2.31 2.35 8.0 8.0 8.0 7.8 2015 ............................................................... 2.37 2.36 2.36 2.39 7.8 7.8 7.8 7.9 2016 ............................................................... 2.40 2.39 2.39 2.42 7.8 7.7 7.7 7.7 2017 ............................................................... 2.45 – – – 7.7 – – –
Note: The sum of individual items may not equal totals due to rounding. Dashes indicate data are not available.
-66-

Supplemental table 5. Private service-providing industry workers, by occupational group: employer costs per hoursworked for employee compensation and costs as a percentage of total compensation, 2006-2017 -- Continued
Management, professional, and related occupations1
Compensationcomponent
Cost per hour worked Percent of total compensation
Mar. June Sep. Dec. Mar. June Sep. Dec.
Total compensation 2006 ............................................................... – – – $44.51 – – – 100.0 2007 ............................................................... 45.05 45.11 45.11 45.83 100.0 100.0 100.0 100.0 2008 ............................................................... 46.45 46.65 47.21 47.44 100.0 100.0 100.0 100.0 2009 ............................................................... 47.65 47.86 47.84 47.18 100.0 100.0 100.0 100.0 2010 ............................................................... 47.78 47.86 48.22 48.36 100.0 100.0 100.0 100.0
2011 ............................................................... 48.94 49.24 49.20 49.11 100.0 100.0 100.0 100.0 2012 ............................................................... 49.52 49.86 50.02 49.69 100.0 100.0 100.0 100.0 2013 ............................................................... 49.88 50.23 50.38 50.40 100.0 100.0 100.0 100.0 2014 ............................................................... 51.19 51.89 51.91 54.00 100.0 100.0 100.0 100.0 2015 ............................................................... 54.27 54.21 54.01 54.22 100.0 100.0 100.0 100.0 2016 ............................................................... 54.99 55.82 55.44 56.52 100.0 100.0 100.0 100.0 2017 ............................................................... 57.00 – – – 100.0 – – –
Wages and salaries 2006 ............................................................... – – – 31.88 – – – 71.6 2007 ............................................................... 32.35 32.35 32.25 32.81 71.8 71.7 71.5 71.6 2008 ............................................................... 33.29 33.36 33.84 34.01 71.7 71.5 71.7 71.7 2009 ............................................................... 34.15 34.10 34.06 33.57 71.7 71.3 71.2 71.1 2010 ............................................................... 33.98 34.10 34.35 34.43 71.1 71.3 71.2 71.2
2011 ............................................................... 34.90 35.00 35.03 34.84 71.3 71.1 71.2 70.9 2012 ............................................................... 35.04 35.30 35.35 35.09 70.7 70.8 70.7 70.6 2013 ............................................................... 35.21 35.43 35.54 35.46 70.6 70.5 70.5 70.4 2014 ............................................................... 35.90 36.32 36.40 37.27 70.1 70.0 70.1 69.0 2015 ............................................................... 37.35 37.48 37.59 37.83 68.8 69.1 69.6 69.8 2016 ............................................................... 38.10 38.65 38.42 39.10 69.3 69.2 69.3 69.2 2017 ............................................................... 39.32 – – – 69.0 – – –
Total benefits 2006 ............................................................... – – – 12.62 – – – 28.4 2007 ............................................................... 12.70 12.76 12.86 13.02 28.2 28.3 28.5 28.4 2008 ............................................................... 13.17 13.28 13.37 13.44 28.3 28.5 28.3 28.3 2009 ............................................................... 13.51 13.76 13.79 13.61 28.3 28.7 28.8 28.9 2010 ............................................................... 13.80 13.75 13.87 13.93 28.9 28.7 28.8 28.8
2011 ............................................................... 14.04 14.24 14.17 14.27 28.7 28.9 28.8 29.1 2012 ............................................................... 14.49 14.56 14.67 14.60 29.3 29.2 29.3 29.4 2013 ............................................................... 14.66 14.80 14.84 14.94 29.4 29.5 29.5 29.6 2014 ............................................................... 15.29 15.57 15.51 16.74 29.9 30.0 29.9 31.0 2015 ............................................................... 16.92 16.73 16.42 16.39 31.2 30.9 30.4 30.2 2016 ............................................................... 16.89 17.18 17.02 17.42 30.7 30.8 30.7 30.8 2017 ............................................................... 17.68 – – – 31.0 – – –
Paid leave 2006 ............................................................... – – – 3.75 – – – 8.4 2007 ............................................................... 3.79 3.79 3.79 3.80 8.4 8.4 8.4 8.3 2008 ............................................................... 3.83 3.82 3.91 3.95 8.2 8.2 8.3 8.3 2009 ............................................................... 3.96 3.97 3.96 3.92 8.3 8.3 8.3 8.3 2010 ............................................................... 3.95 3.95 3.98 4.05 8.3 8.3 8.3 8.4
2011 ............................................................... 4.11 4.12 4.09 4.17 8.4 8.4 8.3 8.5 2012 ............................................................... 4.18 4.22 4.24 4.24 8.4 8.5 8.5 8.5 2013 ............................................................... 4.26 4.29 4.30 4.32 8.5 8.5 8.5 8.6 2014 ............................................................... 4.42 4.46 4.46 4.53 8.6 8.6 8.6 8.4 2015 ............................................................... 4.53 4.54 4.54 4.52 8.3 8.4 8.4 8.3 2016 ............................................................... 4.57 4.67 4.63 4.79 8.3 8.4 8.4 8.5 2017 ............................................................... 4.81 – – – 8.4 – – –
Supplemental pay 2006 ............................................................... – – – 1.35 – – – 3.0 2007 ............................................................... 1.36 1.39 1.40 1.38 3.0 3.1 3.1 3.0 2008 ............................................................... 1.41 1.51 1.42 1.45 3.0 3.2 3.0 3.1 2009 ............................................................... 1.40 1.67 1.67 1.59 2.9 3.5 3.5 3.4 2010 ............................................................... 1.57 1.51 1.53 1.43 3.3 3.2 3.2 3.0
2011 ............................................................... 1.33 1.44 1.43 1.43 2.7 2.9 2.9 2.9 2012 ............................................................... 1.49 1.49 1.50 1.45 3.0 3.0 3.0 2.9 2013 ............................................................... 1.41 1.43 1.40 1.48 2.8 2.8 2.8 2.9 2014 ............................................................... 1.47 1.46 1.46 2.40 2.9 2.8 2.8 4.4 2015 ............................................................... 2.53 2.48 2.19 2.21 4.7 4.6 4.1 4.1 2016 ............................................................... 2.62 2.61 2.61 2.53 4.8 4.7 4.7 4.5
See footnotes at end of table.
-67-

Supplemental table 5. Private service-providing industry workers, by occupational group: employer costs per hoursworked for employee compensation and costs as a percentage of total compensation, 2006-2017 -- Continued
Management, professional, and related occupations1
Compensationcomponent
Cost per hour worked Percent of total compensation
Mar. June Sep. Dec. Mar. June Sep. Dec.
Supplemental pay 2017 ............................................................... 2.62 – – – 4.6 – – –
Insurance 2006 ............................................................... – – – 2.72 – – – 6.1 2007 ............................................................... 2.79 2.80 2.81 2.83 6.2 6.2 6.2 6.2 2008 ............................................................... 2.90 2.91 2.93 2.99 6.2 6.2 6.2 6.3 2009 ............................................................... 3.05 3.04 3.07 3.09 6.4 6.4 6.4 6.5 2010 ............................................................... 3.17 3.18 3.19 3.25 6.6 6.6 6.6 6.7
2011 ............................................................... 3.31 3.35 3.34 3.40 6.8 6.8 6.8 6.9 2012 ............................................................... 3.46 3.48 3.52 3.50 7.0 7.0 7.0 7.1 2013 ............................................................... 3.58 3.59 3.59 3.65 7.2 7.1 7.1 7.2 2014 ............................................................... 3.73 3.75 3.75 3.81 7.3 7.2 7.2 7.1 2015 ............................................................... 3.87 3.86 3.87 3.85 7.1 7.1 7.2 7.1 2016 ............................................................... 3.94 3.96 3.98 4.06 7.2 7.1 7.2 7.2 2017 ............................................................... 4.08 – – – 7.2 – – –
Retirement and savings 2006 ............................................................... – – – 1.64 – – – 3.7 2007 ............................................................... 1.55 1.58 1.66 1.77 3.4 3.5 3.7 3.9 2008 ............................................................... 1.77 1.77 1.81 1.74 3.8 3.8 3.8 3.7 2009 ............................................................... 1.76 1.74 1.75 1.71 3.7 3.6 3.7 3.6 2010 ............................................................... 1.77 1.77 1.80 1.83 3.7 3.7 3.7 3.8
2011 ............................................................... 1.89 1.91 1.88 1.90 3.9 3.9 3.8 3.9 2012 ............................................................... 1.93 1.93 1.96 1.98 3.9 3.9 3.9 4.0 2013 ............................................................... 1.98 2.04 2.07 2.02 4.0 4.1 4.1 4.0 2014 ............................................................... 2.16 2.36 2.32 2.43 4.2 4.6 4.5 4.5 2015 ............................................................... 2.42 2.26 2.25 2.19 4.5 4.2 4.2 4.0 2016 ............................................................... 2.12 2.29 2.17 2.39 3.9 4.1 3.9 4.2 2017 ............................................................... 2.44 – – – 4.3 – – –
Legally required benefits 2006 ............................................................... – – – 3.17 – – – 7.1 2007 ............................................................... 3.20 3.20 3.21 3.22 7.1 7.1 7.1 7.0 2008 ............................................................... 3.26 3.27 3.30 3.31 7.0 7.0 7.0 7.0 2009 ............................................................... 3.33 3.33 3.34 3.30 7.0 7.0 7.0 7.0 2010 ............................................................... 3.33 3.34 3.36 3.36 7.0 7.0 7.0 7.0
2011 ............................................................... 3.41 3.42 3.43 3.38 7.0 6.9 7.0 6.9 2012 ............................................................... 3.42 3.44 3.45 3.43 6.9 6.9 6.9 6.9 2013 ............................................................... 3.44 3.45 3.48 3.47 6.9 6.9 6.9 6.9 2014 ............................................................... 3.50 3.52 3.52 3.57 6.8 6.8 6.8 6.6 2015 ............................................................... 3.57 3.58 3.58 3.62 6.6 6.6 6.6 6.7 2016 ............................................................... 3.64 3.64 3.63 3.66 6.6 6.5 6.5 6.5 2017 ............................................................... 3.72 – – – 6.5 – – –
1 Estimates from December 2013 to March 2014 for this series were corrected, details are available atwww.bls.gov/bls/ecec_correction_091014.htm.
Note: The sum of individual items may not equal totals due to rounding. Dashes indicate data are not available.
-68-

Supplemental table 5. Private service-providing industry workers, by occupational group: employer costs per hoursworked for employee compensation and costs as a percentage of total compensation, 2006-2017 -- Continued
Management, business, and financial occcupations1
Compensationcomponent
Cost per hour worked Percent of total compensation
Mar. June Sep. Dec. Mar. June Sep. Dec.
Total compensation 2006 ............................................................... – – – $49.61 – – – 100.0 2007 ............................................................... 50.46 50.15 50.77 50.57 100.0 100.0 100.0 100.0 2008 ............................................................... 51.93 52.02 52.88 53.95 100.0 100.0 100.0 100.0 2009 ............................................................... 53.83 54.28 53.75 54.04 100.0 100.0 100.0 100.0 2010 ............................................................... 54.84 54.70 54.89 56.57 100.0 100.0 100.0 100.0
2011 ............................................................... 56.45 57.38 57.69 57.10 100.0 100.0 100.0 100.0 2012 ............................................................... 57.41 57.73 57.86 57.92 100.0 100.0 100.0 100.0 2013 ............................................................... 58.09 58.84 58.86 60.19 100.0 100.0 100.0 100.0 2014 ............................................................... 60.35 61.49 62.09 66.43 100.0 100.0 100.0 100.0 2015 ............................................................... 67.12 67.00 66.51 67.16 100.0 100.0 100.0 100.0 2016 ............................................................... 68.76 69.25 69.84 70.38 100.0 100.0 100.0 100.0 2017 ............................................................... 70.81 – – – 100.0 – – –
Wages and salaries 2006 ............................................................... – – – 34.70 – – – 69.9 2007 ............................................................... 35.57 35.24 35.58 35.33 70.5 70.3 70.1 69.9 2008 ............................................................... 36.35 36.18 36.94 37.78 70.0 69.6 69.9 70.0 2009 ............................................................... 37.66 37.82 37.41 37.69 70.0 69.7 69.6 69.7 2010 ............................................................... 38.13 38.18 38.26 39.24 69.5 69.8 69.7 69.4
2011 ............................................................... 39.45 39.83 40.12 39.89 69.9 69.4 69.5 69.9 2012 ............................................................... 39.93 40.21 40.23 40.19 69.5 69.7 69.5 69.4 2013 ............................................................... 40.36 40.82 40.79 41.76 69.5 69.4 69.3 69.4 2014 ............................................................... 41.86 42.53 43.01 44.27 69.4 69.2 69.3 66.7 2015 ............................................................... 44.50 44.72 45.07 45.65 66.3 66.7 67.8 68.0 2016 ............................................................... 45.97 46.38 46.71 47.19 66.9 67.0 66.9 67.0 2017 ............................................................... 47.17 – – – 66.6 – – –
Total benefits 2006 ............................................................... – – – 14.91 – – – 30.1 2007 ............................................................... 14.90 14.91 15.19 15.24 29.5 29.7 29.9 30.1 2008 ............................................................... 15.58 15.84 15.94 16.17 30.0 30.4 30.1 30.0 2009 ............................................................... 16.18 16.46 16.34 16.36 30.0 30.3 30.4 30.3 2010 ............................................................... 16.71 16.52 16.63 17.33 30.5 30.2 30.3 30.6
2011 ............................................................... 16.99 17.55 17.57 17.21 30.1 30.6 30.5 30.1 2012 ............................................................... 17.48 17.51 17.63 17.73 30.5 30.3 30.5 30.6 2013 ............................................................... 17.74 18.02 18.07 18.43 30.5 30.6 30.7 30.6 2014 ............................................................... 18.49 18.97 19.08 22.15 30.6 30.8 30.7 33.3 2015 ............................................................... 22.61 22.28 21.44 21.51 33.7 33.3 32.2 32.0 2016 ............................................................... 22.79 22.88 23.13 23.19 33.1 33.0 33.1 33.0 2017 ............................................................... 23.64 – – – 33.4 – – –
Paid leave 2006 ............................................................... – – – 4.49 – – – 9.0 2007 ............................................................... 4.56 4.52 4.56 4.54 9.0 9.0 9.0 9.0 2008 ............................................................... 4.66 4.62 4.78 4.94 9.0 8.9 9.0 9.2 2009 ............................................................... 4.94 4.95 4.86 4.91 9.2 9.1 9.0 9.1 2010 ............................................................... 4.98 4.96 4.98 5.11 9.1 9.1 9.1 9.0
2011 ............................................................... 5.14 5.17 5.19 5.21 9.1 9.0 9.0 9.1 2012 ............................................................... 5.25 5.25 5.26 5.31 9.1 9.1 9.1 9.2 2013 ............................................................... 5.33 5.37 5.39 5.55 9.2 9.1 9.2 9.2 2014 ............................................................... 5.62 5.67 5.71 5.92 9.3 9.2 9.2 8.9 2015 ............................................................... 5.94 5.95 5.95 6.00 8.9 8.9 8.9 8.9 2016 ............................................................... 6.07 6.11 6.18 6.26 8.8 8.8 8.8 8.9 2017 ............................................................... 6.31 – – – 8.9 – – –
Supplemental pay 2006 ............................................................... – – – 1.93 – – – 3.9 2007 ............................................................... 1.91 1.95 2.02 2.01 3.8 3.9 4.0 4.0 2008 ............................................................... 2.12 2.38 2.24 2.19 4.1 4.6 4.2 4.1 2009 ............................................................... 2.10 2.36 2.35 2.30 3.9 4.3 4.4 4.3 2010 ............................................................... 2.33 2.12 2.18 2.56 4.2 3.9 4.0 4.5
2011 ............................................................... 2.10 2.41 2.39 2.21 3.7 4.2 4.1 3.9 2012 ............................................................... 2.33 2.33 2.36 2.26 4.1 4.0 4.1 3.9 2013 ............................................................... 2.16 2.21 2.14 2.24 3.7 3.8 3.6 3.7 2014 ............................................................... 2.15 2.21 2.22 4.84 3.6 3.6 3.6 7.3 2015 ............................................................... 5.14 5.06 4.19 4.15 7.7 7.6 6.3 6.2 2016 ............................................................... 5.49 5.48 5.50 5.40 8.0 7.9 7.9 7.7
See footnotes at end of table.
-69-
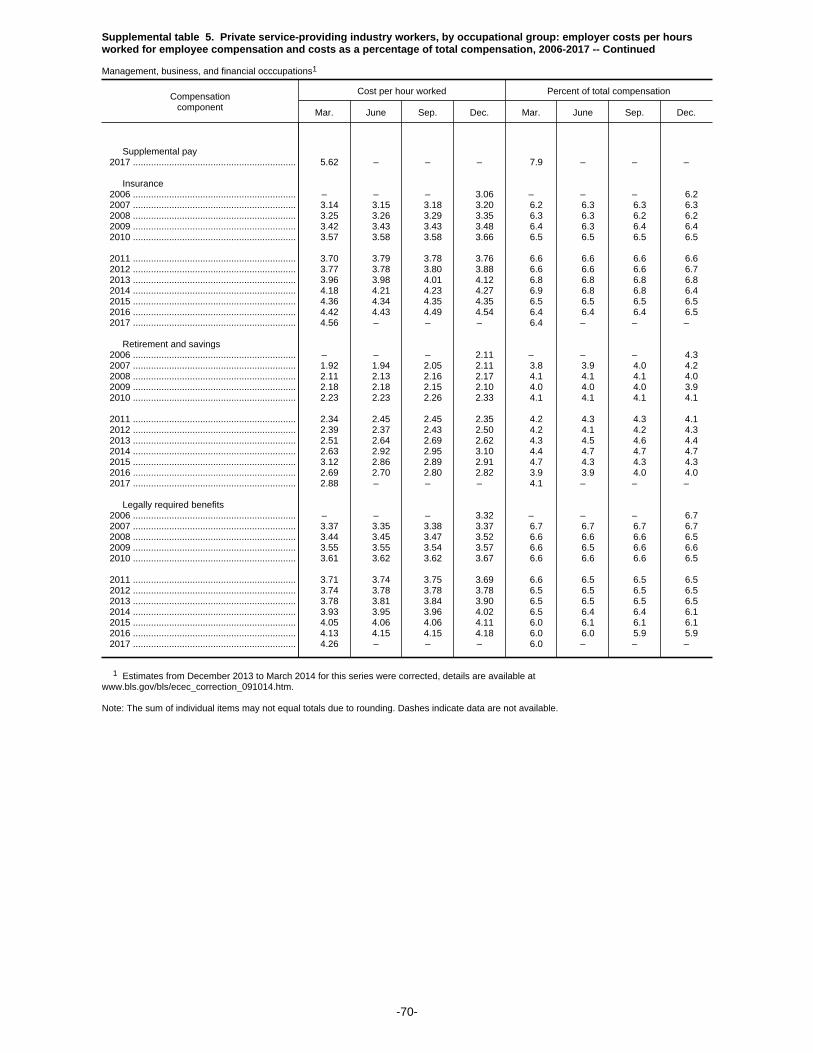
Supplemental table 5. Private service-providing industry workers, by occupational group: employer costs per hoursworked for employee compensation and costs as a percentage of total compensation, 2006-2017 -- Continued
Management, business, and financial occcupations1
Compensationcomponent
Cost per hour worked Percent of total compensation
Mar. June Sep. Dec. Mar. June Sep. Dec.
Supplemental pay 2017 ............................................................... 5.62 – – – 7.9 – – –
Insurance 2006 ............................................................... – – – 3.06 – – – 6.2 2007 ............................................................... 3.14 3.15 3.18 3.20 6.2 6.3 6.3 6.3 2008 ............................................................... 3.25 3.26 3.29 3.35 6.3 6.3 6.2 6.2 2009 ............................................................... 3.42 3.43 3.43 3.48 6.4 6.3 6.4 6.4 2010 ............................................................... 3.57 3.58 3.58 3.66 6.5 6.5 6.5 6.5
2011 ............................................................... 3.70 3.79 3.78 3.76 6.6 6.6 6.6 6.6 2012 ............................................................... 3.77 3.78 3.80 3.88 6.6 6.6 6.6 6.7 2013 ............................................................... 3.96 3.98 4.01 4.12 6.8 6.8 6.8 6.8 2014 ............................................................... 4.18 4.21 4.23 4.27 6.9 6.8 6.8 6.4 2015 ............................................................... 4.36 4.34 4.35 4.35 6.5 6.5 6.5 6.5 2016 ............................................................... 4.42 4.43 4.49 4.54 6.4 6.4 6.4 6.5 2017 ............................................................... 4.56 – – – 6.4 – – –
Retirement and savings 2006 ............................................................... – – – 2.11 – – – 4.3 2007 ............................................................... 1.92 1.94 2.05 2.11 3.8 3.9 4.0 4.2 2008 ............................................................... 2.11 2.13 2.16 2.17 4.1 4.1 4.1 4.0 2009 ............................................................... 2.18 2.18 2.15 2.10 4.0 4.0 4.0 3.9 2010 ............................................................... 2.23 2.23 2.26 2.33 4.1 4.1 4.1 4.1
2011 ............................................................... 2.34 2.45 2.45 2.35 4.2 4.3 4.3 4.1 2012 ............................................................... 2.39 2.37 2.43 2.50 4.2 4.1 4.2 4.3 2013 ............................................................... 2.51 2.64 2.69 2.62 4.3 4.5 4.6 4.4 2014 ............................................................... 2.63 2.92 2.95 3.10 4.4 4.7 4.7 4.7 2015 ............................................................... 3.12 2.86 2.89 2.91 4.7 4.3 4.3 4.3 2016 ............................................................... 2.69 2.70 2.80 2.82 3.9 3.9 4.0 4.0 2017 ............................................................... 2.88 – – – 4.1 – – –
Legally required benefits 2006 ............................................................... – – – 3.32 – – – 6.7 2007 ............................................................... 3.37 3.35 3.38 3.37 6.7 6.7 6.7 6.7 2008 ............................................................... 3.44 3.45 3.47 3.52 6.6 6.6 6.6 6.5 2009 ............................................................... 3.55 3.55 3.54 3.57 6.6 6.5 6.6 6.6 2010 ............................................................... 3.61 3.62 3.62 3.67 6.6 6.6 6.6 6.5
2011 ............................................................... 3.71 3.74 3.75 3.69 6.6 6.5 6.5 6.5 2012 ............................................................... 3.74 3.78 3.78 3.78 6.5 6.5 6.5 6.5 2013 ............................................................... 3.78 3.81 3.84 3.90 6.5 6.5 6.5 6.5 2014 ............................................................... 3.93 3.95 3.96 4.02 6.5 6.4 6.4 6.1 2015 ............................................................... 4.05 4.06 4.06 4.11 6.0 6.1 6.1 6.1 2016 ............................................................... 4.13 4.15 4.15 4.18 6.0 6.0 5.9 5.9 2017 ............................................................... 4.26 – – – 6.0 – – –
1 Estimates from December 2013 to March 2014 for this series were corrected, details are available atwww.bls.gov/bls/ecec_correction_091014.htm.
Note: The sum of individual items may not equal totals due to rounding. Dashes indicate data are not available.
-70-

Supplemental table 5. Private service-providing industry workers, by occupational group: employer costs per hoursworked for employee compensation and costs as a percentage of total compensation, 2006-2017 -- Continued
Professional and related occupations1
Compensationcomponent
Cost per hour worked Percent of total compensation
Mar. June Sep. Dec. Mar. June Sep. Dec.
Total compensation 2006 ............................................................... – – – $42.05 – – – 100.0 2007 ............................................................... 42.47 42.69 42.43 43.63 100.0 100.0 100.0 100.0 2008 ............................................................... 43.95 44.21 44.63 44.60 100.0 100.0 100.0 100.0 2009 ............................................................... 45.01 45.11 45.29 44.23 100.0 100.0 100.0 100.0 2010 ............................................................... 44.81 44.97 45.40 44.75 100.0 100.0 100.0 100.0
2011 ............................................................... 45.68 45.67 45.49 45.34 100.0 100.0 100.0 100.0 2012 ............................................................... 45.82 46.15 46.31 45.52 100.0 100.0 100.0 100.0 2013 ............................................................... 45.74 45.85 46.23 45.59 100.0 100.0 100.0 100.0 2014 ............................................................... 46.75 47.12 46.91 47.76 100.0 100.0 100.0 100.0 2015 ............................................................... 47.96 47.88 47.86 47.91 100.0 100.0 100.0 100.0 2016 ............................................................... 48.33 49.24 48.46 49.85 100.0 100.0 100.0 100.0 2017 ............................................................... 50.48 – – – 100.0 – – –
Wages and salaries 2006 ............................................................... – – – 30.53 – – – 72.6 2007 ............................................................... 30.82 30.96 30.67 31.64 72.6 72.5 72.3 72.5 2008 ............................................................... 31.89 32.08 32.43 32.35 72.6 72.6 72.7 72.5 2009 ............................................................... 32.65 32.51 32.61 31.79 72.5 72.1 72.0 71.9 2010 ............................................................... 32.24 32.38 32.70 32.32 71.9 72.0 72.0 72.2
2011 ............................................................... 32.92 32.89 32.80 32.46 72.1 72.0 72.1 71.6 2012 ............................................................... 32.74 32.98 33.04 32.50 71.5 71.5 71.3 71.4 2013 ............................................................... 32.62 32.69 32.98 32.37 71.3 71.3 71.3 71.0 2014 ............................................................... 33.02 33.24 33.15 33.75 70.6 70.5 70.7 70.7 2015 ............................................................... 33.83 33.90 33.91 34.02 70.5 70.8 70.9 71.0 2016 ............................................................... 34.29 34.86 34.40 35.21 71.0 70.8 71.0 70.6 2017 ............................................................... 35.61 – – – 70.5 – – –
Total benefits 2006 ............................................................... – – – 11.52 – – – 27.4 2007 ............................................................... 11.65 11.73 11.76 11.98 27.4 27.5 27.7 27.5 2008 ............................................................... 12.06 12.13 12.20 12.24 27.4 27.4 27.3 27.5 2009 ............................................................... 12.37 12.60 12.68 12.43 27.5 27.9 28.0 28.1 2010 ............................................................... 12.57 12.59 12.70 12.43 28.1 28.0 28.0 27.8
2011 ............................................................... 12.76 12.79 12.69 12.88 27.9 28.0 27.9 28.4 2012 ............................................................... 13.08 13.16 13.27 13.01 28.5 28.5 28.7 28.6 2013 ............................................................... 13.11 13.16 13.26 13.23 28.7 28.7 28.7 29.0 2014 ............................................................... 13.74 13.88 13.76 14.02 29.4 29.5 29.3 29.3 2015 ............................................................... 14.13 13.98 13.95 13.89 29.5 29.2 29.1 29.0 2016 ............................................................... 14.04 14.38 14.06 14.64 29.0 29.2 29.0 29.4 2017 ............................................................... 14.87 – – – 29.5 – – –
Paid leave 2006 ............................................................... – – – 3.40 – – – 8.1 2007 ............................................................... 3.43 3.45 3.42 3.46 8.1 8.1 8.1 7.9 2008 ............................................................... 3.44 3.47 3.51 3.51 7.8 7.8 7.9 7.9 2009 ............................................................... 3.54 3.54 3.57 3.50 7.9 7.9 7.9 7.9 2010 ............................................................... 3.52 3.53 3.56 3.58 7.9 7.8 7.8 8.0
2011 ............................................................... 3.66 3.66 3.60 3.68 8.0 8.0 7.9 8.1 2012 ............................................................... 3.68 3.74 3.76 3.69 8.0 8.1 8.1 8.1 2013 ............................................................... 3.72 3.74 3.77 3.72 8.1 8.2 8.2 8.2 2014 ............................................................... 3.85 3.87 3.84 3.83 8.2 8.2 8.2 8.0 2015 ............................................................... 3.83 3.84 3.84 3.80 8.0 8.0 8.0 7.9 2016 ............................................................... 3.84 3.97 3.88 4.08 8.0 8.1 8.0 8.2 2017 ............................................................... 4.11 – – – 8.1 – – –
Supplemental pay 2006 ............................................................... – – – 1.07 – – – 2.6 2007 ............................................................... 1.10 1.12 1.10 1.09 2.6 2.6 2.6 2.5 2008 ............................................................... 1.09 1.11 1.05 1.13 2.5 2.5 2.4 2.5 2009 ............................................................... 1.10 1.38 1.38 1.29 2.4 3.1 3.0 2.9 2010 ............................................................... 1.25 1.26 1.25 .94 2.8 2.8 2.8 2.1
2011 ............................................................... 1.00 1.02 1.02 1.07 2.2 2.2 2.2 2.4 2012 ............................................................... 1.10 1.09 1.09 1.05 2.4 2.4 2.4 2.3 2013 ............................................................... 1.03 1.03 1.04 1.11 2.2 2.3 2.3 2.4 2014 ............................................................... 1.15 1.09 1.08 1.17 2.5 2.3 2.3 2.5 2015 ............................................................... 1.25 1.21 1.20 1.26 2.6 2.5 2.5 2.6 2016 ............................................................... 1.24 1.20 1.21 1.15 2.6 2.4 2.5 2.3
See footnotes at end of table.
-71-

Supplemental table 5. Private service-providing industry workers, by occupational group: employer costs per hoursworked for employee compensation and costs as a percentage of total compensation, 2006-2017 -- Continued
Professional and related occupations1
Compensationcomponent
Cost per hour worked Percent of total compensation
Mar. June Sep. Dec. Mar. June Sep. Dec.
Supplemental pay 2017 ............................................................... 1.20 – – – 2.4 – – –
Insurance 2006 ............................................................... – – – 2.55 – – – 6.1 2007 ............................................................... 2.63 2.64 2.64 2.66 6.2 6.2 6.2 6.1 2008 ............................................................... 2.73 2.74 2.77 2.83 6.2 6.2 6.2 6.3 2009 ............................................................... 2.89 2.88 2.91 2.92 6.4 6.4 6.4 6.6 2010 ............................................................... 3.00 3.01 3.03 3.07 6.7 6.7 6.7 6.9
2011 ............................................................... 3.14 3.15 3.15 3.23 6.9 6.9 6.9 7.1 2012 ............................................................... 3.31 3.33 3.38 3.31 7.2 7.2 7.3 7.3 2013 ............................................................... 3.39 3.39 3.39 3.42 7.4 7.4 7.3 7.5 2014 ............................................................... 3.51 3.52 3.52 3.59 7.5 7.5 7.5 7.5 2015 ............................................................... 3.63 3.63 3.63 3.60 7.6 7.6 7.6 7.5 2016 ............................................................... 3.71 3.74 3.73 3.83 7.7 7.6 7.7 7.7 2017 ............................................................... 3.86 – – – 7.6 – – –
Retirement and savings 2006 ............................................................... – – – 1.41 – – – 3.3 2007 ............................................................... 1.38 1.40 1.47 1.61 3.2 3.3 3.5 3.7 2008 ............................................................... 1.62 1.61 1.65 1.55 3.7 3.6 3.7 3.5 2009 ............................................................... 1.59 1.56 1.58 1.55 3.5 3.5 3.5 3.5 2010 ............................................................... 1.58 1.57 1.61 1.62 3.5 3.5 3.5 3.6
2011 ............................................................... 1.69 1.68 1.63 1.69 3.7 3.7 3.6 3.7 2012 ............................................................... 1.72 1.72 1.74 1.71 3.7 3.7 3.8 3.8 2013 ............................................................... 1.71 1.73 1.76 1.72 3.7 3.8 3.8 3.8 2014 ............................................................... 1.93 2.09 2.02 2.09 4.1 4.4 4.3 4.4 2015 ............................................................... 2.08 1.96 1.93 1.85 4.3 4.1 4.0 3.9 2016 ............................................................... 1.85 2.09 1.87 2.18 3.8 4.2 3.9 4.4 2017 ............................................................... 2.23 – – – 4.4 – – –
Legally required benefits 2006 ............................................................... – – – 3.10 – – – 7.4 2007 ............................................................... 3.12 3.13 3.13 3.16 7.3 7.3 7.4 7.2 2008 ............................................................... 3.17 3.19 3.22 3.22 7.2 7.2 7.2 7.2 2009 ............................................................... 3.24 3.24 3.25 3.18 7.2 7.2 7.2 7.2 2010 ............................................................... 3.21 3.23 3.26 3.23 7.2 7.2 7.2 7.2
2011 ............................................................... 3.27 3.28 3.29 3.23 7.2 7.2 7.2 7.1 2012 ............................................................... 3.27 3.29 3.29 3.26 7.1 7.1 7.1 7.2 2013 ............................................................... 3.26 3.27 3.30 3.26 7.1 7.1 7.1 7.2 2014 ............................................................... 3.30 3.31 3.30 3.34 7.1 7.0 7.0 7.0 2015 ............................................................... 3.34 3.34 3.35 3.38 7.0 7.0 7.0 7.0 2016 ............................................................... 3.40 3.39 3.37 3.41 7.0 6.9 7.0 6.8 2017 ............................................................... 3.47 – – – 6.9 – – –
1 Estimates from December 2013 to March 2014 for this series were corrected, details are available atwww.bls.gov/bls/ecec_correction_091014.htm.
Note: The sum of individual items may not equal totals due to rounding. Dashes indicate data are not available.
-72-

Supplemental table 5. Private service-providing industry workers, by occupational group: employer costs per hoursworked for employee compensation and costs as a percentage of total compensation, 2006-2017 -- Continued
Sales and office occupations
Compensationcomponent
Cost per hour worked Percent of total compensation
Mar. June Sep. Dec. Mar. June Sep. Dec.
Total compensation 2006 ............................................................... – – – $19.91 – – – 100.0 2007 ............................................................... 20.13 20.17 20.42 20.52 100.0 100.0 100.0 100.0 2008 ............................................................... 20.71 20.85 21.00 20.86 100.0 100.0 100.0 100.0 2009 ............................................................... 20.96 21.01 21.04 21.21 100.0 100.0 100.0 100.0 2010 ............................................................... 21.38 21.47 21.59 21.35 100.0 100.0 100.0 100.0
2011 ............................................................... 21.62 21.77 21.91 22.04 100.0 100.0 100.0 100.0 2012 ............................................................... 22.26 22.29 22.38 22.21 100.0 100.0 100.0 100.0 2013 ............................................................... 22.53 22.63 22.70 22.50 100.0 100.0 100.0 100.0 2014 ............................................................... 22.66 22.78 23.03 23.08 100.0 100.0 100.0 100.0 2015 ............................................................... 23.55 23.41 23.55 23.11 100.0 100.0 100.0 100.0 2016 ............................................................... 23.47 23.54 23.74 23.75 100.0 100.0 100.0 100.0 2017 ............................................................... 23.95 – – – 100.0 – – –
Wages and salaries 2006 ............................................................... – – – 14.40 – – – 72.3 2007 ............................................................... 14.57 14.59 14.77 14.85 72.4 72.3 72.4 72.4 2008 ............................................................... 14.96 15.06 15.16 15.05 72.2 72.2 72.2 72.1 2009 ............................................................... 15.10 15.14 15.17 15.28 72.0 72.1 72.1 72.1 2010 ............................................................... 15.34 15.44 15.52 15.38 71.8 71.9 71.9 72.0
2011 ............................................................... 15.52 15.59 15.70 15.79 71.8 71.6 71.6 71.6 2012 ............................................................... 15.91 15.95 16.06 15.91 71.5 71.6 71.7 71.7 2013 ............................................................... 16.08 16.18 16.23 16.13 71.4 71.5 71.5 71.7 2014 ............................................................... 16.18 16.23 16.43 16.50 71.4 71.3 71.3 71.5 2015 ............................................................... 16.87 16.76 16.87 16.64 71.6 71.6 71.6 72.0 2016 ............................................................... 16.88 16.96 17.08 17.06 71.9 72.1 72.0 71.8 2017 ............................................................... 17.21 – – – 71.8 – – –
Total benefits 2006 ............................................................... – – – 5.51 – – – 27.7 2007 ............................................................... 5.56 5.58 5.64 5.67 27.6 27.7 27.6 27.6 2008 ............................................................... 5.75 5.79 5.84 5.81 27.8 27.8 27.8 27.9 2009 ............................................................... 5.86 5.87 5.88 5.92 28.0 27.9 27.9 27.9 2010 ............................................................... 6.03 6.02 6.08 5.97 28.2 28.1 28.1 28.0
2011 ............................................................... 6.11 6.18 6.21 6.25 28.2 28.4 28.4 28.4 2012 ............................................................... 6.35 6.34 6.33 6.29 28.5 28.4 28.3 28.3 2013 ............................................................... 6.44 6.45 6.47 6.37 28.6 28.5 28.5 28.3 2014 ............................................................... 6.48 6.55 6.60 6.58 28.6 28.7 28.7 28.5 2015 ............................................................... 6.68 6.64 6.68 6.47 28.4 28.4 28.4 28.0 2016 ............................................................... 6.59 6.58 6.65 6.69 28.1 27.9 28.0 28.2 2017 ............................................................... 6.75 – – – 28.2 – – –
Paid leave 2006 ............................................................... – – – 1.27 – – – 6.4 2007 ............................................................... 1.28 1.29 1.29 1.30 6.4 6.4 6.3 6.3 2008 ............................................................... 1.31 1.30 1.32 1.30 6.3 6.3 6.3 6.3 2009 ............................................................... 1.32 1.31 1.31 1.32 6.3 6.2 6.2 6.2 2010 ............................................................... 1.34 1.33 1.35 1.32 6.2 6.2 6.2 6.2
2011 ............................................................... 1.34 1.34 1.35 1.36 6.2 6.2 6.2 6.2 2012 ............................................................... 1.38 1.37 1.37 1.36 6.2 6.1 6.1 6.1 2013 ............................................................... 1.39 1.38 1.39 1.37 6.2 6.1 6.1 6.1 2014 ............................................................... 1.39 1.39 1.41 1.43 6.1 6.1 6.1 6.2 2015 ............................................................... 1.46 1.46 1.47 1.46 6.2 6.2 6.2 6.3 2016 ............................................................... 1.49 1.47 1.51 1.51 6.3 6.3 6.3 6.4 2017 ............................................................... 1.53 – – – 6.4 – – –
Supplemental pay 2006 ............................................................... – – – .47 – – – 2.4 2007 ............................................................... .48 .48 .49 .49 2.4 2.4 2.4 2.4 2008 ............................................................... .49 .52 .51 .50 2.3 2.5 2.4 2.4 2009 ............................................................... .47 .47 .47 .49 2.2 2.2 2.2 2.3 2010 ............................................................... .46 .44 .45 .43 2.2 2.1 2.1 2.0
2011 ............................................................... .46 .47 .48 .46 2.1 2.2 2.2 2.1 2012 ............................................................... .47 .48 .47 .48 2.1 2.1 2.1 2.2 2013 ............................................................... .49 .49 .49 .50 2.2 2.2 2.2 2.2 2014 ............................................................... .52 .53 .54 .56 2.3 2.3 2.3 2.4 2015 ............................................................... .55 .55 .56 .55 2.4 2.4 2.4 2.4 2016 ............................................................... .57 .58 .59 .59 2.4 2.5 2.5 2.5
See footnotes at end of table.
-73-

Supplemental table 5. Private service-providing industry workers, by occupational group: employer costs per hoursworked for employee compensation and costs as a percentage of total compensation, 2006-2017 -- Continued
Sales and office occupations
Compensationcomponent
Cost per hour worked Percent of total compensation
Mar. June Sep. Dec. Mar. June Sep. Dec.
Supplemental pay 2017 ............................................................... 0.60 – – – 2.5 – – –
Insurance 2006 ............................................................... – – – 1.59 – – – 8.0 2007 ............................................................... 1.64 1.64 1.65 1.66 8.1 8.1 8.1 8.1 2008 ............................................................... 1.72 1.72 1.73 1.74 8.3 8.2 8.2 8.4 2009 ............................................................... 1.82 1.82 1.84 1.85 8.7 8.7 8.8 8.7 2010 ............................................................... 1.92 1.92 1.93 1.90 9.0 8.9 8.9 8.9
2011 ............................................................... 1.94 1.98 1.99 2.03 9.0 9.1 9.1 9.2 2012 ............................................................... 2.06 2.05 2.04 2.01 9.2 9.2 9.1 9.0 2013 ............................................................... 2.09 2.08 2.09 2.05 9.3 9.2 9.2 9.1 2014 ............................................................... 2.12 2.12 2.12 2.07 9.4 9.3 9.2 9.0 2015 ............................................................... 2.13 2.13 2.14 2.01 9.0 9.1 9.1 8.7 2016 ............................................................... 2.07 2.07 2.06 2.09 8.8 8.8 8.7 8.8 2017 ............................................................... 2.10 – – – 8.8 – – –
Retirement and savings 2006 ............................................................... – – – .56 – – – 2.8 2007 ............................................................... .53 .53 .56 .58 2.7 2.6 2.7 2.8 2008 ............................................................... .58 .58 .60 .59 2.8 2.8 2.8 2.8 2009 ............................................................... .58 .58 .58 .58 2.8 2.8 2.7 2.7 2010 ............................................................... .60 .61 .62 .61 2.8 2.8 2.9 2.8
2011 ............................................................... .62 .63 .63 .62 2.9 2.9 2.9 2.8 2012 ............................................................... .64 .63 .64 .64 2.9 2.8 2.8 2.9 2013 ............................................................... .66 .67 .67 .63 2.9 3.0 3.0 2.8 2014 ............................................................... .64 .70 .70 .68 2.8 3.1 3.0 3.0 2015 ............................................................... .70 .66 .67 .65 3.0 2.8 2.8 2.8 2016 ............................................................... .65 .65 .68 .68 2.8 2.7 2.8 2.9 2017 ............................................................... .68 – – – 2.9 – – –
Legally required benefits 2006 ............................................................... – – – 1.63 – – – 8.2 2007 ............................................................... 1.63 1.64 1.65 1.66 8.1 8.1 8.1 8.1 2008 ............................................................... 1.66 1.67 1.68 1.67 8.0 8.0 8.0 8.0 2009 ............................................................... 1.68 1.68 1.68 1.69 8.0 8.0 8.0 7.9 2010 ............................................................... 1.71 1.72 1.73 1.71 8.0 8.0 8.0 8.0
2011 ............................................................... 1.74 1.76 1.76 1.77 8.0 8.1 8.1 8.0 2012 ............................................................... 1.79 1.80 1.81 1.80 8.1 8.1 8.1 8.1 2013 ............................................................... 1.82 1.82 1.82 1.81 8.1 8.1 8.0 8.0 2014 ............................................................... 1.81 1.81 1.83 1.82 8.0 8.0 7.9 7.9 2015 ............................................................... 1.84 1.84 1.84 1.81 7.8 7.9 7.8 7.8 2016 ............................................................... 1.82 1.81 1.82 1.82 7.7 7.7 7.7 7.7 2017 ............................................................... 1.84 – – – 7.7 – – –
Note: The sum of individual items may not equal totals due to rounding. Dashes indicate data are not available.
-74-
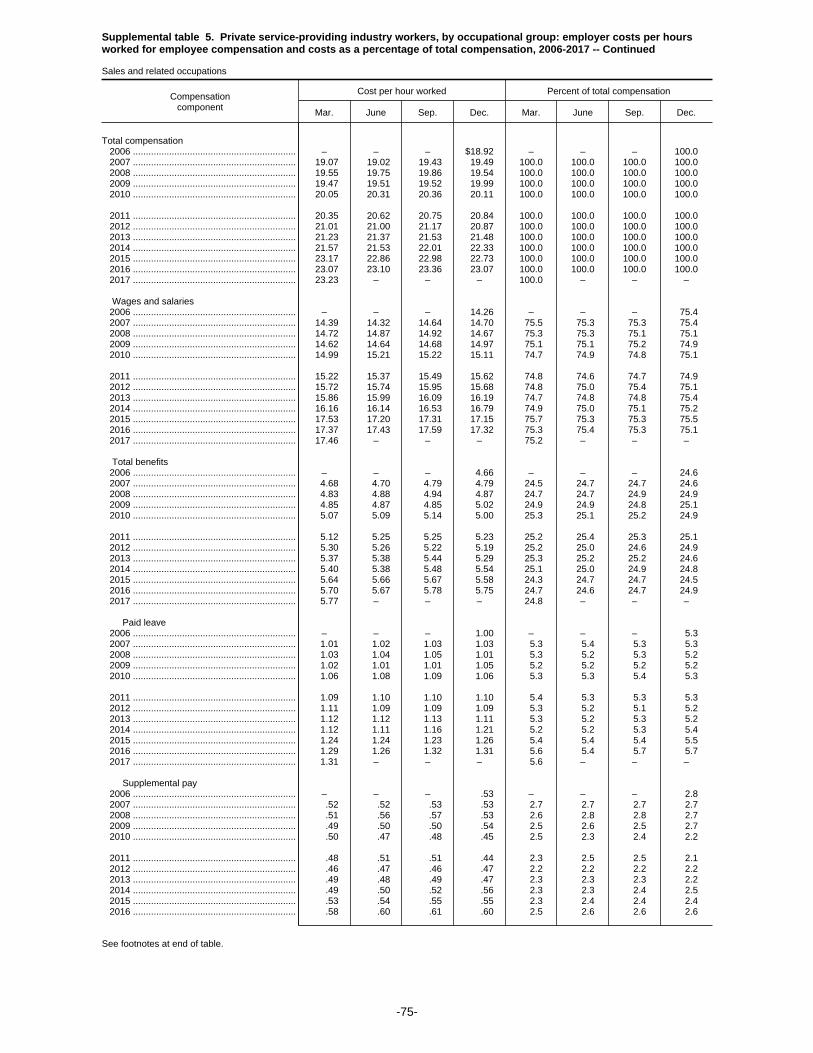
Supplemental table 5. Private service-providing industry workers, by occupational group: employer costs per hoursworked for employee compensation and costs as a percentage of total compensation, 2006-2017 -- Continued
Sales and related occupations
Compensationcomponent
Cost per hour worked Percent of total compensation
Mar. June Sep. Dec. Mar. June Sep. Dec.
Total compensation 2006 ............................................................... – – – $18.92 – – – 100.0 2007 ............................................................... 19.07 19.02 19.43 19.49 100.0 100.0 100.0 100.0 2008 ............................................................... 19.55 19.75 19.86 19.54 100.0 100.0 100.0 100.0 2009 ............................................................... 19.47 19.51 19.52 19.99 100.0 100.0 100.0 100.0 2010 ............................................................... 20.05 20.31 20.36 20.11 100.0 100.0 100.0 100.0
2011 ............................................................... 20.35 20.62 20.75 20.84 100.0 100.0 100.0 100.0 2012 ............................................................... 21.01 21.00 21.17 20.87 100.0 100.0 100.0 100.0 2013 ............................................................... 21.23 21.37 21.53 21.48 100.0 100.0 100.0 100.0 2014 ............................................................... 21.57 21.53 22.01 22.33 100.0 100.0 100.0 100.0 2015 ............................................................... 23.17 22.86 22.98 22.73 100.0 100.0 100.0 100.0 2016 ............................................................... 23.07 23.10 23.36 23.07 100.0 100.0 100.0 100.0 2017 ............................................................... 23.23 – – – 100.0 – – –
Wages and salaries 2006 ............................................................... – – – 14.26 – – – 75.4 2007 ............................................................... 14.39 14.32 14.64 14.70 75.5 75.3 75.3 75.4 2008 ............................................................... 14.72 14.87 14.92 14.67 75.3 75.3 75.1 75.1 2009 ............................................................... 14.62 14.64 14.68 14.97 75.1 75.1 75.2 74.9 2010 ............................................................... 14.99 15.21 15.22 15.11 74.7 74.9 74.8 75.1
2011 ............................................................... 15.22 15.37 15.49 15.62 74.8 74.6 74.7 74.9 2012 ............................................................... 15.72 15.74 15.95 15.68 74.8 75.0 75.4 75.1 2013 ............................................................... 15.86 15.99 16.09 16.19 74.7 74.8 74.8 75.4 2014 ............................................................... 16.16 16.14 16.53 16.79 74.9 75.0 75.1 75.2 2015 ............................................................... 17.53 17.20 17.31 17.15 75.7 75.3 75.3 75.5 2016 ............................................................... 17.37 17.43 17.59 17.32 75.3 75.4 75.3 75.1 2017 ............................................................... 17.46 – – – 75.2 – – –
Total benefits 2006 ............................................................... – – – 4.66 – – – 24.6 2007 ............................................................... 4.68 4.70 4.79 4.79 24.5 24.7 24.7 24.6 2008 ............................................................... 4.83 4.88 4.94 4.87 24.7 24.7 24.9 24.9 2009 ............................................................... 4.85 4.87 4.85 5.02 24.9 24.9 24.8 25.1 2010 ............................................................... 5.07 5.09 5.14 5.00 25.3 25.1 25.2 24.9
2011 ............................................................... 5.12 5.25 5.25 5.23 25.2 25.4 25.3 25.1 2012 ............................................................... 5.30 5.26 5.22 5.19 25.2 25.0 24.6 24.9 2013 ............................................................... 5.37 5.38 5.44 5.29 25.3 25.2 25.2 24.6 2014 ............................................................... 5.40 5.38 5.48 5.54 25.1 25.0 24.9 24.8 2015 ............................................................... 5.64 5.66 5.67 5.58 24.3 24.7 24.7 24.5 2016 ............................................................... 5.70 5.67 5.78 5.75 24.7 24.6 24.7 24.9 2017 ............................................................... 5.77 – – – 24.8 – – –
Paid leave 2006 ............................................................... – – – 1.00 – – – 5.3 2007 ............................................................... 1.01 1.02 1.03 1.03 5.3 5.4 5.3 5.3 2008 ............................................................... 1.03 1.04 1.05 1.01 5.3 5.2 5.3 5.2 2009 ............................................................... 1.02 1.01 1.01 1.05 5.2 5.2 5.2 5.2 2010 ............................................................... 1.06 1.08 1.09 1.06 5.3 5.3 5.4 5.3
2011 ............................................................... 1.09 1.10 1.10 1.10 5.4 5.3 5.3 5.3 2012 ............................................................... 1.11 1.09 1.09 1.09 5.3 5.2 5.1 5.2 2013 ............................................................... 1.12 1.12 1.13 1.11 5.3 5.2 5.3 5.2 2014 ............................................................... 1.12 1.11 1.16 1.21 5.2 5.2 5.3 5.4 2015 ............................................................... 1.24 1.24 1.23 1.26 5.4 5.4 5.4 5.5 2016 ............................................................... 1.29 1.26 1.32 1.31 5.6 5.4 5.7 5.7 2017 ............................................................... 1.31 – – – 5.6 – – –
Supplemental pay 2006 ............................................................... – – – .53 – – – 2.8 2007 ............................................................... .52 .52 .53 .53 2.7 2.7 2.7 2.7 2008 ............................................................... .51 .56 .57 .53 2.6 2.8 2.8 2.7 2009 ............................................................... .49 .50 .50 .54 2.5 2.6 2.5 2.7 2010 ............................................................... .50 .47 .48 .45 2.5 2.3 2.4 2.2
2011 ............................................................... .48 .51 .51 .44 2.3 2.5 2.5 2.1 2012 ............................................................... .46 .47 .46 .47 2.2 2.2 2.2 2.2 2013 ............................................................... .49 .48 .49 .47 2.3 2.3 2.3 2.2 2014 ............................................................... .49 .50 .52 .56 2.3 2.3 2.4 2.5 2015 ............................................................... .53 .54 .55 .55 2.3 2.4 2.4 2.4 2016 ............................................................... .58 .60 .61 .60 2.5 2.6 2.6 2.6
See footnotes at end of table.
-75-

Supplemental table 5. Private service-providing industry workers, by occupational group: employer costs per hoursworked for employee compensation and costs as a percentage of total compensation, 2006-2017 -- Continued
Sales and related occupations
Compensationcomponent
Cost per hour worked Percent of total compensation
Mar. June Sep. Dec. Mar. June Sep. Dec.
Supplemental pay 2017 ............................................................... 0.60 – – – 2.6 – – –
Insurance 2006 ............................................................... – – – 1.11 – – – 5.9 2007 ............................................................... 1.13 1.14 1.16 1.16 5.9 6.0 6.0 5.9 2008 ............................................................... 1.20 1.20 1.21 1.22 6.2 6.1 6.1 6.2 2009 ............................................................... 1.26 1.27 1.27 1.30 6.5 6.5 6.5 6.5 2010 ............................................................... 1.34 1.36 1.36 1.32 6.7 6.7 6.7 6.6
2011 ............................................................... 1.37 1.41 1.40 1.41 6.7 6.8 6.8 6.8 2012 ............................................................... 1.42 1.42 1.38 1.38 6.8 6.8 6.5 6.6 2013 ............................................................... 1.48 1.48 1.50 1.43 7.0 6.9 7.0 6.7 2014 ............................................................... 1.51 1.50 1.50 1.46 7.0 7.0 6.8 6.6 2015 ............................................................... 1.51 1.52 1.52 1.42 6.5 6.6 6.6 6.2 2016 ............................................................... 1.48 1.49 1.48 1.47 6.4 6.4 6.3 6.4 2017 ............................................................... 1.47 – – – 6.3 – – –
Retirement and savings 2006 ............................................................... – – – .42 – – – 2.2 2007 ............................................................... .41 .40 .44 .45 2.2 2.1 2.3 2.3 2008 ............................................................... .45 .45 .45 .45 2.3 2.3 2.3 2.3 2009 ............................................................... .44 .44 .43 .46 2.2 2.2 2.2 2.3 2010 ............................................................... .47 .48 .49 .48 2.4 2.4 2.4 2.4
2011 ............................................................... .48 .49 .50 .51 2.4 2.4 2.4 2.5 2012 ............................................................... .53 .50 .49 .49 2.5 2.4 2.3 2.4 2013 ............................................................... .50 .52 .52 .50 2.4 2.4 2.4 2.3 2014 ............................................................... .51 .50 .50 .51 2.3 2.3 2.3 2.3 2015 ............................................................... .54 .54 .54 .56 2.3 2.4 2.4 2.5 2016 ............................................................... .55 .55 .58 .58 2.4 2.4 2.5 2.5 2017 ............................................................... .58 – – – 2.5 – – –
Legally required benefits 2006 ............................................................... – – – 1.60 – – – 8.5 2007 ............................................................... 1.60 1.61 1.63 1.63 8.4 8.5 8.4 8.4 2008 ............................................................... 1.63 1.65 1.66 1.65 8.4 8.3 8.3 8.4 2009 ............................................................... 1.64 1.65 1.65 1.67 8.4 8.4 8.4 8.4 2010 ............................................................... 1.69 1.71 1.72 1.69 8.4 8.4 8.4 8.4
2011 ............................................................... 1.71 1.74 1.74 1.75 8.4 8.4 8.4 8.4 2012 ............................................................... 1.77 1.78 1.79 1.76 8.4 8.5 8.5 8.4 2013 ............................................................... 1.77 1.78 1.79 1.77 8.4 8.3 8.3 8.3 2014 ............................................................... 1.77 1.77 1.79 1.80 8.2 8.2 8.2 8.0 2015 ............................................................... 1.82 1.82 1.82 1.79 7.9 8.0 7.9 7.9 2016 ............................................................... 1.79 1.78 1.80 1.79 7.8 7.7 7.7 7.8 2017 ............................................................... 1.81 – – – 7.8 – – –
Note: The sum of individual items may not equal totals due to rounding. Dashes indicate data are not available.
-76-
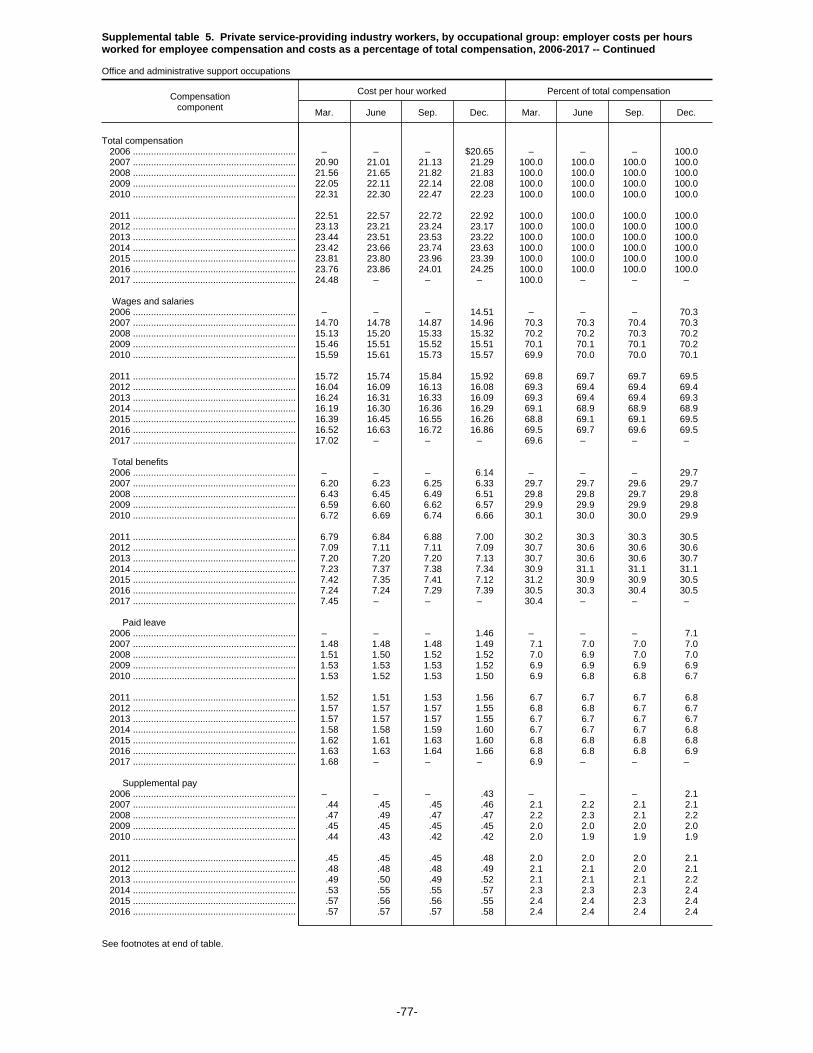
Supplemental table 5. Private service-providing industry workers, by occupational group: employer costs per hoursworked for employee compensation and costs as a percentage of total compensation, 2006-2017 -- Continued
Office and administrative support occupations
Compensationcomponent
Cost per hour worked Percent of total compensation
Mar. June Sep. Dec. Mar. June Sep. Dec.
Total compensation 2006 ............................................................... – – – $20.65 – – – 100.0 2007 ............................................................... 20.90 21.01 21.13 21.29 100.0 100.0 100.0 100.0 2008 ............................................................... 21.56 21.65 21.82 21.83 100.0 100.0 100.0 100.0 2009 ............................................................... 22.05 22.11 22.14 22.08 100.0 100.0 100.0 100.0 2010 ............................................................... 22.31 22.30 22.47 22.23 100.0 100.0 100.0 100.0
2011 ............................................................... 22.51 22.57 22.72 22.92 100.0 100.0 100.0 100.0 2012 ............................................................... 23.13 23.21 23.24 23.17 100.0 100.0 100.0 100.0 2013 ............................................................... 23.44 23.51 23.53 23.22 100.0 100.0 100.0 100.0 2014 ............................................................... 23.42 23.66 23.74 23.63 100.0 100.0 100.0 100.0 2015 ............................................................... 23.81 23.80 23.96 23.39 100.0 100.0 100.0 100.0 2016 ............................................................... 23.76 23.86 24.01 24.25 100.0 100.0 100.0 100.0 2017 ............................................................... 24.48 – – – 100.0 – – –
Wages and salaries 2006 ............................................................... – – – 14.51 – – – 70.3 2007 ............................................................... 14.70 14.78 14.87 14.96 70.3 70.3 70.4 70.3 2008 ............................................................... 15.13 15.20 15.33 15.32 70.2 70.2 70.3 70.2 2009 ............................................................... 15.46 15.51 15.52 15.51 70.1 70.1 70.1 70.2 2010 ............................................................... 15.59 15.61 15.73 15.57 69.9 70.0 70.0 70.1
2011 ............................................................... 15.72 15.74 15.84 15.92 69.8 69.7 69.7 69.5 2012 ............................................................... 16.04 16.09 16.13 16.08 69.3 69.4 69.4 69.4 2013 ............................................................... 16.24 16.31 16.33 16.09 69.3 69.4 69.4 69.3 2014 ............................................................... 16.19 16.30 16.36 16.29 69.1 68.9 68.9 68.9 2015 ............................................................... 16.39 16.45 16.55 16.26 68.8 69.1 69.1 69.5 2016 ............................................................... 16.52 16.63 16.72 16.86 69.5 69.7 69.6 69.5 2017 ............................................................... 17.02 – – – 69.6 – – –
Total benefits 2006 ............................................................... – – – 6.14 – – – 29.7 2007 ............................................................... 6.20 6.23 6.25 6.33 29.7 29.7 29.6 29.7 2008 ............................................................... 6.43 6.45 6.49 6.51 29.8 29.8 29.7 29.8 2009 ............................................................... 6.59 6.60 6.62 6.57 29.9 29.9 29.9 29.8 2010 ............................................................... 6.72 6.69 6.74 6.66 30.1 30.0 30.0 29.9
2011 ............................................................... 6.79 6.84 6.88 7.00 30.2 30.3 30.3 30.5 2012 ............................................................... 7.09 7.11 7.11 7.09 30.7 30.6 30.6 30.6 2013 ............................................................... 7.20 7.20 7.20 7.13 30.7 30.6 30.6 30.7 2014 ............................................................... 7.23 7.37 7.38 7.34 30.9 31.1 31.1 31.1 2015 ............................................................... 7.42 7.35 7.41 7.12 31.2 30.9 30.9 30.5 2016 ............................................................... 7.24 7.24 7.29 7.39 30.5 30.3 30.4 30.5 2017 ............................................................... 7.45 – – – 30.4 – – –
Paid leave 2006 ............................................................... – – – 1.46 – – – 7.1 2007 ............................................................... 1.48 1.48 1.48 1.49 7.1 7.0 7.0 7.0 2008 ............................................................... 1.51 1.50 1.52 1.52 7.0 6.9 7.0 7.0 2009 ............................................................... 1.53 1.53 1.53 1.52 6.9 6.9 6.9 6.9 2010 ............................................................... 1.53 1.52 1.53 1.50 6.9 6.8 6.8 6.7
2011 ............................................................... 1.52 1.51 1.53 1.56 6.7 6.7 6.7 6.8 2012 ............................................................... 1.57 1.57 1.57 1.55 6.8 6.8 6.7 6.7 2013 ............................................................... 1.57 1.57 1.57 1.55 6.7 6.7 6.7 6.7 2014 ............................................................... 1.58 1.58 1.59 1.60 6.7 6.7 6.7 6.8 2015 ............................................................... 1.62 1.61 1.63 1.60 6.8 6.8 6.8 6.8 2016 ............................................................... 1.63 1.63 1.64 1.66 6.8 6.8 6.8 6.9 2017 ............................................................... 1.68 – – – 6.9 – – –
Supplemental pay 2006 ............................................................... – – – .43 – – – 2.1 2007 ............................................................... .44 .45 .45 .46 2.1 2.2 2.1 2.1 2008 ............................................................... .47 .49 .47 .47 2.2 2.3 2.1 2.2 2009 ............................................................... .45 .45 .45 .45 2.0 2.0 2.0 2.0 2010 ............................................................... .44 .43 .42 .42 2.0 1.9 1.9 1.9
2011 ............................................................... .45 .45 .45 .48 2.0 2.0 2.0 2.1 2012 ............................................................... .48 .48 .48 .49 2.1 2.1 2.0 2.1 2013 ............................................................... .49 .50 .49 .52 2.1 2.1 2.1 2.2 2014 ............................................................... .53 .55 .55 .57 2.3 2.3 2.3 2.4 2015 ............................................................... .57 .56 .56 .55 2.4 2.4 2.3 2.4 2016 ............................................................... .57 .57 .57 .58 2.4 2.4 2.4 2.4
See footnotes at end of table.
-77-
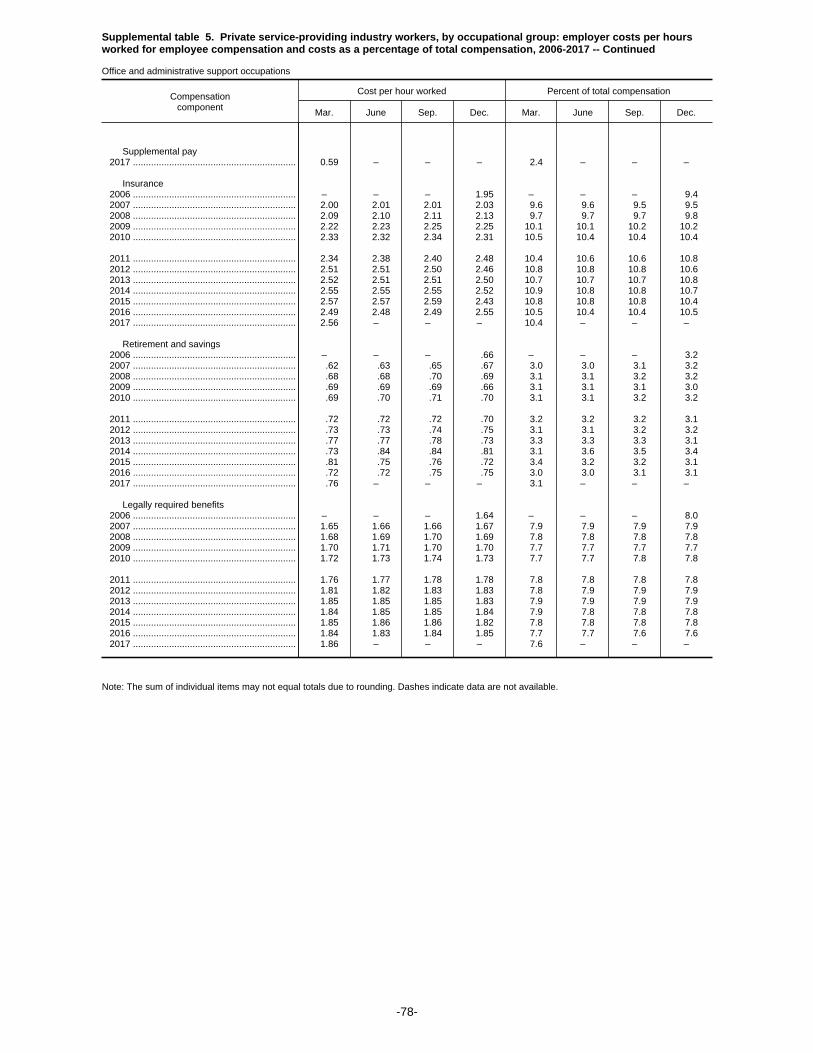
Supplemental table 5. Private service-providing industry workers, by occupational group: employer costs per hoursworked for employee compensation and costs as a percentage of total compensation, 2006-2017 -- Continued
Office and administrative support occupations
Compensationcomponent
Cost per hour worked Percent of total compensation
Mar. June Sep. Dec. Mar. June Sep. Dec.
Supplemental pay 2017 ............................................................... 0.59 – – – 2.4 – – –
Insurance 2006 ............................................................... – – – 1.95 – – – 9.4 2007 ............................................................... 2.00 2.01 2.01 2.03 9.6 9.6 9.5 9.5 2008 ............................................................... 2.09 2.10 2.11 2.13 9.7 9.7 9.7 9.8 2009 ............................................................... 2.22 2.23 2.25 2.25 10.1 10.1 10.2 10.2 2010 ............................................................... 2.33 2.32 2.34 2.31 10.5 10.4 10.4 10.4
2011 ............................................................... 2.34 2.38 2.40 2.48 10.4 10.6 10.6 10.8 2012 ............................................................... 2.51 2.51 2.50 2.46 10.8 10.8 10.8 10.6 2013 ............................................................... 2.52 2.51 2.51 2.50 10.7 10.7 10.7 10.8 2014 ............................................................... 2.55 2.55 2.55 2.52 10.9 10.8 10.8 10.7 2015 ............................................................... 2.57 2.57 2.59 2.43 10.8 10.8 10.8 10.4 2016 ............................................................... 2.49 2.48 2.49 2.55 10.5 10.4 10.4 10.5 2017 ............................................................... 2.56 – – – 10.4 – – –
Retirement and savings 2006 ............................................................... – – – .66 – – – 3.2 2007 ............................................................... .62 .63 .65 .67 3.0 3.0 3.1 3.2 2008 ............................................................... .68 .68 .70 .69 3.1 3.1 3.2 3.2 2009 ............................................................... .69 .69 .69 .66 3.1 3.1 3.1 3.0 2010 ............................................................... .69 .70 .71 .70 3.1 3.1 3.2 3.2
2011 ............................................................... .72 .72 .72 .70 3.2 3.2 3.2 3.1 2012 ............................................................... .73 .73 .74 .75 3.1 3.1 3.2 3.2 2013 ............................................................... .77 .77 .78 .73 3.3 3.3 3.3 3.1 2014 ............................................................... .73 .84 .84 .81 3.1 3.6 3.5 3.4 2015 ............................................................... .81 .75 .76 .72 3.4 3.2 3.2 3.1 2016 ............................................................... .72 .72 .75 .75 3.0 3.0 3.1 3.1 2017 ............................................................... .76 – – – 3.1 – – –
Legally required benefits 2006 ............................................................... – – – 1.64 – – – 8.0 2007 ............................................................... 1.65 1.66 1.66 1.67 7.9 7.9 7.9 7.9 2008 ............................................................... 1.68 1.69 1.70 1.69 7.8 7.8 7.8 7.8 2009 ............................................................... 1.70 1.71 1.70 1.70 7.7 7.7 7.7 7.7 2010 ............................................................... 1.72 1.73 1.74 1.73 7.7 7.7 7.8 7.8
2011 ............................................................... 1.76 1.77 1.78 1.78 7.8 7.8 7.8 7.8 2012 ............................................................... 1.81 1.82 1.83 1.83 7.8 7.9 7.9 7.9 2013 ............................................................... 1.85 1.85 1.85 1.83 7.9 7.9 7.9 7.9 2014 ............................................................... 1.84 1.85 1.85 1.84 7.9 7.8 7.8 7.8 2015 ............................................................... 1.85 1.86 1.86 1.82 7.8 7.8 7.8 7.8 2016 ............................................................... 1.84 1.83 1.84 1.85 7.7 7.7 7.6 7.6 2017 ............................................................... 1.86 – – – 7.6 – – –
Note: The sum of individual items may not equal totals due to rounding. Dashes indicate data are not available.
-78-
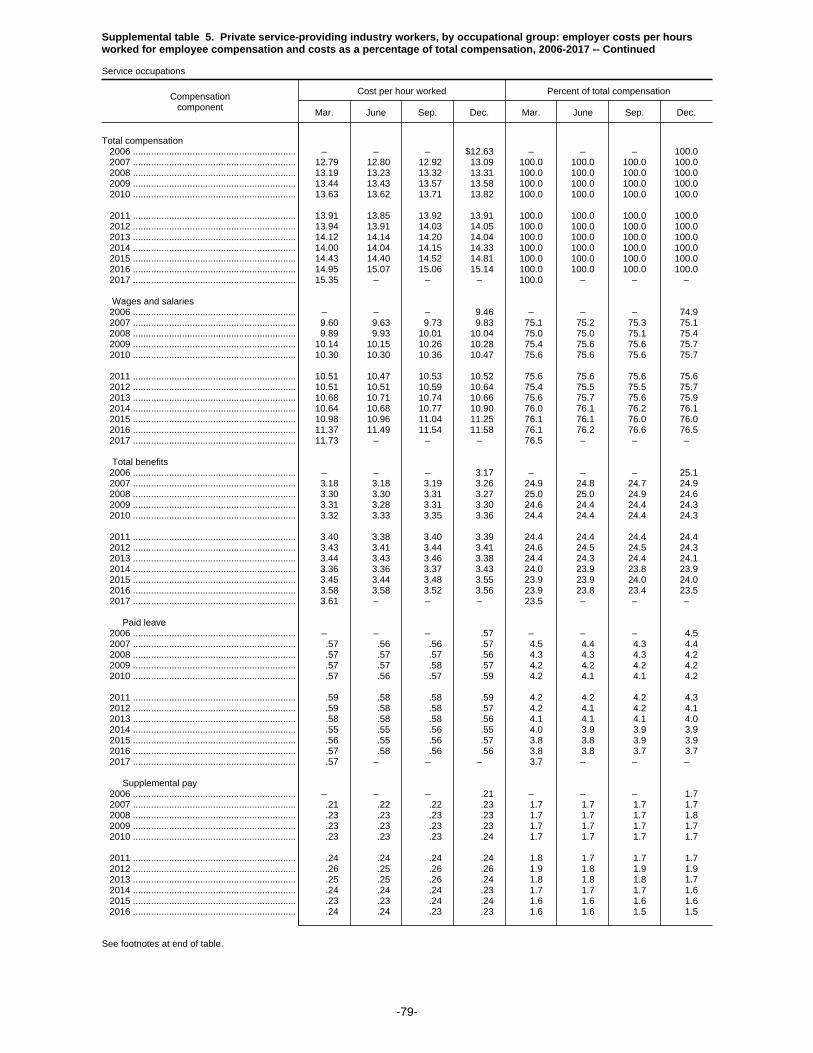
Supplemental table 5. Private service-providing industry workers, by occupational group: employer costs per hoursworked for employee compensation and costs as a percentage of total compensation, 2006-2017 -- Continued
Service occupations
Compensationcomponent
Cost per hour worked Percent of total compensation
Mar. June Sep. Dec. Mar. June Sep. Dec.
Total compensation 2006 ............................................................... – – – $12.63 – – – 100.0 2007 ............................................................... 12.79 12.80 12.92 13.09 100.0 100.0 100.0 100.0 2008 ............................................................... 13.19 13.23 13.32 13.31 100.0 100.0 100.0 100.0 2009 ............................................................... 13.44 13.43 13.57 13.58 100.0 100.0 100.0 100.0 2010 ............................................................... 13.63 13.62 13.71 13.82 100.0 100.0 100.0 100.0
2011 ............................................................... 13.91 13.85 13.92 13.91 100.0 100.0 100.0 100.0 2012 ............................................................... 13.94 13.91 14.03 14.05 100.0 100.0 100.0 100.0 2013 ............................................................... 14.12 14.14 14.20 14.04 100.0 100.0 100.0 100.0 2014 ............................................................... 14.00 14.04 14.15 14.33 100.0 100.0 100.0 100.0 2015 ............................................................... 14.43 14.40 14.52 14.81 100.0 100.0 100.0 100.0 2016 ............................................................... 14.95 15.07 15.06 15.14 100.0 100.0 100.0 100.0 2017 ............................................................... 15.35 – – – 100.0 – – –
Wages and salaries 2006 ............................................................... – – – 9.46 – – – 74.9 2007 ............................................................... 9.60 9.63 9.73 9.83 75.1 75.2 75.3 75.1 2008 ............................................................... 9.89 9.93 10.01 10.04 75.0 75.0 75.1 75.4 2009 ............................................................... 10.14 10.15 10.26 10.28 75.4 75.6 75.6 75.7 2010 ............................................................... 10.30 10.30 10.36 10.47 75.6 75.6 75.6 75.7
2011 ............................................................... 10.51 10.47 10.53 10.52 75.6 75.6 75.6 75.6 2012 ............................................................... 10.51 10.51 10.59 10.64 75.4 75.5 75.5 75.7 2013 ............................................................... 10.68 10.71 10.74 10.66 75.6 75.7 75.6 75.9 2014 ............................................................... 10.64 10.68 10.77 10.90 76.0 76.1 76.2 76.1 2015 ............................................................... 10.98 10.96 11.04 11.25 76.1 76.1 76.0 76.0 2016 ............................................................... 11.37 11.49 11.54 11.58 76.1 76.2 76.6 76.5 2017 ............................................................... 11.73 – – – 76.5 – – –
Total benefits 2006 ............................................................... – – – 3.17 – – – 25.1 2007 ............................................................... 3.18 3.18 3.19 3.26 24.9 24.8 24.7 24.9 2008 ............................................................... 3.30 3.30 3.31 3.27 25.0 25.0 24.9 24.6 2009 ............................................................... 3.31 3.28 3.31 3.30 24.6 24.4 24.4 24.3 2010 ............................................................... 3.32 3.33 3.35 3.36 24.4 24.4 24.4 24.3
2011 ............................................................... 3.40 3.38 3.40 3.39 24.4 24.4 24.4 24.4 2012 ............................................................... 3.43 3.41 3.44 3.41 24.6 24.5 24.5 24.3 2013 ............................................................... 3.44 3.43 3.46 3.38 24.4 24.3 24.4 24.1 2014 ............................................................... 3.36 3.36 3.37 3.43 24.0 23.9 23.8 23.9 2015 ............................................................... 3.45 3.44 3.48 3.55 23.9 23.9 24.0 24.0 2016 ............................................................... 3.58 3.58 3.52 3.56 23.9 23.8 23.4 23.5 2017 ............................................................... 3.61 – – – 23.5 – – –
Paid leave 2006 ............................................................... – – – .57 – – – 4.5 2007 ............................................................... .57 .56 .56 .57 4.5 4.4 4.3 4.4 2008 ............................................................... .57 .57 .57 .56 4.3 4.3 4.3 4.2 2009 ............................................................... .57 .57 .58 .57 4.2 4.2 4.2 4.2 2010 ............................................................... .57 .56 .57 .59 4.2 4.1 4.1 4.2
2011 ............................................................... .59 .58 .58 .59 4.2 4.2 4.2 4.3 2012 ............................................................... .59 .58 .58 .57 4.2 4.1 4.2 4.1 2013 ............................................................... .58 .58 .58 .56 4.1 4.1 4.1 4.0 2014 ............................................................... .55 .55 .56 .55 4.0 3.9 3.9 3.9 2015 ............................................................... .56 .55 .56 .57 3.8 3.8 3.9 3.9 2016 ............................................................... .57 .58 .56 .56 3.8 3.8 3.7 3.7 2017 ............................................................... .57 – – – 3.7 – – –
Supplemental pay 2006 ............................................................... – – – .21 – – – 1.7 2007 ............................................................... .21 .22 .22 .23 1.7 1.7 1.7 1.7 2008 ............................................................... .23 .23 .23 .23 1.7 1.7 1.7 1.8 2009 ............................................................... .23 .23 .23 .23 1.7 1.7 1.7 1.7 2010 ............................................................... .23 .23 .23 .24 1.7 1.7 1.7 1.7
2011 ............................................................... .24 .24 .24 .24 1.8 1.7 1.7 1.7 2012 ............................................................... .26 .25 .26 .26 1.9 1.8 1.9 1.9 2013 ............................................................... .25 .25 .26 .24 1.8 1.8 1.8 1.7 2014 ............................................................... .24 .24 .24 .23 1.7 1.7 1.7 1.6 2015 ............................................................... .23 .23 .24 .24 1.6 1.6 1.6 1.6 2016 ............................................................... .24 .24 .23 .23 1.6 1.6 1.5 1.5
See footnotes at end of table.
-79-
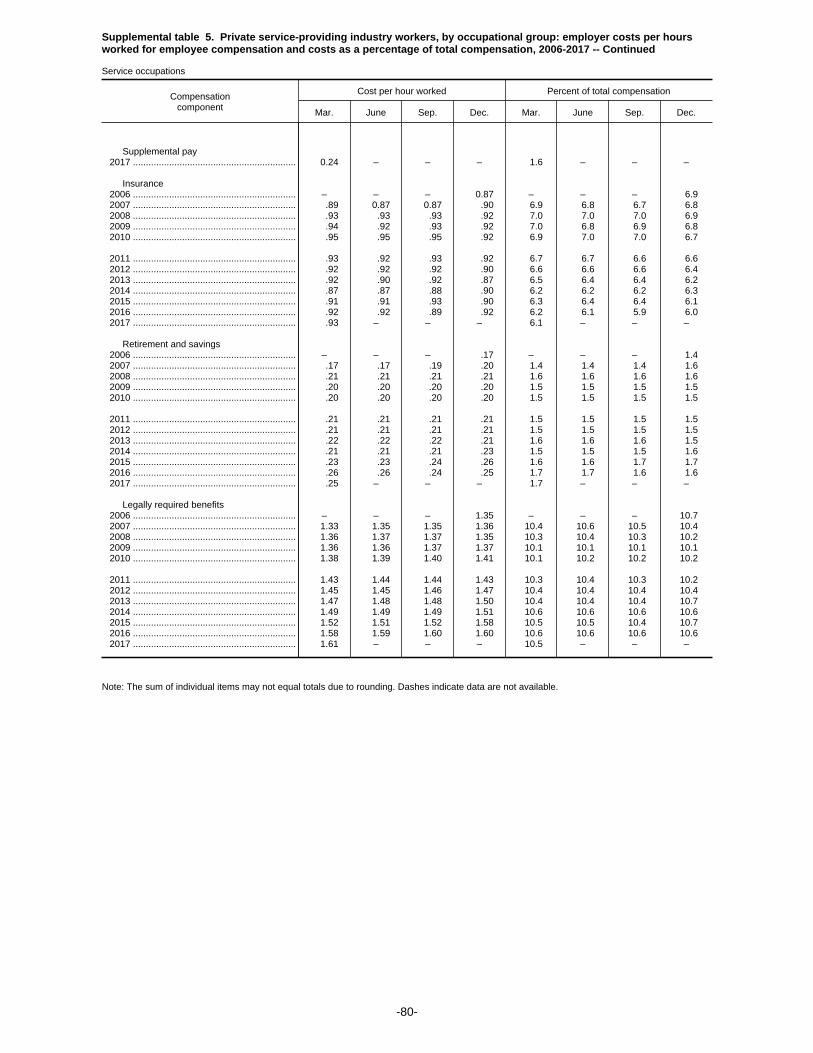
Supplemental table 5. Private service-providing industry workers, by occupational group: employer costs per hoursworked for employee compensation and costs as a percentage of total compensation, 2006-2017 -- Continued
Service occupations
Compensationcomponent
Cost per hour worked Percent of total compensation
Mar. June Sep. Dec. Mar. June Sep. Dec.
Supplemental pay 2017 ............................................................... 0.24 – – – 1.6 – – –
Insurance 2006 ............................................................... – – – 0.87 – – – 6.9 2007 ............................................................... .89 0.87 0.87 .90 6.9 6.8 6.7 6.8 2008 ............................................................... .93 .93 .93 .92 7.0 7.0 7.0 6.9 2009 ............................................................... .94 .92 .93 .92 7.0 6.8 6.9 6.8 2010 ............................................................... .95 .95 .95 .92 6.9 7.0 7.0 6.7
2011 ............................................................... .93 .92 .93 .92 6.7 6.7 6.6 6.6 2012 ............................................................... .92 .92 .92 .90 6.6 6.6 6.6 6.4 2013 ............................................................... .92 .90 .92 .87 6.5 6.4 6.4 6.2 2014 ............................................................... .87 .87 .88 .90 6.2 6.2 6.2 6.3 2015 ............................................................... .91 .91 .93 .90 6.3 6.4 6.4 6.1 2016 ............................................................... .92 .92 .89 .92 6.2 6.1 5.9 6.0 2017 ............................................................... .93 – – – 6.1 – – –
Retirement and savings 2006 ............................................................... – – – .17 – – – 1.4 2007 ............................................................... .17 .17 .19 .20 1.4 1.4 1.4 1.6 2008 ............................................................... .21 .21 .21 .21 1.6 1.6 1.6 1.6 2009 ............................................................... .20 .20 .20 .20 1.5 1.5 1.5 1.5 2010 ............................................................... .20 .20 .20 .20 1.5 1.5 1.5 1.5
2011 ............................................................... .21 .21 .21 .21 1.5 1.5 1.5 1.5 2012 ............................................................... .21 .21 .21 .21 1.5 1.5 1.5 1.5 2013 ............................................................... .22 .22 .22 .21 1.6 1.6 1.6 1.5 2014 ............................................................... .21 .21 .21 .23 1.5 1.5 1.5 1.6 2015 ............................................................... .23 .23 .24 .26 1.6 1.6 1.7 1.7 2016 ............................................................... .26 .26 .24 .25 1.7 1.7 1.6 1.6 2017 ............................................................... .25 – – – 1.7 – – –
Legally required benefits 2006 ............................................................... – – – 1.35 – – – 10.7 2007 ............................................................... 1.33 1.35 1.35 1.36 10.4 10.6 10.5 10.4 2008 ............................................................... 1.36 1.37 1.37 1.35 10.3 10.4 10.3 10.2 2009 ............................................................... 1.36 1.36 1.37 1.37 10.1 10.1 10.1 10.1 2010 ............................................................... 1.38 1.39 1.40 1.41 10.1 10.2 10.2 10.2
2011 ............................................................... 1.43 1.44 1.44 1.43 10.3 10.4 10.3 10.2 2012 ............................................................... 1.45 1.45 1.46 1.47 10.4 10.4 10.4 10.4 2013 ............................................................... 1.47 1.48 1.48 1.50 10.4 10.4 10.4 10.7 2014 ............................................................... 1.49 1.49 1.49 1.51 10.6 10.6 10.6 10.6 2015 ............................................................... 1.52 1.51 1.52 1.58 10.5 10.5 10.4 10.7 2016 ............................................................... 1.58 1.59 1.60 1.60 10.6 10.6 10.6 10.6 2017 ............................................................... 1.61 – – – 10.5 – – –
Note: The sum of individual items may not equal totals due to rounding. Dashes indicate data are not available.
-80-

Supplemental table 5. Private service-providing industry workers, by occupational group: employer costs per hoursworked for employee compensation and costs as a percentage of total compensation, 2006-2017 -- Continued
Natural resources, construction, and maintenance occupations
Compensationcomponent
Cost per hour worked Percent of total compensation
Mar. June Sep. Dec. Mar. June Sep. Dec.
Total compensation 2006 ............................................................... – – – $28.27 – – – 100.0 2007 ............................................................... 28.22 28.49 28.65 28.67 100.0 100.0 100.0 100.0 2008 ............................................................... 28.84 28.91 29.14 29.53 100.0 100.0 100.0 100.0 2009 ............................................................... 29.80 29.88 29.98 29.83 100.0 100.0 100.0 100.0 2010 ............................................................... 30.34 30.32 30.31 29.77 100.0 100.0 100.0 100.0
2011 ............................................................... 29.77 30.03 30.31 29.78 100.0 100.0 100.0 100.0 2012 ............................................................... 30.36 30.71 30.75 30.95 100.0 100.0 100.0 100.0 2013 ............................................................... 31.22 31.14 31.34 30.87 100.0 100.0 100.0 100.0 2014 ............................................................... 31.49 32.11 32.46 32.49 100.0 100.0 100.0 100.0 2015 ............................................................... 32.68 32.28 32.45 31.37 100.0 100.0 100.0 100.0 2016 ............................................................... 31.59 31.53 31.06 32.43 100.0 100.0 100.0 100.0 2017 ............................................................... 32.51 – – – 100.0 – – –
Wages and salaries 2006 ............................................................... – – – 19.53 – – – 69.1 2007 ............................................................... 19.61 19.76 19.90 19.90 69.5 69.4 69.5 69.4 2008 ............................................................... 20.03 20.24 20.35 20.47 69.5 70.0 69.8 69.3 2009 ............................................................... 20.66 20.75 20.84 20.79 69.3 69.4 69.5 69.7 2010 ............................................................... 21.00 20.94 20.93 20.75 69.2 69.1 69.0 69.7
2011 ............................................................... 20.75 20.88 21.08 20.73 69.7 69.5 69.5 69.6 2012 ............................................................... 20.92 21.12 21.13 21.25 68.9 68.8 68.7 68.7 2013 ............................................................... 21.41 21.37 21.52 21.36 68.6 68.6 68.7 69.2 2014 ............................................................... 21.71 21.80 22.05 21.97 68.9 67.9 67.9 67.6 2015 ............................................................... 22.06 22.24 22.33 21.68 67.5 68.9 68.8 69.1 2016 ............................................................... 21.85 21.88 21.69 22.46 69.2 69.4 69.8 69.3 2017 ............................................................... 22.51 – – – 69.3 – – –
Total benefits 2006 ............................................................... – – – 8.74 – – – 30.9 2007 ............................................................... 8.62 8.73 8.75 8.77 30.5 30.6 30.5 30.6 2008 ............................................................... 8.81 8.67 8.79 9.06 30.5 30.0 30.2 30.7 2009 ............................................................... 9.14 9.13 9.14 9.05 30.7 30.6 30.5 30.3 2010 ............................................................... 9.34 9.37 9.38 9.02 30.8 30.9 31.0 30.3
2011 ............................................................... 9.02 9.15 9.23 9.04 30.3 30.5 30.5 30.4 2012 ............................................................... 9.43 9.59 9.62 9.70 31.1 31.2 31.3 31.3 2013 ............................................................... 9.81 9.78 9.82 9.51 31.4 31.4 31.3 30.8 2014 ............................................................... 9.78 10.31 10.41 10.52 31.1 32.1 32.1 32.4 2015 ............................................................... 10.62 10.04 10.12 9.69 32.5 31.1 31.2 30.9 2016 ............................................................... 9.74 9.65 9.36 9.97 30.8 30.6 30.2 30.7 2017 ............................................................... 9.99 – – – 30.7 – – –
Paid leave 2006 ............................................................... – – – 1.88 – – – 6.7 2007 ............................................................... 1.89 1.91 1.89 1.88 6.7 6.7 6.6 6.6 2008 ............................................................... 1.90 1.89 1.92 1.90 6.6 6.5 6.6 6.4 2009 ............................................................... 1.94 1.93 1.93 1.93 6.5 6.5 6.4 6.5 2010 ............................................................... 1.98 1.96 1.96 1.93 6.5 6.5 6.5 6.5
2011 ............................................................... 1.95 1.95 1.97 1.97 6.6 6.5 6.5 6.6 2012 ............................................................... 1.98 1.99 2.00 2.07 6.5 6.5 6.5 6.7 2013 ............................................................... 2.07 2.06 2.08 2.05 6.6 6.6 6.6 6.6 2014 ............................................................... 2.11 2.12 2.15 2.11 6.7 6.6 6.6 6.5 2015 ............................................................... 2.13 2.11 2.13 2.02 6.5 6.5 6.6 6.4 2016 ............................................................... 2.03 2.03 1.96 2.09 6.4 6.5 6.3 6.4 2017 ............................................................... 2.08 – – – 6.4 – – –
Supplemental pay 2006 ............................................................... – – – .77 – – – 2.7 2007 ............................................................... .78 .80 .80 .80 2.8 2.8 2.8 2.8 2008 ............................................................... .82 .80 .84 .86 2.8 2.8 2.9 2.9 2009 ............................................................... .84 .86 .86 .81 2.8 2.9 2.9 2.7 2010 ............................................................... .83 .81 .81 .76 2.7 2.7 2.7 2.6
2011 ............................................................... .75 .77 .78 .77 2.5 2.6 2.6 2.6 2012 ............................................................... .77 .76 .79 .78 2.5 2.5 2.6 2.5 2013 ............................................................... .78 .76 .77 .80 2.5 2.4 2.5 2.6 2014 ............................................................... .82 .83 .84 .86 2.6 2.6 2.6 2.6 2015 ............................................................... .88 .87 .87 .84 2.7 2.7 2.7 2.7 2016 ............................................................... .86 .85 .86 .88 2.7 2.7 2.8 2.7
See footnotes at end of table.
-81-

Supplemental table 5. Private service-providing industry workers, by occupational group: employer costs per hoursworked for employee compensation and costs as a percentage of total compensation, 2006-2017 -- Continued
Natural resources, construction, and maintenance occupations
Compensationcomponent
Cost per hour worked Percent of total compensation
Mar. June Sep. Dec. Mar. June Sep. Dec.
Supplemental pay 2017 ............................................................... 0.86 – – – 2.7 – – –
Insurance 2006 ............................................................... – – – 2.27 – – – 8.0 2007 ............................................................... 2.28 2.31 2.33 2.33 8.1 8.1 8.1 8.1 2008 ............................................................... 2.33 2.32 2.35 2.45 8.1 8.0 8.1 8.3 2009 ............................................................... 2.52 2.55 2.57 2.51 8.5 8.5 8.6 8.4 2010 ............................................................... 2.63 2.62 2.65 2.53 8.7 8.7 8.7 8.5
2011 ............................................................... 2.57 2.59 2.61 2.54 8.6 8.6 8.6 8.5 2012 ............................................................... 2.62 2.62 2.61 2.63 8.6 8.5 8.5 8.5 2013 ............................................................... 2.68 2.66 2.68 2.68 8.6 8.5 8.6 8.7 2014 ............................................................... 2.82 2.83 2.84 2.86 8.9 8.8 8.8 8.8 2015 ............................................................... 2.88 2.84 2.87 2.76 8.8 8.8 8.9 8.8 2016 ............................................................... 2.78 2.77 2.62 2.85 8.8 8.8 8.4 8.8 2017 ............................................................... 2.85 – – – 8.8 – – –
Retirement and savings 2006 ............................................................... – – – 1.18 – – – 4.2 2007 ............................................................... 1.03 1.07 1.08 1.10 3.7 3.7 3.8 3.8 2008 ............................................................... 1.11 .99 1.02 1.15 3.8 3.4 3.5 3.9 2009 ............................................................... 1.13 1.07 1.06 1.10 3.8 3.6 3.5 3.7 2010 ............................................................... 1.13 1.22 1.21 1.08 3.7 4.0 4.0 3.6
2011 ............................................................... 1.04 1.07 1.05 1.04 3.5 3.6 3.5 3.5 2012 ............................................................... 1.29 1.40 1.40 1.40 4.3 4.6 4.5 4.5 2013 ............................................................... 1.45 1.48 1.44 1.18 4.6 4.7 4.6 3.8 2014 ............................................................... 1.20 1.69 1.72 1.88 3.8 5.3 5.3 5.8 2015 ............................................................... 1.90 1.38 1.41 1.31 5.8 4.3 4.3 4.2 2016 ............................................................... 1.31 1.25 1.18 1.25 4.1 4.0 3.8 3.9 2017 ............................................................... 1.26 – – – 3.9 – – –
Legally required benefits 2006 ............................................................... – – – 2.64 – – – 9.3 2007 ............................................................... 2.64 2.64 2.66 2.65 9.3 9.3 9.3 9.3 2008 ............................................................... 2.65 2.66 2.66 2.69 9.2 9.2 9.1 9.1 2009 ............................................................... 2.71 2.72 2.72 2.71 9.1 9.1 9.1 9.1 2010 ............................................................... 2.76 2.76 2.75 2.71 9.1 9.1 9.1 9.1
2011 ............................................................... 2.71 2.77 2.81 2.72 9.1 9.2 9.3 9.1 2012 ............................................................... 2.77 2.81 2.83 2.81 9.1 9.2 9.2 9.1 2013 ............................................................... 2.83 2.82 2.84 2.81 9.1 9.0 9.1 9.1 2014 ............................................................... 2.84 2.84 2.87 2.80 9.0 8.9 8.8 8.6 2015 ............................................................... 2.82 2.84 2.83 2.76 8.6 8.8 8.7 8.8 2016 ............................................................... 2.76 2.75 2.74 2.89 8.7 8.7 8.8 8.9 2017 ............................................................... 2.93 – – – 9.0 – – –
Note: The sum of individual items may not equal totals due to rounding. Dashes indicate data are not available.
-82-

Supplemental table 5. Private service-providing industry workers, by occupational group: employer costs per hoursworked for employee compensation and costs as a percentage of total compensation, 2006-2017 -- Continued
Installation, maintenance, and repair occupations
Compensationcomponent
Cost per hour worked Percent of total compensation
Mar. June Sep. Dec. Mar. June Sep. Dec.
Total compensation 2006 ............................................................... – – – $28.54 – – – 100.0 2007 ............................................................... 28.58 28.87 29.05 29.06 100.0 100.0 100.0 100.0 2008 ............................................................... 29.26 29.28 29.58 29.74 100.0 100.0 100.0 100.0 2009 ............................................................... 30.01 29.99 30.10 30.16 100.0 100.0 100.0 100.0 2010 ............................................................... 30.61 30.56 30.56 29.89 100.0 100.0 100.0 100.0
2011 ............................................................... 30.07 30.36 30.57 30.34 100.0 100.0 100.0 100.0 2012 ............................................................... 30.96 31.37 31.40 31.39 100.0 100.0 100.0 100.0 2013 ............................................................... 31.64 31.63 31.85 31.42 100.0 100.0 100.0 100.0 2014 ............................................................... 32.12 32.79 33.15 33.14 100.0 100.0 100.0 100.0 2015 ............................................................... 33.33 32.86 33.03 31.51 100.0 100.0 100.0 100.0 2016 ............................................................... 31.74 31.67 31.06 32.20 100.0 100.0 100.0 100.0 2017 ............................................................... 32.31 – – – 100.0 – – –
Wages and salaries 2006 ............................................................... – – – 19.75 – – – 69.2 2007 ............................................................... 19.89 20.07 20.24 20.22 69.6 69.5 69.7 69.6 2008 ............................................................... 20.35 20.54 20.69 20.69 69.6 70.2 70.0 69.6 2009 ............................................................... 20.87 20.92 21.03 21.10 69.5 69.8 69.8 70.0 2010 ............................................................... 21.30 21.23 21.21 20.98 69.6 69.5 69.4 70.2
2011 ............................................................... 21.00 21.17 21.33 21.13 69.8 69.7 69.8 69.7 2012 ............................................................... 21.32 21.54 21.54 21.53 68.9 68.7 68.6 68.6 2013 ............................................................... 21.66 21.68 21.86 21.72 68.5 68.5 68.6 69.1 2014 ............................................................... 22.12 22.17 22.43 22.26 68.9 67.6 67.7 67.2 2015 ............................................................... 22.35 22.55 22.64 21.72 67.1 68.6 68.5 68.9 2016 ............................................................... 21.87 21.93 21.69 22.31 68.9 69.2 69.8 69.3 2017 ............................................................... 22.40 – – – 69.3 – – –
Total benefits 2006 ............................................................... – – – 8.78 – – – 30.8 2007 ............................................................... 8.69 8.81 8.81 8.84 30.4 30.5 30.3 30.4 2008 ............................................................... 8.91 8.74 8.88 9.05 30.4 29.8 30.0 30.4 2009 ............................................................... 9.14 9.07 9.08 9.06 30.5 30.2 30.2 30.0 2010 ............................................................... 9.31 9.33 9.35 8.91 30.4 30.5 30.6 29.8
2011 ............................................................... 9.07 9.19 9.24 9.21 30.2 30.3 30.2 30.3 2012 ............................................................... 9.64 9.83 9.86 9.86 31.1 31.3 31.4 31.4 2013 ............................................................... 9.98 9.95 9.99 9.70 31.5 31.5 31.4 30.9 2014 ............................................................... 10.00 10.61 10.72 10.87 31.1 32.4 32.3 32.8 2015 ............................................................... 10.98 10.31 10.40 9.79 32.9 31.4 31.5 31.1 2016 ............................................................... 9.87 9.74 9.37 9.89 31.1 30.8 30.2 30.7 2017 ............................................................... 9.91 – – – 30.7 – – –
Paid leave 2006 ............................................................... – – – 1.95 – – – 6.8 2007 ............................................................... 1.96 2.00 1.98 1.97 6.9 6.9 6.8 6.8 2008 ............................................................... 1.98 1.97 2.00 2.01 6.8 6.7 6.8 6.7 2009 ............................................................... 2.04 2.03 2.04 2.05 6.8 6.8 6.8 6.8 2010 ............................................................... 2.09 2.07 2.07 2.02 6.8 6.8 6.8 6.8
2011 ............................................................... 2.04 2.04 2.06 2.05 6.8 6.7 6.7 6.7 2012 ............................................................... 2.06 2.08 2.08 2.13 6.7 6.6 6.6 6.8 2013 ............................................................... 2.13 2.12 2.15 2.12 6.7 6.7 6.7 6.8 2014 ............................................................... 2.20 2.20 2.23 2.19 6.8 6.7 6.7 6.6 2015 ............................................................... 2.22 2.20 2.22 2.06 6.6 6.7 6.7 6.5 2016 ............................................................... 2.08 2.08 1.99 2.13 6.6 6.6 6.4 6.6 2017 ............................................................... 2.12 – – – 6.6 – – –
Supplemental pay 2006 ............................................................... – – – .78 – – – 2.7 2007 ............................................................... .79 .82 .81 .81 2.8 2.8 2.8 2.8 2008 ............................................................... .83 .81 .84 .85 2.8 2.8 2.8 2.9 2009 ............................................................... .83 .83 .83 .79 2.8 2.8 2.8 2.6 2010 ............................................................... .79 .76 .76 .71 2.6 2.5 2.5 2.4
2011 ............................................................... .74 .74 .75 .75 2.4 2.5 2.5 2.5 2012 ............................................................... .75 .74 .77 .80 2.4 2.4 2.5 2.5 2013 ............................................................... .80 .77 .78 .82 2.5 2.4 2.5 2.6 2014 ............................................................... .85 .86 .87 .89 2.7 2.6 2.6 2.7 2015 ............................................................... .92 .90 .91 .89 2.8 2.7 2.7 2.8 2016 ............................................................... .90 .87 .89 .91 2.8 2.8 2.9 2.8
See footnotes at end of table.
-83-

Supplemental table 5. Private service-providing industry workers, by occupational group: employer costs per hoursworked for employee compensation and costs as a percentage of total compensation, 2006-2017 -- Continued
Installation, maintenance, and repair occupations
Compensationcomponent
Cost per hour worked Percent of total compensation
Mar. June Sep. Dec. Mar. June Sep. Dec.
Supplemental pay 2017 ............................................................... 0.89 – – – 2.8 – – –
Insurance 2006 ............................................................... – – – 2.25 – – – 7.9 2007 ............................................................... 2.28 2.30 2.30 2.32 8.0 8.0 7.9 8.0 2008 ............................................................... 2.32 2.32 2.36 2.46 7.9 7.9 8.0 8.3 2009 ............................................................... 2.52 2.56 2.57 2.56 8.4 8.5 8.5 8.5 2010 ............................................................... 2.64 2.68 2.70 2.57 8.6 8.8 8.8 8.6
2011 ............................................................... 2.64 2.67 2.68 2.67 8.8 8.8 8.8 8.8 2012 ............................................................... 2.76 2.76 2.75 2.70 8.9 8.8 8.7 8.6 2013 ............................................................... 2.75 2.72 2.74 2.76 8.7 8.6 8.6 8.8 2014 ............................................................... 2.91 2.92 2.94 2.95 9.0 8.9 8.9 8.9 2015 ............................................................... 2.96 2.93 2.96 2.82 8.9 8.9 8.9 8.9 2016 ............................................................... 2.86 2.84 2.66 2.89 9.0 9.0 8.6 9.0 2017 ............................................................... 2.88 – – – 8.9 – – –
Retirement and savings 2006 ............................................................... – – – 1.18 – – – 4.1 2007 ............................................................... 1.03 1.07 1.07 1.10 3.6 3.7 3.7 3.8 2008 ............................................................... 1.13 .99 1.03 1.10 3.9 3.4 3.5 3.7 2009 ............................................................... 1.10 .99 .99 1.00 3.7 3.3 3.3 3.3 2010 ............................................................... 1.08 1.12 1.14 .98 3.5 3.7 3.7 3.3
2011 ............................................................... 1.00 1.02 1.00 1.03 3.3 3.4 3.3 3.4 2012 ............................................................... 1.32 1.44 1.44 1.41 4.3 4.6 4.6 4.5 2013 ............................................................... 1.47 1.50 1.46 1.17 4.6 4.7 4.6 3.7 2014 ............................................................... 1.19 1.77 1.79 2.03 3.7 5.4 5.4 6.1 2015 ............................................................... 2.06 1.44 1.47 1.29 6.2 4.4 4.5 4.1 2016 ............................................................... 1.30 1.23 1.13 1.23 4.1 3.9 3.6 3.8 2017 ............................................................... 1.24 – – – 3.8 – – –
Legally required benefits 2006 ............................................................... – – – 2.62 – – – 9.2 2007 ............................................................... 2.63 2.63 2.65 2.64 9.2 9.1 9.1 9.1 2008 ............................................................... 2.64 2.65 2.65 2.64 9.0 9.0 9.0 8.9 2009 ............................................................... 2.65 2.65 2.65 2.66 8.8 8.8 8.8 8.8 2010 ............................................................... 2.70 2.69 2.68 2.63 8.8 8.8 8.8 8.8
2011 ............................................................... 2.65 2.71 2.75 2.72 8.8 8.9 9.0 9.0 2012 ............................................................... 2.76 2.81 2.82 2.82 8.9 9.0 9.0 9.0 2013 ............................................................... 2.84 2.84 2.86 2.83 9.0 9.0 9.0 9.0 2014 ............................................................... 2.86 2.86 2.89 2.81 8.9 8.7 8.7 8.5 2015 ............................................................... 2.83 2.85 2.84 2.73 8.5 8.7 8.6 8.7 2016 ............................................................... 2.73 2.72 2.70 2.73 8.6 8.6 8.7 8.5 2017 ............................................................... 2.77 – – – 8.6 – – –
Note: The sum of individual items may not equal totals due to rounding. Dashes indicate data are not available.
-84-
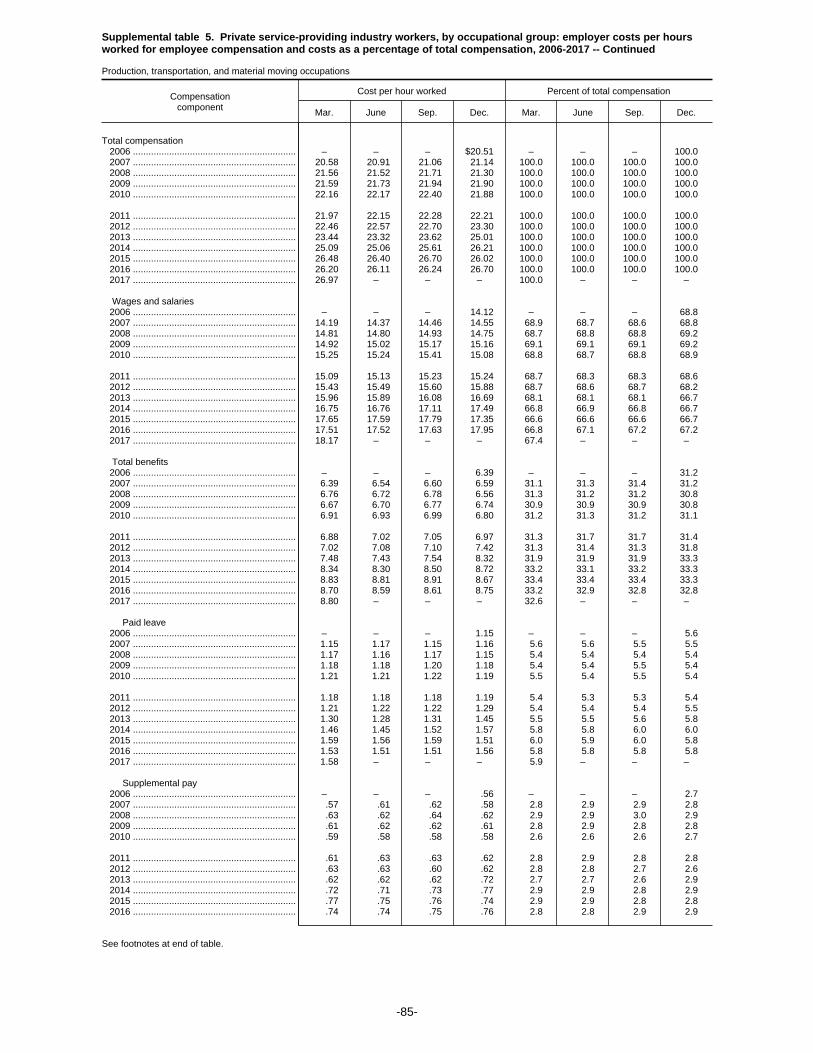
Supplemental table 5. Private service-providing industry workers, by occupational group: employer costs per hoursworked for employee compensation and costs as a percentage of total compensation, 2006-2017 -- Continued
Production, transportation, and material moving occupations
Compensationcomponent
Cost per hour worked Percent of total compensation
Mar. June Sep. Dec. Mar. June Sep. Dec.
Total compensation 2006 ............................................................... – – – $20.51 – – – 100.0 2007 ............................................................... 20.58 20.91 21.06 21.14 100.0 100.0 100.0 100.0 2008 ............................................................... 21.56 21.52 21.71 21.30 100.0 100.0 100.0 100.0 2009 ............................................................... 21.59 21.73 21.94 21.90 100.0 100.0 100.0 100.0 2010 ............................................................... 22.16 22.17 22.40 21.88 100.0 100.0 100.0 100.0
2011 ............................................................... 21.97 22.15 22.28 22.21 100.0 100.0 100.0 100.0 2012 ............................................................... 22.46 22.57 22.70 23.30 100.0 100.0 100.0 100.0 2013 ............................................................... 23.44 23.32 23.62 25.01 100.0 100.0 100.0 100.0 2014 ............................................................... 25.09 25.06 25.61 26.21 100.0 100.0 100.0 100.0 2015 ............................................................... 26.48 26.40 26.70 26.02 100.0 100.0 100.0 100.0 2016 ............................................................... 26.20 26.11 26.24 26.70 100.0 100.0 100.0 100.0 2017 ............................................................... 26.97 – – – 100.0 – – –
Wages and salaries 2006 ............................................................... – – – 14.12 – – – 68.8 2007 ............................................................... 14.19 14.37 14.46 14.55 68.9 68.7 68.6 68.8 2008 ............................................................... 14.81 14.80 14.93 14.75 68.7 68.8 68.8 69.2 2009 ............................................................... 14.92 15.02 15.17 15.16 69.1 69.1 69.1 69.2 2010 ............................................................... 15.25 15.24 15.41 15.08 68.8 68.7 68.8 68.9
2011 ............................................................... 15.09 15.13 15.23 15.24 68.7 68.3 68.3 68.6 2012 ............................................................... 15.43 15.49 15.60 15.88 68.7 68.6 68.7 68.2 2013 ............................................................... 15.96 15.89 16.08 16.69 68.1 68.1 68.1 66.7 2014 ............................................................... 16.75 16.76 17.11 17.49 66.8 66.9 66.8 66.7 2015 ............................................................... 17.65 17.59 17.79 17.35 66.6 66.6 66.6 66.7 2016 ............................................................... 17.51 17.52 17.63 17.95 66.8 67.1 67.2 67.2 2017 ............................................................... 18.17 – – – 67.4 – – –
Total benefits 2006 ............................................................... – – – 6.39 – – – 31.2 2007 ............................................................... 6.39 6.54 6.60 6.59 31.1 31.3 31.4 31.2 2008 ............................................................... 6.76 6.72 6.78 6.56 31.3 31.2 31.2 30.8 2009 ............................................................... 6.67 6.70 6.77 6.74 30.9 30.9 30.9 30.8 2010 ............................................................... 6.91 6.93 6.99 6.80 31.2 31.3 31.2 31.1
2011 ............................................................... 6.88 7.02 7.05 6.97 31.3 31.7 31.7 31.4 2012 ............................................................... 7.02 7.08 7.10 7.42 31.3 31.4 31.3 31.8 2013 ............................................................... 7.48 7.43 7.54 8.32 31.9 31.9 31.9 33.3 2014 ............................................................... 8.34 8.30 8.50 8.72 33.2 33.1 33.2 33.3 2015 ............................................................... 8.83 8.81 8.91 8.67 33.4 33.4 33.4 33.3 2016 ............................................................... 8.70 8.59 8.61 8.75 33.2 32.9 32.8 32.8 2017 ............................................................... 8.80 – – – 32.6 – – –
Paid leave 2006 ............................................................... – – – 1.15 – – – 5.6 2007 ............................................................... 1.15 1.17 1.15 1.16 5.6 5.6 5.5 5.5 2008 ............................................................... 1.17 1.16 1.17 1.15 5.4 5.4 5.4 5.4 2009 ............................................................... 1.18 1.18 1.20 1.18 5.4 5.4 5.5 5.4 2010 ............................................................... 1.21 1.21 1.22 1.19 5.5 5.4 5.5 5.4
2011 ............................................................... 1.18 1.18 1.18 1.19 5.4 5.3 5.3 5.4 2012 ............................................................... 1.21 1.22 1.22 1.29 5.4 5.4 5.4 5.5 2013 ............................................................... 1.30 1.28 1.31 1.45 5.5 5.5 5.6 5.8 2014 ............................................................... 1.46 1.45 1.52 1.57 5.8 5.8 6.0 6.0 2015 ............................................................... 1.59 1.56 1.59 1.51 6.0 5.9 6.0 5.8 2016 ............................................................... 1.53 1.51 1.51 1.56 5.8 5.8 5.8 5.8 2017 ............................................................... 1.58 – – – 5.9 – – –
Supplemental pay 2006 ............................................................... – – – .56 – – – 2.7 2007 ............................................................... .57 .61 .62 .58 2.8 2.9 2.9 2.8 2008 ............................................................... .63 .62 .64 .62 2.9 2.9 3.0 2.9 2009 ............................................................... .61 .62 .62 .61 2.8 2.9 2.8 2.8 2010 ............................................................... .59 .58 .58 .58 2.6 2.6 2.6 2.7
2011 ............................................................... .61 .63 .63 .62 2.8 2.9 2.8 2.8 2012 ............................................................... .63 .63 .60 .62 2.8 2.8 2.7 2.6 2013 ............................................................... .62 .62 .62 .72 2.7 2.7 2.6 2.9 2014 ............................................................... .72 .71 .73 .77 2.9 2.9 2.8 2.9 2015 ............................................................... .77 .75 .76 .74 2.9 2.9 2.8 2.8 2016 ............................................................... .74 .74 .75 .76 2.8 2.8 2.9 2.9
See footnotes at end of table.
-85-

Supplemental table 5. Private service-providing industry workers, by occupational group: employer costs per hoursworked for employee compensation and costs as a percentage of total compensation, 2006-2017 -- Continued
Production, transportation, and material moving occupations
Compensationcomponent
Cost per hour worked Percent of total compensation
Mar. June Sep. Dec. Mar. June Sep. Dec.
Supplemental pay 2017 ............................................................... 0.76 – – – 2.8 – – –
Insurance 2006 ............................................................... – – – 1.69 – – – 8.3 2007 ............................................................... 1.75 1.78 1.83 1.84 8.5 8.5 8.7 8.7 2008 ............................................................... 1.88 1.88 1.90 1.84 8.7 8.7 8.8 8.6 2009 ............................................................... 1.89 1.90 1.93 1.93 8.8 8.8 8.8 8.8 2010 ............................................................... 2.04 2.08 2.10 2.08 9.2 9.4 9.4 9.5
2011 ............................................................... 2.10 2.13 2.15 2.08 9.5 9.6 9.6 9.4 2012 ............................................................... 2.11 2.14 2.16 2.27 9.4 9.5 9.5 9.7 2013 ............................................................... 2.29 2.26 2.29 2.60 9.8 9.7 9.7 10.4 2014 ............................................................... 2.61 2.59 2.63 2.61 10.4 10.4 10.3 10.0 2015 ............................................................... 2.65 2.68 2.71 2.59 10.0 10.2 10.2 10.0 2016 ............................................................... 2.60 2.53 2.56 2.54 9.9 9.7 9.8 9.5 2017 ............................................................... 2.54 – – – 9.4 – – –
Retirement and savings 2006 ............................................................... – – – .84 – – – 4.1 2007 ............................................................... .80 .85 .86 .88 3.9 4.1 4.1 4.2 2008 ............................................................... .91 .89 .90 .85 4.2 4.2 4.1 4.0 2009 ............................................................... .86 .86 .87 .87 4.0 4.0 4.0 4.0 2010 ............................................................... .89 .86 .88 .78 4.0 3.9 3.9 3.6
2011 ............................................................... .80 .86 .87 .81 3.6 3.9 3.9 3.6 2012 ............................................................... .78 .80 .81 .89 3.5 3.5 3.6 3.8 2013 ............................................................... .90 .89 .91 1.06 3.8 3.8 3.8 4.2 2014 ............................................................... 1.06 1.04 1.08 1.18 4.2 4.2 4.2 4.5 2015 ............................................................... 1.21 1.21 1.25 1.24 4.6 4.6 4.7 4.8 2016 ............................................................... 1.24 1.24 1.23 1.29 4.7 4.7 4.7 4.8 2017 ............................................................... 1.30 – – – 4.8 – – –
Legally required benefits 2006 ............................................................... – – – 2.15 – – – 10.5 2007 ............................................................... 2.12 2.12 2.14 2.13 10.3 10.1 10.2 10.1 2008 ............................................................... 2.17 2.17 2.17 2.09 10.1 10.1 10.0 9.8 2009 ............................................................... 2.12 2.14 2.15 2.15 9.8 9.9 9.8 9.8 2010 ............................................................... 2.19 2.19 2.22 2.17 9.9 9.9 9.9 9.9
2011 ............................................................... 2.19 2.22 2.23 2.27 10.0 10.0 10.0 10.2 2012 ............................................................... 2.29 2.30 2.31 2.36 10.2 10.2 10.2 10.1 2013 ............................................................... 2.37 2.38 2.40 2.49 10.1 10.2 10.2 10.0 2014 ............................................................... 2.49 2.50 2.54 2.60 9.9 10.0 9.9 9.9 2015 ............................................................... 2.61 2.60 2.60 2.59 9.8 9.8 9.7 9.9 2016 ............................................................... 2.58 2.57 2.56 2.60 9.8 9.8 9.7 9.7 2017 ............................................................... 2.62 – – – 9.7 – – –
Note: The sum of individual items may not equal totals due to rounding. Dashes indicate data are not available.
-86-
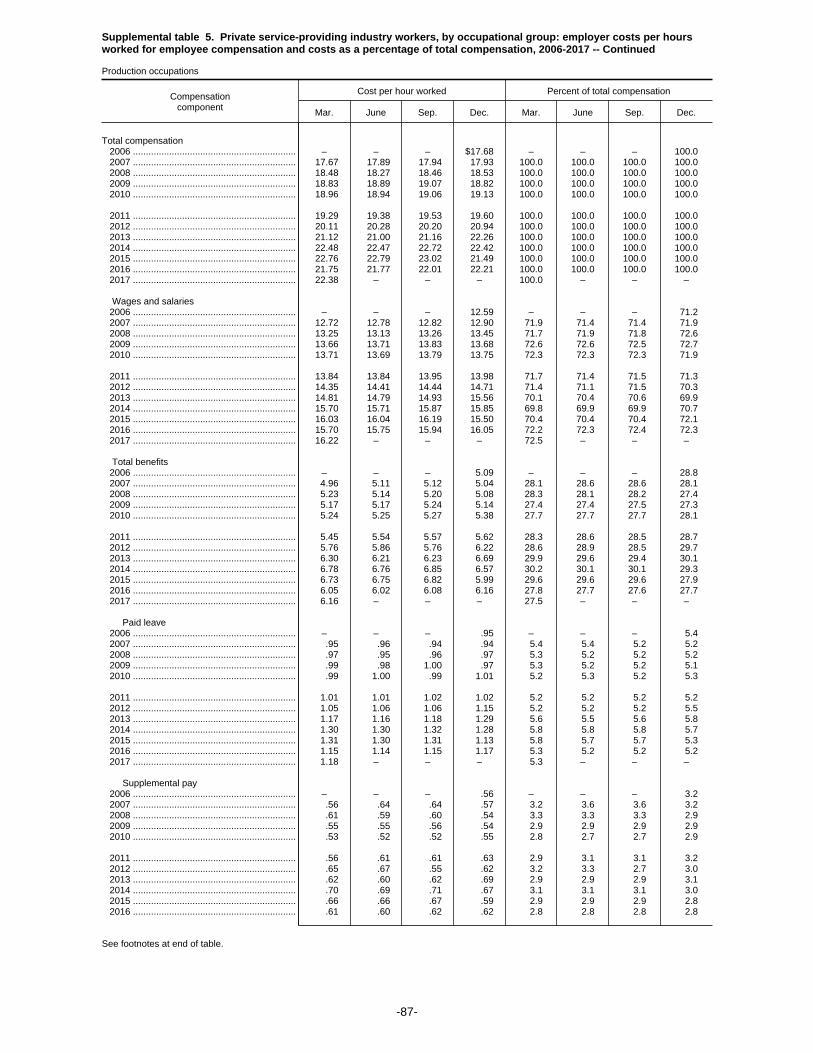
Supplemental table 5. Private service-providing industry workers, by occupational group: employer costs per hoursworked for employee compensation and costs as a percentage of total compensation, 2006-2017 -- Continued
Production occupations
Compensationcomponent
Cost per hour worked Percent of total compensation
Mar. June Sep. Dec. Mar. June Sep. Dec.
Total compensation 2006 ............................................................... – – – $17.68 – – – 100.0 2007 ............................................................... 17.67 17.89 17.94 17.93 100.0 100.0 100.0 100.0 2008 ............................................................... 18.48 18.27 18.46 18.53 100.0 100.0 100.0 100.0 2009 ............................................................... 18.83 18.89 19.07 18.82 100.0 100.0 100.0 100.0 2010 ............................................................... 18.96 18.94 19.06 19.13 100.0 100.0 100.0 100.0
2011 ............................................................... 19.29 19.38 19.53 19.60 100.0 100.0 100.0 100.0 2012 ............................................................... 20.11 20.28 20.20 20.94 100.0 100.0 100.0 100.0 2013 ............................................................... 21.12 21.00 21.16 22.26 100.0 100.0 100.0 100.0 2014 ............................................................... 22.48 22.47 22.72 22.42 100.0 100.0 100.0 100.0 2015 ............................................................... 22.76 22.79 23.02 21.49 100.0 100.0 100.0 100.0 2016 ............................................................... 21.75 21.77 22.01 22.21 100.0 100.0 100.0 100.0 2017 ............................................................... 22.38 – – – 100.0 – – –
Wages and salaries 2006 ............................................................... – – – 12.59 – – – 71.2 2007 ............................................................... 12.72 12.78 12.82 12.90 71.9 71.4 71.4 71.9 2008 ............................................................... 13.25 13.13 13.26 13.45 71.7 71.9 71.8 72.6 2009 ............................................................... 13.66 13.71 13.83 13.68 72.6 72.6 72.5 72.7 2010 ............................................................... 13.71 13.69 13.79 13.75 72.3 72.3 72.3 71.9
2011 ............................................................... 13.84 13.84 13.95 13.98 71.7 71.4 71.5 71.3 2012 ............................................................... 14.35 14.41 14.44 14.71 71.4 71.1 71.5 70.3 2013 ............................................................... 14.81 14.79 14.93 15.56 70.1 70.4 70.6 69.9 2014 ............................................................... 15.70 15.71 15.87 15.85 69.8 69.9 69.9 70.7 2015 ............................................................... 16.03 16.04 16.19 15.50 70.4 70.4 70.4 72.1 2016 ............................................................... 15.70 15.75 15.94 16.05 72.2 72.3 72.4 72.3 2017 ............................................................... 16.22 – – – 72.5 – – –
Total benefits 2006 ............................................................... – – – 5.09 – – – 28.8 2007 ............................................................... 4.96 5.11 5.12 5.04 28.1 28.6 28.6 28.1 2008 ............................................................... 5.23 5.14 5.20 5.08 28.3 28.1 28.2 27.4 2009 ............................................................... 5.17 5.17 5.24 5.14 27.4 27.4 27.5 27.3 2010 ............................................................... 5.24 5.25 5.27 5.38 27.7 27.7 27.7 28.1
2011 ............................................................... 5.45 5.54 5.57 5.62 28.3 28.6 28.5 28.7 2012 ............................................................... 5.76 5.86 5.76 6.22 28.6 28.9 28.5 29.7 2013 ............................................................... 6.30 6.21 6.23 6.69 29.9 29.6 29.4 30.1 2014 ............................................................... 6.78 6.76 6.85 6.57 30.2 30.1 30.1 29.3 2015 ............................................................... 6.73 6.75 6.82 5.99 29.6 29.6 29.6 27.9 2016 ............................................................... 6.05 6.02 6.08 6.16 27.8 27.7 27.6 27.7 2017 ............................................................... 6.16 – – – 27.5 – – –
Paid leave 2006 ............................................................... – – – .95 – – – 5.4 2007 ............................................................... .95 .96 .94 .94 5.4 5.4 5.2 5.2 2008 ............................................................... .97 .95 .96 .97 5.3 5.2 5.2 5.2 2009 ............................................................... .99 .98 1.00 .97 5.3 5.2 5.2 5.1 2010 ............................................................... .99 1.00 .99 1.01 5.2 5.3 5.2 5.3
2011 ............................................................... 1.01 1.01 1.02 1.02 5.2 5.2 5.2 5.2 2012 ............................................................... 1.05 1.06 1.06 1.15 5.2 5.2 5.2 5.5 2013 ............................................................... 1.17 1.16 1.18 1.29 5.6 5.5 5.6 5.8 2014 ............................................................... 1.30 1.30 1.32 1.28 5.8 5.8 5.8 5.7 2015 ............................................................... 1.31 1.30 1.31 1.13 5.8 5.7 5.7 5.3 2016 ............................................................... 1.15 1.14 1.15 1.17 5.3 5.2 5.2 5.2 2017 ............................................................... 1.18 – – – 5.3 – – –
Supplemental pay 2006 ............................................................... – – – .56 – – – 3.2 2007 ............................................................... .56 .64 .64 .57 3.2 3.6 3.6 3.2 2008 ............................................................... .61 .59 .60 .54 3.3 3.3 3.3 2.9 2009 ............................................................... .55 .55 .56 .54 2.9 2.9 2.9 2.9 2010 ............................................................... .53 .52 .52 .55 2.8 2.7 2.7 2.9
2011 ............................................................... .56 .61 .61 .63 2.9 3.1 3.1 3.2 2012 ............................................................... .65 .67 .55 .62 3.2 3.3 2.7 3.0 2013 ............................................................... .62 .60 .62 .69 2.9 2.9 2.9 3.1 2014 ............................................................... .70 .69 .71 .67 3.1 3.1 3.1 3.0 2015 ............................................................... .66 .66 .67 .59 2.9 2.9 2.9 2.8 2016 ............................................................... .61 .60 .62 .62 2.8 2.8 2.8 2.8
See footnotes at end of table.
-87-

Supplemental table 5. Private service-providing industry workers, by occupational group: employer costs per hoursworked for employee compensation and costs as a percentage of total compensation, 2006-2017 -- Continued
Production occupations
Compensationcomponent
Cost per hour worked Percent of total compensation
Mar. June Sep. Dec. Mar. June Sep. Dec.
Supplemental pay 2017 ............................................................... 0.63 – – – 2.8 – – –
Insurance 2006 ............................................................... – – – 1.30 – – – 7.3 2007 ............................................................... 1.29 1.32 1.35 1.34 7.3 7.4 7.5 7.5 2008 ............................................................... 1.40 1.38 1.40 1.34 7.6 7.6 7.6 7.2 2009 ............................................................... 1.37 1.38 1.40 1.40 7.3 7.3 7.4 7.5 2010 ............................................................... 1.46 1.46 1.48 1.51 7.7 7.7 7.7 7.9
2011 ............................................................... 1.53 1.53 1.54 1.52 7.9 7.9 7.9 7.8 2012 ............................................................... 1.56 1.60 1.61 1.75 7.8 7.9 8.0 8.4 2013 ............................................................... 1.78 1.73 1.72 1.83 8.4 8.2 8.1 8.2 2014 ............................................................... 1.87 1.88 1.91 1.80 8.3 8.4 8.4 8.0 2015 ............................................................... 1.87 1.89 1.91 1.60 8.2 8.3 8.3 7.5 2016 ............................................................... 1.63 1.62 1.62 1.66 7.5 7.4 7.4 7.5 2017 ............................................................... 1.64 – – – 7.3 – – –
Retirement and savings 2006 ............................................................... – – – .50 – – – 2.8 2007 ............................................................... .37 .39 .41 .42 2.1 2.2 2.3 2.3 2008 ............................................................... .44 .43 .44 .43 2.4 2.3 2.4 2.3 2009 ............................................................... .46 .45 .46 .42 2.4 2.4 2.4 2.3 2010 ............................................................... .43 .43 .43 .44 2.3 2.3 2.2 2.3
2011 ............................................................... .46 .46 .46 .47 2.4 2.4 2.4 2.4 2012 ............................................................... .49 .51 .52 .62 2.4 2.5 2.6 3.0 2013 ............................................................... .64 .64 .62 .72 3.0 3.0 2.9 3.2 2014 ............................................................... .73 .72 .73 .70 3.3 3.2 3.2 3.1 2015 ............................................................... .73 .74 .76 .58 3.2 3.2 3.3 2.7 2016 ............................................................... .58 .57 .59 .61 2.7 2.6 2.7 2.7 2017 ............................................................... .60 – – – 2.7 – – –
Legally required benefits 2006 ............................................................... – – – 1.79 – – – 10.1 2007 ............................................................... 1.78 1.79 1.78 1.77 10.1 10.0 9.9 9.9 2008 ............................................................... 1.81 1.78 1.79 1.79 9.8 9.7 9.7 9.7 2009 ............................................................... 1.80 1.81 1.82 1.80 9.5 9.6 9.5 9.6 2010 ............................................................... 1.83 1.84 1.86 1.88 9.7 9.7 9.7 9.8
2011 ............................................................... 1.90 1.93 1.95 1.97 9.8 10.0 10.0 10.0 2012 ............................................................... 2.00 2.02 2.02 2.07 10.0 10.0 10.0 9.9 2013 ............................................................... 2.10 2.08 2.09 2.17 9.9 9.9 9.9 9.7 2014 ............................................................... 2.18 2.17 2.18 2.13 9.7 9.7 9.6 9.5 2015 ............................................................... 2.16 2.16 2.17 2.08 9.5 9.5 9.4 9.7 2016 ............................................................... 2.08 2.08 2.09 2.11 9.6 9.6 9.5 9.5 2017 ............................................................... 2.12 – – – 9.5 – – –
Note: The sum of individual items may not equal totals due to rounding. Dashes indicate data are not available.
-88-
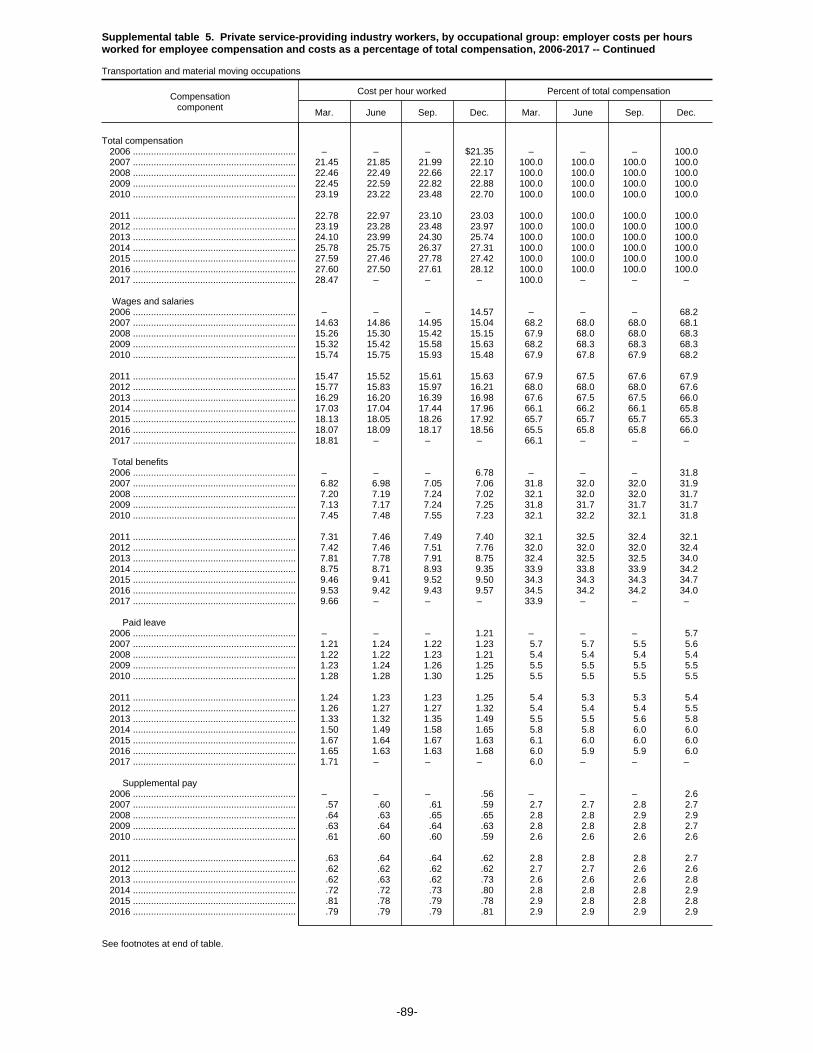
Supplemental table 5. Private service-providing industry workers, by occupational group: employer costs per hoursworked for employee compensation and costs as a percentage of total compensation, 2006-2017 -- Continued
Transportation and material moving occupations
Compensationcomponent
Cost per hour worked Percent of total compensation
Mar. June Sep. Dec. Mar. June Sep. Dec.
Total compensation 2006 ............................................................... – – – $21.35 – – – 100.0 2007 ............................................................... 21.45 21.85 21.99 22.10 100.0 100.0 100.0 100.0 2008 ............................................................... 22.46 22.49 22.66 22.17 100.0 100.0 100.0 100.0 2009 ............................................................... 22.45 22.59 22.82 22.88 100.0 100.0 100.0 100.0 2010 ............................................................... 23.19 23.22 23.48 22.70 100.0 100.0 100.0 100.0
2011 ............................................................... 22.78 22.97 23.10 23.03 100.0 100.0 100.0 100.0 2012 ............................................................... 23.19 23.28 23.48 23.97 100.0 100.0 100.0 100.0 2013 ............................................................... 24.10 23.99 24.30 25.74 100.0 100.0 100.0 100.0 2014 ............................................................... 25.78 25.75 26.37 27.31 100.0 100.0 100.0 100.0 2015 ............................................................... 27.59 27.46 27.78 27.42 100.0 100.0 100.0 100.0 2016 ............................................................... 27.60 27.50 27.61 28.12 100.0 100.0 100.0 100.0 2017 ............................................................... 28.47 – – – 100.0 – – –
Wages and salaries 2006 ............................................................... – – – 14.57 – – – 68.2 2007 ............................................................... 14.63 14.86 14.95 15.04 68.2 68.0 68.0 68.1 2008 ............................................................... 15.26 15.30 15.42 15.15 67.9 68.0 68.0 68.3 2009 ............................................................... 15.32 15.42 15.58 15.63 68.2 68.3 68.3 68.3 2010 ............................................................... 15.74 15.75 15.93 15.48 67.9 67.8 67.9 68.2
2011 ............................................................... 15.47 15.52 15.61 15.63 67.9 67.5 67.6 67.9 2012 ............................................................... 15.77 15.83 15.97 16.21 68.0 68.0 68.0 67.6 2013 ............................................................... 16.29 16.20 16.39 16.98 67.6 67.5 67.5 66.0 2014 ............................................................... 17.03 17.04 17.44 17.96 66.1 66.2 66.1 65.8 2015 ............................................................... 18.13 18.05 18.26 17.92 65.7 65.7 65.7 65.3 2016 ............................................................... 18.07 18.09 18.17 18.56 65.5 65.8 65.8 66.0 2017 ............................................................... 18.81 – – – 66.1 – – –
Total benefits 2006 ............................................................... – – – 6.78 – – – 31.8 2007 ............................................................... 6.82 6.98 7.05 7.06 31.8 32.0 32.0 31.9 2008 ............................................................... 7.20 7.19 7.24 7.02 32.1 32.0 32.0 31.7 2009 ............................................................... 7.13 7.17 7.24 7.25 31.8 31.7 31.7 31.7 2010 ............................................................... 7.45 7.48 7.55 7.23 32.1 32.2 32.1 31.8
2011 ............................................................... 7.31 7.46 7.49 7.40 32.1 32.5 32.4 32.1 2012 ............................................................... 7.42 7.46 7.51 7.76 32.0 32.0 32.0 32.4 2013 ............................................................... 7.81 7.78 7.91 8.75 32.4 32.5 32.5 34.0 2014 ............................................................... 8.75 8.71 8.93 9.35 33.9 33.8 33.9 34.2 2015 ............................................................... 9.46 9.41 9.52 9.50 34.3 34.3 34.3 34.7 2016 ............................................................... 9.53 9.42 9.43 9.57 34.5 34.2 34.2 34.0 2017 ............................................................... 9.66 – – – 33.9 – – –
Paid leave 2006 ............................................................... – – – 1.21 – – – 5.7 2007 ............................................................... 1.21 1.24 1.22 1.23 5.7 5.7 5.5 5.6 2008 ............................................................... 1.22 1.22 1.23 1.21 5.4 5.4 5.4 5.4 2009 ............................................................... 1.23 1.24 1.26 1.25 5.5 5.5 5.5 5.5 2010 ............................................................... 1.28 1.28 1.30 1.25 5.5 5.5 5.5 5.5
2011 ............................................................... 1.24 1.23 1.23 1.25 5.4 5.3 5.3 5.4 2012 ............................................................... 1.26 1.27 1.27 1.32 5.4 5.4 5.4 5.5 2013 ............................................................... 1.33 1.32 1.35 1.49 5.5 5.5 5.6 5.8 2014 ............................................................... 1.50 1.49 1.58 1.65 5.8 5.8 6.0 6.0 2015 ............................................................... 1.67 1.64 1.67 1.63 6.1 6.0 6.0 6.0 2016 ............................................................... 1.65 1.63 1.63 1.68 6.0 5.9 5.9 6.0 2017 ............................................................... 1.71 – – – 6.0 – – –
Supplemental pay 2006 ............................................................... – – – .56 – – – 2.6 2007 ............................................................... .57 .60 .61 .59 2.7 2.7 2.8 2.7 2008 ............................................................... .64 .63 .65 .65 2.8 2.8 2.9 2.9 2009 ............................................................... .63 .64 .64 .63 2.8 2.8 2.8 2.7 2010 ............................................................... .61 .60 .60 .59 2.6 2.6 2.6 2.6
2011 ............................................................... .63 .64 .64 .62 2.8 2.8 2.8 2.7 2012 ............................................................... .62 .62 .62 .62 2.7 2.7 2.6 2.6 2013 ............................................................... .62 .63 .62 .73 2.6 2.6 2.6 2.8 2014 ............................................................... .72 .72 .73 .80 2.8 2.8 2.8 2.9 2015 ............................................................... .81 .78 .79 .78 2.9 2.8 2.8 2.8 2016 ............................................................... .79 .79 .79 .81 2.9 2.9 2.9 2.9
See footnotes at end of table.
-89-
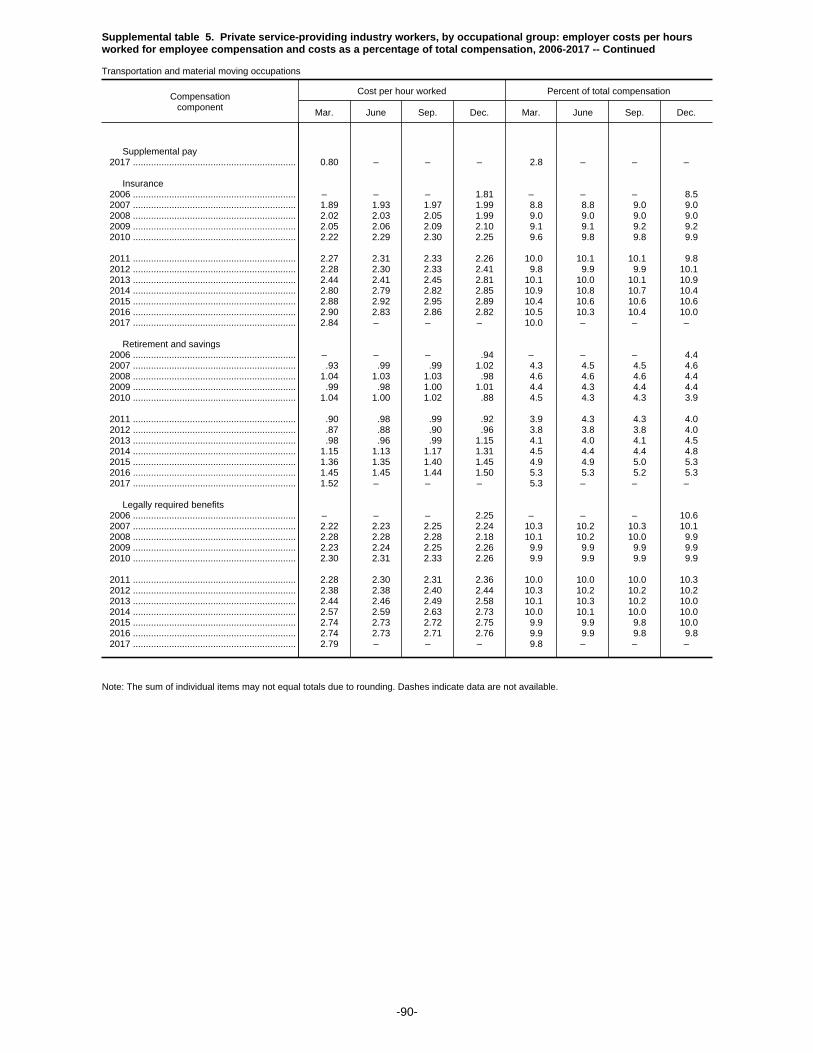
Supplemental table 5. Private service-providing industry workers, by occupational group: employer costs per hoursworked for employee compensation and costs as a percentage of total compensation, 2006-2017 -- Continued
Transportation and material moving occupations
Compensationcomponent
Cost per hour worked Percent of total compensation
Mar. June Sep. Dec. Mar. June Sep. Dec.
Supplemental pay 2017 ............................................................... 0.80 – – – 2.8 – – –
Insurance 2006 ............................................................... – – – 1.81 – – – 8.5 2007 ............................................................... 1.89 1.93 1.97 1.99 8.8 8.8 9.0 9.0 2008 ............................................................... 2.02 2.03 2.05 1.99 9.0 9.0 9.0 9.0 2009 ............................................................... 2.05 2.06 2.09 2.10 9.1 9.1 9.2 9.2 2010 ............................................................... 2.22 2.29 2.30 2.25 9.6 9.8 9.8 9.9
2011 ............................................................... 2.27 2.31 2.33 2.26 10.0 10.1 10.1 9.8 2012 ............................................................... 2.28 2.30 2.33 2.41 9.8 9.9 9.9 10.1 2013 ............................................................... 2.44 2.41 2.45 2.81 10.1 10.0 10.1 10.9 2014 ............................................................... 2.80 2.79 2.82 2.85 10.9 10.8 10.7 10.4 2015 ............................................................... 2.88 2.92 2.95 2.89 10.4 10.6 10.6 10.6 2016 ............................................................... 2.90 2.83 2.86 2.82 10.5 10.3 10.4 10.0 2017 ............................................................... 2.84 – – – 10.0 – – –
Retirement and savings 2006 ............................................................... – – – .94 – – – 4.4 2007 ............................................................... .93 .99 .99 1.02 4.3 4.5 4.5 4.6 2008 ............................................................... 1.04 1.03 1.03 .98 4.6 4.6 4.6 4.4 2009 ............................................................... .99 .98 1.00 1.01 4.4 4.3 4.4 4.4 2010 ............................................................... 1.04 1.00 1.02 .88 4.5 4.3 4.3 3.9
2011 ............................................................... .90 .98 .99 .92 3.9 4.3 4.3 4.0 2012 ............................................................... .87 .88 .90 .96 3.8 3.8 3.8 4.0 2013 ............................................................... .98 .96 .99 1.15 4.1 4.0 4.1 4.5 2014 ............................................................... 1.15 1.13 1.17 1.31 4.5 4.4 4.4 4.8 2015 ............................................................... 1.36 1.35 1.40 1.45 4.9 4.9 5.0 5.3 2016 ............................................................... 1.45 1.45 1.44 1.50 5.3 5.3 5.2 5.3 2017 ............................................................... 1.52 – – – 5.3 – – –
Legally required benefits 2006 ............................................................... – – – 2.25 – – – 10.6 2007 ............................................................... 2.22 2.23 2.25 2.24 10.3 10.2 10.3 10.1 2008 ............................................................... 2.28 2.28 2.28 2.18 10.1 10.2 10.0 9.9 2009 ............................................................... 2.23 2.24 2.25 2.26 9.9 9.9 9.9 9.9 2010 ............................................................... 2.30 2.31 2.33 2.26 9.9 9.9 9.9 9.9
2011 ............................................................... 2.28 2.30 2.31 2.36 10.0 10.0 10.0 10.3 2012 ............................................................... 2.38 2.38 2.40 2.44 10.3 10.2 10.2 10.2 2013 ............................................................... 2.44 2.46 2.49 2.58 10.1 10.3 10.2 10.0 2014 ............................................................... 2.57 2.59 2.63 2.73 10.0 10.1 10.0 10.0 2015 ............................................................... 2.74 2.73 2.72 2.75 9.9 9.9 9.8 10.0 2016 ............................................................... 2.74 2.73 2.71 2.76 9.9 9.9 9.8 9.8 2017 ............................................................... 2.79 – – – 9.8 – – –
Note: The sum of individual items may not equal totals due to rounding. Dashes indicate data are not available.
-90-
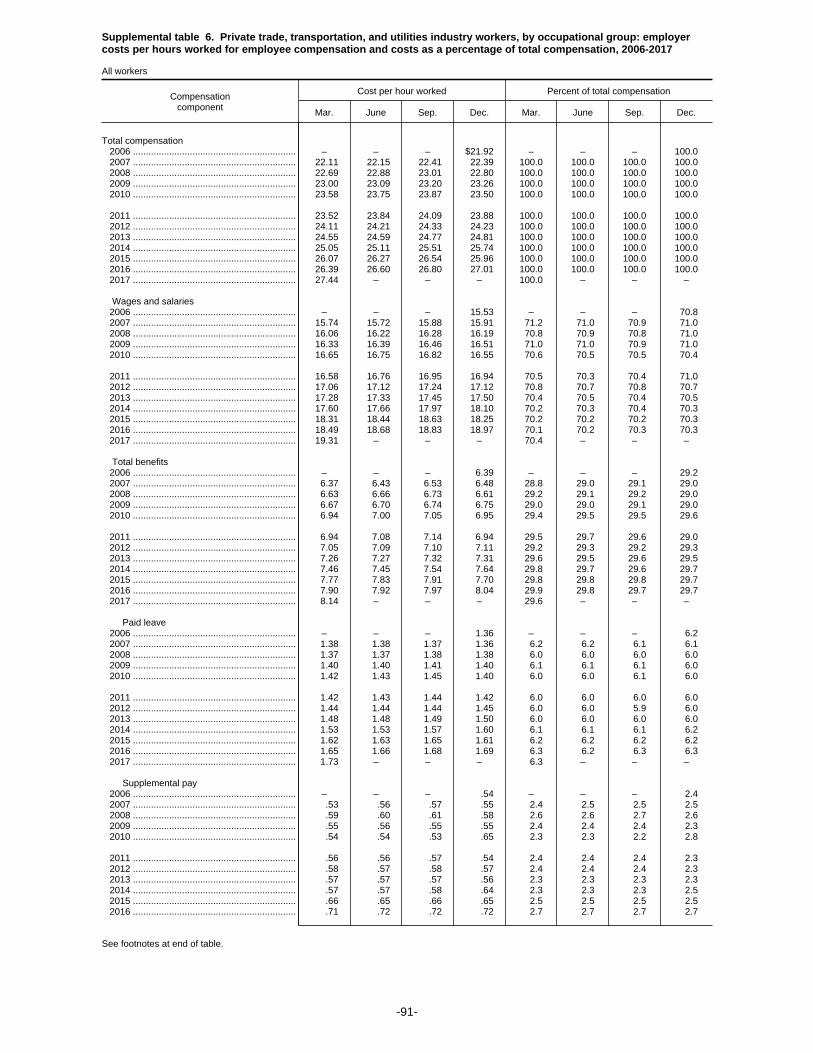
Supplemental table 6. Private trade, transportation, and utilities industry workers, by occupational group: employercosts per hours worked for employee compensation and costs as a percentage of total compensation, 2006-2017
All workers
Compensationcomponent
Cost per hour worked Percent of total compensation
Mar. June Sep. Dec. Mar. June Sep. Dec.
Total compensation 2006 ............................................................... – – – $21.92 – – – 100.0 2007 ............................................................... 22.11 22.15 22.41 22.39 100.0 100.0 100.0 100.0 2008 ............................................................... 22.69 22.88 23.01 22.80 100.0 100.0 100.0 100.0 2009 ............................................................... 23.00 23.09 23.20 23.26 100.0 100.0 100.0 100.0 2010 ............................................................... 23.58 23.75 23.87 23.50 100.0 100.0 100.0 100.0
2011 ............................................................... 23.52 23.84 24.09 23.88 100.0 100.0 100.0 100.0 2012 ............................................................... 24.11 24.21 24.33 24.23 100.0 100.0 100.0 100.0 2013 ............................................................... 24.55 24.59 24.77 24.81 100.0 100.0 100.0 100.0 2014 ............................................................... 25.05 25.11 25.51 25.74 100.0 100.0 100.0 100.0 2015 ............................................................... 26.07 26.27 26.54 25.96 100.0 100.0 100.0 100.0 2016 ............................................................... 26.39 26.60 26.80 27.01 100.0 100.0 100.0 100.0 2017 ............................................................... 27.44 – – – 100.0 – – –
Wages and salaries 2006 ............................................................... – – – 15.53 – – – 70.8 2007 ............................................................... 15.74 15.72 15.88 15.91 71.2 71.0 70.9 71.0 2008 ............................................................... 16.06 16.22 16.28 16.19 70.8 70.9 70.8 71.0 2009 ............................................................... 16.33 16.39 16.46 16.51 71.0 71.0 70.9 71.0 2010 ............................................................... 16.65 16.75 16.82 16.55 70.6 70.5 70.5 70.4
2011 ............................................................... 16.58 16.76 16.95 16.94 70.5 70.3 70.4 71.0 2012 ............................................................... 17.06 17.12 17.24 17.12 70.8 70.7 70.8 70.7 2013 ............................................................... 17.28 17.33 17.45 17.50 70.4 70.5 70.4 70.5 2014 ............................................................... 17.60 17.66 17.97 18.10 70.2 70.3 70.4 70.3 2015 ............................................................... 18.31 18.44 18.63 18.25 70.2 70.2 70.2 70.3 2016 ............................................................... 18.49 18.68 18.83 18.97 70.1 70.2 70.3 70.3 2017 ............................................................... 19.31 – – – 70.4 – – –
Total benefits 2006 ............................................................... – – – 6.39 – – – 29.2 2007 ............................................................... 6.37 6.43 6.53 6.48 28.8 29.0 29.1 29.0 2008 ............................................................... 6.63 6.66 6.73 6.61 29.2 29.1 29.2 29.0 2009 ............................................................... 6.67 6.70 6.74 6.75 29.0 29.0 29.1 29.0 2010 ............................................................... 6.94 7.00 7.05 6.95 29.4 29.5 29.5 29.6
2011 ............................................................... 6.94 7.08 7.14 6.94 29.5 29.7 29.6 29.0 2012 ............................................................... 7.05 7.09 7.10 7.11 29.2 29.3 29.2 29.3 2013 ............................................................... 7.26 7.27 7.32 7.31 29.6 29.5 29.6 29.5 2014 ............................................................... 7.46 7.45 7.54 7.64 29.8 29.7 29.6 29.7 2015 ............................................................... 7.77 7.83 7.91 7.70 29.8 29.8 29.8 29.7 2016 ............................................................... 7.90 7.92 7.97 8.04 29.9 29.8 29.7 29.7 2017 ............................................................... 8.14 – – – 29.6 – – –
Paid leave 2006 ............................................................... – – – 1.36 – – – 6.2 2007 ............................................................... 1.38 1.38 1.37 1.36 6.2 6.2 6.1 6.1 2008 ............................................................... 1.37 1.37 1.38 1.38 6.0 6.0 6.0 6.0 2009 ............................................................... 1.40 1.40 1.41 1.40 6.1 6.1 6.1 6.0 2010 ............................................................... 1.42 1.43 1.45 1.40 6.0 6.0 6.1 6.0
2011 ............................................................... 1.42 1.43 1.44 1.42 6.0 6.0 6.0 6.0 2012 ............................................................... 1.44 1.44 1.44 1.45 6.0 6.0 5.9 6.0 2013 ............................................................... 1.48 1.48 1.49 1.50 6.0 6.0 6.0 6.0 2014 ............................................................... 1.53 1.53 1.57 1.60 6.1 6.1 6.1 6.2 2015 ............................................................... 1.62 1.63 1.65 1.61 6.2 6.2 6.2 6.2 2016 ............................................................... 1.65 1.66 1.68 1.69 6.3 6.2 6.3 6.3 2017 ............................................................... 1.73 – – – 6.3 – – –
Supplemental pay 2006 ............................................................... – – – .54 – – – 2.4 2007 ............................................................... .53 .56 .57 .55 2.4 2.5 2.5 2.5 2008 ............................................................... .59 .60 .61 .58 2.6 2.6 2.7 2.6 2009 ............................................................... .55 .56 .55 .55 2.4 2.4 2.4 2.3 2010 ............................................................... .54 .54 .53 .65 2.3 2.3 2.2 2.8
2011 ............................................................... .56 .56 .57 .54 2.4 2.4 2.4 2.3 2012 ............................................................... .58 .57 .58 .57 2.4 2.4 2.4 2.3 2013 ............................................................... .57 .57 .57 .56 2.3 2.3 2.3 2.3 2014 ............................................................... .57 .57 .58 .64 2.3 2.3 2.3 2.5 2015 ............................................................... .66 .65 .66 .65 2.5 2.5 2.5 2.5 2016 ............................................................... .71 .72 .72 .72 2.7 2.7 2.7 2.7
See footnotes at end of table.
-91-
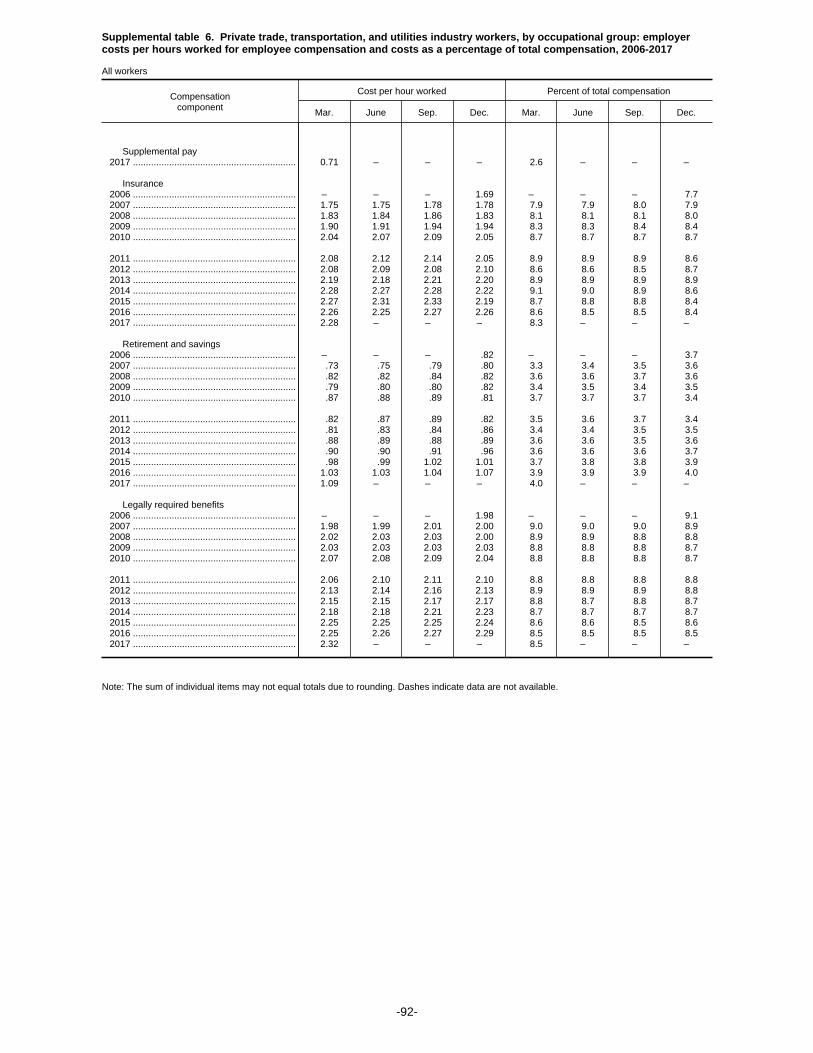
Supplemental table 6. Private trade, transportation, and utilities industry workers, by occupational group: employercosts per hours worked for employee compensation and costs as a percentage of total compensation, 2006-2017
All workers
Compensationcomponent
Cost per hour worked Percent of total compensation
Mar. June Sep. Dec. Mar. June Sep. Dec.
Supplemental pay 2017 ............................................................... 0.71 – – – 2.6 – – –
Insurance 2006 ............................................................... – – – 1.69 – – – 7.7 2007 ............................................................... 1.75 1.75 1.78 1.78 7.9 7.9 8.0 7.9 2008 ............................................................... 1.83 1.84 1.86 1.83 8.1 8.1 8.1 8.0 2009 ............................................................... 1.90 1.91 1.94 1.94 8.3 8.3 8.4 8.4 2010 ............................................................... 2.04 2.07 2.09 2.05 8.7 8.7 8.7 8.7
2011 ............................................................... 2.08 2.12 2.14 2.05 8.9 8.9 8.9 8.6 2012 ............................................................... 2.08 2.09 2.08 2.10 8.6 8.6 8.5 8.7 2013 ............................................................... 2.19 2.18 2.21 2.20 8.9 8.9 8.9 8.9 2014 ............................................................... 2.28 2.27 2.28 2.22 9.1 9.0 8.9 8.6 2015 ............................................................... 2.27 2.31 2.33 2.19 8.7 8.8 8.8 8.4 2016 ............................................................... 2.26 2.25 2.27 2.26 8.6 8.5 8.5 8.4 2017 ............................................................... 2.28 – – – 8.3 – – –
Retirement and savings 2006 ............................................................... – – – .82 – – – 3.7 2007 ............................................................... .73 .75 .79 .80 3.3 3.4 3.5 3.6 2008 ............................................................... .82 .82 .84 .82 3.6 3.6 3.7 3.6 2009 ............................................................... .79 .80 .80 .82 3.4 3.5 3.4 3.5 2010 ............................................................... .87 .88 .89 .81 3.7 3.7 3.7 3.4
2011 ............................................................... .82 .87 .89 .82 3.5 3.6 3.7 3.4 2012 ............................................................... .81 .83 .84 .86 3.4 3.4 3.5 3.5 2013 ............................................................... .88 .89 .88 .89 3.6 3.6 3.5 3.6 2014 ............................................................... .90 .90 .91 .96 3.6 3.6 3.6 3.7 2015 ............................................................... .98 .99 1.02 1.01 3.7 3.8 3.8 3.9 2016 ............................................................... 1.03 1.03 1.04 1.07 3.9 3.9 3.9 4.0 2017 ............................................................... 1.09 – – – 4.0 – – –
Legally required benefits 2006 ............................................................... – – – 1.98 – – – 9.1 2007 ............................................................... 1.98 1.99 2.01 2.00 9.0 9.0 9.0 8.9 2008 ............................................................... 2.02 2.03 2.03 2.00 8.9 8.9 8.8 8.8 2009 ............................................................... 2.03 2.03 2.03 2.03 8.8 8.8 8.8 8.7 2010 ............................................................... 2.07 2.08 2.09 2.04 8.8 8.8 8.8 8.7
2011 ............................................................... 2.06 2.10 2.11 2.10 8.8 8.8 8.8 8.8 2012 ............................................................... 2.13 2.14 2.16 2.13 8.9 8.9 8.9 8.8 2013 ............................................................... 2.15 2.15 2.17 2.17 8.8 8.7 8.8 8.7 2014 ............................................................... 2.18 2.18 2.21 2.23 8.7 8.7 8.7 8.7 2015 ............................................................... 2.25 2.25 2.25 2.24 8.6 8.6 8.5 8.6 2016 ............................................................... 2.25 2.26 2.27 2.29 8.5 8.5 8.5 8.5 2017 ............................................................... 2.32 – – – 8.5 – – –
Note: The sum of individual items may not equal totals due to rounding. Dashes indicate data are not available.
-92-
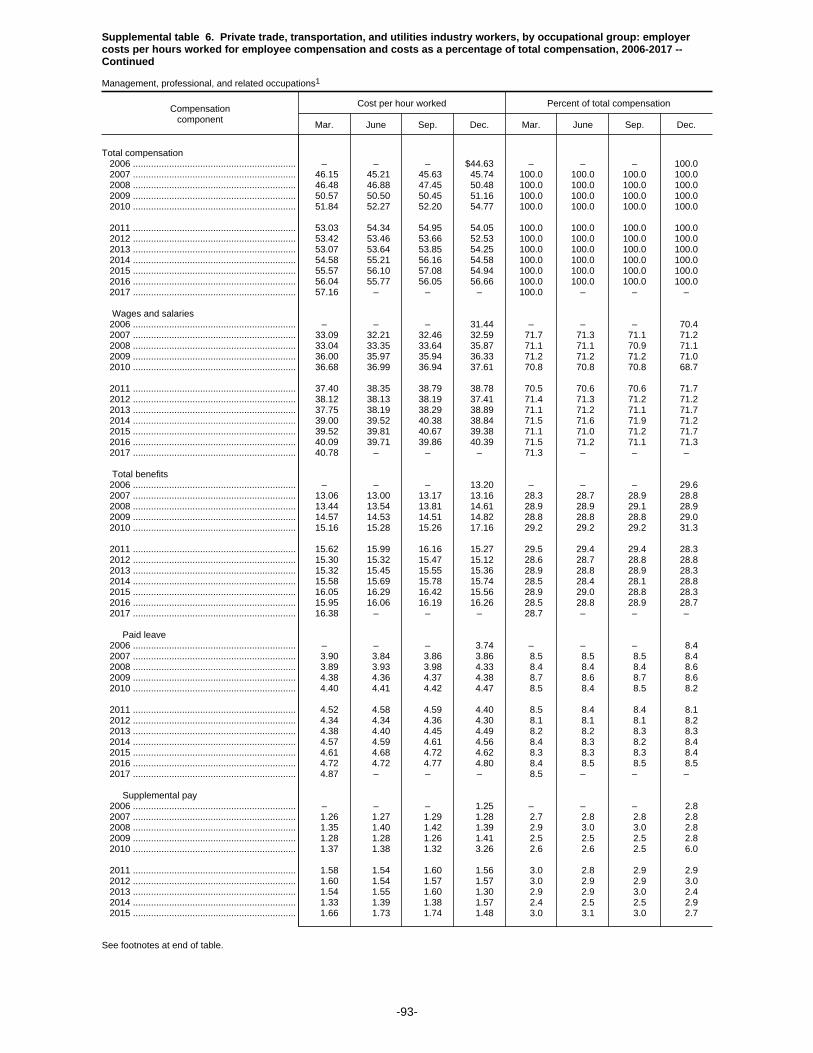
Supplemental table 6. Private trade, transportation, and utilities industry workers, by occupational group: employercosts per hours worked for employee compensation and costs as a percentage of total compensation, 2006-2017 --Continued
Management, professional, and related occupations1
Compensationcomponent
Cost per hour worked Percent of total compensation
Mar. June Sep. Dec. Mar. June Sep. Dec.
Total compensation 2006 ............................................................... – – – $44.63 – – – 100.0 2007 ............................................................... 46.15 45.21 45.63 45.74 100.0 100.0 100.0 100.0 2008 ............................................................... 46.48 46.88 47.45 50.48 100.0 100.0 100.0 100.0 2009 ............................................................... 50.57 50.50 50.45 51.16 100.0 100.0 100.0 100.0 2010 ............................................................... 51.84 52.27 52.20 54.77 100.0 100.0 100.0 100.0
2011 ............................................................... 53.03 54.34 54.95 54.05 100.0 100.0 100.0 100.0 2012 ............................................................... 53.42 53.46 53.66 52.53 100.0 100.0 100.0 100.0 2013 ............................................................... 53.07 53.64 53.85 54.25 100.0 100.0 100.0 100.0 2014 ............................................................... 54.58 55.21 56.16 54.58 100.0 100.0 100.0 100.0 2015 ............................................................... 55.57 56.10 57.08 54.94 100.0 100.0 100.0 100.0 2016 ............................................................... 56.04 55.77 56.05 56.66 100.0 100.0 100.0 100.0 2017 ............................................................... 57.16 – – – 100.0 – – –
Wages and salaries 2006 ............................................................... – – – 31.44 – – – 70.4 2007 ............................................................... 33.09 32.21 32.46 32.59 71.7 71.3 71.1 71.2 2008 ............................................................... 33.04 33.35 33.64 35.87 71.1 71.1 70.9 71.1 2009 ............................................................... 36.00 35.97 35.94 36.33 71.2 71.2 71.2 71.0 2010 ............................................................... 36.68 36.99 36.94 37.61 70.8 70.8 70.8 68.7
2011 ............................................................... 37.40 38.35 38.79 38.78 70.5 70.6 70.6 71.7 2012 ............................................................... 38.12 38.13 38.19 37.41 71.4 71.3 71.2 71.2 2013 ............................................................... 37.75 38.19 38.29 38.89 71.1 71.2 71.1 71.7 2014 ............................................................... 39.00 39.52 40.38 38.84 71.5 71.6 71.9 71.2 2015 ............................................................... 39.52 39.81 40.67 39.38 71.1 71.0 71.2 71.7 2016 ............................................................... 40.09 39.71 39.86 40.39 71.5 71.2 71.1 71.3 2017 ............................................................... 40.78 – – – 71.3 – – –
Total benefits 2006 ............................................................... – – – 13.20 – – – 29.6 2007 ............................................................... 13.06 13.00 13.17 13.16 28.3 28.7 28.9 28.8 2008 ............................................................... 13.44 13.54 13.81 14.61 28.9 28.9 29.1 28.9 2009 ............................................................... 14.57 14.53 14.51 14.82 28.8 28.8 28.8 29.0 2010 ............................................................... 15.16 15.28 15.26 17.16 29.2 29.2 29.2 31.3
2011 ............................................................... 15.62 15.99 16.16 15.27 29.5 29.4 29.4 28.3 2012 ............................................................... 15.30 15.32 15.47 15.12 28.6 28.7 28.8 28.8 2013 ............................................................... 15.32 15.45 15.55 15.36 28.9 28.8 28.9 28.3 2014 ............................................................... 15.58 15.69 15.78 15.74 28.5 28.4 28.1 28.8 2015 ............................................................... 16.05 16.29 16.42 15.56 28.9 29.0 28.8 28.3 2016 ............................................................... 15.95 16.06 16.19 16.26 28.5 28.8 28.9 28.7 2017 ............................................................... 16.38 – – – 28.7 – – –
Paid leave 2006 ............................................................... – – – 3.74 – – – 8.4 2007 ............................................................... 3.90 3.84 3.86 3.86 8.5 8.5 8.5 8.4 2008 ............................................................... 3.89 3.93 3.98 4.33 8.4 8.4 8.4 8.6 2009 ............................................................... 4.38 4.36 4.37 4.38 8.7 8.6 8.7 8.6 2010 ............................................................... 4.40 4.41 4.42 4.47 8.5 8.4 8.5 8.2
2011 ............................................................... 4.52 4.58 4.59 4.40 8.5 8.4 8.4 8.1 2012 ............................................................... 4.34 4.34 4.36 4.30 8.1 8.1 8.1 8.2 2013 ............................................................... 4.38 4.40 4.45 4.49 8.2 8.2 8.3 8.3 2014 ............................................................... 4.57 4.59 4.61 4.56 8.4 8.3 8.2 8.4 2015 ............................................................... 4.61 4.68 4.72 4.62 8.3 8.3 8.3 8.4 2016 ............................................................... 4.72 4.72 4.77 4.80 8.4 8.5 8.5 8.5 2017 ............................................................... 4.87 – – – 8.5 – – –
Supplemental pay 2006 ............................................................... – – – 1.25 – – – 2.8 2007 ............................................................... 1.26 1.27 1.29 1.28 2.7 2.8 2.8 2.8 2008 ............................................................... 1.35 1.40 1.42 1.39 2.9 3.0 3.0 2.8 2009 ............................................................... 1.28 1.28 1.26 1.41 2.5 2.5 2.5 2.8 2010 ............................................................... 1.37 1.38 1.32 3.26 2.6 2.6 2.5 6.0
2011 ............................................................... 1.58 1.54 1.60 1.56 3.0 2.8 2.9 2.9 2012 ............................................................... 1.60 1.54 1.57 1.57 3.0 2.9 2.9 3.0 2013 ............................................................... 1.54 1.55 1.60 1.30 2.9 2.9 3.0 2.4 2014 ............................................................... 1.33 1.39 1.38 1.57 2.4 2.5 2.5 2.9 2015 ............................................................... 1.66 1.73 1.74 1.48 3.0 3.1 3.0 2.7
See footnotes at end of table.
-93-
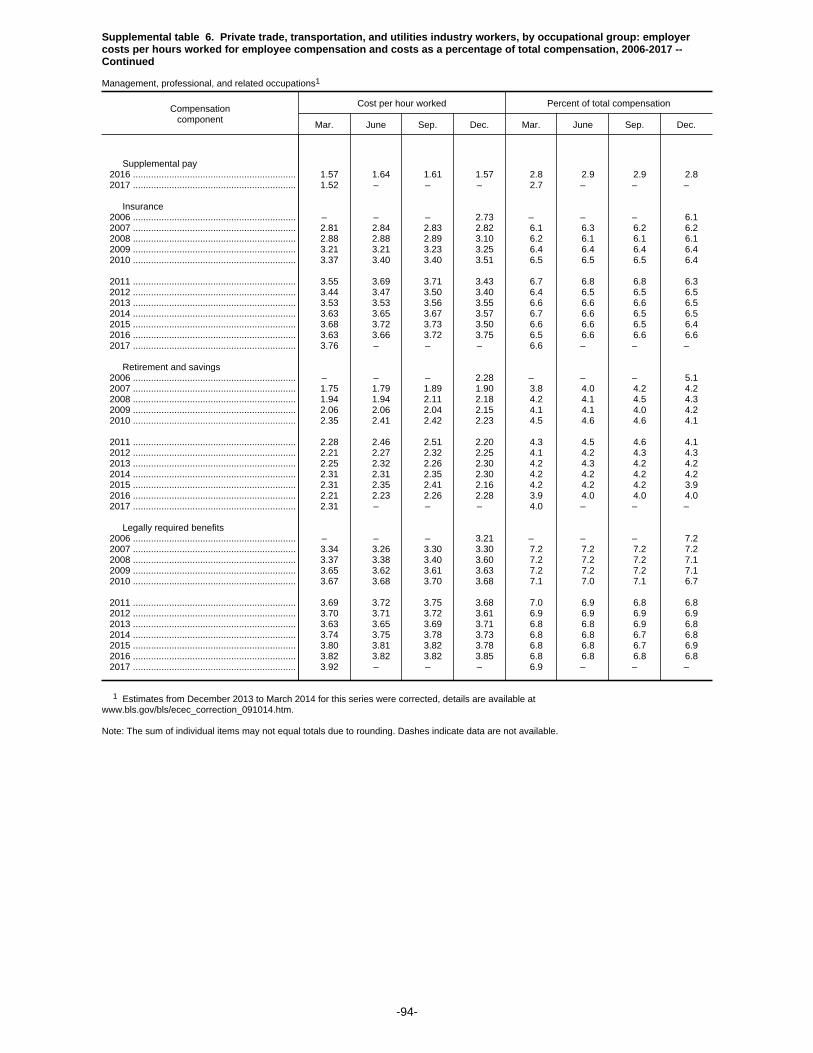
Supplemental table 6. Private trade, transportation, and utilities industry workers, by occupational group: employercosts per hours worked for employee compensation and costs as a percentage of total compensation, 2006-2017 --Continued
Management, professional, and related occupations1
Compensationcomponent
Cost per hour worked Percent of total compensation
Mar. June Sep. Dec. Mar. June Sep. Dec.
Supplemental pay 2016 ............................................................... 1.57 1.64 1.61 1.57 2.8 2.9 2.9 2.8 2017 ............................................................... 1.52 – – – 2.7 – – –
Insurance 2006 ............................................................... – – – 2.73 – – – 6.1 2007 ............................................................... 2.81 2.84 2.83 2.82 6.1 6.3 6.2 6.2 2008 ............................................................... 2.88 2.88 2.89 3.10 6.2 6.1 6.1 6.1 2009 ............................................................... 3.21 3.21 3.23 3.25 6.4 6.4 6.4 6.4 2010 ............................................................... 3.37 3.40 3.40 3.51 6.5 6.5 6.5 6.4
2011 ............................................................... 3.55 3.69 3.71 3.43 6.7 6.8 6.8 6.3 2012 ............................................................... 3.44 3.47 3.50 3.40 6.4 6.5 6.5 6.5 2013 ............................................................... 3.53 3.53 3.56 3.55 6.6 6.6 6.6 6.5 2014 ............................................................... 3.63 3.65 3.67 3.57 6.7 6.6 6.5 6.5 2015 ............................................................... 3.68 3.72 3.73 3.50 6.6 6.6 6.5 6.4 2016 ............................................................... 3.63 3.66 3.72 3.75 6.5 6.6 6.6 6.6 2017 ............................................................... 3.76 – – – 6.6 – – –
Retirement and savings 2006 ............................................................... – – – 2.28 – – – 5.1 2007 ............................................................... 1.75 1.79 1.89 1.90 3.8 4.0 4.2 4.2 2008 ............................................................... 1.94 1.94 2.11 2.18 4.2 4.1 4.5 4.3 2009 ............................................................... 2.06 2.06 2.04 2.15 4.1 4.1 4.0 4.2 2010 ............................................................... 2.35 2.41 2.42 2.23 4.5 4.6 4.6 4.1
2011 ............................................................... 2.28 2.46 2.51 2.20 4.3 4.5 4.6 4.1 2012 ............................................................... 2.21 2.27 2.32 2.25 4.1 4.2 4.3 4.3 2013 ............................................................... 2.25 2.32 2.26 2.30 4.2 4.3 4.2 4.2 2014 ............................................................... 2.31 2.31 2.35 2.30 4.2 4.2 4.2 4.2 2015 ............................................................... 2.31 2.35 2.41 2.16 4.2 4.2 4.2 3.9 2016 ............................................................... 2.21 2.23 2.26 2.28 3.9 4.0 4.0 4.0 2017 ............................................................... 2.31 – – – 4.0 – – –
Legally required benefits 2006 ............................................................... – – – 3.21 – – – 7.2 2007 ............................................................... 3.34 3.26 3.30 3.30 7.2 7.2 7.2 7.2 2008 ............................................................... 3.37 3.38 3.40 3.60 7.2 7.2 7.2 7.1 2009 ............................................................... 3.65 3.62 3.61 3.63 7.2 7.2 7.2 7.1 2010 ............................................................... 3.67 3.68 3.70 3.68 7.1 7.0 7.1 6.7
2011 ............................................................... 3.69 3.72 3.75 3.68 7.0 6.9 6.8 6.8 2012 ............................................................... 3.70 3.71 3.72 3.61 6.9 6.9 6.9 6.9 2013 ............................................................... 3.63 3.65 3.69 3.71 6.8 6.8 6.9 6.8 2014 ............................................................... 3.74 3.75 3.78 3.73 6.8 6.8 6.7 6.8 2015 ............................................................... 3.80 3.81 3.82 3.78 6.8 6.8 6.7 6.9 2016 ............................................................... 3.82 3.82 3.82 3.85 6.8 6.8 6.8 6.8 2017 ............................................................... 3.92 – – – 6.9 – – –
1 Estimates from December 2013 to March 2014 for this series were corrected, details are available atwww.bls.gov/bls/ecec_correction_091014.htm.
Note: The sum of individual items may not equal totals due to rounding. Dashes indicate data are not available.
-94-

Supplemental table 6. Private trade, transportation, and utilities industry workers, by occupational group: employercosts per hours worked for employee compensation and costs as a percentage of total compensation, 2006-2017 --Continued
Management, business, and financial occcupations
Compensationcomponent
Cost per hour worked Percent of total compensation
Mar. June Sep. Dec. Mar. June Sep. Dec.
Total compensation 2006 ............................................................... – – – $50.07 – – – 100.0 2007 ............................................................... 53.20 50.99 51.49 51.76 100.0 100.0 100.0 100.0 2008 ............................................................... 52.47 53.16 53.76 54.70 100.0 100.0 100.0 100.0 2009 ............................................................... 54.33 54.17 53.82 54.80 100.0 100.0 100.0 100.0 2010 ............................................................... 55.73 56.17 55.49 61.67 100.0 100.0 100.0 100.0
2011 ............................................................... 57.74 60.05 60.92 59.78 100.0 100.0 100.0 100.0 2012 ............................................................... 58.07 58.16 58.18 58.68 100.0 100.0 100.0 100.0 2013 ............................................................... 59.42 60.57 61.14 61.22 100.0 100.0 100.0 100.0 2014 ............................................................... 61.56 62.55 64.22 61.65 100.0 100.0 100.0 100.0 2015 ............................................................... 63.05 64.08 65.71 61.35 100.0 100.0 100.0 100.0 2016 ............................................................... 63.07 62.25 62.72 63.26 100.0 100.0 100.0 100.0 2017 ............................................................... 63.82 – – – 100.0 – – –
Wages and salaries 2006 ............................................................... – – – 34.91 – – – 69.7 2007 ............................................................... 37.98 36.01 36.21 36.45 71.4 70.6 70.3 70.4 2008 ............................................................... 36.86 37.38 37.60 38.54 70.2 70.3 69.9 70.5 2009 ............................................................... 38.38 38.31 38.06 38.55 70.6 70.7 70.7 70.3 2010 ............................................................... 39.10 39.49 39.00 41.18 70.2 70.3 70.3 66.8
2011 ............................................................... 40.35 42.09 42.70 42.52 69.9 70.1 70.1 71.1 2012 ............................................................... 40.99 41.09 41.01 41.20 70.6 70.7 70.5 70.2 2013 ............................................................... 41.73 42.58 42.84 43.50 70.2 70.3 70.1 71.0 2014 ............................................................... 43.58 44.39 45.89 43.40 70.8 71.0 71.5 70.4 2015 ............................................................... 44.39 44.97 46.42 43.89 70.4 70.2 70.6 71.5 2016 ............................................................... 45.04 44.15 44.40 44.90 71.4 70.9 70.8 71.0 2017 ............................................................... 45.32 – – – 71.0 – – –
Total benefits 2006 ............................................................... – – – 15.17 – – – 30.3 2007 ............................................................... 15.22 14.98 15.29 15.31 28.6 29.4 29.7 29.6 2008 ............................................................... 15.62 15.79 16.16 16.16 29.8 29.7 30.1 29.5 2009 ............................................................... 15.96 15.87 15.75 16.25 29.4 29.3 29.3 29.7 2010 ............................................................... 16.62 16.68 16.49 20.49 29.8 29.7 29.7 33.2
2011 ............................................................... 17.39 17.96 18.22 17.26 30.1 29.9 29.9 28.9 2012 ............................................................... 17.08 17.07 17.16 17.49 29.4 29.3 29.5 29.8 2013 ............................................................... 17.69 17.99 18.30 17.72 29.8 29.7 29.9 29.0 2014 ............................................................... 17.98 18.16 18.33 18.26 29.2 29.0 28.5 29.6 2015 ............................................................... 18.66 19.11 19.29 17.46 29.6 29.8 29.4 28.5 2016 ............................................................... 18.03 18.10 18.32 18.36 28.6 29.1 29.2 29.0 2017 ............................................................... 18.50 – – – 29.0 – – –
Paid leave 2006 ............................................................... – – – 4.39 – – – 8.8 2007 ............................................................... 4.70 4.54 4.54 4.56 8.8 8.9 8.8 8.8 2008 ............................................................... 4.58 4.66 4.71 4.84 8.7 8.8 8.8 8.9 2009 ............................................................... 4.87 4.84 4.81 4.88 9.0 8.9 8.9 8.9 2010 ............................................................... 4.92 4.91 4.87 5.03 8.8 8.7 8.8 8.2
2011 ............................................................... 5.05 5.17 5.23 5.07 8.7 8.6 8.6 8.5 2012 ............................................................... 4.93 4.93 4.94 5.15 8.5 8.5 8.5 8.8 2013 ............................................................... 5.26 5.33 5.42 5.35 8.8 8.8 8.9 8.7 2014 ............................................................... 5.46 5.50 5.53 5.40 8.9 8.8 8.6 8.8 2015 ............................................................... 5.45 5.60 5.65 5.24 8.6 8.7 8.6 8.5 2016 ............................................................... 5.41 5.36 5.45 5.47 8.6 8.6 8.7 8.6 2017 ............................................................... 5.54 – – – 8.7 – – –
Supplemental pay 2006 ............................................................... – – – 1.59 – – – 3.2 2007 ............................................................... 1.63 1.66 1.76 1.76 3.1 3.2 3.4 3.4 2008 ............................................................... 1.87 1.96 1.98 1.76 3.6 3.7 3.7 3.2 2009 ............................................................... 1.56 1.54 1.52 1.72 2.9 2.9 2.8 3.1 2010 ............................................................... 1.63 1.64 1.54 5.17 2.9 2.9 2.8 8.4
2011 ............................................................... 2.07 1.87 1.92 1.96 3.6 3.1 3.2 3.3 2012 ............................................................... 2.01 1.91 1.94 2.06 3.5 3.3 3.3 3.5 2013 ............................................................... 1.99 2.05 2.08 1.60 3.4 3.4 3.4 2.6 2014 ............................................................... 1.61 1.71 1.72 2.07 2.6 2.7 2.7 3.4 2015 ............................................................... 2.20 2.34 2.36 1.89 3.5 3.6 3.6 3.1
See footnotes at end of table.
-95-

Supplemental table 6. Private trade, transportation, and utilities industry workers, by occupational group: employercosts per hours worked for employee compensation and costs as a percentage of total compensation, 2006-2017 --Continued
Management, business, and financial occcupations
Compensationcomponent
Cost per hour worked Percent of total compensation
Mar. June Sep. Dec. Mar. June Sep. Dec.
Supplemental pay 2016 ............................................................... 2.06 2.18 2.14 2.09 3.3 3.5 3.4 3.3 2017 ............................................................... 2.01 – – – 3.1 – – –
Insurance 2006 ............................................................... – – – 3.00 – – – 6.0 2007 ............................................................... 3.10 3.13 3.17 3.15 5.8 6.1 6.2 6.1 2008 ............................................................... 3.20 3.20 3.25 3.39 6.1 6.0 6.0 6.2 2009 ............................................................... 3.50 3.48 3.48 3.60 6.4 6.4 6.5 6.6 2010 ............................................................... 3.74 3.75 3.73 3.97 6.7 6.7 6.7 6.4
2011 ............................................................... 3.94 4.21 4.24 3.92 6.8 7.0 7.0 6.6 2012 ............................................................... 3.88 3.93 3.93 3.86 6.7 6.8 6.8 6.6 2013 ............................................................... 4.06 4.10 4.19 4.06 6.8 6.8 6.9 6.6 2014 ............................................................... 4.15 4.16 4.20 4.01 6.7 6.6 6.5 6.5 2015 ............................................................... 4.15 4.18 4.19 3.82 6.6 6.5 6.4 6.2 2016 ............................................................... 3.97 3.97 4.06 4.09 6.3 6.4 6.5 6.5 2017 ............................................................... 4.13 – – – 6.5 – – –
Retirement and savings 2006 ............................................................... – – – 2.74 – – – 5.5 2007 ............................................................... 2.09 2.12 2.24 2.26 3.9 4.2 4.4 4.4 2008 ............................................................... 2.31 2.28 2.52 2.41 4.4 4.3 4.7 4.4 2009 ............................................................... 2.23 2.24 2.21 2.28 4.1 4.1 4.1 4.2 2010 ............................................................... 2.53 2.57 2.56 2.43 4.5 4.6 4.6 3.9
2011 ............................................................... 2.45 2.78 2.86 2.41 4.2 4.6 4.7 4.0 2012 ............................................................... 2.39 2.40 2.46 2.55 4.1 4.1 4.2 4.3 2013 ............................................................... 2.51 2.58 2.62 2.72 4.2 4.3 4.3 4.4 2014 ............................................................... 2.73 2.74 2.79 2.74 4.4 4.4 4.3 4.4 2015 ............................................................... 2.75 2.83 2.91 2.42 4.4 4.4 4.4 3.9 2016 ............................................................... 2.46 2.47 2.53 2.56 3.9 4.0 4.0 4.0 2017 ............................................................... 2.58 – – – 4.0 – – –
Legally required benefits 2006 ............................................................... – – – 3.45 – – – 6.9 2007 ............................................................... 3.71 3.54 3.58 3.58 7.0 6.9 6.9 6.9 2008 ............................................................... 3.65 3.68 3.70 3.76 6.9 6.9 6.9 6.9 2009 ............................................................... 3.80 3.76 3.74 3.76 7.0 6.9 7.0 6.9 2010 ............................................................... 3.80 3.80 3.79 3.88 6.8 6.8 6.8 6.3
2011 ............................................................... 3.88 3.93 3.98 3.90 6.7 6.6 6.5 6.5 2012 ............................................................... 3.88 3.89 3.90 3.86 6.7 6.7 6.7 6.6 2013 ............................................................... 3.88 3.93 3.98 4.00 6.5 6.5 6.5 6.5 2014 ............................................................... 4.02 4.05 4.09 4.04 6.5 6.5 6.4 6.5 2015 ............................................................... 4.11 4.16 4.18 4.09 6.5 6.5 6.4 6.7 2016 ............................................................... 4.14 4.12 4.14 4.16 6.6 6.6 6.6 6.6 2017 ............................................................... 4.24 – – – 6.6 – – –
Note: The sum of individual items may not equal totals due to rounding. Dashes indicate data are not available.
-96-

Supplemental table 6. Private trade, transportation, and utilities industry workers, by occupational group: employercosts per hours worked for employee compensation and costs as a percentage of total compensation, 2006-2017 --Continued
Professional and related occupations1
Compensationcomponent
Cost per hour worked Percent of total compensation
Mar. June Sep. Dec. Mar. June Sep. Dec.
Total compensation 2006 ............................................................... – – – $39.37 – – – 100.0 2007 ............................................................... 39.47 39.79 39.84 39.91 100.0 100.0 100.0 100.0 2008 ............................................................... 40.62 40.74 41.31 45.51 100.0 100.0 100.0 100.0 2009 ............................................................... 46.08 46.15 46.52 46.69 100.0 100.0 100.0 100.0 2010 ............................................................... 47.07 47.58 48.20 46.55 100.0 100.0 100.0 100.0
2011 ............................................................... 47.55 47.59 48.00 47.15 100.0 100.0 100.0 100.0 2012 ............................................................... 47.89 48.02 48.39 45.53 100.0 100.0 100.0 100.0 2013 ............................................................... 45.86 45.64 45.63 45.77 100.0 100.0 100.0 100.0 2014 ............................................................... 46.07 46.31 46.41 45.71 100.0 100.0 100.0 100.0 2015 ............................................................... 46.30 46.38 46.57 46.81 100.0 100.0 100.0 100.0 2016 ............................................................... 47.22 47.50 47.78 48.33 100.0 100.0 100.0 100.0 2017 ............................................................... 48.68 – – – 100.0 – – –
Wages and salaries 2006 ............................................................... – – – 28.08 – – – 71.3 2007 ............................................................... 28.46 28.66 28.76 28.85 72.1 72.0 72.2 72.3 2008 ............................................................... 29.31 29.41 29.79 32.73 72.2 72.2 72.1 71.9 2009 ............................................................... 33.17 33.20 33.46 33.61 72.0 71.9 71.9 72.0 2010 ............................................................... 33.70 33.99 34.44 33.37 71.6 71.4 71.5 71.7
2011 ............................................................... 33.99 33.93 34.24 34.28 71.5 71.3 71.3 72.7 2012 ............................................................... 34.71 34.72 34.90 33.09 72.5 72.3 72.1 72.7 2013 ............................................................... 33.23 33.12 33.16 33.29 72.5 72.6 72.7 72.7 2014 ............................................................... 33.42 33.62 33.71 33.12 72.5 72.6 72.6 72.5 2015 ............................................................... 33.48 33.52 33.65 33.66 72.3 72.3 72.3 71.9 2016 ............................................................... 33.88 34.04 34.23 34.72 71.7 71.7 71.6 71.8 2017 ............................................................... 35.00 – – – 71.9 – – –
Total benefits 2006 ............................................................... – – – 11.29 – – – 28.7 2007 ............................................................... 11.01 11.14 11.08 11.07 27.9 28.0 27.8 27.7 2008 ............................................................... 11.31 11.34 11.52 12.78 27.8 27.8 27.9 28.1 2009 ............................................................... 12.91 12.95 13.06 13.08 28.0 28.1 28.1 28.0 2010 ............................................................... 13.37 13.58 13.76 13.18 28.4 28.6 28.5 28.3
2011 ............................................................... 13.57 13.67 13.76 12.88 28.5 28.7 28.7 27.3 2012 ............................................................... 13.18 13.30 13.49 12.44 27.5 27.7 27.9 27.3 2013 ............................................................... 12.62 12.52 12.46 12.48 27.5 27.4 27.3 27.3 2014 ............................................................... 12.65 12.69 12.69 12.59 27.5 27.4 27.4 27.5 2015 ............................................................... 12.82 12.86 12.92 13.14 27.7 27.7 27.7 28.1 2016 ............................................................... 13.34 13.46 13.55 13.62 28.3 28.3 28.4 28.2 2017 ............................................................... 13.68 – – – 28.1 – – –
Paid leave 2006 ............................................................... – – – 3.11 – – – 7.9 2007 ............................................................... 3.15 3.18 3.18 3.17 8.0 8.0 8.0 8.0 2008 ............................................................... 3.22 3.23 3.28 3.73 7.9 7.9 7.9 8.2 2009 ............................................................... 3.79 3.78 3.85 3.77 8.2 8.2 8.3 8.1 2010 ............................................................... 3.76 3.80 3.87 3.80 8.0 8.0 8.0 8.2
2011 ............................................................... 3.91 3.89 3.86 3.59 8.2 8.2 8.0 7.6 2012 ............................................................... 3.64 3.66 3.69 3.33 7.6 7.6 7.6 7.3 2013 ............................................................... 3.38 3.33 3.34 3.44 7.4 7.3 7.3 7.5 2014 ............................................................... 3.48 3.49 3.49 3.50 7.6 7.5 7.5 7.7 2015 ............................................................... 3.57 3.56 3.58 3.84 7.7 7.7 7.7 8.2 2016 ............................................................... 3.87 3.90 3.93 3.97 8.2 8.2 8.2 8.2 2017 ............................................................... 4.01 – – – 8.2 – – –
Supplemental pay 2006 ............................................................... – – – .91 – – – 2.3 2007 ............................................................... .92 .91 .82 .82 2.3 2.3 2.1 2.1 2008 ............................................................... .84 .85 .87 .97 2.1 2.1 2.1 2.1 2009 ............................................................... .93 .97 .96 1.03 2.0 2.1 2.1 2.2 2010 ............................................................... 1.05 1.07 1.04 1.00 2.2 2.2 2.2 2.2
2011 ............................................................... 1.02 1.14 1.22 1.09 2.1 2.4 2.5 2.3 2012 ............................................................... 1.12 1.10 1.13 1.00 2.3 2.3 2.3 2.2 2013 ............................................................... 1.03 .98 1.05 .95 2.2 2.2 2.3 2.1 2014 ............................................................... .99 .99 .97 .94 2.1 2.1 2.1 2.1 2015 ............................................................... .98 .99 .99 .96 2.1 2.1 2.1 2.1
See footnotes at end of table.
-97-

Supplemental table 6. Private trade, transportation, and utilities industry workers, by occupational group: employercosts per hours worked for employee compensation and costs as a percentage of total compensation, 2006-2017 --Continued
Professional and related occupations1
Compensationcomponent
Cost per hour worked Percent of total compensation
Mar. June Sep. Dec. Mar. June Sep. Dec.
Supplemental pay 2016 ............................................................... 0.96 0.95 0.97 0.93 2.0 2.0 2.0 1.9 2017 ............................................................... .90 – – – 1.9 – – –
Insurance 2006 ............................................................... – – – 2.46 – – – 6.2 2007 ............................................................... 2.54 2.56 2.49 2.49 6.4 6.4 6.3 6.2 2008 ............................................................... 2.57 2.56 2.54 2.76 6.3 6.3 6.2 6.1 2009 ............................................................... 2.87 2.90 2.94 2.82 6.2 6.3 6.3 6.0 2010 ............................................................... 2.92 2.98 3.01 2.96 6.2 6.3 6.2 6.4
2011 ............................................................... 3.09 3.08 3.10 2.83 6.5 6.5 6.5 6.0 2012 ............................................................... 2.93 2.93 3.00 2.87 6.1 6.1 6.2 6.3 2013 ............................................................... 2.92 2.87 2.86 2.94 6.4 6.3 6.3 6.4 2014 ............................................................... 3.00 3.04 3.02 3.03 6.5 6.6 6.5 6.6 2015 ............................................................... 3.10 3.16 3.17 3.10 6.7 6.8 6.8 6.6 2016 ............................................................... 3.20 3.27 3.30 3.33 6.8 6.9 6.9 6.9 2017 ............................................................... 3.30 – – – 6.8 – – –
Retirement and savings 2006 ............................................................... – – – 1.83 – – – 4.7 2007 ............................................................... 1.42 1.48 1.55 1.55 3.6 3.7 3.9 3.9 2008 ............................................................... 1.58 1.61 1.71 1.91 3.9 4.0 4.1 4.2 2009 ............................................................... 1.85 1.85 1.84 1.99 4.0 4.0 4.0 4.3 2010 ............................................................... 2.13 2.21 2.26 1.99 4.5 4.6 4.7 4.3
2011 ............................................................... 2.08 2.07 2.11 1.95 4.4 4.4 4.4 4.1 2012 ............................................................... 2.00 2.12 2.16 1.91 4.2 4.4 4.5 4.2 2013 ............................................................... 1.95 2.01 1.84 1.79 4.3 4.4 4.0 3.9 2014 ............................................................... 1.79 1.78 1.81 1.76 3.9 3.8 3.9 3.8 2015 ............................................................... 1.77 1.76 1.79 1.85 3.8 3.8 3.9 3.9 2016 ............................................................... 1.90 1.92 1.93 1.93 4.0 4.0 4.0 4.0 2017 ............................................................... 1.96 – – – 4.0 – – –
Legally required benefits 2006 ............................................................... – – – 2.98 – – – 7.6 2007 ............................................................... 2.98 3.00 3.03 3.03 7.6 7.5 7.6 7.6 2008 ............................................................... 3.10 3.09 3.11 3.41 7.6 7.6 7.5 7.5 2009 ............................................................... 3.47 3.45 3.47 3.48 7.5 7.5 7.5 7.4 2010 ............................................................... 3.51 3.54 3.58 3.44 7.5 7.4 7.4 7.4
2011 ............................................................... 3.48 3.47 3.48 3.41 7.3 7.3 7.2 7.2 2012 ............................................................... 3.49 3.49 3.51 3.32 7.3 7.3 7.3 7.3 2013 ............................................................... 3.34 3.33 3.37 3.36 7.3 7.3 7.4 7.3 2014 ............................................................... 3.39 3.39 3.40 3.35 7.3 7.3 7.3 7.3 2015 ............................................................... 3.40 3.39 3.39 3.40 7.3 7.3 7.3 7.3 2016 ............................................................... 3.42 3.42 3.43 3.46 7.2 7.2 7.2 7.2 2017 ............................................................... 3.51 – – – 7.2 – – –
1 Estimates from December 2013 to March 2014 for this series were corrected, details are available atwww.bls.gov/bls/ecec_correction_091014.htm.
Note: The sum of individual items may not equal totals due to rounding. Dashes indicate data are not available.
-98-
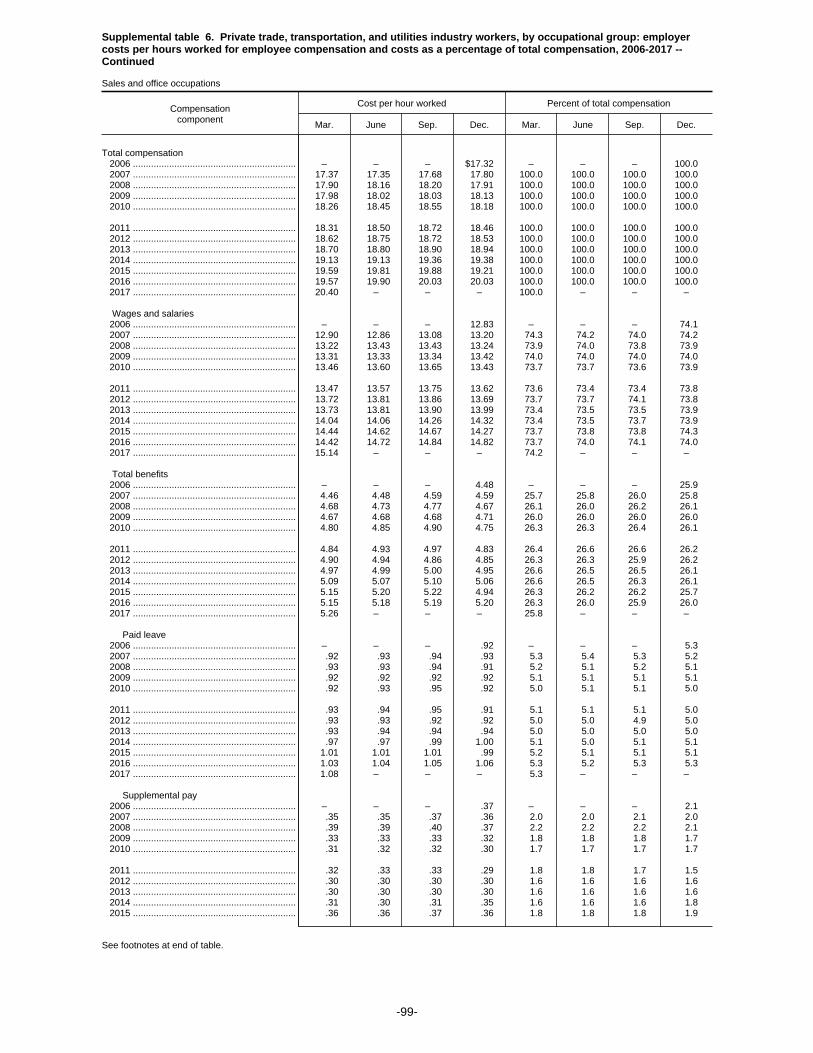
Supplemental table 6. Private trade, transportation, and utilities industry workers, by occupational group: employercosts per hours worked for employee compensation and costs as a percentage of total compensation, 2006-2017 --Continued
Sales and office occupations
Compensationcomponent
Cost per hour worked Percent of total compensation
Mar. June Sep. Dec. Mar. June Sep. Dec.
Total compensation 2006 ............................................................... – – – $17.32 – – – 100.0 2007 ............................................................... 17.37 17.35 17.68 17.80 100.0 100.0 100.0 100.0 2008 ............................................................... 17.90 18.16 18.20 17.91 100.0 100.0 100.0 100.0 2009 ............................................................... 17.98 18.02 18.03 18.13 100.0 100.0 100.0 100.0 2010 ............................................................... 18.26 18.45 18.55 18.18 100.0 100.0 100.0 100.0
2011 ............................................................... 18.31 18.50 18.72 18.46 100.0 100.0 100.0 100.0 2012 ............................................................... 18.62 18.75 18.72 18.53 100.0 100.0 100.0 100.0 2013 ............................................................... 18.70 18.80 18.90 18.94 100.0 100.0 100.0 100.0 2014 ............................................................... 19.13 19.13 19.36 19.38 100.0 100.0 100.0 100.0 2015 ............................................................... 19.59 19.81 19.88 19.21 100.0 100.0 100.0 100.0 2016 ............................................................... 19.57 19.90 20.03 20.03 100.0 100.0 100.0 100.0 2017 ............................................................... 20.40 – – – 100.0 – – –
Wages and salaries 2006 ............................................................... – – – 12.83 – – – 74.1 2007 ............................................................... 12.90 12.86 13.08 13.20 74.3 74.2 74.0 74.2 2008 ............................................................... 13.22 13.43 13.43 13.24 73.9 74.0 73.8 73.9 2009 ............................................................... 13.31 13.33 13.34 13.42 74.0 74.0 74.0 74.0 2010 ............................................................... 13.46 13.60 13.65 13.43 73.7 73.7 73.6 73.9
2011 ............................................................... 13.47 13.57 13.75 13.62 73.6 73.4 73.4 73.8 2012 ............................................................... 13.72 13.81 13.86 13.69 73.7 73.7 74.1 73.8 2013 ............................................................... 13.73 13.81 13.90 13.99 73.4 73.5 73.5 73.9 2014 ............................................................... 14.04 14.06 14.26 14.32 73.4 73.5 73.7 73.9 2015 ............................................................... 14.44 14.62 14.67 14.27 73.7 73.8 73.8 74.3 2016 ............................................................... 14.42 14.72 14.84 14.82 73.7 74.0 74.1 74.0 2017 ............................................................... 15.14 – – – 74.2 – – –
Total benefits 2006 ............................................................... – – – 4.48 – – – 25.9 2007 ............................................................... 4.46 4.48 4.59 4.59 25.7 25.8 26.0 25.8 2008 ............................................................... 4.68 4.73 4.77 4.67 26.1 26.0 26.2 26.1 2009 ............................................................... 4.67 4.68 4.68 4.71 26.0 26.0 26.0 26.0 2010 ............................................................... 4.80 4.85 4.90 4.75 26.3 26.3 26.4 26.1
2011 ............................................................... 4.84 4.93 4.97 4.83 26.4 26.6 26.6 26.2 2012 ............................................................... 4.90 4.94 4.86 4.85 26.3 26.3 25.9 26.2 2013 ............................................................... 4.97 4.99 5.00 4.95 26.6 26.5 26.5 26.1 2014 ............................................................... 5.09 5.07 5.10 5.06 26.6 26.5 26.3 26.1 2015 ............................................................... 5.15 5.20 5.22 4.94 26.3 26.2 26.2 25.7 2016 ............................................................... 5.15 5.18 5.19 5.20 26.3 26.0 25.9 26.0 2017 ............................................................... 5.26 – – – 25.8 – – –
Paid leave 2006 ............................................................... – – – .92 – – – 5.3 2007 ............................................................... .92 .93 .94 .93 5.3 5.4 5.3 5.2 2008 ............................................................... .93 .93 .94 .91 5.2 5.1 5.2 5.1 2009 ............................................................... .92 .92 .92 .92 5.1 5.1 5.1 5.1 2010 ............................................................... .92 .93 .95 .92 5.0 5.1 5.1 5.0
2011 ............................................................... .93 .94 .95 .91 5.1 5.1 5.1 5.0 2012 ............................................................... .93 .93 .92 .92 5.0 5.0 4.9 5.0 2013 ............................................................... .93 .94 .94 .94 5.0 5.0 5.0 5.0 2014 ............................................................... .97 .97 .99 1.00 5.1 5.0 5.1 5.1 2015 ............................................................... 1.01 1.01 1.01 .99 5.2 5.1 5.1 5.1 2016 ............................................................... 1.03 1.04 1.05 1.06 5.3 5.2 5.3 5.3 2017 ............................................................... 1.08 – – – 5.3 – – –
Supplemental pay 2006 ............................................................... – – – .37 – – – 2.1 2007 ............................................................... .35 .35 .37 .36 2.0 2.0 2.1 2.0 2008 ............................................................... .39 .39 .40 .37 2.2 2.2 2.2 2.1 2009 ............................................................... .33 .33 .33 .32 1.8 1.8 1.8 1.7 2010 ............................................................... .31 .32 .32 .30 1.7 1.7 1.7 1.7
2011 ............................................................... .32 .33 .33 .29 1.8 1.8 1.7 1.5 2012 ............................................................... .30 .30 .30 .30 1.6 1.6 1.6 1.6 2013 ............................................................... .30 .30 .30 .30 1.6 1.6 1.6 1.6 2014 ............................................................... .31 .30 .31 .35 1.6 1.6 1.6 1.8 2015 ............................................................... .36 .36 .37 .36 1.8 1.8 1.8 1.9
See footnotes at end of table.
-99-

Supplemental table 6. Private trade, transportation, and utilities industry workers, by occupational group: employercosts per hours worked for employee compensation and costs as a percentage of total compensation, 2006-2017 --Continued
Sales and office occupations
Compensationcomponent
Cost per hour worked Percent of total compensation
Mar. June Sep. Dec. Mar. June Sep. Dec.
Supplemental pay 2016 ............................................................... 0.45 0.45 0.45 0.45 2.3 2.3 2.2 2.2 2017 ............................................................... .45 – – – 2.2 – – –
Insurance 2006 ............................................................... – – – 1.25 – – – 7.2 2007 ............................................................... 1.27 1.28 1.31 1.31 7.3 7.4 7.4 7.4 2008 ............................................................... 1.36 1.38 1.39 1.37 7.6 7.6 7.6 7.6 2009 ............................................................... 1.42 1.43 1.44 1.45 7.9 7.9 8.0 8.0 2010 ............................................................... 1.51 1.52 1.53 1.50 8.3 8.2 8.3 8.2
2011 ............................................................... 1.53 1.56 1.57 1.53 8.3 8.4 8.4 8.3 2012 ............................................................... 1.56 1.56 1.49 1.51 8.4 8.3 8.0 8.2 2013 ............................................................... 1.60 1.61 1.61 1.57 8.6 8.6 8.5 8.3 2014 ............................................................... 1.65 1.64 1.63 1.56 8.6 8.6 8.4 8.0 2015 ............................................................... 1.60 1.63 1.63 1.46 8.2 8.2 8.2 7.6 2016 ............................................................... 1.54 1.54 1.53 1.53 7.8 7.7 7.6 7.6 2017 ............................................................... 1.53 – – – 7.5 – – –
Retirement and savings 2006 ............................................................... – – – .40 – – – 2.3 2007 ............................................................... .38 .37 .42 .43 2.2 2.2 2.4 2.4 2008 ............................................................... .43 .45 .45 .44 2.4 2.5 2.5 2.5 2009 ............................................................... .42 .43 .42 .43 2.3 2.4 2.3 2.4 2010 ............................................................... .45 .46 .47 .44 2.5 2.5 2.5 2.4
2011 ............................................................... .45 .46 .47 .47 2.4 2.5 2.5 2.5 2012 ............................................................... .47 .47 .47 .48 2.5 2.5 2.5 2.6 2013 ............................................................... .48 .50 .49 .49 2.6 2.6 2.6 2.6 2014 ............................................................... .50 .51 .50 .50 2.6 2.7 2.6 2.6 2015 ............................................................... .51 .52 .53 .49 2.6 2.6 2.7 2.5 2016 ............................................................... .49 .50 .50 .51 2.5 2.5 2.5 2.5 2017 ............................................................... .51 – – – 2.5 – – –
Legally required benefits 2006 ............................................................... – – – 1.54 – – – 8.9 2007 ............................................................... 1.54 1.54 1.56 1.56 8.9 8.9 8.8 8.8 2008 ............................................................... 1.56 1.58 1.58 1.57 8.7 8.7 8.7 8.8 2009 ............................................................... 1.58 1.58 1.58 1.58 8.8 8.7 8.7 8.7 2010 ............................................................... 1.60 1.62 1.63 1.60 8.8 8.8 8.8 8.8
2011 ............................................................... 1.61 1.64 1.65 1.64 8.8 8.9 8.8 8.9 2012 ............................................................... 1.65 1.67 1.67 1.64 8.9 8.9 8.9 8.8 2013 ............................................................... 1.65 1.65 1.65 1.65 8.8 8.8 8.7 8.7 2014 ............................................................... 1.66 1.65 1.67 1.66 8.7 8.6 8.6 8.6 2015 ............................................................... 1.67 1.68 1.68 1.63 8.5 8.5 8.4 8.5 2016 ............................................................... 1.64 1.65 1.66 1.66 8.4 8.3 8.3 8.3 2017 ............................................................... 1.69 – – – 8.3 – – –
Note: The sum of individual items may not equal totals due to rounding. Dashes indicate data are not available.
-100-

Supplemental table 6. Private trade, transportation, and utilities industry workers, by occupational group: employercosts per hours worked for employee compensation and costs as a percentage of total compensation, 2006-2017 --Continued
Sales and related occupations
Compensationcomponent
Cost per hour worked Percent of total compensation
Mar. June Sep. Dec. Mar. June Sep. Dec.
Total compensation 2006 ............................................................... – – – $16.44 – – – 100.0 2007 ............................................................... 16.41 16.38 16.75 16.92 100.0 100.0 100.0 100.0 2008 ............................................................... 16.97 17.25 17.22 17.02 100.0 100.0 100.0 100.0 2009 ............................................................... 17.01 17.07 17.05 17.26 100.0 100.0 100.0 100.0 2010 ............................................................... 17.31 17.56 17.60 17.25 100.0 100.0 100.0 100.0
2011 ............................................................... 17.28 17.54 17.77 17.47 100.0 100.0 100.0 100.0 2012 ............................................................... 17.58 17.72 17.73 17.57 100.0 100.0 100.0 100.0 2013 ............................................................... 17.72 17.82 17.97 18.12 100.0 100.0 100.0 100.0 2014 ............................................................... 18.29 18.24 18.53 18.68 100.0 100.0 100.0 100.0 2015 ............................................................... 18.87 19.10 19.12 18.39 100.0 100.0 100.0 100.0 2016 ............................................................... 18.70 19.10 19.20 19.13 100.0 100.0 100.0 100.0 2017 ............................................................... 19.52 – – – 100.0 – – –
Wages and salaries 2006 ............................................................... – – – 12.53 – – – 76.2 2007 ............................................................... 12.53 12.48 12.74 12.90 76.4 76.2 76.1 76.2 2008 ............................................................... 12.88 13.14 13.08 12.93 75.9 76.2 76.0 76.0 2009 ............................................................... 12.94 12.98 12.98 13.13 76.1 76.0 76.1 76.0 2010 ............................................................... 13.12 13.31 13.31 13.09 75.8 75.8 75.7 75.9
2011 ............................................................... 13.07 13.24 13.44 13.28 75.7 75.5 75.6 76.0 2012 ............................................................... 13.36 13.47 13.55 13.37 76.0 76.0 76.4 76.1 2013 ............................................................... 13.39 13.47 13.57 13.79 75.5 75.6 75.5 76.1 2014 ............................................................... 13.82 13.81 14.07 14.20 75.6 75.7 75.9 76.0 2015 ............................................................... 14.31 14.51 14.53 14.08 75.9 75.9 76.0 76.6 2016 ............................................................... 14.19 14.55 14.65 14.58 75.9 76.2 76.3 76.2 2017 ............................................................... 14.92 – – – 76.4 – – –
Total benefits 2006 ............................................................... – – – 3.91 – – – 23.8 2007 ............................................................... 3.88 3.90 4.01 4.02 23.6 23.8 23.9 23.8 2008 ............................................................... 4.09 4.11 4.14 4.09 24.1 23.8 24.0 24.0 2009 ............................................................... 4.06 4.09 4.07 4.14 23.9 24.0 23.9 24.0 2010 ............................................................... 4.19 4.25 4.28 4.16 24.2 24.2 24.3 24.1
2011 ............................................................... 4.21 4.30 4.33 4.18 24.3 24.5 24.4 24.0 2012 ............................................................... 4.22 4.25 4.18 4.19 24.0 24.0 23.6 23.9 2013 ............................................................... 4.34 4.35 4.40 4.33 24.5 24.4 24.5 23.9 2014 ............................................................... 4.47 4.43 4.47 4.48 24.4 24.3 24.1 24.0 2015 ............................................................... 4.55 4.60 4.59 4.30 24.1 24.1 24.0 23.4 2016 ............................................................... 4.51 4.54 4.55 4.54 24.1 23.8 23.7 23.8 2017 ............................................................... 4.60 – – – 23.6 – – –
Paid leave 2006 ............................................................... – – – .76 – – – 4.6 2007 ............................................................... .76 .77 .78 .78 4.6 4.7 4.7 4.6 2008 ............................................................... .78 .78 .79 .77 4.6 4.5 4.6 4.5 2009 ............................................................... .77 .77 .77 .78 4.5 4.5 4.5 4.5 2010 ............................................................... .77 .79 .80 .78 4.4 4.5 4.6 4.5
2011 ............................................................... .78 .80 .80 .77 4.5 4.6 4.5 4.4 2012 ............................................................... .78 .79 .77 .78 4.4 4.5 4.4 4.4 2013 ............................................................... .79 .79 .80 .82 4.5 4.4 4.5 4.5 2014 ............................................................... .85 .83 .86 .88 4.6 4.6 4.6 4.7 2015 ............................................................... .90 .89 .88 .86 4.7 4.7 4.6 4.7 2016 ............................................................... .90 .91 .92 .92 4.8 4.8 4.8 4.8 2017 ............................................................... .94 – – – 4.8 – – –
Supplemental pay 2006 ............................................................... – – – .36 – – – 2.2 2007 ............................................................... .33 .33 .35 .35 2.0 2.0 2.1 2.0 2008 ............................................................... .37 .37 .38 .34 2.2 2.2 2.2 2.0 2009 ............................................................... .29 .30 .30 .29 1.7 1.8 1.8 1.7 2010 ............................................................... .29 .29 .30 .28 1.7 1.7 1.7 1.6
2011 ............................................................... .30 .30 .30 .25 1.7 1.7 1.7 1.4 2012 ............................................................... .26 .26 .27 .27 1.5 1.5 1.5 1.5 2013 ............................................................... .28 .27 .28 .27 1.6 1.5 1.6 1.5 2014 ............................................................... .27 .26 .27 .31 1.5 1.4 1.5 1.6 2015 ............................................................... .32 .32 .33 .31 1.7 1.7 1.7 1.7
See footnotes at end of table.
-101-

Supplemental table 6. Private trade, transportation, and utilities industry workers, by occupational group: employercosts per hours worked for employee compensation and costs as a percentage of total compensation, 2006-2017 --Continued
Sales and related occupations
Compensationcomponent
Cost per hour worked Percent of total compensation
Mar. June Sep. Dec. Mar. June Sep. Dec.
Supplemental pay 2016 ............................................................... 0.40 0.40 0.39 0.39 2.2 2.1 2.1 2.1 2017 ............................................................... .39 – – – 2.0 – – –
Insurance 2006 ............................................................... – – – .96 – – – 5.9 2007 ............................................................... .97 .98 1.01 1.02 5.9 6.0 6.0 6.0 2008 ............................................................... 1.06 1.06 1.07 1.08 6.2 6.2 6.2 6.4 2009 ............................................................... 1.12 1.12 1.12 1.15 6.6 6.6 6.6 6.7 2010 ............................................................... 1.19 1.20 1.20 1.17 6.8 6.8 6.8 6.8
2011 ............................................................... 1.19 1.23 1.23 1.20 6.9 7.0 6.9 6.9 2012 ............................................................... 1.20 1.20 1.15 1.18 6.8 6.8 6.5 6.7 2013 ............................................................... 1.28 1.29 1.30 1.25 7.2 7.2 7.3 6.9 2014 ............................................................... 1.34 1.33 1.32 1.28 7.3 7.3 7.1 6.9 2015 ............................................................... 1.31 1.33 1.33 1.18 7.0 7.0 7.0 6.4 2016 ............................................................... 1.25 1.26 1.24 1.24 6.7 6.6 6.5 6.5 2017 ............................................................... 1.23 – – – 6.3 – – –
Retirement and savings 2006 ............................................................... – – – .32 – – – 2.0 2007 ............................................................... .32 .31 .35 .36 2.0 1.9 2.1 2.1 2008 ............................................................... .36 .36 .37 .36 2.1 2.1 2.1 2.1 2009 ............................................................... .35 .36 .35 .37 2.1 2.1 2.1 2.1 2010 ............................................................... .38 .38 .39 .37 2.2 2.2 2.2 2.2
2011 ............................................................... .37 .38 .40 .37 2.2 2.2 2.2 2.1 2012 ............................................................... .38 .38 .37 .38 2.2 2.1 2.1 2.2 2013 ............................................................... .38 .40 .41 .40 2.2 2.2 2.3 2.2 2014 ............................................................... .40 .40 .40 .39 2.2 2.2 2.1 2.1 2015 ............................................................... .40 .42 .42 .38 2.1 2.2 2.2 2.1 2016 ............................................................... .38 .38 .39 .39 2.1 2.0 2.0 2.0 2017 ............................................................... .40 – – – 2.0 – – –
Legally required benefits 2006 ............................................................... – – – 1.50 – – – 9.1 2007 ............................................................... 1.49 1.50 1.52 1.52 9.1 9.2 9.1 9.0 2008 ............................................................... 1.52 1.53 1.54 1.53 9.0 8.9 8.9 9.0 2009 ............................................................... 1.53 1.53 1.53 1.55 9.0 9.0 9.0 9.0 2010 ............................................................... 1.56 1.58 1.59 1.55 9.0 9.0 9.0 9.0
2011 ............................................................... 1.57 1.60 1.60 1.59 9.1 9.1 9.0 9.1 2012 ............................................................... 1.61 1.62 1.63 1.59 9.1 9.1 9.2 9.1 2013 ............................................................... 1.60 1.60 1.61 1.60 9.0 9.0 8.9 8.8 2014 ............................................................... 1.61 1.60 1.62 1.62 8.8 8.8 8.7 8.7 2015 ............................................................... 1.63 1.64 1.63 1.57 8.6 8.6 8.5 8.6 2016 ............................................................... 1.58 1.59 1.60 1.60 8.4 8.3 8.3 8.4 2017 ............................................................... 1.63 – – – 8.3 – – –
Note: The sum of individual items may not equal totals due to rounding. Dashes indicate data are not available.
-102-
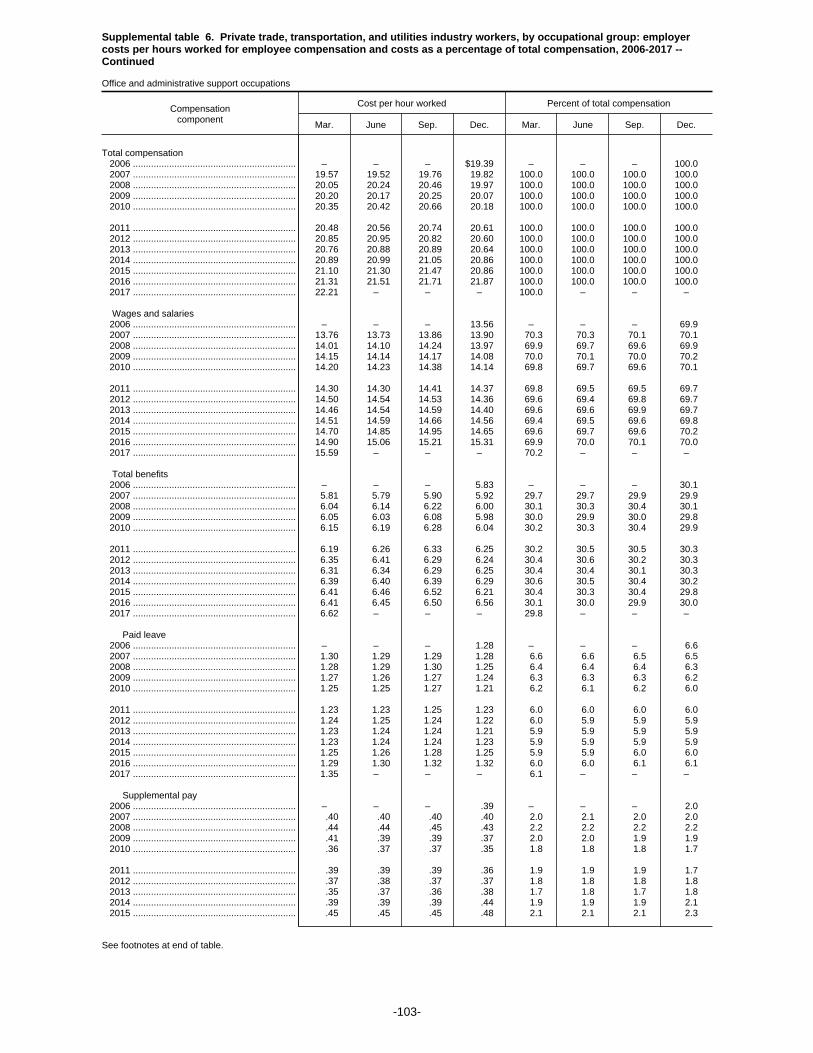
Supplemental table 6. Private trade, transportation, and utilities industry workers, by occupational group: employercosts per hours worked for employee compensation and costs as a percentage of total compensation, 2006-2017 --Continued
Office and administrative support occupations
Compensationcomponent
Cost per hour worked Percent of total compensation
Mar. June Sep. Dec. Mar. June Sep. Dec.
Total compensation 2006 ............................................................... – – – $19.39 – – – 100.0 2007 ............................................................... 19.57 19.52 19.76 19.82 100.0 100.0 100.0 100.0 2008 ............................................................... 20.05 20.24 20.46 19.97 100.0 100.0 100.0 100.0 2009 ............................................................... 20.20 20.17 20.25 20.07 100.0 100.0 100.0 100.0 2010 ............................................................... 20.35 20.42 20.66 20.18 100.0 100.0 100.0 100.0
2011 ............................................................... 20.48 20.56 20.74 20.61 100.0 100.0 100.0 100.0 2012 ............................................................... 20.85 20.95 20.82 20.60 100.0 100.0 100.0 100.0 2013 ............................................................... 20.76 20.88 20.89 20.64 100.0 100.0 100.0 100.0 2014 ............................................................... 20.89 20.99 21.05 20.86 100.0 100.0 100.0 100.0 2015 ............................................................... 21.10 21.30 21.47 20.86 100.0 100.0 100.0 100.0 2016 ............................................................... 21.31 21.51 21.71 21.87 100.0 100.0 100.0 100.0 2017 ............................................................... 22.21 – – – 100.0 – – –
Wages and salaries 2006 ............................................................... – – – 13.56 – – – 69.9 2007 ............................................................... 13.76 13.73 13.86 13.90 70.3 70.3 70.1 70.1 2008 ............................................................... 14.01 14.10 14.24 13.97 69.9 69.7 69.6 69.9 2009 ............................................................... 14.15 14.14 14.17 14.08 70.0 70.1 70.0 70.2 2010 ............................................................... 14.20 14.23 14.38 14.14 69.8 69.7 69.6 70.1
2011 ............................................................... 14.30 14.30 14.41 14.37 69.8 69.5 69.5 69.7 2012 ............................................................... 14.50 14.54 14.53 14.36 69.6 69.4 69.8 69.7 2013 ............................................................... 14.46 14.54 14.59 14.40 69.6 69.6 69.9 69.7 2014 ............................................................... 14.51 14.59 14.66 14.56 69.4 69.5 69.6 69.8 2015 ............................................................... 14.70 14.85 14.95 14.65 69.6 69.7 69.6 70.2 2016 ............................................................... 14.90 15.06 15.21 15.31 69.9 70.0 70.1 70.0 2017 ............................................................... 15.59 – – – 70.2 – – –
Total benefits 2006 ............................................................... – – – 5.83 – – – 30.1 2007 ............................................................... 5.81 5.79 5.90 5.92 29.7 29.7 29.9 29.9 2008 ............................................................... 6.04 6.14 6.22 6.00 30.1 30.3 30.4 30.1 2009 ............................................................... 6.05 6.03 6.08 5.98 30.0 29.9 30.0 29.8 2010 ............................................................... 6.15 6.19 6.28 6.04 30.2 30.3 30.4 29.9
2011 ............................................................... 6.19 6.26 6.33 6.25 30.2 30.5 30.5 30.3 2012 ............................................................... 6.35 6.41 6.29 6.24 30.4 30.6 30.2 30.3 2013 ............................................................... 6.31 6.34 6.29 6.25 30.4 30.4 30.1 30.3 2014 ............................................................... 6.39 6.40 6.39 6.29 30.6 30.5 30.4 30.2 2015 ............................................................... 6.41 6.46 6.52 6.21 30.4 30.3 30.4 29.8 2016 ............................................................... 6.41 6.45 6.50 6.56 30.1 30.0 29.9 30.0 2017 ............................................................... 6.62 – – – 29.8 – – –
Paid leave 2006 ............................................................... – – – 1.28 – – – 6.6 2007 ............................................................... 1.30 1.29 1.29 1.28 6.6 6.6 6.5 6.5 2008 ............................................................... 1.28 1.29 1.30 1.25 6.4 6.4 6.4 6.3 2009 ............................................................... 1.27 1.26 1.27 1.24 6.3 6.3 6.3 6.2 2010 ............................................................... 1.25 1.25 1.27 1.21 6.2 6.1 6.2 6.0
2011 ............................................................... 1.23 1.23 1.25 1.23 6.0 6.0 6.0 6.0 2012 ............................................................... 1.24 1.25 1.24 1.22 6.0 5.9 5.9 5.9 2013 ............................................................... 1.23 1.24 1.24 1.21 5.9 5.9 5.9 5.9 2014 ............................................................... 1.23 1.24 1.24 1.23 5.9 5.9 5.9 5.9 2015 ............................................................... 1.25 1.26 1.28 1.25 5.9 5.9 6.0 6.0 2016 ............................................................... 1.29 1.30 1.32 1.32 6.0 6.0 6.1 6.1 2017 ............................................................... 1.35 – – – 6.1 – – –
Supplemental pay 2006 ............................................................... – – – .39 – – – 2.0 2007 ............................................................... .40 .40 .40 .40 2.0 2.1 2.0 2.0 2008 ............................................................... .44 .44 .45 .43 2.2 2.2 2.2 2.2 2009 ............................................................... .41 .39 .39 .37 2.0 2.0 1.9 1.9 2010 ............................................................... .36 .37 .37 .35 1.8 1.8 1.8 1.7
2011 ............................................................... .39 .39 .39 .36 1.9 1.9 1.9 1.7 2012 ............................................................... .37 .38 .37 .37 1.8 1.8 1.8 1.8 2013 ............................................................... .35 .37 .36 .38 1.7 1.8 1.7 1.8 2014 ............................................................... .39 .39 .39 .44 1.9 1.9 1.9 2.1 2015 ............................................................... .45 .45 .45 .48 2.1 2.1 2.1 2.3
See footnotes at end of table.
-103-

Supplemental table 6. Private trade, transportation, and utilities industry workers, by occupational group: employercosts per hours worked for employee compensation and costs as a percentage of total compensation, 2006-2017 --Continued
Office and administrative support occupations
Compensationcomponent
Cost per hour worked Percent of total compensation
Mar. June Sep. Dec. Mar. June Sep. Dec.
Supplemental pay 2016 ............................................................... 0.54 0.56 0.56 0.56 2.5 2.6 2.6 2.6 2017 ............................................................... .56 – – – 2.5 – – –
Insurance 2006 ............................................................... – – – 1.93 – – – 10.0 2007 ............................................................... 1.96 1.94 2.00 1.99 10.0 9.9 10.1 10.0 2008 ............................................................... 2.06 2.10 2.12 2.03 10.3 10.4 10.4 10.2 2009 ............................................................... 2.11 2.12 2.17 2.12 10.5 10.5 10.7 10.6 2010 ............................................................... 2.22 2.23 2.26 2.21 10.9 10.9 11.0 10.9
2011 ............................................................... 2.25 2.27 2.29 2.26 11.0 11.0 11.1 11.0 2012 ............................................................... 2.33 2.34 2.23 2.23 11.2 11.2 10.7 10.8 2013 ............................................................... 2.28 2.29 2.27 2.22 11.0 11.0 10.9 10.8 2014 ............................................................... 2.31 2.28 2.28 2.14 11.1 10.9 10.8 10.3 2015 ............................................................... 2.20 2.24 2.26 2.02 10.4 10.5 10.5 9.7 2016 ............................................................... 2.11 2.10 2.10 2.13 9.9 9.8 9.7 9.7 2017 ............................................................... 2.14 – – – 9.7 – – –
Retirement and savings 2006 ............................................................... – – – .59 – – – 3.0 2007 ............................................................... .51 .52 .56 .59 2.6 2.7 2.8 3.0 2008 ............................................................... .59 .63 .65 .63 3.0 3.1 3.2 3.1 2009 ............................................................... .58 .58 .58 .57 2.9 2.9 2.9 2.9 2010 ............................................................... .62 .63 .64 .58 3.1 3.1 3.1 2.9
2011 ............................................................... .61 .63 .64 .67 3.0 3.0 3.1 3.3 2012 ............................................................... .65 .68 .69 .68 3.1 3.3 3.3 3.3 2013 ............................................................... .70 .70 .67 .68 3.4 3.3 3.2 3.3 2014 ............................................................... .70 .73 .71 .72 3.4 3.5 3.4 3.4 2015 ............................................................... .73 .73 .76 .71 3.5 3.4 3.5 3.4 2016 ............................................................... .71 .73 .74 .75 3.3 3.4 3.4 3.4 2017 ............................................................... .76 – – – 3.4 – – –
Legally required benefits 2006 ............................................................... – – – 1.64 – – – 8.4 2007 ............................................................... 1.64 1.64 1.66 1.66 8.4 8.4 8.4 8.4 2008 ............................................................... 1.67 1.68 1.69 1.66 8.3 8.3 8.3 8.3 2009 ............................................................... 1.68 1.67 1.67 1.67 8.3 8.3 8.3 8.3 2010 ............................................................... 1.69 1.70 1.72 1.69 8.3 8.3 8.3 8.4
2011 ............................................................... 1.72 1.74 1.76 1.73 8.4 8.5 8.5 8.4 2012 ............................................................... 1.76 1.76 1.77 1.74 8.4 8.4 8.5 8.5 2013 ............................................................... 1.74 1.75 1.75 1.75 8.4 8.4 8.4 8.5 2014 ............................................................... 1.76 1.76 1.77 1.76 8.4 8.4 8.4 8.4 2015 ............................................................... 1.77 1.78 1.78 1.75 8.4 8.3 8.3 8.4 2016 ............................................................... 1.76 1.77 1.78 1.80 8.3 8.2 8.2 8.2 2017 ............................................................... 1.81 – – – 8.2 – – –
Note: The sum of individual items may not equal totals due to rounding. Dashes indicate data are not available.
-104-

Supplemental table 6. Private trade, transportation, and utilities industry workers, by occupational group: employercosts per hours worked for employee compensation and costs as a percentage of total compensation, 2006-2017 --Continued
Service occupations
Compensationcomponent
Cost per hour worked Percent of total compensation
Mar. June Sep. Dec. Mar. June Sep. Dec.
Total compensation 2006 ............................................................... – – – $19.31 – – – 100.0 2007 ............................................................... 19.57 19.25 19.33 19.27 100.0 100.0 100.0 100.0 2008 ............................................................... 19.64 19.85 19.76 19.42 100.0 100.0 100.0 100.0 2009 ............................................................... 19.58 19.71 19.97 20.17 100.0 100.0 100.0 100.0 2010 ............................................................... 20.57 20.58 20.76 20.37 100.0 100.0 100.0 100.0
2011 ............................................................... 20.72 20.92 21.03 22.24 100.0 100.0 100.0 100.0 2012 ............................................................... 22.98 23.13 23.41 23.08 100.0 100.0 100.0 100.0 2013 ............................................................... 23.64 23.54 23.83 16.94 100.0 100.0 100.0 100.0 2014 ............................................................... 17.04 17.11 17.15 16.11 100.0 100.0 100.0 100.0 2015 ............................................................... 16.28 16.35 16.47 16.54 100.0 100.0 100.0 100.0 2016 ............................................................... 16.88 17.15 17.08 17.76 100.0 100.0 100.0 100.0 2017 ............................................................... 17.97 – – – 100.0 – – –
Wages and salaries 2006 ............................................................... – – – 13.22 – – – 68.5 2007 ............................................................... 13.35 13.21 13.30 13.26 68.2 68.6 68.8 68.8 2008 ............................................................... 13.42 13.59 13.60 13.40 68.3 68.4 68.8 69.0 2009 ............................................................... 13.54 13.64 13.79 13.96 69.1 69.2 69.1 69.2 2010 ............................................................... 14.10 14.08 14.19 13.94 68.6 68.4 68.4 68.4
2011 ............................................................... 14.06 14.16 14.28 14.79 67.9 67.7 67.9 66.5 2012 ............................................................... 14.99 15.24 15.37 15.27 65.2 65.9 65.7 66.2 2013 ............................................................... 15.56 15.55 15.70 12.02 65.8 66.1 65.9 71.0 2014 ............................................................... 12.06 12.15 12.22 11.78 70.8 71.0 71.2 73.1 2015 ............................................................... 11.87 11.91 12.00 11.96 72.9 72.8 72.9 72.3 2016 ............................................................... 12.12 12.31 12.33 12.56 71.8 71.8 72.2 70.7 2017 ............................................................... 12.72 – – – 70.8 – – –
Total benefits 2006 ............................................................... – – – 6.09 – – – 31.5 2007 ............................................................... 6.22 6.04 6.03 6.01 31.8 31.4 31.2 31.2 2008 ............................................................... 6.22 6.26 6.16 6.02 31.7 31.6 31.2 31.0 2009 ............................................................... 6.04 6.07 6.18 6.21 30.9 30.8 30.9 30.8 2010 ............................................................... 6.47 6.50 6.57 6.43 31.4 31.6 31.6 31.6
2011 ............................................................... 6.66 6.76 6.75 7.45 32.1 32.3 32.1 33.5 2012 ............................................................... 7.99 7.89 8.04 7.81 34.8 34.1 34.3 33.8 2013 ............................................................... 8.08 7.99 8.13 4.92 34.2 33.9 34.1 29.0 2014 ............................................................... 4.98 4.96 4.93 4.34 29.2 29.0 28.8 26.9 2015 ............................................................... 4.41 4.45 4.47 4.58 27.1 27.2 27.1 27.7 2016 ............................................................... 4.76 4.83 4.74 5.20 28.2 28.2 27.8 29.3 2017 ............................................................... 5.25 – – – 29.2 – – –
Paid leave 2006 ............................................................... – – – 1.33 – – – 6.9 2007 ............................................................... 1.34 1.21 1.16 1.15 6.9 6.3 6.0 6.0 2008 ............................................................... 1.16 1.16 1.14 1.13 5.9 5.9 5.8 5.8 2009 ............................................................... 1.16 1.19 1.21 1.23 5.9 6.0 6.1 6.1 2010 ............................................................... 1.25 1.26 1.28 1.27 6.1 6.1 6.2 6.2
2011 ............................................................... 1.28 1.32 1.30 1.51 6.2 6.3 6.2 6.8 2012 ............................................................... 1.55 1.52 1.54 1.49 6.8 6.6 6.6 6.5 2013 ............................................................... 1.53 1.53 1.54 .80 6.5 6.5 6.5 4.7 2014 ............................................................... .80 .81 .81 .72 4.7 4.7 4.7 4.5 2015 ............................................................... .73 .73 .73 .73 4.5 4.5 4.4 4.4 2016 ............................................................... .74 .76 .75 .78 4.4 4.4 4.4 4.4 2017 ............................................................... .80 – – – 4.5 – – –
Supplemental pay 2006 ............................................................... – – – .29 – – – 1.5 2007 ............................................................... .31 .44 .42 .43 1.6 2.3 2.2 2.2 2008 ............................................................... .48 .44 .44 .42 2.4 2.2 2.2 2.2 2009 ............................................................... .44 .43 .42 .39 2.2 2.2 2.1 2.0 2010 ............................................................... .39 .38 .39 .36 1.9 1.9 1.9 1.8
2011 ............................................................... .39 .40 .38 .39 1.9 1.9 1.8 1.8 2012 ............................................................... .71 .67 .68 .61 3.1 2.9 2.9 2.6 2013 ............................................................... .62 .55 .57 .29 2.6 2.4 2.4 1.7 2014 ............................................................... .29 .29 .29 .27 1.7 1.7 1.7 1.7 2015 ............................................................... .27 .27 .28 .31 1.6 1.7 1.7 1.9
See footnotes at end of table.
-105-
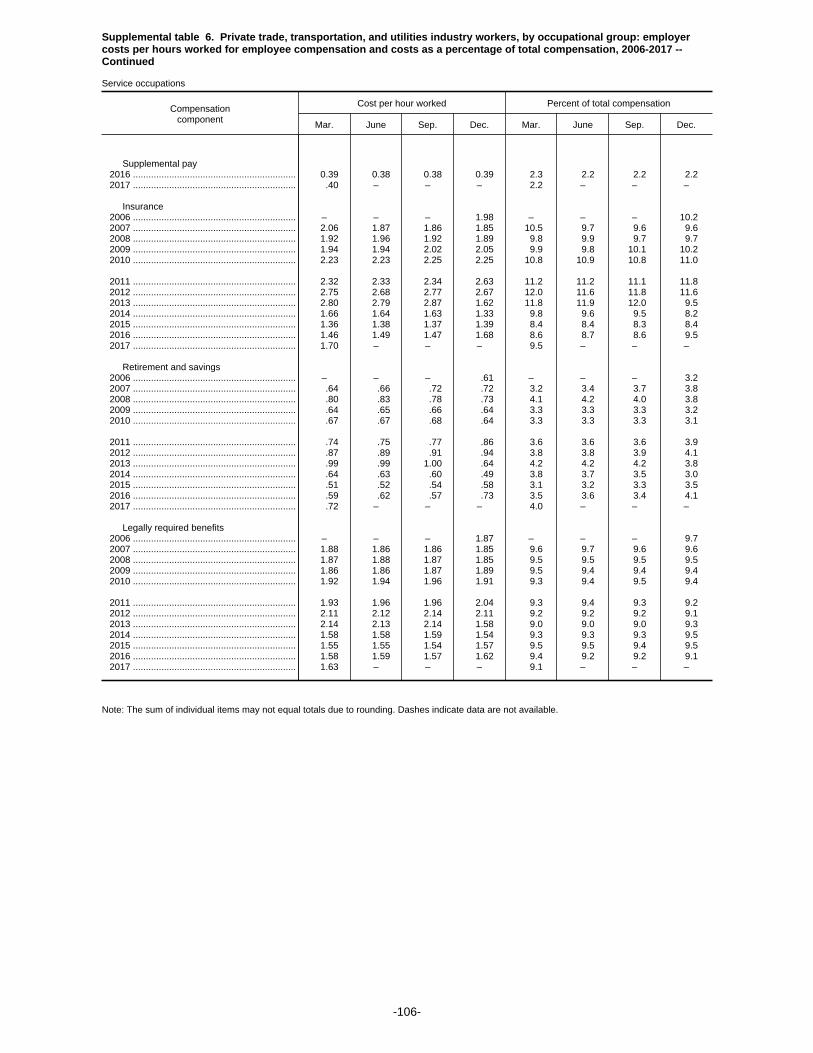
Supplemental table 6. Private trade, transportation, and utilities industry workers, by occupational group: employercosts per hours worked for employee compensation and costs as a percentage of total compensation, 2006-2017 --Continued
Service occupations
Compensationcomponent
Cost per hour worked Percent of total compensation
Mar. June Sep. Dec. Mar. June Sep. Dec.
Supplemental pay 2016 ............................................................... 0.39 0.38 0.38 0.39 2.3 2.2 2.2 2.2 2017 ............................................................... .40 – – – 2.2 – – –
Insurance 2006 ............................................................... – – – 1.98 – – – 10.2 2007 ............................................................... 2.06 1.87 1.86 1.85 10.5 9.7 9.6 9.6 2008 ............................................................... 1.92 1.96 1.92 1.89 9.8 9.9 9.7 9.7 2009 ............................................................... 1.94 1.94 2.02 2.05 9.9 9.8 10.1 10.2 2010 ............................................................... 2.23 2.23 2.25 2.25 10.8 10.9 10.8 11.0
2011 ............................................................... 2.32 2.33 2.34 2.63 11.2 11.2 11.1 11.8 2012 ............................................................... 2.75 2.68 2.77 2.67 12.0 11.6 11.8 11.6 2013 ............................................................... 2.80 2.79 2.87 1.62 11.8 11.9 12.0 9.5 2014 ............................................................... 1.66 1.64 1.63 1.33 9.8 9.6 9.5 8.2 2015 ............................................................... 1.36 1.38 1.37 1.39 8.4 8.4 8.3 8.4 2016 ............................................................... 1.46 1.49 1.47 1.68 8.6 8.7 8.6 9.5 2017 ............................................................... 1.70 – – – 9.5 – – –
Retirement and savings 2006 ............................................................... – – – .61 – – – 3.2 2007 ............................................................... .64 .66 .72 .72 3.2 3.4 3.7 3.8 2008 ............................................................... .80 .83 .78 .73 4.1 4.2 4.0 3.8 2009 ............................................................... .64 .65 .66 .64 3.3 3.3 3.3 3.2 2010 ............................................................... .67 .67 .68 .64 3.3 3.3 3.3 3.1
2011 ............................................................... .74 .75 .77 .86 3.6 3.6 3.6 3.9 2012 ............................................................... .87 .89 .91 .94 3.8 3.8 3.9 4.1 2013 ............................................................... .99 .99 1.00 .64 4.2 4.2 4.2 3.8 2014 ............................................................... .64 .63 .60 .49 3.8 3.7 3.5 3.0 2015 ............................................................... .51 .52 .54 .58 3.1 3.2 3.3 3.5 2016 ............................................................... .59 .62 .57 .73 3.5 3.6 3.4 4.1 2017 ............................................................... .72 – – – 4.0 – – –
Legally required benefits 2006 ............................................................... – – – 1.87 – – – 9.7 2007 ............................................................... 1.88 1.86 1.86 1.85 9.6 9.7 9.6 9.6 2008 ............................................................... 1.87 1.88 1.87 1.85 9.5 9.5 9.5 9.5 2009 ............................................................... 1.86 1.86 1.87 1.89 9.5 9.4 9.4 9.4 2010 ............................................................... 1.92 1.94 1.96 1.91 9.3 9.4 9.5 9.4
2011 ............................................................... 1.93 1.96 1.96 2.04 9.3 9.4 9.3 9.2 2012 ............................................................... 2.11 2.12 2.14 2.11 9.2 9.2 9.2 9.1 2013 ............................................................... 2.14 2.13 2.14 1.58 9.0 9.0 9.0 9.3 2014 ............................................................... 1.58 1.58 1.59 1.54 9.3 9.3 9.3 9.5 2015 ............................................................... 1.55 1.55 1.54 1.57 9.5 9.5 9.4 9.5 2016 ............................................................... 1.58 1.59 1.57 1.62 9.4 9.2 9.2 9.1 2017 ............................................................... 1.63 – – – 9.1 – – –
Note: The sum of individual items may not equal totals due to rounding. Dashes indicate data are not available.
-106-

Supplemental table 6. Private trade, transportation, and utilities industry workers, by occupational group: employercosts per hours worked for employee compensation and costs as a percentage of total compensation, 2006-2017 --Continued
Natural resources, construction, and maintenance occupations
Compensationcomponent
Cost per hour worked Percent of total compensation
Mar. June Sep. Dec. Mar. June Sep. Dec.
Total compensation 2006 ............................................................... – – – $28.50 – – – 100.0 2007 ............................................................... 28.35 28.68 28.98 28.87 100.0 100.0 100.0 100.0 2008 ............................................................... 29.12 29.36 29.56 29.00 100.0 100.0 100.0 100.0 2009 ............................................................... 29.42 29.63 29.96 29.97 100.0 100.0 100.0 100.0 2010 ............................................................... 30.52 30.71 30.66 30.09 100.0 100.0 100.0 100.0
2011 ............................................................... 29.97 30.38 30.75 29.82 100.0 100.0 100.0 100.0 2012 ............................................................... 30.25 30.42 30.50 31.36 100.0 100.0 100.0 100.0 2013 ............................................................... 31.55 31.66 31.84 31.15 100.0 100.0 100.0 100.0 2014 ............................................................... 31.75 31.89 32.31 31.30 100.0 100.0 100.0 100.0 2015 ............................................................... 31.39 31.76 31.91 32.32 100.0 100.0 100.0 100.0 2016 ............................................................... 32.78 32.83 33.23 33.34 100.0 100.0 100.0 100.0 2017 ............................................................... 33.67 – – – 100.0 – – –
Wages and salaries 2006 ............................................................... – – – 19.77 – – – 69.4 2007 ............................................................... 19.85 20.06 20.29 20.17 70.0 69.9 70.0 69.9 2008 ............................................................... 20.31 20.57 20.63 20.08 69.7 70.1 69.8 69.2 2009 ............................................................... 20.35 20.46 20.68 20.78 69.2 69.1 69.0 69.3 2010 ............................................................... 20.99 21.06 21.00 20.81 68.8 68.6 68.5 69.2
2011 ............................................................... 20.77 20.98 21.24 20.72 69.3 69.1 69.1 69.5 2012 ............................................................... 20.96 21.03 21.03 21.46 69.3 69.1 69.0 68.4 2013 ............................................................... 21.59 21.65 21.83 21.42 68.4 68.4 68.5 68.8 2014 ............................................................... 21.76 21.84 22.18 21.45 68.5 68.5 68.6 68.5 2015 ............................................................... 21.50 21.77 21.84 22.03 68.5 68.5 68.4 68.2 2016 ............................................................... 22.32 22.43 22.73 22.80 68.1 68.3 68.4 68.4 2017 ............................................................... 23.01 – – – 68.3 – – –
Total benefits 2006 ............................................................... – – – 8.72 – – – 30.6 2007 ............................................................... 8.50 8.62 8.69 8.70 30.0 30.1 30.0 30.1 2008 ............................................................... 8.82 8.78 8.93 8.92 30.3 29.9 30.2 30.8 2009 ............................................................... 9.07 9.17 9.29 9.19 30.8 30.9 31.0 30.7 2010 ............................................................... 9.53 9.65 9.66 9.28 31.2 31.4 31.5 30.8
2011 ............................................................... 9.20 9.40 9.51 9.09 30.7 30.9 30.9 30.5 2012 ............................................................... 9.30 9.39 9.47 9.89 30.7 30.9 31.0 31.6 2013 ............................................................... 9.97 10.01 10.01 9.72 31.6 31.6 31.5 31.2 2014 ............................................................... 9.99 10.04 10.13 9.85 31.5 31.5 31.4 31.5 2015 ............................................................... 9.90 9.99 10.07 10.29 31.5 31.5 31.6 31.8 2016 ............................................................... 10.47 10.40 10.50 10.54 31.9 31.7 31.6 31.6 2017 ............................................................... 10.67 – – – 31.7 – – –
Paid leave 2006 ............................................................... – – – 1.85 – – – 6.5 2007 ............................................................... 1.87 1.90 1.89 1.89 6.6 6.6 6.5 6.5 2008 ............................................................... 1.89 1.92 1.92 1.86 6.5 6.5 6.5 6.4 2009 ............................................................... 1.90 1.89 1.94 1.91 6.5 6.4 6.5 6.4 2010 ............................................................... 1.95 1.95 1.95 1.88 6.4 6.4 6.4 6.3
2011 ............................................................... 1.92 1.93 1.97 1.95 6.4 6.4 6.4 6.5 2012 ............................................................... 1.98 1.97 1.98 2.08 6.5 6.5 6.5 6.6 2013 ............................................................... 2.08 2.09 2.12 2.02 6.6 6.6 6.7 6.5 2014 ............................................................... 2.07 2.09 2.13 2.04 6.5 6.6 6.6 6.5 2015 ............................................................... 2.04 2.07 2.09 2.08 6.5 6.5 6.5 6.5 2016 ............................................................... 2.12 2.12 2.15 2.15 6.5 6.5 6.5 6.5 2017 ............................................................... 2.19 – – – 6.5 – – –
Supplemental pay 2006 ............................................................... – – – .82 – – – 2.9 2007 ............................................................... .84 .84 .83 .84 3.0 2.9 2.9 2.9 2008 ............................................................... .88 .90 .96 .95 3.0 3.1 3.2 3.3 2009 ............................................................... .94 .99 1.00 .92 3.2 3.3 3.4 3.1 2010 ............................................................... .94 .93 .94 .89 3.1 3.0 3.1 2.9
2011 ............................................................... .86 .89 .89 .86 2.9 2.9 2.9 2.9 2012 ............................................................... .94 .93 .97 .91 3.1 3.1 3.2 2.9 2013 ............................................................... .89 .86 .88 .89 2.8 2.7 2.8 2.8 2014 ............................................................... .92 .92 .93 .88 2.9 2.9 2.9 2.8 2015 ............................................................... .89 .88 .89 .99 2.9 2.8 2.8 3.1
See footnotes at end of table.
-107-
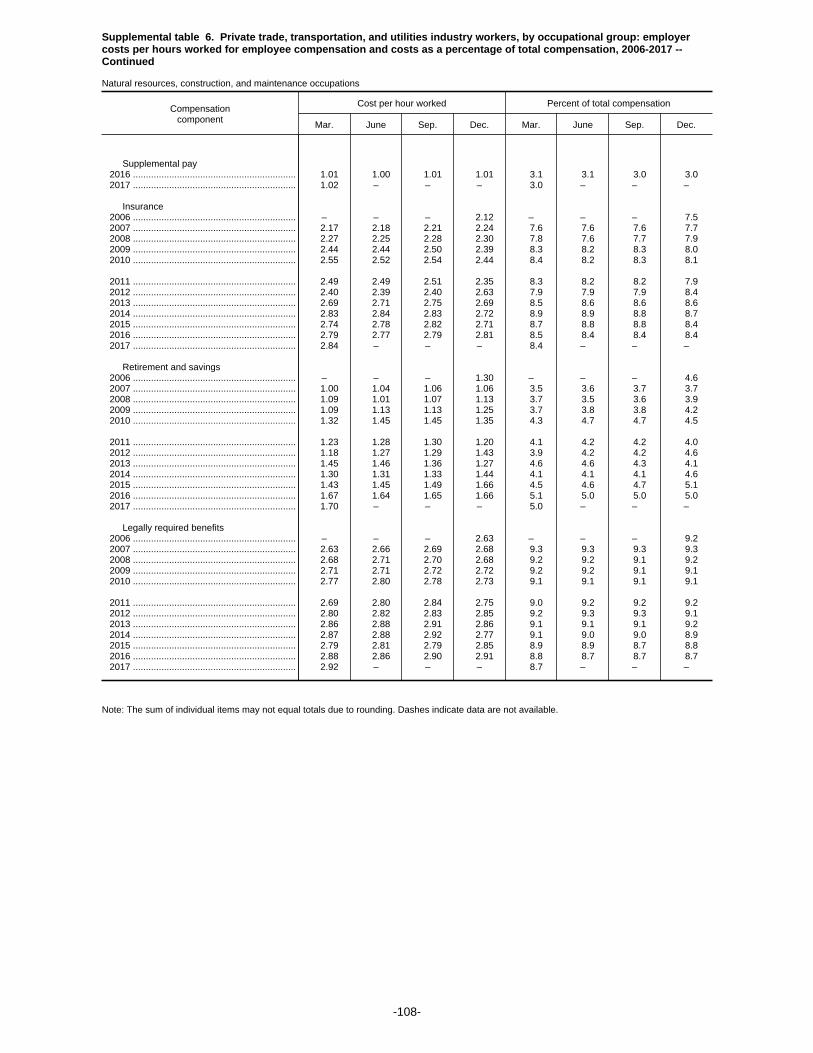
Supplemental table 6. Private trade, transportation, and utilities industry workers, by occupational group: employercosts per hours worked for employee compensation and costs as a percentage of total compensation, 2006-2017 --Continued
Natural resources, construction, and maintenance occupations
Compensationcomponent
Cost per hour worked Percent of total compensation
Mar. June Sep. Dec. Mar. June Sep. Dec.
Supplemental pay 2016 ............................................................... 1.01 1.00 1.01 1.01 3.1 3.1 3.0 3.0 2017 ............................................................... 1.02 – – – 3.0 – – –
Insurance 2006 ............................................................... – – – 2.12 – – – 7.5 2007 ............................................................... 2.17 2.18 2.21 2.24 7.6 7.6 7.6 7.7 2008 ............................................................... 2.27 2.25 2.28 2.30 7.8 7.6 7.7 7.9 2009 ............................................................... 2.44 2.44 2.50 2.39 8.3 8.2 8.3 8.0 2010 ............................................................... 2.55 2.52 2.54 2.44 8.4 8.2 8.3 8.1
2011 ............................................................... 2.49 2.49 2.51 2.35 8.3 8.2 8.2 7.9 2012 ............................................................... 2.40 2.39 2.40 2.63 7.9 7.9 7.9 8.4 2013 ............................................................... 2.69 2.71 2.75 2.69 8.5 8.6 8.6 8.6 2014 ............................................................... 2.83 2.84 2.83 2.72 8.9 8.9 8.8 8.7 2015 ............................................................... 2.74 2.78 2.82 2.71 8.7 8.8 8.8 8.4 2016 ............................................................... 2.79 2.77 2.79 2.81 8.5 8.4 8.4 8.4 2017 ............................................................... 2.84 – – – 8.4 – – –
Retirement and savings 2006 ............................................................... – – – 1.30 – – – 4.6 2007 ............................................................... 1.00 1.04 1.06 1.06 3.5 3.6 3.7 3.7 2008 ............................................................... 1.09 1.01 1.07 1.13 3.7 3.5 3.6 3.9 2009 ............................................................... 1.09 1.13 1.13 1.25 3.7 3.8 3.8 4.2 2010 ............................................................... 1.32 1.45 1.45 1.35 4.3 4.7 4.7 4.5
2011 ............................................................... 1.23 1.28 1.30 1.20 4.1 4.2 4.2 4.0 2012 ............................................................... 1.18 1.27 1.29 1.43 3.9 4.2 4.2 4.6 2013 ............................................................... 1.45 1.46 1.36 1.27 4.6 4.6 4.3 4.1 2014 ............................................................... 1.30 1.31 1.33 1.44 4.1 4.1 4.1 4.6 2015 ............................................................... 1.43 1.45 1.49 1.66 4.5 4.6 4.7 5.1 2016 ............................................................... 1.67 1.64 1.65 1.66 5.1 5.0 5.0 5.0 2017 ............................................................... 1.70 – – – 5.0 – – –
Legally required benefits 2006 ............................................................... – – – 2.63 – – – 9.2 2007 ............................................................... 2.63 2.66 2.69 2.68 9.3 9.3 9.3 9.3 2008 ............................................................... 2.68 2.71 2.70 2.68 9.2 9.2 9.1 9.2 2009 ............................................................... 2.71 2.71 2.72 2.72 9.2 9.2 9.1 9.1 2010 ............................................................... 2.77 2.80 2.78 2.73 9.1 9.1 9.1 9.1
2011 ............................................................... 2.69 2.80 2.84 2.75 9.0 9.2 9.2 9.2 2012 ............................................................... 2.80 2.82 2.83 2.85 9.2 9.3 9.3 9.1 2013 ............................................................... 2.86 2.88 2.91 2.86 9.1 9.1 9.1 9.2 2014 ............................................................... 2.87 2.88 2.92 2.77 9.1 9.0 9.0 8.9 2015 ............................................................... 2.79 2.81 2.79 2.85 8.9 8.9 8.7 8.8 2016 ............................................................... 2.88 2.86 2.90 2.91 8.8 8.7 8.7 8.7 2017 ............................................................... 2.92 – – – 8.7 – – –
Note: The sum of individual items may not equal totals due to rounding. Dashes indicate data are not available.
-108-
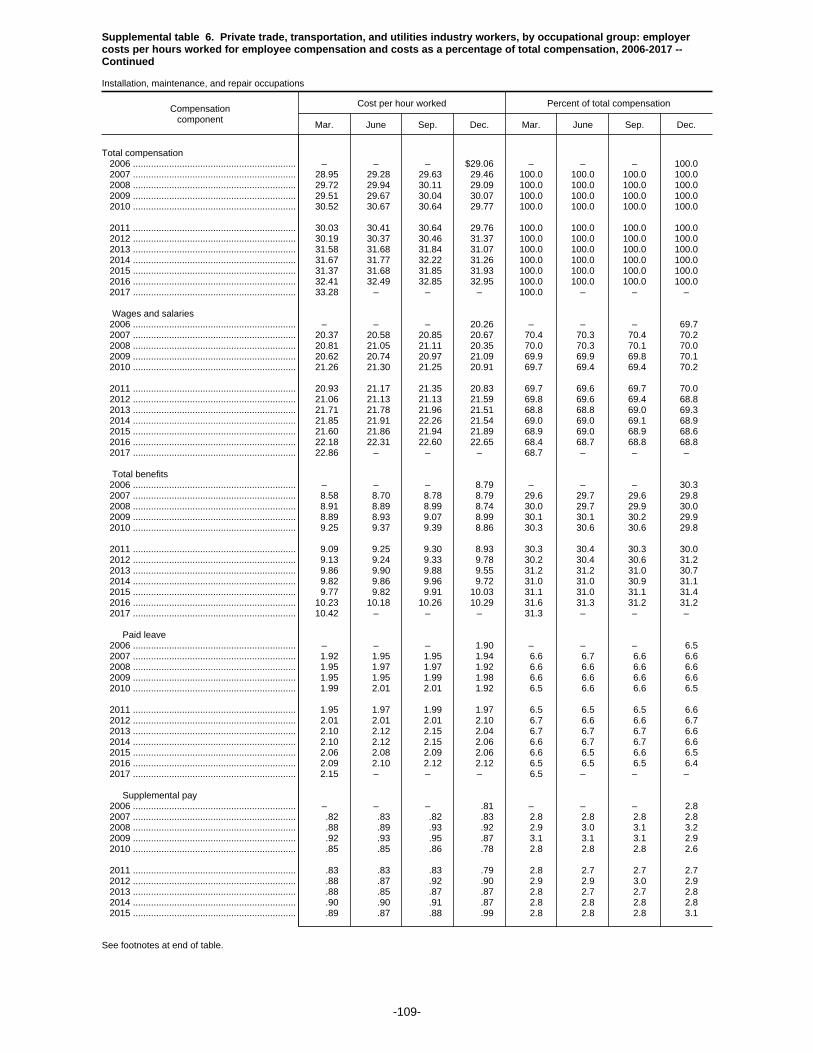
Supplemental table 6. Private trade, transportation, and utilities industry workers, by occupational group: employercosts per hours worked for employee compensation and costs as a percentage of total compensation, 2006-2017 --Continued
Installation, maintenance, and repair occupations
Compensationcomponent
Cost per hour worked Percent of total compensation
Mar. June Sep. Dec. Mar. June Sep. Dec.
Total compensation 2006 ............................................................... – – – $29.06 – – – 100.0 2007 ............................................................... 28.95 29.28 29.63 29.46 100.0 100.0 100.0 100.0 2008 ............................................................... 29.72 29.94 30.11 29.09 100.0 100.0 100.0 100.0 2009 ............................................................... 29.51 29.67 30.04 30.07 100.0 100.0 100.0 100.0 2010 ............................................................... 30.52 30.67 30.64 29.77 100.0 100.0 100.0 100.0
2011 ............................................................... 30.03 30.41 30.64 29.76 100.0 100.0 100.0 100.0 2012 ............................................................... 30.19 30.37 30.46 31.37 100.0 100.0 100.0 100.0 2013 ............................................................... 31.58 31.68 31.84 31.07 100.0 100.0 100.0 100.0 2014 ............................................................... 31.67 31.77 32.22 31.26 100.0 100.0 100.0 100.0 2015 ............................................................... 31.37 31.68 31.85 31.93 100.0 100.0 100.0 100.0 2016 ............................................................... 32.41 32.49 32.85 32.95 100.0 100.0 100.0 100.0 2017 ............................................................... 33.28 – – – 100.0 – – –
Wages and salaries 2006 ............................................................... – – – 20.26 – – – 69.7 2007 ............................................................... 20.37 20.58 20.85 20.67 70.4 70.3 70.4 70.2 2008 ............................................................... 20.81 21.05 21.11 20.35 70.0 70.3 70.1 70.0 2009 ............................................................... 20.62 20.74 20.97 21.09 69.9 69.9 69.8 70.1 2010 ............................................................... 21.26 21.30 21.25 20.91 69.7 69.4 69.4 70.2
2011 ............................................................... 20.93 21.17 21.35 20.83 69.7 69.6 69.7 70.0 2012 ............................................................... 21.06 21.13 21.13 21.59 69.8 69.6 69.4 68.8 2013 ............................................................... 21.71 21.78 21.96 21.51 68.8 68.8 69.0 69.3 2014 ............................................................... 21.85 21.91 22.26 21.54 69.0 69.0 69.1 68.9 2015 ............................................................... 21.60 21.86 21.94 21.89 68.9 69.0 68.9 68.6 2016 ............................................................... 22.18 22.31 22.60 22.65 68.4 68.7 68.8 68.8 2017 ............................................................... 22.86 – – – 68.7 – – –
Total benefits 2006 ............................................................... – – – 8.79 – – – 30.3 2007 ............................................................... 8.58 8.70 8.78 8.79 29.6 29.7 29.6 29.8 2008 ............................................................... 8.91 8.89 8.99 8.74 30.0 29.7 29.9 30.0 2009 ............................................................... 8.89 8.93 9.07 8.99 30.1 30.1 30.2 29.9 2010 ............................................................... 9.25 9.37 9.39 8.86 30.3 30.6 30.6 29.8
2011 ............................................................... 9.09 9.25 9.30 8.93 30.3 30.4 30.3 30.0 2012 ............................................................... 9.13 9.24 9.33 9.78 30.2 30.4 30.6 31.2 2013 ............................................................... 9.86 9.90 9.88 9.55 31.2 31.2 31.0 30.7 2014 ............................................................... 9.82 9.86 9.96 9.72 31.0 31.0 30.9 31.1 2015 ............................................................... 9.77 9.82 9.91 10.03 31.1 31.0 31.1 31.4 2016 ............................................................... 10.23 10.18 10.26 10.29 31.6 31.3 31.2 31.2 2017 ............................................................... 10.42 – – – 31.3 – – –
Paid leave 2006 ............................................................... – – – 1.90 – – – 6.5 2007 ............................................................... 1.92 1.95 1.95 1.94 6.6 6.7 6.6 6.6 2008 ............................................................... 1.95 1.97 1.97 1.92 6.6 6.6 6.6 6.6 2009 ............................................................... 1.95 1.95 1.99 1.98 6.6 6.6 6.6 6.6 2010 ............................................................... 1.99 2.01 2.01 1.92 6.5 6.6 6.6 6.5
2011 ............................................................... 1.95 1.97 1.99 1.97 6.5 6.5 6.5 6.6 2012 ............................................................... 2.01 2.01 2.01 2.10 6.7 6.6 6.6 6.7 2013 ............................................................... 2.10 2.12 2.15 2.04 6.7 6.7 6.7 6.6 2014 ............................................................... 2.10 2.12 2.15 2.06 6.6 6.7 6.7 6.6 2015 ............................................................... 2.06 2.08 2.09 2.06 6.6 6.5 6.6 6.5 2016 ............................................................... 2.09 2.10 2.12 2.12 6.5 6.5 6.5 6.4 2017 ............................................................... 2.15 – – – 6.5 – – –
Supplemental pay 2006 ............................................................... – – – .81 – – – 2.8 2007 ............................................................... .82 .83 .82 .83 2.8 2.8 2.8 2.8 2008 ............................................................... .88 .89 .93 .92 2.9 3.0 3.1 3.2 2009 ............................................................... .92 .93 .95 .87 3.1 3.1 3.1 2.9 2010 ............................................................... .85 .85 .86 .78 2.8 2.8 2.8 2.6
2011 ............................................................... .83 .83 .83 .79 2.8 2.7 2.7 2.7 2012 ............................................................... .88 .87 .92 .90 2.9 2.9 3.0 2.9 2013 ............................................................... .88 .85 .87 .87 2.8 2.7 2.7 2.8 2014 ............................................................... .90 .90 .91 .87 2.8 2.8 2.8 2.8 2015 ............................................................... .89 .87 .88 .99 2.8 2.8 2.8 3.1
See footnotes at end of table.
-109-

Supplemental table 6. Private trade, transportation, and utilities industry workers, by occupational group: employercosts per hours worked for employee compensation and costs as a percentage of total compensation, 2006-2017 --Continued
Installation, maintenance, and repair occupations
Compensationcomponent
Cost per hour worked Percent of total compensation
Mar. June Sep. Dec. Mar. June Sep. Dec.
Supplemental pay 2016 ............................................................... 1.01 1.00 1.01 1.00 3.1 3.1 3.1 3.0 2017 ............................................................... 1.01 – – – 3.0 – – –
Insurance 2006 ............................................................... – – – 2.13 – – – 7.3 2007 ............................................................... 2.17 2.18 2.21 2.24 7.5 7.5 7.5 7.6 2008 ............................................................... 2.28 2.27 2.30 2.24 7.7 7.6 7.6 7.7 2009 ............................................................... 2.33 2.36 2.41 2.37 7.9 8.0 8.0 7.9 2010 ............................................................... 2.44 2.49 2.50 2.40 8.0 8.1 8.2 8.1
2011 ............................................................... 2.50 2.51 2.51 2.35 8.3 8.3 8.2 7.9 2012 ............................................................... 2.40 2.41 2.41 2.60 8.0 7.9 7.9 8.3 2013 ............................................................... 2.67 2.69 2.71 2.65 8.5 8.5 8.5 8.5 2014 ............................................................... 2.79 2.80 2.80 2.67 8.8 8.8 8.7 8.5 2015 ............................................................... 2.69 2.71 2.74 2.63 8.6 8.5 8.6 8.2 2016 ............................................................... 2.71 2.69 2.71 2.73 8.3 8.3 8.3 8.3 2017 ............................................................... 2.77 – – – 8.3 – – –
Retirement and savings 2006 ............................................................... – – – 1.30 – – – 4.5 2007 ............................................................... 1.00 1.05 1.07 1.06 3.5 3.6 3.6 3.6 2008 ............................................................... 1.09 1.02 1.06 1.00 3.7 3.4 3.5 3.4 2009 ............................................................... 1.02 1.02 1.04 1.08 3.4 3.4 3.5 3.6 2010 ............................................................... 1.24 1.28 1.29 1.10 4.1 4.2 4.2 3.7
2011 ............................................................... 1.13 1.17 1.17 1.09 3.8 3.8 3.8 3.7 2012 ............................................................... 1.06 1.16 1.18 1.33 3.5 3.8 3.9 4.3 2013 ............................................................... 1.35 1.36 1.24 1.15 4.3 4.3 3.9 3.7 2014 ............................................................... 1.17 1.18 1.19 1.36 3.7 3.7 3.7 4.4 2015 ............................................................... 1.35 1.37 1.41 1.55 4.3 4.3 4.4 4.8 2016 ............................................................... 1.58 1.55 1.54 1.55 4.9 4.8 4.7 4.7 2017 ............................................................... 1.59 – – – 4.8 – – –
Legally required benefits 2006 ............................................................... – – – 2.65 – – – 9.1 2007 ............................................................... 2.66 2.69 2.73 2.71 9.2 9.2 9.2 9.2 2008 ............................................................... 2.72 2.74 2.74 2.66 9.2 9.1 9.1 9.1 2009 ............................................................... 2.68 2.68 2.68 2.69 9.1 9.0 8.9 8.9 2010 ............................................................... 2.72 2.75 2.73 2.66 8.9 9.0 8.9 8.9
2011 ............................................................... 2.68 2.76 2.79 2.73 8.9 9.1 9.1 9.2 2012 ............................................................... 2.77 2.80 2.81 2.85 9.2 9.2 9.2 9.1 2013 ............................................................... 2.87 2.88 2.91 2.84 9.1 9.1 9.2 9.2 2014 ............................................................... 2.86 2.87 2.90 2.76 9.0 9.0 9.0 8.8 2015 ............................................................... 2.78 2.80 2.78 2.82 8.9 8.8 8.7 8.8 2016 ............................................................... 2.85 2.84 2.87 2.89 8.8 8.7 8.7 8.8 2017 ............................................................... 2.89 – – – 8.7 – – –
Note: The sum of individual items may not equal totals due to rounding. Dashes indicate data are not available.
-110-

Supplemental table 6. Private trade, transportation, and utilities industry workers, by occupational group: employercosts per hours worked for employee compensation and costs as a percentage of total compensation, 2006-2017 --Continued
Production, transportation, and material moving occupations
Compensationcomponent
Cost per hour worked Percent of total compensation
Mar. June Sep. Dec. Mar. June Sep. Dec.
Total compensation 2006 ............................................................... – – – $23.25 – – – 100.0 2007 ............................................................... 23.35 23.92 24.09 23.97 100.0 100.0 100.0 100.0 2008 ............................................................... 24.42 24.51 24.71 24.13 100.0 100.0 100.0 100.0 2009 ............................................................... 24.50 24.75 25.08 25.09 100.0 100.0 100.0 100.0 2010 ............................................................... 25.46 25.61 25.90 24.91 100.0 100.0 100.0 100.0
2011 ............................................................... 25.09 25.31 25.48 24.92 100.0 100.0 100.0 100.0 2012 ............................................................... 25.21 25.34 25.65 26.11 100.0 100.0 100.0 100.0 2013 ............................................................... 26.37 26.30 26.60 27.99 100.0 100.0 100.0 100.0 2014 ............................................................... 28.16 28.16 28.86 30.33 100.0 100.0 100.0 100.0 2015 ............................................................... 30.70 30.70 31.11 30.42 100.0 100.0 100.0 100.0 2016 ............................................................... 30.75 30.82 30.97 31.44 100.0 100.0 100.0 100.0 2017 ............................................................... 31.86 – – – 100.0 – – –
Wages and salaries 2006 ............................................................... – – – 15.59 – – – 67.0 2007 ............................................................... 15.67 15.99 16.07 16.05 67.1 66.8 66.7 66.9 2008 ............................................................... 16.30 16.40 16.53 16.23 66.8 66.9 66.9 67.2 2009 ............................................................... 16.43 16.59 16.80 16.82 67.1 67.0 67.0 67.0 2010 ............................................................... 16.96 17.03 17.23 16.63 66.6 66.5 66.5 66.7
2011 ............................................................... 16.67 16.75 16.86 16.69 66.4 66.2 66.2 67.0 2012 ............................................................... 16.93 16.98 17.20 17.44 67.1 67.0 67.1 66.8 2013 ............................................................... 17.60 17.53 17.73 18.32 66.7 66.7 66.6 65.5 2014 ............................................................... 18.42 18.43 18.87 19.76 65.4 65.4 65.4 65.2 2015 ............................................................... 19.97 19.95 20.20 19.70 65.0 65.0 64.9 64.8 2016 ............................................................... 19.94 20.04 20.16 20.53 64.9 65.0 65.1 65.3 2017 ............................................................... 20.83 – – – 65.4 – – –
Total benefits 2006 ............................................................... – – – 7.66 – – – 33.0 2007 ............................................................... 7.68 7.93 8.02 7.93 32.9 33.2 33.3 33.1 2008 ............................................................... 8.11 8.11 8.18 7.90 33.2 33.1 33.1 32.8 2009 ............................................................... 8.07 8.16 8.27 8.27 32.9 33.0 33.0 33.0 2010 ............................................................... 8.50 8.58 8.67 8.28 33.4 33.5 33.5 33.3
2011 ............................................................... 8.42 8.57 8.61 8.23 33.6 33.8 33.8 33.0 2012 ............................................................... 8.29 8.36 8.45 8.67 32.9 33.0 32.9 33.2 2013 ............................................................... 8.77 8.76 8.87 9.67 33.3 33.3 33.4 34.5 2014 ............................................................... 9.75 9.73 9.98 10.57 34.6 34.6 34.6 34.8 2015 ............................................................... 10.73 10.75 10.90 10.72 35.0 35.0 35.1 35.2 2016 ............................................................... 10.81 10.78 10.81 10.91 35.1 35.0 34.9 34.7 2017 ............................................................... 11.03 – – – 34.6 – – –
Paid leave 2006 ............................................................... – – – 1.41 – – – 6.1 2007 ............................................................... 1.42 1.45 1.43 1.42 6.1 6.1 6.0 5.9 2008 ............................................................... 1.43 1.43 1.44 1.42 5.8 5.8 5.8 5.9 2009 ............................................................... 1.46 1.47 1.50 1.48 5.9 6.0 6.0 5.9 2010 ............................................................... 1.52 1.53 1.55 1.47 6.0 6.0 6.0 5.9
2011 ............................................................... 1.47 1.46 1.46 1.44 5.8 5.8 5.8 5.8 2012 ............................................................... 1.46 1.47 1.47 1.54 5.8 5.8 5.7 5.9 2013 ............................................................... 1.56 1.55 1.58 1.74 5.9 5.9 5.9 6.2 2014 ............................................................... 1.76 1.75 1.85 1.98 6.2 6.2 6.4 6.5 2015 ............................................................... 2.01 1.99 2.03 1.93 6.5 6.5 6.5 6.3 2016 ............................................................... 1.96 1.96 1.97 2.01 6.4 6.3 6.4 6.4 2017 ............................................................... 2.05 – – – 6.4 – – –
Supplemental pay 2006 ............................................................... – – – .64 – – – 2.8 2007 ............................................................... .65 .72 .73 .67 2.8 3.0 3.0 2.8 2008 ............................................................... .74 .72 .76 .73 3.0 3.0 3.1 3.0 2009 ............................................................... .72 .73 .73 .72 2.9 3.0 2.9 2.9 2010 ............................................................... .68 .68 .68 .67 2.7 2.6 2.6 2.7
2011 ............................................................... .72 .74 .74 .73 2.9 2.9 2.9 2.9 2012 ............................................................... .74 .74 .74 .74 2.9 2.9 2.9 2.8 2013 ............................................................... .75 .76 .75 .86 2.8 2.9 2.8 3.1 2014 ............................................................... .86 .86 .87 .96 3.1 3.0 3.0 3.2 2015 ............................................................... .97 .93 .94 .93 3.2 3.0 3.0 3.0
See footnotes at end of table.
-111-
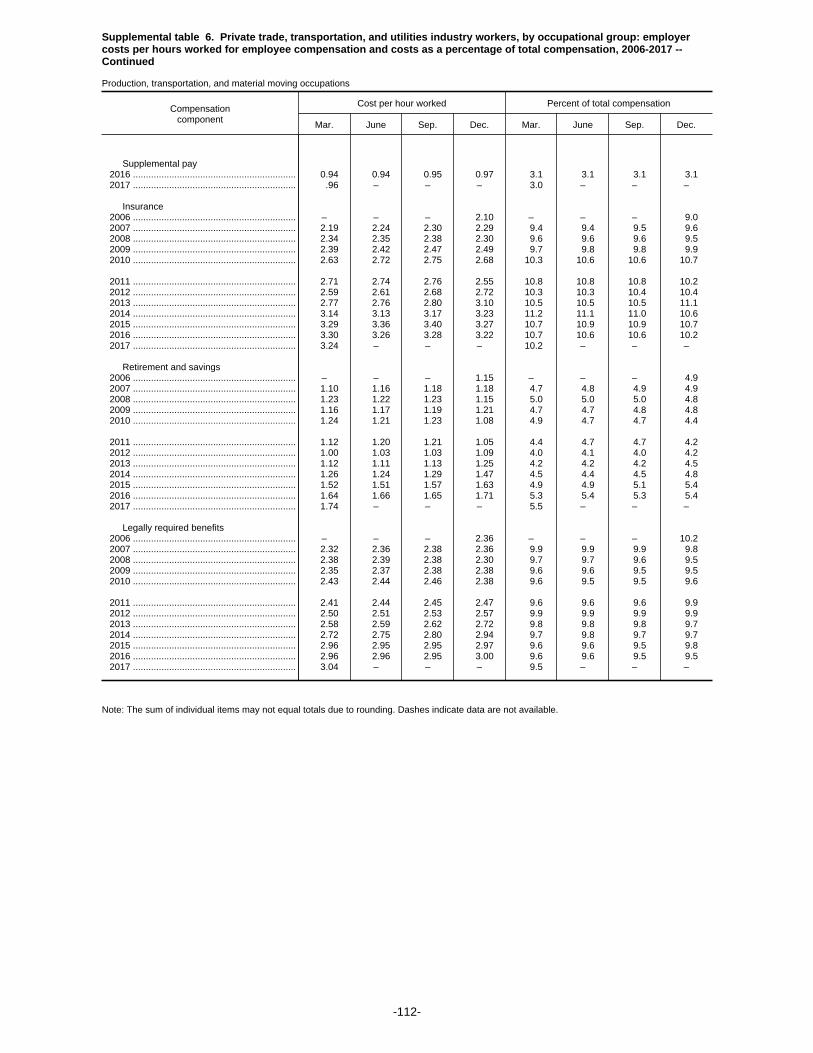
Supplemental table 6. Private trade, transportation, and utilities industry workers, by occupational group: employercosts per hours worked for employee compensation and costs as a percentage of total compensation, 2006-2017 --Continued
Production, transportation, and material moving occupations
Compensationcomponent
Cost per hour worked Percent of total compensation
Mar. June Sep. Dec. Mar. June Sep. Dec.
Supplemental pay 2016 ............................................................... 0.94 0.94 0.95 0.97 3.1 3.1 3.1 3.1 2017 ............................................................... .96 – – – 3.0 – – –
Insurance 2006 ............................................................... – – – 2.10 – – – 9.0 2007 ............................................................... 2.19 2.24 2.30 2.29 9.4 9.4 9.5 9.6 2008 ............................................................... 2.34 2.35 2.38 2.30 9.6 9.6 9.6 9.5 2009 ............................................................... 2.39 2.42 2.47 2.49 9.7 9.8 9.8 9.9 2010 ............................................................... 2.63 2.72 2.75 2.68 10.3 10.6 10.6 10.7
2011 ............................................................... 2.71 2.74 2.76 2.55 10.8 10.8 10.8 10.2 2012 ............................................................... 2.59 2.61 2.68 2.72 10.3 10.3 10.4 10.4 2013 ............................................................... 2.77 2.76 2.80 3.10 10.5 10.5 10.5 11.1 2014 ............................................................... 3.14 3.13 3.17 3.23 11.2 11.1 11.0 10.6 2015 ............................................................... 3.29 3.36 3.40 3.27 10.7 10.9 10.9 10.7 2016 ............................................................... 3.30 3.26 3.28 3.22 10.7 10.6 10.6 10.2 2017 ............................................................... 3.24 – – – 10.2 – – –
Retirement and savings 2006 ............................................................... – – – 1.15 – – – 4.9 2007 ............................................................... 1.10 1.16 1.18 1.18 4.7 4.8 4.9 4.9 2008 ............................................................... 1.23 1.22 1.23 1.15 5.0 5.0 5.0 4.8 2009 ............................................................... 1.16 1.17 1.19 1.21 4.7 4.7 4.8 4.8 2010 ............................................................... 1.24 1.21 1.23 1.08 4.9 4.7 4.7 4.4
2011 ............................................................... 1.12 1.20 1.21 1.05 4.4 4.7 4.7 4.2 2012 ............................................................... 1.00 1.03 1.03 1.09 4.0 4.1 4.0 4.2 2013 ............................................................... 1.12 1.11 1.13 1.25 4.2 4.2 4.2 4.5 2014 ............................................................... 1.26 1.24 1.29 1.47 4.5 4.4 4.5 4.8 2015 ............................................................... 1.52 1.51 1.57 1.63 4.9 4.9 5.1 5.4 2016 ............................................................... 1.64 1.66 1.65 1.71 5.3 5.4 5.3 5.4 2017 ............................................................... 1.74 – – – 5.5 – – –
Legally required benefits 2006 ............................................................... – – – 2.36 – – – 10.2 2007 ............................................................... 2.32 2.36 2.38 2.36 9.9 9.9 9.9 9.8 2008 ............................................................... 2.38 2.39 2.38 2.30 9.7 9.7 9.6 9.5 2009 ............................................................... 2.35 2.37 2.38 2.38 9.6 9.6 9.5 9.5 2010 ............................................................... 2.43 2.44 2.46 2.38 9.6 9.5 9.5 9.6
2011 ............................................................... 2.41 2.44 2.45 2.47 9.6 9.6 9.6 9.9 2012 ............................................................... 2.50 2.51 2.53 2.57 9.9 9.9 9.9 9.9 2013 ............................................................... 2.58 2.59 2.62 2.72 9.8 9.8 9.8 9.7 2014 ............................................................... 2.72 2.75 2.80 2.94 9.7 9.8 9.7 9.7 2015 ............................................................... 2.96 2.95 2.95 2.97 9.6 9.6 9.5 9.8 2016 ............................................................... 2.96 2.96 2.95 3.00 9.6 9.6 9.5 9.5 2017 ............................................................... 3.04 – – – 9.5 – – –
Note: The sum of individual items may not equal totals due to rounding. Dashes indicate data are not available.
-112-
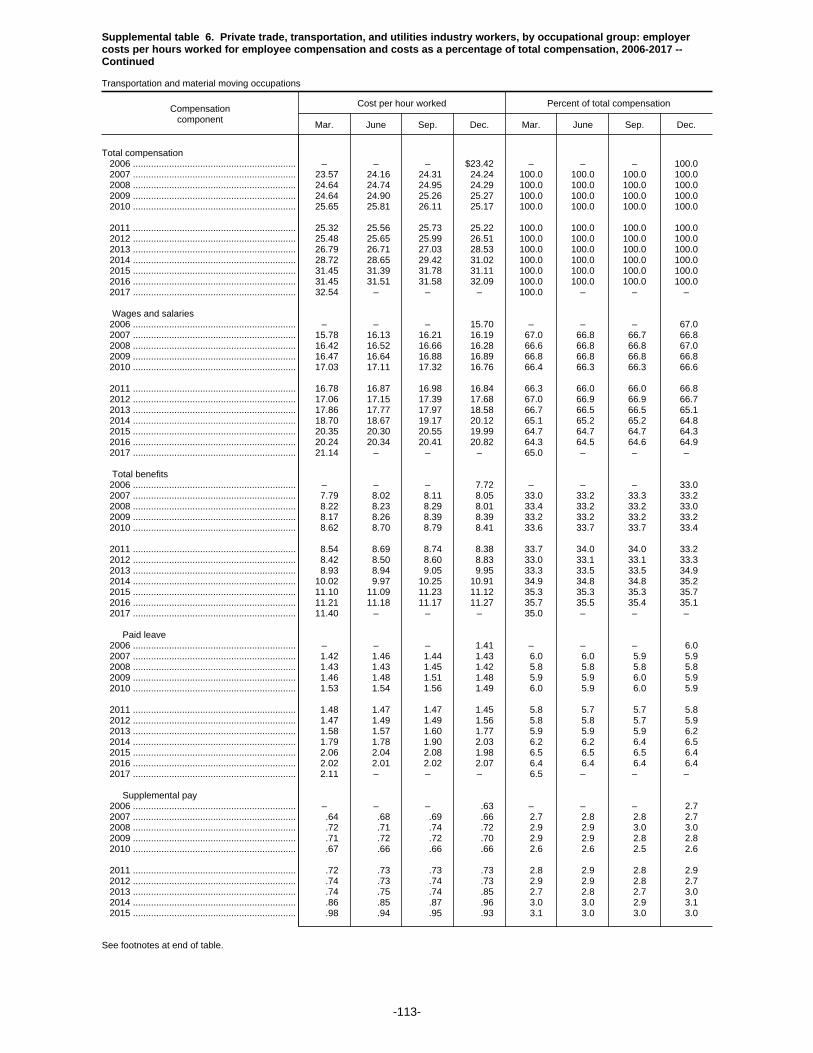
Supplemental table 6. Private trade, transportation, and utilities industry workers, by occupational group: employercosts per hours worked for employee compensation and costs as a percentage of total compensation, 2006-2017 --Continued
Transportation and material moving occupations
Compensationcomponent
Cost per hour worked Percent of total compensation
Mar. June Sep. Dec. Mar. June Sep. Dec.
Total compensation 2006 ............................................................... – – – $23.42 – – – 100.0 2007 ............................................................... 23.57 24.16 24.31 24.24 100.0 100.0 100.0 100.0 2008 ............................................................... 24.64 24.74 24.95 24.29 100.0 100.0 100.0 100.0 2009 ............................................................... 24.64 24.90 25.26 25.27 100.0 100.0 100.0 100.0 2010 ............................................................... 25.65 25.81 26.11 25.17 100.0 100.0 100.0 100.0
2011 ............................................................... 25.32 25.56 25.73 25.22 100.0 100.0 100.0 100.0 2012 ............................................................... 25.48 25.65 25.99 26.51 100.0 100.0 100.0 100.0 2013 ............................................................... 26.79 26.71 27.03 28.53 100.0 100.0 100.0 100.0 2014 ............................................................... 28.72 28.65 29.42 31.02 100.0 100.0 100.0 100.0 2015 ............................................................... 31.45 31.39 31.78 31.11 100.0 100.0 100.0 100.0 2016 ............................................................... 31.45 31.51 31.58 32.09 100.0 100.0 100.0 100.0 2017 ............................................................... 32.54 – – – 100.0 – – –
Wages and salaries 2006 ............................................................... – – – 15.70 – – – 67.0 2007 ............................................................... 15.78 16.13 16.21 16.19 67.0 66.8 66.7 66.8 2008 ............................................................... 16.42 16.52 16.66 16.28 66.6 66.8 66.8 67.0 2009 ............................................................... 16.47 16.64 16.88 16.89 66.8 66.8 66.8 66.8 2010 ............................................................... 17.03 17.11 17.32 16.76 66.4 66.3 66.3 66.6
2011 ............................................................... 16.78 16.87 16.98 16.84 66.3 66.0 66.0 66.8 2012 ............................................................... 17.06 17.15 17.39 17.68 67.0 66.9 66.9 66.7 2013 ............................................................... 17.86 17.77 17.97 18.58 66.7 66.5 66.5 65.1 2014 ............................................................... 18.70 18.67 19.17 20.12 65.1 65.2 65.2 64.8 2015 ............................................................... 20.35 20.30 20.55 19.99 64.7 64.7 64.7 64.3 2016 ............................................................... 20.24 20.34 20.41 20.82 64.3 64.5 64.6 64.9 2017 ............................................................... 21.14 – – – 65.0 – – –
Total benefits 2006 ............................................................... – – – 7.72 – – – 33.0 2007 ............................................................... 7.79 8.02 8.11 8.05 33.0 33.2 33.3 33.2 2008 ............................................................... 8.22 8.23 8.29 8.01 33.4 33.2 33.2 33.0 2009 ............................................................... 8.17 8.26 8.39 8.39 33.2 33.2 33.2 33.2 2010 ............................................................... 8.62 8.70 8.79 8.41 33.6 33.7 33.7 33.4
2011 ............................................................... 8.54 8.69 8.74 8.38 33.7 34.0 34.0 33.2 2012 ............................................................... 8.42 8.50 8.60 8.83 33.0 33.1 33.1 33.3 2013 ............................................................... 8.93 8.94 9.05 9.95 33.3 33.5 33.5 34.9 2014 ............................................................... 10.02 9.97 10.25 10.91 34.9 34.8 34.8 35.2 2015 ............................................................... 11.10 11.09 11.23 11.12 35.3 35.3 35.3 35.7 2016 ............................................................... 11.21 11.18 11.17 11.27 35.7 35.5 35.4 35.1 2017 ............................................................... 11.40 – – – 35.0 – – –
Paid leave 2006 ............................................................... – – – 1.41 – – – 6.0 2007 ............................................................... 1.42 1.46 1.44 1.43 6.0 6.0 5.9 5.9 2008 ............................................................... 1.43 1.43 1.45 1.42 5.8 5.8 5.8 5.8 2009 ............................................................... 1.46 1.48 1.51 1.48 5.9 5.9 6.0 5.9 2010 ............................................................... 1.53 1.54 1.56 1.49 6.0 5.9 6.0 5.9
2011 ............................................................... 1.48 1.47 1.47 1.45 5.8 5.7 5.7 5.8 2012 ............................................................... 1.47 1.49 1.49 1.56 5.8 5.8 5.7 5.9 2013 ............................................................... 1.58 1.57 1.60 1.77 5.9 5.9 5.9 6.2 2014 ............................................................... 1.79 1.78 1.90 2.03 6.2 6.2 6.4 6.5 2015 ............................................................... 2.06 2.04 2.08 1.98 6.5 6.5 6.5 6.4 2016 ............................................................... 2.02 2.01 2.02 2.07 6.4 6.4 6.4 6.4 2017 ............................................................... 2.11 – – – 6.5 – – –
Supplemental pay 2006 ............................................................... – – – .63 – – – 2.7 2007 ............................................................... .64 .68 .69 .66 2.7 2.8 2.8 2.7 2008 ............................................................... .72 .71 .74 .72 2.9 2.9 3.0 3.0 2009 ............................................................... .71 .72 .72 .70 2.9 2.9 2.8 2.8 2010 ............................................................... .67 .66 .66 .66 2.6 2.6 2.5 2.6
2011 ............................................................... .72 .73 .73 .73 2.8 2.9 2.8 2.9 2012 ............................................................... .74 .73 .74 .73 2.9 2.9 2.8 2.7 2013 ............................................................... .74 .75 .74 .85 2.7 2.8 2.7 3.0 2014 ............................................................... .86 .85 .87 .96 3.0 3.0 2.9 3.1 2015 ............................................................... .98 .94 .95 .93 3.1 3.0 3.0 3.0
See footnotes at end of table.
-113-
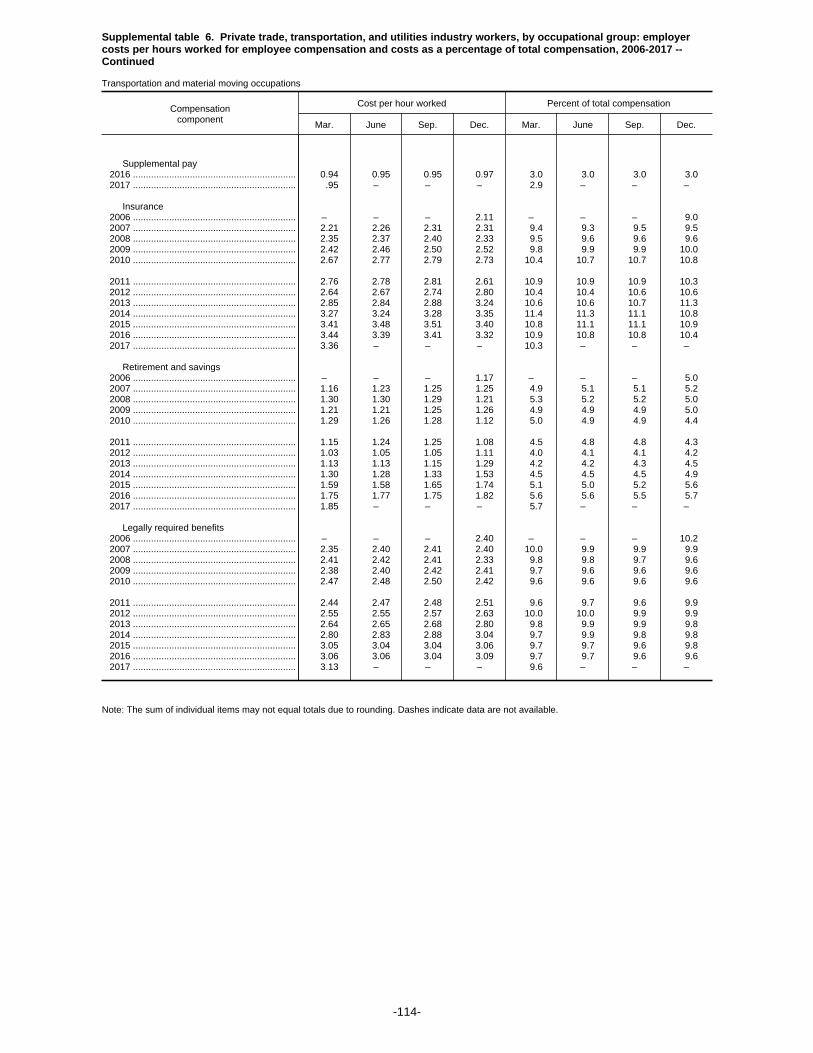
Supplemental table 6. Private trade, transportation, and utilities industry workers, by occupational group: employercosts per hours worked for employee compensation and costs as a percentage of total compensation, 2006-2017 --Continued
Transportation and material moving occupations
Compensationcomponent
Cost per hour worked Percent of total compensation
Mar. June Sep. Dec. Mar. June Sep. Dec.
Supplemental pay 2016 ............................................................... 0.94 0.95 0.95 0.97 3.0 3.0 3.0 3.0 2017 ............................................................... .95 – – – 2.9 – – –
Insurance 2006 ............................................................... – – – 2.11 – – – 9.0 2007 ............................................................... 2.21 2.26 2.31 2.31 9.4 9.3 9.5 9.5 2008 ............................................................... 2.35 2.37 2.40 2.33 9.5 9.6 9.6 9.6 2009 ............................................................... 2.42 2.46 2.50 2.52 9.8 9.9 9.9 10.0 2010 ............................................................... 2.67 2.77 2.79 2.73 10.4 10.7 10.7 10.8
2011 ............................................................... 2.76 2.78 2.81 2.61 10.9 10.9 10.9 10.3 2012 ............................................................... 2.64 2.67 2.74 2.80 10.4 10.4 10.6 10.6 2013 ............................................................... 2.85 2.84 2.88 3.24 10.6 10.6 10.7 11.3 2014 ............................................................... 3.27 3.24 3.28 3.35 11.4 11.3 11.1 10.8 2015 ............................................................... 3.41 3.48 3.51 3.40 10.8 11.1 11.1 10.9 2016 ............................................................... 3.44 3.39 3.41 3.32 10.9 10.8 10.8 10.4 2017 ............................................................... 3.36 – – – 10.3 – – –
Retirement and savings 2006 ............................................................... – – – 1.17 – – – 5.0 2007 ............................................................... 1.16 1.23 1.25 1.25 4.9 5.1 5.1 5.2 2008 ............................................................... 1.30 1.30 1.29 1.21 5.3 5.2 5.2 5.0 2009 ............................................................... 1.21 1.21 1.25 1.26 4.9 4.9 4.9 5.0 2010 ............................................................... 1.29 1.26 1.28 1.12 5.0 4.9 4.9 4.4
2011 ............................................................... 1.15 1.24 1.25 1.08 4.5 4.8 4.8 4.3 2012 ............................................................... 1.03 1.05 1.05 1.11 4.0 4.1 4.1 4.2 2013 ............................................................... 1.13 1.13 1.15 1.29 4.2 4.2 4.3 4.5 2014 ............................................................... 1.30 1.28 1.33 1.53 4.5 4.5 4.5 4.9 2015 ............................................................... 1.59 1.58 1.65 1.74 5.1 5.0 5.2 5.6 2016 ............................................................... 1.75 1.77 1.75 1.82 5.6 5.6 5.5 5.7 2017 ............................................................... 1.85 – – – 5.7 – – –
Legally required benefits 2006 ............................................................... – – – 2.40 – – – 10.2 2007 ............................................................... 2.35 2.40 2.41 2.40 10.0 9.9 9.9 9.9 2008 ............................................................... 2.41 2.42 2.41 2.33 9.8 9.8 9.7 9.6 2009 ............................................................... 2.38 2.40 2.42 2.41 9.7 9.6 9.6 9.6 2010 ............................................................... 2.47 2.48 2.50 2.42 9.6 9.6 9.6 9.6
2011 ............................................................... 2.44 2.47 2.48 2.51 9.6 9.7 9.6 9.9 2012 ............................................................... 2.55 2.55 2.57 2.63 10.0 10.0 9.9 9.9 2013 ............................................................... 2.64 2.65 2.68 2.80 9.8 9.9 9.9 9.8 2014 ............................................................... 2.80 2.83 2.88 3.04 9.7 9.9 9.8 9.8 2015 ............................................................... 3.05 3.04 3.04 3.06 9.7 9.7 9.6 9.8 2016 ............................................................... 3.06 3.06 3.04 3.09 9.7 9.7 9.6 9.6 2017 ............................................................... 3.13 – – – 9.6 – – –
Note: The sum of individual items may not equal totals due to rounding. Dashes indicate data are not available.
-114-
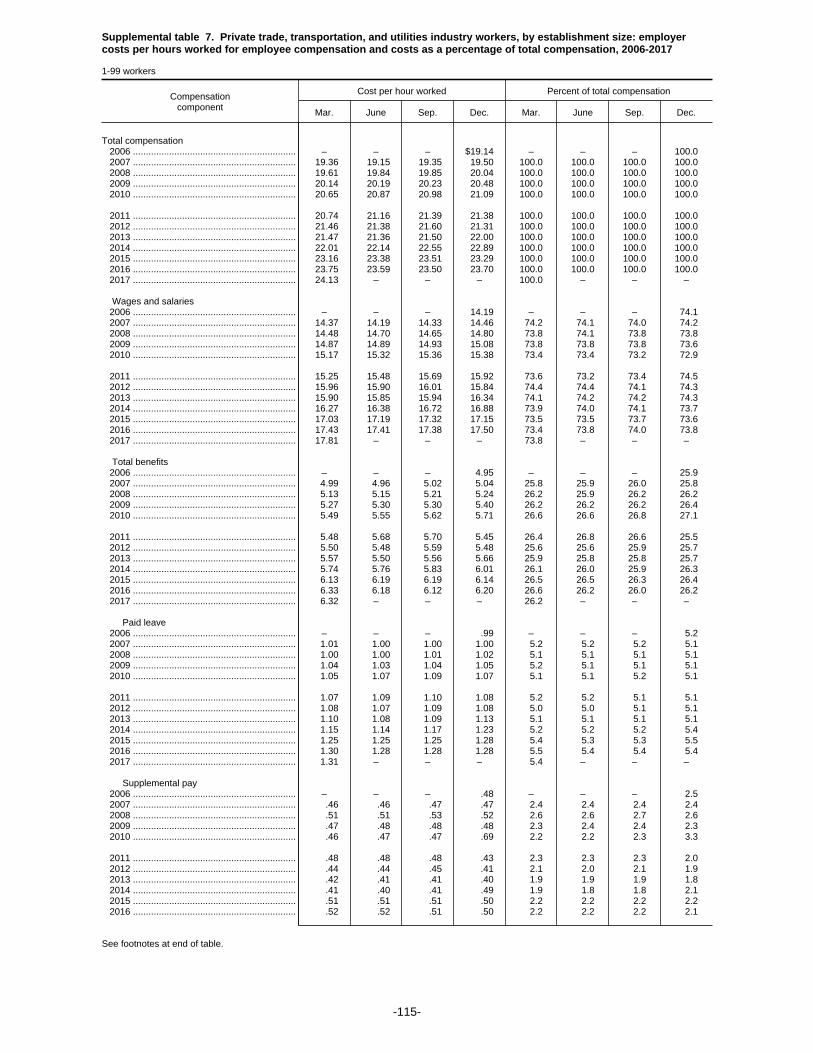
Supplemental table 7. Private trade, transportation, and utilities industry workers, by establishment size: employercosts per hours worked for employee compensation and costs as a percentage of total compensation, 2006-2017
1-99 workers
Compensationcomponent
Cost per hour worked Percent of total compensation
Mar. June Sep. Dec. Mar. June Sep. Dec.
Total compensation 2006 ............................................................... – – – $19.14 – – – 100.0 2007 ............................................................... 19.36 19.15 19.35 19.50 100.0 100.0 100.0 100.0 2008 ............................................................... 19.61 19.84 19.85 20.04 100.0 100.0 100.0 100.0 2009 ............................................................... 20.14 20.19 20.23 20.48 100.0 100.0 100.0 100.0 2010 ............................................................... 20.65 20.87 20.98 21.09 100.0 100.0 100.0 100.0
2011 ............................................................... 20.74 21.16 21.39 21.38 100.0 100.0 100.0 100.0 2012 ............................................................... 21.46 21.38 21.60 21.31 100.0 100.0 100.0 100.0 2013 ............................................................... 21.47 21.36 21.50 22.00 100.0 100.0 100.0 100.0 2014 ............................................................... 22.01 22.14 22.55 22.89 100.0 100.0 100.0 100.0 2015 ............................................................... 23.16 23.38 23.51 23.29 100.0 100.0 100.0 100.0 2016 ............................................................... 23.75 23.59 23.50 23.70 100.0 100.0 100.0 100.0 2017 ............................................................... 24.13 – – – 100.0 – – –
Wages and salaries 2006 ............................................................... – – – 14.19 – – – 74.1 2007 ............................................................... 14.37 14.19 14.33 14.46 74.2 74.1 74.0 74.2 2008 ............................................................... 14.48 14.70 14.65 14.80 73.8 74.1 73.8 73.8 2009 ............................................................... 14.87 14.89 14.93 15.08 73.8 73.8 73.8 73.6 2010 ............................................................... 15.17 15.32 15.36 15.38 73.4 73.4 73.2 72.9
2011 ............................................................... 15.25 15.48 15.69 15.92 73.6 73.2 73.4 74.5 2012 ............................................................... 15.96 15.90 16.01 15.84 74.4 74.4 74.1 74.3 2013 ............................................................... 15.90 15.85 15.94 16.34 74.1 74.2 74.2 74.3 2014 ............................................................... 16.27 16.38 16.72 16.88 73.9 74.0 74.1 73.7 2015 ............................................................... 17.03 17.19 17.32 17.15 73.5 73.5 73.7 73.6 2016 ............................................................... 17.43 17.41 17.38 17.50 73.4 73.8 74.0 73.8 2017 ............................................................... 17.81 – – – 73.8 – – –
Total benefits 2006 ............................................................... – – – 4.95 – – – 25.9 2007 ............................................................... 4.99 4.96 5.02 5.04 25.8 25.9 26.0 25.8 2008 ............................................................... 5.13 5.15 5.21 5.24 26.2 25.9 26.2 26.2 2009 ............................................................... 5.27 5.30 5.30 5.40 26.2 26.2 26.2 26.4 2010 ............................................................... 5.49 5.55 5.62 5.71 26.6 26.6 26.8 27.1
2011 ............................................................... 5.48 5.68 5.70 5.45 26.4 26.8 26.6 25.5 2012 ............................................................... 5.50 5.48 5.59 5.48 25.6 25.6 25.9 25.7 2013 ............................................................... 5.57 5.50 5.56 5.66 25.9 25.8 25.8 25.7 2014 ............................................................... 5.74 5.76 5.83 6.01 26.1 26.0 25.9 26.3 2015 ............................................................... 6.13 6.19 6.19 6.14 26.5 26.5 26.3 26.4 2016 ............................................................... 6.33 6.18 6.12 6.20 26.6 26.2 26.0 26.2 2017 ............................................................... 6.32 – – – 26.2 – – –
Paid leave 2006 ............................................................... – – – .99 – – – 5.2 2007 ............................................................... 1.01 1.00 1.00 1.00 5.2 5.2 5.2 5.1 2008 ............................................................... 1.00 1.00 1.01 1.02 5.1 5.1 5.1 5.1 2009 ............................................................... 1.04 1.03 1.04 1.05 5.2 5.1 5.1 5.1 2010 ............................................................... 1.05 1.07 1.09 1.07 5.1 5.1 5.2 5.1
2011 ............................................................... 1.07 1.09 1.10 1.08 5.2 5.2 5.1 5.1 2012 ............................................................... 1.08 1.07 1.09 1.08 5.0 5.0 5.1 5.1 2013 ............................................................... 1.10 1.08 1.09 1.13 5.1 5.1 5.1 5.1 2014 ............................................................... 1.15 1.14 1.17 1.23 5.2 5.2 5.2 5.4 2015 ............................................................... 1.25 1.25 1.25 1.28 5.4 5.3 5.3 5.5 2016 ............................................................... 1.30 1.28 1.28 1.28 5.5 5.4 5.4 5.4 2017 ............................................................... 1.31 – – – 5.4 – – –
Supplemental pay 2006 ............................................................... – – – .48 – – – 2.5 2007 ............................................................... .46 .46 .47 .47 2.4 2.4 2.4 2.4 2008 ............................................................... .51 .51 .53 .52 2.6 2.6 2.7 2.6 2009 ............................................................... .47 .48 .48 .48 2.3 2.4 2.4 2.3 2010 ............................................................... .46 .47 .47 .69 2.2 2.2 2.3 3.3
2011 ............................................................... .48 .48 .48 .43 2.3 2.3 2.3 2.0 2012 ............................................................... .44 .44 .45 .41 2.1 2.0 2.1 1.9 2013 ............................................................... .42 .41 .41 .40 1.9 1.9 1.9 1.8 2014 ............................................................... .41 .40 .41 .49 1.9 1.8 1.8 2.1 2015 ............................................................... .51 .51 .51 .50 2.2 2.2 2.2 2.2 2016 ............................................................... .52 .52 .51 .50 2.2 2.2 2.2 2.1
See footnotes at end of table.
-115-
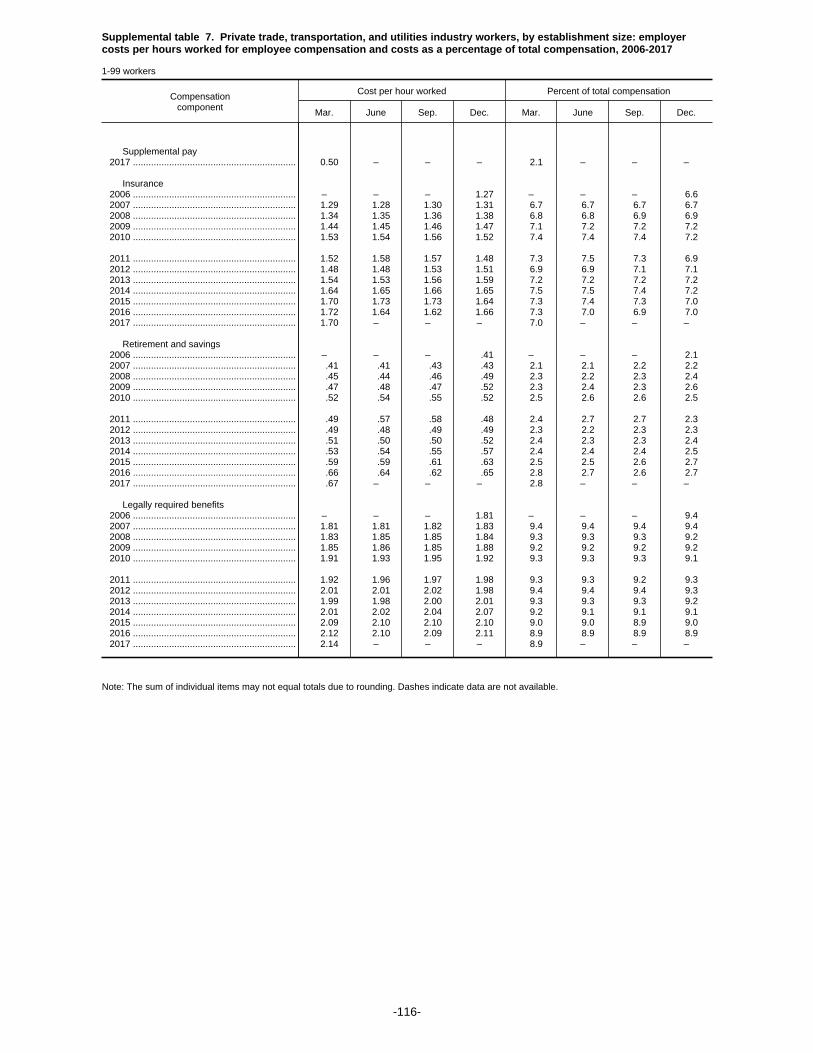
Supplemental table 7. Private trade, transportation, and utilities industry workers, by establishment size: employercosts per hours worked for employee compensation and costs as a percentage of total compensation, 2006-2017
1-99 workers
Compensationcomponent
Cost per hour worked Percent of total compensation
Mar. June Sep. Dec. Mar. June Sep. Dec.
Supplemental pay 2017 ............................................................... 0.50 – – – 2.1 – – –
Insurance 2006 ............................................................... – – – 1.27 – – – 6.6 2007 ............................................................... 1.29 1.28 1.30 1.31 6.7 6.7 6.7 6.7 2008 ............................................................... 1.34 1.35 1.36 1.38 6.8 6.8 6.9 6.9 2009 ............................................................... 1.44 1.45 1.46 1.47 7.1 7.2 7.2 7.2 2010 ............................................................... 1.53 1.54 1.56 1.52 7.4 7.4 7.4 7.2
2011 ............................................................... 1.52 1.58 1.57 1.48 7.3 7.5 7.3 6.9 2012 ............................................................... 1.48 1.48 1.53 1.51 6.9 6.9 7.1 7.1 2013 ............................................................... 1.54 1.53 1.56 1.59 7.2 7.2 7.2 7.2 2014 ............................................................... 1.64 1.65 1.66 1.65 7.5 7.5 7.4 7.2 2015 ............................................................... 1.70 1.73 1.73 1.64 7.3 7.4 7.3 7.0 2016 ............................................................... 1.72 1.64 1.62 1.66 7.3 7.0 6.9 7.0 2017 ............................................................... 1.70 – – – 7.0 – – –
Retirement and savings 2006 ............................................................... – – – .41 – – – 2.1 2007 ............................................................... .41 .41 .43 .43 2.1 2.1 2.2 2.2 2008 ............................................................... .45 .44 .46 .49 2.3 2.2 2.3 2.4 2009 ............................................................... .47 .48 .47 .52 2.3 2.4 2.3 2.6 2010 ............................................................... .52 .54 .55 .52 2.5 2.6 2.6 2.5
2011 ............................................................... .49 .57 .58 .48 2.4 2.7 2.7 2.3 2012 ............................................................... .49 .48 .49 .49 2.3 2.2 2.3 2.3 2013 ............................................................... .51 .50 .50 .52 2.4 2.3 2.3 2.4 2014 ............................................................... .53 .54 .55 .57 2.4 2.4 2.4 2.5 2015 ............................................................... .59 .59 .61 .63 2.5 2.5 2.6 2.7 2016 ............................................................... .66 .64 .62 .65 2.8 2.7 2.6 2.7 2017 ............................................................... .67 – – – 2.8 – – –
Legally required benefits 2006 ............................................................... – – – 1.81 – – – 9.4 2007 ............................................................... 1.81 1.81 1.82 1.83 9.4 9.4 9.4 9.4 2008 ............................................................... 1.83 1.85 1.85 1.84 9.3 9.3 9.3 9.2 2009 ............................................................... 1.85 1.86 1.85 1.88 9.2 9.2 9.2 9.2 2010 ............................................................... 1.91 1.93 1.95 1.92 9.3 9.3 9.3 9.1
2011 ............................................................... 1.92 1.96 1.97 1.98 9.3 9.3 9.2 9.3 2012 ............................................................... 2.01 2.01 2.02 1.98 9.4 9.4 9.4 9.3 2013 ............................................................... 1.99 1.98 2.00 2.01 9.3 9.3 9.3 9.2 2014 ............................................................... 2.01 2.02 2.04 2.07 9.2 9.1 9.1 9.1 2015 ............................................................... 2.09 2.10 2.10 2.10 9.0 9.0 8.9 9.0 2016 ............................................................... 2.12 2.10 2.09 2.11 8.9 8.9 8.9 8.9 2017 ............................................................... 2.14 – – – 8.9 – – –
Note: The sum of individual items may not equal totals due to rounding. Dashes indicate data are not available.
-116-

Supplemental table 7. Private trade, transportation, and utilities industry workers, by establishment size: employercosts per hours worked for employee compensation and costs as a percentage of total compensation, 2006-2017 --Continued
1-49 workers
Compensationcomponent
Cost per hour worked Percent of total compensation
Mar. June Sep. Dec. Mar. June Sep. Dec.
Total compensation 2006 ............................................................... – – – $18.67 – – – 100.0 2007 ............................................................... 18.79 18.72 18.96 19.10 100.0 100.0 100.0 100.0 2008 ............................................................... 19.23 19.42 19.39 19.51 100.0 100.0 100.0 100.0 2009 ............................................................... 19.47 19.51 19.51 19.75 100.0 100.0 100.0 100.0 2010 ............................................................... 19.84 20.11 20.25 20.44 100.0 100.0 100.0 100.0
2011 ............................................................... 19.92 20.29 20.52 20.70 100.0 100.0 100.0 100.0 2012 ............................................................... 20.64 20.55 20.66 20.76 100.0 100.0 100.0 100.0 2013 ............................................................... 20.79 20.60 20.61 21.40 100.0 100.0 100.0 100.0 2014 ............................................................... 21.42 21.41 21.88 22.34 100.0 100.0 100.0 100.0 2015 ............................................................... 22.56 22.65 22.86 22.90 100.0 100.0 100.0 100.0 2016 ............................................................... 22.88 22.99 23.10 23.23 100.0 100.0 100.0 100.0 2017 ............................................................... 23.56 – – – 100.0 – – –
Wages and salaries 2006 ............................................................... – – – 13.98 – – – 74.9 2007 ............................................................... 14.07 13.99 14.19 14.32 74.9 74.8 74.8 75.0 2008 ............................................................... 14.36 14.56 14.47 14.54 74.7 75.0 74.6 74.5 2009 ............................................................... 14.53 14.55 14.54 14.70 74.6 74.5 74.5 74.4 2010 ............................................................... 14.74 14.91 15.00 15.01 74.3 74.2 74.1 73.4
2011 ............................................................... 14.82 15.03 15.24 15.57 74.4 74.1 74.3 75.2 2012 ............................................................... 15.52 15.46 15.51 15.62 75.2 75.2 75.1 75.2 2013 ............................................................... 15.58 15.49 15.50 16.09 74.9 75.2 75.2 75.2 2014 ............................................................... 16.02 16.05 16.44 16.64 74.8 75.0 75.1 74.5 2015 ............................................................... 16.80 16.87 17.05 17.04 74.5 74.5 74.6 74.4 2016 ............................................................... 17.11 17.22 17.33 17.39 74.8 74.9 75.0 74.9 2017 ............................................................... 17.65 – – – 74.9 – – –
Total benefits 2006 ............................................................... – – – 4.69 – – – 25.1 2007 ............................................................... 4.72 4.73 4.77 4.78 25.1 25.2 25.2 25.0 2008 ............................................................... 4.87 4.86 4.92 4.97 25.3 25.0 25.4 25.5 2009 ............................................................... 4.94 4.97 4.97 5.05 25.4 25.5 25.5 25.6 2010 ............................................................... 5.10 5.19 5.25 5.43 25.7 25.8 25.9 26.6
2011 ............................................................... 5.11 5.26 5.28 5.13 25.6 25.9 25.7 24.8 2012 ............................................................... 5.12 5.09 5.14 5.15 24.8 24.8 24.9 24.8 2013 ............................................................... 5.21 5.11 5.11 5.31 25.1 24.8 24.8 24.8 2014 ............................................................... 5.39 5.36 5.44 5.70 25.2 25.0 24.9 25.5 2015 ............................................................... 5.76 5.78 5.81 5.86 25.5 25.5 25.4 25.6 2016 ............................................................... 5.77 5.78 5.77 5.84 25.2 25.1 25.0 25.1 2017 ............................................................... 5.90 – – – 25.1 – – –
Paid leave 2006 ............................................................... – – – .93 – – – 5.0 2007 ............................................................... .94 .94 .94 .94 5.0 5.0 5.0 4.9 2008 ............................................................... .93 .93 .94 .96 4.8 4.8 4.8 4.9 2009 ............................................................... .96 .95 .96 .97 4.9 4.9 4.9 4.9 2010 ............................................................... .97 1.00 1.01 .99 4.9 5.0 5.0 4.8
2011 ............................................................... .98 1.01 1.00 1.00 4.9 5.0 4.9 4.8 2012 ............................................................... .99 .97 .98 .99 4.8 4.7 4.8 4.8 2013 ............................................................... 1.01 .98 .98 1.05 4.8 4.7 4.7 4.9 2014 ............................................................... 1.07 1.06 1.09 1.17 5.0 4.9 5.0 5.2 2015 ............................................................... 1.18 1.17 1.18 1.23 5.2 5.2 5.1 5.4 2016 ............................................................... 1.22 1.22 1.24 1.25 5.3 5.3 5.4 5.4 2017 ............................................................... 1.27 – – – 5.4 – – –
Supplemental pay 2006 ............................................................... – – – .48 – – – 2.6 2007 ............................................................... .46 .46 .47 .47 2.4 2.4 2.5 2.4 2008 ............................................................... .51 .51 .53 .51 2.7 2.6 2.7 2.6 2009 ............................................................... .45 .47 .46 .44 2.3 2.4 2.3 2.2 2010 ............................................................... .43 .44 .45 .74 2.2 2.2 2.2 3.6
2011 ............................................................... .45 .44 .45 .39 2.3 2.2 2.2 1.9 2012 ............................................................... .40 .40 .41 .38 1.9 1.9 2.0 1.8 2013 ............................................................... .38 .37 .37 .37 1.8 1.8 1.8 1.7 2014 ............................................................... .37 .37 .38 .48 1.8 1.7 1.7 2.2 2015 ............................................................... .49 .50 .50 .49 2.2 2.2 2.2 2.1
See footnotes at end of table.
-117-
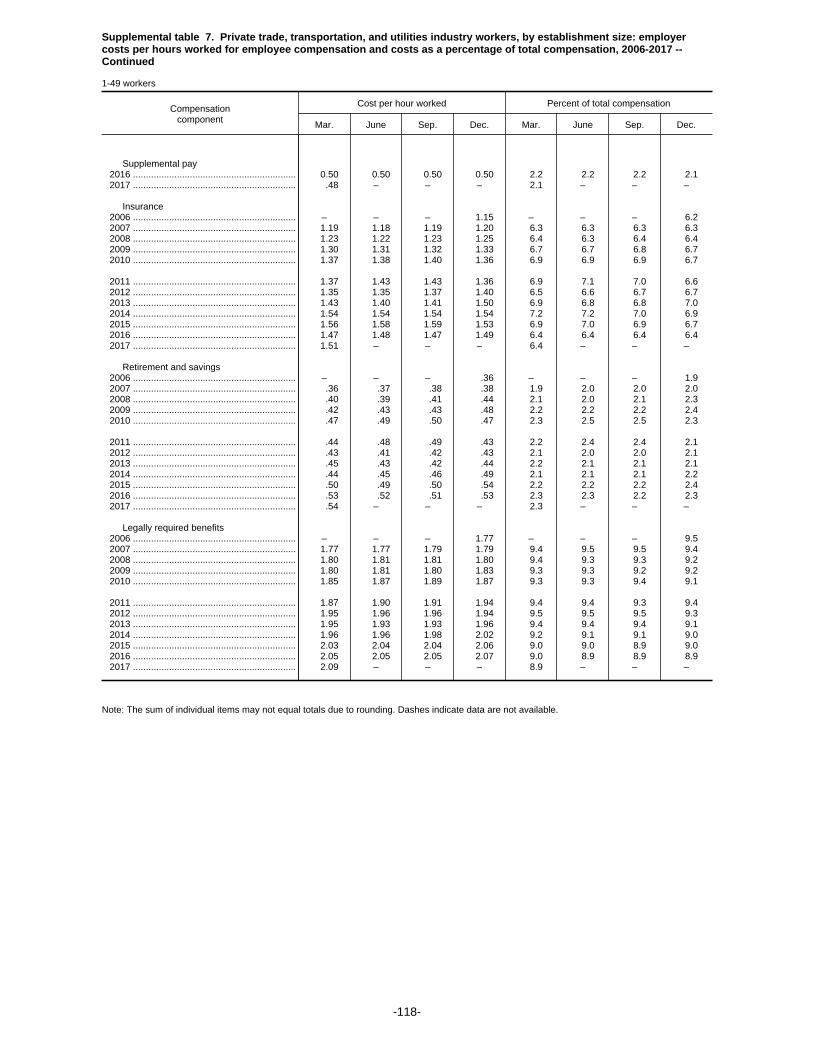
Supplemental table 7. Private trade, transportation, and utilities industry workers, by establishment size: employercosts per hours worked for employee compensation and costs as a percentage of total compensation, 2006-2017 --Continued
1-49 workers
Compensationcomponent
Cost per hour worked Percent of total compensation
Mar. June Sep. Dec. Mar. June Sep. Dec.
Supplemental pay 2016 ............................................................... 0.50 0.50 0.50 0.50 2.2 2.2 2.2 2.1 2017 ............................................................... .48 – – – 2.1 – – –
Insurance 2006 ............................................................... – – – 1.15 – – – 6.2 2007 ............................................................... 1.19 1.18 1.19 1.20 6.3 6.3 6.3 6.3 2008 ............................................................... 1.23 1.22 1.23 1.25 6.4 6.3 6.4 6.4 2009 ............................................................... 1.30 1.31 1.32 1.33 6.7 6.7 6.8 6.7 2010 ............................................................... 1.37 1.38 1.40 1.36 6.9 6.9 6.9 6.7
2011 ............................................................... 1.37 1.43 1.43 1.36 6.9 7.1 7.0 6.6 2012 ............................................................... 1.35 1.35 1.37 1.40 6.5 6.6 6.7 6.7 2013 ............................................................... 1.43 1.40 1.41 1.50 6.9 6.8 6.8 7.0 2014 ............................................................... 1.54 1.54 1.54 1.54 7.2 7.2 7.0 6.9 2015 ............................................................... 1.56 1.58 1.59 1.53 6.9 7.0 6.9 6.7 2016 ............................................................... 1.47 1.48 1.47 1.49 6.4 6.4 6.4 6.4 2017 ............................................................... 1.51 – – – 6.4 – – –
Retirement and savings 2006 ............................................................... – – – .36 – – – 1.9 2007 ............................................................... .36 .37 .38 .38 1.9 2.0 2.0 2.0 2008 ............................................................... .40 .39 .41 .44 2.1 2.0 2.1 2.3 2009 ............................................................... .42 .43 .43 .48 2.2 2.2 2.2 2.4 2010 ............................................................... .47 .49 .50 .47 2.3 2.5 2.5 2.3
2011 ............................................................... .44 .48 .49 .43 2.2 2.4 2.4 2.1 2012 ............................................................... .43 .41 .42 .43 2.1 2.0 2.0 2.1 2013 ............................................................... .45 .43 .42 .44 2.2 2.1 2.1 2.1 2014 ............................................................... .44 .45 .46 .49 2.1 2.1 2.1 2.2 2015 ............................................................... .50 .49 .50 .54 2.2 2.2 2.2 2.4 2016 ............................................................... .53 .52 .51 .53 2.3 2.3 2.2 2.3 2017 ............................................................... .54 – – – 2.3 – – –
Legally required benefits 2006 ............................................................... – – – 1.77 – – – 9.5 2007 ............................................................... 1.77 1.77 1.79 1.79 9.4 9.5 9.5 9.4 2008 ............................................................... 1.80 1.81 1.81 1.80 9.4 9.3 9.3 9.2 2009 ............................................................... 1.80 1.81 1.80 1.83 9.3 9.3 9.2 9.2 2010 ............................................................... 1.85 1.87 1.89 1.87 9.3 9.3 9.4 9.1
2011 ............................................................... 1.87 1.90 1.91 1.94 9.4 9.4 9.3 9.4 2012 ............................................................... 1.95 1.96 1.96 1.94 9.5 9.5 9.5 9.3 2013 ............................................................... 1.95 1.93 1.93 1.96 9.4 9.4 9.4 9.1 2014 ............................................................... 1.96 1.96 1.98 2.02 9.2 9.1 9.1 9.0 2015 ............................................................... 2.03 2.04 2.04 2.06 9.0 9.0 8.9 9.0 2016 ............................................................... 2.05 2.05 2.05 2.07 9.0 8.9 8.9 8.9 2017 ............................................................... 2.09 – – – 8.9 – – –
Note: The sum of individual items may not equal totals due to rounding. Dashes indicate data are not available.
-118-

Supplemental table 7. Private trade, transportation, and utilities industry workers, by establishment size: employercosts per hours worked for employee compensation and costs as a percentage of total compensation, 2006-2017 --Continued
50-99 workers
Compensationcomponent
Cost per hour worked Percent of total compensation
Mar. June Sep. Dec. Mar. June Sep. Dec.
Total compensation 2006 ............................................................... – – – $20.50 – – – 100.0 2007 ............................................................... 20.94 20.33 20.44 20.61 100.0 100.0 100.0 100.0 2008 ............................................................... 20.69 21.06 21.21 21.55 100.0 100.0 100.0 100.0 2009 ............................................................... 22.06 22.12 22.34 22.79 100.0 100.0 100.0 100.0 2010 ............................................................... 23.12 23.19 23.17 23.02 100.0 100.0 100.0 100.0
2011 ............................................................... 23.20 23.76 23.96 23.34 100.0 100.0 100.0 100.0 2012 ............................................................... 23.97 24.05 24.71 23.03 100.0 100.0 100.0 100.0 2013 ............................................................... 23.61 23.76 24.32 23.79 100.0 100.0 100.0 100.0 2014 ............................................................... 23.79 24.34 24.56 24.54 100.0 100.0 100.0 100.0 2015 ............................................................... 24.94 25.61 25.46 24.44 100.0 100.0 100.0 100.0 2016 ............................................................... 26.26 25.42 24.71 25.12 100.0 100.0 100.0 100.0 2017 ............................................................... 25.81 – – – 100.0 – – –
Wages and salaries 2006 ............................................................... – – – 14.80 – – – 72.2 2007 ............................................................... 15.21 14.73 14.71 14.85 72.6 72.5 72.0 72.0 2008 ............................................................... 14.82 15.08 15.17 15.54 71.6 71.6 71.5 72.1 2009 ............................................................... 15.85 15.88 16.06 16.28 71.8 71.8 71.9 71.5 2010 ............................................................... 16.46 16.55 16.44 16.47 71.2 71.4 71.0 71.6
2011 ............................................................... 16.57 16.83 17.02 16.94 71.4 70.8 71.1 72.5 2012 ............................................................... 17.29 17.31 17.67 16.52 72.1 72.0 71.5 71.8 2013 ............................................................... 16.92 17.00 17.34 17.09 71.7 71.6 71.3 71.9 2014 ............................................................... 17.01 17.38 17.56 17.59 71.5 71.4 71.5 71.7 2015 ............................................................... 17.72 18.17 18.14 17.45 71.1 71.0 71.3 71.4 2016 ............................................................... 18.34 18.00 17.53 17.82 69.8 70.8 70.9 71.0 2017 ............................................................... 18.25 – – – 70.7 – – –
Total benefits 2006 ............................................................... – – – 5.70 – – – 27.8 2007 ............................................................... 5.73 5.60 5.73 5.76 27.4 27.5 28.0 28.0 2008 ............................................................... 5.87 5.98 6.04 6.01 28.4 28.4 28.5 27.9 2009 ............................................................... 6.21 6.24 6.28 6.50 28.2 28.2 28.1 28.5 2010 ............................................................... 6.67 6.64 6.73 6.54 28.8 28.6 29.0 28.4
2011 ............................................................... 6.62 6.94 6.93 6.41 28.6 29.2 28.9 27.5 2012 ............................................................... 6.68 6.74 7.04 6.51 27.9 28.0 28.5 28.2 2013 ............................................................... 6.68 6.75 6.98 6.69 28.3 28.4 28.7 28.1 2014 ............................................................... 6.77 6.96 7.01 6.95 28.5 28.6 28.5 28.3 2015 ............................................................... 7.21 7.43 7.32 6.99 28.9 29.0 28.7 28.6 2016 ............................................................... 7.92 7.42 7.18 7.30 30.2 29.2 29.1 29.0 2017 ............................................................... 7.56 – – – 29.3 – – –
Paid leave 2006 ............................................................... – – – 1.17 – – – 5.7 2007 ............................................................... 1.21 1.16 1.16 1.17 5.8 5.7 5.7 5.7 2008 ............................................................... 1.18 1.21 1.21 1.19 5.7 5.7 5.7 5.5 2009 ............................................................... 1.25 1.26 1.27 1.30 5.7 5.7 5.7 5.7 2010 ............................................................... 1.30 1.29 1.32 1.32 5.6 5.6 5.7 5.7
2011 ............................................................... 1.33 1.35 1.37 1.33 5.7 5.7 5.7 5.7 2012 ............................................................... 1.37 1.40 1.45 1.35 5.7 5.8 5.9 5.8 2013 ............................................................... 1.40 1.40 1.44 1.37 5.9 5.9 5.9 5.7 2014 ............................................................... 1.38 1.41 1.43 1.43 5.8 5.8 5.8 5.8 2015 ............................................................... 1.46 1.50 1.48 1.40 5.8 5.8 5.8 5.7 2016 ............................................................... 1.54 1.45 1.40 1.40 5.9 5.7 5.7 5.6 2017 ............................................................... 1.44 – – – 5.6 – – –
Supplemental pay 2006 ............................................................... – – – .48 – – – 2.3 2007 ............................................................... .47 .48 .47 .48 2.3 2.4 2.3 2.3 2008 ............................................................... .50 .51 .52 .54 2.4 2.4 2.5 2.5 2009 ............................................................... .52 .54 .53 .58 2.4 2.4 2.4 2.5 2010 ............................................................... .55 .54 .55 .53 2.4 2.3 2.4 2.3
2011 ............................................................... .58 .59 .59 .53 2.5 2.5 2.4 2.3 2012 ............................................................... .57 .56 .58 .51 2.4 2.3 2.3 2.2 2013 ............................................................... .53 .53 .55 .48 2.3 2.2 2.3 2.0 2014 ............................................................... .51 .51 .51 .51 2.1 2.1 2.1 2.1 2015 ............................................................... .54 .54 .52 .54 2.2 2.1 2.0 2.2
See footnotes at end of table.
-119-

Supplemental table 7. Private trade, transportation, and utilities industry workers, by establishment size: employercosts per hours worked for employee compensation and costs as a percentage of total compensation, 2006-2017 --Continued
50-99 workers
Compensationcomponent
Cost per hour worked Percent of total compensation
Mar. June Sep. Dec. Mar. June Sep. Dec.
Supplemental pay 2016 ............................................................... 0.59 0.58 0.54 0.52 2.3 2.3 2.2 2.1 2017 ............................................................... .56 – – – 2.2 – – –
Insurance 2006 ............................................................... – – – 1.59 – – – 7.8 2007 ............................................................... 1.58 1.57 1.62 1.62 7.6 7.7 7.9 7.8 2008 ............................................................... 1.67 1.72 1.74 1.72 8.1 8.2 8.2 8.0 2009 ............................................................... 1.83 1.83 1.87 1.93 8.3 8.3 8.4 8.5 2010 ............................................................... 2.03 2.02 2.04 1.97 8.8 8.7 8.8 8.5
2011 ............................................................... 1.96 2.02 1.99 1.82 8.5 8.5 8.3 7.8 2012 ............................................................... 1.88 1.89 2.03 1.86 7.8 7.8 8.2 8.1 2013 ............................................................... 1.91 1.95 2.03 1.89 8.1 8.2 8.4 7.9 2014 ............................................................... 1.93 2.00 2.03 1.96 8.1 8.2 8.3 8.0 2015 ............................................................... 2.10 2.20 2.13 1.96 8.4 8.6 8.4 8.0 2016 ............................................................... 2.45 2.14 2.08 2.15 9.3 8.4 8.4 8.6 2017 ............................................................... 2.23 – – – 8.6 – – –
Retirement and savings 2006 ............................................................... – – – .55 – – – 2.7 2007 ............................................................... .54 .50 .56 .57 2.6 2.4 2.8 2.8 2008 ............................................................... .60 .61 .62 .60 2.9 2.9 2.9 2.8 2009 ............................................................... .60 .62 .60 .65 2.7 2.8 2.7 2.9 2010 ............................................................... .68 .68 .70 .65 2.9 2.9 3.0 2.8
2011 ............................................................... .66 .83 .85 .64 2.8 3.5 3.5 2.7 2012 ............................................................... .69 .72 .74 .68 2.9 3.0 3.0 2.9 2013 ............................................................... .70 .73 .74 .77 3.0 3.1 3.0 3.2 2014 ............................................................... .79 .82 .82 .80 3.3 3.4 3.3 3.3 2015 ............................................................... .85 .90 .91 .88 3.4 3.5 3.6 3.6 2016 ............................................................... 1.04 .99 .96 1.00 3.9 3.9 3.9 4.0 2017 ............................................................... 1.04 – – – 4.0 – – –
Legally required benefits 2006 ............................................................... – – – 1.91 – – – 9.3 2007 ............................................................... 1.93 1.89 1.91 1.92 9.2 9.3 9.3 9.3 2008 ............................................................... 1.93 1.94 1.94 1.95 9.3 9.2 9.2 9.1 2009 ............................................................... 2.01 2.00 2.00 2.05 9.1 9.0 9.0 9.0 2010 ............................................................... 2.11 2.11 2.12 2.07 9.1 9.1 9.1 9.0
2011 ............................................................... 2.09 2.14 2.14 2.10 9.0 9.0 8.9 9.0 2012 ............................................................... 2.17 2.18 2.24 2.11 9.1 9.1 9.1 9.2 2013 ............................................................... 2.14 2.14 2.22 2.19 9.1 9.0 9.1 9.2 2014 ............................................................... 2.16 2.22 2.23 2.25 9.1 9.1 9.1 9.2 2015 ............................................................... 2.27 2.30 2.27 2.20 9.1 9.0 8.9 9.0 2016 ............................................................... 2.30 2.25 2.20 2.23 8.8 8.9 8.9 8.9 2017 ............................................................... 2.30 – – – 8.9 – – –
Note: The sum of individual items may not equal totals due to rounding. Dashes indicate data are not available.
-120-
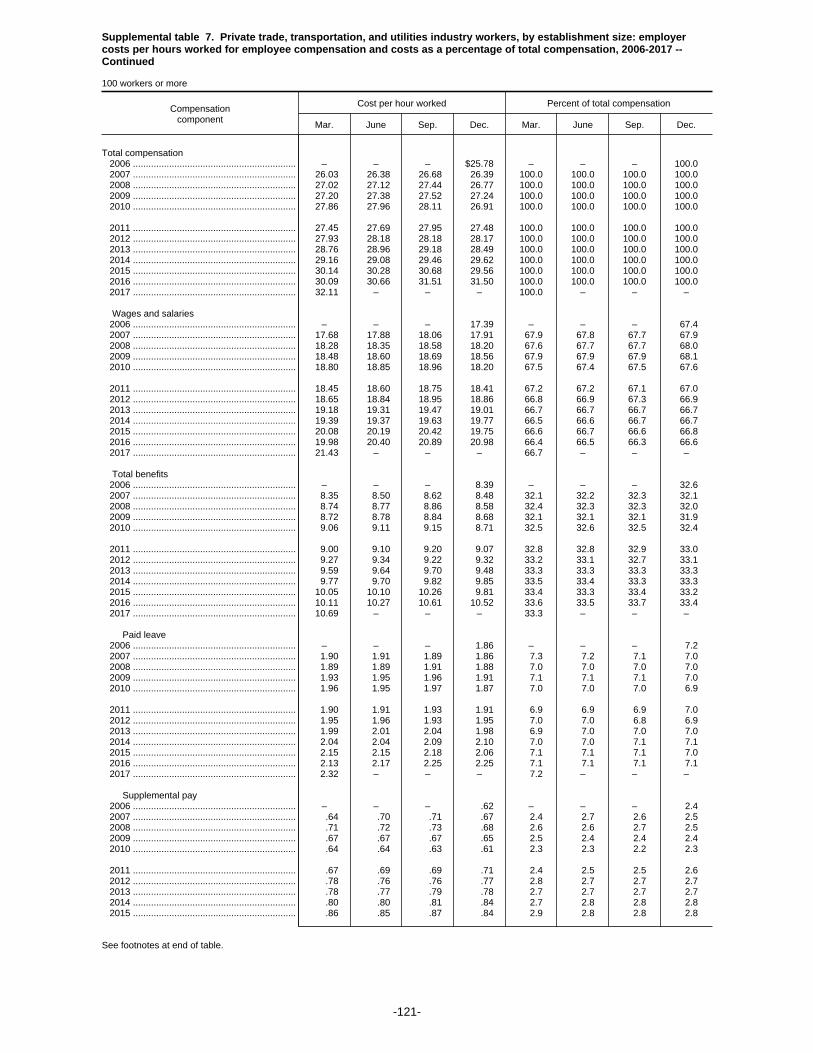
Supplemental table 7. Private trade, transportation, and utilities industry workers, by establishment size: employercosts per hours worked for employee compensation and costs as a percentage of total compensation, 2006-2017 --Continued
100 workers or more
Compensationcomponent
Cost per hour worked Percent of total compensation
Mar. June Sep. Dec. Mar. June Sep. Dec.
Total compensation 2006 ............................................................... – – – $25.78 – – – 100.0 2007 ............................................................... 26.03 26.38 26.68 26.39 100.0 100.0 100.0 100.0 2008 ............................................................... 27.02 27.12 27.44 26.77 100.0 100.0 100.0 100.0 2009 ............................................................... 27.20 27.38 27.52 27.24 100.0 100.0 100.0 100.0 2010 ............................................................... 27.86 27.96 28.11 26.91 100.0 100.0 100.0 100.0
2011 ............................................................... 27.45 27.69 27.95 27.48 100.0 100.0 100.0 100.0 2012 ............................................................... 27.93 28.18 28.18 28.17 100.0 100.0 100.0 100.0 2013 ............................................................... 28.76 28.96 29.18 28.49 100.0 100.0 100.0 100.0 2014 ............................................................... 29.16 29.08 29.46 29.62 100.0 100.0 100.0 100.0 2015 ............................................................... 30.14 30.28 30.68 29.56 100.0 100.0 100.0 100.0 2016 ............................................................... 30.09 30.66 31.51 31.50 100.0 100.0 100.0 100.0 2017 ............................................................... 32.11 – – – 100.0 – – –
Wages and salaries 2006 ............................................................... – – – 17.39 – – – 67.4 2007 ............................................................... 17.68 17.88 18.06 17.91 67.9 67.8 67.7 67.9 2008 ............................................................... 18.28 18.35 18.58 18.20 67.6 67.7 67.7 68.0 2009 ............................................................... 18.48 18.60 18.69 18.56 67.9 67.9 67.9 68.1 2010 ............................................................... 18.80 18.85 18.96 18.20 67.5 67.4 67.5 67.6
2011 ............................................................... 18.45 18.60 18.75 18.41 67.2 67.2 67.1 67.0 2012 ............................................................... 18.65 18.84 18.95 18.86 66.8 66.9 67.3 66.9 2013 ............................................................... 19.18 19.31 19.47 19.01 66.7 66.7 66.7 66.7 2014 ............................................................... 19.39 19.37 19.63 19.77 66.5 66.6 66.7 66.7 2015 ............................................................... 20.08 20.19 20.42 19.75 66.6 66.7 66.6 66.8 2016 ............................................................... 19.98 20.40 20.89 20.98 66.4 66.5 66.3 66.6 2017 ............................................................... 21.43 – – – 66.7 – – –
Total benefits 2006 ............................................................... – – – 8.39 – – – 32.6 2007 ............................................................... 8.35 8.50 8.62 8.48 32.1 32.2 32.3 32.1 2008 ............................................................... 8.74 8.77 8.86 8.58 32.4 32.3 32.3 32.0 2009 ............................................................... 8.72 8.78 8.84 8.68 32.1 32.1 32.1 31.9 2010 ............................................................... 9.06 9.11 9.15 8.71 32.5 32.6 32.5 32.4
2011 ............................................................... 9.00 9.10 9.20 9.07 32.8 32.8 32.9 33.0 2012 ............................................................... 9.27 9.34 9.22 9.32 33.2 33.1 32.7 33.1 2013 ............................................................... 9.59 9.64 9.70 9.48 33.3 33.3 33.3 33.3 2014 ............................................................... 9.77 9.70 9.82 9.85 33.5 33.4 33.3 33.3 2015 ............................................................... 10.05 10.10 10.26 9.81 33.4 33.3 33.4 33.2 2016 ............................................................... 10.11 10.27 10.61 10.52 33.6 33.5 33.7 33.4 2017 ............................................................... 10.69 – – – 33.3 – – –
Paid leave 2006 ............................................................... – – – 1.86 – – – 7.2 2007 ............................................................... 1.90 1.91 1.89 1.86 7.3 7.2 7.1 7.0 2008 ............................................................... 1.89 1.89 1.91 1.88 7.0 7.0 7.0 7.0 2009 ............................................................... 1.93 1.95 1.96 1.91 7.1 7.1 7.1 7.0 2010 ............................................................... 1.96 1.95 1.97 1.87 7.0 7.0 7.0 6.9
2011 ............................................................... 1.90 1.91 1.93 1.91 6.9 6.9 6.9 7.0 2012 ............................................................... 1.95 1.96 1.93 1.95 7.0 7.0 6.8 6.9 2013 ............................................................... 1.99 2.01 2.04 1.98 6.9 7.0 7.0 7.0 2014 ............................................................... 2.04 2.04 2.09 2.10 7.0 7.0 7.1 7.1 2015 ............................................................... 2.15 2.15 2.18 2.06 7.1 7.1 7.1 7.0 2016 ............................................................... 2.13 2.17 2.25 2.25 7.1 7.1 7.1 7.1 2017 ............................................................... 2.32 – – – 7.2 – – –
Supplemental pay 2006 ............................................................... – – – .62 – – – 2.4 2007 ............................................................... .64 .70 .71 .67 2.4 2.7 2.6 2.5 2008 ............................................................... .71 .72 .73 .68 2.6 2.6 2.7 2.5 2009 ............................................................... .67 .67 .67 .65 2.5 2.4 2.4 2.4 2010 ............................................................... .64 .64 .63 .61 2.3 2.3 2.2 2.3
2011 ............................................................... .67 .69 .69 .71 2.4 2.5 2.5 2.6 2012 ............................................................... .78 .76 .76 .77 2.8 2.7 2.7 2.7 2013 ............................................................... .78 .77 .79 .78 2.7 2.7 2.7 2.7 2014 ............................................................... .80 .80 .81 .84 2.7 2.8 2.8 2.8 2015 ............................................................... .86 .85 .87 .84 2.9 2.8 2.8 2.8
See footnotes at end of table.
-121-

Supplemental table 7. Private trade, transportation, and utilities industry workers, by establishment size: employercosts per hours worked for employee compensation and costs as a percentage of total compensation, 2006-2017 --Continued
100 workers or more
Compensationcomponent
Cost per hour worked Percent of total compensation
Mar. June Sep. Dec. Mar. June Sep. Dec.
Supplemental pay 2016 ............................................................... 0.97 0.98 1.02 1.01 3.2 3.2 3.2 3.2 2017 ............................................................... 1.01 – – – 3.1 – – –
Insurance 2006 ............................................................... – – – 2.29 – – – 8.9 2007 ............................................................... 2.39 2.40 2.46 2.42 9.2 9.1 9.2 9.2 2008 ............................................................... 2.52 2.54 2.55 2.48 9.3 9.3 9.3 9.3 2009 ............................................................... 2.59 2.60 2.64 2.62 9.5 9.5 9.6 9.6 2010 ............................................................... 2.79 2.84 2.86 2.80 10.0 10.2 10.2 10.4
2011 ............................................................... 2.88 2.90 2.95 2.87 10.5 10.5 10.5 10.4 2012 ............................................................... 2.95 2.96 2.86 2.90 10.6 10.5 10.1 10.3 2013 ............................................................... 3.07 3.06 3.09 2.99 10.7 10.6 10.6 10.5 2014 ............................................................... 3.13 3.09 3.09 3.00 10.7 10.6 10.5 10.1 2015 ............................................................... 3.06 3.11 3.15 2.94 10.1 10.3 10.3 9.9 2016 ............................................................... 3.01 3.08 3.18 3.09 10.0 10.0 10.1 9.8 2017 ............................................................... 3.10 – – – 9.7 – – –
Retirement and savings 2006 ............................................................... – – – 1.39 – – – 5.4 2007 ............................................................... 1.19 1.24 1.30 1.30 4.6 4.7 4.9 4.9 2008 ............................................................... 1.35 1.35 1.38 1.29 5.0 5.0 5.0 4.8 2009 ............................................................... 1.26 1.28 1.28 1.26 4.6 4.7 4.6 4.6 2010 ............................................................... 1.38 1.37 1.39 1.22 4.9 4.9 4.9 4.5
2011 ............................................................... 1.29 1.30 1.32 1.31 4.7 4.7 4.7 4.8 2012 ............................................................... 1.27 1.33 1.33 1.36 4.6 4.7 4.7 4.8 2013 ............................................................... 1.38 1.41 1.39 1.36 4.8 4.9 4.7 4.8 2014 ............................................................... 1.41 1.38 1.39 1.49 4.8 4.7 4.7 5.0 2015 ............................................................... 1.52 1.53 1.58 1.53 5.0 5.1 5.2 5.2 2016 ............................................................... 1.54 1.57 1.64 1.64 5.1 5.1 5.2 5.2 2017 ............................................................... 1.68 – – – 5.2 – – –
Legally required benefits 2006 ............................................................... – – – 2.23 – – – 8.7 2007 ............................................................... 2.23 2.25 2.27 2.24 8.6 8.5 8.5 8.5 2008 ............................................................... 2.27 2.28 2.29 2.24 8.4 8.4 8.3 8.4 2009 ............................................................... 2.28 2.28 2.29 2.25 8.4 8.3 8.3 8.3 2010 ............................................................... 2.29 2.30 2.31 2.22 8.2 8.2 8.2 8.2
2011 ............................................................... 2.25 2.30 2.32 2.27 8.2 8.3 8.3 8.3 2012 ............................................................... 2.32 2.34 2.34 2.34 8.3 8.3 8.3 8.3 2013 ............................................................... 2.37 2.38 2.40 2.36 8.2 8.2 8.2 8.3 2014 ............................................................... 2.39 2.40 2.43 2.44 8.2 8.3 8.3 8.2 2015 ............................................................... 2.47 2.46 2.47 2.45 8.2 8.1 8.0 8.3 2016 ............................................................... 2.45 2.47 2.52 2.53 8.1 8.1 8.0 8.0 2017 ............................................................... 2.58 – – – 8.0 – – –
Note: The sum of individual items may not equal totals due to rounding. Dashes indicate data are not available.
-122-
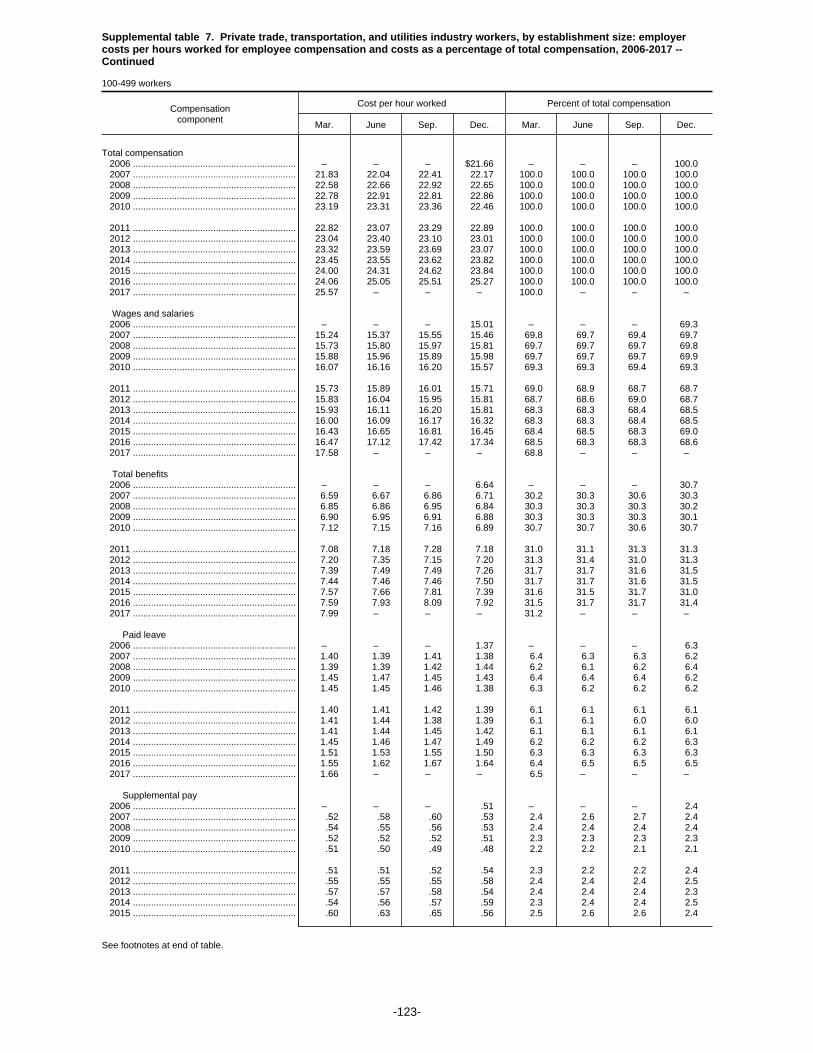
Supplemental table 7. Private trade, transportation, and utilities industry workers, by establishment size: employercosts per hours worked for employee compensation and costs as a percentage of total compensation, 2006-2017 --Continued
100-499 workers
Compensationcomponent
Cost per hour worked Percent of total compensation
Mar. June Sep. Dec. Mar. June Sep. Dec.
Total compensation 2006 ............................................................... – – – $21.66 – – – 100.0 2007 ............................................................... 21.83 22.04 22.41 22.17 100.0 100.0 100.0 100.0 2008 ............................................................... 22.58 22.66 22.92 22.65 100.0 100.0 100.0 100.0 2009 ............................................................... 22.78 22.91 22.81 22.86 100.0 100.0 100.0 100.0 2010 ............................................................... 23.19 23.31 23.36 22.46 100.0 100.0 100.0 100.0
2011 ............................................................... 22.82 23.07 23.29 22.89 100.0 100.0 100.0 100.0 2012 ............................................................... 23.04 23.40 23.10 23.01 100.0 100.0 100.0 100.0 2013 ............................................................... 23.32 23.59 23.69 23.07 100.0 100.0 100.0 100.0 2014 ............................................................... 23.45 23.55 23.62 23.82 100.0 100.0 100.0 100.0 2015 ............................................................... 24.00 24.31 24.62 23.84 100.0 100.0 100.0 100.0 2016 ............................................................... 24.06 25.05 25.51 25.27 100.0 100.0 100.0 100.0 2017 ............................................................... 25.57 – – – 100.0 – – –
Wages and salaries 2006 ............................................................... – – – 15.01 – – – 69.3 2007 ............................................................... 15.24 15.37 15.55 15.46 69.8 69.7 69.4 69.7 2008 ............................................................... 15.73 15.80 15.97 15.81 69.7 69.7 69.7 69.8 2009 ............................................................... 15.88 15.96 15.89 15.98 69.7 69.7 69.7 69.9 2010 ............................................................... 16.07 16.16 16.20 15.57 69.3 69.3 69.4 69.3
2011 ............................................................... 15.73 15.89 16.01 15.71 69.0 68.9 68.7 68.7 2012 ............................................................... 15.83 16.04 15.95 15.81 68.7 68.6 69.0 68.7 2013 ............................................................... 15.93 16.11 16.20 15.81 68.3 68.3 68.4 68.5 2014 ............................................................... 16.00 16.09 16.17 16.32 68.3 68.3 68.4 68.5 2015 ............................................................... 16.43 16.65 16.81 16.45 68.4 68.5 68.3 69.0 2016 ............................................................... 16.47 17.12 17.42 17.34 68.5 68.3 68.3 68.6 2017 ............................................................... 17.58 – – – 68.8 – – –
Total benefits 2006 ............................................................... – – – 6.64 – – – 30.7 2007 ............................................................... 6.59 6.67 6.86 6.71 30.2 30.3 30.6 30.3 2008 ............................................................... 6.85 6.86 6.95 6.84 30.3 30.3 30.3 30.2 2009 ............................................................... 6.90 6.95 6.91 6.88 30.3 30.3 30.3 30.1 2010 ............................................................... 7.12 7.15 7.16 6.89 30.7 30.7 30.6 30.7
2011 ............................................................... 7.08 7.18 7.28 7.18 31.0 31.1 31.3 31.3 2012 ............................................................... 7.20 7.35 7.15 7.20 31.3 31.4 31.0 31.3 2013 ............................................................... 7.39 7.49 7.49 7.26 31.7 31.7 31.6 31.5 2014 ............................................................... 7.44 7.46 7.46 7.50 31.7 31.7 31.6 31.5 2015 ............................................................... 7.57 7.66 7.81 7.39 31.6 31.5 31.7 31.0 2016 ............................................................... 7.59 7.93 8.09 7.92 31.5 31.7 31.7 31.4 2017 ............................................................... 7.99 – – – 31.2 – – –
Paid leave 2006 ............................................................... – – – 1.37 – – – 6.3 2007 ............................................................... 1.40 1.39 1.41 1.38 6.4 6.3 6.3 6.2 2008 ............................................................... 1.39 1.39 1.42 1.44 6.2 6.1 6.2 6.4 2009 ............................................................... 1.45 1.47 1.45 1.43 6.4 6.4 6.4 6.2 2010 ............................................................... 1.45 1.45 1.46 1.38 6.3 6.2 6.2 6.2
2011 ............................................................... 1.40 1.41 1.42 1.39 6.1 6.1 6.1 6.1 2012 ............................................................... 1.41 1.44 1.38 1.39 6.1 6.1 6.0 6.0 2013 ............................................................... 1.41 1.44 1.45 1.42 6.1 6.1 6.1 6.1 2014 ............................................................... 1.45 1.46 1.47 1.49 6.2 6.2 6.2 6.3 2015 ............................................................... 1.51 1.53 1.55 1.50 6.3 6.3 6.3 6.3 2016 ............................................................... 1.55 1.62 1.67 1.64 6.4 6.5 6.5 6.5 2017 ............................................................... 1.66 – – – 6.5 – – –
Supplemental pay 2006 ............................................................... – – – .51 – – – 2.4 2007 ............................................................... .52 .58 .60 .53 2.4 2.6 2.7 2.4 2008 ............................................................... .54 .55 .56 .53 2.4 2.4 2.4 2.4 2009 ............................................................... .52 .52 .52 .51 2.3 2.3 2.3 2.3 2010 ............................................................... .51 .50 .49 .48 2.2 2.2 2.1 2.1
2011 ............................................................... .51 .51 .52 .54 2.3 2.2 2.2 2.4 2012 ............................................................... .55 .55 .55 .58 2.4 2.4 2.4 2.5 2013 ............................................................... .57 .57 .58 .54 2.4 2.4 2.4 2.3 2014 ............................................................... .54 .56 .57 .59 2.3 2.4 2.4 2.5 2015 ............................................................... .60 .63 .65 .56 2.5 2.6 2.6 2.4
See footnotes at end of table.
-123-
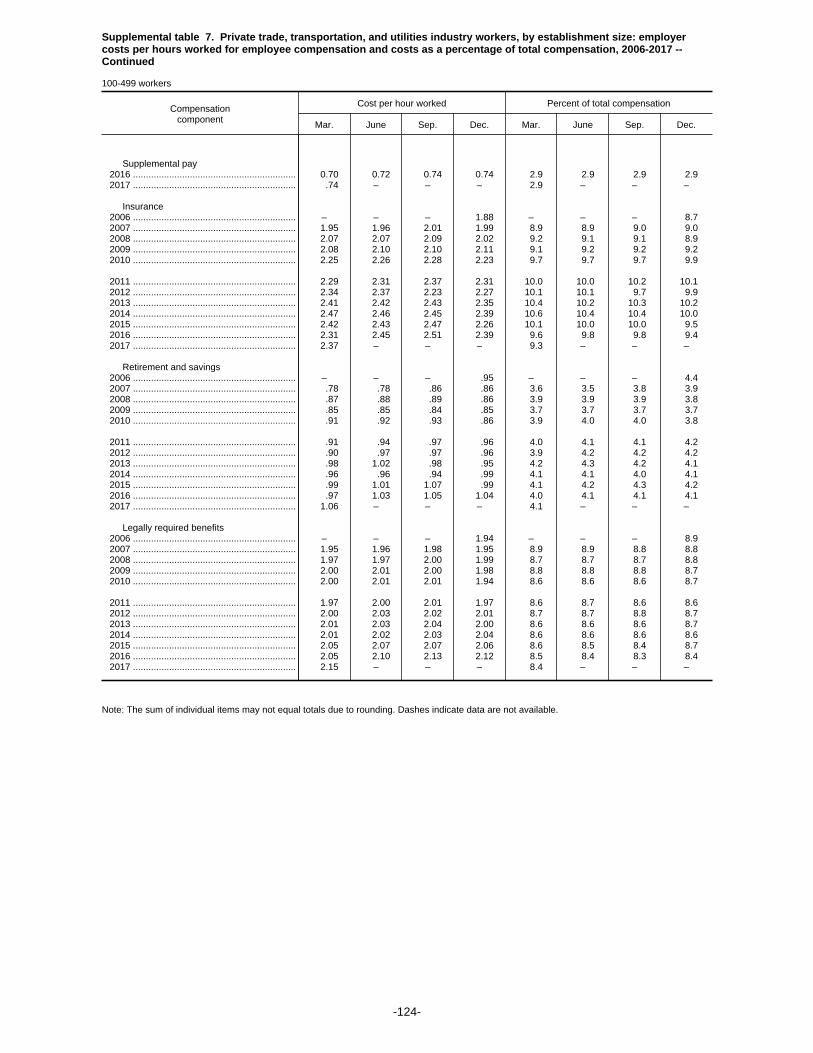
Supplemental table 7. Private trade, transportation, and utilities industry workers, by establishment size: employercosts per hours worked for employee compensation and costs as a percentage of total compensation, 2006-2017 --Continued
100-499 workers
Compensationcomponent
Cost per hour worked Percent of total compensation
Mar. June Sep. Dec. Mar. June Sep. Dec.
Supplemental pay 2016 ............................................................... 0.70 0.72 0.74 0.74 2.9 2.9 2.9 2.9 2017 ............................................................... .74 – – – 2.9 – – –
Insurance 2006 ............................................................... – – – 1.88 – – – 8.7 2007 ............................................................... 1.95 1.96 2.01 1.99 8.9 8.9 9.0 9.0 2008 ............................................................... 2.07 2.07 2.09 2.02 9.2 9.1 9.1 8.9 2009 ............................................................... 2.08 2.10 2.10 2.11 9.1 9.2 9.2 9.2 2010 ............................................................... 2.25 2.26 2.28 2.23 9.7 9.7 9.7 9.9
2011 ............................................................... 2.29 2.31 2.37 2.31 10.0 10.0 10.2 10.1 2012 ............................................................... 2.34 2.37 2.23 2.27 10.1 10.1 9.7 9.9 2013 ............................................................... 2.41 2.42 2.43 2.35 10.4 10.2 10.3 10.2 2014 ............................................................... 2.47 2.46 2.45 2.39 10.6 10.4 10.4 10.0 2015 ............................................................... 2.42 2.43 2.47 2.26 10.1 10.0 10.0 9.5 2016 ............................................................... 2.31 2.45 2.51 2.39 9.6 9.8 9.8 9.4 2017 ............................................................... 2.37 – – – 9.3 – – –
Retirement and savings 2006 ............................................................... – – – .95 – – – 4.4 2007 ............................................................... .78 .78 .86 .86 3.6 3.5 3.8 3.9 2008 ............................................................... .87 .88 .89 .86 3.9 3.9 3.9 3.8 2009 ............................................................... .85 .85 .84 .85 3.7 3.7 3.7 3.7 2010 ............................................................... .91 .92 .93 .86 3.9 4.0 4.0 3.8
2011 ............................................................... .91 .94 .97 .96 4.0 4.1 4.1 4.2 2012 ............................................................... .90 .97 .97 .96 3.9 4.2 4.2 4.2 2013 ............................................................... .98 1.02 .98 .95 4.2 4.3 4.2 4.1 2014 ............................................................... .96 .96 .94 .99 4.1 4.1 4.0 4.1 2015 ............................................................... .99 1.01 1.07 .99 4.1 4.2 4.3 4.2 2016 ............................................................... .97 1.03 1.05 1.04 4.0 4.1 4.1 4.1 2017 ............................................................... 1.06 – – – 4.1 – – –
Legally required benefits 2006 ............................................................... – – – 1.94 – – – 8.9 2007 ............................................................... 1.95 1.96 1.98 1.95 8.9 8.9 8.8 8.8 2008 ............................................................... 1.97 1.97 2.00 1.99 8.7 8.7 8.7 8.8 2009 ............................................................... 2.00 2.01 2.00 1.98 8.8 8.8 8.8 8.7 2010 ............................................................... 2.00 2.01 2.01 1.94 8.6 8.6 8.6 8.7
2011 ............................................................... 1.97 2.00 2.01 1.97 8.6 8.7 8.6 8.6 2012 ............................................................... 2.00 2.03 2.02 2.01 8.7 8.7 8.8 8.7 2013 ............................................................... 2.01 2.03 2.04 2.00 8.6 8.6 8.6 8.7 2014 ............................................................... 2.01 2.02 2.03 2.04 8.6 8.6 8.6 8.6 2015 ............................................................... 2.05 2.07 2.07 2.06 8.6 8.5 8.4 8.7 2016 ............................................................... 2.05 2.10 2.13 2.12 8.5 8.4 8.3 8.4 2017 ............................................................... 2.15 – – – 8.4 – – –
Note: The sum of individual items may not equal totals due to rounding. Dashes indicate data are not available.
-124-

Supplemental table 7. Private trade, transportation, and utilities industry workers, by establishment size: employercosts per hours worked for employee compensation and costs as a percentage of total compensation, 2006-2017 --Continued
500 workers or more
Compensationcomponent
Cost per hour worked Percent of total compensation
Mar. June Sep. Dec. Mar. June Sep. Dec.
Total compensation 2006 ............................................................... – – – $37.14 – – – 100.0 2007 ............................................................... 37.60 38.46 38.37 37.98 100.0 100.0 100.0 100.0 2008 ............................................................... 39.06 39.40 39.88 38.34 100.0 100.0 100.0 100.0 2009 ............................................................... 40.01 40.54 41.81 41.42 100.0 100.0 100.0 100.0 2010 ............................................................... 43.21 42.83 43.03 41.16 100.0 100.0 100.0 100.0
2011 ............................................................... 42.92 43.03 42.98 42.41 100.0 100.0 100.0 100.0 2012 ............................................................... 44.37 44.30 45.02 44.18 100.0 100.0 100.0 100.0 2013 ............................................................... 45.98 45.47 45.98 46.21 100.0 100.0 100.0 100.0 2014 ............................................................... 47.57 47.27 48.95 48.32 100.0 100.0 100.0 100.0 2015 ............................................................... 50.19 50.28 49.90 48.87 100.0 100.0 100.0 100.0 2016 ............................................................... 51.02 50.36 51.17 52.11 100.0 100.0 100.0 100.0 2017 ............................................................... 53.86 – – – 100.0 – – –
Wages and salaries 2006 ............................................................... – – – 23.92 – – – 64.4 2007 ............................................................... 24.41 24.86 24.91 24.64 64.9 64.6 64.9 64.9 2008 ............................................................... 25.19 25.38 25.78 24.90 64.5 64.4 64.6 65.0 2009 ............................................................... 26.00 26.37 27.14 26.92 65.0 65.0 64.9 65.0 2010 ............................................................... 27.79 27.47 27.63 26.64 64.3 64.1 64.2 64.7
2011 ............................................................... 27.53 27.56 27.57 27.19 64.2 64.1 64.2 64.1 2012 ............................................................... 28.13 28.26 28.92 28.30 63.4 63.8 64.2 64.1 2013 ............................................................... 29.44 29.19 29.49 29.48 64.0 64.2 64.1 63.8 2014 ............................................................... 30.29 30.18 31.22 30.88 63.7 63.9 63.8 63.9 2015 ............................................................... 32.03 32.03 31.87 30.88 63.8 63.7 63.9 63.2 2016 ............................................................... 32.17 31.90 32.29 33.00 63.1 63.3 63.1 63.3 2017 ............................................................... 34.20 – – – 63.5 – – –
Total benefits 2006 ............................................................... – – – 13.22 – – – 35.6 2007 ............................................................... 13.20 13.60 13.46 13.34 35.1 35.4 35.1 35.1 2008 ............................................................... 13.87 14.02 14.10 13.44 35.5 35.6 35.4 35.0 2009 ............................................................... 14.01 14.17 14.67 14.50 35.0 35.0 35.1 35.0 2010 ............................................................... 15.42 15.36 15.40 14.52 35.7 35.9 35.8 35.3
2011 ............................................................... 15.38 15.47 15.40 15.21 35.8 35.9 35.8 35.9 2012 ............................................................... 16.24 16.04 16.11 15.88 36.6 36.2 35.8 35.9 2013 ............................................................... 16.54 16.28 16.49 16.73 36.0 35.8 35.9 36.2 2014 ............................................................... 17.28 17.09 17.73 17.44 36.3 36.1 36.2 36.1 2015 ............................................................... 18.15 18.25 18.03 17.99 36.2 36.3 36.1 36.8 2016 ............................................................... 18.85 18.47 18.88 19.11 36.9 36.7 36.9 36.7 2017 ............................................................... 19.66 – – – 36.5 – – –
Paid leave 2006 ............................................................... – – – 3.22 – – – 8.7 2007 ............................................................... 3.30 3.35 3.21 3.17 8.8 8.7 8.4 8.3 2008 ............................................................... 3.23 3.25 3.28 3.13 8.3 8.2 8.2 8.2 2009 ............................................................... 3.32 3.37 3.49 3.46 8.3 8.3 8.3 8.4 2010 ............................................................... 3.60 3.54 3.57 3.43 8.3 8.3 8.3 8.3
2011 ............................................................... 3.59 3.58 3.55 3.61 8.4 8.3 8.3 8.5 2012 ............................................................... 3.76 3.73 3.75 3.68 8.5 8.4 8.3 8.3 2013 ............................................................... 3.83 3.78 3.82 3.83 8.3 8.3 8.3 8.3 2014 ............................................................... 3.96 3.92 4.17 4.05 8.3 8.3 8.5 8.4 2015 ............................................................... 4.24 4.22 4.18 3.93 8.5 8.4 8.4 8.1 2016 ............................................................... 4.17 4.10 4.17 4.28 8.2 8.1 8.1 8.2 2017 ............................................................... 4.49 – – – 8.3 – – –
Supplemental pay 2006 ............................................................... – – – .92 – – – 2.5 2007 ............................................................... .96 1.04 1.01 1.03 2.6 2.7 2.6 2.7 2008 ............................................................... 1.18 1.19 1.19 1.09 3.0 3.0 3.0 2.8 2009 ............................................................... 1.10 1.10 1.12 1.07 2.8 2.7 2.7 2.6 2010 ............................................................... 1.09 1.07 1.06 1.02 2.5 2.5 2.5 2.5
2011 ............................................................... 1.19 1.26 1.25 1.25 2.8 2.9 2.9 3.0 2012 ............................................................... 1.55 1.47 1.47 1.38 3.5 3.3 3.3 3.1 2013 ............................................................... 1.45 1.39 1.43 1.58 3.2 3.1 3.1 3.4 2014 ............................................................... 1.62 1.60 1.64 1.64 3.4 3.4 3.3 3.4 2015 ............................................................... 1.72 1.60 1.58 1.76 3.4 3.2 3.2 3.6
See footnotes at end of table.
-125-
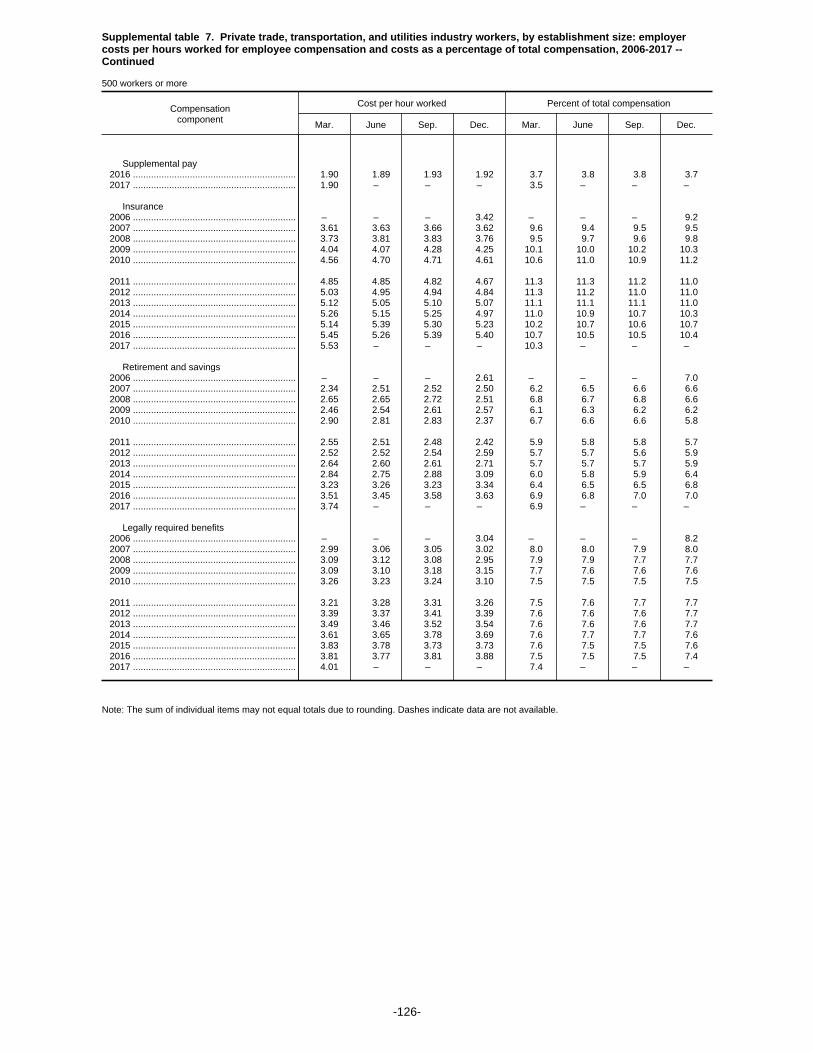
Supplemental table 7. Private trade, transportation, and utilities industry workers, by establishment size: employercosts per hours worked for employee compensation and costs as a percentage of total compensation, 2006-2017 --Continued
500 workers or more
Compensationcomponent
Cost per hour worked Percent of total compensation
Mar. June Sep. Dec. Mar. June Sep. Dec.
Supplemental pay 2016 ............................................................... 1.90 1.89 1.93 1.92 3.7 3.8 3.8 3.7 2017 ............................................................... 1.90 – – – 3.5 – – –
Insurance 2006 ............................................................... – – – 3.42 – – – 9.2 2007 ............................................................... 3.61 3.63 3.66 3.62 9.6 9.4 9.5 9.5 2008 ............................................................... 3.73 3.81 3.83 3.76 9.5 9.7 9.6 9.8 2009 ............................................................... 4.04 4.07 4.28 4.25 10.1 10.0 10.2 10.3 2010 ............................................................... 4.56 4.70 4.71 4.61 10.6 11.0 10.9 11.2
2011 ............................................................... 4.85 4.85 4.82 4.67 11.3 11.3 11.2 11.0 2012 ............................................................... 5.03 4.95 4.94 4.84 11.3 11.2 11.0 11.0 2013 ............................................................... 5.12 5.05 5.10 5.07 11.1 11.1 11.1 11.0 2014 ............................................................... 5.26 5.15 5.25 4.97 11.0 10.9 10.7 10.3 2015 ............................................................... 5.14 5.39 5.30 5.23 10.2 10.7 10.6 10.7 2016 ............................................................... 5.45 5.26 5.39 5.40 10.7 10.5 10.5 10.4 2017 ............................................................... 5.53 – – – 10.3 – – –
Retirement and savings 2006 ............................................................... – – – 2.61 – – – 7.0 2007 ............................................................... 2.34 2.51 2.52 2.50 6.2 6.5 6.6 6.6 2008 ............................................................... 2.65 2.65 2.72 2.51 6.8 6.7 6.8 6.6 2009 ............................................................... 2.46 2.54 2.61 2.57 6.1 6.3 6.2 6.2 2010 ............................................................... 2.90 2.81 2.83 2.37 6.7 6.6 6.6 5.8
2011 ............................................................... 2.55 2.51 2.48 2.42 5.9 5.8 5.8 5.7 2012 ............................................................... 2.52 2.52 2.54 2.59 5.7 5.7 5.6 5.9 2013 ............................................................... 2.64 2.60 2.61 2.71 5.7 5.7 5.7 5.9 2014 ............................................................... 2.84 2.75 2.88 3.09 6.0 5.8 5.9 6.4 2015 ............................................................... 3.23 3.26 3.23 3.34 6.4 6.5 6.5 6.8 2016 ............................................................... 3.51 3.45 3.58 3.63 6.9 6.8 7.0 7.0 2017 ............................................................... 3.74 – – – 6.9 – – –
Legally required benefits 2006 ............................................................... – – – 3.04 – – – 8.2 2007 ............................................................... 2.99 3.06 3.05 3.02 8.0 8.0 7.9 8.0 2008 ............................................................... 3.09 3.12 3.08 2.95 7.9 7.9 7.7 7.7 2009 ............................................................... 3.09 3.10 3.18 3.15 7.7 7.6 7.6 7.6 2010 ............................................................... 3.26 3.23 3.24 3.10 7.5 7.5 7.5 7.5
2011 ............................................................... 3.21 3.28 3.31 3.26 7.5 7.6 7.7 7.7 2012 ............................................................... 3.39 3.37 3.41 3.39 7.6 7.6 7.6 7.7 2013 ............................................................... 3.49 3.46 3.52 3.54 7.6 7.6 7.6 7.7 2014 ............................................................... 3.61 3.65 3.78 3.69 7.6 7.7 7.7 7.6 2015 ............................................................... 3.83 3.78 3.73 3.73 7.6 7.5 7.5 7.6 2016 ............................................................... 3.81 3.77 3.81 3.88 7.5 7.5 7.5 7.4 2017 ............................................................... 4.01 – – – 7.4 – – –
Note: The sum of individual items may not equal totals due to rounding. Dashes indicate data are not available.
-126-

Supplemental table 8. Private trade, transportation, and utilities industry workers, by bargaining status: employer costsper hours worked for employee compensation and costs as a percentage of total compensation, 2006-2017
Union workers
Compensationcomponent
Cost per hour worked Percent of total compensation
Mar. June Sep. Dec. Mar. June Sep. Dec.
Total compensation 2006 ............................................................... – – – $35.66 – – – 100.0 2007 ............................................................... 35.34 35.81 35.98 35.78 100.0 100.0 100.0 100.0 2008 ............................................................... 36.55 36.60 36.86 36.01 100.0 100.0 100.0 100.0 2009 ............................................................... 36.58 36.97 37.35 36.31 100.0 100.0 100.0 100.0 2010 ............................................................... 37.21 37.57 38.12 36.75 100.0 100.0 100.0 100.0
2011 ............................................................... 37.13 37.45 37.73 36.37 100.0 100.0 100.0 100.0 2012 ............................................................... 36.85 37.26 37.73 37.41 100.0 100.0 100.0 100.0 2013 ............................................................... 38.16 38.25 38.47 39.18 100.0 100.0 100.0 100.0 2014 ............................................................... 39.82 39.64 40.74 41.72 100.0 100.0 100.0 100.0 2015 ............................................................... 42.33 42.37 42.82 42.07 100.0 100.0 100.0 100.0 2016 ............................................................... 42.70 42.91 43.81 44.23 100.0 100.0 100.0 100.0 2017 ............................................................... 45.04 – – – 100.0 – – –
Wages and salaries 2006 ............................................................... – – – 21.83 – – – 61.2 2007 ............................................................... 21.86 22.13 22.35 22.23 61.8 61.8 62.1 62.1 2008 ............................................................... 22.59 22.64 22.91 22.35 61.8 61.9 62.2 62.1 2009 ............................................................... 22.71 22.95 23.21 22.50 62.1 62.1 62.1 62.0 2010 ............................................................... 22.76 22.91 23.25 22.30 61.2 61.0 61.0 60.7
2011 ............................................................... 22.43 22.44 22.65 21.73 60.4 59.9 60.0 59.7 2012 ............................................................... 21.94 22.25 22.60 22.29 59.5 59.7 59.9 59.6 2013 ............................................................... 22.76 22.79 23.04 23.36 59.7 59.6 59.9 59.6 2014 ............................................................... 23.75 23.65 24.39 24.95 59.7 59.7 59.9 59.8 2015 ............................................................... 25.29 25.31 25.56 24.88 59.7 59.7 59.7 59.1 2016 ............................................................... 25.30 25.33 25.87 26.28 59.2 59.0 59.1 59.4 2017 ............................................................... 26.79 – – – 59.5 – – –
Total benefits 2006 ............................................................... – – – 13.83 – – – 38.8 2007 ............................................................... 13.48 13.68 13.63 13.56 38.2 38.2 37.9 37.9 2008 ............................................................... 13.96 13.96 13.95 13.67 38.2 38.1 37.8 37.9 2009 ............................................................... 13.87 14.02 14.15 13.81 37.9 37.9 37.9 38.0 2010 ............................................................... 14.45 14.65 14.87 14.45 38.8 39.0 39.0 39.3
2011 ............................................................... 14.70 15.01 15.08 14.64 39.6 40.1 40.0 40.3 2012 ............................................................... 14.91 15.01 15.13 15.11 40.5 40.3 40.1 40.4 2013 ............................................................... 15.40 15.45 15.43 15.82 40.3 40.4 40.1 40.4 2014 ............................................................... 16.07 15.99 16.35 16.77 40.3 40.3 40.1 40.2 2015 ............................................................... 17.05 17.06 17.26 17.19 40.3 40.3 40.3 40.9 2016 ............................................................... 17.40 17.58 17.94 17.95 40.8 41.0 40.9 40.6 2017 ............................................................... 18.25 – – – 40.5 – – –
Paid leave 2006 ............................................................... – – – 3.02 – – – 8.5 2007 ............................................................... 3.01 3.00 2.92 2.88 8.5 8.4 8.1 8.1 2008 ............................................................... 2.88 2.88 2.89 2.80 7.9 7.9 7.9 7.8 2009 ............................................................... 2.87 2.90 2.94 2.77 7.9 7.8 7.9 7.6 2010 ............................................................... 2.86 2.86 2.91 2.79 7.7 7.6 7.6 7.6
2011 ............................................................... 2.81 2.80 2.80 2.76 7.6 7.5 7.4 7.6 2012 ............................................................... 2.78 2.79 2.78 2.76 7.6 7.5 7.4 7.4 2013 ............................................................... 2.82 2.85 2.88 2.93 7.4 7.4 7.5 7.5 2014 ............................................................... 2.99 2.96 3.15 3.20 7.5 7.5 7.7 7.7 2015 ............................................................... 3.26 3.26 3.29 3.17 7.7 7.7 7.7 7.5 2016 ............................................................... 3.24 3.25 3.35 3.39 7.6 7.6 7.6 7.7 2017 ............................................................... 3.45 – – – 7.7 – – –
Supplemental pay 2006 ............................................................... – – – .90 – – – 2.5 2007 ............................................................... .91 .97 .97 .99 2.6 2.7 2.7 2.8 2008 ............................................................... 1.10 1.08 1.09 1.00 3.0 3.0 3.0 2.8 2009 ............................................................... .95 .96 .97 .91 2.6 2.6 2.6 2.5 2010 ............................................................... .90 .89 .90 .85 2.4 2.4 2.4 2.3
2011 ............................................................... .99 1.01 1.01 .98 2.7 2.7 2.7 2.7 2012 ............................................................... 1.20 1.18 1.19 1.12 3.3 3.2 3.2 3.0 2013 ............................................................... 1.12 1.09 1.10 1.24 2.9 2.9 2.9 3.2 2014 ............................................................... 1.24 1.23 1.25 1.28 3.1 3.1 3.1 3.1 2015 ............................................................... 1.30 1.22 1.24 1.23 3.1 2.9 2.9 2.9 2016 ............................................................... 1.24 1.22 1.27 1.27 2.9 2.9 2.9 2.9
See footnotes at end of table.
-127-

Supplemental table 8. Private trade, transportation, and utilities industry workers, by bargaining status: employer costsper hours worked for employee compensation and costs as a percentage of total compensation, 2006-2017
Union workers
Compensationcomponent
Cost per hour worked Percent of total compensation
Mar. June Sep. Dec. Mar. June Sep. Dec.
Supplemental pay 2017 ............................................................... 1.31 – – – 2.9 – – –
Insurance 2006 ............................................................... – – – 3.93 – – – 11.0 2007 ............................................................... 4.12 4.08 4.08 4.06 11.7 11.4 11.3 11.3 2008 ............................................................... 4.16 4.19 4.21 4.24 11.4 11.4 11.4 11.8 2009 ............................................................... 4.44 4.48 4.53 4.46 12.2 12.1 12.1 12.3 2010 ............................................................... 4.83 4.97 5.06 5.13 13.0 13.2 13.3 14.0
2011 ............................................................... 5.17 5.21 5.22 5.21 13.9 13.9 13.8 14.3 2012 ............................................................... 5.33 5.31 5.37 5.40 14.5 14.2 14.2 14.4 2013 ............................................................... 5.52 5.53 5.54 5.66 14.5 14.5 14.4 14.4 2014 ............................................................... 5.78 5.72 5.75 5.75 14.5 14.4 14.1 13.8 2015 ............................................................... 5.82 5.97 6.00 5.86 13.8 14.1 14.0 13.9 2016 ............................................................... 5.95 6.06 6.17 6.03 13.9 14.1 14.1 13.6 2017 ............................................................... 6.11 – – – 13.6 – – –
Retirement and savings 2006 ............................................................... – – – 2.85 – – – 8.0 2007 ............................................................... 2.40 2.54 2.55 2.54 6.8 7.1 7.1 7.1 2008 ............................................................... 2.68 2.67 2.64 2.62 7.3 7.3 7.2 7.3 2009 ............................................................... 2.54 2.62 2.61 2.64 7.0 7.1 7.0 7.3 2010 ............................................................... 2.75 2.81 2.86 2.64 7.4 7.5 7.5 7.2
2011 ............................................................... 2.66 2.88 2.89 2.62 7.2 7.7 7.7 7.2 2012 ............................................................... 2.46 2.57 2.59 2.67 6.7 6.9 6.9 7.1 2013 ............................................................... 2.76 2.80 2.68 2.73 7.2 7.3 7.0 7.0 2014 ............................................................... 2.78 2.77 2.77 3.08 7.0 7.0 6.8 7.4 2015 ............................................................... 3.16 3.13 3.24 3.48 7.5 7.4 7.6 8.3 2016 ............................................................... 3.54 3.64 3.71 3.77 8.3 8.5 8.5 8.5 2017 ............................................................... 3.81 – – – 8.5 – – –
Legally required benefits 2006 ............................................................... – – – 3.13 – – – 8.8 2007 ............................................................... 3.05 3.09 3.10 3.09 8.6 8.6 8.6 8.6 2008 ............................................................... 3.14 3.14 3.11 3.00 8.6 8.6 8.4 8.3 2009 ............................................................... 3.06 3.07 3.09 3.03 8.4 8.3 8.3 8.3 2010 ............................................................... 3.10 3.11 3.14 3.04 8.3 8.3 8.2 8.3
2011 ............................................................... 3.07 3.12 3.15 3.07 8.3 8.3 8.4 8.4 2012 ............................................................... 3.14 3.17 3.19 3.16 8.5 8.5 8.5 8.4 2013 ............................................................... 3.17 3.19 3.23 3.26 8.3 8.3 8.4 8.3 2014 ............................................................... 3.28 3.32 3.42 3.46 8.2 8.4 8.4 8.3 2015 ............................................................... 3.50 3.48 3.49 3.45 8.3 8.2 8.1 8.2 2016 ............................................................... 3.44 3.40 3.44 3.49 8.1 7.9 7.9 7.9 2017 ............................................................... 3.57 – – – 7.9 – – –
Note: The sum of individual items may not equal totals due to rounding. Dashes indicate data are not available.
-128-

Supplemental table 8. Private trade, transportation, and utilities industry workers, by bargaining status: employer costsper hours worked for employee compensation and costs as a percentage of total compensation, 2006-2017 -- Continued
Nonunion workers
Compensationcomponent
Cost per hour worked Percent of total compensation
Mar. June Sep. Dec. Mar. June Sep. Dec.
Total compensation 2006 ............................................................... – – – $19.98 – – – 100.0 2007 ............................................................... 20.21 20.20 20.45 20.47 100.0 100.0 100.0 100.0 2008 ............................................................... 20.69 20.87 20.97 21.00 100.0 100.0 100.0 100.0 2009 ............................................................... 21.12 21.15 21.18 21.34 100.0 100.0 100.0 100.0 2010 ............................................................... 21.58 21.73 21.79 21.68 100.0 100.0 100.0 100.0
2011 ............................................................... 21.65 21.97 22.18 22.16 100.0 100.0 100.0 100.0 2012 ............................................................... 22.35 22.40 22.46 22.35 100.0 100.0 100.0 100.0 2013 ............................................................... 22.61 22.64 22.79 22.78 100.0 100.0 100.0 100.0 2014 ............................................................... 22.97 23.06 23.32 23.44 100.0 100.0 100.0 100.0 2015 ............................................................... 23.74 23.96 24.14 23.58 100.0 100.0 100.0 100.0 2016 ............................................................... 23.99 24.19 24.32 24.42 100.0 100.0 100.0 100.0 2017 ............................................................... 24.78 – – – 100.0 – – –
Wages and salaries 2006 ............................................................... – – – 14.64 – – – 73.3 2007 ............................................................... 14.86 14.81 14.95 15.00 73.5 73.3 73.1 73.3 2008 ............................................................... 15.12 15.28 15.31 15.35 73.1 73.2 73.0 73.1 2009 ............................................................... 15.45 15.47 15.49 15.63 73.1 73.2 73.2 73.3 2010 ............................................................... 15.75 15.85 15.88 15.76 73.0 73.0 72.9 72.7
2011 ............................................................... 15.77 15.98 16.15 16.29 72.9 72.7 72.8 73.5 2012 ............................................................... 16.39 16.41 16.48 16.38 73.3 73.3 73.4 73.3 2013 ............................................................... 16.50 16.55 16.64 16.67 73.0 73.1 73.0 73.2 2014 ............................................................... 16.73 16.82 17.04 17.12 72.8 72.9 73.1 73.0 2015 ............................................................... 17.30 17.46 17.61 17.28 72.9 72.9 73.0 73.3 2016 ............................................................... 17.49 17.70 17.80 17.87 72.9 73.2 73.2 73.2 2017 ............................................................... 18.18 – – – 73.3 – – –
Total benefits 2006 ............................................................... – – – 5.34 – – – 26.7 2007 ............................................................... 5.35 5.39 5.50 5.47 26.5 26.7 26.9 26.7 2008 ............................................................... 5.57 5.59 5.66 5.65 26.9 26.8 27.0 26.9 2009 ............................................................... 5.67 5.68 5.68 5.71 26.9 26.8 26.8 26.7 2010 ............................................................... 5.83 5.88 5.91 5.92 27.0 27.0 27.1 27.3
2011 ............................................................... 5.87 5.99 6.03 5.88 27.1 27.3 27.2 26.5 2012 ............................................................... 5.96 5.99 5.97 5.97 26.7 26.7 26.6 26.7 2013 ............................................................... 6.11 6.09 6.15 6.11 27.0 26.9 27.0 26.8 2014 ............................................................... 6.24 6.24 6.28 6.33 27.2 27.1 26.9 27.0 2015 ............................................................... 6.43 6.50 6.53 6.30 27.1 27.1 27.0 26.7 2016 ............................................................... 6.50 6.49 6.52 6.54 27.1 26.8 26.8 26.8 2017 ............................................................... 6.60 – – – 26.7 – – –
Paid leave 2006 ............................................................... – – – 1.12 – – – 5.6 2007 ............................................................... 1.14 1.15 1.15 1.14 5.7 5.7 5.6 5.6 2008 ............................................................... 1.15 1.15 1.16 1.18 5.5 5.5 5.5 5.6 2009 ............................................................... 1.20 1.19 1.19 1.20 5.7 5.6 5.6 5.6 2010 ............................................................... 1.21 1.22 1.23 1.21 5.6 5.6 5.7 5.6
2011 ............................................................... 1.22 1.24 1.25 1.24 5.7 5.6 5.6 5.6 2012 ............................................................... 1.25 1.26 1.25 1.26 5.6 5.6 5.6 5.6 2013 ............................................................... 1.29 1.28 1.29 1.29 5.7 5.7 5.7 5.7 2014 ............................................................... 1.32 1.32 1.34 1.37 5.8 5.7 5.7 5.8 2015 ............................................................... 1.39 1.39 1.40 1.38 5.8 5.8 5.8 5.8 2016 ............................................................... 1.42 1.42 1.44 1.44 5.9 5.9 5.9 5.9 2017 ............................................................... 1.47 – – – 5.9 – – –
Supplemental pay 2006 ............................................................... – – – .49 – – – 2.4 2007 ............................................................... .48 .50 .51 .49 2.4 2.5 2.5 2.4 2008 ............................................................... .52 .52 .54 .53 2.5 2.5 2.6 2.5 2009 ............................................................... .49 .50 .49 .49 2.3 2.4 2.3 2.3 2010 ............................................................... .48 .48 .48 .63 2.2 2.2 2.2 2.9
2011 ............................................................... .50 .50 .51 .48 2.3 2.3 2.3 2.2 2012 ............................................................... .49 .49 .49 .49 2.2 2.2 2.2 2.2 2013 ............................................................... .49 .49 .50 .47 2.2 2.2 2.2 2.1 2014 ............................................................... .48 .48 .49 .54 2.1 2.1 2.1 2.3 2015 ............................................................... .56 .57 .58 .56 2.4 2.4 2.4 2.4 2016 ............................................................... .63 .64 .64 .64 2.6 2.7 2.6 2.6
See footnotes at end of table.
-129-
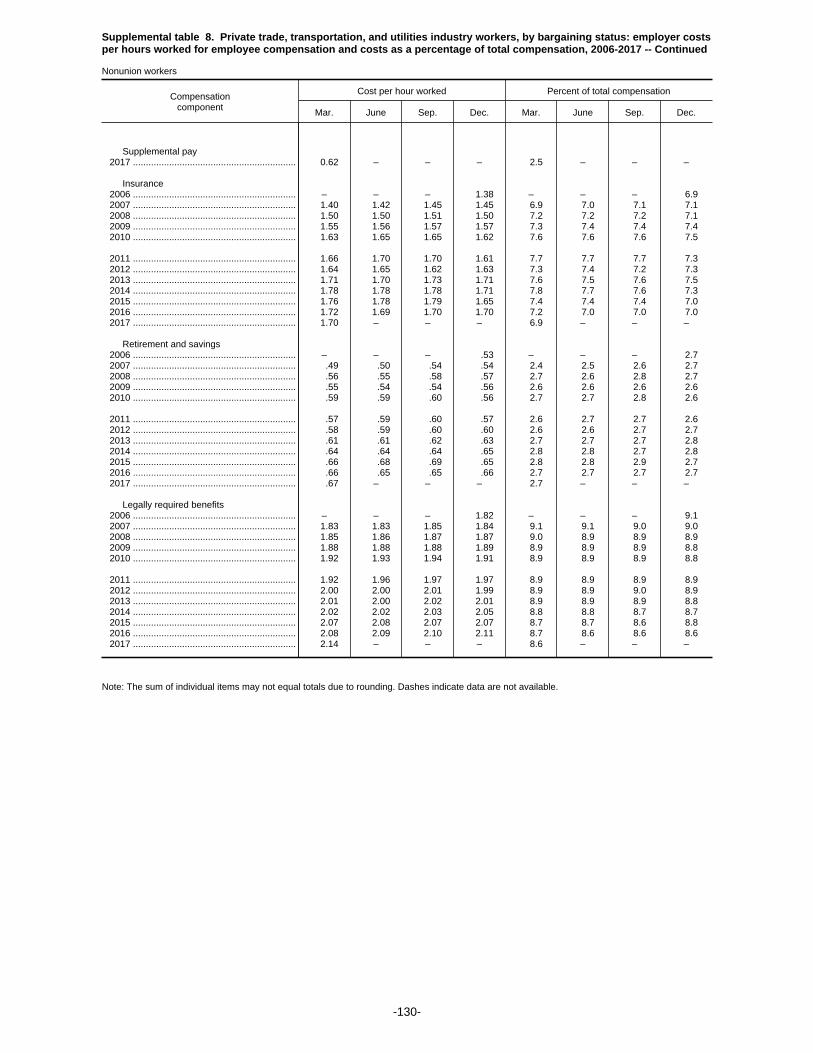
Supplemental table 8. Private trade, transportation, and utilities industry workers, by bargaining status: employer costsper hours worked for employee compensation and costs as a percentage of total compensation, 2006-2017 -- Continued
Nonunion workers
Compensationcomponent
Cost per hour worked Percent of total compensation
Mar. June Sep. Dec. Mar. June Sep. Dec.
Supplemental pay 2017 ............................................................... 0.62 – – – 2.5 – – –
Insurance 2006 ............................................................... – – – 1.38 – – – 6.9 2007 ............................................................... 1.40 1.42 1.45 1.45 6.9 7.0 7.1 7.1 2008 ............................................................... 1.50 1.50 1.51 1.50 7.2 7.2 7.2 7.1 2009 ............................................................... 1.55 1.56 1.57 1.57 7.3 7.4 7.4 7.4 2010 ............................................................... 1.63 1.65 1.65 1.62 7.6 7.6 7.6 7.5
2011 ............................................................... 1.66 1.70 1.70 1.61 7.7 7.7 7.7 7.3 2012 ............................................................... 1.64 1.65 1.62 1.63 7.3 7.4 7.2 7.3 2013 ............................................................... 1.71 1.70 1.73 1.71 7.6 7.5 7.6 7.5 2014 ............................................................... 1.78 1.78 1.78 1.71 7.8 7.7 7.6 7.3 2015 ............................................................... 1.76 1.78 1.79 1.65 7.4 7.4 7.4 7.0 2016 ............................................................... 1.72 1.69 1.70 1.70 7.2 7.0 7.0 7.0 2017 ............................................................... 1.70 – – – 6.9 – – –
Retirement and savings 2006 ............................................................... – – – .53 – – – 2.7 2007 ............................................................... .49 .50 .54 .54 2.4 2.5 2.6 2.7 2008 ............................................................... .56 .55 .58 .57 2.7 2.6 2.8 2.7 2009 ............................................................... .55 .54 .54 .56 2.6 2.6 2.6 2.6 2010 ............................................................... .59 .59 .60 .56 2.7 2.7 2.8 2.6
2011 ............................................................... .57 .59 .60 .57 2.6 2.7 2.7 2.6 2012 ............................................................... .58 .59 .60 .60 2.6 2.6 2.7 2.7 2013 ............................................................... .61 .61 .62 .63 2.7 2.7 2.7 2.8 2014 ............................................................... .64 .64 .64 .65 2.8 2.8 2.7 2.8 2015 ............................................................... .66 .68 .69 .65 2.8 2.8 2.9 2.7 2016 ............................................................... .66 .65 .65 .66 2.7 2.7 2.7 2.7 2017 ............................................................... .67 – – – 2.7 – – –
Legally required benefits 2006 ............................................................... – – – 1.82 – – – 9.1 2007 ............................................................... 1.83 1.83 1.85 1.84 9.1 9.1 9.0 9.0 2008 ............................................................... 1.85 1.86 1.87 1.87 9.0 8.9 8.9 8.9 2009 ............................................................... 1.88 1.88 1.88 1.89 8.9 8.9 8.9 8.8 2010 ............................................................... 1.92 1.93 1.94 1.91 8.9 8.9 8.9 8.8
2011 ............................................................... 1.92 1.96 1.97 1.97 8.9 8.9 8.9 8.9 2012 ............................................................... 2.00 2.00 2.01 1.99 8.9 8.9 9.0 8.9 2013 ............................................................... 2.01 2.00 2.02 2.01 8.9 8.9 8.9 8.8 2014 ............................................................... 2.02 2.02 2.03 2.05 8.8 8.8 8.7 8.7 2015 ............................................................... 2.07 2.08 2.07 2.07 8.7 8.7 8.6 8.8 2016 ............................................................... 2.08 2.09 2.10 2.11 8.7 8.6 8.6 8.6 2017 ............................................................... 2.14 – – – 8.6 – – –
Note: The sum of individual items may not equal totals due to rounding. Dashes indicate data are not available.
-130-

Supplemental table 9. Private wholesale trade industry workers, by occupational group: employer costs per hoursworked for employee compensation and costs as a percentage of total compensation, 2006-2017
All workers
Compensationcomponent
Cost per hour worked Percent of total compensation
Mar. June Sep. Dec. Mar. June Sep. Dec.
Total compensation 2006 ............................................................... – – – $28.08 – – – 100.0 2007 ............................................................... 28.21 28.15 28.44 28.78 100.0 100.0 100.0 100.0 2008 ............................................................... 29.02 29.28 29.18 29.68 100.0 100.0 100.0 100.0 2009 ............................................................... 29.77 29.67 29.45 29.76 100.0 100.0 100.0 100.0 2010 ............................................................... 30.01 30.29 30.16 31.26 100.0 100.0 100.0 100.0
2011 ............................................................... 30.05 30.87 31.30 31.55 100.0 100.0 100.0 100.0 2012 ............................................................... 31.11 31.11 31.35 31.45 100.0 100.0 100.0 100.0 2013 ............................................................... 31.42 31.70 31.81 32.31 100.0 100.0 100.0 100.0 2014 ............................................................... 32.34 32.46 33.04 34.34 100.0 100.0 100.0 100.0 2015 ............................................................... 34.50 34.95 35.30 34.95 100.0 100.0 100.0 100.0 2016 ............................................................... 35.38 35.45 35.79 36.01 100.0 100.0 100.0 100.0 2017 ............................................................... 36.48 – – – 100.0 – – –
Wages and salaries 2006 ............................................................... – – – 19.69 – – – 70.1 2007 ............................................................... 19.80 19.63 19.88 20.19 70.2 69.7 69.9 70.2 2008 ............................................................... 20.29 20.54 20.39 20.84 69.9 70.2 69.9 70.2 2009 ............................................................... 20.95 20.84 20.63 20.80 70.4 70.2 70.1 69.9 2010 ............................................................... 20.87 21.10 20.96 21.50 69.5 69.7 69.5 68.8
2011 ............................................................... 21.02 21.45 21.78 22.30 70.0 69.5 69.6 70.7 2012 ............................................................... 21.97 21.96 22.15 22.13 70.6 70.6 70.7 70.4 2013 ............................................................... 22.03 22.22 22.32 22.91 70.1 70.1 70.1 70.9 2014 ............................................................... 22.84 22.89 23.39 24.19 70.6 70.5 70.8 70.5 2015 ............................................................... 24.29 24.55 24.84 24.74 70.4 70.2 70.4 70.8 2016 ............................................................... 25.03 25.08 25.29 25.40 70.8 70.8 70.7 70.5 2017 ............................................................... 25.79 – – – 70.7 – – –
Total benefits 2006 ............................................................... – – – 8.39 – – – 29.9 2007 ............................................................... 8.40 8.52 8.56 8.58 29.8 30.3 30.1 29.8 2008 ............................................................... 8.73 8.74 8.80 8.84 30.1 29.8 30.1 29.8 2009 ............................................................... 8.82 8.83 8.81 8.96 29.6 29.8 29.9 30.1 2010 ............................................................... 9.14 9.19 9.20 9.76 30.5 30.3 30.5 31.2
2011 ............................................................... 9.03 9.41 9.52 9.25 30.0 30.5 30.4 29.3 2012 ............................................................... 9.14 9.15 9.19 9.31 29.4 29.4 29.3 29.6 2013 ............................................................... 9.38 9.48 9.50 9.40 29.9 29.9 29.9 29.1 2014 ............................................................... 9.50 9.58 9.65 10.15 29.4 29.5 29.2 29.5 2015 ............................................................... 10.21 10.40 10.46 10.21 29.6 29.8 29.6 29.2 2016 ............................................................... 10.35 10.37 10.50 10.61 29.2 29.2 29.3 29.5 2017 ............................................................... 10.69 – – – 29.3 – – –
Paid leave 2006 ............................................................... – – – 1.91 – – – 6.8 2007 ............................................................... 1.90 1.92 1.91 1.92 6.8 6.8 6.7 6.7 2008 ............................................................... 1.91 1.90 1.92 2.00 6.6 6.5 6.6 6.7 2009 ............................................................... 2.02 2.00 1.99 2.00 6.8 6.7 6.8 6.7 2010 ............................................................... 2.02 2.02 2.02 2.05 6.7 6.7 6.7 6.6
2011 ............................................................... 2.03 2.06 2.08 2.14 6.7 6.7 6.6 6.8 2012 ............................................................... 2.11 2.12 2.11 2.19 6.8 6.8 6.7 7.0 2013 ............................................................... 2.22 2.23 2.24 2.23 7.1 7.0 7.0 6.9 2014 ............................................................... 2.27 2.26 2.30 2.45 7.0 7.0 7.0 7.1 2015 ............................................................... 2.45 2.48 2.48 2.52 7.1 7.1 7.0 7.2 2016 ............................................................... 2.54 2.53 2.59 2.61 7.2 7.1 7.2 7.2 2017 ............................................................... 2.64 – – – 7.2 – – –
Supplemental pay 2006 ............................................................... – – – .92 – – – 3.3 2007 ............................................................... .91 .97 .98 .93 3.2 3.5 3.4 3.2 2008 ............................................................... 1.00 1.02 1.04 .97 3.4 3.5 3.6 3.3 2009 ............................................................... .87 .88 .89 .95 2.9 3.0 3.0 3.2 2010 ............................................................... .93 .93 .92 1.59 3.1 3.1 3.0 5.1
2011 ............................................................... 1.00 .98 .98 .93 3.3 3.2 3.1 2.9 2012 ............................................................... .96 .95 .96 .93 3.1 3.0 3.0 3.0 2013 ............................................................... .93 .95 .93 .82 3.0 3.0 2.9 2.5 2014 ............................................................... .83 .84 .86 1.02 2.6 2.6 2.6 3.0 2015 ............................................................... 1.03 1.06 1.06 1.04 3.0 3.0 3.0 3.0 2016 ............................................................... 1.07 1.05 1.05 1.05 3.0 3.0 2.9 2.9
See footnotes at end of table.
-131-
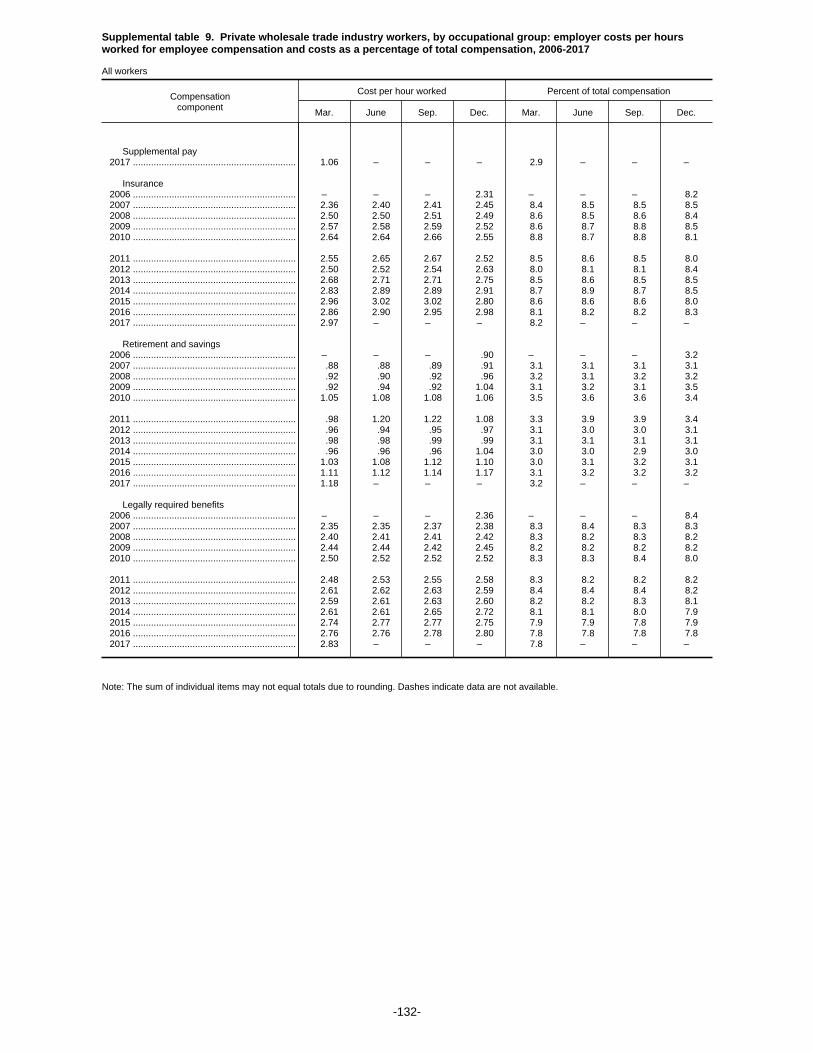
Supplemental table 9. Private wholesale trade industry workers, by occupational group: employer costs per hoursworked for employee compensation and costs as a percentage of total compensation, 2006-2017
All workers
Compensationcomponent
Cost per hour worked Percent of total compensation
Mar. June Sep. Dec. Mar. June Sep. Dec.
Supplemental pay 2017 ............................................................... 1.06 – – – 2.9 – – –
Insurance 2006 ............................................................... – – – 2.31 – – – 8.2 2007 ............................................................... 2.36 2.40 2.41 2.45 8.4 8.5 8.5 8.5 2008 ............................................................... 2.50 2.50 2.51 2.49 8.6 8.5 8.6 8.4 2009 ............................................................... 2.57 2.58 2.59 2.52 8.6 8.7 8.8 8.5 2010 ............................................................... 2.64 2.64 2.66 2.55 8.8 8.7 8.8 8.1
2011 ............................................................... 2.55 2.65 2.67 2.52 8.5 8.6 8.5 8.0 2012 ............................................................... 2.50 2.52 2.54 2.63 8.0 8.1 8.1 8.4 2013 ............................................................... 2.68 2.71 2.71 2.75 8.5 8.6 8.5 8.5 2014 ............................................................... 2.83 2.89 2.89 2.91 8.7 8.9 8.7 8.5 2015 ............................................................... 2.96 3.02 3.02 2.80 8.6 8.6 8.6 8.0 2016 ............................................................... 2.86 2.90 2.95 2.98 8.1 8.2 8.2 8.3 2017 ............................................................... 2.97 – – – 8.2 – – –
Retirement and savings 2006 ............................................................... – – – .90 – – – 3.2 2007 ............................................................... .88 .88 .89 .91 3.1 3.1 3.1 3.1 2008 ............................................................... .92 .90 .92 .96 3.2 3.1 3.2 3.2 2009 ............................................................... .92 .94 .92 1.04 3.1 3.2 3.1 3.5 2010 ............................................................... 1.05 1.08 1.08 1.06 3.5 3.6 3.6 3.4
2011 ............................................................... .98 1.20 1.22 1.08 3.3 3.9 3.9 3.4 2012 ............................................................... .96 .94 .95 .97 3.1 3.0 3.0 3.1 2013 ............................................................... .98 .98 .99 .99 3.1 3.1 3.1 3.1 2014 ............................................................... .96 .96 .96 1.04 3.0 3.0 2.9 3.0 2015 ............................................................... 1.03 1.08 1.12 1.10 3.0 3.1 3.2 3.1 2016 ............................................................... 1.11 1.12 1.14 1.17 3.1 3.2 3.2 3.2 2017 ............................................................... 1.18 – – – 3.2 – – –
Legally required benefits 2006 ............................................................... – – – 2.36 – – – 8.4 2007 ............................................................... 2.35 2.35 2.37 2.38 8.3 8.4 8.3 8.3 2008 ............................................................... 2.40 2.41 2.41 2.42 8.3 8.2 8.3 8.2 2009 ............................................................... 2.44 2.44 2.42 2.45 8.2 8.2 8.2 8.2 2010 ............................................................... 2.50 2.52 2.52 2.52 8.3 8.3 8.4 8.0
2011 ............................................................... 2.48 2.53 2.55 2.58 8.3 8.2 8.2 8.2 2012 ............................................................... 2.61 2.62 2.63 2.59 8.4 8.4 8.4 8.2 2013 ............................................................... 2.59 2.61 2.63 2.60 8.2 8.2 8.3 8.1 2014 ............................................................... 2.61 2.61 2.65 2.72 8.1 8.1 8.0 7.9 2015 ............................................................... 2.74 2.77 2.77 2.75 7.9 7.9 7.8 7.9 2016 ............................................................... 2.76 2.76 2.78 2.80 7.8 7.8 7.8 7.8 2017 ............................................................... 2.83 – – – 7.8 – – –
Note: The sum of individual items may not equal totals due to rounding. Dashes indicate data are not available.
-132-
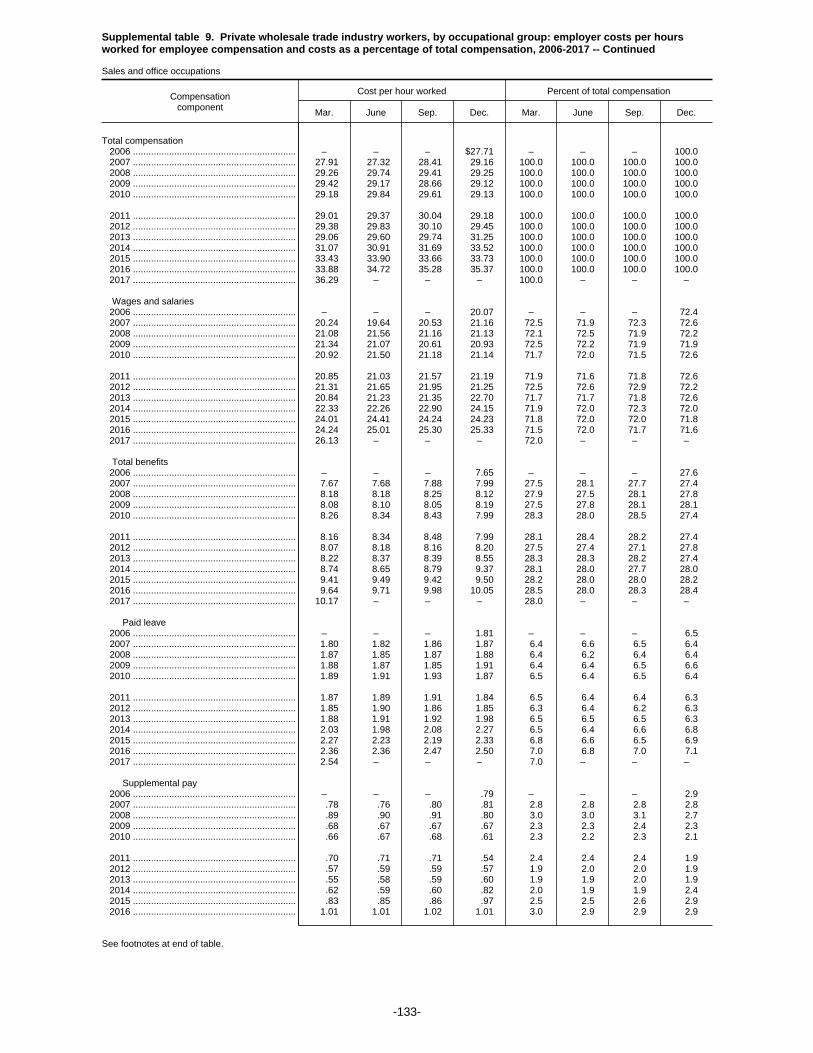
Supplemental table 9. Private wholesale trade industry workers, by occupational group: employer costs per hoursworked for employee compensation and costs as a percentage of total compensation, 2006-2017 -- Continued
Sales and office occupations
Compensationcomponent
Cost per hour worked Percent of total compensation
Mar. June Sep. Dec. Mar. June Sep. Dec.
Total compensation 2006 ............................................................... – – – $27.71 – – – 100.0 2007 ............................................................... 27.91 27.32 28.41 29.16 100.0 100.0 100.0 100.0 2008 ............................................................... 29.26 29.74 29.41 29.25 100.0 100.0 100.0 100.0 2009 ............................................................... 29.42 29.17 28.66 29.12 100.0 100.0 100.0 100.0 2010 ............................................................... 29.18 29.84 29.61 29.13 100.0 100.0 100.0 100.0
2011 ............................................................... 29.01 29.37 30.04 29.18 100.0 100.0 100.0 100.0 2012 ............................................................... 29.38 29.83 30.10 29.45 100.0 100.0 100.0 100.0 2013 ............................................................... 29.06 29.60 29.74 31.25 100.0 100.0 100.0 100.0 2014 ............................................................... 31.07 30.91 31.69 33.52 100.0 100.0 100.0 100.0 2015 ............................................................... 33.43 33.90 33.66 33.73 100.0 100.0 100.0 100.0 2016 ............................................................... 33.88 34.72 35.28 35.37 100.0 100.0 100.0 100.0 2017 ............................................................... 36.29 – – – 100.0 – – –
Wages and salaries 2006 ............................................................... – – – 20.07 – – – 72.4 2007 ............................................................... 20.24 19.64 20.53 21.16 72.5 71.9 72.3 72.6 2008 ............................................................... 21.08 21.56 21.16 21.13 72.1 72.5 71.9 72.2 2009 ............................................................... 21.34 21.07 20.61 20.93 72.5 72.2 71.9 71.9 2010 ............................................................... 20.92 21.50 21.18 21.14 71.7 72.0 71.5 72.6
2011 ............................................................... 20.85 21.03 21.57 21.19 71.9 71.6 71.8 72.6 2012 ............................................................... 21.31 21.65 21.95 21.25 72.5 72.6 72.9 72.2 2013 ............................................................... 20.84 21.23 21.35 22.70 71.7 71.7 71.8 72.6 2014 ............................................................... 22.33 22.26 22.90 24.15 71.9 72.0 72.3 72.0 2015 ............................................................... 24.01 24.41 24.24 24.23 71.8 72.0 72.0 71.8 2016 ............................................................... 24.24 25.01 25.30 25.33 71.5 72.0 71.7 71.6 2017 ............................................................... 26.13 – – – 72.0 – – –
Total benefits 2006 ............................................................... – – – 7.65 – – – 27.6 2007 ............................................................... 7.67 7.68 7.88 7.99 27.5 28.1 27.7 27.4 2008 ............................................................... 8.18 8.18 8.25 8.12 27.9 27.5 28.1 27.8 2009 ............................................................... 8.08 8.10 8.05 8.19 27.5 27.8 28.1 28.1 2010 ............................................................... 8.26 8.34 8.43 7.99 28.3 28.0 28.5 27.4
2011 ............................................................... 8.16 8.34 8.48 7.99 28.1 28.4 28.2 27.4 2012 ............................................................... 8.07 8.18 8.16 8.20 27.5 27.4 27.1 27.8 2013 ............................................................... 8.22 8.37 8.39 8.55 28.3 28.3 28.2 27.4 2014 ............................................................... 8.74 8.65 8.79 9.37 28.1 28.0 27.7 28.0 2015 ............................................................... 9.41 9.49 9.42 9.50 28.2 28.0 28.0 28.2 2016 ............................................................... 9.64 9.71 9.98 10.05 28.5 28.0 28.3 28.4 2017 ............................................................... 10.17 – – – 28.0 – – –
Paid leave 2006 ............................................................... – – – 1.81 – – – 6.5 2007 ............................................................... 1.80 1.82 1.86 1.87 6.4 6.6 6.5 6.4 2008 ............................................................... 1.87 1.85 1.87 1.88 6.4 6.2 6.4 6.4 2009 ............................................................... 1.88 1.87 1.85 1.91 6.4 6.4 6.5 6.6 2010 ............................................................... 1.89 1.91 1.93 1.87 6.5 6.4 6.5 6.4
2011 ............................................................... 1.87 1.89 1.91 1.84 6.5 6.4 6.4 6.3 2012 ............................................................... 1.85 1.90 1.86 1.85 6.3 6.4 6.2 6.3 2013 ............................................................... 1.88 1.91 1.92 1.98 6.5 6.5 6.5 6.3 2014 ............................................................... 2.03 1.98 2.08 2.27 6.5 6.4 6.6 6.8 2015 ............................................................... 2.27 2.23 2.19 2.33 6.8 6.6 6.5 6.9 2016 ............................................................... 2.36 2.36 2.47 2.50 7.0 6.8 7.0 7.1 2017 ............................................................... 2.54 – – – 7.0 – – –
Supplemental pay 2006 ............................................................... – – – .79 – – – 2.9 2007 ............................................................... .78 .76 .80 .81 2.8 2.8 2.8 2.8 2008 ............................................................... .89 .90 .91 .80 3.0 3.0 3.1 2.7 2009 ............................................................... .68 .67 .67 .67 2.3 2.3 2.4 2.3 2010 ............................................................... .66 .67 .68 .61 2.3 2.2 2.3 2.1
2011 ............................................................... .70 .71 .71 .54 2.4 2.4 2.4 1.9 2012 ............................................................... .57 .59 .59 .57 1.9 2.0 2.0 1.9 2013 ............................................................... .55 .58 .59 .60 1.9 1.9 2.0 1.9 2014 ............................................................... .62 .59 .60 .82 2.0 1.9 1.9 2.4 2015 ............................................................... .83 .85 .86 .97 2.5 2.5 2.6 2.9 2016 ............................................................... 1.01 1.01 1.02 1.01 3.0 2.9 2.9 2.9
See footnotes at end of table.
-133-

Supplemental table 9. Private wholesale trade industry workers, by occupational group: employer costs per hoursworked for employee compensation and costs as a percentage of total compensation, 2006-2017 -- Continued
Sales and office occupations
Compensationcomponent
Cost per hour worked Percent of total compensation
Mar. June Sep. Dec. Mar. June Sep. Dec.
Supplemental pay 2017 ............................................................... 1.01 – – – 2.8 – – –
Insurance 2006 ............................................................... – – – 2.15 – – – 7.8 2007 ............................................................... 2.21 2.25 2.29 2.34 7.9 8.2 8.1 8.0 2008 ............................................................... 2.43 2.42 2.45 2.41 8.3 8.1 8.3 8.2 2009 ............................................................... 2.48 2.52 2.52 2.46 8.4 8.6 8.8 8.5 2010 ............................................................... 2.53 2.54 2.57 2.39 8.7 8.5 8.7 8.2
2011 ............................................................... 2.46 2.56 2.59 2.45 8.5 8.7 8.6 8.4 2012 ............................................................... 2.48 2.51 2.52 2.61 8.5 8.4 8.4 8.9 2013 ............................................................... 2.65 2.71 2.70 2.79 9.1 9.2 9.1 8.9 2014 ............................................................... 2.87 2.91 2.89 2.89 9.3 9.4 9.1 8.6 2015 ............................................................... 2.92 2.97 2.94 2.76 8.7 8.8 8.7 8.2 2016 ............................................................... 2.85 2.89 2.97 2.98 8.4 8.3 8.4 8.4 2017 ............................................................... 2.98 – – – 8.2 – – –
Retirement and savings 2006 ............................................................... – – – .77 – – – 2.8 2007 ............................................................... .78 .76 .78 .79 2.8 2.8 2.7 2.7 2008 ............................................................... .80 .82 .83 .84 2.7 2.7 2.8 2.9 2009 ............................................................... .83 .85 .84 .95 2.8 2.9 2.9 3.2 2010 ............................................................... .95 .95 .97 .88 3.3 3.2 3.3 3.0
2011 ............................................................... .87 .90 .95 .86 3.0 3.1 3.2 2.9 2012 ............................................................... .80 .80 .80 .84 2.7 2.7 2.7 2.8 2013 ............................................................... .83 .83 .83 .83 2.9 2.8 2.8 2.6 2014 ............................................................... .83 .81 .80 .89 2.7 2.6 2.5 2.7 2015 ............................................................... .90 .92 .92 .93 2.7 2.7 2.7 2.8 2016 ............................................................... .93 .93 .96 .99 2.8 2.7 2.7 2.8 2017 ............................................................... 1.01 – – – 2.8 – – –
Legally required benefits 2006 ............................................................... – – – 2.12 – – – 7.6 2007 ............................................................... 2.11 2.09 2.15 2.17 7.5 7.7 7.6 7.4 2008 ............................................................... 2.18 2.20 2.20 2.18 7.5 7.4 7.5 7.5 2009 ............................................................... 2.20 2.19 2.17 2.21 7.5 7.5 7.6 7.6 2010 ............................................................... 2.24 2.27 2.27 2.24 7.7 7.6 7.7 7.7
2011 ............................................................... 2.26 2.28 2.31 2.31 7.8 7.8 7.7 7.9 2012 ............................................................... 2.36 2.38 2.39 2.32 8.0 8.0 7.9 7.9 2013 ............................................................... 2.30 2.34 2.35 2.36 7.9 7.9 7.9 7.6 2014 ............................................................... 2.38 2.36 2.41 2.50 7.7 7.6 7.6 7.5 2015 ............................................................... 2.49 2.52 2.49 2.50 7.5 7.4 7.4 7.4 2016 ............................................................... 2.49 2.51 2.56 2.57 7.3 7.2 7.2 7.3 2017 ............................................................... 2.63 – – – 7.2 – – –
Note: The sum of individual items may not equal totals due to rounding. Dashes indicate data are not available.
-134-

Supplemental table 9. Private wholesale trade industry workers, by occupational group: employer costs per hoursworked for employee compensation and costs as a percentage of total compensation, 2006-2017 -- Continued
Office and administrative support occupations
Compensationcomponent
Cost per hour worked Percent of total compensation
Mar. June Sep. Dec. Mar. June Sep. Dec.
Total compensation 2006 ............................................................... – – – $21.05 – – – 100.0 2007 ............................................................... 21.54 21.75 21.98 22.24 100.0 100.0 100.0 100.0 2008 ............................................................... 22.69 22.82 23.07 22.97 100.0 100.0 100.0 100.0 2009 ............................................................... 23.34 23.27 23.27 23.14 100.0 100.0 100.0 100.0 2010 ............................................................... 23.27 23.29 23.42 22.65 100.0 100.0 100.0 100.0
2011 ............................................................... 22.93 23.06 23.43 23.32 100.0 100.0 100.0 100.0 2012 ............................................................... 23.47 23.41 23.50 22.86 100.0 100.0 100.0 100.0 2013 ............................................................... 22.77 23.14 23.05 22.93 100.0 100.0 100.0 100.0 2014 ............................................................... 23.03 23.34 23.34 23.83 100.0 100.0 100.0 100.0 2015 ............................................................... 24.08 24.46 24.40 24.48 100.0 100.0 100.0 100.0 2016 ............................................................... 24.84 24.96 25.02 25.09 100.0 100.0 100.0 100.0 2017 ............................................................... 25.36 – – – 100.0 – – –
Wages and salaries 2006 ............................................................... – – – 14.78 – – – 70.2 2007 ............................................................... 15.13 15.27 15.42 15.57 70.2 70.2 70.1 70.0 2008 ............................................................... 15.86 15.93 16.09 16.05 69.9 69.8 69.7 69.9 2009 ............................................................... 16.37 16.28 16.24 16.19 70.1 70.0 69.8 70.0 2010 ............................................................... 16.23 16.26 16.33 16.06 69.7 69.8 69.7 70.9
2011 ............................................................... 16.18 16.12 16.35 16.41 70.6 69.9 69.8 70.4 2012 ............................................................... 16.60 16.52 16.62 16.09 70.7 70.6 70.7 70.4 2013 ............................................................... 16.10 16.31 16.26 16.12 70.7 70.5 70.6 70.3 2014 ............................................................... 16.15 16.33 16.36 16.60 70.2 70.0 70.1 69.7 2015 ............................................................... 16.76 17.02 16.96 17.04 69.6 69.6 69.5 69.6 2016 ............................................................... 17.28 17.32 17.36 17.41 69.5 69.4 69.4 69.4 2017 ............................................................... 17.61 – – – 69.5 – – –
Total benefits 2006 ............................................................... – – – 6.27 – – – 29.8 2007 ............................................................... 6.41 6.48 6.56 6.67 29.8 29.8 29.9 30.0 2008 ............................................................... 6.84 6.89 6.98 6.92 30.1 30.2 30.3 30.1 2009 ............................................................... 6.97 6.99 7.03 6.95 29.9 30.0 30.2 30.0 2010 ............................................................... 7.04 7.03 7.09 6.60 30.3 30.2 30.3 29.1
2011 ............................................................... 6.75 6.93 7.08 6.91 29.4 30.1 30.2 29.6 2012 ............................................................... 6.87 6.89 6.89 6.77 29.3 29.4 29.3 29.6 2013 ............................................................... 6.67 6.83 6.79 6.81 29.3 29.5 29.4 29.7 2014 ............................................................... 6.87 7.01 6.98 7.22 29.8 30.0 29.9 30.3 2015 ............................................................... 7.32 7.44 7.44 7.44 30.4 30.4 30.5 30.4 2016 ............................................................... 7.57 7.64 7.66 7.68 30.5 30.6 30.6 30.6 2017 ............................................................... 7.74 – – – 30.5 – – –
Paid leave 2006 ............................................................... – – – 1.41 – – – 6.7 2007 ............................................................... 1.43 1.45 1.45 1.47 6.7 6.7 6.6 6.6 2008 ............................................................... 1.48 1.48 1.50 1.50 6.5 6.5 6.5 6.5 2009 ............................................................... 1.52 1.51 1.51 1.53 6.5 6.5 6.5 6.6 2010 ............................................................... 1.53 1.53 1.54 1.47 6.6 6.6 6.6 6.5
2011 ............................................................... 1.48 1.48 1.50 1.49 6.4 6.4 6.4 6.4 2012 ............................................................... 1.51 1.50 1.50 1.46 6.4 6.4 6.4 6.4 2013 ............................................................... 1.46 1.49 1.48 1.45 6.4 6.4 6.4 6.3 2014 ............................................................... 1.45 1.48 1.48 1.54 6.3 6.3 6.3 6.5 2015 ............................................................... 1.56 1.59 1.59 1.65 6.5 6.5 6.5 6.7 2016 ............................................................... 1.67 1.67 1.67 1.66 6.7 6.7 6.7 6.6 2017 ............................................................... 1.68 – – – 6.6 – – –
Supplemental pay 2006 ............................................................... – – – .51 – – – 2.4 2007 ............................................................... .54 .57 .56 .58 2.5 2.6 2.5 2.6 2008 ............................................................... .61 .62 .63 .63 2.7 2.7 2.7 2.7 2009 ............................................................... .56 .55 .56 .53 2.4 2.4 2.4 2.3 2010 ............................................................... .51 .53 .53 .48 2.2 2.3 2.3 2.1
2011 ............................................................... .54 .55 .55 .48 2.3 2.4 2.4 2.1 2012 ............................................................... .47 .50 .49 .49 2.0 2.1 2.1 2.1 2013 ............................................................... .44 .47 .45 .48 1.9 2.0 1.9 2.1 2014 ............................................................... .49 .50 .51 .73 2.1 2.2 2.2 3.1 2015 ............................................................... .75 .76 .76 .88 3.1 3.1 3.1 3.6 2016 ............................................................... .89 .93 .93 .93 3.6 3.7 3.7 3.7
See footnotes at end of table.
-135-

Supplemental table 9. Private wholesale trade industry workers, by occupational group: employer costs per hoursworked for employee compensation and costs as a percentage of total compensation, 2006-2017 -- Continued
Office and administrative support occupations
Compensationcomponent
Cost per hour worked Percent of total compensation
Mar. June Sep. Dec. Mar. June Sep. Dec.
Supplemental pay 2017 ............................................................... 0.94 – – – 3.7 – – –
Insurance 2006 ............................................................... – – – 2.10 – – – 10.0 2007 ............................................................... 2.16 2.16 2.20 2.25 10.0 9.9 10.0 10.1 2008 ............................................................... 2.33 2.34 2.38 2.34 10.3 10.2 10.3 10.2 2009 ............................................................... 2.41 2.45 2.49 2.39 10.3 10.6 10.7 10.3 2010 ............................................................... 2.44 2.41 2.44 2.24 10.5 10.4 10.4 9.9
2011 ............................................................... 2.28 2.38 2.45 2.37 9.9 10.3 10.4 10.2 2012 ............................................................... 2.42 2.43 2.43 2.44 10.3 10.4 10.3 10.7 2013 ............................................................... 2.41 2.48 2.48 2.52 10.6 10.7 10.8 11.0 2014 ............................................................... 2.56 2.63 2.63 2.54 11.1 11.3 11.3 10.7 2015 ............................................................... 2.57 2.63 2.64 2.41 10.7 10.8 10.8 9.9 2016 ............................................................... 2.50 2.54 2.56 2.58 10.1 10.2 10.2 10.3 2017 ............................................................... 2.59 – – – 10.2 – – –
Retirement and savings 2006 ............................................................... – – – .53 – – – 2.5 2007 ............................................................... .53 .54 .56 .59 2.5 2.5 2.6 2.6 2008 ............................................................... .61 .64 .65 .65 2.7 2.8 2.8 2.8 2009 ............................................................... .65 .65 .66 .68 2.8 2.8 2.8 2.9 2010 ............................................................... .70 .69 .71 .59 3.0 3.0 3.0 2.6
2011 ............................................................... .60 .66 .70 .66 2.6 2.9 3.0 2.8 2012 ............................................................... .52 .50 .50 .47 2.2 2.2 2.1 2.1 2013 ............................................................... .48 .48 .47 .48 2.1 2.1 2.0 2.1 2014 ............................................................... .49 .51 .48 .52 2.1 2.2 2.1 2.2 2015 ............................................................... .52 .54 .55 .57 2.2 2.2 2.3 2.3 2016 ............................................................... .56 .57 .58 .59 2.3 2.3 2.3 2.3 2017 ............................................................... .60 – – – 2.4 – – –
Legally required benefits 2006 ............................................................... – – – 1.73 – – – 8.2 2007 ............................................................... 1.75 1.76 1.78 1.79 8.1 8.1 8.1 8.0 2008 ............................................................... 1.82 1.82 1.83 1.81 8.0 8.0 7.9 7.9 2009 ............................................................... 1.83 1.83 1.82 1.82 7.8 7.8 7.8 7.9 2010 ............................................................... 1.86 1.87 1.88 1.83 8.0 8.0 8.0 8.1
2011 ............................................................... 1.86 1.87 1.89 1.91 8.1 8.1 8.1 8.2 2012 ............................................................... 1.95 1.95 1.97 1.90 8.3 8.3 8.4 8.3 2013 ............................................................... 1.88 1.91 1.91 1.88 8.2 8.2 8.3 8.2 2014 ............................................................... 1.87 1.89 1.87 1.90 8.1 8.1 8.0 8.0 2015 ............................................................... 1.91 1.93 1.91 1.93 7.9 7.9 7.8 7.9 2016 ............................................................... 1.94 1.93 1.93 1.93 7.8 7.7 7.7 7.7 2017 ............................................................... 1.94 – – – 7.7 – – –
Note: The sum of individual items may not equal totals due to rounding. Dashes indicate data are not available.
-136-
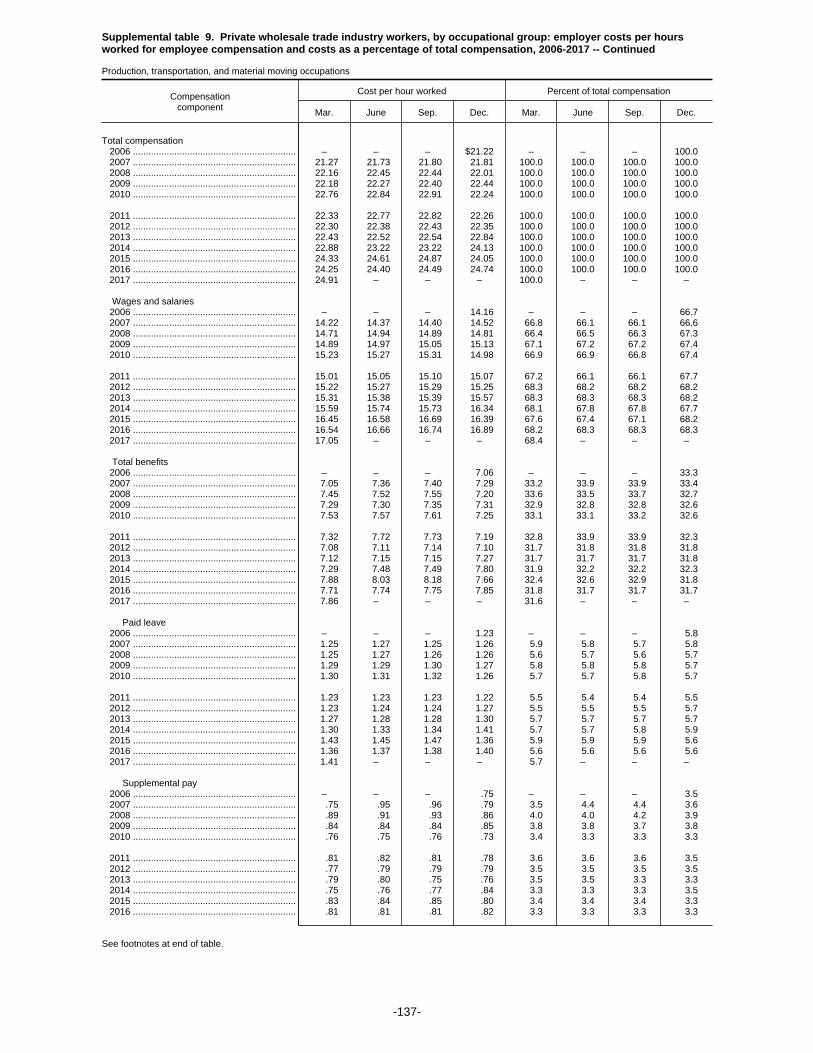
Supplemental table 9. Private wholesale trade industry workers, by occupational group: employer costs per hoursworked for employee compensation and costs as a percentage of total compensation, 2006-2017 -- Continued
Production, transportation, and material moving occupations
Compensationcomponent
Cost per hour worked Percent of total compensation
Mar. June Sep. Dec. Mar. June Sep. Dec.
Total compensation 2006 ............................................................... – – – $21.22 – – – 100.0 2007 ............................................................... 21.27 21.73 21.80 21.81 100.0 100.0 100.0 100.0 2008 ............................................................... 22.16 22.45 22.44 22.01 100.0 100.0 100.0 100.0 2009 ............................................................... 22.18 22.27 22.40 22.44 100.0 100.0 100.0 100.0 2010 ............................................................... 22.76 22.84 22.91 22.24 100.0 100.0 100.0 100.0
2011 ............................................................... 22.33 22.77 22.82 22.26 100.0 100.0 100.0 100.0 2012 ............................................................... 22.30 22.38 22.43 22.35 100.0 100.0 100.0 100.0 2013 ............................................................... 22.43 22.52 22.54 22.84 100.0 100.0 100.0 100.0 2014 ............................................................... 22.88 23.22 23.22 24.13 100.0 100.0 100.0 100.0 2015 ............................................................... 24.33 24.61 24.87 24.05 100.0 100.0 100.0 100.0 2016 ............................................................... 24.25 24.40 24.49 24.74 100.0 100.0 100.0 100.0 2017 ............................................................... 24.91 – – – 100.0 – – –
Wages and salaries 2006 ............................................................... – – – 14.16 – – – 66.7 2007 ............................................................... 14.22 14.37 14.40 14.52 66.8 66.1 66.1 66.6 2008 ............................................................... 14.71 14.94 14.89 14.81 66.4 66.5 66.3 67.3 2009 ............................................................... 14.89 14.97 15.05 15.13 67.1 67.2 67.2 67.4 2010 ............................................................... 15.23 15.27 15.31 14.98 66.9 66.9 66.8 67.4
2011 ............................................................... 15.01 15.05 15.10 15.07 67.2 66.1 66.1 67.7 2012 ............................................................... 15.22 15.27 15.29 15.25 68.3 68.2 68.2 68.2 2013 ............................................................... 15.31 15.38 15.39 15.57 68.3 68.3 68.3 68.2 2014 ............................................................... 15.59 15.74 15.73 16.34 68.1 67.8 67.8 67.7 2015 ............................................................... 16.45 16.58 16.69 16.39 67.6 67.4 67.1 68.2 2016 ............................................................... 16.54 16.66 16.74 16.89 68.2 68.3 68.3 68.3 2017 ............................................................... 17.05 – – – 68.4 – – –
Total benefits 2006 ............................................................... – – – 7.06 – – – 33.3 2007 ............................................................... 7.05 7.36 7.40 7.29 33.2 33.9 33.9 33.4 2008 ............................................................... 7.45 7.52 7.55 7.20 33.6 33.5 33.7 32.7 2009 ............................................................... 7.29 7.30 7.35 7.31 32.9 32.8 32.8 32.6 2010 ............................................................... 7.53 7.57 7.61 7.25 33.1 33.1 33.2 32.6
2011 ............................................................... 7.32 7.72 7.73 7.19 32.8 33.9 33.9 32.3 2012 ............................................................... 7.08 7.11 7.14 7.10 31.7 31.8 31.8 31.8 2013 ............................................................... 7.12 7.15 7.15 7.27 31.7 31.7 31.7 31.8 2014 ............................................................... 7.29 7.48 7.49 7.80 31.9 32.2 32.2 32.3 2015 ............................................................... 7.88 8.03 8.18 7.66 32.4 32.6 32.9 31.8 2016 ............................................................... 7.71 7.74 7.75 7.85 31.8 31.7 31.7 31.7 2017 ............................................................... 7.86 – – – 31.6 – – –
Paid leave 2006 ............................................................... – – – 1.23 – – – 5.8 2007 ............................................................... 1.25 1.27 1.25 1.26 5.9 5.8 5.7 5.8 2008 ............................................................... 1.25 1.27 1.26 1.26 5.6 5.7 5.6 5.7 2009 ............................................................... 1.29 1.29 1.30 1.27 5.8 5.8 5.8 5.7 2010 ............................................................... 1.30 1.31 1.32 1.26 5.7 5.7 5.8 5.7
2011 ............................................................... 1.23 1.23 1.23 1.22 5.5 5.4 5.4 5.5 2012 ............................................................... 1.23 1.24 1.24 1.27 5.5 5.5 5.5 5.7 2013 ............................................................... 1.27 1.28 1.28 1.30 5.7 5.7 5.7 5.7 2014 ............................................................... 1.30 1.33 1.34 1.41 5.7 5.7 5.8 5.9 2015 ............................................................... 1.43 1.45 1.47 1.36 5.9 5.9 5.9 5.6 2016 ............................................................... 1.36 1.37 1.38 1.40 5.6 5.6 5.6 5.6 2017 ............................................................... 1.41 – – – 5.7 – – –
Supplemental pay 2006 ............................................................... – – – .75 – – – 3.5 2007 ............................................................... .75 .95 .96 .79 3.5 4.4 4.4 3.6 2008 ............................................................... .89 .91 .93 .86 4.0 4.0 4.2 3.9 2009 ............................................................... .84 .84 .84 .85 3.8 3.8 3.7 3.8 2010 ............................................................... .76 .75 .76 .73 3.4 3.3 3.3 3.3
2011 ............................................................... .81 .82 .81 .78 3.6 3.6 3.6 3.5 2012 ............................................................... .77 .79 .79 .79 3.5 3.5 3.5 3.5 2013 ............................................................... .79 .80 .75 .76 3.5 3.5 3.3 3.3 2014 ............................................................... .75 .76 .77 .84 3.3 3.3 3.3 3.5 2015 ............................................................... .83 .84 .85 .80 3.4 3.4 3.4 3.3 2016 ............................................................... .81 .81 .81 .82 3.3 3.3 3.3 3.3
See footnotes at end of table.
-137-

Supplemental table 9. Private wholesale trade industry workers, by occupational group: employer costs per hoursworked for employee compensation and costs as a percentage of total compensation, 2006-2017 -- Continued
Production, transportation, and material moving occupations
Compensationcomponent
Cost per hour worked Percent of total compensation
Mar. June Sep. Dec. Mar. June Sep. Dec.
Supplemental pay 2017 ............................................................... 0.82 – – – 3.3 – – –
Insurance 2006 ............................................................... – – – 2.15 – – – 10.1 2007 ............................................................... 2.18 2.23 2.26 2.31 10.2 10.3 10.4 10.6 2008 ............................................................... 2.34 2.35 2.38 2.26 10.6 10.5 10.6 10.3 2009 ............................................................... 2.30 2.30 2.32 2.26 10.4 10.3 10.4 10.1 2010 ............................................................... 2.38 2.40 2.43 2.24 10.5 10.5 10.6 10.1
2011 ............................................................... 2.25 2.28 2.29 2.07 10.1 10.0 10.0 9.3 2012 ............................................................... 2.10 2.12 2.15 2.14 9.4 9.5 9.6 9.6 2013 ............................................................... 2.13 2.14 2.15 2.23 9.5 9.5 9.6 9.8 2014 ............................................................... 2.30 2.39 2.39 2.44 10.0 10.3 10.3 10.1 2015 ............................................................... 2.48 2.54 2.59 2.35 10.2 10.3 10.4 9.8 2016 ............................................................... 2.37 2.38 2.41 2.44 9.8 9.8 9.8 9.9 2017 ............................................................... 2.42 – – – 9.7 – – –
Retirement and savings 2006 ............................................................... – – – .74 – – – 3.5 2007 ............................................................... .69 .70 .71 .73 3.2 3.2 3.3 3.3 2008 ............................................................... .75 .74 .76 .73 3.4 3.3 3.4 3.3 2009 ............................................................... .73 .73 .75 .76 3.3 3.3 3.3 3.4 2010 ............................................................... .84 .85 .84 .82 3.7 3.7 3.7 3.7
2011 ............................................................... .81 1.15 1.14 .87 3.6 5.0 5.0 3.9 2012 ............................................................... .68 .64 .65 .62 3.0 2.9 2.9 2.8 2013 ............................................................... .64 .65 .65 .69 2.9 2.9 2.9 3.0 2014 ............................................................... .66 .69 .67 .72 2.9 3.0 2.9 3.0 2015 ............................................................... .72 .75 .80 .76 3.0 3.0 3.2 3.2 2016 ............................................................... .77 .76 .77 .79 3.2 3.1 3.2 3.2 2017 ............................................................... .80 – – – 3.2 – – –
Legally required benefits 2006 ............................................................... – – – 2.19 – – – 10.3 2007 ............................................................... 2.19 2.21 2.22 2.20 10.3 10.2 10.2 10.1 2008 ............................................................... 2.22 2.24 2.22 2.10 10.0 10.0 9.9 9.5 2009 ............................................................... 2.14 2.15 2.15 2.18 9.6 9.6 9.6 9.7 2010 ............................................................... 2.24 2.25 2.26 2.20 9.8 9.8 9.9 9.9
2011 ............................................................... 2.21 2.24 2.24 2.25 9.9 9.8 9.8 10.1 2012 ............................................................... 2.29 2.32 2.30 2.28 10.3 10.4 10.3 10.2 2013 ............................................................... 2.28 2.29 2.31 2.29 10.2 10.1 10.3 10.0 2014 ............................................................... 2.28 2.31 2.31 2.39 10.0 9.9 10.0 9.9 2015 ............................................................... 2.42 2.45 2.47 2.39 10.0 9.9 9.9 9.9 2016 ............................................................... 2.40 2.41 2.38 2.40 9.9 9.9 9.7 9.7 2017 ............................................................... 2.40 – – – 9.6 – – –
Note: The sum of individual items may not equal totals due to rounding. Dashes indicate data are not available.
-138-

Supplemental table 9. Private wholesale trade industry workers, by occupational group: employer costs per hoursworked for employee compensation and costs as a percentage of total compensation, 2006-2017 -- Continued
Transportation and material moving occupations
Compensationcomponent
Cost per hour worked Percent of total compensation
Mar. June Sep. Dec. Mar. June Sep. Dec.
Total compensation 2006 ............................................................... – – – $21.40 – – – 100.0 2007 ............................................................... 21.47 21.86 21.88 22.05 100.0 100.0 100.0 100.0 2008 ............................................................... 22.22 22.61 22.55 21.97 100.0 100.0 100.0 100.0 2009 ............................................................... 22.16 22.28 22.42 22.31 100.0 100.0 100.0 100.0 2010 ............................................................... 22.67 22.75 22.80 22.24 100.0 100.0 100.0 100.0
2011 ............................................................... 22.31 22.82 22.87 22.39 100.0 100.0 100.0 100.0 2012 ............................................................... 22.38 22.47 22.48 22.57 100.0 100.0 100.0 100.0 2013 ............................................................... 22.61 22.71 22.65 22.94 100.0 100.0 100.0 100.0 2014 ............................................................... 23.05 23.22 23.22 24.24 100.0 100.0 100.0 100.0 2015 ............................................................... 24.47 24.68 24.92 24.68 100.0 100.0 100.0 100.0 2016 ............................................................... 24.86 25.01 25.08 25.28 100.0 100.0 100.0 100.0 2017 ............................................................... 25.48 – – – 100.0 – – –
Wages and salaries 2006 ............................................................... – – – 14.29 – – – 66.8 2007 ............................................................... 14.34 14.52 14.53 14.71 66.8 66.4 66.4 66.7 2008 ............................................................... 14.79 15.07 14.99 14.76 66.6 66.7 66.5 67.2 2009 ............................................................... 14.84 14.94 15.03 15.01 67.0 67.1 67.0 67.3 2010 ............................................................... 15.13 15.17 15.19 14.94 66.7 66.7 66.6 67.2
2011 ............................................................... 14.96 15.02 15.06 15.08 67.1 65.8 65.8 67.3 2012 ............................................................... 15.22 15.27 15.26 15.32 68.0 68.0 67.9 67.9 2013 ............................................................... 15.37 15.43 15.42 15.54 68.0 68.0 68.1 67.7 2014 ............................................................... 15.63 15.67 15.65 16.27 67.8 67.5 67.4 67.1 2015 ............................................................... 16.39 16.47 16.60 16.58 67.0 66.7 66.6 67.2 2016 ............................................................... 16.70 16.83 16.85 16.98 67.2 67.3 67.2 67.2 2017 ............................................................... 17.15 – – – 67.3 – – –
Total benefits 2006 ............................................................... – – – 7.12 – – – 33.2 2007 ............................................................... 7.13 7.34 7.35 7.33 33.2 33.6 33.6 33.3 2008 ............................................................... 7.43 7.54 7.56 7.21 33.4 33.3 33.5 32.8 2009 ............................................................... 7.32 7.34 7.39 7.30 33.0 32.9 33.0 32.7 2010 ............................................................... 7.54 7.58 7.61 7.30 33.3 33.3 33.4 32.8
2011 ............................................................... 7.35 7.80 7.81 7.31 32.9 34.2 34.2 32.7 2012 ............................................................... 7.16 7.20 7.22 7.25 32.0 32.0 32.1 32.1 2013 ............................................................... 7.23 7.28 7.23 7.40 32.0 32.0 31.9 32.3 2014 ............................................................... 7.43 7.55 7.57 7.97 32.2 32.5 32.6 32.9 2015 ............................................................... 8.08 8.21 8.32 8.11 33.0 33.3 33.4 32.8 2016 ............................................................... 8.16 8.19 8.23 8.30 32.8 32.7 32.8 32.8 2017 ............................................................... 8.33 – – – 32.7 – – –
Paid leave 2006 ............................................................... – – – 1.25 – – – 5.9 2007 ............................................................... 1.27 1.29 1.27 1.29 5.9 5.9 5.8 5.8 2008 ............................................................... 1.25 1.28 1.27 1.25 5.6 5.7 5.6 5.7 2009 ............................................................... 1.29 1.29 1.30 1.26 5.8 5.8 5.8 5.6 2010 ............................................................... 1.29 1.30 1.31 1.26 5.7 5.7 5.7 5.6
2011 ............................................................... 1.22 1.22 1.22 1.19 5.4 5.3 5.3 5.3 2012 ............................................................... 1.21 1.21 1.21 1.26 5.4 5.4 5.4 5.6 2013 ............................................................... 1.26 1.26 1.26 1.25 5.6 5.6 5.6 5.5 2014 ............................................................... 1.27 1.28 1.29 1.37 5.5 5.5 5.6 5.6 2015 ............................................................... 1.38 1.40 1.42 1.37 5.7 5.7 5.7 5.6 2016 ............................................................... 1.38 1.39 1.40 1.41 5.5 5.5 5.6 5.6 2017 ............................................................... 1.43 – – – 5.6 – – –
Supplemental pay 2006 ............................................................... – – – .74 – – – 3.5 2007 ............................................................... .76 .87 .88 .77 3.5 4.0 4.0 3.5 2008 ............................................................... .89 .91 .95 .87 4.0 4.0 4.2 3.9 2009 ............................................................... .84 .83 .84 .85 3.8 3.7 3.7 3.8 2010 ............................................................... .77 .75 .75 .74 3.4 3.3 3.3 3.3
2011 ............................................................... .83 .83 .83 .82 3.7 3.7 3.6 3.6 2012 ............................................................... .83 .85 .85 .83 3.7 3.8 3.8 3.7 2013 ............................................................... .82 .83 .77 .78 3.6 3.7 3.4 3.4 2014 ............................................................... .76 .77 .79 .86 3.3 3.3 3.4 3.6 2015 ............................................................... .87 .89 .91 .88 3.6 3.6 3.6 3.5 2016 ............................................................... .89 .90 .89 .89 3.6 3.6 3.5 3.5
See footnotes at end of table.
-139-
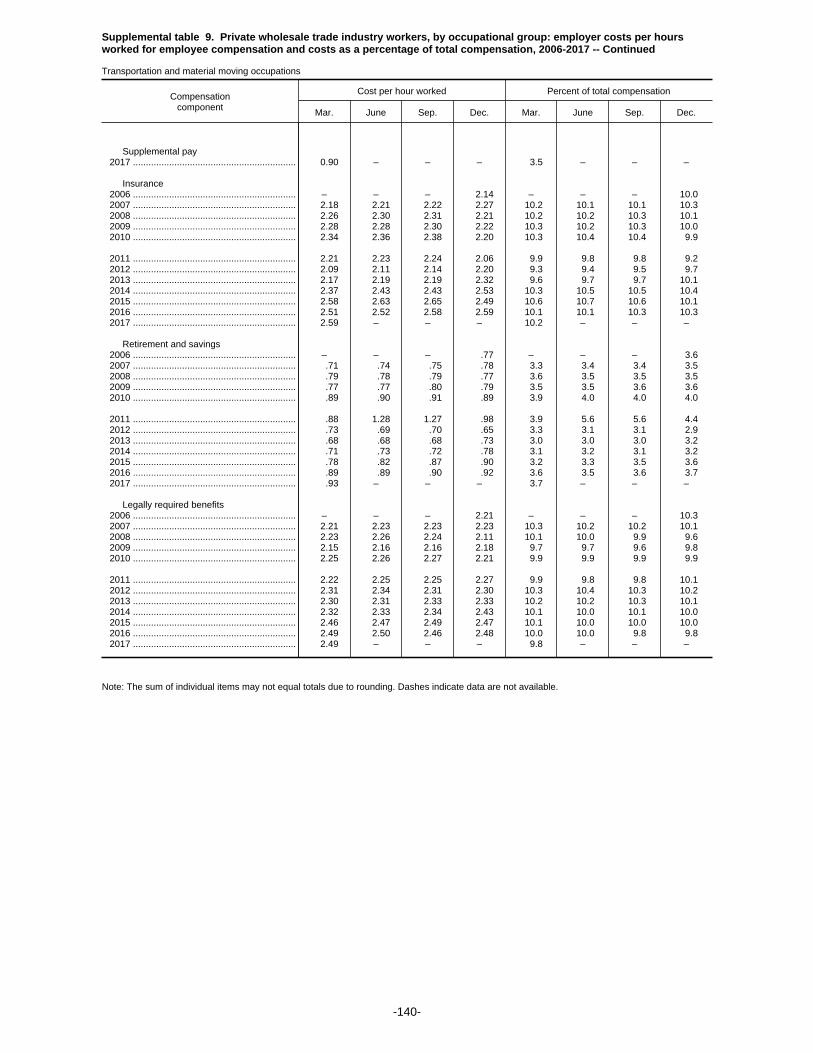
Supplemental table 9. Private wholesale trade industry workers, by occupational group: employer costs per hoursworked for employee compensation and costs as a percentage of total compensation, 2006-2017 -- Continued
Transportation and material moving occupations
Compensationcomponent
Cost per hour worked Percent of total compensation
Mar. June Sep. Dec. Mar. June Sep. Dec.
Supplemental pay 2017 ............................................................... 0.90 – – – 3.5 – – –
Insurance 2006 ............................................................... – – – 2.14 – – – 10.0 2007 ............................................................... 2.18 2.21 2.22 2.27 10.2 10.1 10.1 10.3 2008 ............................................................... 2.26 2.30 2.31 2.21 10.2 10.2 10.3 10.1 2009 ............................................................... 2.28 2.28 2.30 2.22 10.3 10.2 10.3 10.0 2010 ............................................................... 2.34 2.36 2.38 2.20 10.3 10.4 10.4 9.9
2011 ............................................................... 2.21 2.23 2.24 2.06 9.9 9.8 9.8 9.2 2012 ............................................................... 2.09 2.11 2.14 2.20 9.3 9.4 9.5 9.7 2013 ............................................................... 2.17 2.19 2.19 2.32 9.6 9.7 9.7 10.1 2014 ............................................................... 2.37 2.43 2.43 2.53 10.3 10.5 10.5 10.4 2015 ............................................................... 2.58 2.63 2.65 2.49 10.6 10.7 10.6 10.1 2016 ............................................................... 2.51 2.52 2.58 2.59 10.1 10.1 10.3 10.3 2017 ............................................................... 2.59 – – – 10.2 – – –
Retirement and savings 2006 ............................................................... – – – .77 – – – 3.6 2007 ............................................................... .71 .74 .75 .78 3.3 3.4 3.4 3.5 2008 ............................................................... .79 .78 .79 .77 3.6 3.5 3.5 3.5 2009 ............................................................... .77 .77 .80 .79 3.5 3.5 3.6 3.6 2010 ............................................................... .89 .90 .91 .89 3.9 4.0 4.0 4.0
2011 ............................................................... .88 1.28 1.27 .98 3.9 5.6 5.6 4.4 2012 ............................................................... .73 .69 .70 .65 3.3 3.1 3.1 2.9 2013 ............................................................... .68 .68 .68 .73 3.0 3.0 3.0 3.2 2014 ............................................................... .71 .73 .72 .78 3.1 3.2 3.1 3.2 2015 ............................................................... .78 .82 .87 .90 3.2 3.3 3.5 3.6 2016 ............................................................... .89 .89 .90 .92 3.6 3.5 3.6 3.7 2017 ............................................................... .93 – – – 3.7 – – –
Legally required benefits 2006 ............................................................... – – – 2.21 – – – 10.3 2007 ............................................................... 2.21 2.23 2.23 2.23 10.3 10.2 10.2 10.1 2008 ............................................................... 2.23 2.26 2.24 2.11 10.1 10.0 9.9 9.6 2009 ............................................................... 2.15 2.16 2.16 2.18 9.7 9.7 9.6 9.8 2010 ............................................................... 2.25 2.26 2.27 2.21 9.9 9.9 9.9 9.9
2011 ............................................................... 2.22 2.25 2.25 2.27 9.9 9.8 9.8 10.1 2012 ............................................................... 2.31 2.34 2.31 2.30 10.3 10.4 10.3 10.2 2013 ............................................................... 2.30 2.31 2.33 2.33 10.2 10.2 10.3 10.1 2014 ............................................................... 2.32 2.33 2.34 2.43 10.1 10.0 10.1 10.0 2015 ............................................................... 2.46 2.47 2.49 2.47 10.1 10.0 10.0 10.0 2016 ............................................................... 2.49 2.50 2.46 2.48 10.0 10.0 9.8 9.8 2017 ............................................................... 2.49 – – – 9.8 – – –
Note: The sum of individual items may not equal totals due to rounding. Dashes indicate data are not available.
-140-
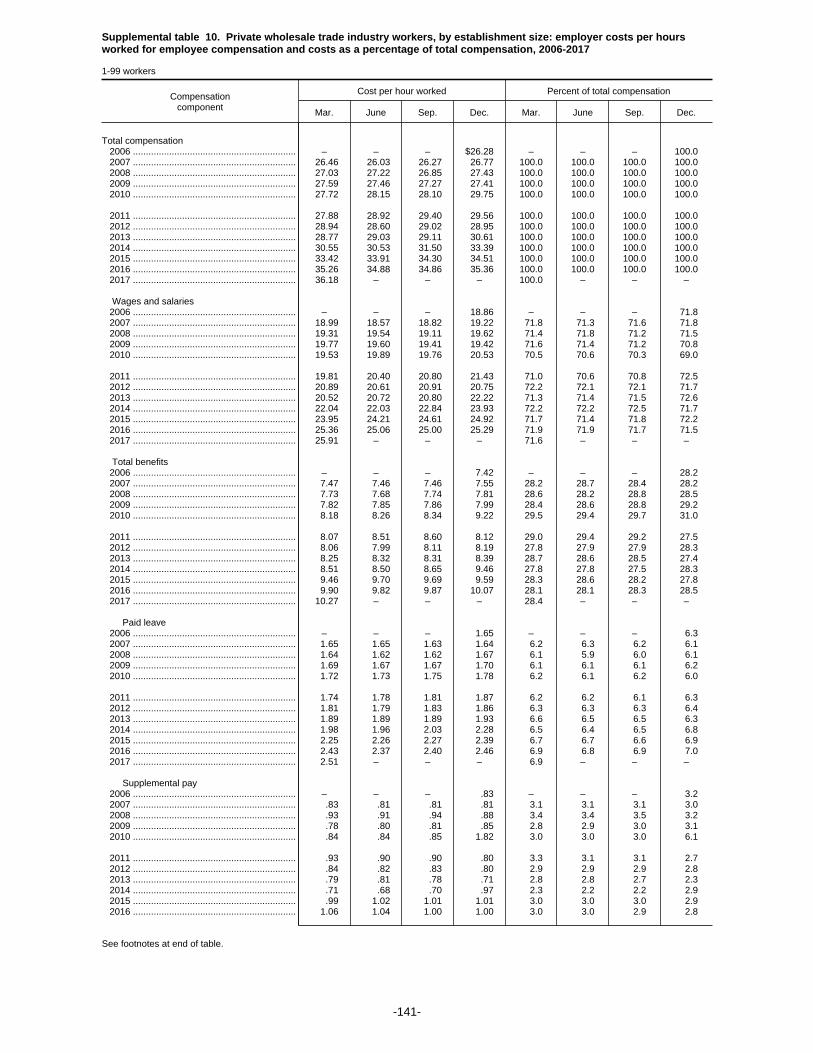
Supplemental table 10. Private wholesale trade industry workers, by establishment size: employer costs per hoursworked for employee compensation and costs as a percentage of total compensation, 2006-2017
1-99 workers
Compensationcomponent
Cost per hour worked Percent of total compensation
Mar. June Sep. Dec. Mar. June Sep. Dec.
Total compensation 2006 ............................................................... – – – $26.28 – – – 100.0 2007 ............................................................... 26.46 26.03 26.27 26.77 100.0 100.0 100.0 100.0 2008 ............................................................... 27.03 27.22 26.85 27.43 100.0 100.0 100.0 100.0 2009 ............................................................... 27.59 27.46 27.27 27.41 100.0 100.0 100.0 100.0 2010 ............................................................... 27.72 28.15 28.10 29.75 100.0 100.0 100.0 100.0
2011 ............................................................... 27.88 28.92 29.40 29.56 100.0 100.0 100.0 100.0 2012 ............................................................... 28.94 28.60 29.02 28.95 100.0 100.0 100.0 100.0 2013 ............................................................... 28.77 29.03 29.11 30.61 100.0 100.0 100.0 100.0 2014 ............................................................... 30.55 30.53 31.50 33.39 100.0 100.0 100.0 100.0 2015 ............................................................... 33.42 33.91 34.30 34.51 100.0 100.0 100.0 100.0 2016 ............................................................... 35.26 34.88 34.86 35.36 100.0 100.0 100.0 100.0 2017 ............................................................... 36.18 – – – 100.0 – – –
Wages and salaries 2006 ............................................................... – – – 18.86 – – – 71.8 2007 ............................................................... 18.99 18.57 18.82 19.22 71.8 71.3 71.6 71.8 2008 ............................................................... 19.31 19.54 19.11 19.62 71.4 71.8 71.2 71.5 2009 ............................................................... 19.77 19.60 19.41 19.42 71.6 71.4 71.2 70.8 2010 ............................................................... 19.53 19.89 19.76 20.53 70.5 70.6 70.3 69.0
2011 ............................................................... 19.81 20.40 20.80 21.43 71.0 70.6 70.8 72.5 2012 ............................................................... 20.89 20.61 20.91 20.75 72.2 72.1 72.1 71.7 2013 ............................................................... 20.52 20.72 20.80 22.22 71.3 71.4 71.5 72.6 2014 ............................................................... 22.04 22.03 22.84 23.93 72.2 72.2 72.5 71.7 2015 ............................................................... 23.95 24.21 24.61 24.92 71.7 71.4 71.8 72.2 2016 ............................................................... 25.36 25.06 25.00 25.29 71.9 71.9 71.7 71.5 2017 ............................................................... 25.91 – – – 71.6 – – –
Total benefits 2006 ............................................................... – – – 7.42 – – – 28.2 2007 ............................................................... 7.47 7.46 7.46 7.55 28.2 28.7 28.4 28.2 2008 ............................................................... 7.73 7.68 7.74 7.81 28.6 28.2 28.8 28.5 2009 ............................................................... 7.82 7.85 7.86 7.99 28.4 28.6 28.8 29.2 2010 ............................................................... 8.18 8.26 8.34 9.22 29.5 29.4 29.7 31.0
2011 ............................................................... 8.07 8.51 8.60 8.12 29.0 29.4 29.2 27.5 2012 ............................................................... 8.06 7.99 8.11 8.19 27.8 27.9 27.9 28.3 2013 ............................................................... 8.25 8.32 8.31 8.39 28.7 28.6 28.5 27.4 2014 ............................................................... 8.51 8.50 8.65 9.46 27.8 27.8 27.5 28.3 2015 ............................................................... 9.46 9.70 9.69 9.59 28.3 28.6 28.2 27.8 2016 ............................................................... 9.90 9.82 9.87 10.07 28.1 28.1 28.3 28.5 2017 ............................................................... 10.27 – – – 28.4 – – –
Paid leave 2006 ............................................................... – – – 1.65 – – – 6.3 2007 ............................................................... 1.65 1.65 1.63 1.64 6.2 6.3 6.2 6.1 2008 ............................................................... 1.64 1.62 1.62 1.67 6.1 5.9 6.0 6.1 2009 ............................................................... 1.69 1.67 1.67 1.70 6.1 6.1 6.1 6.2 2010 ............................................................... 1.72 1.73 1.75 1.78 6.2 6.1 6.2 6.0
2011 ............................................................... 1.74 1.78 1.81 1.87 6.2 6.2 6.1 6.3 2012 ............................................................... 1.81 1.79 1.83 1.86 6.3 6.3 6.3 6.4 2013 ............................................................... 1.89 1.89 1.89 1.93 6.6 6.5 6.5 6.3 2014 ............................................................... 1.98 1.96 2.03 2.28 6.5 6.4 6.5 6.8 2015 ............................................................... 2.25 2.26 2.27 2.39 6.7 6.7 6.6 6.9 2016 ............................................................... 2.43 2.37 2.40 2.46 6.9 6.8 6.9 7.0 2017 ............................................................... 2.51 – – – 6.9 – – –
Supplemental pay 2006 ............................................................... – – – .83 – – – 3.2 2007 ............................................................... .83 .81 .81 .81 3.1 3.1 3.1 3.0 2008 ............................................................... .93 .91 .94 .88 3.4 3.4 3.5 3.2 2009 ............................................................... .78 .80 .81 .85 2.8 2.9 3.0 3.1 2010 ............................................................... .84 .84 .85 1.82 3.0 3.0 3.0 6.1
2011 ............................................................... .93 .90 .90 .80 3.3 3.1 3.1 2.7 2012 ............................................................... .84 .82 .83 .80 2.9 2.9 2.9 2.8 2013 ............................................................... .79 .81 .78 .71 2.8 2.8 2.7 2.3 2014 ............................................................... .71 .68 .70 .97 2.3 2.2 2.2 2.9 2015 ............................................................... .99 1.02 1.01 1.01 3.0 3.0 3.0 2.9 2016 ............................................................... 1.06 1.04 1.00 1.00 3.0 3.0 2.9 2.8
See footnotes at end of table.
-141-
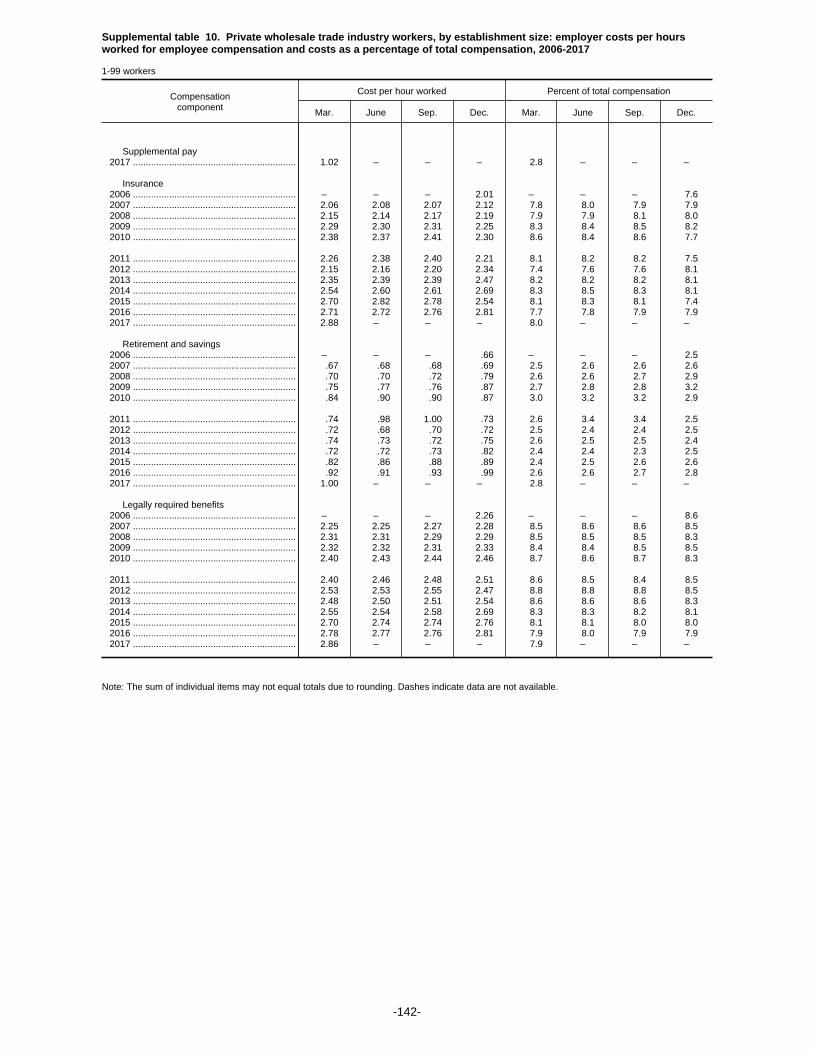
Supplemental table 10. Private wholesale trade industry workers, by establishment size: employer costs per hoursworked for employee compensation and costs as a percentage of total compensation, 2006-2017
1-99 workers
Compensationcomponent
Cost per hour worked Percent of total compensation
Mar. June Sep. Dec. Mar. June Sep. Dec.
Supplemental pay 2017 ............................................................... 1.02 – – – 2.8 – – –
Insurance 2006 ............................................................... – – – 2.01 – – – 7.6 2007 ............................................................... 2.06 2.08 2.07 2.12 7.8 8.0 7.9 7.9 2008 ............................................................... 2.15 2.14 2.17 2.19 7.9 7.9 8.1 8.0 2009 ............................................................... 2.29 2.30 2.31 2.25 8.3 8.4 8.5 8.2 2010 ............................................................... 2.38 2.37 2.41 2.30 8.6 8.4 8.6 7.7
2011 ............................................................... 2.26 2.38 2.40 2.21 8.1 8.2 8.2 7.5 2012 ............................................................... 2.15 2.16 2.20 2.34 7.4 7.6 7.6 8.1 2013 ............................................................... 2.35 2.39 2.39 2.47 8.2 8.2 8.2 8.1 2014 ............................................................... 2.54 2.60 2.61 2.69 8.3 8.5 8.3 8.1 2015 ............................................................... 2.70 2.82 2.78 2.54 8.1 8.3 8.1 7.4 2016 ............................................................... 2.71 2.72 2.76 2.81 7.7 7.8 7.9 7.9 2017 ............................................................... 2.88 – – – 8.0 – – –
Retirement and savings 2006 ............................................................... – – – .66 – – – 2.5 2007 ............................................................... .67 .68 .68 .69 2.5 2.6 2.6 2.6 2008 ............................................................... .70 .70 .72 .79 2.6 2.6 2.7 2.9 2009 ............................................................... .75 .77 .76 .87 2.7 2.8 2.8 3.2 2010 ............................................................... .84 .90 .90 .87 3.0 3.2 3.2 2.9
2011 ............................................................... .74 .98 1.00 .73 2.6 3.4 3.4 2.5 2012 ............................................................... .72 .68 .70 .72 2.5 2.4 2.4 2.5 2013 ............................................................... .74 .73 .72 .75 2.6 2.5 2.5 2.4 2014 ............................................................... .72 .72 .73 .82 2.4 2.4 2.3 2.5 2015 ............................................................... .82 .86 .88 .89 2.4 2.5 2.6 2.6 2016 ............................................................... .92 .91 .93 .99 2.6 2.6 2.7 2.8 2017 ............................................................... 1.00 – – – 2.8 – – –
Legally required benefits 2006 ............................................................... – – – 2.26 – – – 8.6 2007 ............................................................... 2.25 2.25 2.27 2.28 8.5 8.6 8.6 8.5 2008 ............................................................... 2.31 2.31 2.29 2.29 8.5 8.5 8.5 8.3 2009 ............................................................... 2.32 2.32 2.31 2.33 8.4 8.4 8.5 8.5 2010 ............................................................... 2.40 2.43 2.44 2.46 8.7 8.6 8.7 8.3
2011 ............................................................... 2.40 2.46 2.48 2.51 8.6 8.5 8.4 8.5 2012 ............................................................... 2.53 2.53 2.55 2.47 8.8 8.8 8.8 8.5 2013 ............................................................... 2.48 2.50 2.51 2.54 8.6 8.6 8.6 8.3 2014 ............................................................... 2.55 2.54 2.58 2.69 8.3 8.3 8.2 8.1 2015 ............................................................... 2.70 2.74 2.74 2.76 8.1 8.1 8.0 8.0 2016 ............................................................... 2.78 2.77 2.76 2.81 7.9 8.0 7.9 7.9 2017 ............................................................... 2.86 – – – 7.9 – – –
Note: The sum of individual items may not equal totals due to rounding. Dashes indicate data are not available.
-142-
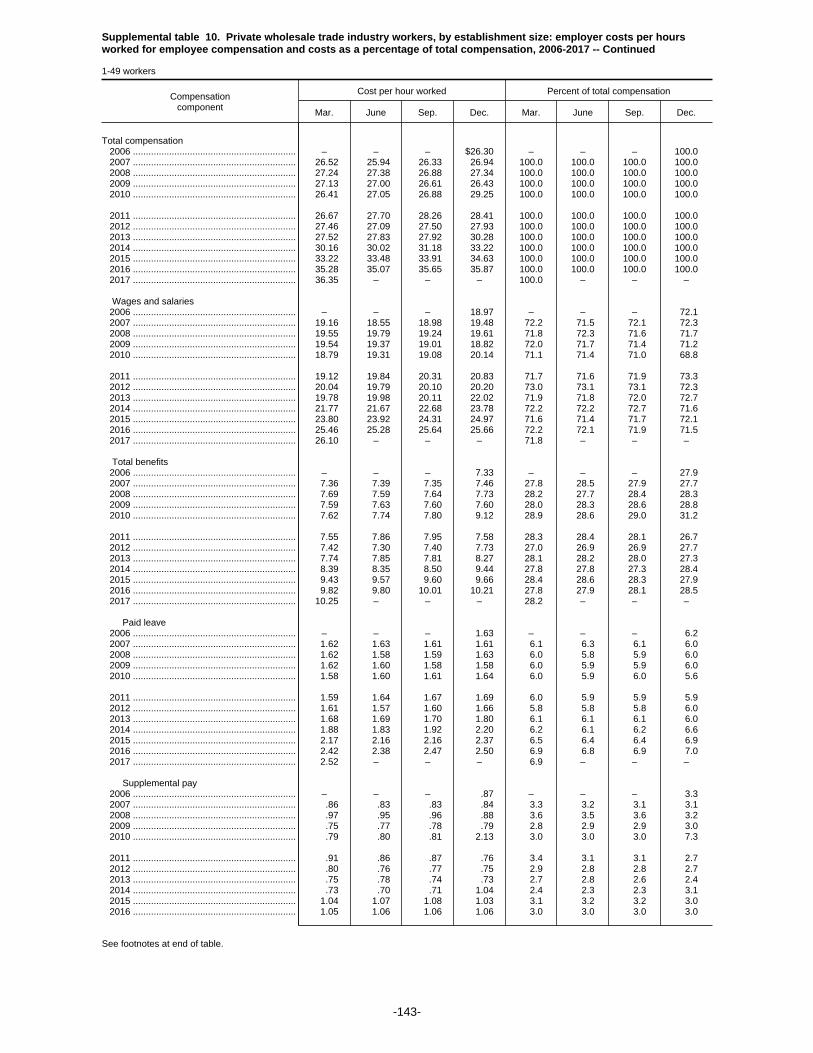
Supplemental table 10. Private wholesale trade industry workers, by establishment size: employer costs per hoursworked for employee compensation and costs as a percentage of total compensation, 2006-2017 -- Continued
1-49 workers
Compensationcomponent
Cost per hour worked Percent of total compensation
Mar. June Sep. Dec. Mar. June Sep. Dec.
Total compensation 2006 ............................................................... – – – $26.30 – – – 100.0 2007 ............................................................... 26.52 25.94 26.33 26.94 100.0 100.0 100.0 100.0 2008 ............................................................... 27.24 27.38 26.88 27.34 100.0 100.0 100.0 100.0 2009 ............................................................... 27.13 27.00 26.61 26.43 100.0 100.0 100.0 100.0 2010 ............................................................... 26.41 27.05 26.88 29.25 100.0 100.0 100.0 100.0
2011 ............................................................... 26.67 27.70 28.26 28.41 100.0 100.0 100.0 100.0 2012 ............................................................... 27.46 27.09 27.50 27.93 100.0 100.0 100.0 100.0 2013 ............................................................... 27.52 27.83 27.92 30.28 100.0 100.0 100.0 100.0 2014 ............................................................... 30.16 30.02 31.18 33.22 100.0 100.0 100.0 100.0 2015 ............................................................... 33.22 33.48 33.91 34.63 100.0 100.0 100.0 100.0 2016 ............................................................... 35.28 35.07 35.65 35.87 100.0 100.0 100.0 100.0 2017 ............................................................... 36.35 – – – 100.0 – – –
Wages and salaries 2006 ............................................................... – – – 18.97 – – – 72.1 2007 ............................................................... 19.16 18.55 18.98 19.48 72.2 71.5 72.1 72.3 2008 ............................................................... 19.55 19.79 19.24 19.61 71.8 72.3 71.6 71.7 2009 ............................................................... 19.54 19.37 19.01 18.82 72.0 71.7 71.4 71.2 2010 ............................................................... 18.79 19.31 19.08 20.14 71.1 71.4 71.0 68.8
2011 ............................................................... 19.12 19.84 20.31 20.83 71.7 71.6 71.9 73.3 2012 ............................................................... 20.04 19.79 20.10 20.20 73.0 73.1 73.1 72.3 2013 ............................................................... 19.78 19.98 20.11 22.02 71.9 71.8 72.0 72.7 2014 ............................................................... 21.77 21.67 22.68 23.78 72.2 72.2 72.7 71.6 2015 ............................................................... 23.80 23.92 24.31 24.97 71.6 71.4 71.7 72.1 2016 ............................................................... 25.46 25.28 25.64 25.66 72.2 72.1 71.9 71.5 2017 ............................................................... 26.10 – – – 71.8 – – –
Total benefits 2006 ............................................................... – – – 7.33 – – – 27.9 2007 ............................................................... 7.36 7.39 7.35 7.46 27.8 28.5 27.9 27.7 2008 ............................................................... 7.69 7.59 7.64 7.73 28.2 27.7 28.4 28.3 2009 ............................................................... 7.59 7.63 7.60 7.60 28.0 28.3 28.6 28.8 2010 ............................................................... 7.62 7.74 7.80 9.12 28.9 28.6 29.0 31.2
2011 ............................................................... 7.55 7.86 7.95 7.58 28.3 28.4 28.1 26.7 2012 ............................................................... 7.42 7.30 7.40 7.73 27.0 26.9 26.9 27.7 2013 ............................................................... 7.74 7.85 7.81 8.27 28.1 28.2 28.0 27.3 2014 ............................................................... 8.39 8.35 8.50 9.44 27.8 27.8 27.3 28.4 2015 ............................................................... 9.43 9.57 9.60 9.66 28.4 28.6 28.3 27.9 2016 ............................................................... 9.82 9.80 10.01 10.21 27.8 27.9 28.1 28.5 2017 ............................................................... 10.25 – – – 28.2 – – –
Paid leave 2006 ............................................................... – – – 1.63 – – – 6.2 2007 ............................................................... 1.62 1.63 1.61 1.61 6.1 6.3 6.1 6.0 2008 ............................................................... 1.62 1.58 1.59 1.63 6.0 5.8 5.9 6.0 2009 ............................................................... 1.62 1.60 1.58 1.58 6.0 5.9 5.9 6.0 2010 ............................................................... 1.58 1.60 1.61 1.64 6.0 5.9 6.0 5.6
2011 ............................................................... 1.59 1.64 1.67 1.69 6.0 5.9 5.9 5.9 2012 ............................................................... 1.61 1.57 1.60 1.66 5.8 5.8 5.8 6.0 2013 ............................................................... 1.68 1.69 1.70 1.80 6.1 6.1 6.1 6.0 2014 ............................................................... 1.88 1.83 1.92 2.20 6.2 6.1 6.2 6.6 2015 ............................................................... 2.17 2.16 2.16 2.37 6.5 6.4 6.4 6.9 2016 ............................................................... 2.42 2.38 2.47 2.50 6.9 6.8 6.9 7.0 2017 ............................................................... 2.52 – – – 6.9 – – –
Supplemental pay 2006 ............................................................... – – – .87 – – – 3.3 2007 ............................................................... .86 .83 .83 .84 3.3 3.2 3.1 3.1 2008 ............................................................... .97 .95 .96 .88 3.6 3.5 3.6 3.2 2009 ............................................................... .75 .77 .78 .79 2.8 2.9 2.9 3.0 2010 ............................................................... .79 .80 .81 2.13 3.0 3.0 3.0 7.3
2011 ............................................................... .91 .86 .87 .76 3.4 3.1 3.1 2.7 2012 ............................................................... .80 .76 .77 .75 2.9 2.8 2.8 2.7 2013 ............................................................... .75 .78 .74 .73 2.7 2.8 2.6 2.4 2014 ............................................................... .73 .70 .71 1.04 2.4 2.3 2.3 3.1 2015 ............................................................... 1.04 1.07 1.08 1.03 3.1 3.2 3.2 3.0 2016 ............................................................... 1.05 1.06 1.06 1.06 3.0 3.0 3.0 3.0
See footnotes at end of table.
-143-

Supplemental table 10. Private wholesale trade industry workers, by establishment size: employer costs per hoursworked for employee compensation and costs as a percentage of total compensation, 2006-2017 -- Continued
1-49 workers
Compensationcomponent
Cost per hour worked Percent of total compensation
Mar. June Sep. Dec. Mar. June Sep. Dec.
Supplemental pay 2017 ............................................................... 1.03 – – – 2.8 – – –
Insurance 2006 ............................................................... – – – 1.94 – – – 7.4 2007 ............................................................... 2.01 2.03 2.00 2.06 7.6 7.8 7.6 7.6 2008 ............................................................... 2.09 2.07 2.09 2.12 7.7 7.5 7.8 7.8 2009 ............................................................... 2.19 2.20 2.21 2.10 8.1 8.1 8.3 7.9 2010 ............................................................... 2.18 2.15 2.18 2.11 8.2 8.0 8.1 7.2
2011 ............................................................... 2.08 2.20 2.22 2.07 7.8 8.0 7.9 7.3 2012 ............................................................... 1.98 2.00 2.02 2.27 7.2 7.4 7.3 8.1 2013 ............................................................... 2.26 2.30 2.28 2.48 8.2 8.3 8.2 8.2 2014 ............................................................... 2.53 2.58 2.58 2.69 8.4 8.6 8.3 8.1 2015 ............................................................... 2.69 2.75 2.74 2.56 8.1 8.2 8.1 7.4 2016 ............................................................... 2.63 2.66 2.72 2.79 7.5 7.6 7.6 7.8 2017 ............................................................... 2.80 – – – 7.7 – – –
Retirement and savings 2006 ............................................................... – – – .64 – – – 2.4 2007 ............................................................... .64 .67 .67 .68 2.4 2.6 2.5 2.5 2008 ............................................................... .70 .69 .72 .81 2.6 2.5 2.7 2.9 2009 ............................................................... .74 .77 .76 .86 2.7 2.8 2.9 3.3 2010 ............................................................... .77 .86 .86 .86 2.9 3.2 3.2 3.0
2011 ............................................................... .67 .79 .80 .65 2.5 2.8 2.8 2.3 2012 ............................................................... .62 .56 .58 .66 2.3 2.1 2.1 2.3 2013 ............................................................... .66 .68 .66 .74 2.4 2.4 2.4 2.4 2014 ............................................................... .72 .72 .72 .82 2.4 2.4 2.3 2.5 2015 ............................................................... .83 .86 .89 .92 2.5 2.6 2.6 2.6 2016 ............................................................... .91 .91 .93 1.00 2.6 2.6 2.6 2.8 2017 ............................................................... 1.00 – – – 2.8 – – –
Legally required benefits 2006 ............................................................... – – – 2.25 – – – 8.5 2007 ............................................................... 2.24 2.22 2.25 2.27 8.4 8.6 8.6 8.4 2008 ............................................................... 2.30 2.30 2.28 2.28 8.4 8.4 8.5 8.4 2009 ............................................................... 2.28 2.29 2.27 2.27 8.4 8.5 8.5 8.6 2010 ............................................................... 2.30 2.33 2.34 2.38 8.7 8.6 8.7 8.1
2011 ............................................................... 2.30 2.36 2.39 2.41 8.6 8.5 8.5 8.5 2012 ............................................................... 2.41 2.41 2.43 2.39 8.8 8.9 8.8 8.6 2013 ............................................................... 2.38 2.41 2.43 2.52 8.7 8.7 8.7 8.3 2014 ............................................................... 2.54 2.51 2.57 2.69 8.4 8.4 8.2 8.1 2015 ............................................................... 2.70 2.73 2.74 2.78 8.1 8.2 8.1 8.0 2016 ............................................................... 2.80 2.80 2.83 2.86 7.9 8.0 7.9 8.0 2017 ............................................................... 2.89 – – – 7.9 – – –
Note: The sum of individual items may not equal totals due to rounding. Dashes indicate data are not available.
-144-
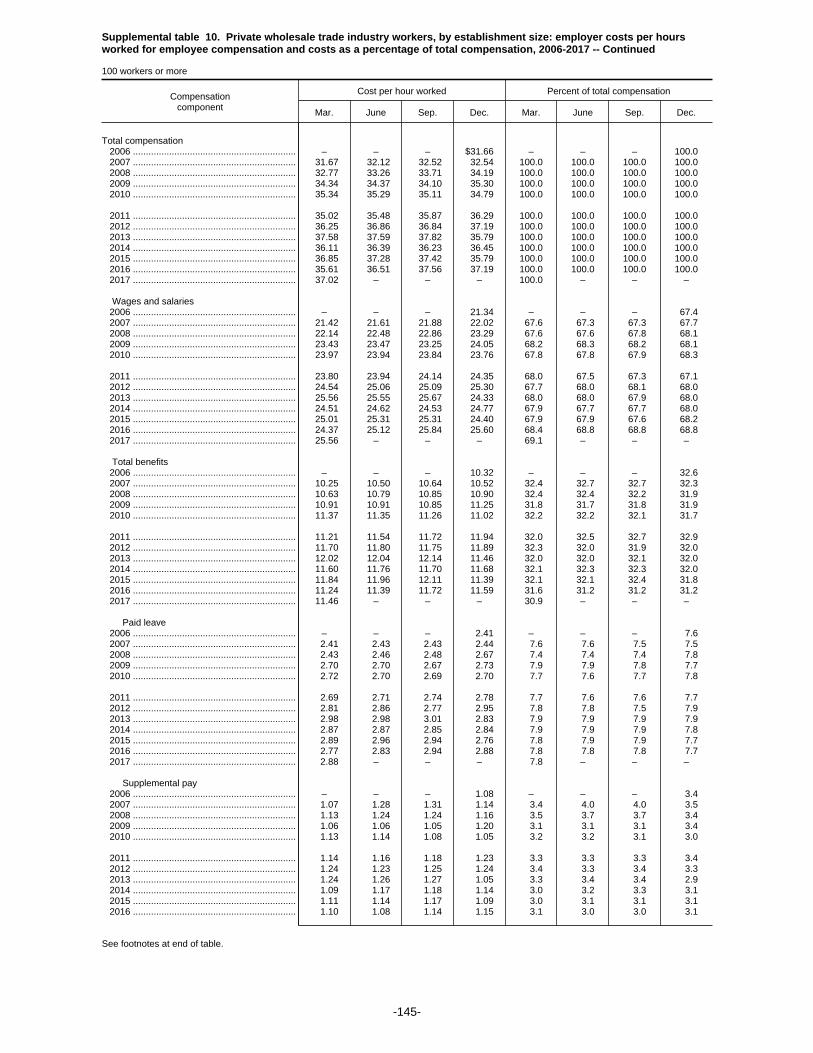
Supplemental table 10. Private wholesale trade industry workers, by establishment size: employer costs per hoursworked for employee compensation and costs as a percentage of total compensation, 2006-2017 -- Continued
100 workers or more
Compensationcomponent
Cost per hour worked Percent of total compensation
Mar. June Sep. Dec. Mar. June Sep. Dec.
Total compensation 2006 ............................................................... – – – $31.66 – – – 100.0 2007 ............................................................... 31.67 32.12 32.52 32.54 100.0 100.0 100.0 100.0 2008 ............................................................... 32.77 33.26 33.71 34.19 100.0 100.0 100.0 100.0 2009 ............................................................... 34.34 34.37 34.10 35.30 100.0 100.0 100.0 100.0 2010 ............................................................... 35.34 35.29 35.11 34.79 100.0 100.0 100.0 100.0
2011 ............................................................... 35.02 35.48 35.87 36.29 100.0 100.0 100.0 100.0 2012 ............................................................... 36.25 36.86 36.84 37.19 100.0 100.0 100.0 100.0 2013 ............................................................... 37.58 37.59 37.82 35.79 100.0 100.0 100.0 100.0 2014 ............................................................... 36.11 36.39 36.23 36.45 100.0 100.0 100.0 100.0 2015 ............................................................... 36.85 37.28 37.42 35.79 100.0 100.0 100.0 100.0 2016 ............................................................... 35.61 36.51 37.56 37.19 100.0 100.0 100.0 100.0 2017 ............................................................... 37.02 – – – 100.0 – – –
Wages and salaries 2006 ............................................................... – – – 21.34 – – – 67.4 2007 ............................................................... 21.42 21.61 21.88 22.02 67.6 67.3 67.3 67.7 2008 ............................................................... 22.14 22.48 22.86 23.29 67.6 67.6 67.8 68.1 2009 ............................................................... 23.43 23.47 23.25 24.05 68.2 68.3 68.2 68.1 2010 ............................................................... 23.97 23.94 23.84 23.76 67.8 67.8 67.9 68.3
2011 ............................................................... 23.80 23.94 24.14 24.35 68.0 67.5 67.3 67.1 2012 ............................................................... 24.54 25.06 25.09 25.30 67.7 68.0 68.1 68.0 2013 ............................................................... 25.56 25.55 25.67 24.33 68.0 68.0 67.9 68.0 2014 ............................................................... 24.51 24.62 24.53 24.77 67.9 67.7 67.7 68.0 2015 ............................................................... 25.01 25.31 25.31 24.40 67.9 67.9 67.6 68.2 2016 ............................................................... 24.37 25.12 25.84 25.60 68.4 68.8 68.8 68.8 2017 ............................................................... 25.56 – – – 69.1 – – –
Total benefits 2006 ............................................................... – – – 10.32 – – – 32.6 2007 ............................................................... 10.25 10.50 10.64 10.52 32.4 32.7 32.7 32.3 2008 ............................................................... 10.63 10.79 10.85 10.90 32.4 32.4 32.2 31.9 2009 ............................................................... 10.91 10.91 10.85 11.25 31.8 31.7 31.8 31.9 2010 ............................................................... 11.37 11.35 11.26 11.02 32.2 32.2 32.1 31.7
2011 ............................................................... 11.21 11.54 11.72 11.94 32.0 32.5 32.7 32.9 2012 ............................................................... 11.70 11.80 11.75 11.89 32.3 32.0 31.9 32.0 2013 ............................................................... 12.02 12.04 12.14 11.46 32.0 32.0 32.1 32.0 2014 ............................................................... 11.60 11.76 11.70 11.68 32.1 32.3 32.3 32.0 2015 ............................................................... 11.84 11.96 12.11 11.39 32.1 32.1 32.4 31.8 2016 ............................................................... 11.24 11.39 11.72 11.59 31.6 31.2 31.2 31.2 2017 ............................................................... 11.46 – – – 30.9 – – –
Paid leave 2006 ............................................................... – – – 2.41 – – – 7.6 2007 ............................................................... 2.41 2.43 2.43 2.44 7.6 7.6 7.5 7.5 2008 ............................................................... 2.43 2.46 2.48 2.67 7.4 7.4 7.4 7.8 2009 ............................................................... 2.70 2.70 2.67 2.73 7.9 7.9 7.8 7.7 2010 ............................................................... 2.72 2.70 2.69 2.70 7.7 7.6 7.7 7.8
2011 ............................................................... 2.69 2.71 2.74 2.78 7.7 7.6 7.6 7.7 2012 ............................................................... 2.81 2.86 2.77 2.95 7.8 7.8 7.5 7.9 2013 ............................................................... 2.98 2.98 3.01 2.83 7.9 7.9 7.9 7.9 2014 ............................................................... 2.87 2.87 2.85 2.84 7.9 7.9 7.9 7.8 2015 ............................................................... 2.89 2.96 2.94 2.76 7.8 7.9 7.9 7.7 2016 ............................................................... 2.77 2.83 2.94 2.88 7.8 7.8 7.8 7.7 2017 ............................................................... 2.88 – – – 7.8 – – –
Supplemental pay 2006 ............................................................... – – – 1.08 – – – 3.4 2007 ............................................................... 1.07 1.28 1.31 1.14 3.4 4.0 4.0 3.5 2008 ............................................................... 1.13 1.24 1.24 1.16 3.5 3.7 3.7 3.4 2009 ............................................................... 1.06 1.06 1.05 1.20 3.1 3.1 3.1 3.4 2010 ............................................................... 1.13 1.14 1.08 1.05 3.2 3.2 3.1 3.0
2011 ............................................................... 1.14 1.16 1.18 1.23 3.3 3.3 3.3 3.4 2012 ............................................................... 1.24 1.23 1.25 1.24 3.4 3.3 3.4 3.3 2013 ............................................................... 1.24 1.26 1.27 1.05 3.3 3.4 3.4 2.9 2014 ............................................................... 1.09 1.17 1.18 1.14 3.0 3.2 3.3 3.1 2015 ............................................................... 1.11 1.14 1.17 1.09 3.0 3.1 3.1 3.1 2016 ............................................................... 1.10 1.08 1.14 1.15 3.1 3.0 3.0 3.1
See footnotes at end of table.
-145-

Supplemental table 10. Private wholesale trade industry workers, by establishment size: employer costs per hoursworked for employee compensation and costs as a percentage of total compensation, 2006-2017 -- Continued
100 workers or more
Compensationcomponent
Cost per hour worked Percent of total compensation
Mar. June Sep. Dec. Mar. June Sep. Dec.
Supplemental pay 2017 ............................................................... 1.14 – – – 3.1 – – –
Insurance 2006 ............................................................... – – – 2.90 – – – 9.2 2007 ............................................................... 2.95 2.99 3.04 3.07 9.3 9.3 9.4 9.4 2008 ............................................................... 3.18 3.18 3.18 3.08 9.7 9.6 9.4 9.0 2009 ............................................................... 3.16 3.18 3.20 3.13 9.2 9.2 9.4 8.9 2010 ............................................................... 3.25 3.26 3.27 3.12 9.2 9.2 9.3 9.0
2011 ............................................................... 3.20 3.27 3.32 3.27 9.1 9.2 9.3 9.0 2012 ............................................................... 3.34 3.35 3.37 3.31 9.2 9.1 9.1 8.9 2013 ............................................................... 3.43 3.43 3.42 3.35 9.1 9.1 9.0 9.4 2014 ............................................................... 3.43 3.49 3.46 3.39 9.5 9.6 9.6 9.3 2015 ............................................................... 3.50 3.45 3.54 3.29 9.5 9.3 9.5 9.2 2016 ............................................................... 3.15 3.22 3.31 3.29 8.8 8.8 8.8 8.8 2017 ............................................................... 3.15 – – – 8.5 – – –
Retirement and savings 2006 ............................................................... – – – 1.39 – – – 4.4 2007 ............................................................... 1.29 1.25 1.29 1.31 4.1 3.9 4.0 4.0 2008 ............................................................... 1.32 1.31 1.31 1.31 4.0 3.9 3.9 3.8 2009 ............................................................... 1.29 1.29 1.25 1.45 3.8 3.7 3.7 4.1 2010 ............................................................... 1.53 1.51 1.50 1.50 4.3 4.3 4.3 4.3
2011 ............................................................... 1.52 1.70 1.76 1.91 4.4 4.8 4.9 5.3 2012 ............................................................... 1.52 1.52 1.53 1.54 4.2 4.1 4.1 4.1 2013 ............................................................... 1.54 1.52 1.57 1.50 4.1 4.1 4.2 4.2 2014 ............................................................... 1.46 1.46 1.43 1.52 4.1 4.0 3.9 4.2 2015 ............................................................... 1.51 1.57 1.63 1.50 4.1 4.2 4.4 4.2 2016 ............................................................... 1.49 1.51 1.53 1.49 4.2 4.1 4.1 4.0 2017 ............................................................... 1.51 – – – 4.1 – – –
Legally required benefits 2006 ............................................................... – – – 2.54 – – – 8.0 2007 ............................................................... 2.53 2.55 2.57 2.56 8.0 7.9 7.9 7.9 2008 ............................................................... 2.57 2.61 2.63 2.68 7.8 7.8 7.8 7.8 2009 ............................................................... 2.70 2.68 2.67 2.74 7.8 7.8 7.8 7.8 2010 ............................................................... 2.74 2.74 2.73 2.65 7.7 7.8 7.8 7.6
2011 ............................................................... 2.66 2.71 2.73 2.75 7.6 7.6 7.6 7.6 2012 ............................................................... 2.79 2.84 2.83 2.85 7.7 7.7 7.7 7.7 2013 ............................................................... 2.84 2.85 2.88 2.74 7.6 7.6 7.6 7.7 2014 ............................................................... 2.75 2.77 2.77 2.80 7.6 7.6 7.7 7.7 2015 ............................................................... 2.82 2.83 2.83 2.75 7.7 7.6 7.6 7.7 2016 ............................................................... 2.74 2.75 2.80 2.78 7.7 7.5 7.5 7.5 2017 ............................................................... 2.77 – – – 7.5 – – –
Note: The sum of individual items may not equal totals due to rounding. Dashes indicate data are not available.
-146-
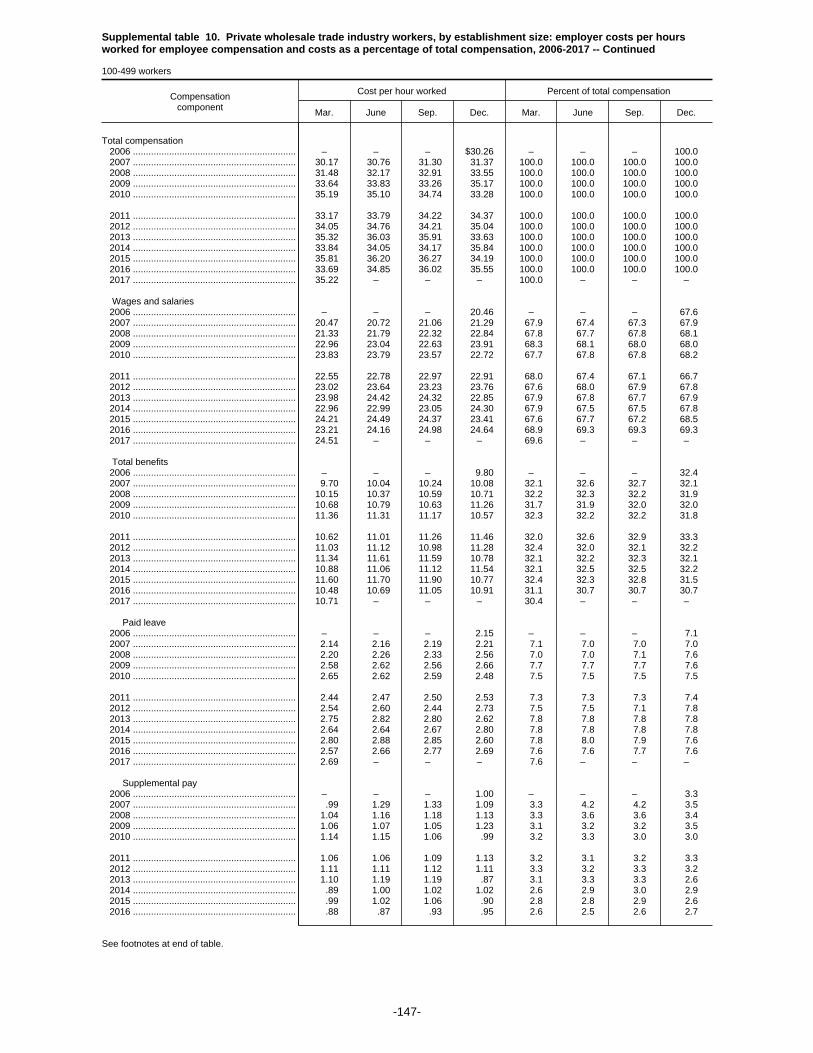
Supplemental table 10. Private wholesale trade industry workers, by establishment size: employer costs per hoursworked for employee compensation and costs as a percentage of total compensation, 2006-2017 -- Continued
100-499 workers
Compensationcomponent
Cost per hour worked Percent of total compensation
Mar. June Sep. Dec. Mar. June Sep. Dec.
Total compensation 2006 ............................................................... – – – $30.26 – – – 100.0 2007 ............................................................... 30.17 30.76 31.30 31.37 100.0 100.0 100.0 100.0 2008 ............................................................... 31.48 32.17 32.91 33.55 100.0 100.0 100.0 100.0 2009 ............................................................... 33.64 33.83 33.26 35.17 100.0 100.0 100.0 100.0 2010 ............................................................... 35.19 35.10 34.74 33.28 100.0 100.0 100.0 100.0
2011 ............................................................... 33.17 33.79 34.22 34.37 100.0 100.0 100.0 100.0 2012 ............................................................... 34.05 34.76 34.21 35.04 100.0 100.0 100.0 100.0 2013 ............................................................... 35.32 36.03 35.91 33.63 100.0 100.0 100.0 100.0 2014 ............................................................... 33.84 34.05 34.17 35.84 100.0 100.0 100.0 100.0 2015 ............................................................... 35.81 36.20 36.27 34.19 100.0 100.0 100.0 100.0 2016 ............................................................... 33.69 34.85 36.02 35.55 100.0 100.0 100.0 100.0 2017 ............................................................... 35.22 – – – 100.0 – – –
Wages and salaries 2006 ............................................................... – – – 20.46 – – – 67.6 2007 ............................................................... 20.47 20.72 21.06 21.29 67.9 67.4 67.3 67.9 2008 ............................................................... 21.33 21.79 22.32 22.84 67.8 67.7 67.8 68.1 2009 ............................................................... 22.96 23.04 22.63 23.91 68.3 68.1 68.0 68.0 2010 ............................................................... 23.83 23.79 23.57 22.72 67.7 67.8 67.8 68.2
2011 ............................................................... 22.55 22.78 22.97 22.91 68.0 67.4 67.1 66.7 2012 ............................................................... 23.02 23.64 23.23 23.76 67.6 68.0 67.9 67.8 2013 ............................................................... 23.98 24.42 24.32 22.85 67.9 67.8 67.7 67.9 2014 ............................................................... 22.96 22.99 23.05 24.30 67.9 67.5 67.5 67.8 2015 ............................................................... 24.21 24.49 24.37 23.41 67.6 67.7 67.2 68.5 2016 ............................................................... 23.21 24.16 24.98 24.64 68.9 69.3 69.3 69.3 2017 ............................................................... 24.51 – – – 69.6 – – –
Total benefits 2006 ............................................................... – – – 9.80 – – – 32.4 2007 ............................................................... 9.70 10.04 10.24 10.08 32.1 32.6 32.7 32.1 2008 ............................................................... 10.15 10.37 10.59 10.71 32.2 32.3 32.2 31.9 2009 ............................................................... 10.68 10.79 10.63 11.26 31.7 31.9 32.0 32.0 2010 ............................................................... 11.36 11.31 11.17 10.57 32.3 32.2 32.2 31.8
2011 ............................................................... 10.62 11.01 11.26 11.46 32.0 32.6 32.9 33.3 2012 ............................................................... 11.03 11.12 10.98 11.28 32.4 32.0 32.1 32.2 2013 ............................................................... 11.34 11.61 11.59 10.78 32.1 32.2 32.3 32.1 2014 ............................................................... 10.88 11.06 11.12 11.54 32.1 32.5 32.5 32.2 2015 ............................................................... 11.60 11.70 11.90 10.77 32.4 32.3 32.8 31.5 2016 ............................................................... 10.48 10.69 11.05 10.91 31.1 30.7 30.7 30.7 2017 ............................................................... 10.71 – – – 30.4 – – –
Paid leave 2006 ............................................................... – – – 2.15 – – – 7.1 2007 ............................................................... 2.14 2.16 2.19 2.21 7.1 7.0 7.0 7.0 2008 ............................................................... 2.20 2.26 2.33 2.56 7.0 7.0 7.1 7.6 2009 ............................................................... 2.58 2.62 2.56 2.66 7.7 7.7 7.7 7.6 2010 ............................................................... 2.65 2.62 2.59 2.48 7.5 7.5 7.5 7.5
2011 ............................................................... 2.44 2.47 2.50 2.53 7.3 7.3 7.3 7.4 2012 ............................................................... 2.54 2.60 2.44 2.73 7.5 7.5 7.1 7.8 2013 ............................................................... 2.75 2.82 2.80 2.62 7.8 7.8 7.8 7.8 2014 ............................................................... 2.64 2.64 2.67 2.80 7.8 7.8 7.8 7.8 2015 ............................................................... 2.80 2.88 2.85 2.60 7.8 8.0 7.9 7.6 2016 ............................................................... 2.57 2.66 2.77 2.69 7.6 7.6 7.7 7.6 2017 ............................................................... 2.69 – – – 7.6 – – –
Supplemental pay 2006 ............................................................... – – – 1.00 – – – 3.3 2007 ............................................................... .99 1.29 1.33 1.09 3.3 4.2 4.2 3.5 2008 ............................................................... 1.04 1.16 1.18 1.13 3.3 3.6 3.6 3.4 2009 ............................................................... 1.06 1.07 1.05 1.23 3.1 3.2 3.2 3.5 2010 ............................................................... 1.14 1.15 1.06 .99 3.2 3.3 3.0 3.0
2011 ............................................................... 1.06 1.06 1.09 1.13 3.2 3.1 3.2 3.3 2012 ............................................................... 1.11 1.11 1.12 1.11 3.3 3.2 3.3 3.2 2013 ............................................................... 1.10 1.19 1.19 .87 3.1 3.3 3.3 2.6 2014 ............................................................... .89 1.00 1.02 1.02 2.6 2.9 3.0 2.9 2015 ............................................................... .99 1.02 1.06 .90 2.8 2.8 2.9 2.6 2016 ............................................................... .88 .87 .93 .95 2.6 2.5 2.6 2.7
See footnotes at end of table.
-147-

Supplemental table 10. Private wholesale trade industry workers, by establishment size: employer costs per hoursworked for employee compensation and costs as a percentage of total compensation, 2006-2017 -- Continued
100-499 workers
Compensationcomponent
Cost per hour worked Percent of total compensation
Mar. June Sep. Dec. Mar. June Sep. Dec.
Supplemental pay 2017 ............................................................... 0.91 – – – 2.6 – – –
Insurance 2006 ............................................................... – – – 2.84 – – – 9.4 2007 ............................................................... 2.86 2.90 2.97 3.01 9.5 9.4 9.5 9.6 2008 ............................................................... 3.13 3.13 3.20 3.05 9.9 9.7 9.7 9.1 2009 ............................................................... 3.10 3.18 3.19 3.17 9.2 9.4 9.6 9.0 2010 ............................................................... 3.29 3.28 3.29 3.01 9.3 9.3 9.5 9.0
2011 ............................................................... 3.03 3.10 3.18 3.12 9.1 9.2 9.3 9.1 2012 ............................................................... 3.16 3.17 3.20 3.14 9.3 9.1 9.3 9.0 2013 ............................................................... 3.21 3.27 3.22 3.17 9.1 9.1 9.0 9.4 2014 ............................................................... 3.27 3.33 3.31 3.39 9.7 9.8 9.7 9.4 2015 ............................................................... 3.49 3.41 3.53 3.22 9.7 9.4 9.7 9.4 2016 ............................................................... 3.01 3.11 3.20 3.19 8.9 8.9 8.9 9.0 2017 ............................................................... 3.04 – – – 8.6 – – –
Retirement and savings 2006 ............................................................... – – – 1.34 – – – 4.4 2007 ............................................................... 1.26 1.22 1.26 1.29 4.2 4.0 4.0 4.1 2008 ............................................................... 1.28 1.29 1.28 1.27 4.1 4.0 3.9 3.8 2009 ............................................................... 1.24 1.22 1.16 1.42 3.7 3.6 3.5 4.0 2010 ............................................................... 1.52 1.48 1.47 1.45 4.3 4.2 4.2 4.4
2011 ............................................................... 1.47 1.70 1.79 1.98 4.4 5.0 5.2 5.8 2012 ............................................................... 1.48 1.46 1.46 1.51 4.3 4.2 4.3 4.3 2013 ............................................................... 1.51 1.51 1.54 1.45 4.3 4.2 4.3 4.3 2014 ............................................................... 1.42 1.40 1.40 1.55 4.2 4.1 4.1 4.3 2015 ............................................................... 1.53 1.60 1.68 1.39 4.3 4.4 4.6 4.1 2016 ............................................................... 1.36 1.38 1.41 1.37 4.0 4.0 3.9 3.8 2017 ............................................................... 1.39 – – – 3.9 – – –
Legally required benefits 2006 ............................................................... – – – 2.47 – – – 8.2 2007 ............................................................... 2.45 2.48 2.50 2.49 8.1 8.1 8.0 7.9 2008 ............................................................... 2.50 2.54 2.61 2.69 7.9 7.9 7.9 8.0 2009 ............................................................... 2.69 2.70 2.66 2.78 8.0 8.0 8.0 7.9 2010 ............................................................... 2.77 2.78 2.77 2.64 7.9 7.9 8.0 7.9
2011 ............................................................... 2.63 2.68 2.71 2.70 7.9 7.9 7.9 7.9 2012 ............................................................... 2.74 2.79 2.76 2.79 8.0 8.0 8.1 8.0 2013 ............................................................... 2.76 2.83 2.84 2.67 7.8 7.9 7.9 7.9 2014 ............................................................... 2.66 2.69 2.71 2.78 7.9 7.9 7.9 7.7 2015 ............................................................... 2.78 2.79 2.78 2.67 7.8 7.7 7.7 7.8 2016 ............................................................... 2.65 2.67 2.74 2.71 7.9 7.7 7.6 7.6 2017 ............................................................... 2.68 – – – 7.6 – – –
Note: The sum of individual items may not equal totals due to rounding. Dashes indicate data are not available.
-148-
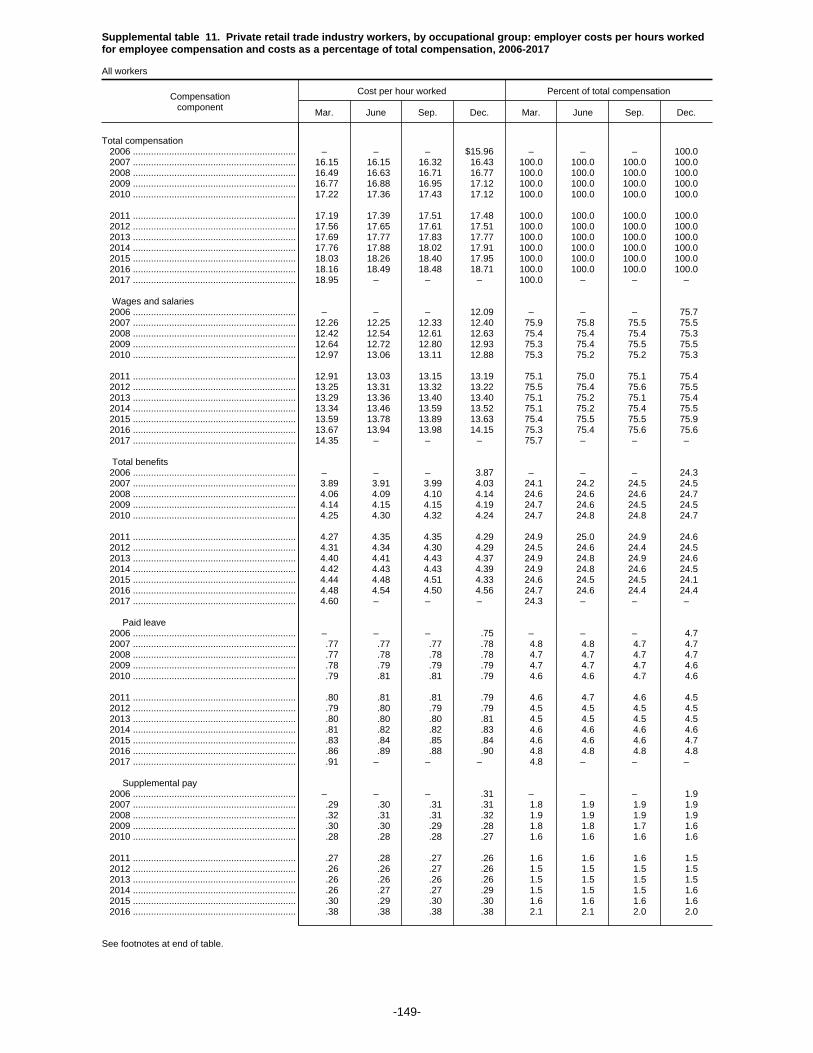
Supplemental table 11. Private retail trade industry workers, by occupational group: employer costs per hours workedfor employee compensation and costs as a percentage of total compensation, 2006-2017
All workers
Compensationcomponent
Cost per hour worked Percent of total compensation
Mar. June Sep. Dec. Mar. June Sep. Dec.
Total compensation 2006 ............................................................... – – – $15.96 – – – 100.0 2007 ............................................................... 16.15 16.15 16.32 16.43 100.0 100.0 100.0 100.0 2008 ............................................................... 16.49 16.63 16.71 16.77 100.0 100.0 100.0 100.0 2009 ............................................................... 16.77 16.88 16.95 17.12 100.0 100.0 100.0 100.0 2010 ............................................................... 17.22 17.36 17.43 17.12 100.0 100.0 100.0 100.0
2011 ............................................................... 17.19 17.39 17.51 17.48 100.0 100.0 100.0 100.0 2012 ............................................................... 17.56 17.65 17.61 17.51 100.0 100.0 100.0 100.0 2013 ............................................................... 17.69 17.77 17.83 17.77 100.0 100.0 100.0 100.0 2014 ............................................................... 17.76 17.88 18.02 17.91 100.0 100.0 100.0 100.0 2015 ............................................................... 18.03 18.26 18.40 17.95 100.0 100.0 100.0 100.0 2016 ............................................................... 18.16 18.49 18.48 18.71 100.0 100.0 100.0 100.0 2017 ............................................................... 18.95 – – – 100.0 – – –
Wages and salaries 2006 ............................................................... – – – 12.09 – – – 75.7 2007 ............................................................... 12.26 12.25 12.33 12.40 75.9 75.8 75.5 75.5 2008 ............................................................... 12.42 12.54 12.61 12.63 75.4 75.4 75.4 75.3 2009 ............................................................... 12.64 12.72 12.80 12.93 75.3 75.4 75.5 75.5 2010 ............................................................... 12.97 13.06 13.11 12.88 75.3 75.2 75.2 75.3
2011 ............................................................... 12.91 13.03 13.15 13.19 75.1 75.0 75.1 75.4 2012 ............................................................... 13.25 13.31 13.32 13.22 75.5 75.4 75.6 75.5 2013 ............................................................... 13.29 13.36 13.40 13.40 75.1 75.2 75.1 75.4 2014 ............................................................... 13.34 13.46 13.59 13.52 75.1 75.2 75.4 75.5 2015 ............................................................... 13.59 13.78 13.89 13.63 75.4 75.5 75.5 75.9 2016 ............................................................... 13.67 13.94 13.98 14.15 75.3 75.4 75.6 75.6 2017 ............................................................... 14.35 – – – 75.7 – – –
Total benefits 2006 ............................................................... – – – 3.87 – – – 24.3 2007 ............................................................... 3.89 3.91 3.99 4.03 24.1 24.2 24.5 24.5 2008 ............................................................... 4.06 4.09 4.10 4.14 24.6 24.6 24.6 24.7 2009 ............................................................... 4.14 4.15 4.15 4.19 24.7 24.6 24.5 24.5 2010 ............................................................... 4.25 4.30 4.32 4.24 24.7 24.8 24.8 24.7
2011 ............................................................... 4.27 4.35 4.35 4.29 24.9 25.0 24.9 24.6 2012 ............................................................... 4.31 4.34 4.30 4.29 24.5 24.6 24.4 24.5 2013 ............................................................... 4.40 4.41 4.43 4.37 24.9 24.8 24.9 24.6 2014 ............................................................... 4.42 4.43 4.43 4.39 24.9 24.8 24.6 24.5 2015 ............................................................... 4.44 4.48 4.51 4.33 24.6 24.5 24.5 24.1 2016 ............................................................... 4.48 4.54 4.50 4.56 24.7 24.6 24.4 24.4 2017 ............................................................... 4.60 – – – 24.3 – – –
Paid leave 2006 ............................................................... – – – .75 – – – 4.7 2007 ............................................................... .77 .77 .77 .78 4.8 4.8 4.7 4.7 2008 ............................................................... .77 .78 .78 .78 4.7 4.7 4.7 4.7 2009 ............................................................... .78 .79 .79 .79 4.7 4.7 4.7 4.6 2010 ............................................................... .79 .81 .81 .79 4.6 4.6 4.7 4.6
2011 ............................................................... .80 .81 .81 .79 4.6 4.7 4.6 4.5 2012 ............................................................... .79 .80 .79 .79 4.5 4.5 4.5 4.5 2013 ............................................................... .80 .80 .80 .81 4.5 4.5 4.5 4.5 2014 ............................................................... .81 .82 .82 .83 4.6 4.6 4.6 4.6 2015 ............................................................... .83 .84 .85 .84 4.6 4.6 4.6 4.7 2016 ............................................................... .86 .89 .88 .90 4.8 4.8 4.8 4.8 2017 ............................................................... .91 – – – 4.8 – – –
Supplemental pay 2006 ............................................................... – – – .31 – – – 1.9 2007 ............................................................... .29 .30 .31 .31 1.8 1.9 1.9 1.9 2008 ............................................................... .32 .31 .31 .32 1.9 1.9 1.9 1.9 2009 ............................................................... .30 .30 .29 .28 1.8 1.8 1.7 1.6 2010 ............................................................... .28 .28 .28 .27 1.6 1.6 1.6 1.6
2011 ............................................................... .27 .28 .27 .26 1.6 1.6 1.6 1.5 2012 ............................................................... .26 .26 .27 .26 1.5 1.5 1.5 1.5 2013 ............................................................... .26 .26 .26 .26 1.5 1.5 1.5 1.5 2014 ............................................................... .26 .27 .27 .29 1.5 1.5 1.5 1.6 2015 ............................................................... .30 .29 .30 .30 1.6 1.6 1.6 1.6 2016 ............................................................... .38 .38 .38 .38 2.1 2.1 2.0 2.0
See footnotes at end of table.
-149-

Supplemental table 11. Private retail trade industry workers, by occupational group: employer costs per hours workedfor employee compensation and costs as a percentage of total compensation, 2006-2017
All workers
Compensationcomponent
Cost per hour worked Percent of total compensation
Mar. June Sep. Dec. Mar. June Sep. Dec.
Supplemental pay 2017 ............................................................... 0.37 – – – 2.0 – – –
Insurance 2006 ............................................................... – – – 1.01 – – – 6.3 2007 ............................................................... 1.01 1.01 1.03 1.04 6.2 6.3 6.3 6.4 2008 ............................................................... 1.08 1.09 1.09 1.12 6.5 6.5 6.5 6.7 2009 ............................................................... 1.15 1.15 1.16 1.20 6.9 6.8 6.8 7.0 2010 ............................................................... 1.24 1.26 1.25 1.25 7.2 7.2 7.2 7.3
2011 ............................................................... 1.27 1.30 1.30 1.28 7.4 7.5 7.4 7.3 2012 ............................................................... 1.28 1.28 1.24 1.25 7.3 7.3 7.0 7.2 2013 ............................................................... 1.33 1.33 1.34 1.28 7.5 7.5 7.5 7.2 2014 ............................................................... 1.33 1.32 1.32 1.26 7.5 7.4 7.3 7.1 2015 ............................................................... 1.29 1.31 1.32 1.20 7.2 7.2 7.2 6.7 2016 ............................................................... 1.25 1.26 1.24 1.26 6.9 6.8 6.7 6.7 2017 ............................................................... 1.26 – – – 6.6 – – –
Retirement and savings 2006 ............................................................... – – – .29 – – – 1.8 2007 ............................................................... .29 .29 .34 .35 1.8 1.8 2.1 2.1 2008 ............................................................... .36 .36 .37 .36 2.2 2.2 2.2 2.1 2009 ............................................................... .34 .35 .34 .34 2.0 2.0 2.0 2.0 2010 ............................................................... .35 .35 .36 .34 2.0 2.0 2.1 2.0
2011 ............................................................... .34 .35 .36 .35 2.0 2.0 2.0 2.0 2012 ............................................................... .36 .36 .36 .37 2.0 2.0 2.0 2.1 2013 ............................................................... .38 .39 .40 .40 2.1 2.2 2.2 2.3 2014 ............................................................... .40 .41 .39 .39 2.2 2.3 2.2 2.2 2015 ............................................................... .39 .40 .41 .38 2.2 2.2 2.2 2.1 2016 ............................................................... .38 .40 .39 .40 2.1 2.1 2.1 2.1 2017 ............................................................... .40 – – – 2.1 – – –
Legally required benefits 2006 ............................................................... – – – 1.52 – – – 9.5 2007 ............................................................... 1.53 1.53 1.54 1.54 9.5 9.5 9.4 9.4 2008 ............................................................... 1.54 1.55 1.55 1.56 9.4 9.3 9.3 9.3 2009 ............................................................... 1.57 1.57 1.57 1.57 9.3 9.3 9.3 9.2 2010 ............................................................... 1.59 1.61 1.61 1.58 9.2 9.2 9.3 9.2
2011 ............................................................... 1.59 1.62 1.62 1.62 9.3 9.3 9.2 9.3 2012 ............................................................... 1.63 1.64 1.64 1.62 9.3 9.3 9.3 9.3 2013 ............................................................... 1.63 1.63 1.63 1.62 9.2 9.2 9.1 9.1 2014 ............................................................... 1.61 1.62 1.63 1.62 9.1 9.0 9.0 9.0 2015 ............................................................... 1.63 1.64 1.63 1.61 9.0 9.0 8.9 8.9 2016 ............................................................... 1.61 1.62 1.62 1.63 8.9 8.8 8.7 8.7 2017 ............................................................... 1.65 – – – 8.7 – – –
Note: The sum of individual items may not equal totals due to rounding. Dashes indicate data are not available.
-150-

Supplemental table 11. Private retail trade industry workers, by occupational group: employer costs per hours workedfor employee compensation and costs as a percentage of total compensation, 2006-2017 -- Continued
Sales and office occupations
Compensationcomponent
Cost per hour worked Percent of total compensation
Mar. June Sep. Dec. Mar. June Sep. Dec.
Total compensation 2006 ............................................................... – – – $14.30 – – – 100.0 2007 ............................................................... 14.24 14.39 14.50 14.66 100.0 100.0 100.0 100.0 2008 ............................................................... 14.66 14.82 14.91 14.97 100.0 100.0 100.0 100.0 2009 ............................................................... 14.94 15.04 15.13 15.28 100.0 100.0 100.0 100.0 2010 ............................................................... 15.32 15.45 15.56 15.43 100.0 100.0 100.0 100.0
2011 ............................................................... 15.45 15.66 15.76 15.72 100.0 100.0 100.0 100.0 2012 ............................................................... 15.75 15.81 15.69 15.56 100.0 100.0 100.0 100.0 2013 ............................................................... 15.75 15.84 15.91 15.76 100.0 100.0 100.0 100.0 2014 ............................................................... 15.83 15.90 16.05 15.87 100.0 100.0 100.0 100.0 2015 ............................................................... 15.99 16.20 16.31 15.84 100.0 100.0 100.0 100.0 2016 ............................................................... 16.17 16.41 16.42 16.50 100.0 100.0 100.0 100.0 2017 ............................................................... 16.71 – – – 100.0 – – –
Wages and salaries 2006 ............................................................... – – – 10.93 – – – 76.4 2007 ............................................................... 10.89 11.01 11.05 11.17 76.5 76.5 76.2 76.2 2008 ............................................................... 11.14 11.27 11.34 11.37 76.0 76.0 76.0 75.9 2009 ............................................................... 11.35 11.43 11.52 11.62 76.0 76.0 76.2 76.1 2010 ............................................................... 11.62 11.70 11.78 11.67 75.8 75.7 75.7 75.6
2011 ............................................................... 11.67 11.80 11.90 11.89 75.6 75.4 75.5 75.6 2012 ............................................................... 11.91 11.95 11.94 11.82 75.6 75.6 76.1 76.0 2013 ............................................................... 11.90 11.96 12.02 11.96 75.5 75.5 75.5 75.9 2014 ............................................................... 11.95 12.02 12.16 12.07 75.5 75.6 75.8 76.0 2015 ............................................................... 12.14 12.30 12.39 12.13 75.9 75.9 75.9 76.6 2016 ............................................................... 12.26 12.48 12.54 12.58 75.8 76.0 76.4 76.3 2017 ............................................................... 12.77 – – – 76.4 – – –
Total benefits 2006 ............................................................... – – – 3.37 – – – 23.6 2007 ............................................................... 3.34 3.38 3.45 3.49 23.5 23.5 23.8 23.8 2008 ............................................................... 3.52 3.55 3.57 3.61 24.0 24.0 24.0 24.1 2009 ............................................................... 3.59 3.61 3.60 3.66 24.0 24.0 23.8 23.9 2010 ............................................................... 3.70 3.75 3.78 3.76 24.2 24.3 24.3 24.4
2011 ............................................................... 3.77 3.86 3.87 3.83 24.4 24.6 24.5 24.4 2012 ............................................................... 3.84 3.86 3.75 3.74 24.4 24.4 23.9 24.0 2013 ............................................................... 3.85 3.87 3.89 3.81 24.5 24.5 24.5 24.1 2014 ............................................................... 3.87 3.88 3.89 3.81 24.5 24.4 24.2 24.0 2015 ............................................................... 3.85 3.90 3.92 3.70 24.1 24.1 24.1 23.4 2016 ............................................................... 3.91 3.93 3.88 3.91 24.2 24.0 23.6 23.7 2017 ............................................................... 3.94 – – – 23.6 – – –
Paid leave 2006 ............................................................... – – – .62 – – – 4.3 2007 ............................................................... .62 .63 .63 .63 4.3 4.4 4.3 4.3 2008 ............................................................... .62 .63 .63 .63 4.2 4.2 4.2 4.2 2009 ............................................................... .63 .63 .63 .64 4.2 4.2 4.2 4.2 2010 ............................................................... .63 .65 .66 .66 4.1 4.2 4.2 4.3
2011 ............................................................... .65 .67 .67 .65 4.2 4.3 4.2 4.2 2012 ............................................................... .66 .66 .64 .64 4.2 4.2 4.1 4.1 2013 ............................................................... .65 .65 .66 .65 4.1 4.1 4.1 4.2 2014 ............................................................... .66 .66 .67 .66 4.2 4.2 4.2 4.2 2015 ............................................................... .67 .68 .69 .67 4.2 4.2 4.2 4.2 2016 ............................................................... .70 .71 .71 .72 4.3 4.4 4.3 4.3 2017 ............................................................... .73 – – – 4.3 – – –
Supplemental pay 2006 ............................................................... – – – .26 – – – 1.8 2007 ............................................................... .24 .25 .26 .26 1.7 1.8 1.8 1.7 2008 ............................................................... .26 .26 .26 .26 1.8 1.8 1.7 1.8 2009 ............................................................... .23 .24 .24 .23 1.6 1.6 1.6 1.5 2010 ............................................................... .23 .23 .23 .22 1.5 1.5 1.5 1.4
2011 ............................................................... .23 .23 .23 .20 1.5 1.5 1.4 1.3 2012 ............................................................... .21 .21 .21 .21 1.3 1.3 1.3 1.3 2013 ............................................................... .21 .21 .21 .21 1.3 1.3 1.3 1.3 2014 ............................................................... .21 .21 .21 .23 1.3 1.3 1.3 1.4 2015 ............................................................... .23 .23 .23 .23 1.4 1.4 1.4 1.5 2016 ............................................................... .32 .33 .32 .32 2.0 2.0 1.9 1.9
See footnotes at end of table.
-151-
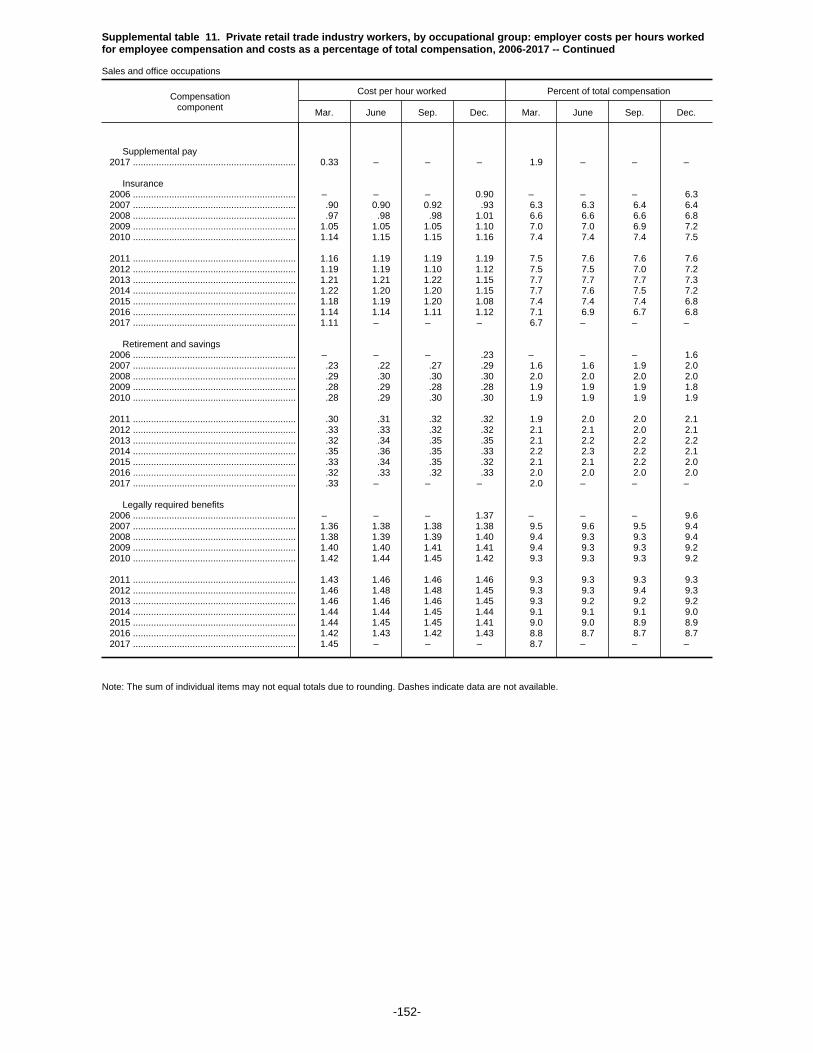
Supplemental table 11. Private retail trade industry workers, by occupational group: employer costs per hours workedfor employee compensation and costs as a percentage of total compensation, 2006-2017 -- Continued
Sales and office occupations
Compensationcomponent
Cost per hour worked Percent of total compensation
Mar. June Sep. Dec. Mar. June Sep. Dec.
Supplemental pay 2017 ............................................................... 0.33 – – – 1.9 – – –
Insurance 2006 ............................................................... – – – 0.90 – – – 6.3 2007 ............................................................... .90 0.90 0.92 .93 6.3 6.3 6.4 6.4 2008 ............................................................... .97 .98 .98 1.01 6.6 6.6 6.6 6.8 2009 ............................................................... 1.05 1.05 1.05 1.10 7.0 7.0 6.9 7.2 2010 ............................................................... 1.14 1.15 1.15 1.16 7.4 7.4 7.4 7.5
2011 ............................................................... 1.16 1.19 1.19 1.19 7.5 7.6 7.6 7.6 2012 ............................................................... 1.19 1.19 1.10 1.12 7.5 7.5 7.0 7.2 2013 ............................................................... 1.21 1.21 1.22 1.15 7.7 7.7 7.7 7.3 2014 ............................................................... 1.22 1.20 1.20 1.15 7.7 7.6 7.5 7.2 2015 ............................................................... 1.18 1.19 1.20 1.08 7.4 7.4 7.4 6.8 2016 ............................................................... 1.14 1.14 1.11 1.12 7.1 6.9 6.7 6.8 2017 ............................................................... 1.11 – – – 6.7 – – –
Retirement and savings 2006 ............................................................... – – – .23 – – – 1.6 2007 ............................................................... .23 .22 .27 .29 1.6 1.6 1.9 2.0 2008 ............................................................... .29 .30 .30 .30 2.0 2.0 2.0 2.0 2009 ............................................................... .28 .29 .28 .28 1.9 1.9 1.9 1.8 2010 ............................................................... .28 .29 .30 .30 1.9 1.9 1.9 1.9
2011 ............................................................... .30 .31 .32 .32 1.9 2.0 2.0 2.1 2012 ............................................................... .33 .33 .32 .32 2.1 2.1 2.0 2.1 2013 ............................................................... .32 .34 .35 .35 2.1 2.2 2.2 2.2 2014 ............................................................... .35 .36 .35 .33 2.2 2.3 2.2 2.1 2015 ............................................................... .33 .34 .35 .32 2.1 2.1 2.2 2.0 2016 ............................................................... .32 .33 .32 .33 2.0 2.0 2.0 2.0 2017 ............................................................... .33 – – – 2.0 – – –
Legally required benefits 2006 ............................................................... – – – 1.37 – – – 9.6 2007 ............................................................... 1.36 1.38 1.38 1.38 9.5 9.6 9.5 9.4 2008 ............................................................... 1.38 1.39 1.39 1.40 9.4 9.3 9.3 9.4 2009 ............................................................... 1.40 1.40 1.41 1.41 9.4 9.3 9.3 9.2 2010 ............................................................... 1.42 1.44 1.45 1.42 9.3 9.3 9.3 9.2
2011 ............................................................... 1.43 1.46 1.46 1.46 9.3 9.3 9.3 9.3 2012 ............................................................... 1.46 1.48 1.48 1.45 9.3 9.3 9.4 9.3 2013 ............................................................... 1.46 1.46 1.46 1.45 9.3 9.2 9.2 9.2 2014 ............................................................... 1.44 1.44 1.45 1.44 9.1 9.1 9.1 9.0 2015 ............................................................... 1.44 1.45 1.45 1.41 9.0 9.0 8.9 8.9 2016 ............................................................... 1.42 1.43 1.42 1.43 8.8 8.7 8.7 8.7 2017 ............................................................... 1.45 – – – 8.7 – – –
Note: The sum of individual items may not equal totals due to rounding. Dashes indicate data are not available.
-152-

Supplemental table 11. Private retail trade industry workers, by occupational group: employer costs per hours workedfor employee compensation and costs as a percentage of total compensation, 2006-2017 -- Continued
Sales and related occupations
Compensationcomponent
Cost per hour worked Percent of total compensation
Mar. June Sep. Dec. Mar. June Sep. Dec.
Total compensation 2006 ............................................................... – – – $14.04 – – – 100.0 2007 ............................................................... 13.94 14.15 14.23 14.40 100.0 100.0 100.0 100.0 2008 ............................................................... 14.41 14.59 14.67 14.79 100.0 100.0 100.0 100.0 2009 ............................................................... 14.72 14.83 14.92 15.10 100.0 100.0 100.0 100.0 2010 ............................................................... 15.11 15.25 15.35 15.19 100.0 100.0 100.0 100.0
2011 ............................................................... 15.19 15.44 15.56 15.45 100.0 100.0 100.0 100.0 2012 ............................................................... 15.45 15.49 15.42 15.25 100.0 100.0 100.0 100.0 2013 ............................................................... 15.43 15.53 15.62 15.50 100.0 100.0 100.0 100.0 2014 ............................................................... 15.56 15.64 15.80 15.58 100.0 100.0 100.0 100.0 2015 ............................................................... 15.69 15.92 16.02 15.55 100.0 100.0 100.0 100.0 2016 ............................................................... 15.88 16.12 16.13 16.18 100.0 100.0 100.0 100.0 2017 ............................................................... 16.37 – – – 100.0 – – –
Wages and salaries 2006 ............................................................... – – – 10.81 – – – 77.0 2007 ............................................................... 10.75 10.91 10.93 11.07 77.1 77.1 76.8 76.8 2008 ............................................................... 11.05 11.20 11.26 11.32 76.7 76.8 76.8 76.5 2009 ............................................................... 11.29 11.37 11.47 11.59 76.7 76.7 76.9 76.8 2010 ............................................................... 11.57 11.66 11.74 11.61 76.6 76.4 76.5 76.4
2011 ............................................................... 11.60 11.75 11.86 11.83 76.4 76.1 76.2 76.5 2012 ............................................................... 11.83 11.86 11.87 11.74 76.6 76.6 77.0 77.0 2013 ............................................................... 11.81 11.87 11.93 11.89 76.5 76.4 76.4 76.7 2014 ............................................................... 11.89 11.97 12.11 11.99 76.4 76.5 76.6 77.0 2015 ............................................................... 12.07 12.24 12.32 12.08 76.9 76.9 76.9 77.7 2016 ............................................................... 12.19 12.41 12.47 12.50 76.8 77.0 77.3 77.3 2017 ............................................................... 12.67 – – – 77.4 – – –
Total benefits 2006 ............................................................... – – – 3.23 – – – 23.0 2007 ............................................................... 3.19 3.24 3.30 3.33 22.9 22.9 23.2 23.2 2008 ............................................................... 3.36 3.39 3.41 3.47 23.3 23.2 23.2 23.5 2009 ............................................................... 3.44 3.46 3.45 3.51 23.3 23.3 23.1 23.2 2010 ............................................................... 3.54 3.59 3.61 3.58 23.4 23.6 23.5 23.6
2011 ............................................................... 3.59 3.69 3.70 3.63 23.6 23.9 23.8 23.5 2012 ............................................................... 3.62 3.63 3.55 3.51 23.4 23.4 23.0 23.0 2013 ............................................................... 3.63 3.66 3.69 3.61 23.5 23.6 23.6 23.3 2014 ............................................................... 3.67 3.68 3.69 3.58 23.6 23.5 23.4 23.0 2015 ............................................................... 3.62 3.67 3.70 3.47 23.1 23.1 23.1 22.3 2016 ............................................................... 3.69 3.71 3.66 3.68 23.2 23.0 22.7 22.7 2017 ............................................................... 3.70 – – – 22.6 – – –
Paid leave 2006 ............................................................... – – – .57 – – – 4.1 2007 ............................................................... .57 .58 .58 .58 4.1 4.1 4.1 4.1 2008 ............................................................... .58 .58 .59 .59 4.0 4.0 4.0 4.0 2009 ............................................................... .59 .59 .59 .59 4.0 4.0 3.9 3.9 2010 ............................................................... .59 .61 .62 .62 3.9 4.0 4.0 4.1
2011 ............................................................... .61 .63 .63 .61 4.0 4.1 4.0 3.9 2012 ............................................................... .61 .61 .60 .60 3.9 3.9 3.9 3.9 2013 ............................................................... .60 .60 .61 .61 3.9 3.9 3.9 3.9 2014 ............................................................... .62 .62 .63 .61 4.0 4.0 4.0 3.9 2015 ............................................................... .62 .63 .64 .61 4.0 4.0 4.0 3.9 2016 ............................................................... .65 .66 .65 .66 4.1 4.1 4.0 4.1 2017 ............................................................... .67 – – – 4.1 – – –
Supplemental pay 2006 ............................................................... – – – .27 – – – 1.9 2007 ............................................................... .24 .26 .26 .26 1.7 1.8 1.8 1.8 2008 ............................................................... .26 .27 .27 .27 1.8 1.8 1.8 1.8 2009 ............................................................... .23 .24 .24 .23 1.6 1.6 1.6 1.5 2010 ............................................................... .23 .23 .23 .23 1.5 1.5 1.5 1.5
2011 ............................................................... .23 .23 .23 .21 1.5 1.5 1.5 1.3 2012 ............................................................... .21 .21 .21 .21 1.4 1.4 1.4 1.4 2013 ............................................................... .21 .21 .21 .20 1.4 1.3 1.4 1.3 2014 ............................................................... .20 .21 .21 .23 1.3 1.3 1.4 1.5 2015 ............................................................... .23 .23 .23 .22 1.5 1.4 1.4 1.4 2016 ............................................................... .32 .32 .32 .32 2.0 2.0 2.0 2.0
See footnotes at end of table.
-153-

Supplemental table 11. Private retail trade industry workers, by occupational group: employer costs per hours workedfor employee compensation and costs as a percentage of total compensation, 2006-2017 -- Continued
Sales and related occupations
Compensationcomponent
Cost per hour worked Percent of total compensation
Mar. June Sep. Dec. Mar. June Sep. Dec.
Supplemental pay 2017 ............................................................... 0.32 – – – 2.0 – – –
Insurance 2006 ............................................................... – – – 0.81 – – – 5.8 2007 ............................................................... .81 0.81 0.83 .84 5.8 5.7 5.8 5.8 2008 ............................................................... .87 .88 .88 .92 6.0 6.0 6.0 6.2 2009 ............................................................... .95 .95 .95 .99 6.5 6.4 6.3 6.6 2010 ............................................................... 1.02 1.03 1.03 1.03 6.7 6.8 6.7 6.7
2011 ............................................................... 1.03 1.06 1.07 1.06 6.8 6.9 6.9 6.8 2012 ............................................................... 1.05 1.05 .99 .99 6.8 6.8 6.4 6.5 2013 ............................................................... 1.09 1.10 1.12 1.04 7.1 7.1 7.1 6.7 2014 ............................................................... 1.10 1.10 1.10 1.04 7.1 7.1 7.0 6.7 2015 ............................................................... 1.06 1.08 1.09 .97 6.8 6.8 6.8 6.2 2016 ............................................................... 1.03 1.03 1.00 1.01 6.5 6.4 6.2 6.2 2017 ............................................................... 1.00 – – – 6.1 – – –
Retirement and savings 2006 ............................................................... – – – .22 – – – 1.6 2007 ............................................................... .22 .22 .26 .27 1.6 1.5 1.8 1.9 2008 ............................................................... .27 .28 .28 .28 1.9 1.9 1.9 1.9 2009 ............................................................... .27 .27 .27 .27 1.8 1.8 1.8 1.8 2010 ............................................................... .27 .27 .28 .28 1.8 1.8 1.8 1.8
2011 ............................................................... .28 .29 .30 .29 1.8 1.9 1.9 1.9 2012 ............................................................... .29 .28 .28 .27 1.9 1.8 1.8 1.8 2013 ............................................................... .27 .30 .30 .30 1.8 1.9 1.9 1.9 2014 ............................................................... .30 .30 .30 .28 1.9 1.9 1.9 1.8 2015 ............................................................... .28 .29 .30 .27 1.8 1.8 1.9 1.7 2016 ............................................................... .27 .28 .27 .28 1.7 1.7 1.7 1.7 2017 ............................................................... .28 – – – 1.7 – – –
Legally required benefits 2006 ............................................................... – – – 1.36 – – – 9.7 2007 ............................................................... 1.35 1.37 1.38 1.38 9.7 9.7 9.7 9.6 2008 ............................................................... 1.38 1.39 1.39 1.41 9.6 9.5 9.5 9.5 2009 ............................................................... 1.40 1.41 1.41 1.42 9.5 9.5 9.4 9.4 2010 ............................................................... 1.43 1.45 1.45 1.43 9.5 9.5 9.5 9.4
2011 ............................................................... 1.44 1.47 1.47 1.46 9.5 9.5 9.4 9.5 2012 ............................................................... 1.47 1.48 1.48 1.45 9.5 9.5 9.6 9.5 2013 ............................................................... 1.45 1.45 1.46 1.44 9.4 9.4 9.3 9.3 2014 ............................................................... 1.44 1.44 1.45 1.43 9.3 9.2 9.2 9.2 2015 ............................................................... 1.44 1.44 1.44 1.40 9.1 9.1 9.0 9.0 2016 ............................................................... 1.41 1.42 1.41 1.42 8.9 8.8 8.8 8.8 2017 ............................................................... 1.44 – – – 8.8 – – –
Note: The sum of individual items may not equal totals due to rounding. Dashes indicate data are not available.
-154-

Supplemental table 11. Private retail trade industry workers, by occupational group: employer costs per hours workedfor employee compensation and costs as a percentage of total compensation, 2006-2017 -- Continued
Office and administrative support occupations
Compensationcomponent
Cost per hour worked Percent of total compensation
Mar. June Sep. Dec. Mar. June Sep. Dec.
Total compensation 2006 ............................................................... – – – $15.51 – – – 100.0 2007 ............................................................... 15.58 15.44 15.66 15.79 100.0 100.0 100.0 100.0 2008 ............................................................... 15.77 15.84 15.96 15.75 100.0 100.0 100.0 100.0 2009 ............................................................... 15.87 15.90 15.97 15.97 100.0 100.0 100.0 100.0 2010 ............................................................... 16.14 16.20 16.38 16.32 100.0 100.0 100.0 100.0
2011 ............................................................... 16.38 16.48 16.51 16.70 100.0 100.0 100.0 100.0 2012 ............................................................... 16.84 16.95 16.65 16.66 100.0 100.0 100.0 100.0 2013 ............................................................... 16.86 16.91 16.94 16.69 100.0 100.0 100.0 100.0 2014 ............................................................... 16.75 16.81 16.89 16.87 100.0 100.0 100.0 100.0 2015 ............................................................... 16.99 17.15 17.27 16.73 100.0 100.0 100.0 100.0 2016 ............................................................... 17.07 17.33 17.36 17.54 100.0 100.0 100.0 100.0 2017 ............................................................... 17.85 – – – 100.0 – – –
Wages and salaries 2006 ............................................................... – – – 11.48 – – – 74.0 2007 ............................................................... 11.56 11.44 11.54 11.61 74.2 74.1 73.7 73.5 2008 ............................................................... 11.54 11.57 11.66 11.57 73.2 73.0 73.0 73.4 2009 ............................................................... 11.63 11.68 11.73 11.74 73.3 73.4 73.5 73.5 2010 ............................................................... 11.79 11.83 11.95 11.90 73.1 73.0 73.0 72.9
2011 ............................................................... 11.95 11.99 12.03 12.12 72.9 72.8 72.9 72.6 2012 ............................................................... 12.19 12.26 12.19 12.13 72.4 72.3 73.2 72.8 2013 ............................................................... 12.22 12.29 12.34 12.19 72.5 72.6 72.9 73.0 2014 ............................................................... 12.16 12.22 12.33 12.31 72.6 72.7 73.0 73.0 2015 ............................................................... 12.36 12.51 12.59 12.31 72.8 72.9 72.9 73.6 2016 ............................................................... 12.47 12.70 12.77 12.87 73.1 73.3 73.6 73.4 2017 ............................................................... 13.12 – – – 73.5 – – –
Total benefits 2006 ............................................................... – – – 4.03 – – – 26.0 2007 ............................................................... 4.02 3.99 4.12 4.18 25.8 25.9 26.3 26.5 2008 ............................................................... 4.23 4.28 4.30 4.19 26.8 27.0 27.0 26.6 2009 ............................................................... 4.23 4.22 4.23 4.24 26.7 26.6 26.5 26.5 2010 ............................................................... 4.34 4.37 4.43 4.42 26.9 27.0 27.0 27.1
2011 ............................................................... 4.44 4.49 4.48 4.58 27.1 27.2 27.1 27.4 2012 ............................................................... 4.65 4.69 4.46 4.53 27.6 27.7 26.8 27.2 2013 ............................................................... 4.64 4.63 4.59 4.50 27.5 27.4 27.1 27.0 2014 ............................................................... 4.59 4.58 4.57 4.56 27.4 27.3 27.0 27.0 2015 ............................................................... 4.62 4.64 4.67 4.42 27.2 27.1 27.1 26.4 2016 ............................................................... 4.60 4.63 4.59 4.67 26.9 26.7 26.4 26.6 2017 ............................................................... 4.73 – – – 26.5 – – –
Paid leave 2006 ............................................................... – – – .84 – – – 5.4 2007 ............................................................... .85 .82 .83 .83 5.4 5.3 5.3 5.3 2008 ............................................................... .81 .81 .82 .80 5.2 5.1 5.2 5.1 2009 ............................................................... .80 .81 .81 .80 5.1 5.1 5.0 5.0 2010 ............................................................... .79 .79 .81 .80 4.9 4.9 4.9 4.9
2011 ............................................................... .80 .81 .82 .82 4.9 4.9 4.9 4.9 2012 ............................................................... .83 .83 .81 .81 4.9 4.9 4.9 4.9 2013 ............................................................... .82 .83 .83 .80 4.9 4.9 4.9 4.8 2014 ............................................................... .80 .81 .81 .82 4.8 4.8 4.8 4.9 2015 ............................................................... .83 .84 .85 .83 4.9 4.9 4.9 5.0 2016 ............................................................... .87 .89 .89 .90 5.1 5.1 5.1 5.1 2017 ............................................................... .92 – – – 5.1 – – –
Supplemental pay 2006 ............................................................... – – – .25 – – – 1.6 2007 ............................................................... .24 .25 .25 .25 1.5 1.6 1.6 1.6 2008 ............................................................... .25 .25 .24 .25 1.6 1.6 1.5 1.6 2009 ............................................................... .24 .24 .24 .23 1.5 1.5 1.5 1.4 2010 ............................................................... .22 .22 .22 .21 1.4 1.4 1.4 1.3
2011 ............................................................... .22 .22 .21 .20 1.3 1.3 1.3 1.2 2012 ............................................................... .21 .21 .20 .20 1.2 1.2 1.2 1.2 2013 ............................................................... .20 .20 .20 .21 1.2 1.2 1.2 1.3 2014 ............................................................... .22 .21 .22 .24 1.3 1.3 1.3 1.4 2015 ............................................................... .24 .23 .24 .26 1.4 1.4 1.4 1.5 2016 ............................................................... .32 .33 .32 .33 1.9 1.9 1.8 1.9
See footnotes at end of table.
-155-
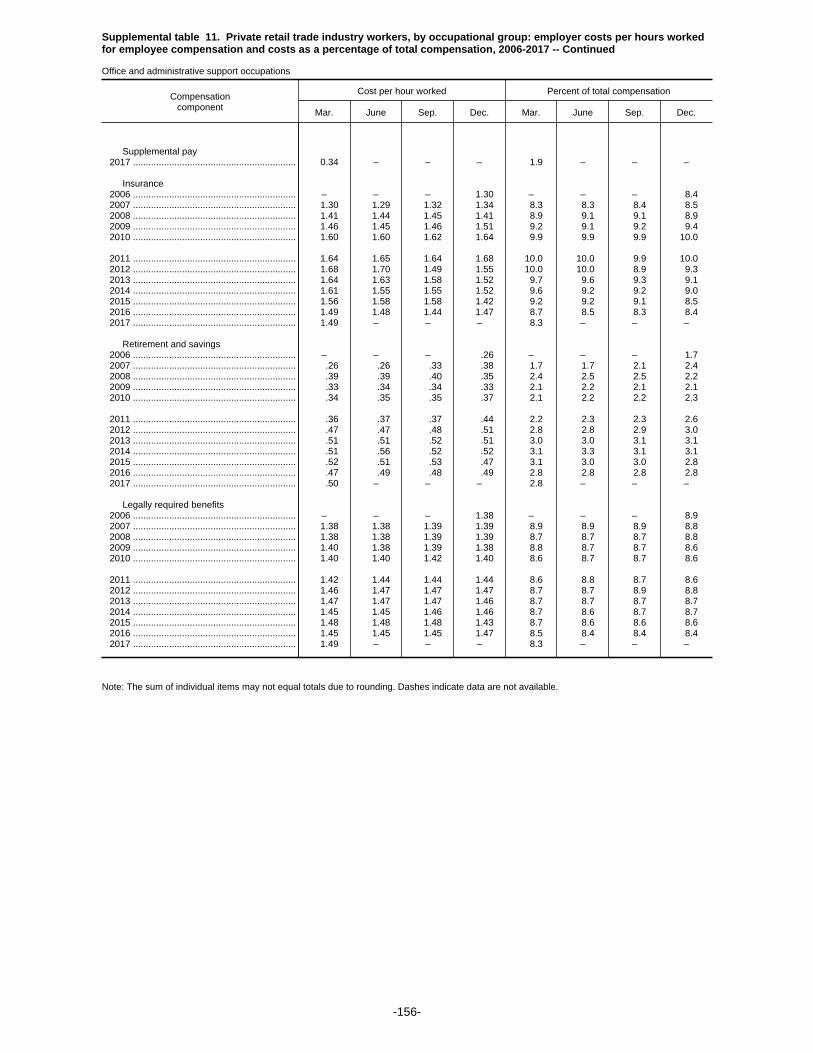
Supplemental table 11. Private retail trade industry workers, by occupational group: employer costs per hours workedfor employee compensation and costs as a percentage of total compensation, 2006-2017 -- Continued
Office and administrative support occupations
Compensationcomponent
Cost per hour worked Percent of total compensation
Mar. June Sep. Dec. Mar. June Sep. Dec.
Supplemental pay 2017 ............................................................... 0.34 – – – 1.9 – – –
Insurance 2006 ............................................................... – – – 1.30 – – – 8.4 2007 ............................................................... 1.30 1.29 1.32 1.34 8.3 8.3 8.4 8.5 2008 ............................................................... 1.41 1.44 1.45 1.41 8.9 9.1 9.1 8.9 2009 ............................................................... 1.46 1.45 1.46 1.51 9.2 9.1 9.2 9.4 2010 ............................................................... 1.60 1.60 1.62 1.64 9.9 9.9 9.9 10.0
2011 ............................................................... 1.64 1.65 1.64 1.68 10.0 10.0 9.9 10.0 2012 ............................................................... 1.68 1.70 1.49 1.55 10.0 10.0 8.9 9.3 2013 ............................................................... 1.64 1.63 1.58 1.52 9.7 9.6 9.3 9.1 2014 ............................................................... 1.61 1.55 1.55 1.52 9.6 9.2 9.2 9.0 2015 ............................................................... 1.56 1.58 1.58 1.42 9.2 9.2 9.1 8.5 2016 ............................................................... 1.49 1.48 1.44 1.47 8.7 8.5 8.3 8.4 2017 ............................................................... 1.49 – – – 8.3 – – –
Retirement and savings 2006 ............................................................... – – – .26 – – – 1.7 2007 ............................................................... .26 .26 .33 .38 1.7 1.7 2.1 2.4 2008 ............................................................... .39 .39 .40 .35 2.4 2.5 2.5 2.2 2009 ............................................................... .33 .34 .34 .33 2.1 2.2 2.1 2.1 2010 ............................................................... .34 .35 .35 .37 2.1 2.2 2.2 2.3
2011 ............................................................... .36 .37 .37 .44 2.2 2.3 2.3 2.6 2012 ............................................................... .47 .47 .48 .51 2.8 2.8 2.9 3.0 2013 ............................................................... .51 .51 .52 .51 3.0 3.0 3.1 3.1 2014 ............................................................... .51 .56 .52 .52 3.1 3.3 3.1 3.1 2015 ............................................................... .52 .51 .53 .47 3.1 3.0 3.0 2.8 2016 ............................................................... .47 .49 .48 .49 2.8 2.8 2.8 2.8 2017 ............................................................... .50 – – – 2.8 – – –
Legally required benefits 2006 ............................................................... – – – 1.38 – – – 8.9 2007 ............................................................... 1.38 1.38 1.39 1.39 8.9 8.9 8.9 8.8 2008 ............................................................... 1.38 1.38 1.39 1.39 8.7 8.7 8.7 8.8 2009 ............................................................... 1.40 1.38 1.39 1.38 8.8 8.7 8.7 8.6 2010 ............................................................... 1.40 1.40 1.42 1.40 8.6 8.7 8.7 8.6
2011 ............................................................... 1.42 1.44 1.44 1.44 8.6 8.8 8.7 8.6 2012 ............................................................... 1.46 1.47 1.47 1.47 8.7 8.7 8.9 8.8 2013 ............................................................... 1.47 1.47 1.47 1.46 8.7 8.7 8.7 8.7 2014 ............................................................... 1.45 1.45 1.46 1.46 8.7 8.6 8.7 8.7 2015 ............................................................... 1.48 1.48 1.48 1.43 8.7 8.6 8.6 8.6 2016 ............................................................... 1.45 1.45 1.45 1.47 8.5 8.4 8.4 8.4 2017 ............................................................... 1.49 – – – 8.3 – – –
Note: The sum of individual items may not equal totals due to rounding. Dashes indicate data are not available.
-156-

Supplemental table 11. Private retail trade industry workers, by occupational group: employer costs per hours workedfor employee compensation and costs as a percentage of total compensation, 2006-2017 -- Continued
Production, transportation, and material moving occupations
Compensationcomponent
Cost per hour worked Percent of total compensation
Mar. June Sep. Dec. Mar. June Sep. Dec.
Total compensation 2006 ............................................................... – – – $14.62 – – – 100.0 2007 ............................................................... 14.69 15.03 15.15 15.16 100.0 100.0 100.0 100.0 2008 ............................................................... 15.34 15.48 15.52 15.72 100.0 100.0 100.0 100.0 2009 ............................................................... 15.85 15.96 16.20 16.05 100.0 100.0 100.0 100.0 2010 ............................................................... 16.22 16.29 16.45 16.08 100.0 100.0 100.0 100.0
2011 ............................................................... 16.10 16.21 16.24 16.14 100.0 100.0 100.0 100.0 2012 ............................................................... 16.14 16.22 16.36 16.45 100.0 100.0 100.0 100.0 2013 ............................................................... 16.59 16.60 16.78 16.57 100.0 100.0 100.0 100.0 2014 ............................................................... 16.46 16.56 16.66 17.16 100.0 100.0 100.0 100.0 2015 ............................................................... 17.35 17.49 17.63 16.58 100.0 100.0 100.0 100.0 2016 ............................................................... 16.72 16.85 16.90 17.05 100.0 100.0 100.0 100.0 2017 ............................................................... 17.34 – – – 100.0 – – –
Wages and salaries 2006 ............................................................... – – – 10.56 – – – 72.2 2007 ............................................................... 10.61 10.83 10.91 10.92 72.2 72.1 72.0 72.1 2008 ............................................................... 11.06 11.19 11.21 11.32 72.1 72.3 72.2 72.0 2009 ............................................................... 11.39 11.49 11.66 11.49 71.9 72.0 72.0 71.6 2010 ............................................................... 11.52 11.57 11.67 11.49 71.1 71.0 70.9 71.5
2011 ............................................................... 11.49 11.52 11.58 11.59 71.4 71.1 71.3 71.8 2012 ............................................................... 11.60 11.62 11.64 11.72 71.9 71.6 71.1 71.2 2013 ............................................................... 11.79 11.81 11.90 11.86 71.1 71.1 70.9 71.6 2014 ............................................................... 11.77 11.85 11.94 12.25 71.5 71.6 71.7 71.4 2015 ............................................................... 12.35 12.43 12.56 12.07 71.2 71.1 71.3 72.8 2016 ............................................................... 12.17 12.28 12.32 12.43 72.8 72.9 72.9 72.9 2017 ............................................................... 12.64 – – – 72.9 – – –
Total benefits 2006 ............................................................... – – – 4.06 – – – 27.8 2007 ............................................................... 4.08 4.20 4.24 4.23 27.8 27.9 28.0 27.9 2008 ............................................................... 4.28 4.29 4.31 4.40 27.9 27.7 27.8 28.0 2009 ............................................................... 4.45 4.47 4.54 4.56 28.1 28.0 28.0 28.4 2010 ............................................................... 4.70 4.73 4.78 4.58 28.9 29.0 29.1 28.5
2011 ............................................................... 4.61 4.69 4.66 4.55 28.6 28.9 28.7 28.2 2012 ............................................................... 4.53 4.60 4.72 4.73 28.1 28.4 28.9 28.8 2013 ............................................................... 4.80 4.80 4.87 4.71 28.9 28.9 29.1 28.4 2014 ............................................................... 4.69 4.71 4.71 4.90 28.5 28.4 28.3 28.6 2015 ............................................................... 5.00 5.06 5.07 4.51 28.8 28.9 28.7 27.2 2016 ............................................................... 4.55 4.56 4.57 4.62 27.2 27.1 27.1 27.1 2017 ............................................................... 4.70 – – – 27.1 – – –
Paid leave 2006 ............................................................... – – – .62 – – – 4.2 2007 ............................................................... .62 .66 .65 .65 4.2 4.4 4.3 4.3 2008 ............................................................... .65 .67 .67 .68 4.2 4.3 4.3 4.3 2009 ............................................................... .70 .69 .71 .70 4.4 4.3 4.4 4.3 2010 ............................................................... .70 .72 .73 .69 4.3 4.4 4.4 4.3
2011 ............................................................... .69 .69 .70 .68 4.3 4.3 4.3 4.2 2012 ............................................................... .69 .70 .70 .72 4.3 4.3 4.3 4.4 2013 ............................................................... .73 .73 .74 .72 4.4 4.4 4.4 4.4 2014 ............................................................... .72 .72 .73 .75 4.4 4.4 4.4 4.4 2015 ............................................................... .76 .77 .77 .68 4.4 4.4 4.4 4.1 2016 ............................................................... .68 .69 .69 .70 4.1 4.1 4.1 4.1 2017 ............................................................... .72 – – – 4.2 – – –
Supplemental pay 2006 ............................................................... – – – .40 – – – 2.7 2007 ............................................................... .40 .41 .42 .42 2.8 2.8 2.8 2.8 2008 ............................................................... .44 .42 .43 .43 2.9 2.7 2.7 2.7 2009 ............................................................... .42 .42 .41 .42 2.6 2.6 2.6 2.6 2010 ............................................................... .42 .42 .42 .40 2.6 2.6 2.6 2.5
2011 ............................................................... .40 .40 .38 .38 2.5 2.4 2.4 2.4 2012 ............................................................... .38 .38 .39 .36 2.3 2.4 2.4 2.2 2013 ............................................................... .36 .37 .37 .32 2.2 2.2 2.2 1.9 2014 ............................................................... .32 .32 .32 .33 1.9 1.9 1.9 1.9 2015 ............................................................... .33 .33 .34 .28 1.9 1.9 1.9 1.7 2016 ............................................................... .29 .29 .29 .29 1.7 1.7 1.7 1.7
See footnotes at end of table.
-157-

Supplemental table 11. Private retail trade industry workers, by occupational group: employer costs per hours workedfor employee compensation and costs as a percentage of total compensation, 2006-2017 -- Continued
Production, transportation, and material moving occupations
Compensationcomponent
Cost per hour worked Percent of total compensation
Mar. June Sep. Dec. Mar. June Sep. Dec.
Supplemental pay 2017 ............................................................... 0.30 – – – 1.7 – – –
Insurance 2006 ............................................................... – – – 1.19 – – – 8.1 2007 ............................................................... 1.20 1.24 1.25 1.25 8.2 8.3 8.2 8.2 2008 ............................................................... 1.26 1.28 1.28 1.32 8.2 8.2 8.2 8.4 2009 ............................................................... 1.36 1.38 1.42 1.46 8.6 8.6 8.7 9.1 2010 ............................................................... 1.53 1.54 1.56 1.45 9.4 9.5 9.5 9.0
2011 ............................................................... 1.47 1.51 1.49 1.42 9.1 9.3 9.2 8.8 2012 ............................................................... 1.42 1.45 1.55 1.53 8.8 8.9 9.5 9.3 2013 ............................................................... 1.58 1.55 1.60 1.51 9.5 9.3 9.6 9.1 2014 ............................................................... 1.50 1.51 1.52 1.56 9.1 9.1 9.1 9.1 2015 ............................................................... 1.62 1.66 1.64 1.32 9.3 9.5 9.3 7.9 2016 ............................................................... 1.34 1.35 1.37 1.38 8.0 8.0 8.1 8.1 2017 ............................................................... 1.40 – – – 8.1 – – –
Retirement and savings 2006 ............................................................... – – – .30 – – – 2.1 2007 ............................................................... .29 .30 .33 .33 2.0 2.0 2.1 2.2 2008 ............................................................... .34 .34 .35 .35 2.2 2.2 2.2 2.2 2009 ............................................................... .33 .32 .34 .34 2.1 2.0 2.1 2.1 2010 ............................................................... .36 .37 .37 .36 2.2 2.2 2.2 2.2
2011 ............................................................... .36 .37 .38 .33 2.2 2.3 2.3 2.1 2012 ............................................................... .33 .34 .34 .35 2.1 2.1 2.1 2.2 2013 ............................................................... .36 .39 .40 .40 2.2 2.3 2.4 2.4 2014 ............................................................... .41 .41 .39 .42 2.5 2.5 2.3 2.5 2015 ............................................................... .44 .46 .47 .37 2.5 2.6 2.7 2.2 2016 ............................................................... .38 .39 .39 .40 2.3 2.3 2.3 2.4 2017 ............................................................... .41 – – – 2.4 – – –
Legally required benefits 2006 ............................................................... – – – 1.55 – – – 10.6 2007 ............................................................... 1.56 1.58 1.60 1.58 10.6 10.5 10.5 10.4 2008 ............................................................... 1.59 1.59 1.59 1.62 10.4 10.2 10.2 10.3 2009 ............................................................... 1.65 1.66 1.66 1.65 10.4 10.4 10.3 10.3 2010 ............................................................... 1.68 1.68 1.71 1.69 10.4 10.3 10.4 10.5
2011 ............................................................... 1.69 1.72 1.71 1.73 10.5 10.6 10.5 10.7 2012 ............................................................... 1.72 1.73 1.74 1.76 10.7 10.7 10.6 10.7 2013 ............................................................... 1.77 1.76 1.75 1.75 10.7 10.6 10.4 10.6 2014 ............................................................... 1.74 1.75 1.76 1.85 10.6 10.5 10.5 10.8 2015 ............................................................... 1.86 1.85 1.85 1.86 10.7 10.6 10.5 11.2 2016 ............................................................... 1.86 1.84 1.84 1.84 11.1 10.9 10.9 10.8 2017 ............................................................... 1.86 – – – 10.7 – – –
Note: The sum of individual items may not equal totals due to rounding. Dashes indicate data are not available.
-158-

Supplemental table 11. Private retail trade industry workers, by occupational group: employer costs per hours workedfor employee compensation and costs as a percentage of total compensation, 2006-2017 -- Continued
Transportation and material moving occupations
Compensationcomponent
Cost per hour worked Percent of total compensation
Mar. June Sep. Dec. Mar. June Sep. Dec.
Total compensation 2006 ............................................................... – – – $13.85 – – – 100.0 2007 ............................................................... 13.92 14.27 14.37 14.35 100.0 100.0 100.0 100.0 2008 ............................................................... 14.53 14.67 14.69 14.94 100.0 100.0 100.0 100.0 2009 ............................................................... 15.03 15.17 15.38 15.17 100.0 100.0 100.0 100.0 2010 ............................................................... 15.28 15.35 15.55 15.30 100.0 100.0 100.0 100.0
2011 ............................................................... 15.35 15.43 15.44 15.33 100.0 100.0 100.0 100.0 2012 ............................................................... 15.23 15.43 15.63 15.44 100.0 100.0 100.0 100.0 2013 ............................................................... 15.62 15.71 15.85 15.74 100.0 100.0 100.0 100.0 2014 ............................................................... 15.62 15.71 15.83 16.49 100.0 100.0 100.0 100.0 2015 ............................................................... 16.68 16.79 16.88 15.93 100.0 100.0 100.0 100.0 2016 ............................................................... 16.03 16.16 16.26 16.42 100.0 100.0 100.0 100.0 2017 ............................................................... 16.71 – – – 100.0 – – –
Wages and salaries 2006 ............................................................... – – – 9.99 – – – 72.1 2007 ............................................................... 10.04 10.26 10.31 10.31 72.1 71.9 71.8 71.9 2008 ............................................................... 10.45 10.58 10.59 10.69 71.9 72.1 72.1 71.6 2009 ............................................................... 10.74 10.85 11.02 10.81 71.5 71.5 71.7 71.3 2010 ............................................................... 10.82 10.86 10.99 10.94 70.8 70.8 70.7 71.5
2011 ............................................................... 10.93 10.95 10.99 11.00 71.2 71.0 71.2 71.8 2012 ............................................................... 10.91 11.02 11.06 11.01 71.7 71.4 70.8 71.3 2013 ............................................................... 11.11 11.14 11.20 11.21 71.1 70.9 70.7 71.2 2014 ............................................................... 11.13 11.20 11.33 11.69 71.2 71.3 71.6 70.9 2015 ............................................................... 11.81 11.86 11.96 11.56 70.8 70.6 70.9 72.6 2016 ............................................................... 11.63 11.74 11.82 11.93 72.6 72.7 72.7 72.7 2017 ............................................................... 12.15 – – – 72.7 – – –
Total benefits 2006 ............................................................... – – – 3.86 – – – 27.9 2007 ............................................................... 3.88 4.01 4.05 4.04 27.9 28.1 28.2 28.1 2008 ............................................................... 4.08 4.09 4.10 4.24 28.1 27.9 27.9 28.4 2009 ............................................................... 4.29 4.32 4.35 4.36 28.5 28.5 28.3 28.7 2010 ............................................................... 4.46 4.48 4.56 4.36 29.2 29.2 29.3 28.5
2011 ............................................................... 4.42 4.48 4.45 4.33 28.8 29.0 28.8 28.2 2012 ............................................................... 4.31 4.41 4.57 4.43 28.3 28.6 29.2 28.7 2013 ............................................................... 4.51 4.56 4.64 4.53 28.9 29.1 29.3 28.8 2014 ............................................................... 4.49 4.51 4.50 4.79 28.8 28.7 28.4 29.1 2015 ............................................................... 4.87 4.93 4.92 4.37 29.2 29.4 29.1 27.4 2016 ............................................................... 4.40 4.42 4.44 4.49 27.4 27.3 27.3 27.3 2017 ............................................................... 4.57 – – – 27.3 – – –
Paid leave 2006 ............................................................... – – – .54 – – – 3.9 2007 ............................................................... .55 .58 .57 .57 3.9 4.1 4.0 4.0 2008 ............................................................... .57 .59 .59 .62 3.9 4.0 4.0 4.1 2009 ............................................................... .63 .63 .65 .63 4.2 4.2 4.2 4.2 2010 ............................................................... .64 .64 .65 .63 4.2 4.2 4.2 4.1
2011 ............................................................... .63 .63 .64 .63 4.1 4.1 4.1 4.1 2012 ............................................................... .64 .65 .66 .66 4.2 4.2 4.3 4.3 2013 ............................................................... .67 .68 .70 .68 4.3 4.3 4.4 4.3 2014 ............................................................... .67 .67 .68 .70 4.3 4.3 4.3 4.2 2015 ............................................................... .70 .71 .71 .62 4.2 4.2 4.2 3.9 2016 ............................................................... .62 .63 .64 .64 3.9 3.9 3.9 3.9 2017 ............................................................... .66 – – – 4.0 – – –
Supplemental pay 2006 ............................................................... – – – .39 – – – 2.8 2007 ............................................................... .39 .40 .41 .41 2.8 2.8 2.8 2.8 2008 ............................................................... .42 .40 .40 .40 2.9 2.7 2.7 2.7 2009 ............................................................... .40 .40 .39 .38 2.6 2.6 2.5 2.5 2010 ............................................................... .39 .39 .39 .37 2.6 2.5 2.5 2.4
2011 ............................................................... .38 .38 .36 .35 2.5 2.4 2.3 2.3 2012 ............................................................... .35 .35 .35 .31 2.3 2.3 2.3 2.0 2013 ............................................................... .32 .32 .33 .29 2.0 2.0 2.1 1.8 2014 ............................................................... .29 .29 .29 .32 1.9 1.8 1.8 1.9 2015 ............................................................... .31 .31 .32 .27 1.9 1.9 1.9 1.7 2016 ............................................................... .27 .27 .27 .28 1.7 1.7 1.7 1.7
See footnotes at end of table.
-159-

Supplemental table 11. Private retail trade industry workers, by occupational group: employer costs per hours workedfor employee compensation and costs as a percentage of total compensation, 2006-2017 -- Continued
Transportation and material moving occupations
Compensationcomponent
Cost per hour worked Percent of total compensation
Mar. June Sep. Dec. Mar. June Sep. Dec.
Supplemental pay 2017 ............................................................... 0.29 – – – 1.7 – – –
Insurance 2006 ............................................................... – – – 1.14 – – – 8.3 2007 ............................................................... 1.15 1.20 1.21 1.21 8.3 8.4 8.4 8.4 2008 ............................................................... 1.23 1.24 1.24 1.31 8.5 8.5 8.4 8.8 2009 ............................................................... 1.34 1.37 1.38 1.41 8.9 9.0 9.0 9.3 2010 ............................................................... 1.46 1.48 1.50 1.37 9.6 9.6 9.6 9.0
2011 ............................................................... 1.41 1.45 1.43 1.36 9.2 9.4 9.2 8.8 2012 ............................................................... 1.34 1.38 1.51 1.45 8.8 8.9 9.7 9.4 2013 ............................................................... 1.49 1.50 1.55 1.48 9.6 9.5 9.8 9.4 2014 ............................................................... 1.45 1.45 1.45 1.53 9.3 9.3 9.2 9.3 2015 ............................................................... 1.58 1.62 1.60 1.26 9.5 9.7 9.5 7.9 2016 ............................................................... 1.28 1.30 1.32 1.33 8.0 8.0 8.1 8.1 2017 ............................................................... 1.35 – – – 8.1 – – –
Retirement and savings 2006 ............................................................... – – – .29 – – – 2.1 2007 ............................................................... .28 .29 .31 .32 2.0 2.0 2.2 2.2 2008 ............................................................... .33 .33 .33 .34 2.3 2.2 2.3 2.3 2009 ............................................................... .32 .31 .32 .32 2.1 2.0 2.1 2.1 2010 ............................................................... .34 .35 .36 .34 2.2 2.3 2.3 2.2
2011 ............................................................... .34 .35 .36 .32 2.2 2.3 2.3 2.1 2012 ............................................................... .32 .33 .33 .30 2.1 2.1 2.1 1.9 2013 ............................................................... .31 .35 .36 .38 2.0 2.2 2.3 2.4 2014 ............................................................... .38 .39 .37 .42 2.5 2.5 2.3 2.6 2015 ............................................................... .43 .45 .46 .37 2.6 2.7 2.7 2.3 2016 ............................................................... .38 .39 .38 .40 2.4 2.4 2.4 2.4 2017 ............................................................... .41 – – – 2.4 – – –
Legally required benefits 2006 ............................................................... – – – 1.50 – – – 10.8 2007 ............................................................... 1.51 1.54 1.55 1.53 10.8 10.8 10.8 10.7 2008 ............................................................... 1.54 1.53 1.54 1.57 10.6 10.5 10.5 10.5 2009 ............................................................... 1.61 1.62 1.62 1.61 10.7 10.7 10.6 10.6 2010 ............................................................... 1.63 1.64 1.67 1.66 10.7 10.7 10.7 10.8
2011 ............................................................... 1.66 1.67 1.66 1.67 10.8 10.8 10.7 10.9 2012 ............................................................... 1.67 1.70 1.71 1.71 11.0 11.0 10.9 11.1 2013 ............................................................... 1.72 1.72 1.70 1.71 11.0 11.0 10.7 10.8 2014 ............................................................... 1.69 1.70 1.71 1.83 10.8 10.8 10.8 11.1 2015 ............................................................... 1.84 1.83 1.83 1.85 11.1 10.9 10.8 11.6 2016 ............................................................... 1.85 1.83 1.83 1.83 11.5 11.3 11.2 11.2 2017 ............................................................... 1.85 – – – 11.1 – – –
Note: The sum of individual items may not equal totals due to rounding. Dashes indicate data are not available.
-160-
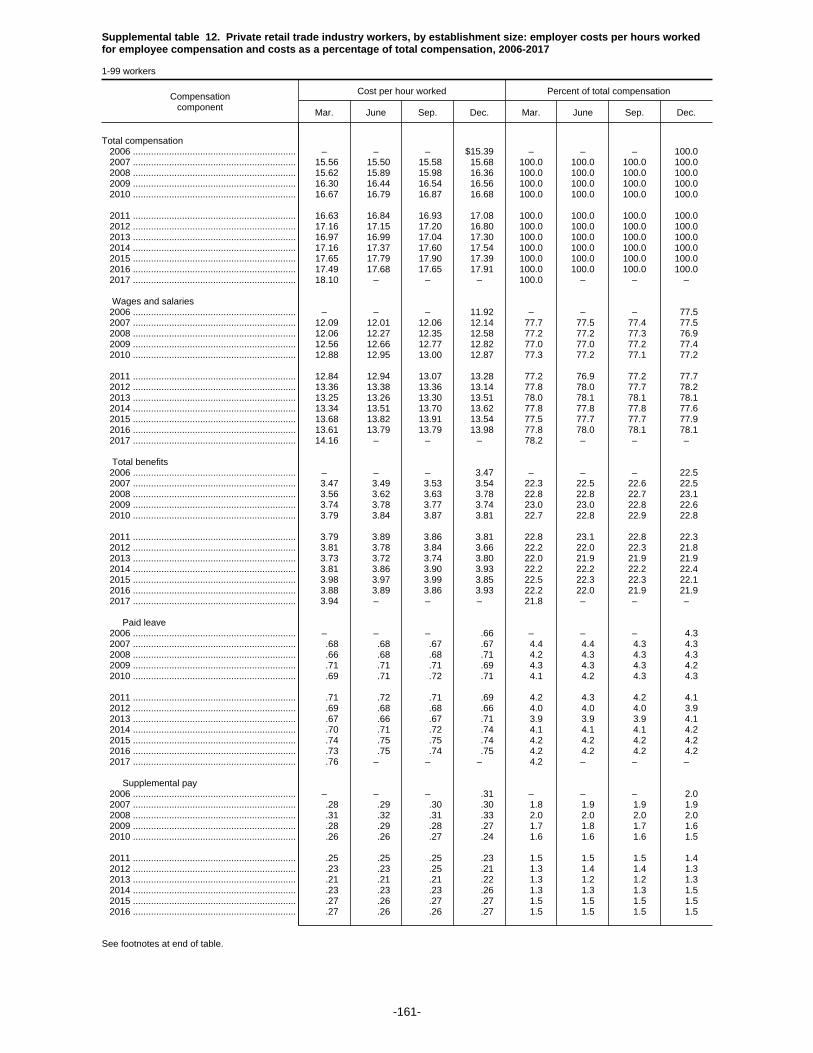
Supplemental table 12. Private retail trade industry workers, by establishment size: employer costs per hours workedfor employee compensation and costs as a percentage of total compensation, 2006-2017
1-99 workers
Compensationcomponent
Cost per hour worked Percent of total compensation
Mar. June Sep. Dec. Mar. June Sep. Dec.
Total compensation 2006 ............................................................... – – – $15.39 – – – 100.0 2007 ............................................................... 15.56 15.50 15.58 15.68 100.0 100.0 100.0 100.0 2008 ............................................................... 15.62 15.89 15.98 16.36 100.0 100.0 100.0 100.0 2009 ............................................................... 16.30 16.44 16.54 16.56 100.0 100.0 100.0 100.0 2010 ............................................................... 16.67 16.79 16.87 16.68 100.0 100.0 100.0 100.0
2011 ............................................................... 16.63 16.84 16.93 17.08 100.0 100.0 100.0 100.0 2012 ............................................................... 17.16 17.15 17.20 16.80 100.0 100.0 100.0 100.0 2013 ............................................................... 16.97 16.99 17.04 17.30 100.0 100.0 100.0 100.0 2014 ............................................................... 17.16 17.37 17.60 17.54 100.0 100.0 100.0 100.0 2015 ............................................................... 17.65 17.79 17.90 17.39 100.0 100.0 100.0 100.0 2016 ............................................................... 17.49 17.68 17.65 17.91 100.0 100.0 100.0 100.0 2017 ............................................................... 18.10 – – – 100.0 – – –
Wages and salaries 2006 ............................................................... – – – 11.92 – – – 77.5 2007 ............................................................... 12.09 12.01 12.06 12.14 77.7 77.5 77.4 77.5 2008 ............................................................... 12.06 12.27 12.35 12.58 77.2 77.2 77.3 76.9 2009 ............................................................... 12.56 12.66 12.77 12.82 77.0 77.0 77.2 77.4 2010 ............................................................... 12.88 12.95 13.00 12.87 77.3 77.2 77.1 77.2
2011 ............................................................... 12.84 12.94 13.07 13.28 77.2 76.9 77.2 77.7 2012 ............................................................... 13.36 13.38 13.36 13.14 77.8 78.0 77.7 78.2 2013 ............................................................... 13.25 13.26 13.30 13.51 78.0 78.1 78.1 78.1 2014 ............................................................... 13.34 13.51 13.70 13.62 77.8 77.8 77.8 77.6 2015 ............................................................... 13.68 13.82 13.91 13.54 77.5 77.7 77.7 77.9 2016 ............................................................... 13.61 13.79 13.79 13.98 77.8 78.0 78.1 78.1 2017 ............................................................... 14.16 – – – 78.2 – – –
Total benefits 2006 ............................................................... – – – 3.47 – – – 22.5 2007 ............................................................... 3.47 3.49 3.53 3.54 22.3 22.5 22.6 22.5 2008 ............................................................... 3.56 3.62 3.63 3.78 22.8 22.8 22.7 23.1 2009 ............................................................... 3.74 3.78 3.77 3.74 23.0 23.0 22.8 22.6 2010 ............................................................... 3.79 3.84 3.87 3.81 22.7 22.8 22.9 22.8
2011 ............................................................... 3.79 3.89 3.86 3.81 22.8 23.1 22.8 22.3 2012 ............................................................... 3.81 3.78 3.84 3.66 22.2 22.0 22.3 21.8 2013 ............................................................... 3.73 3.72 3.74 3.80 22.0 21.9 21.9 21.9 2014 ............................................................... 3.81 3.86 3.90 3.93 22.2 22.2 22.2 22.4 2015 ............................................................... 3.98 3.97 3.99 3.85 22.5 22.3 22.3 22.1 2016 ............................................................... 3.88 3.89 3.86 3.93 22.2 22.0 21.9 21.9 2017 ............................................................... 3.94 – – – 21.8 – – –
Paid leave 2006 ............................................................... – – – .66 – – – 4.3 2007 ............................................................... .68 .68 .67 .67 4.4 4.4 4.3 4.3 2008 ............................................................... .66 .68 .68 .71 4.2 4.3 4.3 4.3 2009 ............................................................... .71 .71 .71 .69 4.3 4.3 4.3 4.2 2010 ............................................................... .69 .71 .72 .71 4.1 4.2 4.3 4.3
2011 ............................................................... .71 .72 .71 .69 4.2 4.3 4.2 4.1 2012 ............................................................... .69 .68 .68 .66 4.0 4.0 4.0 3.9 2013 ............................................................... .67 .66 .67 .71 3.9 3.9 3.9 4.1 2014 ............................................................... .70 .71 .72 .74 4.1 4.1 4.1 4.2 2015 ............................................................... .74 .75 .75 .74 4.2 4.2 4.2 4.2 2016 ............................................................... .73 .75 .74 .75 4.2 4.2 4.2 4.2 2017 ............................................................... .76 – – – 4.2 – – –
Supplemental pay 2006 ............................................................... – – – .31 – – – 2.0 2007 ............................................................... .28 .29 .30 .30 1.8 1.9 1.9 1.9 2008 ............................................................... .31 .32 .31 .33 2.0 2.0 2.0 2.0 2009 ............................................................... .28 .29 .28 .27 1.7 1.8 1.7 1.6 2010 ............................................................... .26 .26 .27 .24 1.6 1.6 1.6 1.5
2011 ............................................................... .25 .25 .25 .23 1.5 1.5 1.5 1.4 2012 ............................................................... .23 .23 .25 .21 1.3 1.4 1.4 1.3 2013 ............................................................... .21 .21 .21 .22 1.3 1.2 1.2 1.3 2014 ............................................................... .23 .23 .23 .26 1.3 1.3 1.3 1.5 2015 ............................................................... .27 .26 .27 .27 1.5 1.5 1.5 1.5 2016 ............................................................... .27 .26 .26 .27 1.5 1.5 1.5 1.5
See footnotes at end of table.
-161-
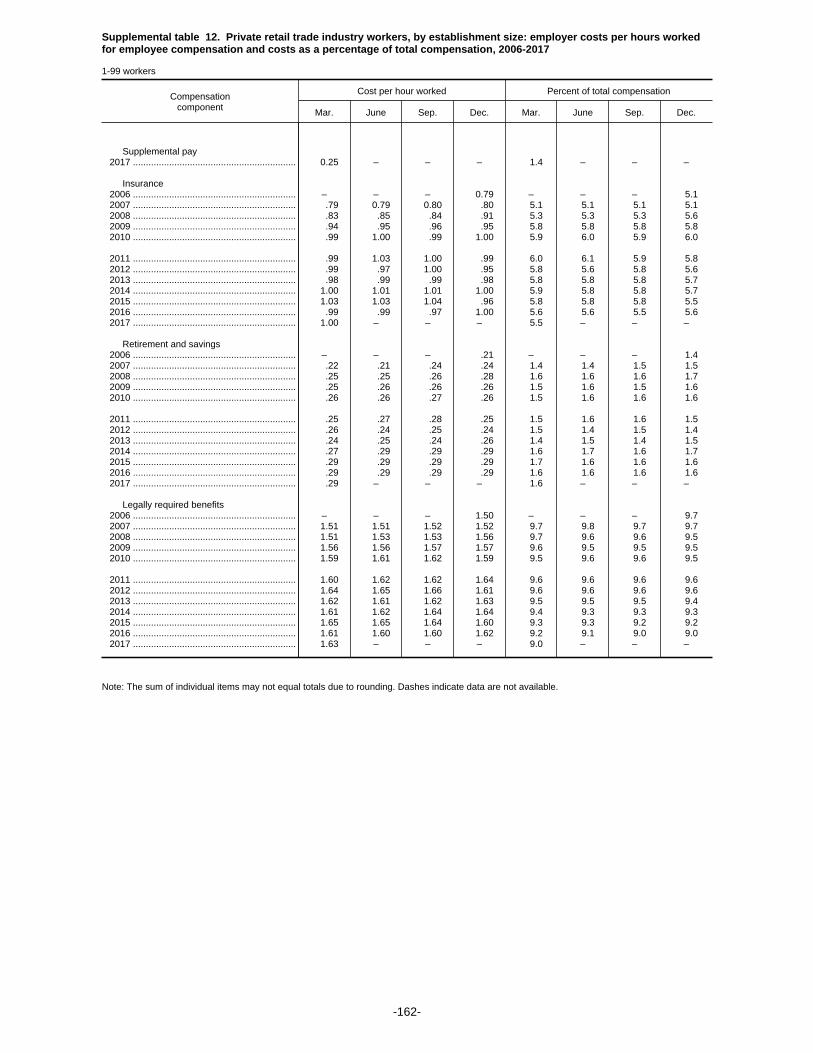
Supplemental table 12. Private retail trade industry workers, by establishment size: employer costs per hours workedfor employee compensation and costs as a percentage of total compensation, 2006-2017
1-99 workers
Compensationcomponent
Cost per hour worked Percent of total compensation
Mar. June Sep. Dec. Mar. June Sep. Dec.
Supplemental pay 2017 ............................................................... 0.25 – – – 1.4 – – –
Insurance 2006 ............................................................... – – – 0.79 – – – 5.1 2007 ............................................................... .79 0.79 0.80 .80 5.1 5.1 5.1 5.1 2008 ............................................................... .83 .85 .84 .91 5.3 5.3 5.3 5.6 2009 ............................................................... .94 .95 .96 .95 5.8 5.8 5.8 5.8 2010 ............................................................... .99 1.00 .99 1.00 5.9 6.0 5.9 6.0
2011 ............................................................... .99 1.03 1.00 .99 6.0 6.1 5.9 5.8 2012 ............................................................... .99 .97 1.00 .95 5.8 5.6 5.8 5.6 2013 ............................................................... .98 .99 .99 .98 5.8 5.8 5.8 5.7 2014 ............................................................... 1.00 1.01 1.01 1.00 5.9 5.8 5.8 5.7 2015 ............................................................... 1.03 1.03 1.04 .96 5.8 5.8 5.8 5.5 2016 ............................................................... .99 .99 .97 1.00 5.6 5.6 5.5 5.6 2017 ............................................................... 1.00 – – – 5.5 – – –
Retirement and savings 2006 ............................................................... – – – .21 – – – 1.4 2007 ............................................................... .22 .21 .24 .24 1.4 1.4 1.5 1.5 2008 ............................................................... .25 .25 .26 .28 1.6 1.6 1.6 1.7 2009 ............................................................... .25 .26 .26 .26 1.5 1.6 1.5 1.6 2010 ............................................................... .26 .26 .27 .26 1.5 1.6 1.6 1.6
2011 ............................................................... .25 .27 .28 .25 1.5 1.6 1.6 1.5 2012 ............................................................... .26 .24 .25 .24 1.5 1.4 1.5 1.4 2013 ............................................................... .24 .25 .24 .26 1.4 1.5 1.4 1.5 2014 ............................................................... .27 .29 .29 .29 1.6 1.7 1.6 1.7 2015 ............................................................... .29 .29 .29 .29 1.7 1.6 1.6 1.6 2016 ............................................................... .29 .29 .29 .29 1.6 1.6 1.6 1.6 2017 ............................................................... .29 – – – 1.6 – – –
Legally required benefits 2006 ............................................................... – – – 1.50 – – – 9.7 2007 ............................................................... 1.51 1.51 1.52 1.52 9.7 9.8 9.7 9.7 2008 ............................................................... 1.51 1.53 1.53 1.56 9.7 9.6 9.6 9.5 2009 ............................................................... 1.56 1.56 1.57 1.57 9.6 9.5 9.5 9.5 2010 ............................................................... 1.59 1.61 1.62 1.59 9.5 9.6 9.6 9.5
2011 ............................................................... 1.60 1.62 1.62 1.64 9.6 9.6 9.6 9.6 2012 ............................................................... 1.64 1.65 1.66 1.61 9.6 9.6 9.6 9.6 2013 ............................................................... 1.62 1.61 1.62 1.63 9.5 9.5 9.5 9.4 2014 ............................................................... 1.61 1.62 1.64 1.64 9.4 9.3 9.3 9.3 2015 ............................................................... 1.65 1.65 1.64 1.60 9.3 9.3 9.2 9.2 2016 ............................................................... 1.61 1.60 1.60 1.62 9.2 9.1 9.0 9.0 2017 ............................................................... 1.63 – – – 9.0 – – –
Note: The sum of individual items may not equal totals due to rounding. Dashes indicate data are not available.
-162-

Supplemental table 12. Private retail trade industry workers, by establishment size: employer costs per hours workedfor employee compensation and costs as a percentage of total compensation, 2006-2017 -- Continued
1-49 workers
Compensationcomponent
Cost per hour worked Percent of total compensation
Mar. June Sep. Dec. Mar. June Sep. Dec.
Total compensation 2006 ............................................................... – – – $14.83 – – – 100.0 2007 ............................................................... 14.74 14.92 15.03 15.15 100.0 100.0 100.0 100.0 2008 ............................................................... 15.12 15.32 15.40 15.82 100.0 100.0 100.0 100.0 2009 ............................................................... 15.71 15.83 15.88 15.98 100.0 100.0 100.0 100.0 2010 ............................................................... 16.01 16.07 16.29 15.93 100.0 100.0 100.0 100.0
2011 ............................................................... 15.97 16.07 16.14 16.64 100.0 100.0 100.0 100.0 2012 ............................................................... 16.64 16.66 16.67 16.61 100.0 100.0 100.0 100.0 2013 ............................................................... 16.67 16.66 16.65 16.98 100.0 100.0 100.0 100.0 2014 ............................................................... 16.74 16.93 17.11 17.06 100.0 100.0 100.0 100.0 2015 ............................................................... 17.12 17.28 17.45 17.04 100.0 100.0 100.0 100.0 2016 ............................................................... 17.03 17.18 17.26 17.53 100.0 100.0 100.0 100.0 2017 ............................................................... 17.70 – – – 100.0 – – –
Wages and salaries 2006 ............................................................... – – – 11.61 – – – 78.3 2007 ............................................................... 11.56 11.70 11.77 11.87 78.5 78.4 78.3 78.3 2008 ............................................................... 11.82 11.98 12.06 12.28 78.2 78.2 78.3 77.6 2009 ............................................................... 12.23 12.32 12.38 12.50 77.8 77.8 78.0 78.2 2010 ............................................................... 12.51 12.50 12.69 12.46 78.1 77.8 77.9 78.2
2011 ............................................................... 12.48 12.51 12.62 13.06 78.2 77.9 78.2 78.5 2012 ............................................................... 13.10 13.12 13.11 13.16 78.7 78.8 78.6 79.2 2013 ............................................................... 13.19 13.20 13.18 13.43 79.1 79.2 79.2 79.1 2014 ............................................................... 13.22 13.37 13.54 13.43 79.0 79.0 79.2 78.7 2015 ............................................................... 13.47 13.63 13.77 13.42 78.7 78.9 78.9 78.8 2016 ............................................................... 13.40 13.55 13.63 13.82 78.7 78.8 79.0 78.8 2017 ............................................................... 13.96 – – – 78.9 – – –
Total benefits 2006 ............................................................... – – – 3.22 – – – 21.7 2007 ............................................................... 3.17 3.22 3.26 3.28 21.5 21.6 21.7 21.7 2008 ............................................................... 3.30 3.34 3.34 3.54 21.8 21.8 21.7 22.4 2009 ............................................................... 3.48 3.51 3.49 3.48 22.2 22.2 22.0 21.8 2010 ............................................................... 3.50 3.57 3.60 3.47 21.9 22.2 22.1 21.8
2011 ............................................................... 3.49 3.55 3.52 3.58 21.8 22.1 21.8 21.5 2012 ............................................................... 3.55 3.54 3.56 3.45 21.3 21.2 21.4 20.8 2013 ............................................................... 3.49 3.46 3.46 3.56 20.9 20.8 20.8 20.9 2014 ............................................................... 3.52 3.56 3.56 3.63 21.0 21.0 20.8 21.3 2015 ............................................................... 3.65 3.65 3.68 3.62 21.3 21.1 21.1 21.2 2016 ............................................................... 3.63 3.64 3.63 3.71 21.3 21.2 21.0 21.2 2017 ............................................................... 3.73 – – – 21.1 – – –
Paid leave 2006 ............................................................... – – – .59 – – – 4.0 2007 ............................................................... .59 .60 .60 .61 4.0 4.0 4.0 4.0 2008 ............................................................... .59 .61 .61 .65 3.9 4.0 3.9 4.1 2009 ............................................................... .64 .64 .65 .63 4.1 4.1 4.1 3.9 2010 ............................................................... .62 .65 .66 .64 3.9 4.0 4.1 4.0
2011 ............................................................... .64 .65 .63 .65 4.0 4.1 3.9 3.9 2012 ............................................................... .65 .63 .63 .62 3.9 3.8 3.8 3.8 2013 ............................................................... .63 .62 .62 .67 3.8 3.7 3.7 3.9 2014 ............................................................... .65 .66 .66 .69 3.9 3.9 3.9 4.0 2015 ............................................................... .69 .69 .71 .71 4.0 4.0 4.0 4.2 2016 ............................................................... .70 .70 .71 .73 4.1 4.1 4.1 4.2 2017 ............................................................... .74 – – – 4.2 – – –
Supplemental pay 2006 ............................................................... – – – .31 – – – 2.1 2007 ............................................................... .27 .29 .30 .30 1.8 1.9 2.0 2.0 2008 ............................................................... .31 .31 .31 .33 2.1 2.1 2.0 2.1 2009 ............................................................... .29 .29 .28 .26 1.8 1.8 1.7 1.6 2010 ............................................................... .25 .25 .25 .22 1.6 1.5 1.6 1.4
2011 ............................................................... .22 .22 .23 .22 1.4 1.4 1.4 1.3 2012 ............................................................... .22 .23 .23 .22 1.3 1.4 1.4 1.3 2013 ............................................................... .21 .21 .21 .21 1.3 1.2 1.2 1.3 2014 ............................................................... .21 .21 .22 .26 1.3 1.3 1.3 1.5 2015 ............................................................... .26 .26 .27 .26 1.5 1.5 1.5 1.5 2016 ............................................................... .26 .27 .27 .27 1.5 1.5 1.5 1.5
See footnotes at end of table.
-163-

Supplemental table 12. Private retail trade industry workers, by establishment size: employer costs per hours workedfor employee compensation and costs as a percentage of total compensation, 2006-2017 -- Continued
1-49 workers
Compensationcomponent
Cost per hour worked Percent of total compensation
Mar. June Sep. Dec. Mar. June Sep. Dec.
Supplemental pay 2017 ............................................................... 0.25 – – – 1.4 – – –
Insurance 2006 ............................................................... – – – 0.69 – – – 4.6 2007 ............................................................... .68 0.68 0.70 .71 4.6 4.6 4.6 4.7 2008 ............................................................... .73 .74 .72 .81 4.8 4.8 4.7 5.1 2009 ............................................................... .83 .85 .84 .85 5.3 5.4 5.3 5.3 2010 ............................................................... .87 .90 .88 .86 5.5 5.6 5.4 5.4
2011 ............................................................... .86 .89 .87 .88 5.4 5.5 5.4 5.3 2012 ............................................................... .87 .86 .88 .84 5.2 5.2 5.3 5.1 2013 ............................................................... .87 .86 .87 .87 5.2 5.2 5.2 5.1 2014 ............................................................... .88 .87 .86 .86 5.2 5.2 5.0 5.0 2015 ............................................................... .87 .88 .88 .84 5.1 5.1 5.1 4.9 2016 ............................................................... .86 .86 .86 .88 5.1 5.0 5.0 5.0 2017 ............................................................... .89 – – – 5.0 – – –
Retirement and savings 2006 ............................................................... – – – .17 – – – 1.1 2007 ............................................................... .17 .18 .18 .18 1.2 1.2 1.2 1.2 2008 ............................................................... .19 .19 .19 .22 1.3 1.2 1.3 1.4 2009 ............................................................... .20 .20 .21 .21 1.3 1.3 1.3 1.3 2010 ............................................................... .21 .22 .22 .21 1.3 1.4 1.4 1.3
2011 ............................................................... .21 .22 .23 .21 1.3 1.4 1.4 1.2 2012 ............................................................... .20 .19 .20 .18 1.2 1.1 1.2 1.1 2013 ............................................................... .19 .18 .18 .20 1.1 1.1 1.1 1.2 2014 ............................................................... .19 .21 .21 .23 1.1 1.2 1.2 1.3 2015 ............................................................... .23 .21 .22 .23 1.3 1.2 1.3 1.3 2016 ............................................................... .23 .23 .23 .24 1.4 1.3 1.3 1.4 2017 ............................................................... .24 – – – 1.4 – – –
Legally required benefits 2006 ............................................................... – – – 1.47 – – – 9.9 2007 ............................................................... 1.45 1.48 1.49 1.49 9.9 9.9 9.9 9.8 2008 ............................................................... 1.48 1.49 1.50 1.53 9.8 9.7 9.7 9.7 2009 ............................................................... 1.53 1.53 1.52 1.53 9.7 9.7 9.6 9.6 2010 ............................................................... 1.54 1.56 1.58 1.54 9.6 9.7 9.7 9.7
2011 ............................................................... 1.55 1.57 1.57 1.61 9.7 9.8 9.7 9.7 2012 ............................................................... 1.61 1.62 1.62 1.59 9.7 9.8 9.7 9.6 2013 ............................................................... 1.60 1.59 1.59 1.60 9.6 9.6 9.6 9.4 2014 ............................................................... 1.59 1.60 1.60 1.60 9.5 9.4 9.4 9.4 2015 ............................................................... 1.60 1.61 1.60 1.58 9.4 9.3 9.2 9.3 2016 ............................................................... 1.57 1.57 1.57 1.60 9.2 9.2 9.1 9.1 2017 ............................................................... 1.61 – – – 9.1 – – –
Note: The sum of individual items may not equal totals due to rounding. Dashes indicate data are not available.
-164-
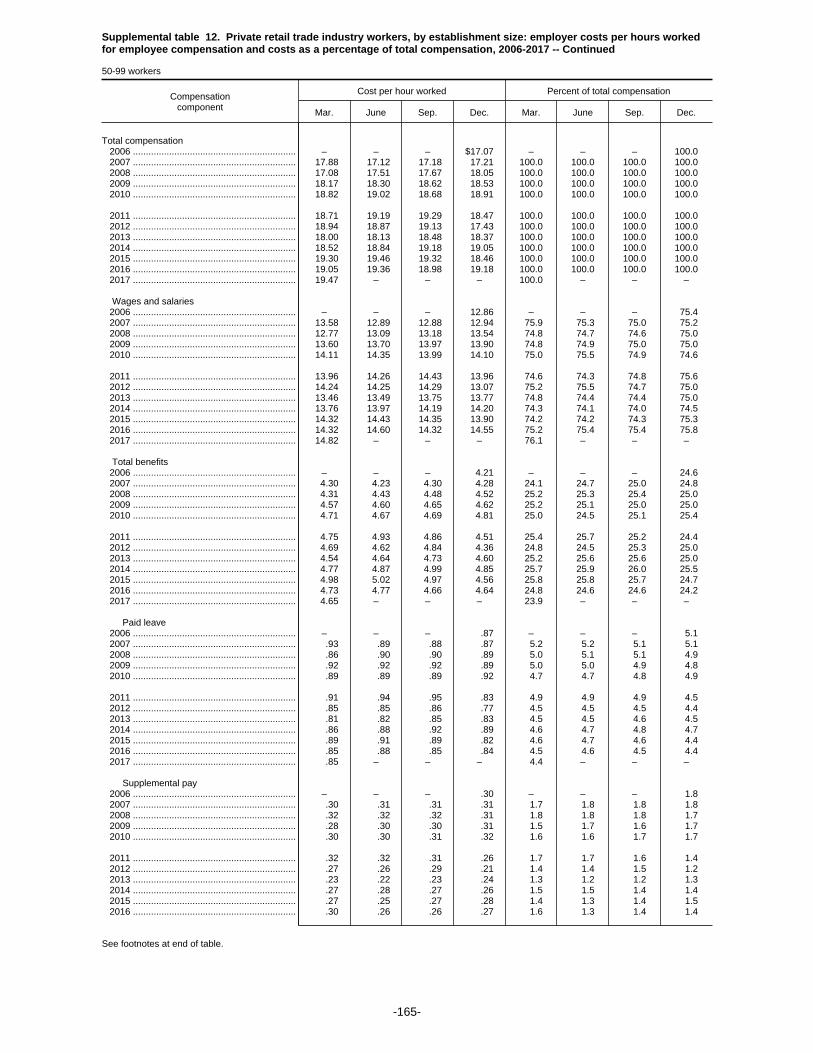
Supplemental table 12. Private retail trade industry workers, by establishment size: employer costs per hours workedfor employee compensation and costs as a percentage of total compensation, 2006-2017 -- Continued
50-99 workers
Compensationcomponent
Cost per hour worked Percent of total compensation
Mar. June Sep. Dec. Mar. June Sep. Dec.
Total compensation 2006 ............................................................... – – – $17.07 – – – 100.0 2007 ............................................................... 17.88 17.12 17.18 17.21 100.0 100.0 100.0 100.0 2008 ............................................................... 17.08 17.51 17.67 18.05 100.0 100.0 100.0 100.0 2009 ............................................................... 18.17 18.30 18.62 18.53 100.0 100.0 100.0 100.0 2010 ............................................................... 18.82 19.02 18.68 18.91 100.0 100.0 100.0 100.0
2011 ............................................................... 18.71 19.19 19.29 18.47 100.0 100.0 100.0 100.0 2012 ............................................................... 18.94 18.87 19.13 17.43 100.0 100.0 100.0 100.0 2013 ............................................................... 18.00 18.13 18.48 18.37 100.0 100.0 100.0 100.0 2014 ............................................................... 18.52 18.84 19.18 19.05 100.0 100.0 100.0 100.0 2015 ............................................................... 19.30 19.46 19.32 18.46 100.0 100.0 100.0 100.0 2016 ............................................................... 19.05 19.36 18.98 19.18 100.0 100.0 100.0 100.0 2017 ............................................................... 19.47 – – – 100.0 – – –
Wages and salaries 2006 ............................................................... – – – 12.86 – – – 75.4 2007 ............................................................... 13.58 12.89 12.88 12.94 75.9 75.3 75.0 75.2 2008 ............................................................... 12.77 13.09 13.18 13.54 74.8 74.7 74.6 75.0 2009 ............................................................... 13.60 13.70 13.97 13.90 74.8 74.9 75.0 75.0 2010 ............................................................... 14.11 14.35 13.99 14.10 75.0 75.5 74.9 74.6
2011 ............................................................... 13.96 14.26 14.43 13.96 74.6 74.3 74.8 75.6 2012 ............................................................... 14.24 14.25 14.29 13.07 75.2 75.5 74.7 75.0 2013 ............................................................... 13.46 13.49 13.75 13.77 74.8 74.4 74.4 75.0 2014 ............................................................... 13.76 13.97 14.19 14.20 74.3 74.1 74.0 74.5 2015 ............................................................... 14.32 14.43 14.35 13.90 74.2 74.2 74.3 75.3 2016 ............................................................... 14.32 14.60 14.32 14.55 75.2 75.4 75.4 75.8 2017 ............................................................... 14.82 – – – 76.1 – – –
Total benefits 2006 ............................................................... – – – 4.21 – – – 24.6 2007 ............................................................... 4.30 4.23 4.30 4.28 24.1 24.7 25.0 24.8 2008 ............................................................... 4.31 4.43 4.48 4.52 25.2 25.3 25.4 25.0 2009 ............................................................... 4.57 4.60 4.65 4.62 25.2 25.1 25.0 25.0 2010 ............................................................... 4.71 4.67 4.69 4.81 25.0 24.5 25.1 25.4
2011 ............................................................... 4.75 4.93 4.86 4.51 25.4 25.7 25.2 24.4 2012 ............................................................... 4.69 4.62 4.84 4.36 24.8 24.5 25.3 25.0 2013 ............................................................... 4.54 4.64 4.73 4.60 25.2 25.6 25.6 25.0 2014 ............................................................... 4.77 4.87 4.99 4.85 25.7 25.9 26.0 25.5 2015 ............................................................... 4.98 5.02 4.97 4.56 25.8 25.8 25.7 24.7 2016 ............................................................... 4.73 4.77 4.66 4.64 24.8 24.6 24.6 24.2 2017 ............................................................... 4.65 – – – 23.9 – – –
Paid leave 2006 ............................................................... – – – .87 – – – 5.1 2007 ............................................................... .93 .89 .88 .87 5.2 5.2 5.1 5.1 2008 ............................................................... .86 .90 .90 .89 5.0 5.1 5.1 4.9 2009 ............................................................... .92 .92 .92 .89 5.0 5.0 4.9 4.8 2010 ............................................................... .89 .89 .89 .92 4.7 4.7 4.8 4.9
2011 ............................................................... .91 .94 .95 .83 4.9 4.9 4.9 4.5 2012 ............................................................... .85 .85 .86 .77 4.5 4.5 4.5 4.4 2013 ............................................................... .81 .82 .85 .83 4.5 4.5 4.6 4.5 2014 ............................................................... .86 .88 .92 .89 4.6 4.7 4.8 4.7 2015 ............................................................... .89 .91 .89 .82 4.6 4.7 4.6 4.4 2016 ............................................................... .85 .88 .85 .84 4.5 4.6 4.5 4.4 2017 ............................................................... .85 – – – 4.4 – – –
Supplemental pay 2006 ............................................................... – – – .30 – – – 1.8 2007 ............................................................... .30 .31 .31 .31 1.7 1.8 1.8 1.8 2008 ............................................................... .32 .32 .32 .31 1.8 1.8 1.8 1.7 2009 ............................................................... .28 .30 .30 .31 1.5 1.7 1.6 1.7 2010 ............................................................... .30 .30 .31 .32 1.6 1.6 1.7 1.7
2011 ............................................................... .32 .32 .31 .26 1.7 1.7 1.6 1.4 2012 ............................................................... .27 .26 .29 .21 1.4 1.4 1.5 1.2 2013 ............................................................... .23 .22 .23 .24 1.3 1.2 1.2 1.3 2014 ............................................................... .27 .28 .27 .26 1.5 1.5 1.4 1.4 2015 ............................................................... .27 .25 .27 .28 1.4 1.3 1.4 1.5 2016 ............................................................... .30 .26 .26 .27 1.6 1.3 1.4 1.4
See footnotes at end of table.
-165-

Supplemental table 12. Private retail trade industry workers, by establishment size: employer costs per hours workedfor employee compensation and costs as a percentage of total compensation, 2006-2017 -- Continued
50-99 workers
Compensationcomponent
Cost per hour worked Percent of total compensation
Mar. June Sep. Dec. Mar. June Sep. Dec.
Supplemental pay 2017 ............................................................... 0.27 – – – 1.4 – – –
Insurance 2006 ............................................................... – – – 1.09 – – – 6.4 2007 ............................................................... 1.08 1.09 1.10 1.09 6.1 6.4 6.4 6.3 2008 ............................................................... 1.12 1.16 1.19 1.22 6.6 6.6 6.7 6.8 2009 ............................................................... 1.30 1.28 1.32 1.29 7.1 7.0 7.1 7.0 2010 ............................................................... 1.36 1.32 1.32 1.41 7.2 7.0 7.1 7.5
2011 ............................................................... 1.40 1.47 1.40 1.32 7.5 7.6 7.2 7.2 2012 ............................................................... 1.40 1.35 1.47 1.30 7.4 7.1 7.7 7.5 2013 ............................................................... 1.38 1.41 1.45 1.36 7.7 7.8 7.8 7.4 2014 ............................................................... 1.42 1.45 1.51 1.45 7.7 7.7 7.9 7.6 2015 ............................................................... 1.53 1.55 1.52 1.32 7.9 7.9 7.9 7.2 2016 ............................................................... 1.40 1.43 1.38 1.38 7.3 7.4 7.3 7.2 2017 ............................................................... 1.37 – – – 7.0 – – –
Retirement and savings 2006 ............................................................... – – – .34 – – – 2.0 2007 ............................................................... .33 .32 .41 .40 1.9 1.9 2.4 2.3 2008 ............................................................... .41 .43 .45 .44 2.4 2.5 2.6 2.5 2009 ............................................................... .42 .43 .41 .43 2.3 2.3 2.2 2.3 2010 ............................................................... .42 .41 .42 .42 2.2 2.1 2.3 2.2
2011 ............................................................... .38 .43 .42 .39 2.0 2.2 2.2 2.1 2012 ............................................................... .44 .43 .44 .43 2.3 2.3 2.3 2.5 2013 ............................................................... .44 .49 .48 .46 2.4 2.7 2.6 2.5 2014 ............................................................... .52 .55 .54 .48 2.8 2.9 2.8 2.5 2015 ............................................................... .49 .52 .53 .47 2.5 2.7 2.7 2.5 2016 ............................................................... .48 .49 .49 .46 2.5 2.5 2.6 2.4 2017 ............................................................... .46 – – – 2.4 – – –
Legally required benefits 2006 ............................................................... – – – 1.60 – – – 9.4 2007 ............................................................... 1.66 1.61 1.60 1.61 9.3 9.4 9.3 9.3 2008 ............................................................... 1.60 1.62 1.62 1.65 9.4 9.2 9.2 9.1 2009 ............................................................... 1.66 1.67 1.70 1.72 9.2 9.1 9.1 9.3 2010 ............................................................... 1.74 1.75 1.75 1.74 9.3 9.2 9.4 9.2
2011 ............................................................... 1.74 1.78 1.78 1.70 9.3 9.3 9.2 9.2 2012 ............................................................... 1.74 1.73 1.77 1.65 9.2 9.2 9.3 9.5 2013 ............................................................... 1.69 1.69 1.72 1.71 9.4 9.3 9.3 9.3 2014 ............................................................... 1.69 1.71 1.76 1.77 9.1 9.1 9.2 9.3 2015 ............................................................... 1.79 1.79 1.78 1.67 9.3 9.2 9.2 9.1 2016 ............................................................... 1.71 1.70 1.68 1.69 9.0 8.8 8.8 8.8 2017 ............................................................... 1.70 – – – 8.7 – – –
Note: The sum of individual items may not equal totals due to rounding. Dashes indicate data are not available.
-166-
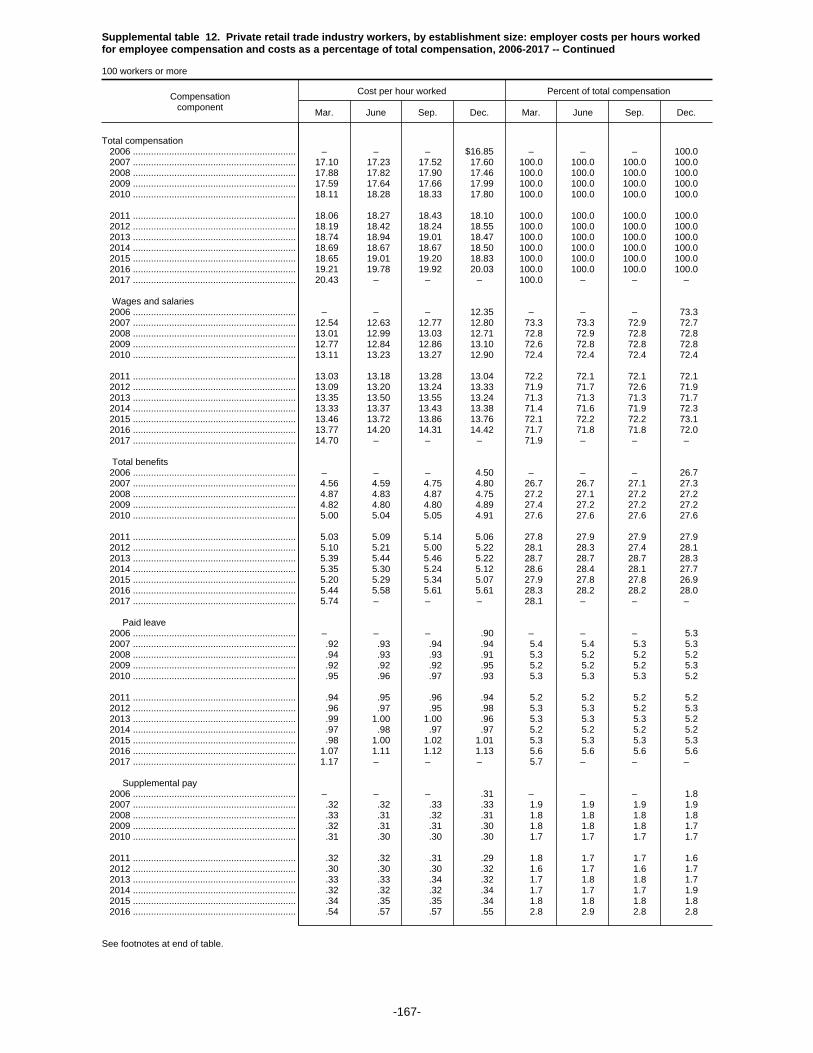
Supplemental table 12. Private retail trade industry workers, by establishment size: employer costs per hours workedfor employee compensation and costs as a percentage of total compensation, 2006-2017 -- Continued
100 workers or more
Compensationcomponent
Cost per hour worked Percent of total compensation
Mar. June Sep. Dec. Mar. June Sep. Dec.
Total compensation 2006 ............................................................... – – – $16.85 – – – 100.0 2007 ............................................................... 17.10 17.23 17.52 17.60 100.0 100.0 100.0 100.0 2008 ............................................................... 17.88 17.82 17.90 17.46 100.0 100.0 100.0 100.0 2009 ............................................................... 17.59 17.64 17.66 17.99 100.0 100.0 100.0 100.0 2010 ............................................................... 18.11 18.28 18.33 17.80 100.0 100.0 100.0 100.0
2011 ............................................................... 18.06 18.27 18.43 18.10 100.0 100.0 100.0 100.0 2012 ............................................................... 18.19 18.42 18.24 18.55 100.0 100.0 100.0 100.0 2013 ............................................................... 18.74 18.94 19.01 18.47 100.0 100.0 100.0 100.0 2014 ............................................................... 18.69 18.67 18.67 18.50 100.0 100.0 100.0 100.0 2015 ............................................................... 18.65 19.01 19.20 18.83 100.0 100.0 100.0 100.0 2016 ............................................................... 19.21 19.78 19.92 20.03 100.0 100.0 100.0 100.0 2017 ............................................................... 20.43 – – – 100.0 – – –
Wages and salaries 2006 ............................................................... – – – 12.35 – – – 73.3 2007 ............................................................... 12.54 12.63 12.77 12.80 73.3 73.3 72.9 72.7 2008 ............................................................... 13.01 12.99 13.03 12.71 72.8 72.9 72.8 72.8 2009 ............................................................... 12.77 12.84 12.86 13.10 72.6 72.8 72.8 72.8 2010 ............................................................... 13.11 13.23 13.27 12.90 72.4 72.4 72.4 72.4
2011 ............................................................... 13.03 13.18 13.28 13.04 72.2 72.1 72.1 72.1 2012 ............................................................... 13.09 13.20 13.24 13.33 71.9 71.7 72.6 71.9 2013 ............................................................... 13.35 13.50 13.55 13.24 71.3 71.3 71.3 71.7 2014 ............................................................... 13.33 13.37 13.43 13.38 71.4 71.6 71.9 72.3 2015 ............................................................... 13.46 13.72 13.86 13.76 72.1 72.2 72.2 73.1 2016 ............................................................... 13.77 14.20 14.31 14.42 71.7 71.8 71.8 72.0 2017 ............................................................... 14.70 – – – 71.9 – – –
Total benefits 2006 ............................................................... – – – 4.50 – – – 26.7 2007 ............................................................... 4.56 4.59 4.75 4.80 26.7 26.7 27.1 27.3 2008 ............................................................... 4.87 4.83 4.87 4.75 27.2 27.1 27.2 27.2 2009 ............................................................... 4.82 4.80 4.80 4.89 27.4 27.2 27.2 27.2 2010 ............................................................... 5.00 5.04 5.05 4.91 27.6 27.6 27.6 27.6
2011 ............................................................... 5.03 5.09 5.14 5.06 27.8 27.9 27.9 27.9 2012 ............................................................... 5.10 5.21 5.00 5.22 28.1 28.3 27.4 28.1 2013 ............................................................... 5.39 5.44 5.46 5.22 28.7 28.7 28.7 28.3 2014 ............................................................... 5.35 5.30 5.24 5.12 28.6 28.4 28.1 27.7 2015 ............................................................... 5.20 5.29 5.34 5.07 27.9 27.8 27.8 26.9 2016 ............................................................... 5.44 5.58 5.61 5.61 28.3 28.2 28.2 28.0 2017 ............................................................... 5.74 – – – 28.1 – – –
Paid leave 2006 ............................................................... – – – .90 – – – 5.3 2007 ............................................................... .92 .93 .94 .94 5.4 5.4 5.3 5.3 2008 ............................................................... .94 .93 .93 .91 5.3 5.2 5.2 5.2 2009 ............................................................... .92 .92 .92 .95 5.2 5.2 5.2 5.3 2010 ............................................................... .95 .96 .97 .93 5.3 5.3 5.3 5.2
2011 ............................................................... .94 .95 .96 .94 5.2 5.2 5.2 5.2 2012 ............................................................... .96 .97 .95 .98 5.3 5.3 5.2 5.3 2013 ............................................................... .99 1.00 1.00 .96 5.3 5.3 5.3 5.2 2014 ............................................................... .97 .98 .97 .97 5.2 5.2 5.2 5.2 2015 ............................................................... .98 1.00 1.02 1.01 5.3 5.3 5.3 5.3 2016 ............................................................... 1.07 1.11 1.12 1.13 5.6 5.6 5.6 5.6 2017 ............................................................... 1.17 – – – 5.7 – – –
Supplemental pay 2006 ............................................................... – – – .31 – – – 1.8 2007 ............................................................... .32 .32 .33 .33 1.9 1.9 1.9 1.9 2008 ............................................................... .33 .31 .32 .31 1.8 1.8 1.8 1.8 2009 ............................................................... .32 .31 .31 .30 1.8 1.8 1.8 1.7 2010 ............................................................... .31 .30 .30 .30 1.7 1.7 1.7 1.7
2011 ............................................................... .32 .32 .31 .29 1.8 1.7 1.7 1.6 2012 ............................................................... .30 .30 .30 .32 1.6 1.7 1.6 1.7 2013 ............................................................... .33 .33 .34 .32 1.7 1.8 1.8 1.7 2014 ............................................................... .32 .32 .32 .34 1.7 1.7 1.7 1.9 2015 ............................................................... .34 .35 .35 .34 1.8 1.8 1.8 1.8 2016 ............................................................... .54 .57 .57 .55 2.8 2.9 2.8 2.8
See footnotes at end of table.
-167-

Supplemental table 12. Private retail trade industry workers, by establishment size: employer costs per hours workedfor employee compensation and costs as a percentage of total compensation, 2006-2017 -- Continued
100 workers or more
Compensationcomponent
Cost per hour worked Percent of total compensation
Mar. June Sep. Dec. Mar. June Sep. Dec.
Supplemental pay 2017 ............................................................... 0.58 – – – 2.8 – – –
Insurance 2006 ............................................................... – – – 1.35 – – – 8.0 2007 ............................................................... 1.36 1.38 1.41 1.42 7.9 8.0 8.0 8.1 2008 ............................................................... 1.47 1.47 1.48 1.47 8.2 8.3 8.3 8.4 2009 ............................................................... 1.51 1.50 1.51 1.59 8.6 8.5 8.6 8.8 2010 ............................................................... 1.66 1.67 1.68 1.65 9.2 9.1 9.2 9.3
2011 ............................................................... 1.70 1.72 1.76 1.73 9.4 9.4 9.5 9.6 2012 ............................................................... 1.73 1.77 1.60 1.70 9.5 9.6 8.8 9.2 2013 ............................................................... 1.85 1.84 1.86 1.72 9.9 9.7 9.8 9.3 2014 ............................................................... 1.84 1.80 1.79 1.68 9.9 9.7 9.6 9.1 2015 ............................................................... 1.72 1.76 1.77 1.58 9.2 9.3 9.2 8.4 2016 ............................................................... 1.68 1.70 1.71 1.69 8.7 8.6 8.6 8.4 2017 ............................................................... 1.71 – – – 8.4 – – –
Retirement and savings 2006 ............................................................... – – – .41 – – – 2.4 2007 ............................................................... .41 .40 .50 .53 2.4 2.3 2.8 3.0 2008 ............................................................... .53 .53 .54 .50 3.0 3.0 3.0 2.8 2009 ............................................................... .50 .50 .49 .47 2.8 2.8 2.8 2.6 2010 ............................................................... .49 .50 .50 .47 2.7 2.7 2.7 2.6
2011 ............................................................... .48 .48 .49 .51 2.7 2.6 2.7 2.8 2012 ............................................................... .51 .53 .52 .57 2.8 2.9 2.9 3.1 2013 ............................................................... .57 .61 .63 .61 3.0 3.2 3.3 3.3 2014 ............................................................... .60 .59 .55 .54 3.2 3.2 3.0 2.9 2015 ............................................................... .55 .57 .59 .54 3.0 3.0 3.1 2.8 2016 ............................................................... .53 .56 .57 .58 2.8 2.8 2.8 2.9 2017 ............................................................... .60 – – – 2.9 – – –
Legally required benefits 2006 ............................................................... – – – 1.54 – – – 9.2 2007 ............................................................... 1.57 1.57 1.58 1.58 9.2 9.1 9.0 9.0 2008 ............................................................... 1.59 1.58 1.59 1.56 8.9 8.9 8.9 8.9 2009 ............................................................... 1.57 1.57 1.57 1.58 8.9 8.9 8.9 8.8 2010 ............................................................... 1.59 1.60 1.60 1.57 8.8 8.8 8.7 8.8
2011 ............................................................... 1.59 1.62 1.62 1.59 8.8 8.8 8.8 8.8 2012 ............................................................... 1.60 1.63 1.63 1.65 8.8 8.9 8.9 8.9 2013 ............................................................... 1.65 1.65 1.64 1.61 8.8 8.7 8.7 8.7 2014 ............................................................... 1.62 1.61 1.61 1.59 8.6 8.6 8.6 8.6 2015 ............................................................... 1.60 1.61 1.62 1.61 8.6 8.5 8.4 8.6 2016 ............................................................... 1.62 1.65 1.65 1.66 8.4 8.3 8.3 8.3 2017 ............................................................... 1.69 – – – 8.3 – – –
Note: The sum of individual items may not equal totals due to rounding. Dashes indicate data are not available.
-168-

Supplemental table 12. Private retail trade industry workers, by establishment size: employer costs per hours workedfor employee compensation and costs as a percentage of total compensation, 2006-2017 -- Continued
100-499 workers
Compensationcomponent
Cost per hour worked Percent of total compensation
Mar. June Sep. Dec. Mar. June Sep. Dec.
Total compensation 2006 ............................................................... – – – $16.75 – – – 100.0 2007 ............................................................... 16.97 17.07 17.41 17.48 100.0 100.0 100.0 100.0 2008 ............................................................... 17.76 17.66 17.70 17.26 100.0 100.0 100.0 100.0 2009 ............................................................... 17.35 17.44 17.45 17.78 100.0 100.0 100.0 100.0 2010 ............................................................... 17.87 18.06 18.12 17.57 100.0 100.0 100.0 100.0
2011 ............................................................... 17.81 18.00 18.20 17.92 100.0 100.0 100.0 100.0 2012 ............................................................... 18.00 18.24 18.02 18.15 100.0 100.0 100.0 100.0 2013 ............................................................... 18.30 18.46 18.56 18.10 100.0 100.0 100.0 100.0 2014 ............................................................... 18.27 18.25 18.18 17.99 100.0 100.0 100.0 100.0 2015 ............................................................... 18.08 18.53 18.76 18.34 100.0 100.0 100.0 100.0 2016 ............................................................... 18.71 19.29 19.44 19.51 100.0 100.0 100.0 100.0 2017 ............................................................... 19.83 – – – 100.0 – – –
Wages and salaries 2006 ............................................................... – – – 12.28 – – – 73.3 2007 ............................................................... 12.45 12.52 12.67 12.70 73.4 73.4 72.8 72.7 2008 ............................................................... 12.91 12.87 12.88 12.56 72.7 72.9 72.8 72.8 2009 ............................................................... 12.60 12.69 12.70 12.94 72.6 72.8 72.8 72.8 2010 ............................................................... 12.92 13.06 13.12 12.73 72.3 72.3 72.4 72.4
2011 ............................................................... 12.86 13.00 13.11 12.91 72.2 72.2 72.1 72.1 2012 ............................................................... 12.96 13.08 13.09 13.05 72.0 71.7 72.6 71.9 2013 ............................................................... 13.05 13.17 13.22 12.98 71.3 71.3 71.3 71.7 2014 ............................................................... 13.03 13.07 13.08 12.96 71.3 71.6 71.9 72.1 2015 ............................................................... 13.00 13.33 13.49 13.32 71.9 71.9 71.9 72.6 2016 ............................................................... 13.31 13.75 13.87 13.95 71.2 71.3 71.3 71.5 2017 ............................................................... 14.16 – – – 71.4 – – –
Total benefits 2006 ............................................................... – – – 4.47 – – – 26.7 2007 ............................................................... 4.52 4.55 4.74 4.77 26.6 26.6 27.2 27.3 2008 ............................................................... 4.85 4.79 4.82 4.70 27.3 27.1 27.2 27.2 2009 ............................................................... 4.76 4.75 4.75 4.84 27.4 27.2 27.2 27.2 2010 ............................................................... 4.95 4.99 5.00 4.84 27.7 27.7 27.6 27.6
2011 ............................................................... 4.95 5.00 5.08 5.00 27.8 27.8 27.9 27.9 2012 ............................................................... 5.05 5.16 4.93 5.10 28.0 28.3 27.4 28.1 2013 ............................................................... 5.25 5.30 5.33 5.12 28.7 28.7 28.7 28.3 2014 ............................................................... 5.24 5.19 5.11 5.03 28.7 28.4 28.1 27.9 2015 ............................................................... 5.08 5.20 5.28 5.02 28.1 28.1 28.1 27.4 2016 ............................................................... 5.39 5.54 5.58 5.56 28.8 28.7 28.7 28.5 2017 ............................................................... 5.67 – – – 28.6 – – –
Paid leave 2006 ............................................................... – – – .87 – – – 5.2 2007 ............................................................... .89 .89 .91 .91 5.2 5.2 5.3 5.2 2008 ............................................................... .91 .90 .90 .88 5.1 5.1 5.1 5.1 2009 ............................................................... .88 .89 .89 .92 5.1 5.1 5.1 5.2 2010 ............................................................... .92 .94 .94 .89 5.2 5.2 5.2 5.1
2011 ............................................................... .91 .92 .93 .91 5.1 5.1 5.1 5.1 2012 ............................................................... .93 .95 .92 .93 5.1 5.2 5.1 5.1 2013 ............................................................... .93 .95 .95 .92 5.1 5.1 5.1 5.1 2014 ............................................................... .93 .93 .92 .92 5.1 5.1 5.1 5.1 2015 ............................................................... .93 .95 .98 .97 5.1 5.2 5.2 5.3 2016 ............................................................... 1.03 1.07 1.08 1.09 5.5 5.5 5.6 5.6 2017 ............................................................... 1.12 – – – 5.6 – – –
Supplemental pay 2006 ............................................................... – – – .30 – – – 1.8 2007 ............................................................... .31 .31 .32 .32 1.8 1.8 1.8 1.8 2008 ............................................................... .32 .29 .30 .30 1.8 1.7 1.7 1.7 2009 ............................................................... .30 .30 .30 .28 1.7 1.7 1.7 1.6 2010 ............................................................... .29 .29 .29 .28 1.6 1.6 1.6 1.6
2011 ............................................................... .29 .29 .29 .28 1.6 1.6 1.6 1.5 2012 ............................................................... .28 .29 .28 .30 1.6 1.6 1.6 1.7 2013 ............................................................... .30 .30 .31 .29 1.7 1.6 1.7 1.6 2014 ............................................................... .29 .29 .29 .33 1.6 1.6 1.6 1.8 2015 ............................................................... .33 .33 .34 .35 1.8 1.8 1.8 1.9 2016 ............................................................... .55 .57 .57 .57 2.9 2.9 2.9 2.9
See footnotes at end of table.
-169-

Supplemental table 12. Private retail trade industry workers, by establishment size: employer costs per hours workedfor employee compensation and costs as a percentage of total compensation, 2006-2017 -- Continued
100-499 workers
Compensationcomponent
Cost per hour worked Percent of total compensation
Mar. June Sep. Dec. Mar. June Sep. Dec.
Supplemental pay 2017 ............................................................... 0.59 – – – 3.0 – – –
Insurance 2006 ............................................................... – – – 1.35 – – – 8.1 2007 ............................................................... 1.36 1.38 1.42 1.44 8.0 8.1 8.2 8.2 2008 ............................................................... 1.49 1.49 1.49 1.47 8.4 8.4 8.4 8.5 2009 ............................................................... 1.51 1.50 1.51 1.58 8.7 8.6 8.7 8.9 2010 ............................................................... 1.67 1.68 1.68 1.65 9.3 9.3 9.3 9.4
2011 ............................................................... 1.70 1.71 1.76 1.73 9.5 9.5 9.7 9.7 2012 ............................................................... 1.73 1.78 1.58 1.69 9.6 9.7 8.8 9.3 2013 ............................................................... 1.84 1.83 1.84 1.72 10.0 9.9 9.9 9.5 2014 ............................................................... 1.83 1.79 1.77 1.68 10.0 9.8 9.8 9.4 2015 ............................................................... 1.72 1.76 1.78 1.59 9.5 9.5 9.5 8.7 2016 ............................................................... 1.69 1.71 1.73 1.70 9.1 8.9 8.9 8.7 2017 ............................................................... 1.71 – – – 8.6 – – –
Retirement and savings 2006 ............................................................... – – – .40 – – – 2.4 2007 ............................................................... .40 .40 .50 .53 2.3 2.3 2.9 3.0 2008 ............................................................... .53 .53 .54 .49 3.0 3.0 3.1 2.9 2009 ............................................................... .50 .49 .49 .47 2.9 2.8 2.8 2.7 2010 ............................................................... .49 .50 .50 .46 2.8 2.8 2.8 2.6
2011 ............................................................... .48 .48 .49 .51 2.7 2.7 2.7 2.8 2012 ............................................................... .51 .53 .52 .56 2.8 2.9 2.9 3.1 2013 ............................................................... .56 .60 .63 .61 3.0 3.3 3.4 3.3 2014 ............................................................... .59 .58 .54 .54 3.2 3.2 3.0 3.0 2015 ............................................................... .54 .57 .59 .53 3.0 3.1 3.1 2.9 2016 ............................................................... .53 .56 .57 .58 2.8 2.9 2.9 3.0 2017 ............................................................... .60 – – – 3.0 – – –
Legally required benefits 2006 ............................................................... – – – 1.54 – – – 9.2 2007 ............................................................... 1.56 1.56 1.58 1.58 9.2 9.2 9.1 9.0 2008 ............................................................... 1.59 1.58 1.58 1.56 9.0 8.9 8.9 9.0 2009 ............................................................... 1.56 1.57 1.56 1.57 9.0 9.0 8.9 8.8 2010 ............................................................... 1.57 1.59 1.59 1.55 8.8 8.8 8.8 8.9
2011 ............................................................... 1.57 1.60 1.61 1.58 8.8 8.9 8.8 8.8 2012 ............................................................... 1.59 1.62 1.62 1.62 8.8 8.9 9.0 8.9 2013 ............................................................... 1.62 1.62 1.61 1.59 8.9 8.8 8.7 8.8 2014 ............................................................... 1.59 1.58 1.57 1.56 8.7 8.7 8.7 8.7 2015 ............................................................... 1.56 1.58 1.59 1.59 8.7 8.6 8.5 8.7 2016 ............................................................... 1.59 1.63 1.63 1.63 8.5 8.4 8.4 8.4 2017 ............................................................... 1.66 – – – 8.3 – – –
Note: The sum of individual items may not equal totals due to rounding. Dashes indicate data are not available.
-170-

Supplemental table 13. Private retail trade industry workers, by bargaining status: employer costs per hours worked foremployee compensation and costs as a percentage of total compensation, 2006-2017
Union workers
Compensationcomponent
Cost per hour worked Percent of total compensation
Mar. June Sep. Dec. Mar. June Sep. Dec.
Total compensation 2006 ............................................................... – – – $18.26 – – – 100.0 2007 ............................................................... 18.31 18.52 18.67 18.67 100.0 100.0 100.0 100.0 2008 ............................................................... 18.87 19.04 19.05 19.29 100.0 100.0 100.0 100.0 2009 ............................................................... 19.40 19.58 19.78 19.85 100.0 100.0 100.0 100.0 2010 ............................................................... 19.93 20.34 20.51 20.21 100.0 100.0 100.0 100.0
2011 ............................................................... 20.34 20.47 20.55 20.30 100.0 100.0 100.0 100.0 2012 ............................................................... 20.29 20.58 20.79 20.82 100.0 100.0 100.0 100.0 2013 ............................................................... 21.27 21.46 21.51 21.37 100.0 100.0 100.0 100.0 2014 ............................................................... 21.55 21.68 21.58 21.58 100.0 100.0 100.0 100.0 2015 ............................................................... 21.80 22.00 22.13 20.97 100.0 100.0 100.0 100.0 2016 ............................................................... 21.27 21.45 21.40 22.21 100.0 100.0 100.0 100.0 2017 ............................................................... 22.62 – – – 100.0 – – –
Wages and salaries 2006 ............................................................... – – – 12.02 – – – 65.8 2007 ............................................................... 12.09 12.26 12.36 12.37 66.0 66.2 66.2 66.3 2008 ............................................................... 12.52 12.62 12.65 12.67 66.3 66.3 66.4 65.7 2009 ............................................................... 12.74 12.87 13.01 12.97 65.7 65.8 65.7 65.4 2010 ............................................................... 12.90 13.16 13.24 12.94 64.7 64.7 64.6 64.0
2011 ............................................................... 13.04 13.08 13.14 12.70 64.1 63.9 63.9 62.5 2012 ............................................................... 12.67 12.83 12.91 12.79 62.4 62.4 62.1 61.4 2013 ............................................................... 12.95 13.01 13.07 12.88 60.9 60.6 60.7 60.3 2014 ............................................................... 12.97 13.02 13.12 13.01 60.2 60.1 60.8 60.3 2015 ............................................................... 13.12 13.28 13.32 12.69 60.2 60.4 60.2 60.5 2016 ............................................................... 12.89 12.97 12.97 13.50 60.6 60.5 60.6 60.8 2017 ............................................................... 13.79 – – – 60.9 – – –
Total benefits 2006 ............................................................... – – – 6.25 – – – 34.2 2007 ............................................................... 6.23 6.26 6.31 6.30 34.0 33.8 33.8 33.7 2008 ............................................................... 6.35 6.41 6.40 6.62 33.7 33.7 33.6 34.3 2009 ............................................................... 6.65 6.70 6.78 6.87 34.3 34.2 34.3 34.6 2010 ............................................................... 7.03 7.18 7.27 7.27 35.3 35.3 35.4 36.0
2011 ............................................................... 7.31 7.39 7.41 7.60 35.9 36.1 36.1 37.5 2012 ............................................................... 7.62 7.74 7.88 8.03 37.6 37.6 37.9 38.6 2013 ............................................................... 8.32 8.44 8.44 8.49 39.1 39.4 39.3 39.7 2014 ............................................................... 8.58 8.66 8.46 8.57 39.8 39.9 39.2 39.7 2015 ............................................................... 8.67 8.72 8.81 8.27 39.8 39.6 39.8 39.5 2016 ............................................................... 8.38 8.48 8.43 8.71 39.4 39.5 39.4 39.2 2017 ............................................................... 8.83 – – – 39.1 – – –
Paid leave 2006 ............................................................... – – – 1.12 – – – 6.1 2007 ............................................................... 1.12 1.15 1.15 1.14 6.1 6.2 6.2 6.1 2008 ............................................................... 1.13 1.15 1.14 1.17 6.0 6.0 6.0 6.1 2009 ............................................................... 1.17 1.17 1.22 1.19 6.0 6.0 6.1 6.0 2010 ............................................................... 1.16 1.20 1.21 1.16 5.8 5.9 5.9 5.7
2011 ............................................................... 1.17 1.17 1.18 1.14 5.7 5.7 5.7 5.6 2012 ............................................................... 1.13 1.15 1.16 1.15 5.6 5.6 5.6 5.5 2013 ............................................................... 1.19 1.19 1.20 1.19 5.6 5.6 5.6 5.5 2014 ............................................................... 1.20 1.19 1.21 1.23 5.5 5.5 5.6 5.7 2015 ............................................................... 1.25 1.27 1.27 1.20 5.7 5.8 5.7 5.7 2016 ............................................................... 1.21 1.23 1.21 1.29 5.7 5.7 5.7 5.8 2017 ............................................................... 1.32 – – – 5.8 – – –
Supplemental pay 2006 ............................................................... – – – .39 – – – 2.1 2007 ............................................................... .39 .39 .39 .38 2.1 2.1 2.1 2.1 2008 ............................................................... .39 .40 .40 .39 2.1 2.1 2.1 2.0 2009 ............................................................... .39 .39 .39 .38 2.0 2.0 2.0 1.9 2010 ............................................................... .38 .39 .38 .36 1.9 1.9 1.9 1.8
2011 ............................................................... .36 .36 .35 .36 1.8 1.8 1.7 1.8 2012 ............................................................... .36 .37 .37 .37 1.8 1.8 1.8 1.8 2013 ............................................................... .39 .39 .40 .39 1.8 1.8 1.8 1.8 2014 ............................................................... .37 .37 .37 .37 1.7 1.7 1.7 1.7 2015 ............................................................... .37 .37 .37 .31 1.7 1.7 1.7 1.5 2016 ............................................................... .31 .31 .31 .32 1.5 1.5 1.5 1.4
See footnotes at end of table.
-171-
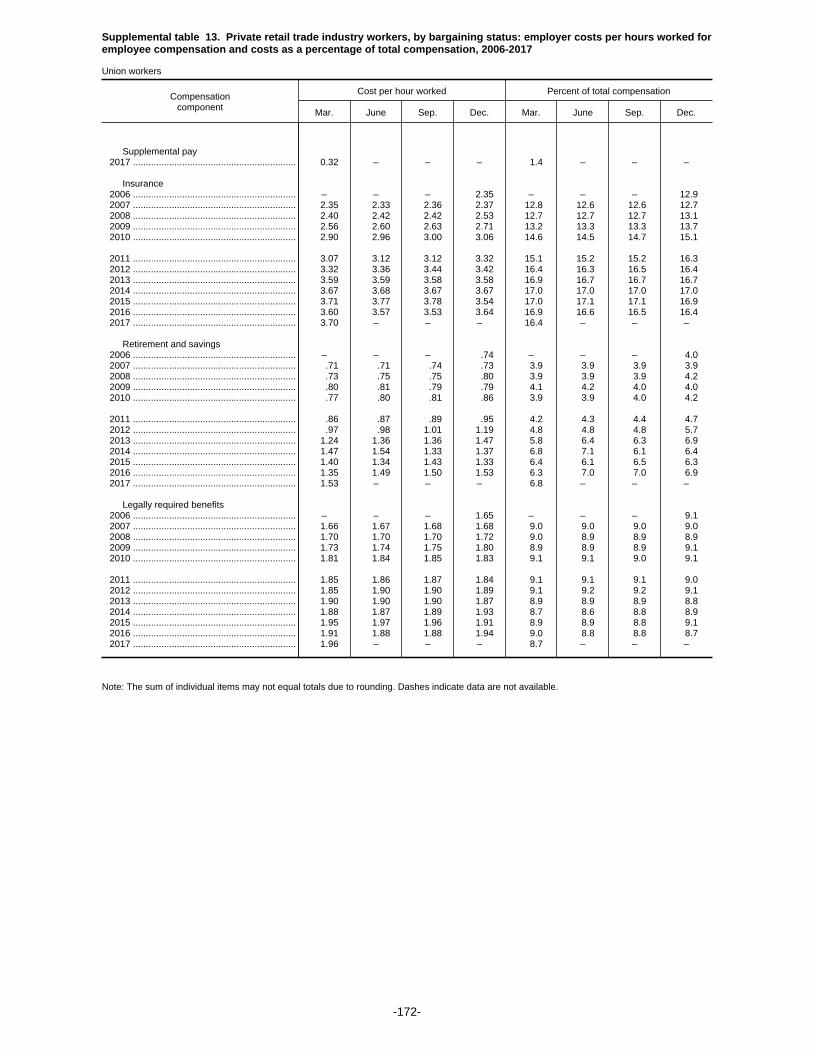
Supplemental table 13. Private retail trade industry workers, by bargaining status: employer costs per hours worked foremployee compensation and costs as a percentage of total compensation, 2006-2017
Union workers
Compensationcomponent
Cost per hour worked Percent of total compensation
Mar. June Sep. Dec. Mar. June Sep. Dec.
Supplemental pay 2017 ............................................................... 0.32 – – – 1.4 – – –
Insurance 2006 ............................................................... – – – 2.35 – – – 12.9 2007 ............................................................... 2.35 2.33 2.36 2.37 12.8 12.6 12.6 12.7 2008 ............................................................... 2.40 2.42 2.42 2.53 12.7 12.7 12.7 13.1 2009 ............................................................... 2.56 2.60 2.63 2.71 13.2 13.3 13.3 13.7 2010 ............................................................... 2.90 2.96 3.00 3.06 14.6 14.5 14.7 15.1
2011 ............................................................... 3.07 3.12 3.12 3.32 15.1 15.2 15.2 16.3 2012 ............................................................... 3.32 3.36 3.44 3.42 16.4 16.3 16.5 16.4 2013 ............................................................... 3.59 3.59 3.58 3.58 16.9 16.7 16.7 16.7 2014 ............................................................... 3.67 3.68 3.67 3.67 17.0 17.0 17.0 17.0 2015 ............................................................... 3.71 3.77 3.78 3.54 17.0 17.1 17.1 16.9 2016 ............................................................... 3.60 3.57 3.53 3.64 16.9 16.6 16.5 16.4 2017 ............................................................... 3.70 – – – 16.4 – – –
Retirement and savings 2006 ............................................................... – – – .74 – – – 4.0 2007 ............................................................... .71 .71 .74 .73 3.9 3.9 3.9 3.9 2008 ............................................................... .73 .75 .75 .80 3.9 3.9 3.9 4.2 2009 ............................................................... .80 .81 .79 .79 4.1 4.2 4.0 4.0 2010 ............................................................... .77 .80 .81 .86 3.9 3.9 4.0 4.2
2011 ............................................................... .86 .87 .89 .95 4.2 4.3 4.4 4.7 2012 ............................................................... .97 .98 1.01 1.19 4.8 4.8 4.8 5.7 2013 ............................................................... 1.24 1.36 1.36 1.47 5.8 6.4 6.3 6.9 2014 ............................................................... 1.47 1.54 1.33 1.37 6.8 7.1 6.1 6.4 2015 ............................................................... 1.40 1.34 1.43 1.33 6.4 6.1 6.5 6.3 2016 ............................................................... 1.35 1.49 1.50 1.53 6.3 7.0 7.0 6.9 2017 ............................................................... 1.53 – – – 6.8 – – –
Legally required benefits 2006 ............................................................... – – – 1.65 – – – 9.1 2007 ............................................................... 1.66 1.67 1.68 1.68 9.0 9.0 9.0 9.0 2008 ............................................................... 1.70 1.70 1.70 1.72 9.0 8.9 8.9 8.9 2009 ............................................................... 1.73 1.74 1.75 1.80 8.9 8.9 8.9 9.1 2010 ............................................................... 1.81 1.84 1.85 1.83 9.1 9.1 9.0 9.1
2011 ............................................................... 1.85 1.86 1.87 1.84 9.1 9.1 9.1 9.0 2012 ............................................................... 1.85 1.90 1.90 1.89 9.1 9.2 9.2 9.1 2013 ............................................................... 1.90 1.90 1.90 1.87 8.9 8.9 8.9 8.8 2014 ............................................................... 1.88 1.87 1.89 1.93 8.7 8.6 8.8 8.9 2015 ............................................................... 1.95 1.97 1.96 1.91 8.9 8.9 8.8 9.1 2016 ............................................................... 1.91 1.88 1.88 1.94 9.0 8.8 8.8 8.7 2017 ............................................................... 1.96 – – – 8.7 – – –
Note: The sum of individual items may not equal totals due to rounding. Dashes indicate data are not available.
-172-
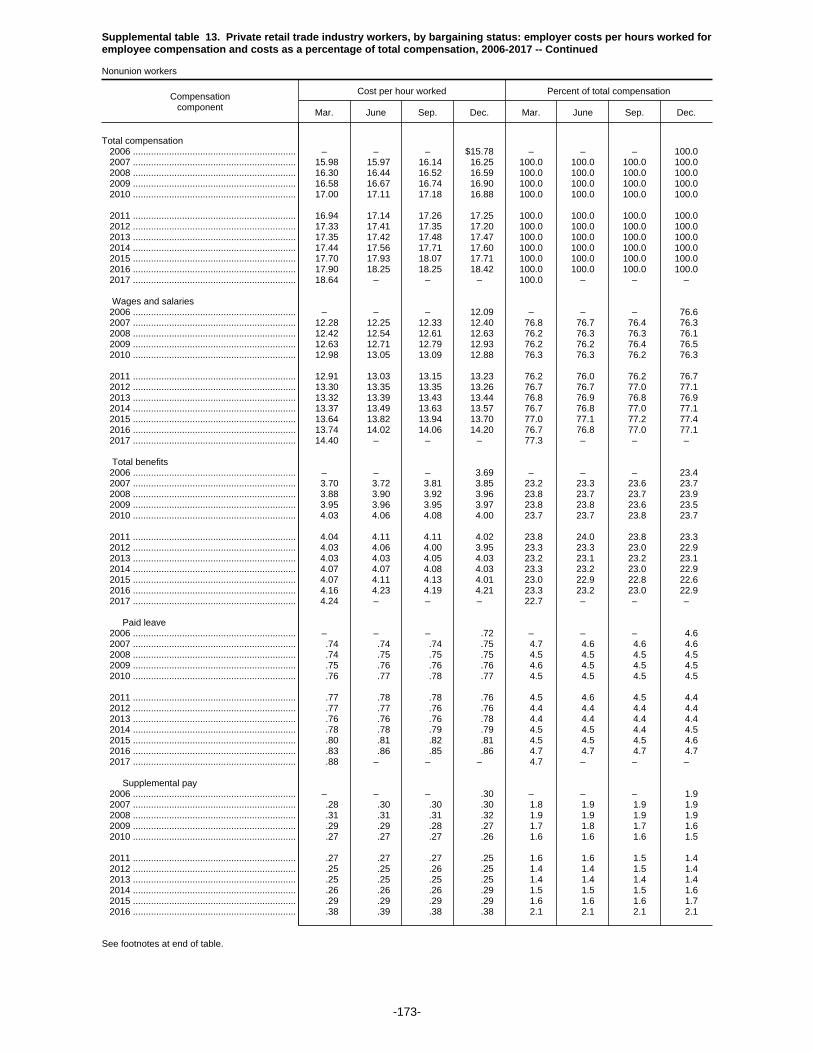
Supplemental table 13. Private retail trade industry workers, by bargaining status: employer costs per hours worked foremployee compensation and costs as a percentage of total compensation, 2006-2017 -- Continued
Nonunion workers
Compensationcomponent
Cost per hour worked Percent of total compensation
Mar. June Sep. Dec. Mar. June Sep. Dec.
Total compensation 2006 ............................................................... – – – $15.78 – – – 100.0 2007 ............................................................... 15.98 15.97 16.14 16.25 100.0 100.0 100.0 100.0 2008 ............................................................... 16.30 16.44 16.52 16.59 100.0 100.0 100.0 100.0 2009 ............................................................... 16.58 16.67 16.74 16.90 100.0 100.0 100.0 100.0 2010 ............................................................... 17.00 17.11 17.18 16.88 100.0 100.0 100.0 100.0
2011 ............................................................... 16.94 17.14 17.26 17.25 100.0 100.0 100.0 100.0 2012 ............................................................... 17.33 17.41 17.35 17.20 100.0 100.0 100.0 100.0 2013 ............................................................... 17.35 17.42 17.48 17.47 100.0 100.0 100.0 100.0 2014 ............................................................... 17.44 17.56 17.71 17.60 100.0 100.0 100.0 100.0 2015 ............................................................... 17.70 17.93 18.07 17.71 100.0 100.0 100.0 100.0 2016 ............................................................... 17.90 18.25 18.25 18.42 100.0 100.0 100.0 100.0 2017 ............................................................... 18.64 – – – 100.0 – – –
Wages and salaries 2006 ............................................................... – – – 12.09 – – – 76.6 2007 ............................................................... 12.28 12.25 12.33 12.40 76.8 76.7 76.4 76.3 2008 ............................................................... 12.42 12.54 12.61 12.63 76.2 76.3 76.3 76.1 2009 ............................................................... 12.63 12.71 12.79 12.93 76.2 76.2 76.4 76.5 2010 ............................................................... 12.98 13.05 13.09 12.88 76.3 76.3 76.2 76.3
2011 ............................................................... 12.91 13.03 13.15 13.23 76.2 76.0 76.2 76.7 2012 ............................................................... 13.30 13.35 13.35 13.26 76.7 76.7 77.0 77.1 2013 ............................................................... 13.32 13.39 13.43 13.44 76.8 76.9 76.8 76.9 2014 ............................................................... 13.37 13.49 13.63 13.57 76.7 76.8 77.0 77.1 2015 ............................................................... 13.64 13.82 13.94 13.70 77.0 77.1 77.2 77.4 2016 ............................................................... 13.74 14.02 14.06 14.20 76.7 76.8 77.0 77.1 2017 ............................................................... 14.40 – – – 77.3 – – –
Total benefits 2006 ............................................................... – – – 3.69 – – – 23.4 2007 ............................................................... 3.70 3.72 3.81 3.85 23.2 23.3 23.6 23.7 2008 ............................................................... 3.88 3.90 3.92 3.96 23.8 23.7 23.7 23.9 2009 ............................................................... 3.95 3.96 3.95 3.97 23.8 23.8 23.6 23.5 2010 ............................................................... 4.03 4.06 4.08 4.00 23.7 23.7 23.8 23.7
2011 ............................................................... 4.04 4.11 4.11 4.02 23.8 24.0 23.8 23.3 2012 ............................................................... 4.03 4.06 4.00 3.95 23.3 23.3 23.0 22.9 2013 ............................................................... 4.03 4.03 4.05 4.03 23.2 23.1 23.2 23.1 2014 ............................................................... 4.07 4.07 4.08 4.03 23.3 23.2 23.0 22.9 2015 ............................................................... 4.07 4.11 4.13 4.01 23.0 22.9 22.8 22.6 2016 ............................................................... 4.16 4.23 4.19 4.21 23.3 23.2 23.0 22.9 2017 ............................................................... 4.24 – – – 22.7 – – –
Paid leave 2006 ............................................................... – – – .72 – – – 4.6 2007 ............................................................... .74 .74 .74 .75 4.7 4.6 4.6 4.6 2008 ............................................................... .74 .75 .75 .75 4.5 4.5 4.5 4.5 2009 ............................................................... .75 .76 .76 .76 4.6 4.5 4.5 4.5 2010 ............................................................... .76 .77 .78 .77 4.5 4.5 4.5 4.5
2011 ............................................................... .77 .78 .78 .76 4.5 4.6 4.5 4.4 2012 ............................................................... .77 .77 .76 .76 4.4 4.4 4.4 4.4 2013 ............................................................... .76 .76 .76 .78 4.4 4.4 4.4 4.4 2014 ............................................................... .78 .78 .79 .79 4.5 4.5 4.4 4.5 2015 ............................................................... .80 .81 .82 .81 4.5 4.5 4.5 4.6 2016 ............................................................... .83 .86 .85 .86 4.7 4.7 4.7 4.7 2017 ............................................................... .88 – – – 4.7 – – –
Supplemental pay 2006 ............................................................... – – – .30 – – – 1.9 2007 ............................................................... .28 .30 .30 .30 1.8 1.9 1.9 1.9 2008 ............................................................... .31 .31 .31 .32 1.9 1.9 1.9 1.9 2009 ............................................................... .29 .29 .28 .27 1.7 1.8 1.7 1.6 2010 ............................................................... .27 .27 .27 .26 1.6 1.6 1.6 1.5
2011 ............................................................... .27 .27 .27 .25 1.6 1.6 1.5 1.4 2012 ............................................................... .25 .25 .26 .25 1.4 1.4 1.5 1.4 2013 ............................................................... .25 .25 .25 .25 1.4 1.4 1.4 1.4 2014 ............................................................... .26 .26 .26 .29 1.5 1.5 1.5 1.6 2015 ............................................................... .29 .29 .29 .29 1.6 1.6 1.6 1.7 2016 ............................................................... .38 .39 .38 .38 2.1 2.1 2.1 2.1
See footnotes at end of table.
-173-
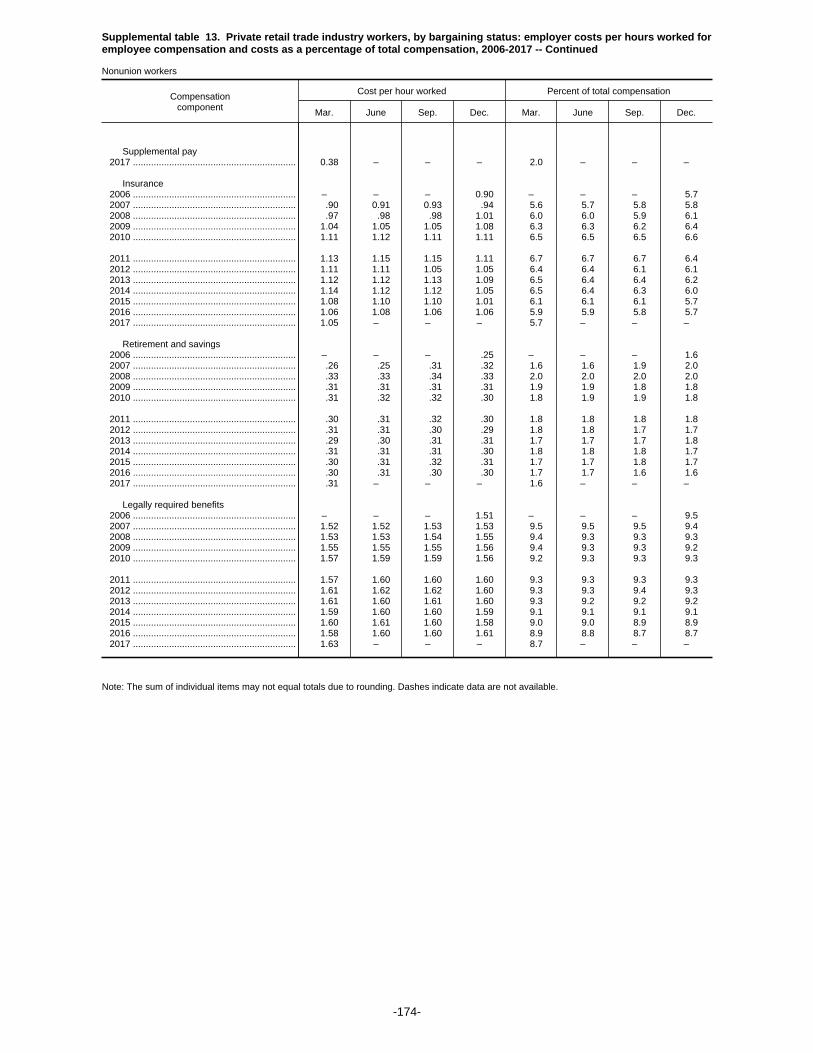
Supplemental table 13. Private retail trade industry workers, by bargaining status: employer costs per hours worked foremployee compensation and costs as a percentage of total compensation, 2006-2017 -- Continued
Nonunion workers
Compensationcomponent
Cost per hour worked Percent of total compensation
Mar. June Sep. Dec. Mar. June Sep. Dec.
Supplemental pay 2017 ............................................................... 0.38 – – – 2.0 – – –
Insurance 2006 ............................................................... – – – 0.90 – – – 5.7 2007 ............................................................... .90 0.91 0.93 .94 5.6 5.7 5.8 5.8 2008 ............................................................... .97 .98 .98 1.01 6.0 6.0 5.9 6.1 2009 ............................................................... 1.04 1.05 1.05 1.08 6.3 6.3 6.2 6.4 2010 ............................................................... 1.11 1.12 1.11 1.11 6.5 6.5 6.5 6.6
2011 ............................................................... 1.13 1.15 1.15 1.11 6.7 6.7 6.7 6.4 2012 ............................................................... 1.11 1.11 1.05 1.05 6.4 6.4 6.1 6.1 2013 ............................................................... 1.12 1.12 1.13 1.09 6.5 6.4 6.4 6.2 2014 ............................................................... 1.14 1.12 1.12 1.05 6.5 6.4 6.3 6.0 2015 ............................................................... 1.08 1.10 1.10 1.01 6.1 6.1 6.1 5.7 2016 ............................................................... 1.06 1.08 1.06 1.06 5.9 5.9 5.8 5.7 2017 ............................................................... 1.05 – – – 5.7 – – –
Retirement and savings 2006 ............................................................... – – – .25 – – – 1.6 2007 ............................................................... .26 .25 .31 .32 1.6 1.6 1.9 2.0 2008 ............................................................... .33 .33 .34 .33 2.0 2.0 2.0 2.0 2009 ............................................................... .31 .31 .31 .31 1.9 1.9 1.8 1.8 2010 ............................................................... .31 .32 .32 .30 1.8 1.9 1.9 1.8
2011 ............................................................... .30 .31 .32 .30 1.8 1.8 1.8 1.8 2012 ............................................................... .31 .31 .30 .29 1.8 1.8 1.7 1.7 2013 ............................................................... .29 .30 .31 .31 1.7 1.7 1.7 1.8 2014 ............................................................... .31 .31 .31 .30 1.8 1.8 1.8 1.7 2015 ............................................................... .30 .31 .32 .31 1.7 1.7 1.8 1.7 2016 ............................................................... .30 .31 .30 .30 1.7 1.7 1.6 1.6 2017 ............................................................... .31 – – – 1.6 – – –
Legally required benefits 2006 ............................................................... – – – 1.51 – – – 9.5 2007 ............................................................... 1.52 1.52 1.53 1.53 9.5 9.5 9.5 9.4 2008 ............................................................... 1.53 1.53 1.54 1.55 9.4 9.3 9.3 9.3 2009 ............................................................... 1.55 1.55 1.55 1.56 9.4 9.3 9.3 9.2 2010 ............................................................... 1.57 1.59 1.59 1.56 9.2 9.3 9.3 9.3
2011 ............................................................... 1.57 1.60 1.60 1.60 9.3 9.3 9.3 9.3 2012 ............................................................... 1.61 1.62 1.62 1.60 9.3 9.3 9.4 9.3 2013 ............................................................... 1.61 1.60 1.61 1.60 9.3 9.2 9.2 9.2 2014 ............................................................... 1.59 1.60 1.60 1.59 9.1 9.1 9.1 9.1 2015 ............................................................... 1.60 1.61 1.60 1.58 9.0 9.0 8.9 8.9 2016 ............................................................... 1.58 1.60 1.60 1.61 8.9 8.8 8.7 8.7 2017 ............................................................... 1.63 – – – 8.7 – – –
Note: The sum of individual items may not equal totals due to rounding. Dashes indicate data are not available.
-174-

Supplemental table 14. Private transportation and warehousing industry workers, by all workers: employer costs perhours worked for employee compensation and costs as a percentage of total compensation, 2006-2017
All workers
Compensationcomponent
Cost per hour worked Percent of total compensation
Mar. June Sep. Dec. Mar. June Sep. Dec.
Total compensation 2006 ............................................................... – – – $31.79 – – – 100.0 2007 ............................................................... 31.90 32.19 32.18 32.20 100.0 100.0 100.0 100.0 2008 ............................................................... 32.76 32.77 33.01 31.63 100.0 100.0 100.0 100.0 2009 ............................................................... 31.95 32.08 32.63 32.84 100.0 100.0 100.0 100.0 2010 ............................................................... 33.29 33.60 33.95 32.72 100.0 100.0 100.0 100.0
2011 ............................................................... 33.18 33.38 33.58 33.44 100.0 100.0 100.0 100.0 2012 ............................................................... 34.07 34.24 34.62 35.04 100.0 100.0 100.0 100.0 2013 ............................................................... 35.47 35.53 35.76 35.63 100.0 100.0 100.0 100.0 2014 ............................................................... 35.98 35.94 36.75 38.04 100.0 100.0 100.0 100.0 2015 ............................................................... 38.69 38.55 38.96 37.85 100.0 100.0 100.0 100.0 2016 ............................................................... 38.58 38.82 38.96 39.24 100.0 100.0 100.0 100.0 2017 ............................................................... 39.87 – – – 100.0 – – –
Wages and salaries 2006 ............................................................... – – – 20.80 – – – 65.4 2007 ............................................................... 20.86 21.07 21.08 21.10 65.4 65.4 65.5 65.5 2008 ............................................................... 21.35 21.42 21.61 20.81 65.2 65.4 65.5 65.8 2009 ............................................................... 21.01 21.10 21.41 21.58 65.8 65.8 65.6 65.7 2010 ............................................................... 21.78 21.93 22.19 21.36 65.4 65.3 65.4 65.3
2011 ............................................................... 21.52 21.65 21.79 21.74 64.9 64.9 64.9 65.0 2012 ............................................................... 22.03 22.17 22.46 22.64 64.7 64.7 64.9 64.6 2013 ............................................................... 22.92 22.93 23.06 22.72 64.6 64.5 64.5 63.8 2014 ............................................................... 22.92 22.95 23.48 24.28 63.7 63.8 63.9 63.8 2015 ............................................................... 24.66 24.56 24.83 24.04 63.7 63.7 63.7 63.5 2016 ............................................................... 24.51 24.73 24.88 25.15 63.5 63.7 63.9 64.1 2017 ............................................................... 25.58 – – – 64.2 – – –
Total benefits 2006 ............................................................... – – – 10.99 – – – 34.6 2007 ............................................................... 11.04 11.12 11.10 11.10 34.6 34.6 34.5 34.5 2008 ............................................................... 11.41 11.35 11.40 10.82 34.8 34.6 34.5 34.2 2009 ............................................................... 10.94 10.98 11.22 11.26 34.2 34.2 34.4 34.3 2010 ............................................................... 11.51 11.67 11.76 11.36 34.6 34.7 34.6 34.7
2011 ............................................................... 11.66 11.73 11.80 11.70 35.1 35.1 35.1 35.0 2012 ............................................................... 12.04 12.07 12.15 12.40 35.3 35.3 35.1 35.4 2013 ............................................................... 12.56 12.60 12.70 12.91 35.4 35.5 35.5 36.2 2014 ............................................................... 13.06 12.99 13.27 13.75 36.3 36.2 36.1 36.2 2015 ............................................................... 14.02 13.99 14.13 13.82 36.3 36.3 36.3 36.5 2016 ............................................................... 14.07 14.09 14.08 14.09 36.5 36.3 36.1 35.9 2017 ............................................................... 14.29 – – – 35.8 – – –
Paid leave 2006 ............................................................... – – – 2.41 – – – 7.6 2007 ............................................................... 2.40 2.38 2.31 2.31 7.5 7.4 7.2 7.2 2008 ............................................................... 2.31 2.31 2.32 2.21 7.1 7.0 7.0 7.0 2009 ............................................................... 2.24 2.26 2.31 2.32 7.0 7.0 7.1 7.1 2010 ............................................................... 2.37 2.38 2.42 2.31 7.1 7.1 7.1 7.1
2011 ............................................................... 2.33 2.32 2.33 2.38 7.0 7.0 6.9 7.1 2012 ............................................................... 2.40 2.40 2.40 2.45 7.0 7.0 6.9 7.0 2013 ............................................................... 2.47 2.48 2.50 2.52 7.0 7.0 7.0 7.1 2014 ............................................................... 2.55 2.54 2.67 2.76 7.1 7.1 7.3 7.3 2015 ............................................................... 2.81 2.78 2.82 2.67 7.3 7.2 7.3 7.0 2016 ............................................................... 2.74 2.75 2.77 2.79 7.1 7.1 7.1 7.1 2017 ............................................................... 2.86 – – – 7.2 – – –
Supplemental pay 2006 ............................................................... – – – .70 – – – 2.2 2007 ............................................................... .71 .76 .75 .76 2.2 2.4 2.3 2.4 2008 ............................................................... .85 .80 .86 .84 2.6 2.4 2.6 2.7 2009 ............................................................... .82 .83 .82 .79 2.6 2.6 2.5 2.4 2010 ............................................................... .74 .74 .74 .75 2.2 2.2 2.2 2.3
2011 ............................................................... .83 .85 .86 .90 2.5 2.6 2.6 2.7 2012 ............................................................... 1.04 1.02 1.02 1.01 3.0 3.0 3.0 2.9 2013 ............................................................... 1.01 1.00 1.01 1.09 2.9 2.8 2.8 3.0 2014 ............................................................... 1.08 1.08 1.09 1.18 3.0 3.0 3.0 3.1 2015 ............................................................... 1.21 1.17 1.17 1.16 3.1 3.0 3.0 3.1 2016 ............................................................... 1.19 1.22 1.23 1.22 3.1 3.1 3.1 3.1
See footnotes at end of table.
-175-
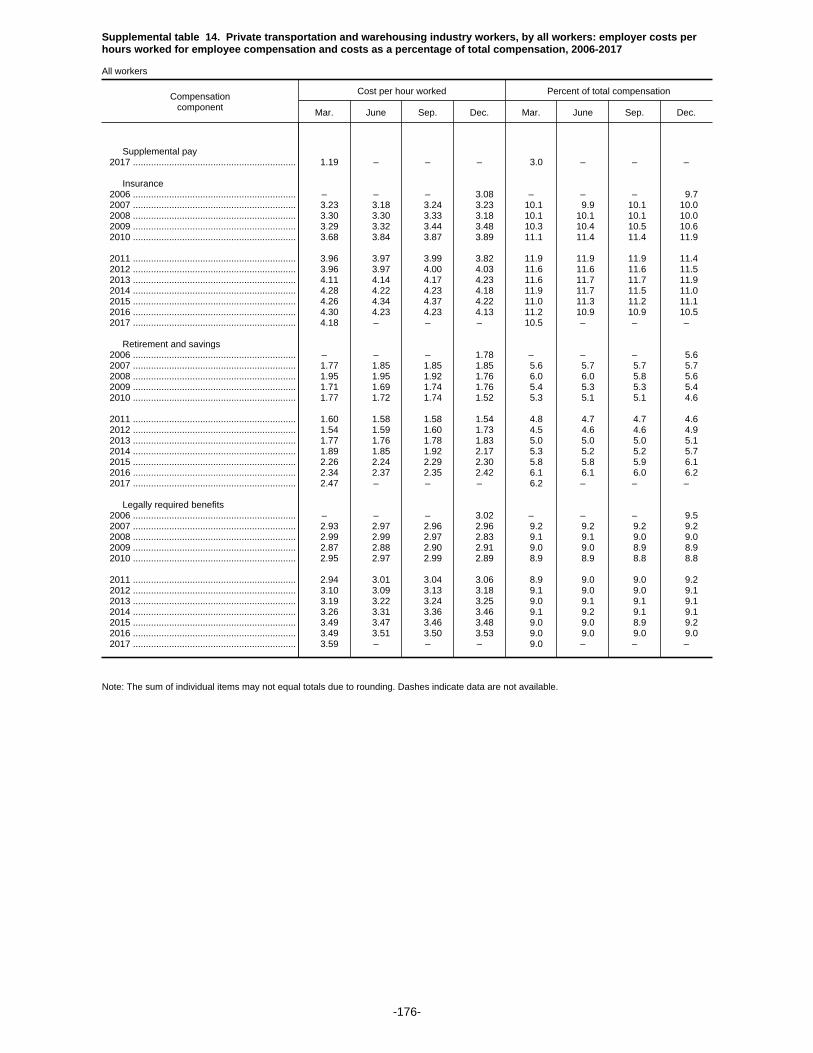
Supplemental table 14. Private transportation and warehousing industry workers, by all workers: employer costs perhours worked for employee compensation and costs as a percentage of total compensation, 2006-2017
All workers
Compensationcomponent
Cost per hour worked Percent of total compensation
Mar. June Sep. Dec. Mar. June Sep. Dec.
Supplemental pay 2017 ............................................................... 1.19 – – – 3.0 – – –
Insurance 2006 ............................................................... – – – 3.08 – – – 9.7 2007 ............................................................... 3.23 3.18 3.24 3.23 10.1 9.9 10.1 10.0 2008 ............................................................... 3.30 3.30 3.33 3.18 10.1 10.1 10.1 10.0 2009 ............................................................... 3.29 3.32 3.44 3.48 10.3 10.4 10.5 10.6 2010 ............................................................... 3.68 3.84 3.87 3.89 11.1 11.4 11.4 11.9
2011 ............................................................... 3.96 3.97 3.99 3.82 11.9 11.9 11.9 11.4 2012 ............................................................... 3.96 3.97 4.00 4.03 11.6 11.6 11.6 11.5 2013 ............................................................... 4.11 4.14 4.17 4.23 11.6 11.7 11.7 11.9 2014 ............................................................... 4.28 4.22 4.23 4.18 11.9 11.7 11.5 11.0 2015 ............................................................... 4.26 4.34 4.37 4.22 11.0 11.3 11.2 11.1 2016 ............................................................... 4.30 4.23 4.23 4.13 11.2 10.9 10.9 10.5 2017 ............................................................... 4.18 – – – 10.5 – – –
Retirement and savings 2006 ............................................................... – – – 1.78 – – – 5.6 2007 ............................................................... 1.77 1.85 1.85 1.85 5.6 5.7 5.7 5.7 2008 ............................................................... 1.95 1.95 1.92 1.76 6.0 6.0 5.8 5.6 2009 ............................................................... 1.71 1.69 1.74 1.76 5.4 5.3 5.3 5.4 2010 ............................................................... 1.77 1.72 1.74 1.52 5.3 5.1 5.1 4.6
2011 ............................................................... 1.60 1.58 1.58 1.54 4.8 4.7 4.7 4.6 2012 ............................................................... 1.54 1.59 1.60 1.73 4.5 4.6 4.6 4.9 2013 ............................................................... 1.77 1.76 1.78 1.83 5.0 5.0 5.0 5.1 2014 ............................................................... 1.89 1.85 1.92 2.17 5.3 5.2 5.2 5.7 2015 ............................................................... 2.26 2.24 2.29 2.30 5.8 5.8 5.9 6.1 2016 ............................................................... 2.34 2.37 2.35 2.42 6.1 6.1 6.0 6.2 2017 ............................................................... 2.47 – – – 6.2 – – –
Legally required benefits 2006 ............................................................... – – – 3.02 – – – 9.5 2007 ............................................................... 2.93 2.97 2.96 2.96 9.2 9.2 9.2 9.2 2008 ............................................................... 2.99 2.99 2.97 2.83 9.1 9.1 9.0 9.0 2009 ............................................................... 2.87 2.88 2.90 2.91 9.0 9.0 8.9 8.9 2010 ............................................................... 2.95 2.97 2.99 2.89 8.9 8.9 8.8 8.8
2011 ............................................................... 2.94 3.01 3.04 3.06 8.9 9.0 9.0 9.2 2012 ............................................................... 3.10 3.09 3.13 3.18 9.1 9.0 9.0 9.1 2013 ............................................................... 3.19 3.22 3.24 3.25 9.0 9.1 9.1 9.1 2014 ............................................................... 3.26 3.31 3.36 3.46 9.1 9.2 9.1 9.1 2015 ............................................................... 3.49 3.47 3.46 3.48 9.0 9.0 8.9 9.2 2016 ............................................................... 3.49 3.51 3.50 3.53 9.0 9.0 9.0 9.0 2017 ............................................................... 3.59 – – – 9.0 – – –
Note: The sum of individual items may not equal totals due to rounding. Dashes indicate data are not available.
-176-
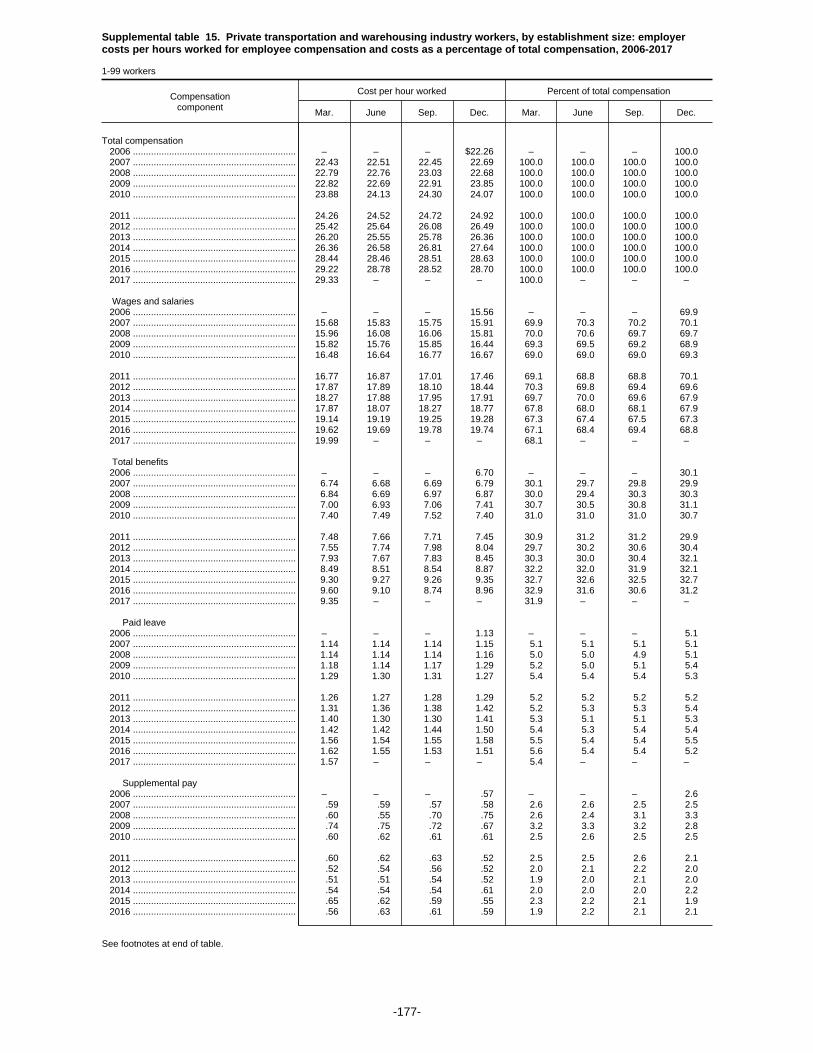
Supplemental table 15. Private transportation and warehousing industry workers, by establishment size: employercosts per hours worked for employee compensation and costs as a percentage of total compensation, 2006-2017
1-99 workers
Compensationcomponent
Cost per hour worked Percent of total compensation
Mar. June Sep. Dec. Mar. June Sep. Dec.
Total compensation 2006 ............................................................... – – – $22.26 – – – 100.0 2007 ............................................................... 22.43 22.51 22.45 22.69 100.0 100.0 100.0 100.0 2008 ............................................................... 22.79 22.76 23.03 22.68 100.0 100.0 100.0 100.0 2009 ............................................................... 22.82 22.69 22.91 23.85 100.0 100.0 100.0 100.0 2010 ............................................................... 23.88 24.13 24.30 24.07 100.0 100.0 100.0 100.0
2011 ............................................................... 24.26 24.52 24.72 24.92 100.0 100.0 100.0 100.0 2012 ............................................................... 25.42 25.64 26.08 26.49 100.0 100.0 100.0 100.0 2013 ............................................................... 26.20 25.55 25.78 26.36 100.0 100.0 100.0 100.0 2014 ............................................................... 26.36 26.58 26.81 27.64 100.0 100.0 100.0 100.0 2015 ............................................................... 28.44 28.46 28.51 28.63 100.0 100.0 100.0 100.0 2016 ............................................................... 29.22 28.78 28.52 28.70 100.0 100.0 100.0 100.0 2017 ............................................................... 29.33 – – – 100.0 – – –
Wages and salaries 2006 ............................................................... – – – 15.56 – – – 69.9 2007 ............................................................... 15.68 15.83 15.75 15.91 69.9 70.3 70.2 70.1 2008 ............................................................... 15.96 16.08 16.06 15.81 70.0 70.6 69.7 69.7 2009 ............................................................... 15.82 15.76 15.85 16.44 69.3 69.5 69.2 68.9 2010 ............................................................... 16.48 16.64 16.77 16.67 69.0 69.0 69.0 69.3
2011 ............................................................... 16.77 16.87 17.01 17.46 69.1 68.8 68.8 70.1 2012 ............................................................... 17.87 17.89 18.10 18.44 70.3 69.8 69.4 69.6 2013 ............................................................... 18.27 17.88 17.95 17.91 69.7 70.0 69.6 67.9 2014 ............................................................... 17.87 18.07 18.27 18.77 67.8 68.0 68.1 67.9 2015 ............................................................... 19.14 19.19 19.25 19.28 67.3 67.4 67.5 67.3 2016 ............................................................... 19.62 19.69 19.78 19.74 67.1 68.4 69.4 68.8 2017 ............................................................... 19.99 – – – 68.1 – – –
Total benefits 2006 ............................................................... – – – 6.70 – – – 30.1 2007 ............................................................... 6.74 6.68 6.69 6.79 30.1 29.7 29.8 29.9 2008 ............................................................... 6.84 6.69 6.97 6.87 30.0 29.4 30.3 30.3 2009 ............................................................... 7.00 6.93 7.06 7.41 30.7 30.5 30.8 31.1 2010 ............................................................... 7.40 7.49 7.52 7.40 31.0 31.0 31.0 30.7
2011 ............................................................... 7.48 7.66 7.71 7.45 30.9 31.2 31.2 29.9 2012 ............................................................... 7.55 7.74 7.98 8.04 29.7 30.2 30.6 30.4 2013 ............................................................... 7.93 7.67 7.83 8.45 30.3 30.0 30.4 32.1 2014 ............................................................... 8.49 8.51 8.54 8.87 32.2 32.0 31.9 32.1 2015 ............................................................... 9.30 9.27 9.26 9.35 32.7 32.6 32.5 32.7 2016 ............................................................... 9.60 9.10 8.74 8.96 32.9 31.6 30.6 31.2 2017 ............................................................... 9.35 – – – 31.9 – – –
Paid leave 2006 ............................................................... – – – 1.13 – – – 5.1 2007 ............................................................... 1.14 1.14 1.14 1.15 5.1 5.1 5.1 5.1 2008 ............................................................... 1.14 1.14 1.14 1.16 5.0 5.0 4.9 5.1 2009 ............................................................... 1.18 1.14 1.17 1.29 5.2 5.0 5.1 5.4 2010 ............................................................... 1.29 1.30 1.31 1.27 5.4 5.4 5.4 5.3
2011 ............................................................... 1.26 1.27 1.28 1.29 5.2 5.2 5.2 5.2 2012 ............................................................... 1.31 1.36 1.38 1.42 5.2 5.3 5.3 5.4 2013 ............................................................... 1.40 1.30 1.30 1.41 5.3 5.1 5.1 5.3 2014 ............................................................... 1.42 1.42 1.44 1.50 5.4 5.3 5.4 5.4 2015 ............................................................... 1.56 1.54 1.55 1.58 5.5 5.4 5.4 5.5 2016 ............................................................... 1.62 1.55 1.53 1.51 5.6 5.4 5.4 5.2 2017 ............................................................... 1.57 – – – 5.4 – – –
Supplemental pay 2006 ............................................................... – – – .57 – – – 2.6 2007 ............................................................... .59 .59 .57 .58 2.6 2.6 2.5 2.5 2008 ............................................................... .60 .55 .70 .75 2.6 2.4 3.1 3.3 2009 ............................................................... .74 .75 .72 .67 3.2 3.3 3.2 2.8 2010 ............................................................... .60 .62 .61 .61 2.5 2.6 2.5 2.5
2011 ............................................................... .60 .62 .63 .52 2.5 2.5 2.6 2.1 2012 ............................................................... .52 .54 .56 .52 2.0 2.1 2.2 2.0 2013 ............................................................... .51 .51 .54 .52 1.9 2.0 2.1 2.0 2014 ............................................................... .54 .54 .54 .61 2.0 2.0 2.0 2.2 2015 ............................................................... .65 .62 .59 .55 2.3 2.2 2.1 1.9 2016 ............................................................... .56 .63 .61 .59 1.9 2.2 2.1 2.1
See footnotes at end of table.
-177-

Supplemental table 15. Private transportation and warehousing industry workers, by establishment size: employercosts per hours worked for employee compensation and costs as a percentage of total compensation, 2006-2017
1-99 workers
Compensationcomponent
Cost per hour worked Percent of total compensation
Mar. June Sep. Dec. Mar. June Sep. Dec.
Supplemental pay 2017 ............................................................... 0.62 – – – 2.1 – – –
Insurance 2006 ............................................................... – – – 1.97 – – – 8.8 2007 ............................................................... 2.01 1.98 2.02 2.05 9.0 8.8 9.0 9.0 2008 ............................................................... 2.09 2.01 2.09 1.99 9.2 8.8 9.1 8.8 2009 ............................................................... 2.07 2.07 2.17 2.26 9.1 9.1 9.5 9.5 2010 ............................................................... 2.30 2.32 2.35 2.37 9.6 9.6 9.7 9.9
2011 ............................................................... 2.40 2.45 2.46 2.26 9.9 10.0 10.0 9.1 2012 ............................................................... 2.30 2.39 2.50 2.39 9.1 9.3 9.6 9.0 2013 ............................................................... 2.35 2.28 2.36 2.69 9.0 8.9 9.2 10.2 2014 ............................................................... 2.70 2.68 2.69 2.63 10.2 10.1 10.0 9.5 2015 ............................................................... 2.84 2.84 2.85 2.88 10.0 10.0 10.0 10.1 2016 ............................................................... 2.96 2.46 2.35 2.51 10.1 8.6 8.3 8.7 2017 ............................................................... 2.60 – – – 8.9 – – –
Retirement and savings 2006 ............................................................... – – – .64 – – – 2.9 2007 ............................................................... .63 .60 .57 .59 2.8 2.7 2.6 2.6 2008 ............................................................... .59 .56 .63 .65 2.6 2.5 2.7 2.8 2009 ............................................................... .66 .63 .64 .78 2.9 2.8 2.8 3.3 2010 ............................................................... .77 .79 .79 .73 3.2 3.3 3.2 3.0
2011 ............................................................... .73 .77 .77 .73 3.0 3.1 3.1 2.9 2012 ............................................................... .73 .79 .83 .92 2.9 3.1 3.2 3.5 2013 ............................................................... .94 .86 .89 1.00 3.6 3.4 3.4 3.8 2014 ............................................................... 1.01 1.01 1.04 1.11 3.8 3.8 3.9 4.0 2015 ............................................................... 1.25 1.21 1.24 1.24 4.4 4.3 4.3 4.3 2016 ............................................................... 1.32 1.27 1.11 1.22 4.5 4.4 3.9 4.3 2017 ............................................................... 1.34 – – – 4.6 – – –
Legally required benefits 2006 ............................................................... – – – 2.39 – – – 10.7 2007 ............................................................... 2.38 2.37 2.40 2.42 10.6 10.5 10.7 10.7 2008 ............................................................... 2.42 2.42 2.41 2.32 10.6 10.6 10.5 10.2 2009 ............................................................... 2.34 2.34 2.35 2.42 10.3 10.3 10.2 10.1 2010 ............................................................... 2.44 2.46 2.46 2.42 10.2 10.2 10.1 10.0
2011 ............................................................... 2.49 2.54 2.56 2.65 10.3 10.4 10.4 10.6 2012 ............................................................... 2.69 2.67 2.71 2.79 10.6 10.4 10.4 10.5 2013 ............................................................... 2.73 2.71 2.74 2.83 10.4 10.6 10.6 10.7 2014 ............................................................... 2.83 2.87 2.84 3.01 10.7 10.8 10.6 10.9 2015 ............................................................... 3.01 3.05 3.03 3.09 10.6 10.7 10.6 10.8 2016 ............................................................... 3.14 3.18 3.14 3.13 10.7 11.0 11.0 10.9 2017 ............................................................... 3.21 – – – 10.9 – – –
Note: The sum of individual items may not equal totals due to rounding. Dashes indicate data are not available.
-178-
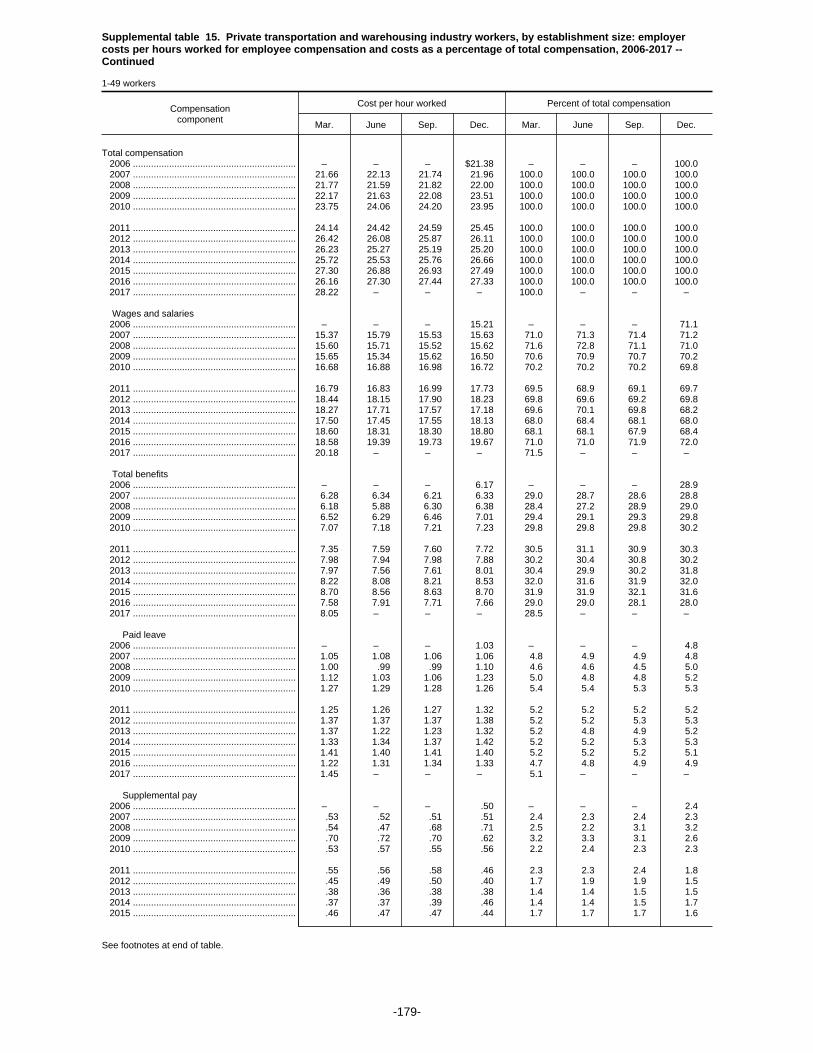
Supplemental table 15. Private transportation and warehousing industry workers, by establishment size: employercosts per hours worked for employee compensation and costs as a percentage of total compensation, 2006-2017 --Continued
1-49 workers
Compensationcomponent
Cost per hour worked Percent of total compensation
Mar. June Sep. Dec. Mar. June Sep. Dec.
Total compensation 2006 ............................................................... – – – $21.38 – – – 100.0 2007 ............................................................... 21.66 22.13 21.74 21.96 100.0 100.0 100.0 100.0 2008 ............................................................... 21.77 21.59 21.82 22.00 100.0 100.0 100.0 100.0 2009 ............................................................... 22.17 21.63 22.08 23.51 100.0 100.0 100.0 100.0 2010 ............................................................... 23.75 24.06 24.20 23.95 100.0 100.0 100.0 100.0
2011 ............................................................... 24.14 24.42 24.59 25.45 100.0 100.0 100.0 100.0 2012 ............................................................... 26.42 26.08 25.87 26.11 100.0 100.0 100.0 100.0 2013 ............................................................... 26.23 25.27 25.19 25.20 100.0 100.0 100.0 100.0 2014 ............................................................... 25.72 25.53 25.76 26.66 100.0 100.0 100.0 100.0 2015 ............................................................... 27.30 26.88 26.93 27.49 100.0 100.0 100.0 100.0 2016 ............................................................... 26.16 27.30 27.44 27.33 100.0 100.0 100.0 100.0 2017 ............................................................... 28.22 – – – 100.0 – – –
Wages and salaries 2006 ............................................................... – – – 15.21 – – – 71.1 2007 ............................................................... 15.37 15.79 15.53 15.63 71.0 71.3 71.4 71.2 2008 ............................................................... 15.60 15.71 15.52 15.62 71.6 72.8 71.1 71.0 2009 ............................................................... 15.65 15.34 15.62 16.50 70.6 70.9 70.7 70.2 2010 ............................................................... 16.68 16.88 16.98 16.72 70.2 70.2 70.2 69.8
2011 ............................................................... 16.79 16.83 16.99 17.73 69.5 68.9 69.1 69.7 2012 ............................................................... 18.44 18.15 17.90 18.23 69.8 69.6 69.2 69.8 2013 ............................................................... 18.27 17.71 17.57 17.18 69.6 70.1 69.8 68.2 2014 ............................................................... 17.50 17.45 17.55 18.13 68.0 68.4 68.1 68.0 2015 ............................................................... 18.60 18.31 18.30 18.80 68.1 68.1 67.9 68.4 2016 ............................................................... 18.58 19.39 19.73 19.67 71.0 71.0 71.9 72.0 2017 ............................................................... 20.18 – – – 71.5 – – –
Total benefits 2006 ............................................................... – – – 6.17 – – – 28.9 2007 ............................................................... 6.28 6.34 6.21 6.33 29.0 28.7 28.6 28.8 2008 ............................................................... 6.18 5.88 6.30 6.38 28.4 27.2 28.9 29.0 2009 ............................................................... 6.52 6.29 6.46 7.01 29.4 29.1 29.3 29.8 2010 ............................................................... 7.07 7.18 7.21 7.23 29.8 29.8 29.8 30.2
2011 ............................................................... 7.35 7.59 7.60 7.72 30.5 31.1 30.9 30.3 2012 ............................................................... 7.98 7.94 7.98 7.88 30.2 30.4 30.8 30.2 2013 ............................................................... 7.97 7.56 7.61 8.01 30.4 29.9 30.2 31.8 2014 ............................................................... 8.22 8.08 8.21 8.53 32.0 31.6 31.9 32.0 2015 ............................................................... 8.70 8.56 8.63 8.70 31.9 31.9 32.1 31.6 2016 ............................................................... 7.58 7.91 7.71 7.66 29.0 29.0 28.1 28.0 2017 ............................................................... 8.05 – – – 28.5 – – –
Paid leave 2006 ............................................................... – – – 1.03 – – – 4.8 2007 ............................................................... 1.05 1.08 1.06 1.06 4.8 4.9 4.9 4.8 2008 ............................................................... 1.00 .99 .99 1.10 4.6 4.6 4.5 5.0 2009 ............................................................... 1.12 1.03 1.06 1.23 5.0 4.8 4.8 5.2 2010 ............................................................... 1.27 1.29 1.28 1.26 5.4 5.4 5.3 5.3
2011 ............................................................... 1.25 1.26 1.27 1.32 5.2 5.2 5.2 5.2 2012 ............................................................... 1.37 1.37 1.37 1.38 5.2 5.2 5.3 5.3 2013 ............................................................... 1.37 1.22 1.23 1.32 5.2 4.8 4.9 5.2 2014 ............................................................... 1.33 1.34 1.37 1.42 5.2 5.2 5.3 5.3 2015 ............................................................... 1.41 1.40 1.41 1.40 5.2 5.2 5.2 5.1 2016 ............................................................... 1.22 1.31 1.34 1.33 4.7 4.8 4.9 4.9 2017 ............................................................... 1.45 – – – 5.1 – – –
Supplemental pay 2006 ............................................................... – – – .50 – – – 2.4 2007 ............................................................... .53 .52 .51 .51 2.4 2.3 2.4 2.3 2008 ............................................................... .54 .47 .68 .71 2.5 2.2 3.1 3.2 2009 ............................................................... .70 .72 .70 .62 3.2 3.3 3.1 2.6 2010 ............................................................... .53 .57 .55 .56 2.2 2.4 2.3 2.3
2011 ............................................................... .55 .56 .58 .46 2.3 2.3 2.4 1.8 2012 ............................................................... .45 .49 .50 .40 1.7 1.9 1.9 1.5 2013 ............................................................... .38 .36 .38 .38 1.4 1.4 1.5 1.5 2014 ............................................................... .37 .37 .39 .46 1.4 1.4 1.5 1.7 2015 ............................................................... .46 .47 .47 .44 1.7 1.7 1.7 1.6
See footnotes at end of table.
-179-
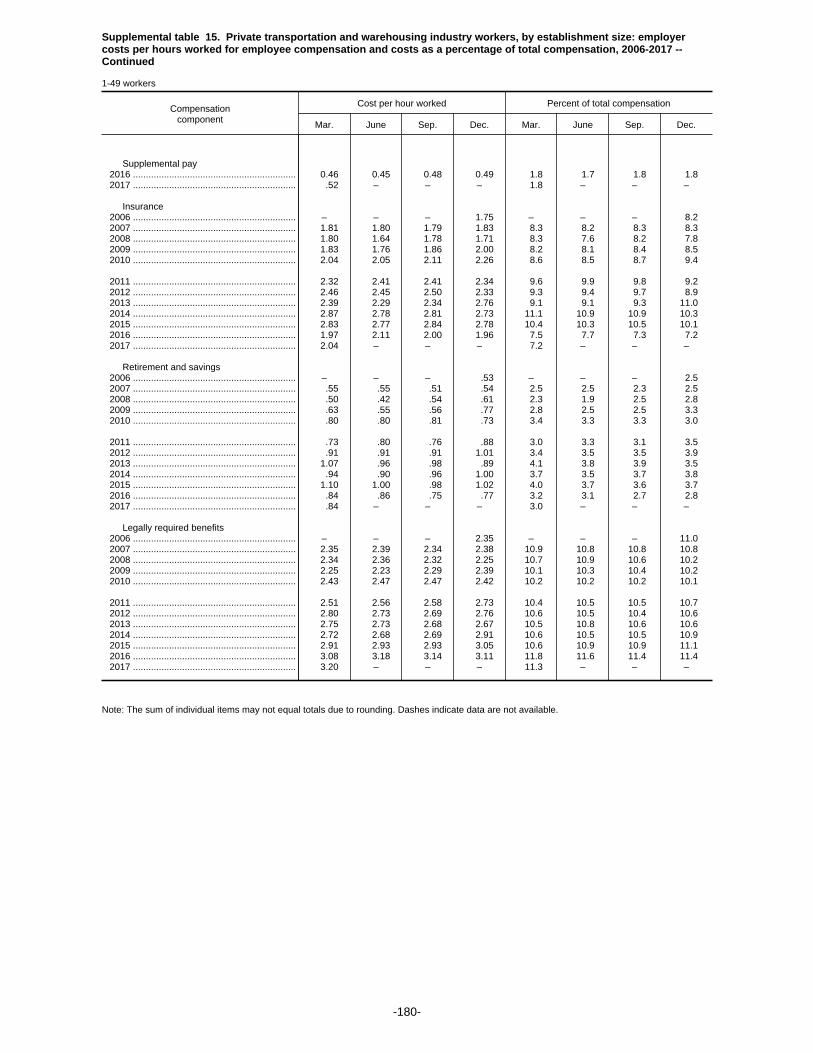
Supplemental table 15. Private transportation and warehousing industry workers, by establishment size: employercosts per hours worked for employee compensation and costs as a percentage of total compensation, 2006-2017 --Continued
1-49 workers
Compensationcomponent
Cost per hour worked Percent of total compensation
Mar. June Sep. Dec. Mar. June Sep. Dec.
Supplemental pay 2016 ............................................................... 0.46 0.45 0.48 0.49 1.8 1.7 1.8 1.8 2017 ............................................................... .52 – – – 1.8 – – –
Insurance 2006 ............................................................... – – – 1.75 – – – 8.2 2007 ............................................................... 1.81 1.80 1.79 1.83 8.3 8.2 8.3 8.3 2008 ............................................................... 1.80 1.64 1.78 1.71 8.3 7.6 8.2 7.8 2009 ............................................................... 1.83 1.76 1.86 2.00 8.2 8.1 8.4 8.5 2010 ............................................................... 2.04 2.05 2.11 2.26 8.6 8.5 8.7 9.4
2011 ............................................................... 2.32 2.41 2.41 2.34 9.6 9.9 9.8 9.2 2012 ............................................................... 2.46 2.45 2.50 2.33 9.3 9.4 9.7 8.9 2013 ............................................................... 2.39 2.29 2.34 2.76 9.1 9.1 9.3 11.0 2014 ............................................................... 2.87 2.78 2.81 2.73 11.1 10.9 10.9 10.3 2015 ............................................................... 2.83 2.77 2.84 2.78 10.4 10.3 10.5 10.1 2016 ............................................................... 1.97 2.11 2.00 1.96 7.5 7.7 7.3 7.2 2017 ............................................................... 2.04 – – – 7.2 – – –
Retirement and savings 2006 ............................................................... – – – .53 – – – 2.5 2007 ............................................................... .55 .55 .51 .54 2.5 2.5 2.3 2.5 2008 ............................................................... .50 .42 .54 .61 2.3 1.9 2.5 2.8 2009 ............................................................... .63 .55 .56 .77 2.8 2.5 2.5 3.3 2010 ............................................................... .80 .80 .81 .73 3.4 3.3 3.3 3.0
2011 ............................................................... .73 .80 .76 .88 3.0 3.3 3.1 3.5 2012 ............................................................... .91 .91 .91 1.01 3.4 3.5 3.5 3.9 2013 ............................................................... 1.07 .96 .98 .89 4.1 3.8 3.9 3.5 2014 ............................................................... .94 .90 .96 1.00 3.7 3.5 3.7 3.8 2015 ............................................................... 1.10 1.00 .98 1.02 4.0 3.7 3.6 3.7 2016 ............................................................... .84 .86 .75 .77 3.2 3.1 2.7 2.8 2017 ............................................................... .84 – – – 3.0 – – –
Legally required benefits 2006 ............................................................... – – – 2.35 – – – 11.0 2007 ............................................................... 2.35 2.39 2.34 2.38 10.9 10.8 10.8 10.8 2008 ............................................................... 2.34 2.36 2.32 2.25 10.7 10.9 10.6 10.2 2009 ............................................................... 2.25 2.23 2.29 2.39 10.1 10.3 10.4 10.2 2010 ............................................................... 2.43 2.47 2.47 2.42 10.2 10.2 10.2 10.1
2011 ............................................................... 2.51 2.56 2.58 2.73 10.4 10.5 10.5 10.7 2012 ............................................................... 2.80 2.73 2.69 2.76 10.6 10.5 10.4 10.6 2013 ............................................................... 2.75 2.73 2.68 2.67 10.5 10.8 10.6 10.6 2014 ............................................................... 2.72 2.68 2.69 2.91 10.6 10.5 10.5 10.9 2015 ............................................................... 2.91 2.93 2.93 3.05 10.6 10.9 10.9 11.1 2016 ............................................................... 3.08 3.18 3.14 3.11 11.8 11.6 11.4 11.4 2017 ............................................................... 3.20 – – – 11.3 – – –
Note: The sum of individual items may not equal totals due to rounding. Dashes indicate data are not available.
-180-
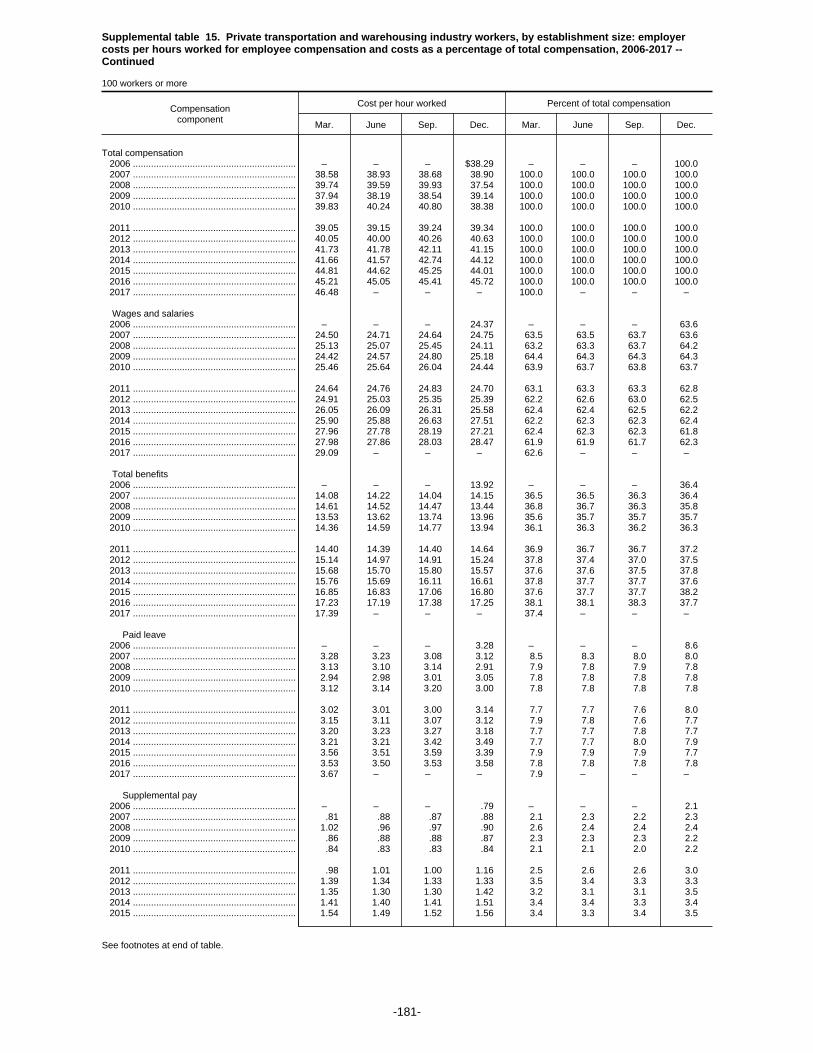
Supplemental table 15. Private transportation and warehousing industry workers, by establishment size: employercosts per hours worked for employee compensation and costs as a percentage of total compensation, 2006-2017 --Continued
100 workers or more
Compensationcomponent
Cost per hour worked Percent of total compensation
Mar. June Sep. Dec. Mar. June Sep. Dec.
Total compensation 2006 ............................................................... – – – $38.29 – – – 100.0 2007 ............................................................... 38.58 38.93 38.68 38.90 100.0 100.0 100.0 100.0 2008 ............................................................... 39.74 39.59 39.93 37.54 100.0 100.0 100.0 100.0 2009 ............................................................... 37.94 38.19 38.54 39.14 100.0 100.0 100.0 100.0 2010 ............................................................... 39.83 40.24 40.80 38.38 100.0 100.0 100.0 100.0
2011 ............................................................... 39.05 39.15 39.24 39.34 100.0 100.0 100.0 100.0 2012 ............................................................... 40.05 40.00 40.26 40.63 100.0 100.0 100.0 100.0 2013 ............................................................... 41.73 41.78 42.11 41.15 100.0 100.0 100.0 100.0 2014 ............................................................... 41.66 41.57 42.74 44.12 100.0 100.0 100.0 100.0 2015 ............................................................... 44.81 44.62 45.25 44.01 100.0 100.0 100.0 100.0 2016 ............................................................... 45.21 45.05 45.41 45.72 100.0 100.0 100.0 100.0 2017 ............................................................... 46.48 – – – 100.0 – – –
Wages and salaries 2006 ............................................................... – – – 24.37 – – – 63.6 2007 ............................................................... 24.50 24.71 24.64 24.75 63.5 63.5 63.7 63.6 2008 ............................................................... 25.13 25.07 25.45 24.11 63.2 63.3 63.7 64.2 2009 ............................................................... 24.42 24.57 24.80 25.18 64.4 64.3 64.3 64.3 2010 ............................................................... 25.46 25.64 26.04 24.44 63.9 63.7 63.8 63.7
2011 ............................................................... 24.64 24.76 24.83 24.70 63.1 63.3 63.3 62.8 2012 ............................................................... 24.91 25.03 25.35 25.39 62.2 62.6 63.0 62.5 2013 ............................................................... 26.05 26.09 26.31 25.58 62.4 62.4 62.5 62.2 2014 ............................................................... 25.90 25.88 26.63 27.51 62.2 62.3 62.3 62.4 2015 ............................................................... 27.96 27.78 28.19 27.21 62.4 62.3 62.3 61.8 2016 ............................................................... 27.98 27.86 28.03 28.47 61.9 61.9 61.7 62.3 2017 ............................................................... 29.09 – – – 62.6 – – –
Total benefits 2006 ............................................................... – – – 13.92 – – – 36.4 2007 ............................................................... 14.08 14.22 14.04 14.15 36.5 36.5 36.3 36.4 2008 ............................................................... 14.61 14.52 14.47 13.44 36.8 36.7 36.3 35.8 2009 ............................................................... 13.53 13.62 13.74 13.96 35.6 35.7 35.7 35.7 2010 ............................................................... 14.36 14.59 14.77 13.94 36.1 36.3 36.2 36.3
2011 ............................................................... 14.40 14.39 14.40 14.64 36.9 36.7 36.7 37.2 2012 ............................................................... 15.14 14.97 14.91 15.24 37.8 37.4 37.0 37.5 2013 ............................................................... 15.68 15.70 15.80 15.57 37.6 37.6 37.5 37.8 2014 ............................................................... 15.76 15.69 16.11 16.61 37.8 37.7 37.7 37.6 2015 ............................................................... 16.85 16.83 17.06 16.80 37.6 37.7 37.7 38.2 2016 ............................................................... 17.23 17.19 17.38 17.25 38.1 38.1 38.3 37.7 2017 ............................................................... 17.39 – – – 37.4 – – –
Paid leave 2006 ............................................................... – – – 3.28 – – – 8.6 2007 ............................................................... 3.28 3.23 3.08 3.12 8.5 8.3 8.0 8.0 2008 ............................................................... 3.13 3.10 3.14 2.91 7.9 7.8 7.9 7.8 2009 ............................................................... 2.94 2.98 3.01 3.05 7.8 7.8 7.8 7.8 2010 ............................................................... 3.12 3.14 3.20 3.00 7.8 7.8 7.8 7.8
2011 ............................................................... 3.02 3.01 3.00 3.14 7.7 7.7 7.6 8.0 2012 ............................................................... 3.15 3.11 3.07 3.12 7.9 7.8 7.6 7.7 2013 ............................................................... 3.20 3.23 3.27 3.18 7.7 7.7 7.8 7.7 2014 ............................................................... 3.21 3.21 3.42 3.49 7.7 7.7 8.0 7.9 2015 ............................................................... 3.56 3.51 3.59 3.39 7.9 7.9 7.9 7.7 2016 ............................................................... 3.53 3.50 3.53 3.58 7.8 7.8 7.8 7.8 2017 ............................................................... 3.67 – – – 7.9 – – –
Supplemental pay 2006 ............................................................... – – – .79 – – – 2.1 2007 ............................................................... .81 .88 .87 .88 2.1 2.3 2.2 2.3 2008 ............................................................... 1.02 .96 .97 .90 2.6 2.4 2.4 2.4 2009 ............................................................... .86 .88 .88 .87 2.3 2.3 2.3 2.2 2010 ............................................................... .84 .83 .83 .84 2.1 2.1 2.0 2.2
2011 ............................................................... .98 1.01 1.00 1.16 2.5 2.6 2.6 3.0 2012 ............................................................... 1.39 1.34 1.33 1.33 3.5 3.4 3.3 3.3 2013 ............................................................... 1.35 1.30 1.30 1.42 3.2 3.1 3.1 3.5 2014 ............................................................... 1.41 1.40 1.41 1.51 3.4 3.4 3.3 3.4 2015 ............................................................... 1.54 1.49 1.52 1.56 3.4 3.3 3.4 3.5
See footnotes at end of table.
-181-
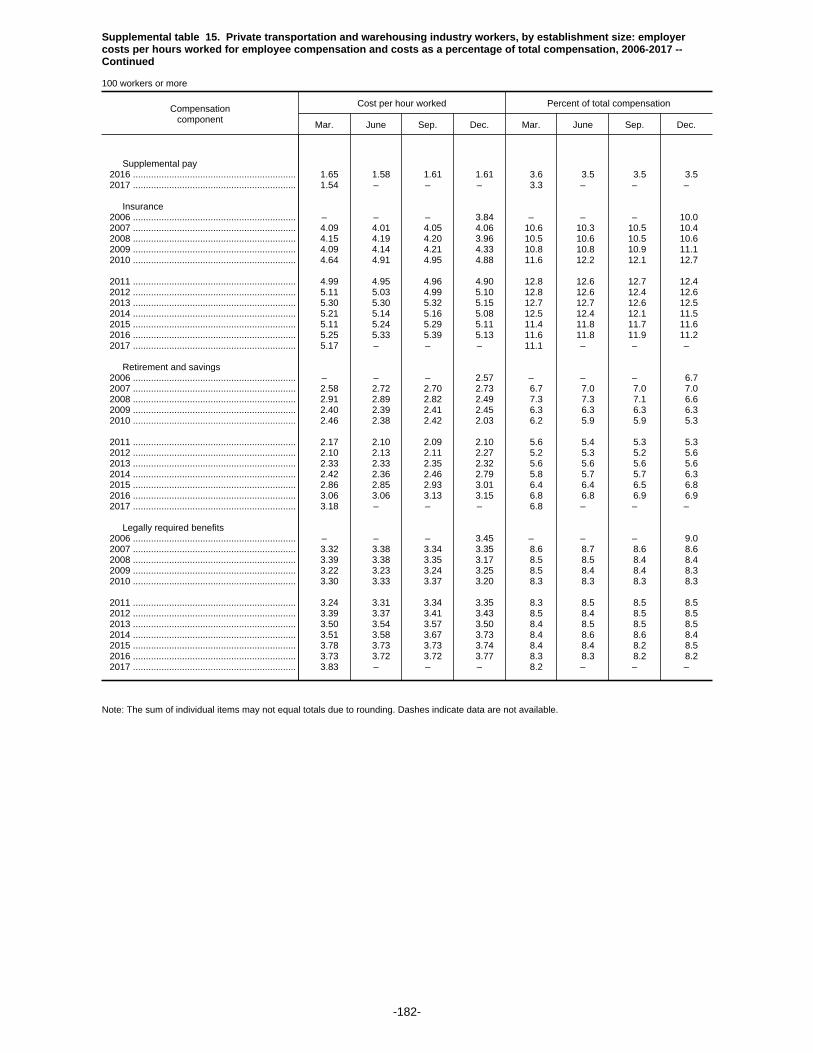
Supplemental table 15. Private transportation and warehousing industry workers, by establishment size: employercosts per hours worked for employee compensation and costs as a percentage of total compensation, 2006-2017 --Continued
100 workers or more
Compensationcomponent
Cost per hour worked Percent of total compensation
Mar. June Sep. Dec. Mar. June Sep. Dec.
Supplemental pay 2016 ............................................................... 1.65 1.58 1.61 1.61 3.6 3.5 3.5 3.5 2017 ............................................................... 1.54 – – – 3.3 – – –
Insurance 2006 ............................................................... – – – 3.84 – – – 10.0 2007 ............................................................... 4.09 4.01 4.05 4.06 10.6 10.3 10.5 10.4 2008 ............................................................... 4.15 4.19 4.20 3.96 10.5 10.6 10.5 10.6 2009 ............................................................... 4.09 4.14 4.21 4.33 10.8 10.8 10.9 11.1 2010 ............................................................... 4.64 4.91 4.95 4.88 11.6 12.2 12.1 12.7
2011 ............................................................... 4.99 4.95 4.96 4.90 12.8 12.6 12.7 12.4 2012 ............................................................... 5.11 5.03 4.99 5.10 12.8 12.6 12.4 12.6 2013 ............................................................... 5.30 5.30 5.32 5.15 12.7 12.7 12.6 12.5 2014 ............................................................... 5.21 5.14 5.16 5.08 12.5 12.4 12.1 11.5 2015 ............................................................... 5.11 5.24 5.29 5.11 11.4 11.8 11.7 11.6 2016 ............................................................... 5.25 5.33 5.39 5.13 11.6 11.8 11.9 11.2 2017 ............................................................... 5.17 – – – 11.1 – – –
Retirement and savings 2006 ............................................................... – – – 2.57 – – – 6.7 2007 ............................................................... 2.58 2.72 2.70 2.73 6.7 7.0 7.0 7.0 2008 ............................................................... 2.91 2.89 2.82 2.49 7.3 7.3 7.1 6.6 2009 ............................................................... 2.40 2.39 2.41 2.45 6.3 6.3 6.3 6.3 2010 ............................................................... 2.46 2.38 2.42 2.03 6.2 5.9 5.9 5.3
2011 ............................................................... 2.17 2.10 2.09 2.10 5.6 5.4 5.3 5.3 2012 ............................................................... 2.10 2.13 2.11 2.27 5.2 5.3 5.2 5.6 2013 ............................................................... 2.33 2.33 2.35 2.32 5.6 5.6 5.6 5.6 2014 ............................................................... 2.42 2.36 2.46 2.79 5.8 5.7 5.7 6.3 2015 ............................................................... 2.86 2.85 2.93 3.01 6.4 6.4 6.5 6.8 2016 ............................................................... 3.06 3.06 3.13 3.15 6.8 6.8 6.9 6.9 2017 ............................................................... 3.18 – – – 6.8 – – –
Legally required benefits 2006 ............................................................... – – – 3.45 – – – 9.0 2007 ............................................................... 3.32 3.38 3.34 3.35 8.6 8.7 8.6 8.6 2008 ............................................................... 3.39 3.38 3.35 3.17 8.5 8.5 8.4 8.4 2009 ............................................................... 3.22 3.23 3.24 3.25 8.5 8.4 8.4 8.3 2010 ............................................................... 3.30 3.33 3.37 3.20 8.3 8.3 8.3 8.3
2011 ............................................................... 3.24 3.31 3.34 3.35 8.3 8.5 8.5 8.5 2012 ............................................................... 3.39 3.37 3.41 3.43 8.5 8.4 8.5 8.5 2013 ............................................................... 3.50 3.54 3.57 3.50 8.4 8.5 8.5 8.5 2014 ............................................................... 3.51 3.58 3.67 3.73 8.4 8.6 8.6 8.4 2015 ............................................................... 3.78 3.73 3.73 3.74 8.4 8.4 8.2 8.5 2016 ............................................................... 3.73 3.72 3.72 3.77 8.3 8.3 8.2 8.2 2017 ............................................................... 3.83 – – – 8.2 – – –
Note: The sum of individual items may not equal totals due to rounding. Dashes indicate data are not available.
-182-

Supplemental table 15. Private transportation and warehousing industry workers, by establishment size: employercosts per hours worked for employee compensation and costs as a percentage of total compensation, 2006-2017 --Continued
100-499 workers
Compensationcomponent
Cost per hour worked Percent of total compensation
Mar. June Sep. Dec. Mar. June Sep. Dec.
Total compensation 2006 ............................................................... – – – $27.36 – – – 100.0 2007 ............................................................... 27.49 27.45 27.24 27.09 100.0 100.0 100.0 100.0 2008 ............................................................... 27.64 27.72 27.92 26.82 100.0 100.0 100.0 100.0 2009 ............................................................... 26.84 27.06 26.99 27.16 100.0 100.0 100.0 100.0 2010 ............................................................... 27.50 27.84 28.58 27.61 100.0 100.0 100.0 100.0
2011 ............................................................... 28.15 28.29 28.35 29.13 100.0 100.0 100.0 100.0 2012 ............................................................... 29.37 29.32 29.15 29.99 100.0 100.0 100.0 100.0 2013 ............................................................... 30.91 30.91 31.17 30.09 100.0 100.0 100.0 100.0 2014 ............................................................... 30.54 30.66 30.47 31.50 100.0 100.0 100.0 100.0 2015 ............................................................... 31.50 31.51 32.21 30.81 100.0 100.0 100.0 100.0 2016 ............................................................... 31.07 32.11 32.70 31.99 100.0 100.0 100.0 100.0 2017 ............................................................... 31.92 – – – 100.0 – – –
Wages and salaries 2006 ............................................................... – – – 17.86 – – – 65.3 2007 ............................................................... 17.85 17.97 17.80 17.76 64.9 65.5 65.3 65.5 2008 ............................................................... 18.11 18.19 18.40 17.86 65.5 65.6 65.9 66.6 2009 ............................................................... 17.85 17.91 17.91 17.99 66.5 66.2 66.4 66.2 2010 ............................................................... 18.11 18.34 18.80 17.85 65.8 65.9 65.8 64.6
2011 ............................................................... 18.04 18.24 18.28 18.49 64.1 64.5 64.5 63.5 2012 ............................................................... 18.59 18.64 18.60 19.05 63.3 63.6 63.8 63.5 2013 ............................................................... 19.47 19.45 19.60 18.75 63.0 62.9 62.9 62.3 2014 ............................................................... 19.10 19.18 19.14 19.80 62.5 62.5 62.8 62.9 2015 ............................................................... 19.89 19.87 20.28 19.46 63.1 63.1 63.0 63.2 2016 ............................................................... 19.71 20.15 20.45 20.33 63.4 62.8 62.5 63.6 2017 ............................................................... 20.45 – – – 64.1 – – –
Total benefits 2006 ............................................................... – – – 9.50 – – – 34.7 2007 ............................................................... 9.64 9.48 9.44 9.34 35.1 34.5 34.7 34.5 2008 ............................................................... 9.54 9.53 9.51 8.96 34.5 34.4 34.1 33.4 2009 ............................................................... 9.00 9.15 9.08 9.17 33.5 33.8 33.6 33.8 2010 ............................................................... 9.39 9.51 9.78 9.76 34.2 34.1 34.2 35.4
2011 ............................................................... 10.11 10.05 10.07 10.64 35.9 35.5 35.5 36.5 2012 ............................................................... 10.78 10.69 10.55 10.94 36.7 36.4 36.2 36.5 2013 ............................................................... 11.45 11.46 11.57 11.33 37.0 37.1 37.1 37.7 2014 ............................................................... 11.45 11.49 11.33 11.69 37.5 37.5 37.2 37.1 2015 ............................................................... 11.61 11.64 11.92 11.35 36.9 36.9 37.0 36.8 2016 ............................................................... 11.36 11.96 12.25 11.66 36.6 37.2 37.5 36.4 2017 ............................................................... 11.46 – – – 35.9 – – –
Paid leave 2006 ............................................................... – – – 2.06 – – – 7.5 2007 ............................................................... 2.04 1.92 1.88 1.91 7.4 7.0 6.9 7.0 2008 ............................................................... 1.87 1.86 1.88 1.77 6.8 6.7 6.7 6.6 2009 ............................................................... 1.76 1.79 1.77 1.69 6.5 6.6 6.6 6.2 2010 ............................................................... 1.77 1.78 1.84 1.80 6.4 6.4 6.4 6.5
2011 ............................................................... 1.82 1.81 1.80 1.91 6.5 6.4 6.4 6.5 2012 ............................................................... 1.91 1.87 1.81 1.85 6.5 6.4 6.2 6.2 2013 ............................................................... 1.95 1.99 2.03 1.94 6.3 6.4 6.5 6.4 2014 ............................................................... 1.98 1.99 1.99 2.04 6.5 6.5 6.5 6.5 2015 ............................................................... 2.03 2.02 2.11 2.05 6.5 6.4 6.5 6.7 2016 ............................................................... 2.10 2.18 2.25 2.19 6.8 6.8 6.9 6.8 2017 ............................................................... 2.15 – – – 6.7 – – –
Supplemental pay 2006 ............................................................... – – – .66 – – – 2.4 2007 ............................................................... .66 .65 .66 .65 2.4 2.4 2.4 2.4 2008 ............................................................... .69 .69 .70 .68 2.5 2.5 2.5 2.5 2009 ............................................................... .62 .64 .64 .62 2.3 2.4 2.4 2.3 2010 ............................................................... .61 .59 .60 .69 2.2 2.1 2.1 2.5
2011 ............................................................... .78 .76 .77 1.03 2.8 2.7 2.7 3.5 2012 ............................................................... 1.06 1.04 1.02 1.11 3.6 3.5 3.5 3.7 2013 ............................................................... 1.13 1.08 1.07 1.11 3.7 3.5 3.4 3.7 2014 ............................................................... 1.06 1.06 1.05 1.02 3.5 3.5 3.4 3.2 2015 ............................................................... 1.04 1.16 1.20 .93 3.3 3.7 3.7 3.0
See footnotes at end of table.
-183-
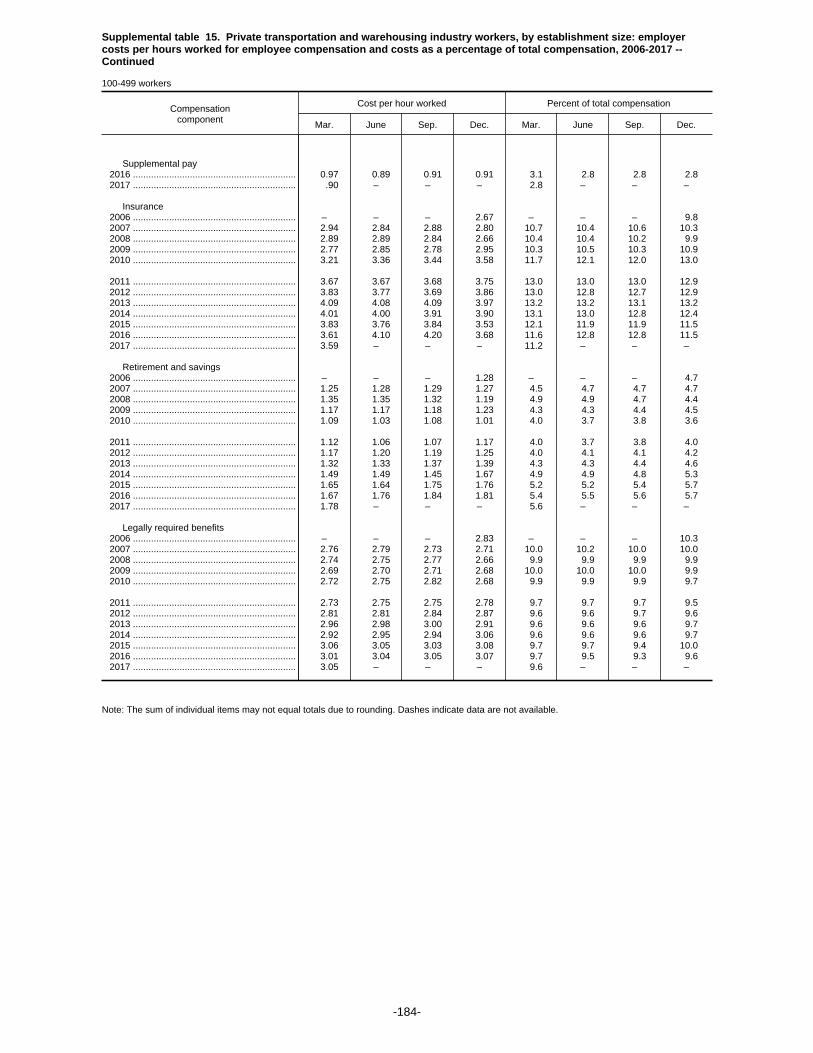
Supplemental table 15. Private transportation and warehousing industry workers, by establishment size: employercosts per hours worked for employee compensation and costs as a percentage of total compensation, 2006-2017 --Continued
100-499 workers
Compensationcomponent
Cost per hour worked Percent of total compensation
Mar. June Sep. Dec. Mar. June Sep. Dec.
Supplemental pay 2016 ............................................................... 0.97 0.89 0.91 0.91 3.1 2.8 2.8 2.8 2017 ............................................................... .90 – – – 2.8 – – –
Insurance 2006 ............................................................... – – – 2.67 – – – 9.8 2007 ............................................................... 2.94 2.84 2.88 2.80 10.7 10.4 10.6 10.3 2008 ............................................................... 2.89 2.89 2.84 2.66 10.4 10.4 10.2 9.9 2009 ............................................................... 2.77 2.85 2.78 2.95 10.3 10.5 10.3 10.9 2010 ............................................................... 3.21 3.36 3.44 3.58 11.7 12.1 12.0 13.0
2011 ............................................................... 3.67 3.67 3.68 3.75 13.0 13.0 13.0 12.9 2012 ............................................................... 3.83 3.77 3.69 3.86 13.0 12.8 12.7 12.9 2013 ............................................................... 4.09 4.08 4.09 3.97 13.2 13.2 13.1 13.2 2014 ............................................................... 4.01 4.00 3.91 3.90 13.1 13.0 12.8 12.4 2015 ............................................................... 3.83 3.76 3.84 3.53 12.1 11.9 11.9 11.5 2016 ............................................................... 3.61 4.10 4.20 3.68 11.6 12.8 12.8 11.5 2017 ............................................................... 3.59 – – – 11.2 – – –
Retirement and savings 2006 ............................................................... – – – 1.28 – – – 4.7 2007 ............................................................... 1.25 1.28 1.29 1.27 4.5 4.7 4.7 4.7 2008 ............................................................... 1.35 1.35 1.32 1.19 4.9 4.9 4.7 4.4 2009 ............................................................... 1.17 1.17 1.18 1.23 4.3 4.3 4.4 4.5 2010 ............................................................... 1.09 1.03 1.08 1.01 4.0 3.7 3.8 3.6
2011 ............................................................... 1.12 1.06 1.07 1.17 4.0 3.7 3.8 4.0 2012 ............................................................... 1.17 1.20 1.19 1.25 4.0 4.1 4.1 4.2 2013 ............................................................... 1.32 1.33 1.37 1.39 4.3 4.3 4.4 4.6 2014 ............................................................... 1.49 1.49 1.45 1.67 4.9 4.9 4.8 5.3 2015 ............................................................... 1.65 1.64 1.75 1.76 5.2 5.2 5.4 5.7 2016 ............................................................... 1.67 1.76 1.84 1.81 5.4 5.5 5.6 5.7 2017 ............................................................... 1.78 – – – 5.6 – – –
Legally required benefits 2006 ............................................................... – – – 2.83 – – – 10.3 2007 ............................................................... 2.76 2.79 2.73 2.71 10.0 10.2 10.0 10.0 2008 ............................................................... 2.74 2.75 2.77 2.66 9.9 9.9 9.9 9.9 2009 ............................................................... 2.69 2.70 2.71 2.68 10.0 10.0 10.0 9.9 2010 ............................................................... 2.72 2.75 2.82 2.68 9.9 9.9 9.9 9.7
2011 ............................................................... 2.73 2.75 2.75 2.78 9.7 9.7 9.7 9.5 2012 ............................................................... 2.81 2.81 2.84 2.87 9.6 9.6 9.7 9.6 2013 ............................................................... 2.96 2.98 3.00 2.91 9.6 9.6 9.6 9.7 2014 ............................................................... 2.92 2.95 2.94 3.06 9.6 9.6 9.6 9.7 2015 ............................................................... 3.06 3.05 3.03 3.08 9.7 9.7 9.4 10.0 2016 ............................................................... 3.01 3.04 3.05 3.07 9.7 9.5 9.3 9.6 2017 ............................................................... 3.05 – – – 9.6 – – –
Note: The sum of individual items may not equal totals due to rounding. Dashes indicate data are not available.
-184-

Supplemental table 16. Private transportation and warehousing industry workers, by bargaining status: employer costsper hours worked for employee compensation and costs as a percentage of total compensation, 2006-2017
Union workers
Compensationcomponent
Cost per hour worked Percent of total compensation
Mar. June Sep. Dec. Mar. June Sep. Dec.
Total compensation 2006 ............................................................... – – – $48.16 – – – 100.0 2007 ............................................................... 48.31 48.84 48.76 48.71 100.0 100.0 100.0 100.0 2008 ............................................................... 50.07 49.86 49.99 47.29 100.0 100.0 100.0 100.0 2009 ............................................................... 48.23 48.39 48.97 46.97 100.0 100.0 100.0 100.0 2010 ............................................................... 47.89 48.69 49.56 47.36 100.0 100.0 100.0 100.0
2011 ............................................................... 48.20 48.29 48.46 47.30 100.0 100.0 100.0 100.0 2012 ............................................................... 48.51 49.00 49.65 50.14 100.0 100.0 100.0 100.0 2013 ............................................................... 51.23 51.38 51.71 51.30 100.0 100.0 100.0 100.0 2014 ............................................................... 52.47 52.11 54.37 56.43 100.0 100.0 100.0 100.0 2015 ............................................................... 57.95 57.50 57.77 55.31 100.0 100.0 100.0 100.0 2016 ............................................................... 56.40 56.40 57.83 58.32 100.0 100.0 100.0 100.0 2017 ............................................................... 59.62 – – – 100.0 – – –
Wages and salaries 2006 ............................................................... – – – 29.30 – – – 60.9 2007 ............................................................... 29.29 29.56 29.78 29.71 60.6 60.5 61.1 61.0 2008 ............................................................... 30.27 30.14 30.49 28.98 60.5 60.5 61.0 61.3 2009 ............................................................... 29.65 29.74 30.18 28.91 61.5 61.5 61.6 61.5 2010 ............................................................... 29.26 29.64 30.20 28.63 61.1 60.9 60.9 60.5
2011 ............................................................... 28.81 28.86 29.01 28.15 59.8 59.8 59.9 59.5 2012 ............................................................... 28.51 29.06 29.67 29.73 58.8 59.3 59.8 59.3 2013 ............................................................... 30.50 30.62 30.88 30.51 59.5 59.6 59.7 59.5 2014 ............................................................... 31.26 31.06 32.46 33.86 59.6 59.6 59.7 60.0 2015 ............................................................... 34.76 34.45 34.64 32.68 60.0 59.9 60.0 59.1 2016 ............................................................... 33.41 33.21 34.06 34.63 59.2 58.9 58.9 59.4 2017 ............................................................... 35.41 – – – 59.4 – – –
Total benefits 2006 ............................................................... – – – 18.85 – – – 39.1 2007 ............................................................... 19.02 19.28 18.99 19.00 39.4 39.5 38.9 39.0 2008 ............................................................... 19.80 19.72 19.50 18.31 39.5 39.5 39.0 38.7 2009 ............................................................... 18.58 18.65 18.79 18.06 38.5 38.5 38.4 38.5 2010 ............................................................... 18.63 19.05 19.36 18.73 38.9 39.1 39.1 39.5
2011 ............................................................... 19.39 19.43 19.45 19.15 40.2 40.2 40.1 40.5 2012 ............................................................... 20.00 19.95 19.98 20.41 41.2 40.7 40.2 40.7 2013 ............................................................... 20.72 20.75 20.83 20.79 40.5 40.4 40.3 40.5 2014 ............................................................... 21.21 21.05 21.91 22.56 40.4 40.4 40.3 40.0 2015 ............................................................... 23.19 23.05 23.13 22.63 40.0 40.1 40.0 40.9 2016 ............................................................... 22.99 23.18 23.77 23.69 40.8 41.1 41.1 40.6 2017 ............................................................... 24.21 – – – 40.6 – – –
Paid leave 2006 ............................................................... – – – 4.47 – – – 9.3 2007 ............................................................... 4.43 4.36 4.17 4.16 9.2 8.9 8.6 8.5 2008 ............................................................... 4.19 4.16 4.18 3.92 8.4 8.3 8.4 8.3 2009 ............................................................... 4.00 4.03 4.09 3.80 8.3 8.3 8.3 8.1 2010 ............................................................... 3.90 3.96 4.05 3.91 8.1 8.1 8.2 8.2
2011 ............................................................... 3.94 3.93 3.90 3.98 8.2 8.1 8.1 8.4 2012 ............................................................... 4.04 4.04 3.97 4.08 8.3 8.2 8.0 8.1 2013 ............................................................... 4.18 4.24 4.27 4.17 8.2 8.3 8.3 8.1 2014 ............................................................... 4.29 4.24 4.64 4.70 8.2 8.1 8.5 8.3 2015 ............................................................... 4.85 4.80 4.83 4.47 8.4 8.3 8.4 8.1 2016 ............................................................... 4.61 4.59 4.75 4.79 8.2 8.1 8.2 8.2 2017 ............................................................... 4.91 – – – 8.2 – – –
Supplemental pay 2006 ............................................................... – – – 1.01 – – – 2.1 2007 ............................................................... 1.04 1.19 1.15 1.18 2.2 2.4 2.4 2.4 2008 ............................................................... 1.38 1.31 1.32 1.21 2.8 2.6 2.6 2.5 2009 ............................................................... 1.14 1.15 1.15 1.06 2.4 2.4 2.3 2.3 2010 ............................................................... 1.05 1.04 1.05 1.03 2.2 2.1 2.1 2.2
2011 ............................................................... 1.24 1.29 1.28 1.28 2.6 2.7 2.6 2.7 2012 ............................................................... 1.74 1.67 1.70 1.62 3.6 3.4 3.4 3.2 2013 ............................................................... 1.64 1.57 1.58 1.77 3.2 3.1 3.1 3.5 2014 ............................................................... 1.78 1.77 1.82 1.90 3.4 3.4 3.3 3.4 2015 ............................................................... 1.94 1.75 1.75 1.76 3.3 3.0 3.0 3.2 2016 ............................................................... 1.77 1.73 1.81 1.82 3.1 3.1 3.1 3.1
See footnotes at end of table.
-185-

Supplemental table 16. Private transportation and warehousing industry workers, by bargaining status: employer costsper hours worked for employee compensation and costs as a percentage of total compensation, 2006-2017
Union workers
Compensationcomponent
Cost per hour worked Percent of total compensation
Mar. June Sep. Dec. Mar. June Sep. Dec.
Supplemental pay 2017 ............................................................... 1.89 – – – 3.2 – – –
Insurance 2006 ............................................................... – – – 5.09 – – – 10.6 2007 ............................................................... 5.48 5.36 5.31 5.31 11.3 11.0 10.9 10.9 2008 ............................................................... 5.51 5.56 5.55 5.38 11.0 11.2 11.1 11.4 2009 ............................................................... 5.61 5.65 5.68 5.59 11.6 11.7 11.6 11.9 2010 ............................................................... 6.00 6.42 6.52 6.71 12.5 13.2 13.1 14.2
2011 ............................................................... 6.84 6.86 6.87 6.78 14.2 14.2 14.2 14.3 2012 ............................................................... 7.05 6.99 7.03 7.20 14.5 14.3 14.2 14.4 2013 ............................................................... 7.28 7.31 7.31 7.19 14.2 14.2 14.1 14.0 2014 ............................................................... 7.30 7.18 7.23 7.16 13.9 13.8 13.3 12.7 2015 ............................................................... 7.30 7.55 7.54 7.31 12.6 13.1 13.1 13.2 2016 ............................................................... 7.44 7.66 7.85 7.53 13.2 13.6 13.6 12.9 2017 ............................................................... 7.65 – – – 12.8 – – –
Retirement and savings 2006 ............................................................... – – – 3.98 – – – 8.3 2007 ............................................................... 3.96 4.21 4.18 4.17 8.2 8.6 8.6 8.6 2008 ............................................................... 4.46 4.46 4.33 3.89 8.9 8.9 8.7 8.2 2009 ............................................................... 3.82 3.83 3.87 3.75 7.9 7.9 7.9 8.0 2010 ............................................................... 3.76 3.67 3.75 3.26 7.8 7.5 7.6 6.9
2011 ............................................................... 3.48 3.39 3.39 3.14 7.2 7.0 7.0 6.6 2012 ............................................................... 3.13 3.17 3.16 3.36 6.4 6.5 6.4 6.7 2013 ............................................................... 3.43 3.40 3.40 3.41 6.7 6.6 6.6 6.7 2014 ............................................................... 3.54 3.44 3.63 4.14 6.7 6.6 6.7 7.3 2015 ............................................................... 4.34 4.27 4.34 4.63 7.5 7.4 7.5 8.4 2016 ............................................................... 4.70 4.80 4.91 5.02 8.3 8.5 8.5 8.6 2017 ............................................................... 5.10 – – – 8.6 – – –
Legally required benefits 2006 ............................................................... – – – 4.30 – – – 8.9 2007 ............................................................... 4.10 4.17 4.17 4.17 8.5 8.5 8.6 8.6 2008 ............................................................... 4.25 4.22 4.14 3.91 8.5 8.5 8.3 8.3 2009 ............................................................... 4.01 3.99 4.01 3.86 8.3 8.2 8.2 8.2 2010 ............................................................... 3.92 3.96 3.99 3.83 8.2 8.1 8.1 8.1
2011 ............................................................... 3.88 3.97 4.01 3.97 8.1 8.2 8.3 8.4 2012 ............................................................... 4.05 4.08 4.12 4.15 8.4 8.3 8.3 8.3 2013 ............................................................... 4.19 4.23 4.27 4.25 8.2 8.2 8.3 8.3 2014 ............................................................... 4.31 4.42 4.60 4.66 8.2 8.5 8.5 8.3 2015 ............................................................... 4.76 4.67 4.66 4.48 8.2 8.1 8.1 8.1 2016 ............................................................... 4.47 4.40 4.45 4.53 7.9 7.8 7.7 7.8 2017 ............................................................... 4.66 – – – 7.8 – – –
Note: The sum of individual items may not equal totals due to rounding. Dashes indicate data are not available.
-186-
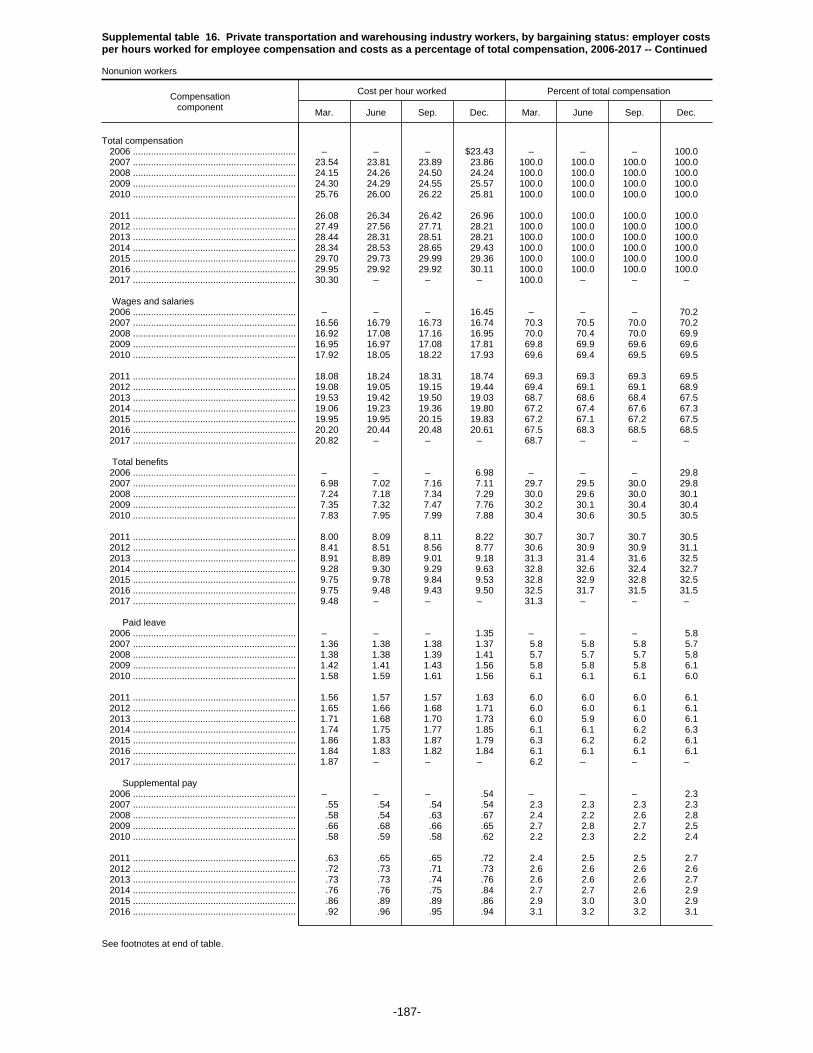
Supplemental table 16. Private transportation and warehousing industry workers, by bargaining status: employer costsper hours worked for employee compensation and costs as a percentage of total compensation, 2006-2017 -- Continued
Nonunion workers
Compensationcomponent
Cost per hour worked Percent of total compensation
Mar. June Sep. Dec. Mar. June Sep. Dec.
Total compensation 2006 ............................................................... – – – $23.43 – – – 100.0 2007 ............................................................... 23.54 23.81 23.89 23.86 100.0 100.0 100.0 100.0 2008 ............................................................... 24.15 24.26 24.50 24.24 100.0 100.0 100.0 100.0 2009 ............................................................... 24.30 24.29 24.55 25.57 100.0 100.0 100.0 100.0 2010 ............................................................... 25.76 26.00 26.22 25.81 100.0 100.0 100.0 100.0
2011 ............................................................... 26.08 26.34 26.42 26.96 100.0 100.0 100.0 100.0 2012 ............................................................... 27.49 27.56 27.71 28.21 100.0 100.0 100.0 100.0 2013 ............................................................... 28.44 28.31 28.51 28.21 100.0 100.0 100.0 100.0 2014 ............................................................... 28.34 28.53 28.65 29.43 100.0 100.0 100.0 100.0 2015 ............................................................... 29.70 29.73 29.99 29.36 100.0 100.0 100.0 100.0 2016 ............................................................... 29.95 29.92 29.92 30.11 100.0 100.0 100.0 100.0 2017 ............................................................... 30.30 – – – 100.0 – – –
Wages and salaries 2006 ............................................................... – – – 16.45 – – – 70.2 2007 ............................................................... 16.56 16.79 16.73 16.74 70.3 70.5 70.0 70.2 2008 ............................................................... 16.92 17.08 17.16 16.95 70.0 70.4 70.0 69.9 2009 ............................................................... 16.95 16.97 17.08 17.81 69.8 69.9 69.6 69.6 2010 ............................................................... 17.92 18.05 18.22 17.93 69.6 69.4 69.5 69.5
2011 ............................................................... 18.08 18.24 18.31 18.74 69.3 69.3 69.3 69.5 2012 ............................................................... 19.08 19.05 19.15 19.44 69.4 69.1 69.1 68.9 2013 ............................................................... 19.53 19.42 19.50 19.03 68.7 68.6 68.4 67.5 2014 ............................................................... 19.06 19.23 19.36 19.80 67.2 67.4 67.6 67.3 2015 ............................................................... 19.95 19.95 20.15 19.83 67.2 67.1 67.2 67.5 2016 ............................................................... 20.20 20.44 20.48 20.61 67.5 68.3 68.5 68.5 2017 ............................................................... 20.82 – – – 68.7 – – –
Total benefits 2006 ............................................................... – – – 6.98 – – – 29.8 2007 ............................................................... 6.98 7.02 7.16 7.11 29.7 29.5 30.0 29.8 2008 ............................................................... 7.24 7.18 7.34 7.29 30.0 29.6 30.0 30.1 2009 ............................................................... 7.35 7.32 7.47 7.76 30.2 30.1 30.4 30.4 2010 ............................................................... 7.83 7.95 7.99 7.88 30.4 30.6 30.5 30.5
2011 ............................................................... 8.00 8.09 8.11 8.22 30.7 30.7 30.7 30.5 2012 ............................................................... 8.41 8.51 8.56 8.77 30.6 30.9 30.9 31.1 2013 ............................................................... 8.91 8.89 9.01 9.18 31.3 31.4 31.6 32.5 2014 ............................................................... 9.28 9.30 9.29 9.63 32.8 32.6 32.4 32.7 2015 ............................................................... 9.75 9.78 9.84 9.53 32.8 32.9 32.8 32.5 2016 ............................................................... 9.75 9.48 9.43 9.50 32.5 31.7 31.5 31.5 2017 ............................................................... 9.48 – – – 31.3 – – –
Paid leave 2006 ............................................................... – – – 1.35 – – – 5.8 2007 ............................................................... 1.36 1.38 1.38 1.37 5.8 5.8 5.8 5.7 2008 ............................................................... 1.38 1.38 1.39 1.41 5.7 5.7 5.7 5.8 2009 ............................................................... 1.42 1.41 1.43 1.56 5.8 5.8 5.8 6.1 2010 ............................................................... 1.58 1.59 1.61 1.56 6.1 6.1 6.1 6.0
2011 ............................................................... 1.56 1.57 1.57 1.63 6.0 6.0 6.0 6.1 2012 ............................................................... 1.65 1.66 1.68 1.71 6.0 6.0 6.1 6.1 2013 ............................................................... 1.71 1.68 1.70 1.73 6.0 5.9 6.0 6.1 2014 ............................................................... 1.74 1.75 1.77 1.85 6.1 6.1 6.2 6.3 2015 ............................................................... 1.86 1.83 1.87 1.79 6.3 6.2 6.2 6.1 2016 ............................................................... 1.84 1.83 1.82 1.84 6.1 6.1 6.1 6.1 2017 ............................................................... 1.87 – – – 6.2 – – –
Supplemental pay 2006 ............................................................... – – – .54 – – – 2.3 2007 ............................................................... .55 .54 .54 .54 2.3 2.3 2.3 2.3 2008 ............................................................... .58 .54 .63 .67 2.4 2.2 2.6 2.8 2009 ............................................................... .66 .68 .66 .65 2.7 2.8 2.7 2.5 2010 ............................................................... .58 .59 .58 .62 2.2 2.3 2.2 2.4
2011 ............................................................... .63 .65 .65 .72 2.4 2.5 2.5 2.7 2012 ............................................................... .72 .73 .71 .73 2.6 2.6 2.6 2.6 2013 ............................................................... .73 .73 .74 .76 2.6 2.6 2.6 2.7 2014 ............................................................... .76 .76 .75 .84 2.7 2.7 2.6 2.9 2015 ............................................................... .86 .89 .89 .86 2.9 3.0 3.0 2.9 2016 ............................................................... .92 .96 .95 .94 3.1 3.2 3.2 3.1
See footnotes at end of table.
-187-
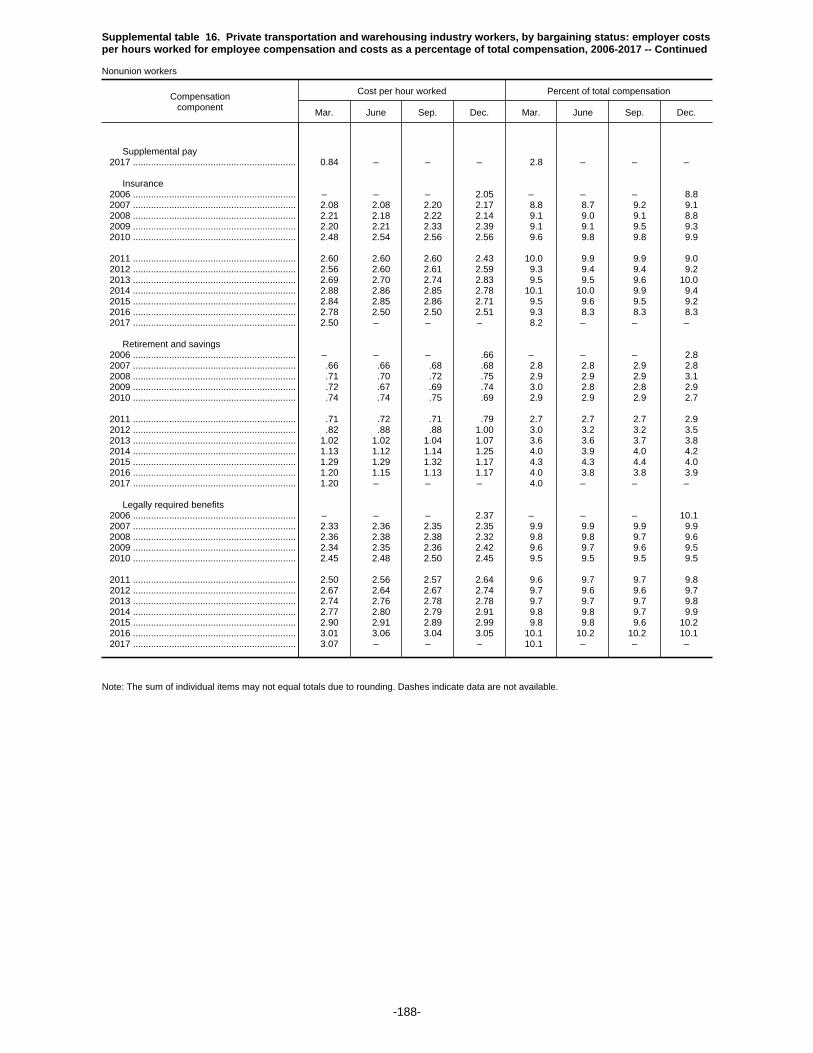
Supplemental table 16. Private transportation and warehousing industry workers, by bargaining status: employer costsper hours worked for employee compensation and costs as a percentage of total compensation, 2006-2017 -- Continued
Nonunion workers
Compensationcomponent
Cost per hour worked Percent of total compensation
Mar. June Sep. Dec. Mar. June Sep. Dec.
Supplemental pay 2017 ............................................................... 0.84 – – – 2.8 – – –
Insurance 2006 ............................................................... – – – 2.05 – – – 8.8 2007 ............................................................... 2.08 2.08 2.20 2.17 8.8 8.7 9.2 9.1 2008 ............................................................... 2.21 2.18 2.22 2.14 9.1 9.0 9.1 8.8 2009 ............................................................... 2.20 2.21 2.33 2.39 9.1 9.1 9.5 9.3 2010 ............................................................... 2.48 2.54 2.56 2.56 9.6 9.8 9.8 9.9
2011 ............................................................... 2.60 2.60 2.60 2.43 10.0 9.9 9.9 9.0 2012 ............................................................... 2.56 2.60 2.61 2.59 9.3 9.4 9.4 9.2 2013 ............................................................... 2.69 2.70 2.74 2.83 9.5 9.5 9.6 10.0 2014 ............................................................... 2.88 2.86 2.85 2.78 10.1 10.0 9.9 9.4 2015 ............................................................... 2.84 2.85 2.86 2.71 9.5 9.6 9.5 9.2 2016 ............................................................... 2.78 2.50 2.50 2.51 9.3 8.3 8.3 8.3 2017 ............................................................... 2.50 – – – 8.2 – – –
Retirement and savings 2006 ............................................................... – – – .66 – – – 2.8 2007 ............................................................... .66 .66 .68 .68 2.8 2.8 2.9 2.8 2008 ............................................................... .71 .70 .72 .75 2.9 2.9 2.9 3.1 2009 ............................................................... .72 .67 .69 .74 3.0 2.8 2.8 2.9 2010 ............................................................... .74 .74 .75 .69 2.9 2.9 2.9 2.7
2011 ............................................................... .71 .72 .71 .79 2.7 2.7 2.7 2.9 2012 ............................................................... .82 .88 .88 1.00 3.0 3.2 3.2 3.5 2013 ............................................................... 1.02 1.02 1.04 1.07 3.6 3.6 3.7 3.8 2014 ............................................................... 1.13 1.12 1.14 1.25 4.0 3.9 4.0 4.2 2015 ............................................................... 1.29 1.29 1.32 1.17 4.3 4.3 4.4 4.0 2016 ............................................................... 1.20 1.15 1.13 1.17 4.0 3.8 3.8 3.9 2017 ............................................................... 1.20 – – – 4.0 – – –
Legally required benefits 2006 ............................................................... – – – 2.37 – – – 10.1 2007 ............................................................... 2.33 2.36 2.35 2.35 9.9 9.9 9.9 9.9 2008 ............................................................... 2.36 2.38 2.38 2.32 9.8 9.8 9.7 9.6 2009 ............................................................... 2.34 2.35 2.36 2.42 9.6 9.7 9.6 9.5 2010 ............................................................... 2.45 2.48 2.50 2.45 9.5 9.5 9.5 9.5
2011 ............................................................... 2.50 2.56 2.57 2.64 9.6 9.7 9.7 9.8 2012 ............................................................... 2.67 2.64 2.67 2.74 9.7 9.6 9.6 9.7 2013 ............................................................... 2.74 2.76 2.78 2.78 9.7 9.7 9.7 9.8 2014 ............................................................... 2.77 2.80 2.79 2.91 9.8 9.8 9.7 9.9 2015 ............................................................... 2.90 2.91 2.89 2.99 9.8 9.8 9.6 10.2 2016 ............................................................... 3.01 3.06 3.04 3.05 10.1 10.2 10.2 10.1 2017 ............................................................... 3.07 – – – 10.1 – – –
Note: The sum of individual items may not equal totals due to rounding. Dashes indicate data are not available.
-188-

Supplemental table 17. Private information industry workers, by occupational group: employer costs per hours workedfor employee compensation and costs as a percentage of total compensation, 2006-2017
All workers
Compensationcomponent
Cost per hour worked Percent of total compensation
Mar. June Sep. Dec. Mar. June Sep. Dec.
Total compensation 2006 ............................................................... – – – $38.31 – – – 100.0 2007 ............................................................... 38.62 39.10 39.11 39.48 100.0 100.0 100.0 100.0 2008 ............................................................... 39.46 38.92 39.53 40.47 100.0 100.0 100.0 100.0 2009 ............................................................... 40.74 40.75 40.97 41.22 100.0 100.0 100.0 100.0 2010 ............................................................... 41.25 41.90 42.06 41.77 100.0 100.0 100.0 100.0
2011 ............................................................... 42.35 42.73 42.74 43.10 100.0 100.0 100.0 100.0 2012 ............................................................... 44.44 45.08 45.05 46.30 100.0 100.0 100.0 100.0 2013 ............................................................... 46.58 47.15 47.29 47.97 100.0 100.0 100.0 100.0 2014 ............................................................... 48.82 51.68 51.77 55.44 100.0 100.0 100.0 100.0 2015 ............................................................... 55.99 53.26 53.03 53.09 100.0 100.0 100.0 100.0 2016 ............................................................... 53.35 53.50 53.20 54.10 100.0 100.0 100.0 100.0 2017 ............................................................... 54.36 – – – 100.0 – – –
Wages and salaries 2006 ............................................................... – – – 26.18 – – – 68.3 2007 ............................................................... 26.42 26.75 26.76 26.96 68.4 68.4 68.4 68.3 2008 ............................................................... 26.96 26.93 27.32 27.82 68.3 69.2 69.1 68.7 2009 ............................................................... 27.88 28.03 28.20 28.26 68.4 68.8 68.8 68.5 2010 ............................................................... 28.20 28.67 28.82 28.59 68.4 68.4 68.5 68.4
2011 ............................................................... 28.93 29.10 29.14 29.16 68.3 68.1 68.2 67.7 2012 ............................................................... 29.48 29.79 29.77 30.32 66.3 66.1 66.1 65.5 2013 ............................................................... 30.52 30.85 30.90 31.88 65.5 65.4 65.3 66.5 2014 ............................................................... 32.36 32.59 32.60 34.31 66.3 63.1 63.0 61.9 2015 ............................................................... 34.43 34.71 34.44 34.64 61.5 65.2 65.0 65.2 2016 ............................................................... 34.96 35.35 35.35 35.69 65.5 66.1 66.5 66.0 2017 ............................................................... 35.71 – – – 65.7 – – –
Total benefits 2006 ............................................................... – – – 12.13 – – – 31.7 2007 ............................................................... 12.19 12.35 12.35 12.53 31.6 31.6 31.6 31.7 2008 ............................................................... 12.50 11.99 12.21 12.65 31.7 30.8 30.9 31.3 2009 ............................................................... 12.86 12.71 12.77 12.97 31.6 31.2 31.2 31.5 2010 ............................................................... 13.05 13.23 13.25 13.19 31.6 31.6 31.5 31.6
2011 ............................................................... 13.42 13.63 13.60 13.94 31.7 31.9 31.8 32.3 2012 ............................................................... 14.97 15.29 15.29 15.97 33.7 33.9 33.9 34.5 2013 ............................................................... 16.06 16.30 16.39 16.08 34.5 34.6 34.7 33.5 2014 ............................................................... 16.45 19.09 19.17 21.13 33.7 36.9 37.0 38.1 2015 ............................................................... 21.56 18.55 18.59 18.45 38.5 34.8 35.0 34.8 2016 ............................................................... 18.39 18.15 17.85 18.41 34.5 33.9 33.5 34.0 2017 ............................................................... 18.64 – – – 34.3 – – –
Paid leave 2006 ............................................................... – – – 3.58 – – – 9.3 2007 ............................................................... 3.57 3.62 3.63 3.66 9.3 9.3 9.3 9.3 2008 ............................................................... 3.62 3.56 3.61 3.67 9.2 9.1 9.1 9.1 2009 ............................................................... 3.78 3.78 3.81 3.83 9.3 9.3 9.3 9.3 2010 ............................................................... 3.81 3.89 3.91 3.87 9.2 9.3 9.3 9.3
2011 ............................................................... 3.90 3.91 3.91 3.92 9.2 9.2 9.2 9.1 2012 ............................................................... 3.94 3.98 3.98 4.12 8.9 8.8 8.8 8.9 2013 ............................................................... 4.15 4.20 4.25 4.38 8.9 8.9 9.0 9.1 2014 ............................................................... 4.49 4.53 4.54 4.82 9.2 8.8 8.8 8.7 2015 ............................................................... 4.86 4.88 4.85 4.87 8.7 9.2 9.1 9.2 2016 ............................................................... 4.90 4.92 4.83 4.97 9.2 9.2 9.1 9.2 2017 ............................................................... 5.00 – – – 9.2 – – –
Supplemental pay 2006 ............................................................... – – – 1.00 – – – 2.6 2007 ............................................................... 1.02 1.09 1.09 1.09 2.6 2.8 2.8 2.8 2008 ............................................................... 1.10 1.01 .99 1.11 2.8 2.6 2.5 2.8 2009 ............................................................... 1.08 1.08 1.07 1.13 2.7 2.7 2.6 2.7 2010 ............................................................... 1.09 1.00 .99 1.01 2.7 2.4 2.4 2.4
2011 ............................................................... 1.08 1.15 1.16 1.37 2.6 2.7 2.7 3.2 2012 ............................................................... 1.31 1.35 1.34 1.50 3.0 3.0 3.0 3.2 2013 ............................................................... 1.46 1.46 1.46 1.71 3.1 3.1 3.1 3.6 2014 ............................................................... 1.79 1.86 1.85 2.42 3.7 3.6 3.6 4.4 2015 ............................................................... 2.84 2.22 2.19 2.32 5.1 4.2 4.1 4.4 2016 ............................................................... 2.27 2.25 2.39 2.31 4.3 4.2 4.5 4.3
See footnotes at end of table.
-189-

Supplemental table 17. Private information industry workers, by occupational group: employer costs per hours workedfor employee compensation and costs as a percentage of total compensation, 2006-2017
All workers
Compensationcomponent
Cost per hour worked Percent of total compensation
Mar. June Sep. Dec. Mar. June Sep. Dec.
Supplemental pay 2017 ............................................................... 2.36 – – – 4.3 – – –
Insurance 2006 ............................................................... – – – 3.11 – – – 8.1 2007 ............................................................... 3.16 3.17 3.15 3.17 8.2 8.1 8.0 8.0 2008 ............................................................... 3.19 3.16 3.25 3.34 8.1 8.1 8.2 8.2 2009 ............................................................... 3.47 3.55 3.60 3.65 8.5 8.7 8.8 8.9 2010 ............................................................... 3.74 3.80 3.79 3.85 9.1 9.1 9.0 9.2
2011 ............................................................... 3.95 4.02 4.02 4.13 9.3 9.4 9.4 9.6 2012 ............................................................... 4.18 4.23 4.29 4.45 9.4 9.4 9.5 9.6 2013 ............................................................... 4.51 4.58 4.62 4.78 9.7 9.7 9.8 10.0 2014 ............................................................... 4.93 4.97 5.00 5.20 10.1 9.6 9.7 9.4 2015 ............................................................... 5.14 5.15 5.20 5.18 9.2 9.7 9.8 9.8 2016 ............................................................... 5.18 5.14 4.99 5.25 9.7 9.6 9.4 9.7 2017 ............................................................... 5.29 – – – 9.7 – – –
Retirement and savings 2006 ............................................................... – – – 1.73 – – – 4.5 2007 ............................................................... 1.70 1.70 1.72 1.81 4.4 4.3 4.4 4.6 2008 ............................................................... 1.80 1.49 1.55 1.67 4.6 3.8 3.9 4.1 2009 ............................................................... 1.67 1.43 1.43 1.47 4.1 3.5 3.5 3.6 2010 ............................................................... 1.50 1.63 1.64 1.58 3.6 3.9 3.9 3.8
2011 ............................................................... 1.57 1.59 1.51 1.52 3.7 3.7 3.5 3.5 2012 ............................................................... 2.50 2.64 2.58 2.73 5.6 5.9 5.7 5.9 2013 ............................................................... 2.76 2.86 2.83 1.91 5.9 6.1 6.0 4.0 2014 ............................................................... 1.87 4.35 4.39 5.15 3.8 8.4 8.5 9.3 2015 ............................................................... 5.17 2.75 2.80 2.54 9.2 5.2 5.3 4.8 2016 ............................................................... 2.51 2.31 2.17 2.34 4.7 4.3 4.1 4.3 2017 ............................................................... 2.43 – – – 4.5 – – –
Legally required benefits 2006 ............................................................... – – – 2.71 – – – 7.1 2007 ............................................................... 2.73 2.77 2.77 2.79 7.1 7.1 7.1 7.1 2008 ............................................................... 2.79 2.78 2.80 2.86 7.1 7.1 7.1 7.1 2009 ............................................................... 2.86 2.86 2.87 2.88 7.0 7.0 7.0 7.0 2010 ............................................................... 2.90 2.91 2.91 2.89 7.0 6.9 6.9 6.9
2011 ............................................................... 2.92 2.97 3.00 3.00 6.9 6.9 7.0 7.0 2012 ............................................................... 3.03 3.09 3.09 3.17 6.8 6.9 6.9 6.9 2013 ............................................................... 3.19 3.21 3.23 3.30 6.8 6.8 6.8 6.9 2014 ............................................................... 3.37 3.39 3.39 3.53 6.9 6.6 6.5 6.4 2015 ............................................................... 3.55 3.55 3.54 3.53 6.3 6.7 6.7 6.7 2016 ............................................................... 3.53 3.53 3.48 3.54 6.6 6.6 6.5 6.5 2017 ............................................................... 3.58 – – – 6.6 – – –
Note: The sum of individual items may not equal totals due to rounding. Dashes indicate data are not available.
-190-

Supplemental table 17. Private information industry workers, by occupational group: employer costs per hours workedfor employee compensation and costs as a percentage of total compensation, 2006-2017 -- Continued
Management, professional, and related occupations1
Compensationcomponent
Cost per hour worked Percent of total compensation
Mar. June Sep. Dec. Mar. June Sep. Dec.
Total compensation 2006 ............................................................... – – – $48.10 – – – 100.0 2007 ............................................................... 48.54 49.01 48.93 49.13 100.0 100.0 100.0 100.0 2008 ............................................................... 49.03 49.02 49.03 50.84 100.0 100.0 100.0 100.0 2009 ............................................................... 51.06 51.29 51.42 51.34 100.0 100.0 100.0 100.0 2010 ............................................................... 51.52 52.38 52.53 53.02 100.0 100.0 100.0 100.0
2011 ............................................................... 53.79 54.42 54.40 53.11 100.0 100.0 100.0 100.0 2012 ............................................................... 54.68 55.36 55.08 56.52 100.0 100.0 100.0 100.0 2013 ............................................................... 57.00 57.60 57.80 58.83 100.0 100.0 100.0 100.0 2014 ............................................................... 59.37 62.91 63.28 67.99 100.0 100.0 100.0 100.0 2015 ............................................................... 69.11 65.18 64.87 65.33 100.0 100.0 100.0 100.0 2016 ............................................................... 65.86 65.96 65.72 66.62 100.0 100.0 100.0 100.0 2017 ............................................................... 67.21 – – – 100.0 – – –
Wages and salaries 2006 ............................................................... – – – 33.69 – – – 70.0 2007 ............................................................... 34.06 34.41 34.38 34.46 70.2 70.2 70.3 70.1 2008 ............................................................... 34.45 34.70 34.73 35.89 70.3 70.8 70.8 70.6 2009 ............................................................... 35.95 36.17 36.28 35.94 70.4 70.5 70.5 70.0 2010 ............................................................... 35.99 36.73 36.87 36.98 69.9 70.1 70.2 69.7
2011 ............................................................... 37.43 37.72 37.82 36.57 69.6 69.3 69.5 68.9 2012 ............................................................... 37.23 37.67 37.44 38.15 68.1 68.0 68.0 67.5 2013 ............................................................... 38.47 38.88 38.99 40.15 67.5 67.5 67.5 68.2 2014 ............................................................... 40.40 40.99 41.14 43.22 68.0 65.2 65.0 63.6 2015 ............................................................... 43.32 43.50 43.17 43.14 62.7 66.7 66.6 66.0 2016 ............................................................... 43.68 43.99 44.13 44.44 66.3 66.7 67.2 66.7 2017 ............................................................... 44.58 – – – 66.3 – – –
Total benefits 2006 ............................................................... – – – 14.41 – – – 30.0 2007 ............................................................... 14.48 14.60 14.55 14.68 29.8 29.8 29.7 29.9 2008 ............................................................... 14.58 14.32 14.30 14.96 29.7 29.2 29.2 29.4 2009 ............................................................... 15.11 15.12 15.14 15.39 29.6 29.5 29.5 30.0 2010 ............................................................... 15.53 15.64 15.67 16.05 30.1 29.9 29.8 30.3
2011 ............................................................... 16.36 16.70 16.58 16.54 30.4 30.7 30.5 31.1 2012 ............................................................... 17.46 17.69 17.65 18.37 31.9 32.0 32.0 32.5 2013 ............................................................... 18.53 18.72 18.81 18.68 32.5 32.5 32.5 31.8 2014 ............................................................... 18.97 21.92 22.14 24.77 32.0 34.8 35.0 36.4 2015 ............................................................... 25.79 21.68 21.70 22.18 37.3 33.3 33.4 34.0 2016 ............................................................... 22.17 21.96 21.59 22.18 33.7 33.3 32.8 33.3 2017 ............................................................... 22.63 – – – 33.7 – – –
Paid leave 2006 ............................................................... – – – 4.77 – – – 9.9 2007 ............................................................... 4.78 4.82 4.82 4.86 9.8 9.8 9.8 9.9 2008 ............................................................... 4.79 4.72 4.72 4.97 9.8 9.6 9.6 9.8 2009 ............................................................... 5.05 5.05 5.05 5.02 9.9 9.8 9.8 9.8 2010 ............................................................... 5.00 5.13 5.16 5.16 9.7 9.8 9.8 9.7
2011 ............................................................... 5.23 5.25 5.25 5.07 9.7 9.7 9.6 9.5 2012 ............................................................... 5.18 5.24 5.21 5.39 9.5 9.5 9.5 9.5 2013 ............................................................... 5.44 5.49 5.53 5.65 9.5 9.5 9.6 9.6 2014 ............................................................... 5.75 5.85 5.89 6.32 9.7 9.3 9.3 9.3 2015 ............................................................... 6.36 6.35 6.35 6.29 9.2 9.7 9.8 9.6 2016 ............................................................... 6.36 6.38 6.23 6.39 9.7 9.7 9.5 9.6 2017 ............................................................... 6.44 – – – 9.6 – – –
Supplemental pay 2006 ............................................................... – – – 1.27 – – – 2.6 2007 ............................................................... 1.31 1.35 1.35 1.35 2.7 2.8 2.8 2.8 2008 ............................................................... 1.37 1.32 1.25 1.34 2.8 2.7 2.5 2.6 2009 ............................................................... 1.32 1.33 1.33 1.40 2.6 2.6 2.6 2.7 2010 ............................................................... 1.34 1.21 1.19 1.26 2.6 2.3 2.3 2.4
2011 ............................................................... 1.40 1.54 1.52 1.73 2.6 2.8 2.8 3.3 2012 ............................................................... 1.75 1.79 1.76 1.82 3.2 3.2 3.2 3.2 2013 ............................................................... 1.77 1.79 1.78 2.07 3.1 3.1 3.1 3.5 2014 ............................................................... 2.12 2.25 2.25 3.25 3.6 3.6 3.6 4.8 2015 ............................................................... 4.12 2.80 2.71 3.17 6.0 4.3 4.2 4.8 2016 ............................................................... 3.09 3.09 3.17 3.15 4.7 4.7 4.8 4.7
See footnotes at end of table.
-191-
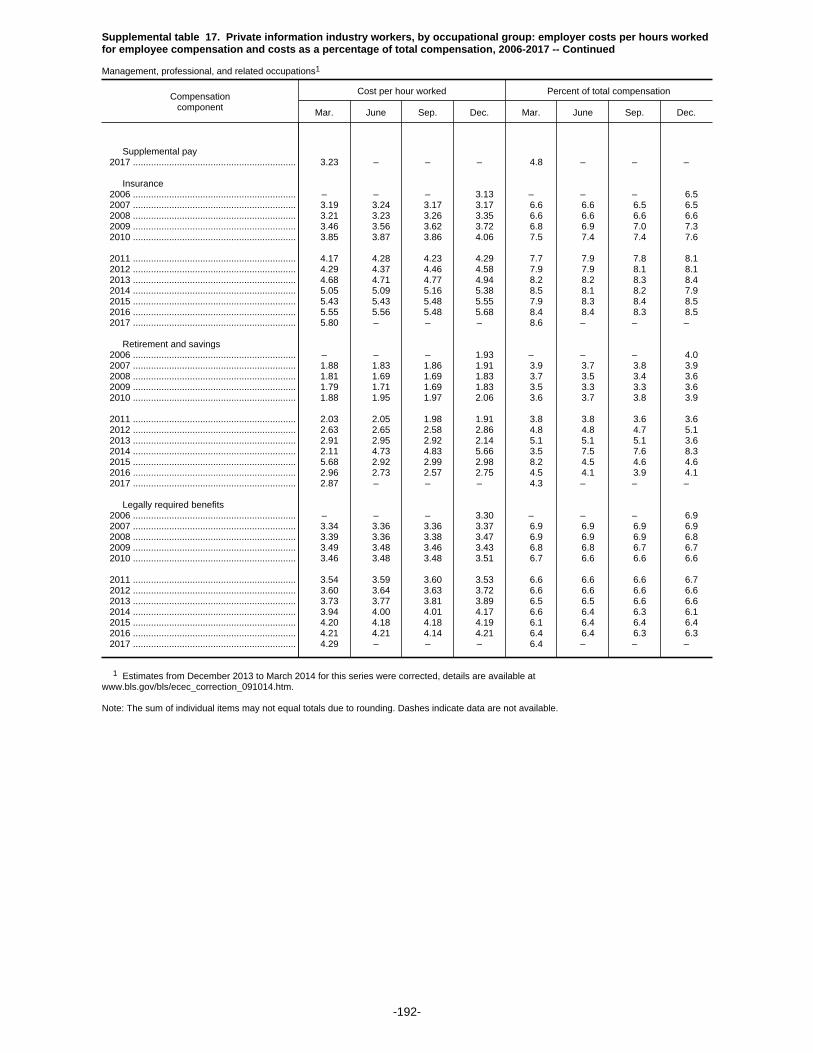
Supplemental table 17. Private information industry workers, by occupational group: employer costs per hours workedfor employee compensation and costs as a percentage of total compensation, 2006-2017 -- Continued
Management, professional, and related occupations1
Compensationcomponent
Cost per hour worked Percent of total compensation
Mar. June Sep. Dec. Mar. June Sep. Dec.
Supplemental pay 2017 ............................................................... 3.23 – – – 4.8 – – –
Insurance 2006 ............................................................... – – – 3.13 – – – 6.5 2007 ............................................................... 3.19 3.24 3.17 3.17 6.6 6.6 6.5 6.5 2008 ............................................................... 3.21 3.23 3.26 3.35 6.6 6.6 6.6 6.6 2009 ............................................................... 3.46 3.56 3.62 3.72 6.8 6.9 7.0 7.3 2010 ............................................................... 3.85 3.87 3.86 4.06 7.5 7.4 7.4 7.6
2011 ............................................................... 4.17 4.28 4.23 4.29 7.7 7.9 7.8 8.1 2012 ............................................................... 4.29 4.37 4.46 4.58 7.9 7.9 8.1 8.1 2013 ............................................................... 4.68 4.71 4.77 4.94 8.2 8.2 8.3 8.4 2014 ............................................................... 5.05 5.09 5.16 5.38 8.5 8.1 8.2 7.9 2015 ............................................................... 5.43 5.43 5.48 5.55 7.9 8.3 8.4 8.5 2016 ............................................................... 5.55 5.56 5.48 5.68 8.4 8.4 8.3 8.5 2017 ............................................................... 5.80 – – – 8.6 – – –
Retirement and savings 2006 ............................................................... – – – 1.93 – – – 4.0 2007 ............................................................... 1.88 1.83 1.86 1.91 3.9 3.7 3.8 3.9 2008 ............................................................... 1.81 1.69 1.69 1.83 3.7 3.5 3.4 3.6 2009 ............................................................... 1.79 1.71 1.69 1.83 3.5 3.3 3.3 3.6 2010 ............................................................... 1.88 1.95 1.97 2.06 3.6 3.7 3.8 3.9
2011 ............................................................... 2.03 2.05 1.98 1.91 3.8 3.8 3.6 3.6 2012 ............................................................... 2.63 2.65 2.58 2.86 4.8 4.8 4.7 5.1 2013 ............................................................... 2.91 2.95 2.92 2.14 5.1 5.1 5.1 3.6 2014 ............................................................... 2.11 4.73 4.83 5.66 3.5 7.5 7.6 8.3 2015 ............................................................... 5.68 2.92 2.99 2.98 8.2 4.5 4.6 4.6 2016 ............................................................... 2.96 2.73 2.57 2.75 4.5 4.1 3.9 4.1 2017 ............................................................... 2.87 – – – 4.3 – – –
Legally required benefits 2006 ............................................................... – – – 3.30 – – – 6.9 2007 ............................................................... 3.34 3.36 3.36 3.37 6.9 6.9 6.9 6.9 2008 ............................................................... 3.39 3.36 3.38 3.47 6.9 6.9 6.9 6.8 2009 ............................................................... 3.49 3.48 3.46 3.43 6.8 6.8 6.7 6.7 2010 ............................................................... 3.46 3.48 3.48 3.51 6.7 6.6 6.6 6.6
2011 ............................................................... 3.54 3.59 3.60 3.53 6.6 6.6 6.6 6.7 2012 ............................................................... 3.60 3.64 3.63 3.72 6.6 6.6 6.6 6.6 2013 ............................................................... 3.73 3.77 3.81 3.89 6.5 6.5 6.6 6.6 2014 ............................................................... 3.94 4.00 4.01 4.17 6.6 6.4 6.3 6.1 2015 ............................................................... 4.20 4.18 4.18 4.19 6.1 6.4 6.4 6.4 2016 ............................................................... 4.21 4.21 4.14 4.21 6.4 6.4 6.3 6.3 2017 ............................................................... 4.29 – – – 6.4 – – –
1 Estimates from December 2013 to March 2014 for this series were corrected, details are available atwww.bls.gov/bls/ecec_correction_091014.htm.
Note: The sum of individual items may not equal totals due to rounding. Dashes indicate data are not available.
-192-

Supplemental table 17. Private information industry workers, by occupational group: employer costs per hours workedfor employee compensation and costs as a percentage of total compensation, 2006-2017 -- Continued
Professional and related occupations1
Compensationcomponent
Cost per hour worked Percent of total compensation
Mar. June Sep. Dec. Mar. June Sep. Dec.
Total compensation 2006 ............................................................... – – – $45.39 – – – 100.0 2007 ............................................................... 45.58 45.97 45.82 46.21 100.0 100.0 100.0 100.0 2008 ............................................................... 46.24 46.46 45.91 47.62 100.0 100.0 100.0 100.0 2009 ............................................................... 47.97 48.39 48.44 47.62 100.0 100.0 100.0 100.0 2010 ............................................................... 47.72 48.75 48.82 49.03 100.0 100.0 100.0 100.0
2011 ............................................................... 49.77 50.54 50.38 49.27 100.0 100.0 100.0 100.0 2012 ............................................................... 51.11 51.81 51.53 52.97 100.0 100.0 100.0 100.0 2013 ............................................................... 53.35 54.00 54.17 55.12 100.0 100.0 100.0 100.0 2014 ............................................................... 55.69 58.25 58.54 61.00 100.0 100.0 100.0 100.0 2015 ............................................................... 63.72 60.71 61.11 58.96 100.0 100.0 100.0 100.0 2016 ............................................................... 59.37 59.31 59.27 60.48 100.0 100.0 100.0 100.0 2017 ............................................................... 60.91 – – – 100.0 – – –
Wages and salaries 2006 ............................................................... – – – 32.03 – – – 70.6 2007 ............................................................... 32.17 32.49 32.40 32.64 70.6 70.7 70.7 70.6 2008 ............................................................... 32.67 33.00 32.65 33.67 70.6 71.0 71.1 70.7 2009 ............................................................... 33.85 34.14 34.19 33.32 70.6 70.6 70.6 70.0 2010 ............................................................... 33.32 34.19 34.26 34.21 69.8 70.1 70.2 69.8
2011 ............................................................... 34.66 35.04 35.03 33.95 69.6 69.3 69.5 68.9 2012 ............................................................... 34.94 35.43 35.16 36.01 68.4 68.4 68.2 68.0 2013 ............................................................... 36.26 36.72 36.81 37.73 68.0 68.0 68.0 68.5 2014 ............................................................... 37.99 38.36 38.46 39.52 68.2 65.9 65.7 64.8 2015 ............................................................... 40.50 40.64 40.82 39.03 63.6 67.0 66.8 66.2 2016 ............................................................... 39.45 39.66 39.84 40.46 66.5 66.9 67.2 66.9 2017 ............................................................... 40.55 – – – 66.6 – – –
Total benefits 2006 ............................................................... – – – 13.36 – – – 29.4 2007 ............................................................... 13.41 13.48 13.42 13.57 29.4 29.3 29.3 29.4 2008 ............................................................... 13.58 13.46 13.27 13.96 29.4 29.0 28.9 29.3 2009 ............................................................... 14.12 14.25 14.25 14.30 29.4 29.4 29.4 30.0 2010 ............................................................... 14.40 14.55 14.56 14.82 30.2 29.9 29.8 30.2
2011 ............................................................... 15.11 15.50 15.35 15.32 30.4 30.7 30.5 31.1 2012 ............................................................... 16.17 16.38 16.37 16.96 31.6 31.6 31.8 32.0 2013 ............................................................... 17.08 17.29 17.36 17.39 32.0 32.0 32.0 31.5 2014 ............................................................... 17.70 19.89 20.08 21.48 31.8 34.1 34.3 35.2 2015 ............................................................... 23.21 20.06 20.29 19.94 36.4 33.0 33.2 33.8 2016 ............................................................... 19.91 19.65 19.43 20.02 33.5 33.1 32.8 33.1 2017 ............................................................... 20.36 – – – 33.4 – – –
Paid leave 2006 ............................................................... – – – 4.47 – – – 9.8 2007 ............................................................... 4.45 4.50 4.49 4.53 9.8 9.8 9.8 9.8 2008 ............................................................... 4.46 4.42 4.36 4.55 9.6 9.5 9.5 9.6 2009 ............................................................... 4.65 4.70 4.70 4.59 9.7 9.7 9.7 9.6 2010 ............................................................... 4.56 4.70 4.72 4.73 9.5 9.6 9.7 9.6
2011 ............................................................... 4.79 4.83 4.80 4.62 9.6 9.6 9.5 9.4 2012 ............................................................... 4.78 4.84 4.82 4.98 9.4 9.3 9.4 9.4 2013 ............................................................... 5.02 5.07 5.11 5.20 9.4 9.4 9.4 9.4 2014 ............................................................... 5.32 5.38 5.40 5.57 9.5 9.2 9.2 9.1 2015 ............................................................... 5.77 5.75 5.82 5.53 9.1 9.5 9.5 9.4 2016 ............................................................... 5.58 5.58 5.50 5.68 9.4 9.4 9.3 9.4 2017 ............................................................... 5.70 – – – 9.4 – – –
Supplemental pay 2006 ............................................................... – – – 1.06 – – – 2.3 2007 ............................................................... 1.09 1.11 1.10 1.11 2.4 2.4 2.4 2.4 2008 ............................................................... 1.14 1.10 1.01 1.15 2.5 2.4 2.2 2.4 2009 ............................................................... 1.14 1.17 1.18 1.18 2.4 2.4 2.4 2.5 2010 ............................................................... 1.12 1.03 1.00 1.00 2.4 2.1 2.0 2.0
2011 ............................................................... 1.09 1.25 1.25 1.41 2.2 2.5 2.5 2.9 2012 ............................................................... 1.43 1.45 1.43 1.48 2.8 2.8 2.8 2.8 2013 ............................................................... 1.43 1.46 1.45 1.67 2.7 2.7 2.7 3.0 2014 ............................................................... 1.77 1.83 1.82 2.11 3.2 3.1 3.1 3.5 2015 ............................................................... 3.43 2.26 2.24 2.50 5.4 3.7 3.7 4.2 2016 ............................................................... 2.42 2.43 2.51 2.49 4.1 4.1 4.2 4.1
See footnotes at end of table.
-193-

Supplemental table 17. Private information industry workers, by occupational group: employer costs per hours workedfor employee compensation and costs as a percentage of total compensation, 2006-2017 -- Continued
Professional and related occupations1
Compensationcomponent
Cost per hour worked Percent of total compensation
Mar. June Sep. Dec. Mar. June Sep. Dec.
Supplemental pay 2017 ............................................................... 2.53 – – – 4.2 – – –
Insurance 2006 ............................................................... – – – 2.94 – – – 6.5 2007 ............................................................... 2.99 3.05 2.99 3.02 6.6 6.6 6.5 6.5 2008 ............................................................... 3.07 3.10 3.11 3.24 6.6 6.7 6.8 6.8 2009 ............................................................... 3.34 3.44 3.48 3.58 7.0 7.1 7.2 7.5 2010 ............................................................... 3.72 3.74 3.74 3.89 7.8 7.7 7.7 7.9
2011 ............................................................... 4.01 4.12 4.06 4.12 8.1 8.1 8.1 8.4 2012 ............................................................... 4.11 4.20 4.32 4.42 8.0 8.1 8.4 8.3 2013 ............................................................... 4.52 4.56 4.64 4.79 8.5 8.5 8.6 8.7 2014 ............................................................... 4.87 4.92 5.00 5.13 8.7 8.5 8.5 8.4 2015 ............................................................... 5.25 5.23 5.31 5.27 8.2 8.6 8.7 8.9 2016 ............................................................... 5.28 5.29 5.26 5.45 8.9 8.9 8.9 9.0 2017 ............................................................... 5.56 – – – 9.1 – – –
Retirement and savings 2006 ............................................................... – – – 1.70 – – – 3.7 2007 ............................................................... 1.66 1.59 1.61 1.65 3.6 3.5 3.5 3.6 2008 ............................................................... 1.64 1.59 1.52 1.68 3.5 3.4 3.3 3.5 2009 ............................................................... 1.64 1.58 1.56 1.68 3.4 3.3 3.2 3.5 2010 ............................................................... 1.71 1.76 1.78 1.88 3.6 3.6 3.6 3.8
2011 ............................................................... 1.86 1.89 1.82 1.80 3.7 3.7 3.6 3.7 2012 ............................................................... 2.42 2.41 2.32 2.52 4.7 4.7 4.5 4.8 2013 ............................................................... 2.56 2.59 2.53 2.01 4.8 4.8 4.7 3.6 2014 ............................................................... 1.99 3.96 4.05 4.73 3.6 6.8 6.9 7.7 2015 ............................................................... 4.73 2.82 2.89 2.72 7.4 4.6 4.7 4.6 2016 ............................................................... 2.70 2.43 2.29 2.45 4.5 4.1 3.9 4.1 2017 ............................................................... 2.55 – – – 4.2 – – –
Legally required benefits 2006 ............................................................... – – – 3.20 – – – 7.0 2007 ............................................................... 3.22 3.24 3.23 3.26 7.1 7.0 7.0 7.1 2008 ............................................................... 3.27 3.25 3.26 3.34 7.1 7.0 7.1 7.0 2009 ............................................................... 3.36 3.36 3.33 3.26 7.0 6.9 6.9 6.8 2010 ............................................................... 3.29 3.32 3.32 3.32 6.9 6.8 6.8 6.8
2011 ............................................................... 3.36 3.41 3.42 3.37 6.8 6.7 6.8 6.8 2012 ............................................................... 3.43 3.48 3.48 3.55 6.7 6.7 6.7 6.7 2013 ............................................................... 3.56 3.60 3.63 3.72 6.7 6.7 6.7 6.7 2014 ............................................................... 3.76 3.80 3.80 3.95 6.8 6.5 6.5 6.5 2015 ............................................................... 4.03 4.00 4.02 3.92 6.3 6.6 6.6 6.6 2016 ............................................................... 3.93 3.92 3.87 3.95 6.6 6.6 6.5 6.5 2017 ............................................................... 4.01 – – – 6.6 – – –
1 Estimates from December 2013 to March 2014 for this series were corrected, details are available atwww.bls.gov/bls/ecec_correction_091014.htm.
Note: The sum of individual items may not equal totals due to rounding. Dashes indicate data are not available.
-194-

Supplemental table 17. Private information industry workers, by occupational group: employer costs per hours workedfor employee compensation and costs as a percentage of total compensation, 2006-2017 -- Continued
Sales and office occupations
Compensationcomponent
Cost per hour worked Percent of total compensation
Mar. June Sep. Dec. Mar. June Sep. Dec.
Total compensation 2006 ............................................................... – – – $28.03 – – – 100.0 2007 ............................................................... 28.45 28.82 28.85 29.50 100.0 100.0 100.0 100.0 2008 ............................................................... 29.38 27.88 29.65 29.04 100.0 100.0 100.0 100.0 2009 ............................................................... 29.51 29.51 29.42 29.98 100.0 100.0 100.0 100.0 2010 ............................................................... 29.97 30.13 30.58 29.75 100.0 100.0 100.0 100.0
2011 ............................................................... 30.36 30.48 30.44 31.81 100.0 100.0 100.0 100.0 2012 ............................................................... 32.35 33.05 33.09 32.72 100.0 100.0 100.0 100.0 2013 ............................................................... 32.97 33.31 33.46 33.95 100.0 100.0 100.0 100.0 2014 ............................................................... 34.58 35.93 36.13 36.95 100.0 100.0 100.0 100.0 2015 ............................................................... 37.12 36.93 36.33 37.23 100.0 100.0 100.0 100.0 2016 ............................................................... 36.84 37.26 36.57 36.88 100.0 100.0 100.0 100.0 2017 ............................................................... 36.21 – – – 100.0 – – –
Wages and salaries 2006 ............................................................... – – – 19.19 – – – 68.5 2007 ............................................................... 19.51 19.76 19.78 20.20 68.6 68.6 68.6 68.5 2008 ............................................................... 20.05 19.27 20.49 19.54 68.2 69.1 69.1 67.3 2009 ............................................................... 19.76 19.92 19.84 20.32 67.0 67.5 67.4 67.8 2010 ............................................................... 20.24 20.34 20.67 20.18 67.5 67.5 67.6 67.8
2011 ............................................................... 20.60 20.64 20.55 21.27 67.9 67.7 67.5 66.9 2012 ............................................................... 21.11 21.47 21.51 21.27 65.3 65.0 65.0 65.0 2013 ............................................................... 21.47 21.61 21.62 22.12 65.1 64.9 64.6 65.1 2014 ............................................................... 22.43 22.52 22.68 23.36 64.9 62.7 62.8 63.2 2015 ............................................................... 23.60 24.10 23.53 24.21 63.6 65.3 64.8 65.0 2016 ............................................................... 24.16 24.79 24.35 24.24 65.6 66.5 66.6 65.7 2017 ............................................................... 23.88 – – – 65.9 – – –
Total benefits 2006 ............................................................... – – – 8.84 – – – 31.5 2007 ............................................................... 8.95 9.05 9.07 9.30 31.4 31.4 31.4 31.5 2008 ............................................................... 9.34 8.62 9.17 9.50 31.8 30.9 30.9 32.7 2009 ............................................................... 9.75 9.60 9.58 9.65 33.0 32.5 32.6 32.2 2010 ............................................................... 9.74 9.79 9.91 9.57 32.5 32.5 32.4 32.2
2011 ............................................................... 9.76 9.84 9.89 10.54 32.1 32.3 32.5 33.1 2012 ............................................................... 11.24 11.58 11.58 11.45 34.7 35.0 35.0 35.0 2013 ............................................................... 11.51 11.70 11.84 11.83 34.9 35.1 35.4 34.9 2014 ............................................................... 12.15 13.41 13.45 13.59 35.1 37.3 37.2 36.8 2015 ............................................................... 13.52 12.83 12.80 13.02 36.4 34.7 35.2 35.0 2016 ............................................................... 12.68 12.47 12.22 12.64 34.4 33.5 33.4 34.3 2017 ............................................................... 12.33 – – – 34.1 – – –
Paid leave 2006 ............................................................... – – – 2.20 – – – 7.8 2007 ............................................................... 2.21 2.25 2.24 2.30 7.8 7.8 7.8 7.8 2008 ............................................................... 2.29 2.21 2.38 2.38 7.8 7.9 8.0 8.2 2009 ............................................................... 2.46 2.49 2.49 2.55 8.3 8.4 8.5 8.5 2010 ............................................................... 2.53 2.55 2.59 2.50 8.5 8.5 8.5 8.4
2011 ............................................................... 2.53 2.50 2.51 2.61 8.3 8.2 8.2 8.2 2012 ............................................................... 2.56 2.60 2.60 2.52 7.9 7.9 7.8 7.7 2013 ............................................................... 2.56 2.60 2.71 2.81 7.8 7.8 8.1 8.3 2014 ............................................................... 2.86 2.88 2.90 2.88 8.3 8.0 8.0 7.8 2015 ............................................................... 2.92 2.98 2.85 3.06 7.9 8.1 7.9 8.2 2016 ............................................................... 3.00 3.02 2.94 3.03 8.2 8.1 8.0 8.2 2017 ............................................................... 3.01 – – – 8.3 – – –
Supplemental pay 2006 ............................................................... – – – .56 – – – 2.0 2007 ............................................................... .58 .66 .65 .66 2.0 2.3 2.3 2.2 2008 ............................................................... .67 .56 .60 .72 2.3 2.0 2.0 2.5 2009 ............................................................... .72 .70 .67 .72 2.4 2.4 2.3 2.4 2010 ............................................................... .71 .64 .66 .61 2.4 2.1 2.1 2.1
2011 ............................................................... .66 .67 .69 .88 2.2 2.2 2.3 2.8 2012 ............................................................... .85 .89 .92 1.03 2.6 2.7 2.8 3.2 2013 ............................................................... .97 .97 .98 1.11 3.0 2.9 2.9 3.3 2014 ............................................................... 1.30 1.29 1.30 1.40 3.8 3.6 3.6 3.8 2015 ............................................................... 1.41 1.46 1.49 1.30 3.8 4.0 4.1 3.5 2016 ............................................................... 1.25 1.17 1.22 1.22 3.4 3.1 3.3 3.3
See footnotes at end of table.
-195-

Supplemental table 17. Private information industry workers, by occupational group: employer costs per hours workedfor employee compensation and costs as a percentage of total compensation, 2006-2017 -- Continued
Sales and office occupations
Compensationcomponent
Cost per hour worked Percent of total compensation
Mar. June Sep. Dec. Mar. June Sep. Dec.
Supplemental pay 2017 ............................................................... 1.22 – – – 3.4 – – –
Insurance 2006 ............................................................... – – – 2.79 – – – 9.9 2007 ............................................................... 2.85 2.82 2.81 2.85 10.0 9.8 9.7 9.7 2008 ............................................................... 2.87 2.78 2.93 3.06 9.8 10.0 9.9 10.5 2009 ............................................................... 3.19 3.24 3.26 3.20 10.8 11.0 11.1 10.7 2010 ............................................................... 3.26 3.28 3.30 3.30 10.9 10.9 10.8 11.1
2011 ............................................................... 3.37 3.40 3.44 3.68 11.1 11.2 11.3 11.6 2012 ............................................................... 3.70 3.73 3.75 3.75 11.4 11.3 11.3 11.5 2013 ............................................................... 3.80 3.90 3.94 4.13 11.5 11.7 11.8 12.2 2014 ............................................................... 4.25 4.28 4.28 4.22 12.3 11.9 11.9 11.4 2015 ............................................................... 4.14 4.15 4.22 4.50 11.2 11.2 11.6 12.1 2016 ............................................................... 4.40 4.28 4.18 4.40 12.0 11.5 11.4 11.9 2017 ............................................................... 4.25 – – – 11.7 – – –
Retirement and savings 2006 ............................................................... – – – 1.29 – – – 4.6 2007 ............................................................... 1.29 1.29 1.32 1.40 4.5 4.5 4.6 4.7 2008 ............................................................... 1.44 1.04 1.17 1.24 4.9 3.7 3.9 4.3 2009 ............................................................... 1.24 1.04 1.03 1.01 4.2 3.5 3.5 3.4 2010 ............................................................... 1.04 1.14 1.16 1.00 3.5 3.8 3.8 3.4
2011 ............................................................... 1.00 1.04 1.01 1.08 3.3 3.4 3.3 3.4 2012 ............................................................... 1.84 2.00 1.97 1.81 5.7 6.1 5.9 5.5 2013 ............................................................... 1.83 1.87 1.85 1.36 5.6 5.6 5.5 4.0 2014 ............................................................... 1.26 2.47 2.47 2.56 3.7 6.9 6.8 6.9 2015 ............................................................... 2.52 1.68 1.70 1.57 6.8 4.5 4.7 4.2 2016 ............................................................... 1.48 1.46 1.39 1.47 4.0 3.9 3.8 4.0 2017 ............................................................... 1.39 – – – 3.8 – – –
Legally required benefits 2006 ............................................................... – – – 1.99 – – – 7.1 2007 ............................................................... 2.02 2.04 2.05 2.08 7.1 7.1 7.1 7.0 2008 ............................................................... 2.07 2.03 2.09 2.10 7.0 7.3 7.1 7.2 2009 ............................................................... 2.13 2.13 2.12 2.17 7.2 7.2 7.2 7.2 2010 ............................................................... 2.19 2.18 2.21 2.15 7.3 7.2 7.2 7.2
2011 ............................................................... 2.20 2.24 2.25 2.29 7.3 7.4 7.4 7.2 2012 ............................................................... 2.29 2.36 2.35 2.33 7.1 7.1 7.1 7.1 2013 ............................................................... 2.34 2.36 2.37 2.42 7.1 7.1 7.1 7.1 2014 ............................................................... 2.47 2.48 2.49 2.53 7.1 6.9 6.9 6.9 2015 ............................................................... 2.53 2.57 2.53 2.59 6.8 6.9 7.0 6.9 2016 ............................................................... 2.55 2.54 2.50 2.51 6.9 6.8 6.8 6.8 2017 ............................................................... 2.47 – – – 6.8 – – –
Note: The sum of individual items may not equal totals due to rounding. Dashes indicate data are not available.
-196-

Supplemental table 18. Private information industry workers, by establishment size: employer costs per hours workedfor employee compensation and costs as a percentage of total compensation, 2006-2017
1-99 workers
Compensationcomponent
Cost per hour worked Percent of total compensation
Mar. June Sep. Dec. Mar. June Sep. Dec.
Total compensation 2006 ............................................................... – – – $30.56 – – – 100.0 2007 ............................................................... 31.19 31.83 32.13 32.43 100.0 100.0 100.0 100.0 2008 ............................................................... 31.73 31.58 32.42 33.82 100.0 100.0 100.0 100.0 2009 ............................................................... 33.43 33.41 33.45 34.79 100.0 100.0 100.0 100.0 2010 ............................................................... 34.61 35.36 35.73 35.69 100.0 100.0 100.0 100.0
2011 ............................................................... 36.32 36.65 36.42 36.59 100.0 100.0 100.0 100.0 2012 ............................................................... 37.73 38.53 38.44 40.79 100.0 100.0 100.0 100.0 2013 ............................................................... 40.90 41.22 41.43 42.38 100.0 100.0 100.0 100.0 2014 ............................................................... 43.12 45.69 45.96 49.96 100.0 100.0 100.0 100.0 2015 ............................................................... 51.97 47.61 48.51 46.01 100.0 100.0 100.0 100.0 2016 ............................................................... 46.30 46.40 44.69 47.90 100.0 100.0 100.0 100.0 2017 ............................................................... 48.40 – – – 100.0 – – –
Wages and salaries 2006 ............................................................... – – – 21.34 – – – 69.8 2007 ............................................................... 21.85 22.51 22.69 22.85 70.1 70.7 70.6 70.5 2008 ............................................................... 22.30 22.31 22.75 23.47 70.3 70.6 70.2 69.4 2009 ............................................................... 23.26 23.35 23.41 24.32 69.6 69.9 70.0 69.9 2010 ............................................................... 24.18 24.58 24.87 24.93 69.9 69.5 69.6 69.8
2011 ............................................................... 25.30 25.43 25.27 25.32 69.7 69.4 69.4 69.2 2012 ............................................................... 25.42 25.74 25.72 26.81 67.4 66.8 66.9 65.7 2013 ............................................................... 26.89 27.08 27.03 28.42 65.7 65.7 65.3 67.1 2014 ............................................................... 28.93 28.62 28.68 30.38 67.1 62.6 62.4 60.8 2015 ............................................................... 30.84 30.89 31.42 30.72 59.3 64.9 64.8 66.8 2016 ............................................................... 30.99 31.40 30.64 32.06 66.9 67.7 68.6 66.9 2017 ............................................................... 32.12 – – – 66.4 – – –
Total benefits 2006 ............................................................... – – – 9.22 – – – 30.2 2007 ............................................................... 9.33 9.33 9.44 9.58 29.9 29.3 29.4 29.5 2008 ............................................................... 9.44 9.27 9.67 10.35 29.7 29.4 29.8 30.6 2009 ............................................................... 10.17 10.06 10.04 10.47 30.4 30.1 30.0 30.1 2010 ............................................................... 10.43 10.78 10.86 10.76 30.1 30.5 30.4 30.2
2011 ............................................................... 11.02 11.22 11.15 11.27 30.3 30.6 30.6 30.8 2012 ............................................................... 12.31 12.78 12.72 13.98 32.6 33.2 33.1 34.3 2013 ............................................................... 14.01 14.14 14.39 13.96 34.3 34.3 34.7 32.9 2014 ............................................................... 14.18 17.07 17.28 19.58 32.9 37.4 37.6 39.2 2015 ............................................................... 21.13 16.73 17.09 15.29 40.7 35.1 35.2 33.2 2016 ............................................................... 15.31 15.00 14.05 15.84 33.1 32.3 31.4 33.1 2017 ............................................................... 16.28 – – – 33.6 – – –
Paid leave 2006 ............................................................... – – – 2.54 – – – 8.3 2007 ............................................................... 2.55 2.55 2.58 2.59 8.2 8.0 8.0 8.0 2008 ............................................................... 2.56 2.53 2.61 2.77 8.1 8.0 8.1 8.2 2009 ............................................................... 2.75 2.78 2.78 2.95 8.2 8.3 8.3 8.5 2010 ............................................................... 2.92 3.02 3.06 3.10 8.4 8.6 8.6 8.7
2011 ............................................................... 3.13 3.15 3.12 3.06 8.6 8.6 8.6 8.4 2012 ............................................................... 3.05 3.10 3.07 3.41 8.1 8.0 8.0 8.4 2013 ............................................................... 3.43 3.45 3.56 3.74 8.4 8.4 8.6 8.8 2014 ............................................................... 3.84 3.84 3.87 4.10 8.9 8.4 8.4 8.2 2015 ............................................................... 4.22 4.14 4.23 4.07 8.1 8.7 8.7 8.8 2016 ............................................................... 4.06 4.07 3.88 4.34 8.8 8.8 8.7 9.1 2017 ............................................................... 4.38 – – – 9.1 – – –
Supplemental pay 2006 ............................................................... – – – .73 – – – 2.4 2007 ............................................................... .76 .77 .79 .78 2.4 2.4 2.4 2.4 2008 ............................................................... .75 .71 .78 .73 2.4 2.2 2.4 2.2 2009 ............................................................... .71 .68 .67 .74 2.1 2.0 2.0 2.1 2010 ............................................................... .72 .68 .68 .66 2.1 1.9 1.9 1.8
2011 ............................................................... .68 .74 .77 .92 1.9 2.0 2.1 2.5 2012 ............................................................... .82 .83 .79 1.06 2.2 2.1 2.0 2.6 2013 ............................................................... 1.04 1.04 1.07 1.49 2.5 2.5 2.6 3.5 2014 ............................................................... 1.32 1.42 1.44 1.61 3.1 3.1 3.1 3.2 2015 ............................................................... 2.80 1.71 1.70 1.60 5.4 3.6 3.5 3.5 2016 ............................................................... 1.57 1.52 1.52 1.61 3.4 3.3 3.4 3.4
See footnotes at end of table.
-197-
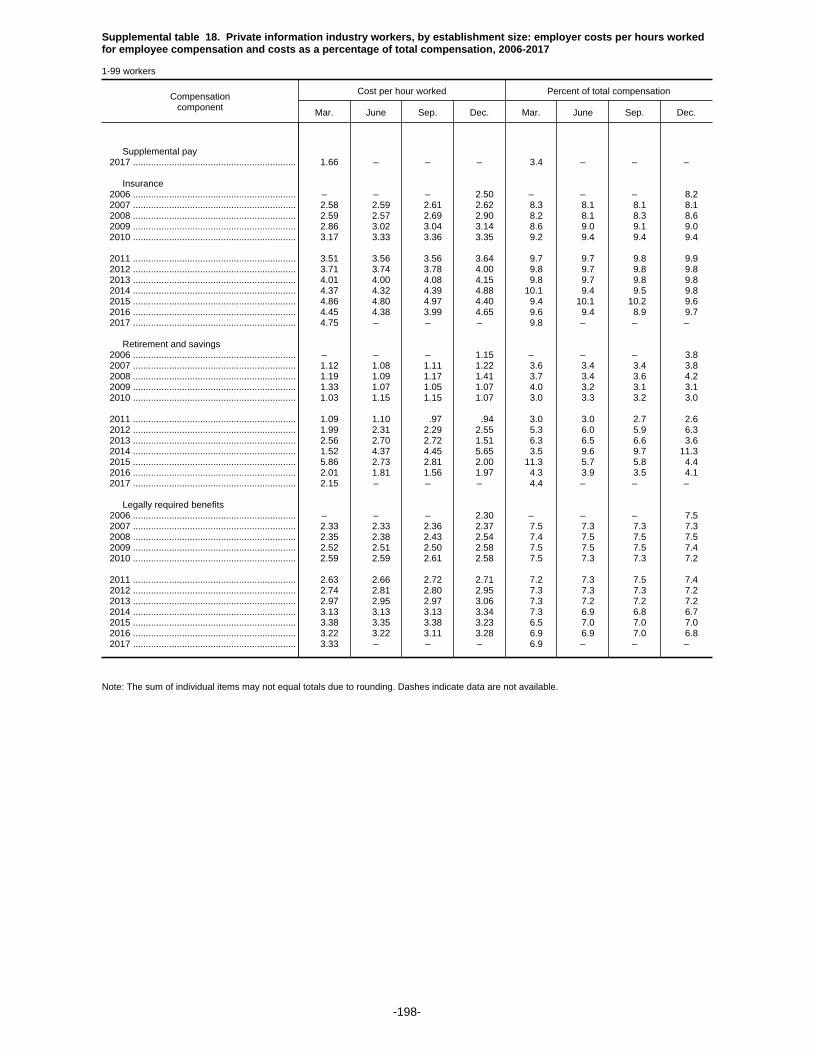
Supplemental table 18. Private information industry workers, by establishment size: employer costs per hours workedfor employee compensation and costs as a percentage of total compensation, 2006-2017
1-99 workers
Compensationcomponent
Cost per hour worked Percent of total compensation
Mar. June Sep. Dec. Mar. June Sep. Dec.
Supplemental pay 2017 ............................................................... 1.66 – – – 3.4 – – –
Insurance 2006 ............................................................... – – – 2.50 – – – 8.2 2007 ............................................................... 2.58 2.59 2.61 2.62 8.3 8.1 8.1 8.1 2008 ............................................................... 2.59 2.57 2.69 2.90 8.2 8.1 8.3 8.6 2009 ............................................................... 2.86 3.02 3.04 3.14 8.6 9.0 9.1 9.0 2010 ............................................................... 3.17 3.33 3.36 3.35 9.2 9.4 9.4 9.4
2011 ............................................................... 3.51 3.56 3.56 3.64 9.7 9.7 9.8 9.9 2012 ............................................................... 3.71 3.74 3.78 4.00 9.8 9.7 9.8 9.8 2013 ............................................................... 4.01 4.00 4.08 4.15 9.8 9.7 9.8 9.8 2014 ............................................................... 4.37 4.32 4.39 4.88 10.1 9.4 9.5 9.8 2015 ............................................................... 4.86 4.80 4.97 4.40 9.4 10.1 10.2 9.6 2016 ............................................................... 4.45 4.38 3.99 4.65 9.6 9.4 8.9 9.7 2017 ............................................................... 4.75 – – – 9.8 – – –
Retirement and savings 2006 ............................................................... – – – 1.15 – – – 3.8 2007 ............................................................... 1.12 1.08 1.11 1.22 3.6 3.4 3.4 3.8 2008 ............................................................... 1.19 1.09 1.17 1.41 3.7 3.4 3.6 4.2 2009 ............................................................... 1.33 1.07 1.05 1.07 4.0 3.2 3.1 3.1 2010 ............................................................... 1.03 1.15 1.15 1.07 3.0 3.3 3.2 3.0
2011 ............................................................... 1.09 1.10 .97 .94 3.0 3.0 2.7 2.6 2012 ............................................................... 1.99 2.31 2.29 2.55 5.3 6.0 5.9 6.3 2013 ............................................................... 2.56 2.70 2.72 1.51 6.3 6.5 6.6 3.6 2014 ............................................................... 1.52 4.37 4.45 5.65 3.5 9.6 9.7 11.3 2015 ............................................................... 5.86 2.73 2.81 2.00 11.3 5.7 5.8 4.4 2016 ............................................................... 2.01 1.81 1.56 1.97 4.3 3.9 3.5 4.1 2017 ............................................................... 2.15 – – – 4.4 – – –
Legally required benefits 2006 ............................................................... – – – 2.30 – – – 7.5 2007 ............................................................... 2.33 2.33 2.36 2.37 7.5 7.3 7.3 7.3 2008 ............................................................... 2.35 2.38 2.43 2.54 7.4 7.5 7.5 7.5 2009 ............................................................... 2.52 2.51 2.50 2.58 7.5 7.5 7.5 7.4 2010 ............................................................... 2.59 2.59 2.61 2.58 7.5 7.3 7.3 7.2
2011 ............................................................... 2.63 2.66 2.72 2.71 7.2 7.3 7.5 7.4 2012 ............................................................... 2.74 2.81 2.80 2.95 7.3 7.3 7.3 7.2 2013 ............................................................... 2.97 2.95 2.97 3.06 7.3 7.2 7.2 7.2 2014 ............................................................... 3.13 3.13 3.13 3.34 7.3 6.9 6.8 6.7 2015 ............................................................... 3.38 3.35 3.38 3.23 6.5 7.0 7.0 7.0 2016 ............................................................... 3.22 3.22 3.11 3.28 6.9 6.9 7.0 6.8 2017 ............................................................... 3.33 – – – 6.9 – – –
Note: The sum of individual items may not equal totals due to rounding. Dashes indicate data are not available.
-198-

Supplemental table 18. Private information industry workers, by establishment size: employer costs per hours workedfor employee compensation and costs as a percentage of total compensation, 2006-2017 -- Continued
100 workers or more
Compensationcomponent
Cost per hour worked Percent of total compensation
Mar. June Sep. Dec. Mar. June Sep. Dec.
Total compensation 2006 ............................................................... – – – $42.67 – – – 100.0 2007 ............................................................... 42.86 43.26 43.18 43.56 100.0 100.0 100.0 100.0 2008 ............................................................... 44.03 43.30 43.78 44.16 100.0 100.0 100.0 100.0 2009 ............................................................... 45.06 45.26 45.69 45.08 100.0 100.0 100.0 100.0 2010 ............................................................... 45.25 46.11 46.16 45.93 100.0 100.0 100.0 100.0
2011 ............................................................... 46.52 46.74 46.83 47.22 100.0 100.0 100.0 100.0 2012 ............................................................... 48.61 49.24 49.09 49.46 100.0 100.0 100.0 100.0 2013 ............................................................... 49.82 50.60 50.70 50.57 100.0 100.0 100.0 100.0 2014 ............................................................... 51.61 54.48 54.46 58.53 100.0 100.0 100.0 100.0 2015 ............................................................... 58.32 56.67 55.86 57.64 100.0 100.0 100.0 100.0 2016 ............................................................... 57.90 58.27 58.23 58.26 100.0 100.0 100.0 100.0 2017 ............................................................... 58.38 – – – 100.0 – – –
Wages and salaries 2006 ............................................................... – – – 28.90 – – – 67.7 2007 ............................................................... 29.03 29.18 29.13 29.33 67.7 67.5 67.5 67.3 2008 ............................................................... 29.72 29.69 30.06 30.23 67.5 68.6 68.7 68.5 2009 ............................................................... 30.61 30.91 31.21 30.62 67.9 68.3 68.3 67.9 2010 ............................................................... 30.63 31.31 31.37 31.08 67.7 67.9 68.0 67.7
2011 ............................................................... 31.45 31.53 31.64 31.60 67.6 67.4 67.6 66.9 2012 ............................................................... 31.99 32.36 32.24 32.34 65.8 65.7 65.7 65.4 2013 ............................................................... 32.59 33.04 33.15 33.49 65.4 65.3 65.4 66.2 2014 ............................................................... 34.05 34.45 34.42 36.53 66.0 63.2 63.2 62.4 2015 ............................................................... 36.51 37.03 36.33 37.15 62.6 65.3 65.0 64.5 2016 ............................................................... 37.52 38.01 38.14 38.13 64.8 65.2 65.5 65.4 2017 ............................................................... 38.14 – – – 65.3 – – –
Total benefits 2006 ............................................................... – – – 13.77 – – – 32.3 2007 ............................................................... 13.83 14.08 14.05 14.23 32.3 32.5 32.5 32.7 2008 ............................................................... 14.31 13.61 13.72 13.92 32.5 31.4 31.3 31.5 2009 ............................................................... 14.45 14.34 14.48 14.46 32.1 31.7 31.7 32.1 2010 ............................................................... 14.62 14.80 14.79 14.84 32.3 32.1 32.0 32.3
2011 ............................................................... 15.08 15.22 15.19 15.63 32.4 32.6 32.4 33.1 2012 ............................................................... 16.62 16.88 16.86 17.12 34.2 34.3 34.3 34.6 2013 ............................................................... 17.23 17.56 17.55 17.07 34.6 34.7 34.6 33.8 2014 ............................................................... 17.56 20.04 20.04 22.00 34.0 36.8 36.8 37.6 2015 ............................................................... 21.81 19.65 19.52 20.49 37.4 34.7 35.0 35.5 2016 ............................................................... 20.38 20.26 20.09 20.13 35.2 34.8 34.5 34.6 2017 ............................................................... 20.24 – – – 34.7 – – –
Paid leave 2006 ............................................................... – – – 4.16 – – – 9.7 2007 ............................................................... 4.16 4.24 4.24 4.29 9.7 9.8 9.8 9.8 2008 ............................................................... 4.24 4.17 4.21 4.17 9.6 9.6 9.6 9.4 2009 ............................................................... 4.38 4.40 4.45 4.36 9.7 9.7 9.7 9.7 2010 ............................................................... 4.35 4.45 4.46 4.39 9.6 9.7 9.7 9.6
2011 ............................................................... 4.44 4.41 4.42 4.47 9.5 9.4 9.4 9.5 2012 ............................................................... 4.50 4.54 4.54 4.52 9.3 9.2 9.2 9.1 2013 ............................................................... 4.55 4.63 4.65 4.68 9.1 9.2 9.2 9.3 2014 ............................................................... 4.81 4.86 4.84 5.23 9.3 8.9 8.9 8.9 2015 ............................................................... 5.23 5.32 5.24 5.39 9.0 9.4 9.4 9.3 2016 ............................................................... 5.44 5.49 5.39 5.39 9.4 9.4 9.3 9.3 2017 ............................................................... 5.41 – – – 9.3 – – –
Supplemental pay 2006 ............................................................... – – – 1.15 – – – 2.7 2007 ............................................................... 1.17 1.27 1.26 1.27 2.7 2.9 2.9 2.9 2008 ............................................................... 1.31 1.19 1.11 1.33 3.0 2.7 2.5 3.0 2009 ............................................................... 1.31 1.33 1.33 1.36 2.9 2.9 2.9 3.0 2010 ............................................................... 1.32 1.21 1.20 1.25 2.9 2.6 2.6 2.7
2011 ............................................................... 1.36 1.41 1.42 1.65 2.9 3.0 3.0 3.5 2012 ............................................................... 1.62 1.68 1.69 1.76 3.3 3.4 3.4 3.5 2013 ............................................................... 1.69 1.71 1.69 1.80 3.4 3.4 3.3 3.6 2014 ............................................................... 2.03 2.06 2.04 2.87 3.9 3.8 3.8 4.9 2015 ............................................................... 2.87 2.53 2.49 2.79 4.9 4.5 4.5 4.8 2016 ............................................................... 2.72 2.74 2.90 2.79 4.7 4.7 5.0 4.8
See footnotes at end of table.
-199-

Supplemental table 18. Private information industry workers, by establishment size: employer costs per hours workedfor employee compensation and costs as a percentage of total compensation, 2006-2017 -- Continued
100 workers or more
Compensationcomponent
Cost per hour worked Percent of total compensation
Mar. June Sep. Dec. Mar. June Sep. Dec.
Supplemental pay 2017 ............................................................... 2.82 – – – 4.8 – – –
Insurance 2006 ............................................................... – – – 3.46 – – – 8.1 2007 ............................................................... 3.50 3.51 3.46 3.49 8.2 8.1 8.0 8.0 2008 ............................................................... 3.54 3.51 3.59 3.58 8.0 8.1 8.2 8.1 2009 ............................................................... 3.83 3.88 3.95 3.96 8.5 8.6 8.6 8.8 2010 ............................................................... 4.08 4.10 4.07 4.19 9.0 8.9 8.8 9.1
2011 ............................................................... 4.25 4.32 4.31 4.44 9.1 9.2 9.2 9.4 2012 ............................................................... 4.48 4.55 4.60 4.71 9.2 9.2 9.4 9.5 2013 ............................................................... 4.80 4.92 4.93 5.07 9.6 9.7 9.7 10.0 2014 ............................................................... 5.21 5.28 5.29 5.37 10.1 9.7 9.7 9.2 2015 ............................................................... 5.30 5.36 5.35 5.68 9.1 9.5 9.6 9.9 2016 ............................................................... 5.64 5.65 5.57 5.65 9.7 9.7 9.6 9.7 2017 ............................................................... 5.64 – – – 9.7 – – –
Retirement and savings 2006 ............................................................... – – – 2.06 – – – 4.8 2007 ............................................................... 2.03 2.05 2.09 2.15 4.7 4.7 4.8 4.9 2008 ............................................................... 2.16 1.73 1.78 1.81 4.9 4.0 4.1 4.1 2009 ............................................................... 1.87 1.65 1.66 1.72 4.1 3.7 3.6 3.8 2010 ............................................................... 1.79 1.93 1.96 1.92 3.9 4.2 4.2 4.2
2011 ............................................................... 1.90 1.91 1.86 1.89 4.1 4.1 4.0 4.0 2012 ............................................................... 2.81 2.85 2.77 2.83 5.8 5.8 5.6 5.7 2013 ............................................................... 2.87 2.95 2.90 2.10 5.8 5.8 5.7 4.1 2014 ............................................................... 2.05 4.33 4.36 4.88 4.0 8.0 8.0 8.3 2015 ............................................................... 4.76 2.76 2.79 2.89 8.2 4.9 5.0 5.0 2016 ............................................................... 2.84 2.64 2.53 2.59 4.9 4.5 4.3 4.5 2017 ............................................................... 2.61 – – – 4.5 – – –
Legally required benefits 2006 ............................................................... – – – 2.95 – – – 6.9 2007 ............................................................... 2.97 3.02 3.01 3.03 6.9 7.0 7.0 7.0 2008 ............................................................... 3.06 3.02 3.03 3.04 6.9 7.0 6.9 6.9 2009 ............................................................... 3.07 3.08 3.09 3.06 6.8 6.8 6.8 6.8 2010 ............................................................... 3.09 3.11 3.11 3.10 6.8 6.7 6.7 6.7
2011 ............................................................... 3.12 3.16 3.18 3.18 6.7 6.8 6.8 6.7 2012 ............................................................... 3.22 3.27 3.27 3.30 6.6 6.6 6.7 6.7 2013 ............................................................... 3.31 3.35 3.38 3.42 6.6 6.6 6.7 6.8 2014 ............................................................... 3.48 3.51 3.50 3.64 6.7 6.4 6.4 6.2 2015 ............................................................... 3.65 3.68 3.65 3.73 6.3 6.5 6.5 6.5 2016 ............................................................... 3.74 3.74 3.69 3.71 6.5 6.4 6.3 6.4 2017 ............................................................... 3.75 – – – 6.4 – – –
Note: The sum of individual items may not equal totals due to rounding. Dashes indicate data are not available.
-200-

Supplemental table 18. Private information industry workers, by establishment size: employer costs per hours workedfor employee compensation and costs as a percentage of total compensation, 2006-2017 -- Continued
100-499 workers
Compensationcomponent
Cost per hour worked Percent of total compensation
Mar. June Sep. Dec. Mar. June Sep. Dec.
Total compensation 2006 ............................................................... – – – $38.92 – – – 100.0 2007 ............................................................... 38.70 39.01 39.07 39.75 100.0 100.0 100.0 100.0 2008 ............................................................... 40.32 39.56 39.63 38.75 100.0 100.0 100.0 100.0 2009 ............................................................... 40.16 40.22 41.11 39.78 100.0 100.0 100.0 100.0 2010 ............................................................... 40.26 40.59 40.59 39.43 100.0 100.0 100.0 100.0
2011 ............................................................... 39.76 40.86 40.92 42.98 100.0 100.0 100.0 100.0 2012 ............................................................... 43.48 43.79 43.59 45.64 100.0 100.0 100.0 100.0 2013 ............................................................... 46.06 46.65 46.91 48.08 100.0 100.0 100.0 100.0 2014 ............................................................... 49.65 53.18 53.13 57.41 100.0 100.0 100.0 100.0 2015 ............................................................... 56.62 53.64 53.73 55.50 100.0 100.0 100.0 100.0 2016 ............................................................... 55.33 55.07 53.14 53.64 100.0 100.0 100.0 100.0 2017 ............................................................... 53.36 – – – 100.0 – – –
Wages and salaries 2006 ............................................................... – – – 26.44 – – – 67.9 2007 ............................................................... 26.24 26.25 26.23 26.67 67.8 67.3 67.1 67.1 2008 ............................................................... 27.28 27.15 27.21 26.56 67.6 68.6 68.7 68.5 2009 ............................................................... 27.14 27.39 28.04 26.86 67.6 68.1 68.2 67.5 2010 ............................................................... 27.16 27.39 27.45 26.77 67.5 67.5 67.6 67.9
2011 ............................................................... 26.98 27.63 27.57 28.83 67.8 67.6 67.4 67.1 2012 ............................................................... 28.63 28.75 28.65 29.90 65.8 65.7 65.7 65.5 2013 ............................................................... 30.21 30.39 30.66 31.84 65.6 65.1 65.4 66.2 2014 ............................................................... 32.68 33.02 33.08 34.81 65.8 62.1 62.3 60.6 2015 ............................................................... 34.28 34.93 34.97 35.70 60.5 65.1 65.1 64.3 2016 ............................................................... 35.85 35.86 34.71 35.03 64.8 65.1 65.3 65.3 2017 ............................................................... 34.85 – – – 65.3 – – –
Total benefits 2006 ............................................................... – – – 12.48 – – – 32.1 2007 ............................................................... 12.46 12.77 12.84 13.08 32.2 32.7 32.9 32.9 2008 ............................................................... 13.05 12.41 12.42 12.19 32.4 31.4 31.3 31.5 2009 ............................................................... 13.02 12.82 13.06 12.92 32.4 31.9 31.8 32.5 2010 ............................................................... 13.10 13.20 13.14 12.66 32.5 32.5 32.4 32.1
2011 ............................................................... 12.78 13.23 13.35 14.15 32.2 32.4 32.6 32.9 2012 ............................................................... 14.85 15.04 14.93 15.74 34.2 34.3 34.3 34.5 2013 ............................................................... 15.85 16.26 16.25 16.24 34.4 34.9 34.6 33.8 2014 ............................................................... 16.97 20.16 20.05 22.60 34.2 37.9 37.7 39.4 2015 ............................................................... 22.34 18.72 18.77 19.80 39.5 34.9 34.9 35.7 2016 ............................................................... 19.48 19.21 18.43 18.60 35.2 34.9 34.7 34.7 2017 ............................................................... 18.50 – – – 34.7 – – –
Paid leave 2006 ............................................................... – – – 3.66 – – – 9.4 2007 ............................................................... 3.63 3.73 3.73 3.78 9.4 9.6 9.5 9.5 2008 ............................................................... 3.70 3.66 3.62 3.31 9.2 9.2 9.1 8.5 2009 ............................................................... 3.62 3.65 3.75 3.58 9.0 9.1 9.1 9.0 2010 ............................................................... 3.61 3.63 3.63 3.49 9.0 8.9 8.9 8.9
2011 ............................................................... 3.51 3.59 3.60 3.91 8.8 8.8 8.8 9.1 2012 ............................................................... 3.81 3.83 3.80 4.02 8.8 8.7 8.7 8.8 2013 ............................................................... 4.06 4.11 4.17 4.30 8.8 8.8 8.9 8.9 2014 ............................................................... 4.54 4.60 4.59 4.93 9.1 8.6 8.6 8.6 2015 ............................................................... 4.84 4.97 4.98 5.02 8.5 9.3 9.3 9.0 2016 ............................................................... 5.03 4.99 4.58 4.69 9.1 9.1 8.6 8.7 2017 ............................................................... 4.65 – – – 8.7 – – –
Supplemental pay 2006 ............................................................... – – – 1.05 – – – 2.7 2007 ............................................................... 1.07 1.13 1.14 1.15 2.8 2.9 2.9 2.9 2008 ............................................................... 1.15 .99 .93 1.11 2.8 2.5 2.3 2.9 2009 ............................................................... 1.10 1.08 1.06 1.14 2.7 2.7 2.6 2.9 2010 ............................................................... 1.12 1.02 1.01 .87 2.8 2.5 2.5 2.2
2011 ............................................................... .92 1.06 1.07 1.31 2.3 2.6 2.6 3.0 2012 ............................................................... 1.14 1.21 1.18 1.45 2.6 2.8 2.7 3.2 2013 ............................................................... 1.41 1.46 1.46 1.49 3.1 3.1 3.1 3.1 2014 ............................................................... 1.78 1.89 1.80 2.98 3.6 3.6 3.4 5.2 2015 ............................................................... 2.99 2.41 2.40 2.69 5.3 4.5 4.5 4.8 2016 ............................................................... 2.61 2.64 2.89 2.55 4.7 4.8 5.4 4.8
See footnotes at end of table.
-201-

Supplemental table 18. Private information industry workers, by establishment size: employer costs per hours workedfor employee compensation and costs as a percentage of total compensation, 2006-2017 -- Continued
100-499 workers
Compensationcomponent
Cost per hour worked Percent of total compensation
Mar. June Sep. Dec. Mar. June Sep. Dec.
Supplemental pay 2017 ............................................................... 2.54 – – – 4.8 – – –
Insurance 2006 ............................................................... – – – 3.34 – – – 8.6 2007 ............................................................... 3.36 3.40 3.39 3.45 8.7 8.7 8.7 8.7 2008 ............................................................... 3.50 3.48 3.56 3.52 8.7 8.8 9.0 9.1 2009 ............................................................... 3.88 3.90 4.01 3.99 9.7 9.7 9.7 10.0 2010 ............................................................... 4.08 4.12 4.05 4.03 10.1 10.2 10.0 10.2
2011 ............................................................... 4.07 4.14 4.24 4.35 10.2 10.1 10.4 10.1 2012 ............................................................... 4.33 4.35 4.39 4.46 10.0 9.9 10.1 9.8 2013 ............................................................... 4.51 4.66 4.63 5.06 9.8 10.0 9.9 10.5 2014 ............................................................... 5.24 5.36 5.33 5.25 10.6 10.1 10.0 9.1 2015 ............................................................... 5.13 5.22 5.25 5.58 9.1 9.7 9.8 10.1 2016 ............................................................... 5.48 5.44 5.19 5.38 9.9 9.9 9.8 10.0 2017 ............................................................... 5.30 – – – 9.9 – – –
Retirement and savings 2006 ............................................................... – – – 1.70 – – – 4.4 2007 ............................................................... 1.67 1.73 1.82 1.89 4.3 4.4 4.6 4.7 2008 ............................................................... 1.86 1.47 1.51 1.51 4.6 3.7 3.8 3.9 2009 ............................................................... 1.63 1.38 1.40 1.46 4.1 3.4 3.4 3.7 2010 ............................................................... 1.50 1.62 1.65 1.50 3.7 4.0 4.1 3.8
2011 ............................................................... 1.51 1.57 1.57 1.62 3.8 3.9 3.8 3.8 2012 ............................................................... 2.63 2.66 2.58 2.72 6.1 6.1 5.9 6.0 2013 ............................................................... 2.76 2.88 2.82 2.08 6.0 6.2 6.0 4.3 2014 ............................................................... 2.03 4.91 4.93 5.92 4.1 9.2 9.3 10.3 2015 ............................................................... 5.87 2.57 2.60 2.83 10.4 4.8 4.8 5.1 2016 ............................................................... 2.70 2.49 2.23 2.40 4.9 4.5 4.2 4.5 2017 ............................................................... 2.42 – – – 4.5 – – –
Legally required benefits 2006 ............................................................... – – – 2.72 – – – 7.0 2007 ............................................................... 2.73 2.79 2.78 2.81 7.1 7.1 7.1 7.1 2008 ............................................................... 2.84 2.82 2.82 2.75 7.0 7.1 7.1 7.1 2009 ............................................................... 2.79 2.81 2.84 2.76 6.9 7.0 6.9 6.9 2010 ............................................................... 2.80 2.80 2.81 2.77 7.0 6.9 6.9 7.0
2011 ............................................................... 2.78 2.86 2.87 2.96 7.0 7.0 7.0 6.9 2012 ............................................................... 2.94 2.98 2.99 3.09 6.8 6.8 6.9 6.8 2013 ............................................................... 3.11 3.14 3.17 3.30 6.8 6.7 6.8 6.9 2014 ............................................................... 3.38 3.40 3.39 3.51 6.8 6.4 6.4 6.1 2015 ............................................................... 3.51 3.54 3.54 3.68 6.2 6.6 6.6 6.6 2016 ............................................................... 3.66 3.65 3.54 3.58 6.6 6.6 6.7 6.7 2017 ............................................................... 3.59 – – – 6.7 – – –
Note: The sum of individual items may not equal totals due to rounding. Dashes indicate data are not available.
-202-
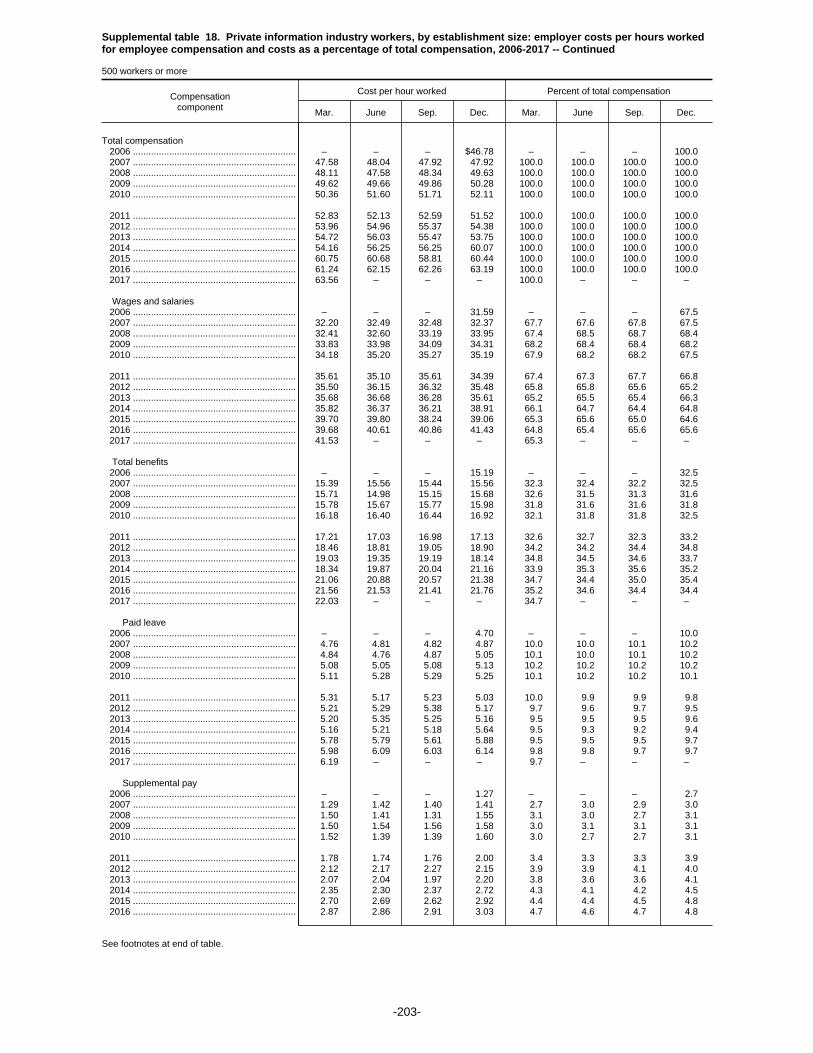
Supplemental table 18. Private information industry workers, by establishment size: employer costs per hours workedfor employee compensation and costs as a percentage of total compensation, 2006-2017 -- Continued
500 workers or more
Compensationcomponent
Cost per hour worked Percent of total compensation
Mar. June Sep. Dec. Mar. June Sep. Dec.
Total compensation 2006 ............................................................... – – – $46.78 – – – 100.0 2007 ............................................................... 47.58 48.04 47.92 47.92 100.0 100.0 100.0 100.0 2008 ............................................................... 48.11 47.58 48.34 49.63 100.0 100.0 100.0 100.0 2009 ............................................................... 49.62 49.66 49.86 50.28 100.0 100.0 100.0 100.0 2010 ............................................................... 50.36 51.60 51.71 52.11 100.0 100.0 100.0 100.0
2011 ............................................................... 52.83 52.13 52.59 51.52 100.0 100.0 100.0 100.0 2012 ............................................................... 53.96 54.96 55.37 54.38 100.0 100.0 100.0 100.0 2013 ............................................................... 54.72 56.03 55.47 53.75 100.0 100.0 100.0 100.0 2014 ............................................................... 54.16 56.25 56.25 60.07 100.0 100.0 100.0 100.0 2015 ............................................................... 60.75 60.68 58.81 60.44 100.0 100.0 100.0 100.0 2016 ............................................................... 61.24 62.15 62.26 63.19 100.0 100.0 100.0 100.0 2017 ............................................................... 63.56 – – – 100.0 – – –
Wages and salaries 2006 ............................................................... – – – 31.59 – – – 67.5 2007 ............................................................... 32.20 32.49 32.48 32.37 67.7 67.6 67.8 67.5 2008 ............................................................... 32.41 32.60 33.19 33.95 67.4 68.5 68.7 68.4 2009 ............................................................... 33.83 33.98 34.09 34.31 68.2 68.4 68.4 68.2 2010 ............................................................... 34.18 35.20 35.27 35.19 67.9 68.2 68.2 67.5
2011 ............................................................... 35.61 35.10 35.61 34.39 67.4 67.3 67.7 66.8 2012 ............................................................... 35.50 36.15 36.32 35.48 65.8 65.8 65.6 65.2 2013 ............................................................... 35.68 36.68 36.28 35.61 65.2 65.5 65.4 66.3 2014 ............................................................... 35.82 36.37 36.21 38.91 66.1 64.7 64.4 64.8 2015 ............................................................... 39.70 39.80 38.24 39.06 65.3 65.6 65.0 64.6 2016 ............................................................... 39.68 40.61 40.86 41.43 64.8 65.4 65.6 65.6 2017 ............................................................... 41.53 – – – 65.3 – – –
Total benefits 2006 ............................................................... – – – 15.19 – – – 32.5 2007 ............................................................... 15.39 15.56 15.44 15.56 32.3 32.4 32.2 32.5 2008 ............................................................... 15.71 14.98 15.15 15.68 32.6 31.5 31.3 31.6 2009 ............................................................... 15.78 15.67 15.77 15.98 31.8 31.6 31.6 31.8 2010 ............................................................... 16.18 16.40 16.44 16.92 32.1 31.8 31.8 32.5
2011 ............................................................... 17.21 17.03 16.98 17.13 32.6 32.7 32.3 33.2 2012 ............................................................... 18.46 18.81 19.05 18.90 34.2 34.2 34.4 34.8 2013 ............................................................... 19.03 19.35 19.19 18.14 34.8 34.5 34.6 33.7 2014 ............................................................... 18.34 19.87 20.04 21.16 33.9 35.3 35.6 35.2 2015 ............................................................... 21.06 20.88 20.57 21.38 34.7 34.4 35.0 35.4 2016 ............................................................... 21.56 21.53 21.41 21.76 35.2 34.6 34.4 34.4 2017 ............................................................... 22.03 – – – 34.7 – – –
Paid leave 2006 ............................................................... – – – 4.70 – – – 10.0 2007 ............................................................... 4.76 4.81 4.82 4.87 10.0 10.0 10.1 10.2 2008 ............................................................... 4.84 4.76 4.87 5.05 10.1 10.0 10.1 10.2 2009 ............................................................... 5.08 5.05 5.08 5.13 10.2 10.2 10.2 10.2 2010 ............................................................... 5.11 5.28 5.29 5.25 10.1 10.2 10.2 10.1
2011 ............................................................... 5.31 5.17 5.23 5.03 10.0 9.9 9.9 9.8 2012 ............................................................... 5.21 5.29 5.38 5.17 9.7 9.6 9.7 9.5 2013 ............................................................... 5.20 5.35 5.25 5.16 9.5 9.5 9.5 9.6 2014 ............................................................... 5.16 5.21 5.18 5.64 9.5 9.3 9.2 9.4 2015 ............................................................... 5.78 5.79 5.61 5.88 9.5 9.5 9.5 9.7 2016 ............................................................... 5.98 6.09 6.03 6.14 9.8 9.8 9.7 9.7 2017 ............................................................... 6.19 – – – 9.7 – – –
Supplemental pay 2006 ............................................................... – – – 1.27 – – – 2.7 2007 ............................................................... 1.29 1.42 1.40 1.41 2.7 3.0 2.9 3.0 2008 ............................................................... 1.50 1.41 1.31 1.55 3.1 3.0 2.7 3.1 2009 ............................................................... 1.50 1.54 1.56 1.58 3.0 3.1 3.1 3.1 2010 ............................................................... 1.52 1.39 1.39 1.60 3.0 2.7 2.7 3.1
2011 ............................................................... 1.78 1.74 1.76 2.00 3.4 3.3 3.3 3.9 2012 ............................................................... 2.12 2.17 2.27 2.15 3.9 3.9 4.1 4.0 2013 ............................................................... 2.07 2.04 1.97 2.20 3.8 3.6 3.6 4.1 2014 ............................................................... 2.35 2.30 2.37 2.72 4.3 4.1 4.2 4.5 2015 ............................................................... 2.70 2.69 2.62 2.92 4.4 4.4 4.5 4.8 2016 ............................................................... 2.87 2.86 2.91 3.03 4.7 4.6 4.7 4.8
See footnotes at end of table.
-203-

Supplemental table 18. Private information industry workers, by establishment size: employer costs per hours workedfor employee compensation and costs as a percentage of total compensation, 2006-2017 -- Continued
500 workers or more
Compensationcomponent
Cost per hour worked Percent of total compensation
Mar. June Sep. Dec. Mar. June Sep. Dec.
Supplemental pay 2017 ............................................................... 3.11 – – – 4.9 – – –
Insurance 2006 ............................................................... – – – 3.58 – – – 7.7 2007 ............................................................... 3.66 3.64 3.54 3.53 7.7 7.6 7.4 7.4 2008 ............................................................... 3.58 3.55 3.62 3.64 7.5 7.5 7.5 7.3 2009 ............................................................... 3.79 3.87 3.90 3.94 7.6 7.8 7.8 7.8 2010 ............................................................... 4.08 4.09 4.09 4.34 8.1 7.9 7.9 8.3
2011 ............................................................... 4.42 4.48 4.38 4.53 8.4 8.6 8.3 8.8 2012 ............................................................... 4.63 4.75 4.83 5.03 8.6 8.6 8.7 9.3 2013 ............................................................... 5.18 5.26 5.31 5.08 9.5 9.4 9.6 9.5 2014 ............................................................... 5.16 5.16 5.24 5.55 9.5 9.2 9.3 9.2 2015 ............................................................... 5.53 5.55 5.49 5.82 9.1 9.1 9.3 9.6 2016 ............................................................... 5.86 5.90 5.88 5.94 9.6 9.5 9.4 9.4 2017 ............................................................... 6.00 – – – 9.4 – – –
Retirement and savings 2006 ............................................................... – – – 2.45 – – – 5.2 2007 ............................................................... 2.44 2.42 2.40 2.46 5.1 5.0 5.0 5.1 2008 ............................................................... 2.49 2.02 2.08 2.12 5.2 4.3 4.3 4.3 2009 ............................................................... 2.08 1.89 1.90 1.97 4.2 3.8 3.8 3.9 2010 ............................................................... 2.08 2.24 2.26 2.32 4.1 4.3 4.4 4.4
2011 ............................................................... 2.26 2.21 2.14 2.17 4.3 4.2 4.1 4.2 2012 ............................................................... 2.99 3.04 2.99 2.97 5.5 5.5 5.4 5.5 2013 ............................................................... 3.02 3.05 3.01 2.12 5.5 5.4 5.4 3.9 2014 ............................................................... 2.07 3.56 3.60 3.43 3.8 6.3 6.4 5.7 2015 ............................................................... 3.18 3.01 3.05 2.97 5.2 5.0 5.2 4.9 2016 ............................................................... 3.01 2.84 2.77 2.80 4.9 4.6 4.4 4.4 2017 ............................................................... 2.81 – – – 4.4 – – –
Legally required benefits 2006 ............................................................... – – – 3.19 – – – 6.8 2007 ............................................................... 3.23 3.27 3.28 3.29 6.8 6.8 6.8 6.9 2008 ............................................................... 3.30 3.23 3.26 3.33 6.9 6.8 6.8 6.7 2009 ............................................................... 3.33 3.32 3.32 3.35 6.7 6.7 6.7 6.7 2010 ............................................................... 3.39 3.41 3.41 3.42 6.7 6.6 6.6 6.6
2011 ............................................................... 3.44 3.44 3.47 3.40 6.5 6.6 6.6 6.6 2012 ............................................................... 3.51 3.57 3.59 3.57 6.5 6.5 6.5 6.6 2013 ............................................................... 3.57 3.65 3.64 3.57 6.5 6.5 6.6 6.6 2014 ............................................................... 3.61 3.65 3.65 3.83 6.7 6.5 6.5 6.4 2015 ............................................................... 3.85 3.85 3.80 3.79 6.3 6.3 6.5 6.3 2016 ............................................................... 3.84 3.85 3.82 3.85 6.3 6.2 6.1 6.1 2017 ............................................................... 3.92 – – – 6.2 – – –
Note: The sum of individual items may not equal totals due to rounding. Dashes indicate data are not available.
-204-

Supplemental table 19. Private financial activities industry workers, by occupational group: employer costs per hoursworked for employee compensation and costs as a percentage of total compensation, 2006-2017
All workers
Compensationcomponent
Cost per hour worked Percent of total compensation
Mar. June Sep. Dec. Mar. June Sep. Dec.
Total compensation 2006 ............................................................... – – – $34.38 – – – 100.0 2007 ............................................................... 34.88 34.70 34.95 34.72 100.0 100.0 100.0 100.0 2008 ............................................................... 35.57 35.67 35.98 36.12 100.0 100.0 100.0 100.0 2009 ............................................................... 36.20 36.32 35.88 36.39 100.0 100.0 100.0 100.0 2010 ............................................................... 36.72 36.76 36.88 37.65 100.0 100.0 100.0 100.0
2011 ............................................................... 37.89 38.62 38.70 39.70 100.0 100.0 100.0 100.0 2012 ............................................................... 39.77 40.14 40.15 40.39 100.0 100.0 100.0 100.0 2013 ............................................................... 40.47 40.75 40.83 41.54 100.0 100.0 100.0 100.0 2014 ............................................................... 41.56 41.94 42.39 44.03 100.0 100.0 100.0 100.0 2015 ............................................................... 45.00 45.05 43.73 43.87 100.0 100.0 100.0 100.0 2016 ............................................................... 45.92 46.02 46.89 46.98 100.0 100.0 100.0 100.0 2017 ............................................................... 46.80 – – – 100.0 – – –
Wages and salaries 2006 ............................................................... – – – 23.32 – – – 67.8 2007 ............................................................... 23.76 23.58 23.80 23.49 68.1 68.0 68.1 67.6 2008 ............................................................... 24.18 23.94 24.34 24.56 68.0 67.1 67.6 68.0 2009 ............................................................... 24.56 24.63 24.30 24.70 67.8 67.8 67.7 67.9 2010 ............................................................... 24.80 25.00 25.03 25.62 67.5 68.0 67.9 68.1
2011 ............................................................... 25.77 25.96 26.06 26.68 68.0 67.2 67.3 67.2 2012 ............................................................... 26.72 27.07 27.09 27.16 67.2 67.4 67.5 67.2 2013 ............................................................... 27.20 27.44 27.52 27.81 67.2 67.3 67.4 67.0 2014 ............................................................... 27.93 28.12 28.49 28.97 67.2 67.1 67.2 65.8 2015 ............................................................... 29.56 29.61 29.43 29.76 65.7 65.7 67.3 67.8 2016 ............................................................... 30.29 30.36 30.84 30.89 65.9 66.0 65.8 65.8 2017 ............................................................... 30.62 – – – 65.4 – – –
Total benefits 2006 ............................................................... – – – 11.06 – – – 32.2 2007 ............................................................... 11.12 11.12 11.16 11.23 31.9 32.0 31.9 32.4 2008 ............................................................... 11.39 11.73 11.65 11.57 32.0 32.9 32.4 32.0 2009 ............................................................... 11.64 11.69 11.58 11.69 32.2 32.2 32.3 32.1 2010 ............................................................... 11.92 11.76 11.86 12.03 32.5 32.0 32.1 31.9
2011 ............................................................... 12.12 12.66 12.64 13.02 32.0 32.8 32.7 32.8 2012 ............................................................... 13.04 13.07 13.06 13.23 32.8 32.6 32.5 32.8 2013 ............................................................... 13.27 13.31 13.31 13.73 32.8 32.7 32.6 33.0 2014 ............................................................... 13.62 13.81 13.90 15.06 32.8 32.9 32.8 34.2 2015 ............................................................... 15.44 15.44 14.31 14.11 34.3 34.3 32.7 32.2 2016 ............................................................... 15.64 15.66 16.05 16.08 34.1 34.0 34.2 34.2 2017 ............................................................... 16.18 – – – 34.6 – – –
Paid leave 2006 ............................................................... – – – 2.79 – – – 8.1 2007 ............................................................... 2.82 2.81 2.82 2.81 8.1 8.1 8.1 8.1 2008 ............................................................... 2.90 2.85 2.97 3.00 8.2 8.0 8.2 8.3 2009 ............................................................... 3.01 3.00 2.91 2.97 8.3 8.3 8.1 8.2 2010 ............................................................... 3.02 3.03 3.04 3.09 8.2 8.2 8.2 8.2
2011 ............................................................... 3.11 3.12 3.14 3.27 8.2 8.1 8.1 8.2 2012 ............................................................... 3.30 3.30 3.31 3.39 8.3 8.2 8.2 8.4 2013 ............................................................... 3.36 3.39 3.40 3.46 8.3 8.3 8.3 8.3 2014 ............................................................... 3.48 3.50 3.56 3.69 8.4 8.3 8.4 8.4 2015 ............................................................... 3.80 3.79 3.75 3.78 8.4 8.4 8.6 8.6 2016 ............................................................... 3.89 3.86 3.96 3.98 8.5 8.4 8.5 8.5 2017 ............................................................... 3.97 – – – 8.5 – – –
Supplemental pay 2006 ............................................................... – – – 1.77 – – – 5.1 2007 ............................................................... 1.82 1.79 1.79 1.83 5.2 5.2 5.1 5.3 2008 ............................................................... 1.84 2.17 1.94 1.90 5.2 6.1 5.4 5.3 2009 ............................................................... 1.84 1.85 1.85 1.90 5.1 5.1 5.2 5.2 2010 ............................................................... 1.83 1.59 1.66 1.72 5.0 4.3 4.5 4.6
2011 ............................................................... 1.70 2.01 1.99 1.98 4.5 5.2 5.1 5.0 2012 ............................................................... 2.02 2.09 2.08 2.11 5.1 5.2 5.2 5.2 2013 ............................................................... 2.12 2.10 2.02 2.26 5.2 5.2 5.0 5.4 2014 ............................................................... 2.13 2.24 2.26 3.12 5.1 5.3 5.3 7.1 2015 ............................................................... 3.25 3.23 2.18 2.03 7.2 7.2 5.0 4.6 2016 ............................................................... 3.31 3.34 3.42 3.43 7.2 7.3 7.3 7.3
See footnotes at end of table.
-205-

Supplemental table 19. Private financial activities industry workers, by occupational group: employer costs per hoursworked for employee compensation and costs as a percentage of total compensation, 2006-2017
All workers
Compensationcomponent
Cost per hour worked Percent of total compensation
Mar. June Sep. Dec. Mar. June Sep. Dec.
Supplemental pay 2017 ............................................................... 3.51 – – – 7.5 – – –
Insurance 2006 ............................................................... – – – 2.63 – – – 7.6 2007 ............................................................... 2.71 2.74 2.74 2.75 7.8 7.9 7.8 7.9 2008 ............................................................... 2.81 2.82 2.84 2.80 7.9 7.9 7.9 7.8 2009 ............................................................... 2.89 2.90 2.91 2.92 8.0 8.0 8.1 8.0 2010 ............................................................... 3.04 3.05 3.06 3.11 8.3 8.3 8.3 8.2
2011 ............................................................... 3.14 3.27 3.27 3.42 8.3 8.5 8.5 8.6 2012 ............................................................... 3.38 3.37 3.36 3.43 8.5 8.4 8.4 8.5 2013 ............................................................... 3.44 3.42 3.46 3.55 8.5 8.4 8.5 8.5 2014 ............................................................... 3.56 3.62 3.60 3.68 8.6 8.6 8.5 8.4 2015 ............................................................... 3.74 3.76 3.76 3.74 8.3 8.3 8.6 8.5 2016 ............................................................... 3.82 3.85 3.89 3.89 8.3 8.4 8.3 8.3 2017 ............................................................... 3.90 – – – 8.3 – – –
Retirement and savings 2006 ............................................................... – – – 1.58 – – – 4.6 2007 ............................................................... 1.45 1.46 1.48 1.51 4.2 4.2 4.2 4.4 2008 ............................................................... 1.48 1.51 1.52 1.48 4.2 4.2 4.2 4.1 2009 ............................................................... 1.49 1.52 1.51 1.48 4.1 4.2 4.2 4.1 2010 ............................................................... 1.59 1.61 1.62 1.63 4.3 4.4 4.4 4.3
2011 ............................................................... 1.65 1.69 1.68 1.73 4.4 4.4 4.3 4.4 2012 ............................................................... 1.68 1.60 1.61 1.61 4.2 4.0 4.0 4.0 2013 ............................................................... 1.64 1.67 1.70 1.70 4.1 4.1 4.2 4.1 2014 ............................................................... 1.68 1.67 1.69 1.73 4.0 4.0 4.0 3.9 2015 ............................................................... 1.78 1.80 1.77 1.69 3.9 4.0 4.1 3.8 2016 ............................................................... 1.71 1.70 1.86 1.85 3.7 3.7 4.0 3.9 2017 ............................................................... 1.86 – – – 4.0 – – –
Legally required benefits 2006 ............................................................... – – – 2.30 – – – 6.7 2007 ............................................................... 2.32 2.32 2.32 2.32 6.6 6.7 6.7 6.7 2008 ............................................................... 2.36 2.37 2.38 2.38 6.6 6.6 6.6 6.6 2009 ............................................................... 2.40 2.41 2.40 2.42 6.6 6.6 6.7 6.6 2010 ............................................................... 2.44 2.48 2.47 2.49 6.7 6.7 6.7 6.6
2011 ............................................................... 2.52 2.55 2.56 2.63 6.7 6.6 6.6 6.6 2012 ............................................................... 2.66 2.70 2.70 2.69 6.7 6.7 6.7 6.7 2013 ............................................................... 2.70 2.72 2.74 2.76 6.7 6.7 6.7 6.7 2014 ............................................................... 2.77 2.78 2.80 2.84 6.7 6.6 6.6 6.4 2015 ............................................................... 2.88 2.88 2.85 2.87 6.4 6.4 6.5 6.5 2016 ............................................................... 2.91 2.91 2.92 2.92 6.3 6.3 6.2 6.2 2017 ............................................................... 2.95 – – – 6.3 – – –
Note: The sum of individual items may not equal totals due to rounding. Dashes indicate data are not available.
-206-

Supplemental table 19. Private financial activities industry workers, by occupational group: employer costs per hoursworked for employee compensation and costs as a percentage of total compensation, 2006-2017 -- Continued
Management, professional, and related occupations1
Compensationcomponent
Cost per hour worked Percent of total compensation
Mar. June Sep. Dec. Mar. June Sep. Dec.
Total compensation 2006 ............................................................... – – – $53.77 – – – 100.0 2007 ............................................................... 54.93 54.28 54.41 53.38 100.0 100.0 100.0 100.0 2008 ............................................................... 55.84 55.66 56.75 56.36 100.0 100.0 100.0 100.0 2009 ............................................................... 56.49 56.78 55.32 55.33 100.0 100.0 100.0 100.0 2010 ............................................................... 56.22 55.78 56.14 57.15 100.0 100.0 100.0 100.0
2011 ............................................................... 57.21 58.40 58.48 58.28 100.0 100.0 100.0 100.0 2012 ............................................................... 58.74 59.43 59.41 59.70 100.0 100.0 100.0 100.0 2013 ............................................................... 59.80 60.74 60.53 62.65 100.0 100.0 100.0 100.0 2014 ............................................................... 62.40 63.59 64.36 67.64 100.0 100.0 100.0 100.0 2015 ............................................................... 68.80 69.51 66.12 66.06 100.0 100.0 100.0 100.0 2016 ............................................................... 70.97 71.57 72.68 73.05 100.0 100.0 100.0 100.0 2017 ............................................................... 73.17 – – – 100.0 – – –
Wages and salaries 2006 ............................................................... – – – 36.06 – – – 67.1 2007 ............................................................... 37.16 36.62 36.71 35.67 67.6 67.5 67.5 66.8 2008 ............................................................... 37.57 36.74 37.99 38.00 67.3 66.0 66.9 67.4 2009 ............................................................... 38.11 38.26 37.15 37.37 67.5 67.4 67.2 67.5 2010 ............................................................... 37.80 37.83 37.94 38.62 67.2 67.8 67.6 67.6
2011 ............................................................... 38.70 38.93 39.09 39.04 67.6 66.7 66.8 67.0 2012 ............................................................... 39.25 39.85 39.81 39.86 66.8 67.1 67.0 66.8 2013 ............................................................... 39.91 40.59 40.52 41.54 66.7 66.8 66.9 66.3 2014 ............................................................... 41.73 42.50 43.09 43.77 66.9 66.8 66.9 64.7 2015 ............................................................... 44.16 44.71 44.39 45.01 64.2 64.3 67.1 68.1 2016 ............................................................... 45.91 46.41 46.83 47.10 64.7 64.8 64.4 64.5 2017 ............................................................... 46.84 – – – 64.0 – – –
Total benefits 2006 ............................................................... – – – 17.71 – – – 32.9 2007 ............................................................... 17.77 17.66 17.71 17.72 32.4 32.5 32.5 33.2 2008 ............................................................... 18.27 18.91 18.77 18.36 32.7 34.0 33.1 32.6 2009 ............................................................... 18.38 18.52 18.17 17.96 32.5 32.6 32.8 32.5 2010 ............................................................... 18.42 17.95 18.20 18.54 32.8 32.2 32.4 32.4
2011 ............................................................... 18.51 19.47 19.39 19.25 32.4 33.3 33.2 33.0 2012 ............................................................... 19.49 19.58 19.60 19.84 33.2 32.9 33.0 33.2 2013 ............................................................... 19.89 20.15 20.02 21.11 33.3 33.2 33.1 33.7 2014 ............................................................... 20.67 21.09 21.28 23.87 33.1 33.2 33.1 35.3 2015 ............................................................... 24.64 24.80 21.73 21.05 35.8 35.7 32.9 31.9 2016 ............................................................... 25.07 25.16 25.84 25.95 35.3 35.2 35.6 35.5 2017 ............................................................... 26.33 – – – 36.0 – – –
Paid leave 2006 ............................................................... – – – 4.79 – – – 8.9 2007 ............................................................... 4.86 4.82 4.83 4.74 8.8 8.9 8.9 8.9 2008 ............................................................... 4.99 4.85 5.20 5.24 8.9 8.7 9.2 9.3 2009 ............................................................... 5.25 5.27 4.99 5.00 9.3 9.3 9.0 9.0 2010 ............................................................... 5.08 5.08 5.11 5.14 9.0 9.1 9.1 9.0
2011 ............................................................... 5.15 5.17 5.19 5.24 9.0 8.9 8.9 9.0 2012 ............................................................... 5.35 5.34 5.34 5.47 9.1 9.0 9.0 9.2 2013 ............................................................... 5.45 5.57 5.57 5.74 9.1 9.2 9.2 9.2 2014 ............................................................... 5.79 5.89 5.99 6.20 9.3 9.3 9.3 9.2 2015 ............................................................... 6.29 6.33 6.21 6.21 9.1 9.1 9.4 9.4 2016 ............................................................... 6.43 6.46 6.58 6.65 9.1 9.0 9.1 9.1 2017 ............................................................... 6.71 – – – 9.2 – – –
Supplemental pay 2006 ............................................................... – – – 3.45 – – – 6.4 2007 ............................................................... 3.54 3.43 3.44 3.47 6.4 6.3 6.3 6.5 2008 ............................................................... 3.68 4.33 3.80 3.58 6.6 7.8 6.7 6.4 2009 ............................................................... 3.49 3.53 3.53 3.33 6.2 6.2 6.4 6.0 2010 ............................................................... 3.35 2.80 3.00 3.14 6.0 5.0 5.4 5.5
2011 ............................................................... 3.00 3.73 3.66 3.48 5.2 6.4 6.3 6.0 2012 ............................................................... 3.61 3.77 3.77 3.73 6.1 6.3 6.4 6.2 2013 ............................................................... 3.76 3.77 3.54 4.15 6.3 6.2 5.8 6.6 2014 ............................................................... 3.69 3.87 3.90 6.09 5.9 6.1 6.1 9.0 2015 ............................................................... 6.63 6.61 3.75 3.24 9.6 9.5 5.7 4.9 2016 ............................................................... 6.80 6.80 7.04 7.08 9.6 9.5 9.7 9.7
See footnotes at end of table.
-207-
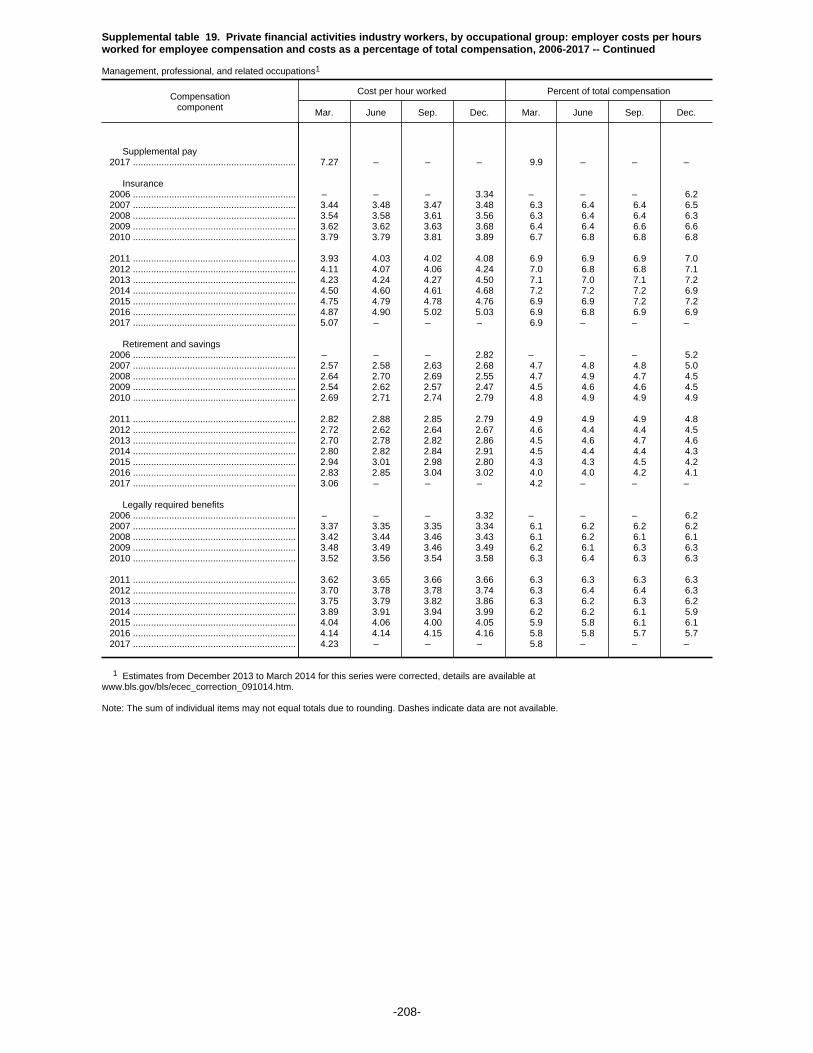
Supplemental table 19. Private financial activities industry workers, by occupational group: employer costs per hoursworked for employee compensation and costs as a percentage of total compensation, 2006-2017 -- Continued
Management, professional, and related occupations1
Compensationcomponent
Cost per hour worked Percent of total compensation
Mar. June Sep. Dec. Mar. June Sep. Dec.
Supplemental pay 2017 ............................................................... 7.27 – – – 9.9 – – –
Insurance 2006 ............................................................... – – – 3.34 – – – 6.2 2007 ............................................................... 3.44 3.48 3.47 3.48 6.3 6.4 6.4 6.5 2008 ............................................................... 3.54 3.58 3.61 3.56 6.3 6.4 6.4 6.3 2009 ............................................................... 3.62 3.62 3.63 3.68 6.4 6.4 6.6 6.6 2010 ............................................................... 3.79 3.79 3.81 3.89 6.7 6.8 6.8 6.8
2011 ............................................................... 3.93 4.03 4.02 4.08 6.9 6.9 6.9 7.0 2012 ............................................................... 4.11 4.07 4.06 4.24 7.0 6.8 6.8 7.1 2013 ............................................................... 4.23 4.24 4.27 4.50 7.1 7.0 7.1 7.2 2014 ............................................................... 4.50 4.60 4.61 4.68 7.2 7.2 7.2 6.9 2015 ............................................................... 4.75 4.79 4.78 4.76 6.9 6.9 7.2 7.2 2016 ............................................................... 4.87 4.90 5.02 5.03 6.9 6.8 6.9 6.9 2017 ............................................................... 5.07 – – – 6.9 – – –
Retirement and savings 2006 ............................................................... – – – 2.82 – – – 5.2 2007 ............................................................... 2.57 2.58 2.63 2.68 4.7 4.8 4.8 5.0 2008 ............................................................... 2.64 2.70 2.69 2.55 4.7 4.9 4.7 4.5 2009 ............................................................... 2.54 2.62 2.57 2.47 4.5 4.6 4.6 4.5 2010 ............................................................... 2.69 2.71 2.74 2.79 4.8 4.9 4.9 4.9
2011 ............................................................... 2.82 2.88 2.85 2.79 4.9 4.9 4.9 4.8 2012 ............................................................... 2.72 2.62 2.64 2.67 4.6 4.4 4.4 4.5 2013 ............................................................... 2.70 2.78 2.82 2.86 4.5 4.6 4.7 4.6 2014 ............................................................... 2.80 2.82 2.84 2.91 4.5 4.4 4.4 4.3 2015 ............................................................... 2.94 3.01 2.98 2.80 4.3 4.3 4.5 4.2 2016 ............................................................... 2.83 2.85 3.04 3.02 4.0 4.0 4.2 4.1 2017 ............................................................... 3.06 – – – 4.2 – – –
Legally required benefits 2006 ............................................................... – – – 3.32 – – – 6.2 2007 ............................................................... 3.37 3.35 3.35 3.34 6.1 6.2 6.2 6.2 2008 ............................................................... 3.42 3.44 3.46 3.43 6.1 6.2 6.1 6.1 2009 ............................................................... 3.48 3.49 3.46 3.49 6.2 6.1 6.3 6.3 2010 ............................................................... 3.52 3.56 3.54 3.58 6.3 6.4 6.3 6.3
2011 ............................................................... 3.62 3.65 3.66 3.66 6.3 6.3 6.3 6.3 2012 ............................................................... 3.70 3.78 3.78 3.74 6.3 6.4 6.4 6.3 2013 ............................................................... 3.75 3.79 3.82 3.86 6.3 6.2 6.3 6.2 2014 ............................................................... 3.89 3.91 3.94 3.99 6.2 6.2 6.1 5.9 2015 ............................................................... 4.04 4.06 4.00 4.05 5.9 5.8 6.1 6.1 2016 ............................................................... 4.14 4.14 4.15 4.16 5.8 5.8 5.7 5.7 2017 ............................................................... 4.23 – – – 5.8 – – –
1 Estimates from December 2013 to March 2014 for this series were corrected, details are available atwww.bls.gov/bls/ecec_correction_091014.htm.
Note: The sum of individual items may not equal totals due to rounding. Dashes indicate data are not available.
-208-

Supplemental table 19. Private financial activities industry workers, by occupational group: employer costs per hoursworked for employee compensation and costs as a percentage of total compensation, 2006-2017 -- Continued
Management, business, and financial occcupations1
Compensationcomponent
Cost per hour worked Percent of total compensation
Mar. June Sep. Dec. Mar. June Sep. Dec.
Total compensation 2006 ............................................................... – – – $54.38 – – – 100.0 2007 ............................................................... 55.72 54.74 54.97 53.58 100.0 100.0 100.0 100.0 2008 ............................................................... 56.54 56.05 57.59 57.39 100.0 100.0 100.0 100.0 2009 ............................................................... 57.38 57.60 55.75 55.97 100.0 100.0 100.0 100.0 2010 ............................................................... 56.97 56.34 56.78 57.64 100.0 100.0 100.0 100.0
2011 ............................................................... 57.43 58.84 58.84 58.49 100.0 100.0 100.0 100.0 2012 ............................................................... 58.96 59.76 59.70 60.06 100.0 100.0 100.0 100.0 2013 ............................................................... 59.99 61.15 60.76 63.31 100.0 100.0 100.0 100.0 2014 ............................................................... 62.83 64.30 65.17 69.25 100.0 100.0 100.0 100.0 2015 ............................................................... 70.59 71.33 67.08 66.85 100.0 100.0 100.0 100.0 2016 ............................................................... 73.03 73.58 74.84 75.36 100.0 100.0 100.0 100.0 2017 ............................................................... 75.41 – – – 100.0 – – –
Wages and salaries 2006 ............................................................... – – – 36.39 – – – 66.9 2007 ............................................................... 37.68 36.90 37.05 35.68 67.6 67.4 67.4 66.6 2008 ............................................................... 37.99 36.83 38.43 38.55 67.2 65.7 66.7 67.2 2009 ............................................................... 38.62 38.69 37.28 37.68 67.3 67.2 66.9 67.3 2010 ............................................................... 38.17 38.11 38.24 38.89 67.0 67.7 67.3 67.5
2011 ............................................................... 38.83 39.09 39.21 39.16 67.6 66.4 66.6 66.9 2012 ............................................................... 39.31 39.98 39.92 40.01 66.7 66.9 66.9 66.6 2013 ............................................................... 39.94 40.78 40.62 41.88 66.6 66.7 66.9 66.1 2014 ............................................................... 42.05 43.02 43.68 44.55 66.9 66.9 67.0 64.3 2015 ............................................................... 44.96 45.55 45.17 45.86 63.7 63.9 67.3 68.6 2016 ............................................................... 46.95 47.42 47.83 48.20 64.3 64.4 63.9 64.0 2017 ............................................................... 47.83 – – – 63.4 – – –
Total benefits 2006 ............................................................... – – – 17.99 – – – 33.1 2007 ............................................................... 18.04 17.84 17.93 17.90 32.4 32.6 32.6 33.4 2008 ............................................................... 18.55 19.21 19.17 18.83 32.8 34.3 33.3 32.8 2009 ............................................................... 18.76 18.90 18.48 18.30 32.7 32.8 33.1 32.7 2010 ............................................................... 18.80 18.22 18.55 18.76 33.0 32.3 32.7 32.5
2011 ............................................................... 18.60 19.75 19.64 19.34 32.4 33.6 33.4 33.1 2012 ............................................................... 19.66 19.77 19.78 20.05 33.3 33.1 33.1 33.4 2013 ............................................................... 20.05 20.37 20.14 21.43 33.4 33.3 33.1 33.9 2014 ............................................................... 20.78 21.27 21.49 24.69 33.1 33.1 33.0 35.7 2015 ............................................................... 25.64 25.78 21.91 20.99 36.3 36.1 32.7 31.4 2016 ............................................................... 26.08 26.16 27.01 27.16 35.7 35.6 36.1 36.0 2017 ............................................................... 27.58 – – – 36.6 – – –
Paid leave 2006 ............................................................... – – – 4.80 – – – 8.8 2007 ............................................................... 4.89 4.82 4.84 4.72 8.8 8.8 8.8 8.8 2008 ............................................................... 5.02 4.85 5.29 5.37 8.9 8.6 9.2 9.4 2009 ............................................................... 5.37 5.37 5.02 5.04 9.4 9.3 9.0 9.0 2010 ............................................................... 5.13 5.12 5.15 5.14 9.0 9.1 9.1 8.9
2011 ............................................................... 5.13 5.16 5.17 5.20 8.9 8.8 8.8 8.9 2012 ............................................................... 5.31 5.29 5.28 5.43 9.0 8.9 8.9 9.0 2013 ............................................................... 5.39 5.53 5.52 5.72 9.0 9.0 9.1 9.0 2014 ............................................................... 5.76 5.89 6.00 6.25 9.2 9.2 9.2 9.0 2015 ............................................................... 6.35 6.40 6.25 6.22 9.0 9.0 9.3 9.3 2016 ............................................................... 6.51 6.54 6.67 6.76 8.9 8.9 8.9 9.0 2017 ............................................................... 6.81 – – – 9.0 – – –
Supplemental pay 2006 ............................................................... – – – 3.81 – – – 7.0 2007 ............................................................... 3.86 3.71 3.72 3.77 6.9 6.8 6.8 7.0 2008 ............................................................... 4.01 4.70 4.17 3.95 7.1 8.4 7.2 6.9 2009 ............................................................... 3.84 3.87 3.87 3.67 6.7 6.7 6.9 6.5 2010 ............................................................... 3.72 3.06 3.33 3.48 6.5 5.4 5.9 6.0
2011 ............................................................... 3.24 4.16 4.08 3.83 5.6 7.1 6.9 6.6 2012 ............................................................... 4.00 4.19 4.19 4.12 6.8 7.0 7.0 6.9 2013 ............................................................... 4.16 4.18 3.89 4.63 6.9 6.8 6.4 7.3 2014 ............................................................... 3.99 4.21 4.25 6.99 6.4 6.5 6.5 10.1 2015 ............................................................... 7.67 7.63 4.01 3.32 10.9 10.7 6.0 5.0 2016 ............................................................... 7.86 7.86 8.20 8.24 10.8 10.7 11.0 10.9
See footnotes at end of table.
-209-

Supplemental table 19. Private financial activities industry workers, by occupational group: employer costs per hoursworked for employee compensation and costs as a percentage of total compensation, 2006-2017 -- Continued
Management, business, and financial occcupations1
Compensationcomponent
Cost per hour worked Percent of total compensation
Mar. June Sep. Dec. Mar. June Sep. Dec.
Supplemental pay 2017 ............................................................... 8.46 – – – 11.2 – – –
Insurance 2006 ............................................................... – – – 3.32 – – – 6.1 2007 ............................................................... 3.42 3.45 3.45 3.47 6.1 6.3 6.3 6.5 2008 ............................................................... 3.52 3.56 3.59 3.54 6.2 6.4 6.2 6.2 2009 ............................................................... 3.60 3.60 3.61 3.65 6.3 6.2 6.5 6.5 2010 ............................................................... 3.75 3.74 3.77 3.82 6.6 6.6 6.6 6.6
2011 ............................................................... 3.86 3.95 3.95 4.00 6.7 6.7 6.7 6.8 2012 ............................................................... 4.03 3.98 3.97 4.15 6.8 6.7 6.6 6.9 2013 ............................................................... 4.13 4.14 4.17 4.40 6.9 6.8 6.9 7.0 2014 ............................................................... 4.40 4.50 4.50 4.58 7.0 7.0 6.9 6.6 2015 ............................................................... 4.66 4.70 4.69 4.64 6.6 6.6 7.0 6.9 2016 ............................................................... 4.76 4.80 4.96 4.97 6.5 6.5 6.6 6.6 2017 ............................................................... 5.00 – – – 6.6 – – –
Retirement and savings 2006 ............................................................... – – – 2.77 – – – 5.1 2007 ............................................................... 2.53 2.53 2.59 2.64 4.5 4.6 4.7 4.9 2008 ............................................................... 2.60 2.68 2.68 2.56 4.6 4.8 4.6 4.5 2009 ............................................................... 2.50 2.60 2.55 2.46 4.4 4.5 4.6 4.4 2010 ............................................................... 2.69 2.74 2.77 2.75 4.7 4.9 4.9 4.8
2011 ............................................................... 2.76 2.84 2.80 2.69 4.8 4.8 4.8 4.6 2012 ............................................................... 2.67 2.57 2.59 2.65 4.5 4.3 4.3 4.4 2013 ............................................................... 2.67 2.76 2.79 2.85 4.5 4.5 4.6 4.5 2014 ............................................................... 2.78 2.79 2.83 2.90 4.4 4.3 4.3 4.2 2015 ............................................................... 2.92 3.00 2.97 2.76 4.1 4.2 4.4 4.1 2016 ............................................................... 2.80 2.81 3.02 3.02 3.8 3.8 4.0 4.0 2017 ............................................................... 3.05 – – – 4.0 – – –
Legally required benefits 2006 ............................................................... – – – 3.30 – – – 6.1 2007 ............................................................... 3.35 3.33 3.33 3.31 6.0 6.1 6.1 6.2 2008 ............................................................... 3.40 3.43 3.44 3.42 6.0 6.1 6.0 6.0 2009 ............................................................... 3.46 3.46 3.44 3.48 6.0 6.0 6.2 6.2 2010 ............................................................... 3.51 3.56 3.52 3.57 6.2 6.3 6.2 6.2
2011 ............................................................... 3.60 3.64 3.64 3.62 6.3 6.2 6.2 6.2 2012 ............................................................... 3.66 3.75 3.74 3.70 6.2 6.3 6.3 6.2 2013 ............................................................... 3.70 3.75 3.77 3.83 6.2 6.1 6.2 6.1 2014 ............................................................... 3.85 3.89 3.91 3.98 6.1 6.0 6.0 5.7 2015 ............................................................... 4.03 4.06 3.99 4.04 5.7 5.7 5.9 6.0 2016 ............................................................... 4.15 4.15 4.16 4.18 5.7 5.6 5.6 5.5 2017 ............................................................... 4.24 – – – 5.6 – – –
1 Estimates from December 2013 to March 2014 for this series were corrected, details are available atwww.bls.gov/bls/ecec_correction_091014.htm.
Note: The sum of individual items may not equal totals due to rounding. Dashes indicate data are not available.
-210-

Supplemental table 19. Private financial activities industry workers, by occupational group: employer costs per hoursworked for employee compensation and costs as a percentage of total compensation, 2006-2017 -- Continued
Professional and related occupations1
Compensationcomponent
Cost per hour worked Percent of total compensation
Mar. June Sep. Dec. Mar. June Sep. Dec.
Total compensation 2006 ............................................................... – – – $51.43 – – – 100.0 2007 ............................................................... 51.87 52.49 52.25 52.61 100.0 100.0 100.0 100.0 2008 ............................................................... 53.17 54.16 53.47 52.64 100.0 100.0 100.0 100.0 2009 ............................................................... 53.26 53.80 53.74 53.00 100.0 100.0 100.0 100.0 2010 ............................................................... 53.53 53.79 53.82 55.32 100.0 100.0 100.0 100.0
2011 ............................................................... 56.41 56.77 57.16 57.53 100.0 100.0 100.0 100.0 2012 ............................................................... 57.93 58.25 58.34 58.33 100.0 100.0 100.0 100.0 2013 ............................................................... 59.07 59.15 59.65 60.15 100.0 100.0 100.0 100.0 2014 ............................................................... 60.75 60.86 61.33 61.60 100.0 100.0 100.0 100.0 2015 ............................................................... 62.12 62.68 62.53 63.13 100.0 100.0 100.0 100.0 2016 ............................................................... 63.32 64.07 64.86 64.70 100.0 100.0 100.0 100.0 2017 ............................................................... 65.14 – – – 100.0 – – –
Wages and salaries 2006 ............................................................... – – – 34.79 – – – 67.6 2007 ............................................................... 35.14 35.53 35.39 35.59 67.7 67.7 67.7 67.7 2008 ............................................................... 35.96 36.41 36.27 35.98 67.6 67.2 67.8 68.4 2009 ............................................................... 36.27 36.68 36.69 36.25 68.1 68.2 68.3 68.4 2010 ............................................................... 36.45 36.83 36.87 37.61 68.1 68.5 68.5 68.0
2011 ............................................................... 38.20 38.35 38.66 38.61 67.7 67.5 67.6 67.1 2012 ............................................................... 39.04 39.37 39.41 39.30 67.4 67.6 67.6 67.4 2013 ............................................................... 39.79 39.85 40.11 40.28 67.4 67.4 67.2 67.0 2014 ............................................................... 40.50 40.47 40.85 40.83 66.7 66.5 66.6 66.3 2015 ............................................................... 41.18 41.56 41.49 41.83 66.3 66.3 66.4 66.3 2016 ............................................................... 42.02 42.64 43.23 43.12 66.4 66.6 66.6 66.6 2017 ............................................................... 43.30 – – – 66.5 – – –
Total benefits 2006 ............................................................... – – – 16.64 – – – 32.4 2007 ............................................................... 16.73 16.96 16.87 17.02 32.3 32.3 32.3 32.3 2008 ............................................................... 17.21 17.76 17.21 16.66 32.4 32.8 32.2 31.6 2009 ............................................................... 16.98 17.12 17.05 16.75 31.9 31.8 31.7 31.6 2010 ............................................................... 17.08 16.96 16.95 17.72 31.9 31.5 31.5 32.0
2011 ............................................................... 18.21 18.42 18.50 18.92 32.3 32.5 32.4 32.9 2012 ............................................................... 18.89 18.89 18.92 19.03 32.6 32.4 32.4 32.6 2013 ............................................................... 19.28 19.30 19.54 19.87 32.6 32.6 32.8 33.0 2014 ............................................................... 20.25 20.39 20.48 20.77 33.3 33.5 33.4 33.7 2015 ............................................................... 20.94 21.12 21.03 21.31 33.7 33.7 33.6 33.7 2016 ............................................................... 21.30 21.43 21.63 21.58 33.6 33.4 33.4 33.4 2017 ............................................................... 21.84 – – – 33.5 – – –
Paid leave 2006 ............................................................... – – – 4.75 – – – 9.2 2007 ............................................................... 4.74 4.81 4.78 4.82 9.1 9.2 9.2 9.2 2008 ............................................................... 4.89 4.89 4.87 4.79 9.2 9.0 9.1 9.1 2009 ............................................................... 4.83 4.90 4.91 4.84 9.1 9.1 9.1 9.1 2010 ............................................................... 4.89 4.93 4.93 5.15 9.1 9.2 9.2 9.3
2011 ............................................................... 5.21 5.21 5.27 5.38 9.2 9.2 9.2 9.3 2012 ............................................................... 5.50 5.54 5.54 5.60 9.5 9.5 9.5 9.6 2013 ............................................................... 5.71 5.70 5.74 5.81 9.7 9.6 9.6 9.7 2014 ............................................................... 5.89 5.87 5.94 6.00 9.7 9.7 9.7 9.7 2015 ............................................................... 6.05 6.07 6.07 6.16 9.7 9.7 9.7 9.8 2016 ............................................................... 6.17 6.20 6.26 6.27 9.7 9.7 9.6 9.7 2017 ............................................................... 6.34 – – – 9.7 – – –
Supplemental pay 2006 ............................................................... – – – 2.07 – – – 4.0 2007 ............................................................... 2.29 2.35 2.34 2.33 4.4 4.5 4.5 4.4 2008 ............................................................... 2.42 2.94 2.38 2.25 4.5 5.4 4.5 4.3 2009 ............................................................... 2.23 2.26 2.26 2.11 4.2 4.2 4.2 4.0 2010 ............................................................... 2.05 1.85 1.82 1.87 3.8 3.4 3.4 3.4
2011 ............................................................... 2.10 2.16 2.15 2.20 3.7 3.8 3.8 3.8 2012 ............................................................... 2.20 2.26 2.25 2.24 3.8 3.9 3.9 3.8 2013 ............................................................... 2.20 2.19 2.20 2.33 3.7 3.7 3.7 3.9 2014 ............................................................... 2.56 2.56 2.58 2.71 4.2 4.2 4.2 4.4 2015 ............................................................... 2.78 2.80 2.75 2.94 4.5 4.5 4.4 4.7 2016 ............................................................... 2.84 2.85 2.87 2.88 4.5 4.5 4.4 4.4
See footnotes at end of table.
-211-

Supplemental table 19. Private financial activities industry workers, by occupational group: employer costs per hoursworked for employee compensation and costs as a percentage of total compensation, 2006-2017 -- Continued
Professional and related occupations1
Compensationcomponent
Cost per hour worked Percent of total compensation
Mar. June Sep. Dec. Mar. June Sep. Dec.
Supplemental pay 2017 ............................................................... 2.95 – – – 4.5 – – –
Insurance 2006 ............................................................... – – – 3.42 – – – 6.7 2007 ............................................................... 3.53 3.57 3.54 3.56 6.8 6.8 6.8 6.8 2008 ............................................................... 3.60 3.64 3.69 3.62 6.8 6.7 6.9 6.9 2009 ............................................................... 3.72 3.72 3.69 3.77 7.0 6.9 6.9 7.1 2010 ............................................................... 3.93 3.97 3.96 4.15 7.3 7.4 7.4 7.5
2011 ............................................................... 4.18 4.30 4.27 4.38 7.4 7.6 7.5 7.6 2012 ............................................................... 4.40 4.41 4.39 4.56 7.6 7.6 7.5 7.8 2013 ............................................................... 4.64 4.62 4.67 4.86 7.9 7.8 7.8 8.1 2014 ............................................................... 4.91 5.02 5.01 5.05 8.1 8.3 8.2 8.2 2015 ............................................................... 5.06 5.10 5.10 5.18 8.1 8.1 8.2 8.2 2016 ............................................................... 5.24 5.27 5.27 5.27 8.3 8.2 8.1 8.1 2017 ............................................................... 5.30 – – – 8.1 – – –
Retirement and savings 2006 ............................................................... – – – 3.03 – – – 5.9 2007 ............................................................... 2.74 2.77 2.77 2.86 5.3 5.3 5.3 5.4 2008 ............................................................... 2.80 2.78 2.75 2.52 5.3 5.1 5.1 4.8 2009 ............................................................... 2.66 2.68 2.63 2.51 5.0 5.0 4.9 4.7 2010 ............................................................... 2.67 2.63 2.63 2.91 5.0 4.9 4.9 5.3
2011 ............................................................... 3.03 3.05 3.06 3.17 5.4 5.4 5.4 5.5 2012 ............................................................... 2.92 2.77 2.83 2.74 5.0 4.8 4.8 4.7 2013 ............................................................... 2.80 2.83 2.93 2.90 4.7 4.8 4.9 4.8 2014 ............................................................... 2.87 2.91 2.90 2.97 4.7 4.8 4.7 4.8 2015 ............................................................... 2.99 3.07 3.05 2.95 4.8 4.9 4.9 4.7 2016 ............................................................... 2.96 3.01 3.12 3.04 4.7 4.7 4.8 4.7 2017 ............................................................... 3.07 – – – 4.7 – – –
Legally required benefits 2006 ............................................................... – – – 3.38 – – – 6.6 2007 ............................................................... 3.42 3.45 3.44 3.45 6.6 6.6 6.6 6.6 2008 ............................................................... 3.50 3.52 3.52 3.49 6.6 6.5 6.6 6.6 2009 ............................................................... 3.54 3.57 3.56 3.52 6.6 6.6 6.6 6.6 2010 ............................................................... 3.54 3.59 3.60 3.64 6.6 6.7 6.7 6.6
2011 ............................................................... 3.69 3.71 3.75 3.79 6.5 6.5 6.6 6.6 2012 ............................................................... 3.87 3.91 3.91 3.89 6.7 6.7 6.7 6.7 2013 ............................................................... 3.94 3.95 4.00 3.97 6.7 6.7 6.7 6.6 2014 ............................................................... 4.01 4.02 4.05 4.04 6.6 6.6 6.6 6.6 2015 ............................................................... 4.07 4.08 4.06 4.08 6.6 6.5 6.5 6.5 2016 ............................................................... 4.09 4.10 4.11 4.11 6.5 6.4 6.3 6.4 2017 ............................................................... 4.17 – – – 6.4 – – –
1 Estimates from December 2013 to March 2014 for this series were corrected, details are available atwww.bls.gov/bls/ecec_correction_091014.htm.
Note: The sum of individual items may not equal totals due to rounding. Dashes indicate data are not available.
-212-

Supplemental table 19. Private financial activities industry workers, by occupational group: employer costs per hoursworked for employee compensation and costs as a percentage of total compensation, 2006-2017 -- Continued
Sales and office occupations
Compensationcomponent
Cost per hour worked Percent of total compensation
Mar. June Sep. Dec. Mar. June Sep. Dec.
Total compensation 2006 ............................................................... – – – $25.89 – – – 100.0 2007 ............................................................... 26.24 26.35 26.69 26.78 100.0 100.0 100.0 100.0 2008 ............................................................... 26.89 27.15 27.11 27.10 100.0 100.0 100.0 100.0 2009 ............................................................... 27.03 27.23 27.30 27.67 100.0 100.0 100.0 100.0 2010 ............................................................... 27.62 28.02 28.10 28.62 100.0 100.0 100.0 100.0
2011 ............................................................... 29.00 29.55 29.63 30.19 100.0 100.0 100.0 100.0 2012 ............................................................... 30.12 30.18 30.30 30.31 100.0 100.0 100.0 100.0 2013 ............................................................... 30.59 30.65 30.94 30.54 100.0 100.0 100.0 100.0 2014 ............................................................... 30.67 30.79 31.11 31.50 100.0 100.0 100.0 100.0 2015 ............................................................... 32.22 32.27 32.18 31.59 100.0 100.0 100.0 100.0 2016 ............................................................... 31.84 31.70 32.74 32.67 100.0 100.0 100.0 100.0 2017 ............................................................... 32.42 – – – 100.0 – – –
Wages and salaries 2006 ............................................................... – – – 17.72 – – – 68.4 2007 ............................................................... 17.98 18.02 18.31 18.30 68.5 68.4 68.6 68.3 2008 ............................................................... 18.44 18.46 18.47 18.51 68.6 68.0 68.1 68.3 2009 ............................................................... 18.37 18.51 18.57 18.82 68.0 68.0 68.0 68.0 2010 ............................................................... 18.69 19.07 19.11 19.56 67.7 68.1 68.0 68.4
2011 ............................................................... 19.78 19.96 20.03 20.35 68.2 67.5 67.6 67.4 2012 ............................................................... 20.37 20.48 20.59 20.50 67.6 67.9 68.0 67.6 2013 ............................................................... 20.68 20.77 20.95 20.63 67.6 67.8 67.7 67.6 2014 ............................................................... 20.68 20.67 20.95 21.09 67.4 67.1 67.3 67.0 2015 ............................................................... 21.74 21.73 21.65 21.26 67.5 67.3 67.3 67.3 2016 ............................................................... 21.52 21.35 22.07 22.01 67.6 67.4 67.4 67.4 2017 ............................................................... 21.76 – – – 67.1 – – –
Total benefits 2006 ............................................................... – – – 8.17 – – – 31.6 2007 ............................................................... 8.27 8.34 8.38 8.48 31.5 31.6 31.4 31.7 2008 ............................................................... 8.46 8.69 8.63 8.59 31.4 32.0 31.9 31.7 2009 ............................................................... 8.65 8.71 8.72 8.85 32.0 32.0 32.0 32.0 2010 ............................................................... 8.93 8.95 8.99 9.06 32.3 31.9 32.0 31.6
2011 ............................................................... 9.22 9.59 9.60 9.85 31.8 32.5 32.4 32.6 2012 ............................................................... 9.75 9.70 9.71 9.81 32.4 32.1 32.0 32.4 2013 ............................................................... 9.91 9.88 9.99 9.91 32.4 32.2 32.3 32.4 2014 ............................................................... 9.99 10.12 10.16 10.41 32.6 32.9 32.7 33.0 2015 ............................................................... 10.49 10.54 10.52 10.33 32.5 32.7 32.7 32.7 2016 ............................................................... 10.33 10.35 10.67 10.66 32.4 32.6 32.6 32.6 2017 ............................................................... 10.65 – – – 32.9 – – –
Paid leave 2006 ............................................................... – – – 1.94 – – – 7.5 2007 ............................................................... 1.96 1.97 1.98 2.01 7.5 7.5 7.4 7.5 2008 ............................................................... 2.03 2.02 2.03 2.02 7.5 7.4 7.5 7.4 2009 ............................................................... 2.02 2.02 2.01 2.05 7.5 7.4 7.4 7.4 2010 ............................................................... 2.08 2.11 2.12 2.14 7.5 7.5 7.6 7.5
2011 ............................................................... 2.18 2.20 2.20 2.28 7.5 7.4 7.4 7.6 2012 ............................................................... 2.28 2.28 2.30 2.33 7.6 7.5 7.6 7.7 2013 ............................................................... 2.34 2.34 2.35 2.32 7.6 7.6 7.6 7.6 2014 ............................................................... 2.33 2.32 2.36 2.44 7.6 7.5 7.6 7.8 2015 ............................................................... 2.55 2.54 2.55 2.49 7.9 7.9 7.9 7.9 2016 ............................................................... 2.52 2.46 2.59 2.57 7.9 7.8 7.9 7.9 2017 ............................................................... 2.52 – – – 7.8 – – –
Supplemental pay 2006 ............................................................... – – – 1.05 – – – 4.1 2007 ............................................................... 1.10 1.11 1.12 1.15 4.2 4.2 4.2 4.3 2008 ............................................................... 1.06 1.27 1.17 1.18 3.9 4.7 4.3 4.4 2009 ............................................................... 1.12 1.14 1.13 1.27 4.2 4.2 4.2 4.6 2010 ............................................................... 1.12 1.05 1.06 1.05 4.1 3.7 3.8 3.7
2011 ............................................................... 1.10 1.22 1.23 1.21 3.8 4.1 4.1 4.0 2012 ............................................................... 1.21 1.23 1.21 1.29 4.0 4.1 4.0 4.3 2013 ............................................................... 1.30 1.27 1.28 1.29 4.2 4.2 4.1 4.2 2014 ............................................................... 1.36 1.46 1.47 1.54 4.4 4.7 4.7 4.9 2015 ............................................................... 1.39 1.41 1.40 1.43 4.3 4.4 4.3 4.5 2016 ............................................................... 1.30 1.37 1.39 1.39 4.1 4.3 4.2 4.2
See footnotes at end of table.
-213-

Supplemental table 19. Private financial activities industry workers, by occupational group: employer costs per hoursworked for employee compensation and costs as a percentage of total compensation, 2006-2017 -- Continued
Sales and office occupations
Compensationcomponent
Cost per hour worked Percent of total compensation
Mar. June Sep. Dec. Mar. June Sep. Dec.
Supplemental pay 2017 ............................................................... 1.42 – – – 4.4 – – –
Insurance 2006 ............................................................... – – – 2.37 – – – 9.2 2007 ............................................................... 2.44 2.47 2.47 2.48 9.3 9.4 9.3 9.3 2008 ............................................................... 2.55 2.55 2.57 2.54 9.5 9.4 9.5 9.4 2009 ............................................................... 2.64 2.66 2.67 2.65 9.8 9.8 9.8 9.6 2010 ............................................................... 2.76 2.77 2.78 2.83 10.0 9.9 9.9 9.9
2011 ............................................................... 2.86 3.02 3.04 3.16 9.9 10.2 10.2 10.5 2012 ............................................................... 3.08 3.09 3.09 3.10 10.2 10.3 10.2 10.2 2013 ............................................................... 3.13 3.10 3.15 3.13 10.2 10.1 10.2 10.2 2014 ............................................................... 3.14 3.18 3.15 3.21 10.2 10.3 10.1 10.2 2015 ............................................................... 3.25 3.29 3.30 3.22 10.1 10.2 10.3 10.2 2016 ............................................................... 3.29 3.32 3.32 3.33 10.3 10.5 10.1 10.2 2017 ............................................................... 3.34 – – – 10.3 – – –
Retirement and savings 2006 ............................................................... – – – 1.05 – – – 4.1 2007 ............................................................... .98 .99 1.01 1.02 3.8 3.8 3.8 3.8 2008 ............................................................... .99 1.01 1.03 1.02 3.7 3.7 3.8 3.8 2009 ............................................................... 1.02 1.05 1.05 1.03 3.8 3.8 3.9 3.7 2010 ............................................................... 1.09 1.11 1.12 1.12 3.9 4.0 4.0 3.9
2011 ............................................................... 1.14 1.18 1.17 1.20 3.9 4.0 3.9 4.0 2012 ............................................................... 1.15 1.05 1.06 1.05 3.8 3.5 3.5 3.4 2013 ............................................................... 1.08 1.09 1.11 1.06 3.5 3.6 3.6 3.5 2014 ............................................................... 1.06 1.05 1.07 1.09 3.5 3.4 3.4 3.5 2015 ............................................................... 1.13 1.14 1.11 1.06 3.5 3.5 3.5 3.4 2016 ............................................................... 1.08 1.07 1.22 1.22 3.4 3.4 3.7 3.7 2017 ............................................................... 1.22 – – – 3.8 – – –
Legally required benefits 2006 ............................................................... – – – 1.76 – – – 6.8 2007 ............................................................... 1.78 1.80 1.80 1.81 6.8 6.8 6.8 6.8 2008 ............................................................... 1.83 1.84 1.84 1.84 6.8 6.8 6.8 6.8 2009 ............................................................... 1.84 1.86 1.85 1.85 6.8 6.8 6.8 6.7 2010 ............................................................... 1.88 1.91 1.90 1.92 6.8 6.8 6.8 6.7
2011 ............................................................... 1.94 1.97 1.97 2.01 6.7 6.7 6.7 6.6 2012 ............................................................... 2.03 2.04 2.05 2.05 6.7 6.8 6.8 6.8 2013 ............................................................... 2.07 2.08 2.09 2.10 6.8 6.8 6.8 6.9 2014 ............................................................... 2.10 2.11 2.11 2.13 6.9 6.9 6.8 6.8 2015 ............................................................... 2.16 2.16 2.15 2.13 6.7 6.7 6.7 6.7 2016 ............................................................... 2.14 2.13 2.15 2.16 6.7 6.7 6.6 6.6 2017 ............................................................... 2.15 – – – 6.6 – – –
Note: The sum of individual items may not equal totals due to rounding. Dashes indicate data are not available.
-214-
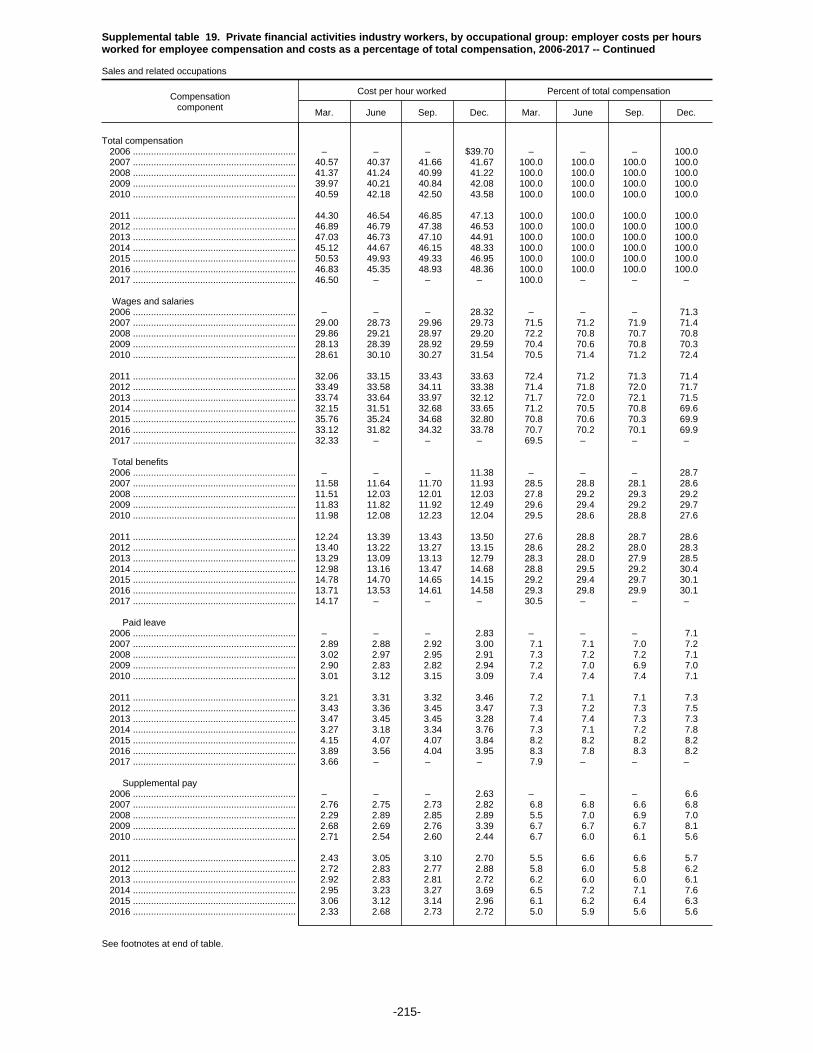
Supplemental table 19. Private financial activities industry workers, by occupational group: employer costs per hoursworked for employee compensation and costs as a percentage of total compensation, 2006-2017 -- Continued
Sales and related occupations
Compensationcomponent
Cost per hour worked Percent of total compensation
Mar. June Sep. Dec. Mar. June Sep. Dec.
Total compensation 2006 ............................................................... – – – $39.70 – – – 100.0 2007 ............................................................... 40.57 40.37 41.66 41.67 100.0 100.0 100.0 100.0 2008 ............................................................... 41.37 41.24 40.99 41.22 100.0 100.0 100.0 100.0 2009 ............................................................... 39.97 40.21 40.84 42.08 100.0 100.0 100.0 100.0 2010 ............................................................... 40.59 42.18 42.50 43.58 100.0 100.0 100.0 100.0
2011 ............................................................... 44.30 46.54 46.85 47.13 100.0 100.0 100.0 100.0 2012 ............................................................... 46.89 46.79 47.38 46.53 100.0 100.0 100.0 100.0 2013 ............................................................... 47.03 46.73 47.10 44.91 100.0 100.0 100.0 100.0 2014 ............................................................... 45.12 44.67 46.15 48.33 100.0 100.0 100.0 100.0 2015 ............................................................... 50.53 49.93 49.33 46.95 100.0 100.0 100.0 100.0 2016 ............................................................... 46.83 45.35 48.93 48.36 100.0 100.0 100.0 100.0 2017 ............................................................... 46.50 – – – 100.0 – – –
Wages and salaries 2006 ............................................................... – – – 28.32 – – – 71.3 2007 ............................................................... 29.00 28.73 29.96 29.73 71.5 71.2 71.9 71.4 2008 ............................................................... 29.86 29.21 28.97 29.20 72.2 70.8 70.7 70.8 2009 ............................................................... 28.13 28.39 28.92 29.59 70.4 70.6 70.8 70.3 2010 ............................................................... 28.61 30.10 30.27 31.54 70.5 71.4 71.2 72.4
2011 ............................................................... 32.06 33.15 33.43 33.63 72.4 71.2 71.3 71.4 2012 ............................................................... 33.49 33.58 34.11 33.38 71.4 71.8 72.0 71.7 2013 ............................................................... 33.74 33.64 33.97 32.12 71.7 72.0 72.1 71.5 2014 ............................................................... 32.15 31.51 32.68 33.65 71.2 70.5 70.8 69.6 2015 ............................................................... 35.76 35.24 34.68 32.80 70.8 70.6 70.3 69.9 2016 ............................................................... 33.12 31.82 34.32 33.78 70.7 70.2 70.1 69.9 2017 ............................................................... 32.33 – – – 69.5 – – –
Total benefits 2006 ............................................................... – – – 11.38 – – – 28.7 2007 ............................................................... 11.58 11.64 11.70 11.93 28.5 28.8 28.1 28.6 2008 ............................................................... 11.51 12.03 12.01 12.03 27.8 29.2 29.3 29.2 2009 ............................................................... 11.83 11.82 11.92 12.49 29.6 29.4 29.2 29.7 2010 ............................................................... 11.98 12.08 12.23 12.04 29.5 28.6 28.8 27.6
2011 ............................................................... 12.24 13.39 13.43 13.50 27.6 28.8 28.7 28.6 2012 ............................................................... 13.40 13.22 13.27 13.15 28.6 28.2 28.0 28.3 2013 ............................................................... 13.29 13.09 13.13 12.79 28.3 28.0 27.9 28.5 2014 ............................................................... 12.98 13.16 13.47 14.68 28.8 29.5 29.2 30.4 2015 ............................................................... 14.78 14.70 14.65 14.15 29.2 29.4 29.7 30.1 2016 ............................................................... 13.71 13.53 14.61 14.58 29.3 29.8 29.9 30.1 2017 ............................................................... 14.17 – – – 30.5 – – –
Paid leave 2006 ............................................................... – – – 2.83 – – – 7.1 2007 ............................................................... 2.89 2.88 2.92 3.00 7.1 7.1 7.0 7.2 2008 ............................................................... 3.02 2.97 2.95 2.91 7.3 7.2 7.2 7.1 2009 ............................................................... 2.90 2.83 2.82 2.94 7.2 7.0 6.9 7.0 2010 ............................................................... 3.01 3.12 3.15 3.09 7.4 7.4 7.4 7.1
2011 ............................................................... 3.21 3.31 3.32 3.46 7.2 7.1 7.1 7.3 2012 ............................................................... 3.43 3.36 3.45 3.47 7.3 7.2 7.3 7.5 2013 ............................................................... 3.47 3.45 3.45 3.28 7.4 7.4 7.3 7.3 2014 ............................................................... 3.27 3.18 3.34 3.76 7.3 7.1 7.2 7.8 2015 ............................................................... 4.15 4.07 4.07 3.84 8.2 8.2 8.2 8.2 2016 ............................................................... 3.89 3.56 4.04 3.95 8.3 7.8 8.3 8.2 2017 ............................................................... 3.66 – – – 7.9 – – –
Supplemental pay 2006 ............................................................... – – – 2.63 – – – 6.6 2007 ............................................................... 2.76 2.75 2.73 2.82 6.8 6.8 6.6 6.8 2008 ............................................................... 2.29 2.89 2.85 2.89 5.5 7.0 6.9 7.0 2009 ............................................................... 2.68 2.69 2.76 3.39 6.7 6.7 6.7 8.1 2010 ............................................................... 2.71 2.54 2.60 2.44 6.7 6.0 6.1 5.6
2011 ............................................................... 2.43 3.05 3.10 2.70 5.5 6.6 6.6 5.7 2012 ............................................................... 2.72 2.83 2.77 2.88 5.8 6.0 5.8 6.2 2013 ............................................................... 2.92 2.83 2.81 2.72 6.2 6.0 6.0 6.1 2014 ............................................................... 2.95 3.23 3.27 3.69 6.5 7.2 7.1 7.6 2015 ............................................................... 3.06 3.12 3.14 2.96 6.1 6.2 6.4 6.3 2016 ............................................................... 2.33 2.68 2.73 2.72 5.0 5.9 5.6 5.6
See footnotes at end of table.
-215-

Supplemental table 19. Private financial activities industry workers, by occupational group: employer costs per hoursworked for employee compensation and costs as a percentage of total compensation, 2006-2017 -- Continued
Sales and related occupations
Compensationcomponent
Cost per hour worked Percent of total compensation
Mar. June Sep. Dec. Mar. June Sep. Dec.
Supplemental pay 2017 ............................................................... 2.74 – – – 5.9 – – –
Insurance 2006 ............................................................... – – – 2.18 – – – 5.5 2007 ............................................................... 2.25 2.28 2.27 2.28 5.5 5.6 5.4 5.5 2008 ............................................................... 2.39 2.37 2.40 2.32 5.8 5.7 5.9 5.6 2009 ............................................................... 2.40 2.40 2.43 2.31 6.0 6.0 6.0 5.5 2010 ............................................................... 2.40 2.44 2.47 2.45 5.9 5.8 5.8 5.6
2011 ............................................................... 2.51 2.74 2.73 2.79 5.7 5.9 5.8 5.9 2012 ............................................................... 2.74 2.78 2.74 2.57 5.8 5.9 5.8 5.5 2013 ............................................................... 2.62 2.55 2.56 2.59 5.6 5.5 5.4 5.8 2014 ............................................................... 2.57 2.60 2.62 2.75 5.7 5.8 5.7 5.7 2015 ............................................................... 2.84 2.81 2.81 2.93 5.6 5.6 5.7 6.2 2016 ............................................................... 3.02 3.00 3.04 3.10 6.4 6.6 6.2 6.4 2017 ............................................................... 3.03 – – – 6.5 – – –
Retirement and savings 2006 ............................................................... – – – 1.34 – – – 3.4 2007 ............................................................... 1.24 1.25 1.28 1.32 3.0 3.1 3.1 3.2 2008 ............................................................... 1.26 1.25 1.26 1.37 3.0 3.0 3.1 3.3 2009 ............................................................... 1.33 1.32 1.33 1.28 3.3 3.3 3.3 3.0 2010 ............................................................... 1.27 1.33 1.35 1.41 3.1 3.1 3.2 3.2
2011 ............................................................... 1.42 1.51 1.50 1.76 3.2 3.3 3.2 3.7 2012 ............................................................... 1.69 1.43 1.47 1.42 3.6 3.1 3.1 3.0 2013 ............................................................... 1.46 1.46 1.47 1.38 3.1 3.1 3.1 3.1 2014 ............................................................... 1.38 1.35 1.40 1.55 3.1 3.0 3.0 3.2 2015 ............................................................... 1.70 1.72 1.65 1.58 3.4 3.4 3.3 3.4 2016 ............................................................... 1.61 1.51 1.92 1.92 3.4 3.3 3.9 4.0 2017 ............................................................... 1.90 – – – 4.1 – – –
Legally required benefits 2006 ............................................................... – – – 2.40 – – – 6.0 2007 ............................................................... 2.44 2.48 2.51 2.51 6.0 6.1 6.0 6.0 2008 ............................................................... 2.55 2.55 2.55 2.53 6.2 6.2 6.2 6.1 2009 ............................................................... 2.54 2.58 2.58 2.57 6.3 6.4 6.3 6.1 2010 ............................................................... 2.58 2.66 2.66 2.65 6.4 6.3 6.3 6.1
2011 ............................................................... 2.67 2.77 2.78 2.79 6.0 6.0 5.9 5.9 2012 ............................................................... 2.82 2.82 2.84 2.81 6.0 6.0 6.0 6.0 2013 ............................................................... 2.82 2.81 2.84 2.82 6.0 6.0 6.0 6.3 2014 ............................................................... 2.81 2.81 2.83 2.93 6.2 6.3 6.1 6.1 2015 ............................................................... 3.03 2.99 2.98 2.85 6.0 6.0 6.0 6.1 2016 ............................................................... 2.86 2.79 2.88 2.88 6.1 6.1 5.9 5.9 2017 ............................................................... 2.83 – – – 6.1 – – –
Note: The sum of individual items may not equal totals due to rounding. Dashes indicate data are not available.
-216-
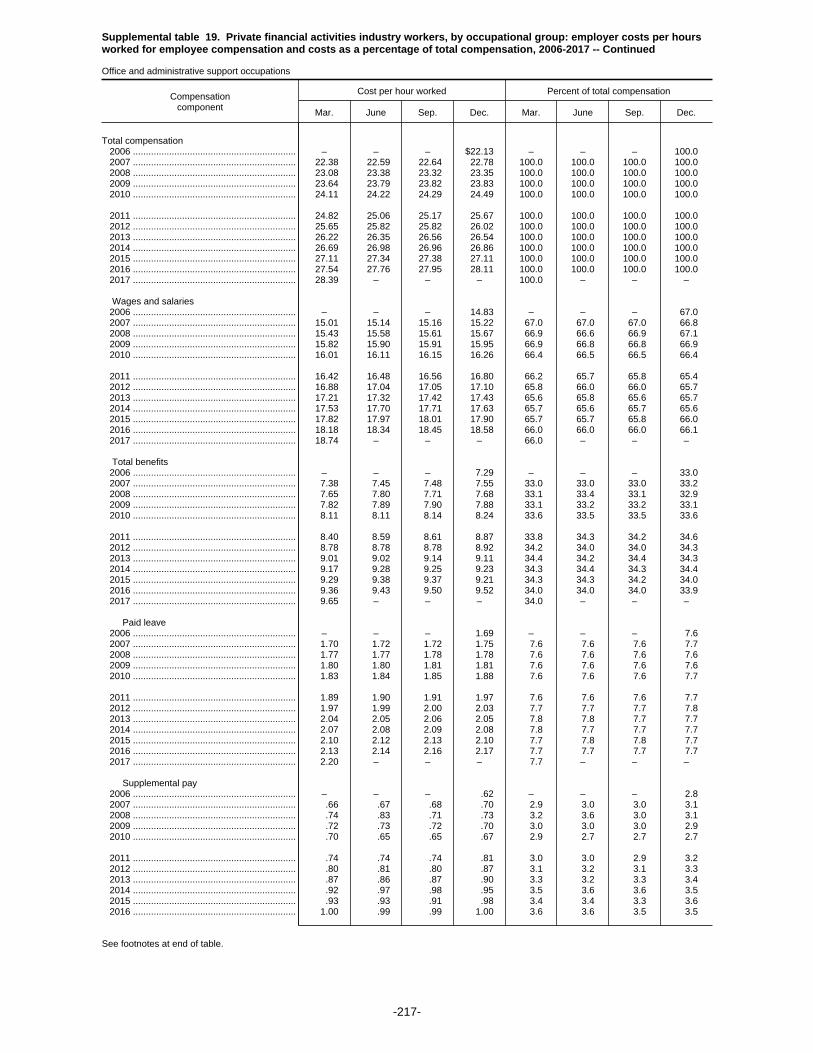
Supplemental table 19. Private financial activities industry workers, by occupational group: employer costs per hoursworked for employee compensation and costs as a percentage of total compensation, 2006-2017 -- Continued
Office and administrative support occupations
Compensationcomponent
Cost per hour worked Percent of total compensation
Mar. June Sep. Dec. Mar. June Sep. Dec.
Total compensation 2006 ............................................................... – – – $22.13 – – – 100.0 2007 ............................................................... 22.38 22.59 22.64 22.78 100.0 100.0 100.0 100.0 2008 ............................................................... 23.08 23.38 23.32 23.35 100.0 100.0 100.0 100.0 2009 ............................................................... 23.64 23.79 23.82 23.83 100.0 100.0 100.0 100.0 2010 ............................................................... 24.11 24.22 24.29 24.49 100.0 100.0 100.0 100.0
2011 ............................................................... 24.82 25.06 25.17 25.67 100.0 100.0 100.0 100.0 2012 ............................................................... 25.65 25.82 25.82 26.02 100.0 100.0 100.0 100.0 2013 ............................................................... 26.22 26.35 26.56 26.54 100.0 100.0 100.0 100.0 2014 ............................................................... 26.69 26.98 26.96 26.86 100.0 100.0 100.0 100.0 2015 ............................................................... 27.11 27.34 27.38 27.11 100.0 100.0 100.0 100.0 2016 ............................................................... 27.54 27.76 27.95 28.11 100.0 100.0 100.0 100.0 2017 ............................................................... 28.39 – – – 100.0 – – –
Wages and salaries 2006 ............................................................... – – – 14.83 – – – 67.0 2007 ............................................................... 15.01 15.14 15.16 15.22 67.0 67.0 67.0 66.8 2008 ............................................................... 15.43 15.58 15.61 15.67 66.9 66.6 66.9 67.1 2009 ............................................................... 15.82 15.90 15.91 15.95 66.9 66.8 66.8 66.9 2010 ............................................................... 16.01 16.11 16.15 16.26 66.4 66.5 66.5 66.4
2011 ............................................................... 16.42 16.48 16.56 16.80 66.2 65.7 65.8 65.4 2012 ............................................................... 16.88 17.04 17.05 17.10 65.8 66.0 66.0 65.7 2013 ............................................................... 17.21 17.32 17.42 17.43 65.6 65.8 65.6 65.7 2014 ............................................................... 17.53 17.70 17.71 17.63 65.7 65.6 65.7 65.6 2015 ............................................................... 17.82 17.97 18.01 17.90 65.7 65.7 65.8 66.0 2016 ............................................................... 18.18 18.34 18.45 18.58 66.0 66.0 66.0 66.1 2017 ............................................................... 18.74 – – – 66.0 – – –
Total benefits 2006 ............................................................... – – – 7.29 – – – 33.0 2007 ............................................................... 7.38 7.45 7.48 7.55 33.0 33.0 33.0 33.2 2008 ............................................................... 7.65 7.80 7.71 7.68 33.1 33.4 33.1 32.9 2009 ............................................................... 7.82 7.89 7.90 7.88 33.1 33.2 33.2 33.1 2010 ............................................................... 8.11 8.11 8.14 8.24 33.6 33.5 33.5 33.6
2011 ............................................................... 8.40 8.59 8.61 8.87 33.8 34.3 34.2 34.6 2012 ............................................................... 8.78 8.78 8.78 8.92 34.2 34.0 34.0 34.3 2013 ............................................................... 9.01 9.02 9.14 9.11 34.4 34.2 34.4 34.3 2014 ............................................................... 9.17 9.28 9.25 9.23 34.3 34.4 34.3 34.4 2015 ............................................................... 9.29 9.38 9.37 9.21 34.3 34.3 34.2 34.0 2016 ............................................................... 9.36 9.43 9.50 9.52 34.0 34.0 34.0 33.9 2017 ............................................................... 9.65 – – – 34.0 – – –
Paid leave 2006 ............................................................... – – – 1.69 – – – 7.6 2007 ............................................................... 1.70 1.72 1.72 1.75 7.6 7.6 7.6 7.7 2008 ............................................................... 1.77 1.77 1.78 1.78 7.6 7.6 7.6 7.6 2009 ............................................................... 1.80 1.80 1.81 1.81 7.6 7.6 7.6 7.6 2010 ............................................................... 1.83 1.84 1.85 1.88 7.6 7.6 7.6 7.7
2011 ............................................................... 1.89 1.90 1.91 1.97 7.6 7.6 7.6 7.7 2012 ............................................................... 1.97 1.99 2.00 2.03 7.7 7.7 7.7 7.8 2013 ............................................................... 2.04 2.05 2.06 2.05 7.8 7.8 7.7 7.7 2014 ............................................................... 2.07 2.08 2.09 2.08 7.8 7.7 7.7 7.7 2015 ............................................................... 2.10 2.12 2.13 2.10 7.7 7.8 7.8 7.7 2016 ............................................................... 2.13 2.14 2.16 2.17 7.7 7.7 7.7 7.7 2017 ............................................................... 2.20 – – – 7.7 – – –
Supplemental pay 2006 ............................................................... – – – .62 – – – 2.8 2007 ............................................................... .66 .67 .68 .70 2.9 3.0 3.0 3.1 2008 ............................................................... .74 .83 .71 .73 3.2 3.6 3.0 3.1 2009 ............................................................... .72 .73 .72 .70 3.0 3.0 3.0 2.9 2010 ............................................................... .70 .65 .65 .67 2.9 2.7 2.7 2.7
2011 ............................................................... .74 .74 .74 .81 3.0 3.0 2.9 3.2 2012 ............................................................... .80 .81 .80 .87 3.1 3.2 3.1 3.3 2013 ............................................................... .87 .86 .87 .90 3.3 3.2 3.3 3.4 2014 ............................................................... .92 .97 .98 .95 3.5 3.6 3.6 3.5 2015 ............................................................... .93 .93 .91 .98 3.4 3.4 3.3 3.6 2016 ............................................................... 1.00 .99 .99 1.00 3.6 3.6 3.5 3.5
See footnotes at end of table.
-217-

Supplemental table 19. Private financial activities industry workers, by occupational group: employer costs per hoursworked for employee compensation and costs as a percentage of total compensation, 2006-2017 -- Continued
Office and administrative support occupations
Compensationcomponent
Cost per hour worked Percent of total compensation
Mar. June Sep. Dec. Mar. June Sep. Dec.
Supplemental pay 2017 ............................................................... 1.04 – – – 3.7 – – –
Insurance 2006 ............................................................... – – – 2.42 – – – 10.9 2007 ............................................................... 2.50 2.52 2.53 2.54 11.2 11.1 11.2 11.1 2008 ............................................................... 2.59 2.60 2.62 2.60 11.2 11.1 11.2 11.1 2009 ............................................................... 2.70 2.72 2.73 2.75 11.4 11.4 11.5 11.5 2010 ............................................................... 2.86 2.86 2.87 2.94 11.8 11.8 11.8 12.0
2011 ............................................................... 2.96 3.10 3.12 3.25 11.9 12.4 12.4 12.7 2012 ............................................................... 3.18 3.18 3.18 3.24 12.4 12.3 12.3 12.4 2013 ............................................................... 3.26 3.25 3.31 3.28 12.4 12.3 12.5 12.4 2014 ............................................................... 3.29 3.34 3.29 3.33 12.3 12.4 12.2 12.4 2015 ............................................................... 3.37 3.43 3.44 3.30 12.4 12.5 12.6 12.2 2016 ............................................................... 3.37 3.42 3.41 3.40 12.2 12.3 12.2 12.1 2017 ............................................................... 3.43 – – – 12.1 – – –
Retirement and savings 2006 ............................................................... – – – .98 – – – 4.4 2007 ............................................................... .92 .92 .93 .94 4.1 4.1 4.1 4.1 2008 ............................................................... .92 .95 .96 .92 4.0 4.1 4.1 4.0 2009 ............................................................... .94 .97 .98 .96 4.0 4.1 4.1 4.0 2010 ............................................................... 1.04 1.05 1.07 1.04 4.3 4.4 4.4 4.2
2011 ............................................................... 1.07 1.09 1.08 1.04 4.3 4.3 4.3 4.1 2012 ............................................................... 1.01 .95 .96 .95 3.9 3.7 3.7 3.6 2013 ............................................................... .98 .99 1.02 .98 3.7 3.8 3.8 3.7 2014 ............................................................... .98 .97 .98 .96 3.7 3.6 3.6 3.6 2015 ............................................................... .97 .98 .96 .91 3.6 3.6 3.5 3.4 2016 ............................................................... .92 .94 1.01 1.01 3.4 3.4 3.6 3.6 2017 ............................................................... 1.02 – – – 3.6 – – –
Legally required benefits 2006 ............................................................... – – – 1.58 – – – 7.2 2007 ............................................................... 1.60 1.61 1.61 1.62 7.1 7.1 7.1 7.1 2008 ............................................................... 1.64 1.65 1.65 1.65 7.1 7.0 7.1 7.1 2009 ............................................................... 1.66 1.67 1.66 1.66 7.0 7.0 7.0 7.0 2010 ............................................................... 1.69 1.71 1.70 1.71 7.0 7.0 7.0 7.0
2011 ............................................................... 1.74 1.76 1.76 1.80 7.0 7.0 7.0 7.0 2012 ............................................................... 1.82 1.84 1.84 1.85 7.1 7.1 7.1 7.1 2013 ............................................................... 1.87 1.88 1.89 1.90 7.1 7.1 7.1 7.2 2014 ............................................................... 1.91 1.92 1.91 1.91 7.1 7.1 7.1 7.1 2015 ............................................................... 1.92 1.93 1.92 1.92 7.1 7.0 7.0 7.1 2016 ............................................................... 1.94 1.94 1.94 1.95 7.0 7.0 6.9 6.9 2017 ............................................................... 1.96 – – – 6.9 – – –
Note: The sum of individual items may not equal totals due to rounding. Dashes indicate data are not available.
-218-
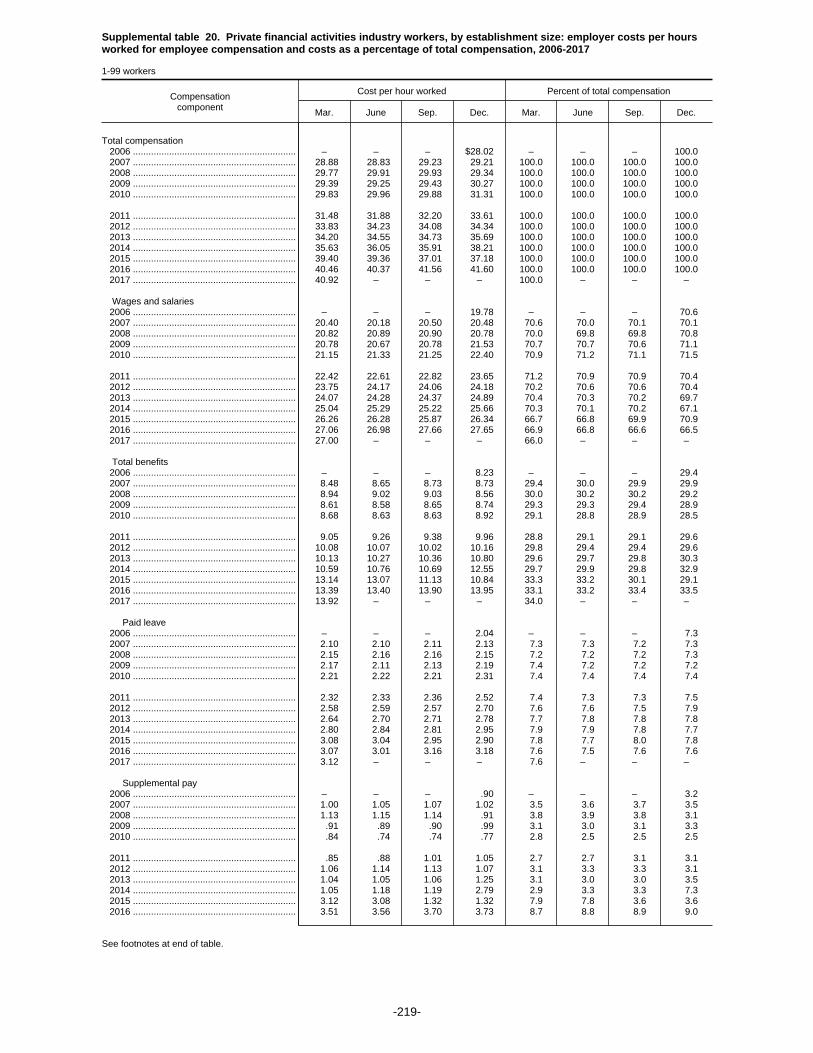
Supplemental table 20. Private financial activities industry workers, by establishment size: employer costs per hoursworked for employee compensation and costs as a percentage of total compensation, 2006-2017
1-99 workers
Compensationcomponent
Cost per hour worked Percent of total compensation
Mar. June Sep. Dec. Mar. June Sep. Dec.
Total compensation 2006 ............................................................... – – – $28.02 – – – 100.0 2007 ............................................................... 28.88 28.83 29.23 29.21 100.0 100.0 100.0 100.0 2008 ............................................................... 29.77 29.91 29.93 29.34 100.0 100.0 100.0 100.0 2009 ............................................................... 29.39 29.25 29.43 30.27 100.0 100.0 100.0 100.0 2010 ............................................................... 29.83 29.96 29.88 31.31 100.0 100.0 100.0 100.0
2011 ............................................................... 31.48 31.88 32.20 33.61 100.0 100.0 100.0 100.0 2012 ............................................................... 33.83 34.23 34.08 34.34 100.0 100.0 100.0 100.0 2013 ............................................................... 34.20 34.55 34.73 35.69 100.0 100.0 100.0 100.0 2014 ............................................................... 35.63 36.05 35.91 38.21 100.0 100.0 100.0 100.0 2015 ............................................................... 39.40 39.36 37.01 37.18 100.0 100.0 100.0 100.0 2016 ............................................................... 40.46 40.37 41.56 41.60 100.0 100.0 100.0 100.0 2017 ............................................................... 40.92 – – – 100.0 – – –
Wages and salaries 2006 ............................................................... – – – 19.78 – – – 70.6 2007 ............................................................... 20.40 20.18 20.50 20.48 70.6 70.0 70.1 70.1 2008 ............................................................... 20.82 20.89 20.90 20.78 70.0 69.8 69.8 70.8 2009 ............................................................... 20.78 20.67 20.78 21.53 70.7 70.7 70.6 71.1 2010 ............................................................... 21.15 21.33 21.25 22.40 70.9 71.2 71.1 71.5
2011 ............................................................... 22.42 22.61 22.82 23.65 71.2 70.9 70.9 70.4 2012 ............................................................... 23.75 24.17 24.06 24.18 70.2 70.6 70.6 70.4 2013 ............................................................... 24.07 24.28 24.37 24.89 70.4 70.3 70.2 69.7 2014 ............................................................... 25.04 25.29 25.22 25.66 70.3 70.1 70.2 67.1 2015 ............................................................... 26.26 26.28 25.87 26.34 66.7 66.8 69.9 70.9 2016 ............................................................... 27.06 26.98 27.66 27.65 66.9 66.8 66.6 66.5 2017 ............................................................... 27.00 – – – 66.0 – – –
Total benefits 2006 ............................................................... – – – 8.23 – – – 29.4 2007 ............................................................... 8.48 8.65 8.73 8.73 29.4 30.0 29.9 29.9 2008 ............................................................... 8.94 9.02 9.03 8.56 30.0 30.2 30.2 29.2 2009 ............................................................... 8.61 8.58 8.65 8.74 29.3 29.3 29.4 28.9 2010 ............................................................... 8.68 8.63 8.63 8.92 29.1 28.8 28.9 28.5
2011 ............................................................... 9.05 9.26 9.38 9.96 28.8 29.1 29.1 29.6 2012 ............................................................... 10.08 10.07 10.02 10.16 29.8 29.4 29.4 29.6 2013 ............................................................... 10.13 10.27 10.36 10.80 29.6 29.7 29.8 30.3 2014 ............................................................... 10.59 10.76 10.69 12.55 29.7 29.9 29.8 32.9 2015 ............................................................... 13.14 13.07 11.13 10.84 33.3 33.2 30.1 29.1 2016 ............................................................... 13.39 13.40 13.90 13.95 33.1 33.2 33.4 33.5 2017 ............................................................... 13.92 – – – 34.0 – – –
Paid leave 2006 ............................................................... – – – 2.04 – – – 7.3 2007 ............................................................... 2.10 2.10 2.11 2.13 7.3 7.3 7.2 7.3 2008 ............................................................... 2.15 2.16 2.16 2.15 7.2 7.2 7.2 7.3 2009 ............................................................... 2.17 2.11 2.13 2.19 7.4 7.2 7.2 7.2 2010 ............................................................... 2.21 2.22 2.21 2.31 7.4 7.4 7.4 7.4
2011 ............................................................... 2.32 2.33 2.36 2.52 7.4 7.3 7.3 7.5 2012 ............................................................... 2.58 2.59 2.57 2.70 7.6 7.6 7.5 7.9 2013 ............................................................... 2.64 2.70 2.71 2.78 7.7 7.8 7.8 7.8 2014 ............................................................... 2.80 2.84 2.81 2.95 7.9 7.9 7.8 7.7 2015 ............................................................... 3.08 3.04 2.95 2.90 7.8 7.7 8.0 7.8 2016 ............................................................... 3.07 3.01 3.16 3.18 7.6 7.5 7.6 7.6 2017 ............................................................... 3.12 – – – 7.6 – – –
Supplemental pay 2006 ............................................................... – – – .90 – – – 3.2 2007 ............................................................... 1.00 1.05 1.07 1.02 3.5 3.6 3.7 3.5 2008 ............................................................... 1.13 1.15 1.14 .91 3.8 3.9 3.8 3.1 2009 ............................................................... .91 .89 .90 .99 3.1 3.0 3.1 3.3 2010 ............................................................... .84 .74 .74 .77 2.8 2.5 2.5 2.5
2011 ............................................................... .85 .88 1.01 1.05 2.7 2.7 3.1 3.1 2012 ............................................................... 1.06 1.14 1.13 1.07 3.1 3.3 3.3 3.1 2013 ............................................................... 1.04 1.05 1.06 1.25 3.1 3.0 3.0 3.5 2014 ............................................................... 1.05 1.18 1.19 2.79 2.9 3.3 3.3 7.3 2015 ............................................................... 3.12 3.08 1.32 1.32 7.9 7.8 3.6 3.6 2016 ............................................................... 3.51 3.56 3.70 3.73 8.7 8.8 8.9 9.0
See footnotes at end of table.
-219-

Supplemental table 20. Private financial activities industry workers, by establishment size: employer costs per hoursworked for employee compensation and costs as a percentage of total compensation, 2006-2017
1-99 workers
Compensationcomponent
Cost per hour worked Percent of total compensation
Mar. June Sep. Dec. Mar. June Sep. Dec.
Supplemental pay 2017 ............................................................... 3.79 – – – 9.3 – – –
Insurance 2006 ............................................................... – – – 2.27 – – – 8.1 2007 ............................................................... 2.35 2.42 2.42 2.44 8.2 8.4 8.3 8.4 2008 ............................................................... 2.51 2.52 2.54 2.41 8.4 8.4 8.5 8.2 2009 ............................................................... 2.44 2.44 2.47 2.42 8.3 8.3 8.4 8.0 2010 ............................................................... 2.49 2.48 2.49 2.53 8.3 8.3 8.3 8.1
2011 ............................................................... 2.55 2.68 2.67 2.86 8.1 8.4 8.3 8.5 2012 ............................................................... 2.85 2.81 2.81 2.85 8.4 8.2 8.2 8.3 2013 ............................................................... 2.85 2.87 2.90 3.00 8.3 8.3 8.4 8.4 2014 ............................................................... 2.98 3.02 2.97 3.06 8.4 8.4 8.3 8.0 2015 ............................................................... 3.10 3.11 3.10 3.03 7.9 7.9 8.4 8.2 2016 ............................................................... 3.13 3.15 3.20 3.20 7.7 7.8 7.7 7.7 2017 ............................................................... 3.19 – – – 7.8 – – –
Retirement and savings 2006 ............................................................... – – – 1.00 – – – 3.6 2007 ............................................................... .97 1.02 1.05 1.05 3.4 3.5 3.6 3.6 2008 ............................................................... 1.05 1.08 1.08 1.01 3.5 3.6 3.6 3.4 2009 ............................................................... .99 1.02 1.03 1.00 3.4 3.5 3.5 3.3 2010 ............................................................... 1.00 1.03 1.03 1.08 3.4 3.4 3.4 3.4
2011 ............................................................... 1.07 1.09 1.06 1.16 3.4 3.4 3.3 3.4 2012 ............................................................... 1.19 1.08 1.07 1.11 3.5 3.1 3.1 3.2 2013 ............................................................... 1.15 1.19 1.20 1.25 3.4 3.4 3.5 3.5 2014 ............................................................... 1.23 1.20 1.20 1.19 3.5 3.3 3.3 3.1 2015 ............................................................... 1.24 1.25 1.21 1.02 3.1 3.2 3.3 2.8 2016 ............................................................... 1.05 1.05 1.20 1.20 2.6 2.6 2.9 2.9 2017 ............................................................... 1.19 – – – 2.9 – – –
Legally required benefits 2006 ............................................................... – – – 2.01 – – – 7.2 2007 ............................................................... 2.05 2.07 2.08 2.09 7.1 7.2 7.1 7.1 2008 ............................................................... 2.11 2.12 2.12 2.10 7.1 7.1 7.1 7.1 2009 ............................................................... 2.11 2.12 2.12 2.14 7.2 7.2 7.2 7.1 2010 ............................................................... 2.14 2.16 2.16 2.23 7.2 7.2 7.2 7.1
2011 ............................................................... 2.26 2.28 2.29 2.37 7.2 7.1 7.1 7.1 2012 ............................................................... 2.40 2.45 2.44 2.43 7.1 7.2 7.2 7.1 2013 ............................................................... 2.44 2.47 2.49 2.52 7.1 7.1 7.2 7.1 2014 ............................................................... 2.52 2.53 2.52 2.56 7.1 7.0 7.0 6.7 2015 ............................................................... 2.60 2.60 2.55 2.56 6.6 6.6 6.9 6.9 2016 ............................................................... 2.63 2.62 2.63 2.64 6.5 6.5 6.3 6.3 2017 ............................................................... 2.64 – – – 6.4 – – –
Note: The sum of individual items may not equal totals due to rounding. Dashes indicate data are not available.
-220-

Supplemental table 20. Private financial activities industry workers, by establishment size: employer costs per hoursworked for employee compensation and costs as a percentage of total compensation, 2006-2017 -- Continued
1-49 workers
Compensationcomponent
Cost per hour worked Percent of total compensation
Mar. June Sep. Dec. Mar. June Sep. Dec.
Total compensation 2006 ............................................................... – – – $27.19 – – – 100.0 2007 ............................................................... 28.19 28.26 28.74 28.73 100.0 100.0 100.0 100.0 2008 ............................................................... 29.39 29.31 29.22 28.32 100.0 100.0 100.0 100.0 2009 ............................................................... 28.02 28.21 28.27 28.81 100.0 100.0 100.0 100.0 2010 ............................................................... 28.39 28.67 28.70 30.40 100.0 100.0 100.0 100.0
2011 ............................................................... 30.58 30.95 31.36 32.34 100.0 100.0 100.0 100.0 2012 ............................................................... 32.40 33.07 32.89 32.65 100.0 100.0 100.0 100.0 2013 ............................................................... 32.32 32.75 32.92 33.54 100.0 100.0 100.0 100.0 2014 ............................................................... 33.94 33.96 33.72 34.07 100.0 100.0 100.0 100.0 2015 ............................................................... 34.40 34.49 34.47 34.79 100.0 100.0 100.0 100.0 2016 ............................................................... 34.80 35.30 35.53 35.52 100.0 100.0 100.0 100.0 2017 ............................................................... 35.24 – – – 100.0 – – –
Wages and salaries 2006 ............................................................... – – – 19.28 – – – 70.9 2007 ............................................................... 19.98 19.83 20.23 20.14 70.9 70.2 70.4 70.1 2008 ............................................................... 20.56 20.49 20.45 20.12 70.0 69.9 70.0 71.1 2009 ............................................................... 19.85 20.01 20.07 20.56 70.8 70.9 71.0 71.4 2010 ............................................................... 20.25 20.49 20.46 21.87 71.3 71.5 71.3 71.9
2011 ............................................................... 21.93 22.09 22.32 22.91 71.7 71.4 71.2 70.8 2012 ............................................................... 22.90 23.51 23.35 23.08 70.7 71.1 71.0 70.7 2013 ............................................................... 22.86 23.14 23.24 23.65 70.7 70.6 70.6 70.5 2014 ............................................................... 23.94 23.81 23.70 23.72 70.5 70.1 70.3 69.6 2015 ............................................................... 23.92 24.02 23.98 24.66 69.5 69.6 69.6 70.9 2016 ............................................................... 24.72 25.06 25.07 25.06 71.1 71.0 70.6 70.6 2017 ............................................................... 24.75 – – – 70.2 – – –
Total benefits 2006 ............................................................... – – – 7.91 – – – 29.1 2007 ............................................................... 8.21 8.43 8.51 8.59 29.1 29.8 29.6 29.9 2008 ............................................................... 8.83 8.82 8.77 8.19 30.0 30.1 30.0 28.9 2009 ............................................................... 8.17 8.20 8.20 8.25 29.2 29.1 29.0 28.6 2010 ............................................................... 8.14 8.17 8.24 8.53 28.7 28.5 28.7 28.1
2011 ............................................................... 8.66 8.86 9.04 9.43 28.3 28.6 28.8 29.2 2012 ............................................................... 9.50 9.56 9.53 9.56 29.3 28.9 29.0 29.3 2013 ............................................................... 9.46 9.62 9.69 9.90 29.3 29.4 29.4 29.5 2014 ............................................................... 10.00 10.15 10.03 10.35 29.5 29.9 29.7 30.4 2015 ............................................................... 10.48 10.47 10.48 10.13 30.5 30.4 30.4 29.1 2016 ............................................................... 10.07 10.24 10.46 10.46 28.9 29.0 29.4 29.4 2017 ............................................................... 10.50 – – – 29.8 – – –
Paid leave 2006 ............................................................... – – – 1.96 – – – 7.2 2007 ............................................................... 2.03 2.04 2.06 2.08 7.2 7.2 7.2 7.2 2008 ............................................................... 2.10 2.09 2.08 2.04 7.1 7.1 7.1 7.2 2009 ............................................................... 2.02 2.02 2.04 2.07 7.2 7.1 7.2 7.2 2010 ............................................................... 2.07 2.10 2.12 2.23 7.3 7.3 7.4 7.3
2011 ............................................................... 2.24 2.25 2.28 2.40 7.3 7.3 7.3 7.4 2012 ............................................................... 2.45 2.46 2.45 2.52 7.6 7.4 7.4 7.7 2013 ............................................................... 2.48 2.54 2.54 2.58 7.7 7.8 7.7 7.7 2014 ............................................................... 2.64 2.60 2.57 2.64 7.8 7.7 7.6 7.8 2015 ............................................................... 2.69 2.68 2.70 2.61 7.8 7.8 7.8 7.5 2016 ............................................................... 2.63 2.66 2.69 2.71 7.6 7.5 7.6 7.6 2017 ............................................................... 2.72 – – – 7.7 – – –
Supplemental pay 2006 ............................................................... – – – .82 – – – 3.0 2007 ............................................................... .94 1.00 1.02 1.04 3.3 3.5 3.5 3.6 2008 ............................................................... 1.16 1.20 1.16 .88 4.0 4.1 4.0 3.1 2009 ............................................................... .86 .85 .84 .95 3.1 3.0 3.0 3.3 2010 ............................................................... .74 .67 .66 .66 2.6 2.3 2.3 2.2
2011 ............................................................... .74 .75 .92 .89 2.4 2.4 2.9 2.7 2012 ............................................................... .88 .94 .93 .90 2.7 2.9 2.8 2.8 2013 ............................................................... .86 .88 .90 .90 2.7 2.7 2.7 2.7 2014 ............................................................... .95 1.14 1.14 1.28 2.8 3.3 3.4 3.7 2015 ............................................................... 1.29 1.25 1.26 1.21 3.7 3.6 3.6 3.5 2016 ............................................................... 1.07 1.16 1.19 1.19 3.1 3.3 3.4 3.4
See footnotes at end of table.
-221-

Supplemental table 20. Private financial activities industry workers, by establishment size: employer costs per hoursworked for employee compensation and costs as a percentage of total compensation, 2006-2017 -- Continued
1-49 workers
Compensationcomponent
Cost per hour worked Percent of total compensation
Mar. June Sep. Dec. Mar. June Sep. Dec.
Supplemental pay 2017 ............................................................... 1.18 – – – 3.3 – – –
Insurance 2006 ............................................................... – – – 2.15 – – – 7.9 2007 ............................................................... 2.23 2.31 2.30 2.34 7.9 8.2 8.0 8.2 2008 ............................................................... 2.41 2.38 2.39 2.27 8.2 8.1 8.2 8.0 2009 ............................................................... 2.30 2.31 2.31 2.28 8.2 8.2 8.2 7.9 2010 ............................................................... 2.35 2.34 2.37 2.45 8.3 8.2 8.3 8.1
2011 ............................................................... 2.48 2.63 2.62 2.79 8.1 8.5 8.4 8.6 2012 ............................................................... 2.78 2.78 2.79 2.79 8.6 8.4 8.5 8.5 2013 ............................................................... 2.78 2.79 2.81 2.92 8.6 8.5 8.5 8.7 2014 ............................................................... 2.92 2.93 2.85 2.96 8.6 8.6 8.5 8.7 2015 ............................................................... 2.97 2.98 3.00 2.93 8.6 8.6 8.7 8.4 2016 ............................................................... 2.97 3.01 3.05 3.03 8.5 8.5 8.6 8.5 2017 ............................................................... 3.03 – – – 8.6 – – –
Retirement and savings 2006 ............................................................... – – – .99 – – – 3.6 2007 ............................................................... .97 1.03 1.07 1.07 3.4 3.7 3.7 3.7 2008 ............................................................... 1.07 1.08 1.07 .96 3.6 3.7 3.7 3.4 2009 ............................................................... .94 .97 .96 .90 3.4 3.4 3.4 3.1 2010 ............................................................... .93 .97 .99 1.02 3.3 3.4 3.5 3.3
2011 ............................................................... 1.00 1.02 .99 1.05 3.3 3.3 3.2 3.3 2012 ............................................................... 1.07 .99 .98 1.01 3.3 3.0 3.0 3.1 2013 ............................................................... .98 1.02 1.04 1.08 3.0 3.1 3.2 3.2 2014 ............................................................... 1.07 1.05 1.05 1.04 3.2 3.1 3.1 3.1 2015 ............................................................... 1.09 1.11 1.07 .90 3.2 3.2 3.1 2.6 2016 ............................................................... .92 .92 1.05 1.05 2.6 2.6 3.0 3.0 2017 ............................................................... 1.08 – – – 3.1 – – –
Legally required benefits 2006 ............................................................... – – – 1.99 – – – 7.3 2007 ............................................................... 2.03 2.04 2.06 2.06 7.2 7.2 7.2 7.2 2008 ............................................................... 2.09 2.08 2.08 2.04 7.1 7.1 7.1 7.2 2009 ............................................................... 2.05 2.06 2.05 2.05 7.3 7.3 7.2 7.1 2010 ............................................................... 2.05 2.09 2.09 2.17 7.2 7.3 7.3 7.2
2011 ............................................................... 2.20 2.22 2.24 2.30 7.2 7.2 7.1 7.1 2012 ............................................................... 2.31 2.38 2.38 2.35 7.1 7.2 7.2 7.2 2013 ............................................................... 2.35 2.38 2.39 2.42 7.3 7.3 7.3 7.2 2014 ............................................................... 2.43 2.43 2.41 2.43 7.1 7.1 7.2 7.1 2015 ............................................................... 2.45 2.45 2.45 2.48 7.1 7.1 7.1 7.1 2016 ............................................................... 2.49 2.50 2.48 2.48 7.2 7.1 7.0 7.0 2017 ............................................................... 2.49 – – – 7.1 – – –
Note: The sum of individual items may not equal totals due to rounding. Dashes indicate data are not available.
-222-
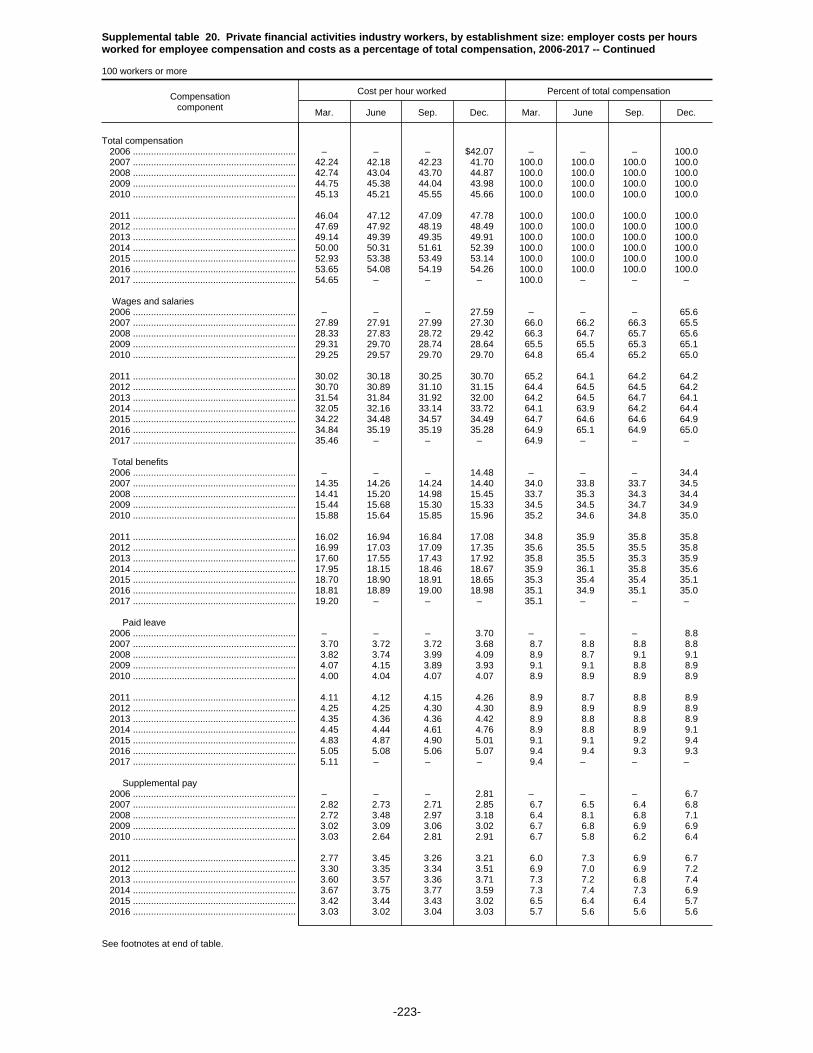
Supplemental table 20. Private financial activities industry workers, by establishment size: employer costs per hoursworked for employee compensation and costs as a percentage of total compensation, 2006-2017 -- Continued
100 workers or more
Compensationcomponent
Cost per hour worked Percent of total compensation
Mar. June Sep. Dec. Mar. June Sep. Dec.
Total compensation 2006 ............................................................... – – – $42.07 – – – 100.0 2007 ............................................................... 42.24 42.18 42.23 41.70 100.0 100.0 100.0 100.0 2008 ............................................................... 42.74 43.04 43.70 44.87 100.0 100.0 100.0 100.0 2009 ............................................................... 44.75 45.38 44.04 43.98 100.0 100.0 100.0 100.0 2010 ............................................................... 45.13 45.21 45.55 45.66 100.0 100.0 100.0 100.0
2011 ............................................................... 46.04 47.12 47.09 47.78 100.0 100.0 100.0 100.0 2012 ............................................................... 47.69 47.92 48.19 48.49 100.0 100.0 100.0 100.0 2013 ............................................................... 49.14 49.39 49.35 49.91 100.0 100.0 100.0 100.0 2014 ............................................................... 50.00 50.31 51.61 52.39 100.0 100.0 100.0 100.0 2015 ............................................................... 52.93 53.38 53.49 53.14 100.0 100.0 100.0 100.0 2016 ............................................................... 53.65 54.08 54.19 54.26 100.0 100.0 100.0 100.0 2017 ............................................................... 54.65 – – – 100.0 – – –
Wages and salaries 2006 ............................................................... – – – 27.59 – – – 65.6 2007 ............................................................... 27.89 27.91 27.99 27.30 66.0 66.2 66.3 65.5 2008 ............................................................... 28.33 27.83 28.72 29.42 66.3 64.7 65.7 65.6 2009 ............................................................... 29.31 29.70 28.74 28.64 65.5 65.5 65.3 65.1 2010 ............................................................... 29.25 29.57 29.70 29.70 64.8 65.4 65.2 65.0
2011 ............................................................... 30.02 30.18 30.25 30.70 65.2 64.1 64.2 64.2 2012 ............................................................... 30.70 30.89 31.10 31.15 64.4 64.5 64.5 64.2 2013 ............................................................... 31.54 31.84 31.92 32.00 64.2 64.5 64.7 64.1 2014 ............................................................... 32.05 32.16 33.14 33.72 64.1 63.9 64.2 64.4 2015 ............................................................... 34.22 34.48 34.57 34.49 64.7 64.6 64.6 64.9 2016 ............................................................... 34.84 35.19 35.19 35.28 64.9 65.1 64.9 65.0 2017 ............................................................... 35.46 – – – 64.9 – – –
Total benefits 2006 ............................................................... – – – 14.48 – – – 34.4 2007 ............................................................... 14.35 14.26 14.24 14.40 34.0 33.8 33.7 34.5 2008 ............................................................... 14.41 15.20 14.98 15.45 33.7 35.3 34.3 34.4 2009 ............................................................... 15.44 15.68 15.30 15.33 34.5 34.5 34.7 34.9 2010 ............................................................... 15.88 15.64 15.85 15.96 35.2 34.6 34.8 35.0
2011 ............................................................... 16.02 16.94 16.84 17.08 34.8 35.9 35.8 35.8 2012 ............................................................... 16.99 17.03 17.09 17.35 35.6 35.5 35.5 35.8 2013 ............................................................... 17.60 17.55 17.43 17.92 35.8 35.5 35.3 35.9 2014 ............................................................... 17.95 18.15 18.46 18.67 35.9 36.1 35.8 35.6 2015 ............................................................... 18.70 18.90 18.91 18.65 35.3 35.4 35.4 35.1 2016 ............................................................... 18.81 18.89 19.00 18.98 35.1 34.9 35.1 35.0 2017 ............................................................... 19.20 – – – 35.1 – – –
Paid leave 2006 ............................................................... – – – 3.70 – – – 8.8 2007 ............................................................... 3.70 3.72 3.72 3.68 8.7 8.8 8.8 8.8 2008 ............................................................... 3.82 3.74 3.99 4.09 8.9 8.7 9.1 9.1 2009 ............................................................... 4.07 4.15 3.89 3.93 9.1 9.1 8.8 8.9 2010 ............................................................... 4.00 4.04 4.07 4.07 8.9 8.9 8.9 8.9
2011 ............................................................... 4.11 4.12 4.15 4.26 8.9 8.7 8.8 8.9 2012 ............................................................... 4.25 4.25 4.30 4.30 8.9 8.9 8.9 8.9 2013 ............................................................... 4.35 4.36 4.36 4.42 8.9 8.8 8.8 8.9 2014 ............................................................... 4.45 4.44 4.61 4.76 8.9 8.8 8.9 9.1 2015 ............................................................... 4.83 4.87 4.90 5.01 9.1 9.1 9.2 9.4 2016 ............................................................... 5.05 5.08 5.06 5.07 9.4 9.4 9.3 9.3 2017 ............................................................... 5.11 – – – 9.4 – – –
Supplemental pay 2006 ............................................................... – – – 2.81 – – – 6.7 2007 ............................................................... 2.82 2.73 2.71 2.85 6.7 6.5 6.4 6.8 2008 ............................................................... 2.72 3.48 2.97 3.18 6.4 8.1 6.8 7.1 2009 ............................................................... 3.02 3.09 3.06 3.02 6.7 6.8 6.9 6.9 2010 ............................................................... 3.03 2.64 2.81 2.91 6.7 5.8 6.2 6.4
2011 ............................................................... 2.77 3.45 3.26 3.21 6.0 7.3 6.9 6.7 2012 ............................................................... 3.30 3.35 3.34 3.51 6.9 7.0 6.9 7.2 2013 ............................................................... 3.60 3.57 3.36 3.71 7.3 7.2 6.8 7.4 2014 ............................................................... 3.67 3.75 3.77 3.59 7.3 7.4 7.3 6.9 2015 ............................................................... 3.42 3.44 3.43 3.02 6.5 6.4 6.4 5.7 2016 ............................................................... 3.03 3.02 3.04 3.03 5.7 5.6 5.6 5.6
See footnotes at end of table.
-223-
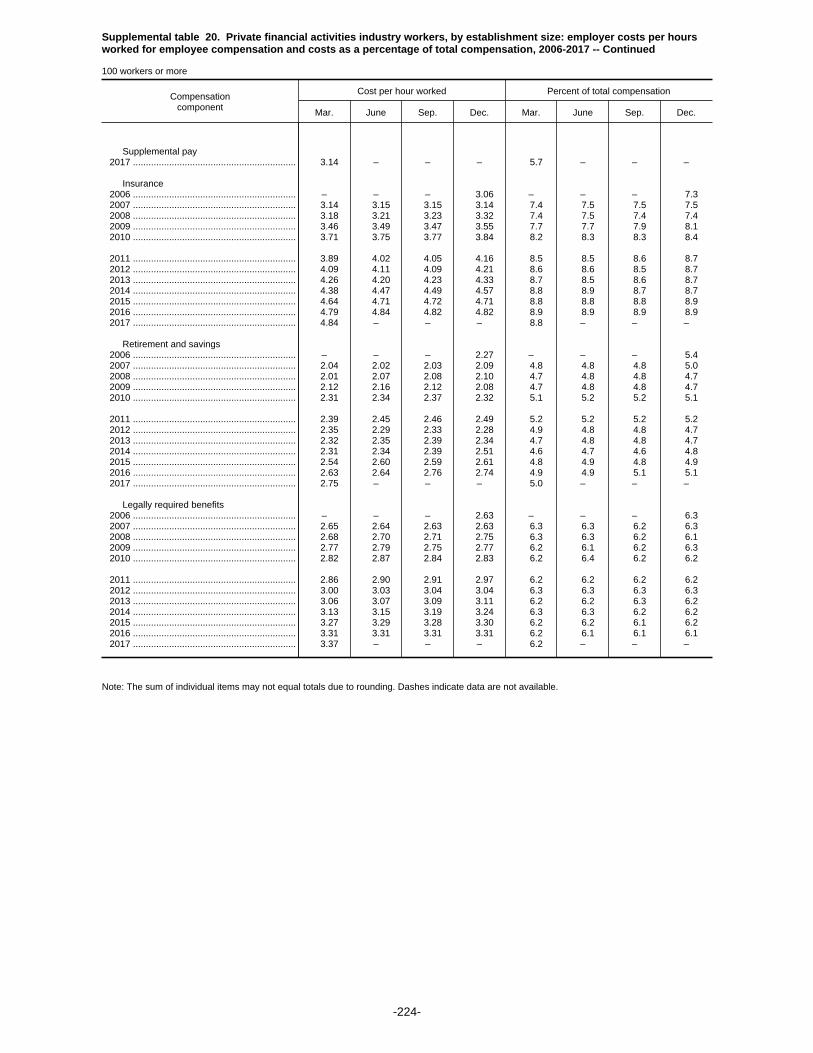
Supplemental table 20. Private financial activities industry workers, by establishment size: employer costs per hoursworked for employee compensation and costs as a percentage of total compensation, 2006-2017 -- Continued
100 workers or more
Compensationcomponent
Cost per hour worked Percent of total compensation
Mar. June Sep. Dec. Mar. June Sep. Dec.
Supplemental pay 2017 ............................................................... 3.14 – – – 5.7 – – –
Insurance 2006 ............................................................... – – – 3.06 – – – 7.3 2007 ............................................................... 3.14 3.15 3.15 3.14 7.4 7.5 7.5 7.5 2008 ............................................................... 3.18 3.21 3.23 3.32 7.4 7.5 7.4 7.4 2009 ............................................................... 3.46 3.49 3.47 3.55 7.7 7.7 7.9 8.1 2010 ............................................................... 3.71 3.75 3.77 3.84 8.2 8.3 8.3 8.4
2011 ............................................................... 3.89 4.02 4.05 4.16 8.5 8.5 8.6 8.7 2012 ............................................................... 4.09 4.11 4.09 4.21 8.6 8.6 8.5 8.7 2013 ............................................................... 4.26 4.20 4.23 4.33 8.7 8.5 8.6 8.7 2014 ............................................................... 4.38 4.47 4.49 4.57 8.8 8.9 8.7 8.7 2015 ............................................................... 4.64 4.71 4.72 4.71 8.8 8.8 8.8 8.9 2016 ............................................................... 4.79 4.84 4.82 4.82 8.9 8.9 8.9 8.9 2017 ............................................................... 4.84 – – – 8.8 – – –
Retirement and savings 2006 ............................................................... – – – 2.27 – – – 5.4 2007 ............................................................... 2.04 2.02 2.03 2.09 4.8 4.8 4.8 5.0 2008 ............................................................... 2.01 2.07 2.08 2.10 4.7 4.8 4.8 4.7 2009 ............................................................... 2.12 2.16 2.12 2.08 4.7 4.8 4.8 4.7 2010 ............................................................... 2.31 2.34 2.37 2.32 5.1 5.2 5.2 5.1
2011 ............................................................... 2.39 2.45 2.46 2.49 5.2 5.2 5.2 5.2 2012 ............................................................... 2.35 2.29 2.33 2.28 4.9 4.8 4.8 4.7 2013 ............................................................... 2.32 2.35 2.39 2.34 4.7 4.8 4.8 4.7 2014 ............................................................... 2.31 2.34 2.39 2.51 4.6 4.7 4.6 4.8 2015 ............................................................... 2.54 2.60 2.59 2.61 4.8 4.9 4.8 4.9 2016 ............................................................... 2.63 2.64 2.76 2.74 4.9 4.9 5.1 5.1 2017 ............................................................... 2.75 – – – 5.0 – – –
Legally required benefits 2006 ............................................................... – – – 2.63 – – – 6.3 2007 ............................................................... 2.65 2.64 2.63 2.63 6.3 6.3 6.2 6.3 2008 ............................................................... 2.68 2.70 2.71 2.75 6.3 6.3 6.2 6.1 2009 ............................................................... 2.77 2.79 2.75 2.77 6.2 6.1 6.2 6.3 2010 ............................................................... 2.82 2.87 2.84 2.83 6.2 6.4 6.2 6.2
2011 ............................................................... 2.86 2.90 2.91 2.97 6.2 6.2 6.2 6.2 2012 ............................................................... 3.00 3.03 3.04 3.04 6.3 6.3 6.3 6.3 2013 ............................................................... 3.06 3.07 3.09 3.11 6.2 6.2 6.3 6.2 2014 ............................................................... 3.13 3.15 3.19 3.24 6.3 6.3 6.2 6.2 2015 ............................................................... 3.27 3.29 3.28 3.30 6.2 6.2 6.1 6.2 2016 ............................................................... 3.31 3.31 3.31 3.31 6.2 6.1 6.1 6.1 2017 ............................................................... 3.37 – – – 6.2 – – –
Note: The sum of individual items may not equal totals due to rounding. Dashes indicate data are not available.
-224-
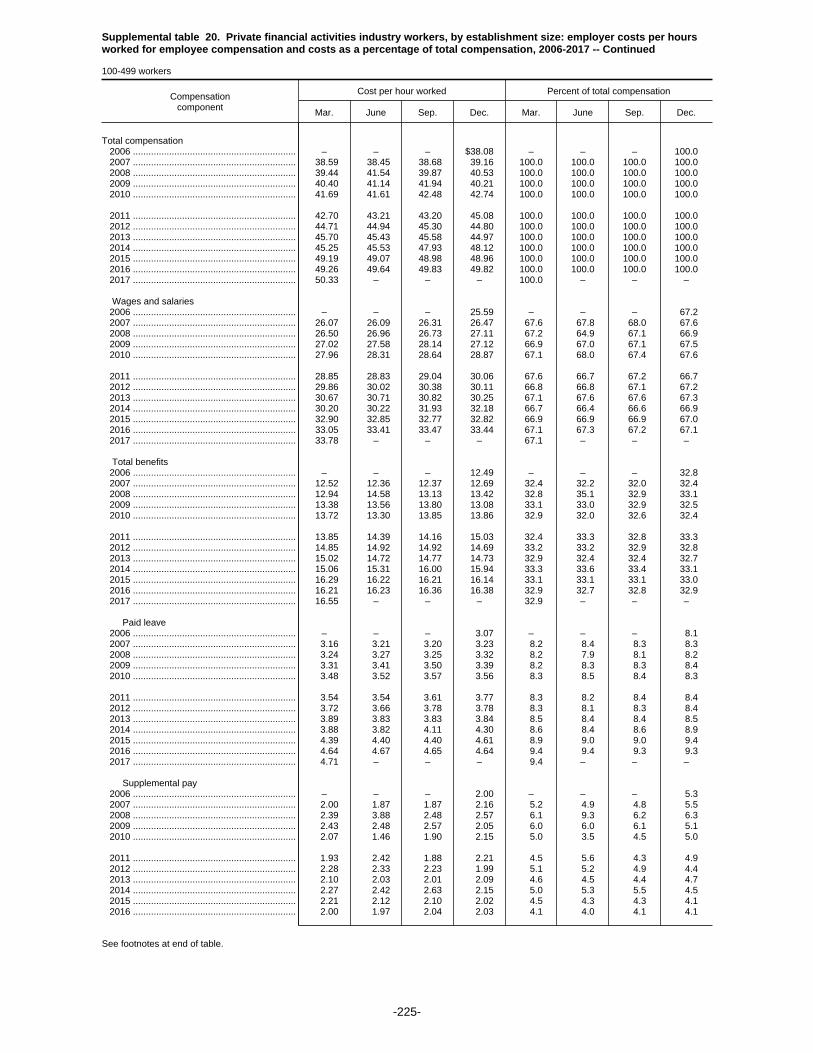
Supplemental table 20. Private financial activities industry workers, by establishment size: employer costs per hoursworked for employee compensation and costs as a percentage of total compensation, 2006-2017 -- Continued
100-499 workers
Compensationcomponent
Cost per hour worked Percent of total compensation
Mar. June Sep. Dec. Mar. June Sep. Dec.
Total compensation 2006 ............................................................... – – – $38.08 – – – 100.0 2007 ............................................................... 38.59 38.45 38.68 39.16 100.0 100.0 100.0 100.0 2008 ............................................................... 39.44 41.54 39.87 40.53 100.0 100.0 100.0 100.0 2009 ............................................................... 40.40 41.14 41.94 40.21 100.0 100.0 100.0 100.0 2010 ............................................................... 41.69 41.61 42.48 42.74 100.0 100.0 100.0 100.0
2011 ............................................................... 42.70 43.21 43.20 45.08 100.0 100.0 100.0 100.0 2012 ............................................................... 44.71 44.94 45.30 44.80 100.0 100.0 100.0 100.0 2013 ............................................................... 45.70 45.43 45.58 44.97 100.0 100.0 100.0 100.0 2014 ............................................................... 45.25 45.53 47.93 48.12 100.0 100.0 100.0 100.0 2015 ............................................................... 49.19 49.07 48.98 48.96 100.0 100.0 100.0 100.0 2016 ............................................................... 49.26 49.64 49.83 49.82 100.0 100.0 100.0 100.0 2017 ............................................................... 50.33 – – – 100.0 – – –
Wages and salaries 2006 ............................................................... – – – 25.59 – – – 67.2 2007 ............................................................... 26.07 26.09 26.31 26.47 67.6 67.8 68.0 67.6 2008 ............................................................... 26.50 26.96 26.73 27.11 67.2 64.9 67.1 66.9 2009 ............................................................... 27.02 27.58 28.14 27.12 66.9 67.0 67.1 67.5 2010 ............................................................... 27.96 28.31 28.64 28.87 67.1 68.0 67.4 67.6
2011 ............................................................... 28.85 28.83 29.04 30.06 67.6 66.7 67.2 66.7 2012 ............................................................... 29.86 30.02 30.38 30.11 66.8 66.8 67.1 67.2 2013 ............................................................... 30.67 30.71 30.82 30.25 67.1 67.6 67.6 67.3 2014 ............................................................... 30.20 30.22 31.93 32.18 66.7 66.4 66.6 66.9 2015 ............................................................... 32.90 32.85 32.77 32.82 66.9 66.9 66.9 67.0 2016 ............................................................... 33.05 33.41 33.47 33.44 67.1 67.3 67.2 67.1 2017 ............................................................... 33.78 – – – 67.1 – – –
Total benefits 2006 ............................................................... – – – 12.49 – – – 32.8 2007 ............................................................... 12.52 12.36 12.37 12.69 32.4 32.2 32.0 32.4 2008 ............................................................... 12.94 14.58 13.13 13.42 32.8 35.1 32.9 33.1 2009 ............................................................... 13.38 13.56 13.80 13.08 33.1 33.0 32.9 32.5 2010 ............................................................... 13.72 13.30 13.85 13.86 32.9 32.0 32.6 32.4
2011 ............................................................... 13.85 14.39 14.16 15.03 32.4 33.3 32.8 33.3 2012 ............................................................... 14.85 14.92 14.92 14.69 33.2 33.2 32.9 32.8 2013 ............................................................... 15.02 14.72 14.77 14.73 32.9 32.4 32.4 32.7 2014 ............................................................... 15.06 15.31 16.00 15.94 33.3 33.6 33.4 33.1 2015 ............................................................... 16.29 16.22 16.21 16.14 33.1 33.1 33.1 33.0 2016 ............................................................... 16.21 16.23 16.36 16.38 32.9 32.7 32.8 32.9 2017 ............................................................... 16.55 – – – 32.9 – – –
Paid leave 2006 ............................................................... – – – 3.07 – – – 8.1 2007 ............................................................... 3.16 3.21 3.20 3.23 8.2 8.4 8.3 8.3 2008 ............................................................... 3.24 3.27 3.25 3.32 8.2 7.9 8.1 8.2 2009 ............................................................... 3.31 3.41 3.50 3.39 8.2 8.3 8.3 8.4 2010 ............................................................... 3.48 3.52 3.57 3.56 8.3 8.5 8.4 8.3
2011 ............................................................... 3.54 3.54 3.61 3.77 8.3 8.2 8.4 8.4 2012 ............................................................... 3.72 3.66 3.78 3.78 8.3 8.1 8.3 8.4 2013 ............................................................... 3.89 3.83 3.83 3.84 8.5 8.4 8.4 8.5 2014 ............................................................... 3.88 3.82 4.11 4.30 8.6 8.4 8.6 8.9 2015 ............................................................... 4.39 4.40 4.40 4.61 8.9 9.0 9.0 9.4 2016 ............................................................... 4.64 4.67 4.65 4.64 9.4 9.4 9.3 9.3 2017 ............................................................... 4.71 – – – 9.4 – – –
Supplemental pay 2006 ............................................................... – – – 2.00 – – – 5.3 2007 ............................................................... 2.00 1.87 1.87 2.16 5.2 4.9 4.8 5.5 2008 ............................................................... 2.39 3.88 2.48 2.57 6.1 9.3 6.2 6.3 2009 ............................................................... 2.43 2.48 2.57 2.05 6.0 6.0 6.1 5.1 2010 ............................................................... 2.07 1.46 1.90 2.15 5.0 3.5 4.5 5.0
2011 ............................................................... 1.93 2.42 1.88 2.21 4.5 5.6 4.3 4.9 2012 ............................................................... 2.28 2.33 2.23 1.99 5.1 5.2 4.9 4.4 2013 ............................................................... 2.10 2.03 2.01 2.09 4.6 4.5 4.4 4.7 2014 ............................................................... 2.27 2.42 2.63 2.15 5.0 5.3 5.5 4.5 2015 ............................................................... 2.21 2.12 2.10 2.02 4.5 4.3 4.3 4.1 2016 ............................................................... 2.00 1.97 2.04 2.03 4.1 4.0 4.1 4.1
See footnotes at end of table.
-225-
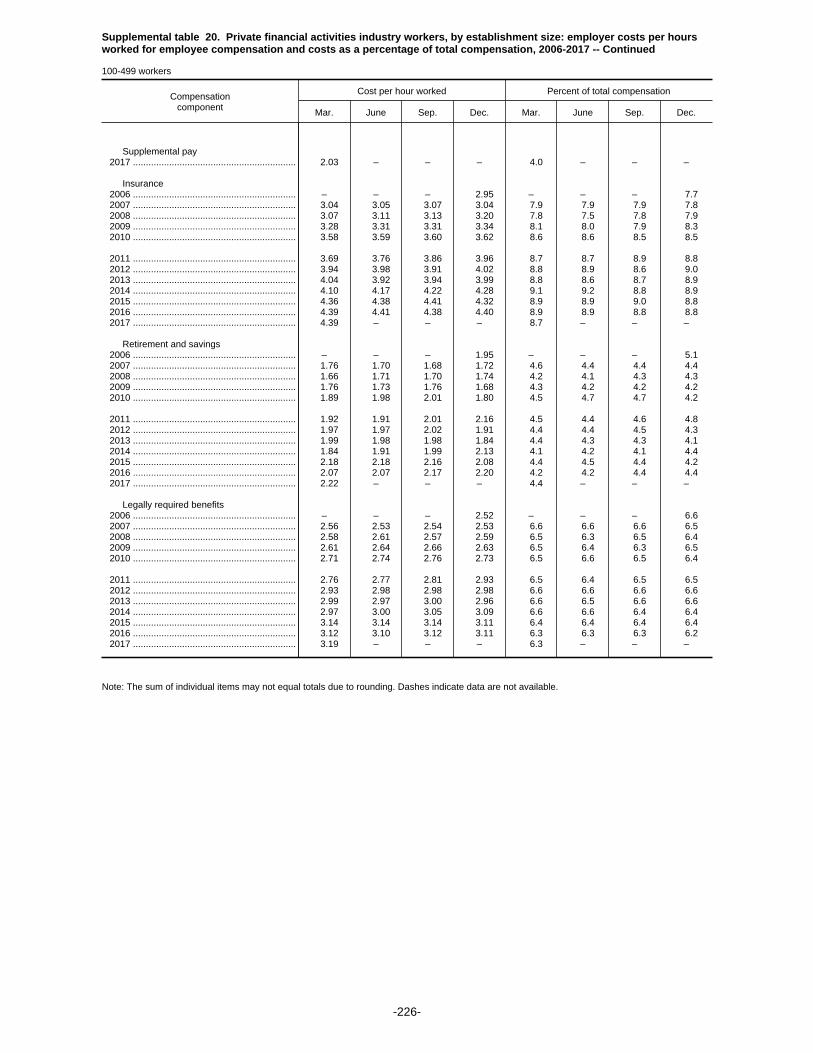
Supplemental table 20. Private financial activities industry workers, by establishment size: employer costs per hoursworked for employee compensation and costs as a percentage of total compensation, 2006-2017 -- Continued
100-499 workers
Compensationcomponent
Cost per hour worked Percent of total compensation
Mar. June Sep. Dec. Mar. June Sep. Dec.
Supplemental pay 2017 ............................................................... 2.03 – – – 4.0 – – –
Insurance 2006 ............................................................... – – – 2.95 – – – 7.7 2007 ............................................................... 3.04 3.05 3.07 3.04 7.9 7.9 7.9 7.8 2008 ............................................................... 3.07 3.11 3.13 3.20 7.8 7.5 7.8 7.9 2009 ............................................................... 3.28 3.31 3.31 3.34 8.1 8.0 7.9 8.3 2010 ............................................................... 3.58 3.59 3.60 3.62 8.6 8.6 8.5 8.5
2011 ............................................................... 3.69 3.76 3.86 3.96 8.7 8.7 8.9 8.8 2012 ............................................................... 3.94 3.98 3.91 4.02 8.8 8.9 8.6 9.0 2013 ............................................................... 4.04 3.92 3.94 3.99 8.8 8.6 8.7 8.9 2014 ............................................................... 4.10 4.17 4.22 4.28 9.1 9.2 8.8 8.9 2015 ............................................................... 4.36 4.38 4.41 4.32 8.9 8.9 9.0 8.8 2016 ............................................................... 4.39 4.41 4.38 4.40 8.9 8.9 8.8 8.8 2017 ............................................................... 4.39 – – – 8.7 – – –
Retirement and savings 2006 ............................................................... – – – 1.95 – – – 5.1 2007 ............................................................... 1.76 1.70 1.68 1.72 4.6 4.4 4.4 4.4 2008 ............................................................... 1.66 1.71 1.70 1.74 4.2 4.1 4.3 4.3 2009 ............................................................... 1.76 1.73 1.76 1.68 4.3 4.2 4.2 4.2 2010 ............................................................... 1.89 1.98 2.01 1.80 4.5 4.7 4.7 4.2
2011 ............................................................... 1.92 1.91 2.01 2.16 4.5 4.4 4.6 4.8 2012 ............................................................... 1.97 1.97 2.02 1.91 4.4 4.4 4.5 4.3 2013 ............................................................... 1.99 1.98 1.98 1.84 4.4 4.3 4.3 4.1 2014 ............................................................... 1.84 1.91 1.99 2.13 4.1 4.2 4.1 4.4 2015 ............................................................... 2.18 2.18 2.16 2.08 4.4 4.5 4.4 4.2 2016 ............................................................... 2.07 2.07 2.17 2.20 4.2 4.2 4.4 4.4 2017 ............................................................... 2.22 – – – 4.4 – – –
Legally required benefits 2006 ............................................................... – – – 2.52 – – – 6.6 2007 ............................................................... 2.56 2.53 2.54 2.53 6.6 6.6 6.6 6.5 2008 ............................................................... 2.58 2.61 2.57 2.59 6.5 6.3 6.5 6.4 2009 ............................................................... 2.61 2.64 2.66 2.63 6.5 6.4 6.3 6.5 2010 ............................................................... 2.71 2.74 2.76 2.73 6.5 6.6 6.5 6.4
2011 ............................................................... 2.76 2.77 2.81 2.93 6.5 6.4 6.5 6.5 2012 ............................................................... 2.93 2.98 2.98 2.98 6.6 6.6 6.6 6.6 2013 ............................................................... 2.99 2.97 3.00 2.96 6.6 6.5 6.6 6.6 2014 ............................................................... 2.97 3.00 3.05 3.09 6.6 6.6 6.4 6.4 2015 ............................................................... 3.14 3.14 3.14 3.11 6.4 6.4 6.4 6.4 2016 ............................................................... 3.12 3.10 3.12 3.11 6.3 6.3 6.3 6.2 2017 ............................................................... 3.19 – – – 6.3 – – –
Note: The sum of individual items may not equal totals due to rounding. Dashes indicate data are not available.
-226-

Supplemental table 20. Private financial activities industry workers, by establishment size: employer costs per hoursworked for employee compensation and costs as a percentage of total compensation, 2006-2017 -- Continued
500 workers or more
Compensationcomponent
Cost per hour worked Percent of total compensation
Mar. June Sep. Dec. Mar. June Sep. Dec.
Total compensation 2006 ............................................................... – – – $44.62 – – – 100.0 2007 ............................................................... 44.61 44.53 44.45 43.32 100.0 100.0 100.0 100.0 2008 ............................................................... 44.82 43.95 46.00 47.66 100.0 100.0 100.0 100.0 2009 ............................................................... 47.53 48.09 45.25 46.28 100.0 100.0 100.0 100.0 2010 ............................................................... 47.20 47.40 47.38 47.48 100.0 100.0 100.0 100.0
2011 ............................................................... 48.08 49.56 49.40 49.60 100.0 100.0 100.0 100.0 2012 ............................................................... 49.70 49.96 50.22 51.30 100.0 100.0 100.0 100.0 2013 ............................................................... 51.74 52.45 52.15 54.27 100.0 100.0 100.0 100.0 2014 ............................................................... 54.23 54.59 54.80 55.99 100.0 100.0 100.0 100.0 2015 ............................................................... 55.95 56.87 57.13 56.50 100.0 100.0 100.0 100.0 2016 ............................................................... 57.07 57.55 57.63 57.86 100.0 100.0 100.0 100.0 2017 ............................................................... 58.13 – – – 100.0 – – –
Wages and salaries 2006 ............................................................... – – – 28.87 – – – 64.7 2007 ............................................................... 29.07 29.07 29.04 27.83 65.2 65.3 65.3 64.3 2008 ............................................................... 29.48 28.36 29.91 30.91 65.8 64.5 65.0 64.9 2009 ............................................................... 30.78 31.06 29.09 29.57 64.7 64.6 64.3 63.9 2010 ............................................................... 30.02 30.34 30.33 30.22 63.6 64.0 64.0 63.6
2011 ............................................................... 30.74 31.03 30.97 31.13 63.9 62.6 62.7 62.8 2012 ............................................................... 31.27 31.49 31.61 31.93 62.9 63.0 62.9 62.2 2013 ............................................................... 32.19 32.72 32.74 33.54 62.2 62.4 62.8 61.8 2014 ............................................................... 33.70 33.90 34.19 35.02 62.1 62.1 62.4 62.5 2015 ............................................................... 35.30 35.79 36.03 35.84 63.1 62.9 63.1 63.4 2016 ............................................................... 36.23 36.58 36.54 36.78 63.5 63.6 63.4 63.6 2017 ............................................................... 36.80 – – – 63.3 – – –
Total benefits 2006 ............................................................... – – – 15.75 – – – 35.3 2007 ............................................................... 15.54 15.46 15.41 15.48 34.8 34.7 34.7 35.7 2008 ............................................................... 15.34 15.58 16.08 16.75 34.2 35.5 35.0 35.1 2009 ............................................................... 16.76 17.03 16.16 16.71 35.3 35.4 35.7 36.1 2010 ............................................................... 17.18 17.07 17.05 17.27 36.4 36.0 36.0 36.4
2011 ............................................................... 17.34 18.53 18.43 18.47 36.1 37.4 37.3 37.2 2012 ............................................................... 18.43 18.47 18.61 19.37 37.1 37.0 37.1 37.8 2013 ............................................................... 19.55 19.73 19.41 20.73 37.8 37.6 37.2 38.2 2014 ............................................................... 20.53 20.69 20.61 20.97 37.9 37.9 37.6 37.5 2015 ............................................................... 20.66 21.07 21.10 20.66 36.9 37.1 36.9 36.6 2016 ............................................................... 20.84 20.97 21.09 21.09 36.5 36.4 36.6 36.4 2017 ............................................................... 21.33 – – – 36.7 – – –
Paid leave 2006 ............................................................... – – – 4.10 – – – 9.2 2007 ............................................................... 4.05 4.04 4.04 3.97 9.1 9.1 9.1 9.2 2008 ............................................................... 4.19 4.03 4.44 4.59 9.3 9.2 9.7 9.6 2009 ............................................................... 4.56 4.62 4.12 4.25 9.6 9.6 9.1 9.2 2010 ............................................................... 4.32 4.35 4.36 4.38 9.1 9.2 9.2 9.2
2011 ............................................................... 4.45 4.48 4.47 4.58 9.3 9.0 9.1 9.2 2012 ............................................................... 4.61 4.65 4.66 4.70 9.3 9.3 9.3 9.2 2013 ............................................................... 4.70 4.76 4.74 4.94 9.1 9.1 9.1 9.1 2014 ............................................................... 4.96 5.00 5.05 5.15 9.1 9.2 9.2 9.2 2015 ............................................................... 5.19 5.26 5.30 5.33 9.3 9.2 9.3 9.4 2016 ............................................................... 5.37 5.39 5.39 5.43 9.4 9.4 9.3 9.4 2017 ............................................................... 5.43 – – – 9.3 – – –
Supplemental pay 2006 ............................................................... – – – 3.33 – – – 7.5 2007 ............................................................... 3.35 3.27 3.23 3.29 7.5 7.4 7.3 7.6 2008 ............................................................... 2.94 3.24 3.26 3.58 6.6 7.4 7.1 7.5 2009 ............................................................... 3.39 3.48 3.34 3.61 7.1 7.2 7.4 7.8 2010 ............................................................... 3.61 3.36 3.35 3.38 7.7 7.1 7.1 7.1
2011 ............................................................... 3.28 4.10 4.08 3.88 6.8 8.3 8.3 7.8 2012 ............................................................... 3.99 4.04 4.12 4.67 8.0 8.1 8.2 9.1 2013 ............................................................... 4.74 4.77 4.37 5.13 9.2 9.1 8.4 9.5 2014 ............................................................... 4.92 4.93 4.76 4.81 9.1 9.0 8.7 8.6 2015 ............................................................... 4.40 4.51 4.50 3.82 7.9 7.9 7.9 6.8 2016 ............................................................... 3.84 3.84 3.83 3.85 6.7 6.7 6.7 6.7
See footnotes at end of table.
-227-

Supplemental table 20. Private financial activities industry workers, by establishment size: employer costs per hoursworked for employee compensation and costs as a percentage of total compensation, 2006-2017 -- Continued
500 workers or more
Compensationcomponent
Cost per hour worked Percent of total compensation
Mar. June Sep. Dec. Mar. June Sep. Dec.
Supplemental pay 2017 ............................................................... 4.02 – – – 6.9 – – –
Insurance 2006 ............................................................... – – – 3.14 – – – 7.0 2007 ............................................................... 3.21 3.22 3.20 3.21 7.2 7.2 7.2 7.4 2008 ............................................................... 3.25 3.27 3.30 3.40 7.2 7.4 7.2 7.1 2009 ............................................................... 3.59 3.60 3.57 3.68 7.5 7.5 7.9 7.9 2010 ............................................................... 3.80 3.85 3.87 3.97 8.0 8.1 8.2 8.4
2011 ............................................................... 4.01 4.18 4.17 4.30 8.3 8.4 8.4 8.7 2012 ............................................................... 4.20 4.20 4.21 4.35 8.4 8.4 8.4 8.5 2013 ............................................................... 4.42 4.42 4.44 4.63 8.5 8.4 8.5 8.5 2014 ............................................................... 4.64 4.73 4.73 4.81 8.6 8.7 8.6 8.6 2015 ............................................................... 4.87 4.97 4.97 5.03 8.7 8.7 8.7 8.9 2016 ............................................................... 5.10 5.17 5.17 5.17 8.9 9.0 9.0 8.9 2017 ............................................................... 5.19 – – – 8.9 – – –
Retirement and savings 2006 ............................................................... – – – 2.47 – – – 5.5 2007 ............................................................... 2.22 2.22 2.25 2.33 5.0 5.0 5.1 5.4 2008 ............................................................... 2.23 2.29 2.30 2.33 5.0 5.2 5.0 4.9 2009 ............................................................... 2.35 2.44 2.33 2.32 4.9 5.1 5.2 5.0 2010 ............................................................... 2.57 2.56 2.58 2.64 5.4 5.4 5.4 5.6
2011 ............................................................... 2.67 2.79 2.73 2.72 5.6 5.6 5.5 5.5 2012 ............................................................... 2.60 2.50 2.54 2.56 5.2 5.0 5.1 5.0 2013 ............................................................... 2.57 2.63 2.70 2.78 5.0 5.0 5.2 5.1 2014 ............................................................... 2.73 2.74 2.75 2.83 5.0 5.0 5.0 5.1 2015 ............................................................... 2.83 2.94 2.93 3.03 5.1 5.2 5.1 5.4 2016 ............................................................... 3.07 3.09 3.23 3.18 5.4 5.4 5.6 5.5 2017 ............................................................... 3.17 – – – 5.5 – – –
Legally required benefits 2006 ............................................................... – – – 2.71 – – – 6.1 2007 ............................................................... 2.71 2.71 2.70 2.68 6.1 6.1 6.1 6.2 2008 ............................................................... 2.74 2.75 2.79 2.85 6.1 6.3 6.1 6.0 2009 ............................................................... 2.87 2.88 2.80 2.85 6.0 6.0 6.2 6.2 2010 ............................................................... 2.88 2.95 2.89 2.89 6.1 6.2 6.1 6.1
2011 ............................................................... 2.92 2.98 2.97 2.99 6.1 6.0 6.0 6.0 2012 ............................................................... 3.04 3.07 3.08 3.09 6.1 6.1 6.1 6.0 2013 ............................................................... 3.12 3.15 3.16 3.25 6.0 6.0 6.1 6.0 2014 ............................................................... 3.28 3.29 3.31 3.36 6.0 6.0 6.0 6.0 2015 ............................................................... 3.38 3.40 3.40 3.45 6.0 6.0 6.0 6.1 2016 ............................................................... 3.46 3.47 3.47 3.47 6.1 6.0 6.0 6.0 2017 ............................................................... 3.51 – – – 6.0 – – –
Note: The sum of individual items may not equal totals due to rounding. Dashes indicate data are not available.
-228-

Supplemental table 21. Private professional and business services industry workers, by occupational group: employercosts per hours worked for employee compensation and costs as a percentage of total compensation, 2006-2017
All workers
Compensationcomponent
Cost per hour worked Percent of total compensation
Mar. June Sep. Dec. Mar. June Sep. Dec.
Total compensation 2006 ............................................................... – – – $29.73 – – – 100.0 2007 ............................................................... 30.22 30.41 30.44 31.14 100.0 100.0 100.0 100.0 2008 ............................................................... 31.70 31.81 32.20 33.00 100.0 100.0 100.0 100.0 2009 ............................................................... 33.29 33.64 33.41 33.05 100.0 100.0 100.0 100.0 2010 ............................................................... 33.48 33.19 33.38 33.25 100.0 100.0 100.0 100.0
2011 ............................................................... 33.94 33.84 33.89 34.39 100.0 100.0 100.0 100.0 2012 ............................................................... 34.88 34.80 34.83 34.83 100.0 100.0 100.0 100.0 2013 ............................................................... 35.21 34.92 34.94 35.54 100.0 100.0 100.0 100.0 2014 ............................................................... 35.75 35.91 36.10 38.49 100.0 100.0 100.0 100.0 2015 ............................................................... 39.42 38.39 38.56 39.40 100.0 100.0 100.0 100.0 2016 ............................................................... 39.35 39.39 39.64 39.83 100.0 100.0 100.0 100.0 2017 ............................................................... 40.46 – – – 100.0 – – –
Wages and salaries 2006 ............................................................... – – – 21.84 – – – 73.5 2007 ............................................................... 22.19 22.30 22.28 22.82 73.4 73.3 73.2 73.3 2008 ............................................................... 23.23 23.34 23.66 24.15 73.3 73.4 73.5 73.2 2009 ............................................................... 24.39 24.38 24.19 24.02 73.2 72.5 72.4 72.7 2010 ............................................................... 24.29 24.10 24.26 24.33 72.6 72.6 72.7 73.2
2011 ............................................................... 24.76 24.64 24.69 24.85 73.0 72.8 72.8 72.3 2012 ............................................................... 25.14 25.10 25.13 25.15 72.1 72.1 72.2 72.2 2013 ............................................................... 25.41 25.16 25.16 25.53 72.2 72.0 72.0 71.9 2014 ............................................................... 25.59 25.73 25.88 27.21 71.6 71.7 71.7 70.7 2015 ............................................................... 27.87 27.19 27.34 28.16 70.7 70.8 70.9 71.5 2016 ............................................................... 28.17 28.20 28.33 28.41 71.6 71.6 71.5 71.3 2017 ............................................................... 28.78 – – – 71.1 – – –
Total benefits 2006 ............................................................... – – – 7.89 – – – 26.5 2007 ............................................................... 8.03 8.11 8.16 8.32 26.6 26.7 26.8 26.7 2008 ............................................................... 8.48 8.47 8.55 8.85 26.7 26.6 26.5 26.8 2009 ............................................................... 8.91 9.26 9.22 9.04 26.8 27.5 27.6 27.3 2010 ............................................................... 9.19 9.09 9.12 8.92 27.4 27.4 27.3 26.8
2011 ............................................................... 9.18 9.19 9.20 9.54 27.0 27.2 27.2 27.7 2012 ............................................................... 9.74 9.70 9.70 9.68 27.9 27.9 27.8 27.8 2013 ............................................................... 9.79 9.76 9.78 10.00 27.8 28.0 28.0 28.1 2014 ............................................................... 10.16 10.18 10.21 11.28 28.4 28.3 28.3 29.3 2015 ............................................................... 11.55 11.20 11.23 11.24 29.3 29.2 29.1 28.5 2016 ............................................................... 11.18 11.18 11.31 11.42 28.4 28.4 28.5 28.7 2017 ............................................................... 11.68 – – – 28.9 – – –
Paid leave 2006 ............................................................... – – – 2.12 – – – 7.1 2007 ............................................................... 2.16 2.16 2.14 2.20 7.1 7.1 7.0 7.1 2008 ............................................................... 2.24 2.23 2.27 2.33 7.1 7.0 7.1 7.1 2009 ............................................................... 2.34 2.34 2.32 2.30 7.0 6.9 7.0 7.0 2010 ............................................................... 2.34 2.32 2.32 2.38 7.0 7.0 7.0 7.1
2011 ............................................................... 2.42 2.41 2.42 2.55 7.1 7.1 7.1 7.4 2012 ............................................................... 2.60 2.57 2.58 2.61 7.4 7.4 7.4 7.5 2013 ............................................................... 2.64 2.59 2.58 2.65 7.5 7.4 7.4 7.5 2014 ............................................................... 2.67 2.67 2.68 2.80 7.5 7.4 7.4 7.3 2015 ............................................................... 2.83 2.76 2.77 2.76 7.2 7.2 7.2 7.0 2016 ............................................................... 2.75 2.76 2.83 2.90 7.0 7.0 7.1 7.3 2017 ............................................................... 2.91 – – – 7.2 – – –
Supplemental pay 2006 ............................................................... – – – .81 – – – 2.7 2007 ............................................................... .82 .84 .84 .84 2.7 2.8 2.7 2.7 2008 ............................................................... .85 .86 .84 .95 2.7 2.7 2.6 2.9 2009 ............................................................... .90 1.27 1.26 1.18 2.7 3.8 3.8 3.6 2010 ............................................................... 1.16 1.13 1.13 .78 3.5 3.4 3.4 2.4
2011 ............................................................... .85 .87 .87 .94 2.5 2.6 2.6 2.7 2012 ............................................................... .99 .96 .93 .87 2.8 2.8 2.7 2.5 2013 ............................................................... .84 .85 .86 .93 2.4 2.4 2.5 2.6 2014 ............................................................... .98 .90 .90 1.82 2.8 2.5 2.5 4.7 2015 ............................................................... 1.92 1.85 1.87 1.95 4.9 4.8 4.9 5.0 2016 ............................................................... 2.03 2.00 1.95 1.87 5.1 5.1 4.9 4.7
See footnotes at end of table.
-229-

Supplemental table 21. Private professional and business services industry workers, by occupational group: employercosts per hours worked for employee compensation and costs as a percentage of total compensation, 2006-2017
All workers
Compensationcomponent
Cost per hour worked Percent of total compensation
Mar. June Sep. Dec. Mar. June Sep. Dec.
Supplemental pay 2017 ............................................................... 2.00 – – – 5.0 – – –
Insurance 2006 ............................................................... – – – 1.74 – – – 5.8 2007 ............................................................... 1.81 1.83 1.84 1.87 6.0 6.0 6.0 6.0 2008 ............................................................... 1.93 1.92 1.93 2.04 6.1 6.0 6.0 6.2 2009 ............................................................... 2.06 2.05 2.06 2.07 6.2 6.1 6.2 6.3 2010 ............................................................... 2.13 2.13 2.12 2.18 6.4 6.4 6.4 6.6
2011 ............................................................... 2.25 2.26 2.26 2.36 6.6 6.7 6.7 6.8 2012 ............................................................... 2.40 2.40 2.40 2.39 6.9 6.9 6.9 6.8 2013 ............................................................... 2.46 2.44 2.42 2.41 7.0 7.0 6.9 6.8 2014 ............................................................... 2.46 2.45 2.45 2.44 6.9 6.8 6.8 6.3 2015 ............................................................... 2.51 2.44 2.45 2.32 6.4 6.4 6.3 5.9 2016 ............................................................... 2.35 2.35 2.41 2.47 6.0 6.0 6.1 6.2 2017 ............................................................... 2.50 – – – 6.2 – – –
Retirement and savings 2006 ............................................................... – – – .82 – – – 2.8 2007 ............................................................... .83 .87 .94 .96 2.7 2.9 3.1 3.1 2008 ............................................................... .98 .98 1.00 .99 3.1 3.1 3.1 3.0 2009 ............................................................... 1.04 1.04 1.03 .96 3.1 3.1 3.1 2.9 2010 ............................................................... .97 .94 .95 .99 2.9 2.8 2.9 3.0
2011 ............................................................... 1.02 1.02 1.02 1.05 3.0 3.0 3.0 3.1 2012 ............................................................... 1.08 1.07 1.10 1.13 3.1 3.1 3.2 3.2 2013 ............................................................... 1.14 1.19 1.23 1.24 3.2 3.4 3.5 3.5 2014 ............................................................... 1.26 1.38 1.39 1.38 3.5 3.8 3.8 3.6 2015 ............................................................... 1.40 1.30 1.28 1.30 3.6 3.4 3.3 3.3 2016 ............................................................... 1.16 1.18 1.22 1.24 3.0 3.0 3.1 3.1 2017 ............................................................... 1.28 – – – 3.2 – – –
Legally required benefits 2006 ............................................................... – – – 2.39 – – – 8.1 2007 ............................................................... 2.41 2.41 2.41 2.44 8.0 7.9 7.9 7.8 2008 ............................................................... 2.48 2.48 2.50 2.53 7.8 7.8 7.8 7.7 2009 ............................................................... 2.56 2.56 2.55 2.53 7.7 7.6 7.6 7.7 2010 ............................................................... 2.58 2.57 2.59 2.59 7.7 7.7 7.7 7.8
2011 ............................................................... 2.64 2.64 2.65 2.64 7.8 7.8 7.8 7.7 2012 ............................................................... 2.68 2.69 2.69 2.69 7.7 7.7 7.7 7.7 2013 ............................................................... 2.71 2.70 2.70 2.77 7.7 7.7 7.7 7.8 2014 ............................................................... 2.79 2.79 2.79 2.85 7.8 7.8 7.7 7.4 2015 ............................................................... 2.88 2.85 2.85 2.91 7.3 7.4 7.4 7.4 2016 ............................................................... 2.90 2.89 2.91 2.94 7.4 7.3 7.3 7.4 2017 ............................................................... 2.99 – – – 7.4 – – –
Note: The sum of individual items may not equal totals due to rounding. Dashes indicate data are not available.
-230-
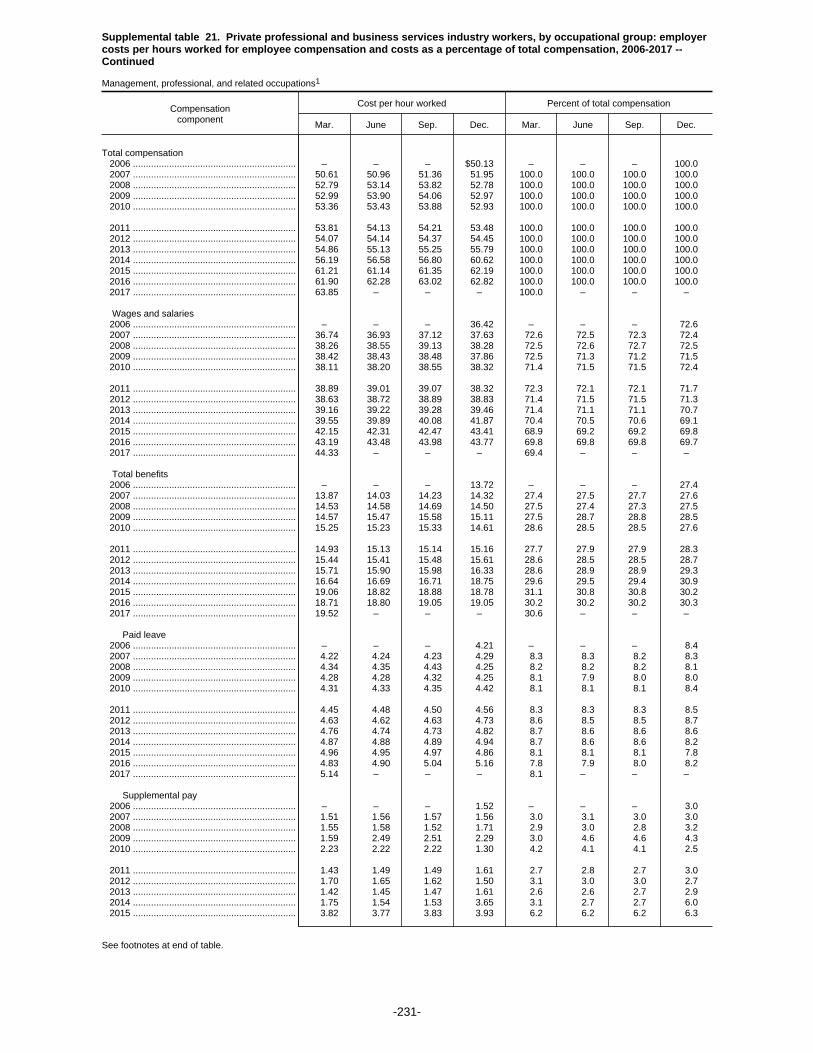
Supplemental table 21. Private professional and business services industry workers, by occupational group: employercosts per hours worked for employee compensation and costs as a percentage of total compensation, 2006-2017 --Continued
Management, professional, and related occupations1
Compensationcomponent
Cost per hour worked Percent of total compensation
Mar. June Sep. Dec. Mar. June Sep. Dec.
Total compensation 2006 ............................................................... – – – $50.13 – – – 100.0 2007 ............................................................... 50.61 50.96 51.36 51.95 100.0 100.0 100.0 100.0 2008 ............................................................... 52.79 53.14 53.82 52.78 100.0 100.0 100.0 100.0 2009 ............................................................... 52.99 53.90 54.06 52.97 100.0 100.0 100.0 100.0 2010 ............................................................... 53.36 53.43 53.88 52.93 100.0 100.0 100.0 100.0
2011 ............................................................... 53.81 54.13 54.21 53.48 100.0 100.0 100.0 100.0 2012 ............................................................... 54.07 54.14 54.37 54.45 100.0 100.0 100.0 100.0 2013 ............................................................... 54.86 55.13 55.25 55.79 100.0 100.0 100.0 100.0 2014 ............................................................... 56.19 56.58 56.80 60.62 100.0 100.0 100.0 100.0 2015 ............................................................... 61.21 61.14 61.35 62.19 100.0 100.0 100.0 100.0 2016 ............................................................... 61.90 62.28 63.02 62.82 100.0 100.0 100.0 100.0 2017 ............................................................... 63.85 – – – 100.0 – – –
Wages and salaries 2006 ............................................................... – – – 36.42 – – – 72.6 2007 ............................................................... 36.74 36.93 37.12 37.63 72.6 72.5 72.3 72.4 2008 ............................................................... 38.26 38.55 39.13 38.28 72.5 72.6 72.7 72.5 2009 ............................................................... 38.42 38.43 38.48 37.86 72.5 71.3 71.2 71.5 2010 ............................................................... 38.11 38.20 38.55 38.32 71.4 71.5 71.5 72.4
2011 ............................................................... 38.89 39.01 39.07 38.32 72.3 72.1 72.1 71.7 2012 ............................................................... 38.63 38.72 38.89 38.83 71.4 71.5 71.5 71.3 2013 ............................................................... 39.16 39.22 39.28 39.46 71.4 71.1 71.1 70.7 2014 ............................................................... 39.55 39.89 40.08 41.87 70.4 70.5 70.6 69.1 2015 ............................................................... 42.15 42.31 42.47 43.41 68.9 69.2 69.2 69.8 2016 ............................................................... 43.19 43.48 43.98 43.77 69.8 69.8 69.8 69.7 2017 ............................................................... 44.33 – – – 69.4 – – –
Total benefits 2006 ............................................................... – – – 13.72 – – – 27.4 2007 ............................................................... 13.87 14.03 14.23 14.32 27.4 27.5 27.7 27.6 2008 ............................................................... 14.53 14.58 14.69 14.50 27.5 27.4 27.3 27.5 2009 ............................................................... 14.57 15.47 15.58 15.11 27.5 28.7 28.8 28.5 2010 ............................................................... 15.25 15.23 15.33 14.61 28.6 28.5 28.5 27.6
2011 ............................................................... 14.93 15.13 15.14 15.16 27.7 27.9 27.9 28.3 2012 ............................................................... 15.44 15.41 15.48 15.61 28.6 28.5 28.5 28.7 2013 ............................................................... 15.71 15.90 15.98 16.33 28.6 28.9 28.9 29.3 2014 ............................................................... 16.64 16.69 16.71 18.75 29.6 29.5 29.4 30.9 2015 ............................................................... 19.06 18.82 18.88 18.78 31.1 30.8 30.8 30.2 2016 ............................................................... 18.71 18.80 19.05 19.05 30.2 30.2 30.2 30.3 2017 ............................................................... 19.52 – – – 30.6 – – –
Paid leave 2006 ............................................................... – – – 4.21 – – – 8.4 2007 ............................................................... 4.22 4.24 4.23 4.29 8.3 8.3 8.2 8.3 2008 ............................................................... 4.34 4.35 4.43 4.25 8.2 8.2 8.2 8.1 2009 ............................................................... 4.28 4.28 4.32 4.25 8.1 7.9 8.0 8.0 2010 ............................................................... 4.31 4.33 4.35 4.42 8.1 8.1 8.1 8.4
2011 ............................................................... 4.45 4.48 4.50 4.56 8.3 8.3 8.3 8.5 2012 ............................................................... 4.63 4.62 4.63 4.73 8.6 8.5 8.5 8.7 2013 ............................................................... 4.76 4.74 4.73 4.82 8.7 8.6 8.6 8.6 2014 ............................................................... 4.87 4.88 4.89 4.94 8.7 8.6 8.6 8.2 2015 ............................................................... 4.96 4.95 4.97 4.86 8.1 8.1 8.1 7.8 2016 ............................................................... 4.83 4.90 5.04 5.16 7.8 7.9 8.0 8.2 2017 ............................................................... 5.14 – – – 8.1 – – –
Supplemental pay 2006 ............................................................... – – – 1.52 – – – 3.0 2007 ............................................................... 1.51 1.56 1.57 1.56 3.0 3.1 3.0 3.0 2008 ............................................................... 1.55 1.58 1.52 1.71 2.9 3.0 2.8 3.2 2009 ............................................................... 1.59 2.49 2.51 2.29 3.0 4.6 4.6 4.3 2010 ............................................................... 2.23 2.22 2.22 1.30 4.2 4.1 4.1 2.5
2011 ............................................................... 1.43 1.49 1.49 1.61 2.7 2.8 2.7 3.0 2012 ............................................................... 1.70 1.65 1.62 1.50 3.1 3.0 3.0 2.7 2013 ............................................................... 1.42 1.45 1.47 1.61 2.6 2.6 2.7 2.9 2014 ............................................................... 1.75 1.54 1.53 3.65 3.1 2.7 2.7 6.0 2015 ............................................................... 3.82 3.77 3.83 3.93 6.2 6.2 6.2 6.3
See footnotes at end of table.
-231-
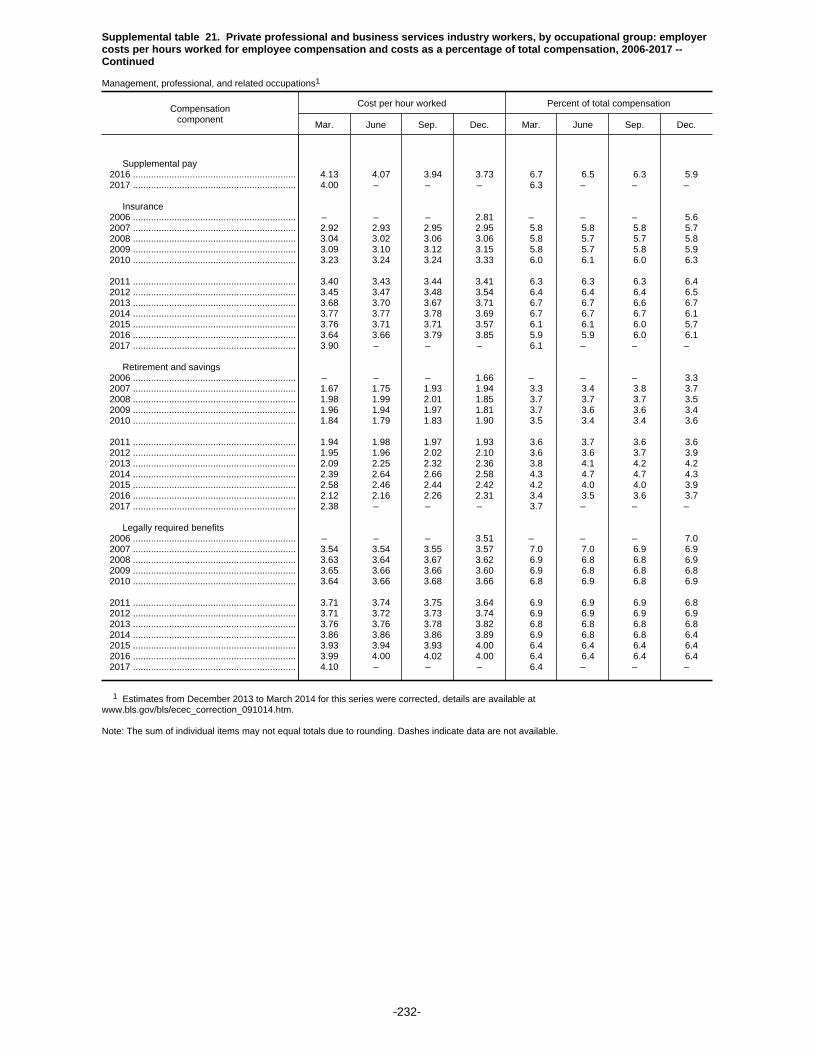
Supplemental table 21. Private professional and business services industry workers, by occupational group: employercosts per hours worked for employee compensation and costs as a percentage of total compensation, 2006-2017 --Continued
Management, professional, and related occupations1
Compensationcomponent
Cost per hour worked Percent of total compensation
Mar. June Sep. Dec. Mar. June Sep. Dec.
Supplemental pay 2016 ............................................................... 4.13 4.07 3.94 3.73 6.7 6.5 6.3 5.9 2017 ............................................................... 4.00 – – – 6.3 – – –
Insurance 2006 ............................................................... – – – 2.81 – – – 5.6 2007 ............................................................... 2.92 2.93 2.95 2.95 5.8 5.8 5.8 5.7 2008 ............................................................... 3.04 3.02 3.06 3.06 5.8 5.7 5.7 5.8 2009 ............................................................... 3.09 3.10 3.12 3.15 5.8 5.7 5.8 5.9 2010 ............................................................... 3.23 3.24 3.24 3.33 6.0 6.1 6.0 6.3
2011 ............................................................... 3.40 3.43 3.44 3.41 6.3 6.3 6.3 6.4 2012 ............................................................... 3.45 3.47 3.48 3.54 6.4 6.4 6.4 6.5 2013 ............................................................... 3.68 3.70 3.67 3.71 6.7 6.7 6.6 6.7 2014 ............................................................... 3.77 3.77 3.78 3.69 6.7 6.7 6.7 6.1 2015 ............................................................... 3.76 3.71 3.71 3.57 6.1 6.1 6.0 5.7 2016 ............................................................... 3.64 3.66 3.79 3.85 5.9 5.9 6.0 6.1 2017 ............................................................... 3.90 – – – 6.1 – – –
Retirement and savings 2006 ............................................................... – – – 1.66 – – – 3.3 2007 ............................................................... 1.67 1.75 1.93 1.94 3.3 3.4 3.8 3.7 2008 ............................................................... 1.98 1.99 2.01 1.85 3.7 3.7 3.7 3.5 2009 ............................................................... 1.96 1.94 1.97 1.81 3.7 3.6 3.6 3.4 2010 ............................................................... 1.84 1.79 1.83 1.90 3.5 3.4 3.4 3.6
2011 ............................................................... 1.94 1.98 1.97 1.93 3.6 3.7 3.6 3.6 2012 ............................................................... 1.95 1.96 2.02 2.10 3.6 3.6 3.7 3.9 2013 ............................................................... 2.09 2.25 2.32 2.36 3.8 4.1 4.2 4.2 2014 ............................................................... 2.39 2.64 2.66 2.58 4.3 4.7 4.7 4.3 2015 ............................................................... 2.58 2.46 2.44 2.42 4.2 4.0 4.0 3.9 2016 ............................................................... 2.12 2.16 2.26 2.31 3.4 3.5 3.6 3.7 2017 ............................................................... 2.38 – – – 3.7 – – –
Legally required benefits 2006 ............................................................... – – – 3.51 – – – 7.0 2007 ............................................................... 3.54 3.54 3.55 3.57 7.0 7.0 6.9 6.9 2008 ............................................................... 3.63 3.64 3.67 3.62 6.9 6.8 6.8 6.9 2009 ............................................................... 3.65 3.66 3.66 3.60 6.9 6.8 6.8 6.8 2010 ............................................................... 3.64 3.66 3.68 3.66 6.8 6.9 6.8 6.9
2011 ............................................................... 3.71 3.74 3.75 3.64 6.9 6.9 6.9 6.8 2012 ............................................................... 3.71 3.72 3.73 3.74 6.9 6.9 6.9 6.9 2013 ............................................................... 3.76 3.76 3.78 3.82 6.8 6.8 6.8 6.8 2014 ............................................................... 3.86 3.86 3.86 3.89 6.9 6.8 6.8 6.4 2015 ............................................................... 3.93 3.94 3.93 4.00 6.4 6.4 6.4 6.4 2016 ............................................................... 3.99 4.00 4.02 4.00 6.4 6.4 6.4 6.4 2017 ............................................................... 4.10 – – – 6.4 – – –
1 Estimates from December 2013 to March 2014 for this series were corrected, details are available atwww.bls.gov/bls/ecec_correction_091014.htm.
Note: The sum of individual items may not equal totals due to rounding. Dashes indicate data are not available.
-232-
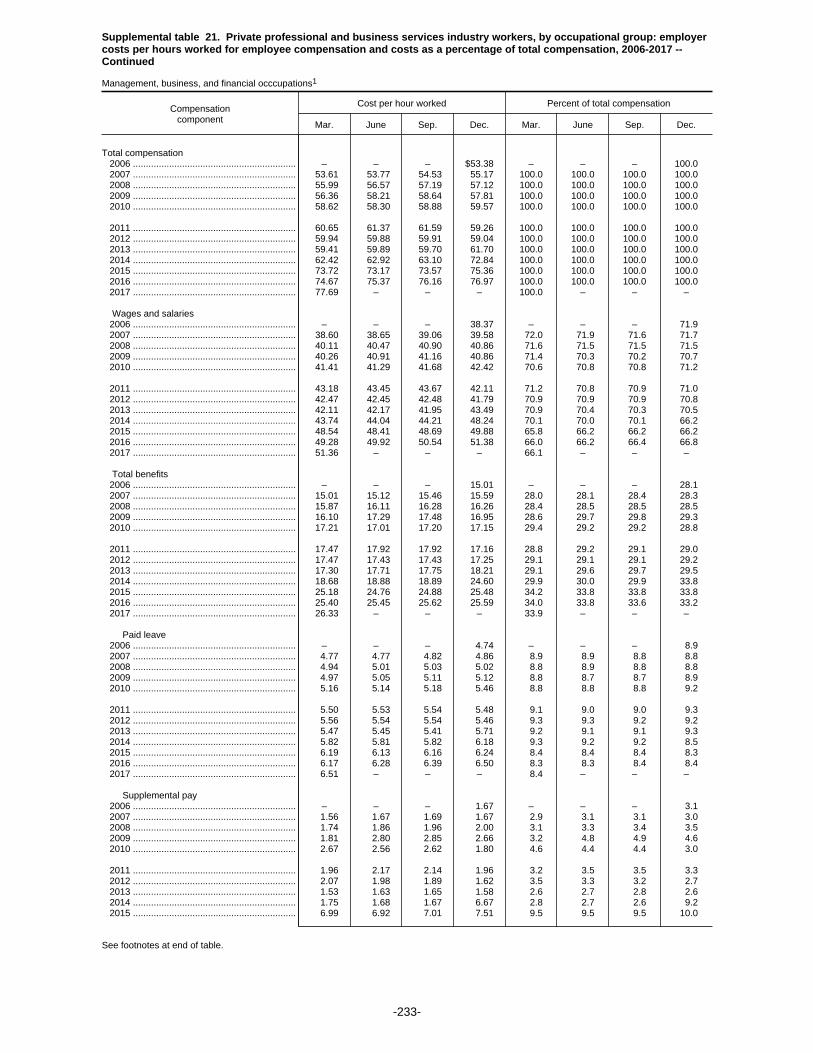
Supplemental table 21. Private professional and business services industry workers, by occupational group: employercosts per hours worked for employee compensation and costs as a percentage of total compensation, 2006-2017 --Continued
Management, business, and financial occcupations1
Compensationcomponent
Cost per hour worked Percent of total compensation
Mar. June Sep. Dec. Mar. June Sep. Dec.
Total compensation 2006 ............................................................... – – – $53.38 – – – 100.0 2007 ............................................................... 53.61 53.77 54.53 55.17 100.0 100.0 100.0 100.0 2008 ............................................................... 55.99 56.57 57.19 57.12 100.0 100.0 100.0 100.0 2009 ............................................................... 56.36 58.21 58.64 57.81 100.0 100.0 100.0 100.0 2010 ............................................................... 58.62 58.30 58.88 59.57 100.0 100.0 100.0 100.0
2011 ............................................................... 60.65 61.37 61.59 59.26 100.0 100.0 100.0 100.0 2012 ............................................................... 59.94 59.88 59.91 59.04 100.0 100.0 100.0 100.0 2013 ............................................................... 59.41 59.89 59.70 61.70 100.0 100.0 100.0 100.0 2014 ............................................................... 62.42 62.92 63.10 72.84 100.0 100.0 100.0 100.0 2015 ............................................................... 73.72 73.17 73.57 75.36 100.0 100.0 100.0 100.0 2016 ............................................................... 74.67 75.37 76.16 76.97 100.0 100.0 100.0 100.0 2017 ............................................................... 77.69 – – – 100.0 – – –
Wages and salaries 2006 ............................................................... – – – 38.37 – – – 71.9 2007 ............................................................... 38.60 38.65 39.06 39.58 72.0 71.9 71.6 71.7 2008 ............................................................... 40.11 40.47 40.90 40.86 71.6 71.5 71.5 71.5 2009 ............................................................... 40.26 40.91 41.16 40.86 71.4 70.3 70.2 70.7 2010 ............................................................... 41.41 41.29 41.68 42.42 70.6 70.8 70.8 71.2
2011 ............................................................... 43.18 43.45 43.67 42.11 71.2 70.8 70.9 71.0 2012 ............................................................... 42.47 42.45 42.48 41.79 70.9 70.9 70.9 70.8 2013 ............................................................... 42.11 42.17 41.95 43.49 70.9 70.4 70.3 70.5 2014 ............................................................... 43.74 44.04 44.21 48.24 70.1 70.0 70.1 66.2 2015 ............................................................... 48.54 48.41 48.69 49.88 65.8 66.2 66.2 66.2 2016 ............................................................... 49.28 49.92 50.54 51.38 66.0 66.2 66.4 66.8 2017 ............................................................... 51.36 – – – 66.1 – – –
Total benefits 2006 ............................................................... – – – 15.01 – – – 28.1 2007 ............................................................... 15.01 15.12 15.46 15.59 28.0 28.1 28.4 28.3 2008 ............................................................... 15.87 16.11 16.28 16.26 28.4 28.5 28.5 28.5 2009 ............................................................... 16.10 17.29 17.48 16.95 28.6 29.7 29.8 29.3 2010 ............................................................... 17.21 17.01 17.20 17.15 29.4 29.2 29.2 28.8
2011 ............................................................... 17.47 17.92 17.92 17.16 28.8 29.2 29.1 29.0 2012 ............................................................... 17.47 17.43 17.43 17.25 29.1 29.1 29.1 29.2 2013 ............................................................... 17.30 17.71 17.75 18.21 29.1 29.6 29.7 29.5 2014 ............................................................... 18.68 18.88 18.89 24.60 29.9 30.0 29.9 33.8 2015 ............................................................... 25.18 24.76 24.88 25.48 34.2 33.8 33.8 33.8 2016 ............................................................... 25.40 25.45 25.62 25.59 34.0 33.8 33.6 33.2 2017 ............................................................... 26.33 – – – 33.9 – – –
Paid leave 2006 ............................................................... – – – 4.74 – – – 8.9 2007 ............................................................... 4.77 4.77 4.82 4.86 8.9 8.9 8.8 8.8 2008 ............................................................... 4.94 5.01 5.03 5.02 8.8 8.9 8.8 8.8 2009 ............................................................... 4.97 5.05 5.11 5.12 8.8 8.7 8.7 8.9 2010 ............................................................... 5.16 5.14 5.18 5.46 8.8 8.8 8.8 9.2
2011 ............................................................... 5.50 5.53 5.54 5.48 9.1 9.0 9.0 9.3 2012 ............................................................... 5.56 5.54 5.54 5.46 9.3 9.3 9.2 9.2 2013 ............................................................... 5.47 5.45 5.41 5.71 9.2 9.1 9.1 9.3 2014 ............................................................... 5.82 5.81 5.82 6.18 9.3 9.2 9.2 8.5 2015 ............................................................... 6.19 6.13 6.16 6.24 8.4 8.4 8.4 8.3 2016 ............................................................... 6.17 6.28 6.39 6.50 8.3 8.3 8.4 8.4 2017 ............................................................... 6.51 – – – 8.4 – – –
Supplemental pay 2006 ............................................................... – – – 1.67 – – – 3.1 2007 ............................................................... 1.56 1.67 1.69 1.67 2.9 3.1 3.1 3.0 2008 ............................................................... 1.74 1.86 1.96 2.00 3.1 3.3 3.4 3.5 2009 ............................................................... 1.81 2.80 2.85 2.66 3.2 4.8 4.9 4.6 2010 ............................................................... 2.67 2.56 2.62 1.80 4.6 4.4 4.4 3.0
2011 ............................................................... 1.96 2.17 2.14 1.96 3.2 3.5 3.5 3.3 2012 ............................................................... 2.07 1.98 1.89 1.62 3.5 3.3 3.2 2.7 2013 ............................................................... 1.53 1.63 1.65 1.58 2.6 2.7 2.8 2.6 2014 ............................................................... 1.75 1.68 1.67 6.67 2.8 2.7 2.6 9.2 2015 ............................................................... 6.99 6.92 7.01 7.51 9.5 9.5 9.5 10.0
See footnotes at end of table.
-233-
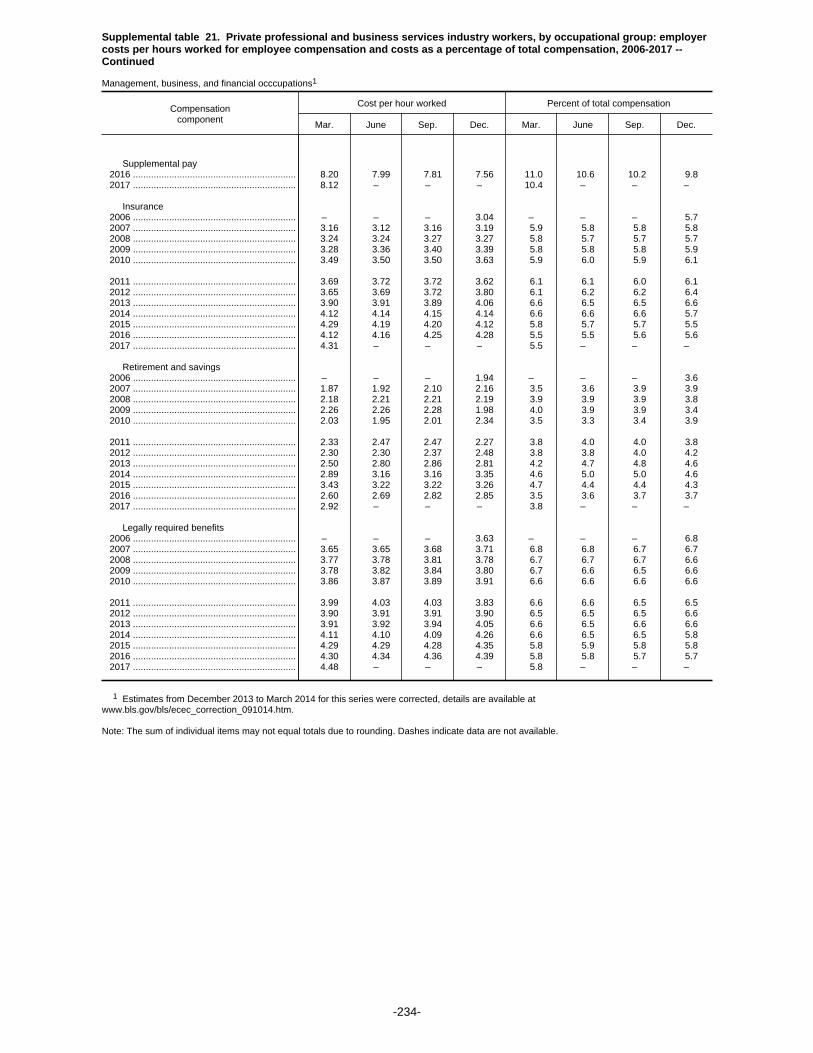
Supplemental table 21. Private professional and business services industry workers, by occupational group: employercosts per hours worked for employee compensation and costs as a percentage of total compensation, 2006-2017 --Continued
Management, business, and financial occcupations1
Compensationcomponent
Cost per hour worked Percent of total compensation
Mar. June Sep. Dec. Mar. June Sep. Dec.
Supplemental pay 2016 ............................................................... 8.20 7.99 7.81 7.56 11.0 10.6 10.2 9.8 2017 ............................................................... 8.12 – – – 10.4 – – –
Insurance 2006 ............................................................... – – – 3.04 – – – 5.7 2007 ............................................................... 3.16 3.12 3.16 3.19 5.9 5.8 5.8 5.8 2008 ............................................................... 3.24 3.24 3.27 3.27 5.8 5.7 5.7 5.7 2009 ............................................................... 3.28 3.36 3.40 3.39 5.8 5.8 5.8 5.9 2010 ............................................................... 3.49 3.50 3.50 3.63 5.9 6.0 5.9 6.1
2011 ............................................................... 3.69 3.72 3.72 3.62 6.1 6.1 6.0 6.1 2012 ............................................................... 3.65 3.69 3.72 3.80 6.1 6.2 6.2 6.4 2013 ............................................................... 3.90 3.91 3.89 4.06 6.6 6.5 6.5 6.6 2014 ............................................................... 4.12 4.14 4.15 4.14 6.6 6.6 6.6 5.7 2015 ............................................................... 4.29 4.19 4.20 4.12 5.8 5.7 5.7 5.5 2016 ............................................................... 4.12 4.16 4.25 4.28 5.5 5.5 5.6 5.6 2017 ............................................................... 4.31 – – – 5.5 – – –
Retirement and savings 2006 ............................................................... – – – 1.94 – – – 3.6 2007 ............................................................... 1.87 1.92 2.10 2.16 3.5 3.6 3.9 3.9 2008 ............................................................... 2.18 2.21 2.21 2.19 3.9 3.9 3.9 3.8 2009 ............................................................... 2.26 2.26 2.28 1.98 4.0 3.9 3.9 3.4 2010 ............................................................... 2.03 1.95 2.01 2.34 3.5 3.3 3.4 3.9
2011 ............................................................... 2.33 2.47 2.47 2.27 3.8 4.0 4.0 3.8 2012 ............................................................... 2.30 2.30 2.37 2.48 3.8 3.8 4.0 4.2 2013 ............................................................... 2.50 2.80 2.86 2.81 4.2 4.7 4.8 4.6 2014 ............................................................... 2.89 3.16 3.16 3.35 4.6 5.0 5.0 4.6 2015 ............................................................... 3.43 3.22 3.22 3.26 4.7 4.4 4.4 4.3 2016 ............................................................... 2.60 2.69 2.82 2.85 3.5 3.6 3.7 3.7 2017 ............................................................... 2.92 – – – 3.8 – – –
Legally required benefits 2006 ............................................................... – – – 3.63 – – – 6.8 2007 ............................................................... 3.65 3.65 3.68 3.71 6.8 6.8 6.7 6.7 2008 ............................................................... 3.77 3.78 3.81 3.78 6.7 6.7 6.7 6.6 2009 ............................................................... 3.78 3.82 3.84 3.80 6.7 6.6 6.5 6.6 2010 ............................................................... 3.86 3.87 3.89 3.91 6.6 6.6 6.6 6.6
2011 ............................................................... 3.99 4.03 4.03 3.83 6.6 6.6 6.5 6.5 2012 ............................................................... 3.90 3.91 3.91 3.90 6.5 6.5 6.5 6.6 2013 ............................................................... 3.91 3.92 3.94 4.05 6.6 6.5 6.6 6.6 2014 ............................................................... 4.11 4.10 4.09 4.26 6.6 6.5 6.5 5.8 2015 ............................................................... 4.29 4.29 4.28 4.35 5.8 5.9 5.8 5.8 2016 ............................................................... 4.30 4.34 4.36 4.39 5.8 5.8 5.7 5.7 2017 ............................................................... 4.48 – – – 5.8 – – –
1 Estimates from December 2013 to March 2014 for this series were corrected, details are available atwww.bls.gov/bls/ecec_correction_091014.htm.
Note: The sum of individual items may not equal totals due to rounding. Dashes indicate data are not available.
-234-

Supplemental table 21. Private professional and business services industry workers, by occupational group: employercosts per hours worked for employee compensation and costs as a percentage of total compensation, 2006-2017 --Continued
Professional and related occupations1
Compensationcomponent
Cost per hour worked Percent of total compensation
Mar. June Sep. Dec. Mar. June Sep. Dec.
Total compensation 2006 ............................................................... – – – $48.78 – – – 100.0 2007 ............................................................... 49.37 49.81 50.07 50.68 100.0 100.0 100.0 100.0 2008 ............................................................... 51.52 51.80 52.49 51.02 100.0 100.0 100.0 100.0 2009 ............................................................... 51.66 52.20 52.22 51.05 100.0 100.0 100.0 100.0 2010 ............................................................... 51.27 51.49 51.89 50.09 100.0 100.0 100.0 100.0
2011 ............................................................... 50.87 51.03 51.03 50.50 100.0 100.0 100.0 100.0 2012 ............................................................... 51.05 51.14 51.45 51.51 100.0 100.0 100.0 100.0 2013 ............................................................... 52.01 52.10 52.61 51.85 100.0 100.0 100.0 100.0 2014 ............................................................... 52.12 52.38 52.67 52.60 100.0 100.0 100.0 100.0 2015 ............................................................... 53.01 53.36 53.28 54.03 100.0 100.0 100.0 100.0 2016 ............................................................... 54.28 54.02 54.94 54.06 100.0 100.0 100.0 100.0 2017 ............................................................... 55.65 – – – 100.0 – – –
Wages and salaries 2006 ............................................................... – – – 35.60 – – – 73.0 2007 ............................................................... 35.97 36.23 36.34 36.86 72.9 72.7 72.6 72.7 2008 ............................................................... 37.53 37.81 38.43 37.23 72.8 73.0 73.2 73.0 2009 ............................................................... 37.69 37.45 37.40 36.67 73.0 71.7 71.6 71.8 2010 ............................................................... 36.79 36.96 37.31 36.57 71.8 71.8 71.9 73.0
2011 ............................................................... 37.04 37.10 37.09 36.37 72.8 72.7 72.7 72.0 2012 ............................................................... 36.65 36.78 36.99 36.95 71.8 71.9 71.9 71.7 2013 ............................................................... 37.31 37.35 37.69 36.77 71.7 71.7 71.6 70.9 2014 ............................................................... 36.81 37.14 37.38 37.68 70.6 70.9 71.0 71.6 2015 ............................................................... 37.96 38.37 38.37 39.40 71.6 71.9 72.0 72.9 2016 ............................................................... 39.56 39.43 39.94 39.06 72.9 73.0 72.7 72.2 2017 ............................................................... 40.17 – – – 72.2 – – –
Total benefits 2006 ............................................................... – – – 13.17 – – – 27.0 2007 ............................................................... 13.40 13.58 13.73 13.81 27.1 27.3 27.4 27.3 2008 ............................................................... 13.99 13.99 14.06 13.79 27.2 27.0 26.8 27.0 2009 ............................................................... 13.97 14.75 14.82 14.38 27.0 28.3 28.4 28.2 2010 ............................................................... 14.47 14.53 14.58 13.52 28.2 28.2 28.1 27.0
2011 ............................................................... 13.83 13.93 13.94 14.13 27.2 27.3 27.3 28.0 2012 ............................................................... 14.39 14.36 14.45 14.57 28.2 28.1 28.1 28.3 2013 ............................................................... 14.70 14.76 14.92 15.08 28.3 28.3 28.4 29.1 2014 ............................................................... 15.31 15.24 15.29 14.92 29.4 29.1 29.0 28.4 2015 ............................................................... 15.05 14.99 14.92 14.63 28.4 28.1 28.0 27.1 2016 ............................................................... 14.72 14.60 15.01 15.00 27.1 27.0 27.3 27.8 2017 ............................................................... 15.49 – – – 27.8 – – –
Paid leave 2006 ............................................................... – – – 3.98 – – – 8.2 2007 ............................................................... 4.00 4.03 3.99 4.06 8.1 8.1 8.0 8.0 2008 ............................................................... 4.10 4.10 4.19 3.94 8.0 7.9 8.0 7.7 2009 ............................................................... 4.01 3.98 4.01 3.91 7.8 7.6 7.7 7.7 2010 ............................................................... 3.97 4.00 4.02 3.98 7.7 7.8 7.7 7.9
2011 ............................................................... 4.00 4.03 4.06 4.09 7.9 7.9 7.9 8.1 2012 ............................................................... 4.15 4.14 4.16 4.27 8.1 8.1 8.1 8.3 2013 ............................................................... 4.31 4.29 4.32 4.23 8.3 8.2 8.2 8.2 2014 ............................................................... 4.25 4.27 4.28 4.13 8.1 8.1 8.1 7.9 2015 ............................................................... 4.16 4.19 4.19 4.00 7.9 7.8 7.9 7.4 2016 ............................................................... 4.04 4.03 4.21 4.33 7.4 7.5 7.7 8.0 2017 ............................................................... 4.33 – – – 7.8 – – –
Supplemental pay 2006 ............................................................... – – – 1.46 – – – 3.0 2007 ............................................................... 1.49 1.52 1.52 1.52 3.0 3.0 3.0 3.0 2008 ............................................................... 1.47 1.47 1.34 1.60 2.9 2.8 2.6 3.1 2009 ............................................................... 1.51 2.36 2.37 2.15 2.9 4.5 4.5 4.2 2010 ............................................................... 2.05 2.08 2.07 1.09 4.0 4.0 4.0 2.2
2011 ............................................................... 1.20 1.21 1.20 1.43 2.4 2.4 2.4 2.8 2012 ............................................................... 1.51 1.48 1.47 1.42 3.0 2.9 2.9 2.8 2013 ............................................................... 1.36 1.34 1.36 1.63 2.6 2.6 2.6 3.2 2014 ............................................................... 1.74 1.44 1.43 1.67 3.3 2.8 2.7 3.2 2015 ............................................................... 1.75 1.73 1.73 1.72 3.3 3.2 3.3 3.2
See footnotes at end of table.
-235-
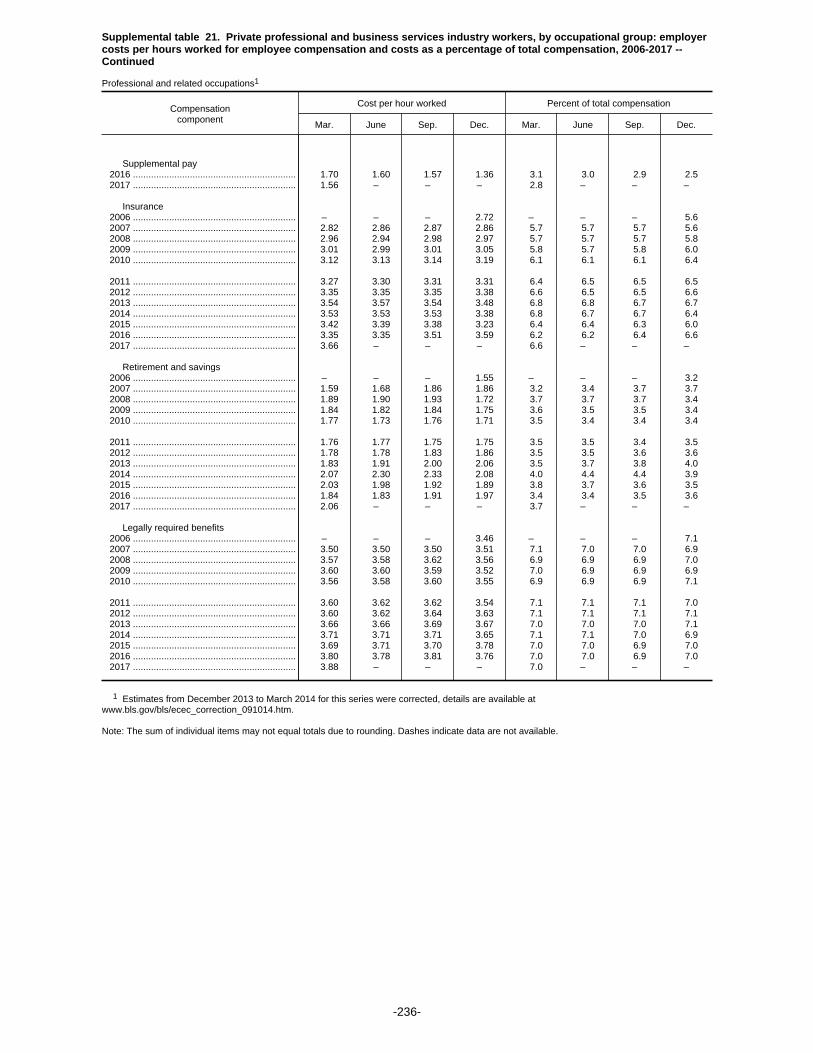
Supplemental table 21. Private professional and business services industry workers, by occupational group: employercosts per hours worked for employee compensation and costs as a percentage of total compensation, 2006-2017 --Continued
Professional and related occupations1
Compensationcomponent
Cost per hour worked Percent of total compensation
Mar. June Sep. Dec. Mar. June Sep. Dec.
Supplemental pay 2016 ............................................................... 1.70 1.60 1.57 1.36 3.1 3.0 2.9 2.5 2017 ............................................................... 1.56 – – – 2.8 – – –
Insurance 2006 ............................................................... – – – 2.72 – – – 5.6 2007 ............................................................... 2.82 2.86 2.87 2.86 5.7 5.7 5.7 5.6 2008 ............................................................... 2.96 2.94 2.98 2.97 5.7 5.7 5.7 5.8 2009 ............................................................... 3.01 2.99 3.01 3.05 5.8 5.7 5.8 6.0 2010 ............................................................... 3.12 3.13 3.14 3.19 6.1 6.1 6.1 6.4
2011 ............................................................... 3.27 3.30 3.31 3.31 6.4 6.5 6.5 6.5 2012 ............................................................... 3.35 3.35 3.35 3.38 6.6 6.5 6.5 6.6 2013 ............................................................... 3.54 3.57 3.54 3.48 6.8 6.8 6.7 6.7 2014 ............................................................... 3.53 3.53 3.53 3.38 6.8 6.7 6.7 6.4 2015 ............................................................... 3.42 3.39 3.38 3.23 6.4 6.4 6.3 6.0 2016 ............................................................... 3.35 3.35 3.51 3.59 6.2 6.2 6.4 6.6 2017 ............................................................... 3.66 – – – 6.6 – – –
Retirement and savings 2006 ............................................................... – – – 1.55 – – – 3.2 2007 ............................................................... 1.59 1.68 1.86 1.86 3.2 3.4 3.7 3.7 2008 ............................................................... 1.89 1.90 1.93 1.72 3.7 3.7 3.7 3.4 2009 ............................................................... 1.84 1.82 1.84 1.75 3.6 3.5 3.5 3.4 2010 ............................................................... 1.77 1.73 1.76 1.71 3.5 3.4 3.4 3.4
2011 ............................................................... 1.76 1.77 1.75 1.75 3.5 3.5 3.4 3.5 2012 ............................................................... 1.78 1.78 1.83 1.86 3.5 3.5 3.6 3.6 2013 ............................................................... 1.83 1.91 2.00 2.06 3.5 3.7 3.8 4.0 2014 ............................................................... 2.07 2.30 2.33 2.08 4.0 4.4 4.4 3.9 2015 ............................................................... 2.03 1.98 1.92 1.89 3.8 3.7 3.6 3.5 2016 ............................................................... 1.84 1.83 1.91 1.97 3.4 3.4 3.5 3.6 2017 ............................................................... 2.06 – – – 3.7 – – –
Legally required benefits 2006 ............................................................... – – – 3.46 – – – 7.1 2007 ............................................................... 3.50 3.50 3.50 3.51 7.1 7.0 7.0 6.9 2008 ............................................................... 3.57 3.58 3.62 3.56 6.9 6.9 6.9 7.0 2009 ............................................................... 3.60 3.60 3.59 3.52 7.0 6.9 6.9 6.9 2010 ............................................................... 3.56 3.58 3.60 3.55 6.9 6.9 6.9 7.1
2011 ............................................................... 3.60 3.62 3.62 3.54 7.1 7.1 7.1 7.0 2012 ............................................................... 3.60 3.62 3.64 3.63 7.1 7.1 7.1 7.1 2013 ............................................................... 3.66 3.66 3.69 3.67 7.0 7.0 7.0 7.1 2014 ............................................................... 3.71 3.71 3.71 3.65 7.1 7.1 7.0 6.9 2015 ............................................................... 3.69 3.71 3.70 3.78 7.0 7.0 6.9 7.0 2016 ............................................................... 3.80 3.78 3.81 3.76 7.0 7.0 6.9 7.0 2017 ............................................................... 3.88 – – – 7.0 – – –
1 Estimates from December 2013 to March 2014 for this series were corrected, details are available atwww.bls.gov/bls/ecec_correction_091014.htm.
Note: The sum of individual items may not equal totals due to rounding. Dashes indicate data are not available.
-236-
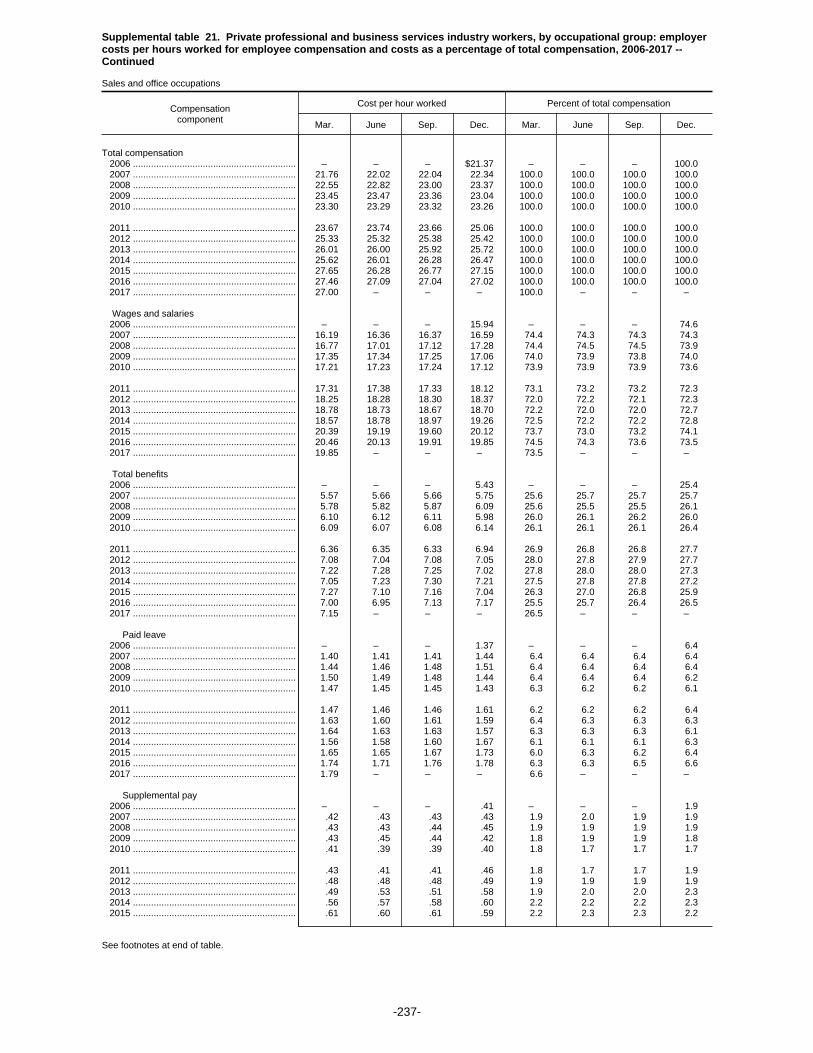
Supplemental table 21. Private professional and business services industry workers, by occupational group: employercosts per hours worked for employee compensation and costs as a percentage of total compensation, 2006-2017 --Continued
Sales and office occupations
Compensationcomponent
Cost per hour worked Percent of total compensation
Mar. June Sep. Dec. Mar. June Sep. Dec.
Total compensation 2006 ............................................................... – – – $21.37 – – – 100.0 2007 ............................................................... 21.76 22.02 22.04 22.34 100.0 100.0 100.0 100.0 2008 ............................................................... 22.55 22.82 23.00 23.37 100.0 100.0 100.0 100.0 2009 ............................................................... 23.45 23.47 23.36 23.04 100.0 100.0 100.0 100.0 2010 ............................................................... 23.30 23.29 23.32 23.26 100.0 100.0 100.0 100.0
2011 ............................................................... 23.67 23.74 23.66 25.06 100.0 100.0 100.0 100.0 2012 ............................................................... 25.33 25.32 25.38 25.42 100.0 100.0 100.0 100.0 2013 ............................................................... 26.01 26.00 25.92 25.72 100.0 100.0 100.0 100.0 2014 ............................................................... 25.62 26.01 26.28 26.47 100.0 100.0 100.0 100.0 2015 ............................................................... 27.65 26.28 26.77 27.15 100.0 100.0 100.0 100.0 2016 ............................................................... 27.46 27.09 27.04 27.02 100.0 100.0 100.0 100.0 2017 ............................................................... 27.00 – – – 100.0 – – –
Wages and salaries 2006 ............................................................... – – – 15.94 – – – 74.6 2007 ............................................................... 16.19 16.36 16.37 16.59 74.4 74.3 74.3 74.3 2008 ............................................................... 16.77 17.01 17.12 17.28 74.4 74.5 74.5 73.9 2009 ............................................................... 17.35 17.34 17.25 17.06 74.0 73.9 73.8 74.0 2010 ............................................................... 17.21 17.23 17.24 17.12 73.9 73.9 73.9 73.6
2011 ............................................................... 17.31 17.38 17.33 18.12 73.1 73.2 73.2 72.3 2012 ............................................................... 18.25 18.28 18.30 18.37 72.0 72.2 72.1 72.3 2013 ............................................................... 18.78 18.73 18.67 18.70 72.2 72.0 72.0 72.7 2014 ............................................................... 18.57 18.78 18.97 19.26 72.5 72.2 72.2 72.8 2015 ............................................................... 20.39 19.19 19.60 20.12 73.7 73.0 73.2 74.1 2016 ............................................................... 20.46 20.13 19.91 19.85 74.5 74.3 73.6 73.5 2017 ............................................................... 19.85 – – – 73.5 – – –
Total benefits 2006 ............................................................... – – – 5.43 – – – 25.4 2007 ............................................................... 5.57 5.66 5.66 5.75 25.6 25.7 25.7 25.7 2008 ............................................................... 5.78 5.82 5.87 6.09 25.6 25.5 25.5 26.1 2009 ............................................................... 6.10 6.12 6.11 5.98 26.0 26.1 26.2 26.0 2010 ............................................................... 6.09 6.07 6.08 6.14 26.1 26.1 26.1 26.4
2011 ............................................................... 6.36 6.35 6.33 6.94 26.9 26.8 26.8 27.7 2012 ............................................................... 7.08 7.04 7.08 7.05 28.0 27.8 27.9 27.7 2013 ............................................................... 7.22 7.28 7.25 7.02 27.8 28.0 28.0 27.3 2014 ............................................................... 7.05 7.23 7.30 7.21 27.5 27.8 27.8 27.2 2015 ............................................................... 7.27 7.10 7.16 7.04 26.3 27.0 26.8 25.9 2016 ............................................................... 7.00 6.95 7.13 7.17 25.5 25.7 26.4 26.5 2017 ............................................................... 7.15 – – – 26.5 – – –
Paid leave 2006 ............................................................... – – – 1.37 – – – 6.4 2007 ............................................................... 1.40 1.41 1.41 1.44 6.4 6.4 6.4 6.4 2008 ............................................................... 1.44 1.46 1.48 1.51 6.4 6.4 6.4 6.4 2009 ............................................................... 1.50 1.49 1.48 1.44 6.4 6.4 6.4 6.2 2010 ............................................................... 1.47 1.45 1.45 1.43 6.3 6.2 6.2 6.1
2011 ............................................................... 1.47 1.46 1.46 1.61 6.2 6.2 6.2 6.4 2012 ............................................................... 1.63 1.60 1.61 1.59 6.4 6.3 6.3 6.3 2013 ............................................................... 1.64 1.63 1.63 1.57 6.3 6.3 6.3 6.1 2014 ............................................................... 1.56 1.58 1.60 1.67 6.1 6.1 6.1 6.3 2015 ............................................................... 1.65 1.65 1.67 1.73 6.0 6.3 6.2 6.4 2016 ............................................................... 1.74 1.71 1.76 1.78 6.3 6.3 6.5 6.6 2017 ............................................................... 1.79 – – – 6.6 – – –
Supplemental pay 2006 ............................................................... – – – .41 – – – 1.9 2007 ............................................................... .42 .43 .43 .43 1.9 2.0 1.9 1.9 2008 ............................................................... .43 .43 .44 .45 1.9 1.9 1.9 1.9 2009 ............................................................... .43 .45 .44 .42 1.8 1.9 1.9 1.8 2010 ............................................................... .41 .39 .39 .40 1.8 1.7 1.7 1.7
2011 ............................................................... .43 .41 .41 .46 1.8 1.7 1.7 1.9 2012 ............................................................... .48 .48 .48 .49 1.9 1.9 1.9 1.9 2013 ............................................................... .49 .53 .51 .58 1.9 2.0 2.0 2.3 2014 ............................................................... .56 .57 .58 .60 2.2 2.2 2.2 2.3 2015 ............................................................... .61 .60 .61 .59 2.2 2.3 2.3 2.2
See footnotes at end of table.
-237-
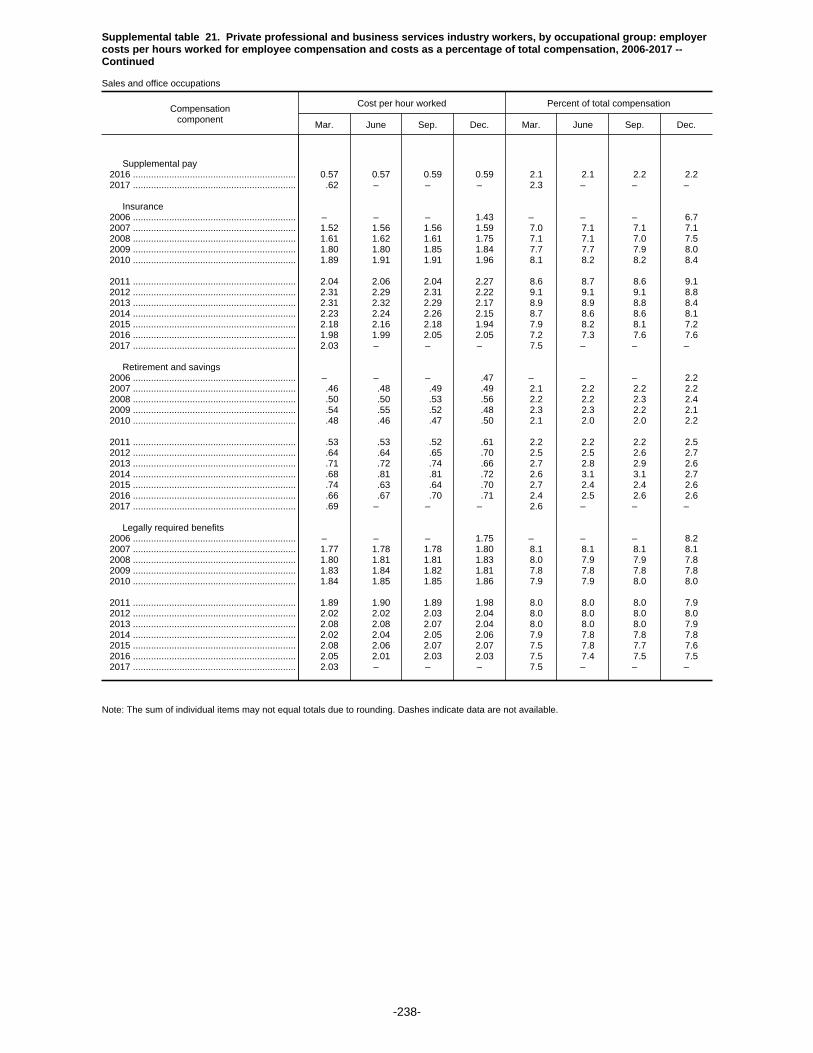
Supplemental table 21. Private professional and business services industry workers, by occupational group: employercosts per hours worked for employee compensation and costs as a percentage of total compensation, 2006-2017 --Continued
Sales and office occupations
Compensationcomponent
Cost per hour worked Percent of total compensation
Mar. June Sep. Dec. Mar. June Sep. Dec.
Supplemental pay 2016 ............................................................... 0.57 0.57 0.59 0.59 2.1 2.1 2.2 2.2 2017 ............................................................... .62 – – – 2.3 – – –
Insurance 2006 ............................................................... – – – 1.43 – – – 6.7 2007 ............................................................... 1.52 1.56 1.56 1.59 7.0 7.1 7.1 7.1 2008 ............................................................... 1.61 1.62 1.61 1.75 7.1 7.1 7.0 7.5 2009 ............................................................... 1.80 1.80 1.85 1.84 7.7 7.7 7.9 8.0 2010 ............................................................... 1.89 1.91 1.91 1.96 8.1 8.2 8.2 8.4
2011 ............................................................... 2.04 2.06 2.04 2.27 8.6 8.7 8.6 9.1 2012 ............................................................... 2.31 2.29 2.31 2.22 9.1 9.1 9.1 8.8 2013 ............................................................... 2.31 2.32 2.29 2.17 8.9 8.9 8.8 8.4 2014 ............................................................... 2.23 2.24 2.26 2.15 8.7 8.6 8.6 8.1 2015 ............................................................... 2.18 2.16 2.18 1.94 7.9 8.2 8.1 7.2 2016 ............................................................... 1.98 1.99 2.05 2.05 7.2 7.3 7.6 7.6 2017 ............................................................... 2.03 – – – 7.5 – – –
Retirement and savings 2006 ............................................................... – – – .47 – – – 2.2 2007 ............................................................... .46 .48 .49 .49 2.1 2.2 2.2 2.2 2008 ............................................................... .50 .50 .53 .56 2.2 2.2 2.3 2.4 2009 ............................................................... .54 .55 .52 .48 2.3 2.3 2.2 2.1 2010 ............................................................... .48 .46 .47 .50 2.1 2.0 2.0 2.2
2011 ............................................................... .53 .53 .52 .61 2.2 2.2 2.2 2.5 2012 ............................................................... .64 .64 .65 .70 2.5 2.5 2.6 2.7 2013 ............................................................... .71 .72 .74 .66 2.7 2.8 2.9 2.6 2014 ............................................................... .68 .81 .81 .72 2.6 3.1 3.1 2.7 2015 ............................................................... .74 .63 .64 .70 2.7 2.4 2.4 2.6 2016 ............................................................... .66 .67 .70 .71 2.4 2.5 2.6 2.6 2017 ............................................................... .69 – – – 2.6 – – –
Legally required benefits 2006 ............................................................... – – – 1.75 – – – 8.2 2007 ............................................................... 1.77 1.78 1.78 1.80 8.1 8.1 8.1 8.1 2008 ............................................................... 1.80 1.81 1.81 1.83 8.0 7.9 7.9 7.8 2009 ............................................................... 1.83 1.84 1.82 1.81 7.8 7.8 7.8 7.8 2010 ............................................................... 1.84 1.85 1.85 1.86 7.9 7.9 8.0 8.0
2011 ............................................................... 1.89 1.90 1.89 1.98 8.0 8.0 8.0 7.9 2012 ............................................................... 2.02 2.02 2.03 2.04 8.0 8.0 8.0 8.0 2013 ............................................................... 2.08 2.08 2.07 2.04 8.0 8.0 8.0 7.9 2014 ............................................................... 2.02 2.04 2.05 2.06 7.9 7.8 7.8 7.8 2015 ............................................................... 2.08 2.06 2.07 2.07 7.5 7.8 7.7 7.6 2016 ............................................................... 2.05 2.01 2.03 2.03 7.5 7.4 7.5 7.5 2017 ............................................................... 2.03 – – – 7.5 – – –
Note: The sum of individual items may not equal totals due to rounding. Dashes indicate data are not available.
-238-
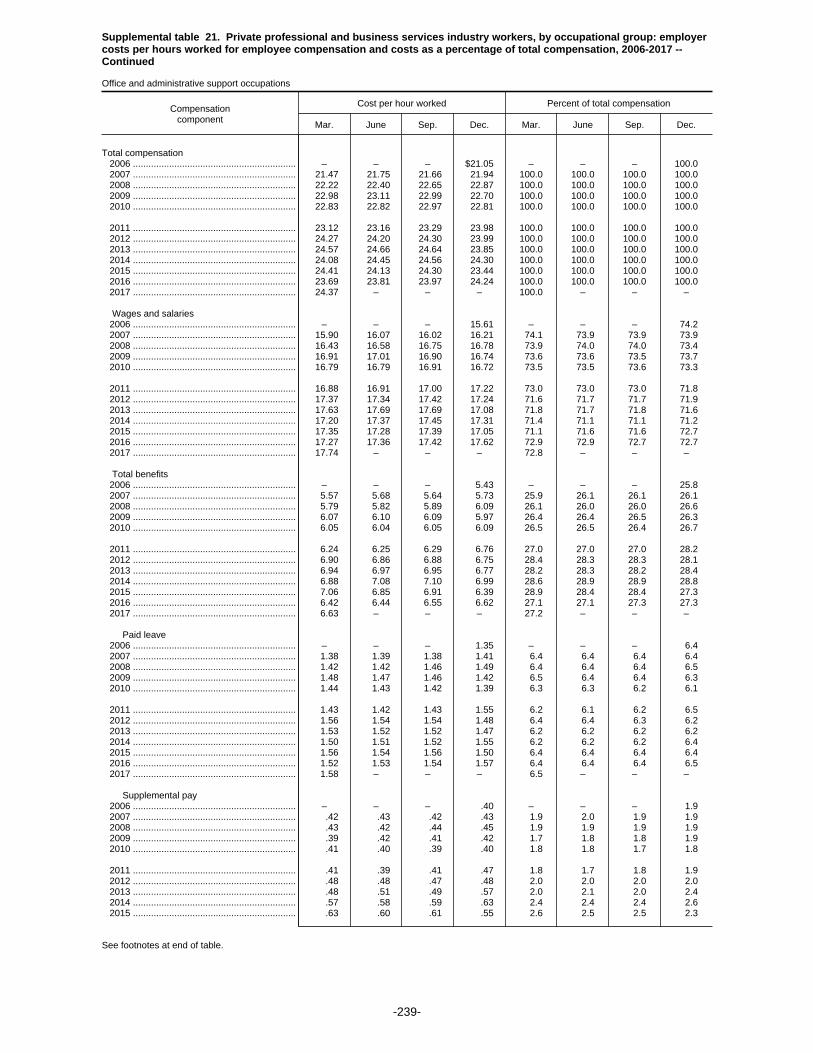
Supplemental table 21. Private professional and business services industry workers, by occupational group: employercosts per hours worked for employee compensation and costs as a percentage of total compensation, 2006-2017 --Continued
Office and administrative support occupations
Compensationcomponent
Cost per hour worked Percent of total compensation
Mar. June Sep. Dec. Mar. June Sep. Dec.
Total compensation 2006 ............................................................... – – – $21.05 – – – 100.0 2007 ............................................................... 21.47 21.75 21.66 21.94 100.0 100.0 100.0 100.0 2008 ............................................................... 22.22 22.40 22.65 22.87 100.0 100.0 100.0 100.0 2009 ............................................................... 22.98 23.11 22.99 22.70 100.0 100.0 100.0 100.0 2010 ............................................................... 22.83 22.82 22.97 22.81 100.0 100.0 100.0 100.0
2011 ............................................................... 23.12 23.16 23.29 23.98 100.0 100.0 100.0 100.0 2012 ............................................................... 24.27 24.20 24.30 23.99 100.0 100.0 100.0 100.0 2013 ............................................................... 24.57 24.66 24.64 23.85 100.0 100.0 100.0 100.0 2014 ............................................................... 24.08 24.45 24.56 24.30 100.0 100.0 100.0 100.0 2015 ............................................................... 24.41 24.13 24.30 23.44 100.0 100.0 100.0 100.0 2016 ............................................................... 23.69 23.81 23.97 24.24 100.0 100.0 100.0 100.0 2017 ............................................................... 24.37 – – – 100.0 – – –
Wages and salaries 2006 ............................................................... – – – 15.61 – – – 74.2 2007 ............................................................... 15.90 16.07 16.02 16.21 74.1 73.9 73.9 73.9 2008 ............................................................... 16.43 16.58 16.75 16.78 73.9 74.0 74.0 73.4 2009 ............................................................... 16.91 17.01 16.90 16.74 73.6 73.6 73.5 73.7 2010 ............................................................... 16.79 16.79 16.91 16.72 73.5 73.5 73.6 73.3
2011 ............................................................... 16.88 16.91 17.00 17.22 73.0 73.0 73.0 71.8 2012 ............................................................... 17.37 17.34 17.42 17.24 71.6 71.7 71.7 71.9 2013 ............................................................... 17.63 17.69 17.69 17.08 71.8 71.7 71.8 71.6 2014 ............................................................... 17.20 17.37 17.45 17.31 71.4 71.1 71.1 71.2 2015 ............................................................... 17.35 17.28 17.39 17.05 71.1 71.6 71.6 72.7 2016 ............................................................... 17.27 17.36 17.42 17.62 72.9 72.9 72.7 72.7 2017 ............................................................... 17.74 – – – 72.8 – – –
Total benefits 2006 ............................................................... – – – 5.43 – – – 25.8 2007 ............................................................... 5.57 5.68 5.64 5.73 25.9 26.1 26.1 26.1 2008 ............................................................... 5.79 5.82 5.89 6.09 26.1 26.0 26.0 26.6 2009 ............................................................... 6.07 6.10 6.09 5.97 26.4 26.4 26.5 26.3 2010 ............................................................... 6.05 6.04 6.05 6.09 26.5 26.5 26.4 26.7
2011 ............................................................... 6.24 6.25 6.29 6.76 27.0 27.0 27.0 28.2 2012 ............................................................... 6.90 6.86 6.88 6.75 28.4 28.3 28.3 28.1 2013 ............................................................... 6.94 6.97 6.95 6.77 28.2 28.3 28.2 28.4 2014 ............................................................... 6.88 7.08 7.10 6.99 28.6 28.9 28.9 28.8 2015 ............................................................... 7.06 6.85 6.91 6.39 28.9 28.4 28.4 27.3 2016 ............................................................... 6.42 6.44 6.55 6.62 27.1 27.1 27.3 27.3 2017 ............................................................... 6.63 – – – 27.2 – – –
Paid leave 2006 ............................................................... – – – 1.35 – – – 6.4 2007 ............................................................... 1.38 1.39 1.38 1.41 6.4 6.4 6.4 6.4 2008 ............................................................... 1.42 1.42 1.46 1.49 6.4 6.4 6.4 6.5 2009 ............................................................... 1.48 1.47 1.46 1.42 6.5 6.4 6.4 6.3 2010 ............................................................... 1.44 1.43 1.42 1.39 6.3 6.3 6.2 6.1
2011 ............................................................... 1.43 1.42 1.43 1.55 6.2 6.1 6.2 6.5 2012 ............................................................... 1.56 1.54 1.54 1.48 6.4 6.4 6.3 6.2 2013 ............................................................... 1.53 1.52 1.52 1.47 6.2 6.2 6.2 6.2 2014 ............................................................... 1.50 1.51 1.52 1.55 6.2 6.2 6.2 6.4 2015 ............................................................... 1.56 1.54 1.56 1.50 6.4 6.4 6.4 6.4 2016 ............................................................... 1.52 1.53 1.54 1.57 6.4 6.4 6.4 6.5 2017 ............................................................... 1.58 – – – 6.5 – – –
Supplemental pay 2006 ............................................................... – – – .40 – – – 1.9 2007 ............................................................... .42 .43 .42 .43 1.9 2.0 1.9 1.9 2008 ............................................................... .43 .42 .44 .45 1.9 1.9 1.9 1.9 2009 ............................................................... .39 .42 .41 .42 1.7 1.8 1.8 1.9 2010 ............................................................... .41 .40 .39 .40 1.8 1.8 1.7 1.8
2011 ............................................................... .41 .39 .41 .47 1.8 1.7 1.8 1.9 2012 ............................................................... .48 .48 .47 .48 2.0 2.0 2.0 2.0 2013 ............................................................... .48 .51 .49 .57 2.0 2.1 2.0 2.4 2014 ............................................................... .57 .58 .59 .63 2.4 2.4 2.4 2.6 2015 ............................................................... .63 .60 .61 .55 2.6 2.5 2.5 2.3
See footnotes at end of table.
-239-
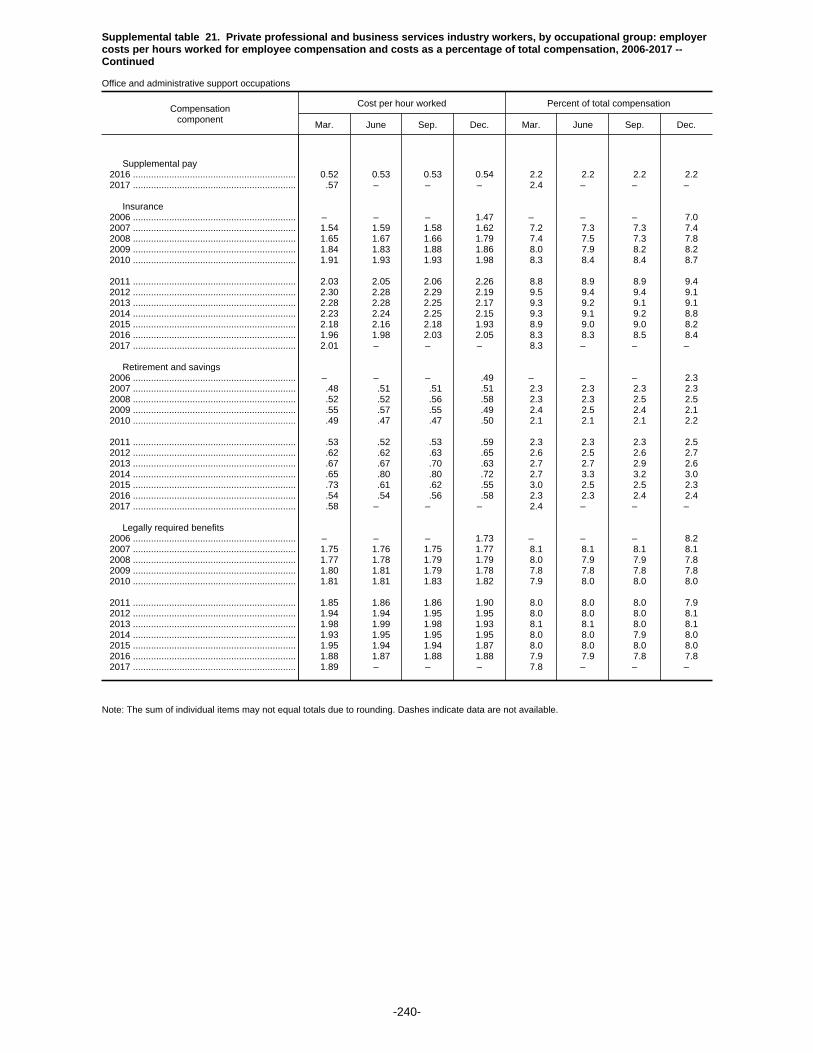
Supplemental table 21. Private professional and business services industry workers, by occupational group: employercosts per hours worked for employee compensation and costs as a percentage of total compensation, 2006-2017 --Continued
Office and administrative support occupations
Compensationcomponent
Cost per hour worked Percent of total compensation
Mar. June Sep. Dec. Mar. June Sep. Dec.
Supplemental pay 2016 ............................................................... 0.52 0.53 0.53 0.54 2.2 2.2 2.2 2.2 2017 ............................................................... .57 – – – 2.4 – – –
Insurance 2006 ............................................................... – – – 1.47 – – – 7.0 2007 ............................................................... 1.54 1.59 1.58 1.62 7.2 7.3 7.3 7.4 2008 ............................................................... 1.65 1.67 1.66 1.79 7.4 7.5 7.3 7.8 2009 ............................................................... 1.84 1.83 1.88 1.86 8.0 7.9 8.2 8.2 2010 ............................................................... 1.91 1.93 1.93 1.98 8.3 8.4 8.4 8.7
2011 ............................................................... 2.03 2.05 2.06 2.26 8.8 8.9 8.9 9.4 2012 ............................................................... 2.30 2.28 2.29 2.19 9.5 9.4 9.4 9.1 2013 ............................................................... 2.28 2.28 2.25 2.17 9.3 9.2 9.1 9.1 2014 ............................................................... 2.23 2.24 2.25 2.15 9.3 9.1 9.2 8.8 2015 ............................................................... 2.18 2.16 2.18 1.93 8.9 9.0 9.0 8.2 2016 ............................................................... 1.96 1.98 2.03 2.05 8.3 8.3 8.5 8.4 2017 ............................................................... 2.01 – – – 8.3 – – –
Retirement and savings 2006 ............................................................... – – – .49 – – – 2.3 2007 ............................................................... .48 .51 .51 .51 2.3 2.3 2.3 2.3 2008 ............................................................... .52 .52 .56 .58 2.3 2.3 2.5 2.5 2009 ............................................................... .55 .57 .55 .49 2.4 2.5 2.4 2.1 2010 ............................................................... .49 .47 .47 .50 2.1 2.1 2.1 2.2
2011 ............................................................... .53 .52 .53 .59 2.3 2.3 2.3 2.5 2012 ............................................................... .62 .62 .63 .65 2.6 2.5 2.6 2.7 2013 ............................................................... .67 .67 .70 .63 2.7 2.7 2.9 2.6 2014 ............................................................... .65 .80 .80 .72 2.7 3.3 3.2 3.0 2015 ............................................................... .73 .61 .62 .55 3.0 2.5 2.5 2.3 2016 ............................................................... .54 .54 .56 .58 2.3 2.3 2.4 2.4 2017 ............................................................... .58 – – – 2.4 – – –
Legally required benefits 2006 ............................................................... – – – 1.73 – – – 8.2 2007 ............................................................... 1.75 1.76 1.75 1.77 8.1 8.1 8.1 8.1 2008 ............................................................... 1.77 1.78 1.79 1.79 8.0 7.9 7.9 7.8 2009 ............................................................... 1.80 1.81 1.79 1.78 7.8 7.8 7.8 7.8 2010 ............................................................... 1.81 1.81 1.83 1.82 7.9 8.0 8.0 8.0
2011 ............................................................... 1.85 1.86 1.86 1.90 8.0 8.0 8.0 7.9 2012 ............................................................... 1.94 1.94 1.95 1.95 8.0 8.0 8.0 8.1 2013 ............................................................... 1.98 1.99 1.98 1.93 8.1 8.1 8.0 8.1 2014 ............................................................... 1.93 1.95 1.95 1.95 8.0 8.0 7.9 8.0 2015 ............................................................... 1.95 1.94 1.94 1.87 8.0 8.0 8.0 8.0 2016 ............................................................... 1.88 1.87 1.88 1.88 7.9 7.9 7.8 7.8 2017 ............................................................... 1.89 – – – 7.8 – – –
Note: The sum of individual items may not equal totals due to rounding. Dashes indicate data are not available.
-240-

Supplemental table 21. Private professional and business services industry workers, by occupational group: employercosts per hours worked for employee compensation and costs as a percentage of total compensation, 2006-2017 --Continued
Service occupations
Compensationcomponent
Cost per hour worked Percent of total compensation
Mar. June Sep. Dec. Mar. June Sep. Dec.
Total compensation 2006 ............................................................... – – – $13.20 – – – 100.0 2007 ............................................................... 13.34 13.44 13.53 13.66 100.0 100.0 100.0 100.0 2008 ............................................................... 13.88 13.91 14.11 14.76 100.0 100.0 100.0 100.0 2009 ............................................................... 15.18 15.18 15.15 15.57 100.0 100.0 100.0 100.0 2010 ............................................................... 15.73 15.73 15.82 16.02 100.0 100.0 100.0 100.0
2011 ............................................................... 16.14 16.18 16.21 15.97 100.0 100.0 100.0 100.0 2012 ............................................................... 15.95 15.99 16.02 15.86 100.0 100.0 100.0 100.0 2013 ............................................................... 15.69 15.81 15.82 15.84 100.0 100.0 100.0 100.0 2014 ............................................................... 15.85 15.98 15.98 15.92 100.0 100.0 100.0 100.0 2015 ............................................................... 16.02 15.89 15.93 15.49 100.0 100.0 100.0 100.0 2016 ............................................................... 15.57 15.91 16.01 16.35 100.0 100.0 100.0 100.0 2017 ............................................................... 16.38 – – – 100.0 – – –
Wages and salaries 2006 ............................................................... – – – 10.25 – – – 77.6 2007 ............................................................... 10.41 10.49 10.56 10.65 78.1 78.1 78.0 77.9 2008 ............................................................... 10.78 10.83 10.98 11.33 77.7 77.9 77.8 76.8 2009 ............................................................... 11.73 11.76 11.75 12.01 77.3 77.5 77.6 77.1 2010 ............................................................... 12.14 12.14 12.26 12.39 77.2 77.2 77.5 77.4
2011 ............................................................... 12.45 12.47 12.50 12.13 77.1 77.1 77.1 75.9 2012 ............................................................... 12.10 12.11 12.14 12.19 75.8 75.7 75.8 76.8 2013 ............................................................... 12.05 12.14 12.12 12.04 76.8 76.8 76.6 76.0 2014 ............................................................... 12.03 12.18 12.20 12.21 75.9 76.2 76.3 76.7 2015 ............................................................... 12.24 12.12 12.14 12.06 76.4 76.3 76.2 77.8 2016 ............................................................... 12.13 12.40 12.46 12.76 77.9 77.9 77.8 78.0 2017 ............................................................... 12.77 – – – 78.0 – – –
Total benefits 2006 ............................................................... – – – 2.95 – – – 22.4 2007 ............................................................... 2.93 2.94 2.98 3.01 21.9 21.9 22.0 22.1 2008 ............................................................... 3.10 3.08 3.14 3.43 22.3 22.1 22.2 23.2 2009 ............................................................... 3.45 3.42 3.40 3.56 22.7 22.5 22.4 22.9 2010 ............................................................... 3.59 3.58 3.57 3.63 22.8 22.8 22.5 22.6
2011 ............................................................... 3.69 3.71 3.72 3.85 22.9 22.9 22.9 24.1 2012 ............................................................... 3.85 3.88 3.88 3.68 24.2 24.3 24.2 23.2 2013 ............................................................... 3.64 3.67 3.70 3.79 23.2 23.2 23.4 24.0 2014 ............................................................... 3.81 3.80 3.79 3.71 24.1 23.8 23.7 23.3 2015 ............................................................... 3.78 3.77 3.80 3.43 23.6 23.7 23.8 22.2 2016 ............................................................... 3.44 3.52 3.55 3.59 22.1 22.1 22.2 22.0 2017 ............................................................... 3.61 – – – 22.0 – – –
Paid leave 2006 ............................................................... – – – .43 – – – 3.2 2007 ............................................................... .43 .43 .43 .44 3.2 3.2 3.2 3.2 2008 ............................................................... .45 .44 .45 .54 3.3 3.2 3.2 3.6 2009 ............................................................... .53 .55 .54 .56 3.5 3.6 3.6 3.6 2010 ............................................................... .55 .55 .56 .58 3.5 3.5 3.5 3.6
2011 ............................................................... .59 .58 .59 .65 3.6 3.6 3.6 4.1 2012 ............................................................... .64 .64 .64 .62 4.0 4.0 4.0 3.9 2013 ............................................................... .61 .61 .60 .63 3.9 3.9 3.8 4.0 2014 ............................................................... .63 .63 .62 .61 4.0 4.0 3.9 3.8 2015 ............................................................... .62 .63 .63 .53 3.9 3.9 4.0 3.4 2016 ............................................................... .53 .54 .53 .54 3.4 3.4 3.3 3.3 2017 ............................................................... .55 – – – 3.4 – – –
Supplemental pay 2006 ............................................................... – – – .30 – – – 2.2 2007 ............................................................... .29 .29 .30 .29 2.2 2.2 2.2 2.1 2008 ............................................................... .30 .31 .31 .38 2.1 2.2 2.2 2.6 2009 ............................................................... .37 .36 .36 .43 2.4 2.4 2.4 2.8 2010 ............................................................... .42 .40 .42 .41 2.7 2.6 2.6 2.5
2011 ............................................................... .43 .42 .41 .44 2.6 2.6 2.5 2.7 2012 ............................................................... .44 .44 .45 .37 2.7 2.8 2.8 2.3 2013 ............................................................... .35 .36 .38 .30 2.2 2.3 2.4 1.9 2014 ............................................................... .31 .31 .31 .27 1.9 1.9 1.9 1.7 2015 ............................................................... .29 .28 .28 .26 1.8 1.8 1.8 1.7
See footnotes at end of table.
-241-
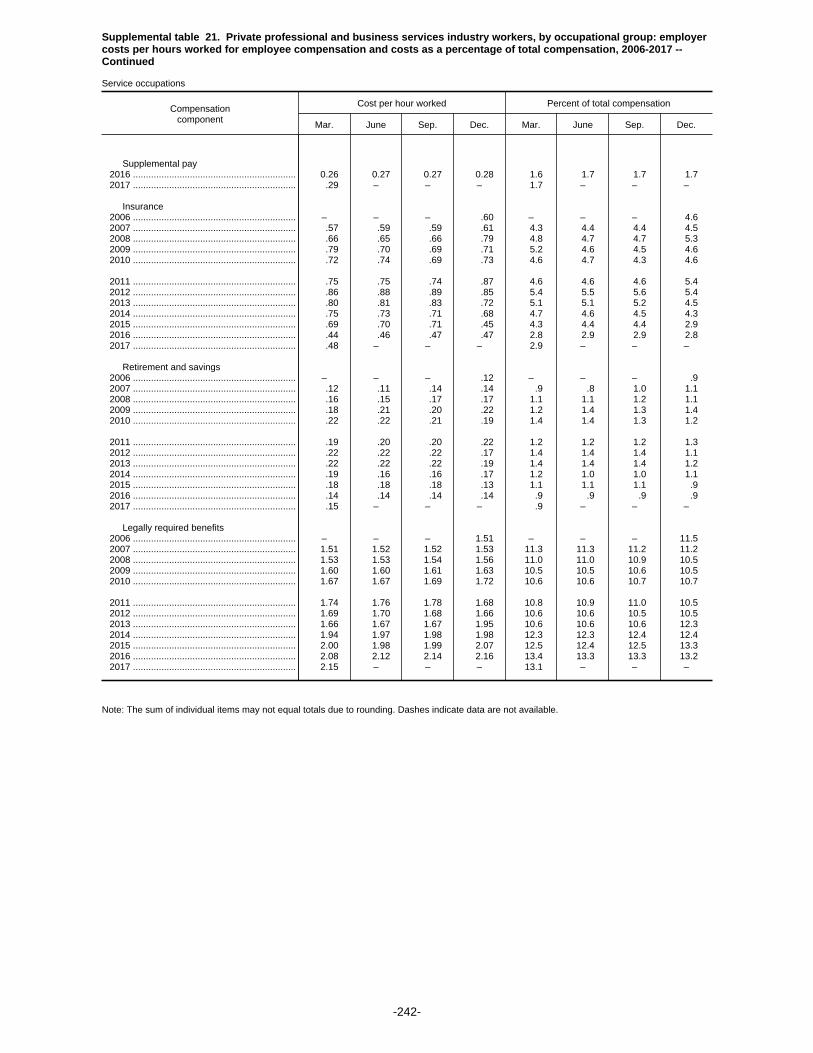
Supplemental table 21. Private professional and business services industry workers, by occupational group: employercosts per hours worked for employee compensation and costs as a percentage of total compensation, 2006-2017 --Continued
Service occupations
Compensationcomponent
Cost per hour worked Percent of total compensation
Mar. June Sep. Dec. Mar. June Sep. Dec.
Supplemental pay 2016 ............................................................... 0.26 0.27 0.27 0.28 1.6 1.7 1.7 1.7 2017 ............................................................... .29 – – – 1.7 – – –
Insurance 2006 ............................................................... – – – .60 – – – 4.6 2007 ............................................................... .57 .59 .59 .61 4.3 4.4 4.4 4.5 2008 ............................................................... .66 .65 .66 .79 4.8 4.7 4.7 5.3 2009 ............................................................... .79 .70 .69 .71 5.2 4.6 4.5 4.6 2010 ............................................................... .72 .74 .69 .73 4.6 4.7 4.3 4.6
2011 ............................................................... .75 .75 .74 .87 4.6 4.6 4.6 5.4 2012 ............................................................... .86 .88 .89 .85 5.4 5.5 5.6 5.4 2013 ............................................................... .80 .81 .83 .72 5.1 5.1 5.2 4.5 2014 ............................................................... .75 .73 .71 .68 4.7 4.6 4.5 4.3 2015 ............................................................... .69 .70 .71 .45 4.3 4.4 4.4 2.9 2016 ............................................................... .44 .46 .47 .47 2.8 2.9 2.9 2.8 2017 ............................................................... .48 – – – 2.9 – – –
Retirement and savings 2006 ............................................................... – – – .12 – – – .9 2007 ............................................................... .12 .11 .14 .14 .9 .8 1.0 1.1 2008 ............................................................... .16 .15 .17 .17 1.1 1.1 1.2 1.1 2009 ............................................................... .18 .21 .20 .22 1.2 1.4 1.3 1.4 2010 ............................................................... .22 .22 .21 .19 1.4 1.4 1.3 1.2
2011 ............................................................... .19 .20 .20 .22 1.2 1.2 1.2 1.3 2012 ............................................................... .22 .22 .22 .17 1.4 1.4 1.4 1.1 2013 ............................................................... .22 .22 .22 .19 1.4 1.4 1.4 1.2 2014 ............................................................... .19 .16 .16 .17 1.2 1.0 1.0 1.1 2015 ............................................................... .18 .18 .18 .13 1.1 1.1 1.1 .9 2016 ............................................................... .14 .14 .14 .14 .9 .9 .9 .9 2017 ............................................................... .15 – – – .9 – – –
Legally required benefits 2006 ............................................................... – – – 1.51 – – – 11.5 2007 ............................................................... 1.51 1.52 1.52 1.53 11.3 11.3 11.2 11.2 2008 ............................................................... 1.53 1.53 1.54 1.56 11.0 11.0 10.9 10.5 2009 ............................................................... 1.60 1.60 1.61 1.63 10.5 10.5 10.6 10.5 2010 ............................................................... 1.67 1.67 1.69 1.72 10.6 10.6 10.7 10.7
2011 ............................................................... 1.74 1.76 1.78 1.68 10.8 10.9 11.0 10.5 2012 ............................................................... 1.69 1.70 1.68 1.66 10.6 10.6 10.5 10.5 2013 ............................................................... 1.66 1.67 1.67 1.95 10.6 10.6 10.6 12.3 2014 ............................................................... 1.94 1.97 1.98 1.98 12.3 12.3 12.4 12.4 2015 ............................................................... 2.00 1.98 1.99 2.07 12.5 12.4 12.5 13.3 2016 ............................................................... 2.08 2.12 2.14 2.16 13.4 13.3 13.3 13.2 2017 ............................................................... 2.15 – – – 13.1 – – –
Note: The sum of individual items may not equal totals due to rounding. Dashes indicate data are not available.
-242-

Supplemental table 21. Private professional and business services industry workers, by occupational group: employercosts per hours worked for employee compensation and costs as a percentage of total compensation, 2006-2017 --Continued
Production, transportation, and material moving occupations
Compensationcomponent
Cost per hour worked Percent of total compensation
Mar. June Sep. Dec. Mar. June Sep. Dec.
Total compensation 2006 ............................................................... – – – $15.05 – – – 100.0 2007 ............................................................... 15.26 14.99 15.53 15.55 100.0 100.0 100.0 100.0 2008 ............................................................... 16.42 16.21 16.38 15.57 100.0 100.0 100.0 100.0 2009 ............................................................... 16.15 16.21 16.24 16.18 100.0 100.0 100.0 100.0 2010 ............................................................... 16.27 16.24 16.44 16.07 100.0 100.0 100.0 100.0
2011 ............................................................... 16.12 16.24 16.35 17.30 100.0 100.0 100.0 100.0 2012 ............................................................... 17.60 17.86 17.38 17.63 100.0 100.0 100.0 100.0 2013 ............................................................... 17.69 17.90 17.85 17.85 100.0 100.0 100.0 100.0 2014 ............................................................... 18.05 17.92 18.11 18.37 100.0 100.0 100.0 100.0 2015 ............................................................... 18.65 18.55 18.64 17.48 100.0 100.0 100.0 100.0 2016 ............................................................... 17.69 17.31 17.86 17.91 100.0 100.0 100.0 100.0 2017 ............................................................... 18.23 – – – 100.0 – – –
Wages and salaries 2006 ............................................................... – – – 11.13 – – – 74.0 2007 ............................................................... 11.31 11.15 11.46 11.55 74.1 74.4 73.8 74.3 2008 ............................................................... 12.06 11.92 12.06 11.72 73.5 73.6 73.6 75.3 2009 ............................................................... 12.18 12.22 12.24 12.32 75.4 75.4 75.3 76.1 2010 ............................................................... 12.34 12.27 12.43 12.18 75.8 75.6 75.6 75.8
2011 ............................................................... 12.17 12.21 12.29 12.86 75.5 75.2 75.2 74.4 2012 ............................................................... 13.10 13.26 13.05 13.20 74.4 74.2 75.1 74.9 2013 ............................................................... 13.21 13.37 13.36 13.46 74.7 74.7 74.9 75.4 2014 ............................................................... 13.66 13.63 13.78 13.92 75.7 76.1 76.1 75.7 2015 ............................................................... 14.06 13.99 14.06 13.32 75.4 75.4 75.4 76.2 2016 ............................................................... 13.49 13.37 13.72 13.76 76.2 77.2 76.8 76.8 2017 ............................................................... 14.01 – – – 76.9 – – –
Total benefits 2006 ............................................................... – – – 3.92 – – – 26.0 2007 ............................................................... 3.95 3.84 4.07 4.00 25.9 25.6 26.2 25.7 2008 ............................................................... 4.36 4.28 4.32 3.85 26.5 26.4 26.4 24.7 2009 ............................................................... 3.97 3.99 4.01 3.86 24.6 24.6 24.7 23.9 2010 ............................................................... 3.93 3.97 4.01 3.89 24.2 24.4 24.4 24.2
2011 ............................................................... 3.95 4.03 4.06 4.43 24.5 24.8 24.8 25.6 2012 ............................................................... 4.51 4.61 4.33 4.43 25.6 25.8 24.9 25.1 2013 ............................................................... 4.48 4.53 4.49 4.40 25.3 25.3 25.1 24.6 2014 ............................................................... 4.39 4.28 4.34 4.46 24.3 23.9 23.9 24.3 2015 ............................................................... 4.59 4.56 4.58 4.15 24.6 24.6 24.6 23.8 2016 ............................................................... 4.21 3.94 4.15 4.15 23.8 22.8 23.2 23.2 2017 ............................................................... 4.21 – – – 23.1 – – –
Paid leave 2006 ............................................................... – – – .52 – – – 3.5 2007 ............................................................... .54 .52 .53 .53 3.5 3.5 3.4 3.4 2008 ............................................................... .57 .56 .56 .57 3.5 3.5 3.4 3.6 2009 ............................................................... .56 .56 .55 .55 3.5 3.4 3.4 3.4 2010 ............................................................... .55 .56 .56 .54 3.4 3.4 3.4 3.3
2011 ............................................................... .54 .55 .55 .70 3.4 3.4 3.4 4.0 2012 ............................................................... .71 .72 .71 .74 4.0 4.0 4.1 4.2 2013 ............................................................... .74 .74 .75 .73 4.2 4.1 4.2 4.1 2014 ............................................................... .74 .72 .72 .78 4.1 4.0 4.0 4.2 2015 ............................................................... .80 .77 .77 .66 4.3 4.2 4.1 3.8 2016 ............................................................... .68 .63 .64 .64 3.8 3.6 3.6 3.6 2017 ............................................................... .65 – – – 3.6 – – –
Supplemental pay 2006 ............................................................... – – – .50 – – – 3.3 2007 ............................................................... .51 .51 .51 .50 3.4 3.4 3.3 3.2 2008 ............................................................... .55 .54 .54 .47 3.4 3.3 3.3 3.0 2009 ............................................................... .52 .52 .53 .50 3.2 3.2 3.3 3.1 2010 ............................................................... .51 .50 .50 .52 3.1 3.1 3.1 3.3
2011 ............................................................... .53 .58 .58 .53 3.3 3.6 3.5 3.1 2012 ............................................................... .54 .55 .39 .43 3.1 3.1 2.3 2.4 2013 ............................................................... .43 .44 .45 .46 2.5 2.5 2.5 2.6 2014 ............................................................... .45 .45 .46 .45 2.5 2.5 2.5 2.4 2015 ............................................................... .45 .45 .46 .38 2.4 2.4 2.4 2.2
See footnotes at end of table.
-243-

Supplemental table 21. Private professional and business services industry workers, by occupational group: employercosts per hours worked for employee compensation and costs as a percentage of total compensation, 2006-2017 --Continued
Production, transportation, and material moving occupations
Compensationcomponent
Cost per hour worked Percent of total compensation
Mar. June Sep. Dec. Mar. June Sep. Dec.
Supplemental pay 2016 ............................................................... 0.38 0.38 0.39 0.39 2.2 2.2 2.2 2.2 2017 ............................................................... .40 – – – 2.2 – – –
Insurance 2006 ............................................................... – – – .81 – – – 5.4 2007 ............................................................... .83 .82 .92 .89 5.4 5.4 5.9 5.7 2008 ............................................................... .97 .96 .97 .83 5.9 5.9 5.9 5.3 2009 ............................................................... .82 .83 .84 .82 5.1 5.1 5.2 5.1 2010 ............................................................... .84 .86 .85 .83 5.2 5.3 5.2 5.2
2011 ............................................................... .86 .87 .87 1.00 5.3 5.3 5.3 5.8 2012 ............................................................... 1.03 1.07 1.00 1.01 5.8 6.0 5.8 5.7 2013 ............................................................... 1.04 1.00 .93 .91 5.9 5.6 5.2 5.1 2014 ............................................................... .88 .83 .85 .88 4.9 4.7 4.7 4.8 2015 ............................................................... .96 .96 .97 .96 5.1 5.2 5.2 5.5 2016 ............................................................... .99 .83 .96 .95 5.6 4.8 5.4 5.3 2017 ............................................................... .96 – – – 5.3 – – –
Retirement and savings 2006 ............................................................... – – – .21 – – – 1.4 2007 ............................................................... .20 .26 .26 .29 1.3 1.7 1.7 1.9 2008 ............................................................... .30 .29 .30 .24 1.8 1.8 1.8 1.6 2009 ............................................................... .29 .28 .27 .20 1.8 1.7 1.7 1.3 2010 ............................................................... .19 .20 .21 .17 1.2 1.2 1.3 1.1
2011 ............................................................... .17 .16 .16 .26 1.0 1.0 1.0 1.5 2012 ............................................................... .27 .27 .26 .28 1.5 1.5 1.5 1.6 2013 ............................................................... .29 .29 .30 .30 1.7 1.6 1.7 1.7 2014 ............................................................... .31 .29 .30 .36 1.7 1.6 1.6 2.0 2015 ............................................................... .38 .40 .39 .22 2.0 2.1 2.1 1.3 2016 ............................................................... .23 .21 .23 .23 1.3 1.2 1.3 1.3 2017 ............................................................... .24 – – – 1.3 – – –
Legally required benefits 2006 ............................................................... – – – 1.88 – – – 12.5 2007 ............................................................... 1.86 1.74 1.85 1.78 12.2 11.6 11.9 11.5 2008 ............................................................... 1.96 1.93 1.95 1.74 12.0 11.9 11.9 11.2 2009 ............................................................... 1.79 1.81 1.81 1.80 11.1 11.2 11.1 11.1 2010 ............................................................... 1.84 1.85 1.89 1.83 11.3 11.4 11.5 11.4
2011 ............................................................... 1.85 1.87 1.90 1.95 11.5 11.5 11.6 11.3 2012 ............................................................... 1.96 1.99 1.97 1.98 11.1 11.2 11.3 11.2 2013 ............................................................... 1.98 2.06 2.06 2.00 11.2 11.5 11.5 11.2 2014 ............................................................... 2.01 1.99 2.01 1.99 11.2 11.1 11.1 10.8 2015 ............................................................... 2.00 1.98 1.99 1.93 10.7 10.7 10.7 11.0 2016 ............................................................... 1.93 1.90 1.93 1.94 10.9 11.0 10.8 10.8 2017 ............................................................... 1.96 – – – 10.8 – – –
Note: The sum of individual items may not equal totals due to rounding. Dashes indicate data are not available.
-244-
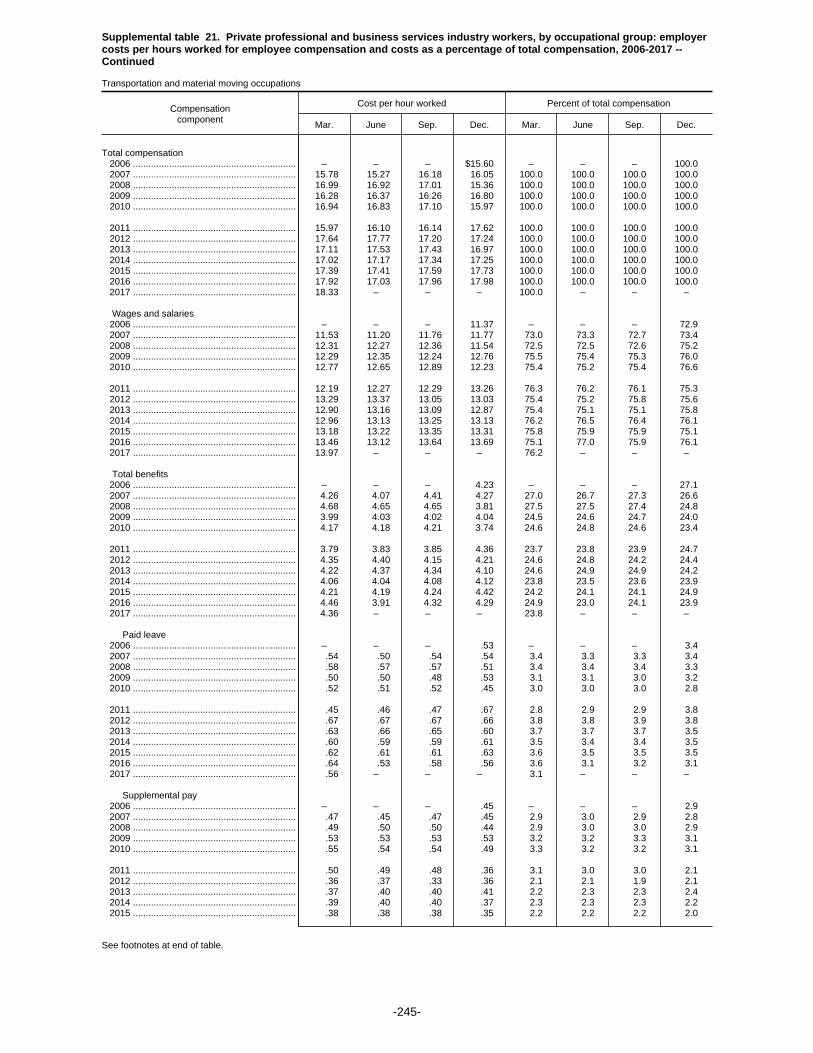
Supplemental table 21. Private professional and business services industry workers, by occupational group: employercosts per hours worked for employee compensation and costs as a percentage of total compensation, 2006-2017 --Continued
Transportation and material moving occupations
Compensationcomponent
Cost per hour worked Percent of total compensation
Mar. June Sep. Dec. Mar. June Sep. Dec.
Total compensation 2006 ............................................................... – – – $15.60 – – – 100.0 2007 ............................................................... 15.78 15.27 16.18 16.05 100.0 100.0 100.0 100.0 2008 ............................................................... 16.99 16.92 17.01 15.36 100.0 100.0 100.0 100.0 2009 ............................................................... 16.28 16.37 16.26 16.80 100.0 100.0 100.0 100.0 2010 ............................................................... 16.94 16.83 17.10 15.97 100.0 100.0 100.0 100.0
2011 ............................................................... 15.97 16.10 16.14 17.62 100.0 100.0 100.0 100.0 2012 ............................................................... 17.64 17.77 17.20 17.24 100.0 100.0 100.0 100.0 2013 ............................................................... 17.11 17.53 17.43 16.97 100.0 100.0 100.0 100.0 2014 ............................................................... 17.02 17.17 17.34 17.25 100.0 100.0 100.0 100.0 2015 ............................................................... 17.39 17.41 17.59 17.73 100.0 100.0 100.0 100.0 2016 ............................................................... 17.92 17.03 17.96 17.98 100.0 100.0 100.0 100.0 2017 ............................................................... 18.33 – – – 100.0 – – –
Wages and salaries 2006 ............................................................... – – – 11.37 – – – 72.9 2007 ............................................................... 11.53 11.20 11.76 11.77 73.0 73.3 72.7 73.4 2008 ............................................................... 12.31 12.27 12.36 11.54 72.5 72.5 72.6 75.2 2009 ............................................................... 12.29 12.35 12.24 12.76 75.5 75.4 75.3 76.0 2010 ............................................................... 12.77 12.65 12.89 12.23 75.4 75.2 75.4 76.6
2011 ............................................................... 12.19 12.27 12.29 13.26 76.3 76.2 76.1 75.3 2012 ............................................................... 13.29 13.37 13.05 13.03 75.4 75.2 75.8 75.6 2013 ............................................................... 12.90 13.16 13.09 12.87 75.4 75.1 75.1 75.8 2014 ............................................................... 12.96 13.13 13.25 13.13 76.2 76.5 76.4 76.1 2015 ............................................................... 13.18 13.22 13.35 13.31 75.8 75.9 75.9 75.1 2016 ............................................................... 13.46 13.12 13.64 13.69 75.1 77.0 75.9 76.1 2017 ............................................................... 13.97 – – – 76.2 – – –
Total benefits 2006 ............................................................... – – – 4.23 – – – 27.1 2007 ............................................................... 4.26 4.07 4.41 4.27 27.0 26.7 27.3 26.6 2008 ............................................................... 4.68 4.65 4.65 3.81 27.5 27.5 27.4 24.8 2009 ............................................................... 3.99 4.03 4.02 4.04 24.5 24.6 24.7 24.0 2010 ............................................................... 4.17 4.18 4.21 3.74 24.6 24.8 24.6 23.4
2011 ............................................................... 3.79 3.83 3.85 4.36 23.7 23.8 23.9 24.7 2012 ............................................................... 4.35 4.40 4.15 4.21 24.6 24.8 24.2 24.4 2013 ............................................................... 4.22 4.37 4.34 4.10 24.6 24.9 24.9 24.2 2014 ............................................................... 4.06 4.04 4.08 4.12 23.8 23.5 23.6 23.9 2015 ............................................................... 4.21 4.19 4.24 4.42 24.2 24.1 24.1 24.9 2016 ............................................................... 4.46 3.91 4.32 4.29 24.9 23.0 24.1 23.9 2017 ............................................................... 4.36 – – – 23.8 – – –
Paid leave 2006 ............................................................... – – – .53 – – – 3.4 2007 ............................................................... .54 .50 .54 .54 3.4 3.3 3.3 3.4 2008 ............................................................... .58 .57 .57 .51 3.4 3.4 3.4 3.3 2009 ............................................................... .50 .50 .48 .53 3.1 3.1 3.0 3.2 2010 ............................................................... .52 .51 .52 .45 3.0 3.0 3.0 2.8
2011 ............................................................... .45 .46 .47 .67 2.8 2.9 2.9 3.8 2012 ............................................................... .67 .67 .67 .66 3.8 3.8 3.9 3.8 2013 ............................................................... .63 .66 .65 .60 3.7 3.7 3.7 3.5 2014 ............................................................... .60 .59 .59 .61 3.5 3.4 3.4 3.5 2015 ............................................................... .62 .61 .61 .63 3.6 3.5 3.5 3.5 2016 ............................................................... .64 .53 .58 .56 3.6 3.1 3.2 3.1 2017 ............................................................... .56 – – – 3.1 – – –
Supplemental pay 2006 ............................................................... – – – .45 – – – 2.9 2007 ............................................................... .47 .45 .47 .45 2.9 3.0 2.9 2.8 2008 ............................................................... .49 .50 .50 .44 2.9 3.0 3.0 2.9 2009 ............................................................... .53 .53 .53 .53 3.2 3.2 3.3 3.1 2010 ............................................................... .55 .54 .54 .49 3.3 3.2 3.2 3.1
2011 ............................................................... .50 .49 .48 .36 3.1 3.0 3.0 2.1 2012 ............................................................... .36 .37 .33 .36 2.1 2.1 1.9 2.1 2013 ............................................................... .37 .40 .40 .41 2.2 2.3 2.3 2.4 2014 ............................................................... .39 .40 .40 .37 2.3 2.3 2.3 2.2 2015 ............................................................... .38 .38 .38 .35 2.2 2.2 2.2 2.0
See footnotes at end of table.
-245-

Supplemental table 21. Private professional and business services industry workers, by occupational group: employercosts per hours worked for employee compensation and costs as a percentage of total compensation, 2006-2017 --Continued
Transportation and material moving occupations
Compensationcomponent
Cost per hour worked Percent of total compensation
Mar. June Sep. Dec. Mar. June Sep. Dec.
Supplemental pay 2016 ............................................................... 0.36 0.34 0.35 0.35 2.0 2.0 2.0 2.0 2017 ............................................................... .36 – – – 2.0 – – –
Insurance 2006 ............................................................... – – – .93 – – – 6.0 2007 ............................................................... .96 .94 1.08 1.05 6.1 6.2 6.7 6.6 2008 ............................................................... 1.14 1.09 1.09 .82 6.7 6.4 6.4 5.3 2009 ............................................................... .80 .83 .85 .84 4.9 5.0 5.2 5.0 2010 ............................................................... .90 .90 .86 .77 5.3 5.4 5.0 4.8
2011 ............................................................... .80 .82 .82 1.02 5.0 5.1 5.1 5.8 2012 ............................................................... 1.04 1.07 .93 .96 5.9 6.0 5.4 5.6 2013 ............................................................... .99 .95 .93 .91 5.8 5.4 5.4 5.4 2014 ............................................................... .87 .85 .86 .84 5.1 4.9 5.0 4.9 2015 ............................................................... .90 .90 .92 1.14 5.2 5.1 5.3 6.5 2016 ............................................................... 1.18 .83 1.11 1.09 6.6 4.9 6.2 6.0 2017 ............................................................... 1.11 – – – 6.0 – – –
Retirement and savings 2006 ............................................................... – – – .23 – – – 1.5 2007 ............................................................... .23 .30 .26 .29 1.4 1.9 1.6 1.8 2008 ............................................................... .27 .28 .28 .22 1.6 1.7 1.7 1.4 2009 ............................................................... .24 .24 .22 .19 1.5 1.4 1.4 1.1 2010 ............................................................... .20 .22 .23 .12 1.2 1.3 1.3 .8
2011 ............................................................... .11 .12 .12 .25 .7 .7 .7 1.4 2012 ............................................................... .26 .26 .21 .25 1.5 1.4 1.2 1.4 2013 ............................................................... .26 .25 .25 .24 1.5 1.4 1.4 1.4 2014 ............................................................... .24 .24 .24 .33 1.4 1.4 1.4 1.9 2015 ............................................................... .34 .34 .33 .24 2.0 1.9 1.9 1.4 2016 ............................................................... .25 .21 .24 .24 1.4 1.3 1.3 1.4 2017 ............................................................... .25 – – – 1.4 – – –
Legally required benefits 2006 ............................................................... – – – 2.08 – – – 13.3 2007 ............................................................... 2.07 1.88 2.05 1.94 13.1 12.3 12.7 12.1 2008 ............................................................... 2.19 2.20 2.21 1.82 12.9 13.0 13.0 11.9 2009 ............................................................... 1.92 1.94 1.92 1.95 11.8 11.8 11.8 11.6 2010 ............................................................... 2.01 2.01 2.06 1.91 11.9 12.0 12.1 12.0
2011 ............................................................... 1.92 1.95 1.97 2.05 12.0 12.1 12.2 11.6 2012 ............................................................... 2.01 2.04 2.01 1.98 11.4 11.5 11.7 11.5 2013 ............................................................... 1.96 2.11 2.11 1.94 11.5 12.0 12.1 11.5 2014 ............................................................... 1.95 1.96 1.99 1.97 11.5 11.4 11.5 11.4 2015 ............................................................... 1.97 1.96 1.98 2.05 11.3 11.3 11.3 11.6 2016 ............................................................... 2.05 1.99 2.04 2.05 11.4 11.7 11.4 11.4 2017 ............................................................... 2.08 – – – 11.4 – – –
Note: The sum of individual items may not equal totals due to rounding. Dashes indicate data are not available.
-246-
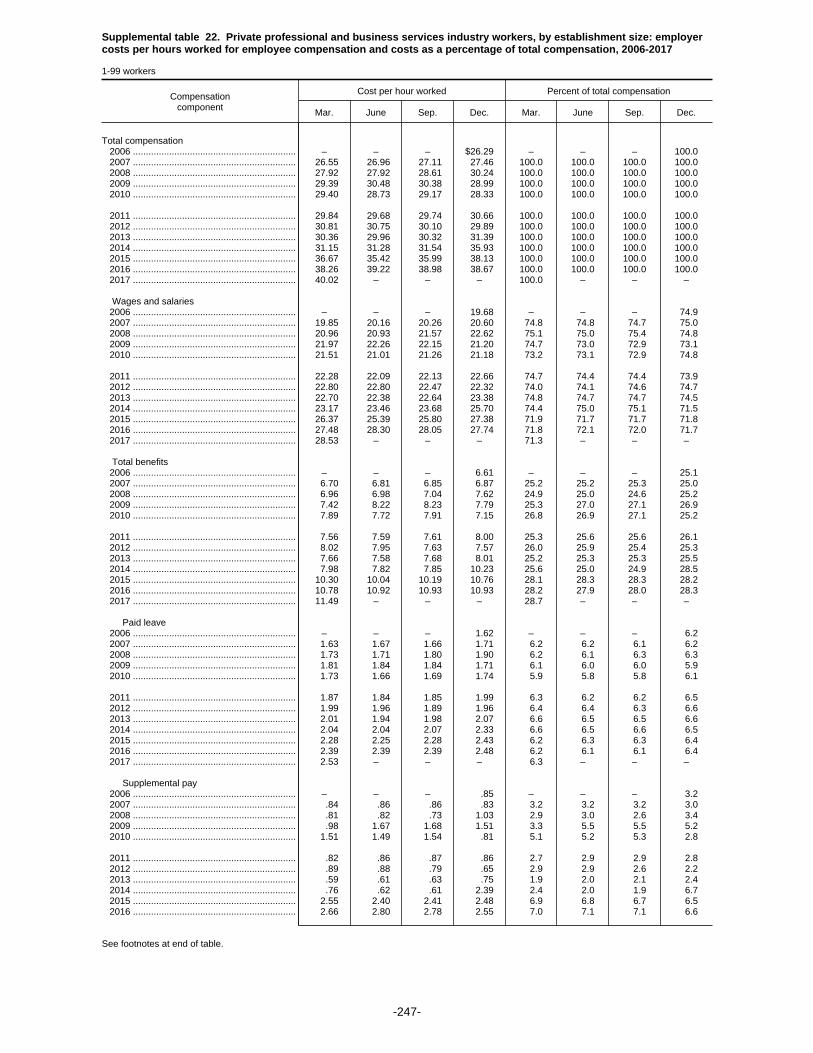
Supplemental table 22. Private professional and business services industry workers, by establishment size: employercosts per hours worked for employee compensation and costs as a percentage of total compensation, 2006-2017
1-99 workers
Compensationcomponent
Cost per hour worked Percent of total compensation
Mar. June Sep. Dec. Mar. June Sep. Dec.
Total compensation 2006 ............................................................... – – – $26.29 – – – 100.0 2007 ............................................................... 26.55 26.96 27.11 27.46 100.0 100.0 100.0 100.0 2008 ............................................................... 27.92 27.92 28.61 30.24 100.0 100.0 100.0 100.0 2009 ............................................................... 29.39 30.48 30.38 28.99 100.0 100.0 100.0 100.0 2010 ............................................................... 29.40 28.73 29.17 28.33 100.0 100.0 100.0 100.0
2011 ............................................................... 29.84 29.68 29.74 30.66 100.0 100.0 100.0 100.0 2012 ............................................................... 30.81 30.75 30.10 29.89 100.0 100.0 100.0 100.0 2013 ............................................................... 30.36 29.96 30.32 31.39 100.0 100.0 100.0 100.0 2014 ............................................................... 31.15 31.28 31.54 35.93 100.0 100.0 100.0 100.0 2015 ............................................................... 36.67 35.42 35.99 38.13 100.0 100.0 100.0 100.0 2016 ............................................................... 38.26 39.22 38.98 38.67 100.0 100.0 100.0 100.0 2017 ............................................................... 40.02 – – – 100.0 – – –
Wages and salaries 2006 ............................................................... – – – 19.68 – – – 74.9 2007 ............................................................... 19.85 20.16 20.26 20.60 74.8 74.8 74.7 75.0 2008 ............................................................... 20.96 20.93 21.57 22.62 75.1 75.0 75.4 74.8 2009 ............................................................... 21.97 22.26 22.15 21.20 74.7 73.0 72.9 73.1 2010 ............................................................... 21.51 21.01 21.26 21.18 73.2 73.1 72.9 74.8
2011 ............................................................... 22.28 22.09 22.13 22.66 74.7 74.4 74.4 73.9 2012 ............................................................... 22.80 22.80 22.47 22.32 74.0 74.1 74.6 74.7 2013 ............................................................... 22.70 22.38 22.64 23.38 74.8 74.7 74.7 74.5 2014 ............................................................... 23.17 23.46 23.68 25.70 74.4 75.0 75.1 71.5 2015 ............................................................... 26.37 25.39 25.80 27.38 71.9 71.7 71.7 71.8 2016 ............................................................... 27.48 28.30 28.05 27.74 71.8 72.1 72.0 71.7 2017 ............................................................... 28.53 – – – 71.3 – – –
Total benefits 2006 ............................................................... – – – 6.61 – – – 25.1 2007 ............................................................... 6.70 6.81 6.85 6.87 25.2 25.2 25.3 25.0 2008 ............................................................... 6.96 6.98 7.04 7.62 24.9 25.0 24.6 25.2 2009 ............................................................... 7.42 8.22 8.23 7.79 25.3 27.0 27.1 26.9 2010 ............................................................... 7.89 7.72 7.91 7.15 26.8 26.9 27.1 25.2
2011 ............................................................... 7.56 7.59 7.61 8.00 25.3 25.6 25.6 26.1 2012 ............................................................... 8.02 7.95 7.63 7.57 26.0 25.9 25.4 25.3 2013 ............................................................... 7.66 7.58 7.68 8.01 25.2 25.3 25.3 25.5 2014 ............................................................... 7.98 7.82 7.85 10.23 25.6 25.0 24.9 28.5 2015 ............................................................... 10.30 10.04 10.19 10.76 28.1 28.3 28.3 28.2 2016 ............................................................... 10.78 10.92 10.93 10.93 28.2 27.9 28.0 28.3 2017 ............................................................... 11.49 – – – 28.7 – – –
Paid leave 2006 ............................................................... – – – 1.62 – – – 6.2 2007 ............................................................... 1.63 1.67 1.66 1.71 6.2 6.2 6.1 6.2 2008 ............................................................... 1.73 1.71 1.80 1.90 6.2 6.1 6.3 6.3 2009 ............................................................... 1.81 1.84 1.84 1.71 6.1 6.0 6.0 5.9 2010 ............................................................... 1.73 1.66 1.69 1.74 5.9 5.8 5.8 6.1
2011 ............................................................... 1.87 1.84 1.85 1.99 6.3 6.2 6.2 6.5 2012 ............................................................... 1.99 1.96 1.89 1.96 6.4 6.4 6.3 6.6 2013 ............................................................... 2.01 1.94 1.98 2.07 6.6 6.5 6.5 6.6 2014 ............................................................... 2.04 2.04 2.07 2.33 6.6 6.5 6.6 6.5 2015 ............................................................... 2.28 2.25 2.28 2.43 6.2 6.3 6.3 6.4 2016 ............................................................... 2.39 2.39 2.39 2.48 6.2 6.1 6.1 6.4 2017 ............................................................... 2.53 – – – 6.3 – – –
Supplemental pay 2006 ............................................................... – – – .85 – – – 3.2 2007 ............................................................... .84 .86 .86 .83 3.2 3.2 3.2 3.0 2008 ............................................................... .81 .82 .73 1.03 2.9 3.0 2.6 3.4 2009 ............................................................... .98 1.67 1.68 1.51 3.3 5.5 5.5 5.2 2010 ............................................................... 1.51 1.49 1.54 .81 5.1 5.2 5.3 2.8
2011 ............................................................... .82 .86 .87 .86 2.7 2.9 2.9 2.8 2012 ............................................................... .89 .88 .79 .65 2.9 2.9 2.6 2.2 2013 ............................................................... .59 .61 .63 .75 1.9 2.0 2.1 2.4 2014 ............................................................... .76 .62 .61 2.39 2.4 2.0 1.9 6.7 2015 ............................................................... 2.55 2.40 2.41 2.48 6.9 6.8 6.7 6.5 2016 ............................................................... 2.66 2.80 2.78 2.55 7.0 7.1 7.1 6.6
See footnotes at end of table.
-247-

Supplemental table 22. Private professional and business services industry workers, by establishment size: employercosts per hours worked for employee compensation and costs as a percentage of total compensation, 2006-2017
1-99 workers
Compensationcomponent
Cost per hour worked Percent of total compensation
Mar. June Sep. Dec. Mar. June Sep. Dec.
Supplemental pay 2017 ............................................................... 2.82 – – – 7.0 – – –
Insurance 2006 ............................................................... – – – 1.45 – – – 5.5 2007 ............................................................... 1.51 1.55 1.58 1.58 5.7 5.8 5.8 5.7 2008 ............................................................... 1.62 1.64 1.65 1.74 5.8 5.9 5.8 5.7 2009 ............................................................... 1.73 1.76 1.78 1.73 5.9 5.8 5.8 6.0 2010 ............................................................... 1.77 1.73 1.76 1.72 6.0 6.0 6.0 6.1
2011 ............................................................... 1.81 1.84 1.84 1.92 6.1 6.2 6.2 6.3 2012 ............................................................... 1.91 1.89 1.84 1.91 6.2 6.1 6.1 6.4 2013 ............................................................... 1.96 1.96 1.93 1.89 6.4 6.5 6.4 6.0 2014 ............................................................... 1.89 1.86 1.86 1.97 6.1 5.9 5.9 5.5 2015 ............................................................... 1.93 1.88 1.91 2.02 5.3 5.3 5.3 5.3 2016 ............................................................... 2.03 2.04 2.06 2.14 5.3 5.2 5.3 5.5 2017 ............................................................... 2.23 – – – 5.6 – – –
Retirement and savings 2006 ............................................................... – – – .43 – – – 1.7 2007 ............................................................... .44 .46 .46 .47 1.7 1.7 1.7 1.7 2008 ............................................................... .45 .46 .48 .53 1.6 1.7 1.7 1.8 2009 ............................................................... .53 .54 .55 .52 1.8 1.8 1.8 1.8 2010 ............................................................... .53 .50 .55 .53 1.8 1.7 1.9 1.9
2011 ............................................................... .62 .61 .61 .75 2.1 2.1 2.1 2.5 2012 ............................................................... .74 .73 .63 .58 2.4 2.4 2.1 1.9 2013 ............................................................... .61 .57 .63 .64 2.0 1.9 2.1 2.0 2014 ............................................................... .65 .64 .64 .77 2.1 2.0 2.0 2.1 2015 ............................................................... .75 .75 .80 .93 2.0 2.1 2.2 2.4 2016 ............................................................... .81 .76 .77 .79 2.1 1.9 2.0 2.0 2017 ............................................................... .85 – – – 2.1 – – –
Legally required benefits 2006 ............................................................... – – – 2.27 – – – 8.6 2007 ............................................................... 2.27 2.26 2.29 2.29 8.6 8.4 8.4 8.3 2008 ............................................................... 2.35 2.35 2.38 2.42 8.4 8.4 8.3 8.0 2009 ............................................................... 2.37 2.41 2.39 2.31 8.1 7.9 7.9 8.0 2010 ............................................................... 2.36 2.34 2.37 2.35 8.0 8.1 8.1 8.3
2011 ............................................................... 2.44 2.44 2.45 2.47 8.2 8.2 8.2 8.1 2012 ............................................................... 2.50 2.50 2.48 2.47 8.1 8.1 8.3 8.3 2013 ............................................................... 2.50 2.50 2.52 2.65 8.2 8.3 8.3 8.5 2014 ............................................................... 2.64 2.66 2.67 2.77 8.5 8.5 8.5 7.7 2015 ............................................................... 2.80 2.76 2.78 2.90 7.6 7.8 7.7 7.6 2016 ............................................................... 2.89 2.93 2.93 2.97 7.5 7.5 7.5 7.7 2017 ............................................................... 3.05 – – – 7.6 – – –
Note: The sum of individual items may not equal totals due to rounding. Dashes indicate data are not available.
-248-
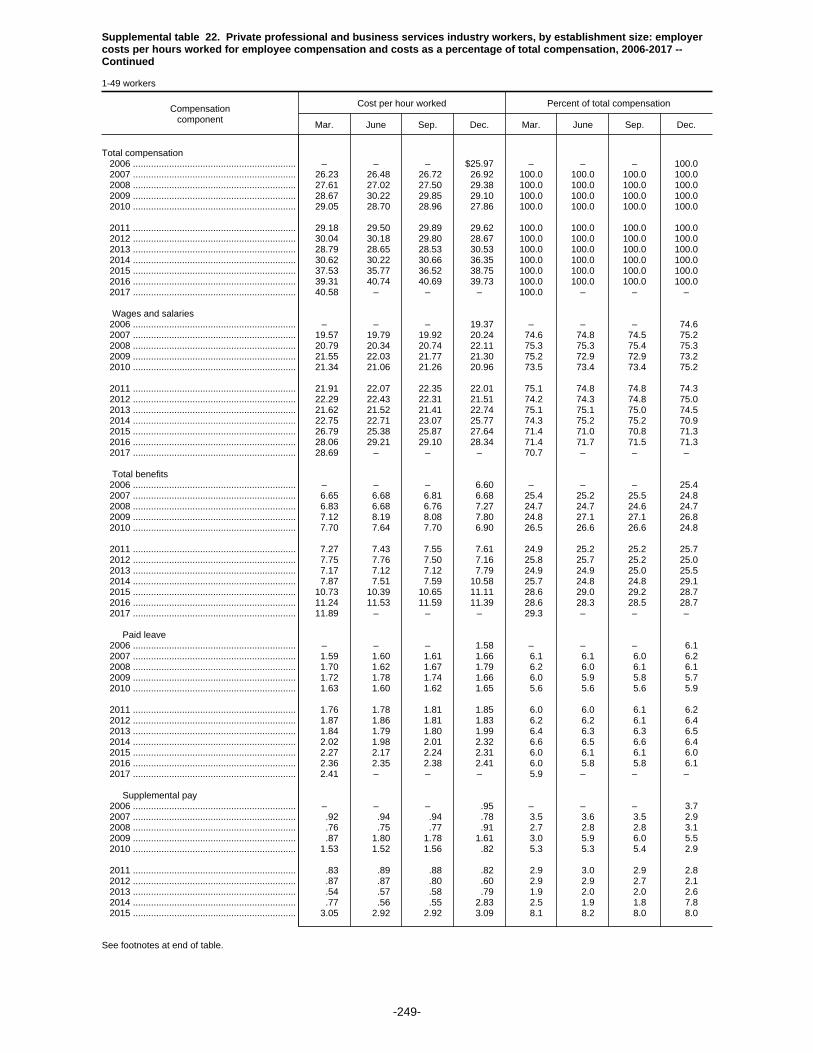
Supplemental table 22. Private professional and business services industry workers, by establishment size: employercosts per hours worked for employee compensation and costs as a percentage of total compensation, 2006-2017 --Continued
1-49 workers
Compensationcomponent
Cost per hour worked Percent of total compensation
Mar. June Sep. Dec. Mar. June Sep. Dec.
Total compensation 2006 ............................................................... – – – $25.97 – – – 100.0 2007 ............................................................... 26.23 26.48 26.72 26.92 100.0 100.0 100.0 100.0 2008 ............................................................... 27.61 27.02 27.50 29.38 100.0 100.0 100.0 100.0 2009 ............................................................... 28.67 30.22 29.85 29.10 100.0 100.0 100.0 100.0 2010 ............................................................... 29.05 28.70 28.96 27.86 100.0 100.0 100.0 100.0
2011 ............................................................... 29.18 29.50 29.89 29.62 100.0 100.0 100.0 100.0 2012 ............................................................... 30.04 30.18 29.80 28.67 100.0 100.0 100.0 100.0 2013 ............................................................... 28.79 28.65 28.53 30.53 100.0 100.0 100.0 100.0 2014 ............................................................... 30.62 30.22 30.66 36.35 100.0 100.0 100.0 100.0 2015 ............................................................... 37.53 35.77 36.52 38.75 100.0 100.0 100.0 100.0 2016 ............................................................... 39.31 40.74 40.69 39.73 100.0 100.0 100.0 100.0 2017 ............................................................... 40.58 – – – 100.0 – – –
Wages and salaries 2006 ............................................................... – – – 19.37 – – – 74.6 2007 ............................................................... 19.57 19.79 19.92 20.24 74.6 74.8 74.5 75.2 2008 ............................................................... 20.79 20.34 20.74 22.11 75.3 75.3 75.4 75.3 2009 ............................................................... 21.55 22.03 21.77 21.30 75.2 72.9 72.9 73.2 2010 ............................................................... 21.34 21.06 21.26 20.96 73.5 73.4 73.4 75.2
2011 ............................................................... 21.91 22.07 22.35 22.01 75.1 74.8 74.8 74.3 2012 ............................................................... 22.29 22.43 22.31 21.51 74.2 74.3 74.8 75.0 2013 ............................................................... 21.62 21.52 21.41 22.74 75.1 75.1 75.0 74.5 2014 ............................................................... 22.75 22.71 23.07 25.77 74.3 75.2 75.2 70.9 2015 ............................................................... 26.79 25.38 25.87 27.64 71.4 71.0 70.8 71.3 2016 ............................................................... 28.06 29.21 29.10 28.34 71.4 71.7 71.5 71.3 2017 ............................................................... 28.69 – – – 70.7 – – –
Total benefits 2006 ............................................................... – – – 6.60 – – – 25.4 2007 ............................................................... 6.65 6.68 6.81 6.68 25.4 25.2 25.5 24.8 2008 ............................................................... 6.83 6.68 6.76 7.27 24.7 24.7 24.6 24.7 2009 ............................................................... 7.12 8.19 8.08 7.80 24.8 27.1 27.1 26.8 2010 ............................................................... 7.70 7.64 7.70 6.90 26.5 26.6 26.6 24.8
2011 ............................................................... 7.27 7.43 7.55 7.61 24.9 25.2 25.2 25.7 2012 ............................................................... 7.75 7.76 7.50 7.16 25.8 25.7 25.2 25.0 2013 ............................................................... 7.17 7.12 7.12 7.79 24.9 24.9 25.0 25.5 2014 ............................................................... 7.87 7.51 7.59 10.58 25.7 24.8 24.8 29.1 2015 ............................................................... 10.73 10.39 10.65 11.11 28.6 29.0 29.2 28.7 2016 ............................................................... 11.24 11.53 11.59 11.39 28.6 28.3 28.5 28.7 2017 ............................................................... 11.89 – – – 29.3 – – –
Paid leave 2006 ............................................................... – – – 1.58 – – – 6.1 2007 ............................................................... 1.59 1.60 1.61 1.66 6.1 6.1 6.0 6.2 2008 ............................................................... 1.70 1.62 1.67 1.79 6.2 6.0 6.1 6.1 2009 ............................................................... 1.72 1.78 1.74 1.66 6.0 5.9 5.8 5.7 2010 ............................................................... 1.63 1.60 1.62 1.65 5.6 5.6 5.6 5.9
2011 ............................................................... 1.76 1.78 1.81 1.85 6.0 6.0 6.1 6.2 2012 ............................................................... 1.87 1.86 1.81 1.83 6.2 6.2 6.1 6.4 2013 ............................................................... 1.84 1.79 1.80 1.99 6.4 6.3 6.3 6.5 2014 ............................................................... 2.02 1.98 2.01 2.32 6.6 6.5 6.6 6.4 2015 ............................................................... 2.27 2.17 2.24 2.31 6.0 6.1 6.1 6.0 2016 ............................................................... 2.36 2.35 2.38 2.41 6.0 5.8 5.8 6.1 2017 ............................................................... 2.41 – – – 5.9 – – –
Supplemental pay 2006 ............................................................... – – – .95 – – – 3.7 2007 ............................................................... .92 .94 .94 .78 3.5 3.6 3.5 2.9 2008 ............................................................... .76 .75 .77 .91 2.7 2.8 2.8 3.1 2009 ............................................................... .87 1.80 1.78 1.61 3.0 5.9 6.0 5.5 2010 ............................................................... 1.53 1.52 1.56 .82 5.3 5.3 5.4 2.9
2011 ............................................................... .83 .89 .88 .82 2.9 3.0 2.9 2.8 2012 ............................................................... .87 .87 .80 .60 2.9 2.9 2.7 2.1 2013 ............................................................... .54 .57 .58 .79 1.9 2.0 2.0 2.6 2014 ............................................................... .77 .56 .55 2.83 2.5 1.9 1.8 7.8 2015 ............................................................... 3.05 2.92 2.92 3.09 8.1 8.2 8.0 8.0
See footnotes at end of table.
-249-
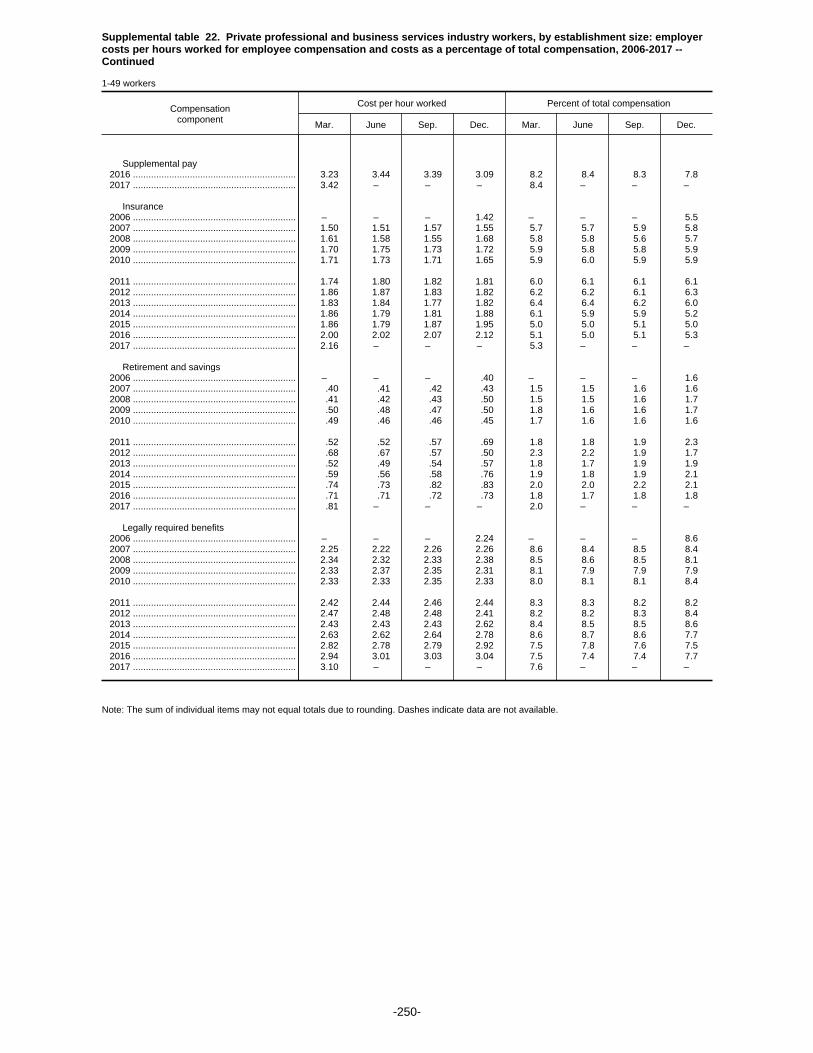
Supplemental table 22. Private professional and business services industry workers, by establishment size: employercosts per hours worked for employee compensation and costs as a percentage of total compensation, 2006-2017 --Continued
1-49 workers
Compensationcomponent
Cost per hour worked Percent of total compensation
Mar. June Sep. Dec. Mar. June Sep. Dec.
Supplemental pay 2016 ............................................................... 3.23 3.44 3.39 3.09 8.2 8.4 8.3 7.8 2017 ............................................................... 3.42 – – – 8.4 – – –
Insurance 2006 ............................................................... – – – 1.42 – – – 5.5 2007 ............................................................... 1.50 1.51 1.57 1.55 5.7 5.7 5.9 5.8 2008 ............................................................... 1.61 1.58 1.55 1.68 5.8 5.8 5.6 5.7 2009 ............................................................... 1.70 1.75 1.73 1.72 5.9 5.8 5.8 5.9 2010 ............................................................... 1.71 1.73 1.71 1.65 5.9 6.0 5.9 5.9
2011 ............................................................... 1.74 1.80 1.82 1.81 6.0 6.1 6.1 6.1 2012 ............................................................... 1.86 1.87 1.83 1.82 6.2 6.2 6.1 6.3 2013 ............................................................... 1.83 1.84 1.77 1.82 6.4 6.4 6.2 6.0 2014 ............................................................... 1.86 1.79 1.81 1.88 6.1 5.9 5.9 5.2 2015 ............................................................... 1.86 1.79 1.87 1.95 5.0 5.0 5.1 5.0 2016 ............................................................... 2.00 2.02 2.07 2.12 5.1 5.0 5.1 5.3 2017 ............................................................... 2.16 – – – 5.3 – – –
Retirement and savings 2006 ............................................................... – – – .40 – – – 1.6 2007 ............................................................... .40 .41 .42 .43 1.5 1.5 1.6 1.6 2008 ............................................................... .41 .42 .43 .50 1.5 1.5 1.6 1.7 2009 ............................................................... .50 .48 .47 .50 1.8 1.6 1.6 1.7 2010 ............................................................... .49 .46 .46 .45 1.7 1.6 1.6 1.6
2011 ............................................................... .52 .52 .57 .69 1.8 1.8 1.9 2.3 2012 ............................................................... .68 .67 .57 .50 2.3 2.2 1.9 1.7 2013 ............................................................... .52 .49 .54 .57 1.8 1.7 1.9 1.9 2014 ............................................................... .59 .56 .58 .76 1.9 1.8 1.9 2.1 2015 ............................................................... .74 .73 .82 .83 2.0 2.0 2.2 2.1 2016 ............................................................... .71 .71 .72 .73 1.8 1.7 1.8 1.8 2017 ............................................................... .81 – – – 2.0 – – –
Legally required benefits 2006 ............................................................... – – – 2.24 – – – 8.6 2007 ............................................................... 2.25 2.22 2.26 2.26 8.6 8.4 8.5 8.4 2008 ............................................................... 2.34 2.32 2.33 2.38 8.5 8.6 8.5 8.1 2009 ............................................................... 2.33 2.37 2.35 2.31 8.1 7.9 7.9 7.9 2010 ............................................................... 2.33 2.33 2.35 2.33 8.0 8.1 8.1 8.4
2011 ............................................................... 2.42 2.44 2.46 2.44 8.3 8.3 8.2 8.2 2012 ............................................................... 2.47 2.48 2.48 2.41 8.2 8.2 8.3 8.4 2013 ............................................................... 2.43 2.43 2.43 2.62 8.4 8.5 8.5 8.6 2014 ............................................................... 2.63 2.62 2.64 2.78 8.6 8.7 8.6 7.7 2015 ............................................................... 2.82 2.78 2.79 2.92 7.5 7.8 7.6 7.5 2016 ............................................................... 2.94 3.01 3.03 3.04 7.5 7.4 7.4 7.7 2017 ............................................................... 3.10 – – – 7.6 – – –
Note: The sum of individual items may not equal totals due to rounding. Dashes indicate data are not available.
-250-

Supplemental table 22. Private professional and business services industry workers, by establishment size: employercosts per hours worked for employee compensation and costs as a percentage of total compensation, 2006-2017 --Continued
50-99 workers
Compensationcomponent
Cost per hour worked Percent of total compensation
Mar. June Sep. Dec. Mar. June Sep. Dec.
Total compensation 2006 ............................................................... – – – $27.42 – – – 100.0 2007 ............................................................... 27.78 28.78 28.46 29.21 100.0 100.0 100.0 100.0 2008 ............................................................... 28.82 30.52 32.49 32.75 100.0 100.0 100.0 100.0 2009 ............................................................... 31.44 31.26 32.02 28.64 100.0 100.0 100.0 100.0 2010 ............................................................... 30.75 28.81 30.03 30.16 100.0 100.0 100.0 100.0
2011 ............................................................... 32.28 30.31 29.22 33.68 100.0 100.0 100.0 100.0 2012 ............................................................... 33.03 32.33 30.93 34.83 100.0 100.0 100.0 100.0 2013 ............................................................... 36.47 34.92 37.41 34.45 100.0 100.0 100.0 100.0 2014 ............................................................... 33.01 34.86 34.34 34.51 100.0 100.0 100.0 100.0 2015 ............................................................... 33.99 34.28 34.22 36.23 100.0 100.0 100.0 100.0 2016 ............................................................... 34.35 33.59 32.48 34.70 100.0 100.0 100.0 100.0 2017 ............................................................... 37.86 – – – 100.0 – – –
Wages and salaries 2006 ............................................................... – – – 20.79 – – – 75.8 2007 ............................................................... 20.91 21.52 21.45 21.74 75.2 74.8 75.4 74.4 2008 ............................................................... 21.47 22.66 24.47 24.10 74.5 74.2 75.3 73.6 2009 ............................................................... 23.16 22.94 23.34 20.88 73.7 73.4 72.9 72.9 2010 ............................................................... 22.13 20.81 21.26 22.05 72.0 72.2 70.8 73.1
2011 ............................................................... 23.64 22.17 21.40 24.56 73.2 73.2 73.2 72.9 2012 ............................................................... 24.26 23.84 22.91 25.60 73.4 73.7 74.1 73.5 2013 ............................................................... 26.88 25.62 27.53 25.65 73.7 73.4 73.6 74.5 2014 ............................................................... 24.65 26.00 25.65 25.46 74.7 74.6 74.7 73.8 2015 ............................................................... 25.05 25.39 25.55 26.55 73.7 74.1 74.7 73.3 2016 ............................................................... 25.32 24.92 24.04 25.50 73.7 74.2 74.0 73.5 2017 ............................................................... 27.93 – – – 73.8 – – –
Total benefits 2006 ............................................................... – – – 6.63 – – – 24.2 2007 ............................................................... 6.88 7.26 7.01 7.48 24.8 25.2 24.6 25.6 2008 ............................................................... 7.36 7.86 8.02 8.64 25.5 25.8 24.7 26.4 2009 ............................................................... 8.28 8.32 8.67 7.76 26.3 26.6 27.1 27.1 2010 ............................................................... 8.61 8.01 8.77 8.11 28.0 27.8 29.2 26.9
2011 ............................................................... 8.64 8.14 7.82 9.11 26.8 26.8 26.8 27.1 2012 ............................................................... 8.77 8.49 8.02 9.23 26.6 26.3 25.9 26.5 2013 ............................................................... 9.58 9.29 9.87 8.80 26.3 26.6 26.4 25.5 2014 ............................................................... 8.37 8.86 8.69 9.05 25.3 25.4 25.3 26.2 2015 ............................................................... 8.94 8.89 8.67 9.68 26.3 25.9 25.3 26.7 2016 ............................................................... 9.03 8.67 8.44 9.19 26.3 25.8 26.0 26.5 2017 ............................................................... 9.93 – – – 26.2 – – –
Paid leave 2006 ............................................................... – – – 1.74 – – – 6.4 2007 ............................................................... 1.82 1.90 1.83 1.86 6.6 6.6 6.4 6.4 2008 ............................................................... 1.81 1.96 2.23 2.21 6.3 6.4 6.9 6.8 2009 ............................................................... 2.06 2.01 2.13 1.88 6.6 6.4 6.6 6.5 2010 ............................................................... 2.09 1.88 1.99 2.09 6.8 6.5 6.6 6.9
2011 ............................................................... 2.29 2.04 1.96 2.40 7.1 6.7 6.7 7.1 2012 ............................................................... 2.33 2.24 2.09 2.48 7.0 6.9 6.8 7.1 2013 ............................................................... 2.67 2.51 2.69 2.36 7.3 7.2 7.2 6.8 2014 ............................................................... 2.13 2.28 2.23 2.37 6.5 6.5 6.5 6.9 2015 ............................................................... 2.32 2.50 2.42 2.78 6.8 7.3 7.1 7.7 2016 ............................................................... 2.51 2.51 2.45 2.72 7.3 7.5 7.5 7.8 2017 ............................................................... 3.01 – – – 8.0 – – –
Supplemental pay 2006 ............................................................... – – – .46 – – – 1.7 2007 ............................................................... .53 .58 .57 .99 1.9 2.0 2.0 3.4 2008 ............................................................... .98 1.05 .60 1.36 3.4 3.4 1.9 4.2 2009 ............................................................... 1.29 1.30 1.35 1.20 4.1 4.2 4.2 4.2 2010 ............................................................... 1.44 1.35 1.47 .77 4.7 4.7 4.9 2.6
2011 ............................................................... .77 .76 .82 .98 2.4 2.5 2.8 2.9 2012 ............................................................... .95 .91 .76 .83 2.9 2.8 2.5 2.4 2013 ............................................................... .75 .77 .80 .64 2.0 2.2 2.1 1.9 2014 ............................................................... .71 .80 .81 .90 2.2 2.3 2.4 2.6 2015 ............................................................... .96 .70 .68 .59 2.8 2.0 2.0 1.6
See footnotes at end of table.
-251-

Supplemental table 22. Private professional and business services industry workers, by establishment size: employercosts per hours worked for employee compensation and costs as a percentage of total compensation, 2006-2017 --Continued
50-99 workers
Compensationcomponent
Cost per hour worked Percent of total compensation
Mar. June Sep. Dec. Mar. June Sep. Dec.
Supplemental pay 2016 ............................................................... 0.53 0.44 0.46 0.53 1.5 1.3 1.4 1.5 2017 ............................................................... .54 – – – 1.4 – – –
Insurance 2006 ............................................................... – – – 1.52 – – – 5.5 2007 ............................................................... 1.58 1.71 1.64 1.66 5.7 5.9 5.8 5.7 2008 ............................................................... 1.64 1.82 2.01 1.90 5.7 6.0 6.2 5.8 2009 ............................................................... 1.82 1.78 1.91 1.78 5.8 5.7 6.0 6.2 2010 ............................................................... 1.98 1.75 2.00 2.00 6.4 6.1 6.7 6.6
2011 ............................................................... 2.07 1.97 1.88 2.23 6.4 6.5 6.4 6.6 2012 ............................................................... 2.04 1.92 1.88 2.27 6.2 6.0 6.1 6.5 2013 ............................................................... 2.44 2.41 2.55 2.16 6.7 6.9 6.8 6.3 2014 ............................................................... 1.99 2.09 2.03 2.24 6.0 6.0 5.9 6.5 2015 ............................................................... 2.16 2.16 2.06 2.26 6.3 6.3 6.0 6.2 2016 ............................................................... 2.13 2.10 2.04 2.25 6.2 6.2 6.3 6.5 2017 ............................................................... 2.51 – – – 6.6 – – –
Retirement and savings 2006 ............................................................... – – – .55 – – – 2.0 2007 ............................................................... .60 .66 .60 .60 2.2 2.3 2.1 2.0 2008 ............................................................... .54 .60 .62 .62 1.9 2.0 1.9 1.9 2009 ............................................................... .61 .72 .78 .58 1.9 2.3 2.4 2.0 2010 ............................................................... .65 .65 .89 .83 2.1 2.3 3.0 2.7
2011 ............................................................... 1.01 .94 .76 .93 3.1 3.1 2.6 2.8 2012 ............................................................... .88 .87 .79 .92 2.7 2.7 2.5 2.6 2013 ............................................................... .93 .85 .96 .88 2.6 2.4 2.6 2.6 2014 ............................................................... .85 .91 .86 .79 2.6 2.6 2.5 2.3 2015 ............................................................... .78 .83 .76 1.23 2.3 2.4 2.2 3.4 2016 ............................................................... 1.17 .97 .94 1.01 3.4 2.9 2.9 2.9 2017 ............................................................... 1.00 – – – 2.6 – – –
Legally required benefits 2006 ............................................................... – – – 2.36 – – – 8.6 2007 ............................................................... 2.36 2.41 2.36 2.37 8.5 8.4 8.3 8.1 2008 ............................................................... 2.39 2.44 2.56 2.55 8.3 8.0 7.9 7.8 2009 ............................................................... 2.49 2.51 2.51 2.32 7.9 8.0 7.9 8.1 2010 ............................................................... 2.46 2.38 2.42 2.42 8.0 8.2 8.1 8.0
2011 ............................................................... 2.51 2.42 2.39 2.57 7.8 8.0 8.2 7.6 2012 ............................................................... 2.57 2.54 2.50 2.73 7.8 7.9 8.1 7.8 2013 ............................................................... 2.80 2.76 2.87 2.76 7.7 7.9 7.7 8.0 2014 ............................................................... 2.68 2.78 2.76 2.75 8.1 8.0 8.0 8.0 2015 ............................................................... 2.72 2.70 2.75 2.82 8.0 7.9 8.0 7.8 2016 ............................................................... 2.69 2.66 2.56 2.69 7.8 7.9 7.9 7.7 2017 ............................................................... 2.86 – – – 7.6 – – –
Note: The sum of individual items may not equal totals due to rounding. Dashes indicate data are not available.
-252-

Supplemental table 22. Private professional and business services industry workers, by establishment size: employercosts per hours worked for employee compensation and costs as a percentage of total compensation, 2006-2017 --Continued
100 workers or more
Compensationcomponent
Cost per hour worked Percent of total compensation
Mar. June Sep. Dec. Mar. June Sep. Dec.
Total compensation 2006 ............................................................... – – – $32.79 – – – 100.0 2007 ............................................................... 33.52 33.38 33.45 34.53 100.0 100.0 100.0 100.0 2008 ............................................................... 35.31 35.46 35.39 35.42 100.0 100.0 100.0 100.0 2009 ............................................................... 36.89 36.77 36.34 37.40 100.0 100.0 100.0 100.0 2010 ............................................................... 37.80 37.81 37.58 37.95 100.0 100.0 100.0 100.0
2011 ............................................................... 38.02 37.95 37.89 37.94 100.0 100.0 100.0 100.0 2012 ............................................................... 38.84 38.80 39.32 39.68 100.0 100.0 100.0 100.0 2013 ............................................................... 40.12 39.86 39.50 39.52 100.0 100.0 100.0 100.0 2014 ............................................................... 40.37 40.64 40.77 41.02 100.0 100.0 100.0 100.0 2015 ............................................................... 42.06 41.16 41.03 40.76 100.0 100.0 100.0 100.0 2016 ............................................................... 40.49 39.56 40.27 40.97 100.0 100.0 100.0 100.0 2017 ............................................................... 40.88 – – – 100.0 – – –
Wages and salaries 2006 ............................................................... – – – 23.76 – – – 72.5 2007 ............................................................... 24.30 24.16 24.11 24.87 72.5 72.4 72.1 72.0 2008 ............................................................... 25.39 25.59 25.51 25.49 71.9 72.2 72.1 72.0 2009 ............................................................... 26.61 26.47 26.16 27.03 72.2 72.0 72.0 72.3 2010 ............................................................... 27.24 27.31 27.25 27.34 72.1 72.2 72.5 72.0
2011 ............................................................... 27.23 27.17 27.15 26.94 71.6 71.6 71.6 71.0 2012 ............................................................... 27.42 27.37 27.66 27.92 70.6 70.6 70.4 70.4 2013 ............................................................... 28.17 27.92 27.64 27.60 70.2 70.0 70.0 69.9 2014 ............................................................... 28.01 28.04 28.14 28.71 69.4 69.0 69.0 70.0 2015 ............................................................... 29.30 28.87 28.81 29.01 69.7 70.2 70.2 71.2 2016 ............................................................... 28.88 28.11 28.60 29.07 71.3 71.1 71.0 71.0 2017 ............................................................... 29.01 – – – 71.0 – – –
Total benefits 2006 ............................................................... – – – 9.03 – – – 27.5 2007 ............................................................... 9.22 9.23 9.34 9.66 27.5 27.6 27.9 28.0 2008 ............................................................... 9.92 9.87 9.88 9.92 28.1 27.8 27.9 28.0 2009 ............................................................... 10.27 10.30 10.18 10.36 27.8 28.0 28.0 27.7 2010 ............................................................... 10.56 10.50 10.33 10.61 27.9 27.8 27.5 28.0
2011 ............................................................... 10.79 10.78 10.74 11.00 28.4 28.4 28.4 29.0 2012 ............................................................... 11.43 11.42 11.66 11.76 29.4 29.4 29.6 29.6 2013 ............................................................... 11.95 11.94 11.86 11.92 29.8 30.0 30.0 30.1 2014 ............................................................... 12.36 12.59 12.63 12.31 30.6 31.0 31.0 30.0 2015 ............................................................... 12.76 12.28 12.22 11.76 30.3 29.8 29.8 28.8 2016 ............................................................... 11.61 11.45 11.67 11.90 28.7 28.9 29.0 29.0 2017 ............................................................... 11.87 – – – 29.0 – – –
Paid leave 2006 ............................................................... – – – 2.57 – – – 7.8 2007 ............................................................... 2.63 2.60 2.56 2.66 7.8 7.8 7.7 7.7 2008 ............................................................... 2.72 2.73 2.70 2.71 7.7 7.7 7.6 7.7 2009 ............................................................... 2.84 2.84 2.80 2.92 7.7 7.7 7.7 7.8 2010 ............................................................... 3.00 2.99 2.95 2.98 7.9 7.9 7.8 7.9
2011 ............................................................... 2.98 2.96 2.97 3.09 7.8 7.8 7.8 8.1 2012 ............................................................... 3.19 3.18 3.23 3.25 8.2 8.2 8.2 8.2 2013 ............................................................... 3.28 3.23 3.18 3.21 8.2 8.1 8.0 8.1 2014 ............................................................... 3.30 3.31 3.30 3.25 8.2 8.1 8.1 7.9 2015 ............................................................... 3.36 3.24 3.24 3.13 8.0 7.9 7.9 7.7 2016 ............................................................... 3.13 3.16 3.23 3.31 7.7 8.0 8.0 8.1 2017 ............................................................... 3.27 – – – 8.0 – – –
Supplemental pay 2006 ............................................................... – – – .79 – – – 2.4 2007 ............................................................... .80 .82 .82 .86 2.4 2.4 2.4 2.5 2008 ............................................................... .88 .89 .93 .89 2.5 2.5 2.6 2.5 2009 ............................................................... .83 .86 .86 .83 2.3 2.4 2.4 2.2 2010 ............................................................... .79 .76 .73 .76 2.1 2.0 1.9 2.0
2011 ............................................................... .88 .87 .87 1.01 2.3 2.3 2.3 2.7 2012 ............................................................... 1.08 1.05 1.06 1.08 2.8 2.7 2.7 2.7 2013 ............................................................... 1.09 1.09 1.09 1.11 2.7 2.7 2.8 2.8 2014 ............................................................... 1.21 1.18 1.19 1.26 3.0 2.9 2.9 3.1 2015 ............................................................... 1.33 1.33 1.36 1.38 3.2 3.2 3.3 3.4
See footnotes at end of table.
-253-
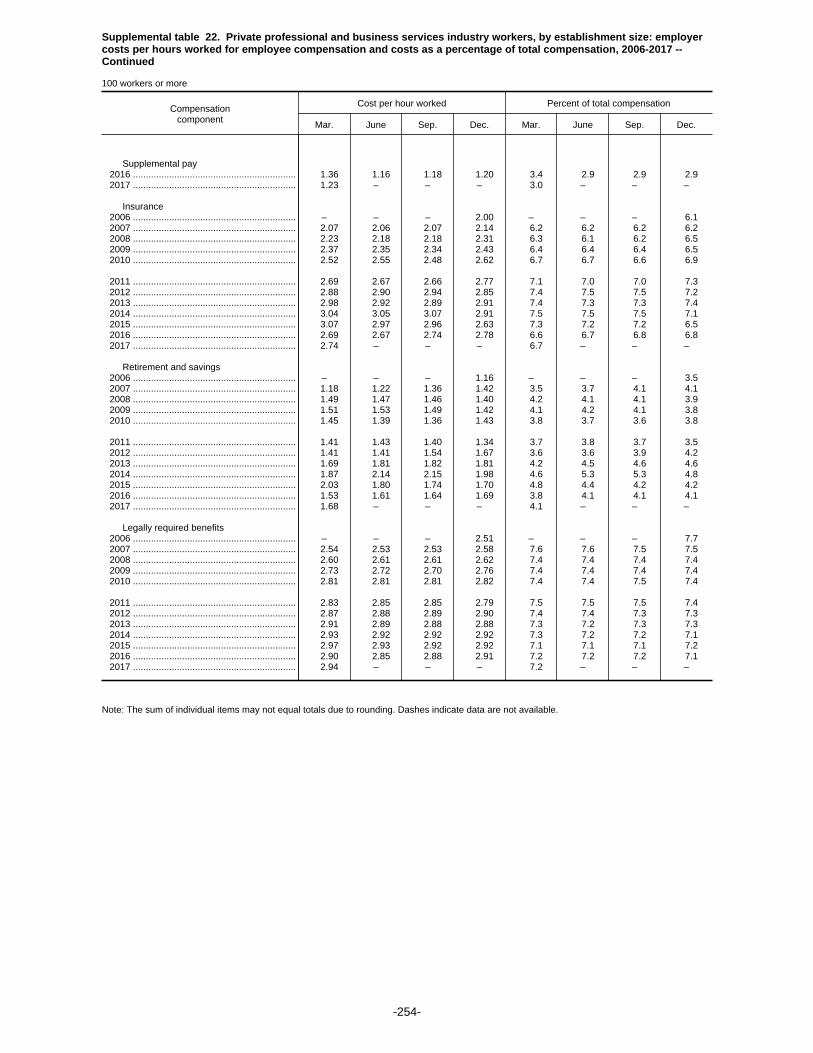
Supplemental table 22. Private professional and business services industry workers, by establishment size: employercosts per hours worked for employee compensation and costs as a percentage of total compensation, 2006-2017 --Continued
100 workers or more
Compensationcomponent
Cost per hour worked Percent of total compensation
Mar. June Sep. Dec. Mar. June Sep. Dec.
Supplemental pay 2016 ............................................................... 1.36 1.16 1.18 1.20 3.4 2.9 2.9 2.9 2017 ............................................................... 1.23 – – – 3.0 – – –
Insurance 2006 ............................................................... – – – 2.00 – – – 6.1 2007 ............................................................... 2.07 2.06 2.07 2.14 6.2 6.2 6.2 6.2 2008 ............................................................... 2.23 2.18 2.18 2.31 6.3 6.1 6.2 6.5 2009 ............................................................... 2.37 2.35 2.34 2.43 6.4 6.4 6.4 6.5 2010 ............................................................... 2.52 2.55 2.48 2.62 6.7 6.7 6.6 6.9
2011 ............................................................... 2.69 2.67 2.66 2.77 7.1 7.0 7.0 7.3 2012 ............................................................... 2.88 2.90 2.94 2.85 7.4 7.5 7.5 7.2 2013 ............................................................... 2.98 2.92 2.89 2.91 7.4 7.3 7.3 7.4 2014 ............................................................... 3.04 3.05 3.07 2.91 7.5 7.5 7.5 7.1 2015 ............................................................... 3.07 2.97 2.96 2.63 7.3 7.2 7.2 6.5 2016 ............................................................... 2.69 2.67 2.74 2.78 6.6 6.7 6.8 6.8 2017 ............................................................... 2.74 – – – 6.7 – – –
Retirement and savings 2006 ............................................................... – – – 1.16 – – – 3.5 2007 ............................................................... 1.18 1.22 1.36 1.42 3.5 3.7 4.1 4.1 2008 ............................................................... 1.49 1.47 1.46 1.40 4.2 4.1 4.1 3.9 2009 ............................................................... 1.51 1.53 1.49 1.42 4.1 4.2 4.1 3.8 2010 ............................................................... 1.45 1.39 1.36 1.43 3.8 3.7 3.6 3.8
2011 ............................................................... 1.41 1.43 1.40 1.34 3.7 3.8 3.7 3.5 2012 ............................................................... 1.41 1.41 1.54 1.67 3.6 3.6 3.9 4.2 2013 ............................................................... 1.69 1.81 1.82 1.81 4.2 4.5 4.6 4.6 2014 ............................................................... 1.87 2.14 2.15 1.98 4.6 5.3 5.3 4.8 2015 ............................................................... 2.03 1.80 1.74 1.70 4.8 4.4 4.2 4.2 2016 ............................................................... 1.53 1.61 1.64 1.69 3.8 4.1 4.1 4.1 2017 ............................................................... 1.68 – – – 4.1 – – –
Legally required benefits 2006 ............................................................... – – – 2.51 – – – 7.7 2007 ............................................................... 2.54 2.53 2.53 2.58 7.6 7.6 7.5 7.5 2008 ............................................................... 2.60 2.61 2.61 2.62 7.4 7.4 7.4 7.4 2009 ............................................................... 2.73 2.72 2.70 2.76 7.4 7.4 7.4 7.4 2010 ............................................................... 2.81 2.81 2.81 2.82 7.4 7.4 7.5 7.4
2011 ............................................................... 2.83 2.85 2.85 2.79 7.5 7.5 7.5 7.4 2012 ............................................................... 2.87 2.88 2.89 2.90 7.4 7.4 7.3 7.3 2013 ............................................................... 2.91 2.89 2.88 2.88 7.3 7.2 7.3 7.3 2014 ............................................................... 2.93 2.92 2.92 2.92 7.3 7.2 7.2 7.1 2015 ............................................................... 2.97 2.93 2.92 2.92 7.1 7.1 7.1 7.2 2016 ............................................................... 2.90 2.85 2.88 2.91 7.2 7.2 7.2 7.1 2017 ............................................................... 2.94 – – – 7.2 – – –
Note: The sum of individual items may not equal totals due to rounding. Dashes indicate data are not available.
-254-

Supplemental table 22. Private professional and business services industry workers, by establishment size: employercosts per hours worked for employee compensation and costs as a percentage of total compensation, 2006-2017 --Continued
100-499 workers
Compensationcomponent
Cost per hour worked Percent of total compensation
Mar. June Sep. Dec. Mar. June Sep. Dec.
Total compensation 2006 ............................................................... – – – $28.26 – – – 100.0 2007 ............................................................... 29.15 28.73 28.78 29.41 100.0 100.0 100.0 100.0 2008 ............................................................... 29.85 29.77 29.81 31.90 100.0 100.0 100.0 100.0 2009 ............................................................... 34.21 33.14 33.46 34.44 100.0 100.0 100.0 100.0 2010 ............................................................... 34.55 34.91 34.84 35.87 100.0 100.0 100.0 100.0
2011 ............................................................... 35.62 35.63 35.71 36.17 100.0 100.0 100.0 100.0 2012 ............................................................... 37.14 36.76 36.91 37.83 100.0 100.0 100.0 100.0 2013 ............................................................... 39.29 38.06 37.80 37.98 100.0 100.0 100.0 100.0 2014 ............................................................... 38.75 39.17 39.46 40.69 100.0 100.0 100.0 100.0 2015 ............................................................... 41.49 40.07 40.40 41.83 100.0 100.0 100.0 100.0 2016 ............................................................... 40.62 39.30 39.06 39.44 100.0 100.0 100.0 100.0 2017 ............................................................... 39.02 – – – 100.0 – – –
Wages and salaries 2006 ............................................................... – – – 20.86 – – – 73.8 2007 ............................................................... 21.45 21.19 21.24 21.66 73.6 73.7 73.8 73.6 2008 ............................................................... 21.96 22.04 22.06 23.56 73.6 74.0 74.0 73.9 2009 ............................................................... 25.41 24.58 24.80 25.69 74.3 74.2 74.1 74.6 2010 ............................................................... 25.71 26.02 26.10 26.66 74.4 74.5 74.9 74.3
2011 ............................................................... 26.32 26.37 26.42 26.63 73.9 74.0 74.0 73.6 2012 ............................................................... 27.17 26.95 26.85 27.32 73.2 73.3 72.7 72.2 2013 ............................................................... 28.28 27.40 27.12 27.12 72.0 72.0 71.7 71.4 2014 ............................................................... 27.46 27.63 27.82 29.12 70.9 70.5 70.5 71.6 2015 ............................................................... 29.56 28.77 28.97 30.23 71.3 71.8 71.7 72.3 2016 ............................................................... 29.42 28.29 28.20 28.47 72.4 72.0 72.2 72.2 2017 ............................................................... 28.32 – – – 72.6 – – –
Total benefits 2006 ............................................................... – – – 7.40 – – – 26.2 2007 ............................................................... 7.70 7.54 7.54 7.75 26.4 26.3 26.2 26.4 2008 ............................................................... 7.89 7.73 7.75 8.34 26.4 26.0 26.0 26.1 2009 ............................................................... 8.80 8.55 8.66 8.76 25.7 25.8 25.9 25.4 2010 ............................................................... 8.84 8.89 8.74 9.21 25.6 25.5 25.1 25.7
2011 ............................................................... 9.30 9.26 9.29 9.53 26.1 26.0 26.0 26.4 2012 ............................................................... 9.96 9.81 10.07 10.52 26.8 26.7 27.3 27.8 2013 ............................................................... 11.00 10.66 10.68 10.87 28.0 28.0 28.3 28.6 2014 ............................................................... 11.28 11.54 11.64 11.57 29.1 29.5 29.5 28.4 2015 ............................................................... 11.93 11.30 11.43 11.61 28.7 28.2 28.3 27.7 2016 ............................................................... 11.20 11.00 10.86 10.97 27.6 28.0 27.8 27.8 2017 ............................................................... 10.71 – – – 27.4 – – –
Paid leave 2006 ............................................................... – – – 2.05 – – – 7.3 2007 ............................................................... 2.10 2.02 2.01 2.07 7.2 7.0 7.0 7.0 2008 ............................................................... 2.08 2.06 2.05 2.24 7.0 6.9 6.9 7.0 2009 ............................................................... 2.43 2.32 2.37 2.51 7.1 7.0 7.1 7.3 2010 ............................................................... 2.52 2.53 2.52 2.58 7.3 7.2 7.2 7.2
2011 ............................................................... 2.57 2.55 2.58 2.76 7.2 7.2 7.2 7.6 2012 ............................................................... 2.88 2.82 2.83 3.00 7.8 7.7 7.7 7.9 2013 ............................................................... 3.13 2.98 2.93 2.97 8.0 7.8 7.8 7.8 2014 ............................................................... 3.08 3.11 3.14 3.15 8.0 7.9 8.0 7.7 2015 ............................................................... 3.21 3.02 3.04 3.09 7.7 7.5 7.5 7.4 2016 ............................................................... 3.01 3.06 3.00 3.02 7.4 7.8 7.7 7.7 2017 ............................................................... 2.92 – – – 7.5 – – –
Supplemental pay 2006 ............................................................... – – – .77 – – – 2.7 2007 ............................................................... .83 .84 .85 .86 2.9 2.9 3.0 2.9 2008 ............................................................... .87 .88 .88 .89 2.9 3.0 3.0 2.8 2009 ............................................................... .91 .92 .89 .72 2.7 2.8 2.7 2.1 2010 ............................................................... .67 .66 .61 .66 2.0 1.9 1.8 1.9
2011 ............................................................... .71 .71 .71 .65 2.0 2.0 2.0 1.8 2012 ............................................................... .69 .66 .70 .74 1.9 1.8 1.9 1.9 2013 ............................................................... .78 .81 .82 .93 2.0 2.1 2.2 2.5 2014 ............................................................... 1.00 1.00 1.02 1.19 2.6 2.5 2.6 2.9 2015 ............................................................... 1.26 1.28 1.32 1.47 3.0 3.2 3.3 3.5
See footnotes at end of table.
-255-

Supplemental table 22. Private professional and business services industry workers, by establishment size: employercosts per hours worked for employee compensation and costs as a percentage of total compensation, 2006-2017 --Continued
100-499 workers
Compensationcomponent
Cost per hour worked Percent of total compensation
Mar. June Sep. Dec. Mar. June Sep. Dec.
Supplemental pay 2016 ............................................................... 1.43 1.12 1.08 1.10 3.5 2.9 2.8 2.8 2017 ............................................................... 1.07 – – – 2.7 – – –
Insurance 2006 ............................................................... – – – 1.58 – – – 5.6 2007 ............................................................... 1.67 1.62 1.61 1.67 5.7 5.6 5.6 5.7 2008 ............................................................... 1.78 1.68 1.68 1.87 6.0 5.6 5.6 5.9 2009 ............................................................... 1.91 1.90 1.95 2.04 5.6 5.7 5.8 5.9 2010 ............................................................... 2.13 2.15 2.09 2.22 6.1 6.2 6.0 6.2
2011 ............................................................... 2.30 2.28 2.28 2.34 6.5 6.4 6.4 6.5 2012 ............................................................... 2.48 2.45 2.51 2.57 6.7 6.7 6.8 6.8 2013 ............................................................... 2.77 2.56 2.58 2.56 7.1 6.7 6.8 6.8 2014 ............................................................... 2.70 2.76 2.80 2.66 7.0 7.1 7.1 6.5 2015 ............................................................... 2.76 2.61 2.67 2.47 6.7 6.5 6.6 5.9 2016 ............................................................... 2.49 2.49 2.50 2.50 6.1 6.3 6.4 6.3 2017 ............................................................... 2.39 – – – 6.1 – – –
Retirement and savings 2006 ............................................................... – – – .71 – – – 2.5 2007 ............................................................... .77 .75 .76 .82 2.6 2.6 2.6 2.8 2008 ............................................................... .84 .79 .81 .91 2.8 2.7 2.7 2.8 2009 ............................................................... .94 .87 .90 .86 2.8 2.6 2.7 2.5 2010 ............................................................... .86 .86 .84 1.01 2.5 2.5 2.4 2.8
2011 ............................................................... .98 .95 .96 1.05 2.7 2.7 2.7 2.9 2012 ............................................................... 1.10 1.07 1.24 1.40 3.0 2.9 3.3 3.7 2013 ............................................................... 1.44 1.49 1.53 1.55 3.7 3.9 4.0 4.1 2014 ............................................................... 1.60 1.78 1.80 1.65 4.1 4.6 4.6 4.1 2015 ............................................................... 1.73 1.50 1.51 1.57 4.2 3.7 3.7 3.8 2016 ............................................................... 1.32 1.45 1.40 1.45 3.3 3.7 3.6 3.7 2017 ............................................................... 1.42 – – – 3.6 – – –
Legally required benefits 2006 ............................................................... – – – 2.29 – – – 8.1 2007 ............................................................... 2.34 2.31 2.31 2.34 8.0 8.0 8.0 7.9 2008 ............................................................... 2.32 2.32 2.33 2.43 7.8 7.8 7.8 7.6 2009 ............................................................... 2.60 2.54 2.56 2.63 7.6 7.7 7.7 7.6 2010 ............................................................... 2.66 2.68 2.69 2.74 7.7 7.7 7.7 7.6
2011 ............................................................... 2.74 2.76 2.76 2.75 7.7 7.7 7.7 7.6 2012 ............................................................... 2.81 2.81 2.79 2.81 7.6 7.6 7.6 7.4 2013 ............................................................... 2.89 2.83 2.83 2.85 7.4 7.4 7.5 7.5 2014 ............................................................... 2.90 2.88 2.88 2.93 7.5 7.4 7.3 7.2 2015 ............................................................... 2.97 2.90 2.90 3.01 7.2 7.2 7.2 7.2 2016 ............................................................... 2.95 2.88 2.88 2.90 7.3 7.3 7.4 7.4 2017 ............................................................... 2.90 – – – 7.4 – – –
Note: The sum of individual items may not equal totals due to rounding. Dashes indicate data are not available.
-256-
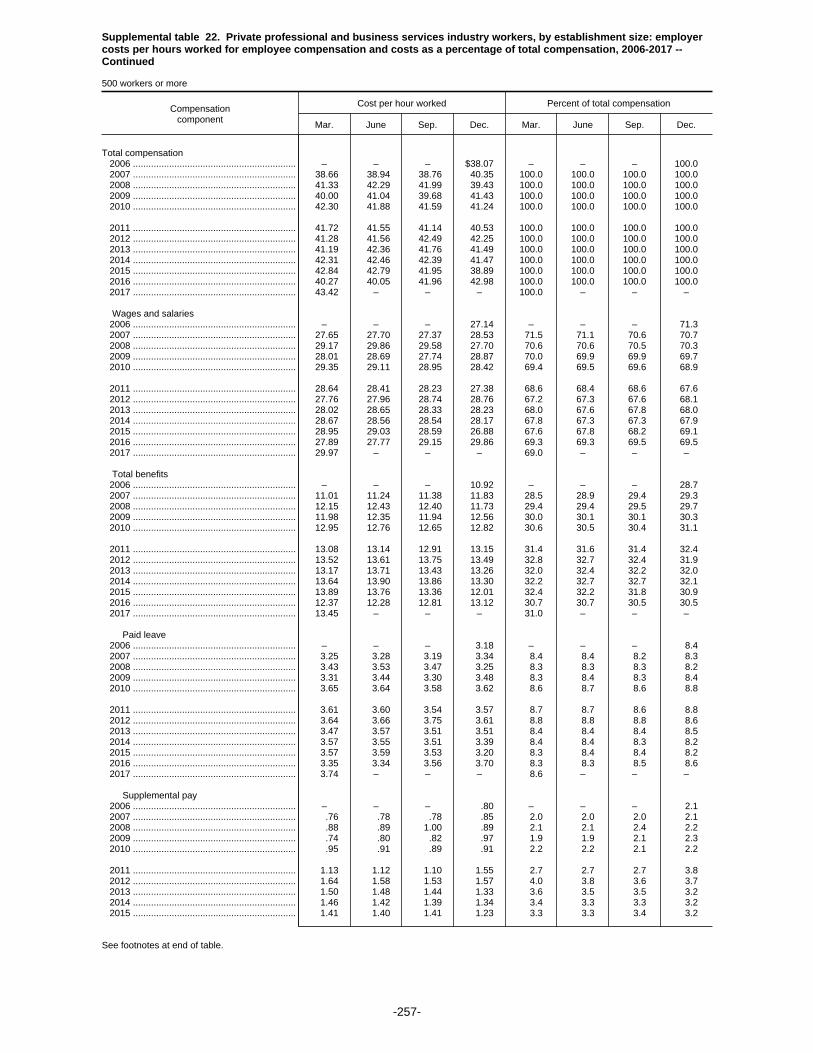
Supplemental table 22. Private professional and business services industry workers, by establishment size: employercosts per hours worked for employee compensation and costs as a percentage of total compensation, 2006-2017 --Continued
500 workers or more
Compensationcomponent
Cost per hour worked Percent of total compensation
Mar. June Sep. Dec. Mar. June Sep. Dec.
Total compensation 2006 ............................................................... – – – $38.07 – – – 100.0 2007 ............................................................... 38.66 38.94 38.76 40.35 100.0 100.0 100.0 100.0 2008 ............................................................... 41.33 42.29 41.99 39.43 100.0 100.0 100.0 100.0 2009 ............................................................... 40.00 41.04 39.68 41.43 100.0 100.0 100.0 100.0 2010 ............................................................... 42.30 41.88 41.59 41.24 100.0 100.0 100.0 100.0
2011 ............................................................... 41.72 41.55 41.14 40.53 100.0 100.0 100.0 100.0 2012 ............................................................... 41.28 41.56 42.49 42.25 100.0 100.0 100.0 100.0 2013 ............................................................... 41.19 42.36 41.76 41.49 100.0 100.0 100.0 100.0 2014 ............................................................... 42.31 42.46 42.39 41.47 100.0 100.0 100.0 100.0 2015 ............................................................... 42.84 42.79 41.95 38.89 100.0 100.0 100.0 100.0 2016 ............................................................... 40.27 40.05 41.96 42.98 100.0 100.0 100.0 100.0 2017 ............................................................... 43.42 – – – 100.0 – – –
Wages and salaries 2006 ............................................................... – – – 27.14 – – – 71.3 2007 ............................................................... 27.65 27.70 27.37 28.53 71.5 71.1 70.6 70.7 2008 ............................................................... 29.17 29.86 29.58 27.70 70.6 70.6 70.5 70.3 2009 ............................................................... 28.01 28.69 27.74 28.87 70.0 69.9 69.9 69.7 2010 ............................................................... 29.35 29.11 28.95 28.42 69.4 69.5 69.6 68.9
2011 ............................................................... 28.64 28.41 28.23 27.38 68.6 68.4 68.6 67.6 2012 ............................................................... 27.76 27.96 28.74 28.76 67.2 67.3 67.6 68.1 2013 ............................................................... 28.02 28.65 28.33 28.23 68.0 67.6 67.8 68.0 2014 ............................................................... 28.67 28.56 28.54 28.17 67.8 67.3 67.3 67.9 2015 ............................................................... 28.95 29.03 28.59 26.88 67.6 67.8 68.2 69.1 2016 ............................................................... 27.89 27.77 29.15 29.86 69.3 69.3 69.5 69.5 2017 ............................................................... 29.97 – – – 69.0 – – –
Total benefits 2006 ............................................................... – – – 10.92 – – – 28.7 2007 ............................................................... 11.01 11.24 11.38 11.83 28.5 28.9 29.4 29.3 2008 ............................................................... 12.15 12.43 12.40 11.73 29.4 29.4 29.5 29.7 2009 ............................................................... 11.98 12.35 11.94 12.56 30.0 30.1 30.1 30.3 2010 ............................................................... 12.95 12.76 12.65 12.82 30.6 30.5 30.4 31.1
2011 ............................................................... 13.08 13.14 12.91 13.15 31.4 31.6 31.4 32.4 2012 ............................................................... 13.52 13.61 13.75 13.49 32.8 32.7 32.4 31.9 2013 ............................................................... 13.17 13.71 13.43 13.26 32.0 32.4 32.2 32.0 2014 ............................................................... 13.64 13.90 13.86 13.30 32.2 32.7 32.7 32.1 2015 ............................................................... 13.89 13.76 13.36 12.01 32.4 32.2 31.8 30.9 2016 ............................................................... 12.37 12.28 12.81 13.12 30.7 30.7 30.5 30.5 2017 ............................................................... 13.45 – – – 31.0 – – –
Paid leave 2006 ............................................................... – – – 3.18 – – – 8.4 2007 ............................................................... 3.25 3.28 3.19 3.34 8.4 8.4 8.2 8.3 2008 ............................................................... 3.43 3.53 3.47 3.25 8.3 8.3 8.3 8.2 2009 ............................................................... 3.31 3.44 3.30 3.48 8.3 8.4 8.3 8.4 2010 ............................................................... 3.65 3.64 3.58 3.62 8.6 8.7 8.6 8.8
2011 ............................................................... 3.61 3.60 3.54 3.57 8.7 8.7 8.6 8.8 2012 ............................................................... 3.64 3.66 3.75 3.61 8.8 8.8 8.8 8.6 2013 ............................................................... 3.47 3.57 3.51 3.51 8.4 8.4 8.4 8.5 2014 ............................................................... 3.57 3.55 3.51 3.39 8.4 8.4 8.3 8.2 2015 ............................................................... 3.57 3.59 3.53 3.20 8.3 8.4 8.4 8.2 2016 ............................................................... 3.35 3.34 3.56 3.70 8.3 8.3 8.5 8.6 2017 ............................................................... 3.74 – – – 8.6 – – –
Supplemental pay 2006 ............................................................... – – – .80 – – – 2.1 2007 ............................................................... .76 .78 .78 .85 2.0 2.0 2.0 2.1 2008 ............................................................... .88 .89 1.00 .89 2.1 2.1 2.4 2.2 2009 ............................................................... .74 .80 .82 .97 1.9 1.9 2.1 2.3 2010 ............................................................... .95 .91 .89 .91 2.2 2.2 2.1 2.2
2011 ............................................................... 1.13 1.12 1.10 1.55 2.7 2.7 2.7 3.8 2012 ............................................................... 1.64 1.58 1.53 1.57 4.0 3.8 3.6 3.7 2013 ............................................................... 1.50 1.48 1.44 1.33 3.6 3.5 3.5 3.2 2014 ............................................................... 1.46 1.42 1.39 1.34 3.4 3.3 3.3 3.2 2015 ............................................................... 1.41 1.40 1.41 1.23 3.3 3.3 3.4 3.2
See footnotes at end of table.
-257-

Supplemental table 22. Private professional and business services industry workers, by establishment size: employercosts per hours worked for employee compensation and costs as a percentage of total compensation, 2006-2017 --Continued
500 workers or more
Compensationcomponent
Cost per hour worked Percent of total compensation
Mar. June Sep. Dec. Mar. June Sep. Dec.
Supplemental pay 2016 ............................................................... 1.23 1.24 1.31 1.35 3.1 3.1 3.1 3.1 2017 ............................................................... 1.46 – – – 3.4 – – –
Insurance 2006 ............................................................... – – – 2.48 – – – 6.5 2007 ............................................................... 2.55 2.60 2.59 2.67 6.6 6.7 6.7 6.6 2008 ............................................................... 2.72 2.78 2.78 2.80 6.6 6.6 6.6 7.1 2009 ............................................................... 2.90 2.87 2.79 2.97 7.3 7.0 7.0 7.2 2010 ............................................................... 3.07 3.09 3.06 3.26 7.3 7.4 7.4 7.9
2011 ............................................................... 3.29 3.27 3.23 3.40 7.9 7.9 7.8 8.4 2012 ............................................................... 3.45 3.52 3.50 3.25 8.4 8.5 8.2 7.7 2013 ............................................................... 3.24 3.42 3.31 3.35 7.9 8.1 7.9 8.1 2014 ............................................................... 3.44 3.39 3.40 3.24 8.1 8.0 8.0 7.8 2015 ............................................................... 3.49 3.51 3.39 2.92 8.1 8.2 8.1 7.5 2016 ............................................................... 3.05 3.00 3.09 3.16 7.6 7.5 7.4 7.4 2017 ............................................................... 3.23 – – – 7.4 – – –
Retirement and savings 2006 ............................................................... – – – 1.69 – – – 4.4 2007 ............................................................... 1.66 1.79 2.05 2.11 4.3 4.6 5.3 5.2 2008 ............................................................... 2.20 2.28 2.23 1.96 5.3 5.4 5.3 5.0 2009 ............................................................... 2.17 2.31 2.18 2.19 5.4 5.6 5.5 5.3 2010 ............................................................... 2.27 2.13 2.13 2.08 5.4 5.1 5.1 5.0
2011 ............................................................... 2.08 2.16 2.05 1.77 5.0 5.2 5.0 4.4 2012 ............................................................... 1.85 1.88 1.95 2.04 4.5 4.5 4.6 4.8 2013 ............................................................... 2.01 2.26 2.21 2.14 4.9 5.3 5.3 5.2 2014 ............................................................... 2.20 2.58 2.59 2.42 5.2 6.1 6.1 5.8 2015 ............................................................... 2.45 2.27 2.07 1.91 5.7 5.3 4.9 4.9 2016 ............................................................... 1.92 1.90 1.96 1.99 4.8 4.7 4.7 4.6 2017 ............................................................... 2.05 – – – 4.7 – – –
Legally required benefits 2006 ............................................................... – – – 2.77 – – – 7.3 2007 ............................................................... 2.79 2.79 2.77 2.85 7.2 7.2 7.1 7.1 2008 ............................................................... 2.92 2.95 2.93 2.83 7.1 7.0 7.0 7.2 2009 ............................................................... 2.87 2.93 2.86 2.95 7.2 7.1 7.2 7.1 2010 ............................................................... 3.01 2.99 2.98 2.95 7.1 7.1 7.2 7.1
2011 ............................................................... 2.98 2.99 2.98 2.86 7.1 7.2 7.3 7.1 2012 ............................................................... 2.94 2.97 3.02 3.02 7.1 7.1 7.1 7.1 2013 ............................................................... 2.94 2.98 2.96 2.92 7.1 7.0 7.1 7.0 2014 ............................................................... 2.98 2.96 2.97 2.90 7.0 7.0 7.0 7.0 2015 ............................................................... 2.97 2.99 2.94 2.75 6.9 7.0 7.0 7.1 2016 ............................................................... 2.83 2.80 2.88 2.92 7.0 7.0 6.9 6.8 2017 ............................................................... 2.98 – – – 6.9 – – –
Note: The sum of individual items may not equal totals due to rounding. Dashes indicate data are not available.
-258-

Supplemental table 23. Private education and health services industry workers, by occupational group: employer costsper hours worked for employee compensation and costs as a percentage of total compensation, 2006-2017
All workers
Compensationcomponent
Cost per hour worked Percent of total compensation
Mar. June Sep. Dec. Mar. June Sep. Dec.
Total compensation 2006 ............................................................... – – – $27.48 – – – 100.0 2007 ............................................................... 27.74 27.67 27.55 28.67 100.0 100.0 100.0 100.0 2008 ............................................................... 28.77 28.75 29.18 29.28 100.0 100.0 100.0 100.0 2009 ............................................................... 29.45 29.46 29.67 29.29 100.0 100.0 100.0 100.0 2010 ............................................................... 29.75 29.63 29.94 29.72 100.0 100.0 100.0 100.0
2011 ............................................................... 30.31 30.13 29.97 30.53 100.0 100.0 100.0 100.0 2012 ............................................................... 30.67 30.88 30.84 30.51 100.0 100.0 100.0 100.0 2013 ............................................................... 30.57 30.79 30.89 30.95 100.0 100.0 100.0 100.0 2014 ............................................................... 31.81 31.96 31.69 32.70 100.0 100.0 100.0 100.0 2015 ............................................................... 32.86 32.58 32.73 32.83 100.0 100.0 100.0 100.0 2016 ............................................................... 33.27 34.09 33.25 34.92 100.0 100.0 100.0 100.0 2017 ............................................................... 35.00 – – – 100.0 – – –
Wages and salaries 2006 ............................................................... – – – 19.85 – – – 72.2 2007 ............................................................... 20.02 19.99 19.84 20.66 72.2 72.3 72.0 72.1 2008 ............................................................... 20.73 20.71 21.02 21.07 72.0 72.0 72.0 72.0 2009 ............................................................... 21.17 21.16 21.31 20.98 71.9 71.8 71.8 71.6 2010 ............................................................... 21.35 21.27 21.49 21.29 71.8 71.8 71.8 71.6
2011 ............................................................... 21.69 21.56 21.48 21.82 71.5 71.6 71.7 71.5 2012 ............................................................... 21.89 22.02 21.95 21.85 71.4 71.3 71.2 71.6 2013 ............................................................... 21.85 22.01 22.09 22.02 71.5 71.5 71.5 71.1 2014 ............................................................... 22.54 22.64 22.49 23.14 70.9 70.8 71.0 70.8 2015 ............................................................... 23.25 23.03 23.16 23.15 70.7 70.7 70.7 70.5 2016 ............................................................... 23.47 23.99 23.49 24.56 70.5 70.4 70.6 70.3 2017 ............................................................... 24.59 – – – 70.2 – – –
Total benefits 2006 ............................................................... – – – 7.63 – – – 27.8 2007 ............................................................... 7.72 7.68 7.71 8.01 27.8 27.7 28.0 27.9 2008 ............................................................... 8.04 8.04 8.16 8.21 28.0 28.0 28.0 28.0 2009 ............................................................... 8.28 8.30 8.37 8.31 28.1 28.2 28.2 28.4 2010 ............................................................... 8.40 8.36 8.46 8.43 28.2 28.2 28.2 28.4
2011 ............................................................... 8.63 8.57 8.49 8.71 28.5 28.4 28.3 28.5 2012 ............................................................... 8.78 8.86 8.89 8.66 28.6 28.7 28.8 28.4 2013 ............................................................... 8.72 8.77 8.80 8.93 28.5 28.5 28.5 28.9 2014 ............................................................... 9.27 9.32 9.20 9.56 29.1 29.2 29.0 29.2 2015 ............................................................... 9.61 9.55 9.58 9.68 29.3 29.3 29.3 29.5 2016 ............................................................... 9.80 10.10 9.76 10.36 29.5 29.6 29.4 29.7 2017 ............................................................... 10.42 – – – 29.8 – – –
Paid leave 2006 ............................................................... – – – 2.10 – – – 7.6 2007 ............................................................... 2.13 2.12 2.11 2.16 7.7 7.7 7.7 7.5 2008 ............................................................... 2.14 2.13 2.17 2.22 7.4 7.4 7.5 7.6 2009 ............................................................... 2.21 2.23 2.25 2.23 7.5 7.6 7.6 7.6 2010 ............................................................... 2.23 2.21 2.24 2.25 7.5 7.5 7.5 7.6
2011 ............................................................... 2.32 2.29 2.25 2.36 7.6 7.6 7.5 7.7 2012 ............................................................... 2.33 2.37 2.38 2.30 7.6 7.7 7.7 7.5 2013 ............................................................... 2.32 2.36 2.37 2.38 7.6 7.7 7.7 7.7 2014 ............................................................... 2.47 2.48 2.45 2.51 7.8 7.8 7.7 7.7 2015 ............................................................... 2.51 2.49 2.50 2.54 7.7 7.6 7.7 7.8 2016 ............................................................... 2.57 2.66 2.57 2.73 7.7 7.8 7.7 7.8 2017 ............................................................... 2.74 – – – 7.8 – – –
Supplemental pay 2006 ............................................................... – – – .54 – – – 2.0 2007 ............................................................... .55 .55 .55 .55 2.0 2.0 2.0 1.9 2008 ............................................................... .55 .56 .56 .56 1.9 1.9 1.9 1.9 2009 ............................................................... .57 .59 .59 .57 1.9 2.0 2.0 2.0 2010 ............................................................... .57 .57 .57 .56 1.9 1.9 1.9 1.9
2011 ............................................................... .58 .57 .57 .56 1.9 1.9 1.9 1.8 2012 ............................................................... .58 .57 .57 .57 1.9 1.9 1.9 1.9 2013 ............................................................... .55 .57 .57 .58 1.8 1.8 1.8 1.9 2014 ............................................................... .58 .60 .59 .59 1.8 1.9 1.9 1.8 2015 ............................................................... .59 .60 .61 .64 1.8 1.9 1.8 2.0 2016 ............................................................... .63 .62 .64 .63 1.9 1.8 1.9 1.8
See footnotes at end of table.
-259-

Supplemental table 23. Private education and health services industry workers, by occupational group: employer costsper hours worked for employee compensation and costs as a percentage of total compensation, 2006-2017
All workers
Compensationcomponent
Cost per hour worked Percent of total compensation
Mar. June Sep. Dec. Mar. June Sep. Dec.
Supplemental pay 2017 ............................................................... 0.64 – – – 1.8 – – –
Insurance 2006 ............................................................... – – – 2.03 – – – 7.4 2007 ............................................................... 2.09 2.06 2.07 2.13 7.5 7.5 7.5 7.4 2008 ............................................................... 2.18 2.18 2.20 2.25 7.6 7.6 7.6 7.7 2009 ............................................................... 2.31 2.30 2.32 2.31 7.8 7.8 7.8 7.9 2010 ............................................................... 2.37 2.37 2.39 2.35 8.0 8.0 8.0 7.9
2011 ............................................................... 2.38 2.37 2.37 2.46 7.8 7.9 7.9 8.1 2012 ............................................................... 2.54 2.57 2.60 2.46 8.3 8.3 8.4 8.1 2013 ............................................................... 2.51 2.51 2.51 2.62 8.2 8.1 8.1 8.5 2014 ............................................................... 2.68 2.70 2.69 2.82 8.4 8.4 8.5 8.6 2015 ............................................................... 2.87 2.86 2.85 2.85 8.7 8.8 8.7 8.7 2016 ............................................................... 2.92 2.94 2.90 3.02 8.8 8.6 8.7 8.6 2017 ............................................................... 3.03 – – – 8.6 – – –
Retirement and savings 2006 ............................................................... – – – .76 – – – 2.8 2007 ............................................................... .76 .74 .78 .93 2.7 2.7 2.8 3.3 2008 ............................................................... .94 .92 .96 .93 3.3 3.2 3.3 3.2 2009 ............................................................... .93 .91 .93 .93 3.2 3.1 3.1 3.2 2010 ............................................................... .94 .92 .96 .98 3.2 3.1 3.2 3.3
2011 ............................................................... 1.03 1.01 .97 .99 3.4 3.3 3.2 3.2 2012 ............................................................... .97 .98 .98 .96 3.2 3.2 3.2 3.1 2013 ............................................................... .97 .96 .97 .97 3.2 3.1 3.1 3.1 2014 ............................................................... 1.15 1.14 1.07 1.19 3.6 3.6 3.4 3.6 2015 ............................................................... 1.19 1.17 1.16 1.17 3.6 3.6 3.5 3.5 2016 ............................................................... 1.18 1.38 1.19 1.45 3.5 4.1 3.6 4.1 2017 ............................................................... 1.47 – – – 4.2 – – –
Legally required benefits 2006 ............................................................... – – – 2.19 – – – 8.0 2007 ............................................................... 2.19 2.20 2.20 2.23 7.9 7.9 8.0 7.8 2008 ............................................................... 2.23 2.24 2.26 2.25 7.8 7.8 7.7 7.7 2009 ............................................................... 2.26 2.27 2.28 2.26 7.7 7.7 7.7 7.7 2010 ............................................................... 2.28 2.28 2.31 2.29 7.7 7.7 7.7 7.7
2011 ............................................................... 2.32 2.32 2.33 2.34 7.7 7.7 7.8 7.7 2012 ............................................................... 2.36 2.37 2.36 2.37 7.7 7.7 7.7 7.8 2013 ............................................................... 2.37 2.38 2.39 2.38 7.8 7.7 7.7 7.7 2014 ............................................................... 2.40 2.40 2.39 2.45 7.5 7.5 7.5 7.5 2015 ............................................................... 2.45 2.44 2.46 2.47 7.5 7.5 7.5 7.5 2016 ............................................................... 2.49 2.49 2.47 2.53 7.5 7.3 7.4 7.2 2017 ............................................................... 2.54 – – – 7.3 – – –
Note: The sum of individual items may not equal totals due to rounding. Dashes indicate data are not available.
-260-

Supplemental table 23. Private education and health services industry workers, by occupational group: employer costsper hours worked for employee compensation and costs as a percentage of total compensation, 2006-2017 -- Continued
Management, professional, and related occupations1
Compensationcomponent
Cost per hour worked Percent of total compensation
Mar. June Sep. Dec. Mar. June Sep. Dec.
Total compensation 2006 ............................................................... – – – $38.60 – – – 100.0 2007 ............................................................... 39.05 39.04 38.58 40.31 100.0 100.0 100.0 100.0 2008 ............................................................... 40.43 40.58 41.07 41.08 100.0 100.0 100.0 100.0 2009 ............................................................... 41.43 41.36 41.61 40.78 100.0 100.0 100.0 100.0 2010 ............................................................... 41.54 41.49 41.99 41.88 100.0 100.0 100.0 100.0
2011 ............................................................... 42.91 42.65 42.30 42.46 100.0 100.0 100.0 100.0 2012 ............................................................... 42.72 43.12 43.17 42.66 100.0 100.0 100.0 100.0 2013 ............................................................... 42.60 42.76 43.19 42.23 100.0 100.0 100.0 100.0 2014 ............................................................... 43.84 44.01 43.53 44.94 100.0 100.0 100.0 100.0 2015 ............................................................... 44.83 44.55 44.77 44.66 100.0 100.0 100.0 100.0 2016 ............................................................... 45.30 46.72 45.08 47.64 100.0 100.0 100.0 100.0 2017 ............................................................... 47.85 – – – 100.0 – – –
Wages and salaries 2006 ............................................................... – – – 28.21 – – – 73.1 2007 ............................................................... 28.51 28.52 28.01 29.36 73.0 73.1 72.6 72.9 2008 ............................................................... 29.46 29.55 29.90 29.84 72.9 72.8 72.8 72.6 2009 ............................................................... 30.08 29.99 30.15 29.42 72.6 72.5 72.4 72.1 2010 ............................................................... 30.07 30.05 30.38 30.19 72.4 72.4 72.4 72.1
2011 ............................................................... 30.89 30.72 30.55 30.45 72.0 72.0 72.2 71.7 2012 ............................................................... 30.62 30.87 30.83 30.61 71.7 71.6 71.4 71.8 2013 ............................................................... 30.51 30.63 30.94 30.12 71.6 71.6 71.6 71.3 2014 ............................................................... 31.08 31.21 30.95 31.81 70.9 70.9 71.1 70.8 2015 ............................................................... 31.74 31.50 31.68 31.49 70.8 70.7 70.8 70.5 2016 ............................................................... 31.95 32.81 31.81 33.47 70.5 70.2 70.6 70.3 2017 ............................................................... 33.57 – – – 70.2 – – –
Total benefits 2006 ............................................................... – – – 10.39 – – – 26.9 2007 ............................................................... 10.54 10.52 10.57 10.94 27.0 26.9 27.4 27.1 2008 ............................................................... 10.97 11.03 11.17 11.25 27.1 27.2 27.2 27.4 2009 ............................................................... 11.35 11.37 11.47 11.36 27.4 27.5 27.6 27.9 2010 ............................................................... 11.47 11.43 11.60 11.68 27.6 27.6 27.6 27.9
2011 ............................................................... 12.02 11.93 11.75 12.01 28.0 28.0 27.8 28.3 2012 ............................................................... 12.10 12.25 12.34 12.05 28.3 28.4 28.6 28.2 2013 ............................................................... 12.09 12.13 12.25 12.11 28.4 28.4 28.4 28.7 2014 ............................................................... 12.76 12.80 12.58 13.13 29.1 29.1 28.9 29.2 2015 ............................................................... 13.09 13.06 13.09 13.17 29.2 29.3 29.2 29.5 2016 ............................................................... 13.35 13.91 13.27 14.16 29.5 29.8 29.4 29.7 2017 ............................................................... 14.28 – – – 29.8 – – –
Paid leave 2006 ............................................................... – – – 3.09 – – – 8.0 2007 ............................................................... 3.14 3.14 3.13 3.17 8.1 8.0 8.1 7.9 2008 ............................................................... 3.12 3.15 3.20 3.26 7.7 7.8 7.8 7.9 2009 ............................................................... 3.26 3.29 3.32 3.29 7.9 7.9 8.0 8.1 2010 ............................................................... 3.29 3.26 3.31 3.37 7.9 7.9 7.9 8.1
2011 ............................................................... 3.49 3.46 3.35 3.48 8.1 8.1 7.9 8.2 2012 ............................................................... 3.43 3.53 3.55 3.44 8.0 8.2 8.2 8.1 2013 ............................................................... 3.47 3.50 3.54 3.46 8.1 8.2 8.2 8.2 2014 ............................................................... 3.64 3.65 3.59 3.66 8.3 8.3 8.3 8.1 2015 ............................................................... 3.63 3.61 3.63 3.67 8.1 8.1 8.1 8.2 2016 ............................................................... 3.71 3.88 3.70 3.96 8.2 8.3 8.2 8.3 2017 ............................................................... 3.99 – – – 8.3 – – –
Supplemental pay 2006 ............................................................... – – – .76 – – – 2.0 2007 ............................................................... .77 .78 .78 .76 2.0 2.0 2.0 1.9 2008 ............................................................... .77 .78 .78 .78 1.9 1.9 1.9 1.9 2009 ............................................................... .80 .84 .84 .80 1.9 2.0 2.0 2.0 2010 ............................................................... .80 .81 .80 .77 1.9 1.9 1.9 1.8
2011 ............................................................... .80 .80 .80 .76 1.9 1.9 1.9 1.8 2012 ............................................................... .78 .77 .78 .77 1.8 1.8 1.8 1.8 2013 ............................................................... .74 .77 .77 .77 1.7 1.8 1.8 1.8 2014 ............................................................... .76 .79 .78 .79 1.7 1.8 1.8 1.8 2015 ............................................................... .77 .80 .80 .87 1.7 1.8 1.8 2.0 2016 ............................................................... .85 .84 .86 .85 1.9 1.8 1.9 1.8
See footnotes at end of table.
-261-

Supplemental table 23. Private education and health services industry workers, by occupational group: employer costsper hours worked for employee compensation and costs as a percentage of total compensation, 2006-2017 -- Continued
Management, professional, and related occupations1
Compensationcomponent
Cost per hour worked Percent of total compensation
Mar. June Sep. Dec. Mar. June Sep. Dec.
Supplemental pay 2017 ............................................................... 0.85 – – – 1.8 – – –
Insurance 2006 ............................................................... – – – 2.46 – – – 6.4 2007 ............................................................... 2.53 2.50 2.53 2.59 6.5 6.4 6.6 6.4 2008 ............................................................... 2.64 2.66 2.68 2.77 6.5 6.6 6.5 6.8 2009 ............................................................... 2.83 2.82 2.84 2.86 6.8 6.8 6.8 7.0 2010 ............................................................... 2.92 2.92 2.96 2.99 7.0 7.0 7.0 7.1
2011 ............................................................... 3.04 3.02 3.01 3.14 7.1 7.1 7.1 7.4 2012 ............................................................... 3.26 3.30 3.36 3.22 7.6 7.7 7.8 7.6 2013 ............................................................... 3.27 3.26 3.27 3.34 7.7 7.6 7.6 7.9 2014 ............................................................... 3.44 3.45 3.44 3.63 7.8 7.8 7.9 8.1 2015 ............................................................... 3.66 3.66 3.67 3.67 8.2 8.2 8.2 8.2 2016 ............................................................... 3.78 3.80 3.73 3.83 8.3 8.1 8.3 8.0 2017 ............................................................... 3.84 – – – 8.0 – – –
Retirement and savings 2006 ............................................................... – – – 1.16 – – – 3.0 2007 ............................................................... 1.16 1.14 1.19 1.44 3.0 2.9 3.1 3.6 2008 ............................................................... 1.45 1.43 1.47 1.41 3.6 3.5 3.6 3.4 2009 ............................................................... 1.42 1.38 1.41 1.41 3.4 3.3 3.4 3.4 2010 ............................................................... 1.43 1.41 1.46 1.50 3.4 3.4 3.5 3.6
2011 ............................................................... 1.59 1.57 1.50 1.58 3.7 3.7 3.5 3.7 2012 ............................................................... 1.56 1.56 1.57 1.53 3.6 3.6 3.6 3.6 2013 ............................................................... 1.54 1.51 1.55 1.50 3.6 3.5 3.6 3.6 2014 ............................................................... 1.84 1.82 1.69 1.89 4.2 4.1 3.9 4.2 2015 ............................................................... 1.89 1.86 1.84 1.80 4.2 4.2 4.1 4.0 2016 ............................................................... 1.82 2.21 1.83 2.30 4.0 4.7 4.1 4.8 2017 ............................................................... 2.34 – – – 4.9 – – –
Legally required benefits 2006 ............................................................... – – – 2.93 – – – 7.6 2007 ............................................................... 2.94 2.95 2.95 2.99 7.5 7.6 7.6 7.4 2008 ............................................................... 2.99 3.01 3.04 3.02 7.4 7.4 7.4 7.4 2009 ............................................................... 3.04 3.04 3.06 3.01 7.3 7.4 7.4 7.4 2010 ............................................................... 3.03 3.03 3.07 3.05 7.3 7.3 7.3 7.3
2011 ............................................................... 3.10 3.09 3.09 3.05 7.2 7.2 7.3 7.2 2012 ............................................................... 3.08 3.08 3.08 3.09 7.2 7.2 7.1 7.2 2013 ............................................................... 3.07 3.08 3.12 3.04 7.2 7.2 7.2 7.2 2014 ............................................................... 3.08 3.09 3.08 3.15 7.0 7.0 7.1 7.0 2015 ............................................................... 3.14 3.12 3.15 3.16 7.0 7.0 7.0 7.1 2016 ............................................................... 3.19 3.18 3.14 3.22 7.0 6.8 7.0 6.8 2017 ............................................................... 3.26 – – – 6.8 – – –
1 Estimates from December 2013 to March 2014 for this series were corrected, details are available atwww.bls.gov/bls/ecec_correction_091014.htm.
Note: The sum of individual items may not equal totals due to rounding. Dashes indicate data are not available.
-262-
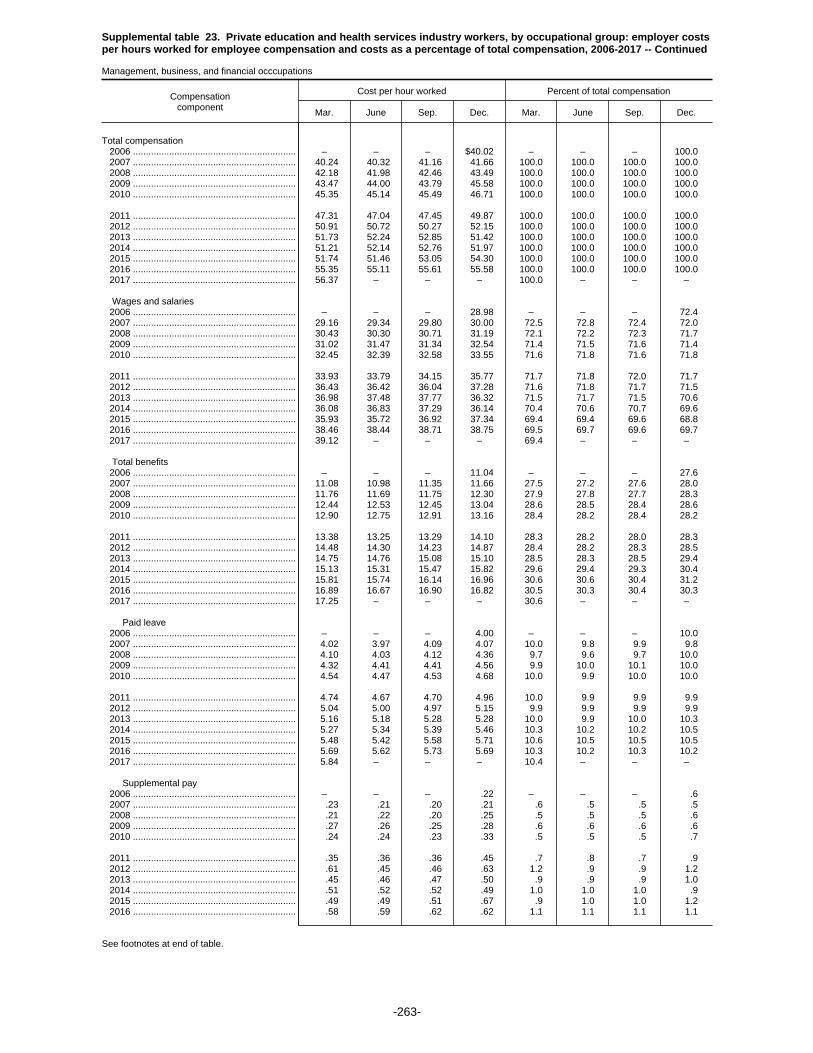
Supplemental table 23. Private education and health services industry workers, by occupational group: employer costsper hours worked for employee compensation and costs as a percentage of total compensation, 2006-2017 -- Continued
Management, business, and financial occcupations
Compensationcomponent
Cost per hour worked Percent of total compensation
Mar. June Sep. Dec. Mar. June Sep. Dec.
Total compensation 2006 ............................................................... – – – $40.02 – – – 100.0 2007 ............................................................... 40.24 40.32 41.16 41.66 100.0 100.0 100.0 100.0 2008 ............................................................... 42.18 41.98 42.46 43.49 100.0 100.0 100.0 100.0 2009 ............................................................... 43.47 44.00 43.79 45.58 100.0 100.0 100.0 100.0 2010 ............................................................... 45.35 45.14 45.49 46.71 100.0 100.0 100.0 100.0
2011 ............................................................... 47.31 47.04 47.45 49.87 100.0 100.0 100.0 100.0 2012 ............................................................... 50.91 50.72 50.27 52.15 100.0 100.0 100.0 100.0 2013 ............................................................... 51.73 52.24 52.85 51.42 100.0 100.0 100.0 100.0 2014 ............................................................... 51.21 52.14 52.76 51.97 100.0 100.0 100.0 100.0 2015 ............................................................... 51.74 51.46 53.05 54.30 100.0 100.0 100.0 100.0 2016 ............................................................... 55.35 55.11 55.61 55.58 100.0 100.0 100.0 100.0 2017 ............................................................... 56.37 – – – 100.0 – – –
Wages and salaries 2006 ............................................................... – – – 28.98 – – – 72.4 2007 ............................................................... 29.16 29.34 29.80 30.00 72.5 72.8 72.4 72.0 2008 ............................................................... 30.43 30.30 30.71 31.19 72.1 72.2 72.3 71.7 2009 ............................................................... 31.02 31.47 31.34 32.54 71.4 71.5 71.6 71.4 2010 ............................................................... 32.45 32.39 32.58 33.55 71.6 71.8 71.6 71.8
2011 ............................................................... 33.93 33.79 34.15 35.77 71.7 71.8 72.0 71.7 2012 ............................................................... 36.43 36.42 36.04 37.28 71.6 71.8 71.7 71.5 2013 ............................................................... 36.98 37.48 37.77 36.32 71.5 71.7 71.5 70.6 2014 ............................................................... 36.08 36.83 37.29 36.14 70.4 70.6 70.7 69.6 2015 ............................................................... 35.93 35.72 36.92 37.34 69.4 69.4 69.6 68.8 2016 ............................................................... 38.46 38.44 38.71 38.75 69.5 69.7 69.6 69.7 2017 ............................................................... 39.12 – – – 69.4 – – –
Total benefits 2006 ............................................................... – – – 11.04 – – – 27.6 2007 ............................................................... 11.08 10.98 11.35 11.66 27.5 27.2 27.6 28.0 2008 ............................................................... 11.76 11.69 11.75 12.30 27.9 27.8 27.7 28.3 2009 ............................................................... 12.44 12.53 12.45 13.04 28.6 28.5 28.4 28.6 2010 ............................................................... 12.90 12.75 12.91 13.16 28.4 28.2 28.4 28.2
2011 ............................................................... 13.38 13.25 13.29 14.10 28.3 28.2 28.0 28.3 2012 ............................................................... 14.48 14.30 14.23 14.87 28.4 28.2 28.3 28.5 2013 ............................................................... 14.75 14.76 15.08 15.10 28.5 28.3 28.5 29.4 2014 ............................................................... 15.13 15.31 15.47 15.82 29.6 29.4 29.3 30.4 2015 ............................................................... 15.81 15.74 16.14 16.96 30.6 30.6 30.4 31.2 2016 ............................................................... 16.89 16.67 16.90 16.82 30.5 30.3 30.4 30.3 2017 ............................................................... 17.25 – – – 30.6 – – –
Paid leave 2006 ............................................................... – – – 4.00 – – – 10.0 2007 ............................................................... 4.02 3.97 4.09 4.07 10.0 9.8 9.9 9.8 2008 ............................................................... 4.10 4.03 4.12 4.36 9.7 9.6 9.7 10.0 2009 ............................................................... 4.32 4.41 4.41 4.56 9.9 10.0 10.1 10.0 2010 ............................................................... 4.54 4.47 4.53 4.68 10.0 9.9 10.0 10.0
2011 ............................................................... 4.74 4.67 4.70 4.96 10.0 9.9 9.9 9.9 2012 ............................................................... 5.04 5.00 4.97 5.15 9.9 9.9 9.9 9.9 2013 ............................................................... 5.16 5.18 5.28 5.28 10.0 9.9 10.0 10.3 2014 ............................................................... 5.27 5.34 5.39 5.46 10.3 10.2 10.2 10.5 2015 ............................................................... 5.48 5.42 5.58 5.71 10.6 10.5 10.5 10.5 2016 ............................................................... 5.69 5.62 5.73 5.69 10.3 10.2 10.3 10.2 2017 ............................................................... 5.84 – – – 10.4 – – –
Supplemental pay 2006 ............................................................... – – – .22 – – – .6 2007 ............................................................... .23 .21 .20 .21 .6 .5 .5 .5 2008 ............................................................... .21 .22 .20 .25 .5 .5 .5 .6 2009 ............................................................... .27 .26 .25 .28 .6 .6 .6 .6 2010 ............................................................... .24 .24 .23 .33 .5 .5 .5 .7
2011 ............................................................... .35 .36 .36 .45 .7 .8 .7 .9 2012 ............................................................... .61 .45 .46 .63 1.2 .9 .9 1.2 2013 ............................................................... .45 .46 .47 .50 .9 .9 .9 1.0 2014 ............................................................... .51 .52 .52 .49 1.0 1.0 1.0 .9 2015 ............................................................... .49 .49 .51 .67 .9 1.0 1.0 1.2 2016 ............................................................... .58 .59 .62 .62 1.1 1.1 1.1 1.1
See footnotes at end of table.
-263-
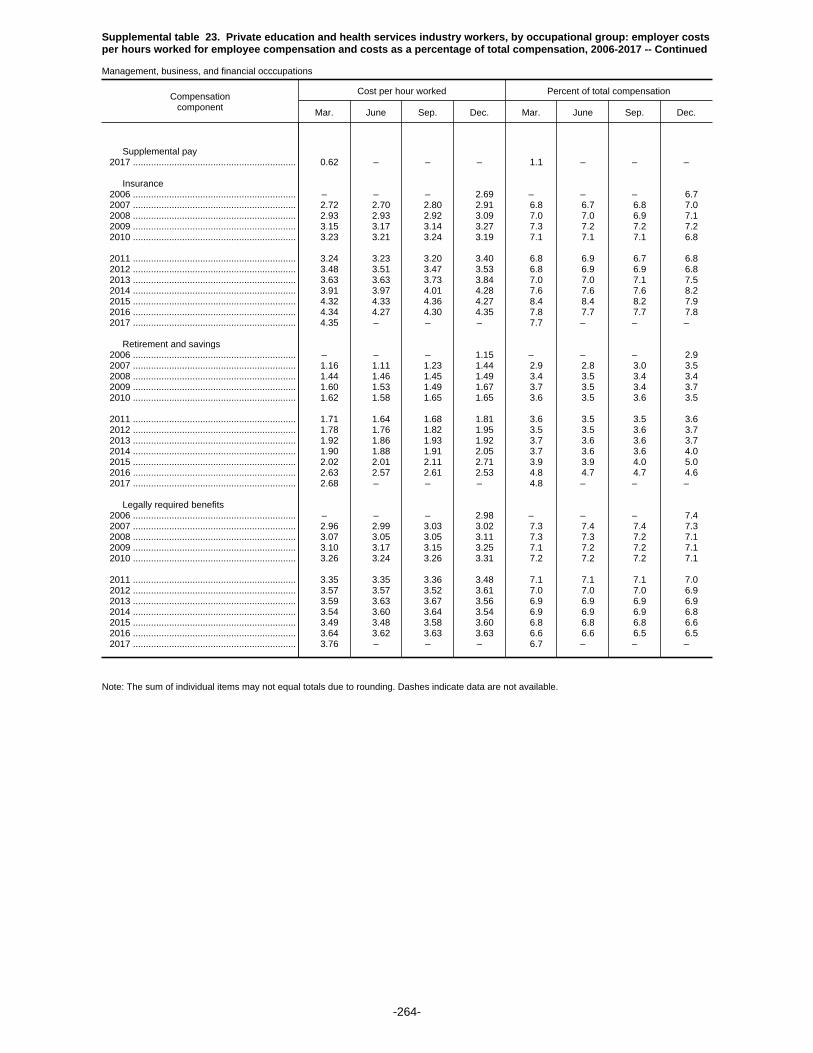
Supplemental table 23. Private education and health services industry workers, by occupational group: employer costsper hours worked for employee compensation and costs as a percentage of total compensation, 2006-2017 -- Continued
Management, business, and financial occcupations
Compensationcomponent
Cost per hour worked Percent of total compensation
Mar. June Sep. Dec. Mar. June Sep. Dec.
Supplemental pay 2017 ............................................................... 0.62 – – – 1.1 – – –
Insurance 2006 ............................................................... – – – 2.69 – – – 6.7 2007 ............................................................... 2.72 2.70 2.80 2.91 6.8 6.7 6.8 7.0 2008 ............................................................... 2.93 2.93 2.92 3.09 7.0 7.0 6.9 7.1 2009 ............................................................... 3.15 3.17 3.14 3.27 7.3 7.2 7.2 7.2 2010 ............................................................... 3.23 3.21 3.24 3.19 7.1 7.1 7.1 6.8
2011 ............................................................... 3.24 3.23 3.20 3.40 6.8 6.9 6.7 6.8 2012 ............................................................... 3.48 3.51 3.47 3.53 6.8 6.9 6.9 6.8 2013 ............................................................... 3.63 3.63 3.73 3.84 7.0 7.0 7.1 7.5 2014 ............................................................... 3.91 3.97 4.01 4.28 7.6 7.6 7.6 8.2 2015 ............................................................... 4.32 4.33 4.36 4.27 8.4 8.4 8.2 7.9 2016 ............................................................... 4.34 4.27 4.30 4.35 7.8 7.7 7.7 7.8 2017 ............................................................... 4.35 – – – 7.7 – – –
Retirement and savings 2006 ............................................................... – – – 1.15 – – – 2.9 2007 ............................................................... 1.16 1.11 1.23 1.44 2.9 2.8 3.0 3.5 2008 ............................................................... 1.44 1.46 1.45 1.49 3.4 3.5 3.4 3.4 2009 ............................................................... 1.60 1.53 1.49 1.67 3.7 3.5 3.4 3.7 2010 ............................................................... 1.62 1.58 1.65 1.65 3.6 3.5 3.6 3.5
2011 ............................................................... 1.71 1.64 1.68 1.81 3.6 3.5 3.5 3.6 2012 ............................................................... 1.78 1.76 1.82 1.95 3.5 3.5 3.6 3.7 2013 ............................................................... 1.92 1.86 1.93 1.92 3.7 3.6 3.6 3.7 2014 ............................................................... 1.90 1.88 1.91 2.05 3.7 3.6 3.6 4.0 2015 ............................................................... 2.02 2.01 2.11 2.71 3.9 3.9 4.0 5.0 2016 ............................................................... 2.63 2.57 2.61 2.53 4.8 4.7 4.7 4.6 2017 ............................................................... 2.68 – – – 4.8 – – –
Legally required benefits 2006 ............................................................... – – – 2.98 – – – 7.4 2007 ............................................................... 2.96 2.99 3.03 3.02 7.3 7.4 7.4 7.3 2008 ............................................................... 3.07 3.05 3.05 3.11 7.3 7.3 7.2 7.1 2009 ............................................................... 3.10 3.17 3.15 3.25 7.1 7.2 7.2 7.1 2010 ............................................................... 3.26 3.24 3.26 3.31 7.2 7.2 7.2 7.1
2011 ............................................................... 3.35 3.35 3.36 3.48 7.1 7.1 7.1 7.0 2012 ............................................................... 3.57 3.57 3.52 3.61 7.0 7.0 7.0 6.9 2013 ............................................................... 3.59 3.63 3.67 3.56 6.9 6.9 6.9 6.9 2014 ............................................................... 3.54 3.60 3.64 3.54 6.9 6.9 6.9 6.8 2015 ............................................................... 3.49 3.48 3.58 3.60 6.8 6.8 6.8 6.6 2016 ............................................................... 3.64 3.62 3.63 3.63 6.6 6.6 6.5 6.5 2017 ............................................................... 3.76 – – – 6.7 – – –
Note: The sum of individual items may not equal totals due to rounding. Dashes indicate data are not available.
-264-
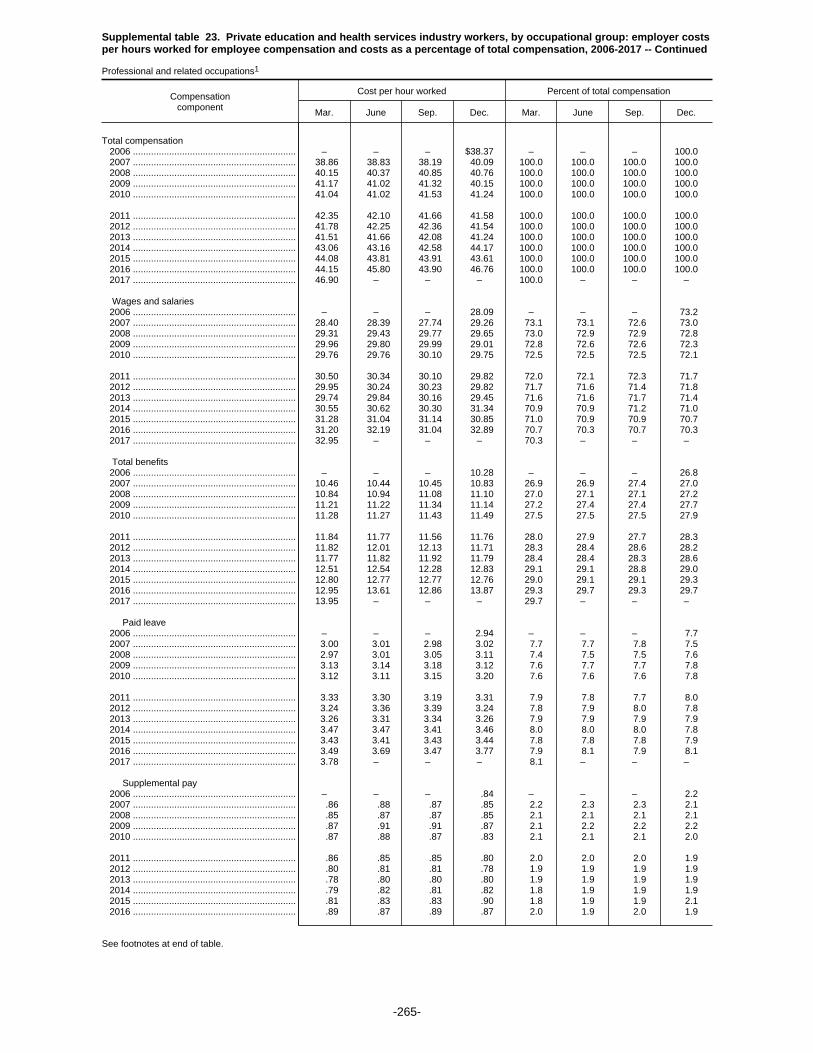
Supplemental table 23. Private education and health services industry workers, by occupational group: employer costsper hours worked for employee compensation and costs as a percentage of total compensation, 2006-2017 -- Continued
Professional and related occupations1
Compensationcomponent
Cost per hour worked Percent of total compensation
Mar. June Sep. Dec. Mar. June Sep. Dec.
Total compensation 2006 ............................................................... – – – $38.37 – – – 100.0 2007 ............................................................... 38.86 38.83 38.19 40.09 100.0 100.0 100.0 100.0 2008 ............................................................... 40.15 40.37 40.85 40.76 100.0 100.0 100.0 100.0 2009 ............................................................... 41.17 41.02 41.32 40.15 100.0 100.0 100.0 100.0 2010 ............................................................... 41.04 41.02 41.53 41.24 100.0 100.0 100.0 100.0
2011 ............................................................... 42.35 42.10 41.66 41.58 100.0 100.0 100.0 100.0 2012 ............................................................... 41.78 42.25 42.36 41.54 100.0 100.0 100.0 100.0 2013 ............................................................... 41.51 41.66 42.08 41.24 100.0 100.0 100.0 100.0 2014 ............................................................... 43.06 43.16 42.58 44.17 100.0 100.0 100.0 100.0 2015 ............................................................... 44.08 43.81 43.91 43.61 100.0 100.0 100.0 100.0 2016 ............................................................... 44.15 45.80 43.90 46.76 100.0 100.0 100.0 100.0 2017 ............................................................... 46.90 – – – 100.0 – – –
Wages and salaries 2006 ............................................................... – – – 28.09 – – – 73.2 2007 ............................................................... 28.40 28.39 27.74 29.26 73.1 73.1 72.6 73.0 2008 ............................................................... 29.31 29.43 29.77 29.65 73.0 72.9 72.9 72.8 2009 ............................................................... 29.96 29.80 29.99 29.01 72.8 72.6 72.6 72.3 2010 ............................................................... 29.76 29.76 30.10 29.75 72.5 72.5 72.5 72.1
2011 ............................................................... 30.50 30.34 30.10 29.82 72.0 72.1 72.3 71.7 2012 ............................................................... 29.95 30.24 30.23 29.82 71.7 71.6 71.4 71.8 2013 ............................................................... 29.74 29.84 30.16 29.45 71.6 71.6 71.7 71.4 2014 ............................................................... 30.55 30.62 30.30 31.34 70.9 70.9 71.2 71.0 2015 ............................................................... 31.28 31.04 31.14 30.85 71.0 70.9 70.9 70.7 2016 ............................................................... 31.20 32.19 31.04 32.89 70.7 70.3 70.7 70.3 2017 ............................................................... 32.95 – – – 70.3 – – –
Total benefits 2006 ............................................................... – – – 10.28 – – – 26.8 2007 ............................................................... 10.46 10.44 10.45 10.83 26.9 26.9 27.4 27.0 2008 ............................................................... 10.84 10.94 11.08 11.10 27.0 27.1 27.1 27.2 2009 ............................................................... 11.21 11.22 11.34 11.14 27.2 27.4 27.4 27.7 2010 ............................................................... 11.28 11.27 11.43 11.49 27.5 27.5 27.5 27.9
2011 ............................................................... 11.84 11.77 11.56 11.76 28.0 27.9 27.7 28.3 2012 ............................................................... 11.82 12.01 12.13 11.71 28.3 28.4 28.6 28.2 2013 ............................................................... 11.77 11.82 11.92 11.79 28.4 28.4 28.3 28.6 2014 ............................................................... 12.51 12.54 12.28 12.83 29.1 29.1 28.8 29.0 2015 ............................................................... 12.80 12.77 12.77 12.76 29.0 29.1 29.1 29.3 2016 ............................................................... 12.95 13.61 12.86 13.87 29.3 29.7 29.3 29.7 2017 ............................................................... 13.95 – – – 29.7 – – –
Paid leave 2006 ............................................................... – – – 2.94 – – – 7.7 2007 ............................................................... 3.00 3.01 2.98 3.02 7.7 7.7 7.8 7.5 2008 ............................................................... 2.97 3.01 3.05 3.11 7.4 7.5 7.5 7.6 2009 ............................................................... 3.13 3.14 3.18 3.12 7.6 7.7 7.7 7.8 2010 ............................................................... 3.12 3.11 3.15 3.20 7.6 7.6 7.6 7.8
2011 ............................................................... 3.33 3.30 3.19 3.31 7.9 7.8 7.7 8.0 2012 ............................................................... 3.24 3.36 3.39 3.24 7.8 7.9 8.0 7.8 2013 ............................................................... 3.26 3.31 3.34 3.26 7.9 7.9 7.9 7.9 2014 ............................................................... 3.47 3.47 3.41 3.46 8.0 8.0 8.0 7.8 2015 ............................................................... 3.43 3.41 3.43 3.44 7.8 7.8 7.8 7.9 2016 ............................................................... 3.49 3.69 3.47 3.77 7.9 8.1 7.9 8.1 2017 ............................................................... 3.78 – – – 8.1 – – –
Supplemental pay 2006 ............................................................... – – – .84 – – – 2.2 2007 ............................................................... .86 .88 .87 .85 2.2 2.3 2.3 2.1 2008 ............................................................... .85 .87 .87 .85 2.1 2.1 2.1 2.1 2009 ............................................................... .87 .91 .91 .87 2.1 2.2 2.2 2.2 2010 ............................................................... .87 .88 .87 .83 2.1 2.1 2.1 2.0
2011 ............................................................... .86 .85 .85 .80 2.0 2.0 2.0 1.9 2012 ............................................................... .80 .81 .81 .78 1.9 1.9 1.9 1.9 2013 ............................................................... .78 .80 .80 .80 1.9 1.9 1.9 1.9 2014 ............................................................... .79 .82 .81 .82 1.8 1.9 1.9 1.9 2015 ............................................................... .81 .83 .83 .90 1.8 1.9 1.9 2.1 2016 ............................................................... .89 .87 .89 .87 2.0 1.9 2.0 1.9
See footnotes at end of table.
-265-

Supplemental table 23. Private education and health services industry workers, by occupational group: employer costsper hours worked for employee compensation and costs as a percentage of total compensation, 2006-2017 -- Continued
Professional and related occupations1
Compensationcomponent
Cost per hour worked Percent of total compensation
Mar. June Sep. Dec. Mar. June Sep. Dec.
Supplemental pay 2017 ............................................................... 0.88 – – – 1.9 – – –
Insurance 2006 ............................................................... – – – 2.42 – – – 6.3 2007 ............................................................... 2.50 2.47 2.49 2.53 6.4 6.4 6.5 6.3 2008 ............................................................... 2.59 2.62 2.64 2.73 6.5 6.5 6.5 6.7 2009 ............................................................... 2.79 2.78 2.80 2.80 6.8 6.8 6.8 7.0 2010 ............................................................... 2.88 2.88 2.92 2.96 7.0 7.0 7.0 7.2
2011 ............................................................... 3.01 3.00 2.99 3.11 7.1 7.1 7.2 7.5 2012 ............................................................... 3.23 3.28 3.34 3.18 7.7 7.8 7.9 7.7 2013 ............................................................... 3.22 3.22 3.22 3.28 7.8 7.7 7.6 8.0 2014 ............................................................... 3.39 3.40 3.38 3.56 7.9 7.9 7.9 8.1 2015 ............................................................... 3.59 3.59 3.60 3.61 8.1 8.2 8.2 8.3 2016 ............................................................... 3.71 3.74 3.66 3.78 8.4 8.2 8.3 8.1 2017 ............................................................... 3.79 – – – 8.1 – – –
Retirement and savings 2006 ............................................................... – – – 1.16 – – – 3.0 2007 ............................................................... 1.16 1.14 1.18 1.44 3.0 2.9 3.1 3.6 2008 ............................................................... 1.45 1.43 1.48 1.40 3.6 3.5 3.6 3.4 2009 ............................................................... 1.40 1.37 1.40 1.37 3.4 3.3 3.4 3.4 2010 ............................................................... 1.40 1.39 1.44 1.48 3.4 3.4 3.5 3.6
2011 ............................................................... 1.58 1.56 1.47 1.55 3.7 3.7 3.5 3.7 2012 ............................................................... 1.53 1.54 1.55 1.48 3.7 3.6 3.7 3.6 2013 ............................................................... 1.49 1.47 1.50 1.46 3.6 3.5 3.6 3.5 2014 ............................................................... 1.84 1.82 1.66 1.88 4.3 4.2 3.9 4.2 2015 ............................................................... 1.87 1.85 1.81 1.70 4.2 4.2 4.1 3.9 2016 ............................................................... 1.72 2.17 1.75 2.27 3.9 4.7 4.0 4.9 2017 ............................................................... 2.30 – – – 4.9 – – –
Legally required benefits 2006 ............................................................... – – – 2.92 – – – 7.6 2007 ............................................................... 2.94 2.94 2.93 2.98 7.6 7.6 7.7 7.4 2008 ............................................................... 2.98 3.01 3.04 3.01 7.4 7.5 7.4 7.4 2009 ............................................................... 3.03 3.02 3.05 2.98 7.4 7.4 7.4 7.4 2010 ............................................................... 3.01 3.01 3.04 3.02 7.3 7.3 7.3 7.3
2011 ............................................................... 3.07 3.06 3.06 2.99 7.2 7.3 7.3 7.2 2012 ............................................................... 3.02 3.03 3.03 3.02 7.2 7.2 7.1 7.3 2013 ............................................................... 3.01 3.02 3.05 2.99 7.3 7.2 7.3 7.2 2014 ............................................................... 3.03 3.03 3.02 3.11 7.0 7.0 7.1 7.0 2015 ............................................................... 3.10 3.08 3.11 3.11 7.0 7.0 7.1 7.1 2016 ............................................................... 3.14 3.13 3.09 3.18 7.1 6.8 7.0 6.8 2017 ............................................................... 3.20 – – – 6.8 – – –
1 Estimates from December 2013 to March 2014 for this series were corrected, details are available atwww.bls.gov/bls/ecec_correction_091014.htm.
Note: The sum of individual items may not equal totals due to rounding. Dashes indicate data are not available.
-266-

Supplemental table 23. Private education and health services industry workers, by occupational group: employer costsper hours worked for employee compensation and costs as a percentage of total compensation, 2006-2017 -- Continued
Sales and office occupations
Compensationcomponent
Cost per hour worked Percent of total compensation
Mar. June Sep. Dec. Mar. June Sep. Dec.
Total compensation 2006 ............................................................... – – – $20.21 – – – 100.0 2007 ............................................................... 20.28 20.39 20.70 20.98 100.0 100.0 100.0 100.0 2008 ............................................................... 21.18 21.07 21.29 21.47 100.0 100.0 100.0 100.0 2009 ............................................................... 21.71 21.90 21.99 22.35 100.0 100.0 100.0 100.0 2010 ............................................................... 22.48 22.47 22.63 22.29 100.0 100.0 100.0 100.0
2011 ............................................................... 22.38 22.35 22.59 22.59 100.0 100.0 100.0 100.0 2012 ............................................................... 22.69 22.86 22.92 23.02 100.0 100.0 100.0 100.0 2013 ............................................................... 23.03 23.00 22.88 22.66 100.0 100.0 100.0 100.0 2014 ............................................................... 22.61 22.66 22.70 23.02 100.0 100.0 100.0 100.0 2015 ............................................................... 23.13 23.15 23.30 23.15 100.0 100.0 100.0 100.0 2016 ............................................................... 23.59 23.56 23.71 23.93 100.0 100.0 100.0 100.0 2017 ............................................................... 24.15 – – – 100.0 – – –
Wages and salaries 2006 ............................................................... – – – 14.11 – – – 69.8 2007 ............................................................... 14.15 14.29 14.57 14.68 69.8 70.1 70.4 70.0 2008 ............................................................... 14.77 14.72 14.87 15.01 69.7 69.9 69.8 69.9 2009 ............................................................... 15.09 15.24 15.31 15.55 69.5 69.6 69.6 69.6 2010 ............................................................... 15.61 15.64 15.74 15.54 69.5 69.6 69.5 69.7
2011 ............................................................... 15.59 15.60 15.77 15.84 69.7 69.8 69.8 70.1 2012 ............................................................... 15.87 15.97 15.96 16.20 70.0 69.8 69.7 70.4 2013 ............................................................... 16.14 16.15 16.05 15.80 70.1 70.2 70.2 69.7 2014 ............................................................... 15.79 15.80 15.81 16.04 69.8 69.7 69.7 69.7 2015 ............................................................... 16.06 16.10 16.23 15.96 69.4 69.5 69.7 68.9 2016 ............................................................... 16.30 16.32 16.42 16.47 69.1 69.3 69.3 68.8 2017 ............................................................... 16.59 – – – 68.7 – – –
Total benefits 2006 ............................................................... – – – 6.09 – – – 30.2 2007 ............................................................... 6.12 6.10 6.13 6.30 30.2 29.9 29.6 30.0 2008 ............................................................... 6.42 6.34 6.42 6.46 30.3 30.1 30.2 30.1 2009 ............................................................... 6.62 6.66 6.68 6.81 30.5 30.4 30.4 30.4 2010 ............................................................... 6.87 6.83 6.89 6.75 30.5 30.4 30.5 30.3
2011 ............................................................... 6.79 6.74 6.82 6.75 30.3 30.2 30.2 29.9 2012 ............................................................... 6.82 6.89 6.95 6.82 30.0 30.2 30.3 29.6 2013 ............................................................... 6.88 6.85 6.83 6.86 29.9 29.8 29.8 30.3 2014 ............................................................... 6.82 6.86 6.89 6.98 30.2 30.3 30.3 30.3 2015 ............................................................... 7.06 7.05 7.07 7.19 30.6 30.5 30.3 31.1 2016 ............................................................... 7.29 7.24 7.29 7.46 30.9 30.7 30.7 31.2 2017 ............................................................... 7.55 – – – 31.3 – – –
Paid leave 2006 ............................................................... – – – 1.58 – – – 7.8 2007 ............................................................... 1.58 1.58 1.60 1.62 7.8 7.8 7.7 7.7 2008 ............................................................... 1.65 1.60 1.62 1.64 7.8 7.6 7.6 7.6 2009 ............................................................... 1.64 1.65 1.64 1.67 7.5 7.5 7.5 7.5 2010 ............................................................... 1.66 1.63 1.66 1.63 7.4 7.3 7.3 7.3
2011 ............................................................... 1.64 1.62 1.65 1.69 7.3 7.3 7.3 7.5 2012 ............................................................... 1.69 1.70 1.69 1.70 7.4 7.4 7.4 7.4 2013 ............................................................... 1.69 1.69 1.66 1.65 7.4 7.3 7.3 7.3 2014 ............................................................... 1.64 1.64 1.65 1.70 7.3 7.2 7.3 7.4 2015 ............................................................... 1.71 1.70 1.73 1.75 7.4 7.3 7.4 7.5 2016 ............................................................... 1.77 1.76 1.77 1.79 7.5 7.5 7.5 7.5 2017 ............................................................... 1.81 – – – 7.5 – – –
Supplemental pay 2006 ............................................................... – – – .33 – – – 1.6 2007 ............................................................... .34 .33 .33 .33 1.7 1.6 1.6 1.6 2008 ............................................................... .31 .33 .33 .33 1.5 1.6 1.6 1.5 2009 ............................................................... .33 .33 .33 .34 1.5 1.5 1.5 1.5 2010 ............................................................... .34 .35 .34 .33 1.5 1.5 1.5 1.5
2011 ............................................................... .34 .34 .34 .33 1.5 1.5 1.5 1.5 2012 ............................................................... .34 .33 .31 .29 1.5 1.4 1.3 1.3 2013 ............................................................... .29 .30 .30 .31 1.2 1.3 1.3 1.4 2014 ............................................................... .30 .30 .31 .30 1.3 1.3 1.4 1.3 2015 ............................................................... .30 .30 .30 .32 1.3 1.3 1.3 1.4 2016 ............................................................... .32 .32 .32 .31 1.3 1.4 1.3 1.3
See footnotes at end of table.
-267-

Supplemental table 23. Private education and health services industry workers, by occupational group: employer costsper hours worked for employee compensation and costs as a percentage of total compensation, 2006-2017 -- Continued
Sales and office occupations
Compensationcomponent
Cost per hour worked Percent of total compensation
Mar. June Sep. Dec. Mar. June Sep. Dec.
Supplemental pay 2017 ............................................................... 0.32 – – – 1.3 – – –
Insurance 2006 ............................................................... – – – 2.00 – – – 9.9 2007 ............................................................... 2.04 2.01 1.99 2.05 10.0 9.9 9.6 9.7 2008 ............................................................... 2.12 2.09 2.11 2.16 10.0 9.9 9.9 10.1 2009 ............................................................... 2.29 2.29 2.31 2.38 10.6 10.5 10.5 10.7 2010 ............................................................... 2.46 2.43 2.43 2.27 10.9 10.8 10.7 10.2
2011 ............................................................... 2.27 2.28 2.31 2.41 10.2 10.2 10.2 10.7 2012 ............................................................... 2.46 2.50 2.58 2.41 10.8 10.9 11.2 10.5 2013 ............................................................... 2.47 2.46 2.48 2.56 10.7 10.7 10.8 11.3 2014 ............................................................... 2.55 2.58 2.58 2.64 11.3 11.4 11.4 11.5 2015 ............................................................... 2.72 2.71 2.67 2.71 11.7 11.7 11.5 11.7 2016 ............................................................... 2.76 2.75 2.76 2.95 11.7 11.7 11.6 12.3 2017 ............................................................... 2.97 – – – 12.3 – – –
Retirement and savings 2006 ............................................................... – – – .58 – – – 2.9 2007 ............................................................... .57 .56 .58 .67 2.8 2.8 2.8 3.2 2008 ............................................................... .69 .67 .69 .69 3.2 3.2 3.3 3.2 2009 ............................................................... .70 .71 .72 .72 3.2 3.2 3.3 3.2 2010 ............................................................... .71 .72 .74 .81 3.2 3.2 3.3 3.6
2011 ............................................................... .82 .77 .77 .60 3.6 3.5 3.4 2.7 2012 ............................................................... .59 .59 .61 .62 2.6 2.6 2.6 2.7 2013 ............................................................... .64 .62 .63 .61 2.8 2.7 2.7 2.7 2014 ............................................................... .60 .62 .63 .59 2.7 2.7 2.8 2.6 2015 ............................................................... .59 .58 .59 .66 2.6 2.5 2.5 2.8 2016 ............................................................... .67 .64 .67 .65 2.8 2.7 2.8 2.7 2017 ............................................................... .68 – – – 2.8 – – –
Legally required benefits 2006 ............................................................... – – – 1.61 – – – 8.0 2007 ............................................................... 1.60 1.61 1.63 1.64 7.9 7.9 7.9 7.8 2008 ............................................................... 1.64 1.65 1.66 1.65 7.7 7.8 7.8 7.7 2009 ............................................................... 1.66 1.68 1.68 1.68 7.6 7.7 7.6 7.5 2010 ............................................................... 1.69 1.70 1.72 1.71 7.5 7.6 7.6 7.7
2011 ............................................................... 1.72 1.73 1.75 1.73 7.7 7.8 7.7 7.6 2012 ............................................................... 1.75 1.78 1.77 1.80 7.7 7.8 7.7 7.8 2013 ............................................................... 1.79 1.79 1.77 1.73 7.8 7.8 7.7 7.6 2014 ............................................................... 1.72 1.72 1.72 1.75 7.6 7.6 7.6 7.6 2015 ............................................................... 1.75 1.76 1.78 1.75 7.6 7.6 7.6 7.6 2016 ............................................................... 1.78 1.77 1.77 1.77 7.5 7.5 7.5 7.4 2017 ............................................................... 1.78 – – – 7.4 – – –
Note: The sum of individual items may not equal totals due to rounding. Dashes indicate data are not available.
-268-
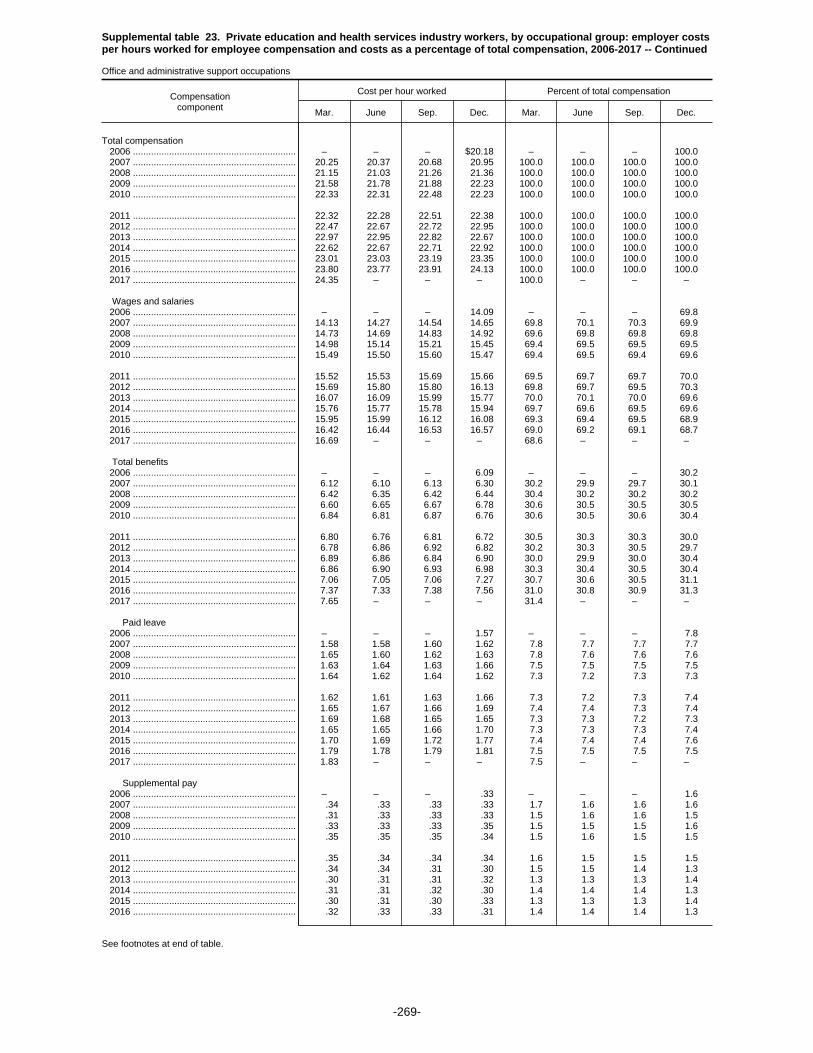
Supplemental table 23. Private education and health services industry workers, by occupational group: employer costsper hours worked for employee compensation and costs as a percentage of total compensation, 2006-2017 -- Continued
Office and administrative support occupations
Compensationcomponent
Cost per hour worked Percent of total compensation
Mar. June Sep. Dec. Mar. June Sep. Dec.
Total compensation 2006 ............................................................... – – – $20.18 – – – 100.0 2007 ............................................................... 20.25 20.37 20.68 20.95 100.0 100.0 100.0 100.0 2008 ............................................................... 21.15 21.03 21.26 21.36 100.0 100.0 100.0 100.0 2009 ............................................................... 21.58 21.78 21.88 22.23 100.0 100.0 100.0 100.0 2010 ............................................................... 22.33 22.31 22.48 22.23 100.0 100.0 100.0 100.0
2011 ............................................................... 22.32 22.28 22.51 22.38 100.0 100.0 100.0 100.0 2012 ............................................................... 22.47 22.67 22.72 22.95 100.0 100.0 100.0 100.0 2013 ............................................................... 22.97 22.95 22.82 22.67 100.0 100.0 100.0 100.0 2014 ............................................................... 22.62 22.67 22.71 22.92 100.0 100.0 100.0 100.0 2015 ............................................................... 23.01 23.03 23.19 23.35 100.0 100.0 100.0 100.0 2016 ............................................................... 23.80 23.77 23.91 24.13 100.0 100.0 100.0 100.0 2017 ............................................................... 24.35 – – – 100.0 – – –
Wages and salaries 2006 ............................................................... – – – 14.09 – – – 69.8 2007 ............................................................... 14.13 14.27 14.54 14.65 69.8 70.1 70.3 69.9 2008 ............................................................... 14.73 14.69 14.83 14.92 69.6 69.8 69.8 69.8 2009 ............................................................... 14.98 15.14 15.21 15.45 69.4 69.5 69.5 69.5 2010 ............................................................... 15.49 15.50 15.60 15.47 69.4 69.5 69.4 69.6
2011 ............................................................... 15.52 15.53 15.69 15.66 69.5 69.7 69.7 70.0 2012 ............................................................... 15.69 15.80 15.80 16.13 69.8 69.7 69.5 70.3 2013 ............................................................... 16.07 16.09 15.99 15.77 70.0 70.1 70.0 69.6 2014 ............................................................... 15.76 15.77 15.78 15.94 69.7 69.6 69.5 69.6 2015 ............................................................... 15.95 15.99 16.12 16.08 69.3 69.4 69.5 68.9 2016 ............................................................... 16.42 16.44 16.53 16.57 69.0 69.2 69.1 68.7 2017 ............................................................... 16.69 – – – 68.6 – – –
Total benefits 2006 ............................................................... – – – 6.09 – – – 30.2 2007 ............................................................... 6.12 6.10 6.13 6.30 30.2 29.9 29.7 30.1 2008 ............................................................... 6.42 6.35 6.42 6.44 30.4 30.2 30.2 30.2 2009 ............................................................... 6.60 6.65 6.67 6.78 30.6 30.5 30.5 30.5 2010 ............................................................... 6.84 6.81 6.87 6.76 30.6 30.5 30.6 30.4
2011 ............................................................... 6.80 6.76 6.81 6.72 30.5 30.3 30.3 30.0 2012 ............................................................... 6.78 6.86 6.92 6.82 30.2 30.3 30.5 29.7 2013 ............................................................... 6.89 6.86 6.84 6.90 30.0 29.9 30.0 30.4 2014 ............................................................... 6.86 6.90 6.93 6.98 30.3 30.4 30.5 30.4 2015 ............................................................... 7.06 7.05 7.06 7.27 30.7 30.6 30.5 31.1 2016 ............................................................... 7.37 7.33 7.38 7.56 31.0 30.8 30.9 31.3 2017 ............................................................... 7.65 – – – 31.4 – – –
Paid leave 2006 ............................................................... – – – 1.57 – – – 7.8 2007 ............................................................... 1.58 1.58 1.60 1.62 7.8 7.7 7.7 7.7 2008 ............................................................... 1.65 1.60 1.62 1.63 7.8 7.6 7.6 7.6 2009 ............................................................... 1.63 1.64 1.63 1.66 7.5 7.5 7.5 7.5 2010 ............................................................... 1.64 1.62 1.64 1.62 7.3 7.2 7.3 7.3
2011 ............................................................... 1.62 1.61 1.63 1.66 7.3 7.2 7.3 7.4 2012 ............................................................... 1.65 1.67 1.66 1.69 7.4 7.4 7.3 7.4 2013 ............................................................... 1.69 1.68 1.65 1.65 7.3 7.3 7.2 7.3 2014 ............................................................... 1.65 1.65 1.66 1.70 7.3 7.3 7.3 7.4 2015 ............................................................... 1.70 1.69 1.72 1.77 7.4 7.4 7.4 7.6 2016 ............................................................... 1.79 1.78 1.79 1.81 7.5 7.5 7.5 7.5 2017 ............................................................... 1.83 – – – 7.5 – – –
Supplemental pay 2006 ............................................................... – – – .33 – – – 1.6 2007 ............................................................... .34 .33 .33 .33 1.7 1.6 1.6 1.6 2008 ............................................................... .31 .33 .33 .33 1.5 1.6 1.6 1.5 2009 ............................................................... .33 .33 .33 .35 1.5 1.5 1.5 1.6 2010 ............................................................... .35 .35 .35 .34 1.5 1.6 1.5 1.5
2011 ............................................................... .35 .34 .34 .34 1.6 1.5 1.5 1.5 2012 ............................................................... .34 .34 .31 .30 1.5 1.5 1.4 1.3 2013 ............................................................... .30 .31 .31 .32 1.3 1.3 1.3 1.4 2014 ............................................................... .31 .31 .32 .30 1.4 1.4 1.4 1.3 2015 ............................................................... .30 .31 .30 .33 1.3 1.3 1.3 1.4 2016 ............................................................... .32 .33 .33 .31 1.4 1.4 1.4 1.3
See footnotes at end of table.
-269-
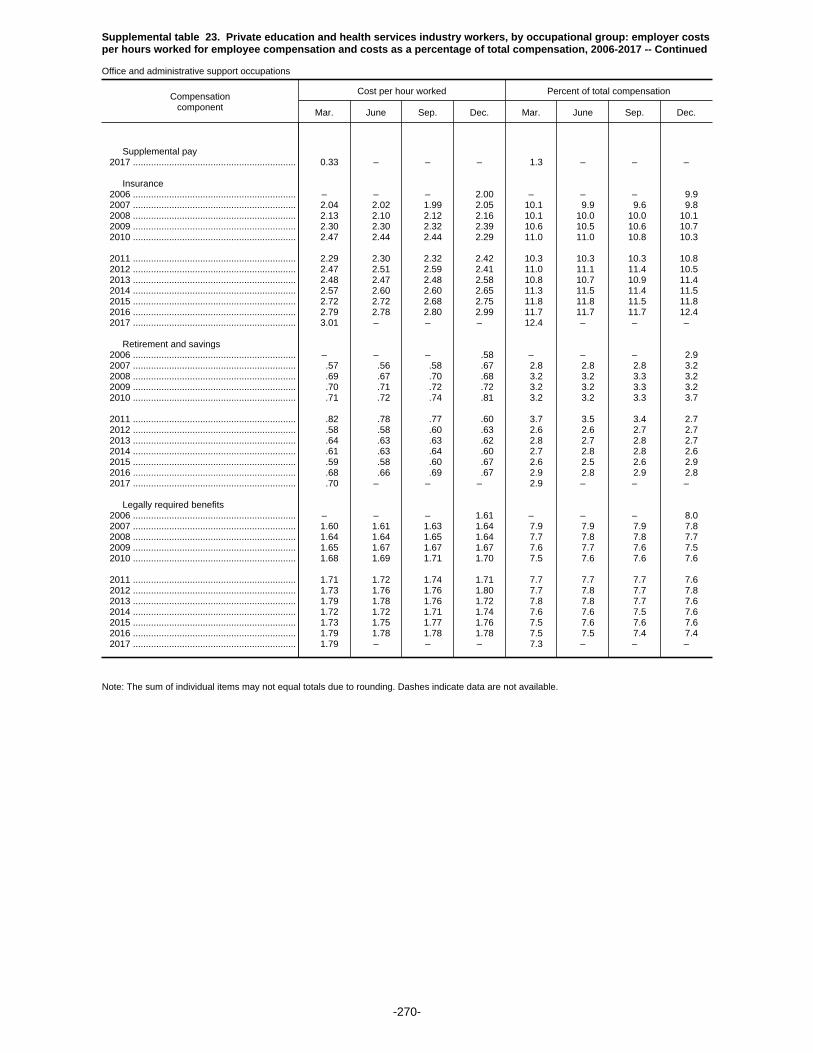
Supplemental table 23. Private education and health services industry workers, by occupational group: employer costsper hours worked for employee compensation and costs as a percentage of total compensation, 2006-2017 -- Continued
Office and administrative support occupations
Compensationcomponent
Cost per hour worked Percent of total compensation
Mar. June Sep. Dec. Mar. June Sep. Dec.
Supplemental pay 2017 ............................................................... 0.33 – – – 1.3 – – –
Insurance 2006 ............................................................... – – – 2.00 – – – 9.9 2007 ............................................................... 2.04 2.02 1.99 2.05 10.1 9.9 9.6 9.8 2008 ............................................................... 2.13 2.10 2.12 2.16 10.1 10.0 10.0 10.1 2009 ............................................................... 2.30 2.30 2.32 2.39 10.6 10.5 10.6 10.7 2010 ............................................................... 2.47 2.44 2.44 2.29 11.0 11.0 10.8 10.3
2011 ............................................................... 2.29 2.30 2.32 2.42 10.3 10.3 10.3 10.8 2012 ............................................................... 2.47 2.51 2.59 2.41 11.0 11.1 11.4 10.5 2013 ............................................................... 2.48 2.47 2.48 2.58 10.8 10.7 10.9 11.4 2014 ............................................................... 2.57 2.60 2.60 2.65 11.3 11.5 11.4 11.5 2015 ............................................................... 2.72 2.72 2.68 2.75 11.8 11.8 11.5 11.8 2016 ............................................................... 2.79 2.78 2.80 2.99 11.7 11.7 11.7 12.4 2017 ............................................................... 3.01 – – – 12.4 – – –
Retirement and savings 2006 ............................................................... – – – .58 – – – 2.9 2007 ............................................................... .57 .56 .58 .67 2.8 2.8 2.8 3.2 2008 ............................................................... .69 .67 .70 .68 3.2 3.2 3.3 3.2 2009 ............................................................... .70 .71 .72 .72 3.2 3.2 3.3 3.2 2010 ............................................................... .71 .72 .74 .81 3.2 3.2 3.3 3.7
2011 ............................................................... .82 .78 .77 .60 3.7 3.5 3.4 2.7 2012 ............................................................... .58 .58 .60 .63 2.6 2.6 2.7 2.7 2013 ............................................................... .64 .63 .63 .62 2.8 2.7 2.8 2.7 2014 ............................................................... .61 .63 .64 .60 2.7 2.8 2.8 2.6 2015 ............................................................... .59 .58 .60 .67 2.6 2.5 2.6 2.9 2016 ............................................................... .68 .66 .69 .67 2.9 2.8 2.9 2.8 2017 ............................................................... .70 – – – 2.9 – – –
Legally required benefits 2006 ............................................................... – – – 1.61 – – – 8.0 2007 ............................................................... 1.60 1.61 1.63 1.64 7.9 7.9 7.9 7.8 2008 ............................................................... 1.64 1.64 1.65 1.64 7.7 7.8 7.8 7.7 2009 ............................................................... 1.65 1.67 1.67 1.67 7.6 7.7 7.6 7.5 2010 ............................................................... 1.68 1.69 1.71 1.70 7.5 7.6 7.6 7.6
2011 ............................................................... 1.71 1.72 1.74 1.71 7.7 7.7 7.7 7.6 2012 ............................................................... 1.73 1.76 1.76 1.80 7.7 7.8 7.7 7.8 2013 ............................................................... 1.79 1.78 1.76 1.72 7.8 7.8 7.7 7.6 2014 ............................................................... 1.72 1.72 1.71 1.74 7.6 7.6 7.5 7.6 2015 ............................................................... 1.73 1.75 1.77 1.76 7.5 7.6 7.6 7.6 2016 ............................................................... 1.79 1.78 1.78 1.78 7.5 7.5 7.4 7.4 2017 ............................................................... 1.79 – – – 7.3 – – –
Note: The sum of individual items may not equal totals due to rounding. Dashes indicate data are not available.
-270-

Supplemental table 23. Private education and health services industry workers, by occupational group: employer costsper hours worked for employee compensation and costs as a percentage of total compensation, 2006-2017 -- Continued
Service occupations
Compensationcomponent
Cost per hour worked Percent of total compensation
Mar. June Sep. Dec. Mar. June Sep. Dec.
Total compensation 2006 ............................................................... – – – $15.20 – – – 100.0 2007 ............................................................... 15.31 15.44 15.49 15.78 100.0 100.0 100.0 100.0 2008 ............................................................... 15.90 16.00 16.10 16.12 100.0 100.0 100.0 100.0 2009 ............................................................... 16.24 16.27 16.39 16.20 100.0 100.0 100.0 100.0 2010 ............................................................... 16.24 16.28 16.32 16.65 100.0 100.0 100.0 100.0
2011 ............................................................... 16.75 16.79 16.84 16.97 100.0 100.0 100.0 100.0 2012 ............................................................... 17.06 17.09 17.21 16.91 100.0 100.0 100.0 100.0 2013 ............................................................... 17.13 17.30 17.28 17.48 100.0 100.0 100.0 100.0 2014 ............................................................... 17.40 17.52 17.65 18.05 100.0 100.0 100.0 100.0 2015 ............................................................... 18.11 18.04 18.22 18.56 100.0 100.0 100.0 100.0 2016 ............................................................... 18.64 18.70 18.81 19.00 100.0 100.0 100.0 100.0 2017 ............................................................... 19.13 – – – 100.0 – – –
Wages and salaries 2006 ............................................................... – – – 10.79 – – – 71.0 2007 ............................................................... 10.86 10.96 11.03 11.16 70.9 71.0 71.2 70.7 2008 ............................................................... 11.25 11.33 11.41 11.46 70.8 70.8 70.9 71.1 2009 ............................................................... 11.53 11.56 11.65 11.57 71.0 71.0 71.1 71.4 2010 ............................................................... 11.58 11.58 11.62 11.90 71.3 71.1 71.2 71.4
2011 ............................................................... 11.95 11.96 12.00 12.17 71.3 71.2 71.2 71.7 2012 ............................................................... 12.19 12.20 12.29 12.20 71.5 71.4 71.4 72.2 2013 ............................................................... 12.34 12.45 12.46 12.52 72.0 72.0 72.1 71.6 2014 ............................................................... 12.47 12.52 12.63 12.93 71.6 71.5 71.6 71.6 2015 ............................................................... 12.97 12.91 13.04 13.31 71.6 71.5 71.6 71.7 2016 ............................................................... 13.37 13.43 13.53 13.62 71.7 71.8 71.9 71.7 2017 ............................................................... 13.71 – – – 71.7 – – –
Total benefits 2006 ............................................................... – – – 4.41 – – – 29.0 2007 ............................................................... 4.45 4.48 4.47 4.62 29.1 29.0 28.8 29.3 2008 ............................................................... 4.65 4.67 4.69 4.66 29.2 29.2 29.1 28.9 2009 ............................................................... 4.72 4.71 4.73 4.63 29.0 29.0 28.9 28.6 2010 ............................................................... 4.66 4.70 4.70 4.76 28.7 28.9 28.8 28.6
2011 ............................................................... 4.80 4.83 4.84 4.80 28.7 28.8 28.8 28.3 2012 ............................................................... 4.87 4.89 4.92 4.71 28.5 28.6 28.6 27.8 2013 ............................................................... 4.79 4.84 4.82 4.96 28.0 28.0 27.9 28.4 2014 ............................................................... 4.94 5.00 5.02 5.13 28.4 28.5 28.4 28.4 2015 ............................................................... 5.14 5.14 5.18 5.25 28.4 28.5 28.4 28.3 2016 ............................................................... 5.28 5.27 5.28 5.38 28.3 28.2 28.1 28.3 2017 ............................................................... 5.42 – – – 28.3 – – –
Paid leave 2006 ............................................................... – – – .94 – – – 6.2 2007 ............................................................... .95 .96 .95 .98 6.2 6.2 6.1 6.2 2008 ............................................................... .97 .98 .98 .99 6.1 6.1 6.1 6.2 2009 ............................................................... 1.00 1.00 1.01 .98 6.2 6.2 6.2 6.1 2010 ............................................................... .98 .98 .98 1.01 6.0 6.0 6.0 6.1
2011 ............................................................... 1.02 1.01 1.02 1.02 6.1 6.0 6.1 6.0 2012 ............................................................... 1.02 1.02 1.03 .97 6.0 5.9 6.0 5.7 2013 ............................................................... .98 1.02 1.02 1.04 5.7 5.9 5.9 5.9 2014 ............................................................... 1.03 1.04 1.05 1.07 5.9 5.9 6.0 5.9 2015 ............................................................... 1.07 1.06 1.08 1.12 5.9 5.9 5.9 6.0 2016 ............................................................... 1.12 1.12 1.11 1.13 6.0 6.0 5.9 5.9 2017 ............................................................... 1.13 – – – 5.9 – – –
Supplemental pay 2006 ............................................................... – – – .34 – – – 2.2 2007 ............................................................... .35 .35 .35 .36 2.3 2.3 2.3 2.3 2008 ............................................................... .36 .36 .37 .37 2.3 2.3 2.3 2.3 2009 ............................................................... .37 .37 .37 .36 2.3 2.3 2.3 2.2 2010 ............................................................... .37 .36 .36 .38 2.3 2.2 2.2 2.3
2011 ............................................................... .39 .39 .39 .40 2.3 2.3 2.3 2.4 2012 ............................................................... .40 .40 .42 .42 2.4 2.4 2.5 2.5 2013 ............................................................... .40 .41 .41 .44 2.3 2.4 2.4 2.5 2014 ............................................................... .42 .44 .43 .43 2.4 2.5 2.4 2.4 2015 ............................................................... .43 .44 .45 .44 2.4 2.5 2.5 2.3 2016 ............................................................... .43 .43 .43 .44 2.3 2.3 2.3 2.3
See footnotes at end of table.
-271-

Supplemental table 23. Private education and health services industry workers, by occupational group: employer costsper hours worked for employee compensation and costs as a percentage of total compensation, 2006-2017 -- Continued
Service occupations
Compensationcomponent
Cost per hour worked Percent of total compensation
Mar. June Sep. Dec. Mar. June Sep. Dec.
Supplemental pay 2017 ............................................................... 0.46 – – – 2.4 – – –
Insurance 2006 ............................................................... – – – 1.43 – – – 9.4 2007 ............................................................... 1.46 1.46 1.45 1.50 9.5 9.5 9.3 9.5 2008 ............................................................... 1.53 1.55 1.55 1.52 9.7 9.7 9.6 9.4 2009 ............................................................... 1.55 1.55 1.55 1.48 9.5 9.5 9.5 9.2 2010 ............................................................... 1.52 1.56 1.55 1.49 9.3 9.6 9.5 9.0
2011 ............................................................... 1.51 1.52 1.53 1.49 9.0 9.0 9.1 8.8 2012 ............................................................... 1.53 1.54 1.52 1.40 8.9 9.0 8.8 8.3 2013 ............................................................... 1.46 1.44 1.43 1.51 8.5 8.3 8.3 8.6 2014 ............................................................... 1.53 1.57 1.57 1.60 8.8 9.0 8.9 8.9 2015 ............................................................... 1.62 1.64 1.64 1.59 9.0 9.1 9.0 8.6 2016 ............................................................... 1.63 1.64 1.64 1.69 8.7 8.8 8.7 8.9 2017 ............................................................... 1.71 – – – 8.9 – – –
Retirement and savings 2006 ............................................................... – – – .27 – – – 1.8 2007 ............................................................... .27 .27 .29 .33 1.8 1.7 1.9 2.1 2008 ............................................................... .33 .33 .34 .34 2.1 2.1 2.1 2.1 2009 ............................................................... .34 .34 .35 .34 2.1 2.1 2.1 2.1 2010 ............................................................... .33 .33 .33 .35 2.1 2.0 2.0 2.1
2011 ............................................................... .36 .36 .35 .31 2.1 2.1 2.1 1.8 2012 ............................................................... .31 .32 .32 .30 1.8 1.9 1.8 1.8 2013 ............................................................... .32 .33 .30 .32 1.9 1.9 1.8 1.8 2014 ............................................................... .32 .32 .33 .36 1.8 1.8 1.9 2.0 2015 ............................................................... .35 .35 .35 .39 1.9 1.9 1.9 2.1 2016 ............................................................... .39 .39 .39 .41 2.1 2.1 2.1 2.2 2017 ............................................................... .41 – – – 2.1 – – –
Legally required benefits 2006 ............................................................... – – – 1.43 – – – 9.4 2007 ............................................................... 1.43 1.43 1.44 1.45 9.3 9.3 9.3 9.2 2008 ............................................................... 1.45 1.45 1.45 1.44 9.1 9.1 9.0 8.9 2009 ............................................................... 1.45 1.45 1.46 1.46 8.9 8.9 8.9 9.0 2010 ............................................................... 1.46 1.47 1.48 1.52 9.0 9.0 9.1 9.1
2011 ............................................................... 1.53 1.54 1.55 1.59 9.1 9.2 9.2 9.3 2012 ............................................................... 1.61 1.62 1.62 1.62 9.4 9.5 9.4 9.6 2013 ............................................................... 1.64 1.65 1.65 1.66 9.6 9.5 9.5 9.5 2014 ............................................................... 1.64 1.64 1.64 1.67 9.4 9.3 9.3 9.2 2015 ............................................................... 1.66 1.65 1.66 1.71 9.2 9.1 9.1 9.2 2016 ............................................................... 1.70 1.70 1.71 1.72 9.1 9.1 9.1 9.0 2017 ............................................................... 1.72 – – – 9.0 – – –
Note: The sum of individual items may not equal totals due to rounding. Dashes indicate data are not available.
-272-
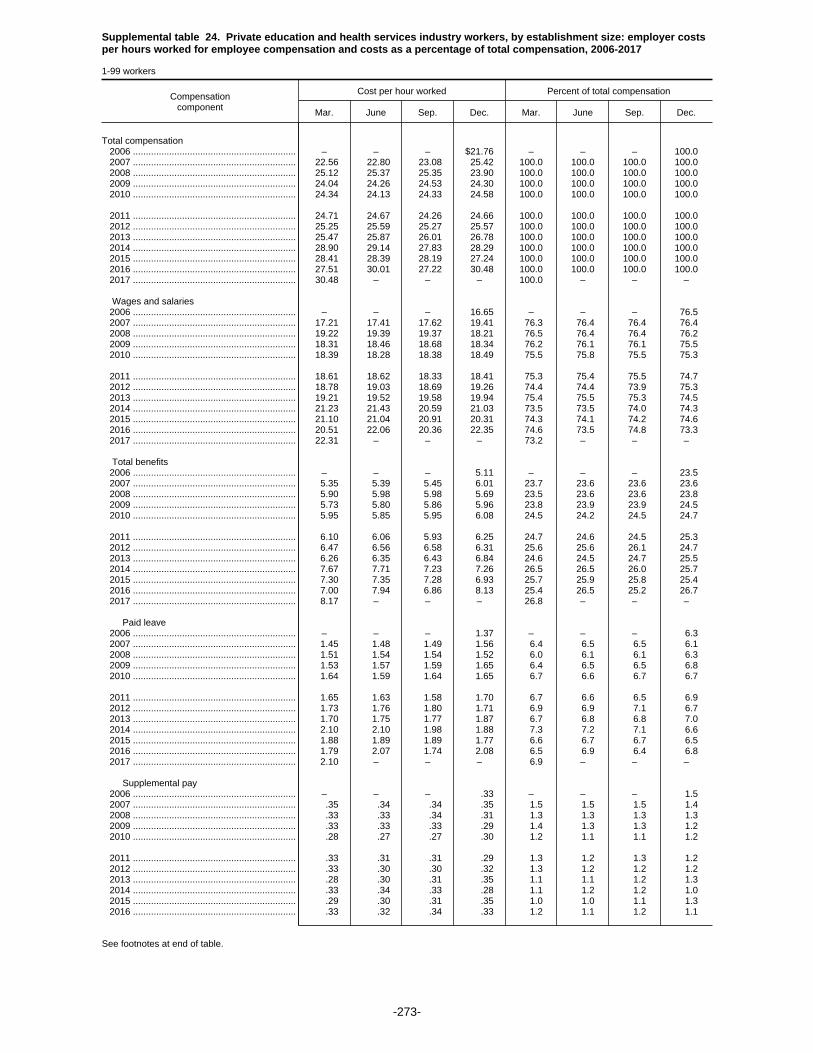
Supplemental table 24. Private education and health services industry workers, by establishment size: employer costsper hours worked for employee compensation and costs as a percentage of total compensation, 2006-2017
1-99 workers
Compensationcomponent
Cost per hour worked Percent of total compensation
Mar. June Sep. Dec. Mar. June Sep. Dec.
Total compensation 2006 ............................................................... – – – $21.76 – – – 100.0 2007 ............................................................... 22.56 22.80 23.08 25.42 100.0 100.0 100.0 100.0 2008 ............................................................... 25.12 25.37 25.35 23.90 100.0 100.0 100.0 100.0 2009 ............................................................... 24.04 24.26 24.53 24.30 100.0 100.0 100.0 100.0 2010 ............................................................... 24.34 24.13 24.33 24.58 100.0 100.0 100.0 100.0
2011 ............................................................... 24.71 24.67 24.26 24.66 100.0 100.0 100.0 100.0 2012 ............................................................... 25.25 25.59 25.27 25.57 100.0 100.0 100.0 100.0 2013 ............................................................... 25.47 25.87 26.01 26.78 100.0 100.0 100.0 100.0 2014 ............................................................... 28.90 29.14 27.83 28.29 100.0 100.0 100.0 100.0 2015 ............................................................... 28.41 28.39 28.19 27.24 100.0 100.0 100.0 100.0 2016 ............................................................... 27.51 30.01 27.22 30.48 100.0 100.0 100.0 100.0 2017 ............................................................... 30.48 – – – 100.0 – – –
Wages and salaries 2006 ............................................................... – – – 16.65 – – – 76.5 2007 ............................................................... 17.21 17.41 17.62 19.41 76.3 76.4 76.4 76.4 2008 ............................................................... 19.22 19.39 19.37 18.21 76.5 76.4 76.4 76.2 2009 ............................................................... 18.31 18.46 18.68 18.34 76.2 76.1 76.1 75.5 2010 ............................................................... 18.39 18.28 18.38 18.49 75.5 75.8 75.5 75.3
2011 ............................................................... 18.61 18.62 18.33 18.41 75.3 75.4 75.5 74.7 2012 ............................................................... 18.78 19.03 18.69 19.26 74.4 74.4 73.9 75.3 2013 ............................................................... 19.21 19.52 19.58 19.94 75.4 75.5 75.3 74.5 2014 ............................................................... 21.23 21.43 20.59 21.03 73.5 73.5 74.0 74.3 2015 ............................................................... 21.10 21.04 20.91 20.31 74.3 74.1 74.2 74.6 2016 ............................................................... 20.51 22.06 20.36 22.35 74.6 73.5 74.8 73.3 2017 ............................................................... 22.31 – – – 73.2 – – –
Total benefits 2006 ............................................................... – – – 5.11 – – – 23.5 2007 ............................................................... 5.35 5.39 5.45 6.01 23.7 23.6 23.6 23.6 2008 ............................................................... 5.90 5.98 5.98 5.69 23.5 23.6 23.6 23.8 2009 ............................................................... 5.73 5.80 5.86 5.96 23.8 23.9 23.9 24.5 2010 ............................................................... 5.95 5.85 5.95 6.08 24.5 24.2 24.5 24.7
2011 ............................................................... 6.10 6.06 5.93 6.25 24.7 24.6 24.5 25.3 2012 ............................................................... 6.47 6.56 6.58 6.31 25.6 25.6 26.1 24.7 2013 ............................................................... 6.26 6.35 6.43 6.84 24.6 24.5 24.7 25.5 2014 ............................................................... 7.67 7.71 7.23 7.26 26.5 26.5 26.0 25.7 2015 ............................................................... 7.30 7.35 7.28 6.93 25.7 25.9 25.8 25.4 2016 ............................................................... 7.00 7.94 6.86 8.13 25.4 26.5 25.2 26.7 2017 ............................................................... 8.17 – – – 26.8 – – –
Paid leave 2006 ............................................................... – – – 1.37 – – – 6.3 2007 ............................................................... 1.45 1.48 1.49 1.56 6.4 6.5 6.5 6.1 2008 ............................................................... 1.51 1.54 1.54 1.52 6.0 6.1 6.1 6.3 2009 ............................................................... 1.53 1.57 1.59 1.65 6.4 6.5 6.5 6.8 2010 ............................................................... 1.64 1.59 1.64 1.65 6.7 6.6 6.7 6.7
2011 ............................................................... 1.65 1.63 1.58 1.70 6.7 6.6 6.5 6.9 2012 ............................................................... 1.73 1.76 1.80 1.71 6.9 6.9 7.1 6.7 2013 ............................................................... 1.70 1.75 1.77 1.87 6.7 6.8 6.8 7.0 2014 ............................................................... 2.10 2.10 1.98 1.88 7.3 7.2 7.1 6.6 2015 ............................................................... 1.88 1.89 1.89 1.77 6.6 6.7 6.7 6.5 2016 ............................................................... 1.79 2.07 1.74 2.08 6.5 6.9 6.4 6.8 2017 ............................................................... 2.10 – – – 6.9 – – –
Supplemental pay 2006 ............................................................... – – – .33 – – – 1.5 2007 ............................................................... .35 .34 .34 .35 1.5 1.5 1.5 1.4 2008 ............................................................... .33 .33 .34 .31 1.3 1.3 1.3 1.3 2009 ............................................................... .33 .33 .33 .29 1.4 1.3 1.3 1.2 2010 ............................................................... .28 .27 .27 .30 1.2 1.1 1.1 1.2
2011 ............................................................... .33 .31 .31 .29 1.3 1.2 1.3 1.2 2012 ............................................................... .33 .30 .30 .32 1.3 1.2 1.2 1.2 2013 ............................................................... .28 .30 .31 .35 1.1 1.1 1.2 1.3 2014 ............................................................... .33 .34 .33 .28 1.1 1.2 1.2 1.0 2015 ............................................................... .29 .30 .31 .35 1.0 1.0 1.1 1.3 2016 ............................................................... .33 .32 .34 .33 1.2 1.1 1.2 1.1
See footnotes at end of table.
-273-

Supplemental table 24. Private education and health services industry workers, by establishment size: employer costsper hours worked for employee compensation and costs as a percentage of total compensation, 2006-2017
1-99 workers
Compensationcomponent
Cost per hour worked Percent of total compensation
Mar. June Sep. Dec. Mar. June Sep. Dec.
Supplemental pay 2017 ............................................................... 0.34 – – – 1.1 – – –
Insurance 2006 ............................................................... – – – 1.15 – – – 5.3 2007 ............................................................... 1.22 1.21 1.24 1.31 5.4 5.3 5.4 5.2 2008 ............................................................... 1.32 1.32 1.30 1.37 5.3 5.2 5.1 5.7 2009 ............................................................... 1.37 1.37 1.37 1.43 5.7 5.6 5.6 5.9 2010 ............................................................... 1.45 1.43 1.44 1.42 6.0 5.9 5.9 5.8
2011 ............................................................... 1.40 1.42 1.41 1.64 5.7 5.7 5.8 6.6 2012 ............................................................... 1.72 1.76 1.79 1.60 6.8 6.9 7.1 6.2 2013 ............................................................... 1.59 1.60 1.61 1.86 6.3 6.2 6.2 6.9 2014 ............................................................... 1.99 2.01 1.93 2.04 6.9 6.9 6.9 7.2 2015 ............................................................... 2.07 2.08 2.04 1.92 7.3 7.3 7.2 7.0 2016 ............................................................... 1.97 2.07 1.89 2.16 7.2 6.9 6.9 7.1 2017 ............................................................... 2.15 – – – 7.1 – – –
Retirement and savings 2006 ............................................................... – – – .37 – – – 1.7 2007 ............................................................... .39 .40 .40 .76 1.7 1.7 1.7 3.0 2008 ............................................................... .75 .75 .77 .53 3.0 3.0 3.0 2.2 2009 ............................................................... .53 .55 .57 .60 2.2 2.3 2.3 2.5 2010 ............................................................... .58 .56 .60 .69 2.4 2.3 2.5 2.8
2011 ............................................................... .67 .65 .59 .61 2.7 2.7 2.4 2.5 2012 ............................................................... .62 .64 .62 .56 2.5 2.5 2.4 2.2 2013 ............................................................... .57 .57 .59 .59 2.2 2.2 2.3 2.2 2014 ............................................................... 1.02 1.02 .82 .89 3.5 3.5 3.0 3.1 2015 ............................................................... .89 .91 .84 .70 3.1 3.2 3.0 2.6 2016 ............................................................... .70 1.24 .71 1.28 2.5 4.1 2.6 4.2 2017 ............................................................... 1.30 – – – 4.3 – – –
Legally required benefits 2006 ............................................................... – – – 1.90 – – – 8.7 2007 ............................................................... 1.95 1.97 1.98 2.03 8.6 8.6 8.6 8.0 2008 ............................................................... 2.00 2.03 2.02 1.96 8.0 8.0 8.0 8.2 2009 ............................................................... 1.97 1.99 2.00 2.00 8.2 8.2 8.2 8.2 2010 ............................................................... 2.00 1.98 2.01 2.02 8.2 8.2 8.3 8.2
2011 ............................................................... 2.05 2.05 2.04 2.02 8.3 8.3 8.4 8.2 2012 ............................................................... 2.07 2.09 2.08 2.12 8.2 8.2 8.2 8.3 2013 ............................................................... 2.12 2.14 2.15 2.18 8.3 8.3 8.3 8.1 2014 ............................................................... 2.23 2.23 2.17 2.18 7.7 7.7 7.8 7.7 2015 ............................................................... 2.18 2.17 2.20 2.20 7.7 7.7 7.8 8.1 2016 ............................................................... 2.21 2.24 2.18 2.28 8.0 7.5 8.0 7.5 2017 ............................................................... 2.28 – – – 7.5 – – –
Note: The sum of individual items may not equal totals due to rounding. Dashes indicate data are not available.
-274-
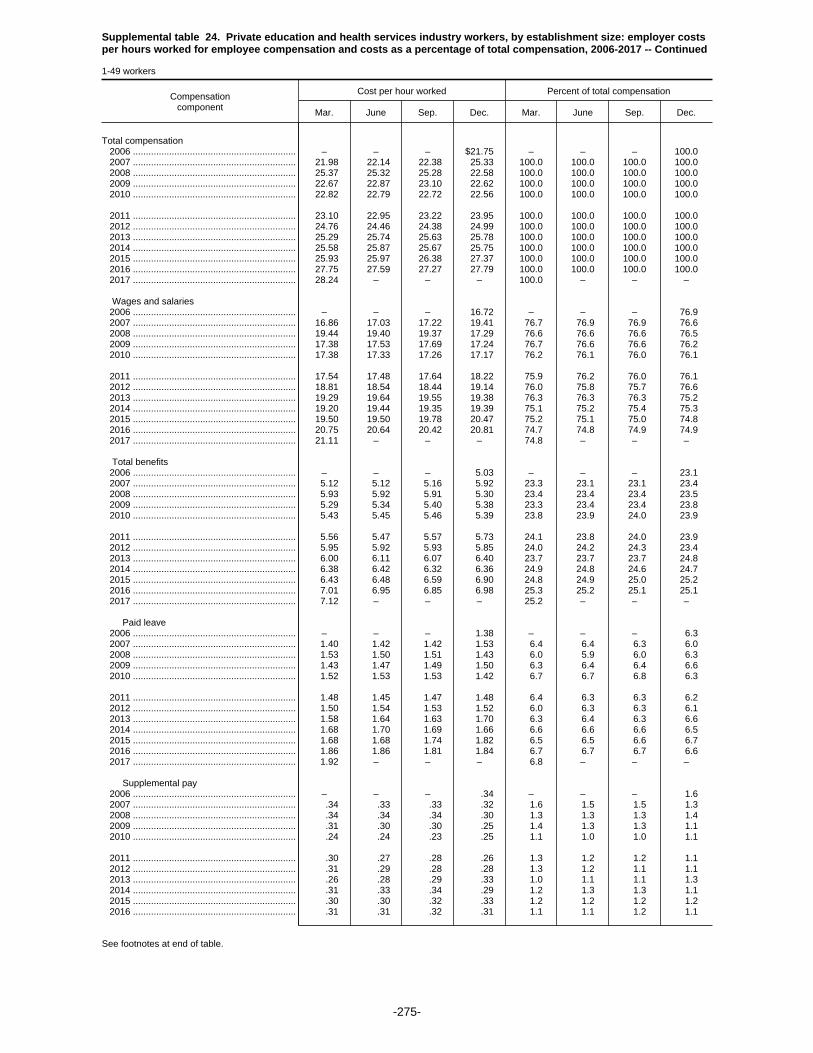
Supplemental table 24. Private education and health services industry workers, by establishment size: employer costsper hours worked for employee compensation and costs as a percentage of total compensation, 2006-2017 -- Continued
1-49 workers
Compensationcomponent
Cost per hour worked Percent of total compensation
Mar. June Sep. Dec. Mar. June Sep. Dec.
Total compensation 2006 ............................................................... – – – $21.75 – – – 100.0 2007 ............................................................... 21.98 22.14 22.38 25.33 100.0 100.0 100.0 100.0 2008 ............................................................... 25.37 25.32 25.28 22.58 100.0 100.0 100.0 100.0 2009 ............................................................... 22.67 22.87 23.10 22.62 100.0 100.0 100.0 100.0 2010 ............................................................... 22.82 22.79 22.72 22.56 100.0 100.0 100.0 100.0
2011 ............................................................... 23.10 22.95 23.22 23.95 100.0 100.0 100.0 100.0 2012 ............................................................... 24.76 24.46 24.38 24.99 100.0 100.0 100.0 100.0 2013 ............................................................... 25.29 25.74 25.63 25.78 100.0 100.0 100.0 100.0 2014 ............................................................... 25.58 25.87 25.67 25.75 100.0 100.0 100.0 100.0 2015 ............................................................... 25.93 25.97 26.38 27.37 100.0 100.0 100.0 100.0 2016 ............................................................... 27.75 27.59 27.27 27.79 100.0 100.0 100.0 100.0 2017 ............................................................... 28.24 – – – 100.0 – – –
Wages and salaries 2006 ............................................................... – – – 16.72 – – – 76.9 2007 ............................................................... 16.86 17.03 17.22 19.41 76.7 76.9 76.9 76.6 2008 ............................................................... 19.44 19.40 19.37 17.29 76.6 76.6 76.6 76.5 2009 ............................................................... 17.38 17.53 17.69 17.24 76.7 76.6 76.6 76.2 2010 ............................................................... 17.38 17.33 17.26 17.17 76.2 76.1 76.0 76.1
2011 ............................................................... 17.54 17.48 17.64 18.22 75.9 76.2 76.0 76.1 2012 ............................................................... 18.81 18.54 18.44 19.14 76.0 75.8 75.7 76.6 2013 ............................................................... 19.29 19.64 19.55 19.38 76.3 76.3 76.3 75.2 2014 ............................................................... 19.20 19.44 19.35 19.39 75.1 75.2 75.4 75.3 2015 ............................................................... 19.50 19.50 19.78 20.47 75.2 75.1 75.0 74.8 2016 ............................................................... 20.75 20.64 20.42 20.81 74.7 74.8 74.9 74.9 2017 ............................................................... 21.11 – – – 74.8 – – –
Total benefits 2006 ............................................................... – – – 5.03 – – – 23.1 2007 ............................................................... 5.12 5.12 5.16 5.92 23.3 23.1 23.1 23.4 2008 ............................................................... 5.93 5.92 5.91 5.30 23.4 23.4 23.4 23.5 2009 ............................................................... 5.29 5.34 5.40 5.38 23.3 23.4 23.4 23.8 2010 ............................................................... 5.43 5.45 5.46 5.39 23.8 23.9 24.0 23.9
2011 ............................................................... 5.56 5.47 5.57 5.73 24.1 23.8 24.0 23.9 2012 ............................................................... 5.95 5.92 5.93 5.85 24.0 24.2 24.3 23.4 2013 ............................................................... 6.00 6.11 6.07 6.40 23.7 23.7 23.7 24.8 2014 ............................................................... 6.38 6.42 6.32 6.36 24.9 24.8 24.6 24.7 2015 ............................................................... 6.43 6.48 6.59 6.90 24.8 24.9 25.0 25.2 2016 ............................................................... 7.01 6.95 6.85 6.98 25.3 25.2 25.1 25.1 2017 ............................................................... 7.12 – – – 25.2 – – –
Paid leave 2006 ............................................................... – – – 1.38 – – – 6.3 2007 ............................................................... 1.40 1.42 1.42 1.53 6.4 6.4 6.3 6.0 2008 ............................................................... 1.53 1.50 1.51 1.43 6.0 5.9 6.0 6.3 2009 ............................................................... 1.43 1.47 1.49 1.50 6.3 6.4 6.4 6.6 2010 ............................................................... 1.52 1.53 1.53 1.42 6.7 6.7 6.8 6.3
2011 ............................................................... 1.48 1.45 1.47 1.48 6.4 6.3 6.3 6.2 2012 ............................................................... 1.50 1.54 1.53 1.52 6.0 6.3 6.3 6.1 2013 ............................................................... 1.58 1.64 1.63 1.70 6.3 6.4 6.3 6.6 2014 ............................................................... 1.68 1.70 1.69 1.66 6.6 6.6 6.6 6.5 2015 ............................................................... 1.68 1.68 1.74 1.82 6.5 6.5 6.6 6.7 2016 ............................................................... 1.86 1.86 1.81 1.84 6.7 6.7 6.7 6.6 2017 ............................................................... 1.92 – – – 6.8 – – –
Supplemental pay 2006 ............................................................... – – – .34 – – – 1.6 2007 ............................................................... .34 .33 .33 .32 1.6 1.5 1.5 1.3 2008 ............................................................... .34 .34 .34 .30 1.3 1.3 1.3 1.4 2009 ............................................................... .31 .30 .30 .25 1.4 1.3 1.3 1.1 2010 ............................................................... .24 .24 .23 .25 1.1 1.0 1.0 1.1
2011 ............................................................... .30 .27 .28 .26 1.3 1.2 1.2 1.1 2012 ............................................................... .31 .29 .28 .28 1.3 1.2 1.1 1.1 2013 ............................................................... .26 .28 .29 .33 1.0 1.1 1.1 1.3 2014 ............................................................... .31 .33 .34 .29 1.2 1.3 1.3 1.1 2015 ............................................................... .30 .30 .32 .33 1.2 1.2 1.2 1.2 2016 ............................................................... .31 .31 .32 .31 1.1 1.1 1.2 1.1
See footnotes at end of table.
-275-
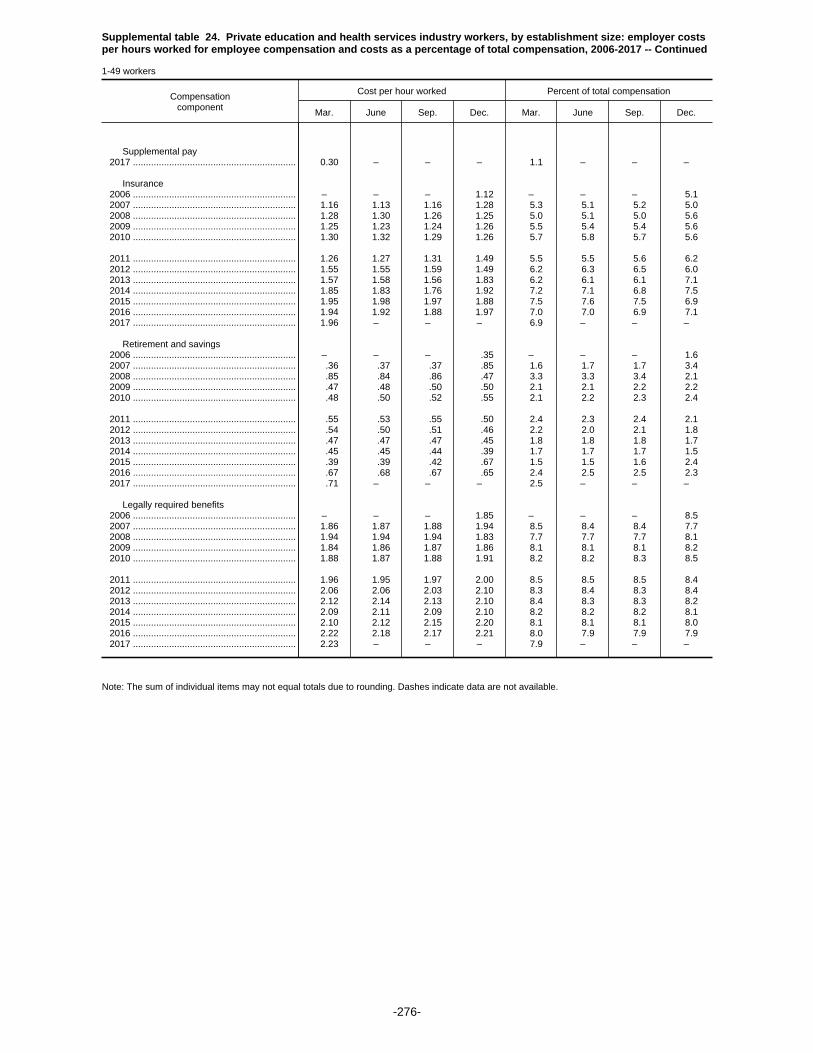
Supplemental table 24. Private education and health services industry workers, by establishment size: employer costsper hours worked for employee compensation and costs as a percentage of total compensation, 2006-2017 -- Continued
1-49 workers
Compensationcomponent
Cost per hour worked Percent of total compensation
Mar. June Sep. Dec. Mar. June Sep. Dec.
Supplemental pay 2017 ............................................................... 0.30 – – – 1.1 – – –
Insurance 2006 ............................................................... – – – 1.12 – – – 5.1 2007 ............................................................... 1.16 1.13 1.16 1.28 5.3 5.1 5.2 5.0 2008 ............................................................... 1.28 1.30 1.26 1.25 5.0 5.1 5.0 5.6 2009 ............................................................... 1.25 1.23 1.24 1.26 5.5 5.4 5.4 5.6 2010 ............................................................... 1.30 1.32 1.29 1.26 5.7 5.8 5.7 5.6
2011 ............................................................... 1.26 1.27 1.31 1.49 5.5 5.5 5.6 6.2 2012 ............................................................... 1.55 1.55 1.59 1.49 6.2 6.3 6.5 6.0 2013 ............................................................... 1.57 1.58 1.56 1.83 6.2 6.1 6.1 7.1 2014 ............................................................... 1.85 1.83 1.76 1.92 7.2 7.1 6.8 7.5 2015 ............................................................... 1.95 1.98 1.97 1.88 7.5 7.6 7.5 6.9 2016 ............................................................... 1.94 1.92 1.88 1.97 7.0 7.0 6.9 7.1 2017 ............................................................... 1.96 – – – 6.9 – – –
Retirement and savings 2006 ............................................................... – – – .35 – – – 1.6 2007 ............................................................... .36 .37 .37 .85 1.6 1.7 1.7 3.4 2008 ............................................................... .85 .84 .86 .47 3.3 3.3 3.4 2.1 2009 ............................................................... .47 .48 .50 .50 2.1 2.1 2.2 2.2 2010 ............................................................... .48 .50 .52 .55 2.1 2.2 2.3 2.4
2011 ............................................................... .55 .53 .55 .50 2.4 2.3 2.4 2.1 2012 ............................................................... .54 .50 .51 .46 2.2 2.0 2.1 1.8 2013 ............................................................... .47 .47 .47 .45 1.8 1.8 1.8 1.7 2014 ............................................................... .45 .45 .44 .39 1.7 1.7 1.7 1.5 2015 ............................................................... .39 .39 .42 .67 1.5 1.5 1.6 2.4 2016 ............................................................... .67 .68 .67 .65 2.4 2.5 2.5 2.3 2017 ............................................................... .71 – – – 2.5 – – –
Legally required benefits 2006 ............................................................... – – – 1.85 – – – 8.5 2007 ............................................................... 1.86 1.87 1.88 1.94 8.5 8.4 8.4 7.7 2008 ............................................................... 1.94 1.94 1.94 1.83 7.7 7.7 7.7 8.1 2009 ............................................................... 1.84 1.86 1.87 1.86 8.1 8.1 8.1 8.2 2010 ............................................................... 1.88 1.87 1.88 1.91 8.2 8.2 8.3 8.5
2011 ............................................................... 1.96 1.95 1.97 2.00 8.5 8.5 8.5 8.4 2012 ............................................................... 2.06 2.06 2.03 2.10 8.3 8.4 8.3 8.4 2013 ............................................................... 2.12 2.14 2.13 2.10 8.4 8.3 8.3 8.2 2014 ............................................................... 2.09 2.11 2.09 2.10 8.2 8.2 8.2 8.1 2015 ............................................................... 2.10 2.12 2.15 2.20 8.1 8.1 8.1 8.0 2016 ............................................................... 2.22 2.18 2.17 2.21 8.0 7.9 7.9 7.9 2017 ............................................................... 2.23 – – – 7.9 – – –
Note: The sum of individual items may not equal totals due to rounding. Dashes indicate data are not available.
-276-
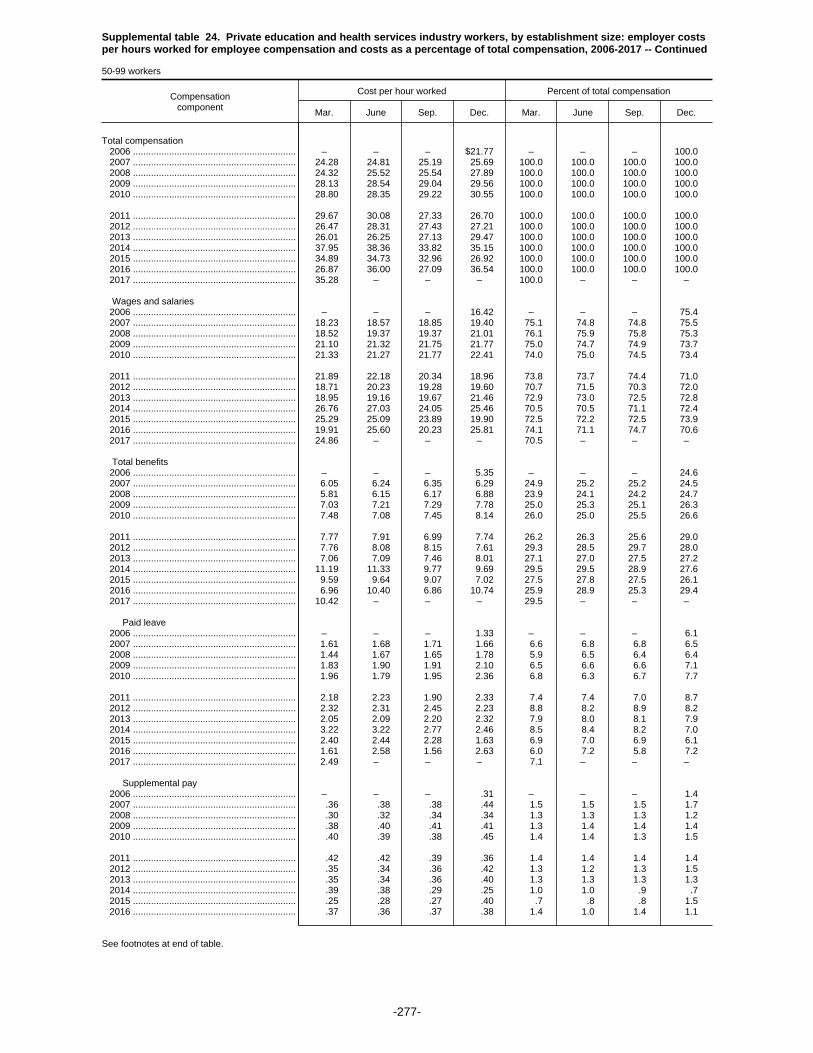
Supplemental table 24. Private education and health services industry workers, by establishment size: employer costsper hours worked for employee compensation and costs as a percentage of total compensation, 2006-2017 -- Continued
50-99 workers
Compensationcomponent
Cost per hour worked Percent of total compensation
Mar. June Sep. Dec. Mar. June Sep. Dec.
Total compensation 2006 ............................................................... – – – $21.77 – – – 100.0 2007 ............................................................... 24.28 24.81 25.19 25.69 100.0 100.0 100.0 100.0 2008 ............................................................... 24.32 25.52 25.54 27.89 100.0 100.0 100.0 100.0 2009 ............................................................... 28.13 28.54 29.04 29.56 100.0 100.0 100.0 100.0 2010 ............................................................... 28.80 28.35 29.22 30.55 100.0 100.0 100.0 100.0
2011 ............................................................... 29.67 30.08 27.33 26.70 100.0 100.0 100.0 100.0 2012 ............................................................... 26.47 28.31 27.43 27.21 100.0 100.0 100.0 100.0 2013 ............................................................... 26.01 26.25 27.13 29.47 100.0 100.0 100.0 100.0 2014 ............................................................... 37.95 38.36 33.82 35.15 100.0 100.0 100.0 100.0 2015 ............................................................... 34.89 34.73 32.96 26.92 100.0 100.0 100.0 100.0 2016 ............................................................... 26.87 36.00 27.09 36.54 100.0 100.0 100.0 100.0 2017 ............................................................... 35.28 – – – 100.0 – – –
Wages and salaries 2006 ............................................................... – – – 16.42 – – – 75.4 2007 ............................................................... 18.23 18.57 18.85 19.40 75.1 74.8 74.8 75.5 2008 ............................................................... 18.52 19.37 19.37 21.01 76.1 75.9 75.8 75.3 2009 ............................................................... 21.10 21.32 21.75 21.77 75.0 74.7 74.9 73.7 2010 ............................................................... 21.33 21.27 21.77 22.41 74.0 75.0 74.5 73.4
2011 ............................................................... 21.89 22.18 20.34 18.96 73.8 73.7 74.4 71.0 2012 ............................................................... 18.71 20.23 19.28 19.60 70.7 71.5 70.3 72.0 2013 ............................................................... 18.95 19.16 19.67 21.46 72.9 73.0 72.5 72.8 2014 ............................................................... 26.76 27.03 24.05 25.46 70.5 70.5 71.1 72.4 2015 ............................................................... 25.29 25.09 23.89 19.90 72.5 72.2 72.5 73.9 2016 ............................................................... 19.91 25.60 20.23 25.81 74.1 71.1 74.7 70.6 2017 ............................................................... 24.86 – – – 70.5 – – –
Total benefits 2006 ............................................................... – – – 5.35 – – – 24.6 2007 ............................................................... 6.05 6.24 6.35 6.29 24.9 25.2 25.2 24.5 2008 ............................................................... 5.81 6.15 6.17 6.88 23.9 24.1 24.2 24.7 2009 ............................................................... 7.03 7.21 7.29 7.78 25.0 25.3 25.1 26.3 2010 ............................................................... 7.48 7.08 7.45 8.14 26.0 25.0 25.5 26.6
2011 ............................................................... 7.77 7.91 6.99 7.74 26.2 26.3 25.6 29.0 2012 ............................................................... 7.76 8.08 8.15 7.61 29.3 28.5 29.7 28.0 2013 ............................................................... 7.06 7.09 7.46 8.01 27.1 27.0 27.5 27.2 2014 ............................................................... 11.19 11.33 9.77 9.69 29.5 29.5 28.9 27.6 2015 ............................................................... 9.59 9.64 9.07 7.02 27.5 27.8 27.5 26.1 2016 ............................................................... 6.96 10.40 6.86 10.74 25.9 28.9 25.3 29.4 2017 ............................................................... 10.42 – – – 29.5 – – –
Paid leave 2006 ............................................................... – – – 1.33 – – – 6.1 2007 ............................................................... 1.61 1.68 1.71 1.66 6.6 6.8 6.8 6.5 2008 ............................................................... 1.44 1.67 1.65 1.78 5.9 6.5 6.4 6.4 2009 ............................................................... 1.83 1.90 1.91 2.10 6.5 6.6 6.6 7.1 2010 ............................................................... 1.96 1.79 1.95 2.36 6.8 6.3 6.7 7.7
2011 ............................................................... 2.18 2.23 1.90 2.33 7.4 7.4 7.0 8.7 2012 ............................................................... 2.32 2.31 2.45 2.23 8.8 8.2 8.9 8.2 2013 ............................................................... 2.05 2.09 2.20 2.32 7.9 8.0 8.1 7.9 2014 ............................................................... 3.22 3.22 2.77 2.46 8.5 8.4 8.2 7.0 2015 ............................................................... 2.40 2.44 2.28 1.63 6.9 7.0 6.9 6.1 2016 ............................................................... 1.61 2.58 1.56 2.63 6.0 7.2 5.8 7.2 2017 ............................................................... 2.49 – – – 7.1 – – –
Supplemental pay 2006 ............................................................... – – – .31 – – – 1.4 2007 ............................................................... .36 .38 .38 .44 1.5 1.5 1.5 1.7 2008 ............................................................... .30 .32 .34 .34 1.3 1.3 1.3 1.2 2009 ............................................................... .38 .40 .41 .41 1.3 1.4 1.4 1.4 2010 ............................................................... .40 .39 .38 .45 1.4 1.4 1.3 1.5
2011 ............................................................... .42 .42 .39 .36 1.4 1.4 1.4 1.4 2012 ............................................................... .35 .34 .36 .42 1.3 1.2 1.3 1.5 2013 ............................................................... .35 .34 .36 .40 1.3 1.3 1.3 1.3 2014 ............................................................... .39 .38 .29 .25 1.0 1.0 .9 .7 2015 ............................................................... .25 .28 .27 .40 .7 .8 .8 1.5 2016 ............................................................... .37 .36 .37 .38 1.4 1.0 1.4 1.1
See footnotes at end of table.
-277-
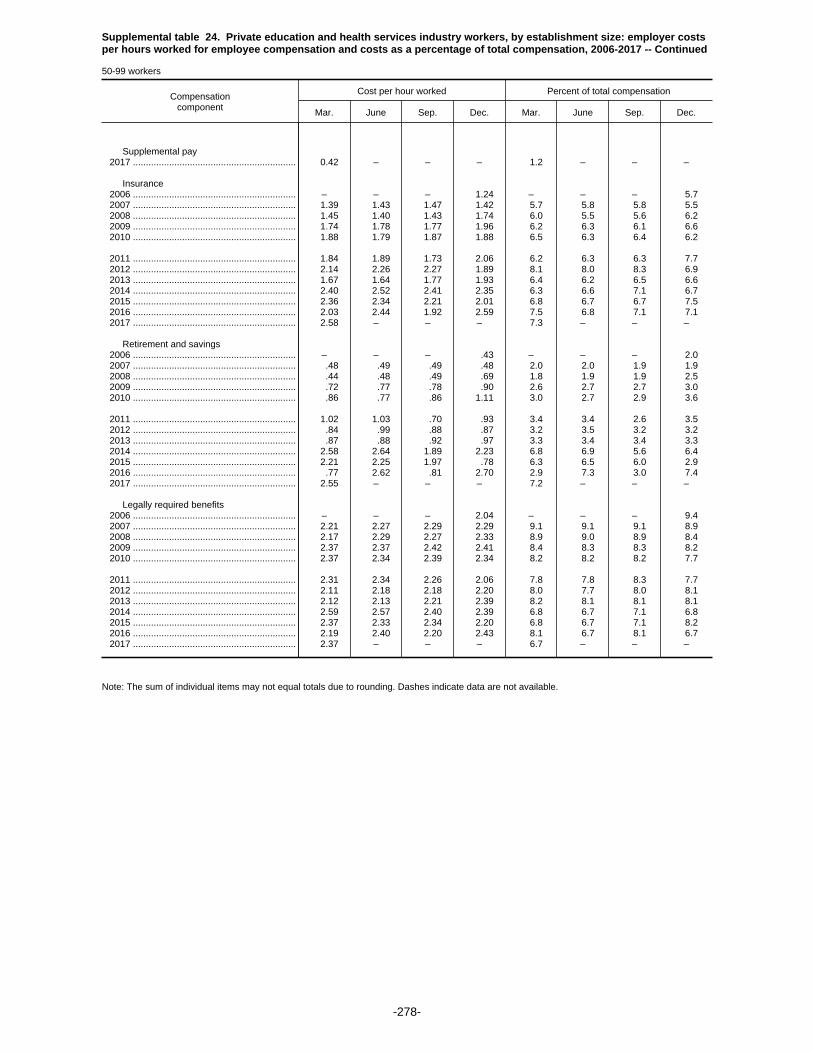
Supplemental table 24. Private education and health services industry workers, by establishment size: employer costsper hours worked for employee compensation and costs as a percentage of total compensation, 2006-2017 -- Continued
50-99 workers
Compensationcomponent
Cost per hour worked Percent of total compensation
Mar. June Sep. Dec. Mar. June Sep. Dec.
Supplemental pay 2017 ............................................................... 0.42 – – – 1.2 – – –
Insurance 2006 ............................................................... – – – 1.24 – – – 5.7 2007 ............................................................... 1.39 1.43 1.47 1.42 5.7 5.8 5.8 5.5 2008 ............................................................... 1.45 1.40 1.43 1.74 6.0 5.5 5.6 6.2 2009 ............................................................... 1.74 1.78 1.77 1.96 6.2 6.3 6.1 6.6 2010 ............................................................... 1.88 1.79 1.87 1.88 6.5 6.3 6.4 6.2
2011 ............................................................... 1.84 1.89 1.73 2.06 6.2 6.3 6.3 7.7 2012 ............................................................... 2.14 2.26 2.27 1.89 8.1 8.0 8.3 6.9 2013 ............................................................... 1.67 1.64 1.77 1.93 6.4 6.2 6.5 6.6 2014 ............................................................... 2.40 2.52 2.41 2.35 6.3 6.6 7.1 6.7 2015 ............................................................... 2.36 2.34 2.21 2.01 6.8 6.7 6.7 7.5 2016 ............................................................... 2.03 2.44 1.92 2.59 7.5 6.8 7.1 7.1 2017 ............................................................... 2.58 – – – 7.3 – – –
Retirement and savings 2006 ............................................................... – – – .43 – – – 2.0 2007 ............................................................... .48 .49 .49 .48 2.0 2.0 1.9 1.9 2008 ............................................................... .44 .48 .49 .69 1.8 1.9 1.9 2.5 2009 ............................................................... .72 .77 .78 .90 2.6 2.7 2.7 3.0 2010 ............................................................... .86 .77 .86 1.11 3.0 2.7 2.9 3.6
2011 ............................................................... 1.02 1.03 .70 .93 3.4 3.4 2.6 3.5 2012 ............................................................... .84 .99 .88 .87 3.2 3.5 3.2 3.2 2013 ............................................................... .87 .88 .92 .97 3.3 3.4 3.4 3.3 2014 ............................................................... 2.58 2.64 1.89 2.23 6.8 6.9 5.6 6.4 2015 ............................................................... 2.21 2.25 1.97 .78 6.3 6.5 6.0 2.9 2016 ............................................................... .77 2.62 .81 2.70 2.9 7.3 3.0 7.4 2017 ............................................................... 2.55 – – – 7.2 – – –
Legally required benefits 2006 ............................................................... – – – 2.04 – – – 9.4 2007 ............................................................... 2.21 2.27 2.29 2.29 9.1 9.1 9.1 8.9 2008 ............................................................... 2.17 2.29 2.27 2.33 8.9 9.0 8.9 8.4 2009 ............................................................... 2.37 2.37 2.42 2.41 8.4 8.3 8.3 8.2 2010 ............................................................... 2.37 2.34 2.39 2.34 8.2 8.2 8.2 7.7
2011 ............................................................... 2.31 2.34 2.26 2.06 7.8 7.8 8.3 7.7 2012 ............................................................... 2.11 2.18 2.18 2.20 8.0 7.7 8.0 8.1 2013 ............................................................... 2.12 2.13 2.21 2.39 8.2 8.1 8.1 8.1 2014 ............................................................... 2.59 2.57 2.40 2.39 6.8 6.7 7.1 6.8 2015 ............................................................... 2.37 2.33 2.34 2.20 6.8 6.7 7.1 8.2 2016 ............................................................... 2.19 2.40 2.20 2.43 8.1 6.7 8.1 6.7 2017 ............................................................... 2.37 – – – 6.7 – – –
Note: The sum of individual items may not equal totals due to rounding. Dashes indicate data are not available.
-278-

Supplemental table 24. Private education and health services industry workers, by establishment size: employer costsper hours worked for employee compensation and costs as a percentage of total compensation, 2006-2017 -- Continued
100 workers or more
Compensationcomponent
Cost per hour worked Percent of total compensation
Mar. June Sep. Dec. Mar. June Sep. Dec.
Total compensation 2006 ............................................................... – – – $30.48 – – – 100.0 2007 ............................................................... 30.47 30.25 29.96 30.46 100.0 100.0 100.0 100.0 2008 ............................................................... 30.78 30.70 31.34 32.47 100.0 100.0 100.0 100.0 2009 ............................................................... 32.62 32.55 32.70 32.38 100.0 100.0 100.0 100.0 2010 ............................................................... 33.18 33.10 33.51 33.18 100.0 100.0 100.0 100.0
2011 ............................................................... 34.13 33.86 33.87 34.58 100.0 100.0 100.0 100.0 2012 ............................................................... 34.50 34.62 34.79 33.91 100.0 100.0 100.0 100.0 2013 ............................................................... 34.02 34.19 34.38 33.85 100.0 100.0 100.0 100.0 2014 ............................................................... 33.88 33.94 34.41 35.86 100.0 100.0 100.0 100.0 2015 ............................................................... 36.06 35.56 35.98 36.87 100.0 100.0 100.0 100.0 2016 ............................................................... 37.38 37.17 37.71 38.26 100.0 100.0 100.0 100.0 2017 ............................................................... 38.46 – – – 100.0 – – –
Wages and salaries 2006 ............................................................... – – – 21.54 – – – 70.7 2007 ............................................................... 21.51 21.36 21.04 21.35 70.6 70.6 70.2 70.1 2008 ............................................................... 21.56 21.47 21.95 22.77 70.0 69.9 70.0 70.1 2009 ............................................................... 22.84 22.76 22.86 22.62 70.0 69.9 69.9 69.9 2010 ............................................................... 23.23 23.16 23.46 23.17 70.0 70.0 70.0 69.8
2011 ............................................................... 23.79 23.58 23.64 24.17 69.7 69.6 69.8 69.9 2012 ............................................................... 24.09 24.13 24.26 23.64 69.8 69.7 69.7 69.7 2013 ............................................................... 23.64 23.73 23.88 23.46 69.5 69.4 69.5 69.3 2014 ............................................................... 23.47 23.49 23.83 24.65 69.3 69.2 69.3 68.7 2015 ............................................................... 24.79 24.44 24.76 25.20 68.7 68.7 68.8 68.4 2016 ............................................................... 25.58 25.44 25.80 26.22 68.4 68.5 68.4 68.5 2017 ............................................................... 26.32 – – – 68.4 – – –
Total benefits 2006 ............................................................... – – – 8.95 – – – 29.3 2007 ............................................................... 8.97 8.89 8.93 9.11 29.4 29.4 29.8 29.9 2008 ............................................................... 9.23 9.23 9.39 9.70 30.0 30.1 30.0 29.9 2009 ............................................................... 9.78 9.78 9.84 9.76 30.0 30.1 30.1 30.1 2010 ............................................................... 9.95 9.94 10.05 10.01 30.0 30.0 30.0 30.2
2011 ............................................................... 10.35 10.28 10.23 10.41 30.3 30.4 30.2 30.1 2012 ............................................................... 10.41 10.49 10.53 10.28 30.2 30.3 30.3 30.3 2013 ............................................................... 10.38 10.45 10.50 10.39 30.5 30.6 30.5 30.7 2014 ............................................................... 10.41 10.45 10.58 11.21 30.7 30.8 30.7 31.3 2015 ............................................................... 11.28 11.12 11.22 11.67 31.3 31.3 31.2 31.6 2016 ............................................................... 11.80 11.73 11.91 12.04 31.6 31.5 31.6 31.5 2017 ............................................................... 12.13 – – – 31.6 – – –
Paid leave 2006 ............................................................... – – – 2.49 – – – 8.2 2007 ............................................................... 2.49 2.46 2.45 2.49 8.2 8.1 8.2 8.2 2008 ............................................................... 2.49 2.47 2.53 2.64 8.1 8.1 8.1 8.1 2009 ............................................................... 2.62 2.62 2.64 2.59 8.0 8.0 8.1 8.0 2010 ............................................................... 2.61 2.60 2.62 2.66 7.9 7.8 7.8 8.0
2011 ............................................................... 2.77 2.74 2.70 2.81 8.1 8.1 8.0 8.1 2012 ............................................................... 2.75 2.80 2.79 2.71 8.0 8.1 8.0 8.0 2013 ............................................................... 2.74 2.78 2.79 2.74 8.0 8.1 8.1 8.1 2014 ............................................................... 2.74 2.75 2.79 2.96 8.1 8.1 8.1 8.3 2015 ............................................................... 2.97 2.91 2.95 3.11 8.2 8.2 8.2 8.4 2016 ............................................................... 3.13 3.11 3.17 3.22 8.4 8.4 8.4 8.4 2017 ............................................................... 3.23 – – – 8.4 – – –
Supplemental pay 2006 ............................................................... – – – .65 – – – 2.1 2007 ............................................................... .66 .67 .66 .66 2.2 2.2 2.2 2.2 2008 ............................................................... .67 .69 .69 .71 2.2 2.2 2.2 2.2 2009 ............................................................... .71 .74 .74 .75 2.2 2.3 2.3 2.3 2010 ............................................................... .75 .76 .76 .73 2.3 2.3 2.3 2.2
2011 ............................................................... .74 .76 .76 .75 2.2 2.2 2.2 2.2 2012 ............................................................... .76 .76 .77 .74 2.2 2.2 2.2 2.2 2013 ............................................................... .73 .75 .75 .75 2.1 2.2 2.2 2.2 2014 ............................................................... .75 .78 .78 .82 2.2 2.3 2.3 2.3 2015 ............................................................... .81 .82 .82 .85 2.2 2.3 2.3 2.3 2016 ............................................................... .85 .85 .86 .86 2.3 2.3 2.3 2.2
See footnotes at end of table.
-279-

Supplemental table 24. Private education and health services industry workers, by establishment size: employer costsper hours worked for employee compensation and costs as a percentage of total compensation, 2006-2017 -- Continued
100 workers or more
Compensationcomponent
Cost per hour worked Percent of total compensation
Mar. June Sep. Dec. Mar. June Sep. Dec.
Supplemental pay 2017 ............................................................... 0.87 – – – 2.3 – – –
Insurance 2006 ............................................................... – – – 2.50 – – – 8.2 2007 ............................................................... 2.55 2.52 2.52 2.59 8.4 8.3 8.4 8.5 2008 ............................................................... 2.66 2.68 2.71 2.77 8.6 8.7 8.7 8.5 2009 ............................................................... 2.85 2.86 2.87 2.86 8.7 8.8 8.8 8.8 2010 ............................................................... 2.96 2.97 2.99 2.97 8.9 9.0 8.9 8.9
2011 ............................................................... 3.04 3.03 3.03 3.03 8.9 8.9 8.9 8.8 2012 ............................................................... 3.12 3.14 3.17 3.06 9.0 9.1 9.1 9.0 2013 ............................................................... 3.13 3.14 3.15 3.15 9.2 9.2 9.2 9.3 2014 ............................................................... 3.16 3.18 3.23 3.38 9.3 9.4 9.4 9.4 2015 ............................................................... 3.44 3.41 3.44 3.53 9.5 9.6 9.5 9.6 2016 ............................................................... 3.61 3.60 3.65 3.66 9.7 9.7 9.7 9.6 2017 ............................................................... 3.69 – – – 9.6 – – –
Retirement and savings 2006 ............................................................... – – – .97 – – – 3.2 2007 ............................................................... .95 .93 .98 1.03 3.1 3.1 3.3 3.4 2008 ............................................................... 1.04 1.02 1.06 1.16 3.4 3.3 3.4 3.6 2009 ............................................................... 1.16 1.13 1.14 1.13 3.6 3.5 3.5 3.5 2010 ............................................................... 1.16 1.15 1.18 1.17 3.5 3.5 3.5 3.5
2011 ............................................................... 1.28 1.25 1.23 1.25 3.7 3.7 3.6 3.6 2012 ............................................................... 1.22 1.21 1.24 1.23 3.5 3.5 3.6 3.6 2013 ............................................................... 1.24 1.23 1.24 1.24 3.6 3.6 3.6 3.7 2014 ............................................................... 1.24 1.23 1.25 1.40 3.6 3.6 3.6 3.9 2015 ............................................................... 1.41 1.36 1.38 1.50 3.9 3.8 3.8 4.1 2016 ............................................................... 1.52 1.49 1.54 1.58 4.1 4.0 4.1 4.1 2017 ............................................................... 1.59 – – – 4.1 – – –
Legally required benefits 2006 ............................................................... – – – 2.34 – – – 7.7 2007 ............................................................... 2.32 2.32 2.32 2.35 7.6 7.7 7.7 7.7 2008 ............................................................... 2.37 2.36 2.39 2.43 7.7 7.7 7.6 7.5 2009 ............................................................... 2.43 2.44 2.44 2.43 7.5 7.5 7.5 7.5 2010 ............................................................... 2.46 2.46 2.49 2.48 7.4 7.4 7.4 7.5
2011 ............................................................... 2.51 2.51 2.52 2.56 7.4 7.4 7.4 7.4 2012 ............................................................... 2.57 2.57 2.57 2.54 7.4 7.4 7.4 7.5 2013 ............................................................... 2.54 2.55 2.57 2.52 7.5 7.5 7.5 7.4 2014 ............................................................... 2.52 2.52 2.55 2.65 7.4 7.4 7.4 7.4 2015 ............................................................... 2.65 2.62 2.64 2.67 7.3 7.4 7.3 7.2 2016 ............................................................... 2.69 2.67 2.69 2.72 7.2 7.2 7.1 7.1 2017 ............................................................... 2.75 – – – 7.1 – – –
Note: The sum of individual items may not equal totals due to rounding. Dashes indicate data are not available.
-280-

Supplemental table 24. Private education and health services industry workers, by establishment size: employer costsper hours worked for employee compensation and costs as a percentage of total compensation, 2006-2017 -- Continued
100-499 workers
Compensationcomponent
Cost per hour worked Percent of total compensation
Mar. June Sep. Dec. Mar. June Sep. Dec.
Total compensation 2006 ............................................................... – – – $26.47 – – – 100.0 2007 ............................................................... 26.12 26.16 24.95 25.30 100.0 100.0 100.0 100.0 2008 ............................................................... 25.66 25.68 26.01 27.90 100.0 100.0 100.0 100.0 2009 ............................................................... 27.69 27.98 28.05 26.65 100.0 100.0 100.0 100.0 2010 ............................................................... 28.06 28.15 28.31 26.87 100.0 100.0 100.0 100.0
2011 ............................................................... 28.89 28.62 28.08 27.98 100.0 100.0 100.0 100.0 2012 ............................................................... 27.34 28.05 28.02 26.08 100.0 100.0 100.0 100.0 2013 ............................................................... 26.15 26.78 26.75 25.82 100.0 100.0 100.0 100.0 2014 ............................................................... 25.82 26.19 26.56 28.04 100.0 100.0 100.0 100.0 2015 ............................................................... 28.53 28.41 28.62 29.68 100.0 100.0 100.0 100.0 2016 ............................................................... 29.93 30.13 30.34 30.77 100.0 100.0 100.0 100.0 2017 ............................................................... 30.96 – – – 100.0 – – –
Wages and salaries 2006 ............................................................... – – – 19.42 – – – 73.4 2007 ............................................................... 19.17 19.29 18.08 18.32 73.4 73.7 72.4 72.4 2008 ............................................................... 18.57 18.53 18.75 20.16 72.4 72.1 72.1 72.3 2009 ............................................................... 20.03 20.21 20.25 19.19 72.4 72.3 72.2 72.0 2010 ............................................................... 20.36 20.40 20.55 19.43 72.6 72.5 72.6 72.3
2011 ............................................................... 20.76 20.60 20.28 20.26 71.9 72.0 72.2 72.4 2012 ............................................................... 19.85 20.33 20.30 18.74 72.6 72.5 72.4 71.8 2013 ............................................................... 18.66 19.11 19.12 18.61 71.4 71.4 71.5 72.1 2014 ............................................................... 18.63 18.93 19.17 20.00 72.2 72.3 72.2 71.3 2015 ............................................................... 20.27 20.21 20.37 20.96 71.1 71.1 71.2 70.6 2016 ............................................................... 21.20 21.33 21.47 21.81 70.8 70.8 70.8 70.9 2017 ............................................................... 21.94 – – – 70.9 – – –
Total benefits 2006 ............................................................... – – – 7.05 – – – 26.6 2007 ............................................................... 6.94 6.87 6.88 6.98 26.6 26.3 27.6 27.6 2008 ............................................................... 7.09 7.16 7.26 7.74 27.6 27.9 27.9 27.7 2009 ............................................................... 7.65 7.76 7.80 7.46 27.6 27.7 27.8 28.0 2010 ............................................................... 7.70 7.75 7.76 7.45 27.4 27.5 27.4 27.7
2011 ............................................................... 8.13 8.02 7.79 7.72 28.1 28.0 27.8 27.6 2012 ............................................................... 7.48 7.72 7.73 7.34 27.4 27.5 27.6 28.2 2013 ............................................................... 7.49 7.67 7.63 7.21 28.6 28.6 28.5 27.9 2014 ............................................................... 7.19 7.26 7.39 8.04 27.8 27.7 27.8 28.7 2015 ............................................................... 8.26 8.20 8.26 8.72 28.9 28.9 28.8 29.4 2016 ............................................................... 8.73 8.80 8.87 8.96 29.2 29.2 29.2 29.1 2017 ............................................................... 9.02 – – – 29.1 – – –
Paid leave 2006 ............................................................... – – – 1.94 – – – 7.3 2007 ............................................................... 1.90 1.89 1.84 1.90 7.3 7.2 7.4 7.5 2008 ............................................................... 1.92 1.90 1.91 2.07 7.5 7.4 7.4 7.4 2009 ............................................................... 1.99 2.03 2.05 1.93 7.2 7.2 7.3 7.2 2010 ............................................................... 1.97 1.96 1.96 1.94 7.0 7.0 6.9 7.2
2011 ............................................................... 2.20 2.15 2.02 2.04 7.6 7.5 7.2 7.3 2012 ............................................................... 1.87 2.02 1.98 1.87 6.8 7.2 7.1 7.2 2013 ............................................................... 1.90 2.01 1.99 1.85 7.3 7.5 7.5 7.2 2014 ............................................................... 1.85 1.86 1.90 2.09 7.1 7.1 7.2 7.4 2015 ............................................................... 2.15 2.14 2.15 2.29 7.5 7.5 7.5 7.7 2016 ............................................................... 2.29 2.30 2.35 2.38 7.6 7.6 7.7 7.7 2017 ............................................................... 2.38 – – – 7.7 – – –
Supplemental pay 2006 ............................................................... – – – .43 – – – 1.6 2007 ............................................................... .43 .43 .44 .43 1.7 1.6 1.7 1.7 2008 ............................................................... .43 .44 .44 .46 1.7 1.7 1.7 1.7 2009 ............................................................... .46 .52 .51 .52 1.7 1.8 1.8 2.0 2010 ............................................................... .53 .55 .55 .45 1.9 2.0 1.9 1.7
2011 ............................................................... .49 .49 .49 .46 1.7 1.7 1.7 1.6 2012 ............................................................... .46 .46 .48 .44 1.7 1.6 1.7 1.7 2013 ............................................................... .42 .45 .45 .42 1.6 1.7 1.7 1.6 2014 ............................................................... .42 .42 .43 .43 1.6 1.6 1.6 1.5 2015 ............................................................... .45 .46 .45 .51 1.6 1.6 1.6 1.7 2016 ............................................................... .50 .51 .50 .49 1.7 1.7 1.6 1.6
See footnotes at end of table.
-281-
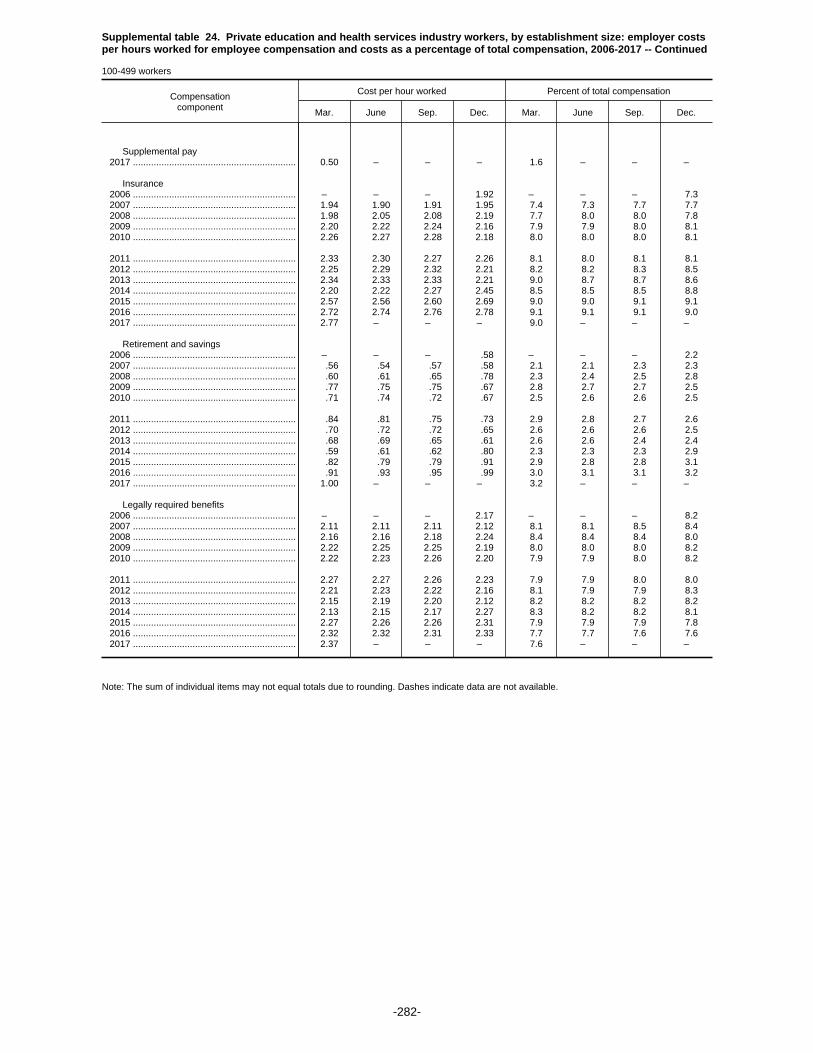
Supplemental table 24. Private education and health services industry workers, by establishment size: employer costsper hours worked for employee compensation and costs as a percentage of total compensation, 2006-2017 -- Continued
100-499 workers
Compensationcomponent
Cost per hour worked Percent of total compensation
Mar. June Sep. Dec. Mar. June Sep. Dec.
Supplemental pay 2017 ............................................................... 0.50 – – – 1.6 – – –
Insurance 2006 ............................................................... – – – 1.92 – – – 7.3 2007 ............................................................... 1.94 1.90 1.91 1.95 7.4 7.3 7.7 7.7 2008 ............................................................... 1.98 2.05 2.08 2.19 7.7 8.0 8.0 7.8 2009 ............................................................... 2.20 2.22 2.24 2.16 7.9 7.9 8.0 8.1 2010 ............................................................... 2.26 2.27 2.28 2.18 8.0 8.0 8.0 8.1
2011 ............................................................... 2.33 2.30 2.27 2.26 8.1 8.0 8.1 8.1 2012 ............................................................... 2.25 2.29 2.32 2.21 8.2 8.2 8.3 8.5 2013 ............................................................... 2.34 2.33 2.33 2.21 9.0 8.7 8.7 8.6 2014 ............................................................... 2.20 2.22 2.27 2.45 8.5 8.5 8.5 8.8 2015 ............................................................... 2.57 2.56 2.60 2.69 9.0 9.0 9.1 9.1 2016 ............................................................... 2.72 2.74 2.76 2.78 9.1 9.1 9.1 9.0 2017 ............................................................... 2.77 – – – 9.0 – – –
Retirement and savings 2006 ............................................................... – – – .58 – – – 2.2 2007 ............................................................... .56 .54 .57 .58 2.1 2.1 2.3 2.3 2008 ............................................................... .60 .61 .65 .78 2.3 2.4 2.5 2.8 2009 ............................................................... .77 .75 .75 .67 2.8 2.7 2.7 2.5 2010 ............................................................... .71 .74 .72 .67 2.5 2.6 2.6 2.5
2011 ............................................................... .84 .81 .75 .73 2.9 2.8 2.7 2.6 2012 ............................................................... .70 .72 .72 .65 2.6 2.6 2.6 2.5 2013 ............................................................... .68 .69 .65 .61 2.6 2.6 2.4 2.4 2014 ............................................................... .59 .61 .62 .80 2.3 2.3 2.3 2.9 2015 ............................................................... .82 .79 .79 .91 2.9 2.8 2.8 3.1 2016 ............................................................... .91 .93 .95 .99 3.0 3.1 3.1 3.2 2017 ............................................................... 1.00 – – – 3.2 – – –
Legally required benefits 2006 ............................................................... – – – 2.17 – – – 8.2 2007 ............................................................... 2.11 2.11 2.11 2.12 8.1 8.1 8.5 8.4 2008 ............................................................... 2.16 2.16 2.18 2.24 8.4 8.4 8.4 8.0 2009 ............................................................... 2.22 2.25 2.25 2.19 8.0 8.0 8.0 8.2 2010 ............................................................... 2.22 2.23 2.26 2.20 7.9 7.9 8.0 8.2
2011 ............................................................... 2.27 2.27 2.26 2.23 7.9 7.9 8.0 8.0 2012 ............................................................... 2.21 2.23 2.22 2.16 8.1 7.9 7.9 8.3 2013 ............................................................... 2.15 2.19 2.20 2.12 8.2 8.2 8.2 8.2 2014 ............................................................... 2.13 2.15 2.17 2.27 8.3 8.2 8.2 8.1 2015 ............................................................... 2.27 2.26 2.26 2.31 7.9 7.9 7.9 7.8 2016 ............................................................... 2.32 2.32 2.31 2.33 7.7 7.7 7.6 7.6 2017 ............................................................... 2.37 – – – 7.6 – – –
Note: The sum of individual items may not equal totals due to rounding. Dashes indicate data are not available.
-282-
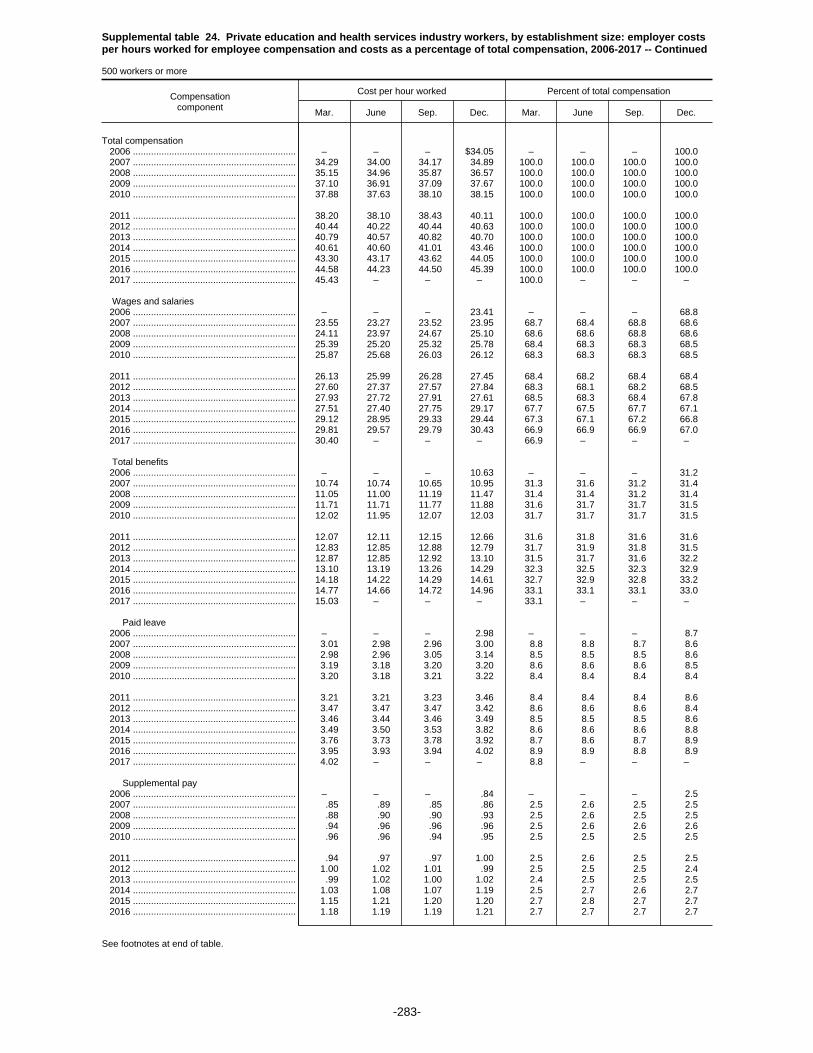
Supplemental table 24. Private education and health services industry workers, by establishment size: employer costsper hours worked for employee compensation and costs as a percentage of total compensation, 2006-2017 -- Continued
500 workers or more
Compensationcomponent
Cost per hour worked Percent of total compensation
Mar. June Sep. Dec. Mar. June Sep. Dec.
Total compensation 2006 ............................................................... – – – $34.05 – – – 100.0 2007 ............................................................... 34.29 34.00 34.17 34.89 100.0 100.0 100.0 100.0 2008 ............................................................... 35.15 34.96 35.87 36.57 100.0 100.0 100.0 100.0 2009 ............................................................... 37.10 36.91 37.09 37.67 100.0 100.0 100.0 100.0 2010 ............................................................... 37.88 37.63 38.10 38.15 100.0 100.0 100.0 100.0
2011 ............................................................... 38.20 38.10 38.43 40.11 100.0 100.0 100.0 100.0 2012 ............................................................... 40.44 40.22 40.44 40.63 100.0 100.0 100.0 100.0 2013 ............................................................... 40.79 40.57 40.82 40.70 100.0 100.0 100.0 100.0 2014 ............................................................... 40.61 40.60 41.01 43.46 100.0 100.0 100.0 100.0 2015 ............................................................... 43.30 43.17 43.62 44.05 100.0 100.0 100.0 100.0 2016 ............................................................... 44.58 44.23 44.50 45.39 100.0 100.0 100.0 100.0 2017 ............................................................... 45.43 – – – 100.0 – – –
Wages and salaries 2006 ............................................................... – – – 23.41 – – – 68.8 2007 ............................................................... 23.55 23.27 23.52 23.95 68.7 68.4 68.8 68.6 2008 ............................................................... 24.11 23.97 24.67 25.10 68.6 68.6 68.8 68.6 2009 ............................................................... 25.39 25.20 25.32 25.78 68.4 68.3 68.3 68.5 2010 ............................................................... 25.87 25.68 26.03 26.12 68.3 68.3 68.3 68.5
2011 ............................................................... 26.13 25.99 26.28 27.45 68.4 68.2 68.4 68.4 2012 ............................................................... 27.60 27.37 27.57 27.84 68.3 68.1 68.2 68.5 2013 ............................................................... 27.93 27.72 27.91 27.61 68.5 68.3 68.4 67.8 2014 ............................................................... 27.51 27.40 27.75 29.17 67.7 67.5 67.7 67.1 2015 ............................................................... 29.12 28.95 29.33 29.44 67.3 67.1 67.2 66.8 2016 ............................................................... 29.81 29.57 29.79 30.43 66.9 66.9 66.9 67.0 2017 ............................................................... 30.40 – – – 66.9 – – –
Total benefits 2006 ............................................................... – – – 10.63 – – – 31.2 2007 ............................................................... 10.74 10.74 10.65 10.95 31.3 31.6 31.2 31.4 2008 ............................................................... 11.05 11.00 11.19 11.47 31.4 31.4 31.2 31.4 2009 ............................................................... 11.71 11.71 11.77 11.88 31.6 31.7 31.7 31.5 2010 ............................................................... 12.02 11.95 12.07 12.03 31.7 31.7 31.7 31.5
2011 ............................................................... 12.07 12.11 12.15 12.66 31.6 31.8 31.6 31.6 2012 ............................................................... 12.83 12.85 12.88 12.79 31.7 31.9 31.8 31.5 2013 ............................................................... 12.87 12.85 12.92 13.10 31.5 31.7 31.6 32.2 2014 ............................................................... 13.10 13.19 13.26 14.29 32.3 32.5 32.3 32.9 2015 ............................................................... 14.18 14.22 14.29 14.61 32.7 32.9 32.8 33.2 2016 ............................................................... 14.77 14.66 14.72 14.96 33.1 33.1 33.1 33.0 2017 ............................................................... 15.03 – – – 33.1 – – –
Paid leave 2006 ............................................................... – – – 2.98 – – – 8.7 2007 ............................................................... 3.01 2.98 2.96 3.00 8.8 8.8 8.7 8.6 2008 ............................................................... 2.98 2.96 3.05 3.14 8.5 8.5 8.5 8.6 2009 ............................................................... 3.19 3.18 3.20 3.20 8.6 8.6 8.6 8.5 2010 ............................................................... 3.20 3.18 3.21 3.22 8.4 8.4 8.4 8.4
2011 ............................................................... 3.21 3.21 3.23 3.46 8.4 8.4 8.4 8.6 2012 ............................................................... 3.47 3.47 3.47 3.42 8.6 8.6 8.6 8.4 2013 ............................................................... 3.46 3.44 3.46 3.49 8.5 8.5 8.5 8.6 2014 ............................................................... 3.49 3.50 3.53 3.82 8.6 8.6 8.6 8.8 2015 ............................................................... 3.76 3.73 3.78 3.92 8.7 8.6 8.7 8.9 2016 ............................................................... 3.95 3.93 3.94 4.02 8.9 8.9 8.8 8.9 2017 ............................................................... 4.02 – – – 8.8 – – –
Supplemental pay 2006 ............................................................... – – – .84 – – – 2.5 2007 ............................................................... .85 .89 .85 .86 2.5 2.6 2.5 2.5 2008 ............................................................... .88 .90 .90 .93 2.5 2.6 2.5 2.5 2009 ............................................................... .94 .96 .96 .96 2.5 2.6 2.6 2.6 2010 ............................................................... .96 .96 .94 .95 2.5 2.5 2.5 2.5
2011 ............................................................... .94 .97 .97 1.00 2.5 2.6 2.5 2.5 2012 ............................................................... 1.00 1.02 1.01 .99 2.5 2.5 2.5 2.4 2013 ............................................................... .99 1.02 1.00 1.02 2.4 2.5 2.5 2.5 2014 ............................................................... 1.03 1.08 1.07 1.19 2.5 2.7 2.6 2.7 2015 ............................................................... 1.15 1.21 1.20 1.20 2.7 2.8 2.7 2.7 2016 ............................................................... 1.18 1.19 1.19 1.21 2.7 2.7 2.7 2.7
See footnotes at end of table.
-283-
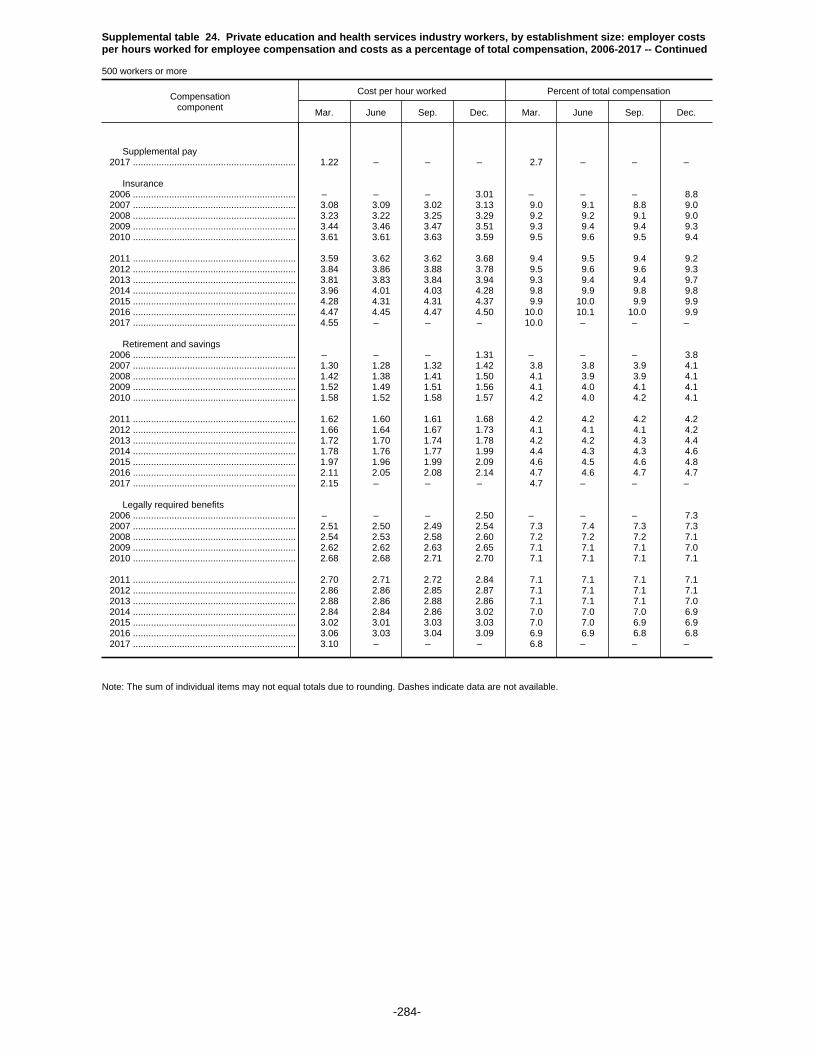
Supplemental table 24. Private education and health services industry workers, by establishment size: employer costsper hours worked for employee compensation and costs as a percentage of total compensation, 2006-2017 -- Continued
500 workers or more
Compensationcomponent
Cost per hour worked Percent of total compensation
Mar. June Sep. Dec. Mar. June Sep. Dec.
Supplemental pay 2017 ............................................................... 1.22 – – – 2.7 – – –
Insurance 2006 ............................................................... – – – 3.01 – – – 8.8 2007 ............................................................... 3.08 3.09 3.02 3.13 9.0 9.1 8.8 9.0 2008 ............................................................... 3.23 3.22 3.25 3.29 9.2 9.2 9.1 9.0 2009 ............................................................... 3.44 3.46 3.47 3.51 9.3 9.4 9.4 9.3 2010 ............................................................... 3.61 3.61 3.63 3.59 9.5 9.6 9.5 9.4
2011 ............................................................... 3.59 3.62 3.62 3.68 9.4 9.5 9.4 9.2 2012 ............................................................... 3.84 3.86 3.88 3.78 9.5 9.6 9.6 9.3 2013 ............................................................... 3.81 3.83 3.84 3.94 9.3 9.4 9.4 9.7 2014 ............................................................... 3.96 4.01 4.03 4.28 9.8 9.9 9.8 9.8 2015 ............................................................... 4.28 4.31 4.31 4.37 9.9 10.0 9.9 9.9 2016 ............................................................... 4.47 4.45 4.47 4.50 10.0 10.1 10.0 9.9 2017 ............................................................... 4.55 – – – 10.0 – – –
Retirement and savings 2006 ............................................................... – – – 1.31 – – – 3.8 2007 ............................................................... 1.30 1.28 1.32 1.42 3.8 3.8 3.9 4.1 2008 ............................................................... 1.42 1.38 1.41 1.50 4.1 3.9 3.9 4.1 2009 ............................................................... 1.52 1.49 1.51 1.56 4.1 4.0 4.1 4.1 2010 ............................................................... 1.58 1.52 1.58 1.57 4.2 4.0 4.2 4.1
2011 ............................................................... 1.62 1.60 1.61 1.68 4.2 4.2 4.2 4.2 2012 ............................................................... 1.66 1.64 1.67 1.73 4.1 4.1 4.1 4.2 2013 ............................................................... 1.72 1.70 1.74 1.78 4.2 4.2 4.3 4.4 2014 ............................................................... 1.78 1.76 1.77 1.99 4.4 4.3 4.3 4.6 2015 ............................................................... 1.97 1.96 1.99 2.09 4.6 4.5 4.6 4.8 2016 ............................................................... 2.11 2.05 2.08 2.14 4.7 4.6 4.7 4.7 2017 ............................................................... 2.15 – – – 4.7 – – –
Legally required benefits 2006 ............................................................... – – – 2.50 – – – 7.3 2007 ............................................................... 2.51 2.50 2.49 2.54 7.3 7.4 7.3 7.3 2008 ............................................................... 2.54 2.53 2.58 2.60 7.2 7.2 7.2 7.1 2009 ............................................................... 2.62 2.62 2.63 2.65 7.1 7.1 7.1 7.0 2010 ............................................................... 2.68 2.68 2.71 2.70 7.1 7.1 7.1 7.1
2011 ............................................................... 2.70 2.71 2.72 2.84 7.1 7.1 7.1 7.1 2012 ............................................................... 2.86 2.86 2.85 2.87 7.1 7.1 7.1 7.1 2013 ............................................................... 2.88 2.86 2.88 2.86 7.1 7.1 7.1 7.0 2014 ............................................................... 2.84 2.84 2.86 3.02 7.0 7.0 7.0 6.9 2015 ............................................................... 3.02 3.01 3.03 3.03 7.0 7.0 6.9 6.9 2016 ............................................................... 3.06 3.03 3.04 3.09 6.9 6.9 6.8 6.8 2017 ............................................................... 3.10 – – – 6.8 – – –
Note: The sum of individual items may not equal totals due to rounding. Dashes indicate data are not available.
-284-

Supplemental table 25. Private education and health services industry workers, by bargaining status: employer costsper hours worked for employee compensation and costs as a percentage of total compensation, 2006-2017
Union workers
Compensationcomponent
Cost per hour worked Percent of total compensation
Mar. June Sep. Dec. Mar. June Sep. Dec.
Total compensation 2006 ............................................................... – – – $31.71 – – – 100.0 2007 ............................................................... 31.97 31.85 32.04 32.63 100.0 100.0 100.0 100.0 2008 ............................................................... 33.28 33.51 33.95 33.75 100.0 100.0 100.0 100.0 2009 ............................................................... 34.70 34.71 35.15 34.32 100.0 100.0 100.0 100.0 2010 ............................................................... 34.54 34.49 34.89 34.77 100.0 100.0 100.0 100.0
2011 ............................................................... 35.56 35.52 35.68 37.62 100.0 100.0 100.0 100.0 2012 ............................................................... 37.79 37.86 38.29 40.36 100.0 100.0 100.0 100.0 2013 ............................................................... 40.84 41.22 41.17 42.53 100.0 100.0 100.0 100.0 2014 ............................................................... 55.06 54.86 49.90 61.17 100.0 100.0 100.0 100.0 2015 ............................................................... 59.61 59.66 56.59 48.37 100.0 100.0 100.0 100.0 2016 ............................................................... 48.73 61.89 48.66 63.61 100.0 100.0 100.0 100.0 2017 ............................................................... 63.39 – – – 100.0 – – –
Wages and salaries 2006 ............................................................... – – – 20.63 – – – 65.1 2007 ............................................................... 20.81 20.68 20.92 21.08 65.1 64.9 65.3 64.6 2008 ............................................................... 21.51 21.65 21.90 21.79 64.6 64.6 64.5 64.6 2009 ............................................................... 22.19 22.16 22.32 21.76 63.9 63.8 63.5 63.4 2010 ............................................................... 21.91 21.97 22.23 22.08 63.4 63.7 63.7 63.5
2011 ............................................................... 22.51 22.49 22.58 24.10 63.3 63.3 63.3 64.1 2012 ............................................................... 24.18 24.22 24.27 25.54 64.0 64.0 63.4 63.3 2013 ............................................................... 25.80 25.98 25.99 26.94 63.2 63.0 63.1 63.3 2014 ............................................................... 35.00 34.80 31.60 38.25 63.6 63.4 63.3 62.5 2015 ............................................................... 37.28 37.38 35.14 29.85 62.5 62.6 62.1 61.7 2016 ............................................................... 30.06 38.46 30.08 39.52 61.7 62.1 61.8 62.1 2017 ............................................................... 39.19 – – – 61.8 – – –
Total benefits 2006 ............................................................... – – – 11.08 – – – 34.9 2007 ............................................................... 11.16 11.16 11.12 11.55 34.9 35.1 34.7 35.4 2008 ............................................................... 11.77 11.85 12.05 11.96 35.4 35.4 35.5 35.4 2009 ............................................................... 12.51 12.55 12.83 12.56 36.1 36.2 36.5 36.6 2010 ............................................................... 12.63 12.52 12.66 12.69 36.6 36.3 36.3 36.5
2011 ............................................................... 13.05 13.03 13.10 13.51 36.7 36.7 36.7 35.9 2012 ............................................................... 13.61 13.65 14.02 14.82 36.0 36.0 36.6 36.7 2013 ............................................................... 15.05 15.23 15.18 15.59 36.8 37.0 36.9 36.7 2014 ............................................................... 20.06 20.06 18.30 22.92 36.4 36.6 36.7 37.5 2015 ............................................................... 22.34 22.29 21.44 18.52 37.5 37.4 37.9 38.3 2016 ............................................................... 18.67 23.43 18.58 24.09 38.3 37.9 38.2 37.9 2017 ............................................................... 24.20 – – – 38.2 – – –
Paid leave 2006 ............................................................... – – – 3.26 – – – 10.3 2007 ............................................................... 3.26 3.24 3.25 3.25 10.2 10.2 10.1 10.0 2008 ............................................................... 3.24 3.25 3.29 3.25 9.7 9.7 9.7 9.6 2009 ............................................................... 3.32 3.33 3.38 3.25 9.6 9.6 9.6 9.5 2010 ............................................................... 3.23 3.16 3.21 3.22 9.4 9.2 9.2 9.3
2011 ............................................................... 3.31 3.27 3.28 3.47 9.3 9.2 9.2 9.2 2012 ............................................................... 3.47 3.48 3.56 3.68 9.2 9.2 9.3 9.1 2013 ............................................................... 3.74 3.76 3.75 3.66 9.2 9.1 9.1 8.6 2014 ............................................................... 4.97 4.95 4.50 5.72 9.0 9.0 9.0 9.3 2015 ............................................................... 5.55 5.56 5.29 4.33 9.3 9.3 9.4 9.0 2016 ............................................................... 4.37 5.75 4.36 5.94 9.0 9.3 9.0 9.3 2017 ............................................................... 5.94 – – – 9.4 – – –
Supplemental pay 2006 ............................................................... – – – .84 – – – 2.6 2007 ............................................................... .85 .88 .85 .84 2.7 2.7 2.7 2.6 2008 ............................................................... .86 .88 .88 .85 2.6 2.6 2.6 2.5 2009 ............................................................... .92 .90 .94 .90 2.7 2.6 2.7 2.6 2010 ............................................................... .93 .91 .88 .88 2.7 2.6 2.5 2.5
2011 ............................................................... .91 .92 .93 .91 2.6 2.6 2.6 2.4 2012 ............................................................... .93 .92 .95 1.11 2.4 2.4 2.5 2.7 2013 ............................................................... 1.12 1.17 1.16 1.21 2.8 2.8 2.8 2.8 2014 ............................................................... 1.12 1.16 1.19 1.27 2.0 2.1 2.4 2.1 2015 ............................................................... 1.27 1.29 1.27 1.35 2.1 2.2 2.2 2.8 2016 ............................................................... 1.40 1.30 1.39 1.32 2.9 2.1 2.9 2.1
See footnotes at end of table.
-285-

Supplemental table 25. Private education and health services industry workers, by bargaining status: employer costsper hours worked for employee compensation and costs as a percentage of total compensation, 2006-2017
Union workers
Compensationcomponent
Cost per hour worked Percent of total compensation
Mar. June Sep. Dec. Mar. June Sep. Dec.
Supplemental pay 2017 ............................................................... 1.34 – – – 2.1 – – –
Insurance 2006 ............................................................... – – – 3.31 – – – 10.4 2007 ............................................................... 3.39 3.37 3.25 3.48 10.6 10.6 10.1 10.7 2008 ............................................................... 3.64 3.67 3.71 3.75 10.9 11.0 10.9 11.1 2009 ............................................................... 4.06 4.09 4.20 4.25 11.7 11.8 11.9 12.4 2010 ............................................................... 4.29 4.29 4.33 4.32 12.4 12.4 12.4 12.4
2011 ............................................................... 4.45 4.45 4.48 4.55 12.5 12.5 12.5 12.1 2012 ............................................................... 4.61 4.62 4.89 4.97 12.2 12.2 12.8 12.3 2013 ............................................................... 5.05 5.08 5.03 5.26 12.4 12.3 12.2 12.4 2014 ............................................................... 5.68 5.73 5.56 6.64 10.3 10.5 11.1 10.9 2015 ............................................................... 6.58 6.60 6.52 6.56 11.0 11.1 11.5 13.6 2016 ............................................................... 6.59 7.02 6.53 7.02 13.5 11.3 13.4 11.0 2017 ............................................................... 7.11 – – – 11.2 – – –
Retirement and savings 2006 ............................................................... – – – 1.07 – – – 3.4 2007 ............................................................... 1.06 1.07 1.22 1.37 3.3 3.4 3.8 4.2 2008 ............................................................... 1.39 1.39 1.50 1.52 4.2 4.2 4.4 4.5 2009 ............................................................... 1.59 1.57 1.62 1.58 4.6 4.5 4.6 4.6 2010 ............................................................... 1.60 1.57 1.61 1.65 4.6 4.5 4.6 4.7
2011 ............................................................... 1.72 1.71 1.71 1.68 4.8 4.8 4.8 4.5 2012 ............................................................... 1.66 1.67 1.71 1.97 4.4 4.4 4.5 4.9 2013 ............................................................... 2.03 2.13 2.14 2.25 5.0 5.2 5.2 5.3 2014 ............................................................... 4.77 4.69 3.63 5.54 8.7 8.6 7.3 9.1 2015 ............................................................... 5.37 5.28 4.85 2.92 9.0 8.9 8.6 6.0 2016 ............................................................... 2.96 5.73 2.98 6.12 6.1 9.3 6.1 9.6 2017 ............................................................... 6.07 – – – 9.6 – – –
Legally required benefits 2006 ............................................................... – – – 2.60 – – – 8.2 2007 ............................................................... 2.60 2.61 2.55 2.60 8.1 8.2 8.0 8.0 2008 ............................................................... 2.64 2.65 2.67 2.60 7.9 7.9 7.9 7.7 2009 ............................................................... 2.62 2.66 2.69 2.59 7.6 7.7 7.7 7.6 2010 ............................................................... 2.58 2.59 2.62 2.62 7.5 7.5 7.5 7.5
2011 ............................................................... 2.67 2.68 2.70 2.92 7.5 7.5 7.6 7.8 2012 ............................................................... 2.93 2.95 2.92 3.09 7.8 7.8 7.6 7.7 2013 ............................................................... 3.10 3.10 3.11 3.22 7.6 7.5 7.6 7.6 2014 ............................................................... 3.52 3.52 3.42 3.75 6.4 6.4 6.9 6.1 2015 ............................................................... 3.57 3.56 3.52 3.36 6.0 6.0 6.2 6.9 2016 ............................................................... 3.35 3.63 3.33 3.70 6.9 5.9 6.8 5.8 2017 ............................................................... 3.75 – – – 5.9 – – –
Note: The sum of individual items may not equal totals due to rounding. Dashes indicate data are not available.
-286-

Supplemental table 25. Private education and health services industry workers, by bargaining status: employer costsper hours worked for employee compensation and costs as a percentage of total compensation, 2006-2017 -- Continued
Nonunion workers1
Compensationcomponent
Cost per hour worked Percent of total compensation
Mar. June Sep. Dec. Mar. June Sep. Dec.
Total compensation 2006 ............................................................... – – – $27.03 – – – 100.0 2007 ............................................................... 27.29 27.22 27.09 28.25 100.0 100.0 100.0 100.0 2008 ............................................................... 28.29 28.25 28.67 28.81 100.0 100.0 100.0 100.0 2009 ............................................................... 28.90 28.90 29.10 28.77 100.0 100.0 100.0 100.0 2010 ............................................................... 29.27 29.14 29.43 29.25 100.0 100.0 100.0 100.0
2011 ............................................................... 29.84 29.64 29.45 29.93 100.0 100.0 100.0 100.0 2012 ............................................................... 30.06 30.27 30.22 29.80 100.0 100.0 100.0 100.0 2013 ............................................................... 29.82 30.02 30.14 30.15 100.0 100.0 100.0 100.0 2014 ............................................................... 30.11 30.24 30.37 30.79 100.0 100.0 100.0 100.0 2015 ............................................................... 30.95 30.61 31.01 31.63 100.0 100.0 100.0 100.0 2016 ............................................................... 32.02 31.72 32.01 32.45 100.0 100.0 100.0 100.0 2017 ............................................................... 32.56 – – – 100.0 – – –
Wages and salaries 2006 ............................................................... – – – 19.77 – – – 73.1 2007 ............................................................... 19.94 19.92 19.73 20.61 73.1 73.2 72.8 73.0 2008 ............................................................... 20.64 20.61 20.93 21.00 73.0 73.0 73.0 72.9 2009 ............................................................... 21.06 21.05 21.20 20.90 72.9 72.8 72.8 72.7 2010 ............................................................... 21.30 21.20 21.41 21.22 72.8 72.8 72.7 72.5
2011 ............................................................... 21.61 21.48 21.38 21.63 72.4 72.5 72.6 72.3 2012 ............................................................... 21.70 21.83 21.75 21.59 72.2 72.1 72.0 72.4 2013 ............................................................... 21.56 21.72 21.81 21.68 72.3 72.3 72.3 71.9 2014 ............................................................... 21.62 21.72 21.83 22.13 71.8 71.8 71.9 71.9 2015 ............................................................... 22.24 21.98 22.29 22.63 71.9 71.8 71.9 71.6 2016 ............................................................... 22.94 22.76 22.96 23.27 71.6 71.7 71.7 71.7 2017 ............................................................... 23.33 – – – 71.6 – – –
Total benefits 2006 ............................................................... – – – 7.26 – – – 26.9 2007 ............................................................... 7.35 7.30 7.36 7.64 26.9 26.8 27.2 27.0 2008 ............................................................... 7.65 7.64 7.74 7.81 27.0 27.0 27.0 27.1 2009 ............................................................... 7.84 7.85 7.90 7.87 27.1 27.2 27.2 27.3 2010 ............................................................... 7.97 7.94 8.03 8.03 27.2 27.2 27.3 27.5
2011 ............................................................... 8.22 8.16 8.07 8.30 27.6 27.5 27.4 27.7 2012 ............................................................... 8.36 8.44 8.47 8.21 27.8 27.9 28.0 27.6 2013 ............................................................... 8.26 8.30 8.34 8.47 27.7 27.7 27.7 28.1 2014 ............................................................... 8.48 8.51 8.54 8.66 28.2 28.2 28.1 28.1 2015 ............................................................... 8.71 8.63 8.72 9.00 28.1 28.2 28.1 28.4 2016 ............................................................... 9.08 8.96 9.05 9.18 28.4 28.3 28.3 28.3 2017 ............................................................... 9.23 – – – 28.4 – – –
Paid leave 2006 ............................................................... – – – 1.98 – – – 7.3 2007 ............................................................... 2.01 2.00 2.00 2.04 7.4 7.3 7.4 7.2 2008 ............................................................... 2.03 2.02 2.06 2.11 7.2 7.1 7.2 7.3 2009 ............................................................... 2.10 2.11 2.13 2.12 7.3 7.3 7.3 7.4 2010 ............................................................... 2.13 2.11 2.14 2.16 7.3 7.2 7.3 7.4
2011 ............................................................... 2.23 2.20 2.15 2.26 7.5 7.4 7.3 7.6 2012 ............................................................... 2.23 2.28 2.28 2.20 7.4 7.5 7.5 7.4 2013 ............................................................... 2.21 2.26 2.26 2.29 7.4 7.5 7.5 7.6 2014 ............................................................... 2.29 2.29 2.30 2.30 7.6 7.6 7.6 7.5 2015 ............................................................... 2.30 2.26 2.30 2.41 7.4 7.4 7.4 7.6 2016 ............................................................... 2.43 2.40 2.42 2.46 7.6 7.6 7.6 7.6 2017 ............................................................... 2.47 – – – 7.6 – – –
Supplemental pay 2006 ............................................................... – – – .51 – – – 1.9 2007 ............................................................... .52 .52 .52 .52 1.9 1.9 1.9 1.8 2008 ............................................................... .52 .52 .53 .53 1.8 1.9 1.8 1.8 2009 ............................................................... .53 .56 .55 .54 1.8 1.9 1.9 1.9 2010 ............................................................... .54 .54 .54 .53 1.8 1.9 1.8 1.8
2011 ............................................................... .55 .54 .54 .54 1.8 1.8 1.8 1.8 2012 ............................................................... .55 .54 .54 .53 1.8 1.8 1.8 1.8 2013 ............................................................... .51 .52 .52 .54 1.7 1.7 1.7 1.8 2014 ............................................................... .54 .56 .55 .55 1.8 1.8 1.8 1.8 2015 ............................................................... .54 .55 .56 .59 1.7 1.8 1.8 1.9 2016 ............................................................... .57 .57 .58 .58 1.8 1.8 1.8 1.8
See footnotes at end of table.
-287-
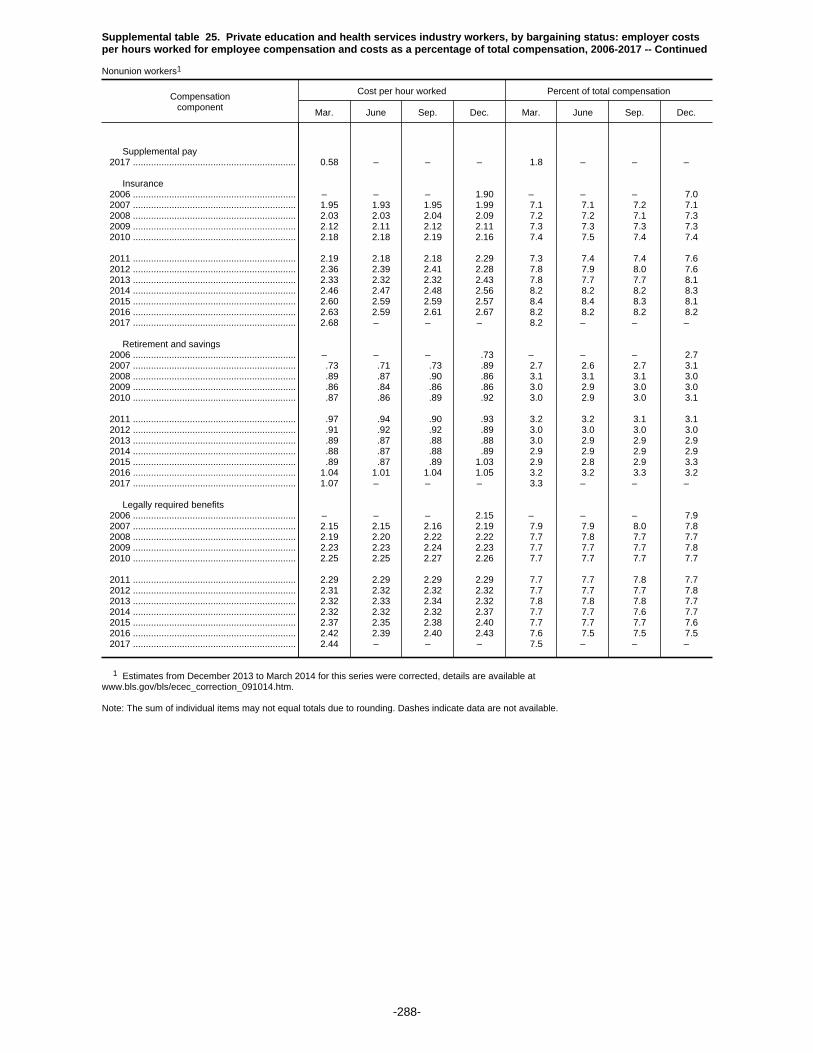
Supplemental table 25. Private education and health services industry workers, by bargaining status: employer costsper hours worked for employee compensation and costs as a percentage of total compensation, 2006-2017 -- Continued
Nonunion workers1
Compensationcomponent
Cost per hour worked Percent of total compensation
Mar. June Sep. Dec. Mar. June Sep. Dec.
Supplemental pay 2017 ............................................................... 0.58 – – – 1.8 – – –
Insurance 2006 ............................................................... – – – 1.90 – – – 7.0 2007 ............................................................... 1.95 1.93 1.95 1.99 7.1 7.1 7.2 7.1 2008 ............................................................... 2.03 2.03 2.04 2.09 7.2 7.2 7.1 7.3 2009 ............................................................... 2.12 2.11 2.12 2.11 7.3 7.3 7.3 7.3 2010 ............................................................... 2.18 2.18 2.19 2.16 7.4 7.5 7.4 7.4
2011 ............................................................... 2.19 2.18 2.18 2.29 7.3 7.4 7.4 7.6 2012 ............................................................... 2.36 2.39 2.41 2.28 7.8 7.9 8.0 7.6 2013 ............................................................... 2.33 2.32 2.32 2.43 7.8 7.7 7.7 8.1 2014 ............................................................... 2.46 2.47 2.48 2.56 8.2 8.2 8.2 8.3 2015 ............................................................... 2.60 2.59 2.59 2.57 8.4 8.4 8.3 8.1 2016 ............................................................... 2.63 2.59 2.61 2.67 8.2 8.2 8.2 8.2 2017 ............................................................... 2.68 – – – 8.2 – – –
Retirement and savings 2006 ............................................................... – – – .73 – – – 2.7 2007 ............................................................... .73 .71 .73 .89 2.7 2.6 2.7 3.1 2008 ............................................................... .89 .87 .90 .86 3.1 3.1 3.1 3.0 2009 ............................................................... .86 .84 .86 .86 3.0 2.9 3.0 3.0 2010 ............................................................... .87 .86 .89 .92 3.0 2.9 3.0 3.1
2011 ............................................................... .97 .94 .90 .93 3.2 3.2 3.1 3.1 2012 ............................................................... .91 .92 .92 .89 3.0 3.0 3.0 3.0 2013 ............................................................... .89 .87 .88 .88 3.0 2.9 2.9 2.9 2014 ............................................................... .88 .87 .88 .89 2.9 2.9 2.9 2.9 2015 ............................................................... .89 .87 .89 1.03 2.9 2.8 2.9 3.3 2016 ............................................................... 1.04 1.01 1.04 1.05 3.2 3.2 3.3 3.2 2017 ............................................................... 1.07 – – – 3.3 – – –
Legally required benefits 2006 ............................................................... – – – 2.15 – – – 7.9 2007 ............................................................... 2.15 2.15 2.16 2.19 7.9 7.9 8.0 7.8 2008 ............................................................... 2.19 2.20 2.22 2.22 7.7 7.8 7.7 7.7 2009 ............................................................... 2.23 2.23 2.24 2.23 7.7 7.7 7.7 7.8 2010 ............................................................... 2.25 2.25 2.27 2.26 7.7 7.7 7.7 7.7
2011 ............................................................... 2.29 2.29 2.29 2.29 7.7 7.7 7.8 7.7 2012 ............................................................... 2.31 2.32 2.32 2.32 7.7 7.7 7.7 7.8 2013 ............................................................... 2.32 2.33 2.34 2.32 7.8 7.8 7.8 7.7 2014 ............................................................... 2.32 2.32 2.32 2.37 7.7 7.7 7.6 7.7 2015 ............................................................... 2.37 2.35 2.38 2.40 7.7 7.7 7.7 7.6 2016 ............................................................... 2.42 2.39 2.40 2.43 7.6 7.5 7.5 7.5 2017 ............................................................... 2.44 – – – 7.5 – – –
1 Estimates from December 2013 to March 2014 for this series were corrected, details are available atwww.bls.gov/bls/ecec_correction_091014.htm.
Note: The sum of individual items may not equal totals due to rounding. Dashes indicate data are not available.
-288-
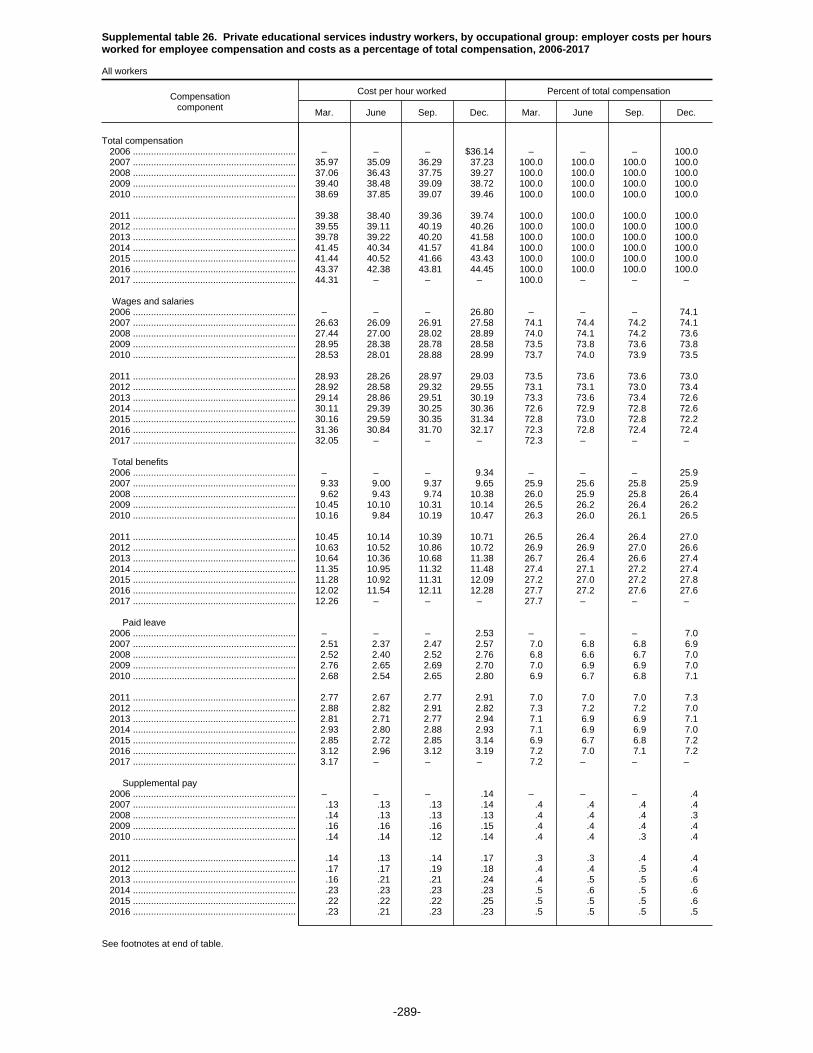
Supplemental table 26. Private educational services industry workers, by occupational group: employer costs per hoursworked for employee compensation and costs as a percentage of total compensation, 2006-2017
All workers
Compensationcomponent
Cost per hour worked Percent of total compensation
Mar. June Sep. Dec. Mar. June Sep. Dec.
Total compensation 2006 ............................................................... – – – $36.14 – – – 100.0 2007 ............................................................... 35.97 35.09 36.29 37.23 100.0 100.0 100.0 100.0 2008 ............................................................... 37.06 36.43 37.75 39.27 100.0 100.0 100.0 100.0 2009 ............................................................... 39.40 38.48 39.09 38.72 100.0 100.0 100.0 100.0 2010 ............................................................... 38.69 37.85 39.07 39.46 100.0 100.0 100.0 100.0
2011 ............................................................... 39.38 38.40 39.36 39.74 100.0 100.0 100.0 100.0 2012 ............................................................... 39.55 39.11 40.19 40.26 100.0 100.0 100.0 100.0 2013 ............................................................... 39.78 39.22 40.20 41.58 100.0 100.0 100.0 100.0 2014 ............................................................... 41.45 40.34 41.57 41.84 100.0 100.0 100.0 100.0 2015 ............................................................... 41.44 40.52 41.66 43.43 100.0 100.0 100.0 100.0 2016 ............................................................... 43.37 42.38 43.81 44.45 100.0 100.0 100.0 100.0 2017 ............................................................... 44.31 – – – 100.0 – – –
Wages and salaries 2006 ............................................................... – – – 26.80 – – – 74.1 2007 ............................................................... 26.63 26.09 26.91 27.58 74.1 74.4 74.2 74.1 2008 ............................................................... 27.44 27.00 28.02 28.89 74.0 74.1 74.2 73.6 2009 ............................................................... 28.95 28.38 28.78 28.58 73.5 73.8 73.6 73.8 2010 ............................................................... 28.53 28.01 28.88 28.99 73.7 74.0 73.9 73.5
2011 ............................................................... 28.93 28.26 28.97 29.03 73.5 73.6 73.6 73.0 2012 ............................................................... 28.92 28.58 29.32 29.55 73.1 73.1 73.0 73.4 2013 ............................................................... 29.14 28.86 29.51 30.19 73.3 73.6 73.4 72.6 2014 ............................................................... 30.11 29.39 30.25 30.36 72.6 72.9 72.8 72.6 2015 ............................................................... 30.16 29.59 30.35 31.34 72.8 73.0 72.8 72.2 2016 ............................................................... 31.36 30.84 31.70 32.17 72.3 72.8 72.4 72.4 2017 ............................................................... 32.05 – – – 72.3 – – –
Total benefits 2006 ............................................................... – – – 9.34 – – – 25.9 2007 ............................................................... 9.33 9.00 9.37 9.65 25.9 25.6 25.8 25.9 2008 ............................................................... 9.62 9.43 9.74 10.38 26.0 25.9 25.8 26.4 2009 ............................................................... 10.45 10.10 10.31 10.14 26.5 26.2 26.4 26.2 2010 ............................................................... 10.16 9.84 10.19 10.47 26.3 26.0 26.1 26.5
2011 ............................................................... 10.45 10.14 10.39 10.71 26.5 26.4 26.4 27.0 2012 ............................................................... 10.63 10.52 10.86 10.72 26.9 26.9 27.0 26.6 2013 ............................................................... 10.64 10.36 10.68 11.38 26.7 26.4 26.6 27.4 2014 ............................................................... 11.35 10.95 11.32 11.48 27.4 27.1 27.2 27.4 2015 ............................................................... 11.28 10.92 11.31 12.09 27.2 27.0 27.2 27.8 2016 ............................................................... 12.02 11.54 12.11 12.28 27.7 27.2 27.6 27.6 2017 ............................................................... 12.26 – – – 27.7 – – –
Paid leave 2006 ............................................................... – – – 2.53 – – – 7.0 2007 ............................................................... 2.51 2.37 2.47 2.57 7.0 6.8 6.8 6.9 2008 ............................................................... 2.52 2.40 2.52 2.76 6.8 6.6 6.7 7.0 2009 ............................................................... 2.76 2.65 2.69 2.70 7.0 6.9 6.9 7.0 2010 ............................................................... 2.68 2.54 2.65 2.80 6.9 6.7 6.8 7.1
2011 ............................................................... 2.77 2.67 2.77 2.91 7.0 7.0 7.0 7.3 2012 ............................................................... 2.88 2.82 2.91 2.82 7.3 7.2 7.2 7.0 2013 ............................................................... 2.81 2.71 2.77 2.94 7.1 6.9 6.9 7.1 2014 ............................................................... 2.93 2.80 2.88 2.93 7.1 6.9 6.9 7.0 2015 ............................................................... 2.85 2.72 2.85 3.14 6.9 6.7 6.8 7.2 2016 ............................................................... 3.12 2.96 3.12 3.19 7.2 7.0 7.1 7.2 2017 ............................................................... 3.17 – – – 7.2 – – –
Supplemental pay 2006 ............................................................... – – – .14 – – – .4 2007 ............................................................... .13 .13 .13 .14 .4 .4 .4 .4 2008 ............................................................... .14 .13 .13 .13 .4 .4 .4 .3 2009 ............................................................... .16 .16 .16 .15 .4 .4 .4 .4 2010 ............................................................... .14 .14 .12 .14 .4 .4 .3 .4
2011 ............................................................... .14 .13 .14 .17 .3 .3 .4 .4 2012 ............................................................... .17 .17 .19 .18 .4 .4 .5 .4 2013 ............................................................... .16 .21 .21 .24 .4 .5 .5 .6 2014 ............................................................... .23 .23 .23 .23 .5 .6 .5 .6 2015 ............................................................... .22 .22 .22 .25 .5 .5 .5 .6 2016 ............................................................... .23 .21 .23 .23 .5 .5 .5 .5
See footnotes at end of table.
-289-

Supplemental table 26. Private educational services industry workers, by occupational group: employer costs per hoursworked for employee compensation and costs as a percentage of total compensation, 2006-2017
All workers
Compensationcomponent
Cost per hour worked Percent of total compensation
Mar. June Sep. Dec. Mar. June Sep. Dec.
Supplemental pay 2017 ............................................................... 0.23 – – – 0.5 – – –
Insurance 2006 ............................................................... – – – 2.53 – – – 7.0 2007 ............................................................... 2.58 2.48 2.56 2.64 7.2 7.1 7.1 7.1 2008 ............................................................... 2.69 2.74 2.76 2.99 7.3 7.5 7.3 7.6 2009 ............................................................... 3.00 2.90 2.96 2.81 7.6 7.5 7.6 7.2 2010 ............................................................... 2.84 2.77 2.87 2.97 7.3 7.3 7.3 7.5
2011 ............................................................... 2.96 2.88 2.92 3.10 7.5 7.5 7.4 7.8 2012 ............................................................... 3.10 3.10 3.18 3.08 7.8 7.9 7.9 7.7 2013 ............................................................... 3.10 2.99 3.08 3.38 7.8 7.6 7.7 8.1 2014 ............................................................... 3.40 3.31 3.43 3.42 8.2 8.2 8.2 8.2 2015 ............................................................... 3.41 3.30 3.42 3.63 8.2 8.2 8.2 8.3 2016 ............................................................... 3.62 3.44 3.63 3.66 8.3 8.1 8.3 8.2 2017 ............................................................... 3.64 – – – 8.2 – – –
Retirement and savings 2006 ............................................................... – – – 1.48 – – – 4.1 2007 ............................................................... 1.46 1.37 1.51 1.56 4.0 3.9 4.2 4.2 2008 ............................................................... 1.54 1.44 1.56 1.70 4.1 4.0 4.1 4.3 2009 ............................................................... 1.71 1.61 1.69 1.72 4.3 4.2 4.3 4.4 2010 ............................................................... 1.71 1.63 1.73 1.74 4.4 4.3 4.4 4.4
2011 ............................................................... 1.75 1.65 1.73 1.71 4.5 4.3 4.4 4.3 2012 ............................................................... 1.65 1.61 1.70 1.72 4.2 4.1 4.2 4.3 2013 ............................................................... 1.72 1.61 1.71 1.85 4.3 4.1 4.3 4.4 2014 ............................................................... 1.84 1.72 1.83 1.92 4.4 4.3 4.4 4.6 2015 ............................................................... 1.84 1.76 1.85 1.98 4.4 4.3 4.4 4.6 2016 ............................................................... 1.97 1.92 2.05 2.11 4.5 4.5 4.7 4.7 2017 ............................................................... 2.11 – – – 4.8 – – –
Legally required benefits 2006 ............................................................... – – – 2.67 – – – 7.4 2007 ............................................................... 2.66 2.66 2.70 2.75 7.4 7.6 7.4 7.4 2008 ............................................................... 2.74 2.72 2.76 2.80 7.4 7.5 7.3 7.1 2009 ............................................................... 2.82 2.79 2.82 2.77 7.2 7.2 7.2 7.2 2010 ............................................................... 2.79 2.76 2.83 2.82 7.2 7.3 7.2 7.1
2011 ............................................................... 2.83 2.79 2.83 2.82 7.2 7.3 7.2 7.1 2012 ............................................................... 2.83 2.82 2.88 2.91 7.2 7.2 7.2 7.2 2013 ............................................................... 2.85 2.84 2.90 2.97 7.2 7.3 7.2 7.1 2014 ............................................................... 2.95 2.90 2.94 2.97 7.1 7.2 7.1 7.1 2015 ............................................................... 2.96 2.92 2.97 3.09 7.1 7.2 7.1 7.1 2016 ............................................................... 3.09 3.02 3.07 3.10 7.1 7.1 7.0 7.0 2017 ............................................................... 3.10 – – – 7.0 – – –
Note: The sum of individual items may not equal totals due to rounding. Dashes indicate data are not available.
-290-

Supplemental table 26. Private educational services industry workers, by occupational group: employer costs perhours worked for employee compensation and costs as a percentage of total compensation, 2006-2017 -- Continued
Management, professional, and related occupations1
Compensationcomponent
Cost per hour worked Percent of total compensation
Mar. June Sep. Dec. Mar. June Sep. Dec.
Total compensation 2006 ............................................................... – – – $42.94 – – – 100.0 2007 ............................................................... 42.66 41.55 42.91 44.20 100.0 100.0 100.0 100.0 2008 ............................................................... 43.80 42.86 44.43 46.25 100.0 100.0 100.0 100.0 2009 ............................................................... 46.38 45.24 45.84 45.06 100.0 100.0 100.0 100.0 2010 ............................................................... 44.98 43.85 45.39 45.88 100.0 100.0 100.0 100.0
2011 ............................................................... 45.75 44.54 45.68 45.41 100.0 100.0 100.0 100.0 2012 ............................................................... 45.15 44.45 45.72 46.07 100.0 100.0 100.0 100.0 2013 ............................................................... 45.48 44.65 45.81 46.73 100.0 100.0 100.0 100.0 2014 ............................................................... 46.41 45.13 46.42 47.34 100.0 100.0 100.0 100.0 2015 ............................................................... 46.62 45.42 46.75 48.44 100.0 100.0 100.0 100.0 2016 ............................................................... 48.34 46.99 48.63 49.46 100.0 100.0 100.0 100.0 2017 ............................................................... 49.27 – – – 100.0 – – –
Wages and salaries 2006 ............................................................... – – – 32.33 – – – 75.3 2007 ............................................................... 32.07 31.32 32.29 33.23 75.2 75.4 75.2 75.2 2008 ............................................................... 32.89 32.21 33.47 34.54 75.1 75.1 75.3 74.7 2009 ............................................................... 34.60 33.82 34.21 33.66 74.6 74.8 74.6 74.7 2010 ............................................................... 33.58 32.83 33.97 34.16 74.6 74.9 74.8 74.4
2011 ............................................................... 34.06 33.19 34.07 33.60 74.5 74.5 74.6 74.0 2012 ............................................................... 33.44 32.91 33.80 34.28 74.1 74.0 73.9 74.4 2013 ............................................................... 33.78 33.30 34.10 34.40 74.3 74.6 74.4 73.6 2014 ............................................................... 34.17 33.30 34.22 34.79 73.6 73.8 73.7 73.5 2015 ............................................................... 34.37 33.60 34.50 35.36 73.7 74.0 73.8 73.0 2016 ............................................................... 35.36 34.57 35.60 36.22 73.1 73.6 73.2 73.2 2017 ............................................................... 36.07 – – – 73.2 – – –
Total benefits 2006 ............................................................... – – – 10.61 – – – 24.7 2007 ............................................................... 10.59 10.23 10.63 10.97 24.8 24.6 24.8 24.8 2008 ............................................................... 10.91 10.66 10.96 11.71 24.9 24.9 24.7 25.3 2009 ............................................................... 11.78 11.41 11.63 11.40 25.4 25.2 25.4 25.3 2010 ............................................................... 11.40 11.02 11.42 11.72 25.4 25.1 25.2 25.6
2011 ............................................................... 11.69 11.35 11.61 11.81 25.5 25.5 25.4 26.0 2012 ............................................................... 11.70 11.55 11.91 11.79 25.9 26.0 26.1 25.6 2013 ............................................................... 11.71 11.34 11.71 12.33 25.7 25.4 25.6 26.4 2014 ............................................................... 12.24 11.84 12.19 12.55 26.4 26.2 26.3 26.5 2015 ............................................................... 12.25 11.83 12.26 13.08 26.3 26.0 26.2 27.0 2016 ............................................................... 12.98 12.42 13.03 13.24 26.9 26.4 26.8 26.8 2017 ............................................................... 13.20 – – – 26.8 – – –
Paid leave 2006 ............................................................... – – – 2.90 – – – 6.8 2007 ............................................................... 2.87 2.71 2.82 2.93 6.7 6.5 6.6 6.6 2008 ............................................................... 2.86 2.73 2.86 3.14 6.5 6.4 6.4 6.8 2009 ............................................................... 3.14 3.02 3.06 3.04 6.8 6.7 6.7 6.8 2010 ............................................................... 3.02 2.85 2.97 3.16 6.7 6.5 6.5 6.9
2011 ............................................................... 3.12 3.02 3.12 3.21 6.8 6.8 6.8 7.1 2012 ............................................................... 3.17 3.09 3.20 3.08 7.0 6.9 7.0 6.7 2013 ............................................................... 3.07 2.95 3.02 3.19 6.7 6.6 6.6 6.8 2014 ............................................................... 3.16 3.02 3.11 3.21 6.8 6.7 6.7 6.8 2015 ............................................................... 3.09 2.95 3.09 3.42 6.6 6.5 6.6 7.1 2016 ............................................................... 3.39 3.19 3.37 3.45 7.0 6.8 6.9 7.0 2017 ............................................................... 3.43 – – – 7.0 – – –
Supplemental pay 2006 ............................................................... – – – .13 – – – .3 2007 ............................................................... .12 .13 .12 .13 .3 .3 .3 .3 2008 ............................................................... .13 .12 .12 .12 .3 .3 .3 .3 2009 ............................................................... .16 .16 .16 .15 .3 .4 .3 .3 2010 ............................................................... .15 .15 .11 .14 .3 .3 .2 .3
2011 ............................................................... .13 .13 .14 .17 .3 .3 .3 .4 2012 ............................................................... .16 .17 .19 .18 .4 .4 .4 .4 2013 ............................................................... .16 .21 .21 .24 .4 .5 .5 .5 2014 ............................................................... .22 .23 .22 .24 .5 .5 .5 .5 2015 ............................................................... .23 .22 .23 .26 .5 .5 .5 .5 2016 ............................................................... .23 .22 .23 .23 .5 .5 .5 .5
See footnotes at end of table.
-291-
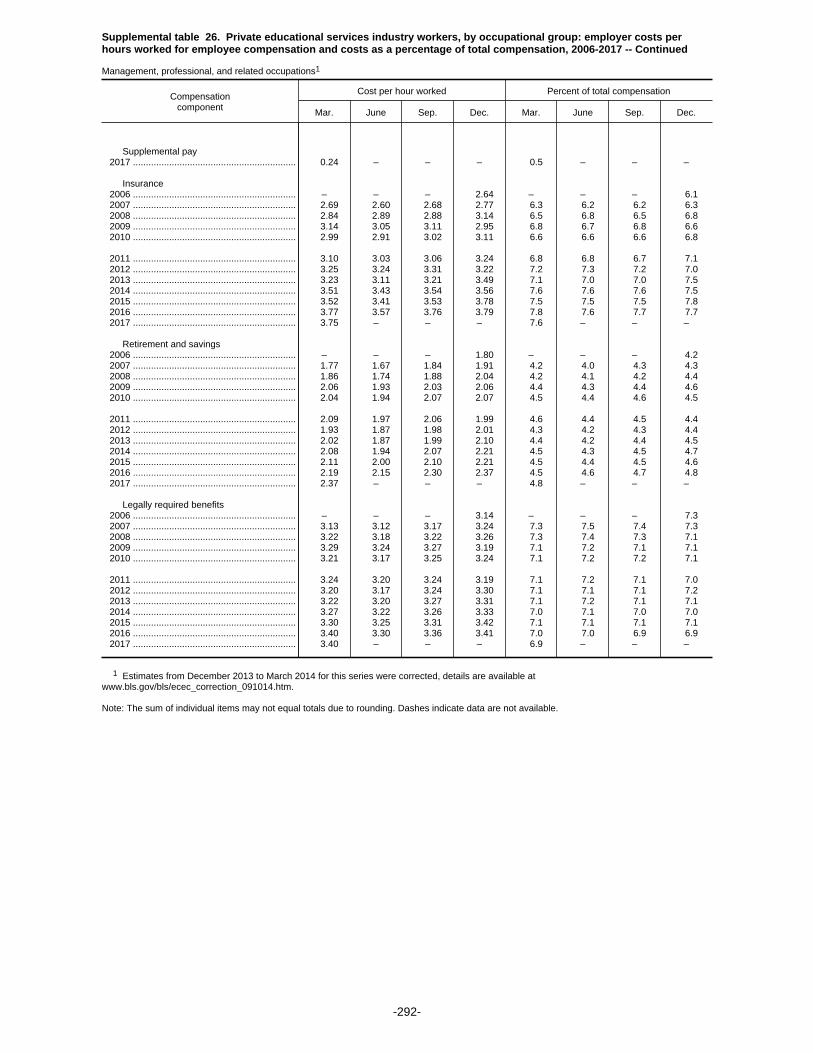
Supplemental table 26. Private educational services industry workers, by occupational group: employer costs perhours worked for employee compensation and costs as a percentage of total compensation, 2006-2017 -- Continued
Management, professional, and related occupations1
Compensationcomponent
Cost per hour worked Percent of total compensation
Mar. June Sep. Dec. Mar. June Sep. Dec.
Supplemental pay 2017 ............................................................... 0.24 – – – 0.5 – – –
Insurance 2006 ............................................................... – – – 2.64 – – – 6.1 2007 ............................................................... 2.69 2.60 2.68 2.77 6.3 6.2 6.2 6.3 2008 ............................................................... 2.84 2.89 2.88 3.14 6.5 6.8 6.5 6.8 2009 ............................................................... 3.14 3.05 3.11 2.95 6.8 6.7 6.8 6.6 2010 ............................................................... 2.99 2.91 3.02 3.11 6.6 6.6 6.6 6.8
2011 ............................................................... 3.10 3.03 3.06 3.24 6.8 6.8 6.7 7.1 2012 ............................................................... 3.25 3.24 3.31 3.22 7.2 7.3 7.2 7.0 2013 ............................................................... 3.23 3.11 3.21 3.49 7.1 7.0 7.0 7.5 2014 ............................................................... 3.51 3.43 3.54 3.56 7.6 7.6 7.6 7.5 2015 ............................................................... 3.52 3.41 3.53 3.78 7.5 7.5 7.5 7.8 2016 ............................................................... 3.77 3.57 3.76 3.79 7.8 7.6 7.7 7.7 2017 ............................................................... 3.75 – – – 7.6 – – –
Retirement and savings 2006 ............................................................... – – – 1.80 – – – 4.2 2007 ............................................................... 1.77 1.67 1.84 1.91 4.2 4.0 4.3 4.3 2008 ............................................................... 1.86 1.74 1.88 2.04 4.2 4.1 4.2 4.4 2009 ............................................................... 2.06 1.93 2.03 2.06 4.4 4.3 4.4 4.6 2010 ............................................................... 2.04 1.94 2.07 2.07 4.5 4.4 4.6 4.5
2011 ............................................................... 2.09 1.97 2.06 1.99 4.6 4.4 4.5 4.4 2012 ............................................................... 1.93 1.87 1.98 2.01 4.3 4.2 4.3 4.4 2013 ............................................................... 2.02 1.87 1.99 2.10 4.4 4.2 4.4 4.5 2014 ............................................................... 2.08 1.94 2.07 2.21 4.5 4.3 4.5 4.7 2015 ............................................................... 2.11 2.00 2.10 2.21 4.5 4.4 4.5 4.6 2016 ............................................................... 2.19 2.15 2.30 2.37 4.5 4.6 4.7 4.8 2017 ............................................................... 2.37 – – – 4.8 – – –
Legally required benefits 2006 ............................................................... – – – 3.14 – – – 7.3 2007 ............................................................... 3.13 3.12 3.17 3.24 7.3 7.5 7.4 7.3 2008 ............................................................... 3.22 3.18 3.22 3.26 7.3 7.4 7.3 7.1 2009 ............................................................... 3.29 3.24 3.27 3.19 7.1 7.2 7.1 7.1 2010 ............................................................... 3.21 3.17 3.25 3.24 7.1 7.2 7.2 7.1
2011 ............................................................... 3.24 3.20 3.24 3.19 7.1 7.2 7.1 7.0 2012 ............................................................... 3.20 3.17 3.24 3.30 7.1 7.1 7.1 7.2 2013 ............................................................... 3.22 3.20 3.27 3.31 7.1 7.2 7.1 7.1 2014 ............................................................... 3.27 3.22 3.26 3.33 7.0 7.1 7.0 7.0 2015 ............................................................... 3.30 3.25 3.31 3.42 7.1 7.1 7.1 7.1 2016 ............................................................... 3.40 3.30 3.36 3.41 7.0 7.0 6.9 6.9 2017 ............................................................... 3.40 – – – 6.9 – – –
1 Estimates from December 2013 to March 2014 for this series were corrected, details are available atwww.bls.gov/bls/ecec_correction_091014.htm.
Note: The sum of individual items may not equal totals due to rounding. Dashes indicate data are not available.
-292-
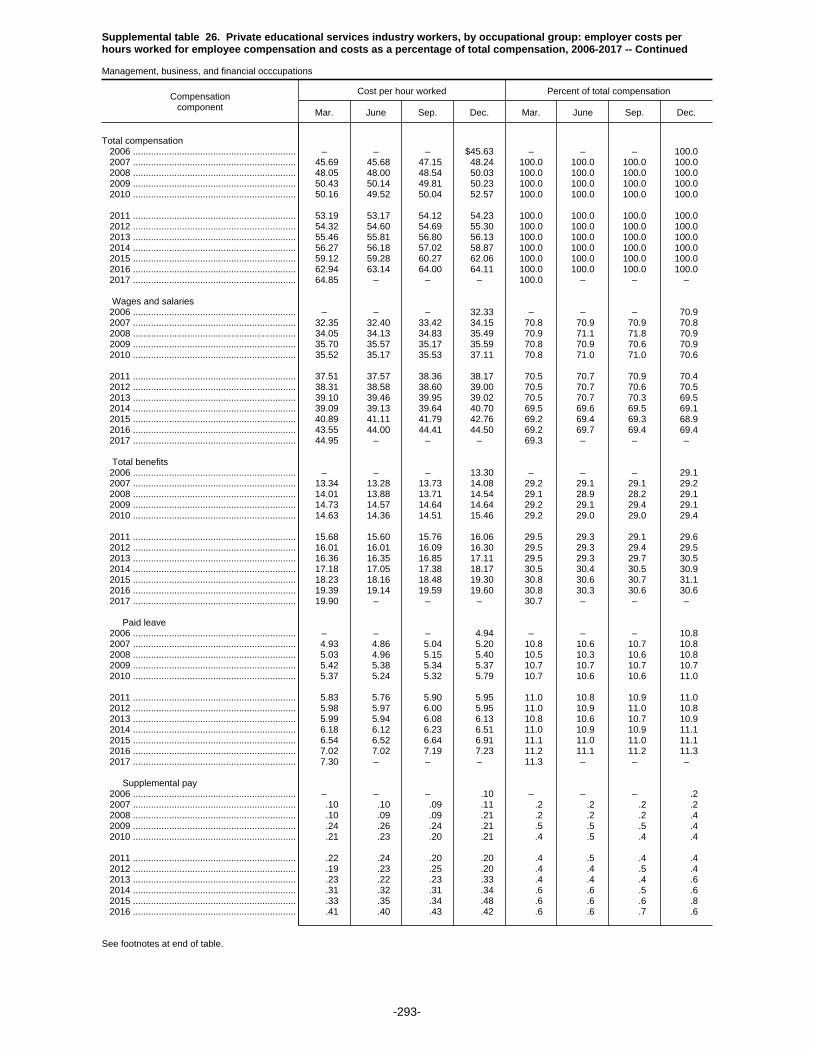
Supplemental table 26. Private educational services industry workers, by occupational group: employer costs perhours worked for employee compensation and costs as a percentage of total compensation, 2006-2017 -- Continued
Management, business, and financial occcupations
Compensationcomponent
Cost per hour worked Percent of total compensation
Mar. June Sep. Dec. Mar. June Sep. Dec.
Total compensation 2006 ............................................................... – – – $45.63 – – – 100.0 2007 ............................................................... 45.69 45.68 47.15 48.24 100.0 100.0 100.0 100.0 2008 ............................................................... 48.05 48.00 48.54 50.03 100.0 100.0 100.0 100.0 2009 ............................................................... 50.43 50.14 49.81 50.23 100.0 100.0 100.0 100.0 2010 ............................................................... 50.16 49.52 50.04 52.57 100.0 100.0 100.0 100.0
2011 ............................................................... 53.19 53.17 54.12 54.23 100.0 100.0 100.0 100.0 2012 ............................................................... 54.32 54.60 54.69 55.30 100.0 100.0 100.0 100.0 2013 ............................................................... 55.46 55.81 56.80 56.13 100.0 100.0 100.0 100.0 2014 ............................................................... 56.27 56.18 57.02 58.87 100.0 100.0 100.0 100.0 2015 ............................................................... 59.12 59.28 60.27 62.06 100.0 100.0 100.0 100.0 2016 ............................................................... 62.94 63.14 64.00 64.11 100.0 100.0 100.0 100.0 2017 ............................................................... 64.85 – – – 100.0 – – –
Wages and salaries 2006 ............................................................... – – – 32.33 – – – 70.9 2007 ............................................................... 32.35 32.40 33.42 34.15 70.8 70.9 70.9 70.8 2008 ............................................................... 34.05 34.13 34.83 35.49 70.9 71.1 71.8 70.9 2009 ............................................................... 35.70 35.57 35.17 35.59 70.8 70.9 70.6 70.9 2010 ............................................................... 35.52 35.17 35.53 37.11 70.8 71.0 71.0 70.6
2011 ............................................................... 37.51 37.57 38.36 38.17 70.5 70.7 70.9 70.4 2012 ............................................................... 38.31 38.58 38.60 39.00 70.5 70.7 70.6 70.5 2013 ............................................................... 39.10 39.46 39.95 39.02 70.5 70.7 70.3 69.5 2014 ............................................................... 39.09 39.13 39.64 40.70 69.5 69.6 69.5 69.1 2015 ............................................................... 40.89 41.11 41.79 42.76 69.2 69.4 69.3 68.9 2016 ............................................................... 43.55 44.00 44.41 44.50 69.2 69.7 69.4 69.4 2017 ............................................................... 44.95 – – – 69.3 – – –
Total benefits 2006 ............................................................... – – – 13.30 – – – 29.1 2007 ............................................................... 13.34 13.28 13.73 14.08 29.2 29.1 29.1 29.2 2008 ............................................................... 14.01 13.88 13.71 14.54 29.1 28.9 28.2 29.1 2009 ............................................................... 14.73 14.57 14.64 14.64 29.2 29.1 29.4 29.1 2010 ............................................................... 14.63 14.36 14.51 15.46 29.2 29.0 29.0 29.4
2011 ............................................................... 15.68 15.60 15.76 16.06 29.5 29.3 29.1 29.6 2012 ............................................................... 16.01 16.01 16.09 16.30 29.5 29.3 29.4 29.5 2013 ............................................................... 16.36 16.35 16.85 17.11 29.5 29.3 29.7 30.5 2014 ............................................................... 17.18 17.05 17.38 18.17 30.5 30.4 30.5 30.9 2015 ............................................................... 18.23 18.16 18.48 19.30 30.8 30.6 30.7 31.1 2016 ............................................................... 19.39 19.14 19.59 19.60 30.8 30.3 30.6 30.6 2017 ............................................................... 19.90 – – – 30.7 – – –
Paid leave 2006 ............................................................... – – – 4.94 – – – 10.8 2007 ............................................................... 4.93 4.86 5.04 5.20 10.8 10.6 10.7 10.8 2008 ............................................................... 5.03 4.96 5.15 5.40 10.5 10.3 10.6 10.8 2009 ............................................................... 5.42 5.38 5.34 5.37 10.7 10.7 10.7 10.7 2010 ............................................................... 5.37 5.24 5.32 5.79 10.7 10.6 10.6 11.0
2011 ............................................................... 5.83 5.76 5.90 5.95 11.0 10.8 10.9 11.0 2012 ............................................................... 5.98 5.97 6.00 5.95 11.0 10.9 11.0 10.8 2013 ............................................................... 5.99 5.94 6.08 6.13 10.8 10.6 10.7 10.9 2014 ............................................................... 6.18 6.12 6.23 6.51 11.0 10.9 10.9 11.1 2015 ............................................................... 6.54 6.52 6.64 6.91 11.1 11.0 11.0 11.1 2016 ............................................................... 7.02 7.02 7.19 7.23 11.2 11.1 11.2 11.3 2017 ............................................................... 7.30 – – – 11.3 – – –
Supplemental pay 2006 ............................................................... – – – .10 – – – .2 2007 ............................................................... .10 .10 .09 .11 .2 .2 .2 .2 2008 ............................................................... .10 .09 .09 .21 .2 .2 .2 .4 2009 ............................................................... .24 .26 .24 .21 .5 .5 .5 .4 2010 ............................................................... .21 .23 .20 .21 .4 .5 .4 .4
2011 ............................................................... .22 .24 .20 .20 .4 .5 .4 .4 2012 ............................................................... .19 .23 .25 .20 .4 .4 .5 .4 2013 ............................................................... .23 .22 .23 .33 .4 .4 .4 .6 2014 ............................................................... .31 .32 .31 .34 .6 .6 .5 .6 2015 ............................................................... .33 .35 .34 .48 .6 .6 .6 .8 2016 ............................................................... .41 .40 .43 .42 .6 .6 .7 .6
See footnotes at end of table.
-293-

Supplemental table 26. Private educational services industry workers, by occupational group: employer costs perhours worked for employee compensation and costs as a percentage of total compensation, 2006-2017 -- Continued
Management, business, and financial occcupations
Compensationcomponent
Cost per hour worked Percent of total compensation
Mar. June Sep. Dec. Mar. June Sep. Dec.
Supplemental pay 2017 ............................................................... 0.44 – – – 0.7 – – –
Insurance 2006 ............................................................... – – – 3.06 – – – 6.7 2007 ............................................................... 3.12 3.07 3.15 3.18 6.8 6.7 6.7 6.6 2008 ............................................................... 3.42 3.42 3.02 3.19 7.1 7.1 6.2 6.4 2009 ............................................................... 3.22 3.17 3.35 3.32 6.4 6.3 6.7 6.6 2010 ............................................................... 3.33 3.28 3.32 3.51 6.6 6.6 6.6 6.7
2011 ............................................................... 3.57 3.59 3.48 3.73 6.7 6.7 6.4 6.9 2012 ............................................................... 3.83 3.82 3.82 3.93 7.0 7.0 7.0 7.1 2013 ............................................................... 3.97 4.01 4.17 4.25 7.2 7.2 7.3 7.6 2014 ............................................................... 4.28 4.26 4.35 4.47 7.6 7.6 7.6 7.6 2015 ............................................................... 4.52 4.51 4.58 4.61 7.6 7.6 7.6 7.4 2016 ............................................................... 4.62 4.45 4.56 4.54 7.3 7.0 7.1 7.1 2017 ............................................................... 4.62 – – – 7.1 – – –
Retirement and savings 2006 ............................................................... – – – 2.08 – – – 4.6 2007 ............................................................... 2.05 2.00 2.15 2.25 4.5 4.4 4.6 4.7 2008 ............................................................... 2.11 2.05 2.14 2.34 4.4 4.3 4.4 4.7 2009 ............................................................... 2.40 2.27 2.26 2.30 4.8 4.5 4.5 4.6 2010 ............................................................... 2.28 2.18 2.21 2.47 4.5 4.4 4.4 4.7
2011 ............................................................... 2.54 2.46 2.57 2.61 4.8 4.6 4.8 4.8 2012 ............................................................... 2.41 2.38 2.40 2.60 4.4 4.4 4.4 4.7 2013 ............................................................... 2.54 2.51 2.64 2.73 4.6 4.5 4.6 4.9 2014 ............................................................... 2.73 2.67 2.77 3.05 4.8 4.8 4.9 5.2 2015 ............................................................... 3.02 2.94 3.04 3.27 5.1 5.0 5.0 5.3 2016 ............................................................... 3.30 3.22 3.32 3.32 5.2 5.1 5.2 5.2 2017 ............................................................... 3.37 – – – 5.2 – – –
Legally required benefits 2006 ............................................................... – – – 3.12 – – – 6.8 2007 ............................................................... 3.13 3.25 3.30 3.34 6.9 7.1 7.0 6.9 2008 ............................................................... 3.35 3.36 3.30 3.41 7.0 7.0 6.8 6.8 2009 ............................................................... 3.45 3.49 3.44 3.44 6.8 7.0 6.9 6.8 2010 ............................................................... 3.45 3.43 3.46 3.48 6.9 6.9 6.9 6.6
2011 ............................................................... 3.52 3.55 3.61 3.57 6.6 6.7 6.7 6.6 2012 ............................................................... 3.60 3.62 3.62 3.62 6.6 6.6 6.6 6.6 2013 ............................................................... 3.64 3.66 3.73 3.66 6.6 6.6 6.6 6.5 2014 ............................................................... 3.68 3.68 3.73 3.80 6.5 6.6 6.5 6.5 2015 ............................................................... 3.82 3.85 3.88 4.03 6.5 6.5 6.4 6.5 2016 ............................................................... 4.04 4.06 4.09 4.10 6.4 6.4 6.4 6.4 2017 ............................................................... 4.17 – – – 6.4 – – –
Note: The sum of individual items may not equal totals due to rounding. Dashes indicate data are not available.
-294-

Supplemental table 26. Private educational services industry workers, by occupational group: employer costs perhours worked for employee compensation and costs as a percentage of total compensation, 2006-2017 -- Continued
Professional and related occupations1
Compensationcomponent
Cost per hour worked Percent of total compensation
Mar. June Sep. Dec. Mar. June Sep. Dec.
Total compensation 2006 ............................................................... – – – $42.47 – – – 100.0 2007 ............................................................... 42.13 40.87 42.21 43.52 100.0 100.0 100.0 100.0 2008 ............................................................... 43.08 42.03 43.76 45.57 100.0 100.0 100.0 100.0 2009 ............................................................... 45.67 44.40 45.15 44.11 100.0 100.0 100.0 100.0 2010 ............................................................... 44.04 42.83 44.53 44.67 100.0 100.0 100.0 100.0
2011 ............................................................... 44.43 43.09 44.25 43.75 100.0 100.0 100.0 100.0 2012 ............................................................... 43.44 42.62 44.06 44.39 100.0 100.0 100.0 100.0 2013 ............................................................... 43.64 42.73 43.91 44.98 100.0 100.0 100.0 100.0 2014 ............................................................... 44.60 43.17 44.54 45.23 100.0 100.0 100.0 100.0 2015 ............................................................... 44.43 43.12 44.45 46.00 100.0 100.0 100.0 100.0 2016 ............................................................... 45.76 44.28 46.06 46.96 100.0 100.0 100.0 100.0 2017 ............................................................... 46.63 – – – 100.0 – – –
Wages and salaries 2006 ............................................................... – – – 32.33 – – – 76.1 2007 ............................................................... 32.02 31.15 32.10 33.07 76.0 76.2 76.0 76.0 2008 ............................................................... 32.69 31.90 33.25 34.37 75.9 75.9 76.0 75.4 2009 ............................................................... 34.40 33.52 34.04 33.31 75.3 75.5 75.4 75.5 2010 ............................................................... 33.22 32.41 33.68 33.62 75.4 75.7 75.6 75.3
2011 ............................................................... 33.45 32.46 33.34 32.75 75.3 75.3 75.3 74.8 2012 ............................................................... 32.54 31.88 32.92 33.42 74.9 74.8 74.7 75.3 2013 ............................................................... 32.79 32.25 33.09 33.54 75.1 75.5 75.4 74.6 2014 ............................................................... 33.26 32.26 33.27 33.70 74.6 74.7 74.7 74.5 2015 ............................................................... 33.23 32.35 33.26 34.04 74.8 75.0 74.8 74.0 2016 ............................................................... 33.91 32.99 34.12 34.80 74.1 74.5 74.1 74.1 2017 ............................................................... 34.56 – – – 74.1 – – –
Total benefits 2006 ............................................................... – – – 10.14 – – – 23.9 2007 ............................................................... 10.12 9.73 10.11 10.45 24.0 23.8 24.0 24.0 2008 ............................................................... 10.39 10.14 10.51 11.20 24.1 24.1 24.0 24.6 2009 ............................................................... 11.26 10.87 11.11 10.81 24.7 24.5 24.6 24.5 2010 ............................................................... 10.82 10.42 10.85 11.05 24.6 24.3 24.4 24.7
2011 ............................................................... 10.98 10.63 10.91 11.01 24.7 24.7 24.7 25.2 2012 ............................................................... 10.90 10.74 11.14 10.97 25.1 25.2 25.3 24.7 2013 ............................................................... 10.85 10.48 10.82 11.44 24.9 24.5 24.6 25.4 2014 ............................................................... 11.33 10.91 11.27 11.53 25.4 25.3 25.3 25.5 2015 ............................................................... 11.20 10.78 11.20 11.97 25.2 25.0 25.2 26.0 2016 ............................................................... 11.85 11.30 11.94 12.16 25.9 25.5 25.9 25.9 2017 ............................................................... 12.07 – – – 25.9 – – –
Paid leave 2006 ............................................................... – – – 2.55 – – – 6.0 2007 ............................................................... 2.52 2.36 2.45 2.55 6.0 5.8 5.8 5.9 2008 ............................................................... 2.49 2.37 2.48 2.73 5.8 5.6 5.7 6.0 2009 ............................................................... 2.74 2.62 2.67 2.62 6.0 5.9 5.9 5.9 2010 ............................................................... 2.59 2.42 2.54 2.68 5.9 5.7 5.7 6.0
2011 ............................................................... 2.65 2.56 2.65 2.70 6.0 5.9 6.0 6.2 2012 ............................................................... 2.65 2.57 2.68 2.56 6.1 6.0 6.1 5.8 2013 ............................................................... 2.53 2.44 2.49 2.64 5.8 5.7 5.7 5.9 2014 ............................................................... 2.61 2.47 2.55 2.60 5.8 5.7 5.7 5.8 2015 ............................................................... 2.49 2.36 2.49 2.79 5.6 5.5 5.6 6.1 2016 ............................................................... 2.75 2.55 2.73 2.80 6.0 5.8 5.9 6.0 2017 ............................................................... 2.78 – – – 6.0 – – –
Supplemental pay 2006 ............................................................... – – – .13 – – – .3 2007 ............................................................... .13 .13 .13 .13 .3 .3 .3 .3 2008 ............................................................... .14 .12 .13 .11 .3 .3 .3 .2 2009 ............................................................... .15 .15 .15 .14 .3 .3 .3 .3 2010 ............................................................... .14 .13 .10 .13 .3 .3 .2 .3
2011 ............................................................... .12 .11 .13 .16 .3 .3 .3 .4 2012 ............................................................... .16 .16 .18 .18 .4 .4 .4 .4 2013 ............................................................... .15 .20 .21 .22 .3 .5 .5 .5 2014 ............................................................... .21 .21 .21 .22 .5 .5 .5 .5 2015 ............................................................... .21 .20 .21 .22 .5 .5 .5 .5 2016 ............................................................... .20 .19 .20 .20 .4 .4 .4 .4
See footnotes at end of table.
-295-

Supplemental table 26. Private educational services industry workers, by occupational group: employer costs perhours worked for employee compensation and costs as a percentage of total compensation, 2006-2017 -- Continued
Professional and related occupations1
Compensationcomponent
Cost per hour worked Percent of total compensation
Mar. June Sep. Dec. Mar. June Sep. Dec.
Supplemental pay 2017 ............................................................... 0.21 – – – 0.4 – – –
Insurance 2006 ............................................................... – – – 2.56 – – – 6.0 2007 ............................................................... 2.62 2.52 2.60 2.70 6.2 6.2 6.2 6.2 2008 ............................................................... 2.74 2.81 2.85 3.13 6.4 6.7 6.5 6.9 2009 ............................................................... 3.12 3.03 3.06 2.89 6.8 6.8 6.8 6.5 2010 ............................................................... 2.93 2.84 2.96 3.04 6.7 6.6 6.7 6.8
2011 ............................................................... 3.01 2.93 2.98 3.15 6.8 6.8 6.7 7.2 2012 ............................................................... 3.14 3.14 3.22 3.09 7.2 7.4 7.3 7.0 2013 ............................................................... 3.10 2.96 3.05 3.35 7.1 6.9 6.9 7.5 2014 ............................................................... 3.37 3.28 3.39 3.40 7.5 7.6 7.6 7.5 2015 ............................................................... 3.34 3.22 3.35 3.64 7.5 7.5 7.5 7.9 2016 ............................................................... 3.62 3.42 3.63 3.66 7.9 7.7 7.9 7.8 2017 ............................................................... 3.61 – – – 7.7 – – –
Retirement and savings 2006 ............................................................... – – – 1.75 – – – 4.1 2007 ............................................................... 1.73 1.62 1.78 1.85 4.1 4.0 4.2 4.3 2008 ............................................................... 1.82 1.69 1.84 1.99 4.2 4.0 4.2 4.4 2009 ............................................................... 2.00 1.88 1.99 2.01 4.4 4.2 4.4 4.6 2010 ............................................................... 1.99 1.90 2.04 2.00 4.5 4.4 4.6 4.5
2011 ............................................................... 2.01 1.88 1.97 1.88 4.5 4.4 4.5 4.3 2012 ............................................................... 1.84 1.78 1.90 1.91 4.2 4.2 4.3 4.3 2013 ............................................................... 1.93 1.76 1.88 1.99 4.4 4.1 4.3 4.4 2014 ............................................................... 1.96 1.81 1.95 2.05 4.4 4.2 4.4 4.5 2015 ............................................................... 1.95 1.85 1.94 2.02 4.4 4.3 4.4 4.4 2016 ............................................................... 1.99 1.97 2.13 2.20 4.3 4.4 4.6 4.7 2017 ............................................................... 2.20 – – – 4.7 – – –
Legally required benefits 2006 ............................................................... – – – 3.15 – – – 7.4 2007 ............................................................... 3.13 3.10 3.15 3.22 7.4 7.6 7.5 7.4 2008 ............................................................... 3.20 3.15 3.21 3.24 7.4 7.5 7.3 7.1 2009 ............................................................... 3.26 3.20 3.24 3.15 7.1 7.2 7.2 7.1 2010 ............................................................... 3.17 3.12 3.21 3.19 7.2 7.3 7.2 7.2
2011 ............................................................... 3.20 3.14 3.17 3.12 7.2 7.3 7.2 7.1 2012 ............................................................... 3.12 3.09 3.17 3.24 7.2 7.3 7.2 7.3 2013 ............................................................... 3.15 3.12 3.19 3.25 7.2 7.3 7.3 7.2 2014 ............................................................... 3.20 3.14 3.18 3.25 7.2 7.3 7.1 7.2 2015 ............................................................... 3.21 3.15 3.21 3.31 7.2 7.3 7.2 7.2 2016 ............................................................... 3.29 3.17 3.24 3.29 7.2 7.2 7.0 7.0 2017 ............................................................... 3.27 – – – 7.0 – – –
1 Estimates from December 2013 to March 2014 for this series were corrected, details are available atwww.bls.gov/bls/ecec_correction_091014.htm.
Note: The sum of individual items may not equal totals due to rounding. Dashes indicate data are not available.
-296-

Supplemental table 26. Private educational services industry workers, by occupational group: employer costs perhours worked for employee compensation and costs as a percentage of total compensation, 2006-2017 -- Continued
Sales and office occupations
Compensationcomponent
Cost per hour worked Percent of total compensation
Mar. June Sep. Dec. Mar. June Sep. Dec.
Total compensation 2006 ............................................................... – – – $22.63 – – – 100.0 2007 ............................................................... 22.82 22.59 23.19 23.76 100.0 100.0 100.0 100.0 2008 ............................................................... 23.87 24.04 24.67 25.01 100.0 100.0 100.0 100.0 2009 ............................................................... 25.29 25.09 25.33 25.06 100.0 100.0 100.0 100.0 2010 ............................................................... 25.27 25.18 25.64 25.46 100.0 100.0 100.0 100.0
2011 ............................................................... 25.49 25.18 25.80 25.77 100.0 100.0 100.0 100.0 2012 ............................................................... 25.66 25.70 26.25 26.94 100.0 100.0 100.0 100.0 2013 ............................................................... 26.94 26.93 27.54 27.63 100.0 100.0 100.0 100.0 2014 ............................................................... 28.01 27.49 28.11 27.44 100.0 100.0 100.0 100.0 2015 ............................................................... 27.64 27.33 27.89 28.62 100.0 100.0 100.0 100.0 2016 ............................................................... 28.65 28.46 29.39 29.54 100.0 100.0 100.0 100.0 2017 ............................................................... 29.74 – – – 100.0 – – –
Wages and salaries 2006 ............................................................... – – – 15.48 – – – 68.4 2007 ............................................................... 15.63 15.58 15.92 16.26 68.5 69.0 68.6 68.4 2008 ............................................................... 16.32 16.45 16.78 16.90 68.4 68.4 68.0 67.6 2009 ............................................................... 17.06 16.99 17.16 17.05 67.4 67.7 67.7 68.0 2010 ............................................................... 17.15 17.21 17.45 17.23 67.9 68.3 68.0 67.7
2011 ............................................................... 17.24 17.12 17.49 17.62 67.6 68.0 67.8 68.4 2012 ............................................................... 17.61 17.66 17.97 18.33 68.6 68.7 68.5 68.0 2013 ............................................................... 18.31 18.32 18.70 18.55 68.0 68.0 67.9 67.1 2014 ............................................................... 18.79 18.68 18.96 18.68 67.1 68.0 67.4 68.1 2015 ............................................................... 18.78 18.67 18.94 19.29 67.9 68.3 67.9 67.4 2016 ............................................................... 19.31 19.37 19.88 19.99 67.4 68.1 67.7 67.7 2017 ............................................................... 20.13 – – – 67.7 – – –
Total benefits 2006 ............................................................... – – – 7.15 – – – 31.6 2007 ............................................................... 7.19 7.01 7.27 7.51 31.5 31.0 31.4 31.6 2008 ............................................................... 7.55 7.59 7.89 8.11 31.6 31.6 32.0 32.4 2009 ............................................................... 8.24 8.10 8.17 8.01 32.6 32.3 32.3 32.0 2010 ............................................................... 8.12 7.98 8.19 8.24 32.1 31.7 32.0 32.3
2011 ............................................................... 8.25 8.06 8.30 8.15 32.4 32.0 32.2 31.6 2012 ............................................................... 8.05 8.04 8.28 8.61 31.4 31.3 31.5 32.0 2013 ............................................................... 8.63 8.61 8.84 9.08 32.0 32.0 32.1 32.9 2014 ............................................................... 9.22 8.81 9.15 8.76 32.9 32.0 32.6 31.9 2015 ............................................................... 8.86 8.66 8.95 9.33 32.1 31.7 32.1 32.6 2016 ............................................................... 9.34 9.09 9.50 9.55 32.6 31.9 32.3 32.3 2017 ............................................................... 9.60 – – – 32.3 – – –
Paid leave 2006 ............................................................... – – – 1.97 – – – 8.7 2007 ............................................................... 1.97 1.91 1.98 2.08 8.6 8.5 8.6 8.8 2008 ............................................................... 2.07 2.02 2.12 2.14 8.7 8.4 8.6 8.6 2009 ............................................................... 2.18 2.12 2.13 2.17 8.6 8.4 8.4 8.6 2010 ............................................................... 2.17 2.10 2.19 2.19 8.6 8.4 8.5 8.6
2011 ............................................................... 2.17 2.08 2.19 2.27 8.5 8.3 8.5 8.8 2012 ............................................................... 2.26 2.25 2.29 2.45 8.8 8.8 8.7 9.1 2013 ............................................................... 2.46 2.42 2.47 2.49 9.2 9.0 9.0 9.0 2014 ............................................................... 2.54 2.42 2.49 2.33 9.1 8.8 8.9 8.5 2015 ............................................................... 2.34 2.26 2.35 2.49 8.5 8.3 8.4 8.7 2016 ............................................................... 2.48 2.42 2.55 2.59 8.7 8.5 8.7 8.8 2017 ............................................................... 2.58 – – – 8.7 – – –
Supplemental pay 2006 ............................................................... – – – .11 – – – .5 2007 ............................................................... .12 .12 .12 .12 .5 .5 .5 .5 2008 ............................................................... .12 .12 .14 .12 .5 .5 .5 .5 2009 ............................................................... .12 .11 .11 .10 .5 .4 .4 .4 2010 ............................................................... .10 .10 .10 .10 .4 .4 .4 .4
2011 ............................................................... .10 .09 .10 .11 .4 .4 .4 .4 2012 ............................................................... .11 .11 .11 .12 .4 .4 .4 .4 2013 ............................................................... .09 .17 .17 .18 .3 .6 .6 .6 2014 ............................................................... .17 .17 .17 .16 .6 .6 .6 .6 2015 ............................................................... .16 .17 .17 .14 .6 .6 .6 .5 2016 ............................................................... .14 .14 .13 .13 .5 .5 .5 .5
See footnotes at end of table.
-297-
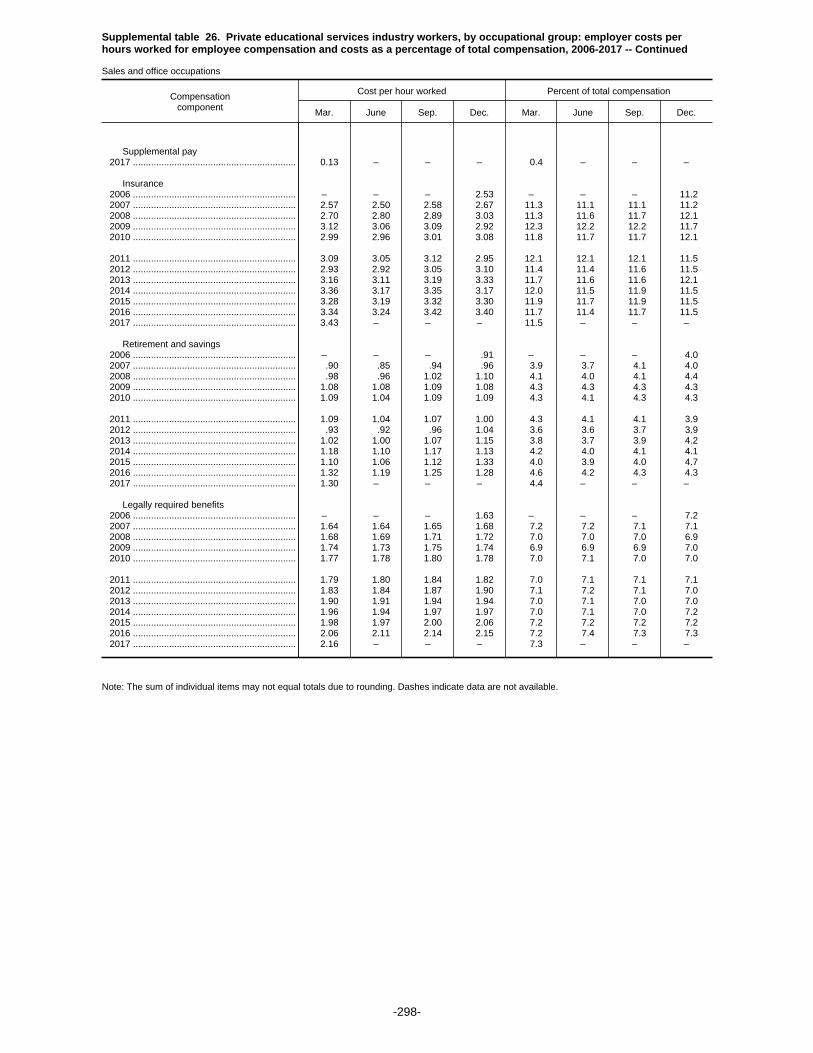
Supplemental table 26. Private educational services industry workers, by occupational group: employer costs perhours worked for employee compensation and costs as a percentage of total compensation, 2006-2017 -- Continued
Sales and office occupations
Compensationcomponent
Cost per hour worked Percent of total compensation
Mar. June Sep. Dec. Mar. June Sep. Dec.
Supplemental pay 2017 ............................................................... 0.13 – – – 0.4 – – –
Insurance 2006 ............................................................... – – – 2.53 – – – 11.2 2007 ............................................................... 2.57 2.50 2.58 2.67 11.3 11.1 11.1 11.2 2008 ............................................................... 2.70 2.80 2.89 3.03 11.3 11.6 11.7 12.1 2009 ............................................................... 3.12 3.06 3.09 2.92 12.3 12.2 12.2 11.7 2010 ............................................................... 2.99 2.96 3.01 3.08 11.8 11.7 11.7 12.1
2011 ............................................................... 3.09 3.05 3.12 2.95 12.1 12.1 12.1 11.5 2012 ............................................................... 2.93 2.92 3.05 3.10 11.4 11.4 11.6 11.5 2013 ............................................................... 3.16 3.11 3.19 3.33 11.7 11.6 11.6 12.1 2014 ............................................................... 3.36 3.17 3.35 3.17 12.0 11.5 11.9 11.5 2015 ............................................................... 3.28 3.19 3.32 3.30 11.9 11.7 11.9 11.5 2016 ............................................................... 3.34 3.24 3.42 3.40 11.7 11.4 11.7 11.5 2017 ............................................................... 3.43 – – – 11.5 – – –
Retirement and savings 2006 ............................................................... – – – .91 – – – 4.0 2007 ............................................................... .90 .85 .94 .96 3.9 3.7 4.1 4.0 2008 ............................................................... .98 .96 1.02 1.10 4.1 4.0 4.1 4.4 2009 ............................................................... 1.08 1.08 1.09 1.08 4.3 4.3 4.3 4.3 2010 ............................................................... 1.09 1.04 1.09 1.09 4.3 4.1 4.3 4.3
2011 ............................................................... 1.09 1.04 1.07 1.00 4.3 4.1 4.1 3.9 2012 ............................................................... .93 .92 .96 1.04 3.6 3.6 3.7 3.9 2013 ............................................................... 1.02 1.00 1.07 1.15 3.8 3.7 3.9 4.2 2014 ............................................................... 1.18 1.10 1.17 1.13 4.2 4.0 4.1 4.1 2015 ............................................................... 1.10 1.06 1.12 1.33 4.0 3.9 4.0 4.7 2016 ............................................................... 1.32 1.19 1.25 1.28 4.6 4.2 4.3 4.3 2017 ............................................................... 1.30 – – – 4.4 – – –
Legally required benefits 2006 ............................................................... – – – 1.63 – – – 7.2 2007 ............................................................... 1.64 1.64 1.65 1.68 7.2 7.2 7.1 7.1 2008 ............................................................... 1.68 1.69 1.71 1.72 7.0 7.0 7.0 6.9 2009 ............................................................... 1.74 1.73 1.75 1.74 6.9 6.9 6.9 7.0 2010 ............................................................... 1.77 1.78 1.80 1.78 7.0 7.1 7.0 7.0
2011 ............................................................... 1.79 1.80 1.84 1.82 7.0 7.1 7.1 7.1 2012 ............................................................... 1.83 1.84 1.87 1.90 7.1 7.2 7.1 7.0 2013 ............................................................... 1.90 1.91 1.94 1.94 7.0 7.1 7.0 7.0 2014 ............................................................... 1.96 1.94 1.97 1.97 7.0 7.1 7.0 7.2 2015 ............................................................... 1.98 1.97 2.00 2.06 7.2 7.2 7.2 7.2 2016 ............................................................... 2.06 2.11 2.14 2.15 7.2 7.4 7.3 7.3 2017 ............................................................... 2.16 – – – 7.3 – – –
Note: The sum of individual items may not equal totals due to rounding. Dashes indicate data are not available.
-298-
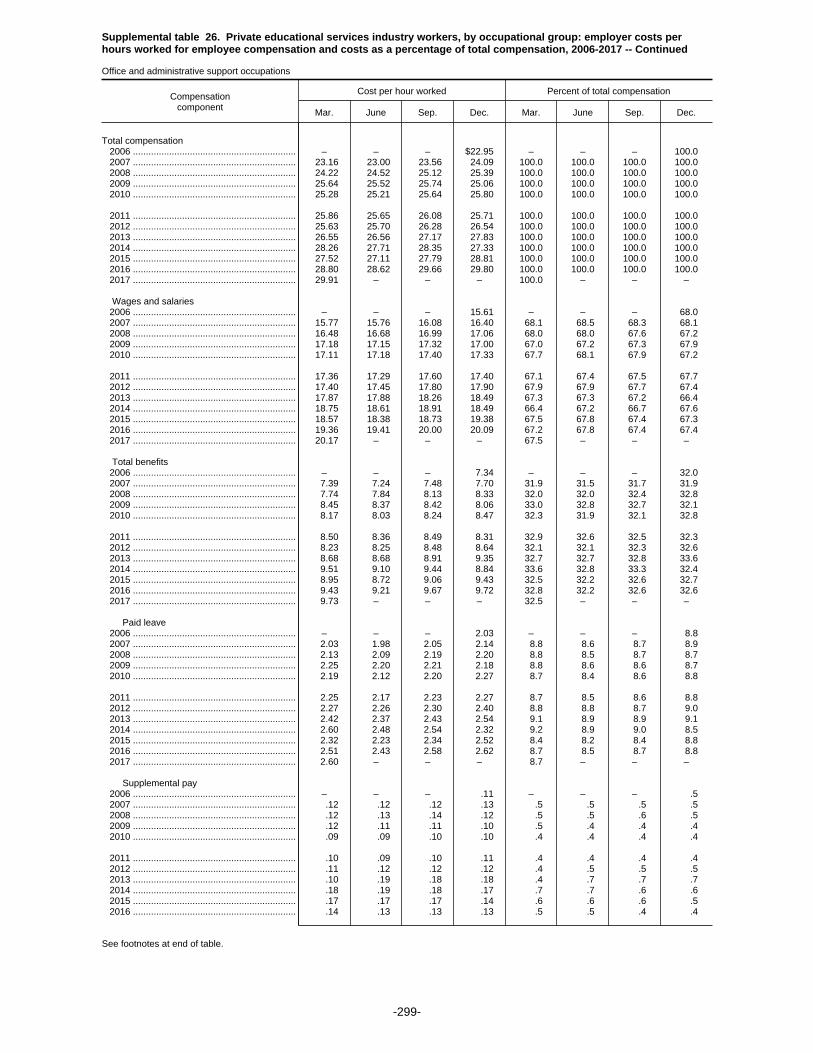
Supplemental table 26. Private educational services industry workers, by occupational group: employer costs perhours worked for employee compensation and costs as a percentage of total compensation, 2006-2017 -- Continued
Office and administrative support occupations
Compensationcomponent
Cost per hour worked Percent of total compensation
Mar. June Sep. Dec. Mar. June Sep. Dec.
Total compensation 2006 ............................................................... – – – $22.95 – – – 100.0 2007 ............................................................... 23.16 23.00 23.56 24.09 100.0 100.0 100.0 100.0 2008 ............................................................... 24.22 24.52 25.12 25.39 100.0 100.0 100.0 100.0 2009 ............................................................... 25.64 25.52 25.74 25.06 100.0 100.0 100.0 100.0 2010 ............................................................... 25.28 25.21 25.64 25.80 100.0 100.0 100.0 100.0
2011 ............................................................... 25.86 25.65 26.08 25.71 100.0 100.0 100.0 100.0 2012 ............................................................... 25.63 25.70 26.28 26.54 100.0 100.0 100.0 100.0 2013 ............................................................... 26.55 26.56 27.17 27.83 100.0 100.0 100.0 100.0 2014 ............................................................... 28.26 27.71 28.35 27.33 100.0 100.0 100.0 100.0 2015 ............................................................... 27.52 27.11 27.79 28.81 100.0 100.0 100.0 100.0 2016 ............................................................... 28.80 28.62 29.66 29.80 100.0 100.0 100.0 100.0 2017 ............................................................... 29.91 – – – 100.0 – – –
Wages and salaries 2006 ............................................................... – – – 15.61 – – – 68.0 2007 ............................................................... 15.77 15.76 16.08 16.40 68.1 68.5 68.3 68.1 2008 ............................................................... 16.48 16.68 16.99 17.06 68.0 68.0 67.6 67.2 2009 ............................................................... 17.18 17.15 17.32 17.00 67.0 67.2 67.3 67.9 2010 ............................................................... 17.11 17.18 17.40 17.33 67.7 68.1 67.9 67.2
2011 ............................................................... 17.36 17.29 17.60 17.40 67.1 67.4 67.5 67.7 2012 ............................................................... 17.40 17.45 17.80 17.90 67.9 67.9 67.7 67.4 2013 ............................................................... 17.87 17.88 18.26 18.49 67.3 67.3 67.2 66.4 2014 ............................................................... 18.75 18.61 18.91 18.49 66.4 67.2 66.7 67.6 2015 ............................................................... 18.57 18.38 18.73 19.38 67.5 67.8 67.4 67.3 2016 ............................................................... 19.36 19.41 20.00 20.09 67.2 67.8 67.4 67.4 2017 ............................................................... 20.17 – – – 67.5 – – –
Total benefits 2006 ............................................................... – – – 7.34 – – – 32.0 2007 ............................................................... 7.39 7.24 7.48 7.70 31.9 31.5 31.7 31.9 2008 ............................................................... 7.74 7.84 8.13 8.33 32.0 32.0 32.4 32.8 2009 ............................................................... 8.45 8.37 8.42 8.06 33.0 32.8 32.7 32.1 2010 ............................................................... 8.17 8.03 8.24 8.47 32.3 31.9 32.1 32.8
2011 ............................................................... 8.50 8.36 8.49 8.31 32.9 32.6 32.5 32.3 2012 ............................................................... 8.23 8.25 8.48 8.64 32.1 32.1 32.3 32.6 2013 ............................................................... 8.68 8.68 8.91 9.35 32.7 32.7 32.8 33.6 2014 ............................................................... 9.51 9.10 9.44 8.84 33.6 32.8 33.3 32.4 2015 ............................................................... 8.95 8.72 9.06 9.43 32.5 32.2 32.6 32.7 2016 ............................................................... 9.43 9.21 9.67 9.72 32.8 32.2 32.6 32.6 2017 ............................................................... 9.73 – – – 32.5 – – –
Paid leave 2006 ............................................................... – – – 2.03 – – – 8.8 2007 ............................................................... 2.03 1.98 2.05 2.14 8.8 8.6 8.7 8.9 2008 ............................................................... 2.13 2.09 2.19 2.20 8.8 8.5 8.7 8.7 2009 ............................................................... 2.25 2.20 2.21 2.18 8.8 8.6 8.6 8.7 2010 ............................................................... 2.19 2.12 2.20 2.27 8.7 8.4 8.6 8.8
2011 ............................................................... 2.25 2.17 2.23 2.27 8.7 8.5 8.6 8.8 2012 ............................................................... 2.27 2.26 2.30 2.40 8.8 8.8 8.7 9.0 2013 ............................................................... 2.42 2.37 2.43 2.54 9.1 8.9 8.9 9.1 2014 ............................................................... 2.60 2.48 2.54 2.32 9.2 8.9 9.0 8.5 2015 ............................................................... 2.32 2.23 2.34 2.52 8.4 8.2 8.4 8.8 2016 ............................................................... 2.51 2.43 2.58 2.62 8.7 8.5 8.7 8.8 2017 ............................................................... 2.60 – – – 8.7 – – –
Supplemental pay 2006 ............................................................... – – – .11 – – – .5 2007 ............................................................... .12 .12 .12 .13 .5 .5 .5 .5 2008 ............................................................... .12 .13 .14 .12 .5 .5 .6 .5 2009 ............................................................... .12 .11 .11 .10 .5 .4 .4 .4 2010 ............................................................... .09 .09 .10 .10 .4 .4 .4 .4
2011 ............................................................... .10 .09 .10 .11 .4 .4 .4 .4 2012 ............................................................... .11 .12 .12 .12 .4 .5 .5 .5 2013 ............................................................... .10 .19 .18 .18 .4 .7 .7 .7 2014 ............................................................... .18 .19 .18 .17 .7 .7 .6 .6 2015 ............................................................... .17 .17 .17 .14 .6 .6 .6 .5 2016 ............................................................... .14 .13 .13 .13 .5 .5 .4 .4
See footnotes at end of table.
-299-
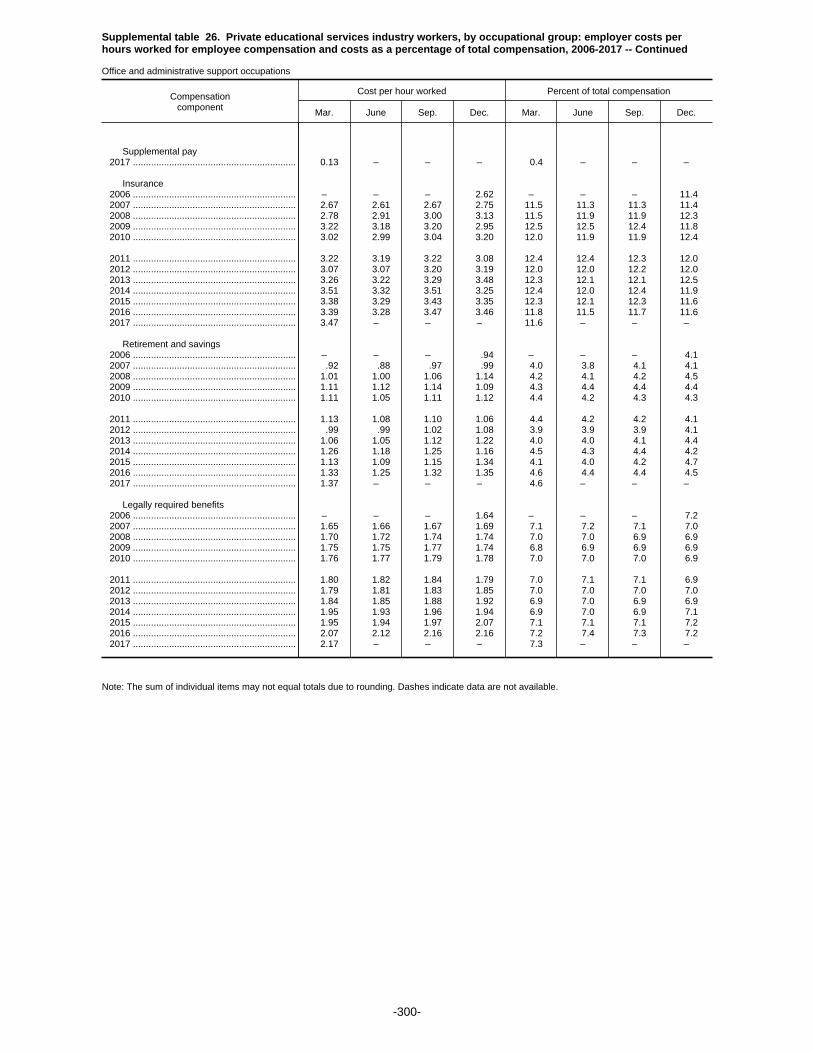
Supplemental table 26. Private educational services industry workers, by occupational group: employer costs perhours worked for employee compensation and costs as a percentage of total compensation, 2006-2017 -- Continued
Office and administrative support occupations
Compensationcomponent
Cost per hour worked Percent of total compensation
Mar. June Sep. Dec. Mar. June Sep. Dec.
Supplemental pay 2017 ............................................................... 0.13 – – – 0.4 – – –
Insurance 2006 ............................................................... – – – 2.62 – – – 11.4 2007 ............................................................... 2.67 2.61 2.67 2.75 11.5 11.3 11.3 11.4 2008 ............................................................... 2.78 2.91 3.00 3.13 11.5 11.9 11.9 12.3 2009 ............................................................... 3.22 3.18 3.20 2.95 12.5 12.5 12.4 11.8 2010 ............................................................... 3.02 2.99 3.04 3.20 12.0 11.9 11.9 12.4
2011 ............................................................... 3.22 3.19 3.22 3.08 12.4 12.4 12.3 12.0 2012 ............................................................... 3.07 3.07 3.20 3.19 12.0 12.0 12.2 12.0 2013 ............................................................... 3.26 3.22 3.29 3.48 12.3 12.1 12.1 12.5 2014 ............................................................... 3.51 3.32 3.51 3.25 12.4 12.0 12.4 11.9 2015 ............................................................... 3.38 3.29 3.43 3.35 12.3 12.1 12.3 11.6 2016 ............................................................... 3.39 3.28 3.47 3.46 11.8 11.5 11.7 11.6 2017 ............................................................... 3.47 – – – 11.6 – – –
Retirement and savings 2006 ............................................................... – – – .94 – – – 4.1 2007 ............................................................... .92 .88 .97 .99 4.0 3.8 4.1 4.1 2008 ............................................................... 1.01 1.00 1.06 1.14 4.2 4.1 4.2 4.5 2009 ............................................................... 1.11 1.12 1.14 1.09 4.3 4.4 4.4 4.4 2010 ............................................................... 1.11 1.05 1.11 1.12 4.4 4.2 4.3 4.3
2011 ............................................................... 1.13 1.08 1.10 1.06 4.4 4.2 4.2 4.1 2012 ............................................................... .99 .99 1.02 1.08 3.9 3.9 3.9 4.1 2013 ............................................................... 1.06 1.05 1.12 1.22 4.0 4.0 4.1 4.4 2014 ............................................................... 1.26 1.18 1.25 1.16 4.5 4.3 4.4 4.2 2015 ............................................................... 1.13 1.09 1.15 1.34 4.1 4.0 4.2 4.7 2016 ............................................................... 1.33 1.25 1.32 1.35 4.6 4.4 4.4 4.5 2017 ............................................................... 1.37 – – – 4.6 – – –
Legally required benefits 2006 ............................................................... – – – 1.64 – – – 7.2 2007 ............................................................... 1.65 1.66 1.67 1.69 7.1 7.2 7.1 7.0 2008 ............................................................... 1.70 1.72 1.74 1.74 7.0 7.0 6.9 6.9 2009 ............................................................... 1.75 1.75 1.77 1.74 6.8 6.9 6.9 6.9 2010 ............................................................... 1.76 1.77 1.79 1.78 7.0 7.0 7.0 6.9
2011 ............................................................... 1.80 1.82 1.84 1.79 7.0 7.1 7.1 6.9 2012 ............................................................... 1.79 1.81 1.83 1.85 7.0 7.0 7.0 7.0 2013 ............................................................... 1.84 1.85 1.88 1.92 6.9 7.0 6.9 6.9 2014 ............................................................... 1.95 1.93 1.96 1.94 6.9 7.0 6.9 7.1 2015 ............................................................... 1.95 1.94 1.97 2.07 7.1 7.1 7.1 7.2 2016 ............................................................... 2.07 2.12 2.16 2.16 7.2 7.4 7.3 7.2 2017 ............................................................... 2.17 – – – 7.3 – – –
Note: The sum of individual items may not equal totals due to rounding. Dashes indicate data are not available.
-300-

Supplemental table 26. Private educational services industry workers, by occupational group: employer costs perhours worked for employee compensation and costs as a percentage of total compensation, 2006-2017 -- Continued
Service occupations
Compensationcomponent
Cost per hour worked Percent of total compensation
Mar. June Sep. Dec. Mar. June Sep. Dec.
Total compensation 2006 ............................................................... – – – $17.50 – – – 100.0 2007 ............................................................... 17.59 17.20 17.77 18.08 100.0 100.0 100.0 100.0 2008 ............................................................... 18.01 17.65 18.35 18.98 100.0 100.0 100.0 100.0 2009 ............................................................... 19.00 18.79 19.15 18.86 100.0 100.0 100.0 100.0 2010 ............................................................... 18.76 18.38 18.98 19.59 100.0 100.0 100.0 100.0
2011 ............................................................... 19.38 18.88 19.32 20.12 100.0 100.0 100.0 100.0 2012 ............................................................... 20.08 20.15 20.50 19.33 100.0 100.0 100.0 100.0 2013 ............................................................... 19.24 18.99 19.75 21.42 100.0 100.0 100.0 100.0 2014 ............................................................... 21.56 21.20 21.73 22.02 100.0 100.0 100.0 100.0 2015 ............................................................... 21.89 21.63 22.06 23.25 100.0 100.0 100.0 100.0 2016 ............................................................... 23.05 22.65 23.33 23.65 100.0 100.0 100.0 100.0 2017 ............................................................... 23.61 – – – 100.0 – – –
Wages and salaries 2006 ............................................................... – – – 12.32 – – – 70.4 2007 ............................................................... 12.41 12.27 12.61 12.84 70.5 71.3 71.0 71.0 2008 ............................................................... 12.83 12.65 13.07 13.22 71.3 71.7 71.2 69.7 2009 ............................................................... 13.23 13.42 13.62 13.66 69.6 71.4 71.1 72.4 2010 ............................................................... 13.57 13.41 13.70 14.04 72.3 73.0 72.2 71.6
2011 ............................................................... 13.88 13.64 13.86 13.98 71.6 72.2 71.7 69.5 2012 ............................................................... 13.96 14.05 14.20 13.67 69.5 69.7 69.2 70.7 2013 ............................................................... 13.64 13.59 14.15 14.52 70.9 71.5 71.6 67.8 2014 ............................................................... 14.63 14.51 14.84 14.96 67.9 68.4 68.3 67.9 2015 ............................................................... 14.90 14.82 15.08 15.63 68.0 68.5 68.3 67.2 2016 ............................................................... 15.57 15.46 15.62 15.79 67.6 68.3 67.0 66.8 2017 ............................................................... 15.72 – – – 66.6 – – –
Total benefits 2006 ............................................................... – – – 5.18 – – – 29.6 2007 ............................................................... 5.18 4.93 5.15 5.24 29.5 28.7 29.0 29.0 2008 ............................................................... 5.17 5.00 5.28 5.76 28.7 28.3 28.8 30.3 2009 ............................................................... 5.77 5.38 5.53 5.20 30.4 28.6 28.9 27.6 2010 ............................................................... 5.19 4.97 5.28 5.56 27.7 27.0 27.8 28.4
2011 ............................................................... 5.50 5.24 5.46 6.14 28.4 27.8 28.3 30.5 2012 ............................................................... 6.12 6.10 6.31 5.66 30.5 30.3 30.8 29.3 2013 ............................................................... 5.60 5.41 5.60 6.90 29.1 28.5 28.4 32.2 2014 ............................................................... 6.93 6.69 6.90 7.07 32.1 31.6 31.7 32.1 2015 ............................................................... 7.00 6.81 6.98 7.62 32.0 31.5 31.7 32.8 2016 ............................................................... 7.48 7.19 7.71 7.86 32.4 31.7 33.0 33.2 2017 ............................................................... 7.89 – – – 33.4 – – –
Paid leave 2006 ............................................................... – – – 1.17 – – – 6.7 2007 ............................................................... 1.16 1.06 1.13 1.20 6.6 6.2 6.4 6.6 2008 ............................................................... 1.17 1.07 1.15 1.30 6.5 6.1 6.3 6.8 2009 ............................................................... 1.29 1.17 1.22 1.20 6.8 6.2 6.4 6.4 2010 ............................................................... 1.18 1.10 1.18 1.27 6.3 6.0 6.2 6.5
2011 ............................................................... 1.25 1.16 1.23 1.40 6.5 6.2 6.3 7.0 2012 ............................................................... 1.41 1.37 1.44 1.28 7.0 6.8 7.0 6.6 2013 ............................................................... 1.28 1.18 1.23 1.50 6.6 6.2 6.2 7.0 2014 ............................................................... 1.50 1.40 1.42 1.55 7.0 6.6 6.6 7.0 2015 ............................................................... 1.53 1.46 1.54 1.74 7.0 6.8 7.0 7.5 2016 ............................................................... 1.71 1.62 1.75 1.80 7.4 7.2 7.5 7.6 2017 ............................................................... 1.80 – – – 7.6 – – –
Supplemental pay 2006 ............................................................... – – – .18 – – – 1.0 2007 ............................................................... .18 .16 .17 .18 1.0 .9 .9 1.0 2008 ............................................................... .18 .16 .17 .18 1.0 .9 .9 .9 2009 ............................................................... .18 .16 .17 .15 .9 .9 .9 .8 2010 ............................................................... .15 .14 .16 .16 .8 .8 .8 .8
2011 ............................................................... .16 .14 .18 .22 .8 .8 1.0 1.1 2012 ............................................................... .22 .22 .24 .23 1.1 1.1 1.2 1.2 2013 ............................................................... .23 .22 .23 .29 1.2 1.2 1.2 1.3 2014 ............................................................... .28 .28 .28 .23 1.3 1.3 1.3 1.1 2015 ............................................................... .22 .21 .23 .24 1.0 1.0 1.0 1.1 2016 ............................................................... .24 .22 .24 .25 1.0 1.0 1.0 1.1
See footnotes at end of table.
-301-

Supplemental table 26. Private educational services industry workers, by occupational group: employer costs perhours worked for employee compensation and costs as a percentage of total compensation, 2006-2017 -- Continued
Service occupations
Compensationcomponent
Cost per hour worked Percent of total compensation
Mar. June Sep. Dec. Mar. June Sep. Dec.
Supplemental pay 2017 ............................................................... 0.25 – – – 1.1 – – –
Insurance 2006 ............................................................... – – – 1.82 – – – 10.4 2007 ............................................................... 1.84 1.74 1.81 1.79 10.5 10.1 10.2 9.9 2008 ............................................................... 1.76 1.74 1.84 2.07 9.8 9.9 10.0 10.9 2009 ............................................................... 2.09 1.88 1.96 1.69 11.0 10.0 10.2 9.0 2010 ............................................................... 1.68 1.61 1.74 1.87 9.0 8.8 9.1 9.5
2011 ............................................................... 1.84 1.70 1.74 2.09 9.5 9.0 9.0 10.4 2012 ............................................................... 2.07 2.06 2.14 1.83 10.3 10.2 10.4 9.4 2013 ............................................................... 1.81 1.72 1.75 2.49 9.4 9.1 8.9 11.6 2014 ............................................................... 2.54 2.48 2.58 2.67 11.8 11.7 11.9 12.1 2015 ............................................................... 2.64 2.58 2.59 2.75 12.1 11.9 11.8 11.8 2016 ............................................................... 2.67 2.55 2.81 2.88 11.6 11.3 12.1 12.2 2017 ............................................................... 2.91 – – – 12.3 – – –
Retirement and savings 2006 ............................................................... – – – .49 – – – 2.8 2007 ............................................................... .48 .43 .48 .50 2.7 2.5 2.7 2.7 2008 ............................................................... .49 .45 .49 .58 2.7 2.5 2.7 3.1 2009 ............................................................... .58 .51 .53 .56 3.1 2.7 2.8 3.0 2010 ............................................................... .57 .52 .57 .59 3.0 2.8 3.0 3.0
2011 ............................................................... .59 .55 .57 .73 3.1 2.9 3.0 3.7 2012 ............................................................... .72 .69 .71 .64 3.6 3.4 3.5 3.3 2013 ............................................................... .63 .61 .64 .85 3.3 3.2 3.2 4.0 2014 ............................................................... .86 .79 .86 .91 4.0 3.7 3.9 4.1 2015 ............................................................... .90 .86 .89 1.04 4.1 4.0 4.1 4.5 2016 ............................................................... 1.01 .97 1.04 1.08 4.4 4.3 4.5 4.6 2017 ............................................................... 1.08 – – – 4.6 – – –
Legally required benefits 2006 ............................................................... – – – 1.52 – – – 8.7 2007 ............................................................... 1.53 1.54 1.57 1.57 8.7 9.0 8.8 8.7 2008 ............................................................... 1.57 1.57 1.62 1.62 8.7 8.9 8.8 8.6 2009 ............................................................... 1.62 1.65 1.66 1.60 8.6 8.8 8.7 8.5 2010 ............................................................... 1.61 1.59 1.64 1.66 8.6 8.7 8.6 8.5
2011 ............................................................... 1.66 1.68 1.73 1.69 8.6 8.9 9.0 8.4 2012 ............................................................... 1.70 1.76 1.78 1.68 8.5 8.7 8.7 8.7 2013 ............................................................... 1.65 1.68 1.75 1.77 8.6 8.8 8.9 8.2 2014 ............................................................... 1.75 1.73 1.75 1.70 8.1 8.2 8.0 7.7 2015 ............................................................... 1.70 1.69 1.73 1.85 7.8 7.8 7.8 8.0 2016 ............................................................... 1.85 1.83 1.86 1.85 8.0 8.1 8.0 7.8 2017 ............................................................... 1.85 – – – 7.8 – – –
Note: The sum of individual items may not equal totals due to rounding. Dashes indicate data are not available.
-302-
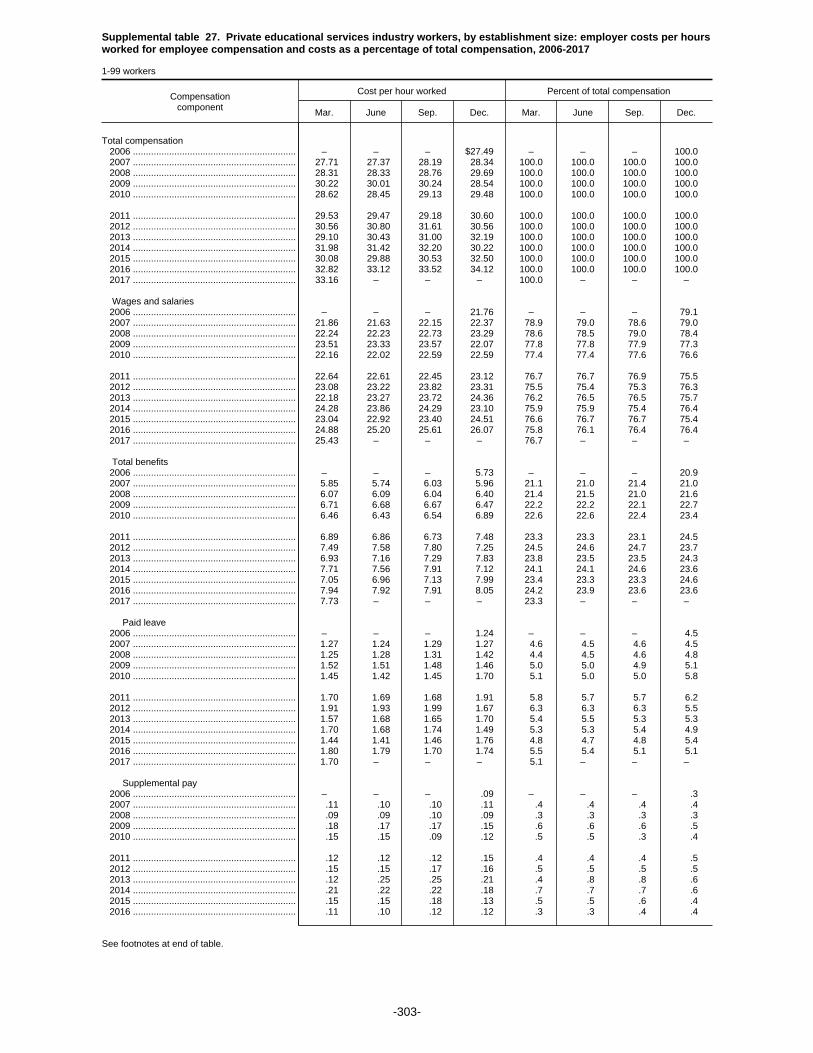
Supplemental table 27. Private educational services industry workers, by establishment size: employer costs per hoursworked for employee compensation and costs as a percentage of total compensation, 2006-2017
1-99 workers
Compensationcomponent
Cost per hour worked Percent of total compensation
Mar. June Sep. Dec. Mar. June Sep. Dec.
Total compensation 2006 ............................................................... – – – $27.49 – – – 100.0 2007 ............................................................... 27.71 27.37 28.19 28.34 100.0 100.0 100.0 100.0 2008 ............................................................... 28.31 28.33 28.76 29.69 100.0 100.0 100.0 100.0 2009 ............................................................... 30.22 30.01 30.24 28.54 100.0 100.0 100.0 100.0 2010 ............................................................... 28.62 28.45 29.13 29.48 100.0 100.0 100.0 100.0
2011 ............................................................... 29.53 29.47 29.18 30.60 100.0 100.0 100.0 100.0 2012 ............................................................... 30.56 30.80 31.61 30.56 100.0 100.0 100.0 100.0 2013 ............................................................... 29.10 30.43 31.00 32.19 100.0 100.0 100.0 100.0 2014 ............................................................... 31.98 31.42 32.20 30.22 100.0 100.0 100.0 100.0 2015 ............................................................... 30.08 29.88 30.53 32.50 100.0 100.0 100.0 100.0 2016 ............................................................... 32.82 33.12 33.52 34.12 100.0 100.0 100.0 100.0 2017 ............................................................... 33.16 – – – 100.0 – – –
Wages and salaries 2006 ............................................................... – – – 21.76 – – – 79.1 2007 ............................................................... 21.86 21.63 22.15 22.37 78.9 79.0 78.6 79.0 2008 ............................................................... 22.24 22.23 22.73 23.29 78.6 78.5 79.0 78.4 2009 ............................................................... 23.51 23.33 23.57 22.07 77.8 77.8 77.9 77.3 2010 ............................................................... 22.16 22.02 22.59 22.59 77.4 77.4 77.6 76.6
2011 ............................................................... 22.64 22.61 22.45 23.12 76.7 76.7 76.9 75.5 2012 ............................................................... 23.08 23.22 23.82 23.31 75.5 75.4 75.3 76.3 2013 ............................................................... 22.18 23.27 23.72 24.36 76.2 76.5 76.5 75.7 2014 ............................................................... 24.28 23.86 24.29 23.10 75.9 75.9 75.4 76.4 2015 ............................................................... 23.04 22.92 23.40 24.51 76.6 76.7 76.7 75.4 2016 ............................................................... 24.88 25.20 25.61 26.07 75.8 76.1 76.4 76.4 2017 ............................................................... 25.43 – – – 76.7 – – –
Total benefits 2006 ............................................................... – – – 5.73 – – – 20.9 2007 ............................................................... 5.85 5.74 6.03 5.96 21.1 21.0 21.4 21.0 2008 ............................................................... 6.07 6.09 6.04 6.40 21.4 21.5 21.0 21.6 2009 ............................................................... 6.71 6.68 6.67 6.47 22.2 22.2 22.1 22.7 2010 ............................................................... 6.46 6.43 6.54 6.89 22.6 22.6 22.4 23.4
2011 ............................................................... 6.89 6.86 6.73 7.48 23.3 23.3 23.1 24.5 2012 ............................................................... 7.49 7.58 7.80 7.25 24.5 24.6 24.7 23.7 2013 ............................................................... 6.93 7.16 7.29 7.83 23.8 23.5 23.5 24.3 2014 ............................................................... 7.71 7.56 7.91 7.12 24.1 24.1 24.6 23.6 2015 ............................................................... 7.05 6.96 7.13 7.99 23.4 23.3 23.3 24.6 2016 ............................................................... 7.94 7.92 7.91 8.05 24.2 23.9 23.6 23.6 2017 ............................................................... 7.73 – – – 23.3 – – –
Paid leave 2006 ............................................................... – – – 1.24 – – – 4.5 2007 ............................................................... 1.27 1.24 1.29 1.27 4.6 4.5 4.6 4.5 2008 ............................................................... 1.25 1.28 1.31 1.42 4.4 4.5 4.6 4.8 2009 ............................................................... 1.52 1.51 1.48 1.46 5.0 5.0 4.9 5.1 2010 ............................................................... 1.45 1.42 1.45 1.70 5.1 5.0 5.0 5.8
2011 ............................................................... 1.70 1.69 1.68 1.91 5.8 5.7 5.7 6.2 2012 ............................................................... 1.91 1.93 1.99 1.67 6.3 6.3 6.3 5.5 2013 ............................................................... 1.57 1.68 1.65 1.70 5.4 5.5 5.3 5.3 2014 ............................................................... 1.70 1.68 1.74 1.49 5.3 5.3 5.4 4.9 2015 ............................................................... 1.44 1.41 1.46 1.76 4.8 4.7 4.8 5.4 2016 ............................................................... 1.80 1.79 1.70 1.74 5.5 5.4 5.1 5.1 2017 ............................................................... 1.70 – – – 5.1 – – –
Supplemental pay 2006 ............................................................... – – – .09 – – – .3 2007 ............................................................... .11 .10 .10 .11 .4 .4 .4 .4 2008 ............................................................... .09 .09 .10 .09 .3 .3 .3 .3 2009 ............................................................... .18 .17 .17 .15 .6 .6 .6 .5 2010 ............................................................... .15 .15 .09 .12 .5 .5 .3 .4
2011 ............................................................... .12 .12 .12 .15 .4 .4 .4 .5 2012 ............................................................... .15 .15 .17 .16 .5 .5 .5 .5 2013 ............................................................... .12 .25 .25 .21 .4 .8 .8 .6 2014 ............................................................... .21 .22 .22 .18 .7 .7 .7 .6 2015 ............................................................... .15 .15 .18 .13 .5 .5 .6 .4 2016 ............................................................... .11 .10 .12 .12 .3 .3 .4 .4
See footnotes at end of table.
-303-
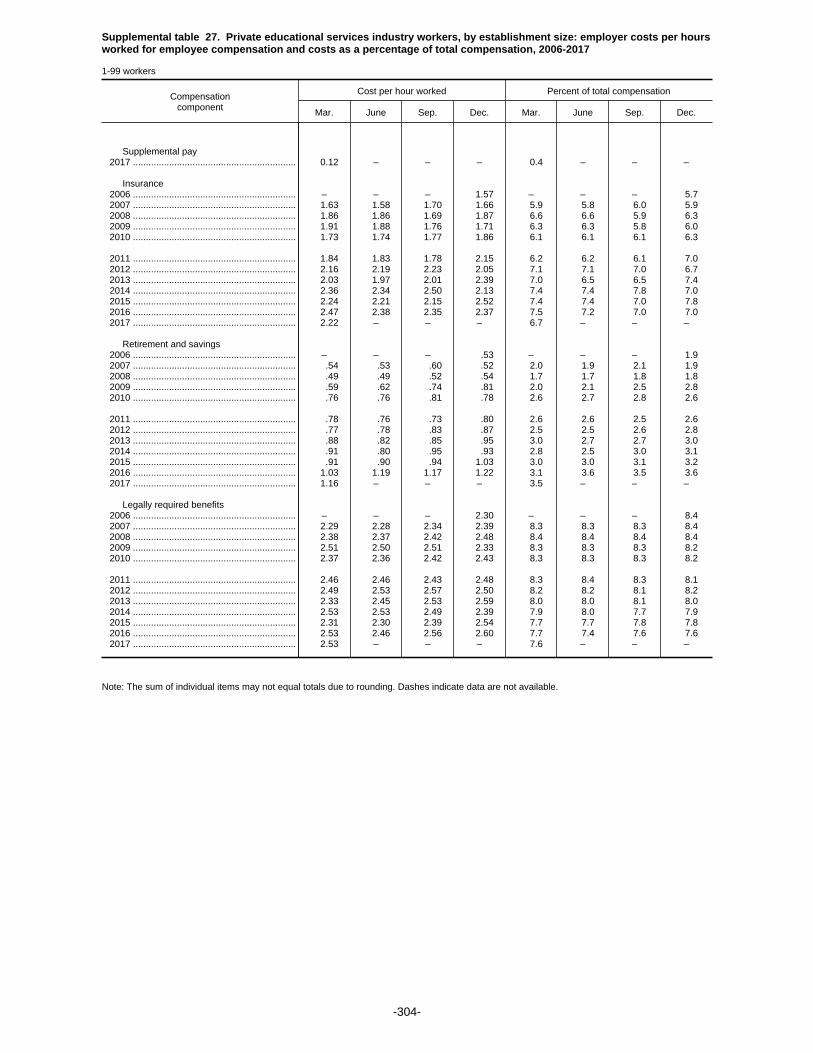
Supplemental table 27. Private educational services industry workers, by establishment size: employer costs per hoursworked for employee compensation and costs as a percentage of total compensation, 2006-2017
1-99 workers
Compensationcomponent
Cost per hour worked Percent of total compensation
Mar. June Sep. Dec. Mar. June Sep. Dec.
Supplemental pay 2017 ............................................................... 0.12 – – – 0.4 – – –
Insurance 2006 ............................................................... – – – 1.57 – – – 5.7 2007 ............................................................... 1.63 1.58 1.70 1.66 5.9 5.8 6.0 5.9 2008 ............................................................... 1.86 1.86 1.69 1.87 6.6 6.6 5.9 6.3 2009 ............................................................... 1.91 1.88 1.76 1.71 6.3 6.3 5.8 6.0 2010 ............................................................... 1.73 1.74 1.77 1.86 6.1 6.1 6.1 6.3
2011 ............................................................... 1.84 1.83 1.78 2.15 6.2 6.2 6.1 7.0 2012 ............................................................... 2.16 2.19 2.23 2.05 7.1 7.1 7.0 6.7 2013 ............................................................... 2.03 1.97 2.01 2.39 7.0 6.5 6.5 7.4 2014 ............................................................... 2.36 2.34 2.50 2.13 7.4 7.4 7.8 7.0 2015 ............................................................... 2.24 2.21 2.15 2.52 7.4 7.4 7.0 7.8 2016 ............................................................... 2.47 2.38 2.35 2.37 7.5 7.2 7.0 7.0 2017 ............................................................... 2.22 – – – 6.7 – – –
Retirement and savings 2006 ............................................................... – – – .53 – – – 1.9 2007 ............................................................... .54 .53 .60 .52 2.0 1.9 2.1 1.9 2008 ............................................................... .49 .49 .52 .54 1.7 1.7 1.8 1.8 2009 ............................................................... .59 .62 .74 .81 2.0 2.1 2.5 2.8 2010 ............................................................... .76 .76 .81 .78 2.6 2.7 2.8 2.6
2011 ............................................................... .78 .76 .73 .80 2.6 2.6 2.5 2.6 2012 ............................................................... .77 .78 .83 .87 2.5 2.5 2.6 2.8 2013 ............................................................... .88 .82 .85 .95 3.0 2.7 2.7 3.0 2014 ............................................................... .91 .80 .95 .93 2.8 2.5 3.0 3.1 2015 ............................................................... .91 .90 .94 1.03 3.0 3.0 3.1 3.2 2016 ............................................................... 1.03 1.19 1.17 1.22 3.1 3.6 3.5 3.6 2017 ............................................................... 1.16 – – – 3.5 – – –
Legally required benefits 2006 ............................................................... – – – 2.30 – – – 8.4 2007 ............................................................... 2.29 2.28 2.34 2.39 8.3 8.3 8.3 8.4 2008 ............................................................... 2.38 2.37 2.42 2.48 8.4 8.4 8.4 8.4 2009 ............................................................... 2.51 2.50 2.51 2.33 8.3 8.3 8.3 8.2 2010 ............................................................... 2.37 2.36 2.42 2.43 8.3 8.3 8.3 8.2
2011 ............................................................... 2.46 2.46 2.43 2.48 8.3 8.4 8.3 8.1 2012 ............................................................... 2.49 2.53 2.57 2.50 8.2 8.2 8.1 8.2 2013 ............................................................... 2.33 2.45 2.53 2.59 8.0 8.0 8.1 8.0 2014 ............................................................... 2.53 2.53 2.49 2.39 7.9 8.0 7.7 7.9 2015 ............................................................... 2.31 2.30 2.39 2.54 7.7 7.7 7.8 7.8 2016 ............................................................... 2.53 2.46 2.56 2.60 7.7 7.4 7.6 7.6 2017 ............................................................... 2.53 – – – 7.6 – – –
Note: The sum of individual items may not equal totals due to rounding. Dashes indicate data are not available.
-304-
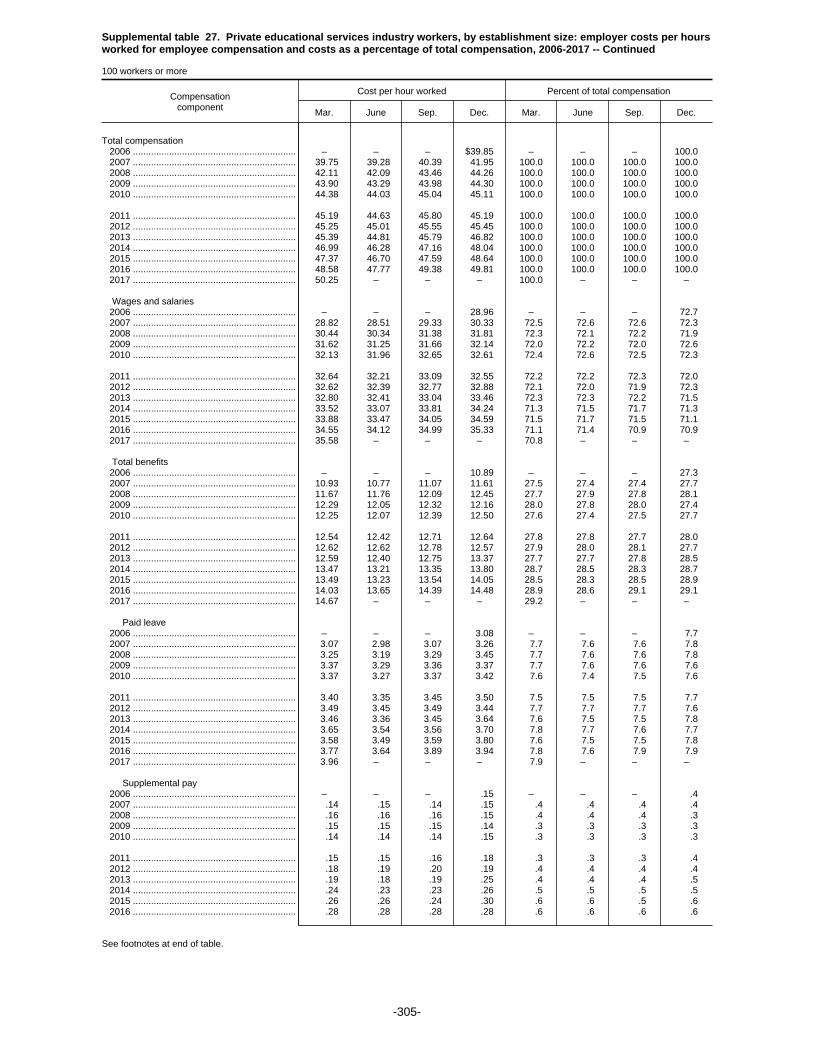
Supplemental table 27. Private educational services industry workers, by establishment size: employer costs per hoursworked for employee compensation and costs as a percentage of total compensation, 2006-2017 -- Continued
100 workers or more
Compensationcomponent
Cost per hour worked Percent of total compensation
Mar. June Sep. Dec. Mar. June Sep. Dec.
Total compensation 2006 ............................................................... – – – $39.85 – – – 100.0 2007 ............................................................... 39.75 39.28 40.39 41.95 100.0 100.0 100.0 100.0 2008 ............................................................... 42.11 42.09 43.46 44.26 100.0 100.0 100.0 100.0 2009 ............................................................... 43.90 43.29 43.98 44.30 100.0 100.0 100.0 100.0 2010 ............................................................... 44.38 44.03 45.04 45.11 100.0 100.0 100.0 100.0
2011 ............................................................... 45.19 44.63 45.80 45.19 100.0 100.0 100.0 100.0 2012 ............................................................... 45.25 45.01 45.55 45.45 100.0 100.0 100.0 100.0 2013 ............................................................... 45.39 44.81 45.79 46.82 100.0 100.0 100.0 100.0 2014 ............................................................... 46.99 46.28 47.16 48.04 100.0 100.0 100.0 100.0 2015 ............................................................... 47.37 46.70 47.59 48.64 100.0 100.0 100.0 100.0 2016 ............................................................... 48.58 47.77 49.38 49.81 100.0 100.0 100.0 100.0 2017 ............................................................... 50.25 – – – 100.0 – – –
Wages and salaries 2006 ............................................................... – – – 28.96 – – – 72.7 2007 ............................................................... 28.82 28.51 29.33 30.33 72.5 72.6 72.6 72.3 2008 ............................................................... 30.44 30.34 31.38 31.81 72.3 72.1 72.2 71.9 2009 ............................................................... 31.62 31.25 31.66 32.14 72.0 72.2 72.0 72.6 2010 ............................................................... 32.13 31.96 32.65 32.61 72.4 72.6 72.5 72.3
2011 ............................................................... 32.64 32.21 33.09 32.55 72.2 72.2 72.3 72.0 2012 ............................................................... 32.62 32.39 32.77 32.88 72.1 72.0 71.9 72.3 2013 ............................................................... 32.80 32.41 33.04 33.46 72.3 72.3 72.2 71.5 2014 ............................................................... 33.52 33.07 33.81 34.24 71.3 71.5 71.7 71.3 2015 ............................................................... 33.88 33.47 34.05 34.59 71.5 71.7 71.5 71.1 2016 ............................................................... 34.55 34.12 34.99 35.33 71.1 71.4 70.9 70.9 2017 ............................................................... 35.58 – – – 70.8 – – –
Total benefits 2006 ............................................................... – – – 10.89 – – – 27.3 2007 ............................................................... 10.93 10.77 11.07 11.61 27.5 27.4 27.4 27.7 2008 ............................................................... 11.67 11.76 12.09 12.45 27.7 27.9 27.8 28.1 2009 ............................................................... 12.29 12.05 12.32 12.16 28.0 27.8 28.0 27.4 2010 ............................................................... 12.25 12.07 12.39 12.50 27.6 27.4 27.5 27.7
2011 ............................................................... 12.54 12.42 12.71 12.64 27.8 27.8 27.7 28.0 2012 ............................................................... 12.62 12.62 12.78 12.57 27.9 28.0 28.1 27.7 2013 ............................................................... 12.59 12.40 12.75 13.37 27.7 27.7 27.8 28.5 2014 ............................................................... 13.47 13.21 13.35 13.80 28.7 28.5 28.3 28.7 2015 ............................................................... 13.49 13.23 13.54 14.05 28.5 28.3 28.5 28.9 2016 ............................................................... 14.03 13.65 14.39 14.48 28.9 28.6 29.1 29.1 2017 ............................................................... 14.67 – – – 29.2 – – –
Paid leave 2006 ............................................................... – – – 3.08 – – – 7.7 2007 ............................................................... 3.07 2.98 3.07 3.26 7.7 7.6 7.6 7.8 2008 ............................................................... 3.25 3.19 3.29 3.45 7.7 7.6 7.6 7.8 2009 ............................................................... 3.37 3.29 3.36 3.37 7.7 7.6 7.6 7.6 2010 ............................................................... 3.37 3.27 3.37 3.42 7.6 7.4 7.5 7.6
2011 ............................................................... 3.40 3.35 3.45 3.50 7.5 7.5 7.5 7.7 2012 ............................................................... 3.49 3.45 3.49 3.44 7.7 7.7 7.7 7.6 2013 ............................................................... 3.46 3.36 3.45 3.64 7.6 7.5 7.5 7.8 2014 ............................................................... 3.65 3.54 3.56 3.70 7.8 7.7 7.6 7.7 2015 ............................................................... 3.58 3.49 3.59 3.80 7.6 7.5 7.5 7.8 2016 ............................................................... 3.77 3.64 3.89 3.94 7.8 7.6 7.9 7.9 2017 ............................................................... 3.96 – – – 7.9 – – –
Supplemental pay 2006 ............................................................... – – – .15 – – – .4 2007 ............................................................... .14 .15 .14 .15 .4 .4 .4 .4 2008 ............................................................... .16 .16 .16 .15 .4 .4 .4 .3 2009 ............................................................... .15 .15 .15 .14 .3 .3 .3 .3 2010 ............................................................... .14 .14 .14 .15 .3 .3 .3 .3
2011 ............................................................... .15 .15 .16 .18 .3 .3 .3 .4 2012 ............................................................... .18 .19 .20 .19 .4 .4 .4 .4 2013 ............................................................... .19 .18 .19 .25 .4 .4 .4 .5 2014 ............................................................... .24 .23 .23 .26 .5 .5 .5 .5 2015 ............................................................... .26 .26 .24 .30 .6 .6 .5 .6 2016 ............................................................... .28 .28 .28 .28 .6 .6 .6 .6
See footnotes at end of table.
-305-

Supplemental table 27. Private educational services industry workers, by establishment size: employer costs per hoursworked for employee compensation and costs as a percentage of total compensation, 2006-2017 -- Continued
100 workers or more
Compensationcomponent
Cost per hour worked Percent of total compensation
Mar. June Sep. Dec. Mar. June Sep. Dec.
Supplemental pay 2017 ............................................................... 0.29 – – – 0.6 – – –
Insurance 2006 ............................................................... – – – 2.94 – – – 7.4 2007 ............................................................... 3.02 2.96 3.00 3.16 7.6 7.5 7.4 7.5 2008 ............................................................... 3.17 3.35 3.44 3.57 7.5 8.0 7.9 8.1 2009 ............................................................... 3.54 3.48 3.62 3.41 8.1 8.0 8.2 7.7 2010 ............................................................... 3.47 3.44 3.53 3.60 7.8 7.8 7.8 8.0
2011 ............................................................... 3.62 3.62 3.64 3.67 8.0 8.1 8.0 8.1 2012 ............................................................... 3.69 3.75 3.78 3.63 8.2 8.3 8.3 8.0 2013 ............................................................... 3.66 3.65 3.74 3.94 8.1 8.1 8.2 8.4 2014 ............................................................... 4.01 3.95 3.98 4.11 8.5 8.5 8.4 8.6 2015 ............................................................... 4.02 3.94 4.10 4.15 8.5 8.4 8.6 8.5 2016 ............................................................... 4.18 4.05 4.33 4.33 8.6 8.5 8.8 8.7 2017 ............................................................... 4.39 – – – 8.7 – – –
Retirement and savings 2006 ............................................................... – – – 1.89 – – – 4.7 2007 ............................................................... 1.87 1.82 1.97 2.11 4.7 4.6 4.9 5.0 2008 ............................................................... 2.14 2.11 2.22 2.31 5.1 5.0 5.1 5.2 2009 ............................................................... 2.26 2.17 2.21 2.22 5.1 5.0 5.0 5.0 2010 ............................................................... 2.25 2.20 2.28 2.28 5.1 5.0 5.1 5.1
2011 ............................................................... 2.33 2.27 2.36 2.25 5.2 5.1 5.1 5.0 2012 ............................................................... 2.21 2.20 2.24 2.18 4.9 4.9 4.9 4.8 2013 ............................................................... 2.16 2.11 2.24 2.35 4.8 4.7 4.9 5.0 2014 ............................................................... 2.38 2.33 2.36 2.45 5.1 5.0 5.0 5.1 2015 ............................................................... 2.33 2.26 2.33 2.44 4.9 4.8 4.9 5.0 2016 ............................................................... 2.43 2.34 2.53 2.56 5.0 4.9 5.1 5.1 2017 ............................................................... 2.62 – – – 5.2 – – –
Legally required benefits 2006 ............................................................... – – – 2.83 – – – 7.1 2007 ............................................................... 2.83 2.86 2.88 2.93 7.1 7.3 7.1 7.0 2008 ............................................................... 2.95 2.96 2.98 2.97 7.0 7.0 6.9 6.7 2009 ............................................................... 2.97 2.95 2.98 3.01 6.8 6.8 6.8 6.8 2010 ............................................................... 3.03 3.02 3.08 3.04 6.8 6.9 6.8 6.7
2011 ............................................................... 3.04 3.03 3.09 3.03 6.7 6.8 6.7 6.7 2012 ............................................................... 3.05 3.03 3.07 3.13 6.7 6.7 6.7 6.9 2013 ............................................................... 3.13 3.10 3.13 3.19 6.9 6.9 6.8 6.8 2014 ............................................................... 3.19 3.15 3.21 3.28 6.8 6.8 6.8 6.8 2015 ............................................................... 3.30 3.28 3.28 3.36 7.0 7.0 6.9 6.9 2016 ............................................................... 3.36 3.34 3.35 3.37 6.9 7.0 6.8 6.8 2017 ............................................................... 3.41 – – – 6.8 – – –
Note: The sum of individual items may not equal totals due to rounding. Dashes indicate data are not available.
-306-
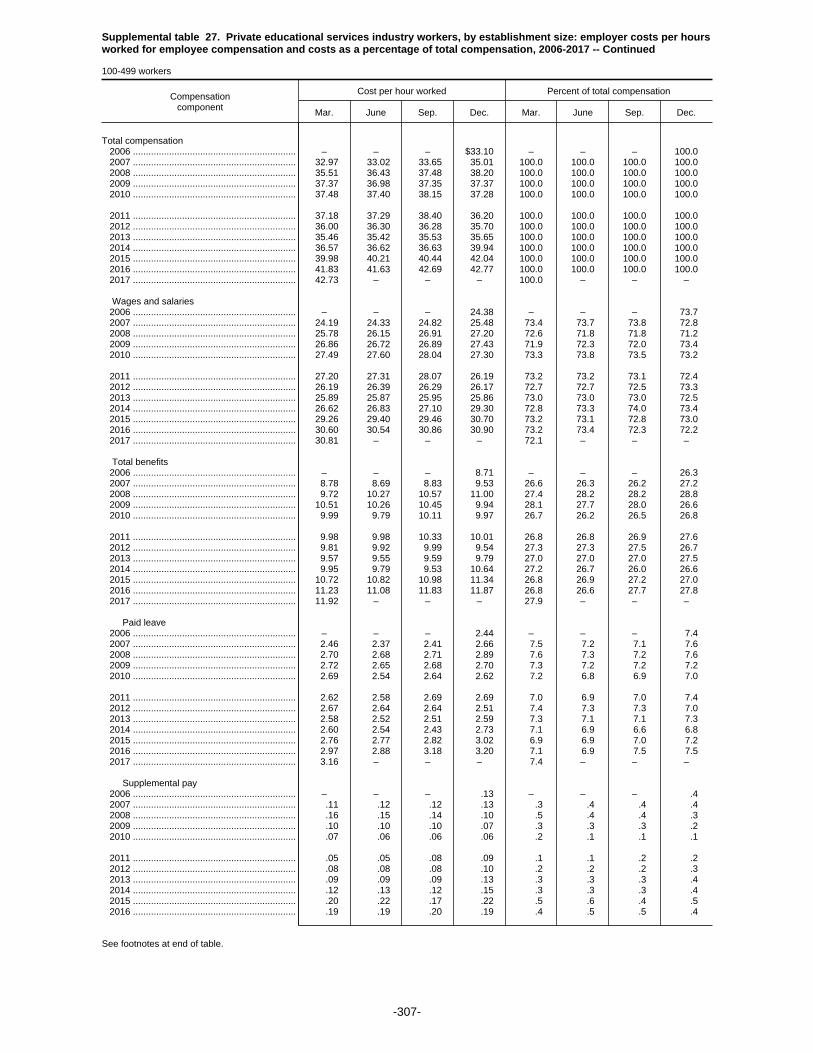
Supplemental table 27. Private educational services industry workers, by establishment size: employer costs per hoursworked for employee compensation and costs as a percentage of total compensation, 2006-2017 -- Continued
100-499 workers
Compensationcomponent
Cost per hour worked Percent of total compensation
Mar. June Sep. Dec. Mar. June Sep. Dec.
Total compensation 2006 ............................................................... – – – $33.10 – – – 100.0 2007 ............................................................... 32.97 33.02 33.65 35.01 100.0 100.0 100.0 100.0 2008 ............................................................... 35.51 36.43 37.48 38.20 100.0 100.0 100.0 100.0 2009 ............................................................... 37.37 36.98 37.35 37.37 100.0 100.0 100.0 100.0 2010 ............................................................... 37.48 37.40 38.15 37.28 100.0 100.0 100.0 100.0
2011 ............................................................... 37.18 37.29 38.40 36.20 100.0 100.0 100.0 100.0 2012 ............................................................... 36.00 36.30 36.28 35.70 100.0 100.0 100.0 100.0 2013 ............................................................... 35.46 35.42 35.53 35.65 100.0 100.0 100.0 100.0 2014 ............................................................... 36.57 36.62 36.63 39.94 100.0 100.0 100.0 100.0 2015 ............................................................... 39.98 40.21 40.44 42.04 100.0 100.0 100.0 100.0 2016 ............................................................... 41.83 41.63 42.69 42.77 100.0 100.0 100.0 100.0 2017 ............................................................... 42.73 – – – 100.0 – – –
Wages and salaries 2006 ............................................................... – – – 24.38 – – – 73.7 2007 ............................................................... 24.19 24.33 24.82 25.48 73.4 73.7 73.8 72.8 2008 ............................................................... 25.78 26.15 26.91 27.20 72.6 71.8 71.8 71.2 2009 ............................................................... 26.86 26.72 26.89 27.43 71.9 72.3 72.0 73.4 2010 ............................................................... 27.49 27.60 28.04 27.30 73.3 73.8 73.5 73.2
2011 ............................................................... 27.20 27.31 28.07 26.19 73.2 73.2 73.1 72.4 2012 ............................................................... 26.19 26.39 26.29 26.17 72.7 72.7 72.5 73.3 2013 ............................................................... 25.89 25.87 25.95 25.86 73.0 73.0 73.0 72.5 2014 ............................................................... 26.62 26.83 27.10 29.30 72.8 73.3 74.0 73.4 2015 ............................................................... 29.26 29.40 29.46 30.70 73.2 73.1 72.8 73.0 2016 ............................................................... 30.60 30.54 30.86 30.90 73.2 73.4 72.3 72.2 2017 ............................................................... 30.81 – – – 72.1 – – –
Total benefits 2006 ............................................................... – – – 8.71 – – – 26.3 2007 ............................................................... 8.78 8.69 8.83 9.53 26.6 26.3 26.2 27.2 2008 ............................................................... 9.72 10.27 10.57 11.00 27.4 28.2 28.2 28.8 2009 ............................................................... 10.51 10.26 10.45 9.94 28.1 27.7 28.0 26.6 2010 ............................................................... 9.99 9.79 10.11 9.97 26.7 26.2 26.5 26.8
2011 ............................................................... 9.98 9.98 10.33 10.01 26.8 26.8 26.9 27.6 2012 ............................................................... 9.81 9.92 9.99 9.54 27.3 27.3 27.5 26.7 2013 ............................................................... 9.57 9.55 9.59 9.79 27.0 27.0 27.0 27.5 2014 ............................................................... 9.95 9.79 9.53 10.64 27.2 26.7 26.0 26.6 2015 ............................................................... 10.72 10.82 10.98 11.34 26.8 26.9 27.2 27.0 2016 ............................................................... 11.23 11.08 11.83 11.87 26.8 26.6 27.7 27.8 2017 ............................................................... 11.92 – – – 27.9 – – –
Paid leave 2006 ............................................................... – – – 2.44 – – – 7.4 2007 ............................................................... 2.46 2.37 2.41 2.66 7.5 7.2 7.1 7.6 2008 ............................................................... 2.70 2.68 2.71 2.89 7.6 7.3 7.2 7.6 2009 ............................................................... 2.72 2.65 2.68 2.70 7.3 7.2 7.2 7.2 2010 ............................................................... 2.69 2.54 2.64 2.62 7.2 6.8 6.9 7.0
2011 ............................................................... 2.62 2.58 2.69 2.69 7.0 6.9 7.0 7.4 2012 ............................................................... 2.67 2.64 2.64 2.51 7.4 7.3 7.3 7.0 2013 ............................................................... 2.58 2.52 2.51 2.59 7.3 7.1 7.1 7.3 2014 ............................................................... 2.60 2.54 2.43 2.73 7.1 6.9 6.6 6.8 2015 ............................................................... 2.76 2.77 2.82 3.02 6.9 6.9 7.0 7.2 2016 ............................................................... 2.97 2.88 3.18 3.20 7.1 6.9 7.5 7.5 2017 ............................................................... 3.16 – – – 7.4 – – –
Supplemental pay 2006 ............................................................... – – – .13 – – – .4 2007 ............................................................... .11 .12 .12 .13 .3 .4 .4 .4 2008 ............................................................... .16 .15 .14 .10 .5 .4 .4 .3 2009 ............................................................... .10 .10 .10 .07 .3 .3 .3 .2 2010 ............................................................... .07 .06 .06 .06 .2 .1 .1 .1
2011 ............................................................... .05 .05 .08 .09 .1 .1 .2 .2 2012 ............................................................... .08 .08 .08 .10 .2 .2 .2 .3 2013 ............................................................... .09 .09 .09 .13 .3 .3 .3 .4 2014 ............................................................... .12 .13 .12 .15 .3 .3 .3 .4 2015 ............................................................... .20 .22 .17 .22 .5 .6 .4 .5 2016 ............................................................... .19 .19 .20 .19 .4 .5 .5 .4
See footnotes at end of table.
-307-
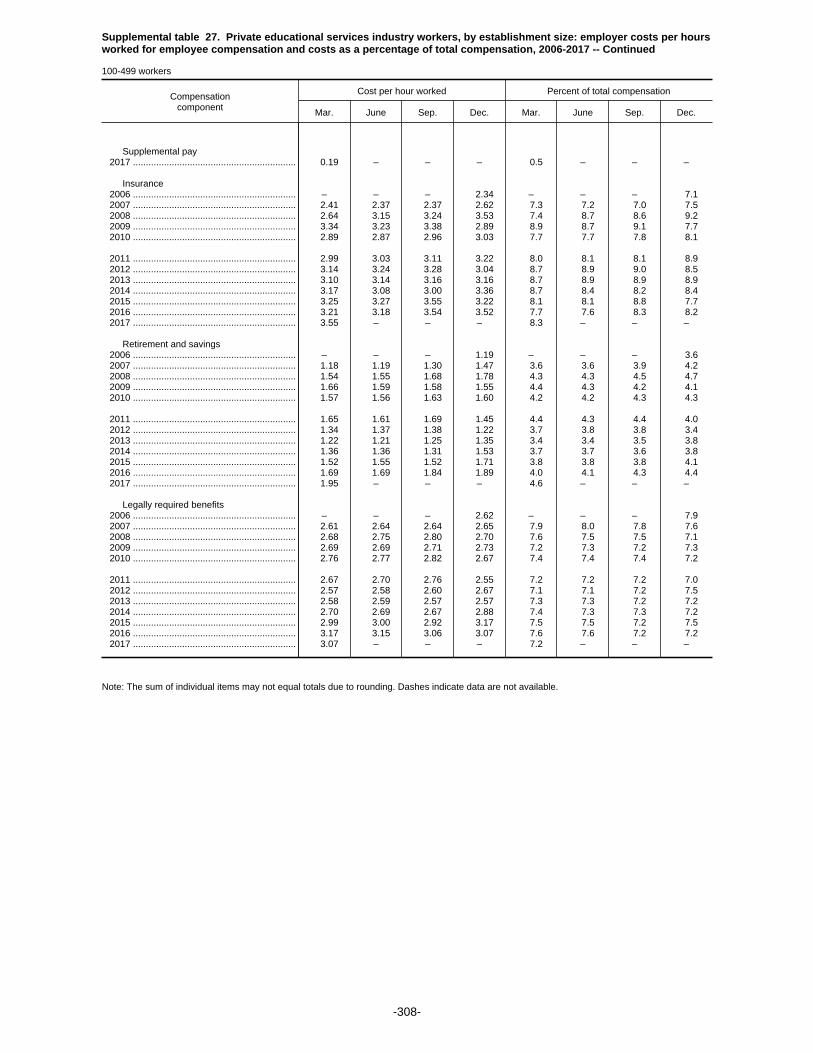
Supplemental table 27. Private educational services industry workers, by establishment size: employer costs per hoursworked for employee compensation and costs as a percentage of total compensation, 2006-2017 -- Continued
100-499 workers
Compensationcomponent
Cost per hour worked Percent of total compensation
Mar. June Sep. Dec. Mar. June Sep. Dec.
Supplemental pay 2017 ............................................................... 0.19 – – – 0.5 – – –
Insurance 2006 ............................................................... – – – 2.34 – – – 7.1 2007 ............................................................... 2.41 2.37 2.37 2.62 7.3 7.2 7.0 7.5 2008 ............................................................... 2.64 3.15 3.24 3.53 7.4 8.7 8.6 9.2 2009 ............................................................... 3.34 3.23 3.38 2.89 8.9 8.7 9.1 7.7 2010 ............................................................... 2.89 2.87 2.96 3.03 7.7 7.7 7.8 8.1
2011 ............................................................... 2.99 3.03 3.11 3.22 8.0 8.1 8.1 8.9 2012 ............................................................... 3.14 3.24 3.28 3.04 8.7 8.9 9.0 8.5 2013 ............................................................... 3.10 3.14 3.16 3.16 8.7 8.9 8.9 8.9 2014 ............................................................... 3.17 3.08 3.00 3.36 8.7 8.4 8.2 8.4 2015 ............................................................... 3.25 3.27 3.55 3.22 8.1 8.1 8.8 7.7 2016 ............................................................... 3.21 3.18 3.54 3.52 7.7 7.6 8.3 8.2 2017 ............................................................... 3.55 – – – 8.3 – – –
Retirement and savings 2006 ............................................................... – – – 1.19 – – – 3.6 2007 ............................................................... 1.18 1.19 1.30 1.47 3.6 3.6 3.9 4.2 2008 ............................................................... 1.54 1.55 1.68 1.78 4.3 4.3 4.5 4.7 2009 ............................................................... 1.66 1.59 1.58 1.55 4.4 4.3 4.2 4.1 2010 ............................................................... 1.57 1.56 1.63 1.60 4.2 4.2 4.3 4.3
2011 ............................................................... 1.65 1.61 1.69 1.45 4.4 4.3 4.4 4.0 2012 ............................................................... 1.34 1.37 1.38 1.22 3.7 3.8 3.8 3.4 2013 ............................................................... 1.22 1.21 1.25 1.35 3.4 3.4 3.5 3.8 2014 ............................................................... 1.36 1.36 1.31 1.53 3.7 3.7 3.6 3.8 2015 ............................................................... 1.52 1.55 1.52 1.71 3.8 3.8 3.8 4.1 2016 ............................................................... 1.69 1.69 1.84 1.89 4.0 4.1 4.3 4.4 2017 ............................................................... 1.95 – – – 4.6 – – –
Legally required benefits 2006 ............................................................... – – – 2.62 – – – 7.9 2007 ............................................................... 2.61 2.64 2.64 2.65 7.9 8.0 7.8 7.6 2008 ............................................................... 2.68 2.75 2.80 2.70 7.6 7.5 7.5 7.1 2009 ............................................................... 2.69 2.69 2.71 2.73 7.2 7.3 7.2 7.3 2010 ............................................................... 2.76 2.77 2.82 2.67 7.4 7.4 7.4 7.2
2011 ............................................................... 2.67 2.70 2.76 2.55 7.2 7.2 7.2 7.0 2012 ............................................................... 2.57 2.58 2.60 2.67 7.1 7.1 7.2 7.5 2013 ............................................................... 2.58 2.59 2.57 2.57 7.3 7.3 7.2 7.2 2014 ............................................................... 2.70 2.69 2.67 2.88 7.4 7.3 7.3 7.2 2015 ............................................................... 2.99 3.00 2.92 3.17 7.5 7.5 7.2 7.5 2016 ............................................................... 3.17 3.15 3.06 3.07 7.6 7.6 7.2 7.2 2017 ............................................................... 3.07 – – – 7.2 – – –
Note: The sum of individual items may not equal totals due to rounding. Dashes indicate data are not available.
-308-

Supplemental table 27. Private educational services industry workers, by establishment size: employer costs per hoursworked for employee compensation and costs as a percentage of total compensation, 2006-2017 -- Continued
500 workers or more
Compensationcomponent
Cost per hour worked Percent of total compensation
Mar. June Sep. Dec. Mar. June Sep. Dec.
Total compensation 2006 ............................................................... – – – $45.01 – – – 100.0 2007 ............................................................... 45.01 44.88 46.04 46.61 100.0 100.0 100.0 100.0 2008 ............................................................... 46.62 46.36 47.74 48.18 100.0 100.0 100.0 100.0 2009 ............................................................... 48.56 48.48 49.14 49.39 100.0 100.0 100.0 100.0 2010 ............................................................... 49.33 49.27 50.05 50.14 100.0 100.0 100.0 100.0
2011 ............................................................... 50.31 50.11 50.80 51.22 100.0 100.0 100.0 100.0 2012 ............................................................... 51.73 51.66 52.40 52.14 100.0 100.0 100.0 100.0 2013 ............................................................... 52.00 52.00 52.87 53.62 100.0 100.0 100.0 100.0 2014 ............................................................... 53.26 53.08 54.15 52.68 100.0 100.0 100.0 100.0 2015 ............................................................... 51.55 50.83 51.90 52.61 100.0 100.0 100.0 100.0 2016 ............................................................... 52.70 51.95 53.28 54.28 100.0 100.0 100.0 100.0 2017 ............................................................... 54.74 – – – 100.0 – – –
Wages and salaries 2006 ............................................................... – – – 32.45 – – – 72.1 2007 ............................................................... 32.41 32.25 33.10 33.60 72.0 71.9 71.9 72.1 2008 ............................................................... 33.61 33.48 34.57 34.79 72.1 72.2 72.4 72.2 2009 ............................................................... 35.00 34.96 35.37 35.60 72.1 72.1 72.0 72.1 2010 ............................................................... 35.46 35.40 36.00 36.03 71.9 71.8 71.9 71.8
2011 ............................................................... 36.12 35.86 36.49 36.82 71.8 71.6 71.8 71.9 2012 ............................................................... 37.14 36.98 37.56 37.49 71.8 71.6 71.7 71.9 2013 ............................................................... 37.39 37.42 37.93 38.08 71.9 72.0 71.8 71.0 2014 ............................................................... 37.67 37.47 38.26 37.06 70.7 70.6 70.7 70.4 2015 ............................................................... 36.49 36.07 36.82 36.93 70.8 71.0 70.9 70.2 2016 ............................................................... 36.96 36.55 37.40 38.14 70.1 70.4 70.2 70.3 2017 ............................................................... 38.42 – – – 70.2 – – –
Total benefits 2006 ............................................................... – – – 12.56 – – – 27.9 2007 ............................................................... 12.60 12.63 12.94 13.01 28.0 28.1 28.1 27.9 2008 ............................................................... 13.00 12.87 13.17 13.39 27.9 27.8 27.6 27.8 2009 ............................................................... 13.55 13.51 13.77 13.79 27.9 27.9 28.0 27.9 2010 ............................................................... 13.87 13.87 14.05 14.12 28.1 28.2 28.1 28.2
2011 ............................................................... 14.19 14.24 14.32 14.40 28.2 28.4 28.2 28.1 2012 ............................................................... 14.60 14.68 14.84 14.65 28.2 28.4 28.3 28.1 2013 ............................................................... 14.60 14.58 14.93 15.54 28.1 28.0 28.2 29.0 2014 ............................................................... 15.59 15.61 15.89 15.61 29.3 29.4 29.3 29.6 2015 ............................................................... 15.06 14.76 15.09 15.68 29.2 29.0 29.1 29.8 2016 ............................................................... 15.73 15.39 15.88 16.14 29.9 29.6 29.8 29.7 2017 ............................................................... 16.32 – – – 29.8 – – –
Paid leave 2006 ............................................................... – – – 3.57 – – – 7.9 2007 ............................................................... 3.54 3.53 3.62 3.66 7.9 7.9 7.9 7.8 2008 ............................................................... 3.62 3.57 3.71 3.81 7.8 7.7 7.8 7.9 2009 ............................................................... 3.83 3.82 3.88 3.87 7.9 7.9 7.9 7.8 2010 ............................................................... 3.85 3.85 3.90 3.94 7.8 7.8 7.8 7.9
2011 ............................................................... 3.90 3.93 3.98 4.04 7.8 7.8 7.8 7.9 2012 ............................................................... 4.07 4.08 4.12 4.07 7.9 7.9 7.9 7.8 2013 ............................................................... 4.04 4.01 4.10 4.28 7.8 7.7 7.8 8.0 2014 ............................................................... 4.28 4.25 4.32 4.25 8.0 8.0 8.0 8.1 2015 ............................................................... 4.04 3.95 4.06 4.27 7.8 7.8 7.8 8.1 2016 ............................................................... 4.26 4.15 4.30 4.41 8.1 8.0 8.1 8.1 2017 ............................................................... 4.44 – – – 8.1 – – –
Supplemental pay 2006 ............................................................... – – – .18 – – – .4 2007 ............................................................... .17 .17 .17 .16 .4 .4 .4 .3 2008 ............................................................... .17 .16 .17 .19 .4 .4 .4 .4 2009 ............................................................... .19 .19 .19 .20 .4 .4 .4 .4 2010 ............................................................... .19 .20 .20 .21 .4 .4 .4 .4
2011 ............................................................... .21 .21 .21 .25 .4 .4 .4 .5 2012 ............................................................... .25 .26 .28 .25 .5 .5 .5 .5 2013 ............................................................... .25 .25 .25 .33 .5 .5 .5 .6 2014 ............................................................... .31 .31 .31 .32 .6 .6 .6 .6 2015 ............................................................... .30 .28 .29 .35 .6 .6 .6 .7 2016 ............................................................... .34 .33 .33 .35 .7 .6 .6 .6
See footnotes at end of table.
-309-

Supplemental table 27. Private educational services industry workers, by establishment size: employer costs per hoursworked for employee compensation and costs as a percentage of total compensation, 2006-2017 -- Continued
500 workers or more
Compensationcomponent
Cost per hour worked Percent of total compensation
Mar. June Sep. Dec. Mar. June Sep. Dec.
Supplemental pay 2017 ............................................................... 0.35 – – – 0.6 – – –
Insurance 2006 ............................................................... – – – 3.40 – – – 7.6 2007 ............................................................... 3.49 3.48 3.53 3.53 7.7 7.8 7.7 7.6 2008 ............................................................... 3.53 3.50 3.58 3.59 7.6 7.6 7.5 7.5 2009 ............................................................... 3.68 3.68 3.80 3.78 7.6 7.6 7.7 7.7 2010 ............................................................... 3.88 3.89 3.94 3.97 7.9 7.9 7.9 7.9
2011 ............................................................... 4.03 4.06 4.00 3.97 8.0 8.1 7.9 7.8 2012 ............................................................... 4.08 4.14 4.15 4.04 7.9 8.0 7.9 7.8 2013 ............................................................... 4.03 4.03 4.14 4.41 7.8 7.8 7.8 8.2 2014 ............................................................... 4.51 4.57 4.63 4.55 8.5 8.6 8.6 8.6 2015 ............................................................... 4.45 4.36 4.42 4.71 8.6 8.6 8.5 9.0 2016 ............................................................... 4.77 4.65 4.79 4.84 9.1 8.9 9.0 8.9 2017 ............................................................... 4.89 – – – 8.9 – – –
Retirement and savings 2006 ............................................................... – – – 2.42 – – – 5.4 2007 ............................................................... 2.41 2.39 2.53 2.54 5.4 5.3 5.5 5.4 2008 ............................................................... 2.55 2.52 2.60 2.66 5.5 5.4 5.5 5.5 2009 ............................................................... 2.69 2.65 2.70 2.72 5.5 5.5 5.5 5.5 2010 ............................................................... 2.73 2.71 2.75 2.73 5.5 5.5 5.5 5.4
2011 ............................................................... 2.77 2.77 2.81 2.79 5.5 5.5 5.5 5.5 2012 ............................................................... 2.81 2.83 2.87 2.84 5.4 5.5 5.5 5.4 2013 ............................................................... 2.79 2.81 2.92 2.96 5.4 5.4 5.5 5.5 2014 ............................................................... 3.00 3.01 3.06 2.97 5.6 5.7 5.6 5.6 2015 ............................................................... 2.79 2.71 2.82 2.87 5.4 5.3 5.4 5.5 2016 ............................................................... 2.88 2.78 2.93 2.99 5.5 5.4 5.5 5.5 2017 ............................................................... 3.02 – – – 5.5 – – –
Legally required benefits 2006 ............................................................... – – – 2.99 – – – 6.6 2007 ............................................................... 2.99 3.06 3.09 3.12 6.6 6.8 6.7 6.7 2008 ............................................................... 3.13 3.12 3.11 3.14 6.7 6.7 6.5 6.5 2009 ............................................................... 3.17 3.17 3.20 3.21 6.5 6.5 6.5 6.5 2010 ............................................................... 3.22 3.22 3.27 3.27 6.5 6.5 6.5 6.5
2011 ............................................................... 3.28 3.27 3.31 3.35 6.5 6.5 6.5 6.5 2012 ............................................................... 3.38 3.38 3.42 3.45 6.5 6.5 6.5 6.6 2013 ............................................................... 3.49 3.48 3.52 3.56 6.7 6.7 6.7 6.6 2014 ............................................................... 3.49 3.48 3.58 3.51 6.6 6.6 6.6 6.7 2015 ............................................................... 3.48 3.45 3.50 3.47 6.7 6.8 6.7 6.6 2016 ............................................................... 3.48 3.48 3.52 3.56 6.6 6.7 6.6 6.6 2017 ............................................................... 3.61 – – – 6.6 – – –
Note: The sum of individual items may not equal totals due to rounding. Dashes indicate data are not available.
-310-

Supplemental table 28. Private health care and social assistance services industry workers, by occupational group:employer costs per hours worked for employee compensation and costs as a percentage of total compensation,2006-2017
All workers
Compensationcomponent
Cost per hour worked Percent of total compensation
Mar. June Sep. Dec. Mar. June Sep. Dec.
Total compensation 2006 ............................................................... – – – $26.09 – – – 100.0 2007 ............................................................... 26.48 26.70 26.33 27.33 100.0 100.0 100.0 100.0 2008 ............................................................... 27.46 27.66 27.91 27.72 100.0 100.0 100.0 100.0 2009 ............................................................... 27.89 28.19 28.28 27.74 100.0 100.0 100.0 100.0 2010 ............................................................... 28.28 28.43 28.58 28.12 100.0 100.0 100.0 100.0
2011 ............................................................... 28.82 28.92 28.54 28.95 100.0 100.0 100.0 100.0 2012 ............................................................... 29.15 29.65 29.39 28.85 100.0 100.0 100.0 100.0 2013 ............................................................... 29.05 29.51 29.49 29.26 100.0 100.0 100.0 100.0 2014 ............................................................... 30.28 30.73 30.19 31.22 100.0 100.0 100.0 100.0 2015 ............................................................... 31.42 31.38 31.38 31.10 100.0 100.0 100.0 100.0 2016 ............................................................... 31.60 32.85 31.62 33.34 100.0 100.0 100.0 100.0 2017 ............................................................... 33.46 – – – 100.0 – – –
Wages and salaries 2006 ............................................................... – – – 18.74 – – – 71.8 2007 ............................................................... 19.01 19.19 18.85 19.57 71.8 71.9 71.6 71.6 2008 ............................................................... 19.67 19.82 19.98 19.85 71.6 71.6 71.6 71.6 2009 ............................................................... 19.95 20.14 20.20 19.74 71.5 71.5 71.4 71.1 2010 ............................................................... 20.17 20.29 20.38 20.02 71.3 71.4 71.3 71.2
2011 ............................................................... 20.49 20.58 20.34 20.58 71.1 71.2 71.3 71.1 2012 ............................................................... 20.69 21.04 20.80 20.54 71.0 71.0 70.8 71.2 2013 ............................................................... 20.65 20.97 20.97 20.72 71.1 71.1 71.1 70.8 2014 ............................................................... 21.34 21.65 21.32 21.97 70.5 70.4 70.6 70.4 2015 ............................................................... 22.08 22.03 22.06 21.81 70.3 70.2 70.3 70.1 2016 ............................................................... 22.17 22.97 22.22 23.30 70.2 69.9 70.3 69.9 2017 ............................................................... 23.35 – – – 69.8 – – –
Total benefits 2006 ............................................................... – – – 7.35 – – – 28.2 2007 ............................................................... 7.47 7.50 7.48 7.75 28.2 28.1 28.4 28.4 2008 ............................................................... 7.79 7.85 7.92 7.87 28.4 28.4 28.4 28.4 2009 ............................................................... 7.94 8.05 8.08 8.01 28.5 28.5 28.6 28.9 2010 ............................................................... 8.11 8.14 8.20 8.10 28.7 28.6 28.7 28.8
2011 ............................................................... 8.33 8.34 8.20 8.36 28.9 28.8 28.7 28.9 2012 ............................................................... 8.46 8.61 8.59 8.31 29.0 29.0 29.2 28.8 2013 ............................................................... 8.40 8.53 8.52 8.54 28.9 28.9 28.9 29.2 2014 ............................................................... 8.94 9.08 8.87 9.25 29.5 29.6 29.4 29.6 2015 ............................................................... 9.33 9.35 9.31 9.28 29.7 29.8 29.7 29.9 2016 ............................................................... 9.43 9.88 9.40 10.04 29.8 30.1 29.7 30.1 2017 ............................................................... 10.11 – – – 30.2 – – –
Paid leave 2006 ............................................................... – – – 2.03 – – – 7.8 2007 ............................................................... 2.07 2.09 2.06 2.10 7.8 7.8 7.8 7.7 2008 ............................................................... 2.08 2.10 2.12 2.14 7.6 7.6 7.6 7.7 2009 ............................................................... 2.13 2.17 2.19 2.15 7.6 7.7 7.7 7.8 2010 ............................................................... 2.16 2.16 2.18 2.16 7.6 7.6 7.6 7.7
2011 ............................................................... 2.24 2.24 2.17 2.26 7.8 7.7 7.6 7.8 2012 ............................................................... 2.23 2.31 2.30 2.21 7.7 7.8 7.8 7.7 2013 ............................................................... 2.24 2.31 2.30 2.29 7.7 7.8 7.8 7.8 2014 ............................................................... 2.40 2.43 2.39 2.44 7.9 7.9 7.9 7.8 2015 ............................................................... 2.46 2.45 2.45 2.45 7.8 7.8 7.8 7.9 2016 ............................................................... 2.48 2.62 2.48 2.66 7.9 8.0 7.8 8.0 2017 ............................................................... 2.67 – – – 8.0 – – –
Supplemental pay 2006 ............................................................... – – – .60 – – – 2.3 2007 ............................................................... .61 .61 .61 .61 2.3 2.3 2.3 2.2 2008 ............................................................... .61 .62 .63 .63 2.2 2.2 2.2 2.3 2009 ............................................................... .64 .65 .65 .64 2.3 2.3 2.3 2.3 2010 ............................................................... .64 .64 .63 .63 2.3 2.2 2.2 2.2
2011 ............................................................... .65 .64 .64 .63 2.3 2.2 2.2 2.2 2012 ............................................................... .65 .63 .63 .63 2.2 2.1 2.2 2.2 2013 ............................................................... .61 .62 .62 .64 2.1 2.1 2.1 2.2 2014 ............................................................... .63 .65 .65 .65 2.1 2.1 2.1 2.1 2015 ............................................................... .65 .66 .66 .71 2.1 2.1 2.1 2.3
See footnotes at end of table.
-311-
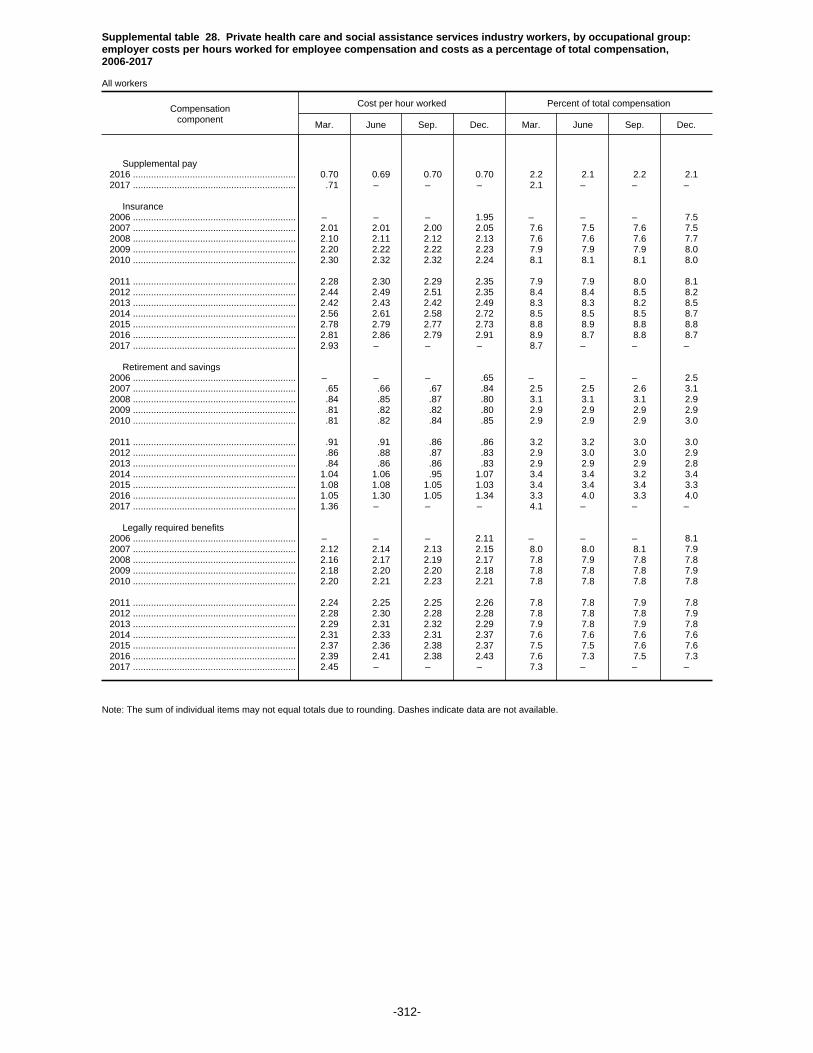
Supplemental table 28. Private health care and social assistance services industry workers, by occupational group:employer costs per hours worked for employee compensation and costs as a percentage of total compensation,2006-2017
All workers
Compensationcomponent
Cost per hour worked Percent of total compensation
Mar. June Sep. Dec. Mar. June Sep. Dec.
Supplemental pay 2016 ............................................................... 0.70 0.69 0.70 0.70 2.2 2.1 2.2 2.1 2017 ............................................................... .71 – – – 2.1 – – –
Insurance 2006 ............................................................... – – – 1.95 – – – 7.5 2007 ............................................................... 2.01 2.01 2.00 2.05 7.6 7.5 7.6 7.5 2008 ............................................................... 2.10 2.11 2.12 2.13 7.6 7.6 7.6 7.7 2009 ............................................................... 2.20 2.22 2.22 2.23 7.9 7.9 7.9 8.0 2010 ............................................................... 2.30 2.32 2.32 2.24 8.1 8.1 8.1 8.0
2011 ............................................................... 2.28 2.30 2.29 2.35 7.9 7.9 8.0 8.1 2012 ............................................................... 2.44 2.49 2.51 2.35 8.4 8.4 8.5 8.2 2013 ............................................................... 2.42 2.43 2.42 2.49 8.3 8.3 8.2 8.5 2014 ............................................................... 2.56 2.61 2.58 2.72 8.5 8.5 8.5 8.7 2015 ............................................................... 2.78 2.79 2.77 2.73 8.8 8.9 8.8 8.8 2016 ............................................................... 2.81 2.86 2.79 2.91 8.9 8.7 8.8 8.7 2017 ............................................................... 2.93 – – – 8.7 – – –
Retirement and savings 2006 ............................................................... – – – .65 – – – 2.5 2007 ............................................................... .65 .66 .67 .84 2.5 2.5 2.6 3.1 2008 ............................................................... .84 .85 .87 .80 3.1 3.1 3.1 2.9 2009 ............................................................... .81 .82 .82 .80 2.9 2.9 2.9 2.9 2010 ............................................................... .81 .82 .84 .85 2.9 2.9 2.9 3.0
2011 ............................................................... .91 .91 .86 .86 3.2 3.2 3.0 3.0 2012 ............................................................... .86 .88 .87 .83 2.9 3.0 3.0 2.9 2013 ............................................................... .84 .86 .86 .83 2.9 2.9 2.9 2.8 2014 ............................................................... 1.04 1.06 .95 1.07 3.4 3.4 3.2 3.4 2015 ............................................................... 1.08 1.08 1.05 1.03 3.4 3.4 3.4 3.3 2016 ............................................................... 1.05 1.30 1.05 1.34 3.3 4.0 3.3 4.0 2017 ............................................................... 1.36 – – – 4.1 – – –
Legally required benefits 2006 ............................................................... – – – 2.11 – – – 8.1 2007 ............................................................... 2.12 2.14 2.13 2.15 8.0 8.0 8.1 7.9 2008 ............................................................... 2.16 2.17 2.19 2.17 7.8 7.9 7.8 7.8 2009 ............................................................... 2.18 2.20 2.20 2.18 7.8 7.8 7.8 7.9 2010 ............................................................... 2.20 2.21 2.23 2.21 7.8 7.8 7.8 7.8
2011 ............................................................... 2.24 2.25 2.25 2.26 7.8 7.8 7.9 7.8 2012 ............................................................... 2.28 2.30 2.28 2.28 7.8 7.8 7.8 7.9 2013 ............................................................... 2.29 2.31 2.32 2.29 7.9 7.8 7.9 7.8 2014 ............................................................... 2.31 2.33 2.31 2.37 7.6 7.6 7.6 7.6 2015 ............................................................... 2.37 2.36 2.38 2.37 7.5 7.5 7.6 7.6 2016 ............................................................... 2.39 2.41 2.38 2.43 7.6 7.3 7.5 7.3 2017 ............................................................... 2.45 – – – 7.3 – – –
Note: The sum of individual items may not equal totals due to rounding. Dashes indicate data are not available.
-312-
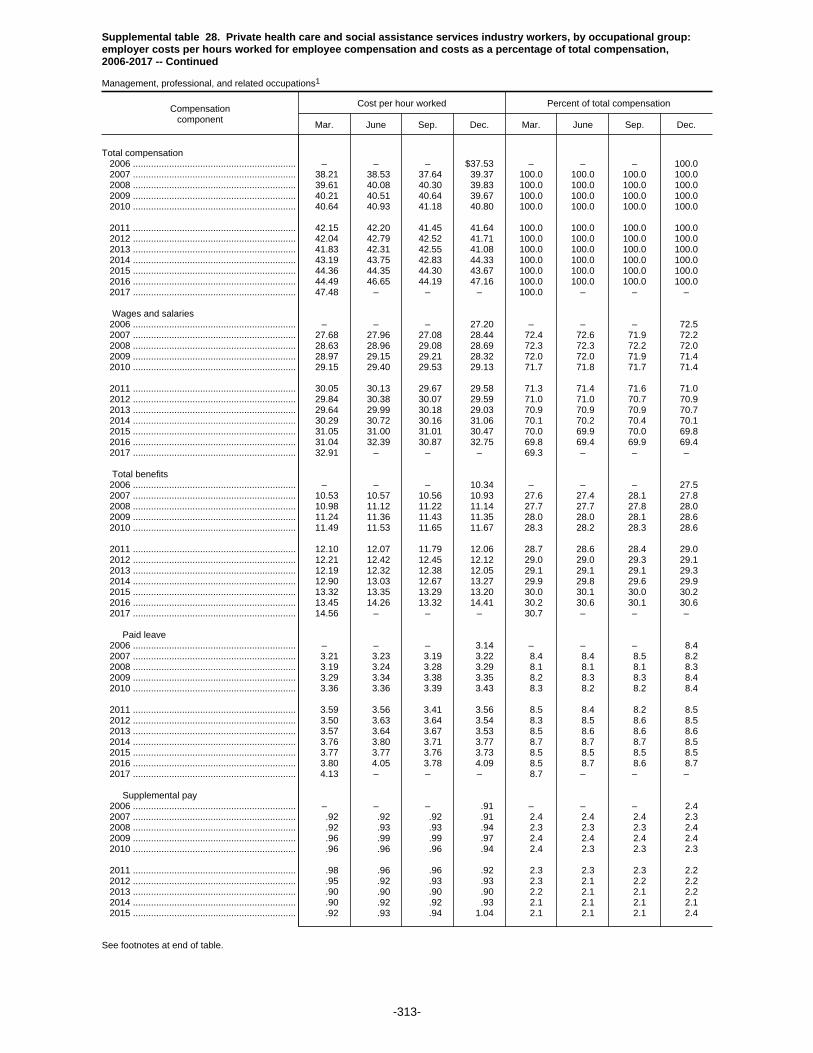
Supplemental table 28. Private health care and social assistance services industry workers, by occupational group:employer costs per hours worked for employee compensation and costs as a percentage of total compensation,2006-2017 -- Continued
Management, professional, and related occupations1
Compensationcomponent
Cost per hour worked Percent of total compensation
Mar. June Sep. Dec. Mar. June Sep. Dec.
Total compensation 2006 ............................................................... – – – $37.53 – – – 100.0 2007 ............................................................... 38.21 38.53 37.64 39.37 100.0 100.0 100.0 100.0 2008 ............................................................... 39.61 40.08 40.30 39.83 100.0 100.0 100.0 100.0 2009 ............................................................... 40.21 40.51 40.64 39.67 100.0 100.0 100.0 100.0 2010 ............................................................... 40.64 40.93 41.18 40.80 100.0 100.0 100.0 100.0
2011 ............................................................... 42.15 42.20 41.45 41.64 100.0 100.0 100.0 100.0 2012 ............................................................... 42.04 42.79 42.52 41.71 100.0 100.0 100.0 100.0 2013 ............................................................... 41.83 42.31 42.55 41.08 100.0 100.0 100.0 100.0 2014 ............................................................... 43.19 43.75 42.83 44.33 100.0 100.0 100.0 100.0 2015 ............................................................... 44.36 44.35 44.30 43.67 100.0 100.0 100.0 100.0 2016 ............................................................... 44.49 46.65 44.19 47.16 100.0 100.0 100.0 100.0 2017 ............................................................... 47.48 – – – 100.0 – – –
Wages and salaries 2006 ............................................................... – – – 27.20 – – – 72.5 2007 ............................................................... 27.68 27.96 27.08 28.44 72.4 72.6 71.9 72.2 2008 ............................................................... 28.63 28.96 29.08 28.69 72.3 72.3 72.2 72.0 2009 ............................................................... 28.97 29.15 29.21 28.32 72.0 72.0 71.9 71.4 2010 ............................................................... 29.15 29.40 29.53 29.13 71.7 71.8 71.7 71.4
2011 ............................................................... 30.05 30.13 29.67 29.58 71.3 71.4 71.6 71.0 2012 ............................................................... 29.84 30.38 30.07 29.59 71.0 71.0 70.7 70.9 2013 ............................................................... 29.64 29.99 30.18 29.03 70.9 70.9 70.9 70.7 2014 ............................................................... 30.29 30.72 30.16 31.06 70.1 70.2 70.4 70.1 2015 ............................................................... 31.05 31.00 31.01 30.47 70.0 69.9 70.0 69.8 2016 ............................................................... 31.04 32.39 30.87 32.75 69.8 69.4 69.9 69.4 2017 ............................................................... 32.91 – – – 69.3 – – –
Total benefits 2006 ............................................................... – – – 10.34 – – – 27.5 2007 ............................................................... 10.53 10.57 10.56 10.93 27.6 27.4 28.1 27.8 2008 ............................................................... 10.98 11.12 11.22 11.14 27.7 27.7 27.8 28.0 2009 ............................................................... 11.24 11.36 11.43 11.35 28.0 28.0 28.1 28.6 2010 ............................................................... 11.49 11.53 11.65 11.67 28.3 28.2 28.3 28.6
2011 ............................................................... 12.10 12.07 11.79 12.06 28.7 28.6 28.4 29.0 2012 ............................................................... 12.21 12.42 12.45 12.12 29.0 29.0 29.3 29.1 2013 ............................................................... 12.19 12.32 12.38 12.05 29.1 29.1 29.1 29.3 2014 ............................................................... 12.90 13.03 12.67 13.27 29.9 29.8 29.6 29.9 2015 ............................................................... 13.32 13.35 13.29 13.20 30.0 30.1 30.0 30.2 2016 ............................................................... 13.45 14.26 13.32 14.41 30.2 30.6 30.1 30.6 2017 ............................................................... 14.56 – – – 30.7 – – –
Paid leave 2006 ............................................................... – – – 3.14 – – – 8.4 2007 ............................................................... 3.21 3.23 3.19 3.22 8.4 8.4 8.5 8.2 2008 ............................................................... 3.19 3.24 3.28 3.29 8.1 8.1 8.1 8.3 2009 ............................................................... 3.29 3.34 3.38 3.35 8.2 8.3 8.3 8.4 2010 ............................................................... 3.36 3.36 3.39 3.43 8.3 8.2 8.2 8.4
2011 ............................................................... 3.59 3.56 3.41 3.56 8.5 8.4 8.2 8.5 2012 ............................................................... 3.50 3.63 3.64 3.54 8.3 8.5 8.6 8.5 2013 ............................................................... 3.57 3.64 3.67 3.53 8.5 8.6 8.6 8.6 2014 ............................................................... 3.76 3.80 3.71 3.77 8.7 8.7 8.7 8.5 2015 ............................................................... 3.77 3.77 3.76 3.73 8.5 8.5 8.5 8.5 2016 ............................................................... 3.80 4.05 3.78 4.09 8.5 8.7 8.6 8.7 2017 ............................................................... 4.13 – – – 8.7 – – –
Supplemental pay 2006 ............................................................... – – – .91 – – – 2.4 2007 ............................................................... .92 .92 .92 .91 2.4 2.4 2.4 2.3 2008 ............................................................... .92 .93 .93 .94 2.3 2.3 2.3 2.4 2009 ............................................................... .96 .99 .99 .97 2.4 2.4 2.4 2.4 2010 ............................................................... .96 .96 .96 .94 2.4 2.3 2.3 2.3
2011 ............................................................... .98 .96 .96 .92 2.3 2.3 2.3 2.2 2012 ............................................................... .95 .92 .93 .93 2.3 2.1 2.2 2.2 2013 ............................................................... .90 .90 .90 .90 2.2 2.1 2.1 2.2 2014 ............................................................... .90 .92 .92 .93 2.1 2.1 2.1 2.1 2015 ............................................................... .92 .93 .94 1.04 2.1 2.1 2.1 2.4
See footnotes at end of table.
-313-
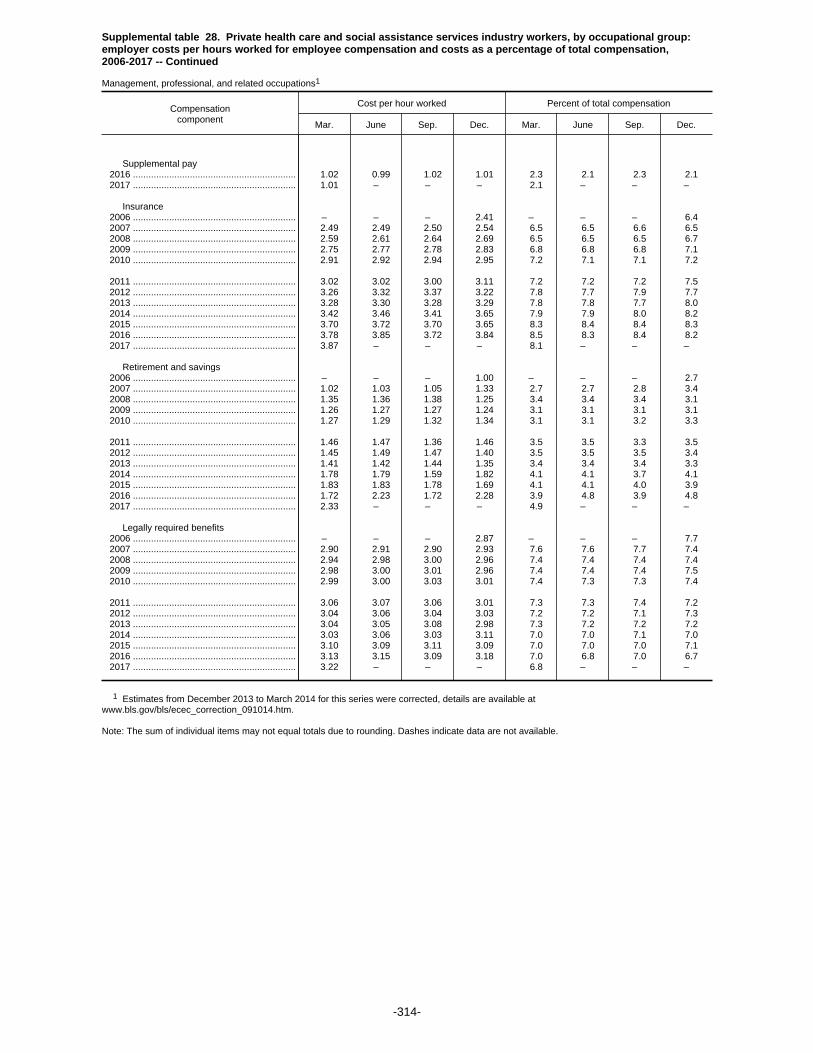
Supplemental table 28. Private health care and social assistance services industry workers, by occupational group:employer costs per hours worked for employee compensation and costs as a percentage of total compensation,2006-2017 -- Continued
Management, professional, and related occupations1
Compensationcomponent
Cost per hour worked Percent of total compensation
Mar. June Sep. Dec. Mar. June Sep. Dec.
Supplemental pay 2016 ............................................................... 1.02 0.99 1.02 1.01 2.3 2.1 2.3 2.1 2017 ............................................................... 1.01 – – – 2.1 – – –
Insurance 2006 ............................................................... – – – 2.41 – – – 6.4 2007 ............................................................... 2.49 2.49 2.50 2.54 6.5 6.5 6.6 6.5 2008 ............................................................... 2.59 2.61 2.64 2.69 6.5 6.5 6.5 6.7 2009 ............................................................... 2.75 2.77 2.78 2.83 6.8 6.8 6.8 7.1 2010 ............................................................... 2.91 2.92 2.94 2.95 7.2 7.1 7.1 7.2
2011 ............................................................... 3.02 3.02 3.00 3.11 7.2 7.2 7.2 7.5 2012 ............................................................... 3.26 3.32 3.37 3.22 7.8 7.7 7.9 7.7 2013 ............................................................... 3.28 3.30 3.28 3.29 7.8 7.8 7.7 8.0 2014 ............................................................... 3.42 3.46 3.41 3.65 7.9 7.9 8.0 8.2 2015 ............................................................... 3.70 3.72 3.70 3.65 8.3 8.4 8.4 8.3 2016 ............................................................... 3.78 3.85 3.72 3.84 8.5 8.3 8.4 8.2 2017 ............................................................... 3.87 – – – 8.1 – – –
Retirement and savings 2006 ............................................................... – – – 1.00 – – – 2.7 2007 ............................................................... 1.02 1.03 1.05 1.33 2.7 2.7 2.8 3.4 2008 ............................................................... 1.35 1.36 1.38 1.25 3.4 3.4 3.4 3.1 2009 ............................................................... 1.26 1.27 1.27 1.24 3.1 3.1 3.1 3.1 2010 ............................................................... 1.27 1.29 1.32 1.34 3.1 3.1 3.2 3.3
2011 ............................................................... 1.46 1.47 1.36 1.46 3.5 3.5 3.3 3.5 2012 ............................................................... 1.45 1.49 1.47 1.40 3.5 3.5 3.5 3.4 2013 ............................................................... 1.41 1.42 1.44 1.35 3.4 3.4 3.4 3.3 2014 ............................................................... 1.78 1.79 1.59 1.82 4.1 4.1 3.7 4.1 2015 ............................................................... 1.83 1.83 1.78 1.69 4.1 4.1 4.0 3.9 2016 ............................................................... 1.72 2.23 1.72 2.28 3.9 4.8 3.9 4.8 2017 ............................................................... 2.33 – – – 4.9 – – –
Legally required benefits 2006 ............................................................... – – – 2.87 – – – 7.7 2007 ............................................................... 2.90 2.91 2.90 2.93 7.6 7.6 7.7 7.4 2008 ............................................................... 2.94 2.98 3.00 2.96 7.4 7.4 7.4 7.4 2009 ............................................................... 2.98 3.00 3.01 2.96 7.4 7.4 7.4 7.5 2010 ............................................................... 2.99 3.00 3.03 3.01 7.4 7.3 7.3 7.4
2011 ............................................................... 3.06 3.07 3.06 3.01 7.3 7.3 7.4 7.2 2012 ............................................................... 3.04 3.06 3.04 3.03 7.2 7.2 7.1 7.3 2013 ............................................................... 3.04 3.05 3.08 2.98 7.3 7.2 7.2 7.2 2014 ............................................................... 3.03 3.06 3.03 3.11 7.0 7.0 7.1 7.0 2015 ............................................................... 3.10 3.09 3.11 3.09 7.0 7.0 7.0 7.1 2016 ............................................................... 3.13 3.15 3.09 3.18 7.0 6.8 7.0 6.7 2017 ............................................................... 3.22 – – – 6.8 – – –
1 Estimates from December 2013 to March 2014 for this series were corrected, details are available atwww.bls.gov/bls/ecec_correction_091014.htm.
Note: The sum of individual items may not equal totals due to rounding. Dashes indicate data are not available.
-314-

Supplemental table 28. Private health care and social assistance services industry workers, by occupational group:employer costs per hours worked for employee compensation and costs as a percentage of total compensation,2006-2017 -- Continued
Professional and related occupations1
Compensationcomponent
Cost per hour worked Percent of total compensation
Mar. June Sep. Dec. Mar. June Sep. Dec.
Total compensation 2006 ............................................................... – – – $37.37 – – – 100.0 2007 ............................................................... 38.10 38.42 37.32 39.28 100.0 100.0 100.0 100.0 2008 ............................................................... 39.45 40.01 40.19 39.64 100.0 100.0 100.0 100.0 2009 ............................................................... 40.13 40.32 40.48 39.17 100.0 100.0 100.0 100.0 2010 ............................................................... 40.30 40.63 40.86 40.37 100.0 100.0 100.0 100.0
2011 ............................................................... 41.82 41.88 41.05 41.02 100.0 100.0 100.0 100.0 2012 ............................................................... 41.35 42.16 41.96 40.80 100.0 100.0 100.0 100.0 2013 ............................................................... 40.99 41.42 41.66 40.36 100.0 100.0 100.0 100.0 2014 ............................................................... 42.71 43.16 42.14 43.92 100.0 100.0 100.0 100.0 2015 ............................................................... 44.00 43.96 43.79 43.03 100.0 100.0 100.0 100.0 2016 ............................................................... 43.75 46.14 43.40 46.72 100.0 100.0 100.0 100.0 2017 ............................................................... 46.97 – – – 100.0 – – –
Wages and salaries 2006 ............................................................... – – – 27.05 – – – 72.4 2007 ............................................................... 27.56 27.83 26.80 28.36 72.4 72.5 71.8 72.2 2008 ............................................................... 28.49 28.90 28.98 28.56 72.2 72.2 72.1 72.0 2009 ............................................................... 28.93 29.02 29.09 27.95 72.1 72.0 71.9 71.4 2010 ............................................................... 28.90 29.17 29.30 28.77 71.7 71.8 71.7 71.3
2011 ............................................................... 29.76 29.85 29.33 29.07 71.2 71.3 71.5 70.9 2012 ............................................................... 29.29 29.87 29.60 28.89 70.8 70.8 70.5 70.8 2013 ............................................................... 28.98 29.29 29.49 28.49 70.7 70.7 70.8 70.6 2014 ............................................................... 29.92 30.27 29.63 30.79 70.1 70.1 70.3 70.1 2015 ............................................................... 30.81 30.75 30.67 30.08 70.0 70.0 70.0 69.9 2016 ............................................................... 30.53 32.02 30.32 32.42 69.8 69.4 69.9 69.4 2017 ............................................................... 32.55 – – – 69.3 – – –
Total benefits 2006 ............................................................... – – – 10.32 – – – 27.6 2007 ............................................................... 10.53 10.58 10.52 10.92 27.6 27.5 28.2 27.8 2008 ............................................................... 10.96 11.11 11.21 11.08 27.8 27.8 27.9 28.0 2009 ............................................................... 11.20 11.30 11.39 11.22 27.9 28.0 28.1 28.6 2010 ............................................................... 11.40 11.45 11.56 11.60 28.3 28.2 28.3 28.7
2011 ............................................................... 12.06 12.03 11.71 11.95 28.8 28.7 28.5 29.1 2012 ............................................................... 12.06 12.30 12.36 11.91 29.2 29.2 29.5 29.2 2013 ............................................................... 12.00 12.13 12.17 11.87 29.3 29.3 29.2 29.4 2014 ............................................................... 12.79 12.89 12.51 13.13 29.9 29.9 29.7 29.9 2015 ............................................................... 13.19 13.21 13.12 12.95 30.0 30.0 30.0 30.1 2016 ............................................................... 13.22 14.12 13.08 14.29 30.2 30.6 30.1 30.6 2017 ............................................................... 14.41 – – – 30.7 – – –
Paid leave 2006 ............................................................... – – – 3.04 – – – 8.1 2007 ............................................................... 3.11 3.14 3.09 3.13 8.2 8.2 8.3 8.0 2008 ............................................................... 3.08 3.15 3.18 3.20 7.8 7.9 7.9 8.1 2009 ............................................................... 3.22 3.25 3.29 3.24 8.0 8.1 8.1 8.3 2010 ............................................................... 3.26 3.26 3.29 3.33 8.1 8.0 8.1 8.3
2011 ............................................................... 3.50 3.47 3.32 3.46 8.4 8.3 8.1 8.4 2012 ............................................................... 3.39 3.54 3.56 3.42 8.2 8.4 8.5 8.4 2013 ............................................................... 3.45 3.51 3.54 3.41 8.4 8.5 8.5 8.5 2014 ............................................................... 3.67 3.69 3.60 3.66 8.6 8.5 8.5 8.3 2015 ............................................................... 3.66 3.65 3.64 3.60 8.3 8.3 8.3 8.4 2016 ............................................................... 3.67 3.95 3.65 4.01 8.4 8.6 8.4 8.6 2017 ............................................................... 4.02 – – – 8.6 – – –
Supplemental pay 2006 ............................................................... – – – 1.02 – – – 2.7 2007 ............................................................... 1.03 1.03 1.02 1.02 2.7 2.7 2.7 2.6 2008 ............................................................... 1.03 1.03 1.04 1.03 2.6 2.6 2.6 2.6 2009 ............................................................... 1.04 1.07 1.08 1.05 2.6 2.7 2.7 2.7 2010 ............................................................... 1.05 1.04 1.04 1.00 2.6 2.6 2.6 2.5
2011 ............................................................... 1.05 1.02 1.02 .96 2.5 2.4 2.5 2.3 2012 ............................................................... .97 .96 .97 .94 2.3 2.3 2.3 2.3 2013 ............................................................... .94 .94 .94 .93 2.3 2.3 2.3 2.3 2014 ............................................................... .93 .95 .95 .96 2.2 2.2 2.2 2.2 2015 ............................................................... .95 .97 .97 1.06 2.2 2.2 2.2 2.5
See footnotes at end of table.
-315-

Supplemental table 28. Private health care and social assistance services industry workers, by occupational group:employer costs per hours worked for employee compensation and costs as a percentage of total compensation,2006-2017 -- Continued
Professional and related occupations1
Compensationcomponent
Cost per hour worked Percent of total compensation
Mar. June Sep. Dec. Mar. June Sep. Dec.
Supplemental pay 2016 ............................................................... 1.06 1.02 1.05 1.04 2.4 2.2 2.4 2.2 2017 ............................................................... 1.04 – – – 2.2 – – –
Insurance 2006 ............................................................... – – – 2.38 – – – 6.4 2007 ............................................................... 2.47 2.46 2.46 2.50 6.5 6.4 6.6 6.4 2008 ............................................................... 2.56 2.58 2.60 2.64 6.5 6.4 6.5 6.7 2009 ............................................................... 2.71 2.73 2.74 2.78 6.7 6.8 6.8 7.1 2010 ............................................................... 2.87 2.89 2.91 2.94 7.1 7.1 7.1 7.3
2011 ............................................................... 3.01 3.01 2.99 3.10 7.2 7.2 7.3 7.6 2012 ............................................................... 3.26 3.31 3.37 3.21 7.9 7.8 8.0 7.9 2013 ............................................................... 3.26 3.28 3.26 3.26 7.9 7.9 7.8 8.1 2014 ............................................................... 3.39 3.42 3.38 3.60 7.9 7.9 8.0 8.2 2015 ............................................................... 3.65 3.67 3.65 3.60 8.3 8.3 8.3 8.4 2016 ............................................................... 3.74 3.82 3.67 3.80 8.5 8.3 8.5 8.1 2017 ............................................................... 3.83 – – – 8.2 – – –
Retirement and savings 2006 ............................................................... – – – 1.02 – – – 2.7 2007 ............................................................... 1.03 1.05 1.05 1.35 2.7 2.7 2.8 3.4 2008 ............................................................... 1.36 1.37 1.39 1.26 3.4 3.4 3.5 3.2 2009 ............................................................... 1.26 1.26 1.27 1.21 3.1 3.1 3.1 3.1 2010 ............................................................... 1.26 1.28 1.31 1.35 3.1 3.1 3.2 3.3
2011 ............................................................... 1.47 1.48 1.35 1.47 3.5 3.5 3.3 3.6 2012 ............................................................... 1.45 1.48 1.46 1.37 3.5 3.5 3.5 3.4 2013 ............................................................... 1.38 1.40 1.42 1.34 3.4 3.4 3.4 3.3 2014 ............................................................... 1.81 1.82 1.60 1.84 4.2 4.2 3.8 4.2 2015 ............................................................... 1.86 1.85 1.78 1.62 4.2 4.2 4.1 3.8 2016 ............................................................... 1.66 2.22 1.66 2.29 3.8 4.8 3.8 4.9 2017 ............................................................... 2.33 – – – 5.0 – – –
Legally required benefits 2006 ............................................................... – – – 2.86 – – – 7.7 2007 ............................................................... 2.89 2.91 2.89 2.92 7.6 7.6 7.7 7.4 2008 ............................................................... 2.93 2.98 3.00 2.96 7.4 7.4 7.5 7.5 2009 ............................................................... 2.98 2.99 3.00 2.94 7.4 7.4 7.4 7.5 2010 ............................................................... 2.96 2.98 3.01 2.98 7.4 7.3 7.4 7.4
2011 ............................................................... 3.04 3.04 3.03 2.96 7.3 7.3 7.4 7.2 2012 ............................................................... 2.99 3.01 3.00 2.97 7.2 7.1 7.1 7.3 2013 ............................................................... 2.98 3.00 3.02 2.93 7.3 7.2 7.3 7.3 2014 ............................................................... 2.99 3.01 2.98 3.08 7.0 7.0 7.1 7.0 2015 ............................................................... 3.07 3.07 3.08 3.06 7.0 7.0 7.0 7.1 2016 ............................................................... 3.10 3.12 3.05 3.15 7.1 6.8 7.0 6.7 2017 ............................................................... 3.19 – – – 6.8 – – –
1 Estimates from December 2013 to March 2014 for this series were corrected, details are available atwww.bls.gov/bls/ecec_correction_091014.htm.
Note: The sum of individual items may not equal totals due to rounding. Dashes indicate data are not available.
-316-
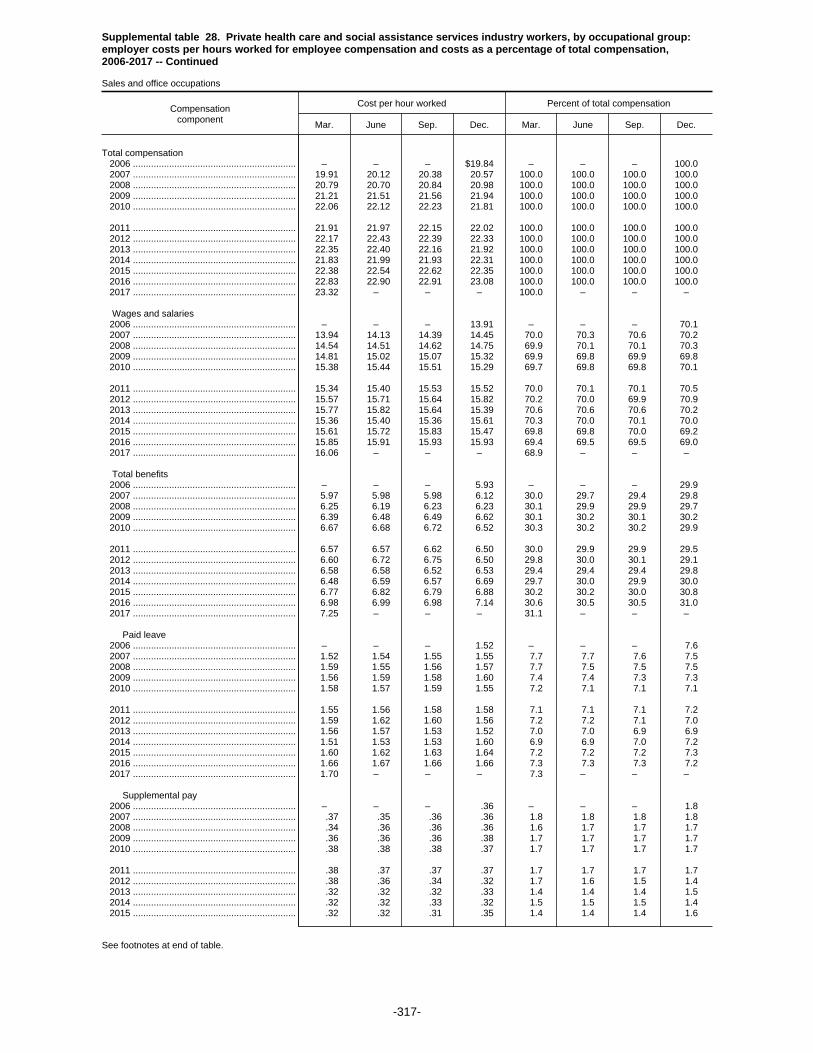
Supplemental table 28. Private health care and social assistance services industry workers, by occupational group:employer costs per hours worked for employee compensation and costs as a percentage of total compensation,2006-2017 -- Continued
Sales and office occupations
Compensationcomponent
Cost per hour worked Percent of total compensation
Mar. June Sep. Dec. Mar. June Sep. Dec.
Total compensation 2006 ............................................................... – – – $19.84 – – – 100.0 2007 ............................................................... 19.91 20.12 20.38 20.57 100.0 100.0 100.0 100.0 2008 ............................................................... 20.79 20.70 20.84 20.98 100.0 100.0 100.0 100.0 2009 ............................................................... 21.21 21.51 21.56 21.94 100.0 100.0 100.0 100.0 2010 ............................................................... 22.06 22.12 22.23 21.81 100.0 100.0 100.0 100.0
2011 ............................................................... 21.91 21.97 22.15 22.02 100.0 100.0 100.0 100.0 2012 ............................................................... 22.17 22.43 22.39 22.33 100.0 100.0 100.0 100.0 2013 ............................................................... 22.35 22.40 22.16 21.92 100.0 100.0 100.0 100.0 2014 ............................................................... 21.83 21.99 21.93 22.31 100.0 100.0 100.0 100.0 2015 ............................................................... 22.38 22.54 22.62 22.35 100.0 100.0 100.0 100.0 2016 ............................................................... 22.83 22.90 22.91 23.08 100.0 100.0 100.0 100.0 2017 ............................................................... 23.32 – – – 100.0 – – –
Wages and salaries 2006 ............................................................... – – – 13.91 – – – 70.1 2007 ............................................................... 13.94 14.13 14.39 14.45 70.0 70.3 70.6 70.2 2008 ............................................................... 14.54 14.51 14.62 14.75 69.9 70.1 70.1 70.3 2009 ............................................................... 14.81 15.02 15.07 15.32 69.9 69.8 69.9 69.8 2010 ............................................................... 15.38 15.44 15.51 15.29 69.7 69.8 69.8 70.1
2011 ............................................................... 15.34 15.40 15.53 15.52 70.0 70.1 70.1 70.5 2012 ............................................................... 15.57 15.71 15.64 15.82 70.2 70.0 69.9 70.9 2013 ............................................................... 15.77 15.82 15.64 15.39 70.6 70.6 70.6 70.2 2014 ............................................................... 15.36 15.40 15.36 15.61 70.3 70.0 70.1 70.0 2015 ............................................................... 15.61 15.72 15.83 15.47 69.8 69.8 70.0 69.2 2016 ............................................................... 15.85 15.91 15.93 15.93 69.4 69.5 69.5 69.0 2017 ............................................................... 16.06 – – – 68.9 – – –
Total benefits 2006 ............................................................... – – – 5.93 – – – 29.9 2007 ............................................................... 5.97 5.98 5.98 6.12 30.0 29.7 29.4 29.8 2008 ............................................................... 6.25 6.19 6.23 6.23 30.1 29.9 29.9 29.7 2009 ............................................................... 6.39 6.48 6.49 6.62 30.1 30.2 30.1 30.2 2010 ............................................................... 6.67 6.68 6.72 6.52 30.3 30.2 30.2 29.9
2011 ............................................................... 6.57 6.57 6.62 6.50 30.0 29.9 29.9 29.5 2012 ............................................................... 6.60 6.72 6.75 6.50 29.8 30.0 30.1 29.1 2013 ............................................................... 6.58 6.58 6.52 6.53 29.4 29.4 29.4 29.8 2014 ............................................................... 6.48 6.59 6.57 6.69 29.7 30.0 29.9 30.0 2015 ............................................................... 6.77 6.82 6.79 6.88 30.2 30.2 30.0 30.8 2016 ............................................................... 6.98 6.99 6.98 7.14 30.6 30.5 30.5 31.0 2017 ............................................................... 7.25 – – – 31.1 – – –
Paid leave 2006 ............................................................... – – – 1.52 – – – 7.6 2007 ............................................................... 1.52 1.54 1.55 1.55 7.7 7.7 7.6 7.5 2008 ............................................................... 1.59 1.55 1.56 1.57 7.7 7.5 7.5 7.5 2009 ............................................................... 1.56 1.59 1.58 1.60 7.4 7.4 7.3 7.3 2010 ............................................................... 1.58 1.57 1.59 1.55 7.2 7.1 7.1 7.1
2011 ............................................................... 1.55 1.56 1.58 1.58 7.1 7.1 7.1 7.2 2012 ............................................................... 1.59 1.62 1.60 1.56 7.2 7.2 7.1 7.0 2013 ............................................................... 1.56 1.57 1.53 1.52 7.0 7.0 6.9 6.9 2014 ............................................................... 1.51 1.53 1.53 1.60 6.9 6.9 7.0 7.2 2015 ............................................................... 1.60 1.62 1.63 1.64 7.2 7.2 7.2 7.3 2016 ............................................................... 1.66 1.67 1.66 1.66 7.3 7.3 7.3 7.2 2017 ............................................................... 1.70 – – – 7.3 – – –
Supplemental pay 2006 ............................................................... – – – .36 – – – 1.8 2007 ............................................................... .37 .35 .36 .36 1.8 1.8 1.8 1.8 2008 ............................................................... .34 .36 .36 .36 1.6 1.7 1.7 1.7 2009 ............................................................... .36 .36 .36 .38 1.7 1.7 1.7 1.7 2010 ............................................................... .38 .38 .38 .37 1.7 1.7 1.7 1.7
2011 ............................................................... .38 .37 .37 .37 1.7 1.7 1.7 1.7 2012 ............................................................... .38 .36 .34 .32 1.7 1.6 1.5 1.4 2013 ............................................................... .32 .32 .32 .33 1.4 1.4 1.4 1.5 2014 ............................................................... .32 .32 .33 .32 1.5 1.5 1.5 1.4 2015 ............................................................... .32 .32 .31 .35 1.4 1.4 1.4 1.6
See footnotes at end of table.
-317-

Supplemental table 28. Private health care and social assistance services industry workers, by occupational group:employer costs per hours worked for employee compensation and costs as a percentage of total compensation,2006-2017 -- Continued
Sales and office occupations
Compensationcomponent
Cost per hour worked Percent of total compensation
Mar. June Sep. Dec. Mar. June Sep. Dec.
Supplemental pay 2016 ............................................................... 0.34 0.35 0.35 0.34 1.5 1.5 1.5 1.5 2017 ............................................................... .35 – – – 1.5 – – –
Insurance 2006 ............................................................... – – – 1.92 – – – 9.7 2007 ............................................................... 1.96 1.95 1.91 1.95 9.8 9.7 9.4 9.5 2008 ............................................................... 2.04 2.00 2.01 2.04 9.8 9.7 9.6 9.7 2009 ............................................................... 2.18 2.20 2.21 2.30 10.3 10.2 10.3 10.5 2010 ............................................................... 2.38 2.36 2.35 2.14 10.8 10.7 10.6 9.8
2011 ............................................................... 2.15 2.18 2.20 2.31 9.8 9.9 9.9 10.5 2012 ............................................................... 2.37 2.43 2.50 2.29 10.7 10.9 11.2 10.2 2013 ............................................................... 2.36 2.36 2.37 2.45 10.5 10.5 10.7 11.2 2014 ............................................................... 2.43 2.49 2.47 2.56 11.2 11.3 11.3 11.5 2015 ............................................................... 2.62 2.64 2.58 2.63 11.7 11.7 11.4 11.8 2016 ............................................................... 2.67 2.68 2.67 2.88 11.7 11.7 11.6 12.5 2017 ............................................................... 2.90 – – – 12.4 – – –
Retirement and savings 2006 ............................................................... – – – .53 – – – 2.7 2007 ............................................................... .52 .53 .54 .62 2.6 2.6 2.6 3.0 2008 ............................................................... .64 .63 .65 .63 3.1 3.1 3.1 3.0 2009 ............................................................... .65 .67 .67 .67 3.0 3.1 3.1 3.0 2010 ............................................................... .66 .68 .69 .76 3.0 3.1 3.1 3.5
2011 ............................................................... .77 .74 .73 .53 3.5 3.3 3.3 2.4 2012 ............................................................... .53 .54 .55 .55 2.4 2.4 2.5 2.5 2013 ............................................................... .57 .56 .56 .53 2.6 2.5 2.5 2.4 2014 ............................................................... .52 .55 .55 .51 2.4 2.5 2.5 2.3 2015 ............................................................... .51 .51 .52 .56 2.3 2.3 2.3 2.5 2016 ............................................................... .57 .57 .58 .55 2.5 2.5 2.5 2.4 2017 ............................................................... .59 – – – 2.5 – – –
Legally required benefits 2006 ............................................................... – – – 1.61 – – – 8.1 2007 ............................................................... 1.60 1.61 1.63 1.63 8.0 8.0 8.0 7.9 2008 ............................................................... 1.63 1.64 1.65 1.64 7.9 7.9 7.9 7.8 2009 ............................................................... 1.65 1.67 1.67 1.67 7.8 7.8 7.7 7.6 2010 ............................................................... 1.68 1.69 1.71 1.69 7.6 7.6 7.7 7.8
2011 ............................................................... 1.71 1.72 1.74 1.71 7.8 7.8 7.8 7.8 2012 ............................................................... 1.74 1.77 1.76 1.78 7.8 7.9 7.9 8.0 2013 ............................................................... 1.77 1.77 1.74 1.70 7.9 7.9 7.8 7.7 2014 ............................................................... 1.69 1.69 1.68 1.71 7.7 7.7 7.7 7.7 2015 ............................................................... 1.71 1.73 1.75 1.71 7.6 7.7 7.7 7.6 2016 ............................................................... 1.73 1.73 1.72 1.71 7.6 7.5 7.5 7.4 2017 ............................................................... 1.72 – – – 7.4 – – –
Note: The sum of individual items may not equal totals due to rounding. Dashes indicate data are not available.
-318-
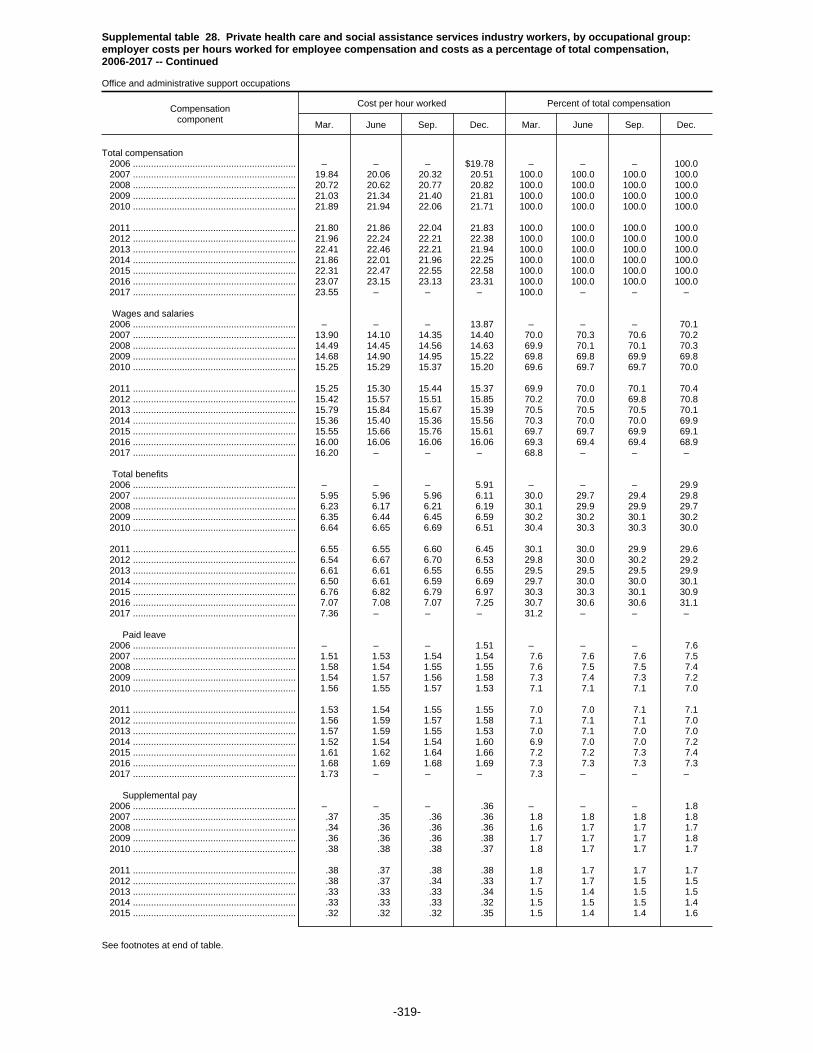
Supplemental table 28. Private health care and social assistance services industry workers, by occupational group:employer costs per hours worked for employee compensation and costs as a percentage of total compensation,2006-2017 -- Continued
Office and administrative support occupations
Compensationcomponent
Cost per hour worked Percent of total compensation
Mar. June Sep. Dec. Mar. June Sep. Dec.
Total compensation 2006 ............................................................... – – – $19.78 – – – 100.0 2007 ............................................................... 19.84 20.06 20.32 20.51 100.0 100.0 100.0 100.0 2008 ............................................................... 20.72 20.62 20.77 20.82 100.0 100.0 100.0 100.0 2009 ............................................................... 21.03 21.34 21.40 21.81 100.0 100.0 100.0 100.0 2010 ............................................................... 21.89 21.94 22.06 21.71 100.0 100.0 100.0 100.0
2011 ............................................................... 21.80 21.86 22.04 21.83 100.0 100.0 100.0 100.0 2012 ............................................................... 21.96 22.24 22.21 22.38 100.0 100.0 100.0 100.0 2013 ............................................................... 22.41 22.46 22.21 21.94 100.0 100.0 100.0 100.0 2014 ............................................................... 21.86 22.01 21.96 22.25 100.0 100.0 100.0 100.0 2015 ............................................................... 22.31 22.47 22.55 22.58 100.0 100.0 100.0 100.0 2016 ............................................................... 23.07 23.15 23.13 23.31 100.0 100.0 100.0 100.0 2017 ............................................................... 23.55 – – – 100.0 – – –
Wages and salaries 2006 ............................................................... – – – 13.87 – – – 70.1 2007 ............................................................... 13.90 14.10 14.35 14.40 70.0 70.3 70.6 70.2 2008 ............................................................... 14.49 14.45 14.56 14.63 69.9 70.1 70.1 70.3 2009 ............................................................... 14.68 14.90 14.95 15.22 69.8 69.8 69.9 69.8 2010 ............................................................... 15.25 15.29 15.37 15.20 69.6 69.7 69.7 70.0
2011 ............................................................... 15.25 15.30 15.44 15.37 69.9 70.0 70.1 70.4 2012 ............................................................... 15.42 15.57 15.51 15.85 70.2 70.0 69.8 70.8 2013 ............................................................... 15.79 15.84 15.67 15.39 70.5 70.5 70.5 70.1 2014 ............................................................... 15.36 15.40 15.36 15.56 70.3 70.0 70.0 69.9 2015 ............................................................... 15.55 15.66 15.76 15.61 69.7 69.7 69.9 69.1 2016 ............................................................... 16.00 16.06 16.06 16.06 69.3 69.4 69.4 68.9 2017 ............................................................... 16.20 – – – 68.8 – – –
Total benefits 2006 ............................................................... – – – 5.91 – – – 29.9 2007 ............................................................... 5.95 5.96 5.96 6.11 30.0 29.7 29.4 29.8 2008 ............................................................... 6.23 6.17 6.21 6.19 30.1 29.9 29.9 29.7 2009 ............................................................... 6.35 6.44 6.45 6.59 30.2 30.2 30.1 30.2 2010 ............................................................... 6.64 6.65 6.69 6.51 30.4 30.3 30.3 30.0
2011 ............................................................... 6.55 6.55 6.60 6.45 30.1 30.0 29.9 29.6 2012 ............................................................... 6.54 6.67 6.70 6.53 29.8 30.0 30.2 29.2 2013 ............................................................... 6.61 6.61 6.55 6.55 29.5 29.5 29.5 29.9 2014 ............................................................... 6.50 6.61 6.59 6.69 29.7 30.0 30.0 30.1 2015 ............................................................... 6.76 6.82 6.79 6.97 30.3 30.3 30.1 30.9 2016 ............................................................... 7.07 7.08 7.07 7.25 30.7 30.6 30.6 31.1 2017 ............................................................... 7.36 – – – 31.2 – – –
Paid leave 2006 ............................................................... – – – 1.51 – – – 7.6 2007 ............................................................... 1.51 1.53 1.54 1.54 7.6 7.6 7.6 7.5 2008 ............................................................... 1.58 1.54 1.55 1.55 7.6 7.5 7.5 7.4 2009 ............................................................... 1.54 1.57 1.56 1.58 7.3 7.4 7.3 7.2 2010 ............................................................... 1.56 1.55 1.57 1.53 7.1 7.1 7.1 7.0
2011 ............................................................... 1.53 1.54 1.55 1.55 7.0 7.0 7.1 7.1 2012 ............................................................... 1.56 1.59 1.57 1.58 7.1 7.1 7.1 7.0 2013 ............................................................... 1.57 1.59 1.55 1.53 7.0 7.1 7.0 7.0 2014 ............................................................... 1.52 1.54 1.54 1.60 6.9 7.0 7.0 7.2 2015 ............................................................... 1.61 1.62 1.64 1.66 7.2 7.2 7.3 7.4 2016 ............................................................... 1.68 1.69 1.68 1.69 7.3 7.3 7.3 7.3 2017 ............................................................... 1.73 – – – 7.3 – – –
Supplemental pay 2006 ............................................................... – – – .36 – – – 1.8 2007 ............................................................... .37 .35 .36 .36 1.8 1.8 1.8 1.8 2008 ............................................................... .34 .36 .36 .36 1.6 1.7 1.7 1.7 2009 ............................................................... .36 .36 .36 .38 1.7 1.7 1.7 1.8 2010 ............................................................... .38 .38 .38 .37 1.8 1.7 1.7 1.7
2011 ............................................................... .38 .37 .38 .38 1.8 1.7 1.7 1.7 2012 ............................................................... .38 .37 .34 .33 1.7 1.7 1.5 1.5 2013 ............................................................... .33 .33 .33 .34 1.5 1.4 1.5 1.5 2014 ............................................................... .33 .33 .33 .32 1.5 1.5 1.5 1.4 2015 ............................................................... .32 .32 .32 .35 1.5 1.4 1.4 1.6
See footnotes at end of table.
-319-
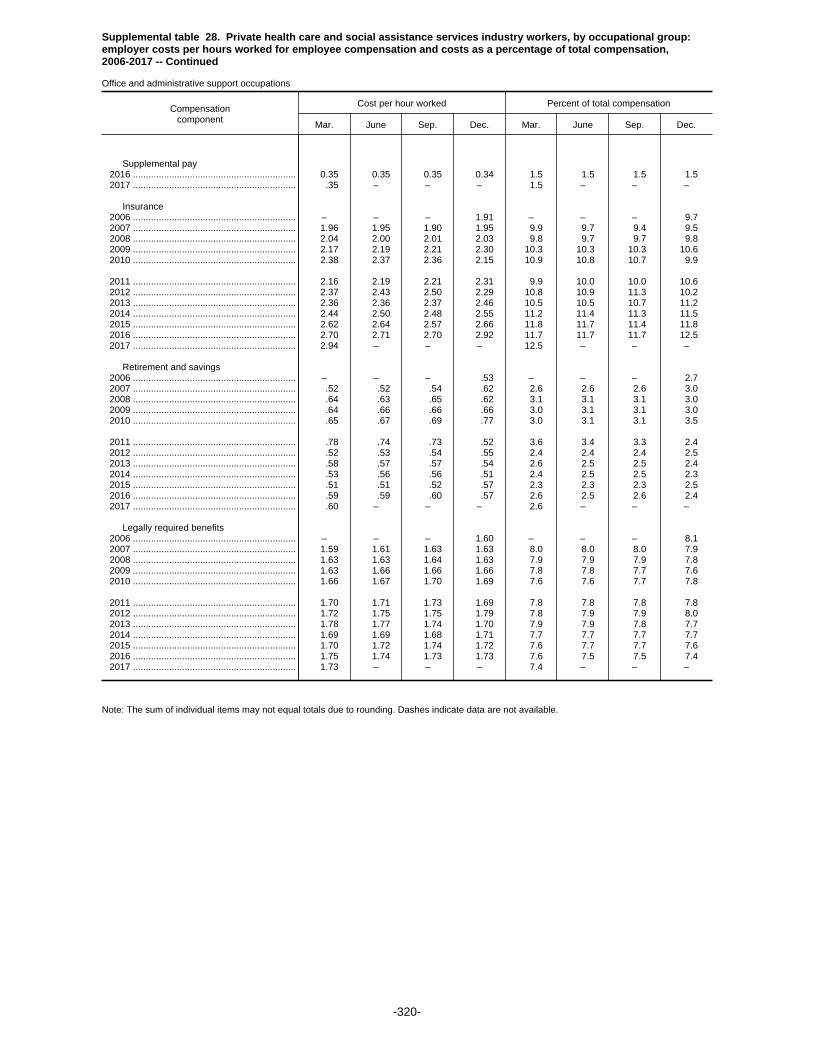
Supplemental table 28. Private health care and social assistance services industry workers, by occupational group:employer costs per hours worked for employee compensation and costs as a percentage of total compensation,2006-2017 -- Continued
Office and administrative support occupations
Compensationcomponent
Cost per hour worked Percent of total compensation
Mar. June Sep. Dec. Mar. June Sep. Dec.
Supplemental pay 2016 ............................................................... 0.35 0.35 0.35 0.34 1.5 1.5 1.5 1.5 2017 ............................................................... .35 – – – 1.5 – – –
Insurance 2006 ............................................................... – – – 1.91 – – – 9.7 2007 ............................................................... 1.96 1.95 1.90 1.95 9.9 9.7 9.4 9.5 2008 ............................................................... 2.04 2.00 2.01 2.03 9.8 9.7 9.7 9.8 2009 ............................................................... 2.17 2.19 2.21 2.30 10.3 10.3 10.3 10.6 2010 ............................................................... 2.38 2.37 2.36 2.15 10.9 10.8 10.7 9.9
2011 ............................................................... 2.16 2.19 2.21 2.31 9.9 10.0 10.0 10.6 2012 ............................................................... 2.37 2.43 2.50 2.29 10.8 10.9 11.3 10.2 2013 ............................................................... 2.36 2.36 2.37 2.46 10.5 10.5 10.7 11.2 2014 ............................................................... 2.44 2.50 2.48 2.55 11.2 11.4 11.3 11.5 2015 ............................................................... 2.62 2.64 2.57 2.66 11.8 11.7 11.4 11.8 2016 ............................................................... 2.70 2.71 2.70 2.92 11.7 11.7 11.7 12.5 2017 ............................................................... 2.94 – – – 12.5 – – –
Retirement and savings 2006 ............................................................... – – – .53 – – – 2.7 2007 ............................................................... .52 .52 .54 .62 2.6 2.6 2.6 3.0 2008 ............................................................... .64 .63 .65 .62 3.1 3.1 3.1 3.0 2009 ............................................................... .64 .66 .66 .66 3.0 3.1 3.1 3.0 2010 ............................................................... .65 .67 .69 .77 3.0 3.1 3.1 3.5
2011 ............................................................... .78 .74 .73 .52 3.6 3.4 3.3 2.4 2012 ............................................................... .52 .53 .54 .55 2.4 2.4 2.4 2.5 2013 ............................................................... .58 .57 .57 .54 2.6 2.5 2.5 2.4 2014 ............................................................... .53 .56 .56 .51 2.4 2.5 2.5 2.3 2015 ............................................................... .51 .51 .52 .57 2.3 2.3 2.3 2.5 2016 ............................................................... .59 .59 .60 .57 2.6 2.5 2.6 2.4 2017 ............................................................... .60 – – – 2.6 – – –
Legally required benefits 2006 ............................................................... – – – 1.60 – – – 8.1 2007 ............................................................... 1.59 1.61 1.63 1.63 8.0 8.0 8.0 7.9 2008 ............................................................... 1.63 1.63 1.64 1.63 7.9 7.9 7.9 7.8 2009 ............................................................... 1.63 1.66 1.66 1.66 7.8 7.8 7.7 7.6 2010 ............................................................... 1.66 1.67 1.70 1.69 7.6 7.6 7.7 7.8
2011 ............................................................... 1.70 1.71 1.73 1.69 7.8 7.8 7.8 7.8 2012 ............................................................... 1.72 1.75 1.75 1.79 7.8 7.9 7.9 8.0 2013 ............................................................... 1.78 1.77 1.74 1.70 7.9 7.9 7.8 7.7 2014 ............................................................... 1.69 1.69 1.68 1.71 7.7 7.7 7.7 7.7 2015 ............................................................... 1.70 1.72 1.74 1.72 7.6 7.7 7.7 7.6 2016 ............................................................... 1.75 1.74 1.73 1.73 7.6 7.5 7.5 7.4 2017 ............................................................... 1.73 – – – 7.4 – – –
Note: The sum of individual items may not equal totals due to rounding. Dashes indicate data are not available.
-320-
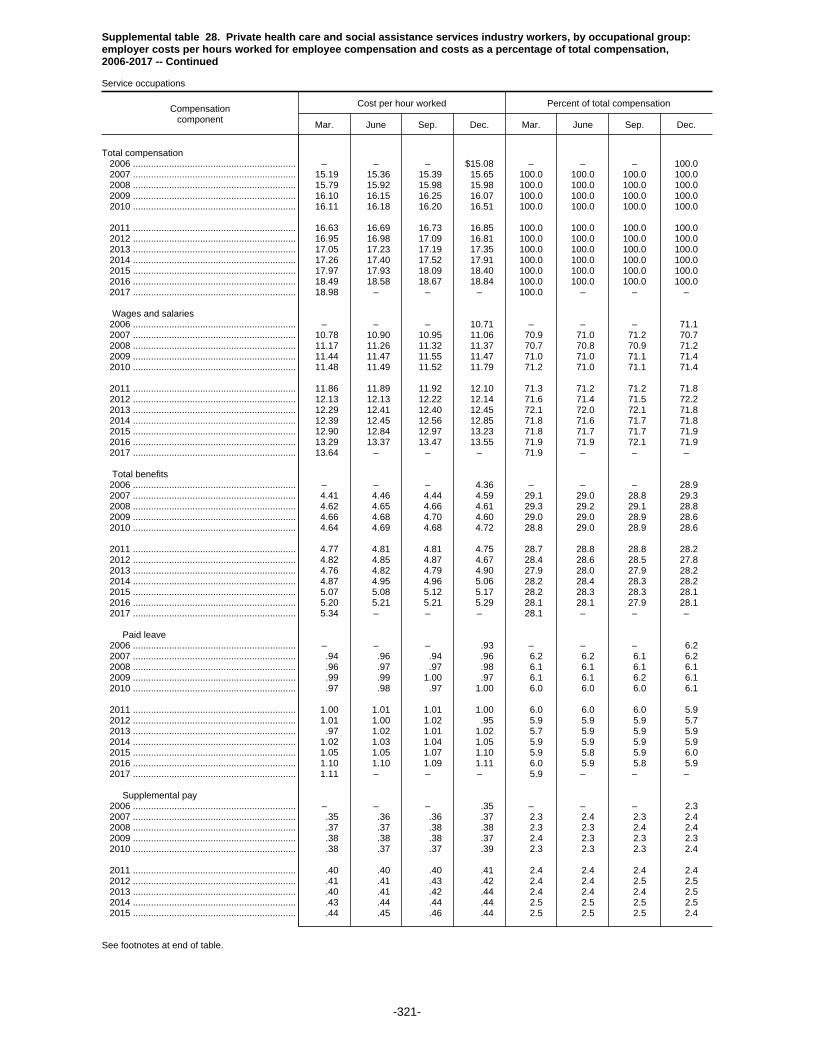
Supplemental table 28. Private health care and social assistance services industry workers, by occupational group:employer costs per hours worked for employee compensation and costs as a percentage of total compensation,2006-2017 -- Continued
Service occupations
Compensationcomponent
Cost per hour worked Percent of total compensation
Mar. June Sep. Dec. Mar. June Sep. Dec.
Total compensation 2006 ............................................................... – – – $15.08 – – – 100.0 2007 ............................................................... 15.19 15.36 15.39 15.65 100.0 100.0 100.0 100.0 2008 ............................................................... 15.79 15.92 15.98 15.98 100.0 100.0 100.0 100.0 2009 ............................................................... 16.10 16.15 16.25 16.07 100.0 100.0 100.0 100.0 2010 ............................................................... 16.11 16.18 16.20 16.51 100.0 100.0 100.0 100.0
2011 ............................................................... 16.63 16.69 16.73 16.85 100.0 100.0 100.0 100.0 2012 ............................................................... 16.95 16.98 17.09 16.81 100.0 100.0 100.0 100.0 2013 ............................................................... 17.05 17.23 17.19 17.35 100.0 100.0 100.0 100.0 2014 ............................................................... 17.26 17.40 17.52 17.91 100.0 100.0 100.0 100.0 2015 ............................................................... 17.97 17.93 18.09 18.40 100.0 100.0 100.0 100.0 2016 ............................................................... 18.49 18.58 18.67 18.84 100.0 100.0 100.0 100.0 2017 ............................................................... 18.98 – – – 100.0 – – –
Wages and salaries 2006 ............................................................... – – – 10.71 – – – 71.1 2007 ............................................................... 10.78 10.90 10.95 11.06 70.9 71.0 71.2 70.7 2008 ............................................................... 11.17 11.26 11.32 11.37 70.7 70.8 70.9 71.2 2009 ............................................................... 11.44 11.47 11.55 11.47 71.0 71.0 71.1 71.4 2010 ............................................................... 11.48 11.49 11.52 11.79 71.2 71.0 71.1 71.4
2011 ............................................................... 11.86 11.89 11.92 12.10 71.3 71.2 71.2 71.8 2012 ............................................................... 12.13 12.13 12.22 12.14 71.6 71.4 71.5 72.2 2013 ............................................................... 12.29 12.41 12.40 12.45 72.1 72.0 72.1 71.8 2014 ............................................................... 12.39 12.45 12.56 12.85 71.8 71.6 71.7 71.8 2015 ............................................................... 12.90 12.84 12.97 13.23 71.8 71.7 71.7 71.9 2016 ............................................................... 13.29 13.37 13.47 13.55 71.9 71.9 72.1 71.9 2017 ............................................................... 13.64 – – – 71.9 – – –
Total benefits 2006 ............................................................... – – – 4.36 – – – 28.9 2007 ............................................................... 4.41 4.46 4.44 4.59 29.1 29.0 28.8 29.3 2008 ............................................................... 4.62 4.65 4.66 4.61 29.3 29.2 29.1 28.8 2009 ............................................................... 4.66 4.68 4.70 4.60 29.0 29.0 28.9 28.6 2010 ............................................................... 4.64 4.69 4.68 4.72 28.8 29.0 28.9 28.6
2011 ............................................................... 4.77 4.81 4.81 4.75 28.7 28.8 28.8 28.2 2012 ............................................................... 4.82 4.85 4.87 4.67 28.4 28.6 28.5 27.8 2013 ............................................................... 4.76 4.82 4.79 4.90 27.9 28.0 27.9 28.2 2014 ............................................................... 4.87 4.95 4.96 5.06 28.2 28.4 28.3 28.2 2015 ............................................................... 5.07 5.08 5.12 5.17 28.2 28.3 28.3 28.1 2016 ............................................................... 5.20 5.21 5.21 5.29 28.1 28.1 27.9 28.1 2017 ............................................................... 5.34 – – – 28.1 – – –
Paid leave 2006 ............................................................... – – – .93 – – – 6.2 2007 ............................................................... .94 .96 .94 .96 6.2 6.2 6.1 6.2 2008 ............................................................... .96 .97 .97 .98 6.1 6.1 6.1 6.1 2009 ............................................................... .99 .99 1.00 .97 6.1 6.1 6.2 6.1 2010 ............................................................... .97 .98 .97 1.00 6.0 6.0 6.0 6.1
2011 ............................................................... 1.00 1.01 1.01 1.00 6.0 6.0 6.0 5.9 2012 ............................................................... 1.01 1.00 1.02 .95 5.9 5.9 5.9 5.7 2013 ............................................................... .97 1.02 1.01 1.02 5.7 5.9 5.9 5.9 2014 ............................................................... 1.02 1.03 1.04 1.05 5.9 5.9 5.9 5.9 2015 ............................................................... 1.05 1.05 1.07 1.10 5.9 5.8 5.9 6.0 2016 ............................................................... 1.10 1.10 1.09 1.11 6.0 5.9 5.8 5.9 2017 ............................................................... 1.11 – – – 5.9 – – –
Supplemental pay 2006 ............................................................... – – – .35 – – – 2.3 2007 ............................................................... .35 .36 .36 .37 2.3 2.4 2.3 2.4 2008 ............................................................... .37 .37 .38 .38 2.3 2.3 2.4 2.4 2009 ............................................................... .38 .38 .38 .37 2.4 2.3 2.3 2.3 2010 ............................................................... .38 .37 .37 .39 2.3 2.3 2.3 2.4
2011 ............................................................... .40 .40 .40 .41 2.4 2.4 2.4 2.4 2012 ............................................................... .41 .41 .43 .42 2.4 2.4 2.5 2.5 2013 ............................................................... .40 .41 .42 .44 2.4 2.4 2.4 2.5 2014 ............................................................... .43 .44 .44 .44 2.5 2.5 2.5 2.5 2015 ............................................................... .44 .45 .46 .44 2.5 2.5 2.5 2.4
See footnotes at end of table.
-321-
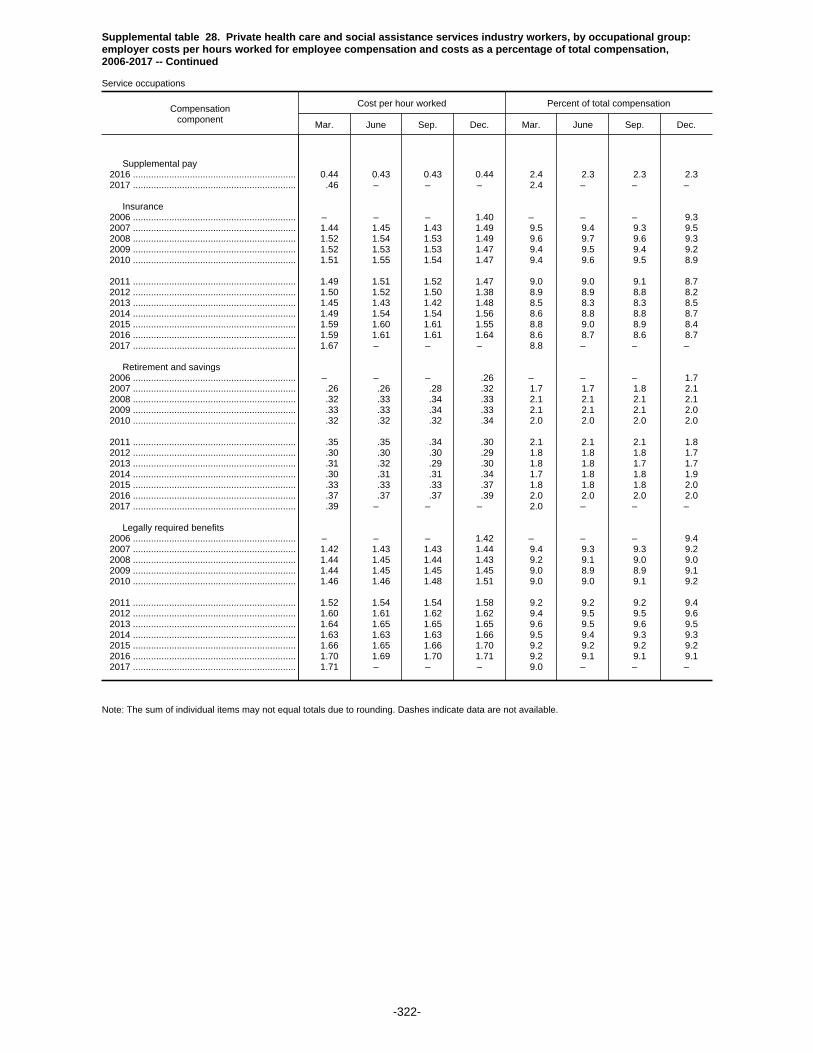
Supplemental table 28. Private health care and social assistance services industry workers, by occupational group:employer costs per hours worked for employee compensation and costs as a percentage of total compensation,2006-2017 -- Continued
Service occupations
Compensationcomponent
Cost per hour worked Percent of total compensation
Mar. June Sep. Dec. Mar. June Sep. Dec.
Supplemental pay 2016 ............................................................... 0.44 0.43 0.43 0.44 2.4 2.3 2.3 2.3 2017 ............................................................... .46 – – – 2.4 – – –
Insurance 2006 ............................................................... – – – 1.40 – – – 9.3 2007 ............................................................... 1.44 1.45 1.43 1.49 9.5 9.4 9.3 9.5 2008 ............................................................... 1.52 1.54 1.53 1.49 9.6 9.7 9.6 9.3 2009 ............................................................... 1.52 1.53 1.53 1.47 9.4 9.5 9.4 9.2 2010 ............................................................... 1.51 1.55 1.54 1.47 9.4 9.6 9.5 8.9
2011 ............................................................... 1.49 1.51 1.52 1.47 9.0 9.0 9.1 8.7 2012 ............................................................... 1.50 1.52 1.50 1.38 8.9 8.9 8.8 8.2 2013 ............................................................... 1.45 1.43 1.42 1.48 8.5 8.3 8.3 8.5 2014 ............................................................... 1.49 1.54 1.54 1.56 8.6 8.8 8.8 8.7 2015 ............................................................... 1.59 1.60 1.61 1.55 8.8 9.0 8.9 8.4 2016 ............................................................... 1.59 1.61 1.61 1.64 8.6 8.7 8.6 8.7 2017 ............................................................... 1.67 – – – 8.8 – – –
Retirement and savings 2006 ............................................................... – – – .26 – – – 1.7 2007 ............................................................... .26 .26 .28 .32 1.7 1.7 1.8 2.1 2008 ............................................................... .32 .33 .34 .33 2.1 2.1 2.1 2.1 2009 ............................................................... .33 .33 .34 .33 2.1 2.1 2.1 2.0 2010 ............................................................... .32 .32 .32 .34 2.0 2.0 2.0 2.0
2011 ............................................................... .35 .35 .34 .30 2.1 2.1 2.1 1.8 2012 ............................................................... .30 .30 .30 .29 1.8 1.8 1.8 1.7 2013 ............................................................... .31 .32 .29 .30 1.8 1.8 1.7 1.7 2014 ............................................................... .30 .31 .31 .34 1.7 1.8 1.8 1.9 2015 ............................................................... .33 .33 .33 .37 1.8 1.8 1.8 2.0 2016 ............................................................... .37 .37 .37 .39 2.0 2.0 2.0 2.0 2017 ............................................................... .39 – – – 2.0 – – –
Legally required benefits 2006 ............................................................... – – – 1.42 – – – 9.4 2007 ............................................................... 1.42 1.43 1.43 1.44 9.4 9.3 9.3 9.2 2008 ............................................................... 1.44 1.45 1.44 1.43 9.2 9.1 9.0 9.0 2009 ............................................................... 1.44 1.45 1.45 1.45 9.0 8.9 8.9 9.1 2010 ............................................................... 1.46 1.46 1.48 1.51 9.0 9.0 9.1 9.2
2011 ............................................................... 1.52 1.54 1.54 1.58 9.2 9.2 9.2 9.4 2012 ............................................................... 1.60 1.61 1.62 1.62 9.4 9.5 9.5 9.6 2013 ............................................................... 1.64 1.65 1.65 1.65 9.6 9.5 9.6 9.5 2014 ............................................................... 1.63 1.63 1.63 1.66 9.5 9.4 9.3 9.3 2015 ............................................................... 1.66 1.65 1.66 1.70 9.2 9.2 9.2 9.2 2016 ............................................................... 1.70 1.69 1.70 1.71 9.2 9.1 9.1 9.1 2017 ............................................................... 1.71 – – – 9.0 – – –
Note: The sum of individual items may not equal totals due to rounding. Dashes indicate data are not available.
-322-

Supplemental table 29. Private health care and social assistance services industry workers, by establishment size:employer costs per hours worked for employee compensation and costs as a percentage of total compensation,2006-2017
1-99 workers
Compensationcomponent
Cost per hour worked Percent of total compensation
Mar. June Sep. Dec. Mar. June Sep. Dec.
Total compensation 2006 ............................................................... – – – $20.97 – – – 100.0 2007 ............................................................... 21.86 22.19 22.39 24.98 100.0 100.0 100.0 100.0 2008 ............................................................... 24.60 24.89 24.79 23.08 100.0 100.0 100.0 100.0 2009 ............................................................... 23.19 23.48 23.73 23.66 100.0 100.0 100.0 100.0 2010 ............................................................... 23.69 23.48 23.64 23.86 100.0 100.0 100.0 100.0
2011 ............................................................... 23.99 23.96 23.54 23.73 100.0 100.0 100.0 100.0 2012 ............................................................... 24.40 24.80 24.36 24.87 100.0 100.0 100.0 100.0 2013 ............................................................... 24.96 25.21 25.34 26.04 100.0 100.0 100.0 100.0 2014 ............................................................... 28.47 28.82 27.23 28.04 100.0 100.0 100.0 100.0 2015 ............................................................... 28.18 28.19 27.90 26.61 100.0 100.0 100.0 100.0 2016 ............................................................... 26.83 29.62 26.44 30.01 100.0 100.0 100.0 100.0 2017 ............................................................... 30.14 – – – 100.0 – – –
Wages and salaries 2006 ............................................................... – – – 15.94 – – – 76.0 2007 ............................................................... 16.57 16.84 17.01 18.96 75.8 75.9 76.0 75.9 2008 ............................................................... 18.73 18.93 18.83 17.49 76.1 76.1 75.9 75.8 2009 ............................................................... 17.60 17.79 17.99 17.78 75.9 75.8 75.8 75.1 2010 ............................................................... 17.81 17.72 17.77 17.90 75.2 75.5 75.2 75.0
2011 ............................................................... 18.01 18.02 17.73 17.68 75.1 75.2 75.3 74.5 2012 ............................................................... 18.10 18.40 17.95 18.69 74.2 74.2 73.7 75.1 2013 ............................................................... 18.80 18.99 19.03 19.34 75.3 75.3 75.1 74.3 2014 ............................................................... 20.81 21.09 20.09 20.76 73.1 73.2 73.8 74.0 2015 ............................................................... 20.85 20.79 20.60 19.81 74.0 73.7 73.9 74.4 2016 ............................................................... 19.96 21.67 19.71 21.87 74.4 73.2 74.6 72.9 2017 ............................................................... 21.91 – – – 72.7 – – –
Total benefits 2006 ............................................................... – – – 5.03 – – – 24.0 2007 ............................................................... 5.29 5.34 5.37 6.02 24.2 24.1 24.0 24.1 2008 ............................................................... 5.88 5.96 5.97 5.59 23.9 23.9 24.1 24.2 2009 ............................................................... 5.59 5.68 5.74 5.88 24.1 24.2 24.2 24.9 2010 ............................................................... 5.87 5.76 5.87 5.96 24.8 24.5 24.8 25.0
2011 ............................................................... 5.98 5.94 5.82 6.05 24.9 24.8 24.7 25.5 2012 ............................................................... 6.30 6.40 6.41 6.18 25.8 25.8 26.3 24.9 2013 ............................................................... 6.17 6.23 6.31 6.70 24.7 24.7 24.9 25.7 2014 ............................................................... 7.66 7.73 7.14 7.28 26.9 26.8 26.2 26.0 2015 ............................................................... 7.34 7.40 7.29 6.80 26.0 26.3 26.1 25.6 2016 ............................................................... 6.88 7.95 6.73 8.14 25.6 26.8 25.4 27.1 2017 ............................................................... 8.23 – – – 27.3 – – –
Paid leave 2006 ............................................................... – – – 1.38 – – – 6.6 2007 ............................................................... 1.48 1.51 1.52 1.60 6.8 6.8 6.8 6.4 2008 ............................................................... 1.55 1.59 1.58 1.53 6.3 6.4 6.4 6.6 2009 ............................................................... 1.53 1.58 1.60 1.68 6.6 6.7 6.8 7.1 2010 ............................................................... 1.66 1.62 1.66 1.65 7.0 6.9 7.0 6.9
2011 ............................................................... 1.64 1.63 1.57 1.66 6.8 6.8 6.7 7.0 2012 ............................................................... 1.70 1.74 1.77 1.72 7.0 7.0 7.3 6.9 2013 ............................................................... 1.72 1.76 1.79 1.89 6.9 7.0 7.1 7.2 2014 ............................................................... 2.15 2.16 2.01 1.93 7.6 7.5 7.4 6.9 2015 ............................................................... 1.94 1.96 1.94 1.77 6.9 6.9 6.9 6.6 2016 ............................................................... 1.79 2.10 1.74 2.13 6.7 7.1 6.6 7.1 2017 ............................................................... 2.15 – – – 7.1 – – –
Supplemental pay 2006 ............................................................... – – – .36 – – – 1.7 2007 ............................................................... .38 .37 .38 .39 1.7 1.7 1.7 1.5 2008 ............................................................... .37 .37 .38 .34 1.5 1.5 1.5 1.5 2009 ............................................................... .35 .35 .35 .31 1.5 1.5 1.5 1.3 2010 ............................................................... .30 .29 .29 .32 1.3 1.2 1.2 1.4
2011 ............................................................... .37 .34 .34 .31 1.5 1.4 1.4 1.3 2012 ............................................................... .35 .33 .32 .34 1.5 1.3 1.3 1.4 2013 ............................................................... .30 .30 .32 .37 1.2 1.2 1.3 1.4 2014 ............................................................... .35 .36 .34 .29 1.2 1.2 1.3 1.0 2015 ............................................................... .30 .32 .32 .38 1.1 1.1 1.2 1.4
See footnotes at end of table.
-323-

Supplemental table 29. Private health care and social assistance services industry workers, by establishment size:employer costs per hours worked for employee compensation and costs as a percentage of total compensation,2006-2017
1-99 workers
Compensationcomponent
Cost per hour worked Percent of total compensation
Mar. June Sep. Dec. Mar. June Sep. Dec.
Supplemental pay 2016 ............................................................... 0.36 0.35 0.36 0.36 1.3 1.2 1.4 1.2 2017 ............................................................... .37 – – – 1.2 – – –
Insurance 2006 ............................................................... – – – 1.09 – – – 5.2 2007 ............................................................... 1.16 1.15 1.17 1.26 5.3 5.2 5.2 5.1 2008 ............................................................... 1.23 1.23 1.24 1.30 5.0 5.0 5.0 5.6 2009 ............................................................... 1.30 1.30 1.32 1.39 5.6 5.5 5.5 5.9 2010 ............................................................... 1.41 1.39 1.39 1.36 5.9 5.9 5.9 5.7
2011 ............................................................... 1.34 1.35 1.36 1.56 5.6 5.6 5.8 6.6 2012 ............................................................... 1.64 1.69 1.73 1.53 6.7 6.8 7.1 6.2 2013 ............................................................... 1.53 1.54 1.56 1.78 6.1 6.1 6.1 6.8 2014 ............................................................... 1.94 1.97 1.85 2.03 6.8 6.8 6.8 7.2 2015 ............................................................... 2.04 2.06 2.02 1.84 7.3 7.3 7.3 6.9 2016 ............................................................... 1.90 2.03 1.83 2.13 7.1 6.9 6.9 7.1 2017 ............................................................... 2.14 – – – 7.1 – – –
Retirement and savings 2006 ............................................................... – – – .35 – – – 1.6 2007 ............................................................... .37 .38 .38 .79 1.7 1.7 1.7 3.2 2008 ............................................................... .79 .79 .81 .53 3.2 3.2 3.3 2.3 2009 ............................................................... .52 .54 .54 .57 2.3 2.3 2.3 2.4 2010 ............................................................... .55 .53 .57 .68 2.3 2.3 2.4 2.8
2011 ............................................................... .65 .64 .57 .58 2.7 2.7 2.4 2.4 2012 ............................................................... .60 .62 .59 .52 2.4 2.5 2.4 2.1 2013 ............................................................... .52 .53 .55 .54 2.1 2.1 2.2 2.1 2014 ............................................................... 1.04 1.05 .80 .88 3.6 3.7 3.0 3.2 2015 ............................................................... .89 .91 .83 .66 3.2 3.2 3.0 2.5 2016 ............................................................... .66 1.25 .66 1.29 2.5 4.2 2.5 4.3 2017 ............................................................... 1.32 – – – 4.4 – – –
Legally required benefits 2006 ............................................................... – – – 1.84 – – – 8.8 2007 ............................................................... 1.90 1.92 1.93 1.97 8.7 8.7 8.6 7.9 2008 ............................................................... 1.94 1.97 1.96 1.88 7.9 7.9 7.9 8.2 2009 ............................................................... 1.90 1.92 1.93 1.95 8.2 8.2 8.1 8.2 2010 ............................................................... 1.95 1.93 1.95 1.96 8.2 8.2 8.2 8.2
2011 ............................................................... 1.99 1.98 1.99 1.94 8.3 8.3 8.4 8.2 2012 ............................................................... 2.01 2.03 2.01 2.07 8.2 8.2 8.2 8.3 2013 ............................................................... 2.09 2.09 2.10 2.13 8.4 8.3 8.3 8.2 2014 ............................................................... 2.18 2.19 2.13 2.15 7.7 7.6 7.8 7.7 2015 ............................................................... 2.16 2.16 2.18 2.16 7.7 7.7 7.8 8.1 2016 ............................................................... 2.17 2.22 2.13 2.23 8.1 7.5 8.0 7.4 2017 ............................................................... 2.24 – – – 7.4 – – –
Note: The sum of individual items may not equal totals due to rounding. Dashes indicate data are not available.
-324-

Supplemental table 29. Private health care and social assistance services industry workers, by establishment size:employer costs per hours worked for employee compensation and costs as a percentage of total compensation,2006-2017 -- Continued
1-49 workers
Compensationcomponent
Cost per hour worked Percent of total compensation
Mar. June Sep. Dec. Mar. June Sep. Dec.
Total compensation 2006 ............................................................... – – – $21.39 – – – 100.0 2007 ............................................................... 21.63 21.83 22.05 25.22 100.0 100.0 100.0 100.0 2008 ............................................................... 25.24 25.16 25.10 22.09 100.0 100.0 100.0 100.0 2009 ............................................................... 22.17 22.40 22.63 22.21 100.0 100.0 100.0 100.0 2010 ............................................................... 22.47 22.44 22.34 21.96 100.0 100.0 100.0 100.0
2011 ............................................................... 22.55 22.39 22.68 23.13 100.0 100.0 100.0 100.0 2012 ............................................................... 23.98 23.65 23.50 24.27 100.0 100.0 100.0 100.0 2013 ............................................................... 24.96 25.21 25.06 25.09 100.0 100.0 100.0 100.0 2014 ............................................................... 24.89 25.26 24.94 25.48 100.0 100.0 100.0 100.0 2015 ............................................................... 25.69 25.66 26.16 27.20 100.0 100.0 100.0 100.0 2016 ............................................................... 27.49 27.13 26.86 27.31 100.0 100.0 100.0 100.0 2017 ............................................................... 27.82 – – – 100.0 – – –
Wages and salaries 2006 ............................................................... – – – 16.37 – – – 76.5 2007 ............................................................... 16.51 16.72 16.91 19.26 76.4 76.6 76.7 76.4 2008 ............................................................... 19.30 19.23 19.16 16.86 76.4 76.4 76.3 76.3 2009 ............................................................... 16.95 17.11 17.28 16.87 76.4 76.4 76.4 75.9 2010 ............................................................... 17.04 16.98 16.90 16.67 75.8 75.7 75.6 75.9
2011 ............................................................... 17.08 17.01 17.19 17.61 75.7 76.0 75.8 76.1 2012 ............................................................... 18.24 17.94 17.80 18.59 76.1 75.9 75.7 76.6 2013 ............................................................... 19.04 19.21 19.08 18.86 76.3 76.2 76.2 75.1 2014 ............................................................... 18.66 18.96 18.77 19.07 75.0 75.1 75.2 74.9 2015 ............................................................... 19.22 19.17 19.52 20.27 74.8 74.7 74.6 74.5 2016 ............................................................... 20.45 20.20 20.02 20.36 74.4 74.5 74.5 74.5 2017 ............................................................... 20.69 – – – 74.4 – – –
Total benefits 2006 ............................................................... – – – 5.02 – – – 23.5 2007 ............................................................... 5.11 5.12 5.14 5.95 23.6 23.4 23.3 23.6 2008 ............................................................... 5.95 5.93 5.94 5.23 23.6 23.6 23.7 23.7 2009 ............................................................... 5.22 5.29 5.35 5.35 23.6 23.6 23.6 24.1 2010 ............................................................... 5.43 5.46 5.45 5.28 24.2 24.3 24.4 24.1
2011 ............................................................... 5.48 5.38 5.49 5.52 24.3 24.0 24.2 23.9 2012 ............................................................... 5.74 5.70 5.71 5.67 23.9 24.1 24.3 23.4 2013 ............................................................... 5.93 6.00 5.97 6.24 23.7 23.8 23.8 24.9 2014 ............................................................... 6.23 6.29 6.17 6.41 25.0 24.9 24.8 25.1 2015 ............................................................... 6.47 6.49 6.65 6.93 25.2 25.3 25.4 25.5 2016 ............................................................... 7.04 6.93 6.84 6.95 25.6 25.5 25.5 25.5 2017 ............................................................... 7.12 – – – 25.6 – – –
Paid leave 2006 ............................................................... – – – 1.41 – – – 6.6 2007 ............................................................... 1.43 1.45 1.45 1.56 6.6 6.6 6.6 6.2 2008 ............................................................... 1.56 1.53 1.54 1.44 6.2 6.1 6.1 6.5 2009 ............................................................... 1.44 1.49 1.50 1.53 6.5 6.6 6.6 6.9 2010 ............................................................... 1.56 1.57 1.57 1.40 6.9 7.0 7.0 6.4
2011 ............................................................... 1.47 1.44 1.46 1.43 6.5 6.4 6.5 6.2 2012 ............................................................... 1.44 1.48 1.47 1.51 6.0 6.3 6.3 6.2 2013 ............................................................... 1.60 1.64 1.64 1.70 6.4 6.5 6.5 6.8 2014 ............................................................... 1.69 1.71 1.69 1.72 6.8 6.8 6.8 6.8 2015 ............................................................... 1.74 1.73 1.80 1.85 6.8 6.7 6.9 6.8 2016 ............................................................... 1.88 1.87 1.82 1.85 6.8 6.9 6.8 6.8 2017 ............................................................... 1.94 – – – 7.0 – – –
Supplemental pay 2006 ............................................................... – – – .37 – – – 1.7 2007 ............................................................... .37 .36 .36 .34 1.7 1.6 1.6 1.4 2008 ............................................................... .37 .37 .37 .33 1.4 1.5 1.5 1.5 2009 ............................................................... .34 .33 .33 .27 1.5 1.5 1.4 1.2 2010 ............................................................... .26 .26 .25 .27 1.2 1.1 1.1 1.2
2011 ............................................................... .33 .29 .30 .28 1.5 1.3 1.3 1.2 2012 ............................................................... .34 .31 .29 .30 1.4 1.3 1.2 1.2 2013 ............................................................... .28 .28 .29 .34 1.1 1.1 1.2 1.4 2014 ............................................................... .32 .34 .36 .30 1.3 1.3 1.4 1.2 2015 ............................................................... .32 .32 .34 .35 1.2 1.2 1.3 1.3
See footnotes at end of table.
-325-
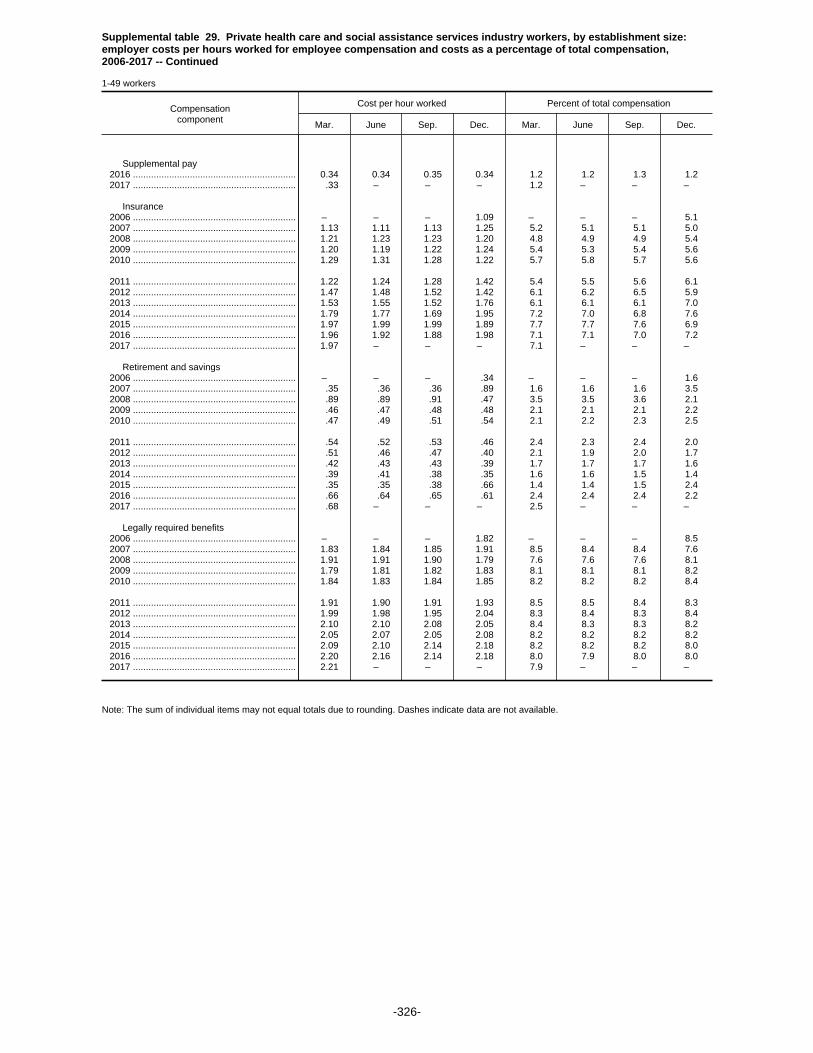
Supplemental table 29. Private health care and social assistance services industry workers, by establishment size:employer costs per hours worked for employee compensation and costs as a percentage of total compensation,2006-2017 -- Continued
1-49 workers
Compensationcomponent
Cost per hour worked Percent of total compensation
Mar. June Sep. Dec. Mar. June Sep. Dec.
Supplemental pay 2016 ............................................................... 0.34 0.34 0.35 0.34 1.2 1.2 1.3 1.2 2017 ............................................................... .33 – – – 1.2 – – –
Insurance 2006 ............................................................... – – – 1.09 – – – 5.1 2007 ............................................................... 1.13 1.11 1.13 1.25 5.2 5.1 5.1 5.0 2008 ............................................................... 1.21 1.23 1.23 1.20 4.8 4.9 4.9 5.4 2009 ............................................................... 1.20 1.19 1.22 1.24 5.4 5.3 5.4 5.6 2010 ............................................................... 1.29 1.31 1.28 1.22 5.7 5.8 5.7 5.6
2011 ............................................................... 1.22 1.24 1.28 1.42 5.4 5.5 5.6 6.1 2012 ............................................................... 1.47 1.48 1.52 1.42 6.1 6.2 6.5 5.9 2013 ............................................................... 1.53 1.55 1.52 1.76 6.1 6.1 6.1 7.0 2014 ............................................................... 1.79 1.77 1.69 1.95 7.2 7.0 6.8 7.6 2015 ............................................................... 1.97 1.99 1.99 1.89 7.7 7.7 7.6 6.9 2016 ............................................................... 1.96 1.92 1.88 1.98 7.1 7.1 7.0 7.2 2017 ............................................................... 1.97 – – – 7.1 – – –
Retirement and savings 2006 ............................................................... – – – .34 – – – 1.6 2007 ............................................................... .35 .36 .36 .89 1.6 1.6 1.6 3.5 2008 ............................................................... .89 .89 .91 .47 3.5 3.5 3.6 2.1 2009 ............................................................... .46 .47 .48 .48 2.1 2.1 2.1 2.2 2010 ............................................................... .47 .49 .51 .54 2.1 2.2 2.3 2.5
2011 ............................................................... .54 .52 .53 .46 2.4 2.3 2.4 2.0 2012 ............................................................... .51 .46 .47 .40 2.1 1.9 2.0 1.7 2013 ............................................................... .42 .43 .43 .39 1.7 1.7 1.7 1.6 2014 ............................................................... .39 .41 .38 .35 1.6 1.6 1.5 1.4 2015 ............................................................... .35 .35 .38 .66 1.4 1.4 1.5 2.4 2016 ............................................................... .66 .64 .65 .61 2.4 2.4 2.4 2.2 2017 ............................................................... .68 – – – 2.5 – – –
Legally required benefits 2006 ............................................................... – – – 1.82 – – – 8.5 2007 ............................................................... 1.83 1.84 1.85 1.91 8.5 8.4 8.4 7.6 2008 ............................................................... 1.91 1.91 1.90 1.79 7.6 7.6 7.6 8.1 2009 ............................................................... 1.79 1.81 1.82 1.83 8.1 8.1 8.1 8.2 2010 ............................................................... 1.84 1.83 1.84 1.85 8.2 8.2 8.2 8.4
2011 ............................................................... 1.91 1.90 1.91 1.93 8.5 8.5 8.4 8.3 2012 ............................................................... 1.99 1.98 1.95 2.04 8.3 8.4 8.3 8.4 2013 ............................................................... 2.10 2.10 2.08 2.05 8.4 8.3 8.3 8.2 2014 ............................................................... 2.05 2.07 2.05 2.08 8.2 8.2 8.2 8.2 2015 ............................................................... 2.09 2.10 2.14 2.18 8.2 8.2 8.2 8.0 2016 ............................................................... 2.20 2.16 2.14 2.18 8.0 7.9 8.0 8.0 2017 ............................................................... 2.21 – – – 7.9 – – –
Note: The sum of individual items may not equal totals due to rounding. Dashes indicate data are not available.
-326-

Supplemental table 29. Private health care and social assistance services industry workers, by establishment size:employer costs per hours worked for employee compensation and costs as a percentage of total compensation,2006-2017 -- Continued
50-99 workers
Compensationcomponent
Cost per hour worked Percent of total compensation
Mar. June Sep. Dec. Mar. June Sep. Dec.
Total compensation 2006 ............................................................... – – – $19.53 – – – 100.0 2007 ............................................................... 22.63 23.45 23.56 24.15 100.0 100.0 100.0 100.0 2008 ............................................................... 22.13 23.92 23.70 26.57 100.0 100.0 100.0 100.0 2009 ............................................................... 26.64 27.24 27.60 28.68 100.0 100.0 100.0 100.0 2010 ............................................................... 27.65 27.15 28.05 29.70 100.0 100.0 100.0 100.0
2011 ............................................................... 28.62 29.08 26.14 25.51 100.0 100.0 100.0 100.0 2012 ............................................................... 25.47 27.57 26.45 26.53 100.0 100.0 100.0 100.0 2013 ............................................................... 24.96 25.23 26.16 28.75 100.0 100.0 100.0 100.0 2014 ............................................................... 38.79 39.63 33.97 35.22 100.0 100.0 100.0 100.0 2015 ............................................................... 34.92 35.16 32.59 25.02 100.0 100.0 100.0 100.0 2016 ............................................................... 25.06 36.17 25.31 36.50 100.0 100.0 100.0 100.0 2017 ............................................................... 35.40 – – – 100.0 – – –
Wages and salaries 2006 ............................................................... – – – 14.48 – – – 74.2 2007 ............................................................... 16.76 17.29 17.38 17.90 74.1 73.7 73.8 74.1 2008 ............................................................... 16.52 17.84 17.65 19.72 74.7 74.6 74.5 74.2 2009 ............................................................... 19.80 20.18 20.47 20.94 74.3 74.1 74.2 73.0 2010 ............................................................... 20.33 20.34 20.76 21.65 73.5 74.9 74.0 72.9
2011 ............................................................... 21.00 21.32 19.34 17.87 73.4 73.3 74.0 70.1 2012 ............................................................... 17.74 19.50 18.34 18.94 69.7 70.7 69.3 71.4 2013 ............................................................... 18.04 18.28 18.85 20.72 72.3 72.4 72.1 72.1 2014 ............................................................... 27.02 27.54 23.99 25.49 69.6 69.5 70.6 72.4 2015 ............................................................... 25.24 25.24 23.54 18.56 72.3 71.8 72.2 74.2 2016 ............................................................... 18.62 25.55 18.89 25.50 74.3 70.6 74.6 69.9 2017 ............................................................... 24.65 – – – 69.6 – – –
Total benefits 2006 ............................................................... – – – 5.04 – – – 25.8 2007 ............................................................... 5.87 6.16 6.18 6.25 25.9 26.3 26.2 25.9 2008 ............................................................... 5.61 6.08 6.04 6.85 25.3 25.4 25.5 25.8 2009 ............................................................... 6.84 7.06 7.13 7.74 25.7 25.9 25.8 27.0 2010 ............................................................... 7.33 6.81 7.29 8.05 26.5 25.1 26.0 27.1
2011 ............................................................... 7.62 7.75 6.80 7.64 26.6 26.7 26.0 29.9 2012 ............................................................... 7.73 8.08 8.12 7.59 30.3 29.3 30.7 28.6 2013 ............................................................... 6.92 6.95 7.31 8.02 27.7 27.6 27.9 27.9 2014 ............................................................... 11.78 12.09 9.98 9.73 30.4 30.5 29.4 27.6 2015 ............................................................... 9.68 9.91 9.05 6.46 27.7 28.2 27.8 25.8 2016 ............................................................... 6.45 10.62 6.42 11.01 25.7 29.4 25.4 30.1 2017 ............................................................... 10.74 – – – 30.4 – – –
Paid leave 2006 ............................................................... – – – 1.29 – – – 6.6 2007 ............................................................... 1.63 1.74 1.75 1.77 7.2 7.4 7.4 7.3 2008 ............................................................... 1.50 1.78 1.73 1.84 6.8 7.4 7.3 6.9 2009 ............................................................... 1.82 1.92 1.95 2.18 6.8 7.0 7.1 7.6 2010 ............................................................... 2.00 1.80 1.99 2.40 7.2 6.6 7.1 8.1
2011 ............................................................... 2.20 2.25 1.88 2.36 7.7 7.7 7.2 9.3 2012 ............................................................... 2.37 2.35 2.49 2.28 9.3 8.5 9.4 8.6 2013 ............................................................... 2.07 2.12 2.23 2.44 8.3 8.4 8.5 8.5 2014 ............................................................... 3.49 3.55 2.93 2.51 9.0 9.0 8.6 7.1 2015 ............................................................... 2.47 2.57 2.33 1.55 7.1 7.3 7.1 6.2 2016 ............................................................... 1.54 2.72 1.54 2.80 6.1 7.5 6.1 7.7 2017 ............................................................... 2.65 – – – 7.5 – – –
Supplemental pay 2006 ............................................................... – – – .36 – – – 1.8 2007 ............................................................... .41 .43 .43 .53 1.8 1.8 1.8 2.2 2008 ............................................................... .37 .40 .42 .41 1.7 1.7 1.8 1.5 2009 ............................................................... .40 .42 .43 .44 1.5 1.6 1.6 1.5 2010 ............................................................... .43 .42 .45 .50 1.5 1.6 1.6 1.7
2011 ............................................................... .47 .47 .43 .40 1.7 1.6 1.7 1.6 2012 ............................................................... .39 .38 .40 .45 1.5 1.4 1.5 1.7 2013 ............................................................... .38 .36 .39 .45 1.5 1.4 1.5 1.5 2014 ............................................................... .44 .43 .31 .26 1.1 1.1 .9 .7 2015 ............................................................... .27 .31 .28 .43 .8 .9 .9 1.7
See footnotes at end of table.
-327-

Supplemental table 29. Private health care and social assistance services industry workers, by establishment size:employer costs per hours worked for employee compensation and costs as a percentage of total compensation,2006-2017 -- Continued
50-99 workers
Compensationcomponent
Cost per hour worked Percent of total compensation
Mar. June Sep. Dec. Mar. June Sep. Dec.
Supplemental pay 2016 ............................................................... 0.41 0.39 0.41 0.42 1.6 1.1 1.6 1.1 2017 ............................................................... .46 – – – 1.3 – – –
Insurance 2006 ............................................................... – – – 1.10 – – – 5.6 2007 ............................................................... 1.26 1.32 1.34 1.30 5.6 5.6 5.7 5.4 2008 ............................................................... 1.32 1.26 1.28 1.65 5.9 5.3 5.4 6.2 2009 ............................................................... 1.63 1.68 1.68 1.90 6.1 6.2 6.1 6.6 2010 ............................................................... 1.78 1.65 1.76 1.76 6.4 6.1 6.3 5.9
2011 ............................................................... 1.71 1.74 1.61 1.96 6.0 6.0 6.2 7.7 2012 ............................................................... 2.08 2.21 2.22 1.84 8.2 8.0 8.4 6.9 2013 ............................................................... 1.56 1.53 1.65 1.85 6.2 6.1 6.3 6.4 2014 ............................................................... 2.39 2.56 2.33 2.25 6.2 6.4 6.8 6.4 2015 ............................................................... 2.24 2.27 2.12 1.74 6.4 6.5 6.5 6.9 2016 ............................................................... 1.76 2.32 1.70 2.50 7.0 6.4 6.7 6.8 2017 ............................................................... 2.54 – – – 7.2 – – –
Retirement and savings 2006 ............................................................... – – – .37 – – – 1.9 2007 ............................................................... .43 .45 .45 .45 1.9 1.9 1.9 1.8 2008 ............................................................... .39 .45 .46 .72 1.8 1.9 1.9 2.7 2009 ............................................................... .72 .77 .76 .87 2.7 2.8 2.8 3.0 2010 ............................................................... .82 .69 .79 1.10 2.9 2.5 2.8 3.7
2011 ............................................................... 1.01 1.03 .67 .93 3.5 3.6 2.6 3.6 2012 ............................................................... .83 1.01 .88 .85 3.3 3.7 3.3 3.2 2013 ............................................................... .85 .87 .90 .96 3.4 3.4 3.4 3.3 2014 ............................................................... 2.89 3.01 2.04 2.38 7.5 7.6 6.0 6.8 2015 ............................................................... 2.35 2.44 2.06 .64 6.7 6.9 6.3 2.6 2016 ............................................................... .64 2.83 .68 2.92 2.6 7.8 2.7 8.0 2017 ............................................................... 2.76 – – – 7.8 – – –
Legally required benefits 2006 ............................................................... – – – 1.92 – – – 9.8 2007 ............................................................... 2.14 2.22 2.22 2.20 9.5 9.5 9.4 9.1 2008 ............................................................... 2.02 2.19 2.15 2.23 9.1 9.1 9.1 8.4 2009 ............................................................... 2.27 2.27 2.31 2.36 8.5 8.3 8.4 8.2 2010 ............................................................... 2.30 2.26 2.31 2.28 8.3 8.3 8.2 7.7
2011 ............................................................... 2.23 2.27 2.21 1.98 7.8 7.8 8.4 7.8 2012 ............................................................... 2.05 2.13 2.13 2.16 8.1 7.7 8.1 8.2 2013 ............................................................... 2.07 2.07 2.14 2.33 8.3 8.2 8.2 8.1 2014 ............................................................... 2.57 2.55 2.36 2.33 6.6 6.4 6.9 6.6 2015 ............................................................... 2.34 2.31 2.27 2.10 6.7 6.6 7.0 8.4 2016 ............................................................... 2.09 2.38 2.09 2.37 8.3 6.6 8.2 6.5 2017 ............................................................... 2.33 – – – 6.6 – – –
Note: The sum of individual items may not equal totals due to rounding. Dashes indicate data are not available.
-328-

Supplemental table 29. Private health care and social assistance services industry workers, by establishment size:employer costs per hours worked for employee compensation and costs as a percentage of total compensation,2006-2017 -- Continued
100 workers or more
Compensationcomponent
Cost per hour worked Percent of total compensation
Mar. June Sep. Dec. Mar. June Sep. Dec.
Total compensation 2006 ............................................................... – – – $28.86 – – – 100.0 2007 ............................................................... 28.98 29.07 28.46 28.63 100.0 100.0 100.0 100.0 2008 ............................................................... 29.03 29.22 29.63 30.53 100.0 100.0 100.0 100.0 2009 ............................................................... 30.72 31.01 30.99 30.32 100.0 100.0 100.0 100.0 2010 ............................................................... 31.23 31.53 31.74 31.05 100.0 100.0 100.0 100.0
2011 ............................................................... 32.19 32.29 31.99 32.63 100.0 100.0 100.0 100.0 2012 ............................................................... 32.56 33.06 33.01 31.72 100.0 100.0 100.0 100.0 2013 ............................................................... 31.92 32.51 32.53 31.58 100.0 100.0 100.0 100.0 2014 ............................................................... 31.61 32.09 32.33 33.60 100.0 100.0 100.0 100.0 2015 ............................................................... 33.87 33.71 33.97 34.57 100.0 100.0 100.0 100.0 2016 ............................................................... 35.21 35.39 35.63 35.99 100.0 100.0 100.0 100.0 2017 ............................................................... 36.16 – – – 100.0 – – –
Wages and salaries 2006 ............................................................... – – – 20.25 – – – 70.2 2007 ............................................................... 20.33 20.43 19.84 19.91 70.1 70.3 69.7 69.6 2008 ............................................................... 20.19 20.32 20.62 21.27 69.5 69.5 69.6 69.7 2009 ............................................................... 21.36 21.55 21.52 20.97 69.5 69.5 69.4 69.2 2010 ............................................................... 21.69 21.89 22.05 21.49 69.4 69.4 69.5 69.2
2011 ............................................................... 22.23 22.32 22.15 22.63 69.1 69.1 69.2 69.4 2012 ............................................................... 22.55 22.89 22.85 21.88 69.3 69.2 69.2 69.0 2013 ............................................................... 21.95 22.37 22.40 21.71 68.8 68.8 68.9 68.8 2014 ............................................................... 21.73 22.05 22.20 22.87 68.7 68.7 68.7 68.1 2015 ............................................................... 23.02 22.94 23.15 23.36 68.0 68.1 68.2 67.6 2016 ............................................................... 23.84 23.99 24.16 24.43 67.7 67.8 67.8 67.9 2017 ............................................................... 24.52 – – – 67.8 – – –
Total benefits 2006 ............................................................... – – – 8.61 – – – 29.8 2007 ............................................................... 8.65 8.64 8.62 8.72 29.9 29.7 30.3 30.4 2008 ............................................................... 8.85 8.90 9.01 9.25 30.5 30.5 30.4 30.3 2009 ............................................................... 9.36 9.46 9.47 9.35 30.5 30.5 30.6 30.8 2010 ............................................................... 9.55 9.63 9.69 9.57 30.6 30.6 30.5 30.8
2011 ............................................................... 9.96 9.97 9.84 10.00 30.9 30.9 30.8 30.6 2012 ............................................................... 10.01 10.17 10.16 9.84 30.7 30.8 30.8 31.0 2013 ............................................................... 9.97 10.15 10.13 9.87 31.2 31.2 31.1 31.2 2014 ............................................................... 9.88 10.04 10.13 10.73 31.3 31.3 31.3 31.9 2015 ............................................................... 10.85 10.77 10.82 11.20 32.0 31.9 31.8 32.4 2016 ............................................................... 11.37 11.40 11.47 11.56 32.3 32.2 32.2 32.1 2017 ............................................................... 11.64 – – – 32.2 – – –
Paid leave 2006 ............................................................... – – – 2.39 – – – 8.3 2007 ............................................................... 2.39 2.39 2.36 2.37 8.3 8.2 8.3 8.3 2008 ............................................................... 2.37 2.38 2.42 2.50 8.2 8.2 8.2 8.2 2009 ............................................................... 2.49 2.52 2.53 2.45 8.1 8.1 8.2 8.1 2010 ............................................................... 2.48 2.50 2.51 2.52 7.9 7.9 7.9 8.1
2011 ............................................................... 2.66 2.65 2.58 2.68 8.3 8.2 8.1 8.2 2012 ............................................................... 2.61 2.71 2.68 2.57 8.0 8.2 8.1 8.1 2013 ............................................................... 2.60 2.69 2.68 2.58 8.2 8.3 8.2 8.2 2014 ............................................................... 2.58 2.63 2.66 2.83 8.2 8.2 8.2 8.4 2015 ............................................................... 2.85 2.81 2.83 2.97 8.4 8.3 8.3 8.6 2016 ............................................................... 3.01 3.03 3.05 3.08 8.5 8.6 8.6 8.6 2017 ............................................................... 3.09 – – – 8.5 – – –
Supplemental pay 2006 ............................................................... – – – .73 – – – 2.5 2007 ............................................................... .74 .73 .74 .74 2.5 2.5 2.6 2.6 2008 ............................................................... .75 .76 .76 .80 2.6 2.6 2.6 2.6 2009 ............................................................... .81 .83 .83 .85 2.6 2.7 2.7 2.8 2010 ............................................................... .86 .85 .85 .83 2.8 2.7 2.7 2.7
2011 ............................................................... .85 .84 .85 .86 2.6 2.6 2.7 2.6 2012 ............................................................... .86 .85 .86 .84 2.6 2.6 2.6 2.6 2013 ............................................................... .83 .84 .84 .83 2.6 2.6 2.6 2.6 2014 ............................................................... .84 .86 .86 .92 2.7 2.7 2.7 2.7 2015 ............................................................... .91 .91 .92 .96 2.7 2.7 2.7 2.8
See footnotes at end of table.
-329-

Supplemental table 29. Private health care and social assistance services industry workers, by establishment size:employer costs per hours worked for employee compensation and costs as a percentage of total compensation,2006-2017 -- Continued
100 workers or more
Compensationcomponent
Cost per hour worked Percent of total compensation
Mar. June Sep. Dec. Mar. June Sep. Dec.
Supplemental pay 2016 ............................................................... 0.95 0.95 0.96 0.97 2.7 2.7 2.7 2.7 2017 ............................................................... .98 – – – 2.7 – – –
Insurance 2006 ............................................................... – – – 2.42 – – – 8.4 2007 ............................................................... 2.47 2.46 2.45 2.49 8.5 8.5 8.6 8.7 2008 ............................................................... 2.58 2.60 2.61 2.64 8.9 8.9 8.8 8.6 2009 ............................................................... 2.74 2.77 2.76 2.77 8.9 8.9 8.9 9.1 2010 ............................................................... 2.87 2.90 2.91 2.86 9.2 9.2 9.2 9.2
2011 ............................................................... 2.94 2.94 2.93 2.91 9.1 9.1 9.2 8.9 2012 ............................................................... 3.01 3.05 3.07 2.95 9.3 9.2 9.3 9.3 2013 ............................................................... 3.03 3.06 3.05 3.01 9.5 9.4 9.4 9.5 2014 ............................................................... 3.01 3.07 3.10 3.24 9.5 9.6 9.6 9.6 2015 ............................................................... 3.33 3.32 3.32 3.41 9.8 9.9 9.8 9.9 2016 ............................................................... 3.50 3.52 3.53 3.53 9.9 9.9 9.9 9.8 2017 ............................................................... 3.56 – – – 9.8 – – –
Retirement and savings 2006 ............................................................... – – – .81 – – – 2.8 2007 ............................................................... .80 .81 .83 .86 2.8 2.8 2.9 3.0 2008 ............................................................... .87 .88 .90 .97 3.0 3.0 3.0 3.2 2009 ............................................................... .98 .98 .98 .94 3.2 3.2 3.2 3.1 2010 ............................................................... .98 1.00 1.01 .98 3.1 3.2 3.2 3.1
2011 ............................................................... 1.09 1.10 1.05 1.06 3.4 3.4 3.3 3.3 2012 ............................................................... 1.05 1.07 1.07 1.05 3.2 3.2 3.2 3.3 2013 ............................................................... 1.07 1.09 1.08 1.05 3.4 3.4 3.3 3.3 2014 ............................................................... 1.04 1.06 1.06 1.21 3.3 3.3 3.3 3.6 2015 ............................................................... 1.23 1.21 1.22 1.32 3.6 3.6 3.6 3.8 2016 ............................................................... 1.34 1.35 1.36 1.38 3.8 3.8 3.8 3.8 2017 ............................................................... 1.39 – – – 3.9 – – –
Legally required benefits 2006 ............................................................... – – – 2.26 – – – 7.8 2007 ............................................................... 2.24 2.25 2.24 2.25 7.7 7.7 7.9 7.9 2008 ............................................................... 2.28 2.29 2.31 2.34 7.8 7.8 7.8 7.7 2009 ............................................................... 2.34 2.36 2.36 2.33 7.6 7.6 7.6 7.7 2010 ............................................................... 2.36 2.38 2.41 2.38 7.6 7.6 7.6 7.7
2011 ............................................................... 2.42 2.44 2.43 2.48 7.5 7.6 7.6 7.6 2012 ............................................................... 2.48 2.50 2.48 2.43 7.6 7.6 7.5 7.7 2013 ............................................................... 2.43 2.47 2.47 2.40 7.6 7.6 7.6 7.6 2014 ............................................................... 2.40 2.43 2.44 2.53 7.6 7.6 7.5 7.5 2015 ............................................................... 2.52 2.51 2.53 2.53 7.5 7.5 7.4 7.3 2016 ............................................................... 2.56 2.56 2.57 2.59 7.3 7.2 7.2 7.2 2017 ............................................................... 2.62 – – – 7.2 – – –
Note: The sum of individual items may not equal totals due to rounding. Dashes indicate data are not available.
-330-

Supplemental table 29. Private health care and social assistance services industry workers, by establishment size:employer costs per hours worked for employee compensation and costs as a percentage of total compensation,2006-2017 -- Continued
100-499 workers
Compensationcomponent
Cost per hour worked Percent of total compensation
Mar. June Sep. Dec. Mar. June Sep. Dec.
Total compensation 2006 ............................................................... – – – $25.43 – – – 100.0 2007 ............................................................... 25.09 25.28 23.70 23.98 100.0 100.0 100.0 100.0 2008 ............................................................... 24.35 24.39 24.57 26.53 100.0 100.0 100.0 100.0 2009 ............................................................... 26.29 26.80 26.81 25.05 100.0 100.0 100.0 100.0 2010 ............................................................... 26.66 26.94 26.98 25.27 100.0 100.0 100.0 100.0
2011 ............................................................... 27.61 27.43 26.60 26.68 100.0 100.0 100.0 100.0 2012 ............................................................... 25.94 26.90 26.76 24.50 100.0 100.0 100.0 100.0 2013 ............................................................... 24.70 25.52 25.50 24.45 100.0 100.0 100.0 100.0 2014 ............................................................... 24.32 24.81 25.15 26.49 100.0 100.0 100.0 100.0 2015 ............................................................... 26.97 27.00 27.18 27.94 100.0 100.0 100.0 100.0 2016 ............................................................... 28.22 28.61 28.72 28.96 100.0 100.0 100.0 100.0 2017 ............................................................... 29.26 – – – 100.0 – – –
Wages and salaries 2006 ............................................................... – – – 18.65 – – – 73.3 2007 ............................................................... 18.42 18.65 17.10 17.34 73.4 73.7 72.2 72.3 2008 ............................................................... 17.61 17.61 17.72 19.22 72.3 72.2 72.1 72.5 2009 ............................................................... 19.05 19.36 19.36 17.96 72.4 72.3 72.2 71.7 2010 ............................................................... 19.31 19.45 19.53 18.21 72.4 72.2 72.4 72.1
2011 ............................................................... 19.76 19.67 19.17 19.32 71.6 71.7 72.1 72.4 2012 ............................................................... 18.83 19.49 19.38 17.51 72.6 72.4 72.4 71.5 2013 ............................................................... 17.53 18.13 18.15 17.59 71.0 71.0 71.2 72.0 2014 ............................................................... 17.52 17.88 18.06 18.79 72.0 72.1 71.8 70.9 2015 ............................................................... 19.05 19.11 19.25 19.59 70.6 70.8 70.8 70.1 2016 ............................................................... 19.85 20.12 20.24 20.44 70.3 70.3 70.5 70.6 2017 ............................................................... 20.66 – – – 70.6 – – –
Total benefits 2006 ............................................................... – – – 6.78 – – – 26.7 2007 ............................................................... 6.67 6.64 6.60 6.63 26.6 26.3 27.8 27.7 2008 ............................................................... 6.74 6.78 6.85 7.30 27.7 27.8 27.9 27.5 2009 ............................................................... 7.24 7.43 7.45 7.09 27.6 27.7 27.8 28.3 2010 ............................................................... 7.36 7.48 7.44 7.06 27.6 27.8 27.6 27.9
2011 ............................................................... 7.85 7.75 7.43 7.35 28.4 28.3 27.9 27.6 2012 ............................................................... 7.11 7.41 7.38 6.98 27.4 27.6 27.6 28.5 2013 ............................................................... 7.17 7.40 7.35 6.85 29.0 29.0 28.8 28.0 2014 ............................................................... 6.80 6.93 7.09 7.70 28.0 27.9 28.2 29.1 2015 ............................................................... 7.92 7.89 7.92 8.35 29.4 29.2 29.2 29.9 2016 ............................................................... 8.37 8.50 8.48 8.53 29.7 29.7 29.5 29.4 2017 ............................................................... 8.60 – – – 29.4 – – –
Paid leave 2006 ............................................................... – – – 1.86 – – – 7.3 2007 ............................................................... 1.81 1.82 1.76 1.79 7.2 7.2 7.4 7.5 2008 ............................................................... 1.82 1.80 1.82 1.96 7.5 7.4 7.4 7.4 2009 ............................................................... 1.89 1.94 1.96 1.81 7.2 7.3 7.3 7.2 2010 ............................................................... 1.86 1.89 1.86 1.84 7.0 7.0 6.9 7.3
2011 ............................................................... 2.14 2.10 1.93 1.93 7.7 7.6 7.2 7.2 2012 ............................................................... 1.74 1.93 1.88 1.77 6.7 7.2 7.0 7.2 2013 ............................................................... 1.79 1.94 1.92 1.75 7.2 7.6 7.5 7.1 2014 ............................................................... 1.74 1.77 1.83 2.00 7.2 7.1 7.3 7.6 2015 ............................................................... 2.07 2.06 2.07 2.19 7.7 7.6 7.6 7.8 2016 ............................................................... 2.19 2.22 2.24 2.25 7.8 7.8 7.8 7.8 2017 ............................................................... 2.27 – – – 7.8 – – –
Supplemental pay 2006 ............................................................... – – – .48 – – – 1.9 2007 ............................................................... .48 .47 .48 .47 1.9 1.8 2.0 2.0 2008 ............................................................... .46 .48 .47 .51 1.9 2.0 1.9 1.9 2009 ............................................................... .52 .57 .57 .59 2.0 2.1 2.1 2.4 2010 ............................................................... .60 .61 .61 .52 2.3 2.3 2.3 2.0
2011 ............................................................... .56 .55 .54 .52 2.0 2.0 2.0 1.9 2012 ............................................................... .52 .51 .54 .50 2.0 1.9 2.0 2.0 2013 ............................................................... .48 .50 .51 .46 1.9 2.0 2.0 1.9 2014 ............................................................... .46 .46 .47 .47 1.9 1.9 1.9 1.8 2015 ............................................................... .48 .48 .49 .55 1.8 1.8 1.8 2.0
See footnotes at end of table.
-331-

Supplemental table 29. Private health care and social assistance services industry workers, by establishment size:employer costs per hours worked for employee compensation and costs as a percentage of total compensation,2006-2017 -- Continued
100-499 workers
Compensationcomponent
Cost per hour worked Percent of total compensation
Mar. June Sep. Dec. Mar. June Sep. Dec.
Supplemental pay 2016 ............................................................... 0.54 0.55 0.54 0.54 1.9 1.9 1.9 1.9 2017 ............................................................... .54 – – – 1.8 – – –
Insurance 2006 ............................................................... – – – 1.86 – – – 7.3 2007 ............................................................... 1.87 1.84 1.85 1.86 7.5 7.3 7.8 7.7 2008 ............................................................... 1.90 1.91 1.93 2.01 7.8 7.8 7.9 7.6 2009 ............................................................... 2.03 2.09 2.09 2.05 7.7 7.8 7.8 8.2 2010 ............................................................... 2.16 2.19 2.19 2.05 8.1 8.1 8.1 8.1
2011 ............................................................... 2.23 2.20 2.15 2.10 8.1 8.0 8.1 7.9 2012 ............................................................... 2.10 2.16 2.17 2.08 8.1 8.0 8.1 8.5 2013 ............................................................... 2.22 2.22 2.21 2.08 9.0 8.7 8.7 8.5 2014 ............................................................... 2.07 2.11 2.17 2.34 8.5 8.5 8.6 8.8 2015 ............................................................... 2.48 2.48 2.48 2.62 9.2 9.2 9.1 9.4 2016 ............................................................... 2.65 2.69 2.66 2.66 9.4 9.4 9.3 9.2 2017 ............................................................... 2.66 – – – 9.1 – – –
Retirement and savings 2006 ............................................................... – – – .49 – – – 1.9 2007 ............................................................... .47 .46 .47 .46 1.9 1.8 2.0 1.9 2008 ............................................................... .47 .49 .52 .65 1.9 2.0 2.1 2.5 2009 ............................................................... .65 .64 .64 .53 2.5 2.4 2.4 2.1 2010 ............................................................... .59 .64 .60 .53 2.2 2.4 2.2 2.1
2011 ............................................................... .71 .70 .62 .62 2.6 2.6 2.3 2.3 2012 ............................................................... .59 .63 .62 .56 2.3 2.3 2.3 2.3 2013 ............................................................... .59 .61 .57 .51 2.4 2.4 2.2 2.1 2014 ............................................................... .48 .51 .52 .70 2.0 2.0 2.1 2.7 2015 ............................................................... .73 .70 .71 .80 2.7 2.6 2.6 2.9 2016 ............................................................... .80 .83 .83 .85 2.8 2.9 2.9 2.9 2017 ............................................................... .86 – – – 2.9 – – –
Legally required benefits 2006 ............................................................... – – – 2.10 – – – 8.2 2007 ............................................................... 2.03 2.04 2.04 2.05 8.1 8.1 8.6 8.6 2008 ............................................................... 2.09 2.09 2.10 2.18 8.6 8.6 8.5 8.2 2009 ............................................................... 2.16 2.19 2.19 2.11 8.2 8.2 8.2 8.4 2010 ............................................................... 2.14 2.16 2.18 2.13 8.0 8.0 8.1 8.4
2011 ............................................................... 2.21 2.21 2.19 2.18 8.0 8.1 8.2 8.2 2012 ............................................................... 2.15 2.18 2.17 2.08 8.3 8.1 8.1 8.5 2013 ............................................................... 2.08 2.13 2.14 2.05 8.4 8.4 8.4 8.4 2014 ............................................................... 2.05 2.08 2.10 2.19 8.4 8.4 8.4 8.3 2015 ............................................................... 2.17 2.17 2.18 2.19 8.0 8.0 8.0 7.8 2016 ............................................................... 2.20 2.21 2.21 2.22 7.8 7.7 7.7 7.7 2017 ............................................................... 2.27 – – – 7.7 – – –
Note: The sum of individual items may not equal totals due to rounding. Dashes indicate data are not available.
-332-

Supplemental table 29. Private health care and social assistance services industry workers, by establishment size:employer costs per hours worked for employee compensation and costs as a percentage of total compensation,2006-2017 -- Continued
500 workers or more
Compensationcomponent
Cost per hour worked Percent of total compensation
Mar. June Sep. Dec. Mar. June Sep. Dec.
Total compensation 2006 ............................................................... – – – $31.99 – – – 100.0 2007 ............................................................... 32.45 32.57 32.45 32.78 100.0 100.0 100.0 100.0 2008 ............................................................... 33.16 33.39 34.04 34.31 100.0 100.0 100.0 100.0 2009 ............................................................... 34.91 35.11 35.06 35.38 100.0 100.0 100.0 100.0 2010 ............................................................... 35.62 35.82 36.07 35.79 100.0 100.0 100.0 100.0
2011 ............................................................... 35.86 36.28 36.33 37.82 100.0 100.0 100.0 100.0 2012 ............................................................... 38.22 38.40 38.34 38.17 100.0 100.0 100.0 100.0 2013 ............................................................... 38.43 38.66 38.66 38.03 100.0 100.0 100.0 100.0 2014 ............................................................... 38.03 38.52 38.59 41.21 100.0 100.0 100.0 100.0 2015 ............................................................... 41.19 41.50 41.70 41.85 100.0 100.0 100.0 100.0 2016 ............................................................... 42.57 42.63 42.54 43.22 100.0 100.0 100.0 100.0 2017 ............................................................... 43.14 – – – 100.0 – – –
Wages and salaries 2006 ............................................................... – – – 21.71 – – – 67.9 2007 ............................................................... 22.03 22.08 22.14 22.21 67.9 67.8 68.2 67.7 2008 ............................................................... 22.46 22.65 23.15 23.21 67.7 67.8 68.0 67.7 2009 ............................................................... 23.55 23.68 23.63 23.86 67.5 67.4 67.4 67.5 2010 ............................................................... 23.97 24.18 24.34 24.17 67.3 67.5 67.5 67.5
2011 ............................................................... 24.20 24.49 24.55 25.52 67.5 67.5 67.6 67.5 2012 ............................................................... 25.73 25.85 25.81 25.78 67.3 67.3 67.3 67.5 2013 ............................................................... 25.93 26.09 26.10 25.44 67.5 67.5 67.5 66.9 2014 ............................................................... 25.43 25.73 25.81 27.25 66.9 66.8 66.9 66.1 2015 ............................................................... 27.24 27.39 27.59 27.51 66.1 66.0 66.2 65.7 2016 ............................................................... 28.04 28.12 28.08 28.55 65.9 66.0 66.0 66.0 2017 ............................................................... 28.43 – – – 65.9 – – –
Total benefits 2006 ............................................................... – – – 10.27 – – – 32.1 2007 ............................................................... 10.42 10.49 10.32 10.57 32.1 32.2 31.8 32.3 2008 ............................................................... 10.71 10.74 10.89 11.09 32.3 32.2 32.0 32.3 2009 ............................................................... 11.36 11.43 11.43 11.51 32.5 32.6 32.6 32.5 2010 ............................................................... 11.65 11.65 11.73 11.62 32.7 32.5 32.5 32.5
2011 ............................................................... 11.66 11.79 11.78 12.30 32.5 32.5 32.4 32.5 2012 ............................................................... 12.49 12.56 12.53 12.39 32.7 32.7 32.7 32.5 2013 ............................................................... 12.50 12.56 12.56 12.59 32.5 32.5 32.5 33.1 2014 ............................................................... 12.59 12.79 12.78 13.97 33.1 33.2 33.1 33.9 2015 ............................................................... 13.95 14.11 14.11 14.34 33.9 34.0 33.8 34.3 2016 ............................................................... 14.53 14.51 14.46 14.68 34.1 34.0 34.0 34.0 2017 ............................................................... 14.72 – – – 34.1 – – –
Paid leave 2006 ............................................................... – – – 2.87 – – – 9.0 2007 ............................................................... 2.91 2.91 2.86 2.88 9.0 8.9 8.8 8.8 2008 ............................................................... 2.86 2.88 2.95 3.01 8.6 8.6 8.7 8.8 2009 ............................................................... 3.06 3.08 3.09 3.07 8.8 8.8 8.8 8.7 2010 ............................................................... 3.07 3.07 3.09 3.08 8.6 8.6 8.6 8.6
2011 ............................................................... 3.08 3.11 3.11 3.34 8.6 8.6 8.5 8.8 2012 ............................................................... 3.35 3.38 3.35 3.29 8.8 8.8 8.7 8.6 2013 ............................................................... 3.34 3.35 3.34 3.33 8.7 8.7 8.6 8.8 2014 ............................................................... 3.33 3.38 3.38 3.71 8.7 8.8 8.8 9.0 2015 ............................................................... 3.69 3.69 3.71 3.83 8.9 8.9 8.9 9.2 2016 ............................................................... 3.87 3.89 3.86 3.93 9.1 9.1 9.1 9.1 2017 ............................................................... 3.91 – – – 9.1 – – –
Supplemental pay 2006 ............................................................... – – – .97 – – – 3.0 2007 ............................................................... .97 .98 .95 .98 3.0 3.0 2.9 3.0 2008 ............................................................... 1.00 1.00 1.01 1.07 3.0 3.0 3.0 3.1 2009 ............................................................... 1.08 1.08 1.09 1.11 3.1 3.1 3.1 3.1 2010 ............................................................... 1.11 1.07 1.07 1.09 3.1 3.0 3.0 3.1
2011 ............................................................... 1.08 1.09 1.10 1.16 3.0 3.0 3.0 3.1 2012 ............................................................... 1.15 1.14 1.14 1.15 3.0 3.0 3.0 3.0 2013 ............................................................... 1.15 1.15 1.14 1.17 3.0 3.0 2.9 3.1 2014 ............................................................... 1.18 1.21 1.21 1.41 3.1 3.1 3.1 3.4 2015 ............................................................... 1.37 1.41 1.41 1.42 3.3 3.4 3.4 3.4
See footnotes at end of table.
-333-
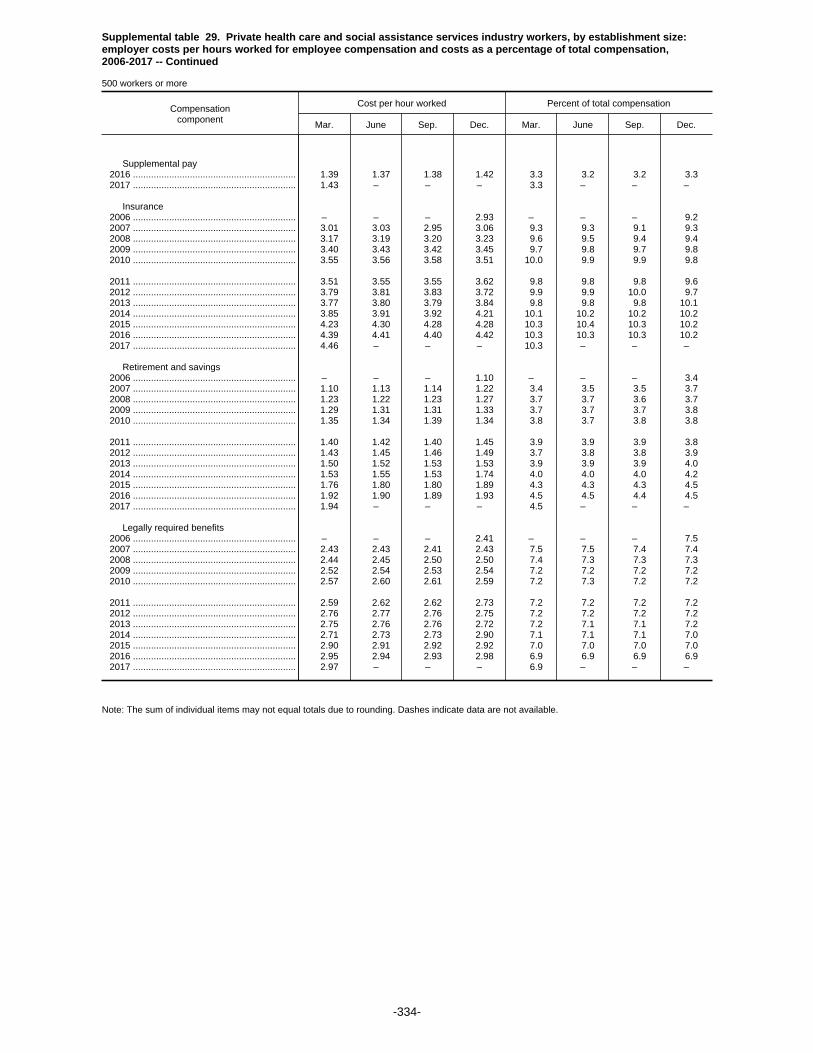
Supplemental table 29. Private health care and social assistance services industry workers, by establishment size:employer costs per hours worked for employee compensation and costs as a percentage of total compensation,2006-2017 -- Continued
500 workers or more
Compensationcomponent
Cost per hour worked Percent of total compensation
Mar. June Sep. Dec. Mar. June Sep. Dec.
Supplemental pay 2016 ............................................................... 1.39 1.37 1.38 1.42 3.3 3.2 3.2 3.3 2017 ............................................................... 1.43 – – – 3.3 – – –
Insurance 2006 ............................................................... – – – 2.93 – – – 9.2 2007 ............................................................... 3.01 3.03 2.95 3.06 9.3 9.3 9.1 9.3 2008 ............................................................... 3.17 3.19 3.20 3.23 9.6 9.5 9.4 9.4 2009 ............................................................... 3.40 3.43 3.42 3.45 9.7 9.8 9.7 9.8 2010 ............................................................... 3.55 3.56 3.58 3.51 10.0 9.9 9.9 9.8
2011 ............................................................... 3.51 3.55 3.55 3.62 9.8 9.8 9.8 9.6 2012 ............................................................... 3.79 3.81 3.83 3.72 9.9 9.9 10.0 9.7 2013 ............................................................... 3.77 3.80 3.79 3.84 9.8 9.8 9.8 10.1 2014 ............................................................... 3.85 3.91 3.92 4.21 10.1 10.2 10.2 10.2 2015 ............................................................... 4.23 4.30 4.28 4.28 10.3 10.4 10.3 10.2 2016 ............................................................... 4.39 4.41 4.40 4.42 10.3 10.3 10.3 10.2 2017 ............................................................... 4.46 – – – 10.3 – – –
Retirement and savings 2006 ............................................................... – – – 1.10 – – – 3.4 2007 ............................................................... 1.10 1.13 1.14 1.22 3.4 3.5 3.5 3.7 2008 ............................................................... 1.23 1.22 1.23 1.27 3.7 3.7 3.6 3.7 2009 ............................................................... 1.29 1.31 1.31 1.33 3.7 3.7 3.7 3.8 2010 ............................................................... 1.35 1.34 1.39 1.34 3.8 3.7 3.8 3.8
2011 ............................................................... 1.40 1.42 1.40 1.45 3.9 3.9 3.9 3.8 2012 ............................................................... 1.43 1.45 1.46 1.49 3.7 3.8 3.8 3.9 2013 ............................................................... 1.50 1.52 1.53 1.53 3.9 3.9 3.9 4.0 2014 ............................................................... 1.53 1.55 1.53 1.74 4.0 4.0 4.0 4.2 2015 ............................................................... 1.76 1.80 1.80 1.89 4.3 4.3 4.3 4.5 2016 ............................................................... 1.92 1.90 1.89 1.93 4.5 4.5 4.4 4.5 2017 ............................................................... 1.94 – – – 4.5 – – –
Legally required benefits 2006 ............................................................... – – – 2.41 – – – 7.5 2007 ............................................................... 2.43 2.43 2.41 2.43 7.5 7.5 7.4 7.4 2008 ............................................................... 2.44 2.45 2.50 2.50 7.4 7.3 7.3 7.3 2009 ............................................................... 2.52 2.54 2.53 2.54 7.2 7.2 7.2 7.2 2010 ............................................................... 2.57 2.60 2.61 2.59 7.2 7.3 7.2 7.2
2011 ............................................................... 2.59 2.62 2.62 2.73 7.2 7.2 7.2 7.2 2012 ............................................................... 2.76 2.77 2.76 2.75 7.2 7.2 7.2 7.2 2013 ............................................................... 2.75 2.76 2.76 2.72 7.2 7.1 7.1 7.2 2014 ............................................................... 2.71 2.73 2.73 2.90 7.1 7.1 7.1 7.0 2015 ............................................................... 2.90 2.91 2.92 2.92 7.0 7.0 7.0 7.0 2016 ............................................................... 2.95 2.94 2.93 2.98 6.9 6.9 6.9 6.9 2017 ............................................................... 2.97 – – – 6.9 – – –
Note: The sum of individual items may not equal totals due to rounding. Dashes indicate data are not available.
-334-

Supplemental table 30. Private health care and social assistance services industry workers, by bargaining status:employer costs per hours worked for employee compensation and costs as a percentage of total compensation,2006-2017
Union workers
Compensationcomponent
Cost per hour worked Percent of total compensation
Mar. June Sep. Dec. Mar. June Sep. Dec.
Total compensation 2006 ............................................................... – – – $31.19 – – – 100.0 2007 ............................................................... 31.50 31.46 31.56 32.12 100.0 100.0 100.0 100.0 2008 ............................................................... 32.80 33.11 33.51 33.31 100.0 100.0 100.0 100.0 2009 ............................................................... 34.28 34.36 34.74 33.85 100.0 100.0 100.0 100.0 2010 ............................................................... 34.05 34.05 34.45 34.15 100.0 100.0 100.0 100.0
2011 ............................................................... 35.00 35.08 35.24 37.27 100.0 100.0 100.0 100.0 2012 ............................................................... 37.48 37.58 37.94 40.09 100.0 100.0 100.0 100.0 2013 ............................................................... 40.62 41.03 40.91 41.56 100.0 100.0 100.0 100.0 2014 ............................................................... 55.52 55.22 49.75 61.76 100.0 100.0 100.0 100.0 2015 ............................................................... 60.01 59.98 56.67 47.28 100.0 100.0 100.0 100.0 2016 ............................................................... 47.69 61.95 47.53 63.81 100.0 100.0 100.0 100.0 2017 ............................................................... 63.66 – – – 100.0 – – –
Wages and salaries 2006 ............................................................... – – – 20.20 – – – 64.8 2007 ............................................................... 20.42 20.35 20.52 20.64 64.8 64.7 65.0 64.3 2008 ............................................................... 21.09 21.29 21.50 21.39 64.3 64.3 64.2 64.2 2009 ............................................................... 21.80 21.83 21.94 21.32 63.6 63.6 63.1 63.0 2010 ............................................................... 21.47 21.58 21.81 21.52 63.0 63.4 63.3 63.0
2011 ............................................................... 21.98 22.06 22.18 23.78 62.8 62.9 63.0 63.8 2012 ............................................................... 23.88 23.94 23.90 25.25 63.7 63.7 63.0 63.0 2013 ............................................................... 25.53 25.76 25.72 26.05 62.9 62.8 62.9 62.7 2014 ............................................................... 35.05 34.79 31.24 38.46 63.1 63.0 62.8 62.3 2015 ............................................................... 37.37 37.46 35.04 28.87 62.3 62.4 61.8 61.1 2016 ............................................................... 29.13 38.29 29.10 39.36 61.1 61.8 61.2 61.7 2017 ............................................................... 39.14 – – – 61.5 – – –
Total benefits 2006 ............................................................... – – – 10.99 – – – 35.2 2007 ............................................................... 11.09 11.11 11.04 11.48 35.2 35.3 35.0 35.7 2008 ............................................................... 11.71 11.81 12.01 11.92 35.7 35.7 35.8 35.8 2009 ............................................................... 12.47 12.52 12.80 12.53 36.4 36.4 36.9 37.0 2010 ............................................................... 12.58 12.47 12.64 12.62 37.0 36.6 36.7 37.0
2011 ............................................................... 13.02 13.01 13.06 13.49 37.2 37.1 37.0 36.2 2012 ............................................................... 13.60 13.64 14.03 14.84 36.3 36.3 37.0 37.0 2013 ............................................................... 15.09 15.27 15.19 15.51 37.1 37.2 37.1 37.3 2014 ............................................................... 20.47 20.43 18.50 23.30 36.9 37.0 37.2 37.7 2015 ............................................................... 22.63 22.52 21.63 18.41 37.7 37.6 38.2 38.9 2016 ............................................................... 18.56 23.66 18.43 24.45 38.9 38.2 38.8 38.3 2017 ............................................................... 24.52 – – – 38.5 – – –
Paid leave 2006 ............................................................... – – – 3.25 – – – 10.4 2007 ............................................................... 3.25 3.24 3.24 3.24 10.3 10.3 10.3 10.1 2008 ............................................................... 3.22 3.25 3.28 3.26 9.8 9.8 9.8 9.8 2009 ............................................................... 3.33 3.34 3.40 3.27 9.7 9.7 9.8 9.7 2010 ............................................................... 3.25 3.18 3.23 3.23 9.5 9.3 9.4 9.5
2011 ............................................................... 3.33 3.29 3.29 3.50 9.5 9.4 9.3 9.4 2012 ............................................................... 3.51 3.52 3.60 3.68 9.4 9.4 9.5 9.2 2013 ............................................................... 3.75 3.77 3.75 3.63 9.2 9.2 9.2 8.7 2014 ............................................................... 5.08 5.05 4.57 5.86 9.2 9.2 9.2 9.5 2015 ............................................................... 5.67 5.66 5.38 4.45 9.4 9.4 9.5 9.4 2016 ............................................................... 4.49 5.95 4.48 6.21 9.4 9.6 9.4 9.7 2017 ............................................................... 6.15 – – – 9.7 – – –
Supplemental pay 2006 ............................................................... – – – .88 – – – 2.8 2007 ............................................................... .89 .91 .89 .88 2.8 2.9 2.8 2.7 2008 ............................................................... .90 .92 .92 .89 2.7 2.8 2.8 2.7 2009 ............................................................... .94 .91 .95 .91 2.7 2.6 2.7 2.7 2010 ............................................................... .95 .92 .93 .94 2.8 2.7 2.7 2.8
2011 ............................................................... .97 .97 .98 .95 2.8 2.8 2.8 2.6 2012 ............................................................... .97 .96 .99 1.16 2.6 2.5 2.6 2.9 2013 ............................................................... 1.18 1.22 1.21 1.27 2.9 3.0 2.9 3.1 2014 ............................................................... 1.18 1.21 1.24 1.34 2.1 2.2 2.5 2.2 2015 ............................................................... 1.33 1.34 1.33 1.44 2.2 2.2 2.3 3.1
See footnotes at end of table.
-335-

Supplemental table 30. Private health care and social assistance services industry workers, by bargaining status:employer costs per hours worked for employee compensation and costs as a percentage of total compensation,2006-2017
Union workers
Compensationcomponent
Cost per hour worked Percent of total compensation
Mar. June Sep. Dec. Mar. June Sep. Dec.
Supplemental pay 2016 ............................................................... 1.50 1.37 1.50 1.41 3.1 2.2 3.1 2.2 2017 ............................................................... 1.42 – – – 2.2 – – –
Insurance 2006 ............................................................... – – – 3.24 – – – 10.4 2007 ............................................................... 3.32 3.32 3.18 3.42 10.6 10.5 10.1 10.6 2008 ............................................................... 3.58 3.63 3.66 3.68 10.9 11.0 10.9 11.0 2009 ............................................................... 4.01 4.05 4.15 4.20 11.7 11.8 12.0 12.4 2010 ............................................................... 4.23 4.24 4.27 4.25 12.4 12.4 12.4 12.4
2011 ............................................................... 4.39 4.40 4.42 4.50 12.5 12.5 12.5 12.1 2012 ............................................................... 4.58 4.58 4.87 4.96 12.2 12.2 12.8 12.4 2013 ............................................................... 5.05 5.09 5.02 5.19 12.4 12.4 12.3 12.5 2014 ............................................................... 5.66 5.72 5.52 6.63 10.2 10.4 11.1 10.7 2015 ............................................................... 6.56 6.58 6.49 6.42 10.9 11.0 11.5 13.6 2016 ............................................................... 6.44 6.92 6.37 6.92 13.5 11.2 13.4 10.9 2017 ............................................................... 7.05 – – – 11.1 – – –
Retirement and savings 2006 ............................................................... – – – 1.01 – – – 3.2 2007 ............................................................... 1.01 1.03 1.18 1.34 3.2 3.3 3.7 4.2 2008 ............................................................... 1.36 1.37 1.48 1.50 4.1 4.1 4.4 4.5 2009 ............................................................... 1.57 1.56 1.61 1.56 4.6 4.5 4.6 4.6 2010 ............................................................... 1.57 1.55 1.59 1.60 4.6 4.5 4.6 4.7
2011 ............................................................... 1.68 1.67 1.66 1.61 4.8 4.8 4.7 4.3 2012 ............................................................... 1.61 1.62 1.65 1.92 4.3 4.3 4.3 4.8 2013 ............................................................... 2.00 2.09 2.09 2.23 4.9 5.1 5.1 5.4 2014 ............................................................... 5.02 4.92 3.76 5.70 9.0 8.9 7.6 9.2 2015 ............................................................... 5.50 5.38 4.92 2.80 9.2 9.0 8.7 5.9 2016 ............................................................... 2.84 5.82 2.82 6.23 6.0 9.4 5.9 9.8 2017 ............................................................... 6.16 – – – 9.7 – – –
Legally required benefits 2006 ............................................................... – – – 2.61 – – – 8.4 2007 ............................................................... 2.61 2.61 2.55 2.60 8.3 8.3 8.1 8.1 2008 ............................................................... 2.64 2.65 2.67 2.60 8.1 8.0 8.0 7.8 2009 ............................................................... 2.63 2.66 2.69 2.59 7.7 7.8 7.8 7.6 2010 ............................................................... 2.57 2.59 2.61 2.61 7.6 7.6 7.6 7.6
2011 ............................................................... 2.66 2.67 2.71 2.93 7.6 7.6 7.7 7.9 2012 ............................................................... 2.95 2.97 2.93 3.11 7.9 7.9 7.7 7.7 2013 ............................................................... 3.12 3.11 3.12 3.18 7.7 7.6 7.6 7.7 2014 ............................................................... 3.52 3.51 3.40 3.77 6.3 6.4 6.8 6.1 2015 ............................................................... 3.57 3.56 3.51 3.30 6.0 5.9 6.2 7.0 2016 ............................................................... 3.30 3.60 3.27 3.67 6.9 5.8 6.9 5.8 2017 ............................................................... 3.74 – – – 5.9 – – –
Note: The sum of individual items may not equal totals due to rounding. Dashes indicate data are not available.
-336-
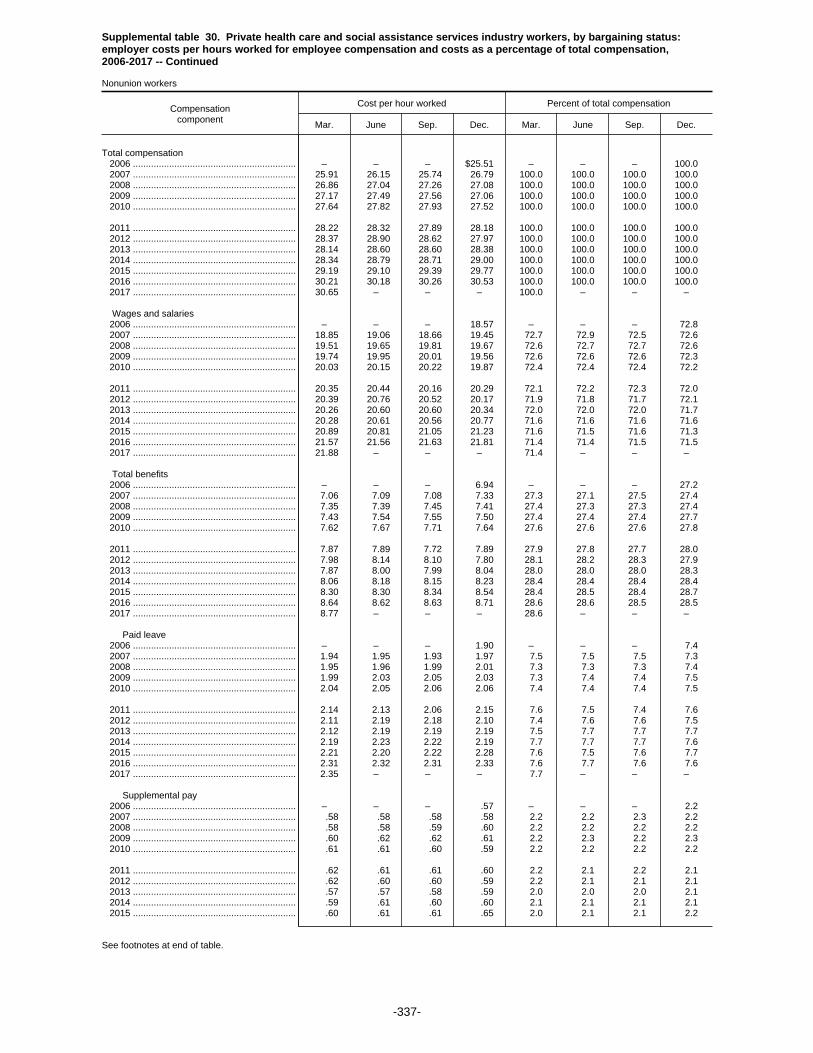
Supplemental table 30. Private health care and social assistance services industry workers, by bargaining status:employer costs per hours worked for employee compensation and costs as a percentage of total compensation,2006-2017 -- Continued
Nonunion workers
Compensationcomponent
Cost per hour worked Percent of total compensation
Mar. June Sep. Dec. Mar. June Sep. Dec.
Total compensation 2006 ............................................................... – – – $25.51 – – – 100.0 2007 ............................................................... 25.91 26.15 25.74 26.79 100.0 100.0 100.0 100.0 2008 ............................................................... 26.86 27.04 27.26 27.08 100.0 100.0 100.0 100.0 2009 ............................................................... 27.17 27.49 27.56 27.06 100.0 100.0 100.0 100.0 2010 ............................................................... 27.64 27.82 27.93 27.52 100.0 100.0 100.0 100.0
2011 ............................................................... 28.22 28.32 27.89 28.18 100.0 100.0 100.0 100.0 2012 ............................................................... 28.37 28.90 28.62 27.97 100.0 100.0 100.0 100.0 2013 ............................................................... 28.14 28.60 28.60 28.38 100.0 100.0 100.0 100.0 2014 ............................................................... 28.34 28.79 28.71 29.00 100.0 100.0 100.0 100.0 2015 ............................................................... 29.19 29.10 29.39 29.77 100.0 100.0 100.0 100.0 2016 ............................................................... 30.21 30.18 30.26 30.53 100.0 100.0 100.0 100.0 2017 ............................................................... 30.65 – – – 100.0 – – –
Wages and salaries 2006 ............................................................... – – – 18.57 – – – 72.8 2007 ............................................................... 18.85 19.06 18.66 19.45 72.7 72.9 72.5 72.6 2008 ............................................................... 19.51 19.65 19.81 19.67 72.6 72.7 72.7 72.6 2009 ............................................................... 19.74 19.95 20.01 19.56 72.6 72.6 72.6 72.3 2010 ............................................................... 20.03 20.15 20.22 19.87 72.4 72.4 72.4 72.2
2011 ............................................................... 20.35 20.44 20.16 20.29 72.1 72.2 72.3 72.0 2012 ............................................................... 20.39 20.76 20.52 20.17 71.9 71.8 71.7 72.1 2013 ............................................................... 20.26 20.60 20.60 20.34 72.0 72.0 72.0 71.7 2014 ............................................................... 20.28 20.61 20.56 20.77 71.6 71.6 71.6 71.6 2015 ............................................................... 20.89 20.81 21.05 21.23 71.6 71.5 71.6 71.3 2016 ............................................................... 21.57 21.56 21.63 21.81 71.4 71.4 71.5 71.5 2017 ............................................................... 21.88 – – – 71.4 – – –
Total benefits 2006 ............................................................... – – – 6.94 – – – 27.2 2007 ............................................................... 7.06 7.09 7.08 7.33 27.3 27.1 27.5 27.4 2008 ............................................................... 7.35 7.39 7.45 7.41 27.4 27.3 27.3 27.4 2009 ............................................................... 7.43 7.54 7.55 7.50 27.4 27.4 27.4 27.7 2010 ............................................................... 7.62 7.67 7.71 7.64 27.6 27.6 27.6 27.8
2011 ............................................................... 7.87 7.89 7.72 7.89 27.9 27.8 27.7 28.0 2012 ............................................................... 7.98 8.14 8.10 7.80 28.1 28.2 28.3 27.9 2013 ............................................................... 7.87 8.00 7.99 8.04 28.0 28.0 28.0 28.3 2014 ............................................................... 8.06 8.18 8.15 8.23 28.4 28.4 28.4 28.4 2015 ............................................................... 8.30 8.30 8.34 8.54 28.4 28.5 28.4 28.7 2016 ............................................................... 8.64 8.62 8.63 8.71 28.6 28.6 28.5 28.5 2017 ............................................................... 8.77 – – – 28.6 – – –
Paid leave 2006 ............................................................... – – – 1.90 – – – 7.4 2007 ............................................................... 1.94 1.95 1.93 1.97 7.5 7.5 7.5 7.3 2008 ............................................................... 1.95 1.96 1.99 2.01 7.3 7.3 7.3 7.4 2009 ............................................................... 1.99 2.03 2.05 2.03 7.3 7.4 7.4 7.5 2010 ............................................................... 2.04 2.05 2.06 2.06 7.4 7.4 7.4 7.5
2011 ............................................................... 2.14 2.13 2.06 2.15 7.6 7.5 7.4 7.6 2012 ............................................................... 2.11 2.19 2.18 2.10 7.4 7.6 7.6 7.5 2013 ............................................................... 2.12 2.19 2.19 2.19 7.5 7.7 7.7 7.7 2014 ............................................................... 2.19 2.23 2.22 2.19 7.7 7.7 7.7 7.6 2015 ............................................................... 2.21 2.20 2.22 2.28 7.6 7.5 7.6 7.7 2016 ............................................................... 2.31 2.32 2.31 2.33 7.6 7.7 7.6 7.6 2017 ............................................................... 2.35 – – – 7.7 – – –
Supplemental pay 2006 ............................................................... – – – .57 – – – 2.2 2007 ............................................................... .58 .58 .58 .58 2.2 2.2 2.3 2.2 2008 ............................................................... .58 .58 .59 .60 2.2 2.2 2.2 2.2 2009 ............................................................... .60 .62 .62 .61 2.2 2.3 2.2 2.3 2010 ............................................................... .61 .61 .60 .59 2.2 2.2 2.2 2.2
2011 ............................................................... .62 .61 .61 .60 2.2 2.1 2.2 2.1 2012 ............................................................... .62 .60 .60 .59 2.2 2.1 2.1 2.1 2013 ............................................................... .57 .57 .58 .59 2.0 2.0 2.0 2.1 2014 ............................................................... .59 .61 .60 .60 2.1 2.1 2.1 2.1 2015 ............................................................... .60 .61 .61 .65 2.0 2.1 2.1 2.2
See footnotes at end of table.
-337-
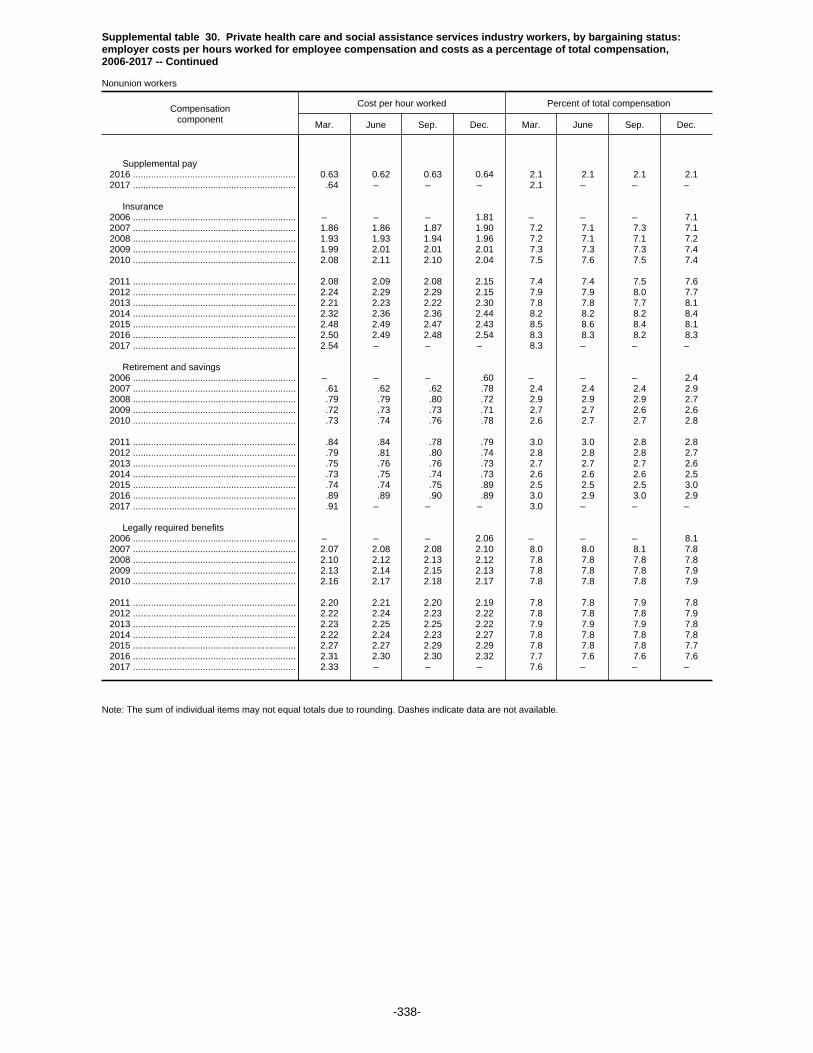
Supplemental table 30. Private health care and social assistance services industry workers, by bargaining status:employer costs per hours worked for employee compensation and costs as a percentage of total compensation,2006-2017 -- Continued
Nonunion workers
Compensationcomponent
Cost per hour worked Percent of total compensation
Mar. June Sep. Dec. Mar. June Sep. Dec.
Supplemental pay 2016 ............................................................... 0.63 0.62 0.63 0.64 2.1 2.1 2.1 2.1 2017 ............................................................... .64 – – – 2.1 – – –
Insurance 2006 ............................................................... – – – 1.81 – – – 7.1 2007 ............................................................... 1.86 1.86 1.87 1.90 7.2 7.1 7.3 7.1 2008 ............................................................... 1.93 1.93 1.94 1.96 7.2 7.1 7.1 7.2 2009 ............................................................... 1.99 2.01 2.01 2.01 7.3 7.3 7.3 7.4 2010 ............................................................... 2.08 2.11 2.10 2.04 7.5 7.6 7.5 7.4
2011 ............................................................... 2.08 2.09 2.08 2.15 7.4 7.4 7.5 7.6 2012 ............................................................... 2.24 2.29 2.29 2.15 7.9 7.9 8.0 7.7 2013 ............................................................... 2.21 2.23 2.22 2.30 7.8 7.8 7.7 8.1 2014 ............................................................... 2.32 2.36 2.36 2.44 8.2 8.2 8.2 8.4 2015 ............................................................... 2.48 2.49 2.47 2.43 8.5 8.6 8.4 8.1 2016 ............................................................... 2.50 2.49 2.48 2.54 8.3 8.3 8.2 8.3 2017 ............................................................... 2.54 – – – 8.3 – – –
Retirement and savings 2006 ............................................................... – – – .60 – – – 2.4 2007 ............................................................... .61 .62 .62 .78 2.4 2.4 2.4 2.9 2008 ............................................................... .79 .79 .80 .72 2.9 2.9 2.9 2.7 2009 ............................................................... .72 .73 .73 .71 2.7 2.7 2.6 2.6 2010 ............................................................... .73 .74 .76 .78 2.6 2.7 2.7 2.8
2011 ............................................................... .84 .84 .78 .79 3.0 3.0 2.8 2.8 2012 ............................................................... .79 .81 .80 .74 2.8 2.8 2.8 2.7 2013 ............................................................... .75 .76 .76 .73 2.7 2.7 2.7 2.6 2014 ............................................................... .73 .75 .74 .73 2.6 2.6 2.6 2.5 2015 ............................................................... .74 .74 .75 .89 2.5 2.5 2.5 3.0 2016 ............................................................... .89 .89 .90 .89 3.0 2.9 3.0 2.9 2017 ............................................................... .91 – – – 3.0 – – –
Legally required benefits 2006 ............................................................... – – – 2.06 – – – 8.1 2007 ............................................................... 2.07 2.08 2.08 2.10 8.0 8.0 8.1 7.8 2008 ............................................................... 2.10 2.12 2.13 2.12 7.8 7.8 7.8 7.8 2009 ............................................................... 2.13 2.14 2.15 2.13 7.8 7.8 7.8 7.9 2010 ............................................................... 2.16 2.17 2.18 2.17 7.8 7.8 7.8 7.9
2011 ............................................................... 2.20 2.21 2.20 2.19 7.8 7.8 7.9 7.8 2012 ............................................................... 2.22 2.24 2.23 2.22 7.8 7.8 7.8 7.9 2013 ............................................................... 2.23 2.25 2.25 2.22 7.9 7.9 7.9 7.8 2014 ............................................................... 2.22 2.24 2.23 2.27 7.8 7.8 7.8 7.8 2015 ............................................................... 2.27 2.27 2.29 2.29 7.8 7.8 7.8 7.7 2016 ............................................................... 2.31 2.30 2.30 2.32 7.7 7.6 7.6 7.6 2017 ............................................................... 2.33 – – – 7.6 – – –
Note: The sum of individual items may not equal totals due to rounding. Dashes indicate data are not available.
-338-

Supplemental table 31. Private leisure and hospitality industry workers, by occupational group: employer costs perhours worked for employee compensation and costs as a percentage of total compensation, 2006-2017
All workers
Compensationcomponent
Cost per hour worked Percent of total compensation
Mar. June Sep. Dec. Mar. June Sep. Dec.
Total compensation 2006 ............................................................... – – – $11.17 – – – 100.0 2007 ............................................................... 11.33 11.49 11.59 11.62 100.0 100.0 100.0 100.0 2008 ............................................................... 11.60 11.82 11.81 11.86 100.0 100.0 100.0 100.0 2009 ............................................................... 11.97 12.09 12.15 11.99 100.0 100.0 100.0 100.0 2010 ............................................................... 11.98 12.11 12.14 12.15 100.0 100.0 100.0 100.0
2011 ............................................................... 12.21 12.35 12.34 12.14 100.0 100.0 100.0 100.0 2012 ............................................................... 12.13 12.20 12.32 12.33 100.0 100.0 100.0 100.0 2013 ............................................................... 12.40 12.68 12.63 12.84 100.0 100.0 100.0 100.0 2014 ............................................................... 12.88 13.16 13.12 13.19 100.0 100.0 100.0 100.0 2015 ............................................................... 13.31 13.52 13.47 13.77 100.0 100.0 100.0 100.0 2016 ............................................................... 13.99 14.32 13.95 13.73 100.0 100.0 100.0 100.0 2017 ............................................................... 14.14 – – – 100.0 – – –
Wages and salaries 2006 ............................................................... – – – 8.71 – – – 78.0 2007 ............................................................... 8.88 8.98 9.08 9.12 78.3 78.1 78.4 78.4 2008 ............................................................... 9.10 9.23 9.25 9.36 78.5 78.1 78.3 78.9 2009 ............................................................... 9.44 9.53 9.59 9.49 78.8 78.8 79.0 79.2 2010 ............................................................... 9.48 9.56 9.58 9.64 79.1 79.0 78.9 79.3
2011 ............................................................... 9.66 9.74 9.75 9.65 79.1 78.9 79.0 79.5 2012 ............................................................... 9.62 9.71 9.82 9.74 79.3 79.6 79.7 79.0 2013 ............................................................... 9.79 10.00 9.97 10.08 79.0 78.9 78.9 78.5 2014 ............................................................... 10.12 10.32 10.32 10.33 78.6 78.4 78.6 78.3 2015 ............................................................... 10.41 10.56 10.53 10.72 78.2 78.1 78.2 77.9 2016 ............................................................... 10.91 11.16 10.99 10.86 78.0 77.9 78.8 79.1 2017 ............................................................... 11.16 – – – 78.9 – – –
Total benefits 2006 ............................................................... – – – 2.46 – – – 22.0 2007 ............................................................... 2.45 2.51 2.51 2.50 21.7 21.9 21.6 21.6 2008 ............................................................... 2.50 2.59 2.56 2.50 21.5 21.9 21.7 21.1 2009 ............................................................... 2.53 2.57 2.56 2.49 21.2 21.2 21.0 20.8 2010 ............................................................... 2.50 2.55 2.56 2.51 20.9 21.0 21.1 20.7
2011 ............................................................... 2.55 2.61 2.58 2.49 20.9 21.1 21.0 20.5 2012 ............................................................... 2.51 2.49 2.50 2.59 20.7 20.4 20.3 21.0 2013 ............................................................... 2.61 2.67 2.66 2.76 21.0 21.1 21.1 21.5 2014 ............................................................... 2.76 2.84 2.80 2.86 21.4 21.6 21.4 21.7 2015 ............................................................... 2.89 2.96 2.94 3.05 21.8 21.9 21.8 22.1 2016 ............................................................... 3.09 3.16 2.96 2.87 22.0 22.1 21.2 20.9 2017 ............................................................... 2.98 – – – 21.1 – – –
Paid leave 2006 ............................................................... – – – .39 – – – 3.5 2007 ............................................................... .39 .40 .40 .40 3.5 3.5 3.5 3.4 2008 ............................................................... .39 .40 .40 .38 3.3 3.4 3.4 3.2 2009 ............................................................... .39 .40 .40 .38 3.2 3.3 3.3 3.1 2010 ............................................................... .37 .38 .38 .40 3.1 3.2 3.1 3.3
2011 ............................................................... .40 .41 .41 .39 3.3 3.3 3.3 3.2 2012 ............................................................... .38 .37 .36 .39 3.2 3.0 3.0 3.1 2013 ............................................................... .39 .40 .40 .43 3.2 3.2 3.2 3.4 2014 ............................................................... .43 .46 .44 .41 3.4 3.5 3.4 3.1 2015 ............................................................... .42 .43 .42 .43 3.1 3.2 3.1 3.1 2016 ............................................................... .44 .47 .41 .38 3.1 3.3 2.9 2.8 2017 ............................................................... .41 – – – 2.9 – – –
Supplemental pay 2006 ............................................................... – – – .13 – – – 1.2 2007 ............................................................... .13 .13 .13 .13 1.2 1.2 1.1 1.1 2008 ............................................................... .13 .14 .13 .14 1.1 1.2 1.1 1.2 2009 ............................................................... .14 .14 .14 .12 1.1 1.2 1.1 1.0 2010 ............................................................... .12 .12 .12 .12 1.0 1.0 1.0 1.0
2011 ............................................................... .12 .13 .13 .12 1.0 1.0 1.0 1.0 2012 ............................................................... .13 .13 .12 .15 1.0 1.0 1.0 1.2 2013 ............................................................... .14 .15 .15 .15 1.2 1.2 1.2 1.2 2014 ............................................................... .15 .16 .15 .15 1.1 1.2 1.1 1.1 2015 ............................................................... .14 .14 .14 .15 1.1 1.1 1.0 1.1 2016 ............................................................... .15 .14 .13 .13 1.1 1.0 .9 .9
See footnotes at end of table.
-339-
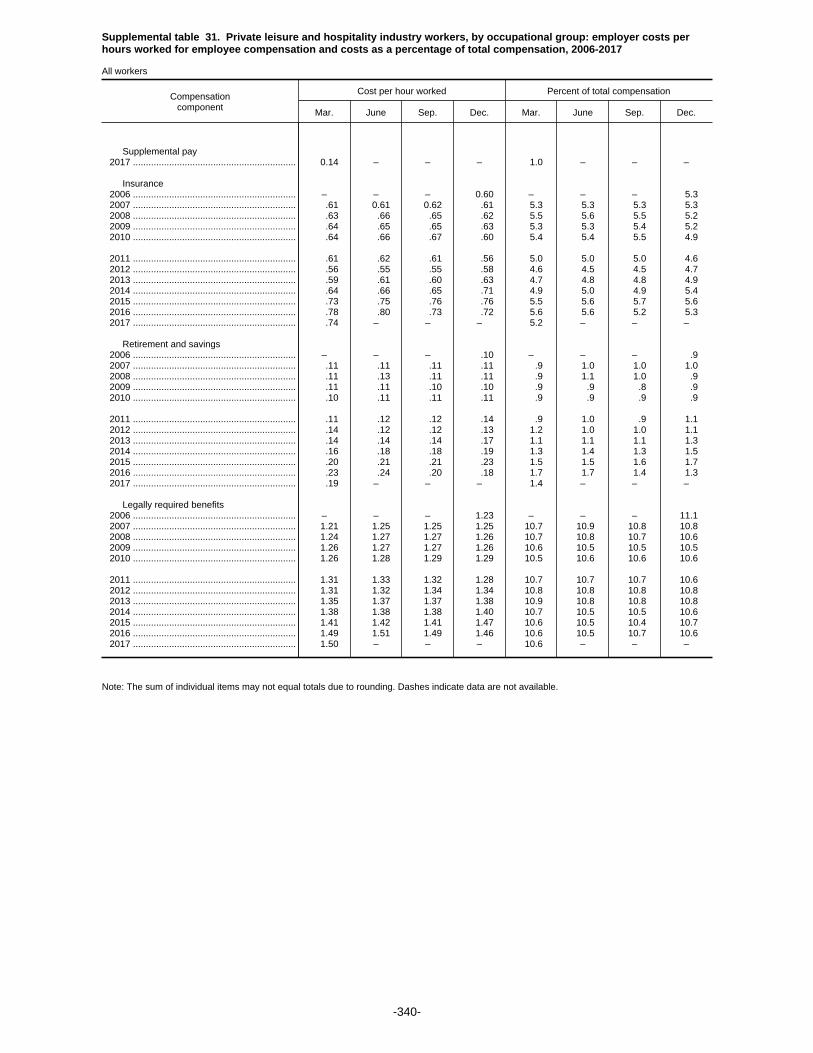
Supplemental table 31. Private leisure and hospitality industry workers, by occupational group: employer costs perhours worked for employee compensation and costs as a percentage of total compensation, 2006-2017
All workers
Compensationcomponent
Cost per hour worked Percent of total compensation
Mar. June Sep. Dec. Mar. June Sep. Dec.
Supplemental pay 2017 ............................................................... 0.14 – – – 1.0 – – –
Insurance 2006 ............................................................... – – – 0.60 – – – 5.3 2007 ............................................................... .61 0.61 0.62 .61 5.3 5.3 5.3 5.3 2008 ............................................................... .63 .66 .65 .62 5.5 5.6 5.5 5.2 2009 ............................................................... .64 .65 .65 .63 5.3 5.3 5.4 5.2 2010 ............................................................... .64 .66 .67 .60 5.4 5.4 5.5 4.9
2011 ............................................................... .61 .62 .61 .56 5.0 5.0 5.0 4.6 2012 ............................................................... .56 .55 .55 .58 4.6 4.5 4.5 4.7 2013 ............................................................... .59 .61 .60 .63 4.7 4.8 4.8 4.9 2014 ............................................................... .64 .66 .65 .71 4.9 5.0 4.9 5.4 2015 ............................................................... .73 .75 .76 .76 5.5 5.6 5.7 5.6 2016 ............................................................... .78 .80 .73 .72 5.6 5.6 5.2 5.3 2017 ............................................................... .74 – – – 5.2 – – –
Retirement and savings 2006 ............................................................... – – – .10 – – – .9 2007 ............................................................... .11 .11 .11 .11 .9 1.0 1.0 1.0 2008 ............................................................... .11 .13 .11 .11 .9 1.1 1.0 .9 2009 ............................................................... .11 .11 .10 .10 .9 .9 .8 .9 2010 ............................................................... .10 .11 .11 .11 .9 .9 .9 .9
2011 ............................................................... .11 .12 .12 .14 .9 1.0 .9 1.1 2012 ............................................................... .14 .12 .12 .13 1.2 1.0 1.0 1.1 2013 ............................................................... .14 .14 .14 .17 1.1 1.1 1.1 1.3 2014 ............................................................... .16 .18 .18 .19 1.3 1.4 1.3 1.5 2015 ............................................................... .20 .21 .21 .23 1.5 1.5 1.6 1.7 2016 ............................................................... .23 .24 .20 .18 1.7 1.7 1.4 1.3 2017 ............................................................... .19 – – – 1.4 – – –
Legally required benefits 2006 ............................................................... – – – 1.23 – – – 11.1 2007 ............................................................... 1.21 1.25 1.25 1.25 10.7 10.9 10.8 10.8 2008 ............................................................... 1.24 1.27 1.27 1.26 10.7 10.8 10.7 10.6 2009 ............................................................... 1.26 1.27 1.27 1.26 10.6 10.5 10.5 10.5 2010 ............................................................... 1.26 1.28 1.29 1.29 10.5 10.6 10.6 10.6
2011 ............................................................... 1.31 1.33 1.32 1.28 10.7 10.7 10.7 10.6 2012 ............................................................... 1.31 1.32 1.34 1.34 10.8 10.8 10.8 10.8 2013 ............................................................... 1.35 1.37 1.37 1.38 10.9 10.8 10.8 10.8 2014 ............................................................... 1.38 1.38 1.38 1.40 10.7 10.5 10.5 10.6 2015 ............................................................... 1.41 1.42 1.41 1.47 10.6 10.5 10.4 10.7 2016 ............................................................... 1.49 1.51 1.49 1.46 10.6 10.5 10.7 10.6 2017 ............................................................... 1.50 – – – 10.6 – – –
Note: The sum of individual items may not equal totals due to rounding. Dashes indicate data are not available.
-340-

Supplemental table 31. Private leisure and hospitality industry workers, by occupational group: employer costs perhours worked for employee compensation and costs as a percentage of total compensation, 2006-2017 -- Continued
Sales and office occupations
Compensationcomponent
Cost per hour worked Percent of total compensation
Mar. June Sep. Dec. Mar. June Sep. Dec.
Total compensation 2006 ............................................................... – – – $13.69 – – – 100.0 2007 ............................................................... 13.80 14.03 13.99 14.05 100.0 100.0 100.0 100.0 2008 ............................................................... 14.23 14.52 14.54 14.66 100.0 100.0 100.0 100.0 2009 ............................................................... 14.76 14.72 14.82 15.78 100.0 100.0 100.0 100.0 2010 ............................................................... 15.82 15.81 15.83 15.98 100.0 100.0 100.0 100.0
2011 ............................................................... 16.02 16.24 16.30 16.30 100.0 100.0 100.0 100.0 2012 ............................................................... 16.27 15.13 16.56 16.22 100.0 100.0 100.0 100.0 2013 ............................................................... 16.35 17.91 17.77 16.17 100.0 100.0 100.0 100.0 2014 ............................................................... 16.58 16.72 16.64 16.85 100.0 100.0 100.0 100.0 2015 ............................................................... 16.52 16.93 16.96 16.71 100.0 100.0 100.0 100.0 2016 ............................................................... 16.89 17.11 17.00 16.97 100.0 100.0 100.0 100.0 2017 ............................................................... 17.10 – – – 100.0 – – –
Wages and salaries 2006 ............................................................... – – – 10.46 – – – 76.4 2007 ............................................................... 10.61 10.80 10.80 10.89 76.9 76.9 77.2 77.5 2008 ............................................................... 11.01 11.11 11.20 11.36 77.4 76.5 77.1 77.5 2009 ............................................................... 11.45 11.42 11.54 12.16 77.5 77.6 77.9 77.0 2010 ............................................................... 12.19 12.16 12.19 12.42 77.0 76.9 77.0 77.7
2011 ............................................................... 12.39 12.50 12.58 12.59 77.4 77.0 77.2 77.2 2012 ............................................................... 12.55 11.81 13.17 12.62 77.2 78.1 79.5 77.8 2013 ............................................................... 12.71 14.13 14.05 12.53 77.8 78.9 79.1 77.5 2014 ............................................................... 12.73 12.82 12.79 12.96 76.8 76.7 76.8 76.9 2015 ............................................................... 12.64 12.93 12.93 12.74 76.5 76.4 76.3 76.2 2016 ............................................................... 12.87 13.01 13.06 13.06 76.2 76.1 76.8 77.0 2017 ............................................................... 13.16 – – – 76.9 – – –
Total benefits 2006 ............................................................... – – – 3.23 – – – 23.6 2007 ............................................................... 3.19 3.24 3.19 3.16 23.1 23.1 22.8 22.5 2008 ............................................................... 3.22 3.41 3.33 3.30 22.6 23.5 22.9 22.5 2009 ............................................................... 3.31 3.30 3.28 3.62 22.5 22.4 22.1 23.0 2010 ............................................................... 3.63 3.65 3.64 3.56 23.0 23.1 23.0 22.3
2011 ............................................................... 3.63 3.73 3.72 3.72 22.6 23.0 22.8 22.8 2012 ............................................................... 3.71 3.32 3.39 3.60 22.8 21.9 20.5 22.2 2013 ............................................................... 3.64 3.78 3.72 3.64 22.2 21.1 20.9 22.5 2014 ............................................................... 3.84 3.90 3.85 3.89 23.2 23.3 23.2 23.1 2015 ............................................................... 3.88 4.00 4.02 3.97 23.5 23.6 23.7 23.8 2016 ............................................................... 4.02 4.10 3.94 3.91 23.8 23.9 23.2 23.0 2017 ............................................................... 3.94 – – – 23.1 – – –
Paid leave 2006 ............................................................... – – – .62 – – – 4.5 2007 ............................................................... .62 .64 .63 .62 4.5 4.6 4.5 4.4 2008 ............................................................... .64 .65 .65 .64 4.5 4.5 4.5 4.4 2009 ............................................................... .65 .65 .66 .76 4.4 4.4 4.5 4.8 2010 ............................................................... .77 .75 .75 .78 4.8 4.8 4.7 4.9
2011 ............................................................... .79 .82 .83 .81 4.9 5.0 5.1 5.0 2012 ............................................................... .79 .62 .60 .72 4.9 4.1 3.6 4.4 2013 ............................................................... .73 .73 .71 .73 4.5 4.1 4.0 4.5 2014 ............................................................... .76 .77 .75 .71 4.6 4.6 4.5 4.2 2015 ............................................................... .69 .71 .71 .72 4.2 4.2 4.2 4.3 2016 ............................................................... .72 .73 .69 .70 4.2 4.3 4.1 4.1 2017 ............................................................... .71 – – – 4.1 – – –
Supplemental pay 2006 ............................................................... – – – .17 – – – 1.3 2007 ............................................................... .16 .16 .16 .16 1.2 1.1 1.2 1.1 2008 ............................................................... .16 .19 .19 .19 1.1 1.3 1.3 1.3 2009 ............................................................... .17 .17 .15 .20 1.2 1.2 1.0 1.3 2010 ............................................................... .19 .19 .19 .15 1.2 1.2 1.2 .9
2011 ............................................................... .15 .16 .16 .17 .9 1.0 1.0 1.1 2012 ............................................................... .18 .18 .18 .20 1.1 1.2 1.1 1.2 2013 ............................................................... .20 .20 .19 .16 1.2 1.1 1.1 1.0 2014 ............................................................... .19 .19 .16 .13 1.1 1.1 1.0 .8 2015 ............................................................... .13 .13 .13 .18 .8 .8 .8 1.1 2016 ............................................................... .18 .18 .16 .17 1.1 1.0 1.0 1.0
See footnotes at end of table.
-341-
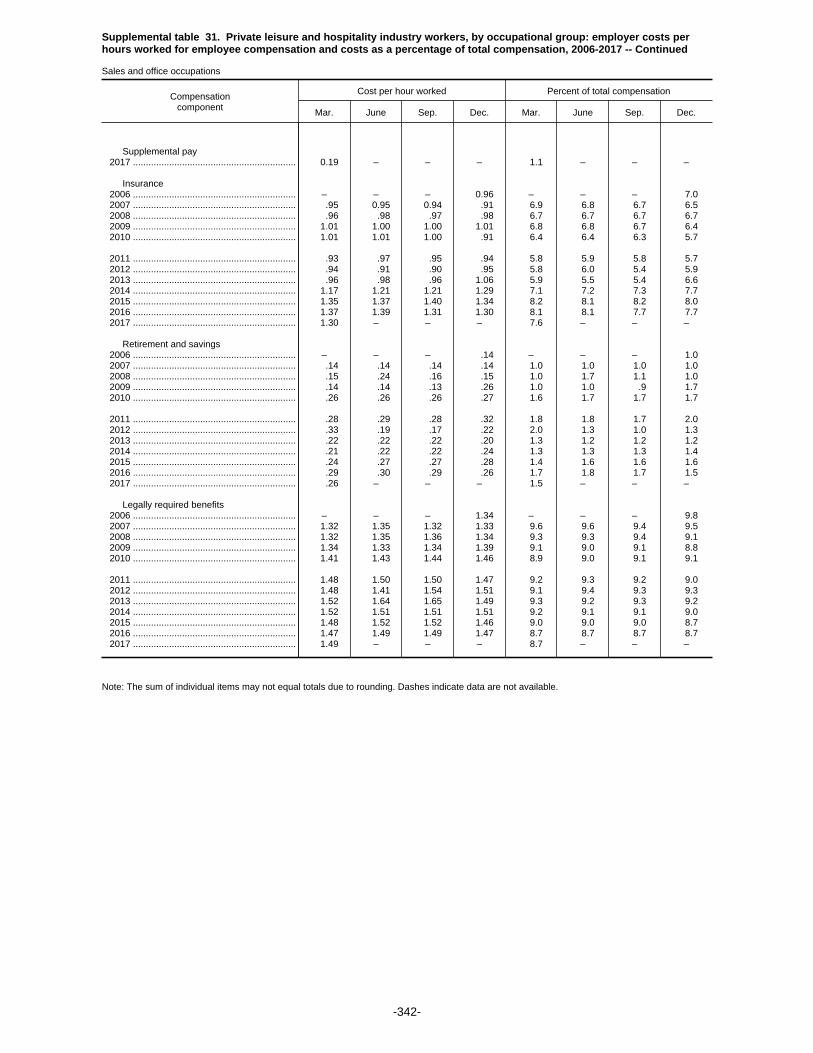
Supplemental table 31. Private leisure and hospitality industry workers, by occupational group: employer costs perhours worked for employee compensation and costs as a percentage of total compensation, 2006-2017 -- Continued
Sales and office occupations
Compensationcomponent
Cost per hour worked Percent of total compensation
Mar. June Sep. Dec. Mar. June Sep. Dec.
Supplemental pay 2017 ............................................................... 0.19 – – – 1.1 – – –
Insurance 2006 ............................................................... – – – 0.96 – – – 7.0 2007 ............................................................... .95 0.95 0.94 .91 6.9 6.8 6.7 6.5 2008 ............................................................... .96 .98 .97 .98 6.7 6.7 6.7 6.7 2009 ............................................................... 1.01 1.00 1.00 1.01 6.8 6.8 6.7 6.4 2010 ............................................................... 1.01 1.01 1.00 .91 6.4 6.4 6.3 5.7
2011 ............................................................... .93 .97 .95 .94 5.8 5.9 5.8 5.7 2012 ............................................................... .94 .91 .90 .95 5.8 6.0 5.4 5.9 2013 ............................................................... .96 .98 .96 1.06 5.9 5.5 5.4 6.6 2014 ............................................................... 1.17 1.21 1.21 1.29 7.1 7.2 7.3 7.7 2015 ............................................................... 1.35 1.37 1.40 1.34 8.2 8.1 8.2 8.0 2016 ............................................................... 1.37 1.39 1.31 1.30 8.1 8.1 7.7 7.7 2017 ............................................................... 1.30 – – – 7.6 – – –
Retirement and savings 2006 ............................................................... – – – .14 – – – 1.0 2007 ............................................................... .14 .14 .14 .14 1.0 1.0 1.0 1.0 2008 ............................................................... .15 .24 .16 .15 1.0 1.7 1.1 1.0 2009 ............................................................... .14 .14 .13 .26 1.0 1.0 .9 1.7 2010 ............................................................... .26 .26 .26 .27 1.6 1.7 1.7 1.7
2011 ............................................................... .28 .29 .28 .32 1.8 1.8 1.7 2.0 2012 ............................................................... .33 .19 .17 .22 2.0 1.3 1.0 1.3 2013 ............................................................... .22 .22 .22 .20 1.3 1.2 1.2 1.2 2014 ............................................................... .21 .22 .22 .24 1.3 1.3 1.3 1.4 2015 ............................................................... .24 .27 .27 .28 1.4 1.6 1.6 1.6 2016 ............................................................... .29 .30 .29 .26 1.7 1.8 1.7 1.5 2017 ............................................................... .26 – – – 1.5 – – –
Legally required benefits 2006 ............................................................... – – – 1.34 – – – 9.8 2007 ............................................................... 1.32 1.35 1.32 1.33 9.6 9.6 9.4 9.5 2008 ............................................................... 1.32 1.35 1.36 1.34 9.3 9.3 9.4 9.1 2009 ............................................................... 1.34 1.33 1.34 1.39 9.1 9.0 9.1 8.8 2010 ............................................................... 1.41 1.43 1.44 1.46 8.9 9.0 9.1 9.1
2011 ............................................................... 1.48 1.50 1.50 1.47 9.2 9.3 9.2 9.0 2012 ............................................................... 1.48 1.41 1.54 1.51 9.1 9.4 9.3 9.3 2013 ............................................................... 1.52 1.64 1.65 1.49 9.3 9.2 9.3 9.2 2014 ............................................................... 1.52 1.51 1.51 1.51 9.2 9.1 9.1 9.0 2015 ............................................................... 1.48 1.52 1.52 1.46 9.0 9.0 9.0 8.7 2016 ............................................................... 1.47 1.49 1.49 1.47 8.7 8.7 8.7 8.7 2017 ............................................................... 1.49 – – – 8.7 – – –
Note: The sum of individual items may not equal totals due to rounding. Dashes indicate data are not available.
-342-

Supplemental table 31. Private leisure and hospitality industry workers, by occupational group: employer costs perhours worked for employee compensation and costs as a percentage of total compensation, 2006-2017 -- Continued
Service occupations
Compensationcomponent
Cost per hour worked Percent of total compensation
Mar. June Sep. Dec. Mar. June Sep. Dec.
Total compensation 2006 ............................................................... – – – $9.86 – – – 100.0 2007 ............................................................... 10.06 10.17 10.29 10.34 100.0 100.0 100.0 100.0 2008 ............................................................... 10.35 10.53 10.57 10.51 100.0 100.0 100.0 100.0 2009 ............................................................... 10.58 10.68 10.76 10.63 100.0 100.0 100.0 100.0 2010 ............................................................... 10.70 10.80 10.87 10.73 100.0 100.0 100.0 100.0
2011 ............................................................... 10.81 10.86 10.88 10.65 100.0 100.0 100.0 100.0 2012 ............................................................... 10.68 10.71 10.77 10.84 100.0 100.0 100.0 100.0 2013 ............................................................... 10.89 10.99 10.97 11.22 100.0 100.0 100.0 100.0 2014 ............................................................... 11.21 11.35 11.42 11.60 100.0 100.0 100.0 100.0 2015 ............................................................... 11.74 11.84 11.86 12.24 100.0 100.0 100.0 100.0 2016 ............................................................... 12.45 12.60 12.50 12.39 100.0 100.0 100.0 100.0 2017 ............................................................... 12.65 – – – 100.0 – – –
Wages and salaries 2006 ............................................................... – – – 7.76 – – – 78.7 2007 ............................................................... 7.96 8.02 8.14 8.18 79.2 78.9 79.1 79.1 2008 ............................................................... 8.19 8.29 8.34 8.37 79.1 78.8 79.0 79.6 2009 ............................................................... 8.42 8.49 8.58 8.50 79.6 79.5 79.7 80.0 2010 ............................................................... 8.56 8.61 8.65 8.60 79.9 79.7 79.6 80.1
2011 ............................................................... 8.64 8.67 8.70 8.59 80.0 79.9 80.0 80.7 2012 ............................................................... 8.60 8.63 8.68 8.68 80.5 80.6 80.6 80.1 2013 ............................................................... 8.72 8.78 8.77 8.94 80.1 79.9 79.9 79.7 2014 ............................................................... 8.96 9.06 9.13 9.23 79.9 79.8 79.9 79.5 2015 ............................................................... 9.34 9.41 9.43 9.69 79.5 79.5 79.5 79.1 2016 ............................................................... 9.87 10.01 10.01 9.95 79.3 79.4 80.1 80.3 2017 ............................................................... 10.16 – – – 80.3 – – –
Total benefits 2006 ............................................................... – – – 2.10 – – – 21.3 2007 ............................................................... 2.10 2.15 2.15 2.16 20.8 21.1 20.9 20.9 2008 ............................................................... 2.16 2.23 2.22 2.14 20.9 21.2 21.0 20.4 2009 ............................................................... 2.16 2.19 2.19 2.13 20.4 20.5 20.3 20.0 2010 ............................................................... 2.15 2.19 2.21 2.13 20.1 20.3 20.4 19.9
2011 ............................................................... 2.16 2.19 2.17 2.05 20.0 20.1 20.0 19.3 2012 ............................................................... 2.08 2.08 2.09 2.16 19.5 19.4 19.4 19.9 2013 ............................................................... 2.17 2.21 2.20 2.28 19.9 20.1 20.1 20.3 2014 ............................................................... 2.26 2.29 2.29 2.37 20.1 20.2 20.1 20.5 2015 ............................................................... 2.41 2.43 2.43 2.55 20.5 20.5 20.5 20.9 2016 ............................................................... 2.58 2.60 2.48 2.44 20.7 20.6 19.9 19.7 2017 ............................................................... 2.49 – – – 19.7 – – –
Paid leave 2006 ............................................................... – – – .27 – – – 2.8 2007 ............................................................... .28 .28 .29 .29 2.8 2.8 2.8 2.8 2008 ............................................................... .28 .29 .29 .27 2.7 2.7 2.7 2.6 2009 ............................................................... .27 .28 .28 .26 2.5 2.6 2.6 2.4 2010 ............................................................... .26 .27 .27 .26 2.4 2.5 2.5 2.4
2011 ............................................................... .26 .27 .27 .24 2.4 2.5 2.5 2.3 2012 ............................................................... .24 .24 .23 .24 2.2 2.2 2.2 2.3 2013 ............................................................... .25 .25 .25 .27 2.3 2.3 2.3 2.4 2014 ............................................................... .26 .27 .27 .26 2.3 2.4 2.3 2.2 2015 ............................................................... .26 .27 .26 .27 2.2 2.2 2.2 2.2 2016 ............................................................... .28 .29 .26 .25 2.2 2.3 2.1 2.1 2017 ............................................................... .26 – – – 2.1 – – –
Supplemental pay 2006 ............................................................... – – – .11 – – – 1.1 2007 ............................................................... .11 .11 .11 .11 1.1 1.1 1.1 1.1 2008 ............................................................... .11 .11 .11 .11 1.1 1.1 1.0 1.0 2009 ............................................................... .11 .11 .11 .10 1.0 1.0 1.0 .9 2010 ............................................................... .10 .10 .10 .10 .9 .9 .9 1.0
2011 ............................................................... .11 .11 .11 .10 1.0 1.0 1.0 .9 2012 ............................................................... .10 .10 .10 .12 .9 .9 .9 1.1 2013 ............................................................... .11 .12 .12 .12 1.0 1.1 1.1 1.1 2014 ............................................................... .12 .12 .12 .11 1.1 1.1 1.1 1.0 2015 ............................................................... .11 .12 .12 .13 1.0 1.0 1.0 1.1 2016 ............................................................... .13 .12 .11 .11 1.0 .9 .9 .8
See footnotes at end of table.
-343-
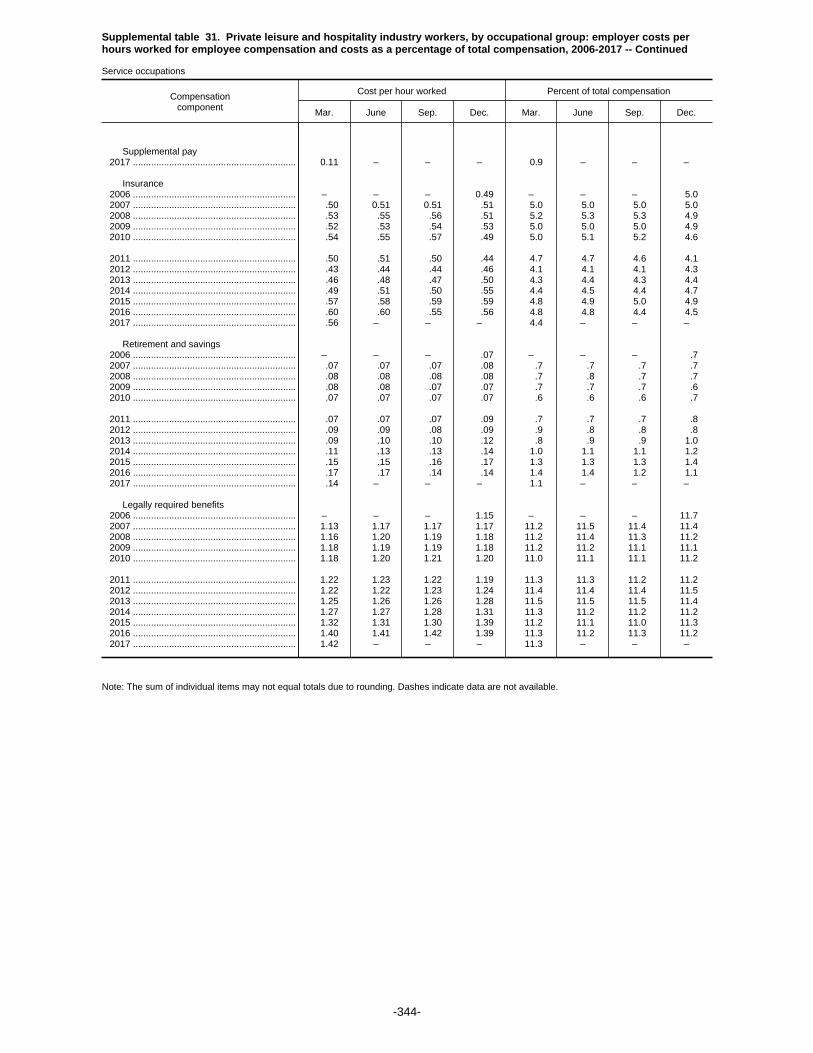
Supplemental table 31. Private leisure and hospitality industry workers, by occupational group: employer costs perhours worked for employee compensation and costs as a percentage of total compensation, 2006-2017 -- Continued
Service occupations
Compensationcomponent
Cost per hour worked Percent of total compensation
Mar. June Sep. Dec. Mar. June Sep. Dec.
Supplemental pay 2017 ............................................................... 0.11 – – – 0.9 – – –
Insurance 2006 ............................................................... – – – 0.49 – – – 5.0 2007 ............................................................... .50 0.51 0.51 .51 5.0 5.0 5.0 5.0 2008 ............................................................... .53 .55 .56 .51 5.2 5.3 5.3 4.9 2009 ............................................................... .52 .53 .54 .53 5.0 5.0 5.0 4.9 2010 ............................................................... .54 .55 .57 .49 5.0 5.1 5.2 4.6
2011 ............................................................... .50 .51 .50 .44 4.7 4.7 4.6 4.1 2012 ............................................................... .43 .44 .44 .46 4.1 4.1 4.1 4.3 2013 ............................................................... .46 .48 .47 .50 4.3 4.4 4.3 4.4 2014 ............................................................... .49 .51 .50 .55 4.4 4.5 4.4 4.7 2015 ............................................................... .57 .58 .59 .59 4.8 4.9 5.0 4.9 2016 ............................................................... .60 .60 .55 .56 4.8 4.8 4.4 4.5 2017 ............................................................... .56 – – – 4.4 – – –
Retirement and savings 2006 ............................................................... – – – .07 – – – .7 2007 ............................................................... .07 .07 .07 .08 .7 .7 .7 .7 2008 ............................................................... .08 .08 .08 .08 .7 .8 .7 .7 2009 ............................................................... .08 .08 .07 .07 .7 .7 .7 .6 2010 ............................................................... .07 .07 .07 .07 .6 .6 .6 .7
2011 ............................................................... .07 .07 .07 .09 .7 .7 .7 .8 2012 ............................................................... .09 .09 .08 .09 .9 .8 .8 .8 2013 ............................................................... .09 .10 .10 .12 .8 .9 .9 1.0 2014 ............................................................... .11 .13 .13 .14 1.0 1.1 1.1 1.2 2015 ............................................................... .15 .15 .16 .17 1.3 1.3 1.3 1.4 2016 ............................................................... .17 .17 .14 .14 1.4 1.4 1.2 1.1 2017 ............................................................... .14 – – – 1.1 – – –
Legally required benefits 2006 ............................................................... – – – 1.15 – – – 11.7 2007 ............................................................... 1.13 1.17 1.17 1.17 11.2 11.5 11.4 11.4 2008 ............................................................... 1.16 1.20 1.19 1.18 11.2 11.4 11.3 11.2 2009 ............................................................... 1.18 1.19 1.19 1.18 11.2 11.2 11.1 11.1 2010 ............................................................... 1.18 1.20 1.21 1.20 11.0 11.1 11.1 11.2
2011 ............................................................... 1.22 1.23 1.22 1.19 11.3 11.3 11.2 11.2 2012 ............................................................... 1.22 1.22 1.23 1.24 11.4 11.4 11.4 11.5 2013 ............................................................... 1.25 1.26 1.26 1.28 11.5 11.5 11.5 11.4 2014 ............................................................... 1.27 1.27 1.28 1.31 11.3 11.2 11.2 11.2 2015 ............................................................... 1.32 1.31 1.30 1.39 11.2 11.1 11.0 11.3 2016 ............................................................... 1.40 1.41 1.42 1.39 11.3 11.2 11.3 11.2 2017 ............................................................... 1.42 – – – 11.3 – – –
Note: The sum of individual items may not equal totals due to rounding. Dashes indicate data are not available.
-344-

Supplemental table 32. Private leisure and hospitality industry workers, by establishment size: employer costs perhours worked for employee compensation and costs as a percentage of total compensation, 2006-2017
1-99 workers
Compensationcomponent
Cost per hour worked Percent of total compensation
Mar. June Sep. Dec. Mar. June Sep. Dec.
Total compensation 2006 ............................................................... – – – $9.53 – – – 100.0 2007 ............................................................... 9.73 9.79 9.92 10.04 100.0 100.0 100.0 100.0 2008 ............................................................... 10.11 10.14 10.17 10.41 100.0 100.0 100.0 100.0 2009 ............................................................... 10.48 10.50 10.58 10.87 100.0 100.0 100.0 100.0 2010 ............................................................... 10.79 10.93 10.94 11.07 100.0 100.0 100.0 100.0
2011 ............................................................... 11.12 11.25 11.20 11.31 100.0 100.0 100.0 100.0 2012 ............................................................... 11.33 11.32 11.51 11.19 100.0 100.0 100.0 100.0 2013 ............................................................... 11.25 11.52 11.46 11.43 100.0 100.0 100.0 100.0 2014 ............................................................... 11.57 11.74 11.74 11.39 100.0 100.0 100.0 100.0 2015 ............................................................... 11.48 11.63 11.54 11.62 100.0 100.0 100.0 100.0 2016 ............................................................... 11.80 12.09 11.99 11.96 100.0 100.0 100.0 100.0 2017 ............................................................... 12.56 – – – 100.0 – – –
Wages and salaries 2006 ............................................................... – – – 7.82 – – – 82.0 2007 ............................................................... 8.01 8.07 8.18 8.27 82.3 82.4 82.4 82.4 2008 ............................................................... 8.31 8.33 8.36 8.60 82.3 82.2 82.2 82.6 2009 ............................................................... 8.67 8.68 8.75 8.93 82.7 82.7 82.7 82.2 2010 ............................................................... 8.90 8.99 9.01 9.15 82.4 82.3 82.4 82.6
2011 ............................................................... 9.16 9.24 9.23 9.28 82.4 82.1 82.3 82.0 2012 ............................................................... 9.26 9.31 9.50 9.20 81.8 82.3 82.5 82.2 2013 ............................................................... 9.23 9.46 9.42 9.37 82.1 82.1 82.2 82.0 2014 ............................................................... 9.49 9.63 9.64 9.34 82.0 82.0 82.1 82.0 2015 ............................................................... 9.41 9.54 9.48 9.52 82.0 82.0 82.1 81.9 2016 ............................................................... 9.68 9.94 9.90 9.85 82.0 82.3 82.6 82.3 2017 ............................................................... 10.29 – – – 82.0 – – –
Total benefits 2006 ............................................................... – – – 1.71 – – – 18.0 2007 ............................................................... 1.72 1.72 1.74 1.77 17.7 17.6 17.6 17.6 2008 ............................................................... 1.79 1.80 1.81 1.81 17.7 17.8 17.8 17.4 2009 ............................................................... 1.82 1.82 1.83 1.93 17.3 17.3 17.3 17.8 2010 ............................................................... 1.90 1.94 1.93 1.92 17.6 17.7 17.6 17.4
2011 ............................................................... 1.96 2.01 1.98 2.03 17.6 17.9 17.7 18.0 2012 ............................................................... 2.06 2.01 2.02 2.00 18.2 17.7 17.5 17.8 2013 ............................................................... 2.01 2.06 2.04 2.06 17.9 17.9 17.8 18.0 2014 ............................................................... 2.09 2.12 2.10 2.05 18.0 18.0 17.9 18.0 2015 ............................................................... 2.07 2.09 2.07 2.10 18.0 18.0 17.9 18.1 2016 ............................................................... 2.12 2.14 2.09 2.11 18.0 17.7 17.4 17.7 2017 ............................................................... 2.27 – – – 18.0 – – –
Paid leave 2006 ............................................................... – – – .18 – – – 1.9 2007 ............................................................... .18 .18 .18 .18 1.8 1.8 1.8 1.8 2008 ............................................................... .18 .18 .20 .20 1.8 1.8 1.9 1.9 2009 ............................................................... .20 .20 .20 .24 1.9 1.9 1.9 2.2 2010 ............................................................... .23 .24 .23 .26 2.1 2.2 2.1 2.4
2011 ............................................................... .26 .28 .27 .28 2.3 2.5 2.4 2.5 2012 ............................................................... .28 .26 .25 .25 2.5 2.3 2.2 2.2 2013 ............................................................... .26 .26 .25 .26 2.3 2.3 2.2 2.3 2014 ............................................................... .27 .28 .27 .22 2.3 2.4 2.3 2.0 2015 ............................................................... .23 .24 .23 .21 2.0 2.1 2.0 1.8 2016 ............................................................... .22 .24 .21 .21 1.8 2.0 1.7 1.8 2017 ............................................................... .25 – – – 2.0 – – –
Supplemental pay 2006 ............................................................... – – – .10 – – – 1.1 2007 ............................................................... .10 .10 .09 .10 1.0 1.0 .9 1.0 2008 ............................................................... .10 .09 .09 .10 1.0 .9 .9 1.0 2009 ............................................................... .10 .10 .09 .10 1.0 .9 .9 .9 2010 ............................................................... .09 .10 .09 .09 .9 .9 .8 .8
2011 ............................................................... .09 .09 .09 .09 .8 .8 .8 .8 2012 ............................................................... .09 .09 .09 .10 .8 .8 .8 .9 2013 ............................................................... .09 .10 .10 .10 .8 .8 .8 .8 2014 ............................................................... .10 .10 .10 .09 .9 .9 .9 .8 2015 ............................................................... .09 .09 .09 .09 .8 .8 .8 .8 2016 ............................................................... .09 .08 .08 .08 .8 .6 .6 .6
See footnotes at end of table.
-345-

Supplemental table 32. Private leisure and hospitality industry workers, by establishment size: employer costs perhours worked for employee compensation and costs as a percentage of total compensation, 2006-2017
1-99 workers
Compensationcomponent
Cost per hour worked Percent of total compensation
Mar. June Sep. Dec. Mar. June Sep. Dec.
Supplemental pay 2017 ............................................................... 0.09 – – – 0.7 – – –
Insurance 2006 ............................................................... – – – 0.26 – – – 2.7 2007 ............................................................... .26 0.27 0.27 .28 2.7 2.8 2.8 2.8 2008 ............................................................... .31 .32 .33 .32 3.1 3.2 3.2 3.0 2009 ............................................................... .32 .32 .33 .36 3.0 3.0 3.1 3.3 2010 ............................................................... .33 .35 .34 .31 3.1 3.2 3.1 2.8
2011 ............................................................... .32 .34 .32 .35 2.8 3.0 2.9 3.1 2012 ............................................................... .35 .33 .33 .33 3.1 2.9 2.9 3.0 2013 ............................................................... .34 .35 .34 .34 3.0 3.0 3.0 3.0 2014 ............................................................... .35 .36 .36 .37 3.0 3.1 3.0 3.3 2015 ............................................................... .38 .39 .39 .37 3.3 3.3 3.4 3.1 2016 ............................................................... .37 .37 .37 .40 3.1 3.1 3.0 3.3 2017 ............................................................... .43 – – – 3.4 – – –
Retirement and savings 2006 ............................................................... – – – .04 – – – .4 2007 ............................................................... .04 .04 .04 .05 .4 .4 .4 .5 2008 ............................................................... .05 .05 .05 .05 .5 .5 .5 .5 2009 ............................................................... .05 .05 .05 .07 .5 .5 .5 .6 2010 ............................................................... .06 .07 .07 .06 .6 .6 .6 .5
2011 ............................................................... .06 .07 .07 .08 .6 .6 .6 .7 2012 ............................................................... .08 .07 .06 .05 .7 .6 .6 .5 2013 ............................................................... .05 .06 .06 .07 .5 .5 .5 .6 2014 ............................................................... .07 .08 .07 .07 .6 .7 .6 .6 2015 ............................................................... .07 .08 .08 .08 .6 .7 .7 .7 2016 ............................................................... .08 .08 .07 .06 .7 .7 .6 .5 2017 ............................................................... .08 – – – .7 – – –
Legally required benefits 2006 ............................................................... – – – 1.14 – – – 11.9 2007 ............................................................... 1.14 1.14 1.16 1.17 11.7 11.6 11.7 11.6 2008 ............................................................... 1.15 1.15 1.14 1.14 11.4 11.4 11.2 11.0 2009 ............................................................... 1.15 1.15 1.16 1.18 11.0 11.0 10.9 10.8 2010 ............................................................... 1.18 1.19 1.20 1.21 10.9 10.9 10.9 10.9
2011 ............................................................... 1.23 1.24 1.23 1.24 11.1 11.0 11.0 10.9 2012 ............................................................... 1.25 1.27 1.28 1.27 11.1 11.2 11.2 11.3 2013 ............................................................... 1.27 1.29 1.29 1.29 11.3 11.2 11.3 11.3 2014 ............................................................... 1.29 1.29 1.29 1.29 11.2 11.0 11.0 11.3 2015 ............................................................... 1.29 1.30 1.28 1.35 11.3 11.1 11.1 11.6 2016 ............................................................... 1.36 1.37 1.37 1.36 11.5 11.4 11.5 11.4 2017 ............................................................... 1.42 – – – 11.3 – – –
Note: The sum of individual items may not equal totals due to rounding. Dashes indicate data are not available.
-346-
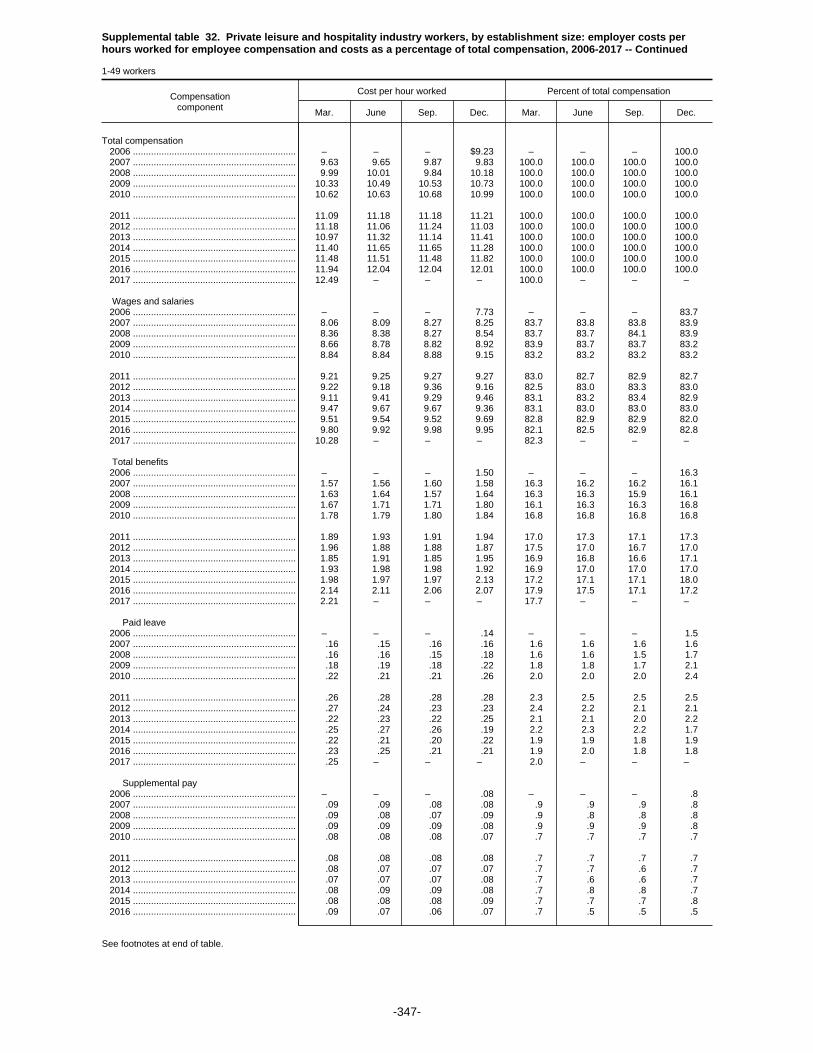
Supplemental table 32. Private leisure and hospitality industry workers, by establishment size: employer costs perhours worked for employee compensation and costs as a percentage of total compensation, 2006-2017 -- Continued
1-49 workers
Compensationcomponent
Cost per hour worked Percent of total compensation
Mar. June Sep. Dec. Mar. June Sep. Dec.
Total compensation 2006 ............................................................... – – – $9.23 – – – 100.0 2007 ............................................................... 9.63 9.65 9.87 9.83 100.0 100.0 100.0 100.0 2008 ............................................................... 9.99 10.01 9.84 10.18 100.0 100.0 100.0 100.0 2009 ............................................................... 10.33 10.49 10.53 10.73 100.0 100.0 100.0 100.0 2010 ............................................................... 10.62 10.63 10.68 10.99 100.0 100.0 100.0 100.0
2011 ............................................................... 11.09 11.18 11.18 11.21 100.0 100.0 100.0 100.0 2012 ............................................................... 11.18 11.06 11.24 11.03 100.0 100.0 100.0 100.0 2013 ............................................................... 10.97 11.32 11.14 11.41 100.0 100.0 100.0 100.0 2014 ............................................................... 11.40 11.65 11.65 11.28 100.0 100.0 100.0 100.0 2015 ............................................................... 11.48 11.51 11.48 11.82 100.0 100.0 100.0 100.0 2016 ............................................................... 11.94 12.04 12.04 12.01 100.0 100.0 100.0 100.0 2017 ............................................................... 12.49 – – – 100.0 – – –
Wages and salaries 2006 ............................................................... – – – 7.73 – – – 83.7 2007 ............................................................... 8.06 8.09 8.27 8.25 83.7 83.8 83.8 83.9 2008 ............................................................... 8.36 8.38 8.27 8.54 83.7 83.7 84.1 83.9 2009 ............................................................... 8.66 8.78 8.82 8.92 83.9 83.7 83.7 83.2 2010 ............................................................... 8.84 8.84 8.88 9.15 83.2 83.2 83.2 83.2
2011 ............................................................... 9.21 9.25 9.27 9.27 83.0 82.7 82.9 82.7 2012 ............................................................... 9.22 9.18 9.36 9.16 82.5 83.0 83.3 83.0 2013 ............................................................... 9.11 9.41 9.29 9.46 83.1 83.2 83.4 82.9 2014 ............................................................... 9.47 9.67 9.67 9.36 83.1 83.0 83.0 83.0 2015 ............................................................... 9.51 9.54 9.52 9.69 82.8 82.9 82.9 82.0 2016 ............................................................... 9.80 9.92 9.98 9.95 82.1 82.5 82.9 82.8 2017 ............................................................... 10.28 – – – 82.3 – – –
Total benefits 2006 ............................................................... – – – 1.50 – – – 16.3 2007 ............................................................... 1.57 1.56 1.60 1.58 16.3 16.2 16.2 16.1 2008 ............................................................... 1.63 1.64 1.57 1.64 16.3 16.3 15.9 16.1 2009 ............................................................... 1.67 1.71 1.71 1.80 16.1 16.3 16.3 16.8 2010 ............................................................... 1.78 1.79 1.80 1.84 16.8 16.8 16.8 16.8
2011 ............................................................... 1.89 1.93 1.91 1.94 17.0 17.3 17.1 17.3 2012 ............................................................... 1.96 1.88 1.88 1.87 17.5 17.0 16.7 17.0 2013 ............................................................... 1.85 1.91 1.85 1.95 16.9 16.8 16.6 17.1 2014 ............................................................... 1.93 1.98 1.98 1.92 16.9 17.0 17.0 17.0 2015 ............................................................... 1.98 1.97 1.97 2.13 17.2 17.1 17.1 18.0 2016 ............................................................... 2.14 2.11 2.06 2.07 17.9 17.5 17.1 17.2 2017 ............................................................... 2.21 – – – 17.7 – – –
Paid leave 2006 ............................................................... – – – .14 – – – 1.5 2007 ............................................................... .16 .15 .16 .16 1.6 1.6 1.6 1.6 2008 ............................................................... .16 .16 .15 .18 1.6 1.6 1.5 1.7 2009 ............................................................... .18 .19 .18 .22 1.8 1.8 1.7 2.1 2010 ............................................................... .22 .21 .21 .26 2.0 2.0 2.0 2.4
2011 ............................................................... .26 .28 .28 .28 2.3 2.5 2.5 2.5 2012 ............................................................... .27 .24 .23 .23 2.4 2.2 2.1 2.1 2013 ............................................................... .22 .23 .22 .25 2.1 2.1 2.0 2.2 2014 ............................................................... .25 .27 .26 .19 2.2 2.3 2.2 1.7 2015 ............................................................... .22 .21 .20 .22 1.9 1.9 1.8 1.9 2016 ............................................................... .23 .25 .21 .21 1.9 2.0 1.8 1.8 2017 ............................................................... .25 – – – 2.0 – – –
Supplemental pay 2006 ............................................................... – – – .08 – – – .8 2007 ............................................................... .09 .09 .08 .08 .9 .9 .9 .8 2008 ............................................................... .09 .08 .07 .09 .9 .8 .8 .8 2009 ............................................................... .09 .09 .09 .08 .9 .9 .9 .8 2010 ............................................................... .08 .08 .08 .07 .7 .7 .7 .7
2011 ............................................................... .08 .08 .08 .08 .7 .7 .7 .7 2012 ............................................................... .08 .07 .07 .07 .7 .7 .6 .7 2013 ............................................................... .07 .07 .07 .08 .7 .6 .6 .7 2014 ............................................................... .08 .09 .09 .08 .7 .8 .8 .7 2015 ............................................................... .08 .08 .08 .09 .7 .7 .7 .8 2016 ............................................................... .09 .07 .06 .07 .7 .5 .5 .5
See footnotes at end of table.
-347-

Supplemental table 32. Private leisure and hospitality industry workers, by establishment size: employer costs perhours worked for employee compensation and costs as a percentage of total compensation, 2006-2017 -- Continued
1-49 workers
Compensationcomponent
Cost per hour worked Percent of total compensation
Mar. June Sep. Dec. Mar. June Sep. Dec.
Supplemental pay 2017 ............................................................... 0.08 – – – 0.6 – – –
Insurance 2006 ............................................................... – – – 0.17 – – – 1.9 2007 ............................................................... .18 0.19 0.19 .19 1.8 1.9 1.9 1.9 2008 ............................................................... .22 .23 .21 .23 2.2 2.3 2.1 2.2 2009 ............................................................... .23 .25 .26 .29 2.2 2.3 2.4 2.7 2010 ............................................................... .28 .27 .27 .26 2.6 2.5 2.6 2.4
2011 ............................................................... .27 .29 .28 .29 2.4 2.6 2.5 2.6 2012 ............................................................... .29 .27 .26 .26 2.6 2.4 2.4 2.4 2013 ............................................................... .26 .27 .25 .27 2.3 2.4 2.2 2.3 2014 ............................................................... .24 .26 .27 .29 2.1 2.2 2.3 2.6 2015 ............................................................... .31 .31 .33 .36 2.7 2.7 2.8 3.0 2016 ............................................................... .36 .34 .33 .35 3.0 2.9 2.8 2.9 2017 ............................................................... .37 – – – 2.9 – – –
Retirement and savings 2006 ............................................................... – – – .03 – – – .3 2007 ............................................................... .04 .04 .04 .03 .4 .4 .4 .3 2008 ............................................................... .04 .05 .04 .04 .4 .5 .4 .4 2009 ............................................................... .04 .05 .04 .06 .4 .5 .4 .6 2010 ............................................................... .06 .06 .06 .06 .6 .6 .6 .6
2011 ............................................................... .07 .07 .06 .08 .6 .6 .6 .7 2012 ............................................................... .08 .06 .05 .04 .7 .5 .5 .4 2013 ............................................................... .04 .05 .04 .07 .4 .4 .4 .6 2014 ............................................................... .07 .08 .08 .07 .6 .7 .7 .6 2015 ............................................................... .07 .07 .07 .08 .6 .6 .6 .7 2016 ............................................................... .08 .08 .05 .05 .7 .6 .4 .4 2017 ............................................................... .08 – – – .6 – – –
Legally required benefits 2006 ............................................................... – – – 1.08 – – – 11.7 2007 ............................................................... 1.11 1.10 1.13 1.12 11.6 11.4 11.5 11.4 2008 ............................................................... 1.12 1.12 1.10 1.11 11.2 11.2 11.2 10.9 2009 ............................................................... 1.12 1.14 1.14 1.15 10.8 10.8 10.8 10.7 2010 ............................................................... 1.15 1.16 1.16 1.18 10.8 10.9 10.9 10.8
2011 ............................................................... 1.22 1.23 1.22 1.23 11.0 11.0 10.9 10.9 2012 ............................................................... 1.24 1.24 1.26 1.26 11.1 11.2 11.2 11.4 2013 ............................................................... 1.26 1.28 1.27 1.29 11.5 11.3 11.4 11.3 2014 ............................................................... 1.28 1.28 1.28 1.29 11.2 11.0 11.0 11.5 2015 ............................................................... 1.30 1.30 1.28 1.38 11.3 11.3 11.2 11.6 2016 ............................................................... 1.38 1.38 1.40 1.39 11.6 11.5 11.6 11.5 2017 ............................................................... 1.44 – – – 11.5 – – –
Note: The sum of individual items may not equal totals due to rounding. Dashes indicate data are not available.
-348-
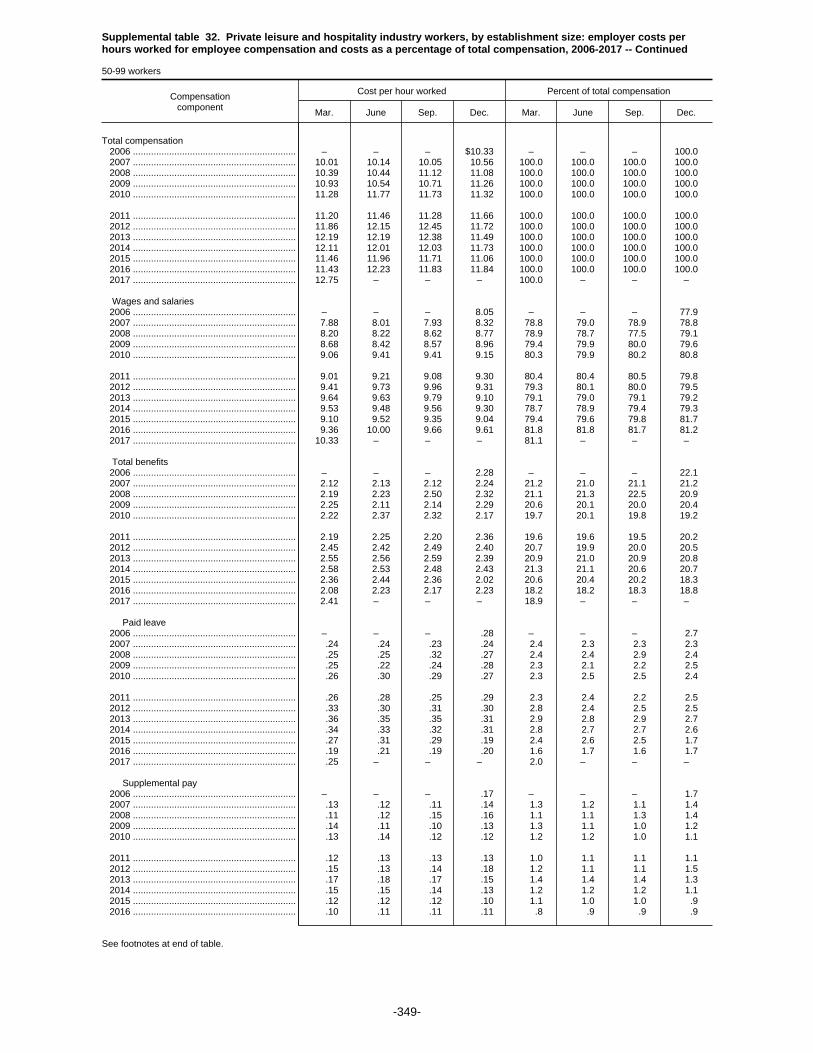
Supplemental table 32. Private leisure and hospitality industry workers, by establishment size: employer costs perhours worked for employee compensation and costs as a percentage of total compensation, 2006-2017 -- Continued
50-99 workers
Compensationcomponent
Cost per hour worked Percent of total compensation
Mar. June Sep. Dec. Mar. June Sep. Dec.
Total compensation 2006 ............................................................... – – – $10.33 – – – 100.0 2007 ............................................................... 10.01 10.14 10.05 10.56 100.0 100.0 100.0 100.0 2008 ............................................................... 10.39 10.44 11.12 11.08 100.0 100.0 100.0 100.0 2009 ............................................................... 10.93 10.54 10.71 11.26 100.0 100.0 100.0 100.0 2010 ............................................................... 11.28 11.77 11.73 11.32 100.0 100.0 100.0 100.0
2011 ............................................................... 11.20 11.46 11.28 11.66 100.0 100.0 100.0 100.0 2012 ............................................................... 11.86 12.15 12.45 11.72 100.0 100.0 100.0 100.0 2013 ............................................................... 12.19 12.19 12.38 11.49 100.0 100.0 100.0 100.0 2014 ............................................................... 12.11 12.01 12.03 11.73 100.0 100.0 100.0 100.0 2015 ............................................................... 11.46 11.96 11.71 11.06 100.0 100.0 100.0 100.0 2016 ............................................................... 11.43 12.23 11.83 11.84 100.0 100.0 100.0 100.0 2017 ............................................................... 12.75 – – – 100.0 – – –
Wages and salaries 2006 ............................................................... – – – 8.05 – – – 77.9 2007 ............................................................... 7.88 8.01 7.93 8.32 78.8 79.0 78.9 78.8 2008 ............................................................... 8.20 8.22 8.62 8.77 78.9 78.7 77.5 79.1 2009 ............................................................... 8.68 8.42 8.57 8.96 79.4 79.9 80.0 79.6 2010 ............................................................... 9.06 9.41 9.41 9.15 80.3 79.9 80.2 80.8
2011 ............................................................... 9.01 9.21 9.08 9.30 80.4 80.4 80.5 79.8 2012 ............................................................... 9.41 9.73 9.96 9.31 79.3 80.1 80.0 79.5 2013 ............................................................... 9.64 9.63 9.79 9.10 79.1 79.0 79.1 79.2 2014 ............................................................... 9.53 9.48 9.56 9.30 78.7 78.9 79.4 79.3 2015 ............................................................... 9.10 9.52 9.35 9.04 79.4 79.6 79.8 81.7 2016 ............................................................... 9.36 10.00 9.66 9.61 81.8 81.8 81.7 81.2 2017 ............................................................... 10.33 – – – 81.1 – – –
Total benefits 2006 ............................................................... – – – 2.28 – – – 22.1 2007 ............................................................... 2.12 2.13 2.12 2.24 21.2 21.0 21.1 21.2 2008 ............................................................... 2.19 2.23 2.50 2.32 21.1 21.3 22.5 20.9 2009 ............................................................... 2.25 2.11 2.14 2.29 20.6 20.1 20.0 20.4 2010 ............................................................... 2.22 2.37 2.32 2.17 19.7 20.1 19.8 19.2
2011 ............................................................... 2.19 2.25 2.20 2.36 19.6 19.6 19.5 20.2 2012 ............................................................... 2.45 2.42 2.49 2.40 20.7 19.9 20.0 20.5 2013 ............................................................... 2.55 2.56 2.59 2.39 20.9 21.0 20.9 20.8 2014 ............................................................... 2.58 2.53 2.48 2.43 21.3 21.1 20.6 20.7 2015 ............................................................... 2.36 2.44 2.36 2.02 20.6 20.4 20.2 18.3 2016 ............................................................... 2.08 2.23 2.17 2.23 18.2 18.2 18.3 18.8 2017 ............................................................... 2.41 – – – 18.9 – – –
Paid leave 2006 ............................................................... – – – .28 – – – 2.7 2007 ............................................................... .24 .24 .23 .24 2.4 2.3 2.3 2.3 2008 ............................................................... .25 .25 .32 .27 2.4 2.4 2.9 2.4 2009 ............................................................... .25 .22 .24 .28 2.3 2.1 2.2 2.5 2010 ............................................................... .26 .30 .29 .27 2.3 2.5 2.5 2.4
2011 ............................................................... .26 .28 .25 .29 2.3 2.4 2.2 2.5 2012 ............................................................... .33 .30 .31 .30 2.8 2.4 2.5 2.5 2013 ............................................................... .36 .35 .35 .31 2.9 2.8 2.9 2.7 2014 ............................................................... .34 .33 .32 .31 2.8 2.7 2.7 2.6 2015 ............................................................... .27 .31 .29 .19 2.4 2.6 2.5 1.7 2016 ............................................................... .19 .21 .19 .20 1.6 1.7 1.6 1.7 2017 ............................................................... .25 – – – 2.0 – – –
Supplemental pay 2006 ............................................................... – – – .17 – – – 1.7 2007 ............................................................... .13 .12 .11 .14 1.3 1.2 1.1 1.4 2008 ............................................................... .11 .12 .15 .16 1.1 1.1 1.3 1.4 2009 ............................................................... .14 .11 .10 .13 1.3 1.1 1.0 1.2 2010 ............................................................... .13 .14 .12 .12 1.2 1.2 1.0 1.1
2011 ............................................................... .12 .13 .13 .13 1.0 1.1 1.1 1.1 2012 ............................................................... .15 .13 .14 .18 1.2 1.1 1.1 1.5 2013 ............................................................... .17 .18 .17 .15 1.4 1.4 1.4 1.3 2014 ............................................................... .15 .15 .14 .13 1.2 1.2 1.2 1.1 2015 ............................................................... .12 .12 .12 .10 1.1 1.0 1.0 .9 2016 ............................................................... .10 .11 .11 .11 .8 .9 .9 .9
See footnotes at end of table.
-349-