Embed Size (px)
Citation preview
Page 1 of 25
ARCELORMITTAL REPORTS SECOND QUARTER 2011 AND HALF YEAR 2011 RESULTS Luxembourg, July 27, 2011 - ArcelorMittal (referred to as “ArcelorMittal” or the “Company”) (MT (New York, Amsterdam,
Paris, Brussels, Luxembourg), MTS (Madrid)), the world’s leading steel company, today announced results1 for the three
and six month periods ended June 30, 2011.
Highlights:
• Health & Safety lost time injury frequency rate2 deteriorated marginally to 1.5x in 2Q 2011 from 1.4x in 1Q
2011
• EBITDA3 increased by 21.5% y-o-y to $3.4 billion in 2Q 2011; EBITDA of $6.0 billion for first 6 months
2011, 32.9% higher than first 6 months 2010
• 2Q 2011 steel shipments of 22.2 Mt, essentially flat y-o-y
• 2Q 2011 EBITDA per ton of $154, 22% higher than 2Q 2010
• 2Q 2011 own iron ore production of 13.1 Mt, up 2.4% y-o-y; 7.0 Mt iron ore shipped at market price4, flat
y-o-y
• Net debt5 increased $2.4 billion to $25.0 billion during 2Q 2011 due primarily to investment in working
capital
Outlook and guidance:
• Due to the continued underlying demand recovery, steel shipments in the second half 2011 are expected
to be higher than the same period of 2010
• Results of our mining business expected to further improve due to increased production and shipments
• EBITDA per-tonne in the last six months of 2011 is expected to exceed the level achieved in the same
period of 2010
• Full year 2011 capex target is increased by 10% from $5.0 billion to $5.5 billion due to recently
announced investments
• For 3Q 2011, EBITDA is expected to be approximately $2.4 - $2.8 billion. Working capital requirements
and net debt are expected to remain stable as compared to the 2Q 2011 levels
news release
Page 2 of 25
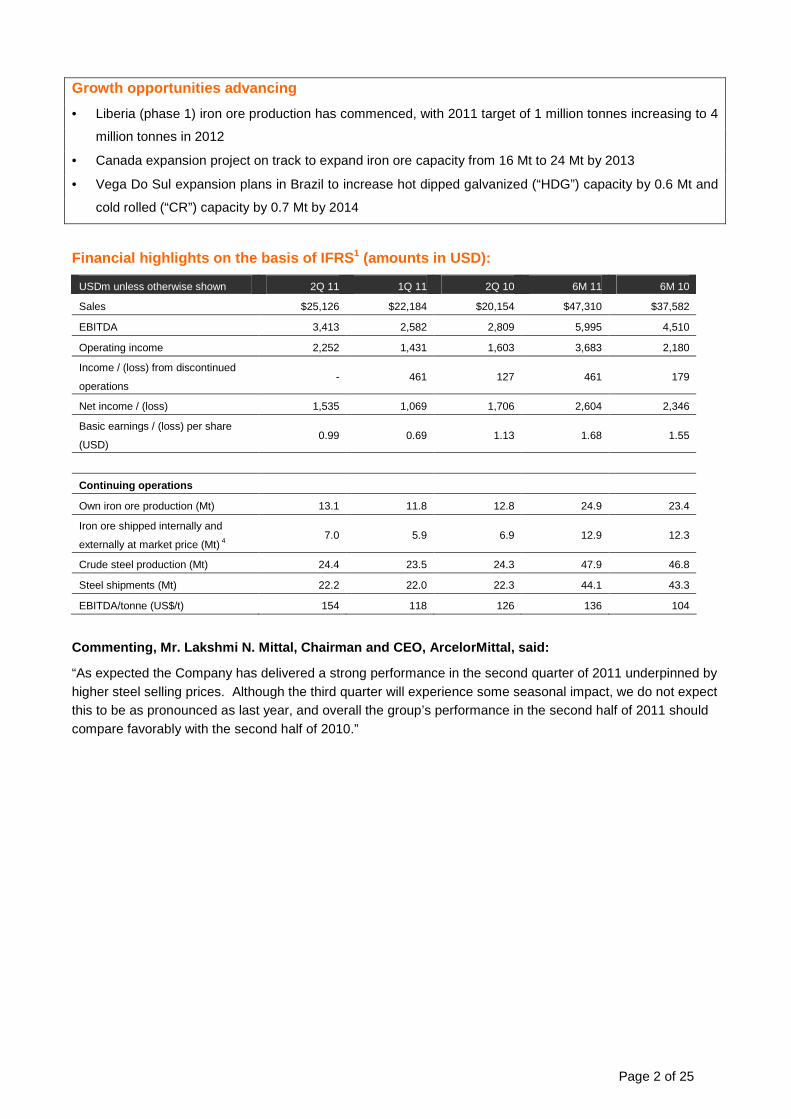
Growth opportunities advancing
• Liberia (phase 1) iron ore production has commenced, with 2011 target of 1 million tonnes increasing to 4
million tonnes in 2012
• Canada expansion project on track to expand iron ore capacity from 16 Mt to 24 Mt by 2013
• Vega Do Sul expansion plans in Brazil to increase hot dipped galvanized (“HDG”) capacity by 0.6 Mt and
cold rolled (“CR”) capacity by 0.7 Mt by 2014
Financial highlights on the basis of IFRS 1 (amounts in USD):
USDm unless otherwise shown 2Q 11 1Q 11 2Q 10 6M 11 6M 10
Sales $25,126 $22,184 $20,154 $47,310 $37,582
EBITDA 3,413 2,582 2,809 5,995 4,510
Operating income 2,252 1,431 1,603 3,683 2,180
Income / (loss) from discontinued
operations - 461 127 461 179
Net income / (loss) 1,535 1,069 1,706 2,604 2,346
Basic earnings / (loss) per share
(USD) 0.99 0.69 1.13 1.68 1.55
Continuing operations
Own iron ore production (Mt) 13.1 11.8 12.8 24.9 23.4
Iron ore shipped internally and
externally at market price (Mt) 4 7.0 5.9 6.9 12.9 12.3
Crude steel production (Mt) 24.4 23.5 24.3 47.9 46.8
Steel shipments (Mt) 22.2 22.0 22.3 44.1 43.3
EBITDA/tonne (US$/t) 154 118 126 136 104
Commenting, Mr. Lakshmi N. Mittal, Chairman and CEO , ArcelorMittal, said:
“As expected the Company has delivered a strong performance in the second quarter of 2011 underpinned by higher steel selling prices. Although the third quarter will experience some seasonal impact, we do not expect this to be as pronounced as last year, and overall the group’s performance in the second half of 2011 should compare favorably with the second half of 2010.”
Page 3 of 25
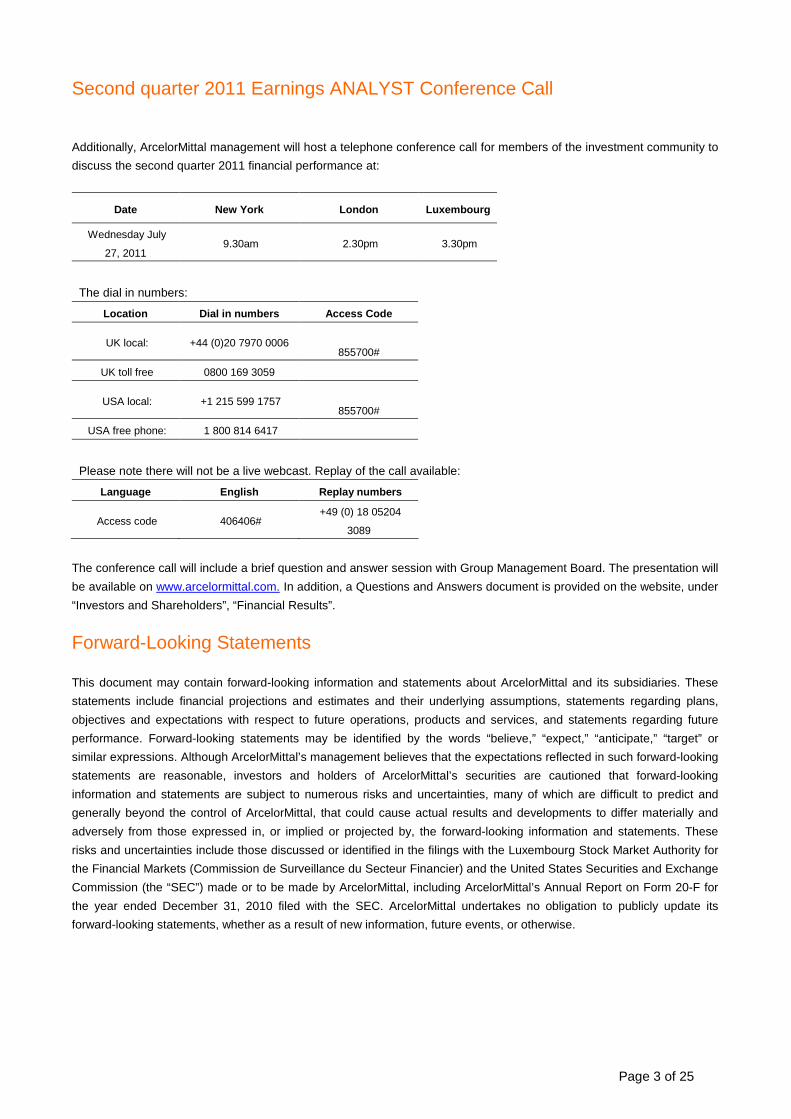
Second quarter 2011 Earnings ANALYST Conference Call
Additionally, ArcelorMittal management will host a telephone conference call for members of the investment community to
discuss the second quarter 2011 financial performance at:
Date New York London Luxembourg
Wednesday July
27, 2011 9.30am 2.30pm 3.30pm
The dial in numbers:
Location Dial in numbers Access Code
UK local: +44 (0)20 7970 0006
855700#
UK toll free 0800 169 3059
USA local: +1 215 599 1757
855700#
USA free phone: 1 800 814 6417
Please note there will not be a live webcast. Replay of the call available:
Language English Replay numbers
Access code 406406# +49 (0) 18 05204
3089
The conference call will include a brief question and answer session with Group Management Board. The presentation will
be available on www.arcelormittal.com. In addition, a Questions and Answers document is provided on the website, under
“Investors and Shareholders”, “Financial Results”.
Forward-Looking Statements
This document may contain forward-looking information and statements about ArcelorMittal and its subsidiaries. These
statements include financial projections and estimates and their underlying assumptions, statements regarding plans,
objectives and expectations with respect to future operations, products and services, and statements regarding future
performance. Forward-looking statements may be identified by the words “believe,” “expect,” “anticipate,” “target” or
similar expressions. Although ArcelorMittal’s management believes that the expectations reflected in such forward-looking
statements are reasonable, investors and holders of ArcelorMittal’s securities are cautioned that forward-looking
information and statements are subject to numerous risks and uncertainties, many of which are difficult to predict and
generally beyond the control of ArcelorMittal, that could cause actual results and developments to differ materially and
adversely from those expressed in, or implied or projected by, the forward-looking information and statements. These
risks and uncertainties include those discussed or identified in the filings with the Luxembourg Stock Market Authority for
the Financial Markets (Commission de Surveillance du Secteur Financier) and the United States Securities and Exchange
Commission (the “SEC”) made or to be made by ArcelorMittal, including ArcelorMittal’s Annual Report on Form 20-F for
the year ended December 31, 2010 filed with the SEC. ArcelorMittal undertakes no obligation to publicly update its
forward-looking statements, whether as a result of new information, future events, or otherwise.
Page 4 of 25
About ArcelorMittal
ArcelorMittal is the world's leading steel company, with presence in more than 60 countries.
ArcelorMittal is the leader in all major global steel markets, including automotive, construction, household appliances and
packaging, with leading R&D and technology, as well as sizeable captive supplies of raw materials and outstanding
distribution networks. With an industrial presence in over 20 countries spanning four continents, the Company covers all
of the key steel markets, from emerging to mature.
Through its core values of sustainability, quality and leadership, ArcelorMittal commits to operating in a responsible way
with respect to the health, safety and well-being of its employees, contractors and the communities in which it operates. It
is also committed to the sustainable management of the environment. It takes a leading role in the industry's efforts to
develop breakthrough steelmaking technologies and is actively researching and developing steel-based technologies and
solutions that contribute to combat climate change.
In 2010, ArcelorMittal had revenues of $78.0 billion and crude steel production of 90.6 million tonnes, representing
approximately 6 per cent of world steel output.
ArcelorMittal is listed on the stock exchanges of New York (MT), Amsterdam (MT), Paris (MT), Brussels (MT),
Luxembourg (MT) and on the Spanish stock exchanges of Barcelona, Bilbao, Madrid and Valencia (MTS).
For more information about ArcelorMittal visit: www.arcelormittal.com.
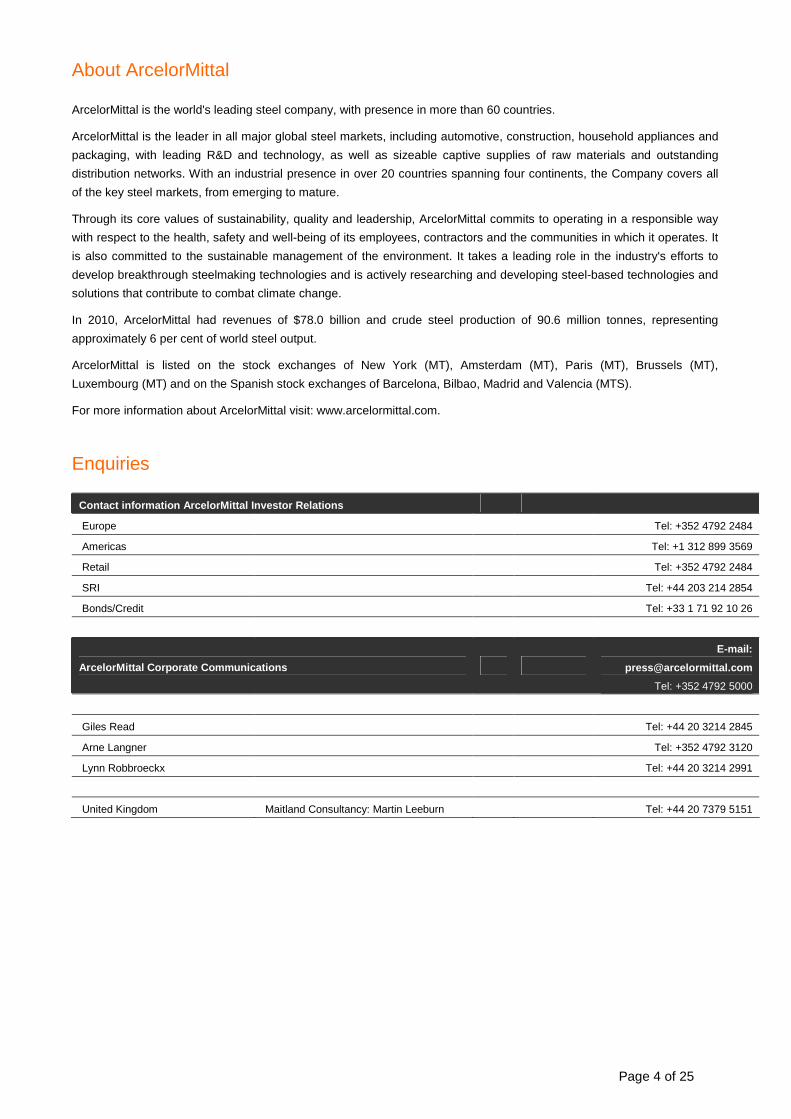
Enquiries
Contact information ArcelorMittal Investor Relation s
Europe Tel: +352 4792 2484
Americas Tel: +1 312 899 3569
Retail Tel: +352 4792 2484
SRI Tel: +44 203 214 2854
Bonds/Credit Tel: +33 1 71 92 10 26
ArcelorMittal Corporate Communications
E-mail:
Tel: +352 4792 5000
Giles Read Tel: +44 20 3214 2845
Arne Langner Tel: +352 4792 3120
Lynn Robbroeckx Tel: +44 20 3214 2991
United Kingdom Maitland Consultancy: Martin Leeburn Tel: +44 20 7379 5151
Page 5 of 25
ArcelorMittal second quarter 2011 and half year 201 1 results ArcelorMittal, the world’s leading steel company, today announced results for the three months and six months ended
June 30, 2011.
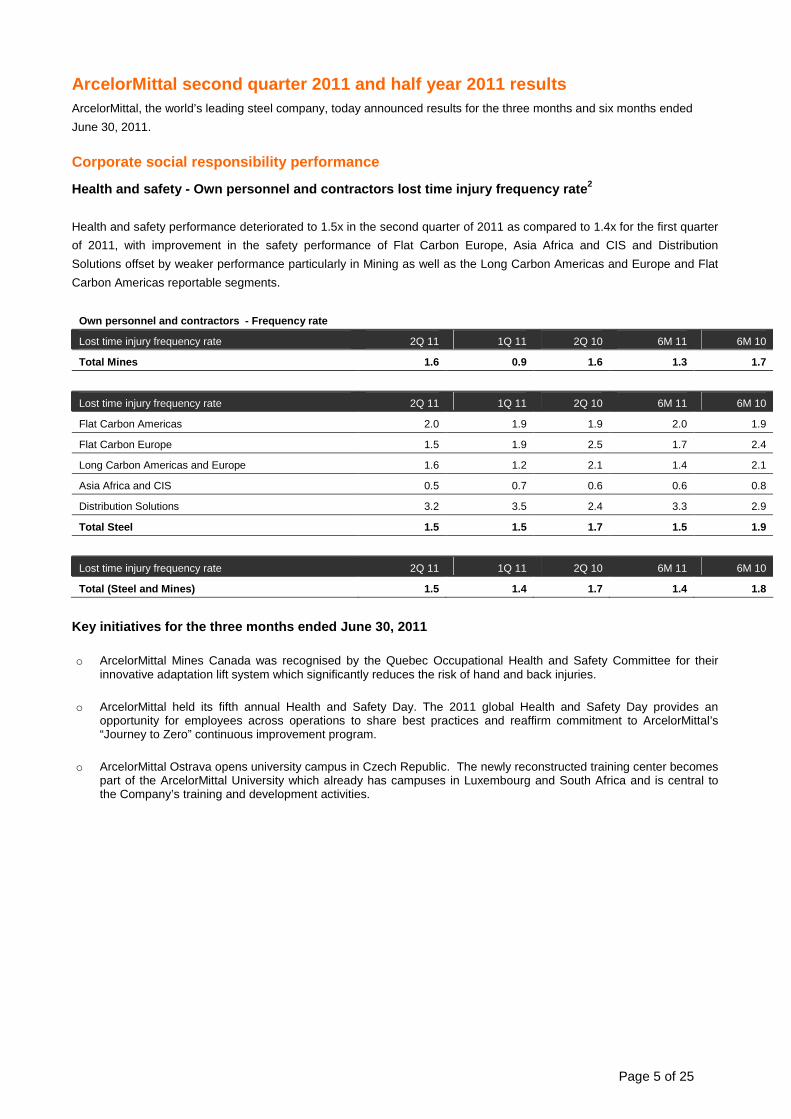
Corporate social responsibility performance
Health and safety - Own personnel and contractors l ost time injury frequency rate 2
Health and safety performance deteriorated to 1.5x in the second quarter of 2011 as compared to 1.4x for the first quarter
of 2011, with improvement in the safety performance of Flat Carbon Europe, Asia Africa and CIS and Distribution
Solutions offset by weaker performance particularly in Mining as well as the Long Carbon Americas and Europe and Flat
Carbon Americas reportable segments.
Own personnel and contractors - Frequency rate
Lost time injury frequency rate 2Q 11 1Q 11 2Q 10 6M 11 6M 10
Total Mines 1.6 0.9 1.6 1.3 1.7
Lost time injury frequency rate 2Q 11 1Q 11 2Q 10 6M 11 6M 10
Flat Carbon Americas 2.0 1.9 1.9 2.0 1.9
Flat Carbon Europe 1.5 1.9 2.5 1.7 2.4
Long Carbon Americas and Europe 1.6 1.2 2.1 1.4 2.1
Asia Africa and CIS 0.5 0.7 0.6 0.6 0.8
Distribution Solutions 3.2 3.5 2.4 3.3 2.9
Total Steel 1.5 1.5 1.7 1.5 1.9
Lost time injury frequency rate 2Q 11 1Q 11 2Q 10 6M 11 6M 10
Total (Steel and Mines) 1.5 1.4 1.7 1.4 1.8
Key initiatives for the three months ended June 30, 2011
o ArcelorMittal Mines Canada was recognised by the Quebec Occupational Health and Safety Committee for their
innovative adaptation lift system which significantly reduces the risk of hand and back injuries.
o ArcelorMittal held its fifth annual Health and Safety Day. The 2011 global Health and Safety Day provides an
opportunity for employees across operations to share best practices and reaffirm commitment to ArcelorMittal’s “Journey to Zero” continuous improvement program.
o ArcelorMittal Ostrava opens university campus in Czech Republic. The newly reconstructed training center becomes
part of the ArcelorMittal University which already has campuses in Luxembourg and South Africa and is central to the Company’s training and development activities.
Page 6 of 25
Analysis of results for the six months ended June 3 0, 2011 versus the six months ended June 30, 2010 ArcelorMittal’s net income for the six months ended June 30, 2011 was $2.6 billion, or $1.68 per share, as compared with
net income of $2.3 billion, or $1.55 per share, for the six months ended June 30, 2010.
Total steel shipments for the six months ended June 30, 2011 were 44.1 million metric tonnes as compared with 43.3
million metric tonnes for the six months ended June 30, 2010.
Sales for the six months ended June 30, 2011 increased 25.9% to $47.3 billion as compared with $37.6 billion for the six
months ended June, 30 2010. Sales were higher during the first half of 2011 as compared to the first half of 2010
primarily due to higher average steel selling prices (22.7%) and slightly higher steel volumes (1.9%).
Depreciation expense for the six months ended June 30, 2011 remained essentially flat at $2.3 billion, as compared to
$2.2 billion in the six months ended June 30, 2010.
Impairment expense for the six months ended June 30, 2011 was $18 million relating to a rolling facility in the Long
Carbon America segment as compared to impairment expenses for the six months ended June 30, 2010 of $118 million
relating to the sale of the Anzherkoye steam coal mine in Russia.
Operating income for the six months ended June 30, 2011 was $3.7 billion, an increase of 68.9% as compared with
operating income of $2.2 billion for the six months ended June 30 2010.
Operating performance for the six months ended June 30, 2011 was positively impacted by a non-cash gain of $336
million recorded in the first quarter relating to the reversal of provisions for inventory write-downs, triggered by improved
market conditions, and reversal of provisions for litigation. In addition, operating performance for the six months ended
June 30, 2011 included a non-cash gain of $308 million related to unwinding of hedges on raw material purchases as
compared to $181 million recorded in the six months ended June 30, 2010.
Income from equity method investments and other income for the six months ended June 30, 2011 was $437 million, as
compared to $270 million for the six months ended June 30, 2010. Income was higher during the first half of 2011 due to
improved performance of joint venture investees.
Net interest expense (including interest expense and interest income) for the six months ended June 30, 2011 was higher
at $916 million, as compared to $656 million for the six months ended June 30, 2010 primarily due to the impact of
exchange rate fluctuations and higher interest expense due to new bonds issued in 2010 and first quarter of 2011.
As a result of hedging transactions undertaken by the Company in December 2010, there were minimal mark-to-market
losses during the first half of 2011 with respect to the embedded derivatives in ArcelorMittal’s convertible bonds issued in
2009 and the related call options. During the six months ended June 30, 2010, the Company had recorded a non-cash
gain of $696 million as a result of these mark-to-market adjustments.
Foreign exchange and other net financing costs were $1.1 billion for the six months ended June 30, 2011 as compared to
$0.7 billion for the six months ended June 30, 2010. During the six months ended June 30, 2011 foreign exchange loss
was $672 million as compared to a $179 million foreign exchange loss in the six months ended June 30, 2010.
ArcelorMittal recorded an income tax benefit of $105 million for the six months ended June 30, 2011, as compared to an
income tax benefit of $453 million for the six months ended June 30, 2010.
Gain attributable to non-controlling interests for the months ended June 30, 2011 was $52 million as compared to a gain
of $119 million for the six months ended June 30, 2010.
Discontinued operations (i.e., the Company’s stainless steel operations, which were spun-off into a separate company,
Aperam, whose shares were distributed to ArcelorMittal shareholders in the first quarter of 2011) for the six months ended
Page 7 of 25
on June 30, 2011 amounted to a gain of $461 million, including $42 million of the post-tax net results contributed by the
stainless steel operations prior to the spin-off of the business into Aperam which was completed on January 25, 2011. The
balance of $419 million represents a one-time non-cash gain from the recognition through the income statement of
gains/losses relating to the demerged assets previously held in equity. Discontinued operations for the six months ended
on June 30, 2010 amounted to a gain of $179 million.
Analysis of results for the three months ended June 30, 2011 versus the three months ended March 31, 2011 and the three months ended June 30, 2010 ArcelorMittal’s net income for the three months ended June 30, 2011 was $1.5 billion, or $0.99 per share, as compared
with net income of $1.1 billion, or $0.69 per share, for the three months ended March 31, 2011 and net income of $1.7
billion, or $1.13 per share, for the three months ended June 30, 2010.
Total steel shipments for the three months ended June 30, 2011 were 22.2 million metric tonnes as compared with 22.0
million metric tonnes for the three months ended March 31, 2011, and 22.3 million metric tonnes for the three months
ended June 30, 2010.
Sales for the three months ended June 30, 2011 increased 13.3% to $25.1 billion as compared with $22.2 billion for the
three months ended March 31, 2011, and were up 24.7% as compared with $20.2 billion for the three months ended June
30, 2010. Sales were higher during the second quarter of 2011 as compared to the first quarter of 2011 primarily due to
higher average steel selling prices (+10.9%).
Depreciation expense for the three months ended June 30, 2011 remained essentially flat at $1.2 billion as compared to
$1.1 billion for both the three months ended March 31, 2011 and June 30, 2010.
Impairment expense for the three months ended June 30, 2011 was nil as compared to impairment expense for the three
months ended March 31, 2011 of $18 million relating to costs in a rolling facility in the Long Carbon America segment.
Impairment expense for the three months ended June 30, 2010 was $118 million related to the Anzherkoye steam coal
mine in Russia.
Operating income for the three months ended June 30, 2011 was $2.3 billion, as compared with operating income of $1.4
billion for the three months ended March 31, 2011 and operating income of $1.6 billion for the three months ended June
30, 2010.
Operating performance for the three months ended March 31, 2011 was positively impacted by a non-cash gain of $336
million related to the reversal of provisions for inventory write-downs, triggered by improved market conditions, and
reversal of provisions for litigations. Operating income for the three months ended June 30, 2011 included a non-cash
gain of $189 million relating to unwinding of hedges on raw material purchases as compared to non-cash gains relating to
such unwinding of $119 million and $92 million recorded in the three months ended March 31, 2011 and June 30, 2010,
respectively.
Income from equity method investments and other income for the three months ended June 30, 2011 was $289 million, as
compared to $148 million and $177 million for the three months ended March 31, 2011 and June 30, 2010, respectively.
Income is higher during the second quarter of 2011 due to improved performance of joint ventures investees.
Net interest expense (including interest expense and interest income) was essentially flat at $457 million for the three
months ended June 30, 2011 from $459 million for the three months ended March 31, 2011. Net interest expense for the
three months ended June 30, 2010 was $304 million.
As a result of hedging transactions undertaken by the Company in December 2010, there were minimal mark-to-market
losses during the second quarter of 2011 with respect to the embedded derivatives in ArcelorMittal’s convertible bonds
and the related call options. During the three months ended June 30, 2010, the Company had recorded a non-cash gain
of $555 million as a result of these mark-to-market adjustments.
Page 8 of 25
Foreign exchange and other net financing costs were $443 million for the three months ended June 30, 2011 as
compared to $667 million for the three months ended March 31, 2011. Foreign exchange and other net financing costs for
the three months ended June 30, 2010 were $465 million.
ArcelorMittal recorded an income tax expense of $61 million for the three months ended June 30, 2011, as compared to
an income tax benefit of $166 million for the three months ended March 31, 2011. The income tax benefit for the three
months ended June 30, 2010 was $92 million.
Gain attributable to non-controlling interests for the three months ended June 30, 2011 was $41 million as compared with
gains of $11 million and $79 million for the three months ended March 31, 2011 and June 30, 2010, respectively.
Discontinued operations (i.e., the Company’s stainless steel operations, which were spun-off into a separate company,
Aperam, whose shares were distributed to ArcelorMittal shareholders in the first quarter of 2011) for the three months
ended on June 30, 2011 were nil. Discontinued operations for the three months ended on March 31, 2011 amounted to a
gain of $461 million, including $42 million of the post-tax net results contributed by the stainless steel operations prior to
the January 25, 2011 spin-off effective date. The balance of $419 million represented a one-time non-cash gain from the
recognition through the income statement of gains/losses relating to the demerged assets previously held in equity.
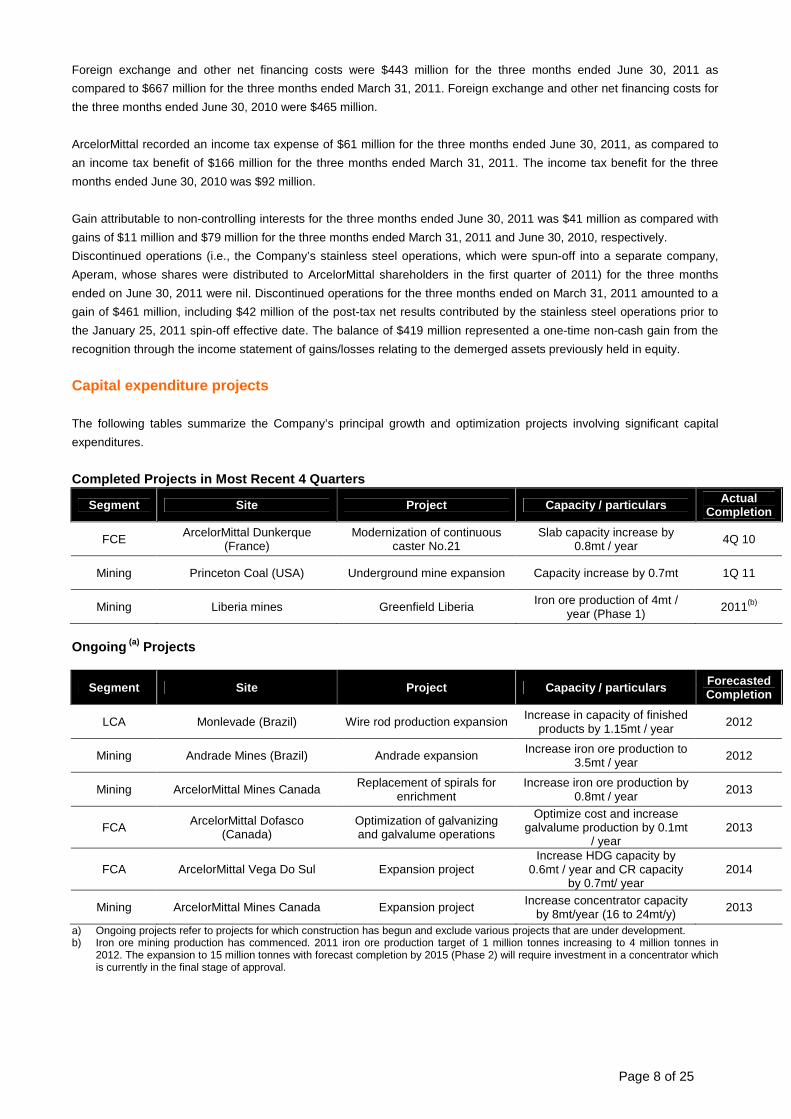
Capital expenditure projects
The following tables summarize the Company’s principal growth and optimization projects involving significant capital
expenditures.
Completed Projects in Most Recent 4 Quarters
Segment Site Project Capacity / particulars Actual Completion
FCE ArcelorMittal Dunkerque (France)
Modernization of continuous caster No.21
Slab capacity increase by 0.8mt / year 4Q 10
Mining Princeton Coal (USA) Underground mine expansion Capacity increase by 0.7mt 1Q 11
Mining Liberia mines Greenfield Liberia Iron ore production of 4mt / year (Phase 1)
2011(b)
Ongoing (a) Projects
Segment Site Project Capacity / particulars Forecasted Completion
LCA Monlevade (Brazil) Wire rod production expansion Increase in capacity of finished products by 1.15mt / year
2012
Mining Andrade Mines (Brazil) Andrade expansion Increase iron ore production to 3.5mt / year
2012
Mining ArcelorMittal Mines Canada Replacement of spirals for enrichment
Increase iron ore production by 0.8mt / year
2013
FCA ArcelorMittal Dofasco (Canada)
Optimization of galvanizing and galvalume operations
Optimize cost and increase galvalume production by 0.1mt
/ year 2013
FCA ArcelorMittal Vega Do Sul Expansion project Increase HDG capacity by
0.6mt / year and CR capacity by 0.7mt/ year
2014
Mining ArcelorMittal Mines Canada Expansion project Increase concentrator capacity by 8mt/year (16 to 24mt/y)
2013
a) Ongoing projects refer to projects for which construction has begun and exclude various projects that are under development. b) Iron ore mining production has commenced. 2011 iron ore production target of 1 million tonnes increasing to 4 million tonnes in
2012. The expansion to 15 million tonnes with forecast completion by 2015 (Phase 2) will require investment in a concentrator which is currently in the final stage of approval.
Page 9 of 25
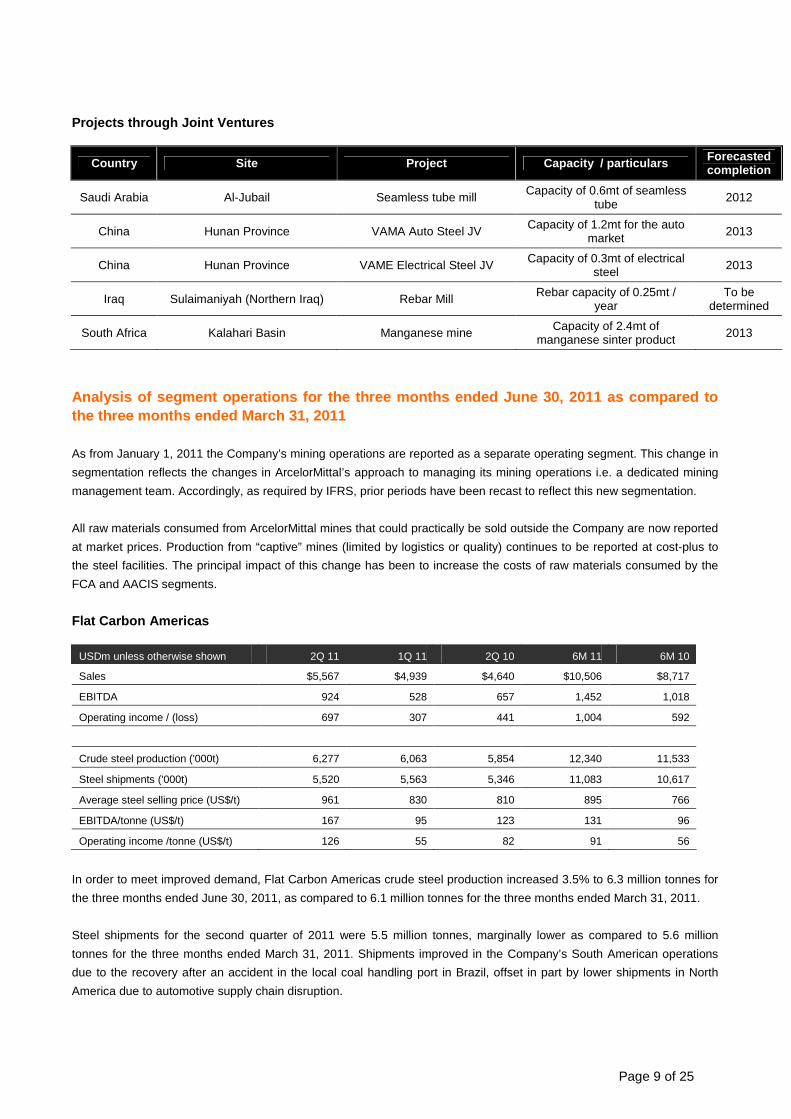
Projects through Joint Ventures
Country Site Project Capacity / particulars Forecasted completion
Saudi Arabia Al-Jubail Seamless tube mill Capacity of 0.6mt of seamless tube
2012
China Hunan Province VAMA Auto Steel JV Capacity of 1.2mt for the auto market 2013
China Hunan Province VAME Electrical Steel JV Capacity of 0.3mt of electrical steel 2013
Iraq Sulaimaniyah (Northern Iraq) Rebar Mill Rebar capacity of 0.25mt / year
To be determined
South Africa Kalahari Basin Manganese mine Capacity of 2.4mt of manganese sinter product 2013
Analysis of segment operations for the three months ended June 30, 2011 as compared to the three months ended March 31, 2011 As from January 1, 2011 the Company’s mining operations are reported as a separate operating segment. This change in
segmentation reflects the changes in ArcelorMittal’s approach to managing its mining operations i.e. a dedicated mining
management team. Accordingly, as required by IFRS, prior periods have been recast to reflect this new segmentation.
All raw materials consumed from ArcelorMittal mines that could practically be sold outside the Company are now reported
at market prices. Production from “captive” mines (limited by logistics or quality) continues to be reported at cost-plus to
the steel facilities. The principal impact of this change has been to increase the costs of raw materials consumed by the
FCA and AACIS segments.
Flat Carbon Americas
USDm unless otherwise shown 2Q 11 1Q 11 2Q 10 6M 11 6M 10
Sales $5,567 $4,939 $4,640 $10,506 $8,717
EBITDA 924 528 657 1,452 1,018
Operating income / (loss) 697 307 441 1,004 592
Crude steel production ('000t) 6,277 6,063 5,854 12,340 11,533
Steel shipments ('000t) 5,520 5,563 5,346 11,083 10,617
Average steel selling price (US$/t) 961 830 810 895 766
EBITDA/tonne (US$/t) 167 95 123 131 96
Operating income /tonne (US$/t) 126 55 82 91 56
In order to meet improved demand, Flat Carbon Americas crude steel production increased 3.5% to 6.3 million tonnes for
the three months ended June 30, 2011, as compared to 6.1 million tonnes for the three months ended March 31, 2011.
Steel shipments for the second quarter of 2011 were 5.5 million tonnes, marginally lower as compared to 5.6 million
tonnes for the three months ended March 31, 2011. Shipments improved in the Company’s South American operations
due to the recovery after an accident in the local coal handling port in Brazil, offset in part by lower shipments in North
America due to automotive supply chain disruption.
Page 10 of 25
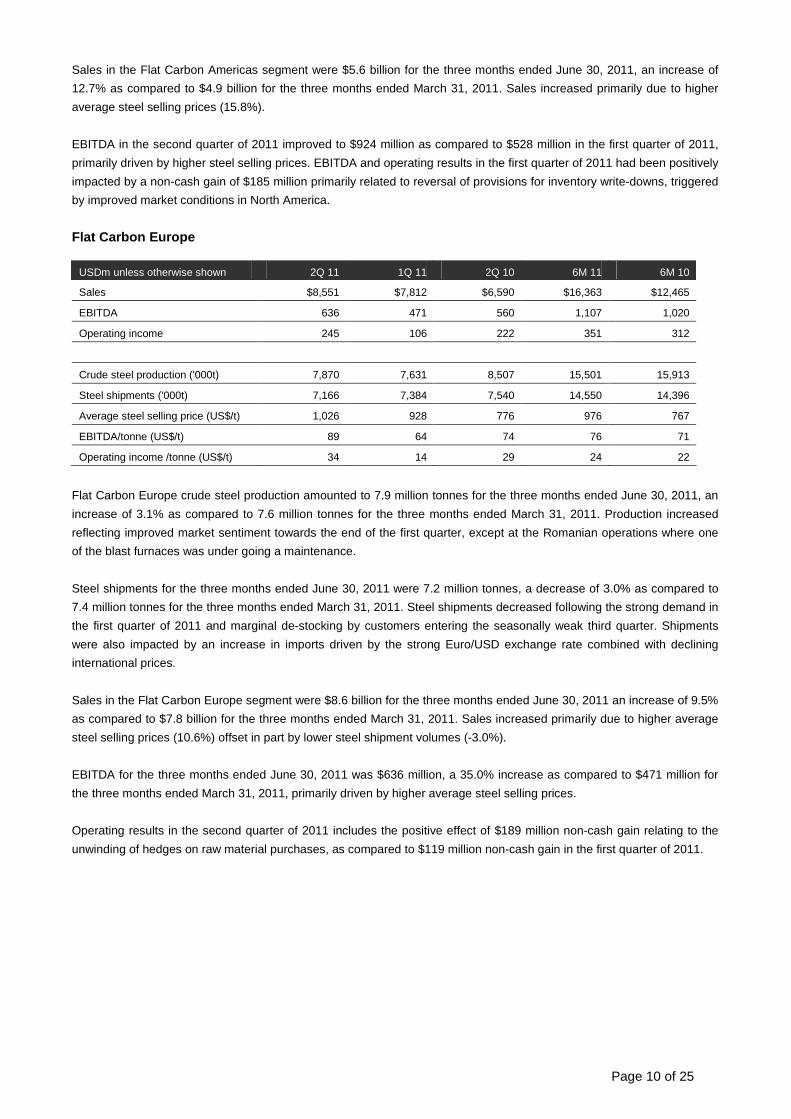
Sales in the Flat Carbon Americas segment were $5.6 billion for the three months ended June 30, 2011, an increase of
12.7% as compared to $4.9 billion for the three months ended March 31, 2011. Sales increased primarily due to higher
average steel selling prices (15.8%).
EBITDA in the second quarter of 2011 improved to $924 million as compared to $528 million in the first quarter of 2011,
primarily driven by higher steel selling prices. EBITDA and operating results in the first quarter of 2011 had been positively
impacted by a non-cash gain of $185 million primarily related to reversal of provisions for inventory write-downs, triggered
by improved market conditions in North America.
Flat Carbon Europe
USDm unless otherwise shown 2Q 11 1Q 11 2Q 10 6M 11 6M 10
Sales $8,551 $7,812 $6,590 $16,363 $12,465
EBITDA 636 471 560 1,107 1,020
Operating income 245 106 222 351 312
Crude steel production ('000t) 7,870 7,631 8,507 15,501 15,913
Steel shipments ('000t) 7,166 7,384 7,540 14,550 14,396
Average steel selling price (US$/t) 1,026 928 776 976 767
EBITDA/tonne (US$/t) 89 64 74 76 71
Operating income /tonne (US$/t) 34 14 29 24 22
Flat Carbon Europe crude steel production amounted to 7.9 million tonnes for the three months ended June 30, 2011, an
increase of 3.1% as compared to 7.6 million tonnes for the three months ended March 31, 2011. Production increased
reflecting improved market sentiment towards the end of the first quarter, except at the Romanian operations where one
of the blast furnaces was under going a maintenance.
Steel shipments for the three months ended June 30, 2011 were 7.2 million tonnes, a decrease of 3.0% as compared to
7.4 million tonnes for the three months ended March 31, 2011. Steel shipments decreased following the strong demand in
the first quarter of 2011 and marginal de-stocking by customers entering the seasonally weak third quarter. Shipments
were also impacted by an increase in imports driven by the strong Euro/USD exchange rate combined with declining
international prices.
Sales in the Flat Carbon Europe segment were $8.6 billion for the three months ended June 30, 2011 an increase of 9.5%
as compared to $7.8 billion for the three months ended March 31, 2011. Sales increased primarily due to higher average
steel selling prices (10.6%) offset in part by lower steel shipment volumes (-3.0%).
EBITDA for the three months ended June 30, 2011 was $636 million, a 35.0% increase as compared to $471 million for
the three months ended March 31, 2011, primarily driven by higher average steel selling prices.
Operating results in the second quarter of 2011 includes the positive effect of $189 million non-cash gain relating to the
unwinding of hedges on raw material purchases, as compared to $119 million non-cash gain in the first quarter of 2011.
Page 11 of 25
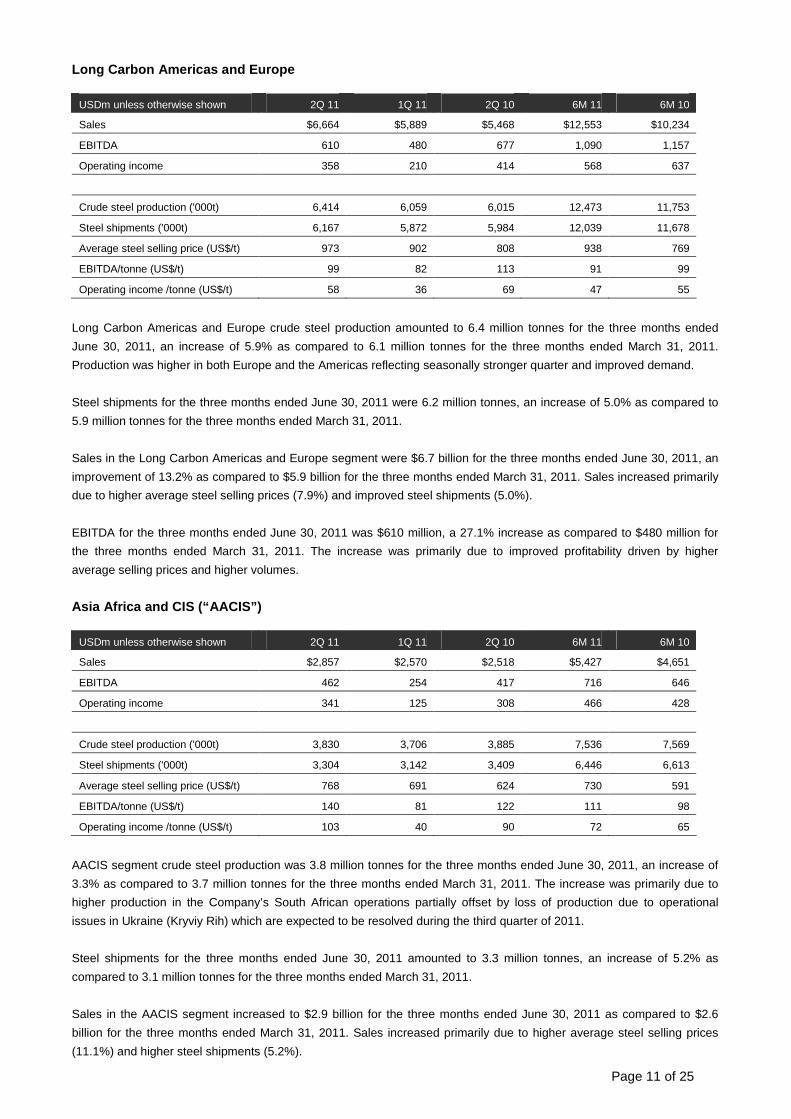
Long Carbon Americas and Europe
USDm unless otherwise shown 2Q 11 1Q 11 2Q 10 6M 11 6M 10
Sales $6,664 $5,889 $5,468 $12,553 $10,234
EBITDA 610 480 677 1,090 1,157
Operating income 358 210 414 568 637
Crude steel production ('000t) 6,414 6,059 6,015 12,473 11,753
Steel shipments ('000t) 6,167 5,872 5,984 12,039 11,678
Average steel selling price (US$/t) 973 902 808 938 769
EBITDA/tonne (US$/t) 99 82 113 91 99
Operating income /tonne (US$/t) 58 36 69 47 55
Long Carbon Americas and Europe crude steel production amounted to 6.4 million tonnes for the three months ended
June 30, 2011, an increase of 5.9% as compared to 6.1 million tonnes for the three months ended March 31, 2011.
Production was higher in both Europe and the Americas reflecting seasonally stronger quarter and improved demand.
Steel shipments for the three months ended June 30, 2011 were 6.2 million tonnes, an increase of 5.0% as compared to
5.9 million tonnes for the three months ended March 31, 2011.
Sales in the Long Carbon Americas and Europe segment were $6.7 billion for the three months ended June 30, 2011, an
improvement of 13.2% as compared to $5.9 billion for the three months ended March 31, 2011. Sales increased primarily
due to higher average steel selling prices (7.9%) and improved steel shipments (5.0%).
EBITDA for the three months ended June 30, 2011 was $610 million, a 27.1% increase as compared to $480 million for
the three months ended March 31, 2011. The increase was primarily due to improved profitability driven by higher
average selling prices and higher volumes.
Asia Africa and CIS (“AACIS”)
USDm unless otherwise shown 2Q 11 1Q 11 2Q 10 6M 11 6M 10
Sales $2,857 $2,570 $2,518 $5,427 $4,651
EBITDA 462 254 417 716 646
Operating income 341 125 308 466 428
Crude steel production ('000t) 3,830 3,706 3,885 7,536 7,569
Steel shipments ('000t) 3,304 3,142 3,409 6,446 6,613
Average steel selling price (US$/t) 768 691 624 730 591
EBITDA/tonne (US$/t) 140 81 122 111 98
Operating income /tonne (US$/t) 103 40 90 72 65
AACIS segment crude steel production was 3.8 million tonnes for the three months ended June 30, 2011, an increase of
3.3% as compared to 3.7 million tonnes for the three months ended March 31, 2011. The increase was primarily due to
higher production in the Company’s South African operations partially offset by loss of production due to operational
issues in Ukraine (Kryviy Rih) which are expected to be resolved during the third quarter of 2011.
Steel shipments for the three months ended June 30, 2011 amounted to 3.3 million tonnes, an increase of 5.2% as
compared to 3.1 million tonnes for the three months ended March 31, 2011.
Sales in the AACIS segment increased to $2.9 billion for the three months ended June 30, 2011 as compared to $2.6
billion for the three months ended March 31, 2011. Sales increased primarily due to higher average steel selling prices
(11.1%) and higher steel shipments (5.2%).
Page 12 of 25
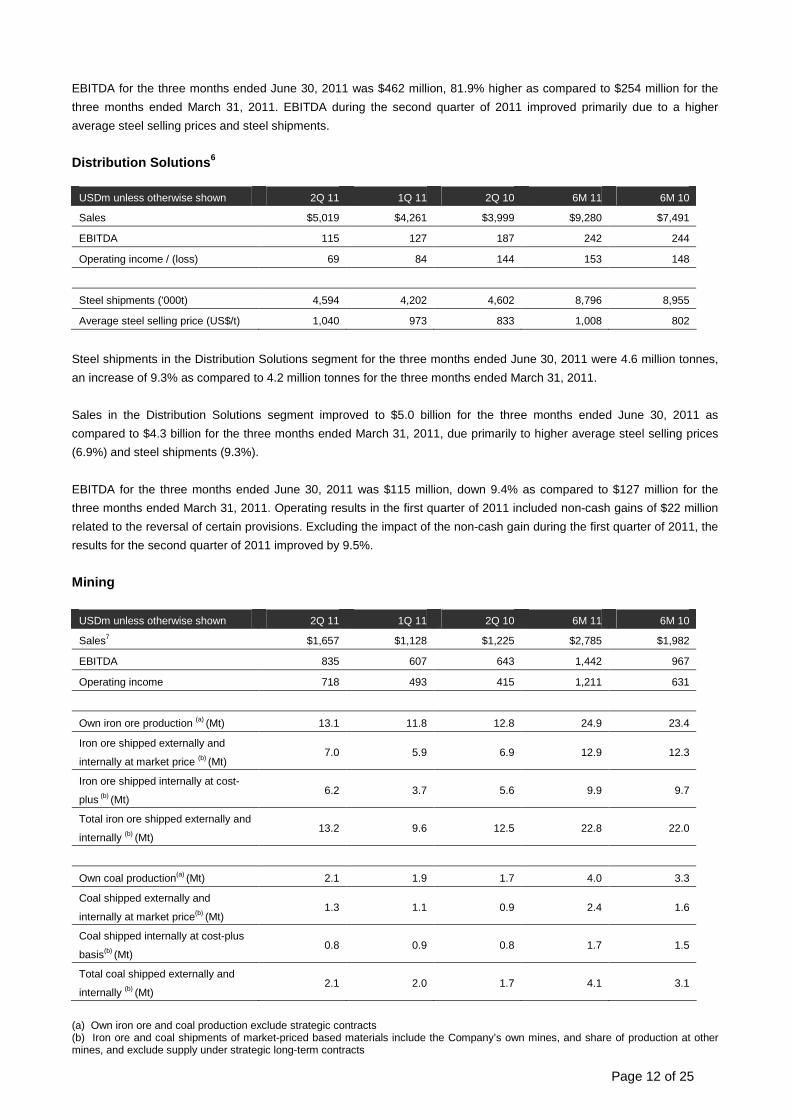
EBITDA for the three months ended June 30, 2011 was $462 million, 81.9% higher as compared to $254 million for the
three months ended March 31, 2011. EBITDA during the second quarter of 2011 improved primarily due to a higher
average steel selling prices and steel shipments.
Distribution Solutions 6
USDm unless otherwise shown 2Q 11 1Q 11 2Q 10 6M 11 6M 10
Sales $5,019 $4,261 $3,999 $9,280 $7,491
EBITDA 115 127 187 242 244
Operating income / (loss) 69 84 144 153 148
Steel shipments ('000t) 4,594 4,202 4,602 8,796 8,955
Average steel selling price (US$/t) 1,040 973 833 1,008 802
Steel shipments in the Distribution Solutions segment for the three months ended June 30, 2011 were 4.6 million tonnes,
an increase of 9.3% as compared to 4.2 million tonnes for the three months ended March 31, 2011.
Sales in the Distribution Solutions segment improved to $5.0 billion for the three months ended June 30, 2011 as
compared to $4.3 billion for the three months ended March 31, 2011, due primarily to higher average steel selling prices
(6.9%) and steel shipments (9.3%).
EBITDA for the three months ended June 30, 2011 was $115 million, down 9.4% as compared to $127 million for the
three months ended March 31, 2011. Operating results in the first quarter of 2011 included non-cash gains of $22 million
related to the reversal of certain provisions. Excluding the impact of the non-cash gain during the first quarter of 2011, the
results for the second quarter of 2011 improved by 9.5%.
Mining
USDm unless otherwise shown 2Q 11 1Q 11 2Q 10 6M 11 6M 10
Sales7 $1,657 $1,128 $1,225 $2,785 $1,982
EBITDA 835 607 643 1,442 967
Operating income 718 493 415 1,211 631
Own iron ore production (a) (Mt) 13.1 11.8 12.8 24.9 23.4
Iron ore shipped externally and
internally at market price (b) (Mt) 7.0 5.9 6.9 12.9 12.3
Iron ore shipped internally at cost-
plus (b) (Mt) 6.2 3.7 5.6 9.9 9.7
Total iron ore shipped externally and
internally (b) (Mt) 13.2 9.6 12.5 22.8 22.0
Own coal production(a) (Mt) 2.1 1.9 1.7 4.0 3.3
Coal shipped externally and
internally at market price(b) (Mt) 1.3 1.1 0.9 2.4 1.6
Coal shipped internally at cost-plus
basis(b) (Mt) 0.8 0.9 0.8 1.7 1.5
Total coal shipped externally and
internally (b) (Mt) 2.1 2.0 1.7 4.1 3.1
(a) Own iron ore and coal production exclude strategic contracts (b) Iron ore and coal shipments of market-priced based materials include the Company’s own mines, and share of production at other mines, and exclude supply under strategic long-term contracts
Page 13 of 25
Own iron ore production (excluding supplies under strategic long-term contracts) was 13.1 million tonnes for the three
months ended June 30, 2011, an increase of 11.4% as compared to 11.8 million tonnes for the three months ended
March 31, 2011.
Total iron ore shipped during the second quarter of 2011 amounted to 13.2 million metric tonnes, an increase of 36.7% as
compared to 9.6 million tonnes in the first quarter of 2011. Shipments of market-priced iron ore increased by 17.7% to 7.0
million tonnes for the three months ended June 30, 2011, as compared to 5.9 million tonnes three months ended March
31, 2011.
Shipments of iron ore were higher in the second quarter of 2011 mainly due to higher shipments in the USA (which had
been affected in the first quarter by weather related factors), normalized shipments in Canada as compared to the first
quarter of 2011 (which were negatively impacted by an operational disruption at the concentrator plant), and logistics
constraints in Brazil during the first quarter.
Own coal production for the three months ended June 30, 2011 increased 7.0% to 2.1 million tonnes as compared to 1.9
million tonnes for the three months ended March 31, 2011.
Total coal shipped during the second quarter of 2011 amounted to 2.1 million tonnes, an increase of 2.3% as compared to
2.0 million tonnes for the first quarter of 2011. Shipments of market-priced coal increased by 14.9% to 1.3 million tonnes
for the three months ended June 30, 2011 as compared to 1.1 million tonnes for the three months ended March 31, 2011.
EBITDA attributable to the Mining segment for the three months ended June 30, 2011 was $835 million, 37.6% higher as
compared to $607 million for the three months ended March 31, 2011 mainly due to higher average selling prices for iron
ore and coal and higher iron ore volumes.
Liquidity and Capital Resources
For the three months ended June 30, 2011, net cash used in operating activities was $0.6 billion, compared to $1.3 billion
for the three months ended March 31, 2011. The cash flow used in operating activities for the second quarter of 2011
included a $2.8 billion investment in operating working capital as compared to a $1.8 billion investment in the first quarter
of 2011. With increased capacity utilization levels during the second quarter of 2011 requiring additional working capital,
rotation days8 increased to 71 days during the second quarter of 2011 from 66 days in the first quarter of 2011.
Net cash used in investing activities for the three months ended June 30, 2011 was $1.3 billion, as compared to $0.6
billion for the three months ended March 31, 2011. Capital expenditures increased to $1.1 billion for the three months
ended June 30, 2011 as compared to $1.0 billion for the three months ended March 31, 2011. The Company’s full year
2011 capital expenditure target has increased by 10% from $5.0 billion to $5.5 billion (as compared to $3.3 billion in 2010)
due to investments in the recently announced capacity expansions at the Company’s Canadian mines, investments in
energy saving projects (reinvesting the proceeds from the sale of carbon dioxide credits), Vega Do Sul investment in
Brazil and expenses related to the study of the Liberia phase 2 expansion. Other investing activities in the second quarter
of 2011 of $186 million included an outflow of $67 million related to acquisition of Cognor in Poland (AMDS), $205 million
for the acquisition of the Prosper coke plant in Germany, offset in part by net cash inflows of $86 million representing cash
proceeds from the sale of certain fixed assets and other recoveries. Other investing activities in the first quarter of 2011 of
$541 million had included an inflow of $0.9 billion from Aperam (due to repayment of a bridge loan), an inflow of $147
million from the sale of carbon dioxide credits (which ArcelorMittal will fully reinvest in energy saving projects in the Flat
Carbon Europe perimeter), which were partially offset by an outflow of $0.5 billion relating to M&A expenditures (primarily
the Baffinland Iron Mines Corporation acquisition).
Page 14 of 25
Net cash provided by financing activities for the three months ended June 30, 2011 was $1.1 billion, as compared to cash
used by financing activities of $0.8 billion for the three months ended March 31, 2011. During the second quarter of 2011,
the Company paid dividends amounting to $302 million as compared to $294 million in the first quarter of 2011. Dividends
paid during the second quarter of 2011 included $8 million paid to minority shareholders.
At June 30, 2011, the Company’s cash and cash equivalents (including restricted cash and short-term investments)
amounted to $3.2 billion as compared to $3.9 billion at March 31, 2011. During the quarter, net debt increased by $2.4
billion to $25.0 billion as compared with $22.6 billion at March 31, 2011 primarily due to investment in working capital and
M&A related expenditures.
The Company had liquidity of $12.39 billion at June 30, 2011, a decline of $2.2 billion as compared with liquidity of $14.5
billion at March 31, 2011, consisting of cash and cash equivalents (including restricted cash and short-term investments)
of $3.2 billion and $9.1 billion of available credit lines.
Update on management gains program
At the end of the second quarter of 2011, the Company’s annualized sustainable savings increased to $3.6 billion as
compared to $3.5 billion at the end of March 31, 2011 (excluding Aperam). The Company maintains its target to reach
management gains of $4.8 billion (revised plan excluding Aperam) of sustainable SG&A, fixed cost reductions and
continuous improvement by end of 2012.
Recent Developments
• On July 11, 2011 ArcelorMittal confirmed that it had along with Peabody Energy Corporation made an indicative,
nonbinding and conditional proposal to make an off-market takeover bid, through a bid company 40% owned by ArcelorMittal and 60% owned by Peabody, to acquire up to 100% of the issued securities of Macarthur (“Indicative Proposal”). Under the Indicative Proposal, Macarthur shareholders would be offered a cash price of A$15.5010 per share, implying a value for the equity in Macarthur of approximately A$4.7 billion. ArcelorMittal already has an ownership interest of approximately 16 percent of Macarthur's shares. The Indicative Proposal is conditional on the successful completion of due diligence, which would be completed in a timely manner. Any resulting offer to Macarthur shareholders would be conditional only on a minimum of 50.01 percent acceptance by Macarthur shareholders, approval from Australia's Foreign Investment Review Board and other customary conditions and approvals.
• On May 24, 2011, ArcelorMittal announced some changes to both its Group Management Board and Management
Committee. The Group Management Board changes involved a change in the responsibilities of Aditya Mittal, Michel Wurth and Gonzalo Urquijo as well as the appointment of Louis Schorsch and the retirement of Christophe Cornier. The Management Committee has also been extended from 12 to 25 members with the new members being CEOs and leaders from within the Group.
• On May 20, 2011, ArcelorMittal announced the expansion of its Mont-Wright mining complex and additional
construction at Port-Cartier in Canada. The investment is expected to allow ArcelorMittal Mines Canada (“AMMC”) to increase its annual production of iron ore concentrate from 16 million metric tonnes to 24 million metric tonnes by 2013. AMMC is also evaluating increasing its production of iron ore pellets from 9.2 million tons to 18.5 million tons. The project would represent a total investment of CAN$2.1 billion (including CAN$0.9 billion investment in pellet plant, if approved) and is subject to environmental and other regulatory approvals.
• On July 26, 2011 announced that Bruno Lafont has joined the Audit Committee and that Suzanne Nimocks has joined
the Appointments, Remuneration and Corporate Governance Committee as well as the Risk Management Committee of the Board of Directors.
For further information about these recent developments, please refer to our website www.arcelormittal.com
Outlook and guidance Looking to the second half of 2011, raw material accounting costs are expected to increase from 2Q 2011 levels. Due to
the continued underlying demand recovery, steel shipments in the second half of 2011 are expected to be higher than the
same period in 2010. Results of our mining business are expected to further improve due to increased production and
shipments; for 2011 we continue to target 10% growth in iron ore production and a 20% increase in coking coal
Page 15 of 25
production. Overall group EBITDA per-tonne in second half of 2011 is expected to exceed the level achieved in the same
period of 2010.
The Company’s full year 2011 capital expenditure target increased by 10% from $5.0 billion to $5.5 billion (as compared
to $3.3 billion in 2010) due to investments in the recently announced capacity expansions at the Company’s Canadian
mines, investments in energy saving projects (reinvesting the proceeds from the sale of carbon dioxide credits), Vega Do
Sul investment in Brazil and expenses related to the study of the Liberia phase 2 expansion.
For the third quarter, EBITDA is expected to be approximately $2.4 - $2.8 billion. Working capital requirements and net
debt are expected to remain stable as compared to the 2Q 2011 levels.
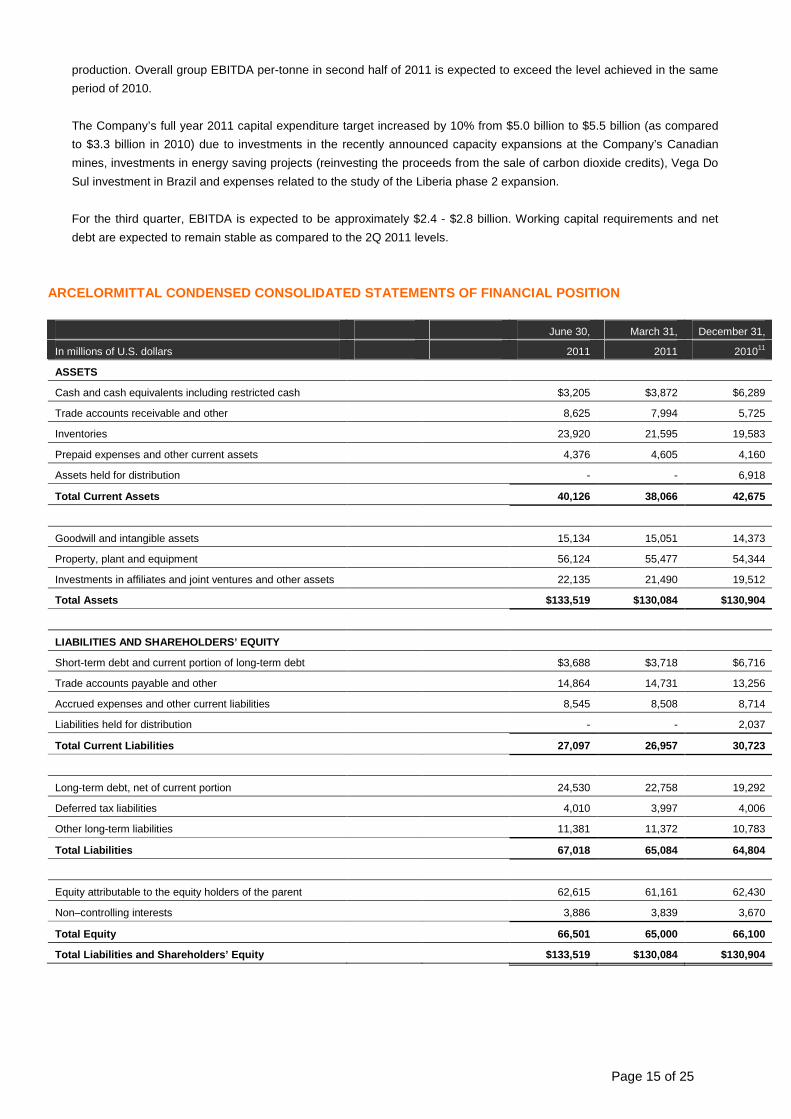
ARCELORMITTAL CONDENSED CONSOLIDATED STATEMENTS OF FINANCIAL POSITION
June 30, March 31, December 31,
In millions of U.S. dollars 2011 2011 201011
ASSETS
Cash and cash equivalents including restricted cash $3,205 $3,872 $6,289
Trade accounts receivable and other 8,625 7,994 5,725
Inventories 23,920 21,595 19,583
Prepaid expenses and other current assets 4,376 4,605 4,160
Assets held for distribution - - 6,918
Total Current Assets 40,126 38,066 42,675
Goodwill and intangible assets 15,134 15,051 14,373
Property, plant and equipment 56,124 55,477 54,344
Investments in affiliates and joint ventures and other assets 22,135 21,490 19,512
Total Assets $133,519 $130,084 $130,904
LIABILITIES AND SHAREHOLDERS’ EQUITY
Short-term debt and current portion of long-term debt $3,688 $3,718 $6,716
Trade accounts payable and other 14,864 14,731 13,256
Accrued expenses and other current liabilities 8,545 8,508 8,714
Liabilities held for distribution - - 2,037
Total Current Liabilities 27,097 26,957 30,723
Long-term debt, net of current portion 24,530 22,758 19,292
Deferred tax liabilities 4,010 3,997 4,006
Other long-term liabilities 11,381 11,372 10,783
Total Liabilities 67,018 65,084 64,804
Equity attributable to the equity holders of the parent 62,615 61,161 62,430
Non–controlling interests 3,886 3,839 3,670
Total Equity 66,501 65,000 66,100
Total Liabilities and Shareholders’ Equity $133,519 $130,084 $130,904
Page 16 of 25
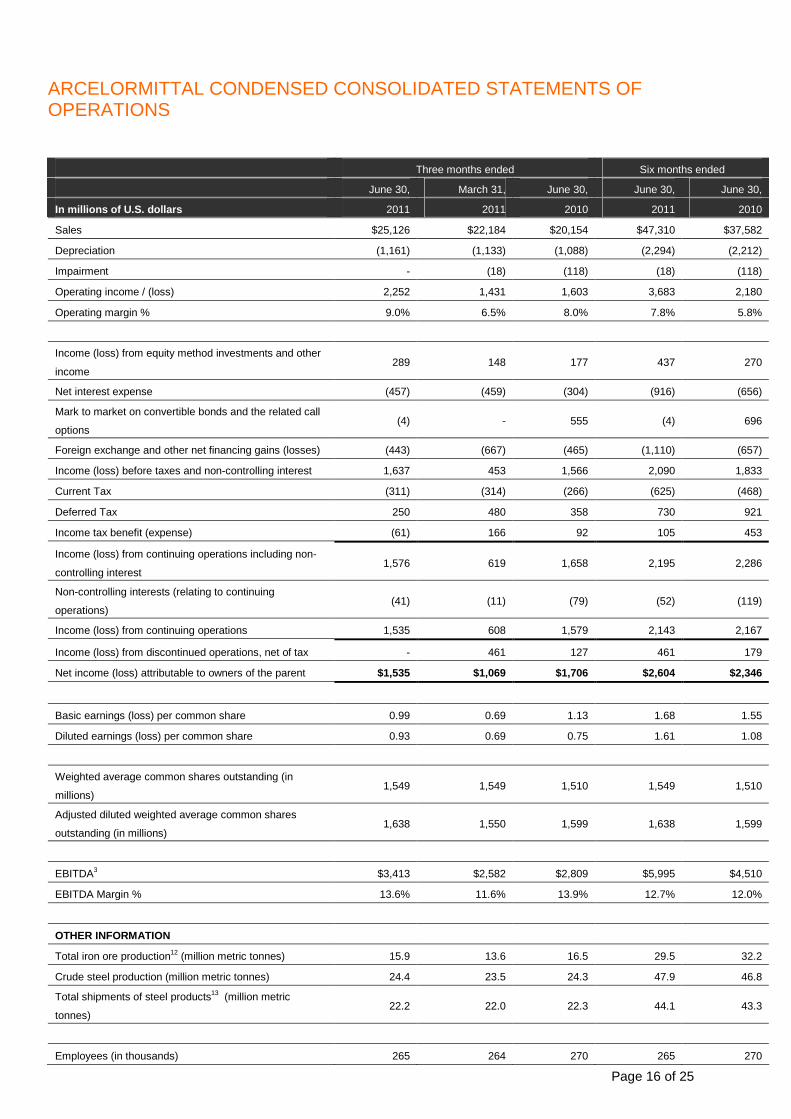
ARCELORMITTAL CONDENSED CONSOLIDATED STATEMENTS OF OPERATIONS
Three months ended Six months ended
June 30, March 31, June 30, June 30, June 30,
In millions of U.S. dollars 2011 2011 2010 2011 2010
Sales $25,126 $22,184 $20,154 $47,310 $37,582
Depreciation (1,161) (1,133) (1,088) (2,294) (2,212)
Impairment - (18) (118) (18) (118)
Operating income / (loss) 2,252 1,431 1,603 3,683 2,180
Operating margin % 9.0% 6.5% 8.0% 7.8% 5.8%
Income (loss) from equity method investments and other
income 289 148 177 437 270
Net interest expense (457) (459) (304) (916) (656)
Mark to market on convertible bonds and the related call
options (4) - 555 (4) 696
Foreign exchange and other net financing gains (losses) (443) (667) (465) (1,110) (657)
Income (loss) before taxes and non-controlling interest 1,637 453 1,566 2,090 1,833
Current Tax (311) (314) (266) (625) (468)
Deferred Tax 250 480 358 730 921
Income tax benefit (expense) (61) 166 92 105 453
Income (loss) from continuing operations including non-
controlling interest 1,576 619 1,658 2,195 2,286
Non-controlling interests (relating to continuing
operations) (41) (11) (79) (52) (119)
Income (loss) from continuing operations 1,535 608 1,579 2,143 2,167
Income (loss) from discontinued operations, net of tax - 461 127 461 179
Net income (loss) attributable to owners of the parent $1,535 $1,069 $1,706 $2,604 $2,346
Basic earnings (loss) per common share 0.99 0.69 1.13 1.68 1.55
Diluted earnings (loss) per common share 0.93 0.69 0.75 1.61 1.08
Weighted average common shares outstanding (in
millions) 1,549 1,549 1,510 1,549 1,510
Adjusted diluted weighted average common shares
outstanding (in millions) 1,638 1,550 1,599 1,638 1,599
EBITDA3 $3,413 $2,582 $2,809 $5,995 $4,510
EBITDA Margin % 13.6% 11.6% 13.9% 12.7% 12.0%
OTHER INFORMATION
Total iron ore production12 (million metric tonnes) 15.9 13.6 16.5 29.5 32.2
Crude steel production (million metric tonnes) 24.4 23.5 24.3 47.9 46.8
Total shipments of steel products13 (million metric
tonnes) 22.2 22.0 22.3 44.1 43.3
Employees (in thousands) 265 264 270 265 270
Page 17 of 25
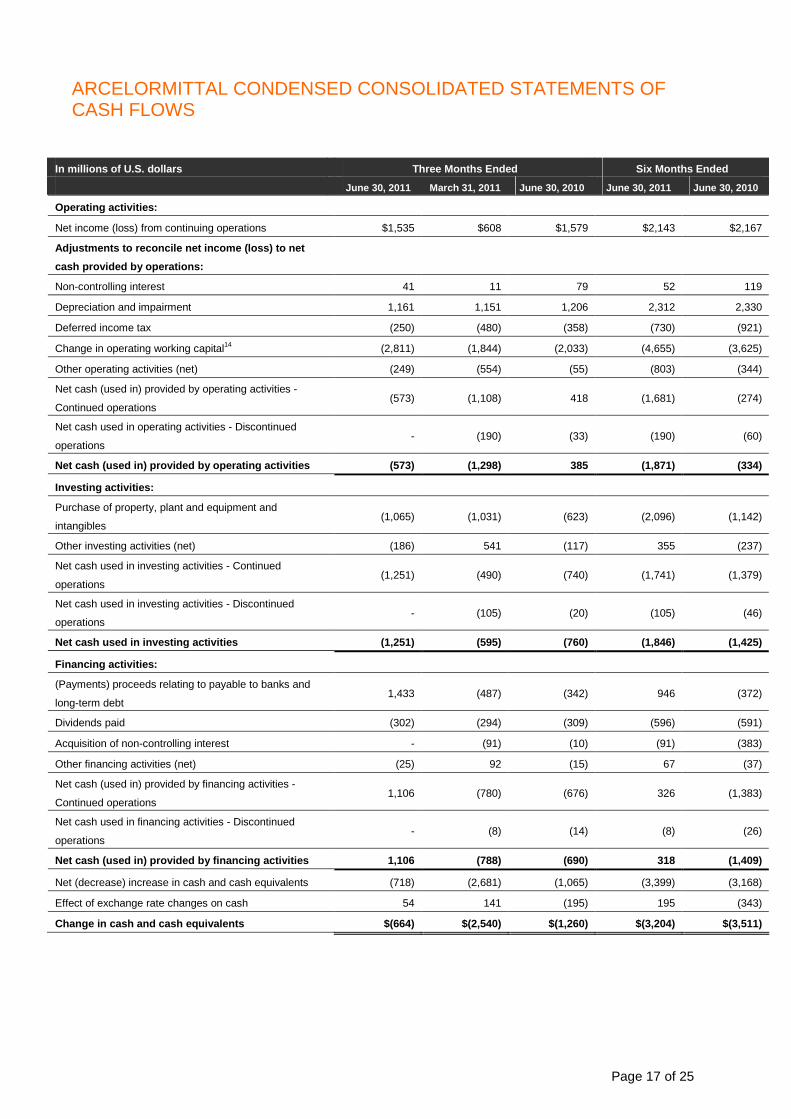
ARCELORMITTAL CONDENSED CONSOLIDATED STATEMENTS OF CASH FLOWS
In millions of U.S. dollars Three Months Ended Six Months Ended
June 30, 2011 March 31, 2011 June 30, 2010 June 30, 2011 June 30, 2010
Operating activities:
Net income (loss) from continuing operations $1,535 $608 $1,579 $2,143 $2,167
Adjustments to reconcile net income (loss) to net
cash provided by operations:
Non-controlling interest 41 11 79 52 119
Depreciation and impairment 1,161 1,151 1,206 2,312 2,330
Deferred income tax (250) (480) (358) (730) (921)
Change in operating working capital14 (2,811) (1,844) (2,033) (4,655) (3,625)
Other operating activities (net) (249) (554) (55) (803) (344)
Net cash (used in) provided by operating activities -
Continued operations (573) (1,108) 418 (1,681) (274)
Net cash used in operating activities - Discontinued
operations - (190) (33) (190) (60)
Net cash (used in) provided by operating activities (573) (1,298) 385 (1,871) (334)
Investing activities:
Purchase of property, plant and equipment and
intangibles (1,065) (1,031) (623) (2,096) (1,142)
Other investing activities (net) (186) 541 (117) 355 (237)
Net cash used in investing activities - Continued
operations (1,251) (490) (740) (1,741) (1,379)
Net cash used in investing activities - Discontinued
operations - (105) (20) (105) (46)
Net cash used in investing activities (1,251) (595) (760) (1,846) (1,425)
Financing activities:
(Payments) proceeds relating to payable to banks and
long-term debt 1,433 (487) (342) 946 (372)
Dividends paid (302) (294) (309) (596) (591)
Acquisition of non-controlling interest - (91) (10) (91) (383)
Other financing activities (net) (25) 92 (15) 67 (37)
Net cash (used in) provided by financing activities -
Continued operations 1,106 (780) (676) 326 (1,383)
Net cash used in financing activities - Discontinued
operations - (8) (14) (8) (26)
Net cash (used in) provided by financing activities 1,106 (788) (690) 318 (1,409)
Net (decrease) increase in cash and cash equivalents (718) (2,681) (1,065) (3,399) (3,168)
Effect of exchange rate changes on cash 54 141 (195) 195 (343)
Change in cash and cash equivalents $(664) $(2,540) $(1,260) $(3,204) $(3,511)
Page 18 of 25
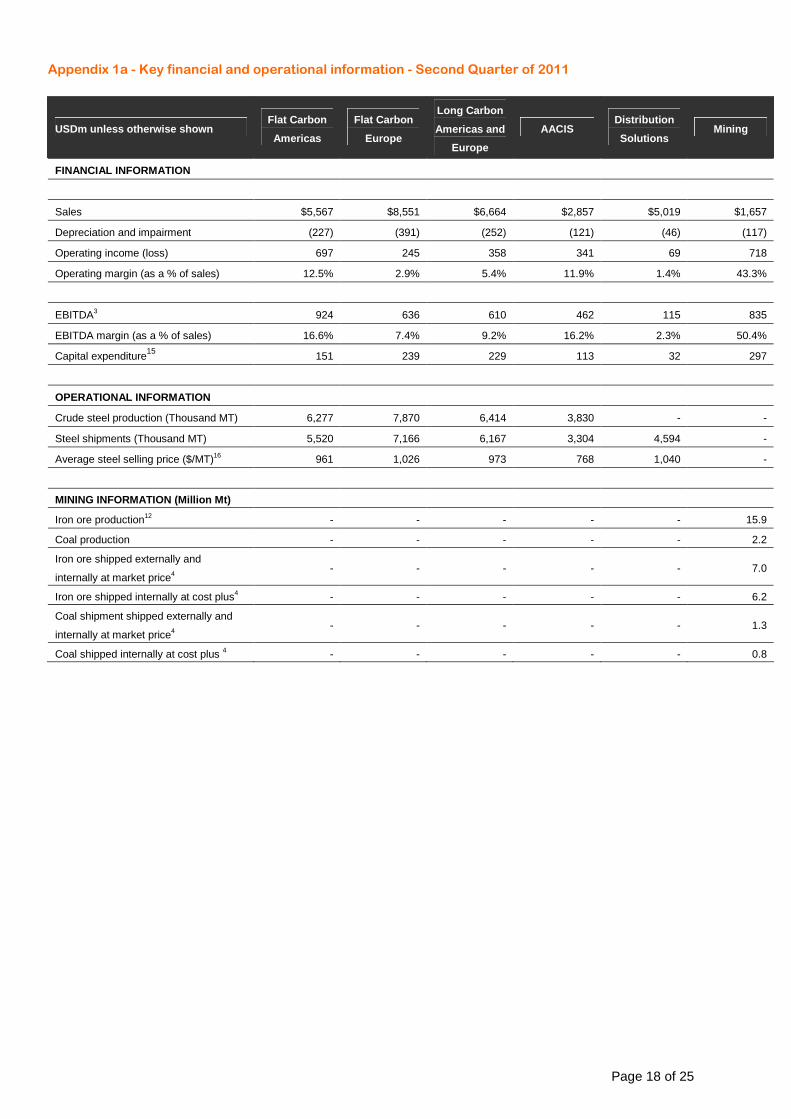
Appendix 1a - Key financial and operational information - Second Quarter of 2011
USDm unless otherwise shown Flat Carbon
Americas
Flat Carbon
Europe
Long Carbon
Americas and
Europe
AACIS Distribution
Solutions Mining
FINANCIAL INFORMATION
Sales $5,567 $8,551 $6,664 $2,857 $5,019 $1,657
Depreciation and impairment (227) (391) (252) (121) (46) (117)
Operating income (loss) 697 245 358 341 69 718
Operating margin (as a % of sales) 12.5% 2.9% 5.4% 11.9% 1.4% 43.3%
EBITDA3 924 636 610 462 115 835
EBITDA margin (as a % of sales) 16.6% 7.4% 9.2% 16.2% 2.3% 50.4%
Capital expenditure15 151 239 229 113 32 297
OPERATIONAL INFORMATION
Crude steel production (Thousand MT) 6,277 7,870 6,414 3,830 - -
Steel shipments (Thousand MT) 5,520 7,166 6,167 3,304 4,594 -
Average steel selling price ($/MT)16 961 1,026 973 768 1,040 -
MINING INFORMATION (Million Mt)
Iron ore production12 - - - - - 15.9
Coal production - - - - - 2.2
Iron ore shipped externally and
internally at market price4 - - - - - 7.0
Iron ore shipped internally at cost plus4 - - - - - 6.2
Coal shipment shipped externally and
internally at market price4 - - - - - 1.3
Coal shipped internally at cost plus 4 - - - - - 0.8
Page 19 of 25
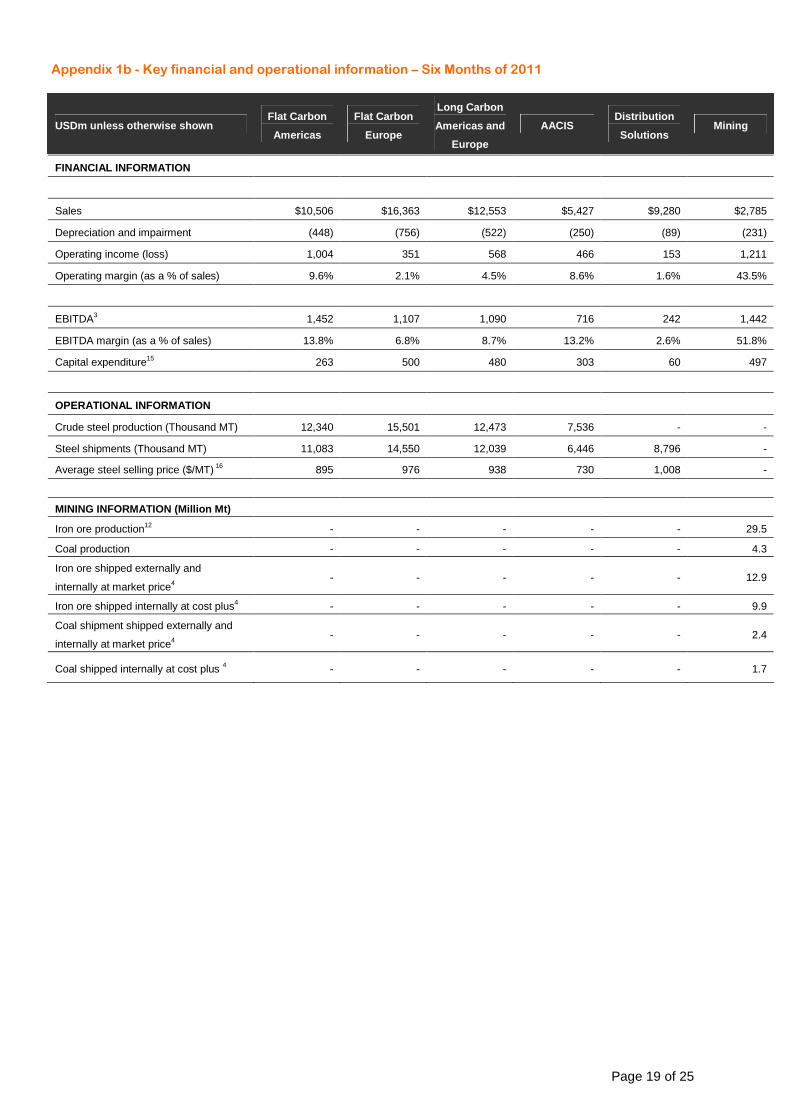
Appendix 1b - Key financial and operational information – Six Months of 2011
USDm unless otherwise shown Flat Carbon
Americas
Flat Carbon
Europe
Long Carbon
Americas and
Europe
AACIS Distribution
Solutions Mining
FINANCIAL INFORMATION
Sales $10,506 $16,363 $12,553 $5,427 $9,280 $2,785
Depreciation and impairment (448) (756) (522) (250) (89) (231)
Operating income (loss) 1,004 351 568 466 153 1,211
Operating margin (as a % of sales) 9.6% 2.1% 4.5% 8.6% 1.6% 43.5%
EBITDA3 1,452 1,107 1,090 716 242 1,442
EBITDA margin (as a % of sales) 13.8% 6.8% 8.7% 13.2% 2.6% 51.8%
Capital expenditure15 263 500 480 303 60 497
OPERATIONAL INFORMATION
Crude steel production (Thousand MT) 12,340 15,501 12,473 7,536 - -
Steel shipments (Thousand MT) 11,083 14,550 12,039 6,446 8,796 -
Average steel selling price ($/MT) 16 895 976 938 730 1,008 -
MINING INFORMATION (Million Mt)
Iron ore production12 - - - - - 29.5
Coal production - - - - - 4.3
Iron ore shipped externally and
internally at market price4 - - - - - 12.9
Iron ore shipped internally at cost plus4 - - - - - 9.9
Coal shipment shipped externally and
internally at market price4 - - - - - 2.4
Coal shipped internally at cost plus 4 - - - - - 1.7
Page 20 of 25
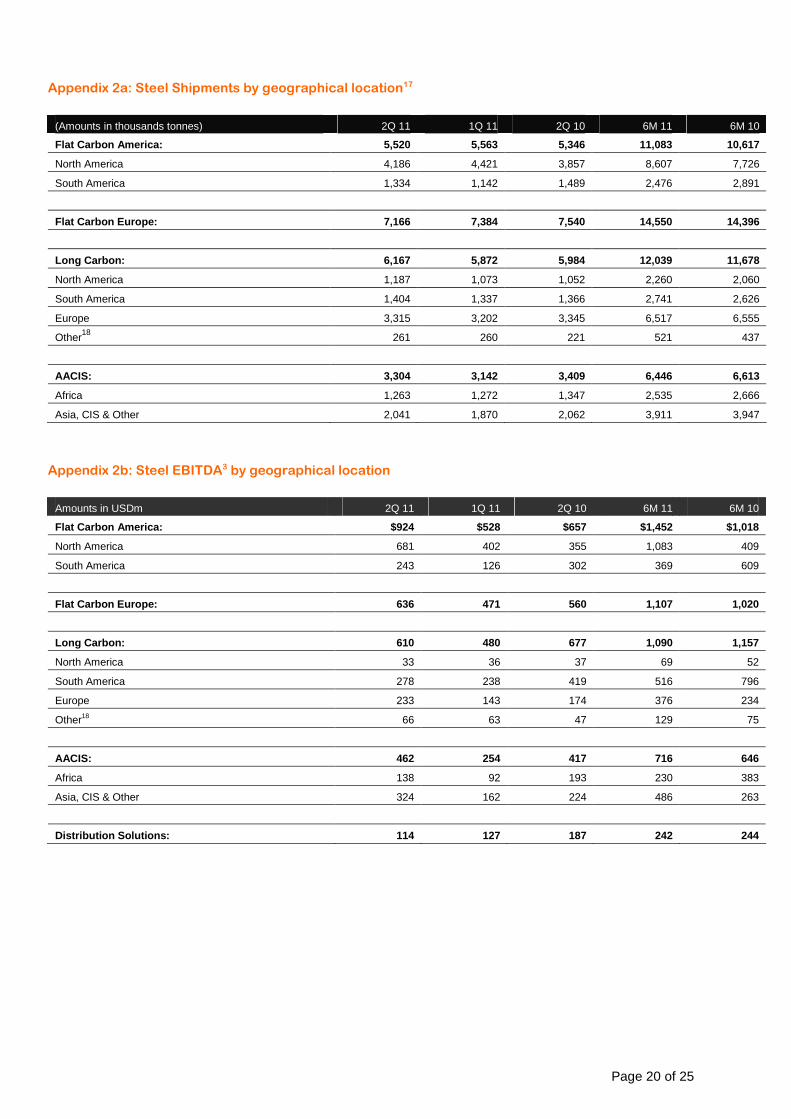
Appendix 2a: Steel Shipments by geographical location17
(Amounts in thousands tonnes) 2Q 11 1Q 11 2Q 10 6M 11 6M 10
Flat Carbon America: 5,520 5,563 5,346 11,083 10,617
North America 4,186 4,421 3,857 8,607 7,726
South America 1,334 1,142 1,489 2,476 2,891
Flat Carbon Europe: 7,166 7,384 7,540 14,550 14,396
Long Carbon: 6,167 5,872 5,984 12,039 11,678
North America 1,187 1,073 1,052 2,260 2,060
South America 1,404 1,337 1,366 2,741 2,626
Europe 3,315 3,202 3,345 6,517 6,555
Other18 261 260 221 521 437
AACIS: 3,304 3,142 3,409 6,446 6,613
Africa 1,263 1,272 1,347 2,535 2,666
Asia, CIS & Other 2,041 1,870 2,062 3,911 3,947
Appendix 2b: Steel EBITDA3 by geographical location
Amounts in USDm 2Q 11 1Q 11 2Q 10 6M 11 6M 10
Flat Carbon America: $924 $528 $657 $1,452 $1,018
North America 681 402 355 1,083 409
South America 243 126 302 369 609
Flat Carbon Europe: 636 471 560 1,107 1,020
Long Carbon: 610 480 677 1,090 1,157
North America 33 36 37 69 52
South America 278 238 419 516 796
Europe 233 143 174 376 234
Other18 66 63 47 129 75
AACIS: 462 254 417 716 646
Africa 138 92 193 230 383
Asia, CIS & Other 324 162 224 486 263
Distribution Solutions: 114 127 187 242 244
Page 21 of 25
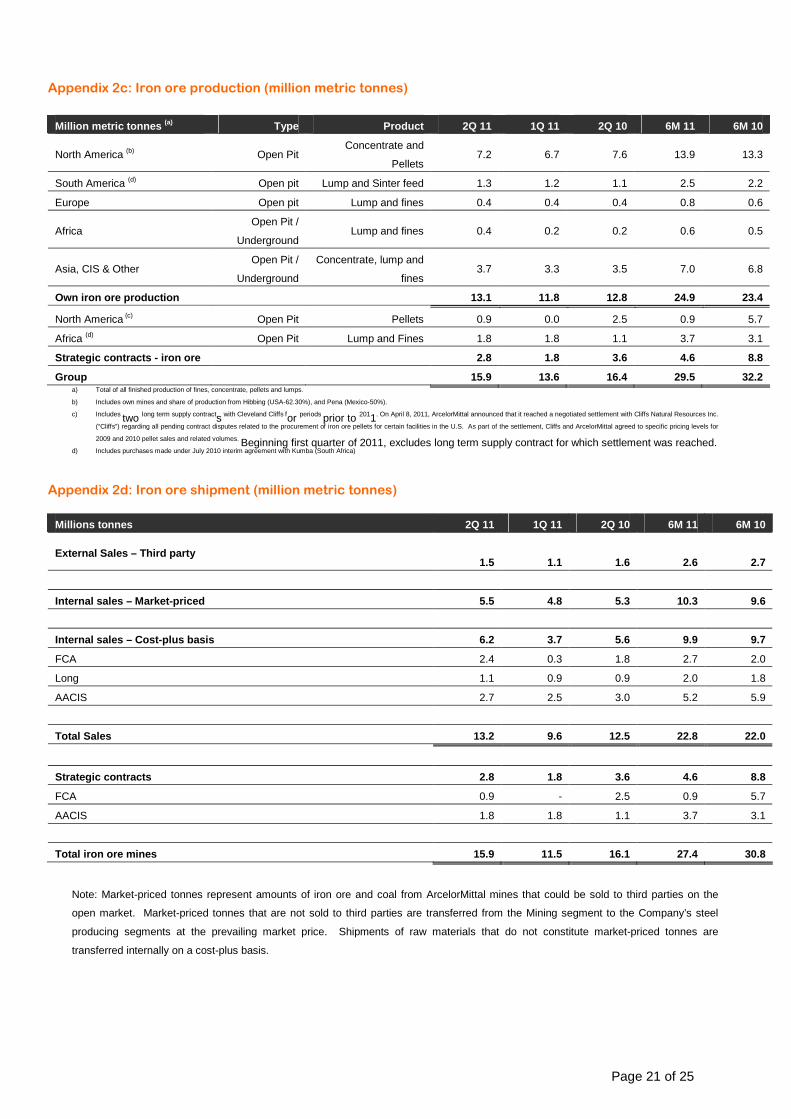
Appendix 2c: Iron ore production (million metric tonnes)
Million metric tonnes (a) Type Product 2Q 11 1Q 11 2Q 10 6M 11 6M 10
North America (b) Open Pit Concentrate and
Pellets 7.2 6.7 7.6 13.9 13.3
South America (d) Open pit Lump and Sinter feed 1.3 1.2 1.1 2.5 2.2
Europe Open pit Lump and fines 0.4 0.4 0.4 0.8 0.6
Africa Open Pit /
Underground Lump and fines 0.4 0.2 0.2 0.6 0.5
Asia, CIS & Other Open Pit /
Underground
Concentrate, lump and
fines 3.7 3.3 3.5 7.0 6.8
Own iron ore production 13.1 11.8 12.8 24.9 23.4
North America (c) Open Pit Pellets 0.9 0.0 2.5 0.9 5.7
Africa (d) Open Pit Lump and Fines 1.8 1.8 1.1 3.7 3.1
Strategic contracts - iron ore 2.8 1.8 3.6 4.6 8.8
Group 15.9 13.6 16.4 29.5 32.2 a) Total of all finished production of fines, concentrate, pellets and lumps.
b) Includes own mines and share of production from Hibbing (USA-62.30%), and Pena (Mexico-50%).
c) Includes two long term supply contracts with Cleveland Cliffs for periods prior to 2011. On April 8, 2011, ArcelorMittal announced that it reached a negotiated settlement with Cliffs Natural Resources Inc.
(“Cliffs”) regarding all pending contract disputes related to the procurement of iron ore pellets for certain facilities in the U.S. As part of the settlement, Cliffs and ArcelorMittal agreed to specific pricing levels for
2009 and 2010 pellet sales and related volumes. Beginning first quarter of 2011, excludes long term supply contract for which settlement was reached. d) Includes purchases made under July 2010 interim agreement with Kumba (South Africa)
Appendix 2d: Iron ore shipment (million metric tonnes)
Millions tonnes 2Q 11 1Q 11 2Q 10 6M 11 6M 10
External Sales – Third party
1.5
1.1
1.6
2.6
2.7
Internal sales – Market-priced 5.5 4.8 5.3 10.3 9.6
Internal sales – Cost-plus basis 6.2 3.7 5.6 9.9 9.7
FCA 2.4 0.3 1.8 2.7 2.0
Long 1.1 0.9 0.9 2.0 1.8
AACIS 2.7 2.5 3.0 5.2 5.9
Total Sales 13.2 9.6 12.5 22.8 22.0
Strategic contracts 2.8 1.8 3.6 4.6 8.8
FCA 0.9 - 2.5 0.9 5.7
AACIS 1.8 1.8 1.1 3.7 3.1
Total iron ore mines 15.9 11.5 16.1 27.4 30.8
Note: Market-priced tonnes represent amounts of iron ore and coal from ArcelorMittal mines that could be sold to third parties on the
open market. Market-priced tonnes that are not sold to third parties are transferred from the Mining segment to the Company’s steel
producing segments at the prevailing market price. Shipments of raw materials that do not constitute market-priced tonnes are
transferred internally on a cost-plus basis.
Page 22 of 25
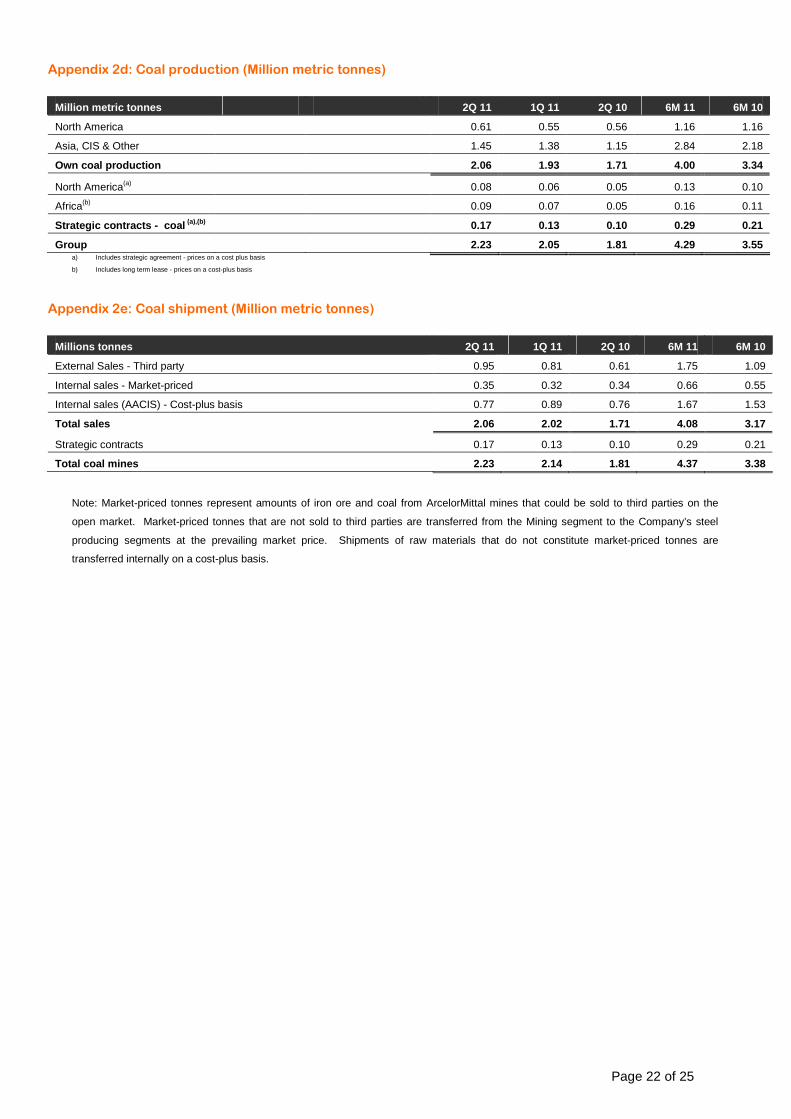
Appendix 2d: Coal production (Million metric tonnes)
Million metric tonnes 2Q 11 1Q 11 2Q 10 6M 11 6M 10
North America 0.61 0.55 0.56 1.16 1.16
Asia, CIS & Other 1.45 1.38 1.15 2.84 2.18
Own coal production 2.06 1.93 1.71 4.00 3.34
North America(a) 0.08 0.06 0.05 0.13 0.10
Africa(b) 0.09 0.07 0.05 0.16 0.11
Strategic contracts - coal (a),(b) 0.17 0.13 0.10 0.29 0.21
Group 2.23 2.05 1.81 4.29 3.55 a) Includes strategic agreement - prices on a cost plus basis
b) Includes long term lease - prices on a cost-plus basis
Appendix 2e: Coal shipment (Million metric tonnes)
Millions tonnes 2Q 11 1Q 11 2Q 10 6M 11 6M 10
External Sales - Third party 0.95 0.81 0.61 1.75 1.09
Internal sales - Market-priced 0.35 0.32 0.34 0.66 0.55
Internal sales (AACIS) - Cost-plus basis 0.77 0.89 0.76 1.67 1.53
Total sales 2.06 2.02 1.71 4.08 3.17
Strategic contracts 0.17 0.13 0.10 0.29 0.21
Total coal mines 2.23 2.14 1.81 4.37 3.38
Note: Market-priced tonnes represent amounts of iron ore and coal from ArcelorMittal mines that could be sold to third parties on the
open market. Market-priced tonnes that are not sold to third parties are transferred from the Mining segment to the Company’s steel
producing segments at the prevailing market price. Shipments of raw materials that do not constitute market-priced tonnes are
transferred internally on a cost-plus basis.
Page 23 of 25
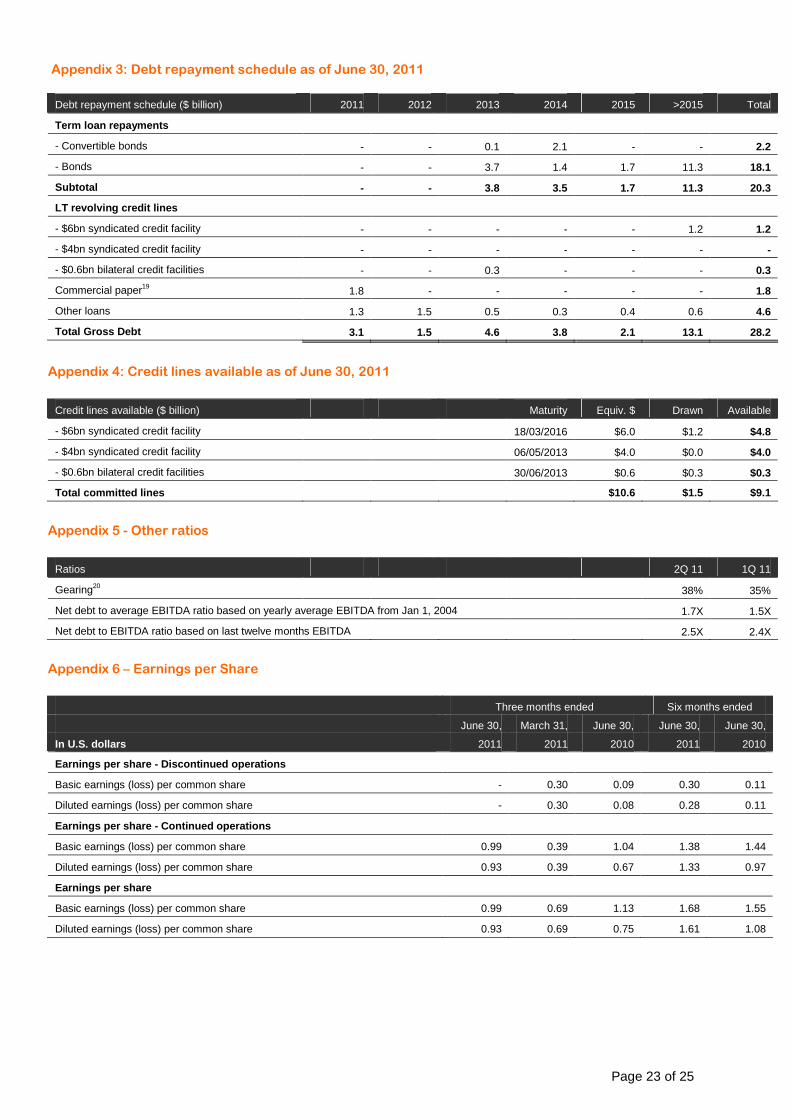
Appendix 3: Debt repayment schedule as of June 30, 2011
Debt repayment schedule ($ billion) 2011 2012 2013 2014 2015 >2015 Total
Term loan repayments
- Convertible bonds - - 0.1 2.1 - - 2.2
- Bonds - - 3.7 1.4 1.7 11.3 18.1
Subtotal - - 3.8 3.5 1.7 11.3 20.3
LT revolving credit lines
- $6bn syndicated credit facility - - - - - 1.2 1.2
- $4bn syndicated credit facility - - - - - - -
- $0.6bn bilateral credit facilities - - 0.3 - - - 0.3
Commercial paper19 1.8 - - - - - 1.8
Other loans 1.3 1.5 0.5 0.3 0.4 0.6 4.6
Total Gross Debt 3.1 1.5 4.6 3.8 2.1 13.1 28.2
Appendix 4: Credit lines available as of June 30, 2011
Credit lines available ($ billion) Maturity Equiv. $ Drawn Available
- $6bn syndicated credit facility 18/03/2016 $6.0 $1.2 $4.8
- $4bn syndicated credit facility 06/05/2013 $4.0 $0.0 $4.0
- $0.6bn bilateral credit facilities 30/06/2013 $0.6 $0.3 $0.3
Total committed lines $10.6 $1.5 $9.1
Appendix 5 - Other ratios
Ratios 2Q 11 1Q 11
Gearing20 38% 35%
Net debt to average EBITDA ratio based on yearly average EBITDA from Jan 1, 2004 1.7X 1.5X
Net debt to EBITDA ratio based on last twelve months EBITDA 2.5X 2.4X
Appendix 6 – Earnings per Share
Three months ended Six months ended
June 30, March 31, June 30, June 30, June 30,
In U.S. dollars 2011 2011 2010 2011 2010
Earnings per share - Discontinued operations
Basic earnings (loss) per common share - 0.30 0.09 0.30 0.11
Diluted earnings (loss) per common share - 0.30 0.08 0.28 0.11
Earnings per share - Continued operations
Basic earnings (loss) per common share 0.99 0.39 1.04 1.38 1.44
Diluted earnings (loss) per common share 0.93 0.39 0.67 1.33 0.97
Earnings per share
Basic earnings (loss) per common share 0.99 0.69 1.13 1.68 1.55
Diluted earnings (loss) per common share 0.93 0.69 0.75 1.61 1.08
Page 24 of 25
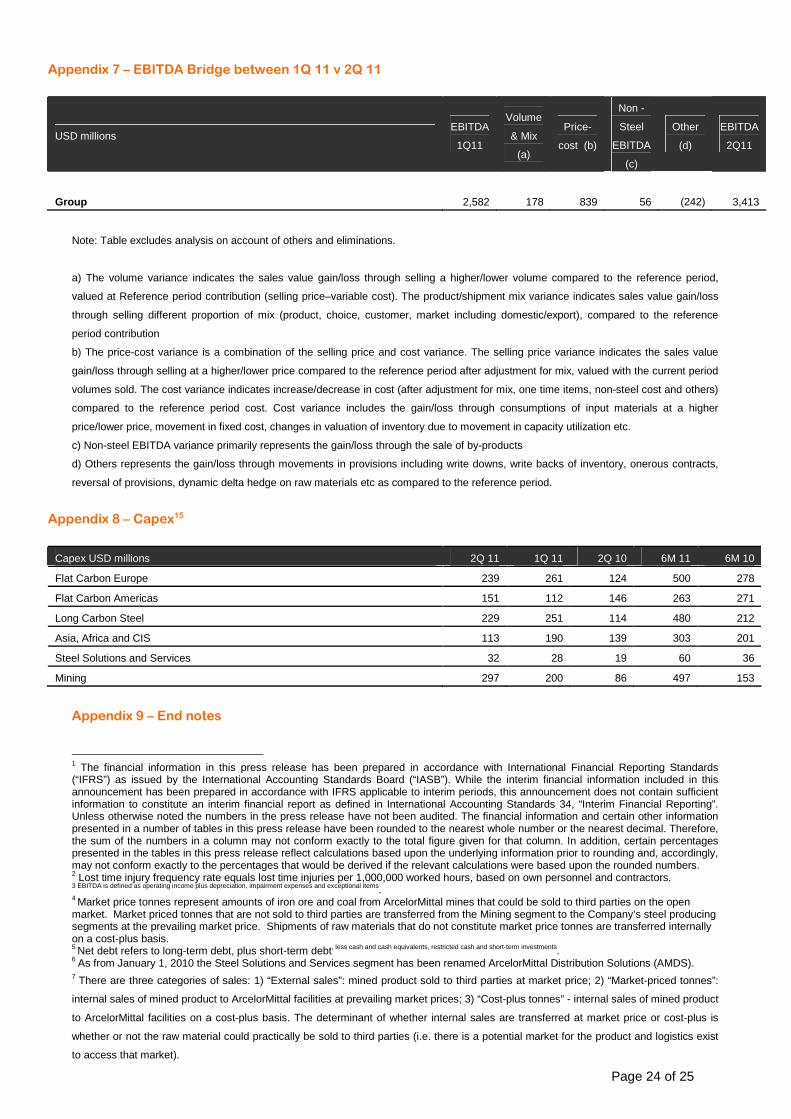
Appendix 7 – EBITDA Bridge between 1Q 11 v 2Q 11
USD millions EBITDA
1Q11
Volume
& Mix
(a)
Price-
cost (b)
Non -
Steel
EBITDA
(c)
Other
(d)
EBITDA
2Q11
Group 2,582 178 839 56
(242) 3,413
Note: Table excludes analysis on account of others and eliminations.
a) The volume variance indicates the sales value gain/loss through selling a higher/lower volume compared to the reference period,
valued at Reference period contribution (selling price–variable cost). The product/shipment mix variance indicates sales value gain/loss
through selling different proportion of mix (product, choice, customer, market including domestic/export), compared to the reference
period contribution
b) The price-cost variance is a combination of the selling price and cost variance. The selling price variance indicates the sales value
gain/loss through selling at a higher/lower price compared to the reference period after adjustment for mix, valued with the current period
volumes sold. The cost variance indicates increase/decrease in cost (after adjustment for mix, one time items, non-steel cost and others)
compared to the reference period cost. Cost variance includes the gain/loss through consumptions of input materials at a higher
price/lower price, movement in fixed cost, changes in valuation of inventory due to movement in capacity utilization etc.
c) Non-steel EBITDA variance primarily represents the gain/loss through the sale of by-products
d) Others represents the gain/loss through movements in provisions including write downs, write backs of inventory, onerous contracts,
reversal of provisions, dynamic delta hedge on raw materials etc as compared to the reference period.
Appendix 8 – Capex15
Capex USD millions 2Q 11 1Q 11 2Q 10 6M 11 6M 10
Flat Carbon Europe 239 261 124 500 278
Flat Carbon Americas 151 112 146 263 271
Long Carbon Steel 229 251 114 480 212
Asia, Africa and CIS 113 190 139 303 201
Steel Solutions and Services 32 28 19 60 36
Mining 297 200 86 497 153
Appendix 9 – End notes 1 The financial information in this press release has been prepared in accordance with International Financial Reporting Standards (“IFRS”) as issued by the International Accounting Standards Board (“IASB”). While the interim financial information included in this announcement has been prepared in accordance with IFRS applicable to interim periods, this announcement does not contain sufficient information to constitute an interim financial report as defined in International Accounting Standards 34, “Interim Financial Reporting”. Unless otherwise noted the numbers in the press release have not been audited. The financial information and certain other information presented in a number of tables in this press release have been rounded to the nearest whole number or the nearest decimal. Therefore, the sum of the numbers in a column may not conform exactly to the total figure given for that column. In addition, certain percentages presented in the tables in this press release reflect calculations based upon the underlying information prior to rounding and, accordingly, may not conform exactly to the percentages that would be derived if the relevant calculations were based upon the rounded numbers. 2 Lost time injury frequency rate equals lost time injuries per 1,000,000 worked hours, based on own personnel and contractors. 3 EBITDA is defined as operating income plus depreciation, impairment expenses and exceptional items. 4 Market price tonnes represent amounts of iron ore and coal from ArcelorMittal mines that could be sold to third parties on the open market. Market priced tonnes that are not sold to third parties are transferred from the Mining segment to the Company’s steel producing segments at the prevailing market price. Shipments of raw materials that do not constitute market price tonnes are transferred internally on a cost-plus basis. 5 Net debt refers to long-term debt, plus short-term debt, less cash and cash equivalents, restricted cash and short-term investments. 6
As from January 1, 2010 the Steel Solutions and Services segment has been renamed ArcelorMittal Distribution Solutions (AMDS). 7
There are three categories of sales: 1) “External sales”: mined product sold to third parties at market price; 2) “Market-priced tonnes”:
internal sales of mined product to ArcelorMittal facilities at prevailing market prices; 3) “Cost-plus tonnes” - internal sales of mined product
to ArcelorMittal facilities on a cost-plus basis. The determinant of whether internal sales are transferred at market price or cost-plus is
whether or not the raw material could practically be sold to third parties (i.e. there is a potential market for the product and logistics exist
to access that market).
Page 25 of 25
8 Rotation days are defined as days of accounts receivable plus days of inventory minus days of accounts payable. Days of accounts payable and inventory are a function of cost of goods sold. Days of accounts receivable are a function of sales. 9 Includes back-up lines for the commercial paper program of approximately $2.9 billion (€2 billion). 10 A$ refers to Australian Dollar 11 In accordance with IFRS the Company has adjusted the 2009 financial information retrospectively for the finalization in 2010 of the allocation of purchase price for certain business combinations carried out in 2009. The adjustments have been reflected in the Company’s consolidated financial statements for the year ended December 31, 2010. 12 Total of all finished production of fines, concentrate, pellets and lumps (includes share of production and strategic long-term contracts). 13 ArcelorMittal Distribution Solutions shipments are eliminated in consolidation as they primarily represent shipments originating from other ArcelorMittal operating subsidiaries.
1414 Changes in operating working capital are defined as trade accounts receivable plus inventories less trade accounts payable. 15 Capex includes the acquisition of intangible assets (such as concessions for mining and IT support). 16 Average steel selling prices are calculated as steel sales divided by steel shipments. 17 Shipments originating from a geographical location. 18 Includes Tubular products business. 19 Commercial paper is expected to continue to be rolled over in the normal course of business. 20 Gearing is defined as (A) long-term debt, plus short-term debt, less cash and cash equivalents, restricted cash and short-term investments, divided by (B) total equity.