Embed Size (px)
Citation preview
Endogenous versus exogenous fatty acid availability
affects lysosomal acidity and MHC class II expression
S. C. Schweitzer,* A. M. Reding,* H. M. Patton,* T. P. Sullivan,* C. E. Stubbs,†
E. Villalobos-Menuey,* S. A. Huber,§ and M. K. Newell1,*
Colorado University Institute of Bioenergetics,* Department of Biology,† University of Colorado, ColoradoSprings, CO; and Department of Pathology,§ University of Vermont, Burlington, VT
Abstract Although the immune system, inflammation, andcellular metabolism are linked to diseases associated withdyslipidemias, the mechanism(s) remain unclear. To deter-mine whether there is a mechanistic link between lipidavailability and inflammation/immune activation, we eval-uated macrophage cell lines incubated under conditions ofaltered exogenous and endogenous lipid availability. Lim-iting exogenous lipids results in decreased lysosomal acidityand decreased lysosomal enzymatic activity. Both lysosomalparameters are restored with the addition of oleoyl-CoA,suggesting that fatty acids play a role in the regulation oflysosomal function. Cell surface expression of major his-tocompatibility complex (MHC)-encoded molecules is alsodecreased in the absence of exogenous lipids. Additionally,we observe decreased g-interferon stimulation of cell sur-face MHC class II. Using cerulenin to limit the endogenoussynthesis of fatty acids results in decreased cell surface ex-pression of MHC class II but does not appear to alterlysosomal acidity, suggesting that lysosomal acidity is de-pendent on exogenous, but not endogenous, fatty acidavailability. Testing these conclusions in an in vivo mousemodel, we observed statistically significant, diet-dependentdifferences in lysosomal acidity and MHC class II cellsurface expression. Collectively, these data demonstratea mechanistic link between lipid availability and early eventsin the immune response.—Schweitzer, S. C., A.M.Reding,H.M. Patton, T. P. Sullivan, C. E. Stubbs, E. Villalobos-Menuey,S.A.Huber, andM.K.Newell.Endogenous versus exogenousfatty acid availability affects lysosomal acidity and MHCclass II expression. J. Lipid Res. 2006. 47: 2525–2537.
Supplementary key words diet & dyslipidemias & inflammation &majorhistocompatibility complex
Lipids are essential components of all cells. A cell’s lipidneeds are usually met by a mixture of endogenous syn-thesis, exogenous (dietary) availability, stored excess, andreuse through salvage pathways (1). Not surprisingly, de-fects in lipid metabolism are commonly accepted compo-
nents of many diseases, including heart disease (2–5),diabetes (6, 7), obesity (8, 9), lysosomal storage disorders(10–12), alcoholism (13), cancer (14–16), aging (8), auto-immune diseases (17, 18), and infectious diseases (19, 20).The diversity of these diseases has made the identificationof a mechanistic link between lipids and the pathogenesisof disease difficult (21).
Recent work suggests that the immune system (22, 23),inflammation (24), and oxidative damage (25) are keycomponents of many diseases associated with dyslipid-emias. The immune system is a complex organization ofcells, tissues, and organs serving to protect the body fromharm. Centrally important players include macrophages,lymphocytes, and the chemical mediators produced bythese cells (26). An important function of macrophagesis to engulf and degrade antigens in the endosomal/lysosomal compartment (27, 28). In the lysosome, theprocessed antigens are loaded onto major histocompati-bility complex (MHC) class II molecules and trafficked tothe cell surface, allowing T-lymphocytes to recognize andrespond to MHC class II and antigen. This recognition isthe first of two requisite steps (29, 30) leading to T-cellactivation, cytokine production, and cytokine release. Thecytokines released by activated T-lymphocytes, macro-phages, and other immune cells are important mediatorsof inflammation (31).
Because lysosomes play an important role in fattyacid storage and in the early cellular events of antigenprocessing and presentation (32, 33), we hypothesizedthat the lysosome represents a “common denominator”linking lipids (particularly fatty acids) to immunologicalevents. We reasoned that altering the availability of ex-ogenous and/or endogenous lipids would affect antigenprocessing and/or presentation and potentially the extentand nature of T-lymphocyte activation. Our rationale issupported by the established influence of diet on diseasesassociated with dyslipidemias, inflammation, and the im-mune response (34–36).
Manuscript received 18 January 2006 and in revised form 24 July 2006 andin re-revised form 16 August 2006.
Published, JLR Papers in Press, August 16, 2006.DOI 10.1194/jlr.M600329-JLR200
1To whom correspondence should be addressed.e-mail: [email protected]
Copyright D 2006 by the American Society for Biochemistry and Molecular Biology, Inc.
This article is available online at http://www.jlr.org Journal of Lipid Research Volume 47, 2006 2525
by guest, on April 4, 2019
ww
w.jlr.org
Dow
nloaded from
To explore our hypothesis, we chose to use both anin vitro cell culture model and a long-term (16 week) invivo mouse study. Results from our in vitro model, in whichwe limit either exogenous availability or the endogenoussynthesis of fatty acids, are consistent with the interpre-tation that fatty acids are important in both maintaininglysosomal acidity and determining the level of expressionof cell surface MHC class II molecules. Our in vivo dietarymodel suggests that dietary lipids influence lysosomalacidity and also supports a diet-dependent effect on thelevel of cell surface MHC class II expression.
METHODS
Cell culture and adaptation to low lipid conditions
Cell lines were maintained in RPMI medium supplementedwith 5% FBS, 2 mM L-glutamine, 10 mM HEPES buffer, 1025 M2-mercaptoethanol, 1 mM sodium pyruvate, 0.04 mg/ml genta-mycin, and penicillin/streptomycin (500 U/ml and 500 mg/ml,respectively) (all reagents were from Gibco BRL). Cell suspen-sions were incubated at 378C under 5% CO2 humidifiedatmospheric conditions. To adapt cells to growth in low-lipidconditions, log growth cells (0.2–0.8 3 106 cells/ml) were grownin medium containing increasing concentrations of delipidizedbovine calf serum (Pel-Freez Biologicals) as a replacement forFBS. A second source of low-lipid additive, Completely ProcessedSerum Replacement-1 (Sigma), was also used to establish low-lipid conditions and gave similar results (data not shown). Low-lipid cell lines derived from HL60 cells included 60-7/low lipidand 60-15/low lipid. Low-lipid cell lines derived from U-937 cellsincluded U-15/low lipid and U-16/low lipid.
Flow cytometry
For cytometric analysis, stained cells were washed and resus-pended in 0.5 ml of PBS containing 2.5% FBS (PBS/FBS). Fluo-rescence was detected on a Coulter Excel flow cytometer, andunless specified otherwise, results are expressed as the geometricmean fluorescence of stained samples minus unstained controlsor isotype. Flow cytometry data were analyzed using Cell Quest(Becton Dickinson) or FlowJo software. Percentage cell deathwas calculated based on forward versus side scatter profiles ofcytometrically gated populations of live and dead cells. Cell sizewas determined by analysis of the forward scatter profiles ofgated populations of live cells.
LysoSensorTM staining of acidic compartments
Lysosomal acidity was determined by staining 100 ml of loggrowth cells with LysoSensor Green DND-189 (34) (MolecularProbes) according to the manufacturer’s instructions. Briefly,100 ml of washed cells was incubated with 0.5–1.0 ml of LysoSensorreagent in the dark at 378C for 20 min. Cells were washed in PBS/FBS, and fluorescence was detected by flow cytometry.
Lysosomal glucocerebrosidase assay
The functional activity of lysosomes was determined using a flowcytometric assay for lysosomal glucocerebrosidase as described byvan Es et al. (35). Briefly, fluorescein b-D-glucopyranoside (FDGlu;Sigma) was added to 100 ml of cells (105–106 cells) to give a finalsubstrate concentration of 1.05 mM. Cells were incubated withsubstrate for 45 min at 378C. Lysosomal glucocerebrosidase ac-tivity produces a fluorescent substrate that is detected by flow
cytometry. As a control, 5–40 mM concentrations of chloroquine(Sigma) were incubated with cells for 1 h before the addition ofFDGlu substrate.
Cell surface immunofluorescence staining
Intact cells were washed and resuspended in PBS/FBS to acell density of 5–10 3 106 cells/ml. Suspensions of human cellswere blocked for nonspecific staining by incubating washed cellson ice for 25–30 min with an equal volume of 10% normal mouseserum (Sigma) diluted in PBS/FBS. Mouse cells were Fc-blockedby the addition of 1ml of anti-mouse Fcg clone 24G2 (Pharmingen)to 100 ml of washed cells, followed by incubation on ice for 15–20 min. Staining was done in microtiter plates using 100 ml ofcell suspension and FITC- or phycoerythrin (PE)-conjugated anti-bodies, according to the manufacturer’s recommended proce-dures and concentrations. The one exception was MHC class Istaining of human cells, which used 10 ml of antibody instead ofthe recommended 20 ml. Fluorescence was detected by flow cy-tometry. Fluorochrome-conjugated antibodies included mouseanti-human HLA-DR, -DP, and -DQ (Pharmingen), mouse anti-human HLA-DR (BD Diagnostics), mouse anti-human HLA-A,B,C(eBiosciences), mouse anti-mouse M5114 antibody detectingmouse I-A and I-E (BD Bioscience), mouse anti-human CD11b(Pharmingen), and mouse anti-human CD14 (Pharmingen).
Total cellular HLA-DR staining
Total cellular pools of HLA-DR were measured by permeabil-izing cells with CytopermCytofixTM (Pharmingen) using the man-ufacturer’s recommended procedure. Permeabilized humancells were blocked by incubation with 10% normal mouse serumdiluted in CytopermCytofix wash buffer and then stained withfluorochrome-conjugated antibodies. Intracellular HLA-DRwas determined by subtracting cell surface HLA-DR fluorescencedetected in intact cells from total cellular HLA-DR fluorescencedetected in permeabilized cells.
Fatty acid reconstitution assays
For the time course, low-lipid cells were incubated with andwithout 50 mM oleoyl-CoA at 378C under 5% CO2 for 24 h. Atselect time points, cells were removed from the culture, washed inPBS/FBS, and assayed with LysoSensor (described above).Reconstitution assays with specific fatty acids used log growthcultures incubated for 20–24 h in medium with and without 75–100 mM oleoyl-CoA, palmitoleoyl-CoA, palmitoyl-CoA, stearoyl-CoA, or linoleoyl-CoA (all from Sigma). Glucocerebrosidaseactivity, LysoSensor staining, and/or HLA-DR cell surface staining(described above) were done after incubation on cells treated anduntreated with fatty acids. Alternatively, studies used 100 mM oleicacid, linoleic acid, or linolenic acid with or without 0.5 mM CoA.Acylated fatty acid-CoA derivatives were diluted in sterile deion-ized water; free fatty acids were solubilized in 100% ethanol, andthe results were compared with those from an ethanol control.
Vitamin D3 treatment of cells
Vitamin D3 (Sigma) was solubilized in isopropanol. Cells wereincubated in low-lipid medium with or without 1026 M vitamin D3
for 36–38 h at 378C under 5% CO2. Cells were washed, blocked,and stained for cell surface expression of CD11b and CD14 asdescribed above.
g-Interferon stimulation of HLA-DR expression
Log growth cultures were incubated for 30 h at 378C under 5%CO2 in either FBS or low-lipid medium with or without 25 ng/ml
2526 Journal of Lipid Research Volume 47, 2006
by guest, on April 4, 2019
ww
w.jlr.org
Dow
nloaded from

g-interferon (Gibco Invitrogen). Cells were washed, blocked, andstained for both total cellular and cell surface HLA-DR as de-scribed above.
Cerulenin treatment of cells
Cerulenin (Sigma) was solubilized in 100% ethanol. For acuteresponse experiments, cell cultures were incubated in appro-priate medium containing no additive, ethanol vehicle control,or 5, 7.5, or 10 mg/ml cerulenin for 20–24 h at 378C under 5%CO2. Cells were washed, blocked, and stained as described above.U-937 cells were adapted for continuous growth in FBS mediumcontaining either 3 or 5 mg/ml cerulenin by slowly increasing theconcentration of cerulenin in the medium from 1 to 5 mg/ml.These cell lines were designated U-C3 and U-C5, respectively.
In vivo mouse study
Female, age-matched Balb/c and C57/B6 mice were fed eithera low-fat or moderately high-fat diet for 16 weeks. Each mousereceived 5 g of food per day. Consumption of food per cage wasdetermined by collecting and weighing uneaten food. Eachmouse was weighed three times during the 16 week period. Micewere monitored daily for observable effects. After the 16 weekfeeding regimen, mice were euthanized, and their spleens wereprocessed using the procedure of Leanderson and Julius (36).Splenocytes were stained with LysoSensor and the M5114 (37)antibody to mouse MHC class II I-A and I-E.
Gating of mouse splenocyte subpopulations
Cytometric analysis of LysoSensor staining was performed ona specific population of large cells based on cell size andgranularity as determined by cytometric analysis. The large cellgate likely represents macrophages and/or other probableantigen-presenting cells (26). Mouse MHC class II cell surfaceexpression was detected on MHC class II-positive large cells(likely antigen-presenting cells) or small cells (likely B-cells) asidentified by positive class II staining and forward scatter.
Statistical significance
Error bars represent SEM. Statistical significance defined byStudent’s t-test (P,0.05),wasdeterminedusingGraphPadsoftware.
RESULTS
Lysosomes are established sites for fatty acid accumu-lation (2, 32, 33, 38), and MHC class II molecules musttraffic through the acidic lysosomal/endosomal compart-ment (27, 28, 39). Thus, we reasoned that fatty acidavailability might have a direct impact on lysosomal acidityand consequent antigen processing and presentationvia MHC class II molecules. To determine the effect(s)of limiting exogenous lipids, we adapted the well-characterized human macrophage cell lines HL60 (40)and U-937 (41) for continuous growth in medium con-taining 5% delipidized bovine calf serum as a replacementfor 5% FBS (see Methods). We then compared the prop-erties of the “low-lipid cells” with those of cells grown intraditional FBS medium.
To date, nine different cell lines have been successfullyadapted for growth under low-lipid conditions. Charac-terization of newly adapted low-lipid cells reveals several
distinctive properties, including increased cell death(Fig. 1A) and an increase in cell size (Fig. 1B), as cells areexposed to increasing concentrations of delipidized bovinecalf serum. Bright-field microscopy (Fig. 1C) of HL60 cellsmaintained in FBS and low-lipid media revealed a tendencyfor low-lipid cells to clump in cell suspensions. Individualcell types differed in their ability to adapt to low-lipidconditions and with respect to their stabilized phenotypes(viability, size, and morphologic appearance) with long-term incubation in low-lipid medium.
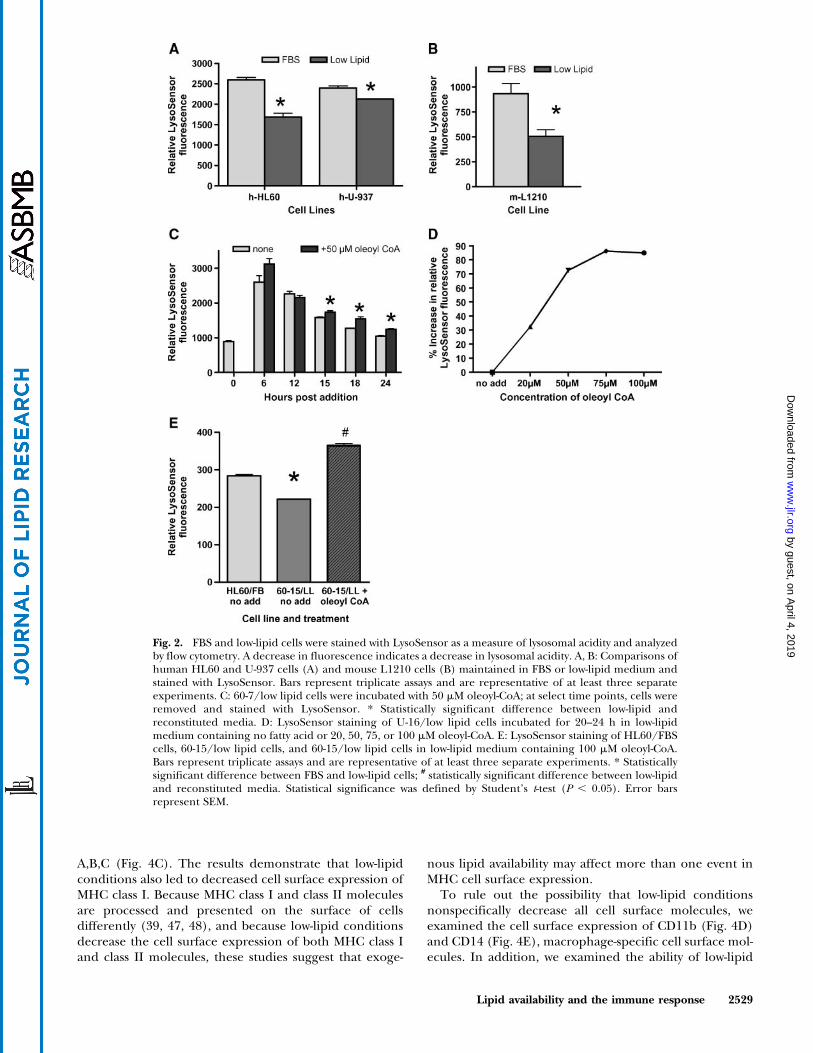
Notably, the most distinctive feature of low-lipid cells wasa decrease in lysosomal acidity. Comparison of LysoSensor(34) staining of HL60/FBS and U-937/FBS cells and theirlow-lipid counterparts revealed a decrease in LysoSensorfluorescence (Fig. 2A), and hence a decrease in lysosomalacidity, in the low-lipid cell lines. Mouse L1210 (42) cellsshowed a similar low-lipid effect (Fig. 2B). A sustained de-crease in LysoSensor staining was seen in every cell linewe adapted to low-lipid conditions and represents a stablehallmark of the low-lipid phenotype.
To determine whether we could restore lysosomalacidity by adding back lipids, we compared LysoSensorstaining of cells in low-lipid medium with staining fromcells in low-lipid medium reconstituted with a specificlipid. We chose oleic acid for the reconstitution assay be-cause fatty acids accumulate in lysosomes as a result ofcholesteryl ester hydrolysis (2, 38) and oleic acid is easilytransported into cells (1, 38, 43). Preliminary experimentsusing free oleic acid, oleic acid plus CoA, and oleoyl-CoAshowed that the CoA derivative is a more effective modifierof lysosomal acidity than free fatty acid or fatty acid plusCoA (Table 1). The addition of oleoyl-CoA to low-lipidmedium resulted in time-delayed (Fig. 2C) and dose-dependent (Fig. 2D) increases in LysoSensor staining.Subsequent reconstitution experiments were done by in-cubating low-lipid cells for 20–24 h in medium with orwithout the addition of 100 mM oleoyl-CoA (Fig. 2E).
To determine whether other fatty acids would have thesame effect on lysosomal acidity, low-lipid cells from bothHL60 and U-937 cell lines were incubated in low-lipidmedium reconstituted with 100 mM oleoyl-CoA, palmitoyl-CoA, palmitoleoyl-CoA, stearoyl-CoA, or linoleoyl-CoA.Oleoyl-CoA, palmitoleoyl-CoA, and linoleoyl-CoA consis-tently showed significant increases in LysoSensor stain-ing compared with cells in low-lipid medium with no fattyacid additive (Tables 1, 2). Notably, the addition of thesaturated fatty acids palmitoyl-CoA and stearoyl-CoA at100 mM concentrations resulted in significant cell death.Seventy percent to 80% of the cells treated with 100 mMpalmitoyl-CoA died as a result of the treatment, and.95%of cells treated with 100 mM stearoyl-CoA died. The un-saturated fatty acid derivatives, oleoyl-CoA, palmitoleoyl-CoA, and linoleoyl-CoA, did not significantly affect cellviability at 100 mM. The increases in lysosomal acidity seenin our reconstitution experiments suggest that exogenousfatty acids are involved in establishing or maintaining lyso-somal acidity.
To demonstrate that the decrease in lysosomal acidityalters enzymatic function, we used an assay for lysosomal
Lipid availability and the immune response 2527
by guest, on April 4, 2019
ww
w.jlr.org
Dow
nloaded from

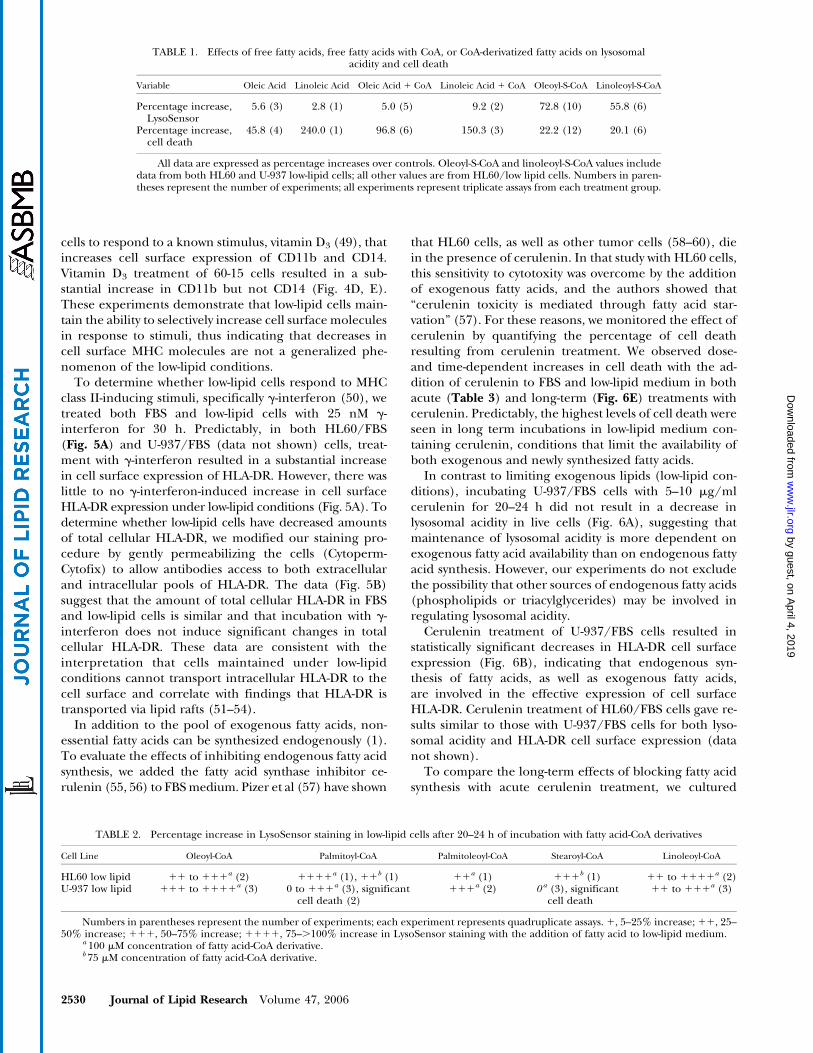
glucocerebrosidase activity (35). For this assay, cells wereincubated with 1.05 mM FDGlu at 378C for 45 min. In thepresence of active enzyme, this substrate was converted toa fluorescent product detected by flow cytometry. Experi-ments measuring both enzyme activity and lysosomalacidity in 60-15/low lipid and HL60/FBS cells showeddecreases in both fluorescent enzyme product (Fig. 3A)and LysoSensor staining (Fig. 3B). When oleoyl-CoA wasadded to low-lipid medium, staining revealed both an in-crease in LysoSensor and an increase in enzyme activity(Fig. 3A, B). As a control, enzyme activity was shown to besensitive to chloroquine (Fig. 3C), a weak base known todecrease lysosomal acidity (44).
The presentation of exogenous antigen to T-lymphocytesis a critical step in T-lymphocyte activation (27) and a rec-ognized contributor to inflammation (23, 45). Effective an-tigen presentation involves the degradation of antigen byacid hydrolases in the lysosomal/endosomal system, in-sertion of the processed antigen into MHC class II mol-ecules, and transport of peptide-loaded MHC molecules tothe cell surface of antigen-presenting cells (39, 46). Giventhe link between lysosomal acidity and MHC class II ex-pression, we used our cell culture system to determine theimpact of low lipid conditions on the level of HLA-DRexpression. We observed a decrease in HLA-DR cell surface
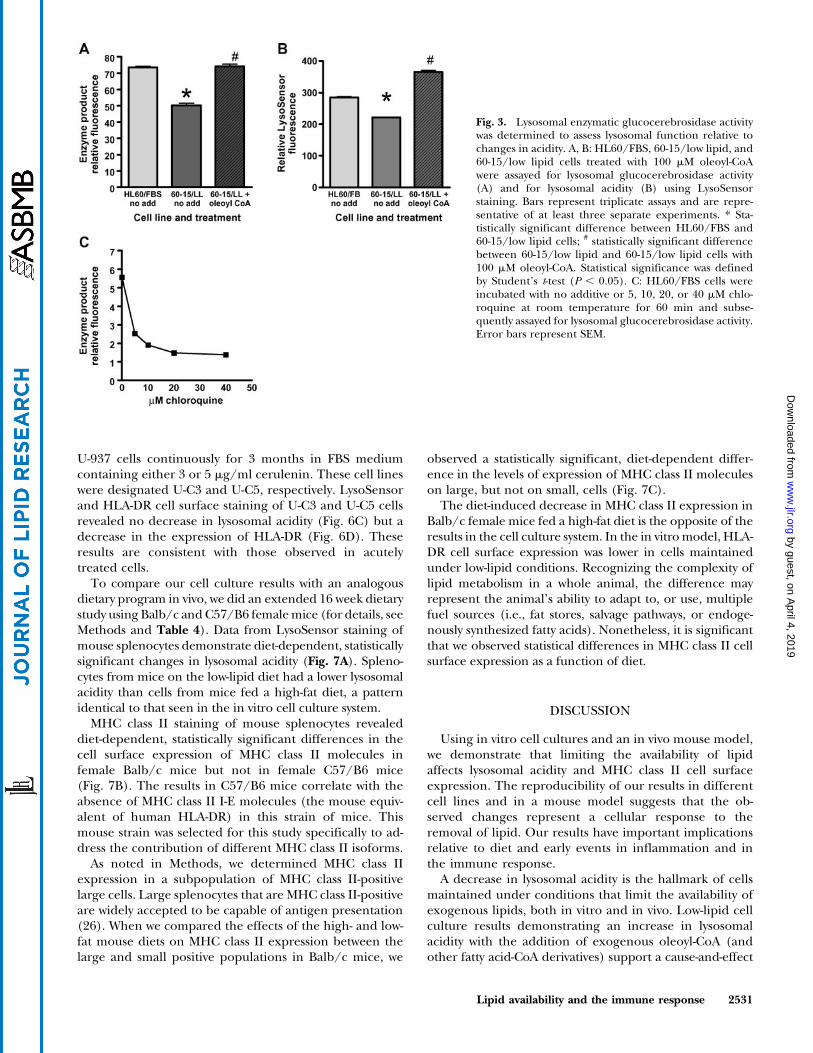
expression in human HL60 and U-937 low-lipid cell lines(Fig. 4A) and a decrease inMHC class IImolecules I-A andI-E in mouse L1210 cells adapted to low-lipid conditions(Fig. 4B). Because HLA-DR represents only one of threeMHC class II isoforms in humans, we repeated the ex-periments with an anti-HLA-DR, -DP, and -DQ antibody. Asimilar decrease in the cell surface expression of MHCclass II was seen in low-lipid cells with this antibody to allthree isoforms (data not shown).
If the observed decrease in lysosomal acidity is respon-sible for the decrease in MHC class II cell surface ex-pression, then fatty acid reconstitution experiments wouldbe expected to cause both an increase in lysosomal acidityand an increase in cell surface HLA-DR expression. Re-constitution experiments adding back 100 mM oleoyl-CoA,palmitoyl-CoA, linoleoyl-CoA, stearoyl-CoA, or palmi-toleoyl-CoA did not consistently demonstrate statisticallysignificant (P, 0.05) increases in HLA-DR cell surface ex-pression (data not shown). Our results suggest that simplyrestoring lysosomal acidity with the addition of specificfatty acids to low-lipid medium is not sufficient to restoreHLA-DR cell surface expression.
To determine whether low-lipid conditions also affectMHC class I cell surface expression, we stained FBS andlow-lipid cell lines with antibody to the combination HLA-
Fig.1. HL60 and U-937 human macrophage cells were incubated in medium containing increasingconcentrations of delipidized bovine calf serum. The effects of the low-lipid conditions on cell viability, cellsize, and cell morphology were observed. A: Percentage cell death was calculated based on forward versusside scatter profiles of cytometrically gated populations of live and dead cells. Manual cell counts usingtrypan blue gave comparable patterns. B: Cell size was determined by cytometric analysis of forward scatterprofiles from gated populations of live cells. C: Bright-field microscopy of HL60 cells maintained in me-dium containing 5% FBS or 5% delipidized bovine calf serum (low-lipid medium). Magnification, 603.Photographs were taken to illustrate cell morphology and are not normalized for absolute cell number.
2528 Journal of Lipid Research Volume 47, 2006
by guest, on April 4, 2019
ww
w.jlr.org
Dow
nloaded from
A,B,C (Fig. 4C). The results demonstrate that low-lipidconditions also led to decreased cell surface expression ofMHC class I. Because MHC class I and class II moleculesare processed and presented on the surface of cellsdifferently (39, 47, 48), and because low-lipid conditionsdecrease the cell surface expression of both MHC class Iand class II molecules, these studies suggest that exoge-
nous lipid availability may affect more than one event inMHC cell surface expression.
To rule out the possibility that low-lipid conditionsnonspecifically decrease all cell surface molecules, weexamined the cell surface expression of CD11b (Fig. 4D)and CD14 (Fig. 4E), macrophage-specific cell surface mol-ecules. In addition, we examined the ability of low-lipid
Fig. 2. FBS and low-lipid cells were stained with LysoSensor as a measure of lysosomal acidity and analyzedby flow cytometry. A decrease in fluorescence indicates a decrease in lysosomal acidity. A, B: Comparisons ofhuman HL60 and U-937 cells (A) and mouse L1210 cells (B) maintained in FBS or low-lipid medium andstained with LysoSensor. Bars represent triplicate assays and are representative of at least three separateexperiments. C: 60-7/low lipid cells were incubated with 50 mM oleoyl-CoA; at select time points, cells wereremoved and stained with LysoSensor. * Statistically significant difference between low-lipid andreconstituted media. D: LysoSensor staining of U-16/low lipid cells incubated for 20–24 h in low-lipidmedium containing no fatty acid or 20, 50, 75, or 100 mM oleoyl-CoA. E: LysoSensor staining of HL60/FBScells, 60-15/low lipid cells, and 60-15/low lipid cells in low-lipid medium containing 100 mM oleoyl-CoA.Bars represent triplicate assays and are representative of at least three separate experiments. * Statisticallysignificant difference between FBS and low-lipid cells; # statistically significant difference between low-lipidand reconstituted media. Statistical significance was defined by Student’s t-test (P , 0.05). Error barsrepresent SEM.
Lipid availability and the immune response 2529
by guest, on April 4, 2019
ww
w.jlr.org
Dow
nloaded from
cells to respond to a known stimulus, vitamin D3 (49), thatincreases cell surface expression of CD11b and CD14.Vitamin D3 treatment of 60-15 cells resulted in a sub-stantial increase in CD11b but not CD14 (Fig. 4D, E).These experiments demonstrate that low-lipid cells main-tain the ability to selectively increase cell surface moleculesin response to stimuli, thus indicating that decreases incell surface MHC molecules are not a generalized phe-nomenon of the low-lipid conditions.
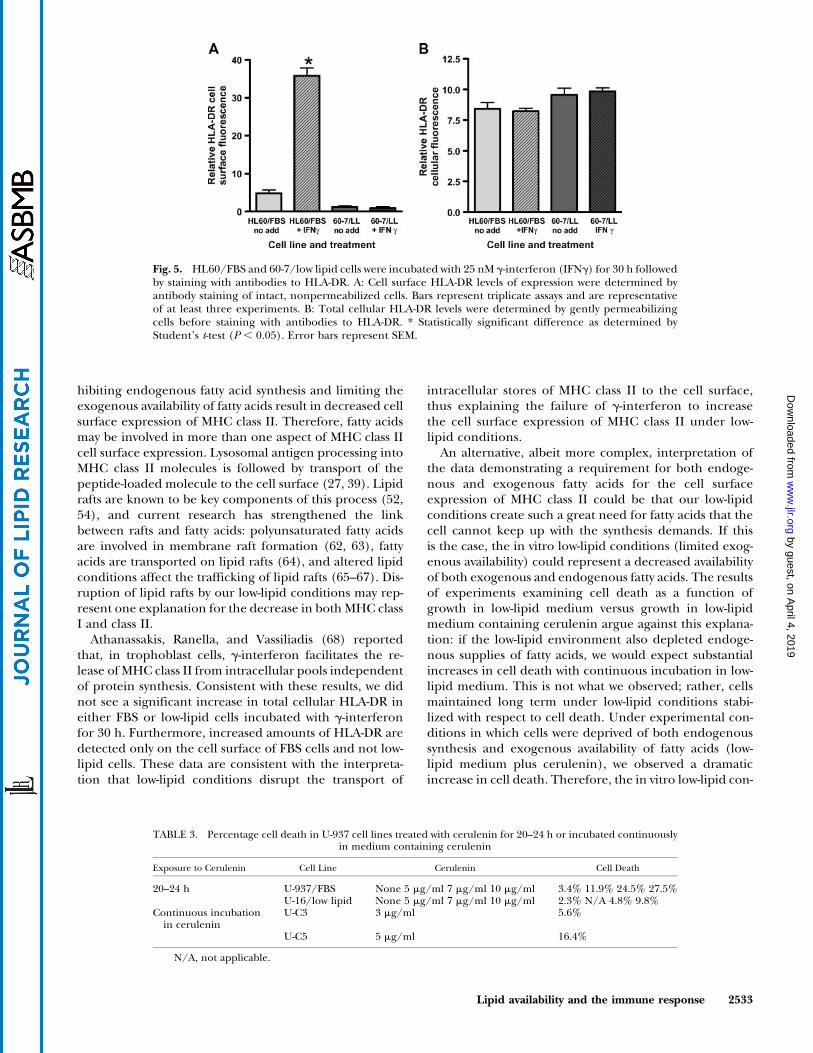
To determine whether low-lipid cells respond to MHCclass II-inducing stimuli, specifically g-interferon (50), wetreated both FBS and low-lipid cells with 25 nM g-interferon for 30 h. Predictably, in both HL60/FBS(Fig. 5A) and U-937/FBS (data not shown) cells, treat-ment with g-interferon resulted in a substantial increasein cell surface expression of HLA-DR. However, there waslittle to no g-interferon-induced increase in cell surfaceHLA-DR expression under low-lipid conditions (Fig. 5A). Todetermine whether low-lipid cells have decreased amountsof total cellular HLA-DR, we modified our staining pro-cedure by gently permeabilizing the cells (Cytoperm-Cytofix) to allow antibodies access to both extracellularand intracellular pools of HLA-DR. The data (Fig. 5B)suggest that the amount of total cellular HLA-DR in FBSand low-lipid cells is similar and that incubation with g-interferon does not induce significant changes in totalcellular HLA-DR. These data are consistent with theinterpretation that cells maintained under low-lipidconditions cannot transport intracellular HLA-DR to thecell surface and correlate with findings that HLA-DR istransported via lipid rafts (51–54).
In addition to the pool of exogenous fatty acids, non-essential fatty acids can be synthesized endogenously (1).To evaluate the effects of inhibiting endogenous fatty acidsynthesis, we added the fatty acid synthase inhibitor ce-rulenin (55, 56) to FBSmedium. Pizer et al (57) have shown
that HL60 cells, as well as other tumor cells (58–60), diein the presence of cerulenin. In that study with HL60 cells,this sensitivity to cytotoxity was overcome by the additionof exogenous fatty acids, and the authors showed that“cerulenin toxicity is mediated through fatty acid star-vation” (57). For these reasons, we monitored the effect ofcerulenin by quantifying the percentage of cell deathresulting from cerulenin treatment. We observed dose-and time-dependent increases in cell death with the ad-dition of cerulenin to FBS and low-lipid medium in bothacute (Table 3) and long-term (Fig. 6E) treatments withcerulenin. Predictably, the highest levels of cell death wereseen in long term incubations in low-lipid medium con-taining cerulenin, conditions that limit the availability ofboth exogenous and newly synthesized fatty acids.
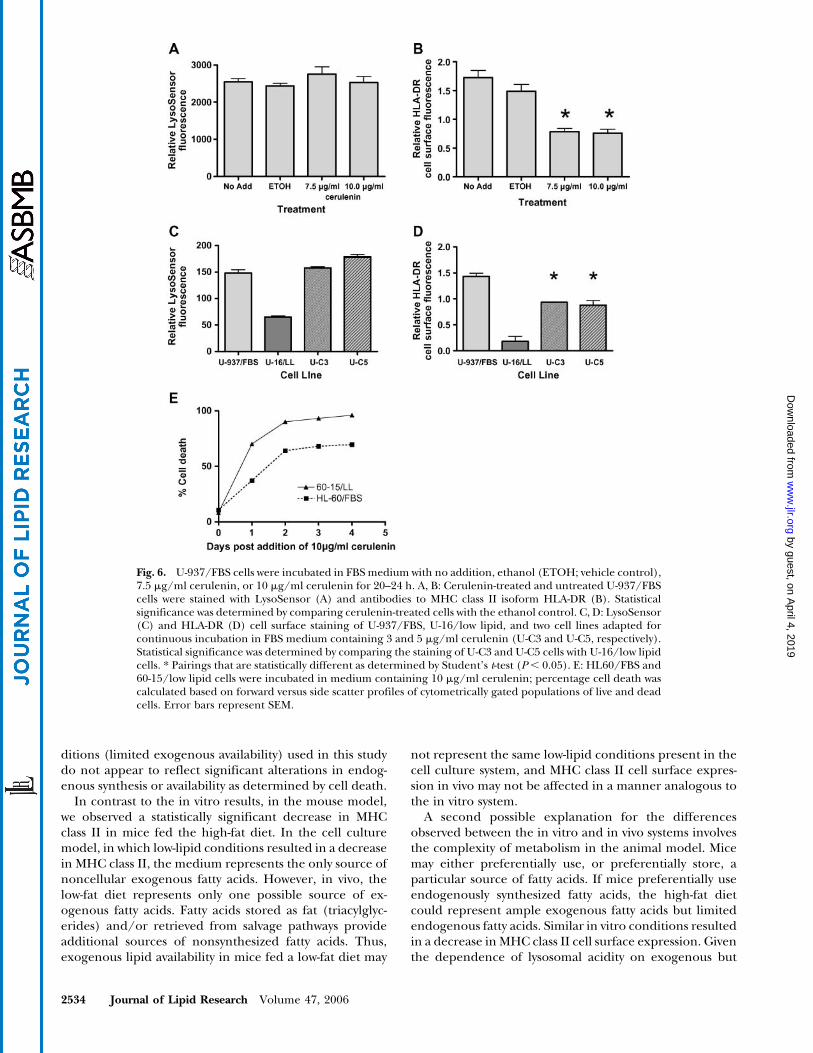
In contrast to limiting exogenous lipids (low-lipid con-ditions), incubating U-937/FBS cells with 5–10 mg/mlcerulenin for 20–24 h did not result in a decrease inlysosomal acidity in live cells (Fig. 6A), suggesting thatmaintenance of lysosomal acidity is more dependent onexogenous fatty acid availability than on endogenous fattyacid synthesis. However, our experiments do not excludethe possibility that other sources of endogenous fatty acids(phospholipids or triacylglycerides) may be involved inregulating lysosomal acidity.
Cerulenin treatment of U-937/FBS cells resulted instatistically significant decreases in HLA-DR cell surfaceexpression (Fig. 6B), indicating that endogenous syn-thesis of fatty acids, as well as exogenous fatty acids,are involved in the effective expression of cell surfaceHLA-DR. Cerulenin treatment of HL60/FBS cells gave re-sults similar to those with U-937/FBS cells for both lyso-somal acidity and HLA-DR cell surface expression (datanot shown).
To compare the long-term effects of blocking fatty acidsynthesis with acute cerulenin treatment, we cultured
TABLE 1. Effects of free fatty acids, free fatty acids with CoA, or CoA-derivatized fatty acids on lysosomalacidity and cell death
Variable Oleic Acid Linoleic Acid Oleic Acid 1 CoA Linoleic Acid 1 CoA Oleoyl-S-CoA Linoleoyl-S-CoA
Percentage increase,LysoSensor
5.6 (3) 2.8 (1) 5.0 (5) 9.2 (2) 72.8 (10) 55.8 (6)
Percentage increase,cell death
45.8 (4) 240.0 (1) 96.8 (6) 150.3 (3) 22.2 (12) 20.1 (6)
All data are expressed as percentage increases over controls. Oleoyl-S-CoA and linoleoyl-S-CoA values includedata from both HL60 and U-937 low-lipid cells; all other values are from HL60/low lipid cells. Numbers in paren-theses represent the number of experiments; all experiments represent triplicate assays from each treatment group.
TABLE 2. Percentage increase in LysoSensor staining in low-lipid cells after 20–24 h of incubation with fatty acid-CoA derivatives
Cell Line Oleoyl-CoA Palmitoyl-CoA Palmitoleoyl-CoA Stearoyl-CoA Linoleoyl-CoA
HL60 low lipid 11 to 111a (2) 1111a (1), 11b (1) 11a (1) 111b (1) 11 to 1111a (2)U-937 low lipid 111 to 1111a (3) 0 to 111a (3), significant
cell death (2)111a (2) 0a (3), significant
cell death11 to 111a (3)
Numbers in parentheses represent the number of experiments; each experiment represents quadruplicate assays. 1, 5–25% increase; 11, 25–50% increase; 111, 50–75% increase; 1111, 75–.100% increase in LysoSensor staining with the addition of fatty acid to low-lipid medium.
a 100 mM concentration of fatty acid-CoA derivative.b 75 mM concentration of fatty acid-CoA derivative.
2530 Journal of Lipid Research Volume 47, 2006
by guest, on April 4, 2019
ww
w.jlr.org
Dow
nloaded from
U-937 cells continuously for 3 months in FBS mediumcontaining either 3 or 5 mg/ml cerulenin. These cell lineswere designated U-C3 and U-C5, respectively. LysoSensorand HLA-DR cell surface staining of U-C3 and U-C5 cellsrevealed no decrease in lysosomal acidity (Fig. 6C) but adecrease in the expression of HLA-DR (Fig. 6D). Theseresults are consistent with those observed in acutelytreated cells.
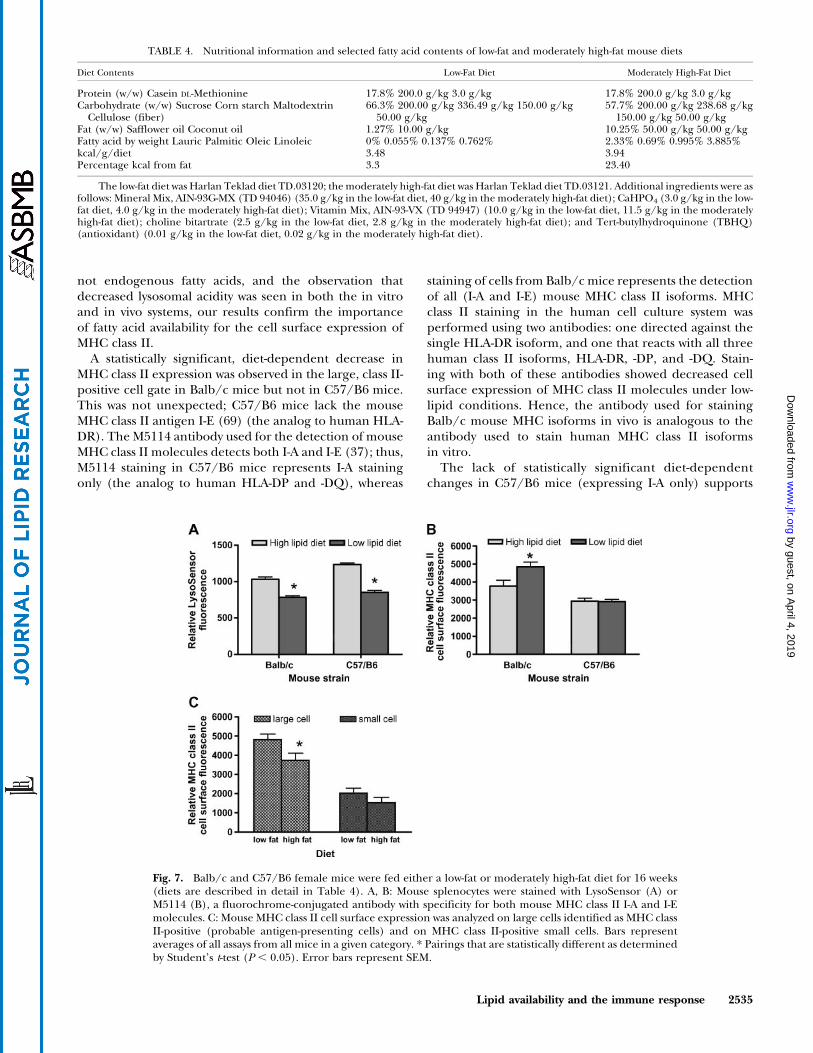
To compare our cell culture results with an analogousdietary program in vivo, we did an extended 16 week dietarystudy using Balb/c andC57/B6 femalemice (for details, seeMethods and Table 4). Data from LysoSensor staining ofmouse splenocytes demonstrate diet-dependent, statisticallysignificant changes in lysosomal acidity (Fig. 7A). Spleno-cytes from mice on the low-lipid diet had a lower lysosomalacidity than cells from mice fed a high-fat diet, a patternidentical to that seen in the in vitro cell culture system.
MHC class II staining of mouse splenocytes revealeddiet-dependent, statistically significant differences in thecell surface expression of MHC class II molecules infemale Balb/c mice but not in female C57/B6 mice(Fig. 7B). The results in C57/B6 mice correlate with theabsence of MHC class II I-E molecules (the mouse equiv-alent of human HLA-DR) in this strain of mice. Thismouse strain was selected for this study specifically to ad-dress the contribution of different MHC class II isoforms.
As noted in Methods, we determined MHC class IIexpression in a subpopulation of MHC class II-positivelarge cells. Large splenocytes that are MHC class II-positiveare widely accepted to be capable of antigen presentation(26). When we compared the effects of the high- and low-fat mouse diets on MHC class II expression between thelarge and small positive populations in Balb/c mice, we
observed a statistically significant, diet-dependent differ-ence in the levels of expression of MHC class II moleculeson large, but not on small, cells (Fig. 7C).
The diet-induced decrease in MHC class II expression inBalb/c female mice fed a high-fat diet is the opposite of theresults in the cell culture system. In the in vitromodel, HLA-DR cell surface expression was lower in cells maintainedunder low-lipid conditions. Recognizing the complexity oflipid metabolism in a whole animal, the difference mayrepresent the animal’s ability to adapt to, or use, multiplefuel sources (i.e., fat stores, salvage pathways, or endoge-nously synthesized fatty acids). Nonetheless, it is significantthat we observed statistical differences in MHC class II cellsurface expression as a function of diet.
DISCUSSION
Using in vitro cell cultures and an in vivo mouse model,we demonstrate that limiting the availability of lipidaffects lysosomal acidity and MHC class II cell surfaceexpression. The reproducibility of our results in differentcell lines and in a mouse model suggests that the ob-served changes represent a cellular response to theremoval of lipid. Our results have important implicationsrelative to diet and early events in inflammation and inthe immune response.
A decrease in lysosomal acidity is the hallmark of cellsmaintained under conditions that limit the availability ofexogenous lipids, both in vitro and in vivo. Low-lipid cellculture results demonstrating an increase in lysosomalacidity with the addition of exogenous oleoyl-CoA (andother fatty acid-CoA derivatives) support a cause-and-effect
Fig. 3. Lysosomal enzymatic glucocerebrosidase activitywas determined to assess lysosomal function relative tochanges in acidity. A, B: HL60/FBS, 60-15/low lipid, and60-15/low lipid cells treated with 100 mM oleoyl-CoAwere assayed for lysosomal glucocerebrosidase activity(A) and for lysosomal acidity (B) using LysoSensorstaining. Bars represent triplicate assays and are repre-sentative of at least three separate experiments. * Sta-tistically significant difference between HL60/FBS and60-15/low lipid cells; # statistically significant differencebetween 60-15/low lipid and 60-15/low lipid cells with100 mM oleoyl-CoA. Statistical significance was definedby Student’s t-test (P , 0.05). C: HL60/FBS cells wereincubated with no additive or 5, 10, 20, or 40 mM chlo-roquine at room temperature for 60 min and subse-quently assayed for lysosomal glucocerebrosidase activity.Error bars represent SEM.
Lipid availability and the immune response 2531
by guest, on April 4, 2019
ww
w.jlr.org
Dow
nloaded from
relationship between exogenous fatty acid availability andlysosomal acidity. Notably, we observed increases in lyso-somal acidity at oleoyl-CoA concentrations as low as 20 mM.However, fatty acids serve many functions within the cell,and reconstituting low-lipid medium with derivatized fattyacids will have pleotrophic effects. We used a high con-centration of fatty acids (100 mM) in our reconstitution as-says to provide saturating conditions. Given the inherentcomplexity of fatty acid transport and metabolism, thestatistically significant (P , 0.05), sustained, and dose-dependent changes in lysosomal acidity seen with theaddition of oleoyl-CoA (and other fatty acids) provide sub-stantial evidence for a cause-and-effect relationship.
Although the exact role of fatty acids in the regulation/maintenance of lysosomal acidity cannot be discernedfrom this study, we propose that fatty acids act as a regu-lator of lysosomal acidity. Mellman and colleagues (61)demonstrated changes in lysosomal acidity in dendriticcells (antigen-presenting cells) during maturation. Thesereported changes in lysosomal acidity may represent asituation in which lysosomal acidity requires a high levelof control, possibly mediated by fatty acid. Future work isaimed at elucidating the mechanism by which exogenousfatty acids influence lysosomal acidity.
Lysosomal acidity is unaffected when endogenous fattyacid synthesis is blocked by cerulenin. In contrast, in-
Fig. 4. Human HL60, human U-937, mouse L-1210 cells, and their respective low-lipid counterparts werestained with fluorochrome-conjugated antibodies to major histocompatibility complex (MHC) moleculesand analyzed by flow cytometry. A, B: Cell surface expression of MHC class II isoform HLA-DR in humanmacrophage cell lines (A) and mouse MHC class II complexes I-A and I-E in L-1210 mouse cells lines (B).C: Cell surface expression of the HLA-A,B,C MHC class I complex in human macrophage cell lines wasdetermined by staining with an antibody against combined HLA-A,B,C. D, E: Cell surface expression ofCD11b (D) and CD14 (E) was determined in 60-15/low lipid cells with and without treatment with 1026 Mvitamin D3. Bars represent triplicate assays and are representative of at least three separate experiments. *Pairings that are statistically different as determined by Student’s t-test (P, 0.05). Error bars represent SEM.
2532 Journal of Lipid Research Volume 47, 2006
by guest, on April 4, 2019
ww
w.jlr.org
Dow
nloaded from
hibiting endogenous fatty acid synthesis and limiting theexogenous availability of fatty acids result in decreased cellsurface expression of MHC class II. Therefore, fatty acidsmay be involved in more than one aspect of MHC class IIcell surface expression. Lysosomal antigen processing intoMHC class II molecules is followed by transport of thepeptide-loaded molecule to the cell surface (27, 39). Lipidrafts are known to be key components of this process (52,54), and current research has strengthened the linkbetween rafts and fatty acids: polyunsaturated fatty acidsare involved in membrane raft formation (62, 63), fattyacids are transported on lipid rafts (64), and altered lipidconditions affect the trafficking of lipid rafts (65–67). Dis-ruption of lipid rafts by our low-lipid conditions may rep-resent one explanation for the decrease in both MHC classI and class II.
Athanassakis, Ranella, and Vassiliadis (68) reportedthat, in trophoblast cells, g-interferon facilitates the re-lease of MHC class II from intracellular pools independentof protein synthesis. Consistent with these results, we didnot see a significant increase in total cellular HLA-DR ineither FBS or low-lipid cells incubated with g-interferonfor 30 h. Furthermore, increased amounts of HLA-DR aredetected only on the cell surface of FBS cells and not low-lipid cells. These data are consistent with the interpreta-tion that low-lipid conditions disrupt the transport of
intracellular stores of MHC class II to the cell surface,thus explaining the failure of g-interferon to increasethe cell surface expression of MHC class II under low-lipid conditions.
An alternative, albeit more complex, interpretation ofthe data demonstrating a requirement for both endoge-nous and exogenous fatty acids for the cell surfaceexpression of MHC class II could be that our low-lipidconditions create such a great need for fatty acids that thecell cannot keep up with the synthesis demands. If thisis the case, the in vitro low-lipid conditions (limited exog-enous availability) could represent a decreased availabilityof both exogenous and endogenous fatty acids. The resultsof experiments examining cell death as a function ofgrowth in low-lipid medium versus growth in low-lipidmedium containing cerulenin argue against this explana-tion: if the low-lipid environment also depleted endoge-nous supplies of fatty acids, we would expect substantialincreases in cell death with continuous incubation in low-lipid medium. This is not what we observed; rather, cellsmaintained long term under low-lipid conditions stabi-lized with respect to cell death. Under experimental con-ditions in which cells were deprived of both endogenoussynthesis and exogenous availability of fatty acids (low-lipid medium plus cerulenin), we observed a dramaticincrease in cell death. Therefore, the in vitro low-lipid con-
Fig. 5. HL60/FBS and 60-7/low lipid cells were incubated with 25 nM g-interferon (IFNg) for 30 h followedby staining with antibodies to HLA-DR. A: Cell surface HLA-DR levels of expression were determined byantibody staining of intact, nonpermeabilized cells. Bars represent triplicate assays and are representativeof at least three experiments. B: Total cellular HLA-DR levels were determined by gently permeabilizingcells before staining with antibodies to HLA-DR. * Statistically significant difference as determined byStudent’s t-test (P , 0.05). Error bars represent SEM.
TABLE 3. Percentage cell death in U-937 cell lines treated with cerulenin for 20–24 h or incubated continuouslyin medium containing cerulenin
Exposure to Cerulenin Cell Line Cerulenin Cell Death
20–24 h U-937/FBS None 5 mg/ml 7 mg/ml 10 mg/ml 3.4% 11.9% 24.5% 27.5%U-16/low lipid None 5 mg/ml 7 mg/ml 10 mg/ml 2.3% N/A 4.8% 9.8%
Continuous incubationin cerulenin
U-C3 3 mg/ml 5.6%
U-C5 5 mg/ml 16.4%
N/A, not applicable.
Lipid availability and the immune response 2533
by guest, on April 4, 2019
ww
w.jlr.org
Dow
nloaded from
ditions (limited exogenous availability) used in this studydo not appear to reflect significant alterations in endog-enous synthesis or availability as determined by cell death.
In contrast to the in vitro results, in the mouse model,we observed a statistically significant decrease in MHCclass II in mice fed the high-fat diet. In the cell culturemodel, in which low-lipid conditions resulted in a decreasein MHC class II, the medium represents the only source ofnoncellular exogenous fatty acids. However, in vivo, thelow-fat diet represents only one possible source of ex-ogenous fatty acids. Fatty acids stored as fat (triacylglyc-erides) and/or retrieved from salvage pathways provideadditional sources of nonsynthesized fatty acids. Thus,exogenous lipid availability in mice fed a low-fat diet may
not represent the same low-lipid conditions present in thecell culture system, and MHC class II cell surface expres-sion in vivo may not be affected in a manner analogous tothe in vitro system.
A second possible explanation for the differencesobserved between the in vitro and in vivo systems involvesthe complexity of metabolism in the animal model. Micemay either preferentially use, or preferentially store, aparticular source of fatty acids. If mice preferentially useendogenously synthesized fatty acids, the high-fat dietcould represent ample exogenous fatty acids but limitedendogenous fatty acids. Similar in vitro conditions resultedin a decrease in MHC class II cell surface expression. Giventhe dependence of lysosomal acidity on exogenous but
Fig. 6. U-937/FBS cells were incubated in FBS medium with no addition, ethanol (ETOH; vehicle control),7.5 mg/ml cerulenin, or 10 mg/ml cerulenin for 20–24 h. A, B: Cerulenin-treated and untreated U-937/FBScells were stained with LysoSensor (A) and antibodies to MHC class II isoform HLA-DR (B). Statisticalsignificance was determined by comparing cerulenin-treated cells with the ethanol control. C, D: LysoSensor(C) and HLA-DR (D) cell surface staining of U-937/FBS, U-16/low lipid, and two cell lines adapted forcontinuous incubation in FBS medium containing 3 and 5 mg/ml cerulenin (U-C3 and U-C5, respectively).Statistical significance was determined by comparing the staining of U-C3 and U-C5 cells with U-16/low lipidcells. * Pairings that are statistically different as determined by Student’s t-test (P, 0.05). E: HL60/FBS and60-15/low lipid cells were incubated in medium containing 10 mg/ml cerulenin; percentage cell death wascalculated based on forward versus side scatter profiles of cytometrically gated populations of live and deadcells. Error bars represent SEM.
2534 Journal of Lipid Research Volume 47, 2006
by guest, on April 4, 2019
ww
w.jlr.org
Dow
nloaded from
not endogenous fatty acids, and the observation thatdecreased lysosomal acidity was seen in both the in vitroand in vivo systems, our results confirm the importanceof fatty acid availability for the cell surface expression ofMHC class II.
A statistically significant, diet-dependent decrease inMHC class II expression was observed in the large, class II-positive cell gate in Balb/c mice but not in C57/B6 mice.This was not unexpected; C57/B6 mice lack the mouseMHC class II antigen I-E (69) (the analog to human HLA-DR). The M5114 antibody used for the detection of mouseMHC class II molecules detects both I-A and I-E (37); thus,M5114 staining in C57/B6 mice represents I-A stainingonly (the analog to human HLA-DP and -DQ), whereas
staining of cells from Balb/c mice represents the detectionof all (I-A and I-E) mouse MHC class II isoforms. MHCclass II staining in the human cell culture system wasperformed using two antibodies: one directed against thesingle HLA-DR isoform, and one that reacts with all threehuman class II isoforms, HLA-DR, -DP, and -DQ. Stain-ing with both of these antibodies showed decreased cellsurface expression of MHC class II molecules under low-lipid conditions. Hence, the antibody used for stainingBalb/c mouse MHC isoforms in vivo is analogous to theantibody used to stain human MHC class II isoformsin vitro.
The lack of statistically significant diet-dependentchanges in C57/B6 mice (expressing I-A only) supports
TABLE 4. Nutritional information and selected fatty acid contents of low-fat and moderately high-fat mouse diets
Diet Contents Low-Fat Diet Moderately High-Fat Diet
Protein (w/w) Casein DL-Methionine 17.8% 200.0 g/kg 3.0 g/kg 17.8% 200.0 g/kg 3.0 g/kgCarbohydrate (w/w) Sucrose Corn starch Maltodextrin
Cellulose (fiber)66.3% 200.00 g/kg 336.49 g/kg 150.00 g/kg50.00 g/kg
57.7% 200.00 g/kg 238.68 g/kg150.00 g/kg 50.00 g/kg
Fat (w/w) Safflower oil Coconut oil 1.27% 10.00 g/kg 10.25% 50.00 g/kg 50.00 g/kgFatty acid by weight Lauric Palmitic Oleic Linoleic 0% 0.055% 0.137% 0.762% 2.33% 0.69% 0.995% 3.885%kcal/g/diet 3.48 3.94Percentage kcal from fat 3.3 23.40
The low-fat diet was Harlan Teklad diet TD.03120; themoderately high-fat diet was Harlan Teklad diet TD.03121. Additional ingredients were asfollows: Mineral Mix, AIN-93G-MX (TD 94046) (35.0 g/kg in the low-fat diet, 40 g/kg in the moderately high-fat diet); CaHPO4 (3.0 g/kg in the low-fat diet, 4.0 g/kg in the moderately high-fat diet); Vitamin Mix, AIN-93-VX (TD 94947) (10.0 g/kg in the low-fat diet, 11.5 g/kg in the moderatelyhigh-fat diet); choline bitartrate (2.5 g/kg in the low-fat diet, 2.8 g/kg in the moderately high-fat diet); and Tert-butylhydroquinone (TBHQ)(antioxidant) (0.01 g/kg in the low-fat diet, 0.02 g/kg in the moderately high-fat diet).
Fig. 7. Balb/c and C57/B6 female mice were fed either a low-fat or moderately high-fat diet for 16 weeks(diets are described in detail in Table 4). A, B: Mouse splenocytes were stained with LysoSensor (A) orM5114 (B), a fluorochrome-conjugated antibody with specificity for both mouse MHC class II I-A and I-Emolecules. C: Mouse MHC class II cell surface expression was analyzed on large cells identified as MHC classII-positive (probable antigen-presenting cells) and on MHC class II-positive small cells. Bars representaverages of all assays from all mice in a given category. * Pairings that are statistically different as determinedby Student’s t-test (P , 0.05). Error bars represent SEM.
Lipid availability and the immune response 2535
by guest, on April 4, 2019
ww
w.jlr.org
Dow
nloaded from
the possibility of a functional, lipid-dependent distinctionbetween MHC class II I-E/HLA-DR and MHC class II I-A/HLA-DP and -DQ. In this study, female mice lacking I-E didnot respond to differences in lipid availability in the samemanner as mice bearing both I-A and I-E isoforms. Func-tional distinctions between the MHC class II isoforms arenot unprecedented. Previous work in our laboratories hasshown differential susceptibility to coxsackievirus-inducedcardiomyopathies and early atherogenesis as a function ofthe presence or absence of I-E in transgenic mouse modelsof disease (70). Together, our data suggest a potentialfunctional or mechanistic link between lipid availability andthe expression of cell surface MHC class II isoforms.
This interpretation could have important implicationsfor explaining the well-established genetic correlation be-tween HLA-DR and HLA-DP and -DQ and between sus-ceptibility and resistance to many diseases. Diseases withestablished genetic links to one or the other, HLA-DR orHLA-DP and -DQ, include heart disease (71), autoimmunediseases (72), infectious diseases (73), and inflammatoryconditions (74). Notably, many autoimmune diseases, suchas multiple sclerosis (75), systemic lupus erythematosus(76), and rheumatoid arthritis (77), show strong associa-tions specifically with HLA-DR expression, and thesediseases are more common in women than in men. Ourobserved effects of lipid availability on the level of cellsurface expression of HLA-DR in human cell culture andMHC class II I-E in female mice may suggest a possiblemechanistic link between lipid availability, autoimmunediseases, and HLA-DR. Our current work is aimed at ex-ploring the relationships between gender, lipid availability,and HLA-DR cell surface expression.
In conclusion, the changes we have observed in lysosomalacidity and MHC class II cell surface expression in responseto varying lipid conditions, both in vitro and in vivo, rep-resent important cellular responses. These changes mayaffect antigen processing and presentation, T-lymphocyteactivation, inflammation, andpotentially the nature andpro-duction of cytokines by T-lymphocytes. We observed a pref-erential use of specific fatty acid pools (exogenous vs.endogenous fatty acids), and these data suggest that dietand/orpharmacologic interventionmaybeusedto influenceearly events in inflammation and the immune response.
The authors thank Dr. Robert Camley and Mr. Jeff Rogersfor their technical assistance. This work was supported byAmerican Heart Association Award 0350585Z (S.C.S. andM.K.N.) and National Institutes of Health Grant RO1 GM-16562 (M.K.N.).
REFERENCES
1. Vance, D., and J. Vance. 2002. Biochemistry of Lipids, Lipoproteinsand Membranes. 4th edition. Elsevier, Amsterdam.
2. Brown, M. S., and J. L. Goldstein. 1986. A receptor mediatedpathway for cholesterol homeostasis. Science. 232: 34–47.
3. Libby, P. 2003. Vascular biology of atherosclerosis: overview andstate of the art. Am. J. Cardiol. 91: 3A–6A.
4. Hartil, K., and M. J. Charron. 2005. Genetic modification of the
heart: transgenic modification of cardiac lipid and carbohydrateutilization. J. Mol. Cell. Cardiol. 39: 581–593.
5. Frayn, K., B. Fielding, and F. Karpe. 2005. Adipose tissue fattyacid metabolism and cardiovascular disease. Curr. Opin. Lipidol. 16:409–415.
6. Raz, I., R. Eldor, S. Cernea, and E. Shafrir. 2005. Diabetes: insulin re-sistance and derangements in lipid metabolism. Cure through inter-vention in fat transport and storage. Diabetes Metab. Res. Rev. 21: 3–14.
7. Taskinen, M. 2005. Type 2 diabetes as a lipid disorder. Curr. Mol.Med. 5: 297–308.
8. Unger, R., and L. Orci. 2002. Lipoapoptosis: its mechanism andits diseases. Biochim. Biophys. Acta. 1585: 202–212.
9. Dobrzyn, A., and J. Ntambi. 2005. The role of stearoyl-CoA de-saturase in the control of metabolism. Prostaglandins Leukot. Essent.Fatty Acids. 73: 35–41.
10. Degroote, S., J. Wolthoorn, and G. van Meer. 2004. The cell biologyof glycosphingolipids. Cell Dev. Biol. 15: 375–387.
11. Ikonen, E., and M. Holtta-Vuori. 2004. Cellular pathology ofNiemann-Pick type C disease. Cell Dev. Biol. 15: 445–454.
12. Futerman, A., and G. van Meer. 2004. The cell biology of lyso-somal storage disorders. Nat. Rev. Mol. Cell Biol. 5: 554–565.
13. Shukla, S., G. Sun, W. Gibson Wood, M. Savolainen, C. Alling, andJ. Hoek. 2001. Ethanol and lipid metabolic signaling. Alcohol Clin.Exp. Res. 25 (Suppl.): 33–39.
14. Nano, J., C. Nobili, F. Girard-Pipau, and P. Rampal. 2003. Effects offatty acids on the growth of Caco-2 cells. Prostaglandins Leukot.Essent. Fatty Acids. 69: 207–215.
15. Lee, K., H. Lee, H. Cho, and Y. Kim. 2005. Role of the conjugatedlinoleic acid in the prevention of cancer. Crit. Rev. Food Sci. Nutr. 45:135–144.
16. Huang, M., M. Graeler, G. Shankar, J. Spencer, and E. Goetzl. 2002.Lysophospholipid mediators of immunity and neoplasia. Biochim.Biophys. Acta. 1582: 161–167.
17. Frostegard, J., E. Svenungsson, R. Wu, I. Gunnarsson, I. Lundberg,L. Klareskog, S. Horkko, and J. Witztum. 2005. Lipid peroxidationis enhanced in patients with systemic lupus erythematosus and isassociated with arterial and renal disease manifestations. ArthritisRheum. 52: 192–200.
18. van Meeteren, M., C. Teunissen, C. Dijkstra, and E. van Tol. 2005.Antioxidants and polyunsaturated fatty acids in multiple sclerosis.Eur. J. Clin. Nutr. 59: 1347–1361.
19. Dube, M., and M. Fenton. 2003. Lipid abnormalities. Clin. Infect.Dis. 36 (Suppl. 2): 79–83.
20. Hanada, K. 2005. Sphingolipids in infectious diseases. Jpn. J. Infect.Dis. 58: 131–148.
21. Wenk, M. 2005. The emerging field of lipidomics. Nat. Rev. DrugDiscov. 4: 594–610.
22. Huber, S., J. Kupperman, and M. Newell. 1999. Hormonal regu-lation of CD4(1) T-cell responses in coxsackievirus B-3-inducedmyocarditis in mice. J. Virol. 73: 4689–4695.
23. Yndestad, A., A. Holm, F. Muller, S. Simonsen, S. Froland, L.Gullestad, and P. Aukrust. 2003. Enhanced expression of inflam-matory cytokines and activation markers in T-cells from patientswith chronic heart failure. Cardiovasc. Res. 60: 141–146.
24. Lord, R., and Y. Bobryshev. 2002. Hallmarks of atheroscleroticlesion development with special reference to immune inflamma-tory mechanisms. Cardiovasc. Surg. 10: 405–414.
25. Stocker, R., and J. J. Keaney. 2004. Role of oxidative modificationsin atherosclerosis. Physiol. Rev. 84: 1381–1478.
26. Kuby, J., R. Goldsby, T. Kindt, and B. Osborne. 2002. Immunology.5th edition. W. H. Freeman and Co., New York.
27. Cresswell, P., and A. Lanzavecchia. 2001. Antigen processing andrecognition. Curr. Opin. Immunol. 13: 11–12.
28. Li, P., J. Gregg, N. Wang, D. Zhou, P. O’Donnell, J. Blum, and Y.Crotzer. 2005. Compartmentalization of class II antigen presenta-tion: contributions of cytoplasmic and endosomal processing.Immunol. Rev. 207: 206–217.
29. Bretscher, P. 1975. The two signal model for B cell induction.Transplant. Rev. 23: 37–48.
30. Bretscher, P., and M. Cohn. 1970. The theory of self-nonself dis-crimination. Science. 169: 1042–1049.
31. Elenkov, I., D. Iezzoni, A. Daly, A. Harris, and G. Chrousos. 2005.Cytokine dysregulation, inflammation, and well-being. Neuroimmu-nomodulation. 12: 255–269.
32. Minor, L., F. Mahlberg, W. Jerome, J. Lewis, G. Rothblatt, and J.Glick. 1991. Lysosomal hydrolysis of lipids in a cell culture model ofsmooth muscle foam cells. Exp. Mol. Pathol. 54: 159–171.
2536 Journal of Lipid Research Volume 47, 2006
by guest, on April 4, 2019
ww
w.jlr.org
Dow
nloaded from
33. Mouritsen, S., A. Hansen, B. Petersen, and S. Buus. 1992. pH de-pendence of the interaction between immunogenic peptides andMHC class II molecules. Evidence for an acidic intracellularcompartment being the organelle of interaction. J. Immunol. 148:1438–1444.
34. Haugland, R. 1996. Handbook of Fluorescent Probes and ResearchChemicals. 6th edition. Molecular Probes, Eugene, OR.
35. van Es, H., M. Veldwijk, M. Havenga, and D. Valerio. 1997. A flowcytometric assay for lysosomal glucocerebrosidase. Anal. Biochem.247: 268–271.
36. Leanderson, T., and M. Julius. 1986. Mouse B cells do not pro-liferate in human interleukin 2. Eur. J. Immunol. 16: 182–187.
37. Sharma, S., T. Budzich, M. Proffitt, D. Shepherd, and J. Remington.1984. Regulation of natural killer cell activity by anti-I-regionmonoclonal antibodies. Cell. Immunol. 85: 125–134.
38. Groener, J., W. Bax, and B. Poorthuis. 1996. Metabolic fate of oleicacid derived from lysosomal degradation of cholesteryl oleate inhuman fibroblasts. J. Lipid Res. 37: 2271–2279.
39. Chow, A., and I. Mellman. 2005. Old lysosomes, new tricks: MHC IIdynamics in DCs. Trends Immunol. 26: 72–78.
40. Collins, S., R. Gallo, and R. Gallagher. 1977. Continuous growthand differentiation of human myeloid leukemic cells in suspensionculture. Nature. 270: 347–349.
41. Koren, H., S. Anderson, and J. Larrick. 1979. In vitro activation of ahuman macrophage-like cell line. Nature. 279: 328–331.
42. Hutchison, D., O. Ittensohn, and M. Bjerregaard. 1966. Growth ofL1210 mouse leukemia cells in vitro. Exp. Cell Res. 42: 157–170.
43. Stemmel, W., L. Pohl, A. Ring, and T. Hermann. 2001. A new con-cept of cellular uptake and intracellular trafficking of long-chainfatty acids. Lipids. 36: 981–989.
44. Poole, B., and S. Ohkuma. 1981. Effect of weak bases on the intra-lysosomal pH in mouse peritoneal macrophages. J. Cell Biol. 90:665–669.
45. Aukurst, P., L.Gulliestad,T.Ueland, J.Damas, andA. Yndestad. 2005.Inflammatory and anti-inflammatory cytokines in chronic heartfailure: potential therapeutic implications. Ann. Med. 37: 74–85.
46. Nakagawa, T., and A. Rudensky. 1999. The role of lysosomal pro-teinases in MHC class II-mediated antigen processing and presen-tation. Immunol. Rev. 172: 121–129.
47. Kloetzel, P. 2004. The proteasome and MHC class I antigenprocessing. Biochim. Biophys. Acta. 1695: 217–225.
48. Lehner, P., and P. Cresswell. 2004. Recent developments in MHC-class-I-mediatedantigenpresentation.Curr.Opin. Immunol.16:82–89.
49. Drayson, M., R. Mitchell, J. Durham, and G. Brown. 2001. Cellproliferation and CD11b expression are controlled indepen-dently during HL60 cell differentiation initiated by 1,25 alpha-dihydroxyvitamin D3 or all-trans-retinoic acid. Exp. Cell Res. 226:126–134.
50. Delvig, A., J. Lee, Z. Chrzanowska-Lightowlers, and J. Robinson.2002. TGF-beta and IFN-gamma cross regulate antigen presenta-tion to CD4 T cells by macrophages. J. Leukoc. Biol. 72: 163–166.
51. Anderson, H., E. Hitbold, and P. Roche. 2000. Concentration ofMHC class II molecules in lipid rafts facilitates antigen presenta-tion. Nat. Immunol. 1: 156–162.
52. Goebel, J., K. Forrest, D. Flynn, R. Rao, and T. Roszman. 2002.Lipid rafts, major histocompatibility complex molecules and im-mune regulation. Hum. Immunol. 63: 813–820.
53. Hiltbold, E., N. Poloso, and P. Roche. 2003. MHC class II-peptidecomplexes and APC lipid rafts accumulate at the immunologicalsynapse. J. Immunol. 170: 1329–1336.
54. Poloso, N., A. Muntasell, and P. Roche. 2004. MHC class IImolecules traffic into lipid rafts during intracellular transport. J.Immunol. 173: 4539–4546.
55. D’Agnolo, G., I. Rosenfeld, J. Awaya, S. Omura, and P. Vagelos.1973. Inhibition of fatty acid synthesis by the antibiotic cerulenin.Specific inactivation of beta-ketoacyl-acyl carrier protein synthase.Biochim. Biophys. Acta. 326: 155–156.
56. Kuhajda, F., E. Pizer, J. Li, N. Mani, G. Frehywot, and C. Townsend.2000. Synthesis and antitumor activity of an inhibitor of fatty acidsynthesis. Proc. Natl. Acad. Sci. USA. 97: 3450–3454.
57. Pizer, E., F. Wood, G. Pasternack, and F. Kuhajda. 1996. Fatty acid
synthase (FAS): a target for cytotoxic antimetabolites in HL60promyelocytic leukemia cells. Cancer Res. 56: 745–751.
58. Pizer, E., F. Chrest, J. DiGiuseppe, and W. Han. 1998. Pharmaco-logical inhibitors of mammalian fatty acid synthase suppress DNAreplication and induce apoptosis in tumor cell lines. Cancer Res. 58:4611–4615.
59. Zhang, Y., C. Guo, and G. Yu. 2005. A pilot study of fatty acidmetabolism in oral squamous cell carcinoma. Int. J. Oral Maxillofac.Surg. 34: 78–81.
60. Liu, X., Y. Shi, V. Giranda, and Y. Luo. 2006. Inhibition of thephosphatidylinositol 3-kinase/Akt pathway sensitizes MDA-MB468human breast cancer cells to cerulenin-induced apoptosis. Mol.Cancer Ther. 5: 494–501.
61. Trombetta, E., M. Ebersold, W. Garrett, M. Pypaert, and I. Mell-man. 2003. Activation of lysosomal function during dendritic cellmaturation. Science. 299: 1400–1403.
62. Ma, D., J. Seo, K. Switzer, Y. Fan, D. McMurray, J. Lupton, and R.Chapkin. 2004. n-3 PUFA and membrane microdomains: a newfrontier in bioactive lipid research. J. Nutr. Biochem. 15: 700–706.
63. Zeyda, M., G. Staffler, V. Horejsi, W. Waldhausl, and T. Stulnig.2002. LAT displacement from lipid rafts as a molecular mechanismfor the inhibition of T cell signaling by polyunsaturated fatty acids.J. Biol. Chem. 277: 28418–28423.
64. Pohl, J., A. Ring, R. Ehehalt, H. Schulze-Bergkamen, A. Schad,P. Verkade, and W. Stemmel. 2004. Long-chain fatty acid uptakeinto adipocytes depends on lipid raft function. Biochemistry. 43:4179–4187.
65. van Laethem, F., X. Liang, F. Andris, J. Urbain, M. Vandenbranden,J. Ruysschaert, M. Resh, T. Stulnig, and O. Leo. 2003. Glucocorti-coids alter the lipid and protein composition of membrane rafts ofa murine T cell hybridoma. J. Immunol. 170: 2932–2939.
66. Fan, Y., L. Ly, R. Barhoumi, D. McMurray, and R. Chapkin. 2004.Dietary docosahexaenoic acid suppresses T cell protein kinase Ctheta lipid raft recruitment and IL-2 production. J. Immunol. 173:6151–6160.
67. Fan, Y., D. McMurray, L. Ly, and R. Chapkin. 2003. Dietary (n-3)polyunsaturated fatty acids remodel mouse T-cell lipid rafts. J. Nutr.133: 1913–1920.
68. Athanassakis, I., A. Ranella, and S. Vassiliadis. 2000. IFN-gammafacilitates release of class-II loaded intracellular pools in tropho-blast cells: a novel property independent of protein synthesis. J.Interferon Cytokine Res. 20: 823–830.
69. Huss, R., C. Beckham, R. Storb, and H. Deeg. 1994. Major histo-compatibility complex class II expression is required for post-transplant immunological but not hemopoietic reconstitution inmice. Transplantation. 58: 1366–1371.
70. Huber, S., J. Stone, D. J. Wagner, J. Kupperman, L. Pfeiffer, C.David, R. O’Brien, G. Davis, and M. Newell. 1999. Gamma delta1T cells regulate major histocompatibility complex class II (IA andIE)-dependent susceptibility to coxsackievirus B3-induced autoim-mune myocarditis. J. Virol. 73: 5630–5636.
71. Akdemir, R., H. Ozhan, H. Gunduz, E. Erbilen, M. Yazici, S. Duran,F. Orkunoglu, S. Albayrak, N. Imirzalioglu, and C. Uyan. 2004.HLA-DR B1 and DQ B1 polymorphisms in patients with coronaryartery ectasia. Acta Cardiol. 59: 499–502.
72. Thorsby, E., and B. Lie. 2005. HLA associated genetic predisposi-tion to autoimmune diseases: genes involved and possible mecha-nisms. Transpl. Immunol. 14: 175–182.
73. Segal, S., and A. Hill. 2003. Genetic susceptibility to infectiousdisease. Trends Microbiol. 11: 445–448.
74. Howell, W., P. Calder, and R. Grimble. 2002. Gene polymorphisms,inflammatory diseases and cancer. Proc. Nutr. Soc. 61: 447–456.
75. Holmes, S., C. Siebold, E. Jones, M. Friese, L. Fugger, and J. Bell.2005. Multiple sclerosis: MHC associations and therapeutic impli-cations. Expert Rev. Mol. Med. 7: 1–17.
76. Rozzo, S., T. Vyse, C. David, E. Palmer, S. Izui, and B. Kotzin. 1999.Analysis of MHC class II genes in the susceptibility to lupus in NewZealand mice. J. Immunol. 162: 2623–2630.
77. Weyand, C., and J. Goronzy. 2000. Association of MHC andrheumatoid arthritis. HLA polymorphisms in phenotypic variantsof rheumatoid arthritis. Arthritis Res. 2: 203–204.
Lipid availability and the immune response 2537
by guest, on April 4, 2019
ww
w.jlr.org
Dow
nloaded from