Embed Size (px)
Citation preview
ENERGY AND COST BENEFIT ANALYSES OF HEATING, VENTILATIONAND AIR CONDITIONING SYSTEMS AVAILABLE FOR OHIO SCHOOLS
Final Report
Prepared for:
Mr. William ManzOhio Department of Development
Office of Energy Efficiency77 South High Street, 26th Floor
Columbus, OH 43215-6108
and
Mr. Franklin BrownOhio School Facilities Commission
88 East Broad Street, Suite 1400Columbus, OH 43215
Prepared by:
Mr. Stephen PettyMr. Greg Hochstetler
Now at: Energy & Environmental Solutions, Inc84 N. High Street, Suite 2B
Dublin, Ohio 43017(614) 798-4123
November 10, 2000
.
ENERGY AND COST BENEFIT ANALYSES OF HEATING, VENTILATION
AND AIR CONDITIONING SYSTEMS AVAILABLE FOR OHIO SCHOOLS
Volume I: Final Report
Prepared for:
Mr. William ManzOhio Department of Development
Office of Energy Efficiency77 South High Street, 26th Floor
Columbus, OH 43215-6108
and
Mr. Franklin BrownOhio School Facilities Commission88 East Broad Street, Suite 1400
Columbus, OH 43215
Prepared by:
Mr. Stephen PettyMr. Greg Hochstetler
Energy and Envrionmental Solutions, Inc.84 N. High Street, Suite 2B
Dublin, Ohio 43017(614) 798-4123
November 10, 2000
Energy and Cost Benefit Analyses of HVAC Systems Available to Ohio Schools
ii
ACKNOWLEDGMENTS
The authors wish to thank Bill Manz of the Ohio Department of Development’s Office of EnergyEfficiency and Franklin Brown of the Ohio School Facilities Commission. for their support andguidance throughout this project. The authors also wish to thank Mr. John Fetters, EffectiveLighting Solutions, Inc. for his significant contributions to Chapter 10 on daylighting and Mr.Mark Taylor, Limbach Company for his work and insights into building zoning and modeling.
Energy and Cost Benefit Analyses of HVAC Systems Available to Ohio Schools
iii
EXECUTIVE SUMMARY
The authors prepared energy analyses of the design options available (Ohio School DesignManual) to architects and engineers (A&Es) for mechanical systems in State of Ohio Schoolbuildings for the Ohio Department of Development’s Office of Energy Efficiency (ODOD-OEE). The objectives of this project were to: 1) model energy costs, by mechanical system, foran elementary school and a high school in three representative locations in the State of Ohio, and2) evaluate three sustaining energy alternatives for their cost-effectiveness for consideration infuture school designs. These two objectives were called Phase 1 and Phase 2, respectively.
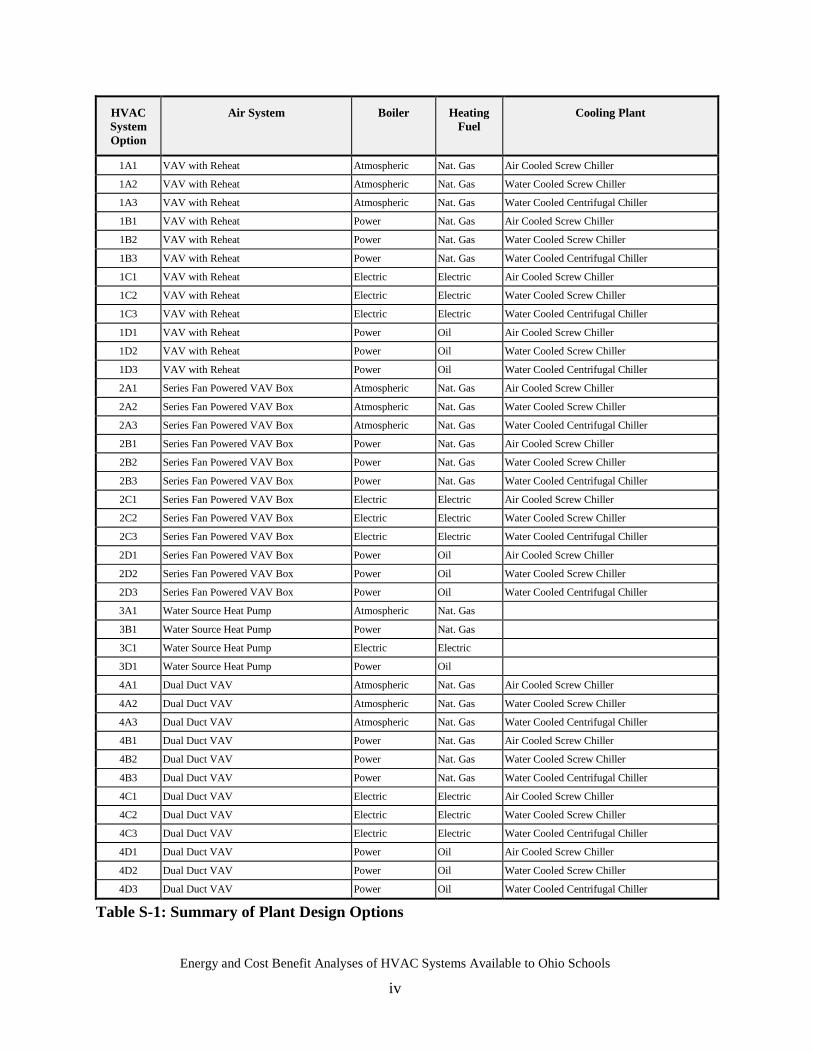
Carrier’s Hourly Analysis Program (HAP) energy analysis model was selected to perform theseanalyses. HAP was selected and used because it: 1) is an 8,760 hour per year code (models abuilding every hour of every day for one calendar year), 2) provides a good compromise betweencomplexity and accuracy of available models, and 3) it is widely used and accepted by industry.Model input data for two types of schools (i.e., an elementary school and a high school) weretaken directly from drawings and specifications for the first two types of these buildingsdesigned under the new Ohio School Design Manual. The elementary schooldrawings/specifications used were for the planned Katherine Thomas Elementary School in theWindham Exempted Village School District located in Windham, OH; the high schooldrawings/specifications used were for the new Uhrichsville High School in the Claymont CitySchool District located in Dennison, OH. Actual architectural details from each building wereloaded into HAP. Each of the 40 potential mechanical system combinations available to an A&E(from the Ohio School Design Manual) were evaluated for three separate weather locations (i.e.,Cleveland, Cincinnati and Columbus, OH). Mechanical configurations evaluated are listed inTable S-1. The left column in Table S-1 provides an identifier code that is used throughout thereport to summarize a specific HVAC System Option
Energy and Cost Benefit Analyses of HVAC Systems Available to Ohio Schools
iv
HVACSystemOption
Air System Boiler HeatingFuel
Cooling Plant
1A1 VAV with Reheat Atmospheric Nat. Gas Air Cooled Screw Chiller
1A2 VAV with Reheat Atmospheric Nat. Gas Water Cooled Screw Chiller
1A3 VAV with Reheat Atmospheric Nat. Gas Water Cooled Centrifugal Chiller
1B1 VAV with Reheat Power Nat. Gas Air Cooled Screw Chiller
1B2 VAV with Reheat Power Nat. Gas Water Cooled Screw Chiller
1B3 VAV with Reheat Power Nat. Gas Water Cooled Centrifugal Chiller
1C1 VAV with Reheat Electric Electric Air Cooled Screw Chiller
1C2 VAV with Reheat Electric Electric Water Cooled Screw Chiller
1C3 VAV with Reheat Electric Electric Water Cooled Centrifugal Chiller
1D1 VAV with Reheat Power Oil Air Cooled Screw Chiller
1D2 VAV with Reheat Power Oil Water Cooled Screw Chiller
1D3 VAV with Reheat Power Oil Water Cooled Centrifugal Chiller
2A1 Series Fan Powered VAV Box Atmospheric Nat. Gas Air Cooled Screw Chiller
2A2 Series Fan Powered VAV Box Atmospheric Nat. Gas Water Cooled Screw Chiller
2A3 Series Fan Powered VAV Box Atmospheric Nat. Gas Water Cooled Centrifugal Chiller
2B1 Series Fan Powered VAV Box Power Nat. Gas Air Cooled Screw Chiller
2B2 Series Fan Powered VAV Box Power Nat. Gas Water Cooled Screw Chiller
2B3 Series Fan Powered VAV Box Power Nat. Gas Water Cooled Centrifugal Chiller
2C1 Series Fan Powered VAV Box Electric Electric Air Cooled Screw Chiller
2C2 Series Fan Powered VAV Box Electric Electric Water Cooled Screw Chiller
2C3 Series Fan Powered VAV Box Electric Electric Water Cooled Centrifugal Chiller
2D1 Series Fan Powered VAV Box Power Oil Air Cooled Screw Chiller
2D2 Series Fan Powered VAV Box Power Oil Water Cooled Screw Chiller
2D3 Series Fan Powered VAV Box Power Oil Water Cooled Centrifugal Chiller
3A1 Water Source Heat Pump Atmospheric Nat. Gas
3B1 Water Source Heat Pump Power Nat. Gas
3C1 Water Source Heat Pump Electric Electric
3D1 Water Source Heat Pump Power Oil
4A1 Dual Duct VAV Atmospheric Nat. Gas Air Cooled Screw Chiller
4A2 Dual Duct VAV Atmospheric Nat. Gas Water Cooled Screw Chiller
4A3 Dual Duct VAV Atmospheric Nat. Gas Water Cooled Centrifugal Chiller
4B1 Dual Duct VAV Power Nat. Gas Air Cooled Screw Chiller
4B2 Dual Duct VAV Power Nat. Gas Water Cooled Screw Chiller
4B3 Dual Duct VAV Power Nat. Gas Water Cooled Centrifugal Chiller
4C1 Dual Duct VAV Electric Electric Air Cooled Screw Chiller
4C2 Dual Duct VAV Electric Electric Water Cooled Screw Chiller
4C3 Dual Duct VAV Electric Electric Water Cooled Centrifugal Chiller
4D1 Dual Duct VAV Power Oil Air Cooled Screw Chiller
4D2 Dual Duct VAV Power Oil Water Cooled Screw Chiller
4D3 Dual Duct VAV Power Oil Water Cooled Centrifugal Chiller
Table S-1: Summary of Plant Design Options
Energy and Cost Benefit Analyses of HVAC Systems Available to Ohio Schools
v
HAP was then run to determine building energy loads. Then HAP was loaded/matched withmechanical systems to determine hourly energy (electrical – demand/total, natural gas andheating oil) needs. Finally, this output information was imported into a MicroSoft® Excel®
spreadsheet and combined with local rate tariffs to determine annual energy costs by equipmentoption, location and type of building.
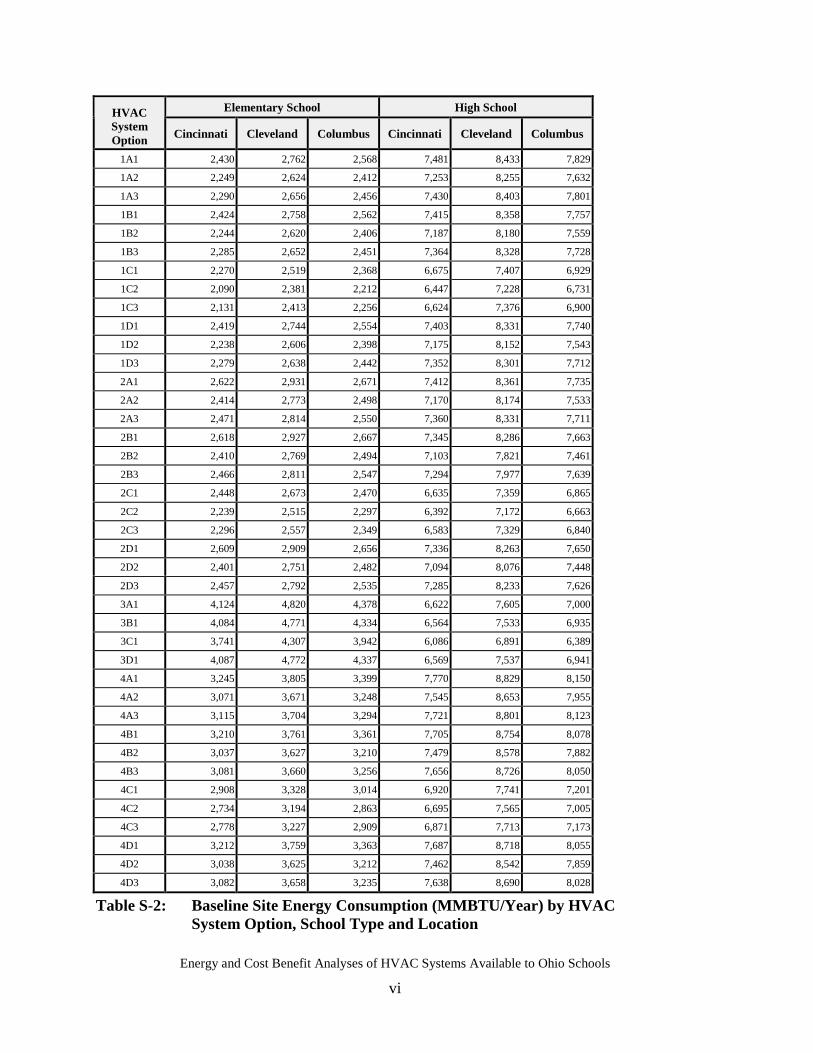
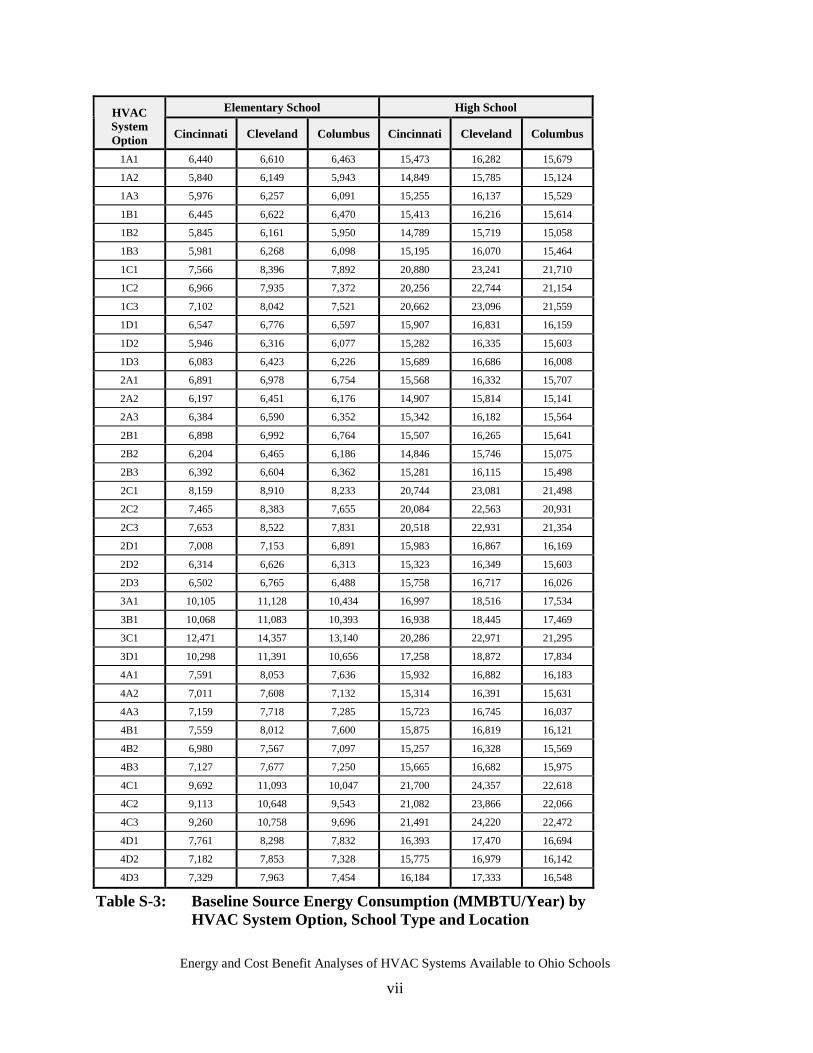
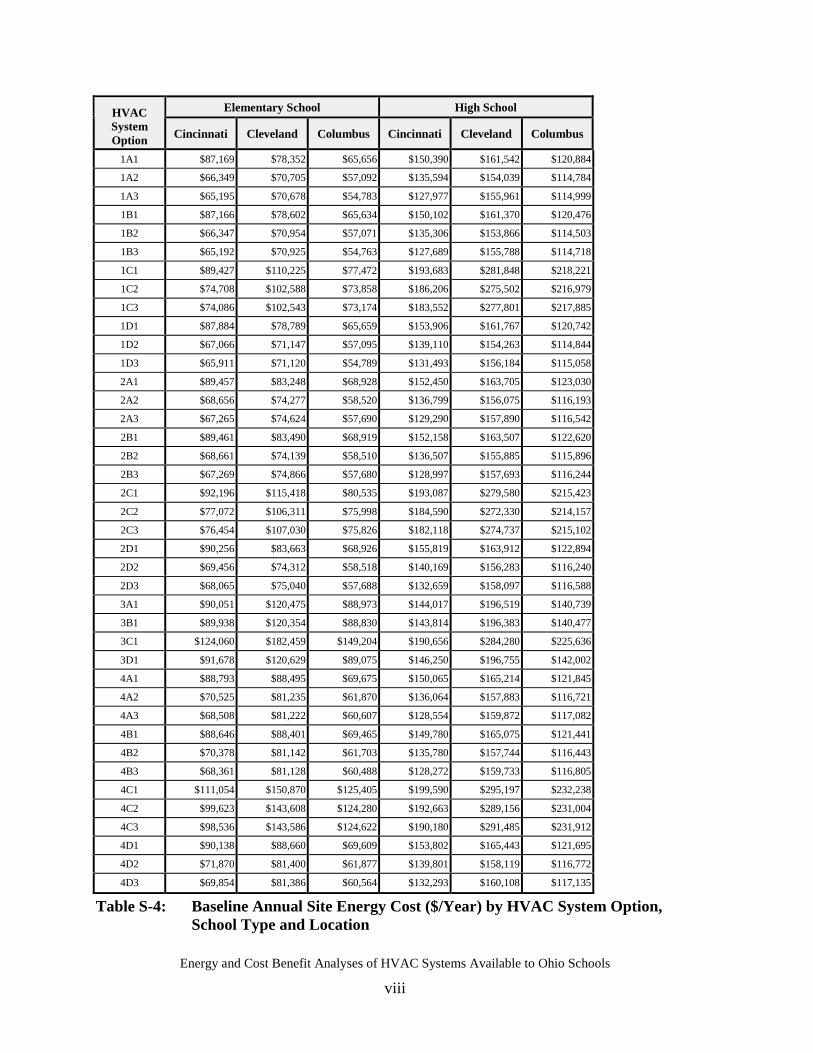
For Phase 1, HAP was operated 240 times (two building types times three cities times 40mechanical system variations). Output (Tables S-2 to S-4) from Phase 1 consisted of six sets ofannual energy consumption (site and source) and cost data (two types of buildings in three cities)for 40 different mechanical systems. This tables provided a baseline comparison of the annualenergy (site and source) and energy cost differences of one mechanical system over the other,including how energy costs for the same mechanical systems compare across the range ofweather conditions (or locations) seen across Ohio. All 240 baseline cases were used as a basisfor comparison against other alternative completed during this work and described later in thesummary. In general, all-electric systems were more expensive than other equipment options.Baseline results show the VAV reheat system utilizing a natural gas fired boiler and water cooledcentrifugal chiller have the lowest annual energy cost. The lowest cost systems in Columbus andCincinnati use a natural gas fired boiler with a power burner whereas, in Cleveland, the naturalgas boiler employs an atmospheric burner. The Cleveland data shows that area to have higherannual energy costs than Cincinnati and Columbus for similar HVAC systems; Columbus has thelowest annual energy costs.
Since annual energy costs only represent a portion of the overall cost of providing spaceconditioning to school buildings, detailed life-cycle costs were prepared for each of the 240HVAC system options modeled. Components of the life cycle analyses included:
• Equipment first costs• Annual energy costs• Annualized service and maintenance costs.
To maintain consistency in the analyses, major cost data bases were reviewed as part of thiswork. Ultimately, the 2000 edition of RSMeans CostWorks® (RSMeans 2000®) was selectedand used as a database engine for our cost estimates for equipment plant and terminal unit firstcosts and annualized service and maintenance costs. Ductwork costs were obtained fromarchitects and engineers specializing in the design of schools. All national costs were correctedby RSMeans 2000® city cost corrections for each of the three cities considered in this work.These factors were 0.958, 1.044 and 0.977 for Cincinnati, Cleveland and Columbus respectively.
Energy and Cost Benefit Analyses of HVAC Systems Available to Ohio Schools
vi
Elementary School High SchoolHVACSystemOption Cincinnati Cleveland Columbus Cincinnati Cleveland Columbus
1A1 2,430 2,762 2,568 7,481 8,433 7,829
1A2 2,249 2,624 2,412 7,253 8,255 7,632
1A3 2,290 2,656 2,456 7,430 8,403 7,801
1B1 2,424 2,758 2,562 7,415 8,358 7,757
1B2 2,244 2,620 2,406 7,187 8,180 7,559
1B3 2,285 2,652 2,451 7,364 8,328 7,728
1C1 2,270 2,519 2,368 6,675 7,407 6,929
1C2 2,090 2,381 2,212 6,447 7,228 6,731
1C3 2,131 2,413 2,256 6,624 7,376 6,900
1D1 2,419 2,744 2,554 7,403 8,331 7,740
1D2 2,238 2,606 2,398 7,175 8,152 7,543
1D3 2,279 2,638 2,442 7,352 8,301 7,712
2A1 2,622 2,931 2,671 7,412 8,361 7,735
2A2 2,414 2,773 2,498 7,170 8,174 7,533
2A3 2,471 2,814 2,550 7,360 8,331 7,711
2B1 2,618 2,927 2,667 7,345 8,286 7,663
2B2 2,410 2,769 2,494 7,103 7,821 7,461
2B3 2,466 2,811 2,547 7,294 7,977 7,639
2C1 2,448 2,673 2,470 6,635 7,359 6,865
2C2 2,239 2,515 2,297 6,392 7,172 6,663
2C3 2,296 2,557 2,349 6,583 7,329 6,840
2D1 2,609 2,909 2,656 7,336 8,263 7,650
2D2 2,401 2,751 2,482 7,094 8,076 7,448
2D3 2,457 2,792 2,535 7,285 8,233 7,626
3A1 4,124 4,820 4,378 6,622 7,605 7,000
3B1 4,084 4,771 4,334 6,564 7,533 6,935
3C1 3,741 4,307 3,942 6,086 6,891 6,389
3D1 4,087 4,772 4,337 6,569 7,537 6,941
4A1 3,245 3,805 3,399 7,770 8,829 8,150
4A2 3,071 3,671 3,248 7,545 8,653 7,955
4A3 3,115 3,704 3,294 7,721 8,801 8,123
4B1 3,210 3,761 3,361 7,705 8,754 8,078
4B2 3,037 3,627 3,210 7,479 8,578 7,882
4B3 3,081 3,660 3,256 7,656 8,726 8,050
4C1 2,908 3,328 3,014 6,920 7,741 7,201
4C2 2,734 3,194 2,863 6,695 7,565 7,005
4C3 2,778 3,227 2,909 6,871 7,713 7,173
4D1 3,212 3,759 3,363 7,687 8,718 8,055
4D2 3,038 3,625 3,212 7,462 8,542 7,859
4D3 3,082 3,658 3,235 7,638 8,690 8,028
Table S-2: Baseline Site Energy Consumption (MMBTU/Year) by HVACSystem Option, School Type and Location
Energy and Cost Benefit Analyses of HVAC Systems Available to Ohio Schools
vii
Elementary School High SchoolHVACSystemOption Cincinnati Cleveland Columbus Cincinnati Cleveland Columbus
1A1 6,440 6,610 6,463 15,473 16,282 15,679
1A2 5,840 6,149 5,943 14,849 15,785 15,124
1A3 5,976 6,257 6,091 15,255 16,137 15,529
1B1 6,445 6,622 6,470 15,413 16,216 15,614
1B2 5,845 6,161 5,950 14,789 15,719 15,058
1B3 5,981 6,268 6,098 15,195 16,070 15,464
1C1 7,566 8,396 7,892 20,880 23,241 21,710
1C2 6,966 7,935 7,372 20,256 22,744 21,154
1C3 7,102 8,042 7,521 20,662 23,096 21,559
1D1 6,547 6,776 6,597 15,907 16,831 16,159
1D2 5,946 6,316 6,077 15,282 16,335 15,603
1D3 6,083 6,423 6,226 15,689 16,686 16,008
2A1 6,891 6,978 6,754 15,568 16,332 15,707
2A2 6,197 6,451 6,176 14,907 15,814 15,141
2A3 6,384 6,590 6,352 15,342 16,182 15,564
2B1 6,898 6,992 6,764 15,507 16,265 15,641
2B2 6,204 6,465 6,186 14,846 15,746 15,075
2B3 6,392 6,604 6,362 15,281 16,115 15,498
2C1 8,159 8,910 8,233 20,744 23,081 21,498
2C2 7,465 8,383 7,655 20,084 22,563 20,931
2C3 7,653 8,522 7,831 20,518 22,931 21,354
2D1 7,008 7,153 6,891 15,983 16,867 16,169
2D2 6,314 6,626 6,313 15,323 16,349 15,603
2D3 6,502 6,765 6,488 15,758 16,717 16,026
3A1 10,105 11,128 10,434 16,997 18,516 17,534
3B1 10,068 11,083 10,393 16,938 18,445 17,469
3C1 12,471 14,357 13,140 20,286 22,971 21,295
3D1 10,298 11,391 10,656 17,258 18,872 17,834
4A1 7,591 8,053 7,636 15,932 16,882 16,183
4A2 7,011 7,608 7,132 15,314 16,391 15,631
4A3 7,159 7,718 7,285 15,723 16,745 16,037
4B1 7,559 8,012 7,600 15,875 16,819 16,121
4B2 6,980 7,567 7,097 15,257 16,328 15,569
4B3 7,127 7,677 7,250 15,665 16,682 15,975
4C1 9,692 11,093 10,047 21,700 24,357 22,618
4C2 9,113 10,648 9,543 21,082 23,866 22,066
4C3 9,260 10,758 9,696 21,491 24,220 22,472
4D1 7,761 8,298 7,832 16,393 17,470 16,694
4D2 7,182 7,853 7,328 15,775 16,979 16,142
4D3 7,329 7,963 7,454 16,184 17,333 16,548
Table S-3: Baseline Source Energy Consumption (MMBTU/Year) byHVAC System Option, School Type and Location
Energy and Cost Benefit Analyses of HVAC Systems Available to Ohio Schools
viii
Elementary School High SchoolHVACSystemOption Cincinnati Cleveland Columbus Cincinnati Cleveland Columbus
1A1 $87,169 $78,352 $65,656 $150,390 $161,542 $120,884
1A2 $66,349 $70,705 $57,092 $135,594 $154,039 $114,784
1A3 $65,195 $70,678 $54,783 $127,977 $155,961 $114,999
1B1 $87,166 $78,602 $65,634 $150,102 $161,370 $120,476
1B2 $66,347 $70,954 $57,071 $135,306 $153,866 $114,503
1B3 $65,192 $70,925 $54,763 $127,689 $155,788 $114,718
1C1 $89,427 $110,225 $77,472 $193,683 $281,848 $218,221
1C2 $74,708 $102,588 $73,858 $186,206 $275,502 $216,979
1C3 $74,086 $102,543 $73,174 $183,552 $277,801 $217,885
1D1 $87,884 $78,789 $65,659 $153,906 $161,767 $120,742
1D2 $67,066 $71,147 $57,095 $139,110 $154,263 $114,844
1D3 $65,911 $71,120 $54,789 $131,493 $156,184 $115,058
2A1 $89,457 $83,248 $68,928 $152,450 $163,705 $123,030
2A2 $68,656 $74,277 $58,520 $136,799 $156,075 $116,193
2A3 $67,265 $74,624 $57,690 $129,290 $157,890 $116,542
2B1 $89,461 $83,490 $68,919 $152,158 $163,507 $122,620
2B2 $68,661 $74,139 $58,510 $136,507 $155,885 $115,896
2B3 $67,269 $74,866 $57,680 $128,997 $157,693 $116,244
2C1 $92,196 $115,418 $80,535 $193,087 $279,580 $215,423
2C2 $77,072 $106,311 $75,998 $184,590 $272,330 $214,157
2C3 $76,454 $107,030 $75,826 $182,118 $274,737 $215,102
2D1 $90,256 $83,663 $68,926 $155,819 $163,912 $122,894
2D2 $69,456 $74,312 $58,518 $140,169 $156,283 $116,240
2D3 $68,065 $75,040 $57,688 $132,659 $158,097 $116,588
3A1 $90,051 $120,475 $88,973 $144,017 $196,519 $140,739
3B1 $89,938 $120,354 $88,830 $143,814 $196,383 $140,477
3C1 $124,060 $182,459 $149,204 $190,656 $284,280 $225,636
3D1 $91,678 $120,629 $89,075 $146,250 $196,755 $142,002
4A1 $88,793 $88,495 $69,675 $150,065 $165,214 $121,845
4A2 $70,525 $81,235 $61,870 $136,064 $157,883 $116,721
4A3 $68,508 $81,222 $60,607 $128,554 $159,872 $117,082
4B1 $88,646 $88,401 $69,465 $149,780 $165,075 $121,441
4B2 $70,378 $81,142 $61,703 $135,780 $157,744 $116,443
4B3 $68,361 $81,128 $60,488 $128,272 $159,733 $116,805
4C1 $111,054 $150,870 $125,405 $199,590 $295,197 $232,238
4C2 $99,623 $143,608 $124,280 $192,663 $289,156 $231,004
4C3 $98,536 $143,586 $124,622 $190,180 $291,485 $231,912
4D1 $90,138 $88,660 $69,609 $153,802 $165,443 $121,695
4D2 $71,870 $81,400 $61,877 $139,801 $158,119 $116,772
4D3 $69,854 $81,386 $60,564 $132,293 $160,108 $117,135
Table S-4: Baseline Annual Site Energy Cost ($/Year) by HVAC System Option,School Type and Location
Energy and Cost Benefit Analyses of HVAC Systems Available to Ohio Schools
ix
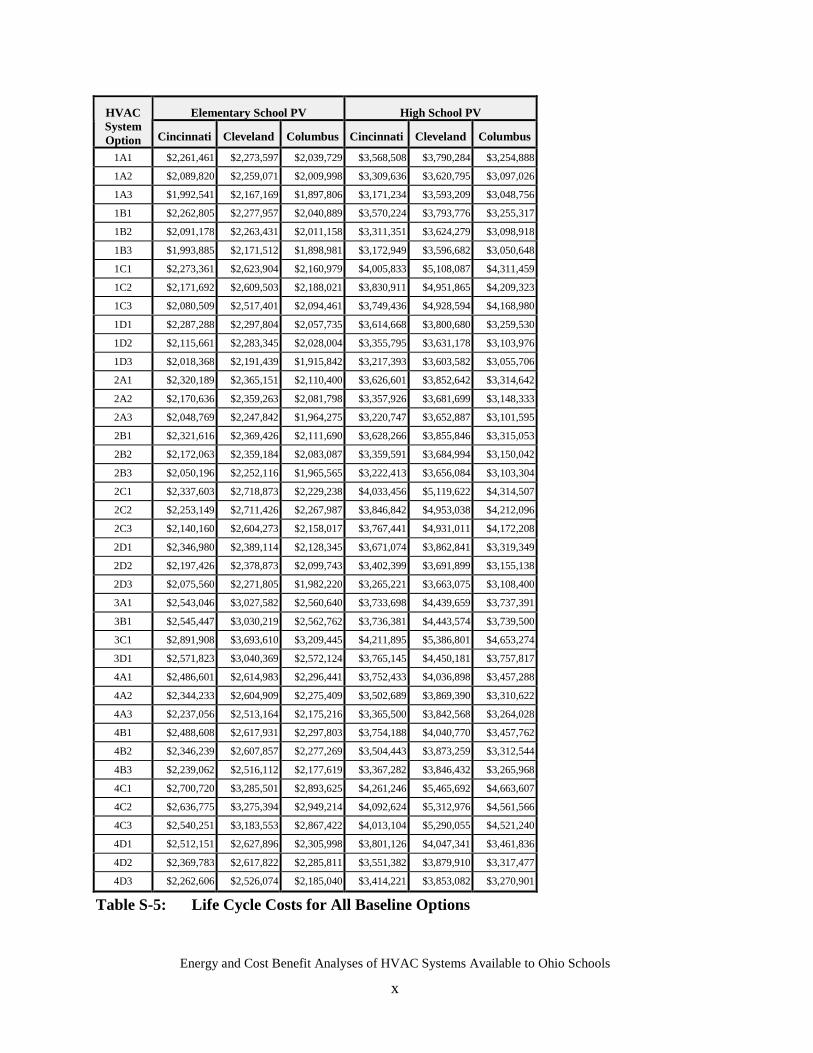
Equipment first costs included three major elements:
• Plant (heating and cooling plant equipment)• Ductwork• Terminal units
Plant first costs were derived by developing cost versus size curve-fits from RSMeans 2000®
databases and then applying these curves to the size of the plant equipment for a particularHVAC option. For each of the four heat pump HVAC cases, 76 separate heat pumps were sizedand costed for the elementary school and 99 heat pumps were sized and costed for the highschool. These numbers reflect the number of zones designed into each building. Ductwork costswere based on cost per square foot for the four air systems considered. Terminal units werecosted similarly to the plant equipment, sizing was taken from architect drawing schedules andfrom our own modeling. For each option, the life cycle cost was calculated as the sum of:
• Total equipment first costs• 20 years of energy savings discounted 6% per year• 20 years of service, repair and replacement annualized costs
Results of life-cycle cost calculations for the elementary and the high school are summarized inTable S-5.
For the elementary school, the least cost life-cycle system was $1,897,806 (Columbus, 1A3HVAC option) and the highest cost life-cycle system was $3,693,610 (Cleveland, 3C1 HVACoption). The highest cost HVAC options were 45%, 70% and 69% higher than the lower costHVAC options respectively. For the high school, the least cost life-cycle system was $3,048,756(Columbus, 1A3 HVAC option) and the highest cost life-cycle system was $5,465,692(Cleveland, 3C1 HVAC option). This implies that the highest cost HVAC options were 34%,52% and 53% higher than the lower cost HVAC options respectively.
Energy and Cost Benefit Analyses of HVAC Systems Available to Ohio Schools
x
Elementary School PV High School PVHVACSystemOption Cincinnati Cleveland Columbus Cincinnati Cleveland Columbus
1A1 $2,261,461 $2,273,597 $2,039,729 $3,568,508 $3,790,284 $3,254,888
1A2 $2,089,820 $2,259,071 $2,009,998 $3,309,636 $3,620,795 $3,097,026
1A3 $1,992,541 $2,167,169 $1,897,806 $3,171,234 $3,593,209 $3,048,756
1B1 $2,262,805 $2,277,957 $2,040,889 $3,570,224 $3,793,776 $3,255,317
1B2 $2,091,178 $2,263,431 $2,011,158 $3,311,351 $3,624,279 $3,098,918
1B3 $1,993,885 $2,171,512 $1,898,981 $3,172,949 $3,596,682 $3,050,648
1C1 $2,273,361 $2,623,904 $2,160,979 $4,005,833 $5,108,087 $4,311,459
1C2 $2,171,692 $2,609,503 $2,188,021 $3,830,911 $4,951,865 $4,209,323
1C3 $2,080,509 $2,517,401 $2,094,461 $3,749,436 $4,928,594 $4,168,980
1D1 $2,287,288 $2,297,804 $2,057,735 $3,614,668 $3,800,680 $3,259,530
1D2 $2,115,661 $2,283,345 $2,028,004 $3,355,795 $3,631,178 $3,103,976
1D3 $2,018,368 $2,191,439 $1,915,842 $3,217,393 $3,603,582 $3,055,706
2A1 $2,320,189 $2,365,151 $2,110,400 $3,626,601 $3,852,642 $3,314,642
2A2 $2,170,636 $2,359,263 $2,081,798 $3,357,926 $3,681,699 $3,148,333
2A3 $2,048,769 $2,247,842 $1,964,275 $3,220,747 $3,652,887 $3,101,595
2B1 $2,321,616 $2,369,426 $2,111,690 $3,628,266 $3,855,846 $3,315,053
2B2 $2,172,063 $2,359,184 $2,083,087 $3,359,591 $3,684,994 $3,150,042
2B3 $2,050,196 $2,252,116 $1,965,565 $3,222,413 $3,656,084 $3,103,304
2C1 $2,337,603 $2,718,873 $2,229,238 $4,033,456 $5,119,622 $4,314,507
2C2 $2,253,149 $2,711,426 $2,267,987 $3,846,842 $4,953,038 $4,212,096
2C3 $2,140,160 $2,604,273 $2,158,017 $3,767,441 $4,931,011 $4,172,208
2D1 $2,346,980 $2,389,114 $2,128,345 $3,671,074 $3,862,841 $3,319,349
2D2 $2,197,426 $2,378,873 $2,099,743 $3,402,399 $3,691,899 $3,155,138
2D3 $2,075,560 $2,271,805 $1,982,220 $3,265,221 $3,663,075 $3,108,400
3A1 $2,543,046 $3,027,582 $2,560,640 $3,733,698 $4,439,659 $3,737,391
3B1 $2,545,447 $3,030,219 $2,562,762 $3,736,381 $4,443,574 $3,739,500
3C1 $2,891,908 $3,693,610 $3,209,445 $4,211,895 $5,386,801 $4,653,274
3D1 $2,571,823 $3,040,369 $2,572,124 $3,765,145 $4,450,181 $3,757,817
4A1 $2,486,601 $2,614,983 $2,296,441 $3,752,433 $4,036,898 $3,457,288
4A2 $2,344,233 $2,604,909 $2,275,409 $3,502,689 $3,869,390 $3,310,622
4A3 $2,237,056 $2,513,164 $2,175,216 $3,365,500 $3,842,568 $3,264,028
4B1 $2,488,608 $2,617,931 $2,297,803 $3,754,188 $4,040,770 $3,457,762
4B2 $2,346,239 $2,607,857 $2,277,269 $3,504,443 $3,873,259 $3,312,544
4B3 $2,239,062 $2,516,112 $2,177,619 $3,367,282 $3,846,432 $3,265,968
4C1 $2,700,720 $3,285,501 $2,893,625 $4,261,246 $5,465,692 $4,663,607
4C2 $2,636,775 $3,275,394 $2,949,214 $4,092,624 $5,312,976 $4,561,566
4C3 $2,540,251 $3,183,553 $2,867,422 $4,013,104 $5,290,055 $4,521,240
4D1 $2,512,151 $2,627,896 $2,305,998 $3,801,126 $4,047,341 $3,461,836
4D2 $2,369,783 $2,617,822 $2,285,811 $3,551,382 $3,879,910 $3,317,477
4D3 $2,262,606 $2,526,074 $2,185,040 $3,414,221 $3,853,082 $3,270,901
Table S-5: Life Cycle Costs for All Baseline Options
Energy and Cost Benefit Analyses of HVAC Systems Available to Ohio Schools
xi
For Phase 2 and supplemental activities, the HAP model was re-run several thousand times underfive separate scenarios to determine the benefits, or costs of these scenarios against baselineannual energy costs or life-cycle costs. These five scenarios included consideration of the use of:
• Controls to minimize use of peak electric power• Enthalpy heat recovery equipment• Reducing, or increasing, the amount of ventilation air to simulate IAQ impacts.• Geothermal heat pump equipment• Impacts of two daylighting approaches on annual energy costs.
For the enthalpy heat recovery case, HAP was re-run 240 times to determine the change inannual energy costs should heat recovery equipment be installed into both building types. In thecontrols case, HAP was again re-run 240 times to determine the possible annual energy savingsassociated with either using special electric rates (Cleveland and Cincinnati) or moving peakpower off peak (Columbus). In the ventilation air case, HAP was re-run 80 times for a prototypehigh school located in Columbus, OH to evaluate the economic impacts of both less ventilationair (10 CFM/person vs 15 CFM/person base case) or increased ventilation air (20 CFM/person vs15 CFM/person). Geothermal heat pump systems are of increasing interest due to claimsregarding reduced energy consumption, lower annual energy costs and lower overall life cyclecosts compared to other conventional systems. HAP was modified and rerun six times (twobuildings in three cities) to determine annual energy costs and cost comparisons against thebaseline systems considered earlier. Several recent studies have shown that certain types ofdaylighting improve standardized student test scores. As part of this work, two types ofdaylighting were evaluated to determine the annual energy costs. Findings from all five of thesescenarios follow:
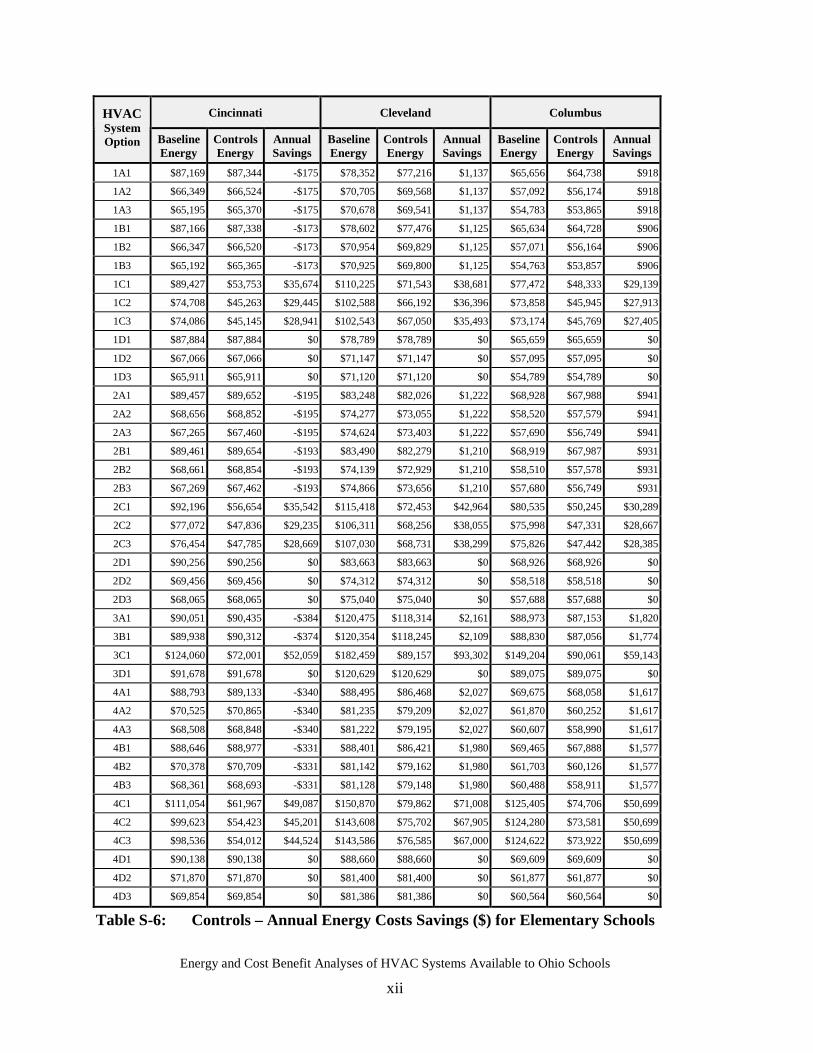
Controls:As seen in the baseline analyses, much of the annual energy costs, and cost differences can betraced to electrical energy consumption, particularly differences in peak power usage (i.e.,demand charges). In this section, the impacts of alternate electric rate structures associated withcontrolling electric demand power was evaluated.
In Cleveland, if certain electric loads are metered using a second meter, then that load can bebilled at a lower, second meter, rate. The Cleveland Electric Illuminating (CEI) Electric SpaceConditioning Schedule is available and applicable to schools (new and existing) that are wiredsuch that space heating and air conditioning equipment can be separately metered. Waterheating equipment may also be separately metered.
Cincinnati Gas and Electric (CG&E) offers an optional electric rate for facilities using electricspace heating. This “EH” rate is available to any public school, parochial school, private schoolor church; the entity simply requests the “EH” rate from CG&E. For Columbus, actual demandcontrol would be needed to obtain special rates.
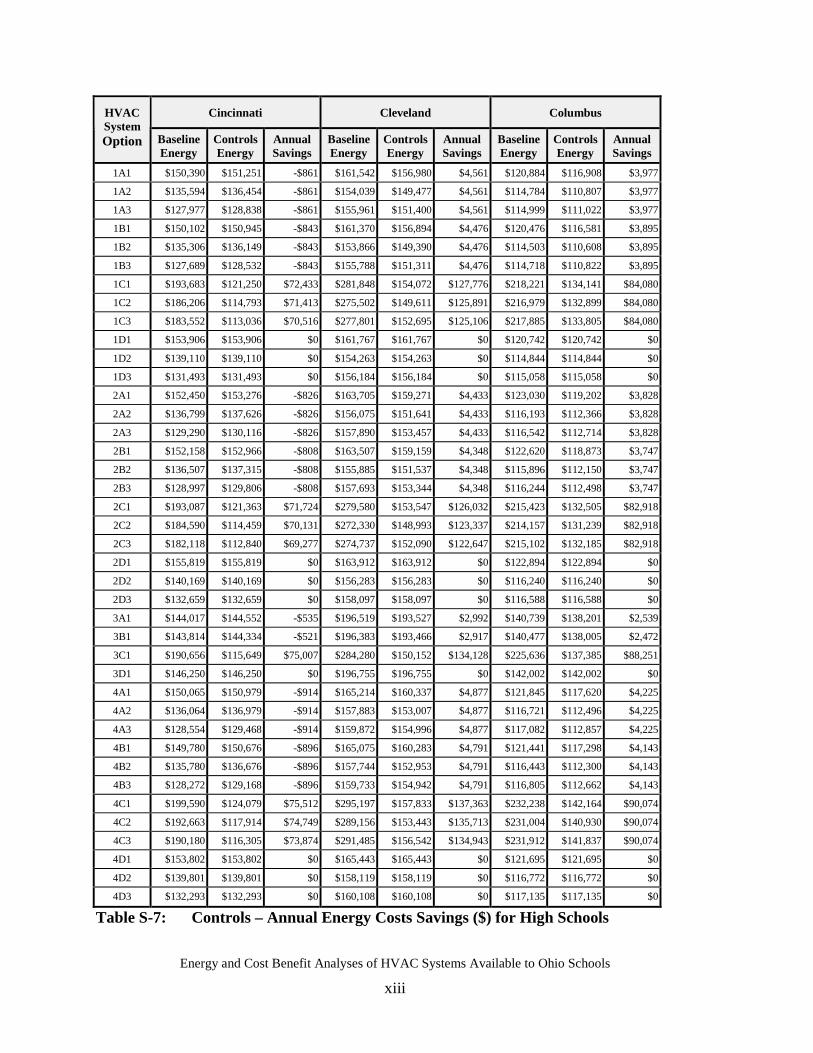
Annual controls energy cost savings for the elementary school and the high school aresummarized in Tables S-6 and S-7. Economic benefits (net present values and paybacks) aresummarized in Tables S-8 and S-9. Detailed benefits were only calculated for Cleveland, thebenefits in Cincinnati are instantaneous since they involve no first costs. Values were notcalculated for Columbus.
Energy and Cost Benefit Analyses of HVAC Systems Available to Ohio Schools
xii
Cincinnati Cleveland ColumbusHVACSystemOption Baseline
EnergyControlsEnergy
AnnualSavings
BaselineEnergy
ControlsEnergy
AnnualSavings
BaselineEnergy
ControlsEnergy
AnnualSavings
1A1 $87,169 $87,344 -$175 $78,352 $77,216 $1,137 $65,656 $64,738 $918
1A2 $66,349 $66,524 -$175 $70,705 $69,568 $1,137 $57,092 $56,174 $918
1A3 $65,195 $65,370 -$175 $70,678 $69,541 $1,137 $54,783 $53,865 $918
1B1 $87,166 $87,338 -$173 $78,602 $77,476 $1,125 $65,634 $64,728 $906
1B2 $66,347 $66,520 -$173 $70,954 $69,829 $1,125 $57,071 $56,164 $906
1B3 $65,192 $65,365 -$173 $70,925 $69,800 $1,125 $54,763 $53,857 $906
1C1 $89,427 $53,753 $35,674 $110,225 $71,543 $38,681 $77,472 $48,333 $29,139
1C2 $74,708 $45,263 $29,445 $102,588 $66,192 $36,396 $73,858 $45,945 $27,913
1C3 $74,086 $45,145 $28,941 $102,543 $67,050 $35,493 $73,174 $45,769 $27,405
1D1 $87,884 $87,884 $0 $78,789 $78,789 $0 $65,659 $65,659 $0
1D2 $67,066 $67,066 $0 $71,147 $71,147 $0 $57,095 $57,095 $0
1D3 $65,911 $65,911 $0 $71,120 $71,120 $0 $54,789 $54,789 $0
2A1 $89,457 $89,652 -$195 $83,248 $82,026 $1,222 $68,928 $67,988 $941
2A2 $68,656 $68,852 -$195 $74,277 $73,055 $1,222 $58,520 $57,579 $941
2A3 $67,265 $67,460 -$195 $74,624 $73,403 $1,222 $57,690 $56,749 $941
2B1 $89,461 $89,654 -$193 $83,490 $82,279 $1,210 $68,919 $67,987 $931
2B2 $68,661 $68,854 -$193 $74,139 $72,929 $1,210 $58,510 $57,578 $931
2B3 $67,269 $67,462 -$193 $74,866 $73,656 $1,210 $57,680 $56,749 $931
2C1 $92,196 $56,654 $35,542 $115,418 $72,453 $42,964 $80,535 $50,245 $30,289
2C2 $77,072 $47,836 $29,235 $106,311 $68,256 $38,055 $75,998 $47,331 $28,667
2C3 $76,454 $47,785 $28,669 $107,030 $68,731 $38,299 $75,826 $47,442 $28,385
2D1 $90,256 $90,256 $0 $83,663 $83,663 $0 $68,926 $68,926 $0
2D2 $69,456 $69,456 $0 $74,312 $74,312 $0 $58,518 $58,518 $0
2D3 $68,065 $68,065 $0 $75,040 $75,040 $0 $57,688 $57,688 $0
3A1 $90,051 $90,435 -$384 $120,475 $118,314 $2,161 $88,973 $87,153 $1,820
3B1 $89,938 $90,312 -$374 $120,354 $118,245 $2,109 $88,830 $87,056 $1,774
3C1 $124,060 $72,001 $52,059 $182,459 $89,157 $93,302 $149,204 $90,061 $59,143
3D1 $91,678 $91,678 $0 $120,629 $120,629 $0 $89,075 $89,075 $0
4A1 $88,793 $89,133 -$340 $88,495 $86,468 $2,027 $69,675 $68,058 $1,617
4A2 $70,525 $70,865 -$340 $81,235 $79,209 $2,027 $61,870 $60,252 $1,617
4A3 $68,508 $68,848 -$340 $81,222 $79,195 $2,027 $60,607 $58,990 $1,617
4B1 $88,646 $88,977 -$331 $88,401 $86,421 $1,980 $69,465 $67,888 $1,577
4B2 $70,378 $70,709 -$331 $81,142 $79,162 $1,980 $61,703 $60,126 $1,577
4B3 $68,361 $68,693 -$331 $81,128 $79,148 $1,980 $60,488 $58,911 $1,577
4C1 $111,054 $61,967 $49,087 $150,870 $79,862 $71,008 $125,405 $74,706 $50,699
4C2 $99,623 $54,423 $45,201 $143,608 $75,702 $67,905 $124,280 $73,581 $50,699
4C3 $98,536 $54,012 $44,524 $143,586 $76,585 $67,000 $124,622 $73,922 $50,699
4D1 $90,138 $90,138 $0 $88,660 $88,660 $0 $69,609 $69,609 $0
4D2 $71,870 $71,870 $0 $81,400 $81,400 $0 $61,877 $61,877 $0
4D3 $69,854 $69,854 $0 $81,386 $81,386 $0 $60,564 $60,564 $0
Table S-6: Controls – Annual Energy Costs Savings ($) for Elementary Schools
Energy and Cost Benefit Analyses of HVAC Systems Available to Ohio Schools
xiii
Cincinnati Cleveland ColumbusHVACSystemOption Baseline
EnergyControlsEnergy
AnnualSavings
BaselineEnergy
ControlsEnergy
AnnualSavings
BaselineEnergy
ControlsEnergy
AnnualSavings
1A1 $150,390 $151,251 -$861 $161,542 $156,980 $4,561 $120,884 $116,908 $3,977
1A2 $135,594 $136,454 -$861 $154,039 $149,477 $4,561 $114,784 $110,807 $3,977
1A3 $127,977 $128,838 -$861 $155,961 $151,400 $4,561 $114,999 $111,022 $3,977
1B1 $150,102 $150,945 -$843 $161,370 $156,894 $4,476 $120,476 $116,581 $3,895
1B2 $135,306 $136,149 -$843 $153,866 $149,390 $4,476 $114,503 $110,608 $3,895
1B3 $127,689 $128,532 -$843 $155,788 $151,311 $4,476 $114,718 $110,822 $3,895
1C1 $193,683 $121,250 $72,433 $281,848 $154,072 $127,776 $218,221 $134,141 $84,080
1C2 $186,206 $114,793 $71,413 $275,502 $149,611 $125,891 $216,979 $132,899 $84,080
1C3 $183,552 $113,036 $70,516 $277,801 $152,695 $125,106 $217,885 $133,805 $84,080
1D1 $153,906 $153,906 $0 $161,767 $161,767 $0 $120,742 $120,742 $0
1D2 $139,110 $139,110 $0 $154,263 $154,263 $0 $114,844 $114,844 $0
1D3 $131,493 $131,493 $0 $156,184 $156,184 $0 $115,058 $115,058 $0
2A1 $152,450 $153,276 -$826 $163,705 $159,271 $4,433 $123,030 $119,202 $3,828
2A2 $136,799 $137,626 -$826 $156,075 $151,641 $4,433 $116,193 $112,366 $3,828
2A3 $129,290 $130,116 -$826 $157,890 $153,457 $4,433 $116,542 $112,714 $3,828
2B1 $152,158 $152,966 -$808 $163,507 $159,159 $4,348 $122,620 $118,873 $3,747
2B2 $136,507 $137,315 -$808 $155,885 $151,537 $4,348 $115,896 $112,150 $3,747
2B3 $128,997 $129,806 -$808 $157,693 $153,344 $4,348 $116,244 $112,498 $3,747
2C1 $193,087 $121,363 $71,724 $279,580 $153,547 $126,032 $215,423 $132,505 $82,918
2C2 $184,590 $114,459 $70,131 $272,330 $148,993 $123,337 $214,157 $131,239 $82,918
2C3 $182,118 $112,840 $69,277 $274,737 $152,090 $122,647 $215,102 $132,185 $82,918
2D1 $155,819 $155,819 $0 $163,912 $163,912 $0 $122,894 $122,894 $0
2D2 $140,169 $140,169 $0 $156,283 $156,283 $0 $116,240 $116,240 $0
2D3 $132,659 $132,659 $0 $158,097 $158,097 $0 $116,588 $116,588 $0
3A1 $144,017 $144,552 -$535 $196,519 $193,527 $2,992 $140,739 $138,201 $2,539
3B1 $143,814 $144,334 -$521 $196,383 $193,466 $2,917 $140,477 $138,005 $2,472
3C1 $190,656 $115,649 $75,007 $284,280 $150,152 $134,128 $225,636 $137,385 $88,251
3D1 $146,250 $146,250 $0 $196,755 $196,755 $0 $142,002 $142,002 $0
4A1 $150,065 $150,979 -$914 $165,214 $160,337 $4,877 $121,845 $117,620 $4,225
4A2 $136,064 $136,979 -$914 $157,883 $153,007 $4,877 $116,721 $112,496 $4,225
4A3 $128,554 $129,468 -$914 $159,872 $154,996 $4,877 $117,082 $112,857 $4,225
4B1 $149,780 $150,676 -$896 $165,075 $160,283 $4,791 $121,441 $117,298 $4,143
4B2 $135,780 $136,676 -$896 $157,744 $152,953 $4,791 $116,443 $112,300 $4,143
4B3 $128,272 $129,168 -$896 $159,733 $154,942 $4,791 $116,805 $112,662 $4,143
4C1 $199,590 $124,079 $75,512 $295,197 $157,833 $137,363 $232,238 $142,164 $90,074
4C2 $192,663 $117,914 $74,749 $289,156 $153,443 $135,713 $231,004 $140,930 $90,074
4C3 $190,180 $116,305 $73,874 $291,485 $156,542 $134,943 $231,912 $141,837 $90,074
4D1 $153,802 $153,802 $0 $165,443 $165,443 $0 $121,695 $121,695 $0
4D2 $139,801 $139,801 $0 $158,119 $158,119 $0 $116,772 $116,772 $0
4D3 $132,293 $132,293 $0 $160,108 $160,108 $0 $117,135 $117,135 $0
Table S-7: Controls – Annual Energy Costs Savings ($) for High Schools

Energy and Cost Benefit Analyses of HVAC Systems Available to Ohio Schools
xiv
Elementary School - Controls - NPV Elementary School - Controls - PBHVACSystemOption Cleveland Cincinnati Columbus Cleveland Cincinnati Columbus
1A1 ($79,854) ($2,007) N/A 81.7 N/A N/A
1A2 ($79,854) ($2,007) N/A 81.7 N/A N/A
1A3 ($79,854) ($2,007) N/A 81.7 N/A N/A
1B1 ($79,985) ($1,980) N/A 82.5 N/A N/A
1B2 ($79,985) ($1,980) N/A 82.5 N/A N/A
1B3 ($79,985) ($1,980) N/A 82.5 N/A N/A
1C1 $350,775 $409,182 N/A 2.4 0.0 N/A
1C2 $324,562 $337,731 N/A 2.6 0.0 N/A
1C3 $314,212 $331,947 N/A 2.6 0.0 N/A
1D1 ($92,894) $0 N/A N/A N/A N/A
1D2 ($92,894) $0 N/A N/A N/A N/A
1D3 ($92,894) $0 N/A N/A N/A N/A
2A1 ($78,880) ($2,239) N/A 76.0 N/A N/A
2A2 ($78,880) ($2,239) N/A 76.0 N/A N/A
2A3 ($78,880) ($2,239) N/A 76.0 N/A N/A
2B1 ($79,011) ($2,214) N/A 76.7 N/A N/A
2B2 ($79,011) ($2,214) N/A 76.7 N/A N/A
2B3 ($79,011) ($2,214) N/A 76.7 N/A N/A
2C1 $399,904 $407,661 N/A 2.2 0.0 N/A
2C2 $343,591 $335,326 N/A 2.4 0.0 N/A
2C3 $346,398 $328,828 N/A 2.4 0.0 N/A
2D1 ($92,894) $0 N/A N/A N/A N/A
2D2 ($92,894) $0 N/A N/A N/A N/A
2D3 ($92,894) $0 N/A N/A N/A N/A
3A1 ($68,105) ($4,403) N/A 43.0 N/A N/A
3B1 ($68,699) ($4,288) N/A 44.0 N/A N/A
3C1 $977,274 $597,108 N/A 1.0 0.0 N/A
3D1 ($92,894) $0 N/A N/A N/A N/A
4A1 ($69,648) ($3,900) N/A 45.8 N/A N/A
4A2 ($69,648) ($3,900) N/A 45.8 N/A N/A
4A3 ($69,648) ($3,900) N/A 45.8 N/A N/A
4B1 ($70,184) ($3,801) N/A 46.9 N/A N/A
4B2 ($70,184) ($3,801) N/A 46.9 N/A N/A
4B3 ($70,184) ($3,801) N/A 46.9 N/A N/A
4C1 $721,560 $563,020 N/A 1.3 0.0 N/A
4C2 $685,973 $518,451 N/A 1.4 0.0 N/A
4C3 $675,597 $510,688 N/A 1.4 0.0 N/A
4D1 ($92,894) $0 N/A N/A N/A N/A
4D2 ($92,894) $0 N/A N/A N/A N/A
4D3 ($92,894) $0 N/A N/A N/A N/A
Table S-8: Controls – Net Present Value and Payback Results for Elementary Schools

Energy and Cost Benefit Analyses of HVAC Systems Available to Ohio Schools
xv
High School - Controls - NPV High School - Controls - PBHVACSystemOption Cleveland Cincinnati Columbus Cleveland Cincinnati Columbus
1A1 ($68,680) ($9,871) N/A 26.5 N/A N/A
1A2 ($68,680) ($9,871) N/A 26.5 N/A N/A
1A3 ($68,680) ($9,871) N/A 26.5 N/A N/A
1B1 ($69,658) ($9,665) N/A 27.0 N/A N/A
1B2 ($69,658) ($9,665) N/A 27.0 N/A N/A
1B3 ($69,658) ($9,665) N/A 27.0 N/A N/A
1C1 $1,344,586 $830,797 N/A 0.9 0.0 N/A
1C2 $1,322,962 $819,098 N/A 1.0 0.0 N/A
1C3 $1,313,956 $808,813 N/A 1.0 0.0 N/A
1D1 ($121,000) $0 N/A N/A N/A N/A
1D2 ($121,000) $0 N/A N/A N/A N/A
1D3 ($121,000) $0 N/A N/A N/A N/A
2A1 ($70,149) ($9,475) N/A 27.3 N/A N/A
2A2 ($70,149) ($9,475) N/A 27.3 N/A N/A
2A3 ($70,149) ($9,475) N/A 27.3 N/A N/A
2B1 ($71,125) ($9,269) N/A 27.8 N/A N/A
2B2 ($71,125) ($9,269) N/A 27.8 N/A N/A
2B3 ($71,125) ($9,269) N/A 27.8 N/A N/A
2C1 $1,324,581 $822,667 N/A 1.0 0.0 N/A
2C2 $1,293,666 $804,397 N/A 1.0 0.0 N/A
2C3 $1,285,752 $794,606 N/A 1.0 0.0 N/A
2D1 ($121,000) $0 N/A N/A N/A N/A
2D2 ($121,000) $0 N/A N/A N/A N/A
2D3 ($121,000) $0 N/A N/A N/A N/A
3A1 ($86,687) ($6,141) N/A 40.4 N/A N/A
3B1 ($87,537) ($5,975) N/A 41.5 N/A N/A
3C1 $1,417,438 $860,329 N/A 0.9 0.0 N/A
3D1 ($121,000) $0 N/A N/A N/A N/A
4A1 ($65,065) ($10,487) N/A 24.8 N/A N/A
4A2 ($65,065) ($10,487) N/A 24.8 N/A N/A
4A3 ($65,065) ($10,487) N/A 24.8 N/A N/A
4B1 ($66,045) ($10,278) N/A 25.3 N/A N/A
4B2 ($66,045) ($10,278) N/A 25.3 N/A N/A
4B3 ($66,045) ($10,278) N/A 25.3 N/A N/A
4C1 $1,454,543 $866,116 N/A 0.9 0.0 N/A
4C2 $1,435,613 $857,365 N/A 0.9 0.0 N/A
4C3 $1,426,785 $847,332 N/A 0.9 0.0 N/A
4D1 ($121,000) $0 N/A N/A N/A N/A
4D2 ($121,000) $0 N/A N/A N/A N/A
4D3 ($121,000) $0 N/A N/A N/A N/A
Table S-9: Controls – Net Present Value and Payback Results for High Schools
Energy and Cost Benefit Analyses of HVAC Systems Available to Ohio Schools
xvi
In summary, for the controls analyses, the following observations were seen:
• In general, the higher the electric demand rate structure, the greater the potential for overallenergy cost savings. Cleveland, with the highest electric rates of the three cities evaluated,provided the greatest controls annual energy cost savings opportunities. The all-electricHVAC options for both buildings always provided the greatest cost savings.
• Cleveland NPVs approached $1 million and PBs were less than one year for all-electricHVAC options. For other HVAC options the results were marginal with negative NPVs andPBs up to 42 years.
• Using alternative rate structures with demand controls, all-electric option annual operatingcosts approach the lower range of baseline annual energy cost HVAC options.
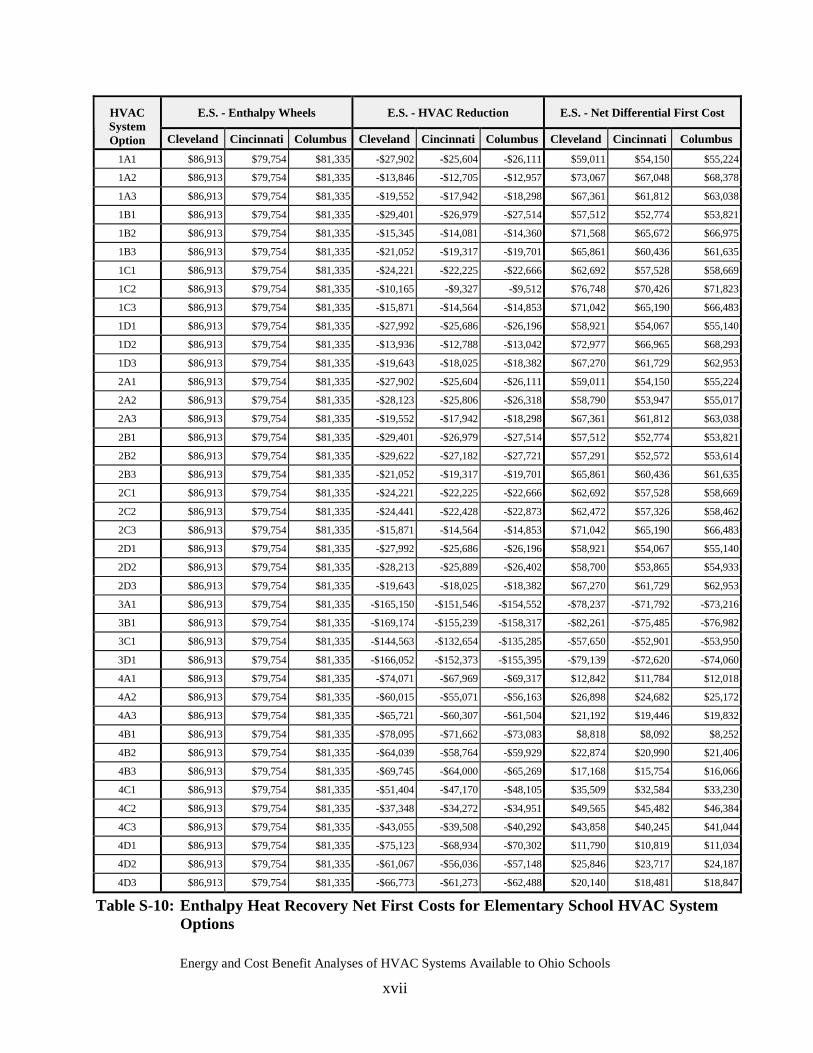
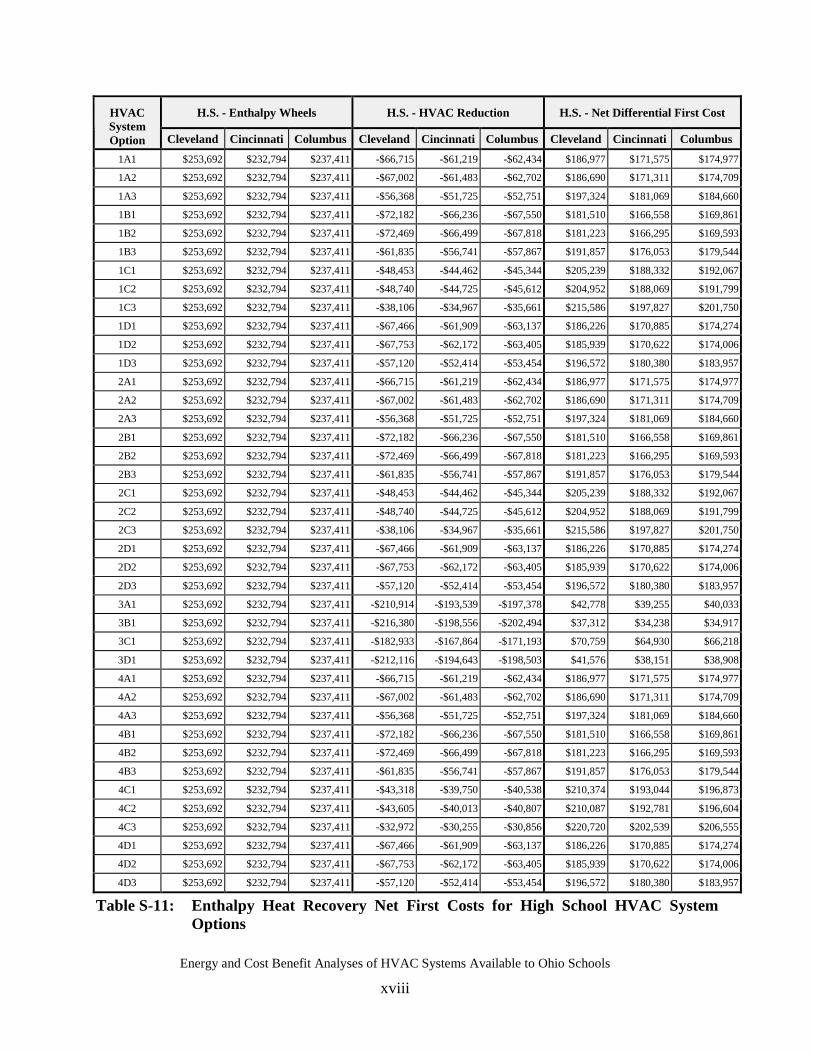
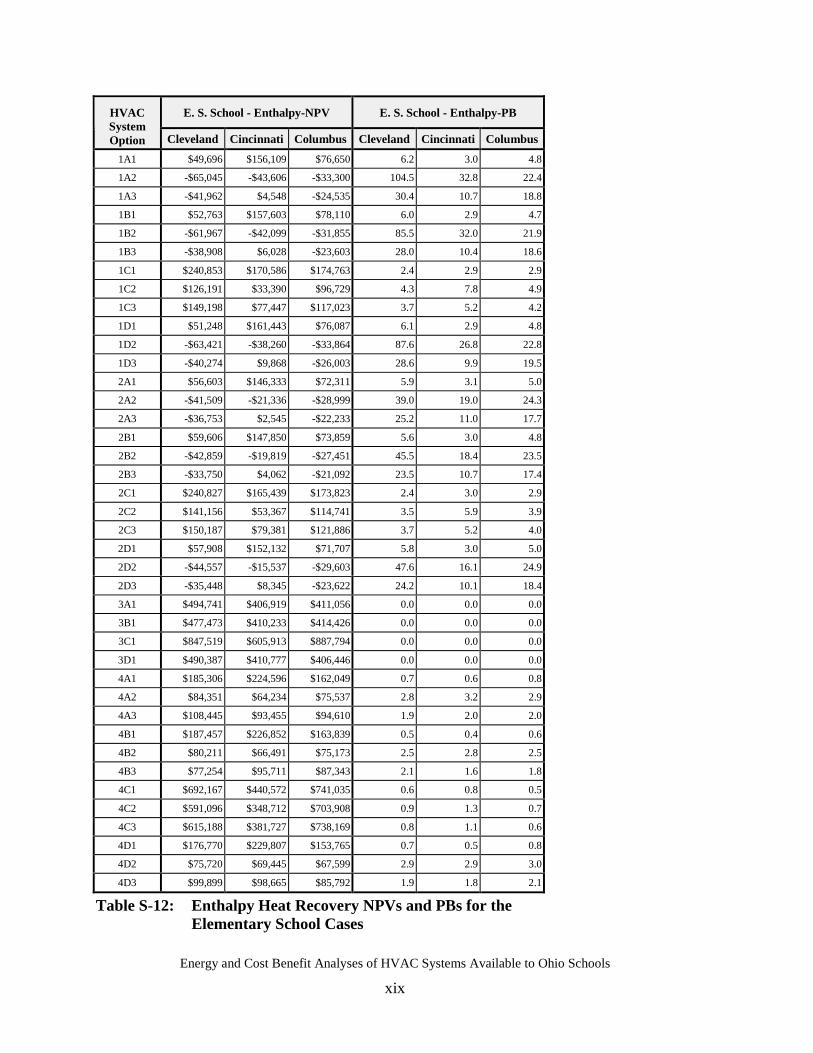
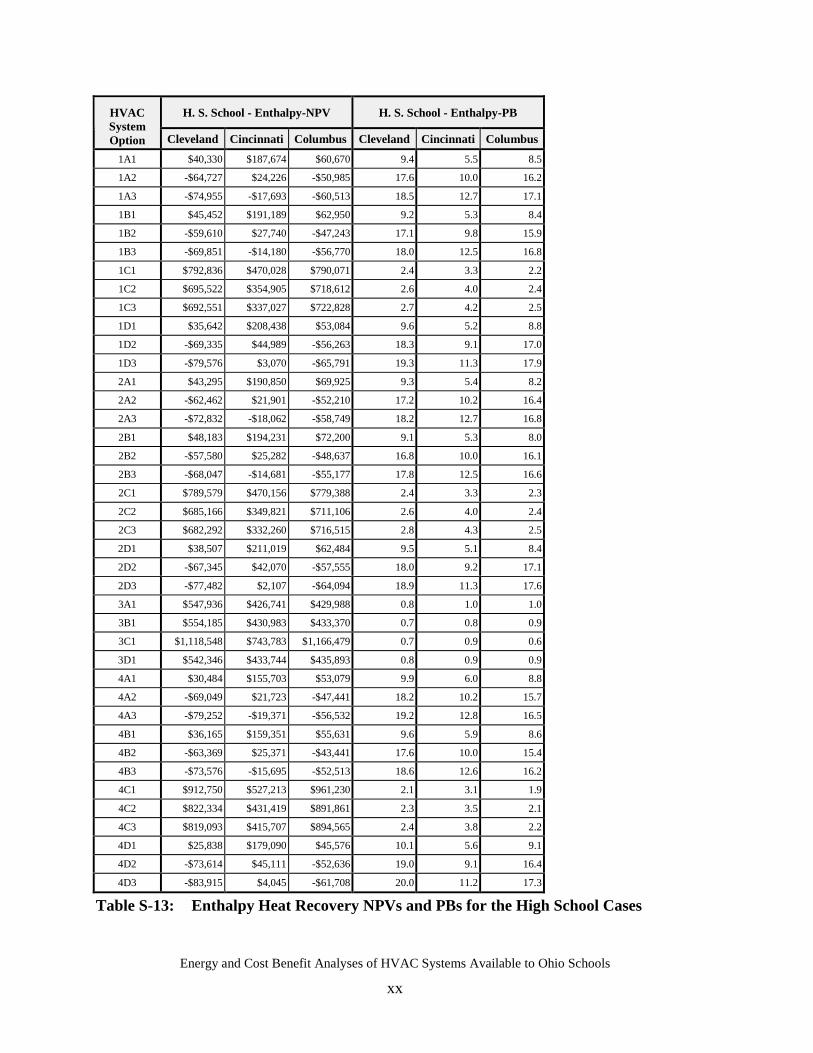
Enthalpy Heat Recovery:Enthalpy heat recovery, or air-to-air heat exchangers, are devices used to treat incoming fresh airwith exiting building air. These systems have the potential to save considerable energy. Thiswork evaluated the cost benefit of enthalpy heat recovery systems.
Given building lives in excess of 20 years, it would appear that enthalpy heat recovery should beconsidered in all high school cases and the majority of elementary school cases. For theelementary school, NPVs ranged from -$65,045 (Cleveland, 1A2) to $887,794 (Columbus, 3C1)and paybacks ranged from nearly instantaneous (Columbus, 3C1) to 104.5 years (Cleveland,1A2). However, over 75% of the cases have positive NPVs and paybacks of less than 11 years.Consistently, systems based on water-cooled screw chillers produce the poorest NPVs and PBswhile all-electric systems produce the best NPVs and PBs. For the high school, NPVs rangedfrom -$83,915 (Cleveland, 4D3) to $1,166,479 (Columbus, 3C1) and paybacks ranged fromnearly instantaneous (Columbus, 3C1) to 20.0 years (Cleveland, 1A2).
Energy and Cost Benefit Analyses of HVAC Systems Available to Ohio Schools
xvii
E.S. - Enthalpy Wheels E.S. - HVAC Reduction E.S. - Net Differential First CostHVACSystemOption Cleveland Cincinnati Columbus Cleveland Cincinnati Columbus Cleveland Cincinnati Columbus
1A1 $86,913 $79,754 $81,335 -$27,902 -$25,604 -$26,111 $59,011 $54,150 $55,224
1A2 $86,913 $79,754 $81,335 -$13,846 -$12,705 -$12,957 $73,067 $67,048 $68,378
1A3 $86,913 $79,754 $81,335 -$19,552 -$17,942 -$18,298 $67,361 $61,812 $63,038
1B1 $86,913 $79,754 $81,335 -$29,401 -$26,979 -$27,514 $57,512 $52,774 $53,821
1B2 $86,913 $79,754 $81,335 -$15,345 -$14,081 -$14,360 $71,568 $65,672 $66,975
1B3 $86,913 $79,754 $81,335 -$21,052 -$19,317 -$19,701 $65,861 $60,436 $61,635
1C1 $86,913 $79,754 $81,335 -$24,221 -$22,225 -$22,666 $62,692 $57,528 $58,669
1C2 $86,913 $79,754 $81,335 -$10,165 -$9,327 -$9,512 $76,748 $70,426 $71,823
1C3 $86,913 $79,754 $81,335 -$15,871 -$14,564 -$14,853 $71,042 $65,190 $66,483
1D1 $86,913 $79,754 $81,335 -$27,992 -$25,686 -$26,196 $58,921 $54,067 $55,140
1D2 $86,913 $79,754 $81,335 -$13,936 -$12,788 -$13,042 $72,977 $66,965 $68,293
1D3 $86,913 $79,754 $81,335 -$19,643 -$18,025 -$18,382 $67,270 $61,729 $62,953
2A1 $86,913 $79,754 $81,335 -$27,902 -$25,604 -$26,111 $59,011 $54,150 $55,224
2A2 $86,913 $79,754 $81,335 -$28,123 -$25,806 -$26,318 $58,790 $53,947 $55,017
2A3 $86,913 $79,754 $81,335 -$19,552 -$17,942 -$18,298 $67,361 $61,812 $63,038
2B1 $86,913 $79,754 $81,335 -$29,401 -$26,979 -$27,514 $57,512 $52,774 $53,821
2B2 $86,913 $79,754 $81,335 -$29,622 -$27,182 -$27,721 $57,291 $52,572 $53,614
2B3 $86,913 $79,754 $81,335 -$21,052 -$19,317 -$19,701 $65,861 $60,436 $61,635
2C1 $86,913 $79,754 $81,335 -$24,221 -$22,225 -$22,666 $62,692 $57,528 $58,669
2C2 $86,913 $79,754 $81,335 -$24,441 -$22,428 -$22,873 $62,472 $57,326 $58,462
2C3 $86,913 $79,754 $81,335 -$15,871 -$14,564 -$14,853 $71,042 $65,190 $66,483
2D1 $86,913 $79,754 $81,335 -$27,992 -$25,686 -$26,196 $58,921 $54,067 $55,140
2D2 $86,913 $79,754 $81,335 -$28,213 -$25,889 -$26,402 $58,700 $53,865 $54,933
2D3 $86,913 $79,754 $81,335 -$19,643 -$18,025 -$18,382 $67,270 $61,729 $62,953
3A1 $86,913 $79,754 $81,335 -$165,150 -$151,546 -$154,552 -$78,237 -$71,792 -$73,216
3B1 $86,913 $79,754 $81,335 -$169,174 -$155,239 -$158,317 -$82,261 -$75,485 -$76,982
3C1 $86,913 $79,754 $81,335 -$144,563 -$132,654 -$135,285 -$57,650 -$52,901 -$53,950
3D1 $86,913 $79,754 $81,335 -$166,052 -$152,373 -$155,395 -$79,139 -$72,620 -$74,060
4A1 $86,913 $79,754 $81,335 -$74,071 -$67,969 -$69,317 $12,842 $11,784 $12,018
4A2 $86,913 $79,754 $81,335 -$60,015 -$55,071 -$56,163 $26,898 $24,682 $25,172
4A3 $86,913 $79,754 $81,335 -$65,721 -$60,307 -$61,504 $21,192 $19,446 $19,832
4B1 $86,913 $79,754 $81,335 -$78,095 -$71,662 -$73,083 $8,818 $8,092 $8,252
4B2 $86,913 $79,754 $81,335 -$64,039 -$58,764 -$59,929 $22,874 $20,990 $21,406
4B3 $86,913 $79,754 $81,335 -$69,745 -$64,000 -$65,269 $17,168 $15,754 $16,066
4C1 $86,913 $79,754 $81,335 -$51,404 -$47,170 -$48,105 $35,509 $32,584 $33,230
4C2 $86,913 $79,754 $81,335 -$37,348 -$34,272 -$34,951 $49,565 $45,482 $46,384
4C3 $86,913 $79,754 $81,335 -$43,055 -$39,508 -$40,292 $43,858 $40,245 $41,044
4D1 $86,913 $79,754 $81,335 -$75,123 -$68,934 -$70,302 $11,790 $10,819 $11,034
4D2 $86,913 $79,754 $81,335 -$61,067 -$56,036 -$57,148 $25,846 $23,717 $24,187
4D3 $86,913 $79,754 $81,335 -$66,773 -$61,273 -$62,488 $20,140 $18,481 $18,847
Table S-10: Enthalpy Heat Recovery Net First Costs for Elementary School HVAC SystemOptions
Energy and Cost Benefit Analyses of HVAC Systems Available to Ohio Schools
xviii
H.S. - Enthalpy Wheels H.S. - HVAC Reduction H.S. - Net Differential First CostHVACSystemOption Cleveland Cincinnati Columbus Cleveland Cincinnati Columbus Cleveland Cincinnati Columbus
1A1 $253,692 $232,794 $237,411 -$66,715 -$61,219 -$62,434 $186,977 $171,575 $174,977
1A2 $253,692 $232,794 $237,411 -$67,002 -$61,483 -$62,702 $186,690 $171,311 $174,709
1A3 $253,692 $232,794 $237,411 -$56,368 -$51,725 -$52,751 $197,324 $181,069 $184,660
1B1 $253,692 $232,794 $237,411 -$72,182 -$66,236 -$67,550 $181,510 $166,558 $169,861
1B2 $253,692 $232,794 $237,411 -$72,469 -$66,499 -$67,818 $181,223 $166,295 $169,593
1B3 $253,692 $232,794 $237,411 -$61,835 -$56,741 -$57,867 $191,857 $176,053 $179,544
1C1 $253,692 $232,794 $237,411 -$48,453 -$44,462 -$45,344 $205,239 $188,332 $192,067
1C2 $253,692 $232,794 $237,411 -$48,740 -$44,725 -$45,612 $204,952 $188,069 $191,799
1C3 $253,692 $232,794 $237,411 -$38,106 -$34,967 -$35,661 $215,586 $197,827 $201,750
1D1 $253,692 $232,794 $237,411 -$67,466 -$61,909 -$63,137 $186,226 $170,885 $174,274
1D2 $253,692 $232,794 $237,411 -$67,753 -$62,172 -$63,405 $185,939 $170,622 $174,006
1D3 $253,692 $232,794 $237,411 -$57,120 -$52,414 -$53,454 $196,572 $180,380 $183,957
2A1 $253,692 $232,794 $237,411 -$66,715 -$61,219 -$62,434 $186,977 $171,575 $174,977
2A2 $253,692 $232,794 $237,411 -$67,002 -$61,483 -$62,702 $186,690 $171,311 $174,709
2A3 $253,692 $232,794 $237,411 -$56,368 -$51,725 -$52,751 $197,324 $181,069 $184,660
2B1 $253,692 $232,794 $237,411 -$72,182 -$66,236 -$67,550 $181,510 $166,558 $169,861
2B2 $253,692 $232,794 $237,411 -$72,469 -$66,499 -$67,818 $181,223 $166,295 $169,593
2B3 $253,692 $232,794 $237,411 -$61,835 -$56,741 -$57,867 $191,857 $176,053 $179,544
2C1 $253,692 $232,794 $237,411 -$48,453 -$44,462 -$45,344 $205,239 $188,332 $192,067
2C2 $253,692 $232,794 $237,411 -$48,740 -$44,725 -$45,612 $204,952 $188,069 $191,799
2C3 $253,692 $232,794 $237,411 -$38,106 -$34,967 -$35,661 $215,586 $197,827 $201,750
2D1 $253,692 $232,794 $237,411 -$67,466 -$61,909 -$63,137 $186,226 $170,885 $174,274
2D2 $253,692 $232,794 $237,411 -$67,753 -$62,172 -$63,405 $185,939 $170,622 $174,006
2D3 $253,692 $232,794 $237,411 -$57,120 -$52,414 -$53,454 $196,572 $180,380 $183,957
3A1 $253,692 $232,794 $237,411 -$210,914 -$193,539 -$197,378 $42,778 $39,255 $40,033
3B1 $253,692 $232,794 $237,411 -$216,380 -$198,556 -$202,494 $37,312 $34,238 $34,917
3C1 $253,692 $232,794 $237,411 -$182,933 -$167,864 -$171,193 $70,759 $64,930 $66,218
3D1 $253,692 $232,794 $237,411 -$212,116 -$194,643 -$198,503 $41,576 $38,151 $38,908
4A1 $253,692 $232,794 $237,411 -$66,715 -$61,219 -$62,434 $186,977 $171,575 $174,977
4A2 $253,692 $232,794 $237,411 -$67,002 -$61,483 -$62,702 $186,690 $171,311 $174,709
4A3 $253,692 $232,794 $237,411 -$56,368 -$51,725 -$52,751 $197,324 $181,069 $184,660
4B1 $253,692 $232,794 $237,411 -$72,182 -$66,236 -$67,550 $181,510 $166,558 $169,861
4B2 $253,692 $232,794 $237,411 -$72,469 -$66,499 -$67,818 $181,223 $166,295 $169,593
4B3 $253,692 $232,794 $237,411 -$61,835 -$56,741 -$57,867 $191,857 $176,053 $179,544
4C1 $253,692 $232,794 $237,411 -$43,318 -$39,750 -$40,538 $210,374 $193,044 $196,873
4C2 $253,692 $232,794 $237,411 -$43,605 -$40,013 -$40,807 $210,087 $192,781 $196,604
4C3 $253,692 $232,794 $237,411 -$32,972 -$30,255 -$30,856 $220,720 $202,539 $206,555
4D1 $253,692 $232,794 $237,411 -$67,466 -$61,909 -$63,137 $186,226 $170,885 $174,274
4D2 $253,692 $232,794 $237,411 -$67,753 -$62,172 -$63,405 $185,939 $170,622 $174,006
4D3 $253,692 $232,794 $237,411 -$57,120 -$52,414 -$53,454 $196,572 $180,380 $183,957
Table S-11: Enthalpy Heat Recovery Net First Costs for High School HVAC SystemOptions
Energy and Cost Benefit Analyses of HVAC Systems Available to Ohio Schools
xix
E. S. School - Enthalpy-NPV E. S. School - Enthalpy-PBHVACSystemOption Cleveland Cincinnati Columbus Cleveland Cincinnati Columbus
1A1 $49,696 $156,109 $76,650 6.2 3.0 4.8
1A2 -$65,045 -$43,606 -$33,300 104.5 32.8 22.4
1A3 -$41,962 $4,548 -$24,535 30.4 10.7 18.8
1B1 $52,763 $157,603 $78,110 6.0 2.9 4.7
1B2 -$61,967 -$42,099 -$31,855 85.5 32.0 21.9
1B3 -$38,908 $6,028 -$23,603 28.0 10.4 18.6
1C1 $240,853 $170,586 $174,763 2.4 2.9 2.9
1C2 $126,191 $33,390 $96,729 4.3 7.8 4.9
1C3 $149,198 $77,447 $117,023 3.7 5.2 4.2
1D1 $51,248 $161,443 $76,087 6.1 2.9 4.8
1D2 -$63,421 -$38,260 -$33,864 87.6 26.8 22.8
1D3 -$40,274 $9,868 -$26,003 28.6 9.9 19.5
2A1 $56,603 $146,333 $72,311 5.9 3.1 5.0
2A2 -$41,509 -$21,336 -$28,999 39.0 19.0 24.3
2A3 -$36,753 $2,545 -$22,233 25.2 11.0 17.7
2B1 $59,606 $147,850 $73,859 5.6 3.0 4.8
2B2 -$42,859 -$19,819 -$27,451 45.5 18.4 23.5
2B3 -$33,750 $4,062 -$21,092 23.5 10.7 17.4
2C1 $240,827 $165,439 $173,823 2.4 3.0 2.9
2C2 $141,156 $53,367 $114,741 3.5 5.9 3.9
2C3 $150,187 $79,381 $121,886 3.7 5.2 4.0
2D1 $57,908 $152,132 $71,707 5.8 3.0 5.0
2D2 -$44,557 -$15,537 -$29,603 47.6 16.1 24.9
2D3 -$35,448 $8,345 -$23,622 24.2 10.1 18.4
3A1 $494,741 $406,919 $411,056 0.0 0.0 0.0
3B1 $477,473 $410,233 $414,426 0.0 0.0 0.0
3C1 $847,519 $605,913 $887,794 0.0 0.0 0.0
3D1 $490,387 $410,777 $406,446 0.0 0.0 0.0
4A1 $185,306 $224,596 $162,049 0.7 0.6 0.8
4A2 $84,351 $64,234 $75,537 2.8 3.2 2.9
4A3 $108,445 $93,455 $94,610 1.9 2.0 2.0
4B1 $187,457 $226,852 $163,839 0.5 0.4 0.6
4B2 $80,211 $66,491 $75,173 2.5 2.8 2.5
4B3 $77,254 $95,711 $87,343 2.1 1.6 1.8
4C1 $692,167 $440,572 $741,035 0.6 0.8 0.5
4C2 $591,096 $348,712 $703,908 0.9 1.3 0.7
4C3 $615,188 $381,727 $738,169 0.8 1.1 0.6
4D1 $176,770 $229,807 $153,765 0.7 0.5 0.8
4D2 $75,720 $69,445 $67,599 2.9 2.9 3.0
4D3 $99,899 $98,665 $85,792 1.9 1.8 2.1
Table S-12: Enthalpy Heat Recovery NPVs and PBs for theElementary School Cases
Energy and Cost Benefit Analyses of HVAC Systems Available to Ohio Schools
xx
H. S. School - Enthalpy-NPV H. S. School - Enthalpy-PBHVACSystemOption Cleveland Cincinnati Columbus Cleveland Cincinnati Columbus
1A1 $40,330 $187,674 $60,670 9.4 5.5 8.5
1A2 -$64,727 $24,226 -$50,985 17.6 10.0 16.2
1A3 -$74,955 -$17,693 -$60,513 18.5 12.7 17.1
1B1 $45,452 $191,189 $62,950 9.2 5.3 8.4
1B2 -$59,610 $27,740 -$47,243 17.1 9.8 15.9
1B3 -$69,851 -$14,180 -$56,770 18.0 12.5 16.8
1C1 $792,836 $470,028 $790,071 2.4 3.3 2.2
1C2 $695,522 $354,905 $718,612 2.6 4.0 2.4
1C3 $692,551 $337,027 $722,828 2.7 4.2 2.5
1D1 $35,642 $208,438 $53,084 9.6 5.2 8.8
1D2 -$69,335 $44,989 -$56,263 18.3 9.1 17.0
1D3 -$79,576 $3,070 -$65,791 19.3 11.3 17.9
2A1 $43,295 $190,850 $69,925 9.3 5.4 8.2
2A2 -$62,462 $21,901 -$52,210 17.2 10.2 16.4
2A3 -$72,832 -$18,062 -$58,749 18.2 12.7 16.8
2B1 $48,183 $194,231 $72,200 9.1 5.3 8.0
2B2 -$57,580 $25,282 -$48,637 16.8 10.0 16.1
2B3 -$68,047 -$14,681 -$55,177 17.8 12.5 16.6
2C1 $789,579 $470,156 $779,388 2.4 3.3 2.3
2C2 $685,166 $349,821 $711,106 2.6 4.0 2.4
2C3 $682,292 $332,260 $716,515 2.8 4.3 2.5
2D1 $38,507 $211,019 $62,484 9.5 5.1 8.4
2D2 -$67,345 $42,070 -$57,555 18.0 9.2 17.1
2D3 -$77,482 $2,107 -$64,094 18.9 11.3 17.6
3A1 $547,936 $426,741 $429,988 0.8 1.0 1.0
3B1 $554,185 $430,983 $433,370 0.7 0.8 0.9
3C1 $1,118,548 $743,783 $1,166,479 0.7 0.9 0.6
3D1 $542,346 $433,744 $435,893 0.8 0.9 0.9
4A1 $30,484 $155,703 $53,079 9.9 6.0 8.8
4A2 -$69,049 $21,723 -$47,441 18.2 10.2 15.7
4A3 -$79,252 -$19,371 -$56,532 19.2 12.8 16.5
4B1 $36,165 $159,351 $55,631 9.6 5.9 8.6
4B2 -$63,369 $25,371 -$43,441 17.6 10.0 15.4
4B3 -$73,576 -$15,695 -$52,513 18.6 12.6 16.2
4C1 $912,750 $527,213 $961,230 2.1 3.1 1.9
4C2 $822,334 $431,419 $891,861 2.3 3.5 2.1
4C3 $819,093 $415,707 $894,565 2.4 3.8 2.2
4D1 $25,838 $179,090 $45,576 10.1 5.6 9.1
4D2 -$73,614 $45,111 -$52,636 19.0 9.1 16.4
4D3 -$83,915 $4,045 -$61,708 20.0 11.2 17.3
Table S-13: Enthalpy Heat Recovery NPVs and PBs for the High School Cases
Energy and Cost Benefit Analyses of HVAC Systems Available to Ohio Schools
xxi
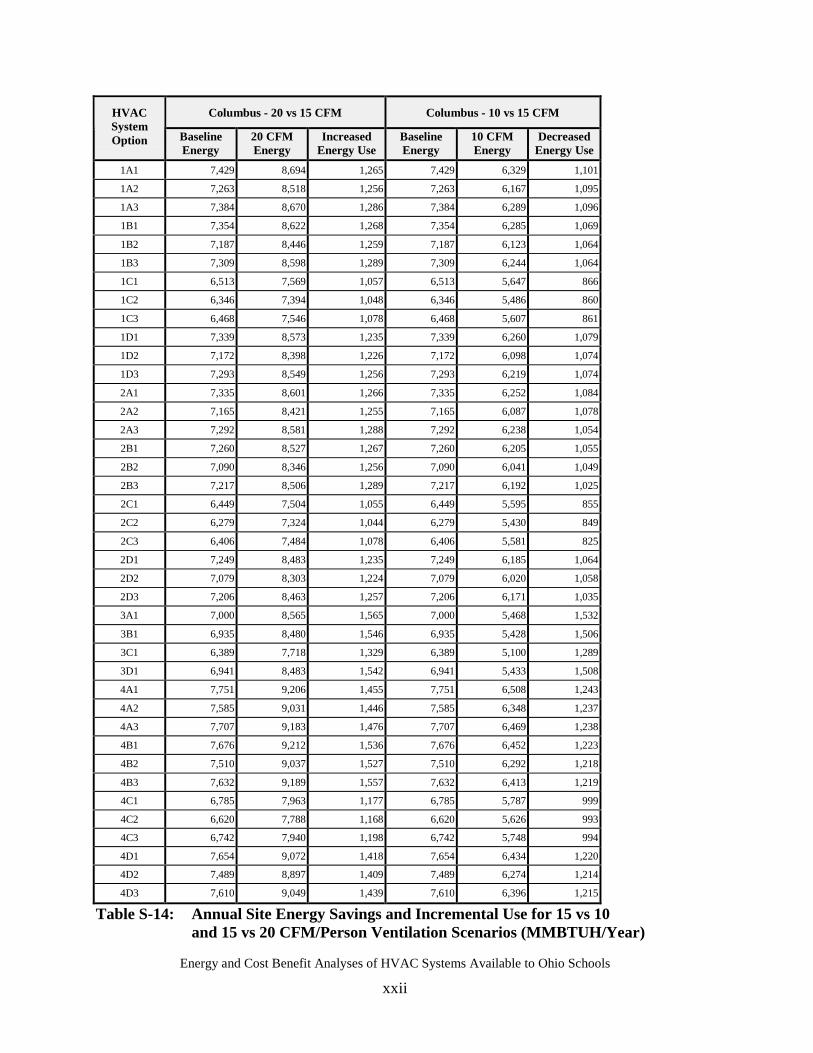
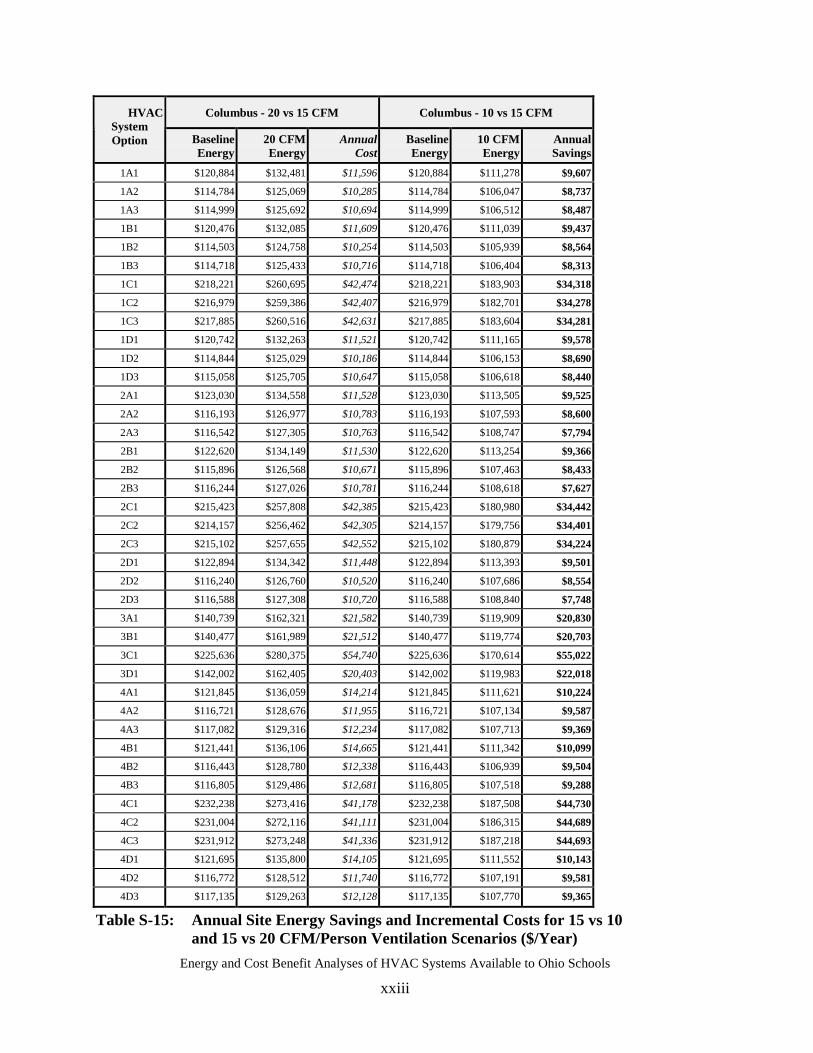
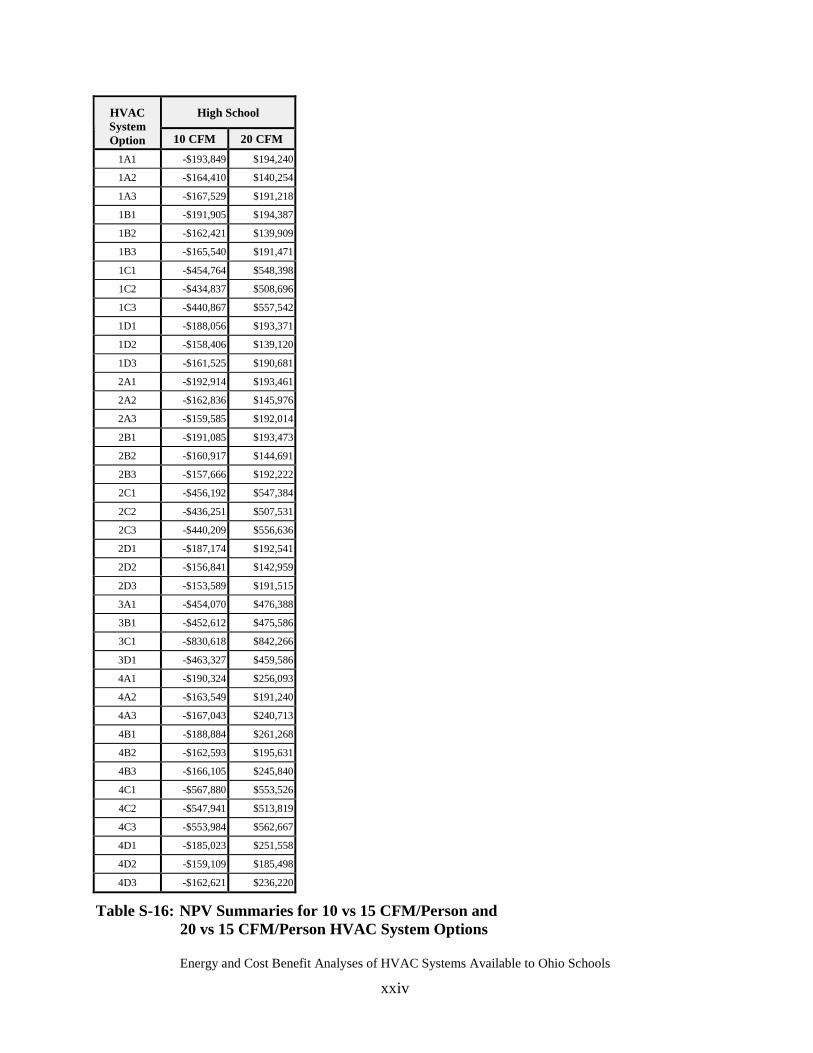
Occupancy-Based Ventilation Analyses:Table S-14 and S-15 summarize analyses of annual energy costs associated for both decreasing(15 to 10 CFM/person), and increasing (15 to 20 CFM/person), ventilation air to a high schoollocated in Columbus, OH. This work was aimed at quantifying the annual energy costimplications for changes to ventilation air being considered under ASHRAE 62. Table S-16summarizes the NPVs associated with increasing or decreasing ventilation air to this high school.
Reduced annual energy costs for the 10 vs 15 CFM/person cases ranged a low of $7,627 per year(2B3) to a high of $55,022 per year (3C1). On a per square foot basis, this ranged from a low of$0.06 per square foot per year (2B3) to a high of $0.46 per square foot per year (3C1). From alife-cycle perspective, decreasing ventilation air to school spaces saves $153,589 (2D3) to$830,618 (3C1), or 4.9% to 17.9% of baseline life cycle costs. Typical savings were about 5.2%.
Energy and Cost Benefit Analyses of HVAC Systems Available to Ohio Schools
xxii
Columbus - 20 vs 15 CFM Columbus - 10 vs 15 CFMHVACSystemOption Baseline
Energy20 CFMEnergy
IncreasedEnergy Use
BaselineEnergy
10 CFMEnergy
DecreasedEnergy Use
1A1 7,429 8,694 1,265 7,429 6,329 1,101
1A2 7,263 8,518 1,256 7,263 6,167 1,095
1A3 7,384 8,670 1,286 7,384 6,289 1,096
1B1 7,354 8,622 1,268 7,354 6,285 1,069
1B2 7,187 8,446 1,259 7,187 6,123 1,064
1B3 7,309 8,598 1,289 7,309 6,244 1,064
1C1 6,513 7,569 1,057 6,513 5,647 866
1C2 6,346 7,394 1,048 6,346 5,486 860
1C3 6,468 7,546 1,078 6,468 5,607 861
1D1 7,339 8,573 1,235 7,339 6,260 1,079
1D2 7,172 8,398 1,226 7,172 6,098 1,074
1D3 7,293 8,549 1,256 7,293 6,219 1,074
2A1 7,335 8,601 1,266 7,335 6,252 1,084
2A2 7,165 8,421 1,255 7,165 6,087 1,078
2A3 7,292 8,581 1,288 7,292 6,238 1,054
2B1 7,260 8,527 1,267 7,260 6,205 1,055
2B2 7,090 8,346 1,256 7,090 6,041 1,049
2B3 7,217 8,506 1,289 7,217 6,192 1,025
2C1 6,449 7,504 1,055 6,449 5,595 855
2C2 6,279 7,324 1,044 6,279 5,430 849
2C3 6,406 7,484 1,078 6,406 5,581 825
2D1 7,249 8,483 1,235 7,249 6,185 1,064
2D2 7,079 8,303 1,224 7,079 6,020 1,058
2D3 7,206 8,463 1,257 7,206 6,171 1,035
3A1 7,000 8,565 1,565 7,000 5,468 1,532
3B1 6,935 8,480 1,546 6,935 5,428 1,506
3C1 6,389 7,718 1,329 6,389 5,100 1,289
3D1 6,941 8,483 1,542 6,941 5,433 1,508
4A1 7,751 9,206 1,455 7,751 6,508 1,243
4A2 7,585 9,031 1,446 7,585 6,348 1,237
4A3 7,707 9,183 1,476 7,707 6,469 1,238
4B1 7,676 9,212 1,536 7,676 6,452 1,223
4B2 7,510 9,037 1,527 7,510 6,292 1,218
4B3 7,632 9,189 1,557 7,632 6,413 1,219
4C1 6,785 7,963 1,177 6,785 5,787 999
4C2 6,620 7,788 1,168 6,620 5,626 993
4C3 6,742 7,940 1,198 6,742 5,748 994
4D1 7,654 9,072 1,418 7,654 6,434 1,220
4D2 7,489 8,897 1,409 7,489 6,274 1,214
4D3 7,610 9,049 1,439 7,610 6,396 1,215
Table S-14: Annual Site Energy Savings and Incremental Use for 15 vs 10and 15 vs 20 CFM/Person Ventilation Scenarios (MMBTUH/Year)
Energy and Cost Benefit Analyses of HVAC Systems Available to Ohio Schools
xxiii
Columbus - 20 vs 15 CFM Columbus - 10 vs 15 CFMHVACSystemOption Baseline
Energy20 CFMEnergy
AnnualCost
BaselineEnergy
10 CFMEnergy
AnnualSavings
1A1 $120,884 $132,481 $11,596 $120,884 $111,278 $9,607
1A2 $114,784 $125,069 $10,285 $114,784 $106,047 $8,737
1A3 $114,999 $125,692 $10,694 $114,999 $106,512 $8,487
1B1 $120,476 $132,085 $11,609 $120,476 $111,039 $9,437
1B2 $114,503 $124,758 $10,254 $114,503 $105,939 $8,564
1B3 $114,718 $125,433 $10,716 $114,718 $106,404 $8,313
1C1 $218,221 $260,695 $42,474 $218,221 $183,903 $34,318
1C2 $216,979 $259,386 $42,407 $216,979 $182,701 $34,278
1C3 $217,885 $260,516 $42,631 $217,885 $183,604 $34,281
1D1 $120,742 $132,263 $11,521 $120,742 $111,165 $9,578
1D2 $114,844 $125,029 $10,186 $114,844 $106,153 $8,690
1D3 $115,058 $125,705 $10,647 $115,058 $106,618 $8,440
2A1 $123,030 $134,558 $11,528 $123,030 $113,505 $9,525
2A2 $116,193 $126,977 $10,783 $116,193 $107,593 $8,600
2A3 $116,542 $127,305 $10,763 $116,542 $108,747 $7,794
2B1 $122,620 $134,149 $11,530 $122,620 $113,254 $9,366
2B2 $115,896 $126,568 $10,671 $115,896 $107,463 $8,433
2B3 $116,244 $127,026 $10,781 $116,244 $108,618 $7,627
2C1 $215,423 $257,808 $42,385 $215,423 $180,980 $34,442
2C2 $214,157 $256,462 $42,305 $214,157 $179,756 $34,401
2C3 $215,102 $257,655 $42,552 $215,102 $180,879 $34,224
2D1 $122,894 $134,342 $11,448 $122,894 $113,393 $9,501
2D2 $116,240 $126,760 $10,520 $116,240 $107,686 $8,554
2D3 $116,588 $127,308 $10,720 $116,588 $108,840 $7,748
3A1 $140,739 $162,321 $21,582 $140,739 $119,909 $20,830
3B1 $140,477 $161,989 $21,512 $140,477 $119,774 $20,703
3C1 $225,636 $280,375 $54,740 $225,636 $170,614 $55,022
3D1 $142,002 $162,405 $20,403 $142,002 $119,983 $22,018
4A1 $121,845 $136,059 $14,214 $121,845 $111,621 $10,224
4A2 $116,721 $128,676 $11,955 $116,721 $107,134 $9,587
4A3 $117,082 $129,316 $12,234 $117,082 $107,713 $9,369
4B1 $121,441 $136,106 $14,665 $121,441 $111,342 $10,099
4B2 $116,443 $128,780 $12,338 $116,443 $106,939 $9,504
4B3 $116,805 $129,486 $12,681 $116,805 $107,518 $9,288
4C1 $232,238 $273,416 $41,178 $232,238 $187,508 $44,730
4C2 $231,004 $272,116 $41,111 $231,004 $186,315 $44,689
4C3 $231,912 $273,248 $41,336 $231,912 $187,218 $44,693
4D1 $121,695 $135,800 $14,105 $121,695 $111,552 $10,143
4D2 $116,772 $128,512 $11,740 $116,772 $107,191 $9,581
4D3 $117,135 $129,263 $12,128 $117,135 $107,770 $9,365
Table S-15: Annual Site Energy Savings and Incremental Costs for 15 vs 10and 15 vs 20 CFM/Person Ventilation Scenarios ($/Year)
Energy and Cost Benefit Analyses of HVAC Systems Available to Ohio Schools
xxiv
High SchoolHVACSystemOption 10 CFM 20 CFM
1A1 -$193,849 $194,240
1A2 -$164,410 $140,254
1A3 -$167,529 $191,218
1B1 -$191,905 $194,387
1B2 -$162,421 $139,909
1B3 -$165,540 $191,471
1C1 -$454,764 $548,398
1C2 -$434,837 $508,696
1C3 -$440,867 $557,542
1D1 -$188,056 $193,371
1D2 -$158,406 $139,120
1D3 -$161,525 $190,681
2A1 -$192,914 $193,461
2A2 -$162,836 $145,976
2A3 -$159,585 $192,014
2B1 -$191,085 $193,473
2B2 -$160,917 $144,691
2B3 -$157,666 $192,222
2C1 -$456,192 $547,384
2C2 -$436,251 $507,531
2C3 -$440,209 $556,636
2D1 -$187,174 $192,541
2D2 -$156,841 $142,959
2D3 -$153,589 $191,515
3A1 -$454,070 $476,388
3B1 -$452,612 $475,586
3C1 -$830,618 $842,266
3D1 -$463,327 $459,586
4A1 -$190,324 $256,093
4A2 -$163,549 $191,240
4A3 -$167,043 $240,713
4B1 -$188,884 $261,268
4B2 -$162,593 $195,631
4B3 -$166,105 $245,840
4C1 -$567,880 $553,526
4C2 -$547,941 $513,819
4C3 -$553,984 $562,667
4D1 -$185,023 $251,558
4D2 -$159,109 $185,498
4D3 -$162,621 $236,220
Table S-16: NPV Summaries for 10 vs 15 CFM/Person and20 vs 15 CFM/Person HVAC System Options
Energy and Cost Benefit Analyses of HVAC Systems Available to Ohio Schools
xxv
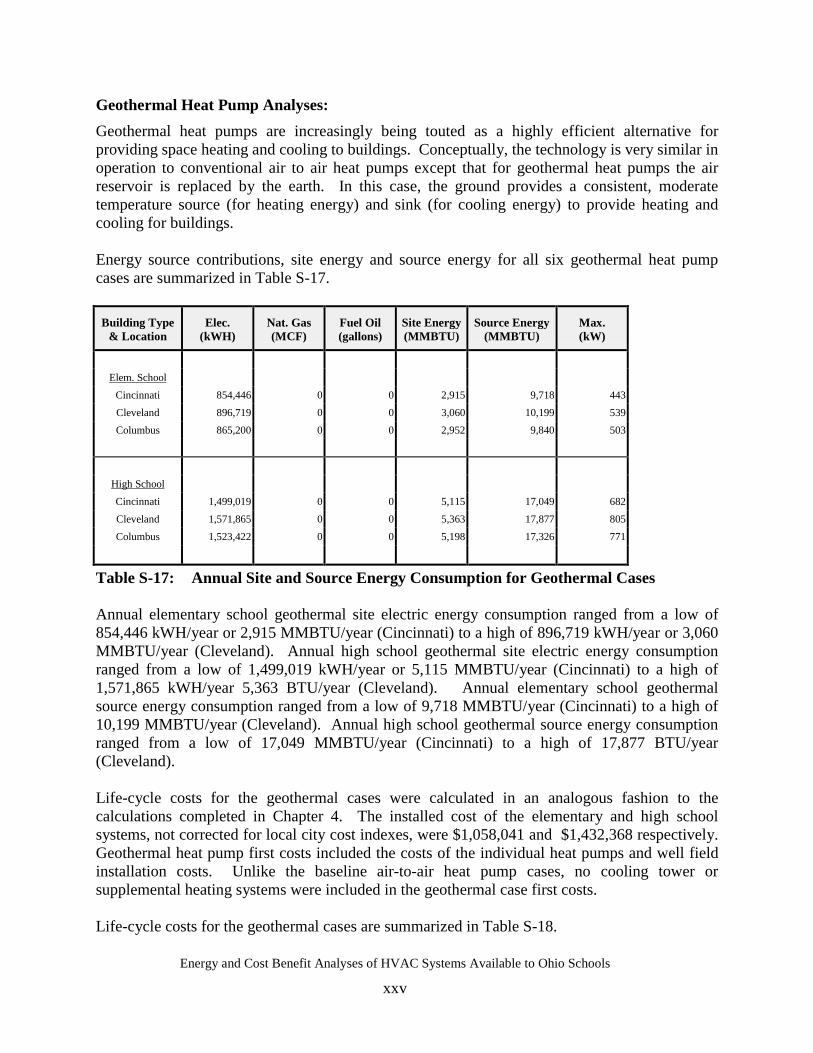
Geothermal Heat Pump Analyses:Geothermal heat pumps are increasingly being touted as a highly efficient alternative forproviding space heating and cooling to buildings. Conceptually, the technology is very similar inoperation to conventional air to air heat pumps except that for geothermal heat pumps the airreservoir is replaced by the earth. In this case, the ground provides a consistent, moderatetemperature source (for heating energy) and sink (for cooling energy) to provide heating andcooling for buildings.
Energy source contributions, site energy and source energy for all six geothermal heat pumpcases are summarized in Table S-17.
Building Type& Location
Elec.(kWH)
Nat. Gas(MCF)
Fuel Oil(gallons)
Site Energy(MMBTU)
Source Energy(MMBTU)
Max.(kW)
Elem. SchoolCincinnati 854,446 0 0 2,915 9,718 443Cleveland 896,719 0 0 3,060 10,199 539Columbus 865,200 0 0 2,952 9,840 503
High SchoolCincinnati 1,499,019 0 0 5,115 17,049 682Cleveland 1,571,865 0 0 5,363 17,877 805Columbus 1,523,422 0 0 5,198 17,326 771
Table S-17: Annual Site and Source Energy Consumption for Geothermal Cases
Annual elementary school geothermal site electric energy consumption ranged from a low of854,446 kWH/year or 2,915 MMBTU/year (Cincinnati) to a high of 896,719 kWH/year or 3,060MMBTU/year (Cleveland). Annual high school geothermal site electric energy consumptionranged from a low of 1,499,019 kWH/year or 5,115 MMBTU/year (Cincinnati) to a high of1,571,865 kWH/year 5,363 BTU/year (Cleveland). Annual elementary school geothermalsource energy consumption ranged from a low of 9,718 MMBTU/year (Cincinnati) to a high of10,199 MMBTU/year (Cleveland). Annual high school geothermal source energy consumptionranged from a low of 17,049 MMBTU/year (Cincinnati) to a high of 17,877 BTU/year(Cleveland).
Life-cycle costs for the geothermal cases were calculated in an analogous fashion to thecalculations completed in Chapter 4. The installed cost of the elementary and high schoolsystems, not corrected for local city cost indexes, were $1,058,041 and $1,432,368 respectively.Geothermal heat pump first costs included the costs of the individual heat pumps and well fieldinstallation costs. Unlike the baseline air-to-air heat pump cases, no cooling tower orsupplemental heating systems were included in the geothermal case first costs.
Life-cycle costs for the geothermal cases are summarized in Table S-18.
Energy and Cost Benefit Analyses of HVAC Systems Available to Ohio Schools
xxvi
Elementary School PV High School PVHVACSystemOption Cincinnati Cleveland Columbus Cincinnati Cleveland Columbus
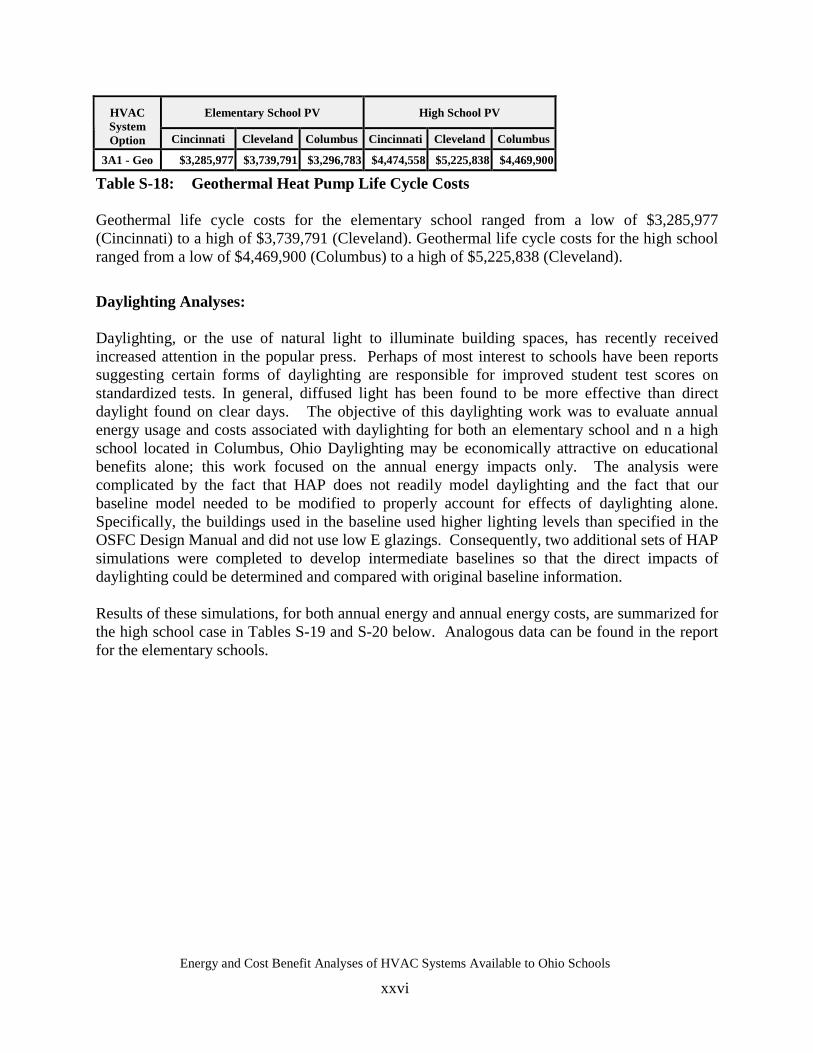
3A1 - Geo $3,285,977 $3,739,791 $3,296,783 $4,474,558 $5,225,838 $4,469,900
Table S-18: Geothermal Heat Pump Life Cycle Costs
Geothermal life cycle costs for the elementary school ranged from a low of $3,285,977(Cincinnati) to a high of $3,739,791 (Cleveland). Geothermal life cycle costs for the high schoolranged from a low of $4,469,900 (Columbus) to a high of $5,225,838 (Cleveland).
Daylighting Analyses:
Daylighting, or the use of natural light to illuminate building spaces, has recently receivedincreased attention in the popular press. Perhaps of most interest to schools have been reportssuggesting certain forms of daylighting are responsible for improved student test scores onstandardized tests. In general, diffused light has been found to be more effective than directdaylight found on clear days. The objective of this daylighting work was to evaluate annualenergy usage and costs associated with daylighting for both an elementary school and n a highschool located in Columbus, Ohio Daylighting may be economically attractive on educationalbenefits alone; this work focused on the annual energy impacts only. The analysis werecomplicated by the fact that HAP does not readily model daylighting and the fact that ourbaseline model needed to be modified to properly account for effects of daylighting alone.Specifically, the buildings used in the baseline used higher lighting levels than specified in theOSFC Design Manual and did not use low E glazings. Consequently, two additional sets of HAPsimulations were completed to develop intermediate baselines so that the direct impacts ofdaylighting could be determined and compared with original baseline information.
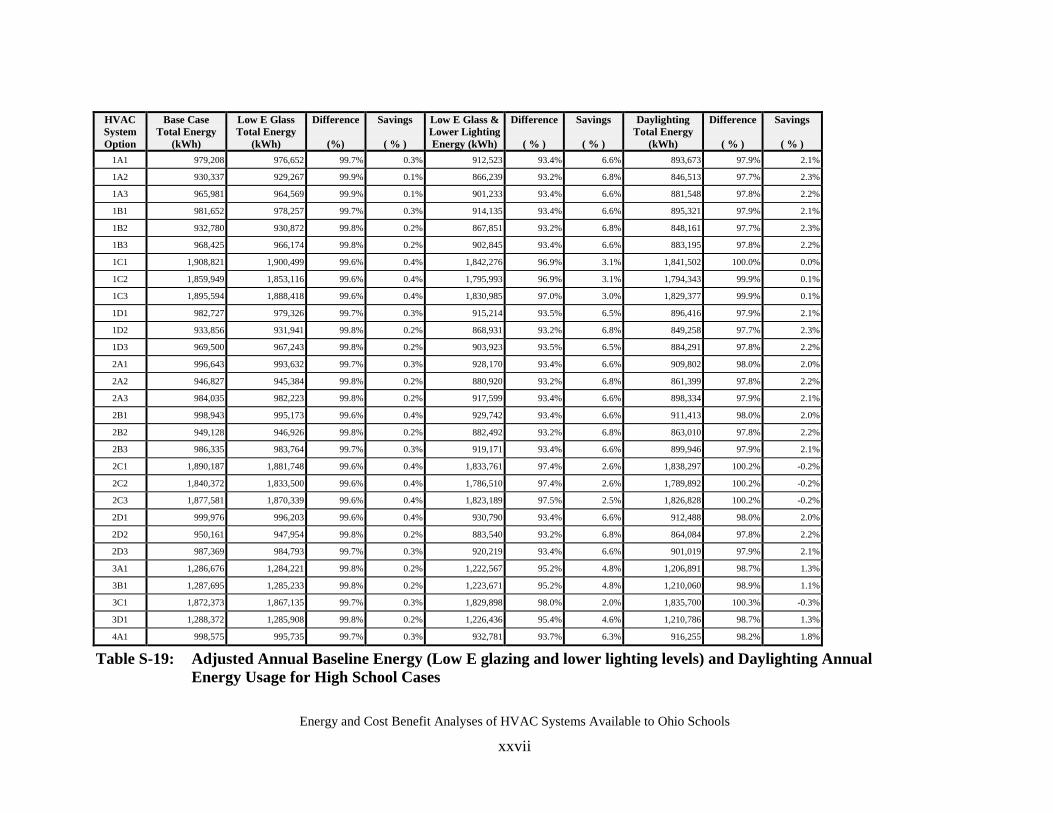
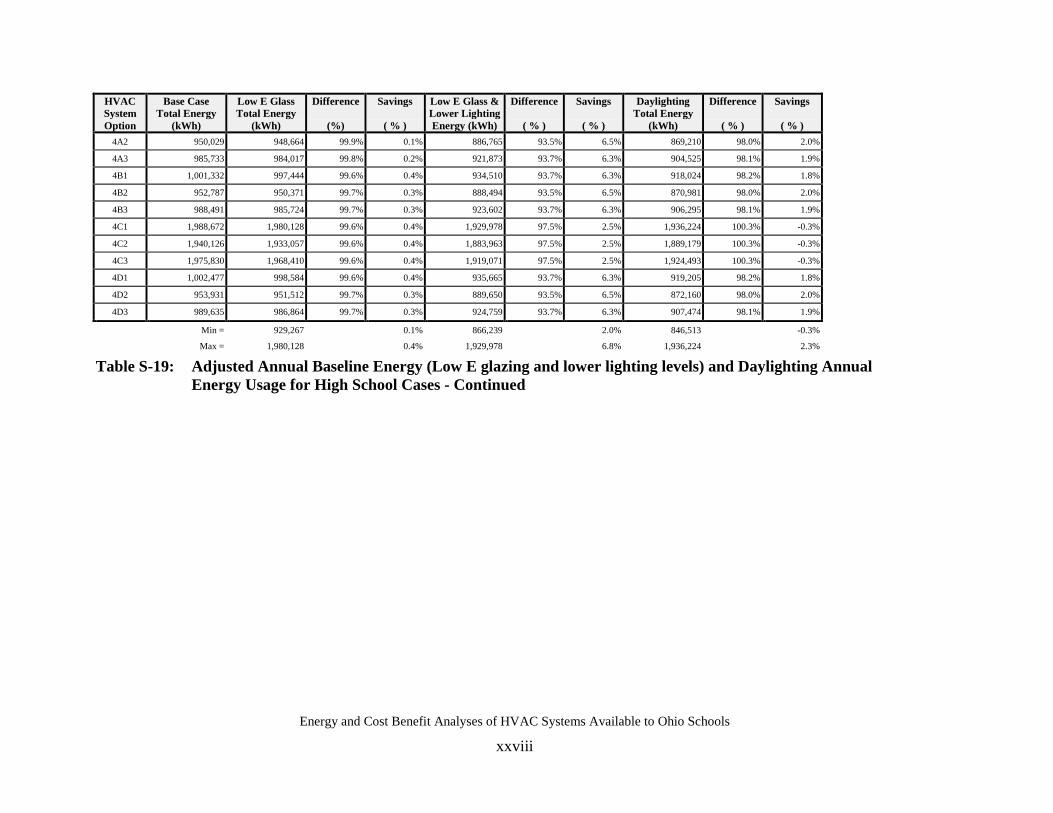
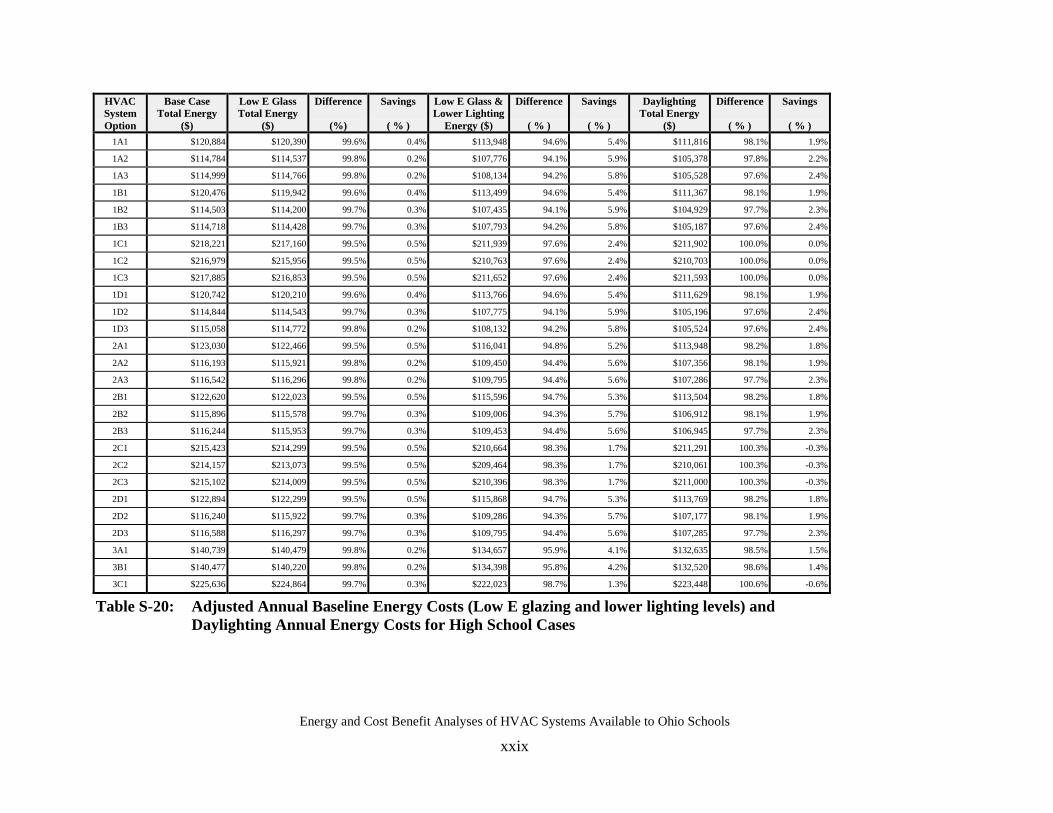
Results of these simulations, for both annual energy and annual energy costs, are summarized forthe high school case in Tables S-19 and S-20 below. Analogous data can be found in the reportfor the elementary schools.
Energy and Cost Benefit Analyses of HVAC Systems Available to Ohio Schools
xxvii
HVACSystemOption
Base CaseTotal Energy
(kWh)
Low E GlassTotal Energy
(kWh)
Difference
(%)
Savings
( % )
Low E Glass &Lower LightingEnergy (kWh)
Difference
( % )
Savings
( % )
DaylightingTotal Energy
(kWh)
Difference
( % )
Savings
( % )1A1 979,208 976,652 99.7% 0.3% 912,523 93.4% 6.6% 893,673 97.9% 2.1%
1A2 930,337 929,267 99.9% 0.1% 866,239 93.2% 6.8% 846,513 97.7% 2.3%
1A3 965,981 964,569 99.9% 0.1% 901,233 93.4% 6.6% 881,548 97.8% 2.2%
1B1 981,652 978,257 99.7% 0.3% 914,135 93.4% 6.6% 895,321 97.9% 2.1%
1B2 932,780 930,872 99.8% 0.2% 867,851 93.2% 6.8% 848,161 97.7% 2.3%
1B3 968,425 966,174 99.8% 0.2% 902,845 93.4% 6.6% 883,195 97.8% 2.2%
1C1 1,908,821 1,900,499 99.6% 0.4% 1,842,276 96.9% 3.1% 1,841,502 100.0% 0.0%
1C2 1,859,949 1,853,116 99.6% 0.4% 1,795,993 96.9% 3.1% 1,794,343 99.9% 0.1%
1C3 1,895,594 1,888,418 99.6% 0.4% 1,830,985 97.0% 3.0% 1,829,377 99.9% 0.1%
1D1 982,727 979,326 99.7% 0.3% 915,214 93.5% 6.5% 896,416 97.9% 2.1%
1D2 933,856 931,941 99.8% 0.2% 868,931 93.2% 6.8% 849,258 97.7% 2.3%
1D3 969,500 967,243 99.8% 0.2% 903,923 93.5% 6.5% 884,291 97.8% 2.2%
2A1 996,643 993,632 99.7% 0.3% 928,170 93.4% 6.6% 909,802 98.0% 2.0%
2A2 946,827 945,384 99.8% 0.2% 880,920 93.2% 6.8% 861,399 97.8% 2.2%
2A3 984,035 982,223 99.8% 0.2% 917,599 93.4% 6.6% 898,334 97.9% 2.1%
2B1 998,943 995,173 99.6% 0.4% 929,742 93.4% 6.6% 911,413 98.0% 2.0%
2B2 949,128 946,926 99.8% 0.2% 882,492 93.2% 6.8% 863,010 97.8% 2.2%
2B3 986,335 983,764 99.7% 0.3% 919,171 93.4% 6.6% 899,946 97.9% 2.1%
2C1 1,890,187 1,881,748 99.6% 0.4% 1,833,761 97.4% 2.6% 1,838,297 100.2% -0.2%
2C2 1,840,372 1,833,500 99.6% 0.4% 1,786,510 97.4% 2.6% 1,789,892 100.2% -0.2%
2C3 1,877,581 1,870,339 99.6% 0.4% 1,823,189 97.5% 2.5% 1,826,828 100.2% -0.2%
2D1 999,976 996,203 99.6% 0.4% 930,790 93.4% 6.6% 912,488 98.0% 2.0%
2D2 950,161 947,954 99.8% 0.2% 883,540 93.2% 6.8% 864,084 97.8% 2.2%
2D3 987,369 984,793 99.7% 0.3% 920,219 93.4% 6.6% 901,019 97.9% 2.1%
3A1 1,286,676 1,284,221 99.8% 0.2% 1,222,567 95.2% 4.8% 1,206,891 98.7% 1.3%
3B1 1,287,695 1,285,233 99.8% 0.2% 1,223,671 95.2% 4.8% 1,210,060 98.9% 1.1%
3C1 1,872,373 1,867,135 99.7% 0.3% 1,829,898 98.0% 2.0% 1,835,700 100.3% -0.3%
3D1 1,288,372 1,285,908 99.8% 0.2% 1,226,436 95.4% 4.6% 1,210,786 98.7% 1.3%
4A1 998,575 995,735 99.7% 0.3% 932,781 93.7% 6.3% 916,255 98.2% 1.8%
Table S-19: Adjusted Annual Baseline Energy (Low E glazing and lower lighting levels) and Daylighting AnnualEnergy Usage for High School Cases
Energy and Cost Benefit Analyses of HVAC Systems Available to Ohio Schools
xxviii
HVACSystemOption
Base CaseTotal Energy
(kWh)
Low E GlassTotal Energy
(kWh)
Difference
(%)
Savings
( % )
Low E Glass &Lower LightingEnergy (kWh)
Difference
( % )
Savings
( % )
DaylightingTotal Energy
(kWh)
Difference
( % )
Savings
( % )4A2 950,029 948,664 99.9% 0.1% 886,765 93.5% 6.5% 869,210 98.0% 2.0%
4A3 985,733 984,017 99.8% 0.2% 921,873 93.7% 6.3% 904,525 98.1% 1.9%
4B1 1,001,332 997,444 99.6% 0.4% 934,510 93.7% 6.3% 918,024 98.2% 1.8%
4B2 952,787 950,371 99.7% 0.3% 888,494 93.5% 6.5% 870,981 98.0% 2.0%
4B3 988,491 985,724 99.7% 0.3% 923,602 93.7% 6.3% 906,295 98.1% 1.9%
4C1 1,988,672 1,980,128 99.6% 0.4% 1,929,978 97.5% 2.5% 1,936,224 100.3% -0.3%
4C2 1,940,126 1,933,057 99.6% 0.4% 1,883,963 97.5% 2.5% 1,889,179 100.3% -0.3%
4C3 1,975,830 1,968,410 99.6% 0.4% 1,919,071 97.5% 2.5% 1,924,493 100.3% -0.3%
4D1 1,002,477 998,584 99.6% 0.4% 935,665 93.7% 6.3% 919,205 98.2% 1.8%
4D2 953,931 951,512 99.7% 0.3% 889,650 93.5% 6.5% 872,160 98.0% 2.0%
4D3 989,635 986,864 99.7% 0.3% 924,759 93.7% 6.3% 907,474 98.1% 1.9%
Min = 929,267 0.1% 866,239 2.0% 846,513 -0.3%
Max = 1,980,128 0.4% 1,929,978 6.8% 1,936,224 2.3%
Table S-19: Adjusted Annual Baseline Energy (Low E glazing and lower lighting levels) and Daylighting AnnualEnergy Usage for High School Cases - Continued
Energy and Cost Benefit Analyses of HVAC Systems Available to Ohio Schools
xxix
HVACSystemOption
Base CaseTotal Energy
($)
Low E GlassTotal Energy
($)
Difference
(%)
Savings
( % )
Low E Glass &Lower Lighting
Energy ($)
Difference
( % )
Savings
( % )
DaylightingTotal Energy
($)
Difference
( % )
Savings
( % )1A1 $120,884 $120,390 99.6% 0.4% $113,948 94.6% 5.4% $111,816 98.1% 1.9%
1A2 $114,784 $114,537 99.8% 0.2% $107,776 94.1% 5.9% $105,378 97.8% 2.2%
1A3 $114,999 $114,766 99.8% 0.2% $108,134 94.2% 5.8% $105,528 97.6% 2.4%
1B1 $120,476 $119,942 99.6% 0.4% $113,499 94.6% 5.4% $111,367 98.1% 1.9%
1B2 $114,503 $114,200 99.7% 0.3% $107,435 94.1% 5.9% $104,929 97.7% 2.3%
1B3 $114,718 $114,428 99.7% 0.3% $107,793 94.2% 5.8% $105,187 97.6% 2.4%
1C1 $218,221 $217,160 99.5% 0.5% $211,939 97.6% 2.4% $211,902 100.0% 0.0%
1C2 $216,979 $215,956 99.5% 0.5% $210,763 97.6% 2.4% $210,703 100.0% 0.0%
1C3 $217,885 $216,853 99.5% 0.5% $211,652 97.6% 2.4% $211,593 100.0% 0.0%
1D1 $120,742 $120,210 99.6% 0.4% $113,766 94.6% 5.4% $111,629 98.1% 1.9%
1D2 $114,844 $114,543 99.7% 0.3% $107,775 94.1% 5.9% $105,196 97.6% 2.4%
1D3 $115,058 $114,772 99.8% 0.2% $108,132 94.2% 5.8% $105,524 97.6% 2.4%
2A1 $123,030 $122,466 99.5% 0.5% $116,041 94.8% 5.2% $113,948 98.2% 1.8%
2A2 $116,193 $115,921 99.8% 0.2% $109,450 94.4% 5.6% $107,356 98.1% 1.9%
2A3 $116,542 $116,296 99.8% 0.2% $109,795 94.4% 5.6% $107,286 97.7% 2.3%
2B1 $122,620 $122,023 99.5% 0.5% $115,596 94.7% 5.3% $113,504 98.2% 1.8%
2B2 $115,896 $115,578 99.7% 0.3% $109,006 94.3% 5.7% $106,912 98.1% 1.9%
2B3 $116,244 $115,953 99.7% 0.3% $109,453 94.4% 5.6% $106,945 97.7% 2.3%
2C1 $215,423 $214,299 99.5% 0.5% $210,664 98.3% 1.7% $211,291 100.3% -0.3%
2C2 $214,157 $213,073 99.5% 0.5% $209,464 98.3% 1.7% $210,061 100.3% -0.3%
2C3 $215,102 $214,009 99.5% 0.5% $210,396 98.3% 1.7% $211,000 100.3% -0.3%
2D1 $122,894 $122,299 99.5% 0.5% $115,868 94.7% 5.3% $113,769 98.2% 1.8%
2D2 $116,240 $115,922 99.7% 0.3% $109,286 94.3% 5.7% $107,177 98.1% 1.9%
2D3 $116,588 $116,297 99.7% 0.3% $109,795 94.4% 5.6% $107,285 97.7% 2.3%
3A1 $140,739 $140,479 99.8% 0.2% $134,657 95.9% 4.1% $132,635 98.5% 1.5%
3B1 $140,477 $140,220 99.8% 0.2% $134,398 95.8% 4.2% $132,520 98.6% 1.4%
3C1 $225,636 $224,864 99.7% 0.3% $222,023 98.7% 1.3% $223,448 100.6% -0.6%
Table S-20: Adjusted Annual Baseline Energy Costs (Low E glazing and lower lighting levels) andDaylighting Annual Energy Costs for High School Cases
Energy and Cost Benefit Analyses of HVAC Systems Available to Ohio Schools
xxx
HVACSystemOption
Base CaseTotal Energy
($)
Low E GlassTotal Energy
($)
Difference
(%)
Savings
( % )
Low E Glass &Lower Lighting
Energy ($)
Difference
( % )
Savings
( % )
DaylightingTotal Energy
($)
Difference
( % )
Savings
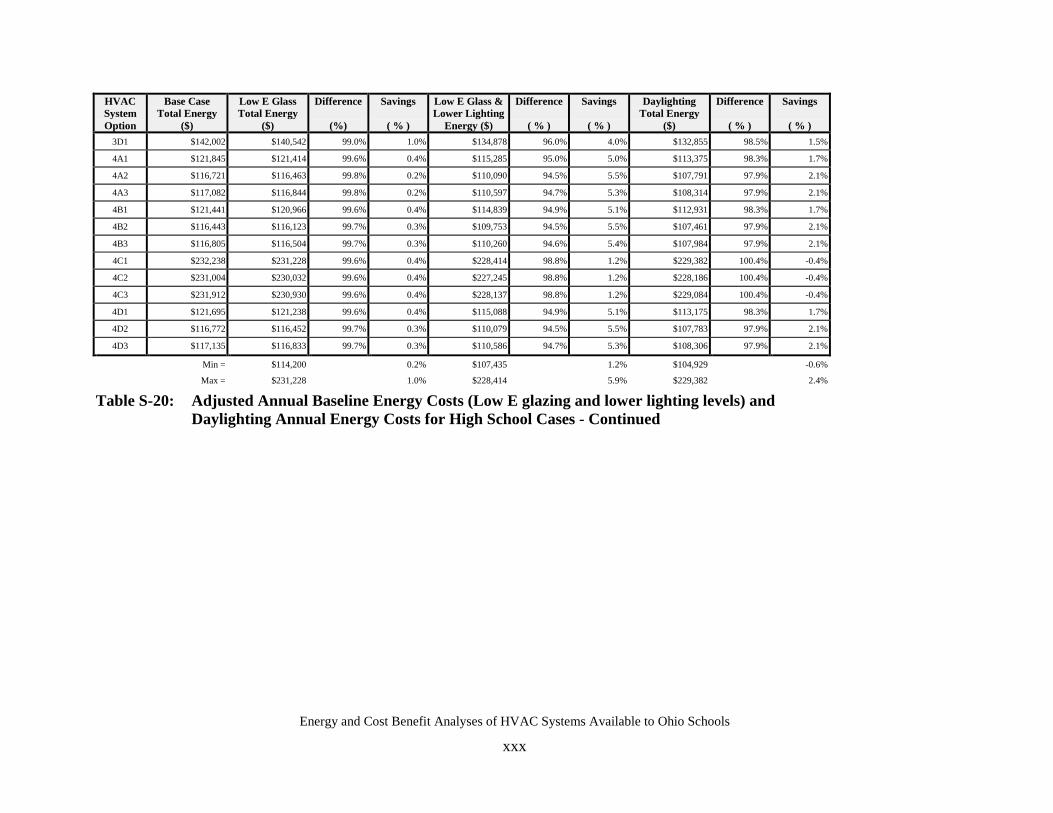
( % )3D1 $142,002 $140,542 99.0% 1.0% $134,878 96.0% 4.0% $132,855 98.5% 1.5%
4A1 $121,845 $121,414 99.6% 0.4% $115,285 95.0% 5.0% $113,375 98.3% 1.7%
4A2 $116,721 $116,463 99.8% 0.2% $110,090 94.5% 5.5% $107,791 97.9% 2.1%
4A3 $117,082 $116,844 99.8% 0.2% $110,597 94.7% 5.3% $108,314 97.9% 2.1%
4B1 $121,441 $120,966 99.6% 0.4% $114,839 94.9% 5.1% $112,931 98.3% 1.7%
4B2 $116,443 $116,123 99.7% 0.3% $109,753 94.5% 5.5% $107,461 97.9% 2.1%
4B3 $116,805 $116,504 99.7% 0.3% $110,260 94.6% 5.4% $107,984 97.9% 2.1%
4C1 $232,238 $231,228 99.6% 0.4% $228,414 98.8% 1.2% $229,382 100.4% -0.4%
4C2 $231,004 $230,032 99.6% 0.4% $227,245 98.8% 1.2% $228,186 100.4% -0.4%
4C3 $231,912 $230,930 99.6% 0.4% $228,137 98.8% 1.2% $229,084 100.4% -0.4%
4D1 $121,695 $121,238 99.6% 0.4% $115,088 94.9% 5.1% $113,175 98.3% 1.7%
4D2 $116,772 $116,452 99.7% 0.3% $110,079 94.5% 5.5% $107,783 97.9% 2.1%
4D3 $117,135 $116,833 99.7% 0.3% $110,586 94.7% 5.3% $108,306 97.9% 2.1%
Min = $114,200 0.2% $107,435 1.2% $104,929 -0.6%
Max = $231,228 1.0% $228,414 5.9% $229,382 2.4%
Table S-20: Adjusted Annual Baseline Energy Costs (Low E glazing and lower lighting levels) andDaylighting Annual Energy Costs for High School Cases - Continued
Energy and Cost Benefit Analyses of HVAC Systems Available to Ohio Schools
xxxi
For the high school cases, the intermediate baseline values, using low E glazings for the originalwindows provided annual energy savings that ranged from 0.1% to 0.4%. Annual cost savingsfor these cases ranged from 0.2% to 1.0%. The second-level intermediate baseline situation,where the classroom lighting was reduced to 60 FC, resulted in annual energy savings (includinglow E glass) that ranged from 2.0 to 6.8%. For these cases, annual cost savings ranged from1.2% to 5.9%. For the daylighting-only cases, annual energy savings ranged from –0.3% to2.3% and annual energy cost savings ranged from –0.6% to 2.4%. The negative savings occur forHVAC system options that employed electric boilers. This occurs because when interiorelectrical loads that produce heat are reduced (such as lighting), the heating system is required tomake up this loss.
Energy and Cost Benefit Analyses of HVAC Systems Available to Ohio Schools
xxxii
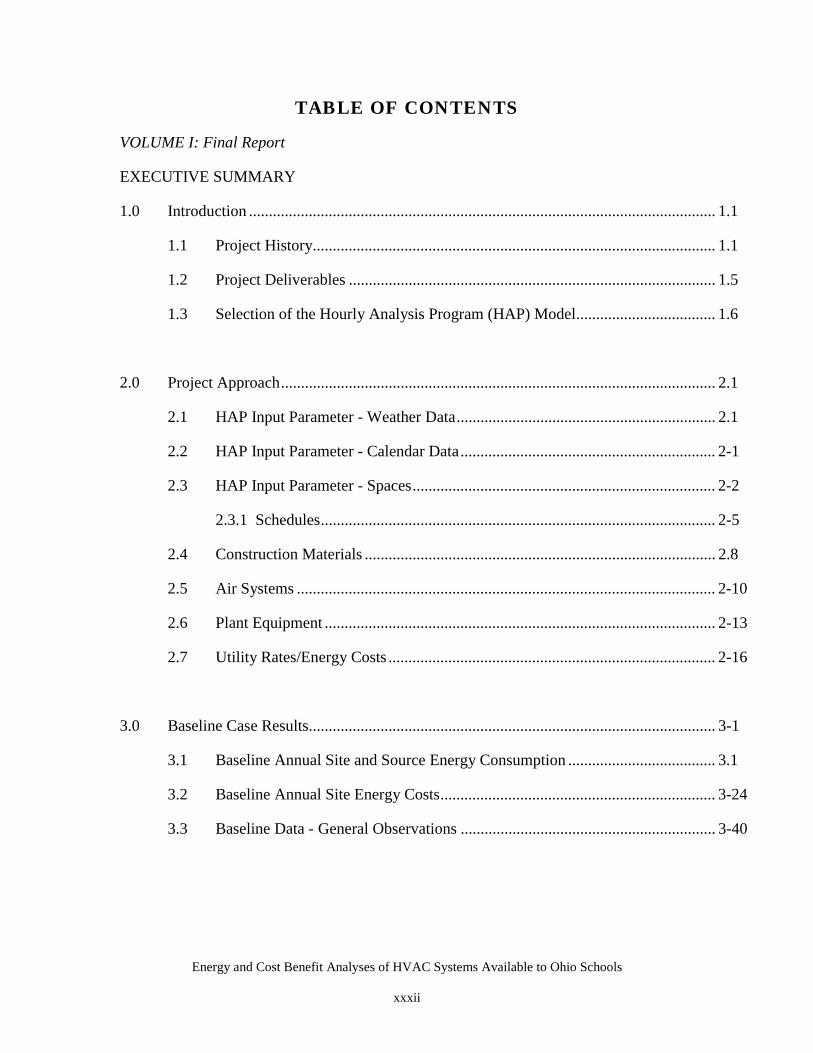
TABLE OF CONTENTS
VOLUME I: Final Report
EXECUTIVE SUMMARY
1.0 Introduction ..................................................................................................................... 1.1
1.1 Project History..................................................................................................... 1.1
1.2 Project Deliverables ............................................................................................ 1.5
1.3 Selection of the Hourly Analysis Program (HAP) Model................................... 1.6
2.0 Project Approach............................................................................................................. 2.1
2.1 HAP Input Parameter - Weather Data................................................................. 2.1
2.2 HAP Input Parameter - Calendar Data................................................................ 2-1
2.3 HAP Input Parameter - Spaces............................................................................ 2-2
2.3.1 Schedules................................................................................................... 2-5
2.4 Construction Materials ........................................................................................ 2.8
2.5 Air Systems ......................................................................................................... 2-10
2.6 Plant Equipment .................................................................................................. 2-13
2.7 Utility Rates/Energy Costs .................................................................................. 2-16
3.0 Baseline Case Results...................................................................................................... 3-1
3.1 Baseline Annual Site and Source Energy Consumption ..................................... 3.1
3.2 Baseline Annual Site Energy Costs..................................................................... 3-24
3.3 Baseline Data - General Observations ................................................................ 3-40
Energy and Cost Benefit Analyses of HVAC Systems Available to Ohio Schools
xxxiii
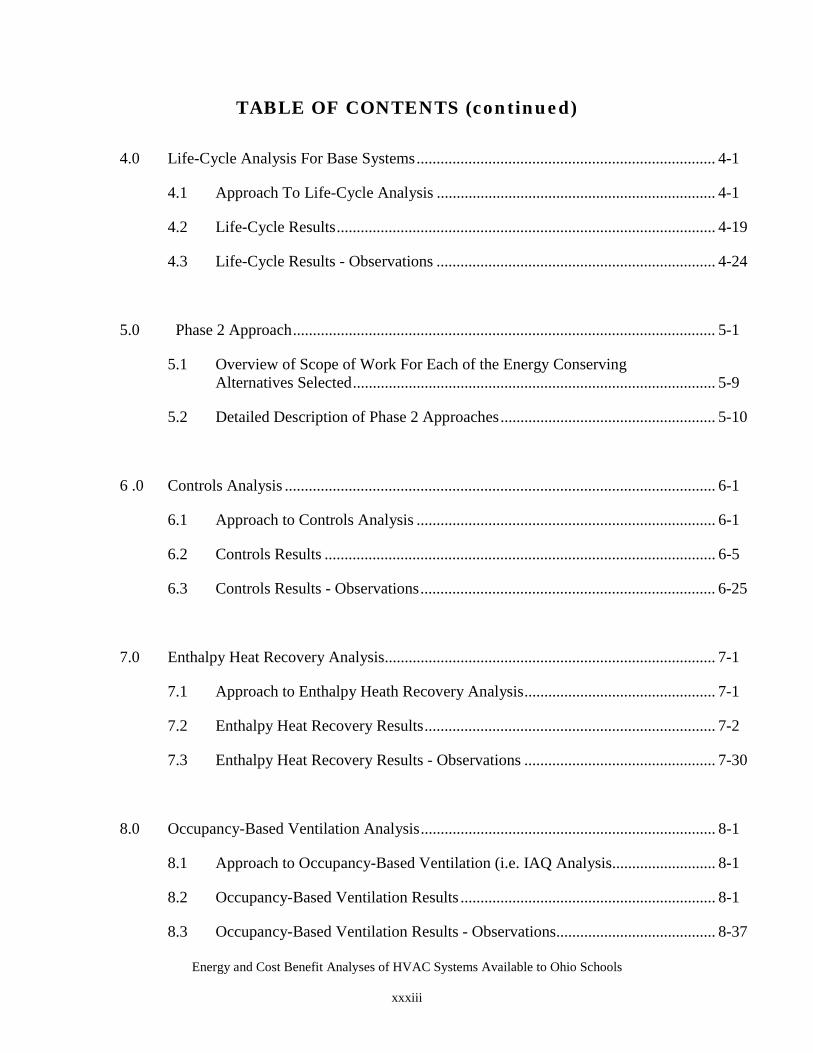
TABLE OF CONTENTS (continued)
4.0 Life-Cycle Analysis For Base Systems........................................................................... 4-1
4.1 Approach To Life-Cycle Analysis ...................................................................... 4-1
4.2 Life-Cycle Results............................................................................................... 4-19
4.3 Life-Cycle Results - Observations ...................................................................... 4-24
5.0 Phase 2 Approach.......................................................................................................... 5-1
5.1 Overview of Scope of Work For Each of the Energy ConservingAlternatives Selected........................................................................................... 5-9
5.2 Detailed Description of Phase 2 Approaches...................................................... 5-10
6 .0 Controls Analysis ............................................................................................................ 6-1
6.1 Approach to Controls Analysis ........................................................................... 6-1
6.2 Controls Results .................................................................................................. 6-5
6.3 Controls Results - Observations.......................................................................... 6-25
7.0 Enthalpy Heat Recovery Analysis................................................................................... 7-1
7.1 Approach to Enthalpy Heath Recovery Analysis................................................ 7-1
7.2 Enthalpy Heat Recovery Results......................................................................... 7-2
7.3 Enthalpy Heat Recovery Results - Observations ................................................ 7-30
8.0 Occupancy-Based Ventilation Analysis.......................................................................... 8-1
8.1 Approach to Occupancy-Based Ventilation (i.e. IAQ Analysis.......................... 8-1
8.2 Occupancy-Based Ventilation Results ................................................................ 8-1
8.3 Occupancy-Based Ventilation Results - Observations........................................ 8-37
Energy and Cost Benefit Analyses of HVAC Systems Available to Ohio Schools
xxxiv
TABLE OF CONTENTS (continued)
9.0 Geothermal Heat Pump Analysis .................................................................................... 9-1
9.1 Approach to Geothermal Heat Pump Analysis .................................................. 9-1
9.2 Geothermal Heat Pump Results .......................................................................... 9-3
9.2.1 Geothermal Case Annual Site and Source Energy Consumption ............. 9-3
9.2.2 Geothermal Heat Pump Annual Energy Costs.......................................... 9-10
9.2.3 Geothermal Heat Pump Life Cycle Costs ................................................. 9-14
9.3 Geothermal Heat Pump Observations ................................................................. 9-14
10.0 Daylighting Analysis....................................................................................................... 10-1
10.1 Approach to Daylighting Analysis...................................................................... 10-1
10.1.1 Window Glazing Characteristics............................................................. 10-1
10.1.2 Cool Daylighting ..................................................................................... 10-2
10.1.3 Approach to Daylighting Analysis........................................................... 10-2
10.1.4 Modeling Trade-offs and Assumptions................................................... 10-3
10.1.5 Modeling Method.................................................................................... 10-4
10.1.6 Modeling Method - Details ..................................................................... 10-4
10.2 Daylighting Results ............................................................................................. 10-6
10.2.1 Elementary School Results...................................................................... 10-7
10.3 Daylighting Results - Observations and Recommendations ............................... 10-17
LIST OF TABLES
Table S-1: Summary of Plant Design Options......................................................................... iv
Table S-2: Baseline Site Energy Consumption (MMBTU/Year) by HVAC SystemSchool Type and Location...................................................................................... vi
Energy and Cost Benefit Analyses of HVAC Systems Available to Ohio Schools
xxxv
TABLE OF CONTENTS (continued)
LIST of TABLES (continued)
Table S-3: Baseline Source Energy Consumption (MMBTU/Year) by HVAC SystemSchool Type and Location.....................................................................................vii
Table S-4: Baseline Annual Site Energy Cost ($Year) by HVAC System, SchoolType and Location................................................................................................viii
Table S-5: Life-Cycle Costs for All Baseline Options ............................................................. x
Table S-6: Controls – Related Annual Cost Savings ($) for Elementary Schools..................xii
Table S-7: Controls –Annual Energy Cost Savings ($) for High Schools..............................xiii
Table S-8: Controls – Net Present Value and Payback Results for Elementary Schools .......xiv
Table S-9: Controls – Net Present Value and Payback Results for High Schools................. xv
Table S-10: Enthalpy Heat Recovery Net First Costs for Elementary School HVACSystem Options ...................................................................................................xvii
Table S-11: Enthalpy Heat Recovery Net First Costs for High School HVAC SystemsOptions ...............................................................................................................xviii
Table S-12: Enthalpy Heat Recovery NPVs and PBs for the Elementary School Cases ....... xix
Table S-13: Enthalpy Heat Recovery NPVs and PBs for the High School Cases.................... xx
Table S-14: Annual Site Energy Savings and Incremental Use for 15 vs 10 and 15 vs20 CFM/person Ventilation Scenarios (MMBTUH/Year)..................................xxii
Table S-15: Annual Site Energy Savings and Incremental Costs for 15 vs 10 and 15 vs20 CFM/person Ventilation Scenarios ($/Year).................................................xxiii
Table S-16: NPV Summaries for 10 vs 15 CFM/Person and 20 vs 15 CFM/PersonHVAC System Options ...................................................................................... xxiv
Table S-17: Annual Site and Source Energy Consumption for Geothermal Cases ................ xxv
Table S-18: Geothermal Heat Pump Life Cycle Costs .......................................................... xxvi
Table S-19: Adjusted Annual Baseline Energy (Low E glazing and lower lightinglevels) and Daylighting Annual Energy Usage for High School Cases............xxvii
Energy and Cost Benefit Analyses of HVAC Systems Available to Ohio Schools
xxxvi
TABLE OF CONTENTS (continued)
LIST OF TABLES (continued)
Table S-20: Adjusted Annual Baseline Energy Costs (low E glazing and lower lightinglevels) and Daylighting Annual Energy Costs for High School Cases .............. xxix
Table 2-1: Number of Holiday/Off-Time Dates Used in the HAP Model ............................2-2
Table 2-2: Typical Input for Elementary School Space ........................................................2-4
Table 2-3: Example HAP High School Schedule – People in Corridors...............................2-6
Table 2-4: Example HAP Elementary School Schedule – People in Classrooms................2-8
Table 2-5: Example of Wall Input Template: Elementary School Wall Type 1 ..................2-9
Table 2-6: Example of Roof Construction Input Templates: Elementary SchoolCustom Roof ........................................................................................................2-9
Table 2-7: Example of Window Construction Input Templates: Elementary SchoolCustom Windows ...............................................................................................2-10
Table 2-8: Example of VAV with Reheat Air System Input Templates: ElementarySchool.................................................................................................................2-11
Table 2-9: Summary of Plant Design Options.....................................................................2-15
Table 2-10: Columbus Southern Power Rates.......................................................................2-18
Table 2-11: Cleveland Electric Illuminating Power Rates ....................................................2-18
Table 2-12: Cincinnati Gas and Electric Power and Gas Rates.............................................2-19
Table 2-13: Columbia Gas of Ohio Gas Rates for Columbus and Cleveland .......................2-20
Table 3-1: Baseline Annual Site Energy Consumption (MMBTU/Year by HVACSystem Option, School Type and Location..........................................................3-2
Table 3-2: Basis for Baseline Annual Site Energy Consumption (MMBTU/Year) byHVAC System for the Columbus Elementary School Case ................................3-3
Table 3-3: Baseline Annual Site Energy Consumption (BTU/FT2/Year) by HVACSystem Option, School Type and Location..........................................................3-5
Energy and Cost Benefit Analyses of HVAC Systems Available to Ohio Schools
xxxvii
TABLE OF CONTENTS (continued)
LIST OF TABLES (continued)
Table 3-4: Baseline Annual Site Energy Consumption (MMBTU/Year) for theElementary School Case – Sorted by HVAC System Option..............................3-6
Table 3-5: Baseline Site Energy Consumption (MMBTU/Year) for the High SchoolCase – Sorted by HVAC System Option .............................................................3-7
Table 3-6: Baseline Annual Source Energy Consumption (MMBTU/Year) by HVACSystem Option, School Type and Location .........................................................3-9
Table 3-7: Baseline Annual Source Energy Consumption (BTU/FT2/Year) by HVACSystem Option, School Type and Location .......................................................3-10
Table 3-8: Baseline Source Energy Consumption (MMBTU/Year) for the ElementarySchool Case – Sorted from Smallest to Largest .................................................3-11
Table 3-9: Baseline Source Energy Consumption (MMBTU/Year) for the HighSchool Case – Sorted from Smallest to Largest .................................................3-12
Table 3-10: Description of Figures 3-1 to 3-10 .....................................................................3-13
Table 3-11: Baseline Annual Site Energy Cost ($/Year) by HVAC System, SchoolType Option and Location..................................................................................3-25
Table 3-12: Baseline Annual Site Energy Cost ($/Ft2/Year) by HVAC System Option,School Type and Location..................................................................................3-26
Table 3-13: Baseline Site Energy Cost ($/Year) for the Elementary School Case –Sorted from Smallest to Largest.........................................................................3-27
Table 3-14: Baseline Site Energy Cost ($/Year) for the High School Case – Sortedfrom Smallest to Largest ....................................................................................3-28
Table 3-15: Description of Figures 3-11 to 3-20 ...................................................................3-29
Table 4-1: Cooling Baseline Equipment Sizes (RT) by HVAC System ...............................4-2
Table 4-2: Heating Baseline Equipment Sizes (MBTUH) by HVAC System .....................4-3
Table 4-3: Cooling Baseline Equipment First Costs ($) by HVAC System – No CityCost Correction ....................................................................................................4-4
Energy and Cost Benefit Analyses of HVAC Systems Available to Ohio Schools
xxxviii
TABLE OF CONTENTS (continued)
LIST OF TABLES (continued)
Table 4-4: Heating Baseline Equipment First Costs ($) by HVAC System – No CityCost Correction ....................................................................................................4-5
Table 4-5: Heat Pump First Costs for an Elementary School and a High School .................4-6
Table 4-6: Summary of Elementary School (Base Cases) First Costs ................................4-10
Table 4-7: Summary of High School (Base Cases) First Costs..........................................4-12
Table 4-8: Annualized Elementary School Service, Maintenance and ReplacementCosts ($) .............................................................................................................4-15
Table 4-9: Annualized High School Service, Maintenance and Replacement Costs($) .......................................................................................................................4-17
Table 4-10: Life-Cycle Costs for all Baseline Options..........................................................4-20
Table 4-11: Elementary School Life Cycle Costs for All Baseline Options – Sorted...........4-21
Table 4-12: High School Life Cycle Costs for All Baseline Options – Sorted .....................4-22
Table 6-1: Controls Options by City and Case Modeled.......................................................6-1
Table 6-2: Incremental Costs for Second Meter in Cleveland Elementary School ...............6-4
Table 6-3: Incremental Costs for Second Meter in Cleveland High School .........................6-4
Table 6-4: Controls –Annual Energy Costs Savings ($) for Elementary Schools.................6-6
Table 6-5: Controls –Annual Energy Costs Savings per Square Foot for ElementarySchools .................................................................................................................6-7
Table 6-6: Controls –Annual Energy Costs Savings ($) for High Schools ..........................6-8
Table 6-7: Controls –Annual Energy Costs Savings per Square Foot for High Schools ......6-9
Table 6-8: Controls – Net Present Value and Payback Results for Elementary Schools ....6-23
Table 6-9: Controls – Net Present Value and Payback Results for High Schools..............6-24
Table 7-1: Heat Recovery Equipment Options in Base Buildings ........................................7-1
Energy and Cost Benefit Analyses of HVAC Systems Available to Ohio Schools
xxxix
TABLE OF CONTENTS (continued)
LIST OF TABLES (continued)
Table 7-2: Cooling Equipment Sizes for HVAC System Utilizing Enthalpy HeatRecovery...............................................................................................................7-3
Table 7-3: Heating Equipment Sizes for HVAC System Utilizing Enthalpy HeatRecovery...............................................................................................................7-4
Table 7-4: Reductions in Cooling Equipment Sizes for HVAC System OptionsUtilizing Enthalpy Heat Recovery .......................................................................7-5
Table 7-5: Reductions in Heating Equipment Sizes for HVAC System OptionsUtilizing Enthalpy Heat Recovery .......................................................................7-6
Table 7-6: Enthalpy Heat Recovery Net First Costs for Elementary School HVACSystem Options ....................................................................................................7-8
Table 7-7: Enthalpy Heat Recovery Net First Costs for High School HVAC SystemOptions .................................................................................................................7-9
Table 7-8: Annual Enthalpy Energy Use Savings for Elementary Schools(MMBTU/Year) .................................................................................................7-10
Table 7-9: Annual Enthalpy Energy Savings for Elementary Schools(MMBTU/FT2/Year) ..........................................................................................7-11
Table 7-10: Annual Enthalpy Energy Use Savings for High School (MMBTU/Year).........7-12
Table 7-11: Annual Enthalpy Energy Savings for Elementary Schools(MMBTU/FT2/Year) ..........................................................................................7-13
Table 7-12: Annual Enthalpy Energy Use Savings for Elementary Schools ($/Year) ..........7-17
Table 7-13:Annual Enthalpy Energy Savings for Elementary Schools ($/FT2/Year) ...............7-18
Table 7-14: Annual Enthalpy Energy Savings for High Schools ($/Year)...........................7-19
Table 7-15: Annual Enthalpy Energy Cost Savings for Elementary Schools($/FT2/Year) .......................................................................................................7-20
Table 7-16: Enthalpy Heat Recovery Annualized Energy and Service, Maintenanceand Replacement Cost Savings for Elementary School HVAC SystemOptions ..............................................................................................................7-24
Energy and Cost Benefit Analyses of HVAC Systems Available to Ohio Schools
xl
TABLE OF CONTENTS (continued)
LIST OF TABLES (continued)
Table 7-17: Enthalpy Heat Recovery Annualized Energy and Service, Maintenanceand Replacement Cost Savings for High School HVAC System Options ......... 7-25
Table 7-18: Enthalpy Heat Recovery NPV’s and PBs for the Elementary School Cases ..... 7-26
Table 7-19: Enthalpy Heat Recovery NPV’s and PBs for the High School Cases ................ 7-27
Table 8-1: Cooling Equipment Chiller Sizes (RT) for Three Fresh Air VentilationRates (High School – Columbus, OH ...................................................................8-2
Table 8-2: Heating Equipment Boiler Sizes (MBTUH) for Three Fresh AirVentilation Rates (High School – Columbus, OH) ...............................................8-3
Table 8-3: Listing of Changes in Heat Pump Model Numbers for the Four Heat PumpCases .....................................................................................................................8-4
Table 8-4: Annual Site Energy Savings and Incremental Use for 15 vs 10 and 15 vs20 CFM/Person Ventilation Scenarios (MMBTUH/Year) ...................................8-7
Table 8-5: Annual Site Energy Savings and Incremental Use for 15 vs 10 and 15 vs20 CFM/Person Ventilation Scenarios (MMBTUH/FT2/Year) ............................8-8
Table 8-6: Annual Site Energy Savings and Incremental Use for 15 vs 10 and 15 vs20 CFM/Person Ventilation Scenarios ($/Year) ................................................8-13
Table 8-7: Annual Energy Savings and Incremental Costs for 15 vs 10 and 15 vs 20CFM/Person Ventilation Scenarios ($/FT2/Year)..............................................8-14
Table 8-8: Total Differential First Costs for HVAC System Options for Both the 10and the 20 CFM/Person Cases – Columbus H.S. w/City Index Correction.......8-18
Table 8-9: Cooling Plant First Costs for HVAC System Options for the Base Case, 10and the 20 CFM/Person Cases – Columbus H.S. w/City Index Correction.......8-19
Table 8-10: Heating Plant First Costs for HVAC System Options for the Base Case, 10and the 20 CFM/Person Cases – Columbus H.S. w/City Index Correction.......8-20
Table 8-11: Heat Pump Plant First Costs for HVAC System Options for the Base Case,10 CFM/Person and the 20 CFM/Person Cases .................................................8-21
Energy and Cost Benefit Analyses of HVAC Systems Available to Ohio Schools
xli
TABLE OF CONTENTS (continued)
LIST OF TABLES (continued)
Table 8-12: Total Differential Service, Maintenance and Repair Costs for HVACSystem Options for Both the 10 and the 20 CFM/Person Cases –Columbus H.S. w/City Index Corrections.............................................................8-25
Table 8-13: Cooling Plant Differential Service, Maintenance and Repair Costs forHVAC System Options for Both the 10 and the 20 CFM/Person Cases ..............8-26
Table 8-14: Heating Plant Differential Service, Maintenance and Repair Costs forHVAC System Options for Both the and the 20 CFM Person Cases ...................8-27
Table 8-15: Heat Pump Plant Differential Service, Maintenance and Repair Costs forHVAC System Options for Both the 10 and the 20 CFM/Person Cases ..............8-28
Table 8-16: NPV Summaries for 10 vs 15 CFM Person and 20 vs 15 CFM/PersonHVAC System Options .........................................................................................8-32
Table 9-1: Assumed Geothermal Heat Pump Ground-Loop Temperatures by Month............ 9-2
Table 9-2: Annual Site and Source Energy Consumption for Geothermal Cases ................... 9-3
Table 9-3: Baseline Site Energy Consumption (MMBYU/Year for the ElementarySchool Case – Sorted by HVAC System Option ................................................... 9-5
Table 9-4: Baseline Site Energy Consumption (MMBTU/Year) for the High SchoolCase – Sorted by HVAC System Option ............................................................... 9-6
Table 9-5: Baseline Site Energy Consumption (MMBTU/Year) for the ElementarySchool Case – Sorted by HVAC System Option ................................................... 9-8
Table 9-6: Baseline Site Energy Consumption (MMBTU/Year) for the High SchoolCase – Sorted by HVAC System Option ............................................................... 9-9
Table 9-7: Summary of Annual Energy Costs for Geothermal Heat Pump Cases ............... 9-10
Table 9-8: Baseline Annual Site Energy Cost ($/Year) for the Elementary SchoolCase – Sorted from Smallest to Largest .............................................................. 9-11
Table 9-9: Baseline Annual Site Energy Cost ($/Year) for the High School Case –Sorted from Smallest to Largest.......................................................................... 9-12
Table 9-10: Differential Annual Site Energy Cost ($/Year) for both the Elementary andHigh School Geothermal Heat Pump Cases........................................................ 9-13
Energy and Cost Benefit Analyses of HVAC Systems Available to Ohio Schools
xlii
TABLE OF CONTENTS (continued)
LIST OF TABLES (continued)
Table 9-11: Geothermal Heat Pump Life Cycle Costs ........................................................... 9-14
Table 10-1: Sky Conditions Used for Columbus, Ohio.......................................................... 10-5
Table 10-2: Integrated Sky Conditions................................................................................... 10-5
Table 10-3: Light Output Assumptions .................................................................................. 10-6
Table 10-4: Average School Year Lighting Power Densities................................................. 10-6
Table 10-5: Adjusted Annual Baseline Energy (Low E glazing and lower lightinglevels) and Daylighting Annual Energy Usage for Elementary SchoolCases.................................................................................................................... 10-8
Table 10-6: Adjusted Annual Baseline Energy (Low E glazing and lower lightinglevels) and Daylighting Annual Energy Usage for Elementary SchoolCases.................................................................................................................. 10-10
Table 10-7: Adjusted Annual Baseline Energy (Low E glazing and lower lightinglevels) and Daylighting Annual Energy Usage for High School Cases............ 10-13
Table 10-8: Adjusted Annual Baseline Energy (Low E glazing and lower lightinglevels) and Daylighting Annual Energy Usage for High School Cases............10-15
LIST OF FIGURES
Figure 3-1: OSFC Elementary School Base Annual Site Energy Consumption(MMBTU/Year) HVAC Systems 1A1 – 1C2 .................................................... 3-14
Figure 3-2: OSFC Elementary School Base Annual Site Energy Consumption(MMBTU/Year) HVAC Systems 1C3 – 2B1 .................................................... 3-15
Figure 3-3: OSFC Elementary School Base Annual Site Energy Consumption(MMBTU/Year) HVAC Systems 2B2 –2D3 .....................................................3-16
Figure 3-4: OSFC Elementary School Base Annual Site Energy Consumption(MMBTU/Year) HVAC Systems 3A1 –4B1 .....................................................3-17
Figure 3-5: OSFC Elementary School Base Annual Site Energy Consumption(MMBTU/Year) HVAC Systems 4B2 –4D3 .....................................................3-18
Energy and Cost Benefit Analyses of HVAC Systems Available to Ohio Schools
xliii
TABLE OF CONTENTS (continued)
LIST OF FIGURES (continued)
Figure 3-6: OSFC High School Base Annual Site Energy Consumption(MMBTU/Year) HVAC Systems 1A1 –1C2 ....................................................3-19
Figure 3-7: OSFC High School Base Annual Site Energy Consumption(MMBTU/Year) HVAC Systems 1C3 –2B1 ....................................................3-20
Figure 3-8: OSFC High School Base Annual Site Energy Consumption(MMBTU/Year) HVAC Systems 2B2 – 2D3 ...................................................3-21
Figure 3-9: OSFC High School Base Annual Site Energy Consumption(MMBTU/Year) HVAC Systems 3A1 – 4B1 ...................................................3-22
Figure 3-10: OSFC High School Base Annual Site Energy Consumption(MMBTU/Year) HVAC Systems 4B2 – 4D3 ...................................................3-23
Figure 3-11: OSFC Elementary School Baseline Annual Energy Costs ($/Year) HVACSystems 1A1 – 1C2 ...........................................................................................3-30
Figure 3-12: OSFC Elementary School Baseline Annual Energy Costs ($/Year) HVACSystems 1C3 – 2B1 ...........................................................................................3-31
Figure 3-13: OSFC Elementary School Baseline Annual Energy Costs ($/Year) HVACSystems 2B2 – 2D3 ...........................................................................................3-32
Figure 3-14: OSFC Elementary School Baseline Annual Energy Costs ($/Year) HVACSystems 3A1 – 4B1 ...........................................................................................3-33
Figure 3-15: OSFC Elementary School Baseline Annual Energy Costs ($/Year) HVACSystems 4B2 – 4D3 ............................................................................................3-34
Figure 3-16: OSFC High School Baseline Annual Energy Costs ($/Year) HVACSystems 1A1 – 1C2............................................................................................3-35
Figure 3-17: OSFC High School Baseline Annual Energy Costs ($/Year) HVACSystems 1C3 – 2B1 ............................................................................................3-36
Figure 3-18: OSFC High School Baseline Annual Energy Costs ($/Year) HVACSystems 2B2 – 2D3 ............................................................................................3-37
Figure 3-19: OSFC High School Baseline Annual Energy Costs ($/Year) HVACSystems 3A1 – 4B1 ............................................................................................3-38
Energy and Cost Benefit Analyses of HVAC Systems Available to Ohio Schools
xliv
TABLE OF CONTENTS (continued)
LIST OF FIGURES (continued)
Figure 3-20: OSFC High School Baseline Annual Energy Costs ($/Year) HVACSystems 4B2 – 4D2 ............................................................................................3-39
Figure 4-1 OSFC Elementary School Life Cycle Cost ($) HVAC Systems 1A1 – 1C2 .....4-23
Figure 6-1 Second Meter Circuit Breakout for Elementary School.......................................6-2
Figure 6-2 Second Meter Circuit Breakout for High School .................................................6-3
Figure 6-3 OSFC Elementary School Controls Option Annual Energy Cost Savings($/Year) HVAC Systems 1A1 – 1C2 .................................................................6-11
Figure 6-4 OSFC Elementary School Controls Option Annual Energy Cost Savings($/Year) HVAC Systems 1C3 – 2B1 .................................................................6-12
Figure 6-5 OSFC Elementary School Controls Option Annual Energy Cost Savings($/Year) HVAC Systems 2B2 – 2D3 .................................................................6-13
Figure 6-6 OSFC Elementary School Controls Option Annual Energy Cost Savings($/Year) HVAC Systems 3A1 – 4B1 .................................................................6-14
Figure 6-7 OSFC Elementary School Controls Option Annual Energy Cost Savings($/Year) HVAC Systems 4B2 – 4D3 .................................................................6-15
Figure 6-8 OSFC High School Controls Option Annual Energy Cost Savings ($/Year)HVAC Systems 1A1 – 1C2................................................................................6-16
Figure 6-9 OSFC High School Controls Option Annual Energy Cost Savings ($/Year)HVAC Systems 1C3 – 2B1................................................................................6-17
Figure 6-10 OSFC High School Controls Option Annual Energy Cost Savings ($/Year)HVAC Systems 2B2- 2D3 .................................................................................6-18
Figure 6-11 OSFC High School Controls Option Annual Energy Cost Savings ($/Year)HVAC Systems 4B2– 4D3.................................................................................6-19
Figure 6-12 OSFC High School Controls Option Annual Energy Cost Savings ($/Year)HVAC Systems 4B2– 4D3.................................................................................6-20
Figure 6-13 OSFC Elementary School Energy Simulation – Cincinnati-Controls PanelVAV w/Reheat ...................................................................................................6-21
Energy and Cost Benefit Analyses of HVAC Systems Available to Ohio Schools
xlv
TABLE OF CONTENTS (continued)
LIST OF FIGURES (continued)
Figure 7-1 OSFC Elementary School Annual Site Energy Savings with Enthalpy HeatRecovery (MMBTU/Year) HVAC Systems 1A1 – 1C2....................................7-14
Figure 7-2 OSFC High School Annual Site Energy Savings with Enthalpy HeatRecovery (MMBTU/Year) HVAC Systems 1A1 – 1C2....................................7-15
Figure 7-3 OSFC Elementary School Annual Site Energy Savings with Enthalpy HeatRecovery ($/Year) HVAC Systems 1A1 – 1C2.................................................7-21
Figure 7-4 OSFC High School Annual Site Energy Savings with Enthalpy HeatRecovery ($/Year) HVAC Systems 1A1 – 1C2.................................................7-22
Figure 7-5 OSFC Elementary School Paybacks with Enthalpy Heat Recovery (Years)HVAC Systems 1A1 – 1C2................................................................................7-28
Figure 7-6 OSFC High School Paybacks with Enthalpy Heat Recovery (Years)HVAC Systems 1A1 – 1C2................................................................................7-29
Figure 8-1 OSFC Columbus High School Annual Site Energy Use for 15 vs 10SCFM/Person (MMBTU/Year) HVAC Systems 1A1 – 1C2 ............................8-10
Figure 8-2 OSFC Columbus High School Annual Site Energy Use for 15 vs 20SCFM/Person (MMBTU/Year) HVAC Systems 1A1 – 1C2 ............................8-11
Figure 8-3 OSFC Columbus High School Annual Site Energy Savings for 15 vs 10SCFM/Person (MMBTU/Year) HVAC Systems 1A1 – 1C2 ............................8-15
Figure 8-4 OSFC Columbus High School Annual Site Savings for 15 vs 20SCFM/Person (MMBTU/Year) HVAC Systems 1A1 – 1C2 ............................8-16
Figure 8-5 OSFC Columbus High School Differential Life Cycle Costs ($) HVACSystems 1A1 – 1D1............................................................................................8-33
Figure 8-6 OSFC Columbus High School Differential Life Cycle Costs ($) HVACSystems 1D2 – 2C2............................................................................................8-34
Figure 8-7 OSFC Columbus High School Differential Life Cycle Costs ($) HVACSystems 2C3 – 4A2............................................................................................8-35
Figure 8-8 OSFC Columbus High School Differential Life Cycle Costs ($) HVACSystems 4A3 – 4D3............................................................................................8-36

Energy and Cost Benefit Analyses of HVAC Systems Available to Ohio Schools
xlvi
TABLE OF CONTENTS (continued)
LIST OF FIGURES (continued)
Figure 9-1 Plot of Assumed Geothermal Heat Pump Ground-Loop Temperatures byMonth ...................................................................................................................9-2
Energy and Cost Benefit Analyses of HVAC Systems Available to Ohio Schools
1-1
1.0 Introduction
Lawhon and Associates, Inc., (L&A) was selected by the Ohio Department ofDevelopment’s Office of Energy Efficiency (ODOD-OEE), to quantitatively analyzeheating, ventilation and air conditioning (HVAC) equipment options contained in theOhio School Facilities Commission’s (OSFC) Ohio School Design Manual (OSDM).The project had two primary objectives: 1) Determine the relative energy effectiveness ofup to 40 HVAC combinations available in the OSFC OSDM for an elementary and highschool in three Ohio cities, and 2) Evaluate alternative, sustainable energy savings thatmight be incorporated in future building designs considered under the OSDM. These twoobjectives were also known as Phase 1 and Phase 2 of the project.
Phase 1 modeled, in detail, two building types designed using the new OSDM, todetermine: 1) annual energy consumption for 40 HVAC system options, and 2) how eachsystem ranked against each other. Initial output from the models consisted of hourlyelectric, gas and fuel oil consumption for each building. Annual site and source energyuse were determined for 240 cases (40 HVAC system options, two buildings and threecities) using this information. This information was also used, with utility rate data fromCincinnati, Cleveland and Columbus, to determine annual energy costs for the 240 cases.
Phase 2 consisted of determining life-cycle costs for the 240 baseline cases andconsidered dozens of sustainable energy savings alternatives for further evaluation.Ultimately, five alternatives were selected that were believed to have the most promisefor providing sustainable energy savings. These included the use of enthalpy heatrecovery wheels, the use of controls to shift building loads, the impact of varyingamounts of fresh air on HVAC loads, the use of geothermal heat pumps and the impactsof daylighting options on annual energy consumption. In each case, the models were re-run using alternative equipment options and compared against baseline data. For severalof the alternatives, the economic cost benefit of such changes was computed using bothpay back and net present value calculations.
1.1 Project History
This project was developed to validate the energy-effectiveness of energy optionsavailable to architects and engineers in the OSDM. The original Request for Proposal(RFP) for this work was issued on July 15, 1998; an amendment to the RFP was issuedJuly 15, 1999. Proposals were due August 15, 1998 and the contract was awardedAugust 29, 1998. Additional follow-up work was proposed on December 23, 1999 andawarded on March 22, 2000. This report summarizes work under both awards.
Energy and Cost Benefit Analyses of HVAC Systems Available to Ohio Schools
1-2
As outlined in the RFP, the scope of work was composed of two major elements: Phase 1and Phase 2.
Phase 1: Model 9 building designs, each in three distinct locations, based onenvelope and HVAC requirements in the OSDM.
Key elements to be included in the Phase 1 proposal included:
1. An evaluation of the OSDM using an appropriate modeling tools, such as DOE-2,Carrier HAP, Trane Trace, etc.
2. Rigorous modeling of a minimum of 9 building types, at one to three locations inOhio (e.g., Columbus, Cincinnati and Cleveland) depending on resourceavailability.
Simulations of each building type should take into account the following factorsestablished by the OSBM:
• Siting, orientation, general building configuration and architectural massing/programming
• Envelope construction (mass and R-value as a minimum), includingfenestration types and configurations
• Lighting, plug and miscellaneous electrical power densities
• HVAC configuration, including layout, zoning and control
• Complete applicable utility rate structures factoring in ability to obtain a lowerrate through aggregation or competition
• Document operational assumptions and key variables that will materiallyaffect baseline energy performance. At a minimum, this is to include:
� Weather data� Occupancy - density and schedule� HVAC run time and set points� Lighting schedule� Plug load power density and schedules.
Phase 2: Complete cost-benefit studies on sustainable building design practices.
Key elements to be included in the Phase 2 proposal included:
1. Identification of opportunities for incorporating sustainable building designpractices including additional improvements in energy efficiency along with othercosts of operations.
Energy and Cost Benefit Analyses of HVAC Systems Available to Ohio Schools
1-3
2. Repeating Phase 1 simulations based on these improvements and including, at aminimum:
• Siting, orientation, general building configuration and architectural massing/programming
• Envelope construction (mass and R-value as a minimum), includingfenestration types and configurations
• Lighting, plug and miscellaneous electrical power densities
• HVAC configuration, including layout, zoning and control
• Complete applicable utility rate structures factoring in ability to obtain a lowerrate through aggregation or competition.
3. Document operational assumptions and key variables that will materially affectbaseline energy performance. At a minimum, this was to include:
• Weather data
• Occupancy - density and schedule
• HVAC run time and set points
• Lighting schedule
• Plug load power density and schedules.
4. Document the incremental costs of effecting the improvements identified earlierduring Phase 2.
5. Complete financial analysis of these technologies/practices to determine if thesavings associated with these improvements will pay for the incremental costs ofthe improvements.
Supplemental Work:
Key elements to be included in the Supplemental Work included:
1. Site and Source Energy: Development of Site and Source Energy Consumptiontables for all options. Activities to be completed during this task will include:
• Extract, organize and incorporate fuel-use data from the project databases foreach of the Phase 1 baseline options.
• Calculate source energy for each of the baseline options using an ORNL set ofFuel Cycle Efficiency values for electricity, fuel oil and natural gas.
• Hold up to two half-day meetings and one full-day presentation of Phase 2results with ODOD-OEE and invited representatives.
Energy and Cost Benefit Analyses of HVAC Systems Available to Ohio Schools
1-4
2. Life-Cycle Costs for Baseline HVAC Options: The objective is to determineHVAC option life-cycle costs. This task was to be completed under the directionof ODOD-OEE, to ensure that consensus is reached on the definition, scope andcontent of elements to be included in life-cycle analyses. L&A was to completelife-cycle analyses based on system equipment first costs, annual energy costs andservice and maintenance costs for each of the forty baseline HVAC options intwo buildings and three cities.
3. Daylighting: Evaluate annual energy cost impacts of two daylighting options onthe Columbus high school HVAC options. L&A will utilize experts to: 1) definethe two daylighting scenarios and, 2) determine how best to integrate consultantinput with HAP. Currently, HAP does not allow one to directly model the HVACimplications of daylighting.
4. Impact of Reduced Load/Equipment on Costs for the Enthalpy Wheel Alternative:The HAP economic evaluations for the Enthalpy heat recovery cases (240 total)will be re-run to account for potentially smaller equipment needs under theenthalpy case. Activities to be completed during this task will include:
• Review existing enthalpy load model data, select revised equipment sizes.(Utilize Fanning-Howey data – although the information sent is equipmentsize specific and must be extrapolated to other equipment sizes).
• Re-run HAP model with new equipment sizes (240 runs)
• Cost equipment
• Re-run economic models; incorporate results into the final report.
5. Development of Presentations: Three specific presentations will be prepared todisseminate project results to: 1) National Audience, School Officials, StateSchool Policy Makers and the Design Professional Community. Activities to becompleted during this task will include:
• Draft Presentation Outlines/Meet with ODOD-OEE and OSFC to finalizepresentation(s) content
• Draft Presentations in MicroSoft® PowerPoint® for the following targetaudiences:
� National� State School Officials and Policy Makers� State School Operating Staff� Professional Design Community� Review Presentations with ODOD-OEE� Finalize Presentations� Develop ASHRAE Paper
The presentations will be provided to ODOD-OEE on disk or CD-ROM.
Energy and Cost Benefit Analyses of HVAC Systems Available to Ohio Schools
1-5
6. Geothermal Heat Pump Option: Add Geothermal Heat Pump as an alternativeheating and cooling plant option. Tasks to be completed during this task willinclude:
• Define project scope with ODOD-OEE and utility sponsor
• Obtain loop temperatures from literature
• Develop input equations for HAP
• Run HAP (three locations, two buildings)
• Define/complete economics
• Prepare Final Report Text/Illustrations
1.2 Project Deliverables
Deliverables were to include:
1. A final report providing a detailed analysis of the new building standardsestablished by the Ohio School Design Manual (OSDM).
2. Improved energy efficiency opportunities that exist in the standards established bythe OSDM.
3. An analysis of each building type incorporating the improvements identified inDeliverable #2.
4. Estimates of the incremental costs, as well as savings, associated with theimplementation of these improvements.
5. An assessment of the capacity of the savings associated with these improvementsto pay for incremental costs of making these improvements.
6. Three MicroSoft® PowerPoint® presentations.
The actual scope of work completed was the same as identified in the RFP except that thenumber of buildings was reduced from nine to six. The six buildings include a highschool and elementary school at three locations. The middle school was eliminatedbecause no middle schools were under design using the new OSDM. This is in partbecause many school districts are converting existing high schools to middle schools asthey expand. Thus, few new middle schools are being designed or built.
Actual project work began on March 1, 1999 following completion of two schoolbuilding designs under the new OSFC OSDM. Both buildings were two of the firstschool buildings designed under the new OSFC OSDM, and were modeled as if theywere located in three different locations (Cincinnati, Cleveland and Columbus).
Energy and Cost Benefit Analyses of HVAC Systems Available to Ohio Schools
1-6
The two schools were modeled during this project were:
• Uhrichsville High School (Claymont City Schools, Dennison, Ohio). Floorarea totaled 120,500 square feet.
• Katherine Thomas Elementary School (Windham Exempted Village SchoolDistrict, Windham, Ohio). Floor area totaled 64,442 square feet.
1.3 Selection of the Hourly Analysis Program (HAP) Model
Four of the most commonly used models are the Department of Energy’s (DOE) DOE2.1E, Carrier’s Hourly Analysis Program (HAP), Ross Meriweather’s Energy SystemsAnalysis Software (ESAS) and Trane’s Trace 600 model. Each of these programs has itsstrengths and weaknesses. In side-by-side comparison tests run by the American GasCooling Center (AGCC), all the models except Trane Trace provided very similarsimulation results under a variety of scenarios. Trane Trace is not currently an 8,760hour per year code, which probably accounts for the difference in results from the othermodels. The DOE model is extremely robust but relatively user-unfriendly. PowerDOE,a Window’s based version of this program, makes the model somewhat more userfriendly. However, it has recently been publicly reported the DOE will be moving fromDOE 2.1E to a program known as “Energy Plus,” thus somewhat obsoleting DOE 2.1E.Energy Plus will combine DOE 2.1E with “Blast” from the University of Chicago, butwas not available in time for use with this project. ESAS and HAP produce very similarresults and are both relatively user friendly. Since the RFP recommended the use ofDOE 2.1E or HAP, L&A selected HAP for use in this work.
HAP version 4.03 was used to complete all energy simulations contained in this work.The output from HAP consisted of hourly data for consumption of electricity, natural gasand fuel oil depending on the equipment configurations selected. This hourly output wastransferred to Microsoft® Excel® spreadsheets and combined with energy cost (e.g.,tariffs for each of the cities and rates appropriate for the location and magnitude of theenergy loads) information to develop annual energy costs presented in this report.Experience has shown that this provides a more accurate estimate of actual energy coststhan using the energy cost estimator found in HAP.
Energy and Cost Benefit Analyses of HVAC Systems Available to Ohio Schools
2-1
2.0 Project Approach
The project approach was to analyze the drawing packages and specifications for both thehigh school and the elementary school to obtain detailed building envelope, equipmentand occupancy information for insertion into the HAP model. This information was thencombined with equipment and weather data from Columbus, Cincinnati and Cleveland toobtain hourly and monthly building energy loads. This information was used tosize/select equipment (from manufacturers’ catalogs) for the model. Actual equipmentsizes recommended by the OSFC provided a good check on whether or not properly sizedequipment was selected. Actual annual energy costs were obtained by combining HAPmodel output with rate schedules in a Microsoft® Excel® spreadsheet. These costsprovided the baseline energy costs against which the alternative cost options (e.g.,enthalpy wheels) were compared.
HAP is an 8,760-model meaning that it calculates building loads for each hour of eachweek of each month for a full year. Release 4.03, and its energy simulation companion3.24, were released on/about February 1, 1999. This work is based on the latest HAPenergy simulation model, Version 3.24.
A detailed explanation of the HAP model input parameters follow:
2.1 HAP Input Parameter - Weather Data
The weather database contained in HAP covers all major cities. The user simply clickson the city of interest and ties weather data for that city to the specific building beingmodeled. For this work, two school buildings (an elementary school and a high school)were modeled in three cities (Cincinnati, Cleveland, and Columbus). These cities werefelt to represent the range of weather conditions seen across the state of Ohio. Byrunning the model for two types of schools in three locations, a total of six sets ofbaseline models were run. However, weather data was needed for only three sites.
HAP uses weather data from the following sources with the following characteristics:
• It utilizes 24-hour profiles for dry-bulb (DB), wet-bulb (WB) and solarconditions for a 12-month design period.
• It uses 99.6% weather data from ASHRAE 97.
• It includes ASHRAE design maximums; covering the worst case events.
2.2 HAP Input Parameter - Calendar Data
HAP requires the user to mark the date(s), if any, when the building will not be occupied.For schools, this includes all holidays and other days off so that the model properlyaccounts for the heat gain due to people being present in the building. For example, forJanuary, it was assumed that on January 1st (New Years Day) and January 18th (MartinLuther King’s birthday) the buildings would be unoccupied. Other unoccupied periodsinclude President’s Day, spring break, summer break, Labor Day, in-service days,
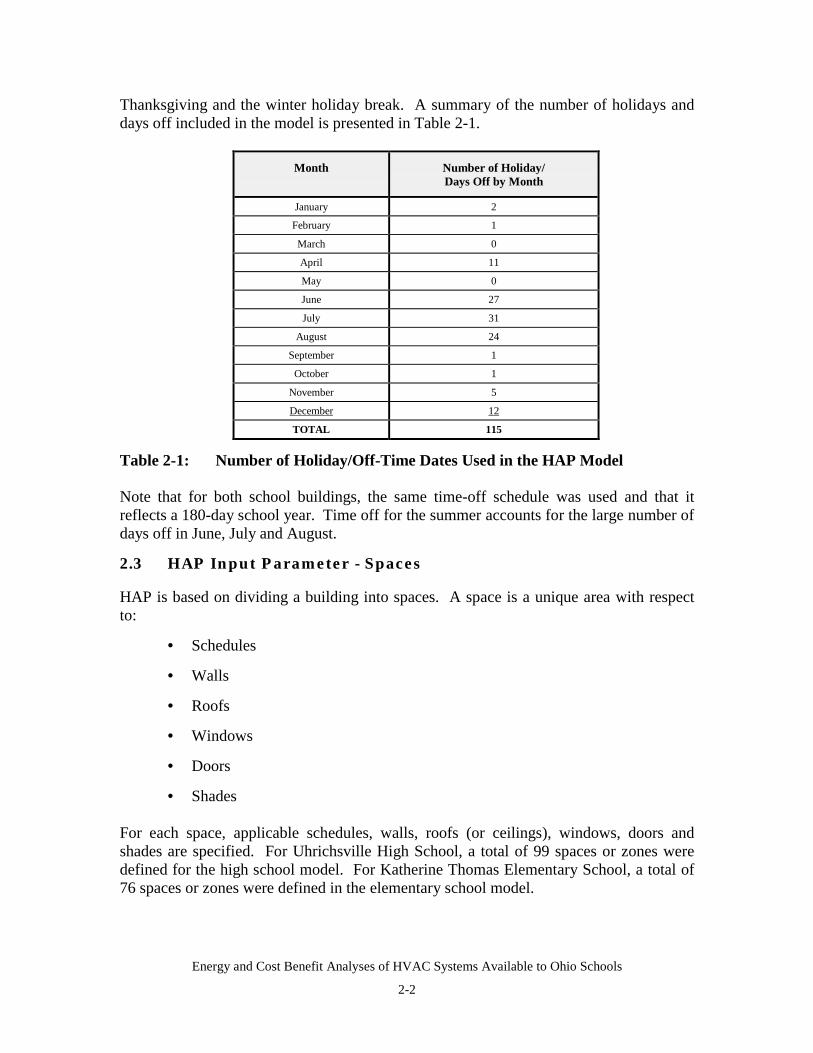
Energy and Cost Benefit Analyses of HVAC Systems Available to Ohio Schools
2-2
Thanksgiving and the winter holiday break. A summary of the number of holidays anddays off included in the model is presented in Table 2-1.
Month Number of Holiday/Days Off by Month
January 2
February 1
March 0
April 11
May 0
June 27
July 31
August 24
September 1
October 1
November 5
December 12
TOTAL 115
Table 2-1: Number of Holiday/Off-Time Dates Used in the HAP Model
Note that for both school buildings, the same time-off schedule was used and that itreflects a 180-day school year. Time off for the summer accounts for the large number ofdays off in June, July and August.
2.3 HAP Input Parameter - Spaces
HAP is based on dividing a building into spaces. A space is a unique area with respectto:
• Schedules
• Walls
• Roofs
• Windows
• Doors
• Shades
For each space, applicable schedules, walls, roofs (or ceilings), windows, doors andshades are specified. For Uhrichsville High School, a total of 99 spaces or zones weredefined for the high school model. For Katherine Thomas Elementary School, a total of76 spaces or zones were defined in the elementary school model.
Energy and Cost Benefit Analyses of HVAC Systems Available to Ohio Schools
2-3
Each of these spaces is assigned:
• A space identifier code
• Floor area
• Building weight
• Windows/Window shading
• Lighting details (lamp wattage, ballast multiplier, and task lighting)
• People loading (people schedule, sensible and latent loads based on level ofactivity)
• Schedules for lighting, task lights, equipment, people, sensible loads, latentloads, and other equipment loads
• Floor details (type, perimeter, area, R-value and insulation R value)
• Roof details (type, slope, gross area, skylight details)
• Infiltration details (cooling CFM, heating CFM, typical CFM and fan on oroff).
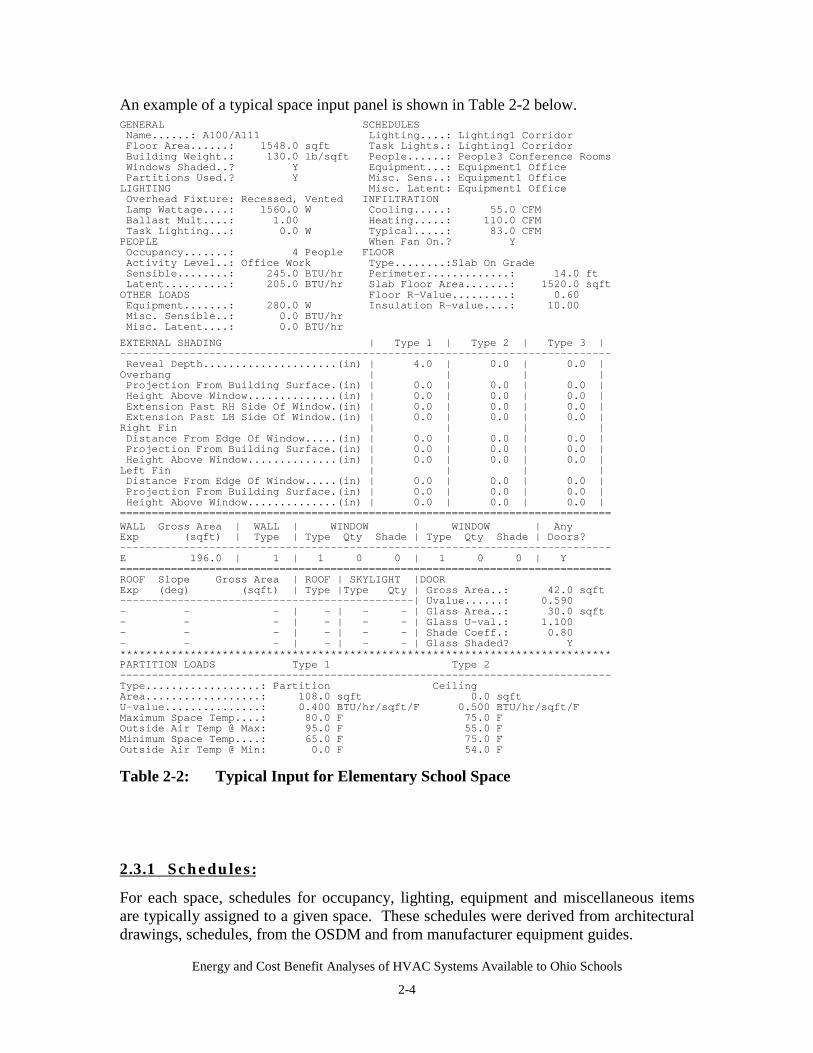
Energy and Cost Benefit Analyses of HVAC Systems Available to Ohio Schools
2-4
An example of a typical space input panel is shown in Table 2-2 below.GENERAL SCHEDULESName......: A100/A111 Lighting....: Lighting1 CorridorFloor Area......: 1548.0 sqft Task Lights.: Lighting1 CorridorBuilding Weight.: 130.0 lb/sqft People......: People3 Conference RoomsWindows Shaded..? Y Equipment...: Equipment1 OfficePartitions Used.? Y Misc. Sens..: Equipment1 OfficeLIGHTING Misc. Latent: Equipment1 OfficeOverhead Fixture: Recessed, Vented INFILTRATIONLamp Wattage....: 1560.0 W Cooling.....: 55.0 CFMBallast Mult....: 1.00 Heating.....: 110.0 CFMTask Lighting...: 0.0 W Typical.....: 83.0 CFMPEOPLE When Fan On.? YOccupancy.......: 4 People FLOORActivity Level..: Office Work Type........:Slab On GradeSensible........: 245.0 BTU/hr Perimeter.............: 14.0 ftLatent..........: 205.0 BTU/hr Slab Floor Area.......: 1520.0 sqftOTHER LOADS Floor R-Value.........: 0.60Equipment.......: 280.0 W Insulation R-value....: 10.00Misc. Sensible..: 0.0 BTU/hrMisc. Latent....: 0.0 BTU/hr
EXTERNAL SHADING | Type 1 | Type 2 | Type 3 |-----------------------------------------------------------------------------Reveal Depth.....................(in) | 4.0 | 0.0 | 0.0 |Overhang | | | |Projection From Building Surface.(in) | 0.0 | 0.0 | 0.0 |Height Above Window..............(in) | 0.0 | 0.0 | 0.0 |Extension Past RH Side Of Window.(in) | 0.0 | 0.0 | 0.0 |Extension Past LH Side Of Window.(in) | 0.0 | 0.0 | 0.0 |Right Fin | | | |Distance From Edge Of Window.....(in) | 0.0 | 0.0 | 0.0 |Projection From Building Surface.(in) | 0.0 | 0.0 | 0.0 |Height Above Window..............(in) | 0.0 | 0.0 | 0.0 |Left Fin | | | |Distance From Edge Of Window.....(in) | 0.0 | 0.0 | 0.0 |Projection From Building Surface.(in) | 0.0 | 0.0 | 0.0 |Height Above Window..............(in) | 0.0 | 0.0 | 0.0 |=============================================================================WALL Gross Area | WALL | WINDOW | WINDOW | AnyExp (sqft) | Type | Type Qty Shade | Type Qty Shade | Doors?-----------------------------------------------------------------------------E 196.0 | 1 | 1 0 0 | 1 0 0 | Y=============================================================================ROOF Slope Gross Area | ROOF | SKYLIGHT |DOORExp (deg) (sqft) | Type |Type Qty | Gross Area..: 42.0 sqft----------------------------------------------| Uvalue......: 0.590- - - | - | - - | Glass Area..: 30.0 sqft- - - | - | - - | Glass U-val.: 1.100- - - | - | - - | Shade Coeff.: 0.80- - - | - | - - | Glass Shaded? Y*****************************************************************************PARTITION LOADS Type 1 Type 2-----------------------------------------------------------------------------Type..................: Partition CeilingArea..................: 108.0 sqft 0.0 sqftU-value...............: 0.400 BTU/hr/sqft/F 0.500 BTU/hr/sqft/FMaximum Space Temp....: 80.0 F 75.0 FOutside Air Temp @ Max: 95.0 F 55.0 FMinimum Space Temp....: 65.0 F 75.0 FOutside Air Temp @ Min: 0.0 F 54.0 F
Table 2-2: Typical Input for Elementary School Space
2.3.1 Schedules:
For each space, schedules for occupancy, lighting, equipment and miscellaneous itemsare typically assigned to a given space. These schedules were derived from architecturaldrawings, schedules, from the OSDM and from manufacturer equipment guides.
Energy and Cost Benefit Analyses of HVAC Systems Available to Ohio Schools
2-5
For the high school, a total of 36 separate schedules were created for the 99 spaces orzones. These are listed below:
Occupancy Schedules (13):
• People1 Corridors• People2 Office• People3 Conference Rooms• People4 Classrooms• People5 Home Economics• People6 Teacher Wk Rooms• People7 Science• People8 Auditeria• People9 Shops• People10 Arts• People11 Band/Vocal Music• People12 Kitchen• People13 Gym
Lighting Schedules (14):
• Lighting1 Corridor• Lighting2 Office• Lighting3 Classroom• Lighting4 Conference• Lighting5 Science• Lighting6 Shops• Lighting7 Arts• Lighting8 Band• Lighting9 Kitchen• Lighting10 Gym• TLighting1 Office• TLighting2 Classroom• TLighting3 Shops• TLighting4 Kitchen
Equipment Schedules (7):
• Equipment1 Office• Equipment2 Classroom• Equipment3 Home Economy
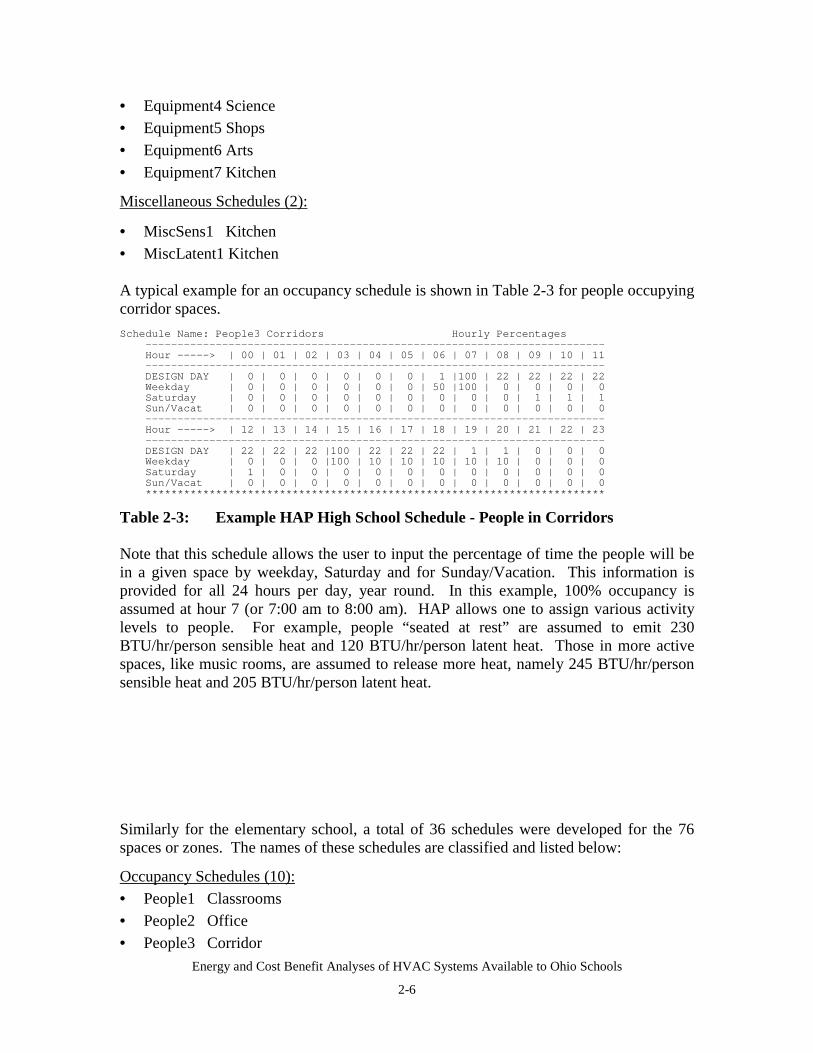
Energy and Cost Benefit Analyses of HVAC Systems Available to Ohio Schools
2-6
• Equipment4 Science• Equipment5 Shops• Equipment6 Arts• Equipment7 Kitchen
Miscellaneous Schedules (2):
• MiscSens1 Kitchen• MiscLatent1 Kitchen
A typical example for an occupancy schedule is shown in Table 2-3 for people occupyingcorridor spaces.Schedule Name: People3 Corridors Hourly Percentages
------------------------------------------------------------------------Hour -----> | 00 | 01 | 02 | 03 | 04 | 05 | 06 | 07 | 08 | 09 | 10 | 11------------------------------------------------------------------------DESIGN DAY | 0 | 0 | 0 | 0 | 0 | 0 | 1 |100 | 22 | 22 | 22 | 22Weekday | 0 | 0 | 0 | 0 | 0 | 0 | 50 |100 | 0 | 0 | 0 | 0Saturday | 0 | 0 | 0 | 0 | 0 | 0 | 0 | 0 | 0 | 1 | 1 | 1Sun/Vacat | 0 | 0 | 0 | 0 | 0 | 0 | 0 | 0 | 0 | 0 | 0 | 0------------------------------------------------------------------------Hour -----> | 12 | 13 | 14 | 15 | 16 | 17 | 18 | 19 | 20 | 21 | 22 | 23------------------------------------------------------------------------DESIGN DAY | 22 | 22 | 22 |100 | 22 | 22 | 22 | 1 | 1 | 0 | 0 | 0Weekday | 0 | 0 | 0 |100 | 10 | 10 | 10 | 10 | 10 | 0 | 0 | 0Saturday | 1 | 0 | 0 | 0 | 0 | 0 | 0 | 0 | 0 | 0 | 0 | 0Sun/Vacat | 0 | 0 | 0 | 0 | 0 | 0 | 0 | 0 | 0 | 0 | 0 | 0************************************************************************
Table 2-3: Example HAP High School Schedule - People in Corridors
Note that this schedule allows the user to input the percentage of time the people will bein a given space by weekday, Saturday and for Sunday/Vacation. This information isprovided for all 24 hours per day, year round. In this example, 100% occupancy isassumed at hour 7 (or 7:00 am to 8:00 am). HAP allows one to assign various activitylevels to people. For example, people “seated at rest” are assumed to emit 230BTU/hr/person sensible heat and 120 BTU/hr/person latent heat. Those in more activespaces, like music rooms, are assumed to release more heat, namely 245 BTU/hr/personsensible heat and 205 BTU/hr/person latent heat.
Similarly for the elementary school, a total of 36 schedules were developed for the 76spaces or zones. The names of these schedules are classified and listed below:
Occupancy Schedules (10):• People1 Classrooms• People2 Office• People3 Corridor
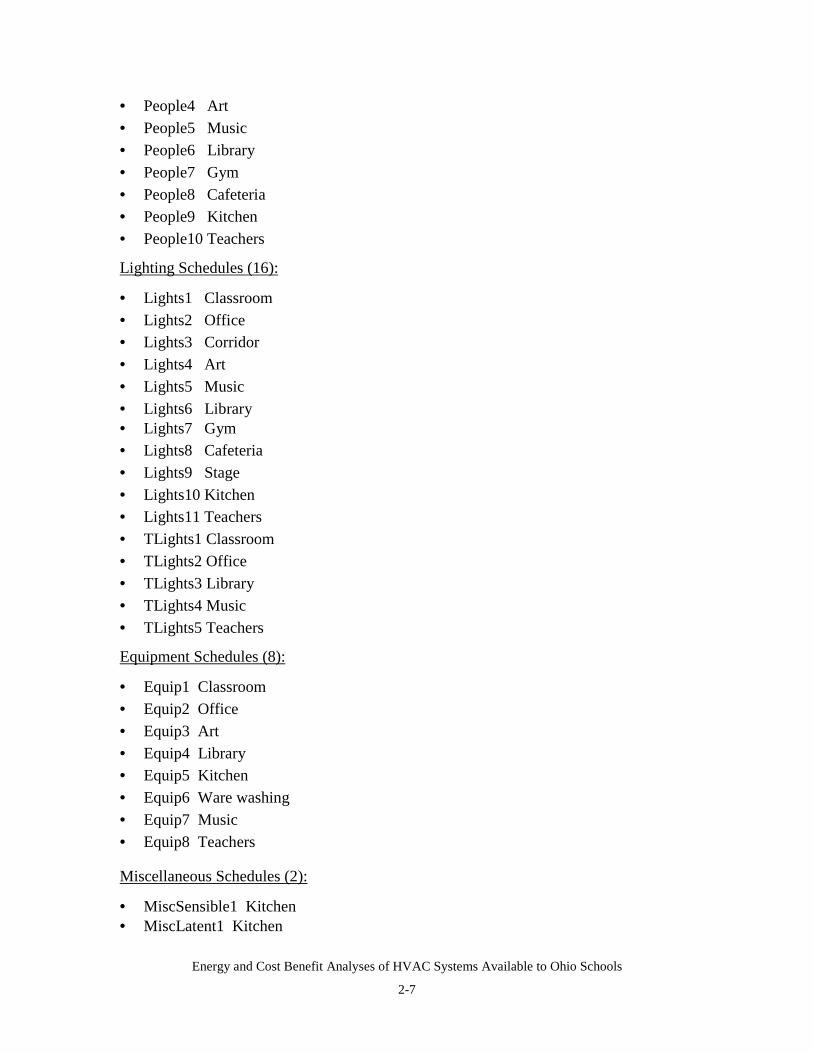
Energy and Cost Benefit Analyses of HVAC Systems Available to Ohio Schools
2-7
• People4 Art• People5 Music• People6 Library• People7 Gym• People8 Cafeteria• People9 Kitchen• People10 Teachers
Lighting Schedules (16):
• Lights1 Classroom• Lights2 Office• Lights3 Corridor• Lights4 Art• Lights5 Music• Lights6 Library• Lights7 Gym• Lights8 Cafeteria• Lights9 Stage• Lights10 Kitchen• Lights11 Teachers• TLights1 Classroom• TLights2 Office• TLights3 Library• TLights4 Music• TLights5 Teachers
Equipment Schedules (8):
• Equip1 Classroom• Equip2 Office• Equip3 Art• Equip4 Library• Equip5 Kitchen• Equip6 Ware washing• Equip7 Music• Equip8 Teachers
Miscellaneous Schedules (2):
• MiscSensible1 Kitchen• MiscLatent1 Kitchen
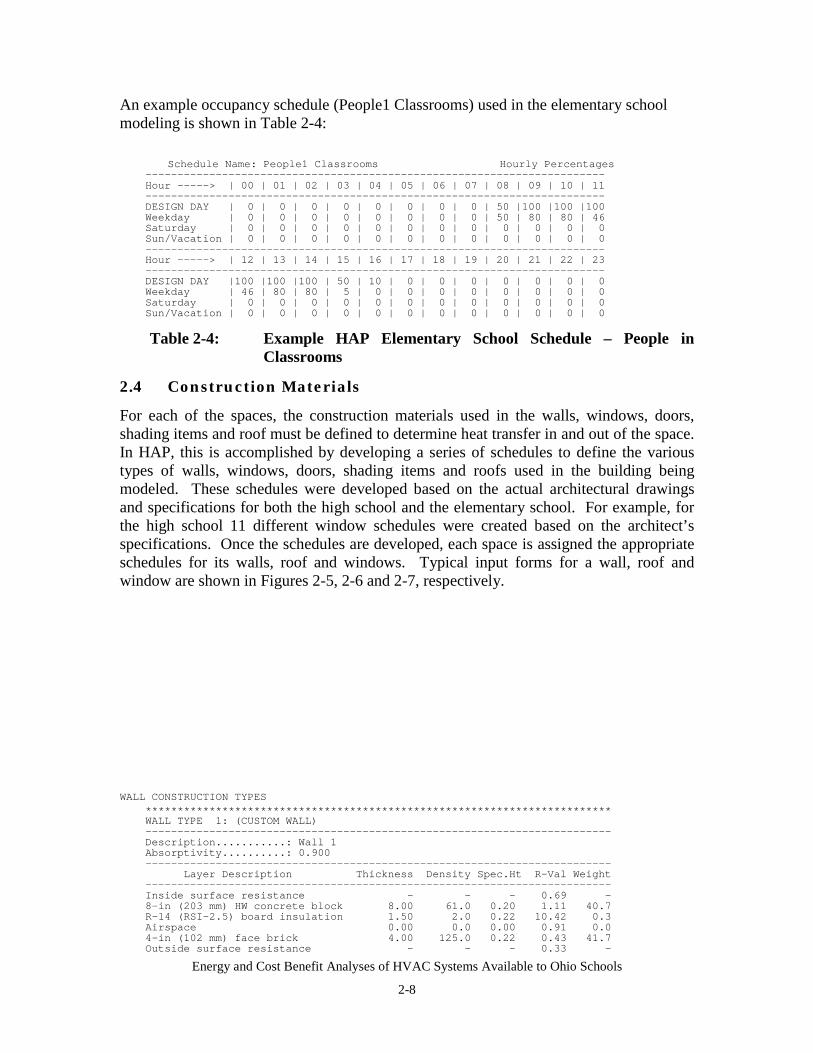
Energy and Cost Benefit Analyses of HVAC Systems Available to Ohio Schools
2-8
An example occupancy schedule (People1 Classrooms) used in the elementary schoolmodeling is shown in Table 2-4:
Schedule Name: People1 Classrooms Hourly Percentages------------------------------------------------------------------------Hour -----> | 00 | 01 | 02 | 03 | 04 | 05 | 06 | 07 | 08 | 09 | 10 | 11------------------------------------------------------------------------DESIGN DAY | 0 | 0 | 0 | 0 | 0 | 0 | 0 | 0 | 50 |100 |100 |100Weekday | 0 | 0 | 0 | 0 | 0 | 0 | 0 | 0 | 50 | 80 | 80 | 46Saturday | 0 | 0 | 0 | 0 | 0 | 0 | 0 | 0 | 0 | 0 | 0 | 0Sun/Vacation | 0 | 0 | 0 | 0 | 0 | 0 | 0 | 0 | 0 | 0 | 0 | 0------------------------------------------------------------------------Hour -----> | 12 | 13 | 14 | 15 | 16 | 17 | 18 | 19 | 20 | 21 | 22 | 23------------------------------------------------------------------------DESIGN DAY |100 |100 |100 | 50 | 10 | 0 | 0 | 0 | 0 | 0 | 0 | 0Weekday | 46 | 80 | 80 | 5 | 0 | 0 | 0 | 0 | 0 | 0 | 0 | 0Saturday | 0 | 0 | 0 | 0 | 0 | 0 | 0 | 0 | 0 | 0 | 0 | 0Sun/Vacation | 0 | 0 | 0 | 0 | 0 | 0 | 0 | 0 | 0 | 0 | 0 | 0
Table 2-4: Example HAP Elementary School Schedule – People inClassrooms
2.4 Construction Materials
For each of the spaces, the construction materials used in the walls, windows, doors,shading items and roof must be defined to determine heat transfer in and out of the space.In HAP, this is accomplished by developing a series of schedules to define the varioustypes of walls, windows, doors, shading items and roofs used in the building beingmodeled. These schedules were developed based on the actual architectural drawingsand specifications for both the high school and the elementary school. For example, forthe high school 11 different window schedules were created based on the architect’sspecifications. Once the schedules are developed, each space is assigned the appropriateschedules for its walls, roof and windows. Typical input forms for a wall, roof andwindow are shown in Figures 2-5, 2-6 and 2-7, respectively.
WALL CONSTRUCTION TYPES*************************************************************************WALL TYPE 1: (CUSTOM WALL)-------------------------------------------------------------------------Description...........: Wall 1Absorptivity..........: 0.900-------------------------------------------------------------------------
Layer Description Thickness Density Spec.Ht R-Val Weight-------------------------------------------------------------------------Inside surface resistance - - - 0.69 -8-in (203 mm) HW concrete block 8.00 61.0 0.20 1.11 40.7R-14 (RSI-2.5) board insulation 1.50 2.0 0.22 10.42 0.3Airspace 0.00 0.0 0.00 0.91 0.04-in (102 mm) face brick 4.00 125.0 0.22 0.43 41.7Outside surface resistance - - - 0.33 -
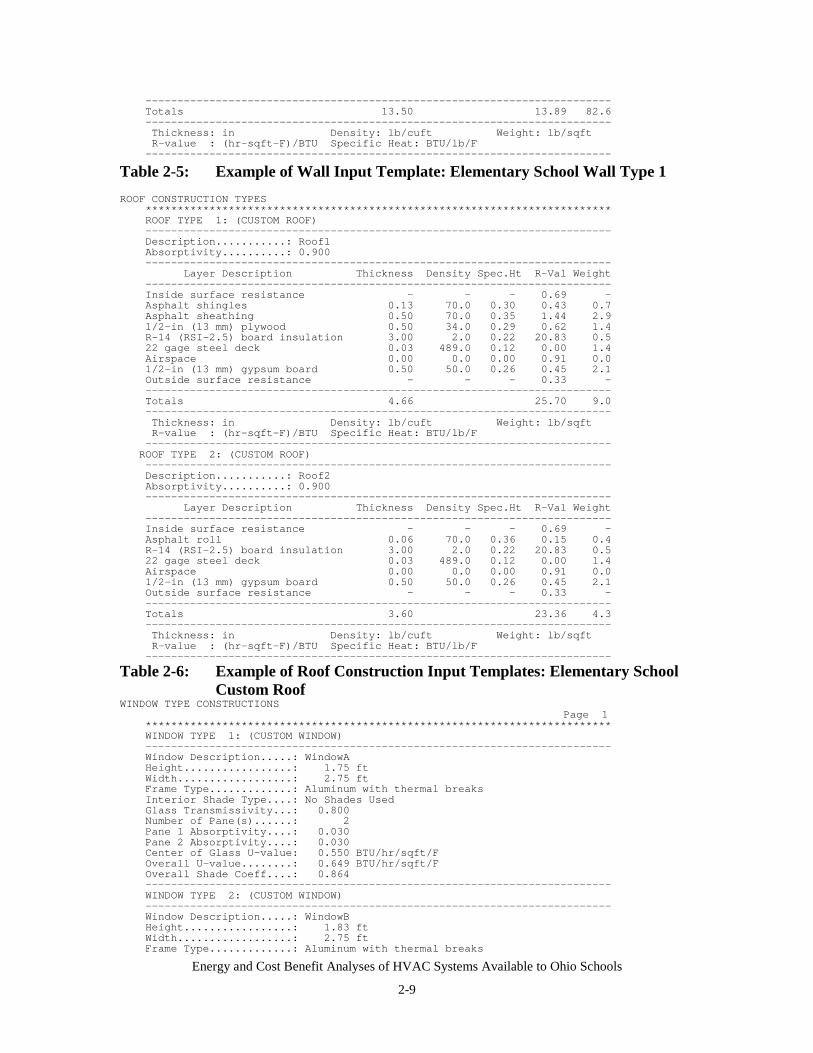
Energy and Cost Benefit Analyses of HVAC Systems Available to Ohio Schools
2-9
-------------------------------------------------------------------------Totals 13.50 13.89 82.6-------------------------------------------------------------------------Thickness: in Density: lb/cuft Weight: lb/sqftR-value : (hr-sqft-F)/BTU Specific Heat: BTU/lb/F-------------------------------------------------------------------------
Table 2-5: Example of Wall Input Template: Elementary School Wall Type 1ROOF CONSTRUCTION TYPES
*************************************************************************ROOF TYPE 1: (CUSTOM ROOF)-------------------------------------------------------------------------Description...........: Roof1Absorptivity..........: 0.900-------------------------------------------------------------------------
Layer Description Thickness Density Spec.Ht R-Val Weight-------------------------------------------------------------------------Inside surface resistance - - - 0.69 -Asphalt shingles 0.13 70.0 0.30 0.43 0.7Asphalt sheathing 0.50 70.0 0.35 1.44 2.91/2-in (13 mm) plywood 0.50 34.0 0.29 0.62 1.4R-14 (RSI-2.5) board insulation 3.00 2.0 0.22 20.83 0.522 gage steel deck 0.03 489.0 0.12 0.00 1.4Airspace 0.00 0.0 0.00 0.91 0.01/2-in (13 mm) gypsum board 0.50 50.0 0.26 0.45 2.1Outside surface resistance - - - 0.33 --------------------------------------------------------------------------Totals 4.66 25.70 9.0-------------------------------------------------------------------------Thickness: in Density: lb/cuft Weight: lb/sqftR-value : (hr-sqft-F)/BTU Specific Heat: BTU/lb/F-------------------------------------------------------------------------ROOF TYPE 2: (CUSTOM ROOF)-------------------------------------------------------------------------Description...........: Roof2Absorptivity..........: 0.900-------------------------------------------------------------------------
Layer Description Thickness Density Spec.Ht R-Val Weight-------------------------------------------------------------------------Inside surface resistance - - - 0.69 -Asphalt roll 0.06 70.0 0.36 0.15 0.4R-14 (RSI-2.5) board insulation 3.00 2.0 0.22 20.83 0.522 gage steel deck 0.03 489.0 0.12 0.00 1.4Airspace 0.00 0.0 0.00 0.91 0.01/2-in (13 mm) gypsum board 0.50 50.0 0.26 0.45 2.1Outside surface resistance - - - 0.33 --------------------------------------------------------------------------Totals 3.60 23.36 4.3-------------------------------------------------------------------------Thickness: in Density: lb/cuft Weight: lb/sqftR-value : (hr-sqft-F)/BTU Specific Heat: BTU/lb/F-------------------------------------------------------------------------
Table 2-6: Example of Roof Construction Input Templates: Elementary SchoolCustom Roof
WINDOW TYPE CONSTRUCTIONSPage 1
*************************************************************************WINDOW TYPE 1: (CUSTOM WINDOW)-------------------------------------------------------------------------Window Description.....: WindowAHeight.................: 1.75 ftWidth..................: 2.75 ftFrame Type.............: Aluminum with thermal breaksInterior Shade Type....: No Shades UsedGlass Transmissivity...: 0.800Number of Pane(s)......: 2Pane 1 Absorptivity....: 0.030Pane 2 Absorptivity....: 0.030Center of Glass U-value: 0.550 BTU/hr/sqft/FOverall U-value........: 0.649 BTU/hr/sqft/FOverall Shade Coeff....: 0.864-------------------------------------------------------------------------WINDOW TYPE 2: (CUSTOM WINDOW)-------------------------------------------------------------------------Window Description.....: WindowBHeight.................: 1.83 ftWidth..................: 2.75 ftFrame Type.............: Aluminum with thermal breaks
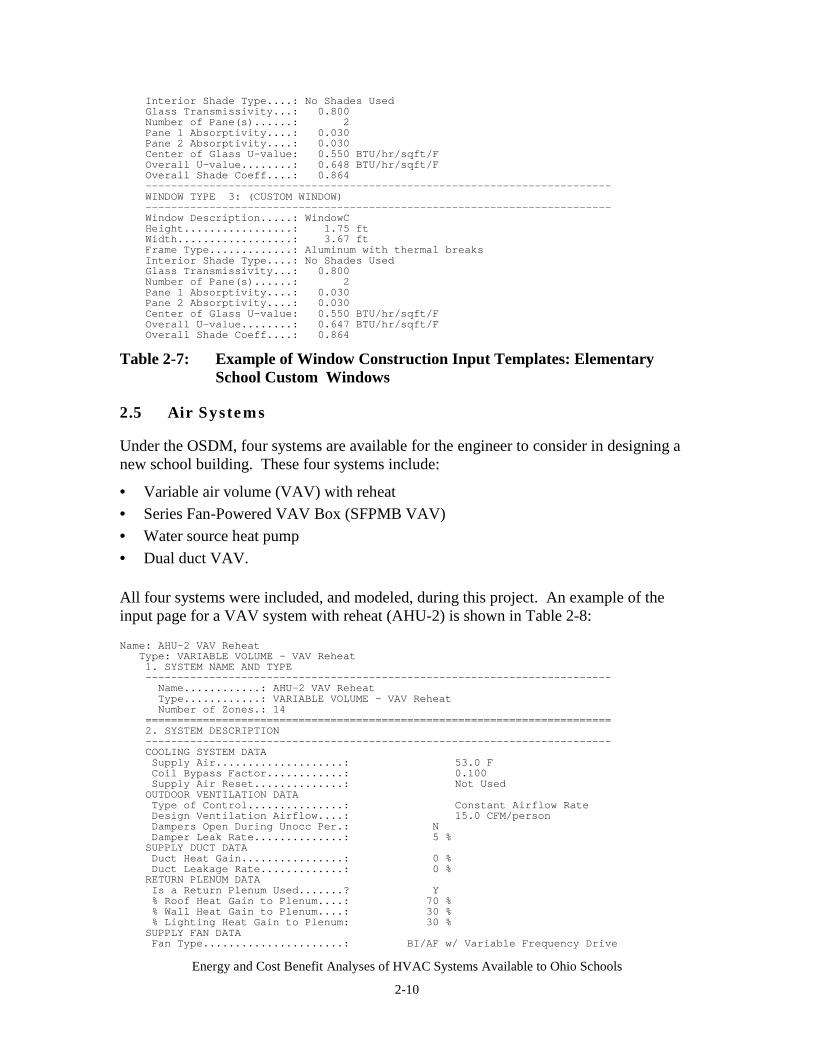
Energy and Cost Benefit Analyses of HVAC Systems Available to Ohio Schools
2-10
Interior Shade Type....: No Shades UsedGlass Transmissivity...: 0.800Number of Pane(s)......: 2Pane 1 Absorptivity....: 0.030Pane 2 Absorptivity....: 0.030Center of Glass U-value: 0.550 BTU/hr/sqft/FOverall U-value........: 0.648 BTU/hr/sqft/FOverall Shade Coeff....: 0.864-------------------------------------------------------------------------WINDOW TYPE 3: (CUSTOM WINDOW)-------------------------------------------------------------------------Window Description.....: WindowCHeight.................: 1.75 ftWidth..................: 3.67 ftFrame Type.............: Aluminum with thermal breaksInterior Shade Type....: No Shades UsedGlass Transmissivity...: 0.800Number of Pane(s)......: 2Pane 1 Absorptivity....: 0.030Pane 2 Absorptivity....: 0.030Center of Glass U-value: 0.550 BTU/hr/sqft/FOverall U-value........: 0.647 BTU/hr/sqft/FOverall Shade Coeff....: 0.864
Table 2-7: Example of Window Construction Input Templates: ElementarySchool Custom Windows
2.5 Air Systems
Under the OSDM, four systems are available for the engineer to consider in designing anew school building. These four systems include:
• Variable air volume (VAV) with reheat• Series Fan-Powered VAV Box (SFPMB VAV)• Water source heat pump• Dual duct VAV.
All four systems were included, and modeled, during this project. An example of theinput page for a VAV system with reheat (AHU-2) is shown in Table 2-8:
Name: AHU-2 VAV ReheatType: VARIABLE VOLUME - VAV Reheat1. SYSTEM NAME AND TYPE-------------------------------------------------------------------------Name............: AHU-2 VAV ReheatType............: VARIABLE VOLUME - VAV ReheatNumber of Zones.: 14
=========================================================================2. SYSTEM DESCRIPTION-------------------------------------------------------------------------COOLING SYSTEM DATASupply Air....................: 53.0 FCoil Bypass Factor............: 0.100Supply Air Reset..............: Not UsedOUTDOOR VENTILATION DATAType of Control...............: Constant Airflow RateDesign Ventilation Airflow....: 15.0 CFM/personDampers Open During Unocc Per.: NDamper Leak Rate..............: 5 %SUPPLY DUCT DATADuct Heat Gain................: 0 %Duct Leakage Rate.............: 0 %RETURN PLENUM DATAIs a Return Plenum Used.......? Y% Roof Heat Gain to Plenum....: 70 %% Wall Heat Gain to Plenum....: 30 %% Lighting Heat Gain to Plenum: 30 %SUPPLY FAN DATAFan Type......................: BI/AF w/ Variable Frequency Drive
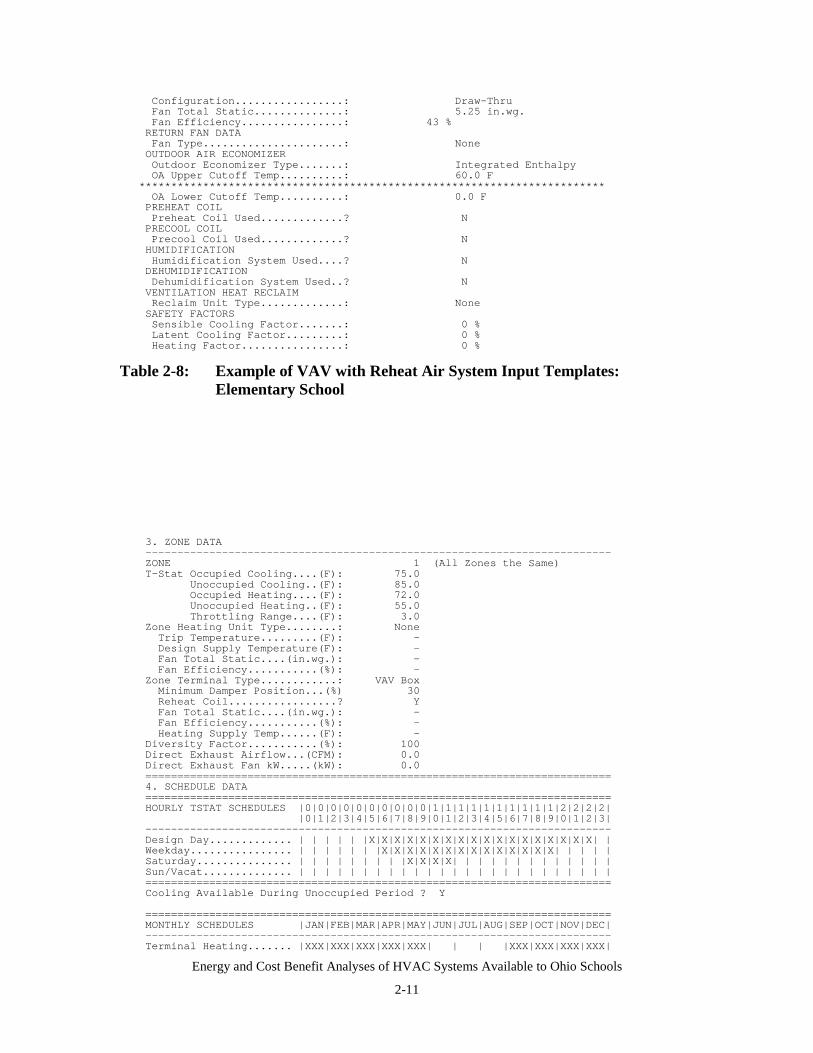
Energy and Cost Benefit Analyses of HVAC Systems Available to Ohio Schools
2-11
Configuration.................: Draw-ThruFan Total Static..............: 5.25 in.wg.Fan Efficiency................: 43 %RETURN FAN DATAFan Type......................: NoneOUTDOOR AIR ECONOMIZEROutdoor Economizer Type.......: Integrated EnthalpyOA Upper Cutoff Temp..........: 60.0 F
*************************************************************************OA Lower Cutoff Temp..........: 0.0 FPREHEAT COILPreheat Coil Used.............? NPRECOOL COILPrecool Coil Used.............? NHUMIDIFICATIONHumidification System Used....? NDEHUMIDIFICATIONDehumidification System Used..? NVENTILATION HEAT RECLAIMReclaim Unit Type.............: NoneSAFETY FACTORSSensible Cooling Factor.......: 0 %Latent Cooling Factor.........: 0 %Heating Factor................: 0 %
Table 2-8: Example of VAV with Reheat Air System Input Templates:Elementary School
3. ZONE DATA-------------------------------------------------------------------------ZONE 1 (All Zones the Same)T-Stat Occupied Cooling....(F): 75.0
Unoccupied Cooling..(F): 85.0Occupied Heating....(F): 72.0Unoccupied Heating..(F): 55.0Throttling Range....(F): 3.0
Zone Heating Unit Type........: NoneTrip Temperature.........(F): -Design Supply Temperature(F): -Fan Total Static....(in.wg.): -Fan Efficiency...........(%): -
Zone Terminal Type............: VAV BoxMinimum Damper Position...(%) 30Reheat Coil.................? YFan Total Static....(in.wg.): -Fan Efficiency...........(%): -Heating Supply Temp......(F): -
Diversity Factor...........(%): 100Direct Exhaust Airflow...(CFM): 0.0Direct Exhaust Fan kW.....(kW): 0.0=========================================================================4. SCHEDULE DATA=========================================================================HOURLY TSTAT SCHEDULES |0|0|0|0|0|0|0|0|0|0|1|1|1|1|1|1|1|1|1|1|2|2|2|2|
|0|1|2|3|4|5|6|7|8|9|0|1|2|3|4|5|6|7|8|9|0|1|2|3|-------------------------------------------------------------------------Design Day............. | | | | | |X|X|X|X|X|X|X|X|X|X|X|X|X|X|X|X|X|X| |Weekday................ | | | | | | |X|X|X|X|X|X|X|X|X|X|X|X|X|X| | | | |Saturday............... | | | | | | | | |X|X|X|X| | | | | | | | | | | | |Sun/Vacat.............. | | | | | | | | | | | | | | | | | | | | | | | | |=========================================================================Cooling Available During Unoccupied Period ? Y
=========================================================================MONTHLY SCHEDULES |JAN|FEB|MAR|APR|MAY|JUN|JUL|AUG|SEP|OCT|NOV|DEC|-------------------------------------------------------------------------Terminal Heating....... |XXX|XXX|XXX|XXX|XXX| | | |XXX|XXX|XXX|XXX|
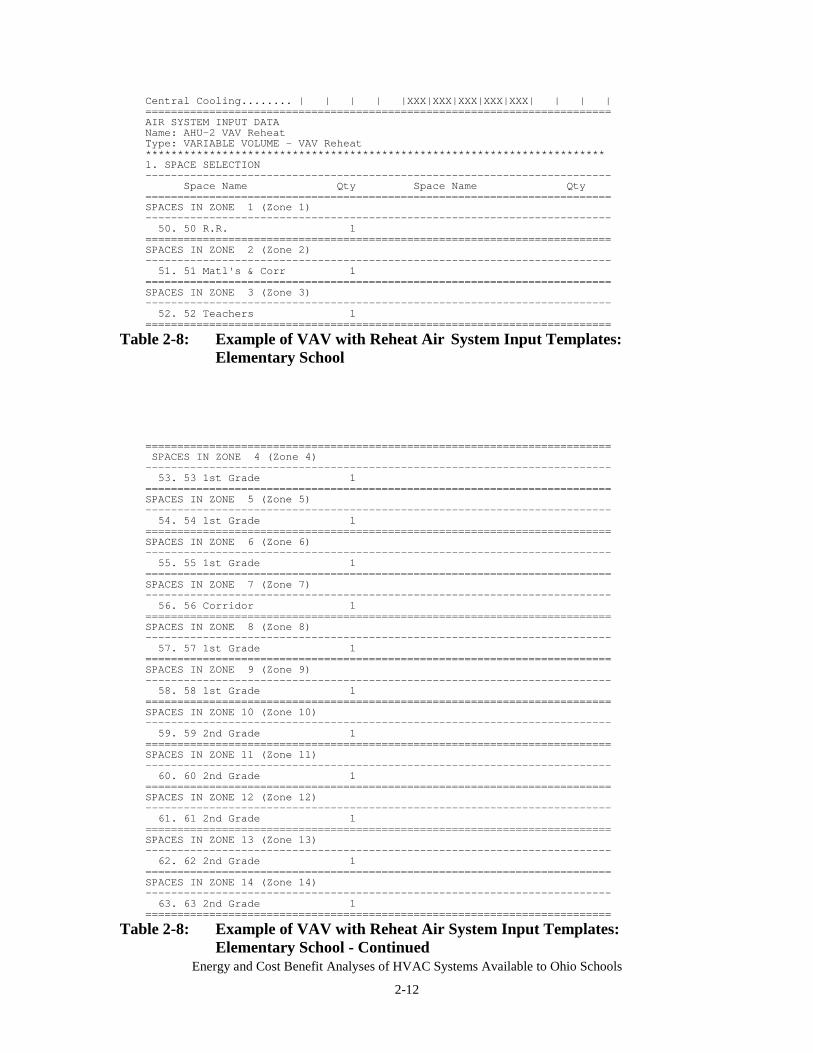
Energy and Cost Benefit Analyses of HVAC Systems Available to Ohio Schools
2-12
Central Cooling........ | | | | |XXX|XXX|XXX|XXX|XXX| | | |=========================================================================AIR SYSTEM INPUT DATAName: AHU-2 VAV ReheatType: VARIABLE VOLUME - VAV Reheat************************************************************************1. SPACE SELECTION-------------------------------------------------------------------------
Space Name Qty Space Name Qty=========================================================================SPACES IN ZONE 1 (Zone 1)-------------------------------------------------------------------------50. 50 R.R. 1
=========================================================================SPACES IN ZONE 2 (Zone 2)-------------------------------------------------------------------------51. 51 Matl's & Corr 1
=========================================================================SPACES IN ZONE 3 (Zone 3)-------------------------------------------------------------------------52. 52 Teachers 1
=========================================================================
Table 2-8: Example of VAV with Reheat Air System Input Templates:Elementary School
=========================================================================SPACES IN ZONE 4 (Zone 4)-------------------------------------------------------------------------53. 53 1st Grade 1
=========================================================================SPACES IN ZONE 5 (Zone 5)-------------------------------------------------------------------------54. 54 1st Grade 1
=========================================================================SPACES IN ZONE 6 (Zone 6)-------------------------------------------------------------------------55. 55 1st Grade 1
=========================================================================SPACES IN ZONE 7 (Zone 7)-------------------------------------------------------------------------56. 56 Corridor 1
=========================================================================SPACES IN ZONE 8 (Zone 8)-------------------------------------------------------------------------57. 57 1st Grade 1
=========================================================================SPACES IN ZONE 9 (Zone 9)-------------------------------------------------------------------------58. 58 1st Grade 1
=========================================================================SPACES IN ZONE 10 (Zone 10)-------------------------------------------------------------------------59. 59 2nd Grade 1
=========================================================================SPACES IN ZONE 11 (Zone 11)-------------------------------------------------------------------------60. 60 2nd Grade 1
=========================================================================SPACES IN ZONE 12 (Zone 12)-------------------------------------------------------------------------61. 61 2nd Grade 1
=========================================================================SPACES IN ZONE 13 (Zone 13)-------------------------------------------------------------------------62. 62 2nd Grade 1
=========================================================================SPACES IN ZONE 14 (Zone 14)-------------------------------------------------------------------------63. 63 2nd Grade 1
=========================================================================
Table 2-8: Example of VAV with Reheat Air System Input Templates:Elementary School - Continued
Energy and Cost Benefit Analyses of HVAC Systems Available to Ohio Schools
2-13
Input values for each of these items in each of the air system input tables was obtaineddirectly from the architect’s drawings/specifications and/or from manufacturers’ catalogs.
2.6 Plant Equipment
Plant equipment in this analysis is defined as the heating and cooling systems selectedand used to maintain the school at necessary comfort conditions. As with the air systems,the OSDM specifies the types of heating and cooling systems an engineer is to considerin the design of a new school building.
For heating systems, one can consider the use of:
• Atmospheric gas hot-water boilers• Power burner gas hot-water boilers• Oil-fired hot-water boilers• Electric boiler
For cooling systems, one can consider the use of:
• Air-cooled packaged screw chillers• Water-cooled screw chillers• Water-cooled centrifugal chillers
Consideration of all these equipment design options (air systems – 3; heating systems – 4and chiller systems –3) results in 36 combinations of design options. Added to this is theuse of a water-source heat pump with the four heating options. Thus, a total forty (36 +4) plant options were available, and were modeled using this work. These options aredelineated in Table 2-9 below:
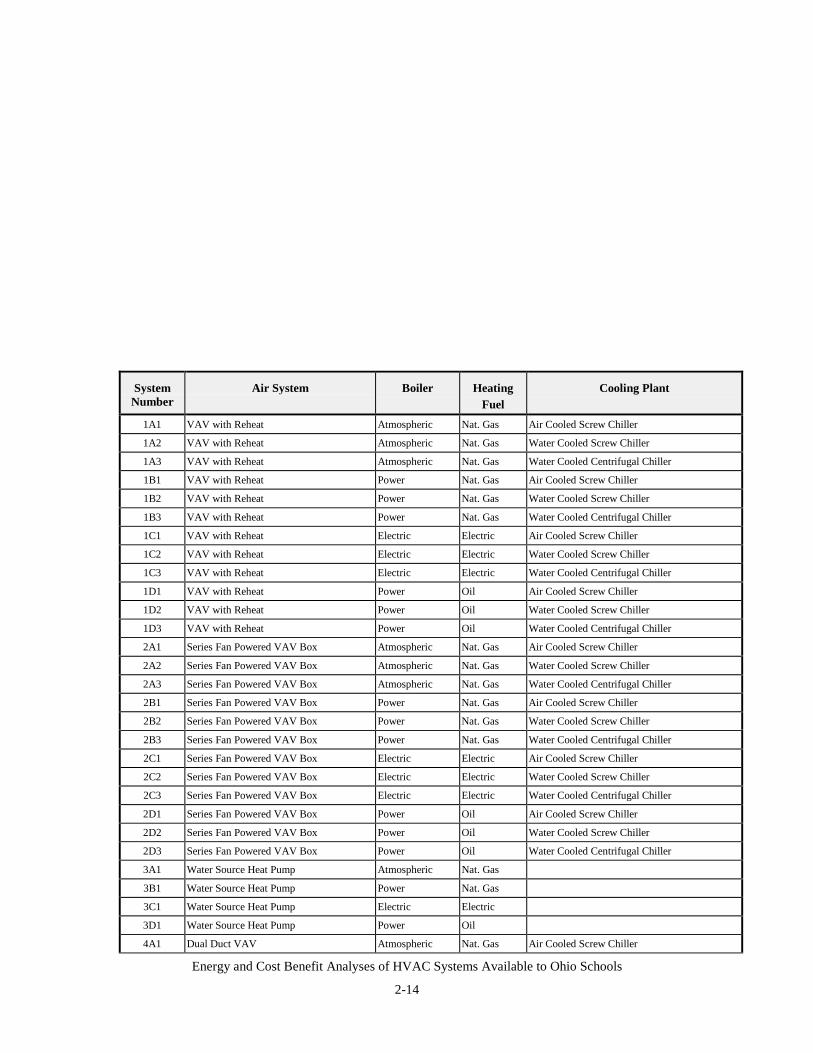
Energy and Cost Benefit Analyses of HVAC Systems Available to Ohio Schools
2-14
SystemNumber
Air System Boiler HeatingFuel
Cooling Plant
1A1 VAV with Reheat Atmospheric Nat. Gas Air Cooled Screw Chiller
1A2 VAV with Reheat Atmospheric Nat. Gas Water Cooled Screw Chiller
1A3 VAV with Reheat Atmospheric Nat. Gas Water Cooled Centrifugal Chiller
1B1 VAV with Reheat Power Nat. Gas Air Cooled Screw Chiller
1B2 VAV with Reheat Power Nat. Gas Water Cooled Screw Chiller
1B3 VAV with Reheat Power Nat. Gas Water Cooled Centrifugal Chiller
1C1 VAV with Reheat Electric Electric Air Cooled Screw Chiller
1C2 VAV with Reheat Electric Electric Water Cooled Screw Chiller
1C3 VAV with Reheat Electric Electric Water Cooled Centrifugal Chiller
1D1 VAV with Reheat Power Oil Air Cooled Screw Chiller
1D2 VAV with Reheat Power Oil Water Cooled Screw Chiller
1D3 VAV with Reheat Power Oil Water Cooled Centrifugal Chiller
2A1 Series Fan Powered VAV Box Atmospheric Nat. Gas Air Cooled Screw Chiller
2A2 Series Fan Powered VAV Box Atmospheric Nat. Gas Water Cooled Screw Chiller
2A3 Series Fan Powered VAV Box Atmospheric Nat. Gas Water Cooled Centrifugal Chiller
2B1 Series Fan Powered VAV Box Power Nat. Gas Air Cooled Screw Chiller
2B2 Series Fan Powered VAV Box Power Nat. Gas Water Cooled Screw Chiller
2B3 Series Fan Powered VAV Box Power Nat. Gas Water Cooled Centrifugal Chiller
2C1 Series Fan Powered VAV Box Electric Electric Air Cooled Screw Chiller
2C2 Series Fan Powered VAV Box Electric Electric Water Cooled Screw Chiller
2C3 Series Fan Powered VAV Box Electric Electric Water Cooled Centrifugal Chiller
2D1 Series Fan Powered VAV Box Power Oil Air Cooled Screw Chiller
2D2 Series Fan Powered VAV Box Power Oil Water Cooled Screw Chiller
2D3 Series Fan Powered VAV Box Power Oil Water Cooled Centrifugal Chiller
3A1 Water Source Heat Pump Atmospheric Nat. Gas
3B1 Water Source Heat Pump Power Nat. Gas
3C1 Water Source Heat Pump Electric Electric
3D1 Water Source Heat Pump Power Oil
4A1 Dual Duct VAV Atmospheric Nat. Gas Air Cooled Screw Chiller
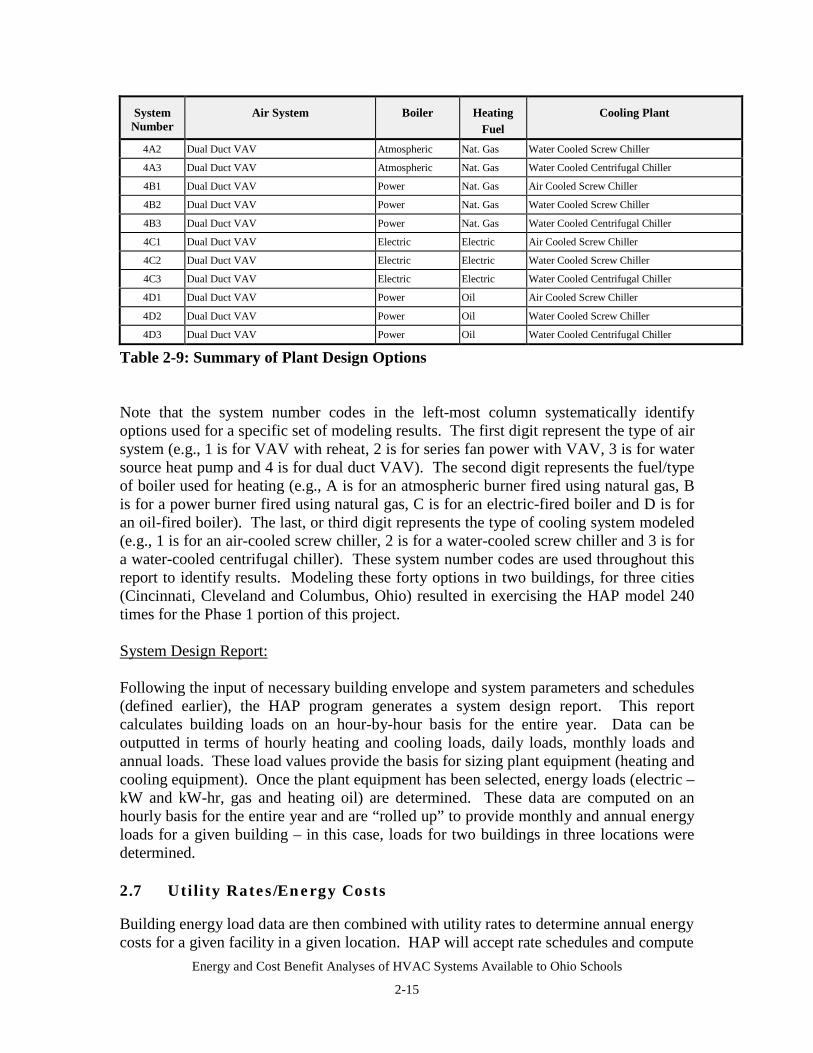
Energy and Cost Benefit Analyses of HVAC Systems Available to Ohio Schools
2-15
SystemNumber
Air System Boiler HeatingFuel
Cooling Plant
4A2 Dual Duct VAV Atmospheric Nat. Gas Water Cooled Screw Chiller
4A3 Dual Duct VAV Atmospheric Nat. Gas Water Cooled Centrifugal Chiller
4B1 Dual Duct VAV Power Nat. Gas Air Cooled Screw Chiller
4B2 Dual Duct VAV Power Nat. Gas Water Cooled Screw Chiller
4B3 Dual Duct VAV Power Nat. Gas Water Cooled Centrifugal Chiller
4C1 Dual Duct VAV Electric Electric Air Cooled Screw Chiller
4C2 Dual Duct VAV Electric Electric Water Cooled Screw Chiller
4C3 Dual Duct VAV Electric Electric Water Cooled Centrifugal Chiller
4D1 Dual Duct VAV Power Oil Air Cooled Screw Chiller
4D2 Dual Duct VAV Power Oil Water Cooled Screw Chiller
4D3 Dual Duct VAV Power Oil Water Cooled Centrifugal Chiller
Table 2-9: Summary of Plant Design Options
Note that the system number codes in the left-most column systematically identifyoptions used for a specific set of modeling results. The first digit represent the type of airsystem (e.g., 1 is for VAV with reheat, 2 is for series fan power with VAV, 3 is for watersource heat pump and 4 is for dual duct VAV). The second digit represents the fuel/typeof boiler used for heating (e.g., A is for an atmospheric burner fired using natural gas, Bis for a power burner fired using natural gas, C is for an electric-fired boiler and D is foran oil-fired boiler). The last, or third digit represents the type of cooling system modeled(e.g., 1 is for an air-cooled screw chiller, 2 is for a water-cooled screw chiller and 3 is fora water-cooled centrifugal chiller). These system number codes are used throughout thisreport to identify results. Modeling these forty options in two buildings, for three cities(Cincinnati, Cleveland and Columbus, Ohio) resulted in exercising the HAP model 240times for the Phase 1 portion of this project.
System Design Report:
Following the input of necessary building envelope and system parameters and schedules(defined earlier), the HAP program generates a system design report. This reportcalculates building loads on an hour-by-hour basis for the entire year. Data can beoutputted in terms of hourly heating and cooling loads, daily loads, monthly loads andannual loads. These load values provide the basis for sizing plant equipment (heating andcooling equipment). Once the plant equipment has been selected, energy loads (electric –kW and kW-hr, gas and heating oil) are determined. These data are computed on anhourly basis for the entire year and are “rolled up” to provide monthly and annual energyloads for a given building – in this case, loads for two buildings in three locations weredetermined.
2.7 Utility Rates/Energy Costs
Building energy load data are then combined with utility rates to determine annual energycosts for a given facility in a given location. HAP will accept rate schedules and compute
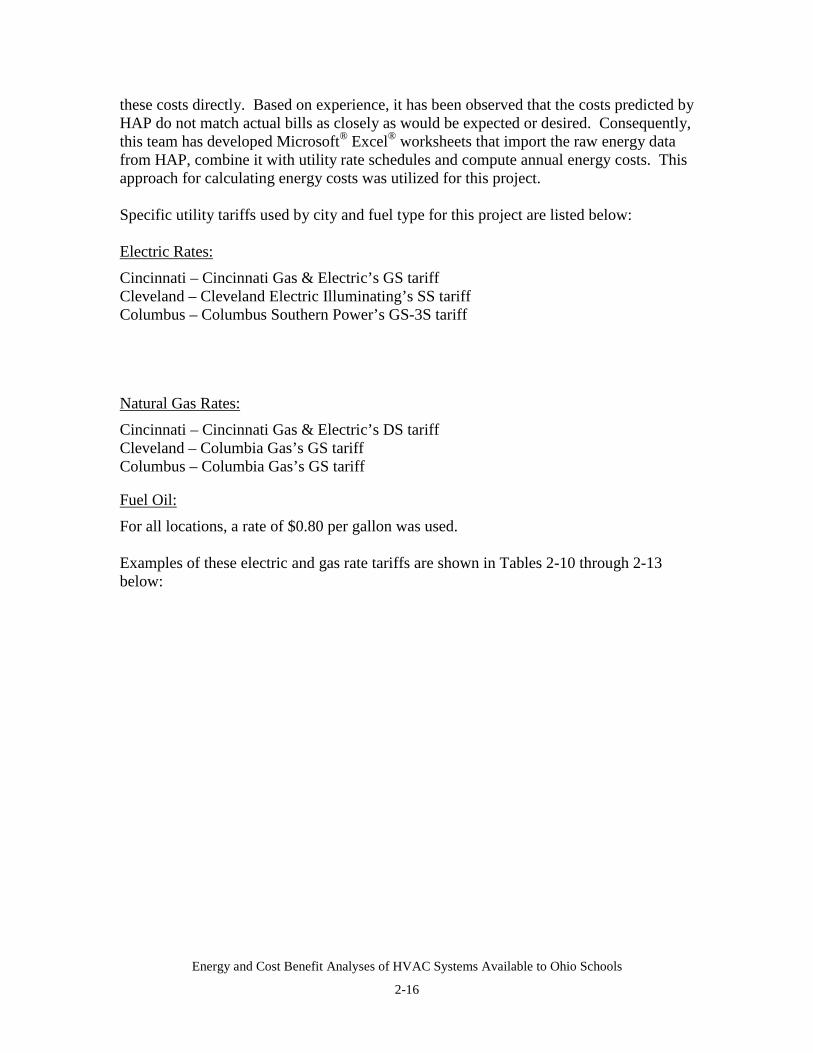
Energy and Cost Benefit Analyses of HVAC Systems Available to Ohio Schools
2-16
these costs directly. Based on experience, it has been observed that the costs predicted byHAP do not match actual bills as closely as would be expected or desired. Consequently,this team has developed Microsoft® Excel® worksheets that import the raw energy datafrom HAP, combine it with utility rate schedules and compute annual energy costs. Thisapproach for calculating energy costs was utilized for this project.
Specific utility tariffs used by city and fuel type for this project are listed below:
Electric Rates:
Cincinnati – Cincinnati Gas & Electric’s GS tariffCleveland – Cleveland Electric Illuminating’s SS tariffColumbus – Columbus Southern Power’s GS-3S tariff
Natural Gas Rates:
Cincinnati – Cincinnati Gas & Electric’s DS tariffCleveland – Columbia Gas’s GS tariffColumbus – Columbia Gas’s GS tariff
Fuel Oil:
For all locations, a rate of $0.80 per gallon was used.
Examples of these electric and gas rate tariffs are shown in Tables 2-10 through 2-13below:
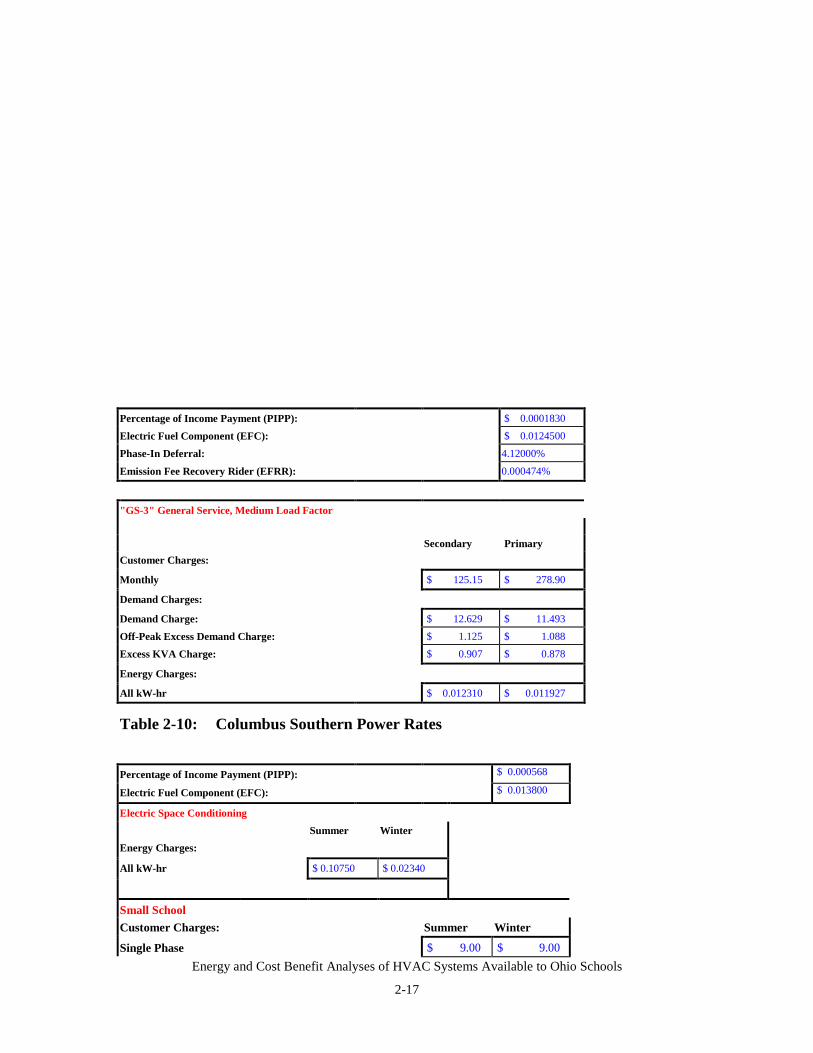
Energy and Cost Benefit Analyses of HVAC Systems Available to Ohio Schools
2-17
Percentage of Income Payment (PIPP): $ 0.0001830
Electric Fuel Component (EFC): $ 0.0124500
Phase-In Deferral: 4.12000%
Emission Fee Recovery Rider (EFRR): 0.000474%
"GS-3" General Service, Medium Load Factor
Secondary PrimaryCustomer Charges:
Monthly $ 125.15 $ 278.90
Demand Charges:
Demand Charge: $ 12.629 $ 11.493
Off-Peak Excess Demand Charge: $ 1.125 $ 1.088
Excess KVA Charge: $ 0.907 $ 0.878
Energy Charges:
All kW-hr $ 0.012310 $ 0.011927
Table 2-10: Columbus Southern Power Rates
Percentage of Income Payment (PIPP): $ 0.000568
Electric Fuel Component (EFC): $ 0.013800
Electric Space ConditioningSummer Winter
Energy Charges:
All kW-hr $ 0.10750 $ 0.02340
Small SchoolCustomer Charges: Summer Winter
Single Phase $ 9.00 $ 9.00
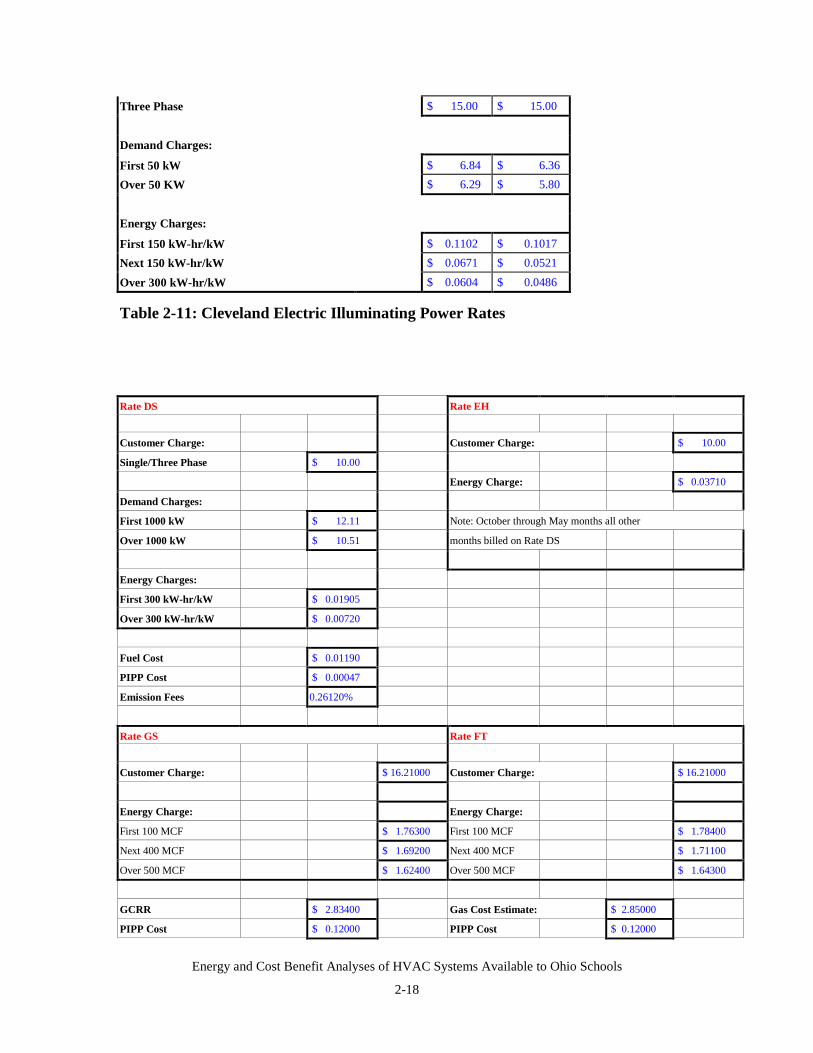
Energy and Cost Benefit Analyses of HVAC Systems Available to Ohio Schools
2-18
Three Phase $ 15.00 $ 15.00
Demand Charges:
First 50 kW $ 6.84 $ 6.36Over 50 KW $ 6.29 $ 5.80
Energy Charges:
First 150 kW-hr/kW $ 0.1102 $ 0.1017Next 150 kW-hr/kW $ 0.0671 $ 0.0521
Over 300 kW-hr/kW $ 0.0604 $ 0.0486
Table 2-11: Cleveland Electric Illuminating Power Rates
Rate DS Rate EH
Customer Charge: Customer Charge: $ 10.00
Single/Three Phase $ 10.00
Energy Charge: $ 0.03710
Demand Charges:
First 1000 kW $ 12.11 Note: October through May months all other
Over 1000 kW $ 10.51 months billed on Rate DS
Energy Charges:
First 300 kW-hr/kW $ 0.01905
Over 300 kW-hr/kW $ 0.00720
Fuel Cost $ 0.01190
PIPP Cost $ 0.00047
Emission Fees 0.26120%
Rate GS Rate FT
Customer Charge: $ 16.21000 Customer Charge: $ 16.21000
Energy Charge: Energy Charge:
First 100 MCF $ 1.76300 First 100 MCF $ 1.78400
Next 400 MCF $ 1.69200 Next 400 MCF $ 1.71100
Over 500 MCF $ 1.62400 Over 500 MCF $ 1.64300
GCRR $ 2.83400 Gas Cost Estimate: $ 2.85000
PIPP Cost $ 0.12000 PIPP Cost $ 0.12000
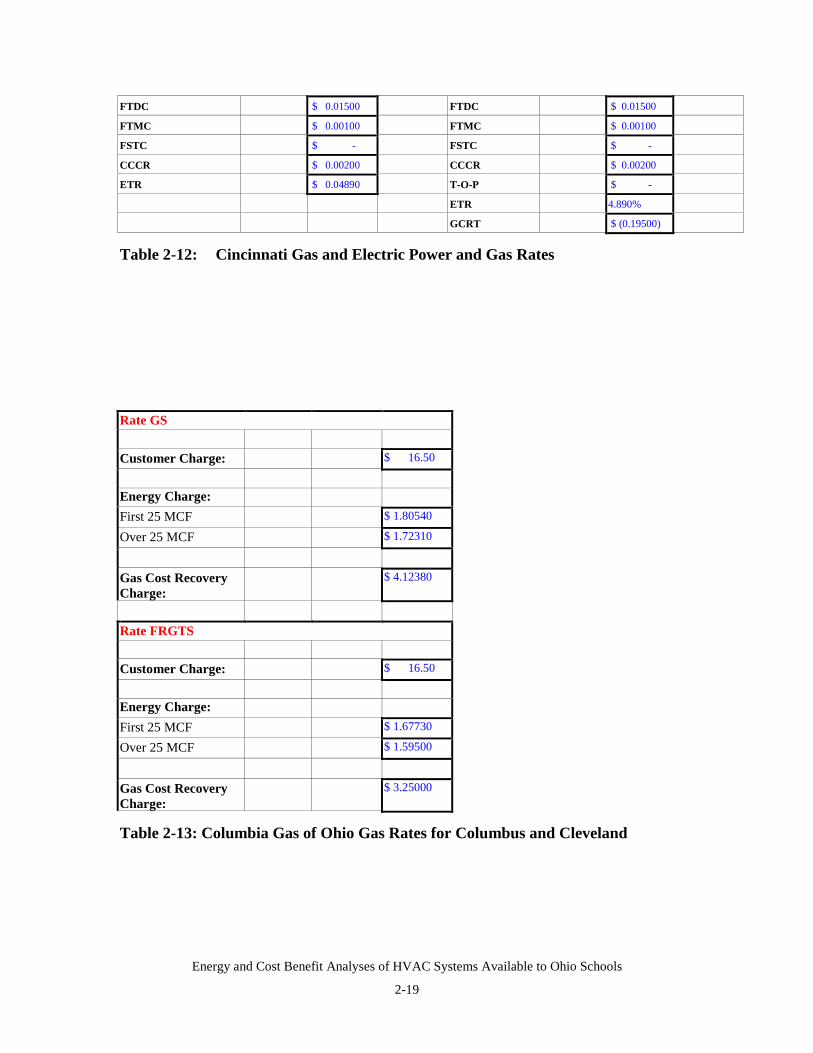
Energy and Cost Benefit Analyses of HVAC Systems Available to Ohio Schools
2-19
FTDC $ 0.01500 FTDC $ 0.01500
FTMC $ 0.00100 FTMC $ 0.00100
FSTC $ - FSTC $ -
CCCR $ 0.00200 CCCR $ 0.00200
ETR $ 0.04890 T-O-P $ -
ETR 4.890%
GCRT $ (0.19500)
Table 2-12: Cincinnati Gas and Electric Power and Gas Rates
Rate GS
Customer Charge: $ 16.50
Energy Charge:First 25 MCF $ 1.80540
Over 25 MCF $ 1.72310
Gas Cost RecoveryCharge:
$ 4.12380
Rate FRGTS
Customer Charge: $ 16.50
Energy Charge:First 25 MCF $ 1.67730
Over 25 MCF $ 1.59500
Gas Cost RecoveryCharge:
$ 3.25000
Table 2-13: Columbia Gas of Ohio Gas Rates for Columbus and Cleveland

Energy and Cost Benefit Analyses of HVAC Systems Available to Ohio Schools
2-20
Energy and Cost Benefit Analysis of HVAC Systems Available to Ohio Schools
3-1
3.0 Baseline Case Results
Results of energy modeling of the subject elementary and high schools, translated to Cincinnati,Columbus and Cleveland, were defined as the 240 Baseline Cases. Baseline Cases used localweather data and utility rates without consideration of special rates or design conditions (e.g.,enthalpy heat recovery technology); these are considered and compared against baseline resultsin other sections of this report. For each city, a total of 80 modeling runs were completed (40 forthe elementary school and 40 for the high school); for all three cities, a total of 240 runs werecompleted. The three cities selected provided a good approximation for the range of weatherconditions and utility rate structures seen across the state. In this chapter, energy results (byHVAC system) are presented first, followed by cost comparison information.
3.1 Baseline Annual Site and Source Energy Consumption
Table 3-1 summarizes site energy consumption in units of million BTU/Year by school type andlocation.
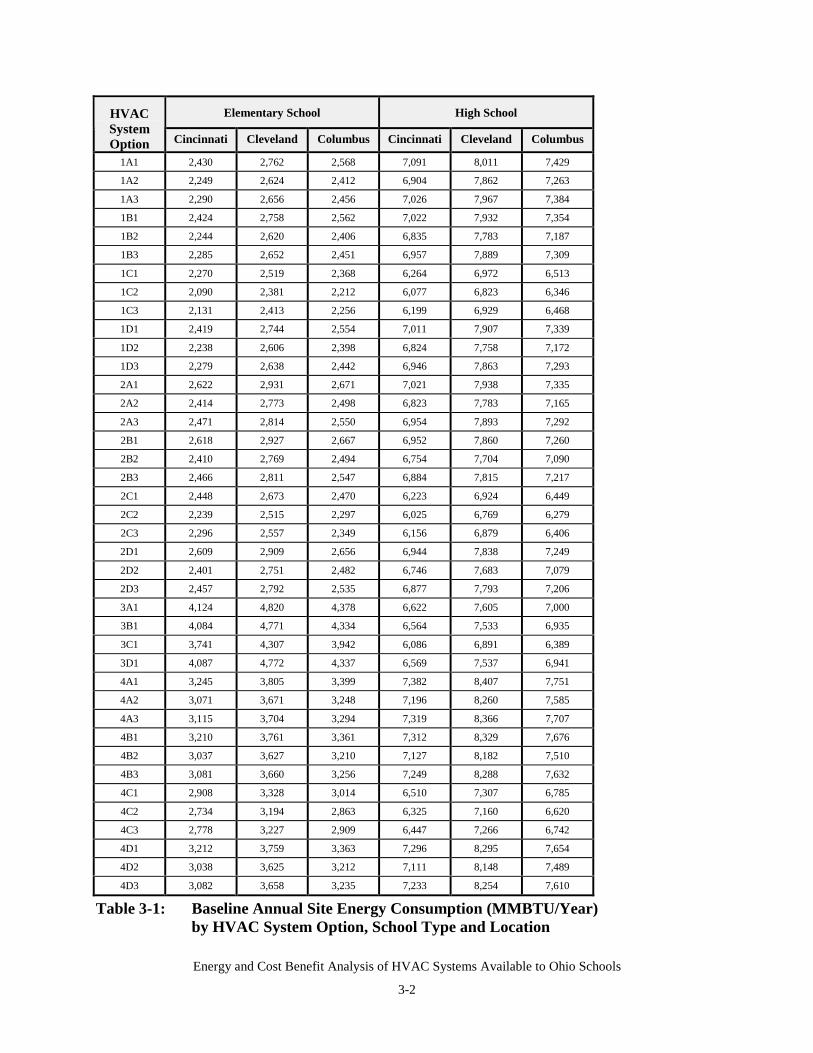
Energy and Cost Benefit Analysis of HVAC Systems Available to Ohio Schools
3-2
Elementary School High SchoolHVACSystemOption Cincinnati Cleveland Columbus Cincinnati Cleveland Columbus
1A1 2,430 2,762 2,568 7,091 8,011 7,429
1A2 2,249 2,624 2,412 6,904 7,862 7,263
1A3 2,290 2,656 2,456 7,026 7,967 7,384
1B1 2,424 2,758 2,562 7,022 7,932 7,354
1B2 2,244 2,620 2,406 6,835 7,783 7,187
1B3 2,285 2,652 2,451 6,957 7,889 7,309
1C1 2,270 2,519 2,368 6,264 6,972 6,513
1C2 2,090 2,381 2,212 6,077 6,823 6,346
1C3 2,131 2,413 2,256 6,199 6,929 6,468
1D1 2,419 2,744 2,554 7,011 7,907 7,339
1D2 2,238 2,606 2,398 6,824 7,758 7,172
1D3 2,279 2,638 2,442 6,946 7,863 7,293
2A1 2,622 2,931 2,671 7,021 7,938 7,335
2A2 2,414 2,773 2,498 6,823 7,783 7,165
2A3 2,471 2,814 2,550 6,954 7,893 7,292
2B1 2,618 2,927 2,667 6,952 7,860 7,260
2B2 2,410 2,769 2,494 6,754 7,704 7,090
2B3 2,466 2,811 2,547 6,884 7,815 7,217
2C1 2,448 2,673 2,470 6,223 6,924 6,449
2C2 2,239 2,515 2,297 6,025 6,769 6,279
2C3 2,296 2,557 2,349 6,156 6,879 6,406
2D1 2,609 2,909 2,656 6,944 7,838 7,249
2D2 2,401 2,751 2,482 6,746 7,683 7,079
2D3 2,457 2,792 2,535 6,877 7,793 7,206
3A1 4,124 4,820 4,378 6,622 7,605 7,000
3B1 4,084 4,771 4,334 6,564 7,533 6,935
3C1 3,741 4,307 3,942 6,086 6,891 6,389
3D1 4,087 4,772 4,337 6,569 7,537 6,941
4A1 3,245 3,805 3,399 7,382 8,407 7,751
4A2 3,071 3,671 3,248 7,196 8,260 7,585
4A3 3,115 3,704 3,294 7,319 8,366 7,707
4B1 3,210 3,761 3,361 7,312 8,329 7,676
4B2 3,037 3,627 3,210 7,127 8,182 7,510
4B3 3,081 3,660 3,256 7,249 8,288 7,632
4C1 2,908 3,328 3,014 6,510 7,307 6,785
4C2 2,734 3,194 2,863 6,325 7,160 6,620
4C3 2,778 3,227 2,909 6,447 7,266 6,742
4D1 3,212 3,759 3,363 7,296 8,295 7,654
4D2 3,038 3,625 3,212 7,111 8,148 7,489
4D3 3,082 3,658 3,235 7,233 8,254 7,610
Table 3-1: Baseline Annual Site Energy Consumption (MMBTU/Year)by HVAC System Option, School Type and Location
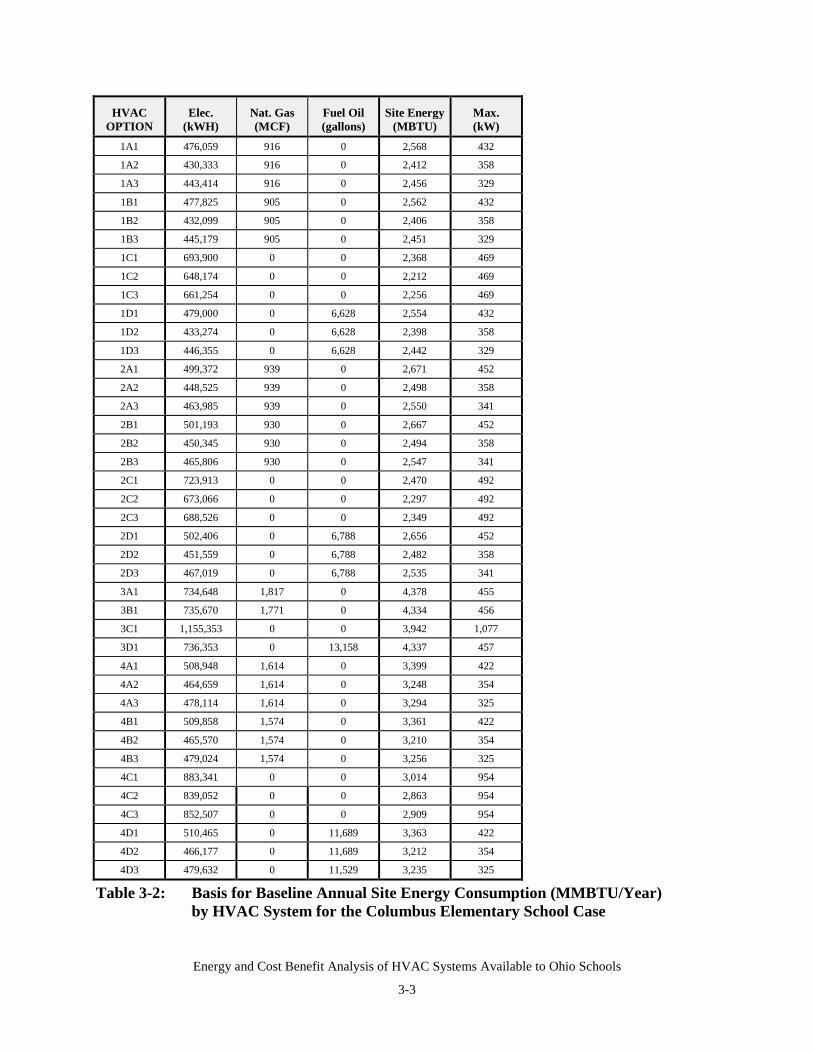
Energy and Cost Benefit Analysis of HVAC Systems Available to Ohio Schools
3-3
HVACOPTION
Elec.(kWH)
Nat. Gas(MCF)
Fuel Oil(gallons)
Site Energy(MBTU)
Max.(kW)
1A1 476,059 916 0 2,568 432
1A2 430,333 916 0 2,412 358
1A3 443,414 916 0 2,456 329
1B1 477,825 905 0 2,562 432
1B2 432,099 905 0 2,406 358
1B3 445,179 905 0 2,451 329
1C1 693,900 0 0 2,368 469
1C2 648,174 0 0 2,212 469
1C3 661,254 0 0 2,256 469
1D1 479,000 0 6,628 2,554 432
1D2 433,274 0 6,628 2,398 358
1D3 446,355 0 6,628 2,442 329
2A1 499,372 939 0 2,671 452
2A2 448,525 939 0 2,498 358
2A3 463,985 939 0 2,550 341
2B1 501,193 930 0 2,667 452
2B2 450,345 930 0 2,494 358
2B3 465,806 930 0 2,547 341
2C1 723,913 0 0 2,470 492
2C2 673,066 0 0 2,297 492
2C3 688,526 0 0 2,349 492
2D1 502,406 0 6,788 2,656 452
2D2 451,559 0 6,788 2,482 358
2D3 467,019 0 6,788 2,535 341
3A1 734,648 1,817 0 4,378 455
3B1 735,670 1,771 0 4,334 456
3C1 1,155,353 0 0 3,942 1,077
3D1 736,353 0 13,158 4,337 457
4A1 508,948 1,614 0 3,399 422
4A2 464,659 1,614 0 3,248 354
4A3 478,114 1,614 0 3,294 325
4B1 509,858 1,574 0 3,361 422
4B2 465,570 1,574 0 3,210 354
4B3 479,024 1,574 0 3,256 325
4C1 883,341 0 0 3,014 954
4C2 839,052 0 0 2,863 954
4C3 852,507 0 0 2,909 954
4D1 510,465 0 11,689 3,363 422
4D2 466,177 0 11,689 3,212 354
4D3 479,632 0 11,529 3,235 325
Table 3-2: Basis for Baseline Annual Site Energy Consumption (MMBTU/Year)by HVAC System for the Columbus Elementary School Case

Energy and Cost Benefit Analysis of HVAC Systems Available to Ohio Schools
3-4
For the Columbus elementary school case, Table 3-2 illustrates the buildup of the source energytotals for each of the fuel forms for the 40 HVAC systems considered.
Annual electric, natural gas and fuel oil consumption, along with total annual fuel consumptionand peak kW power are presented in Table 3-2. These data are the result of hour by hour energyHAP output for each system and each fuel. Similar tables were developed for both buildingtypes in all three cities. Table 3-3 presents annual site energy data on a per-square-foot basis.This table used values of 64,442 ft2 and 120, 500 ft2 for the elementary and the high schoolrespectively.
The following U.S. Department of Energy energy conversion factors were used to develop totalsite energy values presented in this table:
Electricity: 3,412 BTU per kW-hrNatural Gas: 1,030 BTU per cubic footFuel Oil: 138,690 BTU per gallon.
Sorts of annual site energy data, by elementary school and high school, are presented in Tables3-4 and 3-5.
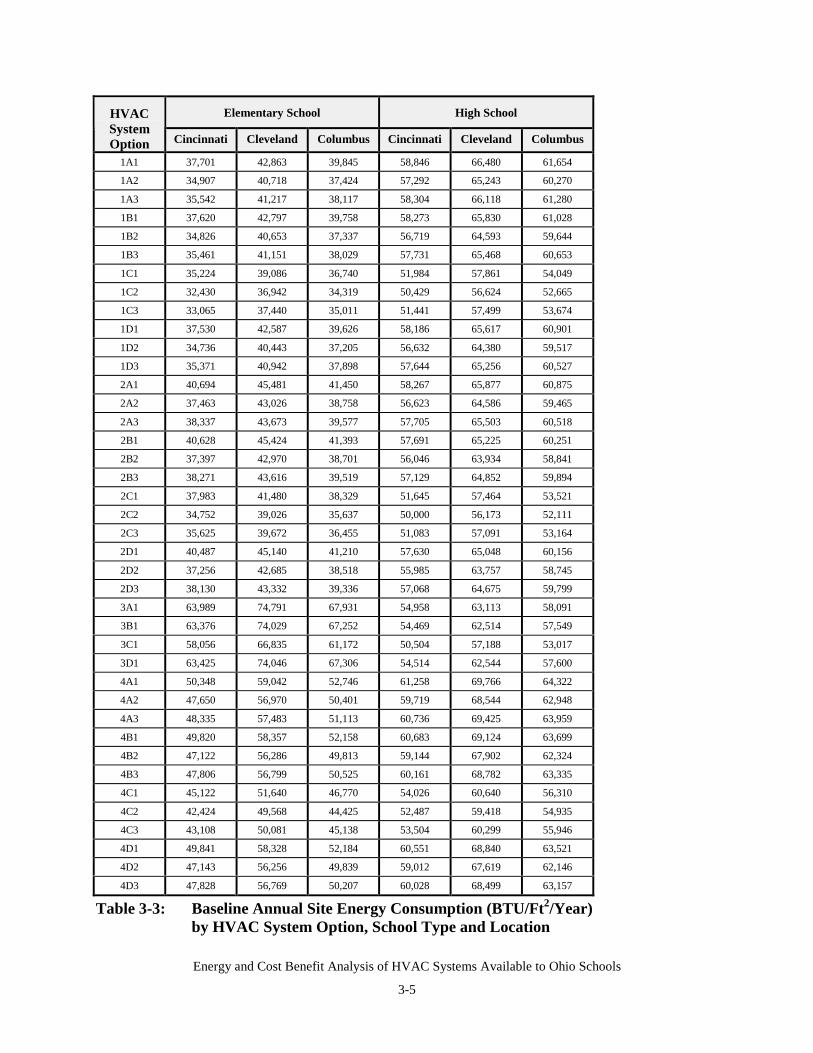
Energy and Cost Benefit Analysis of HVAC Systems Available to Ohio Schools
3-5
Elementary School High SchoolHVACSystemOption Cincinnati Cleveland Columbus Cincinnati Cleveland Columbus
1A1 37,701 42,863 39,845 58,846 66,480 61,654
1A2 34,907 40,718 37,424 57,292 65,243 60,270
1A3 35,542 41,217 38,117 58,304 66,118 61,280
1B1 37,620 42,797 39,758 58,273 65,830 61,028
1B2 34,826 40,653 37,337 56,719 64,593 59,644
1B3 35,461 41,151 38,029 57,731 65,468 60,653
1C1 35,224 39,086 36,740 51,984 57,861 54,049
1C2 32,430 36,942 34,319 50,429 56,624 52,665
1C3 33,065 37,440 35,011 51,441 57,499 53,674
1D1 37,530 42,587 39,626 58,186 65,617 60,901
1D2 34,736 40,443 37,205 56,632 64,380 59,517
1D3 35,371 40,942 37,898 57,644 65,256 60,527
2A1 40,694 45,481 41,450 58,267 65,877 60,875
2A2 37,463 43,026 38,758 56,623 64,586 59,465
2A3 38,337 43,673 39,577 57,705 65,503 60,518
2B1 40,628 45,424 41,393 57,691 65,225 60,251
2B2 37,397 42,970 38,701 56,046 63,934 58,841
2B3 38,271 43,616 39,519 57,129 64,852 59,894
2C1 37,983 41,480 38,329 51,645 57,464 53,521
2C2 34,752 39,026 35,637 50,000 56,173 52,111
2C3 35,625 39,672 36,455 51,083 57,091 53,164
2D1 40,487 45,140 41,210 57,630 65,048 60,156
2D2 37,256 42,685 38,518 55,985 63,757 58,745
2D3 38,130 43,332 39,336 57,068 64,675 59,799
3A1 63,989 74,791 67,931 54,958 63,113 58,091
3B1 63,376 74,029 67,252 54,469 62,514 57,549
3C1 58,056 66,835 61,172 50,504 57,188 53,017
3D1 63,425 74,046 67,306 54,514 62,544 57,600
4A1 50,348 59,042 52,746 61,258 69,766 64,322
4A2 47,650 56,970 50,401 59,719 68,544 62,948
4A3 48,335 57,483 51,113 60,736 69,425 63,959
4B1 49,820 58,357 52,158 60,683 69,124 63,699
4B2 47,122 56,286 49,813 59,144 67,902 62,324
4B3 47,806 56,799 50,525 60,161 68,782 63,335
4C1 45,122 51,640 46,770 54,026 60,640 56,310
4C2 42,424 49,568 44,425 52,487 59,418 54,935
4C3 43,108 50,081 45,138 53,504 60,299 55,946
4D1 49,841 58,328 52,184 60,551 68,840 63,521
4D2 47,143 56,256 49,839 59,012 67,619 62,146
4D3 47,828 56,769 50,207 60,028 68,499 63,157
Table 3-3: Baseline Annual Site Energy Consumption (BTU/Ft2/Year)by HVAC System Option, School Type and Location
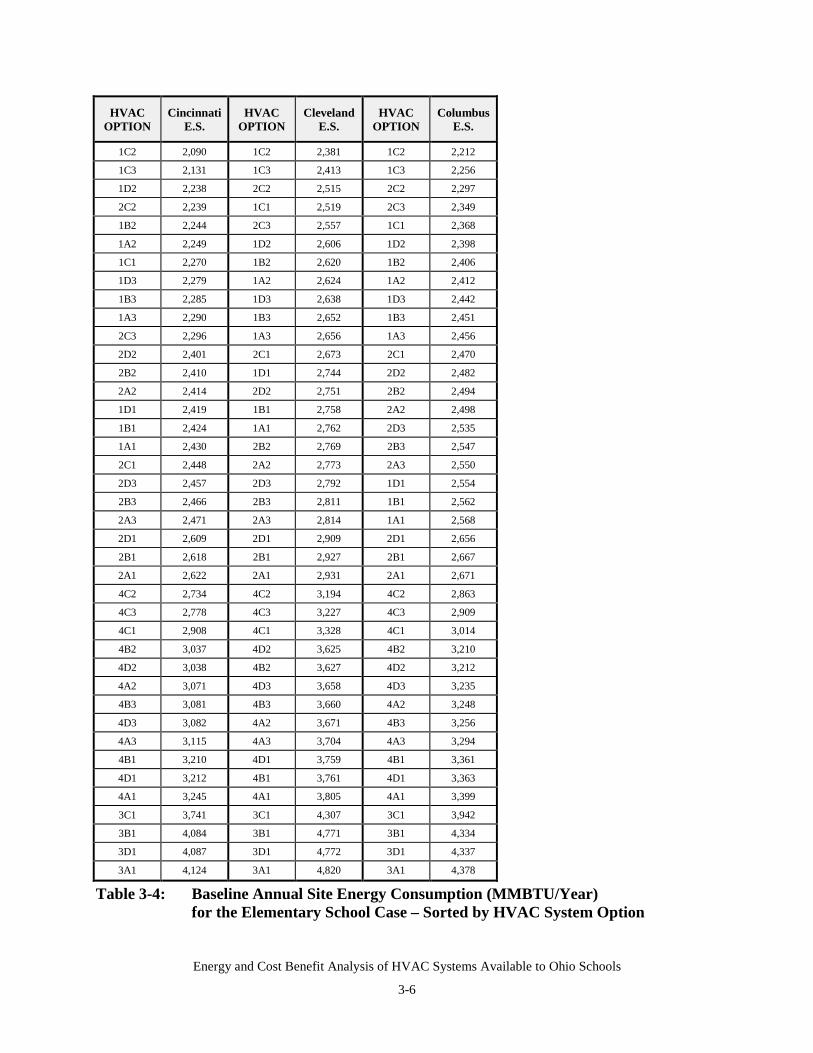
Energy and Cost Benefit Analysis of HVAC Systems Available to Ohio Schools
3-6
HVACOPTION
CincinnatiE.S.
HVACOPTION
ClevelandE.S.
HVACOPTION
ColumbusE.S.
1C2 2,090 1C2 2,381 1C2 2,212
1C3 2,131 1C3 2,413 1C3 2,256
1D2 2,238 2C2 2,515 2C2 2,297
2C2 2,239 1C1 2,519 2C3 2,349
1B2 2,244 2C3 2,557 1C1 2,368
1A2 2,249 1D2 2,606 1D2 2,398
1C1 2,270 1B2 2,620 1B2 2,406
1D3 2,279 1A2 2,624 1A2 2,412
1B3 2,285 1D3 2,638 1D3 2,442
1A3 2,290 1B3 2,652 1B3 2,451
2C3 2,296 1A3 2,656 1A3 2,456
2D2 2,401 2C1 2,673 2C1 2,470
2B2 2,410 1D1 2,744 2D2 2,482
2A2 2,414 2D2 2,751 2B2 2,494
1D1 2,419 1B1 2,758 2A2 2,498
1B1 2,424 1A1 2,762 2D3 2,535
1A1 2,430 2B2 2,769 2B3 2,547
2C1 2,448 2A2 2,773 2A3 2,550
2D3 2,457 2D3 2,792 1D1 2,554
2B3 2,466 2B3 2,811 1B1 2,562
2A3 2,471 2A3 2,814 1A1 2,568
2D1 2,609 2D1 2,909 2D1 2,656
2B1 2,618 2B1 2,927 2B1 2,667
2A1 2,622 2A1 2,931 2A1 2,671
4C2 2,734 4C2 3,194 4C2 2,863
4C3 2,778 4C3 3,227 4C3 2,909
4C1 2,908 4C1 3,328 4C1 3,014
4B2 3,037 4D2 3,625 4B2 3,210
4D2 3,038 4B2 3,627 4D2 3,212
4A2 3,071 4D3 3,658 4D3 3,235
4B3 3,081 4B3 3,660 4A2 3,248
4D3 3,082 4A2 3,671 4B3 3,256
4A3 3,115 4A3 3,704 4A3 3,294
4B1 3,210 4D1 3,759 4B1 3,361
4D1 3,212 4B1 3,761 4D1 3,363
4A1 3,245 4A1 3,805 4A1 3,399
3C1 3,741 3C1 4,307 3C1 3,942
3B1 4,084 3B1 4,771 3B1 4,334
3D1 4,087 3D1 4,772 3D1 4,337
3A1 4,124 3A1 4,820 3A1 4,378
Table 3-4: Baseline Annual Site Energy Consumption (MMBTU/Year)for the Elementary School Case – Sorted by HVAC System Option
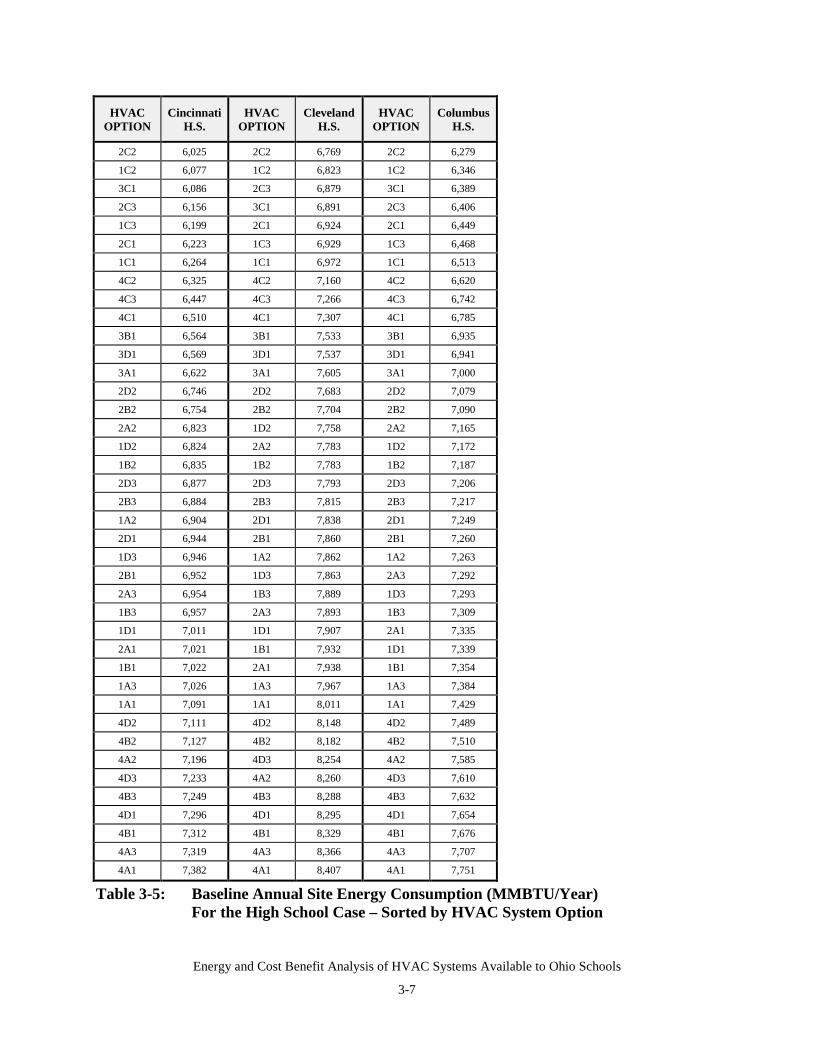
Energy and Cost Benefit Analysis of HVAC Systems Available to Ohio Schools
3-7
HVACOPTION
CincinnatiH.S.
HVACOPTION
ClevelandH.S.
HVACOPTION
ColumbusH.S.
2C2 6,025 2C2 6,769 2C2 6,279
1C2 6,077 1C2 6,823 1C2 6,346
3C1 6,086 2C3 6,879 3C1 6,389
2C3 6,156 3C1 6,891 2C3 6,406
1C3 6,199 2C1 6,924 2C1 6,449
2C1 6,223 1C3 6,929 1C3 6,468
1C1 6,264 1C1 6,972 1C1 6,513
4C2 6,325 4C2 7,160 4C2 6,620
4C3 6,447 4C3 7,266 4C3 6,742
4C1 6,510 4C1 7,307 4C1 6,785
3B1 6,564 3B1 7,533 3B1 6,935
3D1 6,569 3D1 7,537 3D1 6,941
3A1 6,622 3A1 7,605 3A1 7,000
2D2 6,746 2D2 7,683 2D2 7,079
2B2 6,754 2B2 7,704 2B2 7,090
2A2 6,823 1D2 7,758 2A2 7,165
1D2 6,824 2A2 7,783 1D2 7,172
1B2 6,835 1B2 7,783 1B2 7,187
2D3 6,877 2D3 7,793 2D3 7,206
2B3 6,884 2B3 7,815 2B3 7,217
1A2 6,904 2D1 7,838 2D1 7,249
2D1 6,944 2B1 7,860 2B1 7,260
1D3 6,946 1A2 7,862 1A2 7,263
2B1 6,952 1D3 7,863 2A3 7,292
2A3 6,954 1B3 7,889 1D3 7,293
1B3 6,957 2A3 7,893 1B3 7,309
1D1 7,011 1D1 7,907 2A1 7,335
2A1 7,021 1B1 7,932 1D1 7,339
1B1 7,022 2A1 7,938 1B1 7,354
1A3 7,026 1A3 7,967 1A3 7,384
1A1 7,091 1A1 8,011 1A1 7,429
4D2 7,111 4D2 8,148 4D2 7,489
4B2 7,127 4B2 8,182 4B2 7,510
4A2 7,196 4D3 8,254 4A2 7,585
4D3 7,233 4A2 8,260 4D3 7,610
4B3 7,249 4B3 8,288 4B3 7,632
4D1 7,296 4D1 8,295 4D1 7,654
4B1 7,312 4B1 8,329 4B1 7,676
4A3 7,319 4A3 8,366 4A3 7,707
4A1 7,382 4A1 8,407 4A1 7,751
Table 3-5: Baseline Annual Site Energy Consumption (MMBTU/Year)For the High School Case – Sorted by HVAC System Option
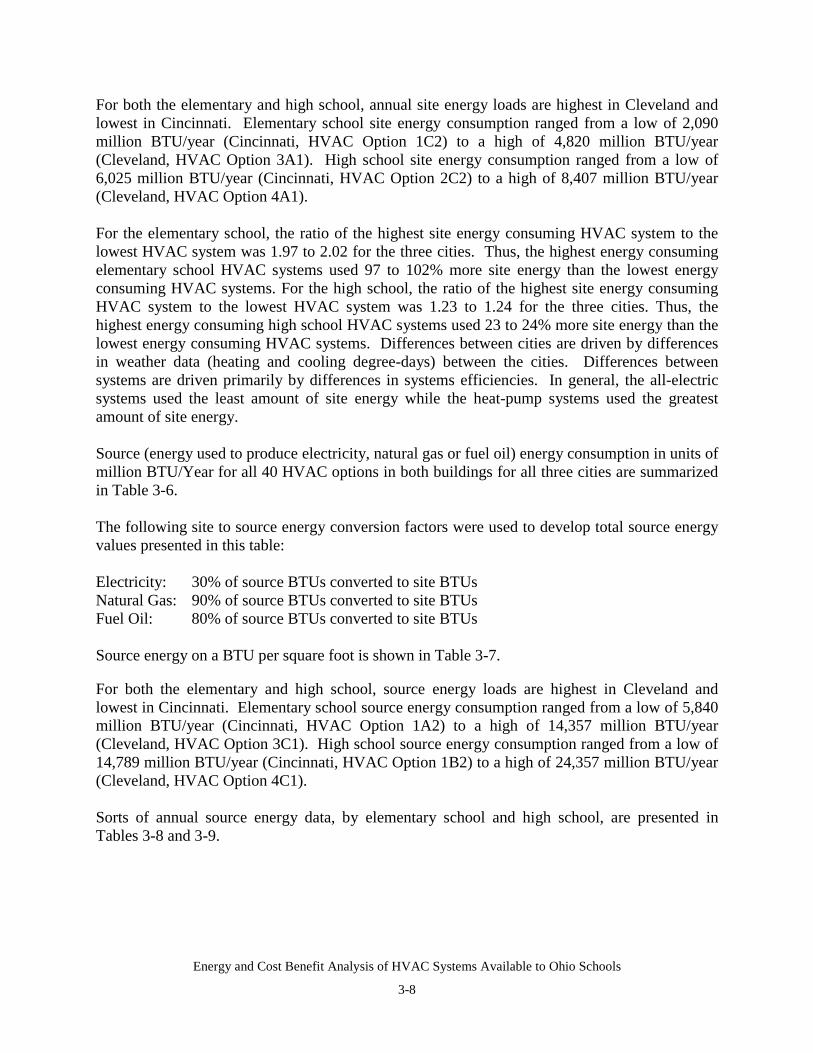
Energy and Cost Benefit Analysis of HVAC Systems Available to Ohio Schools
3-8
For both the elementary and high school, annual site energy loads are highest in Cleveland andlowest in Cincinnati. Elementary school site energy consumption ranged from a low of 2,090million BTU/year (Cincinnati, HVAC Option 1C2) to a high of 4,820 million BTU/year(Cleveland, HVAC Option 3A1). High school site energy consumption ranged from a low of6,025 million BTU/year (Cincinnati, HVAC Option 2C2) to a high of 8,407 million BTU/year(Cleveland, HVAC Option 4A1).
For the elementary school, the ratio of the highest site energy consuming HVAC system to thelowest HVAC system was 1.97 to 2.02 for the three cities. Thus, the highest energy consumingelementary school HVAC systems used 97 to 102% more site energy than the lowest energyconsuming HVAC systems. For the high school, the ratio of the highest site energy consumingHVAC system to the lowest HVAC system was 1.23 to 1.24 for the three cities. Thus, thehighest energy consuming high school HVAC systems used 23 to 24% more site energy than thelowest energy consuming HVAC systems. Differences between cities are driven by differencesin weather data (heating and cooling degree-days) between the cities. Differences betweensystems are driven primarily by differences in systems efficiencies. In general, the all-electricsystems used the least amount of site energy while the heat-pump systems used the greatestamount of site energy.
Source (energy used to produce electricity, natural gas or fuel oil) energy consumption in units ofmillion BTU/Year for all 40 HVAC options in both buildings for all three cities are summarizedin Table 3-6.
The following site to source energy conversion factors were used to develop total source energyvalues presented in this table:
Electricity: 30% of source BTUs converted to site BTUsNatural Gas: 90% of source BTUs converted to site BTUsFuel Oil: 80% of source BTUs converted to site BTUs
Source energy on a BTU per square foot is shown in Table 3-7.
For both the elementary and high school, source energy loads are highest in Cleveland andlowest in Cincinnati. Elementary school source energy consumption ranged from a low of 5,840million BTU/year (Cincinnati, HVAC Option 1A2) to a high of 14,357 million BTU/year(Cleveland, HVAC Option 3C1). High school source energy consumption ranged from a low of14,789 million BTU/year (Cincinnati, HVAC Option 1B2) to a high of 24,357 million BTU/year(Cleveland, HVAC Option 4C1).
Sorts of annual source energy data, by elementary school and high school, are presented inTables 3-8 and 3-9.
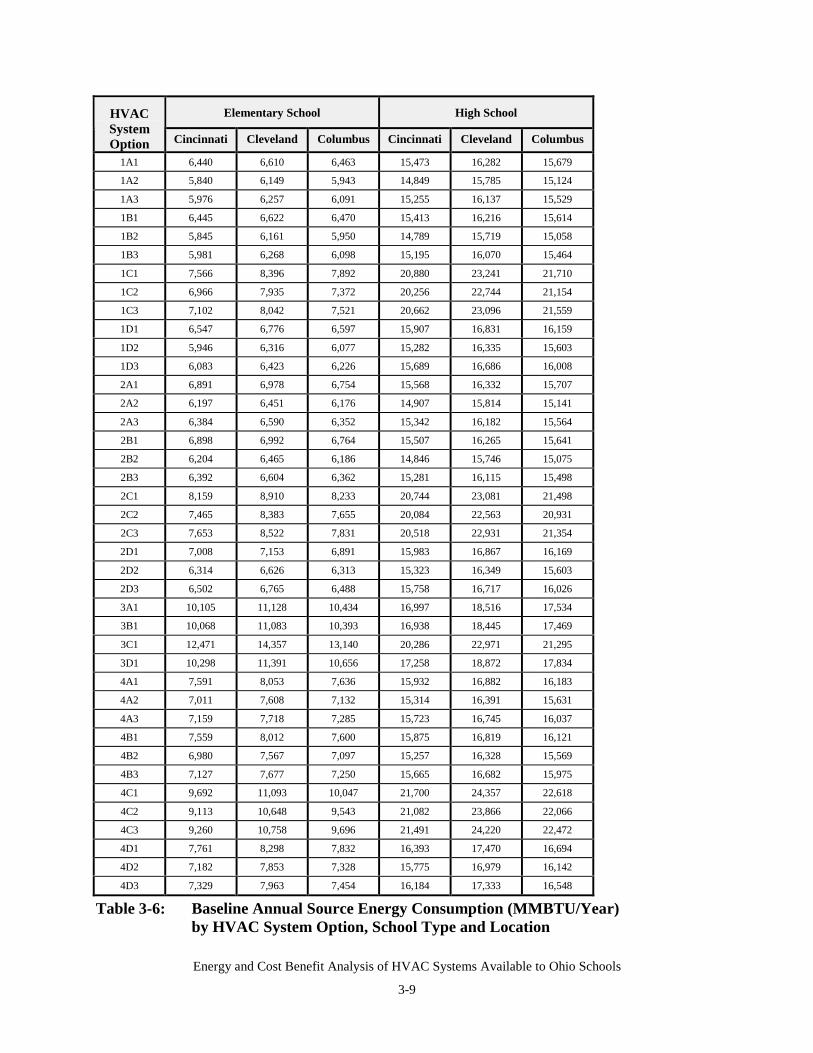
Energy and Cost Benefit Analysis of HVAC Systems Available to Ohio Schools
3-9
Elementary School High SchoolHVACSystemOption Cincinnati Cleveland Columbus Cincinnati Cleveland Columbus
1A1 6,440 6,610 6,463 15,473 16,282 15,679
1A2 5,840 6,149 5,943 14,849 15,785 15,124
1A3 5,976 6,257 6,091 15,255 16,137 15,529
1B1 6,445 6,622 6,470 15,413 16,216 15,614
1B2 5,845 6,161 5,950 14,789 15,719 15,058
1B3 5,981 6,268 6,098 15,195 16,070 15,464
1C1 7,566 8,396 7,892 20,880 23,241 21,710
1C2 6,966 7,935 7,372 20,256 22,744 21,154
1C3 7,102 8,042 7,521 20,662 23,096 21,559
1D1 6,547 6,776 6,597 15,907 16,831 16,159
1D2 5,946 6,316 6,077 15,282 16,335 15,603
1D3 6,083 6,423 6,226 15,689 16,686 16,008
2A1 6,891 6,978 6,754 15,568 16,332 15,707
2A2 6,197 6,451 6,176 14,907 15,814 15,141
2A3 6,384 6,590 6,352 15,342 16,182 15,564
2B1 6,898 6,992 6,764 15,507 16,265 15,641
2B2 6,204 6,465 6,186 14,846 15,746 15,075
2B3 6,392 6,604 6,362 15,281 16,115 15,498
2C1 8,159 8,910 8,233 20,744 23,081 21,498
2C2 7,465 8,383 7,655 20,084 22,563 20,931
2C3 7,653 8,522 7,831 20,518 22,931 21,354
2D1 7,008 7,153 6,891 15,983 16,867 16,169
2D2 6,314 6,626 6,313 15,323 16,349 15,603
2D3 6,502 6,765 6,488 15,758 16,717 16,026
3A1 10,105 11,128 10,434 16,997 18,516 17,534
3B1 10,068 11,083 10,393 16,938 18,445 17,469
3C1 12,471 14,357 13,140 20,286 22,971 21,295
3D1 10,298 11,391 10,656 17,258 18,872 17,834
4A1 7,591 8,053 7,636 15,932 16,882 16,183
4A2 7,011 7,608 7,132 15,314 16,391 15,631
4A3 7,159 7,718 7,285 15,723 16,745 16,037
4B1 7,559 8,012 7,600 15,875 16,819 16,121
4B2 6,980 7,567 7,097 15,257 16,328 15,569
4B3 7,127 7,677 7,250 15,665 16,682 15,975
4C1 9,692 11,093 10,047 21,700 24,357 22,618
4C2 9,113 10,648 9,543 21,082 23,866 22,066
4C3 9,260 10,758 9,696 21,491 24,220 22,472
4D1 7,761 8,298 7,832 16,393 17,470 16,694
4D2 7,182 7,853 7,328 15,775 16,979 16,142
4D3 7,329 7,963 7,454 16,184 17,333 16,548
Table 3-6: Baseline Annual Source Energy Consumption (MMBTU/Year)by HVAC System Option, School Type and Location
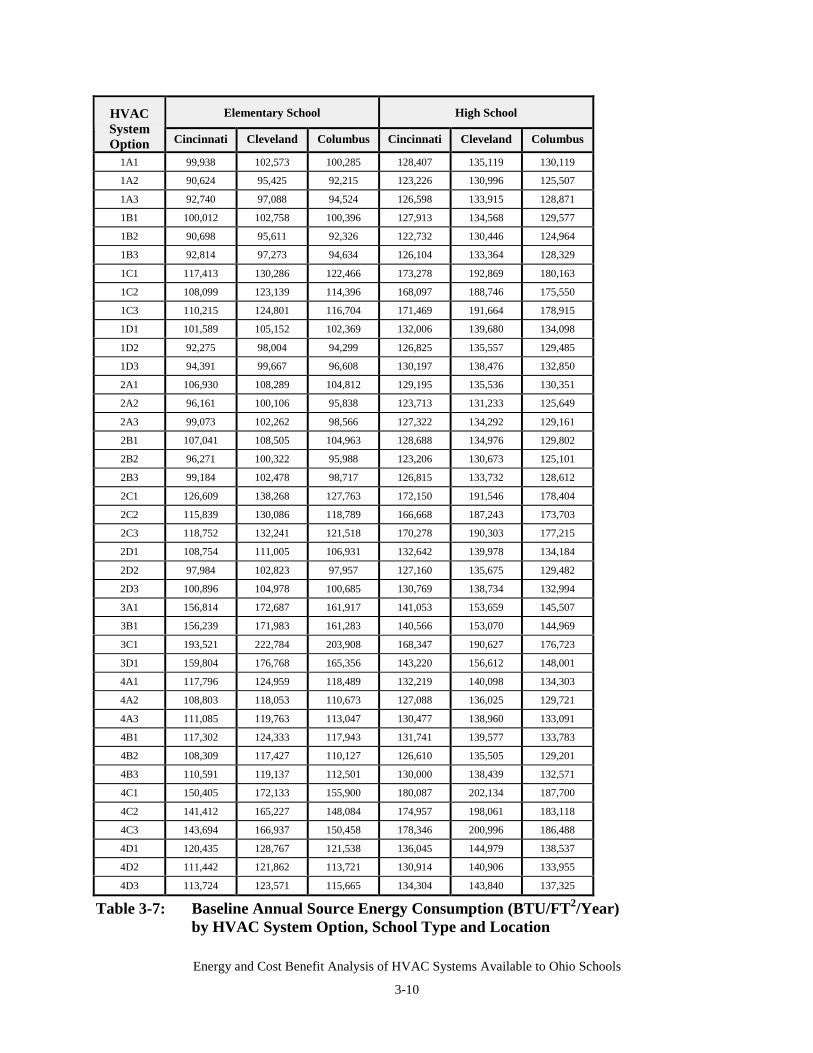
Energy and Cost Benefit Analysis of HVAC Systems Available to Ohio Schools
3-10
Elementary School High SchoolHVACSystemOption Cincinnati Cleveland Columbus Cincinnati Cleveland Columbus
1A1 99,938 102,573 100,285 128,407 135,119 130,119
1A2 90,624 95,425 92,215 123,226 130,996 125,507
1A3 92,740 97,088 94,524 126,598 133,915 128,871
1B1 100,012 102,758 100,396 127,913 134,568 129,577
1B2 90,698 95,611 92,326 122,732 130,446 124,964
1B3 92,814 97,273 94,634 126,104 133,364 128,329
1C1 117,413 130,286 122,466 173,278 192,869 180,163
1C2 108,099 123,139 114,396 168,097 188,746 175,550
1C3 110,215 124,801 116,704 171,469 191,664 178,915
1D1 101,589 105,152 102,369 132,006 139,680 134,098
1D2 92,275 98,004 94,299 126,825 135,557 129,485
1D3 94,391 99,667 96,608 130,197 138,476 132,850
2A1 106,930 108,289 104,812 129,195 135,536 130,351
2A2 96,161 100,106 95,838 123,713 131,233 125,649
2A3 99,073 102,262 98,566 127,322 134,292 129,161
2B1 107,041 108,505 104,963 128,688 134,976 129,802
2B2 96,271 100,322 95,988 123,206 130,673 125,101
2B3 99,184 102,478 98,717 126,815 133,732 128,612
2C1 126,609 138,268 127,763 172,150 191,546 178,404
2C2 115,839 130,086 118,789 166,668 187,243 173,703
2C3 118,752 132,241 121,518 170,278 190,303 177,215
2D1 108,754 111,005 106,931 132,642 139,978 134,184
2D2 97,984 102,823 97,957 127,160 135,675 129,482
2D3 100,896 104,978 100,685 130,769 138,734 132,994
3A1 156,814 172,687 161,917 141,053 153,659 145,507
3B1 156,239 171,983 161,283 140,566 153,070 144,969
3C1 193,521 222,784 203,908 168,347 190,627 176,723
3D1 159,804 176,768 165,356 143,220 156,612 148,001
4A1 117,796 124,959 118,489 132,219 140,098 134,303
4A2 108,803 118,053 110,673 127,088 136,025 129,721
4A3 111,085 119,763 113,047 130,477 138,960 133,091
4B1 117,302 124,333 117,943 131,741 139,577 133,783
4B2 108,309 117,427 110,127 126,610 135,505 129,201
4B3 110,591 119,137 112,501 130,000 138,439 132,571
4C1 150,405 172,133 155,900 180,087 202,134 187,700
4C2 141,412 165,227 148,084 174,957 198,061 183,118
4C3 143,694 166,937 150,458 178,346 200,996 186,488
4D1 120,435 128,767 121,538 136,045 144,979 138,537
4D2 111,442 121,862 113,721 130,914 140,906 133,955
4D3 113,724 123,571 115,665 134,304 143,840 137,325
Table 3-7: Baseline Annual Source Energy Consumption (BTU/FT2/Year)by HVAC System Option, School Type and Location
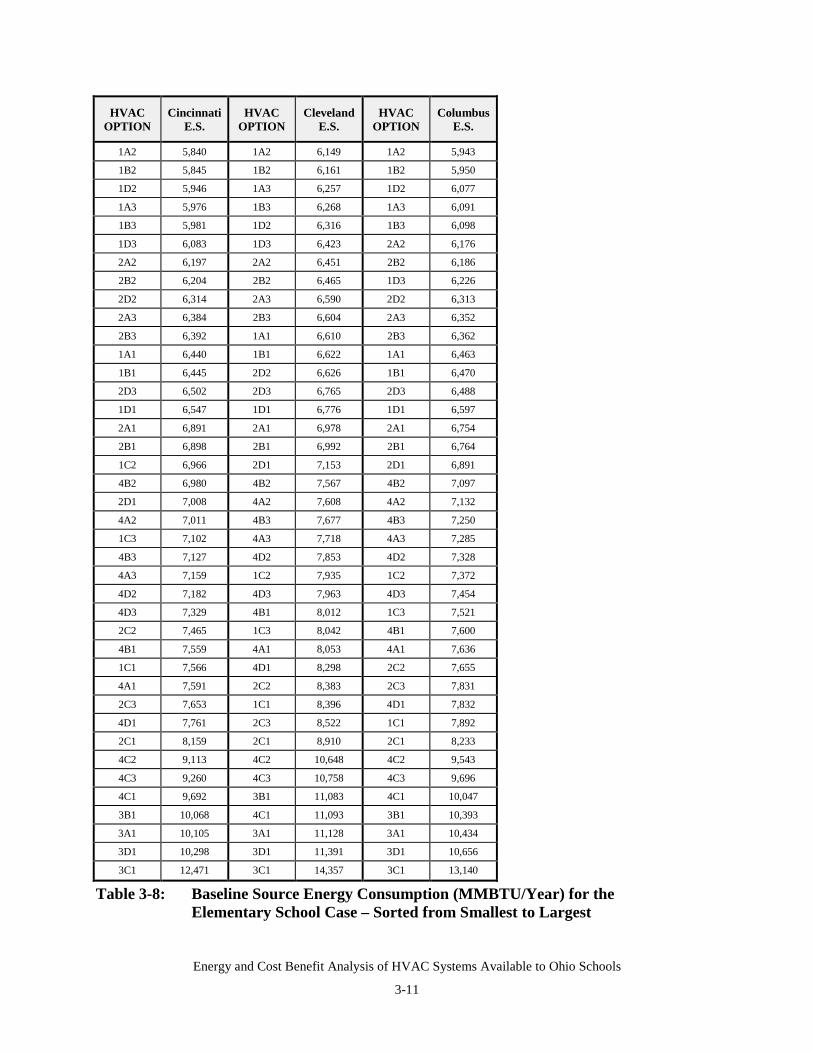
Energy and Cost Benefit Analysis of HVAC Systems Available to Ohio Schools
3-11
HVACOPTION
CincinnatiE.S.
HVACOPTION
ClevelandE.S.
HVACOPTION
ColumbusE.S.
1A2 5,840 1A2 6,149 1A2 5,943
1B2 5,845 1B2 6,161 1B2 5,950
1D2 5,946 1A3 6,257 1D2 6,077
1A3 5,976 1B3 6,268 1A3 6,091
1B3 5,981 1D2 6,316 1B3 6,098
1D3 6,083 1D3 6,423 2A2 6,176
2A2 6,197 2A2 6,451 2B2 6,186
2B2 6,204 2B2 6,465 1D3 6,226
2D2 6,314 2A3 6,590 2D2 6,313
2A3 6,384 2B3 6,604 2A3 6,352
2B3 6,392 1A1 6,610 2B3 6,362
1A1 6,440 1B1 6,622 1A1 6,463
1B1 6,445 2D2 6,626 1B1 6,470
2D3 6,502 2D3 6,765 2D3 6,488
1D1 6,547 1D1 6,776 1D1 6,597
2A1 6,891 2A1 6,978 2A1 6,754
2B1 6,898 2B1 6,992 2B1 6,764
1C2 6,966 2D1 7,153 2D1 6,891
4B2 6,980 4B2 7,567 4B2 7,097
2D1 7,008 4A2 7,608 4A2 7,132
4A2 7,011 4B3 7,677 4B3 7,250
1C3 7,102 4A3 7,718 4A3 7,285
4B3 7,127 4D2 7,853 4D2 7,328
4A3 7,159 1C2 7,935 1C2 7,372
4D2 7,182 4D3 7,963 4D3 7,454
4D3 7,329 4B1 8,012 1C3 7,521
2C2 7,465 1C3 8,042 4B1 7,600
4B1 7,559 4A1 8,053 4A1 7,636
1C1 7,566 4D1 8,298 2C2 7,655
4A1 7,591 2C2 8,383 2C3 7,831
2C3 7,653 1C1 8,396 4D1 7,832
4D1 7,761 2C3 8,522 1C1 7,892
2C1 8,159 2C1 8,910 2C1 8,233
4C2 9,113 4C2 10,648 4C2 9,543
4C3 9,260 4C3 10,758 4C3 9,696
4C1 9,692 3B1 11,083 4C1 10,047
3B1 10,068 4C1 11,093 3B1 10,393
3A1 10,105 3A1 11,128 3A1 10,434
3D1 10,298 3D1 11,391 3D1 10,656
3C1 12,471 3C1 14,357 3C1 13,140
Table 3-8: Baseline Source Energy Consumption (MMBTU/Year) for theElementary School Case – Sorted from Smallest to Largest
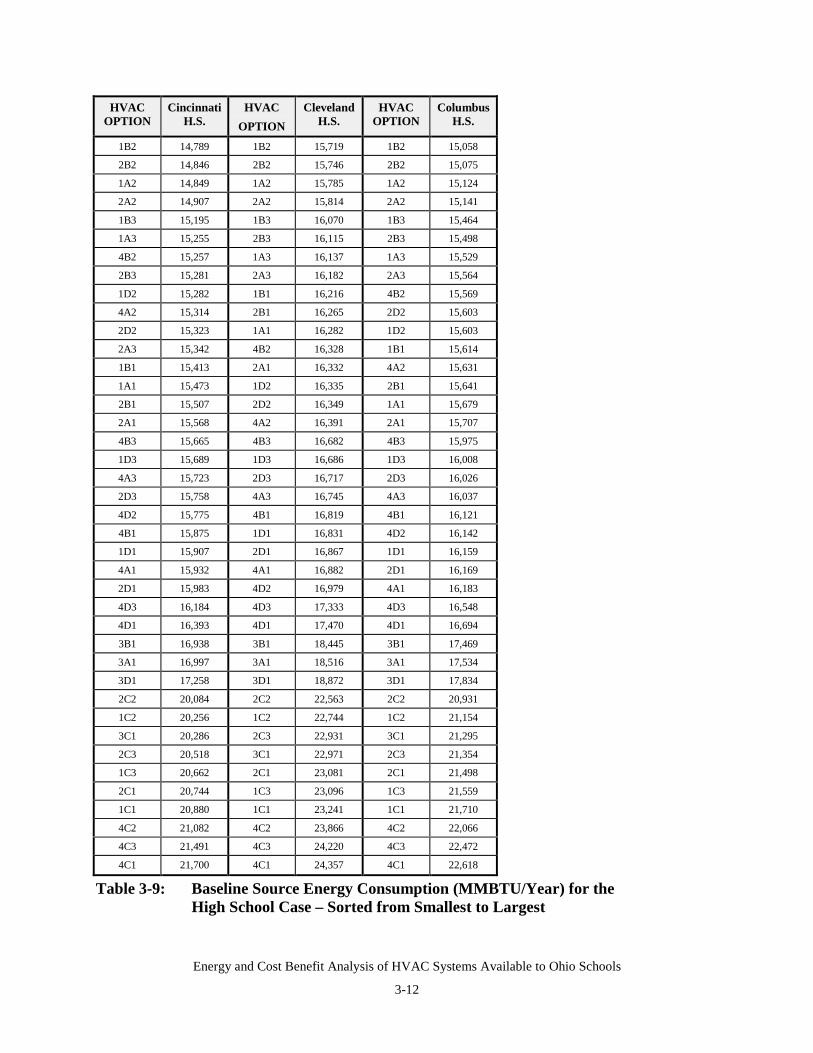
Energy and Cost Benefit Analysis of HVAC Systems Available to Ohio Schools
3-12
HVACOPTION
CincinnatiH.S.
HVACOPTION
ClevelandH.S.
HVACOPTION
ColumbusH.S.
1B2 14,789 1B2 15,719 1B2 15,058
2B2 14,846 2B2 15,746 2B2 15,075
1A2 14,849 1A2 15,785 1A2 15,124
2A2 14,907 2A2 15,814 2A2 15,141
1B3 15,195 1B3 16,070 1B3 15,464
1A3 15,255 2B3 16,115 2B3 15,498
4B2 15,257 1A3 16,137 1A3 15,529
2B3 15,281 2A3 16,182 2A3 15,564
1D2 15,282 1B1 16,216 4B2 15,569
4A2 15,314 2B1 16,265 2D2 15,603
2D2 15,323 1A1 16,282 1D2 15,603
2A3 15,342 4B2 16,328 1B1 15,614
1B1 15,413 2A1 16,332 4A2 15,631
1A1 15,473 1D2 16,335 2B1 15,641
2B1 15,507 2D2 16,349 1A1 15,679
2A1 15,568 4A2 16,391 2A1 15,707
4B3 15,665 4B3 16,682 4B3 15,975
1D3 15,689 1D3 16,686 1D3 16,008
4A3 15,723 2D3 16,717 2D3 16,026
2D3 15,758 4A3 16,745 4A3 16,037
4D2 15,775 4B1 16,819 4B1 16,121
4B1 15,875 1D1 16,831 4D2 16,142
1D1 15,907 2D1 16,867 1D1 16,159
4A1 15,932 4A1 16,882 2D1 16,169
2D1 15,983 4D2 16,979 4A1 16,183
4D3 16,184 4D3 17,333 4D3 16,548
4D1 16,393 4D1 17,470 4D1 16,694
3B1 16,938 3B1 18,445 3B1 17,469
3A1 16,997 3A1 18,516 3A1 17,534
3D1 17,258 3D1 18,872 3D1 17,834
2C2 20,084 2C2 22,563 2C2 20,931
1C2 20,256 1C2 22,744 1C2 21,154
3C1 20,286 2C3 22,931 3C1 21,295
2C3 20,518 3C1 22,971 2C3 21,354
1C3 20,662 2C1 23,081 2C1 21,498
2C1 20,744 1C3 23,096 1C3 21,559
1C1 20,880 1C1 23,241 1C1 21,710
4C2 21,082 4C2 23,866 4C2 22,066
4C3 21,491 4C3 24,220 4C3 22,472
4C1 21,700 4C1 24,357 4C1 22,618
Table 3-9: Baseline Source Energy Consumption (MMBTU/Year) for theHigh School Case – Sorted from Smallest to Largest
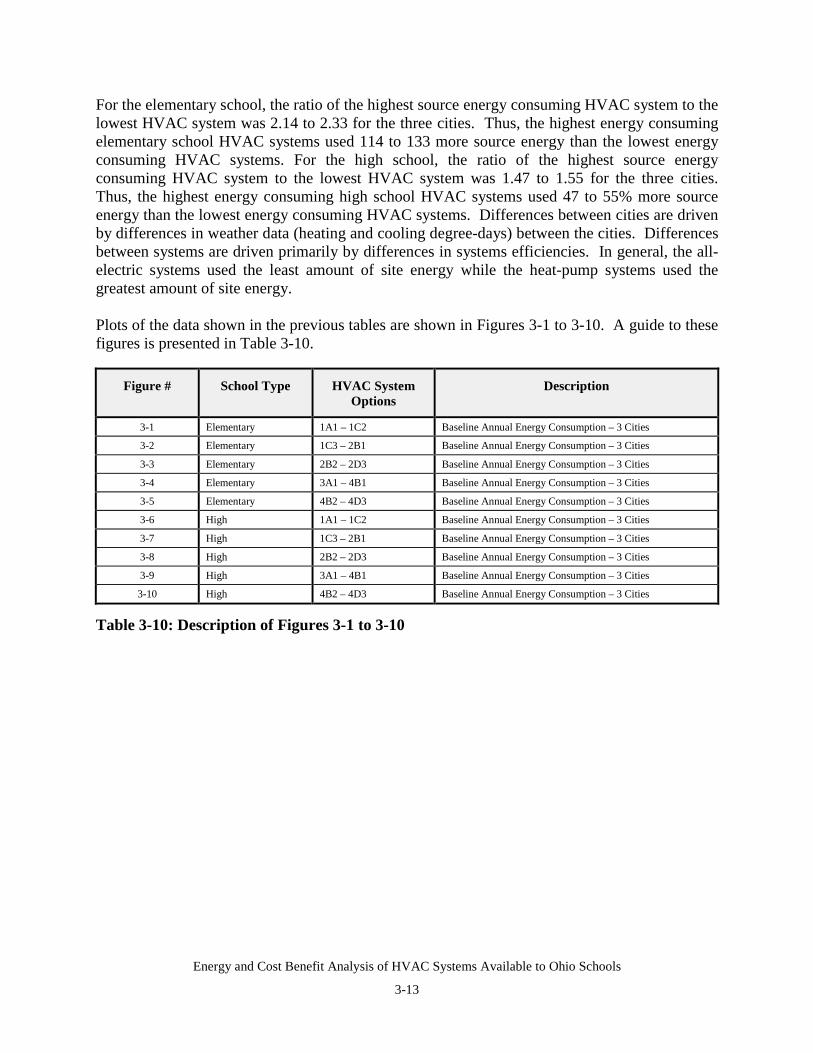
Energy and Cost Benefit Analysis of HVAC Systems Available to Ohio Schools
3-13
For the elementary school, the ratio of the highest source energy consuming HVAC system to thelowest HVAC system was 2.14 to 2.33 for the three cities. Thus, the highest energy consumingelementary school HVAC systems used 114 to 133 more source energy than the lowest energyconsuming HVAC systems. For the high school, the ratio of the highest source energyconsuming HVAC system to the lowest HVAC system was 1.47 to 1.55 for the three cities.Thus, the highest energy consuming high school HVAC systems used 47 to 55% more sourceenergy than the lowest energy consuming HVAC systems. Differences between cities are drivenby differences in weather data (heating and cooling degree-days) between the cities. Differencesbetween systems are driven primarily by differences in systems efficiencies. In general, the all-electric systems used the least amount of site energy while the heat-pump systems used thegreatest amount of site energy.
Plots of the data shown in the previous tables are shown in Figures 3-1 to 3-10. A guide to thesefigures is presented in Table 3-10.
Figure # School Type HVAC SystemOptions
Description
3-1 Elementary 1A1 – 1C2 Baseline Annual Energy Consumption – 3 Cities
3-2 Elementary 1C3 – 2B1 Baseline Annual Energy Consumption – 3 Cities
3-3 Elementary 2B2 – 2D3 Baseline Annual Energy Consumption – 3 Cities
3-4 Elementary 3A1 – 4B1 Baseline Annual Energy Consumption – 3 Cities
3-5 Elementary 4B2 – 4D3 Baseline Annual Energy Consumption – 3 Cities
3-6 High 1A1 – 1C2 Baseline Annual Energy Consumption – 3 Cities
3-7 High 1C3 – 2B1 Baseline Annual Energy Consumption – 3 Cities
3-8 High 2B2 – 2D3 Baseline Annual Energy Consumption – 3 Cities
3-9 High 3A1 – 4B1 Baseline Annual Energy Consumption – 3 Cities
3-10 High 4B2 – 4D3 Baseline Annual Energy Consumption – 3 Cities
Table 3-10: Description of Figures 3-1 to 3-10
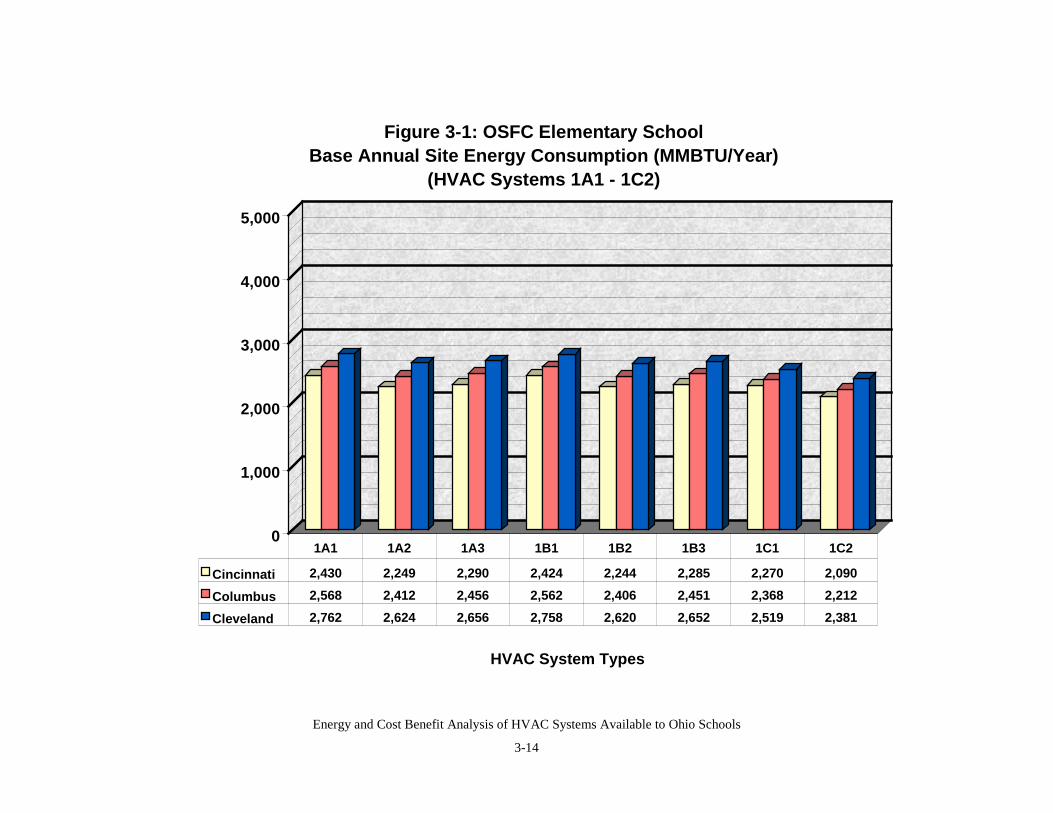
Energy and Cost Benefit Analysis of HVAC Systems Available to Ohio Schools
3-14
0
1,000
2,000
3,000
4,000
5,000
HVAC System Types
Figure 3-1: OSFC Elementary School Base Annual Site Energy Consumption (MMBTU/Year)
(HVAC Systems 1A1 - 1C2)
Cincinnati 2,430 2,249 2,290 2,424 2,244 2,285 2,270 2,090
Columbus 2,568 2,412 2,456 2,562 2,406 2,451 2,368 2,212
Cleveland 2,762 2,624 2,656 2,758 2,620 2,652 2,519 2,381
1A1 1A2 1A3 1B1 1B2 1B3 1C1 1C2
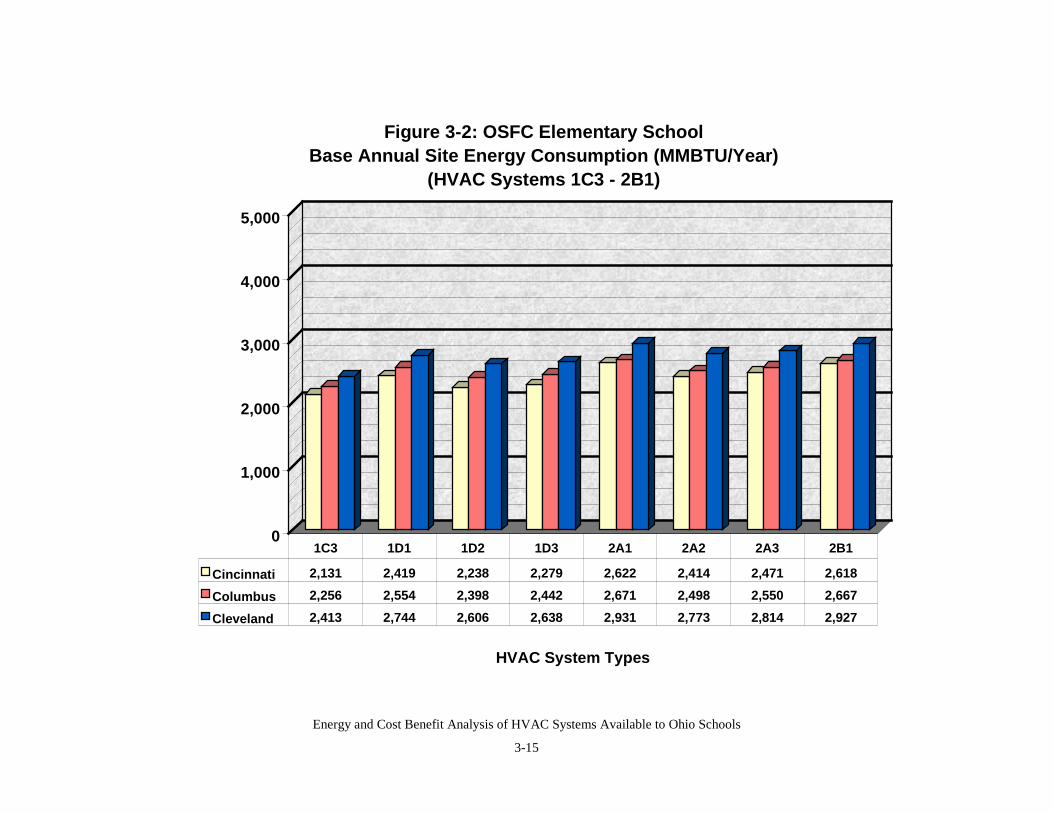
Energy and Cost Benefit Analysis of HVAC Systems Available to Ohio Schools
3-15
0
1,000
2,000
3,000
4,000
5,000
HVAC System Types
Figure 3-2: OSFC Elementary School Base Annual Site Energy Consumption (MMBTU/Year)
(HVAC Systems 1C3 - 2B1)
Cincinnati 2,131 2,419 2,238 2,279 2,622 2,414 2,471 2,618
Columbus 2,256 2,554 2,398 2,442 2,671 2,498 2,550 2,667
Cleveland 2,413 2,744 2,606 2,638 2,931 2,773 2,814 2,927
1C3 1D1 1D2 1D3 2A1 2A2 2A3 2B1
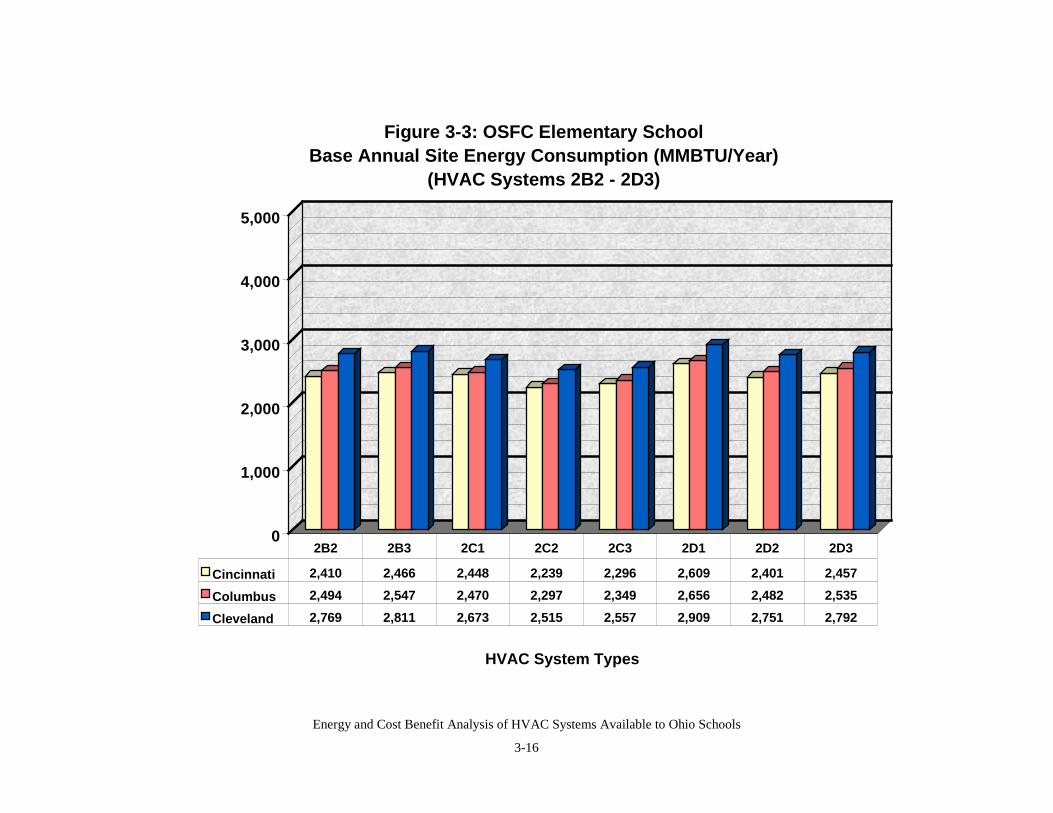
Energy and Cost Benefit Analysis of HVAC Systems Available to Ohio Schools
3-16
0
1,000
2,000
3,000
4,000
5,000
HVAC System Types
Figure 3-3: OSFC Elementary School Base Annual Site Energy Consumption (MMBTU/Year)
(HVAC Systems 2B2 - 2D3)
Cincinnati 2,410 2,466 2,448 2,239 2,296 2,609 2,401 2,457
Columbus 2,494 2,547 2,470 2,297 2,349 2,656 2,482 2,535
Cleveland 2,769 2,811 2,673 2,515 2,557 2,909 2,751 2,792
2B2 2B3 2C1 2C2 2C3 2D1 2D2 2D3
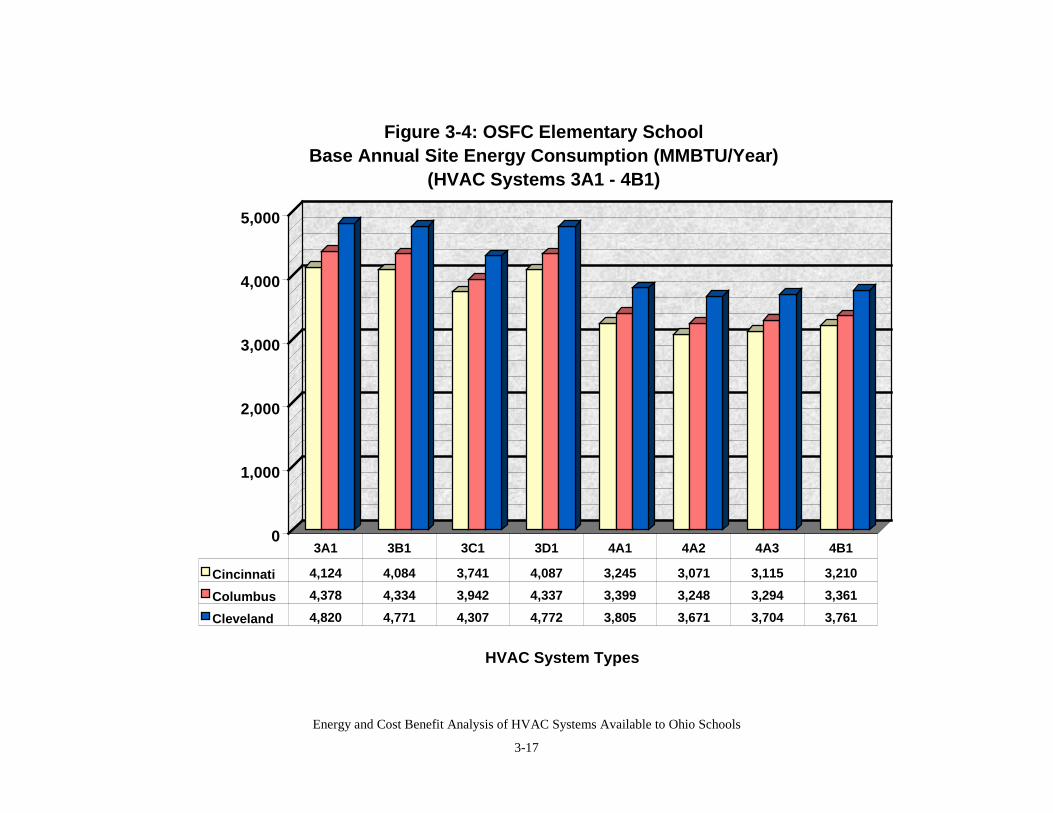
Energy and Cost Benefit Analysis of HVAC Systems Available to Ohio Schools
3-17
0
1,000
2,000
3,000
4,000
5,000
HVAC System Types
Figure 3-4: OSFC Elementary School Base Annual Site Energy Consumption (MMBTU/Year)
(HVAC Systems 3A1 - 4B1)
Cincinnati 4,124 4,084 3,741 4,087 3,245 3,071 3,115 3,210
Columbus 4,378 4,334 3,942 4,337 3,399 3,248 3,294 3,361
Cleveland 4,820 4,771 4,307 4,772 3,805 3,671 3,704 3,761
3A1 3B1 3C1 3D1 4A1 4A2 4A3 4B1
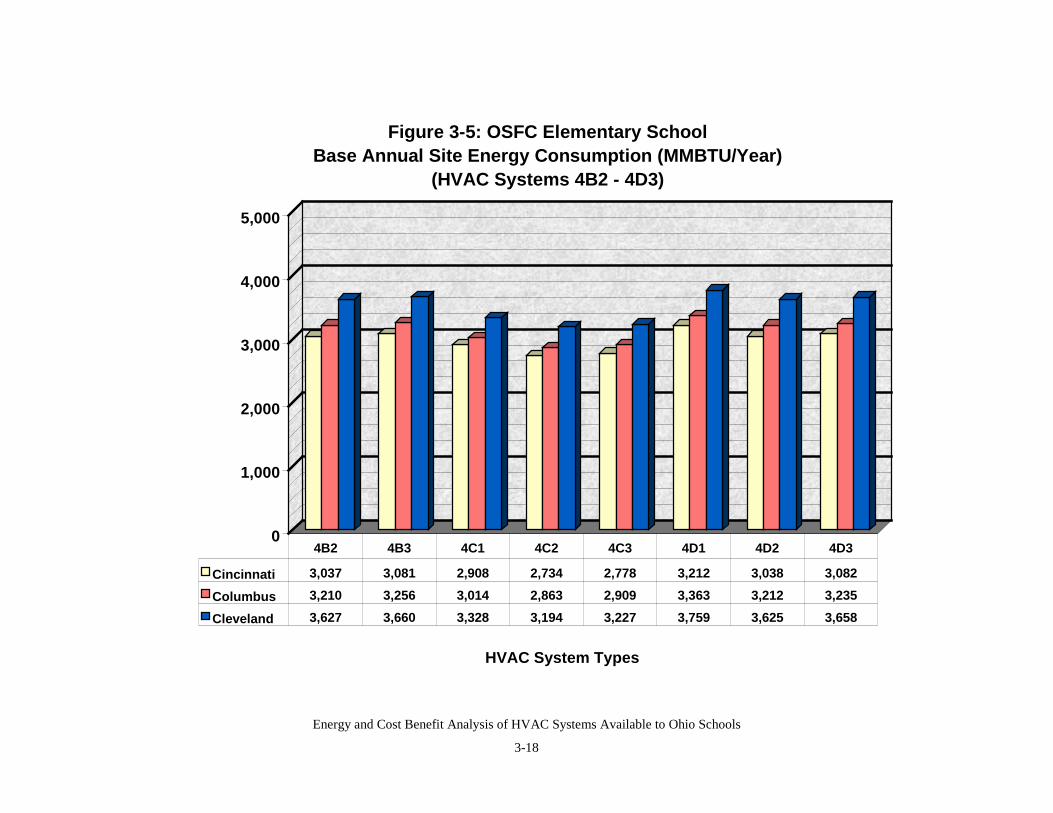
Energy and Cost Benefit Analysis of HVAC Systems Available to Ohio Schools
3-18
0
1,000
2,000
3,000
4,000
5,000
HVAC System Types
Figure 3-5: OSFC Elementary School Base Annual Site Energy Consumption (MMBTU/Year)
(HVAC Systems 4B2 - 4D3)
Cincinnati 3,037 3,081 2,908 2,734 2,778 3,212 3,038 3,082
Columbus 3,210 3,256 3,014 2,863 2,909 3,363 3,212 3,235
Cleveland 3,627 3,660 3,328 3,194 3,227 3,759 3,625 3,658
4B2 4B3 4C1 4C2 4C3 4D1 4D2 4D3
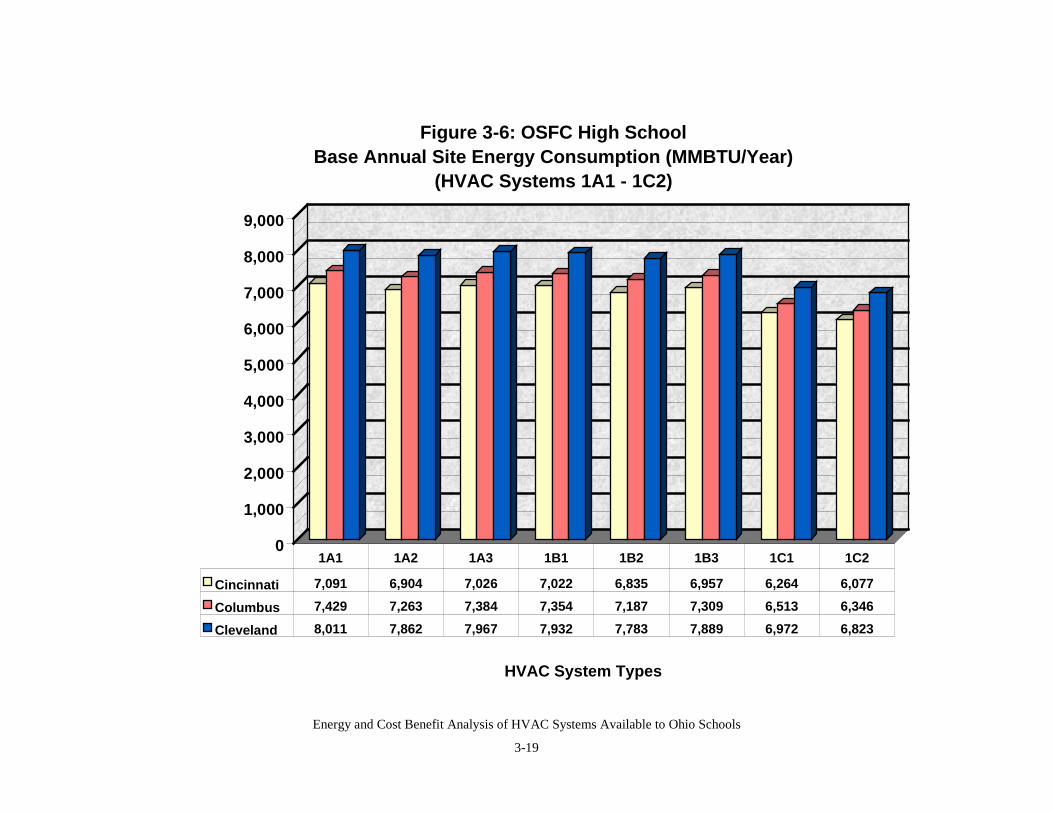
Energy and Cost Benefit Analysis of HVAC Systems Available to Ohio Schools
3-19
0
1,000
2,000
3,000
4,000
5,000
6,000
7,000
8,000
9,000
HVAC System Types
Figure 3-6: OSFC High School Base Annual Site Energy Consumption (MMBTU/Year)
(HVAC Systems 1A1 - 1C2)
Cincinnati 7,091 6,904 7,026 7,022 6,835 6,957 6,264 6,077
Columbus 7,429 7,263 7,384 7,354 7,187 7,309 6,513 6,346
Cleveland 8,011 7,862 7,967 7,932 7,783 7,889 6,972 6,823
1A1 1A2 1A3 1B1 1B2 1B3 1C1 1C2
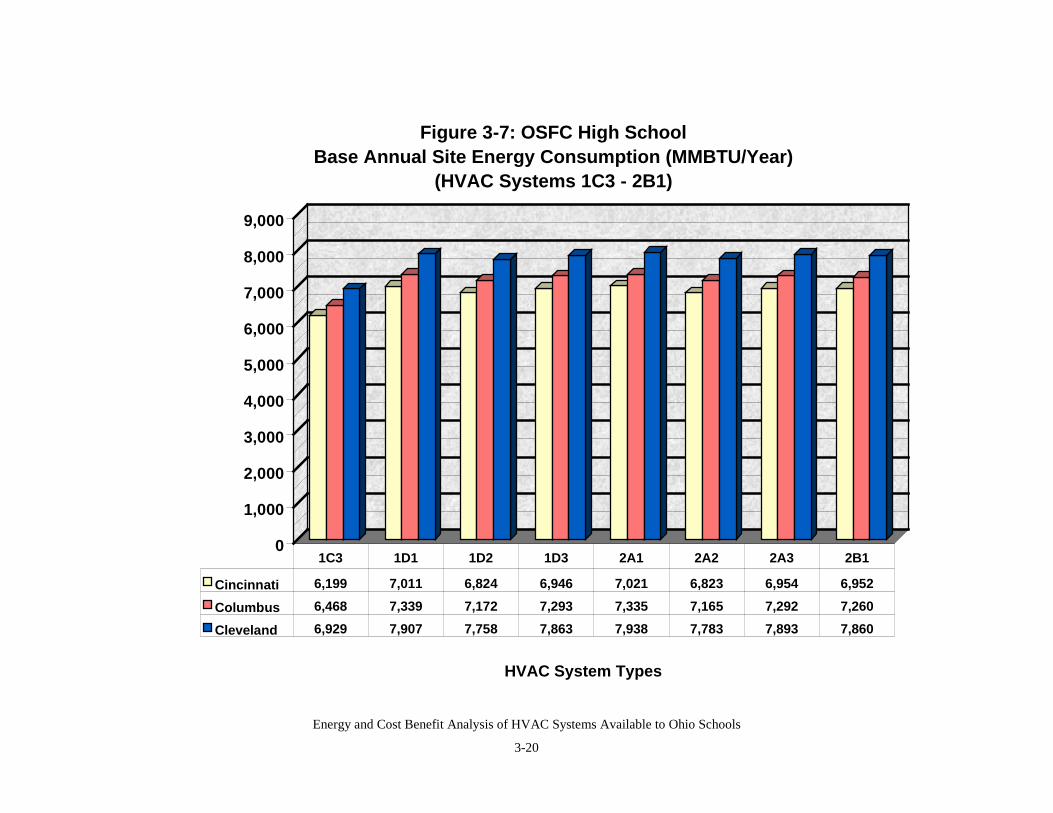
Energy and Cost Benefit Analysis of HVAC Systems Available to Ohio Schools
3-20
0
1,000
2,000
3,000
4,000
5,000
6,000
7,000
8,000
9,000
HVAC System Types
Figure 3-7: OSFC High School Base Annual Site Energy Consumption (MMBTU/Year)
(HVAC Systems 1C3 - 2B1)
Cincinnati 6,199 7,011 6,824 6,946 7,021 6,823 6,954 6,952
Columbus 6,468 7,339 7,172 7,293 7,335 7,165 7,292 7,260
Cleveland 6,929 7,907 7,758 7,863 7,938 7,783 7,893 7,860
1C3 1D1 1D2 1D3 2A1 2A2 2A3 2B1
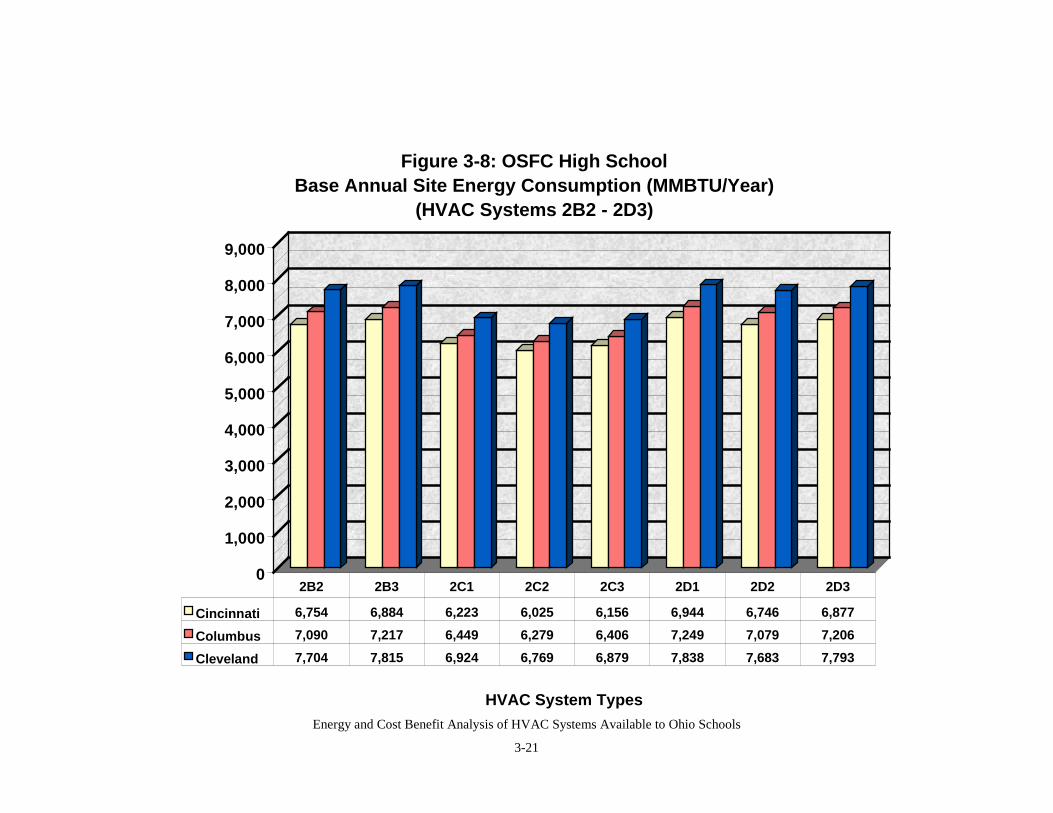
Energy and Cost Benefit Analysis of HVAC Systems Available to Ohio Schools
3-21
0
1,000
2,000
3,000
4,000
5,000
6,000
7,000
8,000
9,000
HVAC System Types
Figure 3-8: OSFC High School Base Annual Site Energy Consumption (MMBTU/Year)
(HVAC Systems 2B2 - 2D3)
Cincinnati 6,754 6,884 6,223 6,025 6,156 6,944 6,746 6,877
Columbus 7,090 7,217 6,449 6,279 6,406 7,249 7,079 7,206
Cleveland 7,704 7,815 6,924 6,769 6,879 7,838 7,683 7,793
2B2 2B3 2C1 2C2 2C3 2D1 2D2 2D3
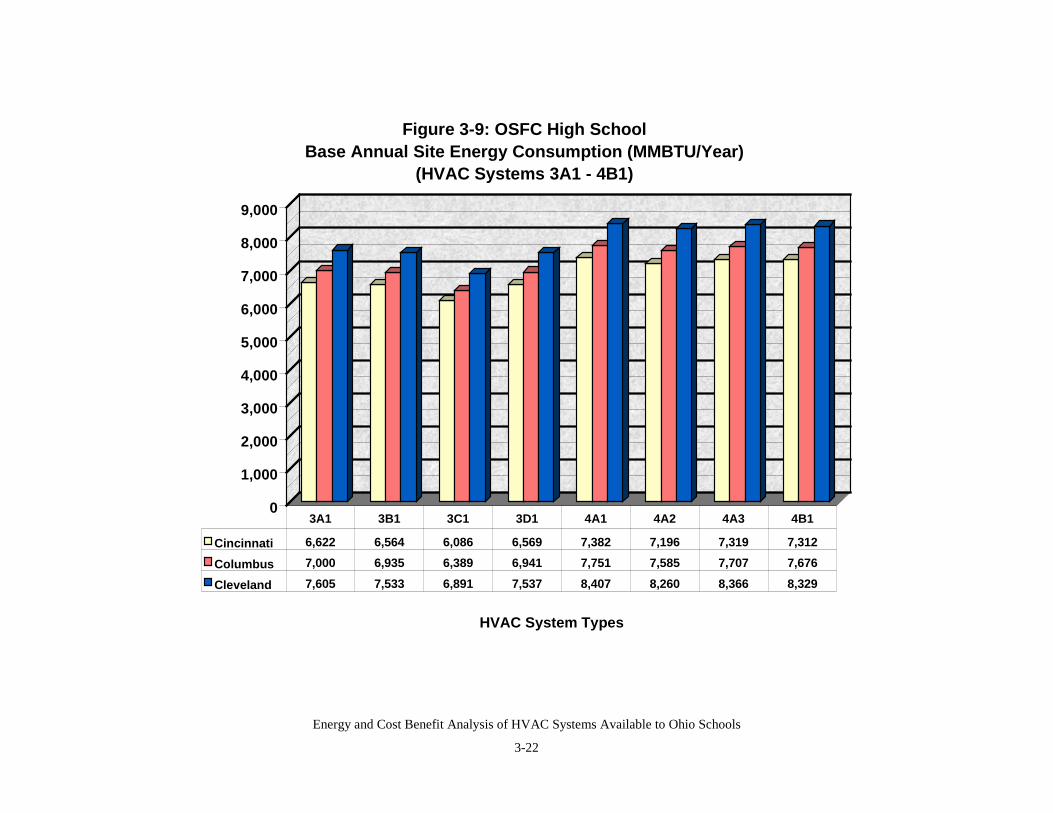
Energy and Cost Benefit Analysis of HVAC Systems Available to Ohio Schools
3-22
0
1,000
2,000
3,000
4,000
5,000
6,000
7,000
8,000
9,000
HVAC System Types
Figure 3-9: OSFC High School Base Annual Site Energy Consumption (MMBTU/Year)
(HVAC Systems 3A1 - 4B1)
Cincinnati 6,622 6,564 6,086 6,569 7,382 7,196 7,319 7,312
Columbus 7,000 6,935 6,389 6,941 7,751 7,585 7,707 7,676
Cleveland 7,605 7,533 6,891 7,537 8,407 8,260 8,366 8,329
3A1 3B1 3C1 3D1 4A1 4A2 4A3 4B1
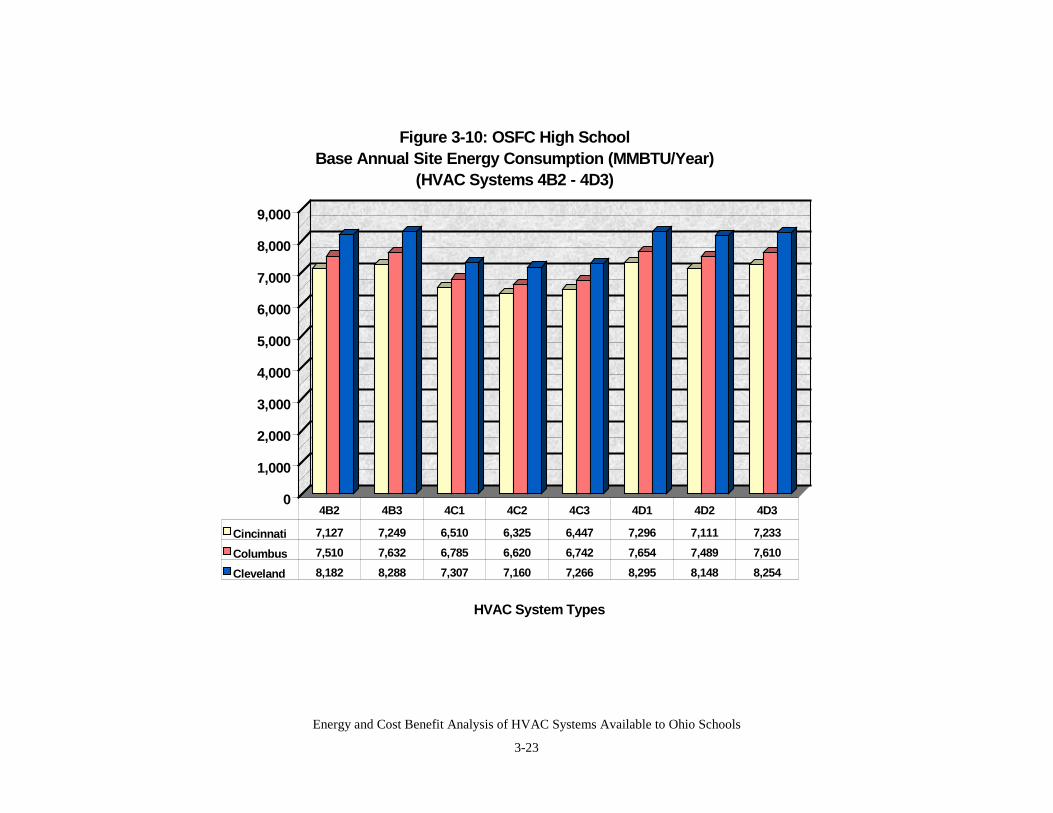
Energy and Cost Benefit Analysis of HVAC Systems Available to Ohio Schools
3-23
0
1,000
2,000
3,000
4,000
5,000
6,000
7,000
8,000
9,000
HVAC System Types
Figure 3-10: OSFC High School Base Annual Site Energy Consumption (MMBTU/Year)
(HVAC Systems 4B2 - 4D3)
Cincinnati 7,127 7,249 6,510 6,325 6,447 7,296 7,111 7,233
Columbus 7,510 7,632 6,785 6,620 6,742 7,654 7,489 7,610
Cleveland 8,182 8,288 7,307 7,160 7,266 8,295 8,148 8,254
4B2 4B3 4C1 4C2 4C3 4D1 4D2 4D3
Energy and Cost Benefit Analysis of HVAC Systems Available to Ohio Schools
3-24
3.2 Baseline Annual Site Energy Costs
Table 3-11 summarizes site energy consumption in units of $/Year by school type and location.Table 3-12 presents the same data on a per-square-foot basis.
For both the elementary and high school, annual site energy costs are highest in Cleveland andlowest in Columbus. Elementary school annual energy consumption ranged from a low of$54,763/year (Columbus, HVAC Option 1B3) to a high of $182,459/year (Cleveland, HVACOption 3C1). High school annual site energy costs ranged from a low of $114,503/year(Columbus, HVAC Option 1B2) to a high of $295,197/year (Cleveland, HVAC Option 4C1).Sorts of annual site energy data, by elementary school and high school, are presented in Tables3-13 and 3-14. As might be expected, the rankings of HVAC system by annual energy costparallel source energy consumption. The HVAC systems with the lowest annual energy coststended to have gas heating combined with water-cooled screw or centrifugal chillers for coolingand VAV with reheat air systems. The HVAC systems with the greatest annual energy costswere the all-electric (heating and cooling) systems. This was due primarily to relatively higherelectric demand costs for these systems.
For the elementary school, the ratio of the highest annual energy cost HVAC system to thelowest HVAC system was 1.90 to 2.72 for the three cities. Thus, the highest energy consumingelementary school HVAC systems would cost a district 90 to 172% more than the lowest annualenergy cost HVAC systems. For the high school, the ratio of the highest annual energy costHVAC system to the lowest HVAC system was 1.56 to 2.03 for the three cities. Thus, thehighest energy consuming high school HVAC systems used 56 to 103% more source energy thanthe lowest energy consuming HVAC systems. Differences between these systems are drivenprimarily by differences in rate structures, electrical demand and weather data (heating andcooling degree-days) between the cities.
Elementary school annual specific energy consumption ranged from a low of $0.85 $/Ft2/Year(Columbus, HVAC Option 1B3) to a high of $2.83 $/Ft2/Year (Cleveland, HVAC Option 3C1).High school annual site energy costs ranged from a low of $0.95 $/Ft2/Year (Columbus, HVACOption 1B2) to a high of $2.45 $/Ft2/Year (Cleveland, HVAC Option 4C1).

Energy and Cost Benefit Analysis of HVAC Systems Available to Ohio Schools
3-25
Elementary School High SchoolHVACSystemOption Cincinnati Cleveland Columbus Cincinnati Cleveland Columbus
1A1 $87,169 $78,352 $65,656 $150,390 $161,542 $120,884
1A2 $66,349 $70,705 $57,092 $135,594 $154,039 $114,784
1A3 $65,195 $70,678 $54,783 $127,977 $155,961 $114,999
1B1 $87,166 $78,602 $65,634 $150,102 $161,370 $120,476
1B2 $66,347 $70,954 $57,071 $135,306 $153,866 $114,503
1B3 $65,192 $70,925 $54,763 $127,689 $155,788 $114,718
1C1 $89,427 $110,225 $77,472 $193,683 $281,848 $218,221
1C2 $74,708 $102,588 $73,858 $186,206 $275,502 $216,979
1C3 $74,086 $102,543 $73,174 $183,552 $277,801 $217,885
1D1 $87,884 $78,789 $65,659 $153,906 $161,767 $120,742
1D2 $67,066 $71,147 $57,095 $139,110 $154,263 $114,844
1D3 $65,911 $71,120 $54,789 $131,493 $156,184 $115,058
2A1 $89,457 $83,248 $68,928 $152,450 $163,705 $123,030
2A2 $68,656 $74,277 $58,520 $136,799 $156,075 $116,193
2A3 $67,265 $74,624 $57,690 $129,290 $157,890 $116,542
2B1 $89,461 $83,490 $68,919 $152,158 $163,507 $122,620
2B2 $68,661 $74,139 $58,510 $136,507 $155,885 $115,896
2B3 $67,269 $74,866 $57,680 $128,997 $157,693 $116,244
2C1 $92,196 $115,418 $80,535 $193,087 $279,580 $215,423
2C2 $77,072 $106,311 $75,998 $184,590 $272,330 $214,157
2C3 $76,454 $107,030 $75,826 $182,118 $274,737 $215,102
2D1 $90,256 $83,663 $68,926 $155,819 $163,912 $122,894
2D2 $69,456 $74,312 $58,518 $140,169 $156,283 $116,240
2D3 $68,065 $75,040 $57,688 $132,659 $158,097 $116,588
3A1 $90,051 $120,475 $88,973 $144,017 $196,519 $140,739
3B1 $89,938 $120,354 $88,830 $143,814 $196,383 $140,477
3C1 $124,060 $182,459 $149,204 $190,656 $284,280 $225,636
3D1 $91,678 $120,629 $89,075 $146,250 $196,755 $142,002
4A1 $88,793 $88,495 $69,675 $150,065 $165,214 $121,845
4A2 $70,525 $81,235 $61,870 $136,064 $157,883 $116,721
4A3 $68,508 $81,222 $60,607 $128,554 $159,872 $117,082
4B1 $88,646 $88,401 $69,465 $149,780 $165,075 $121,441
4B2 $70,378 $81,142 $61,703 $135,780 $157,744 $116,443
4B3 $68,361 $81,128 $60,488 $128,272 $159,733 $116,805
4C1 $111,054 $150,870 $125,405 $199,590 $295,197 $232,238
4C2 $99,623 $143,608 $124,280 $192,663 $289,156 $231,004
4C3 $98,536 $143,586 $124,622 $190,180 $291,485 $231,912
4D1 $90,138 $88,660 $69,609 $153,802 $165,443 $121,695
4D2 $71,870 $81,400 $61,877 $139,801 $158,119 $116,772
4D3 $69,854 $81,386 $60,564 $132,293 $160,108 $117,135
Table 3-11: Baseline Annual Site Energy Cost ($/Year) by HVACSystem Option, School Type and Location
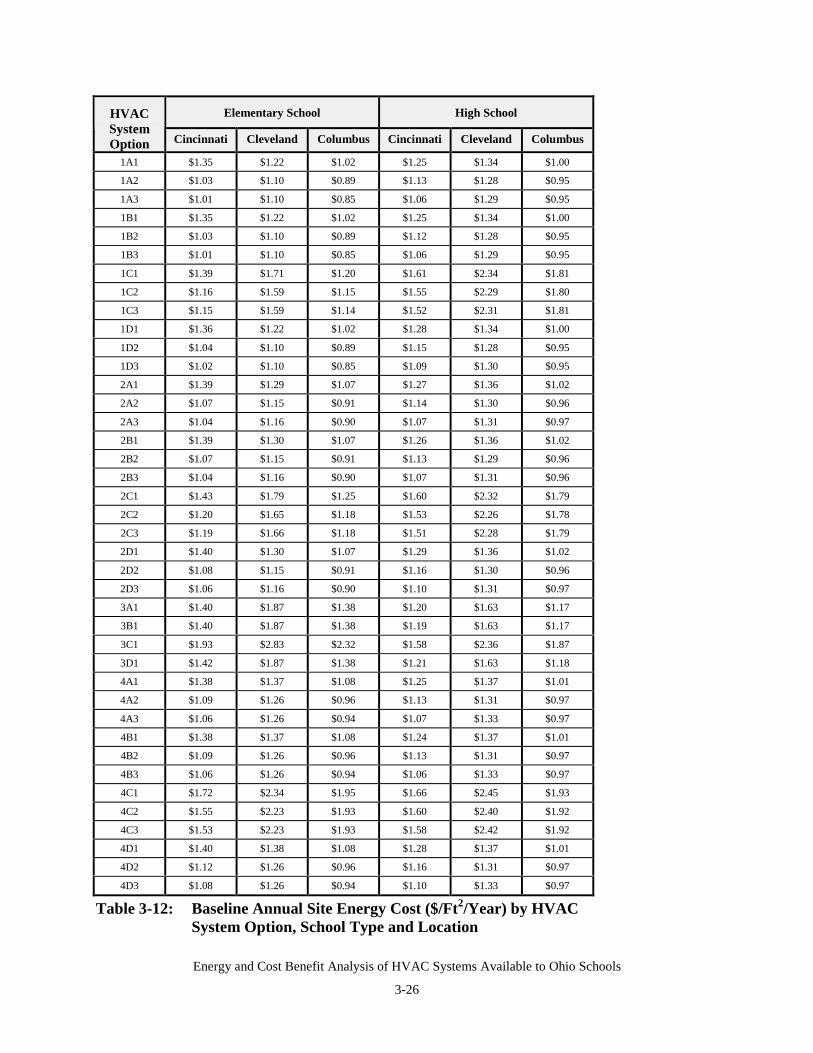
Energy and Cost Benefit Analysis of HVAC Systems Available to Ohio Schools
3-26
Elementary School High SchoolHVACSystemOption Cincinnati Cleveland Columbus Cincinnati Cleveland Columbus
1A1 $1.35 $1.22 $1.02 $1.25 $1.34 $1.00
1A2 $1.03 $1.10 $0.89 $1.13 $1.28 $0.95
1A3 $1.01 $1.10 $0.85 $1.06 $1.29 $0.95
1B1 $1.35 $1.22 $1.02 $1.25 $1.34 $1.00
1B2 $1.03 $1.10 $0.89 $1.12 $1.28 $0.95
1B3 $1.01 $1.10 $0.85 $1.06 $1.29 $0.95
1C1 $1.39 $1.71 $1.20 $1.61 $2.34 $1.81
1C2 $1.16 $1.59 $1.15 $1.55 $2.29 $1.80
1C3 $1.15 $1.59 $1.14 $1.52 $2.31 $1.81
1D1 $1.36 $1.22 $1.02 $1.28 $1.34 $1.00
1D2 $1.04 $1.10 $0.89 $1.15 $1.28 $0.95
1D3 $1.02 $1.10 $0.85 $1.09 $1.30 $0.95
2A1 $1.39 $1.29 $1.07 $1.27 $1.36 $1.02
2A2 $1.07 $1.15 $0.91 $1.14 $1.30 $0.96
2A3 $1.04 $1.16 $0.90 $1.07 $1.31 $0.97
2B1 $1.39 $1.30 $1.07 $1.26 $1.36 $1.02
2B2 $1.07 $1.15 $0.91 $1.13 $1.29 $0.96
2B3 $1.04 $1.16 $0.90 $1.07 $1.31 $0.96
2C1 $1.43 $1.79 $1.25 $1.60 $2.32 $1.79
2C2 $1.20 $1.65 $1.18 $1.53 $2.26 $1.78
2C3 $1.19 $1.66 $1.18 $1.51 $2.28 $1.79
2D1 $1.40 $1.30 $1.07 $1.29 $1.36 $1.02
2D2 $1.08 $1.15 $0.91 $1.16 $1.30 $0.96
2D3 $1.06 $1.16 $0.90 $1.10 $1.31 $0.97
3A1 $1.40 $1.87 $1.38 $1.20 $1.63 $1.17
3B1 $1.40 $1.87 $1.38 $1.19 $1.63 $1.17
3C1 $1.93 $2.83 $2.32 $1.58 $2.36 $1.87
3D1 $1.42 $1.87 $1.38 $1.21 $1.63 $1.18
4A1 $1.38 $1.37 $1.08 $1.25 $1.37 $1.01
4A2 $1.09 $1.26 $0.96 $1.13 $1.31 $0.97
4A3 $1.06 $1.26 $0.94 $1.07 $1.33 $0.97
4B1 $1.38 $1.37 $1.08 $1.24 $1.37 $1.01
4B2 $1.09 $1.26 $0.96 $1.13 $1.31 $0.97
4B3 $1.06 $1.26 $0.94 $1.06 $1.33 $0.97
4C1 $1.72 $2.34 $1.95 $1.66 $2.45 $1.93
4C2 $1.55 $2.23 $1.93 $1.60 $2.40 $1.92
4C3 $1.53 $2.23 $1.93 $1.58 $2.42 $1.92
4D1 $1.40 $1.38 $1.08 $1.28 $1.37 $1.01
4D2 $1.12 $1.26 $0.96 $1.16 $1.31 $0.97
4D3 $1.08 $1.26 $0.94 $1.10 $1.33 $0.97
Table 3-12: Baseline Annual Site Energy Cost ($/Ft2/Year) by HVACSystem Option, School Type and Location
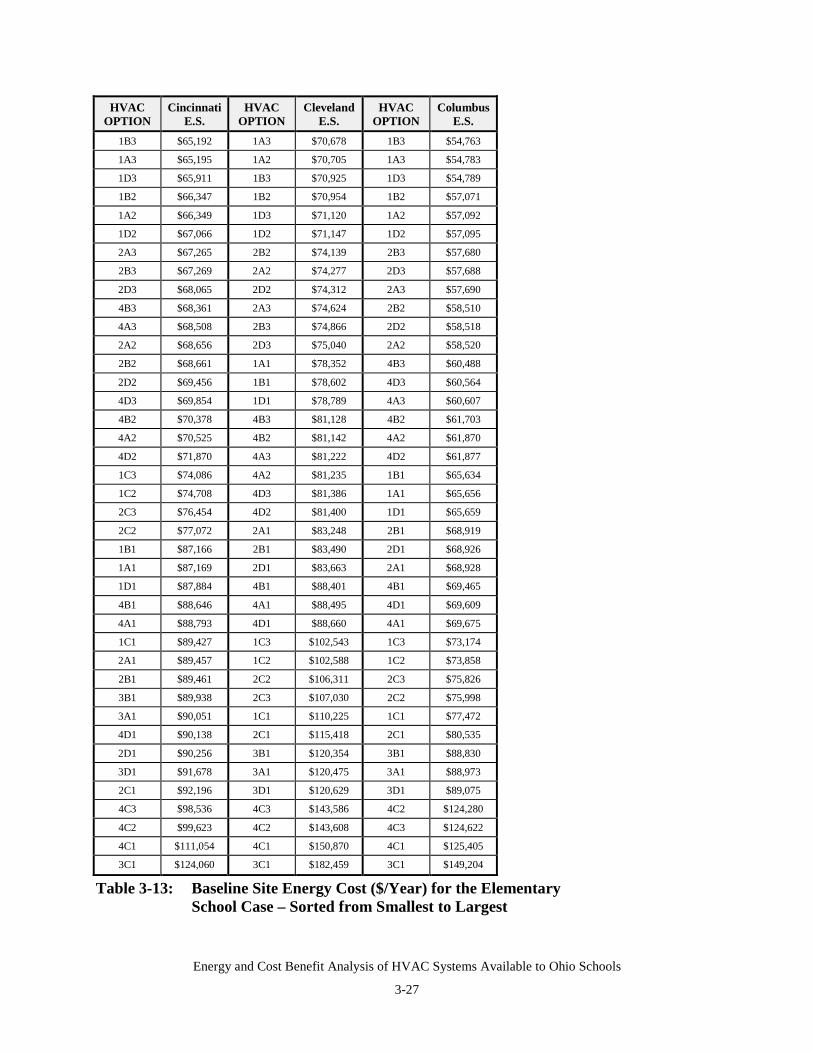
Energy and Cost Benefit Analysis of HVAC Systems Available to Ohio Schools
3-27
HVACOPTION
CincinnatiE.S.
HVACOPTION
ClevelandE.S.
HVACOPTION
ColumbusE.S.
1B3 $65,192 1A3 $70,678 1B3 $54,763
1A3 $65,195 1A2 $70,705 1A3 $54,783
1D3 $65,911 1B3 $70,925 1D3 $54,789
1B2 $66,347 1B2 $70,954 1B2 $57,071
1A2 $66,349 1D3 $71,120 1A2 $57,092
1D2 $67,066 1D2 $71,147 1D2 $57,095
2A3 $67,265 2B2 $74,139 2B3 $57,680
2B3 $67,269 2A2 $74,277 2D3 $57,688
2D3 $68,065 2D2 $74,312 2A3 $57,690
4B3 $68,361 2A3 $74,624 2B2 $58,510
4A3 $68,508 2B3 $74,866 2D2 $58,518
2A2 $68,656 2D3 $75,040 2A2 $58,520
2B2 $68,661 1A1 $78,352 4B3 $60,488
2D2 $69,456 1B1 $78,602 4D3 $60,564
4D3 $69,854 1D1 $78,789 4A3 $60,607
4B2 $70,378 4B3 $81,128 4B2 $61,703
4A2 $70,525 4B2 $81,142 4A2 $61,870
4D2 $71,870 4A3 $81,222 4D2 $61,877
1C3 $74,086 4A2 $81,235 1B1 $65,634
1C2 $74,708 4D3 $81,386 1A1 $65,656
2C3 $76,454 4D2 $81,400 1D1 $65,659
2C2 $77,072 2A1 $83,248 2B1 $68,919
1B1 $87,166 2B1 $83,490 2D1 $68,926
1A1 $87,169 2D1 $83,663 2A1 $68,928
1D1 $87,884 4B1 $88,401 4B1 $69,465
4B1 $88,646 4A1 $88,495 4D1 $69,609
4A1 $88,793 4D1 $88,660 4A1 $69,675
1C1 $89,427 1C3 $102,543 1C3 $73,174
2A1 $89,457 1C2 $102,588 1C2 $73,858
2B1 $89,461 2C2 $106,311 2C3 $75,826
3B1 $89,938 2C3 $107,030 2C2 $75,998
3A1 $90,051 1C1 $110,225 1C1 $77,472
4D1 $90,138 2C1 $115,418 2C1 $80,535
2D1 $90,256 3B1 $120,354 3B1 $88,830
3D1 $91,678 3A1 $120,475 3A1 $88,973
2C1 $92,196 3D1 $120,629 3D1 $89,075
4C3 $98,536 4C3 $143,586 4C2 $124,280
4C2 $99,623 4C2 $143,608 4C3 $124,622
4C1 $111,054 4C1 $150,870 4C1 $125,405
3C1 $124,060 3C1 $182,459 3C1 $149,204
Table 3-13: Baseline Site Energy Cost ($/Year) for the ElementarySchool Case – Sorted from Smallest to Largest
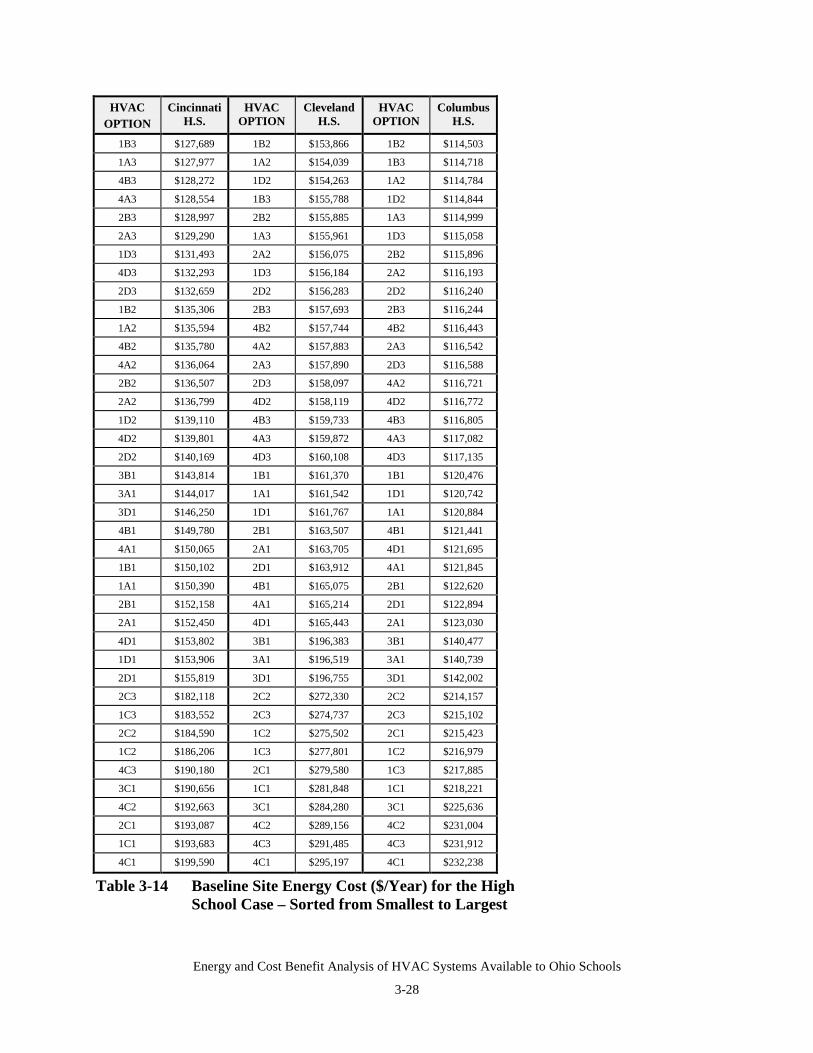
Energy and Cost Benefit Analysis of HVAC Systems Available to Ohio Schools
3-28
HVACOPTION
CincinnatiH.S.
HVACOPTION
ClevelandH.S.
HVACOPTION
ColumbusH.S.
1B3 $127,689 1B2 $153,866 1B2 $114,503
1A3 $127,977 1A2 $154,039 1B3 $114,718
4B3 $128,272 1D2 $154,263 1A2 $114,784
4A3 $128,554 1B3 $155,788 1D2 $114,844
2B3 $128,997 2B2 $155,885 1A3 $114,999
2A3 $129,290 1A3 $155,961 1D3 $115,058
1D3 $131,493 2A2 $156,075 2B2 $115,896
4D3 $132,293 1D3 $156,184 2A2 $116,193
2D3 $132,659 2D2 $156,283 2D2 $116,240
1B2 $135,306 2B3 $157,693 2B3 $116,244
1A2 $135,594 4B2 $157,744 4B2 $116,443
4B2 $135,780 4A2 $157,883 2A3 $116,542
4A2 $136,064 2A3 $157,890 2D3 $116,588
2B2 $136,507 2D3 $158,097 4A2 $116,721
2A2 $136,799 4D2 $158,119 4D2 $116,772
1D2 $139,110 4B3 $159,733 4B3 $116,805
4D2 $139,801 4A3 $159,872 4A3 $117,082
2D2 $140,169 4D3 $160,108 4D3 $117,135
3B1 $143,814 1B1 $161,370 1B1 $120,476
3A1 $144,017 1A1 $161,542 1D1 $120,742
3D1 $146,250 1D1 $161,767 1A1 $120,884
4B1 $149,780 2B1 $163,507 4B1 $121,441
4A1 $150,065 2A1 $163,705 4D1 $121,695
1B1 $150,102 2D1 $163,912 4A1 $121,845
1A1 $150,390 4B1 $165,075 2B1 $122,620
2B1 $152,158 4A1 $165,214 2D1 $122,894
2A1 $152,450 4D1 $165,443 2A1 $123,030
4D1 $153,802 3B1 $196,383 3B1 $140,477
1D1 $153,906 3A1 $196,519 3A1 $140,739
2D1 $155,819 3D1 $196,755 3D1 $142,002
2C3 $182,118 2C2 $272,330 2C2 $214,157
1C3 $183,552 2C3 $274,737 2C3 $215,102
2C2 $184,590 1C2 $275,502 2C1 $215,423
1C2 $186,206 1C3 $277,801 1C2 $216,979
4C3 $190,180 2C1 $279,580 1C3 $217,885
3C1 $190,656 1C1 $281,848 1C1 $218,221
4C2 $192,663 3C1 $284,280 3C1 $225,636
2C1 $193,087 4C2 $289,156 4C2 $231,004
1C1 $193,683 4C3 $291,485 4C3 $231,912
4C1 $199,590 4C1 $295,197 4C1 $232,238
Table 3-14 Baseline Site Energy Cost ($/Year) for the HighSchool Case – Sorted from Smallest to Largest
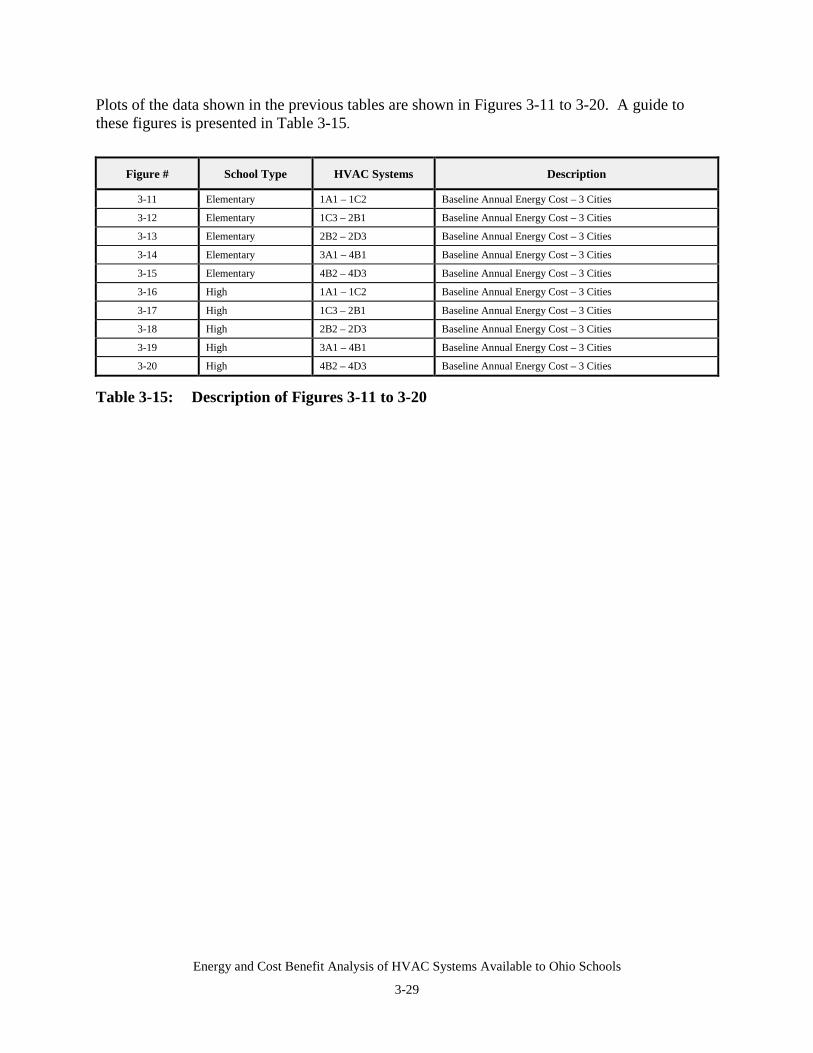
Energy and Cost Benefit Analysis of HVAC Systems Available to Ohio Schools
3-29
Plots of the data shown in the previous tables are shown in Figures 3-11 to 3-20. A guide tothese figures is presented in Table 3-15.
Figure # School Type HVAC Systems Description
3-11 Elementary 1A1 – 1C2 Baseline Annual Energy Cost – 3 Cities
3-12 Elementary 1C3 – 2B1 Baseline Annual Energy Cost – 3 Cities
3-13 Elementary 2B2 – 2D3 Baseline Annual Energy Cost – 3 Cities
3-14 Elementary 3A1 – 4B1 Baseline Annual Energy Cost – 3 Cities
3-15 Elementary 4B2 – 4D3 Baseline Annual Energy Cost – 3 Cities
3-16 High 1A1 – 1C2 Baseline Annual Energy Cost – 3 Cities
3-17 High 1C3 – 2B1 Baseline Annual Energy Cost – 3 Cities
3-18 High 2B2 – 2D3 Baseline Annual Energy Cost – 3 Cities
3-19 High 3A1 – 4B1 Baseline Annual Energy Cost – 3 Cities
3-20 High 4B2 – 4D3 Baseline Annual Energy Cost – 3 Cities
Table 3-15: Description of Figures 3-11 to 3-20
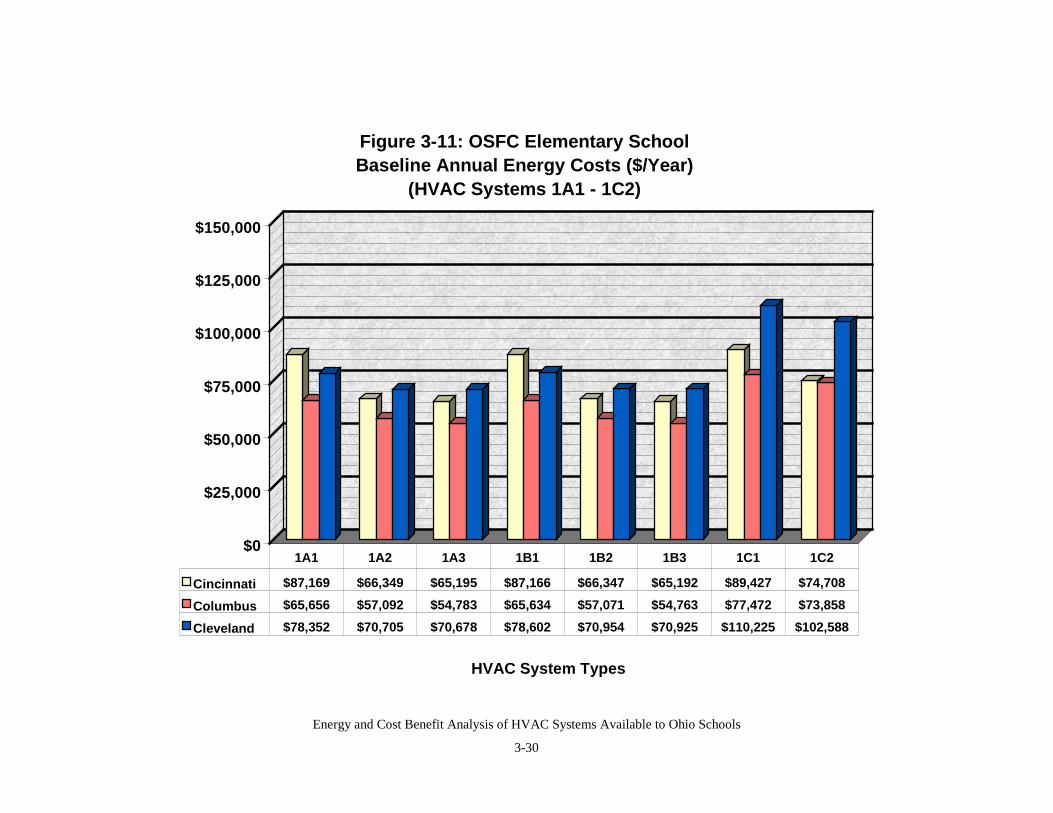
Energy and Cost Benefit Analysis of HVAC Systems Available to Ohio Schools
3-30
$0
$25,000
$50,000
$75,000
$100,000
$125,000
$150,000
HVAC System Types
Figure 3-11: OSFC Elementary School Baseline Annual Energy Costs ($/Year)
(HVAC Systems 1A1 - 1C2)
Cincinnati $87,169 $66,349 $65,195 $87,166 $66,347 $65,192 $89,427 $74,708
Columbus $65,656 $57,092 $54,783 $65,634 $57,071 $54,763 $77,472 $73,858
Cleveland $78,352 $70,705 $70,678 $78,602 $70,954 $70,925 $110,225 $102,588
1A1 1A2 1A3 1B1 1B2 1B3 1C1 1C2
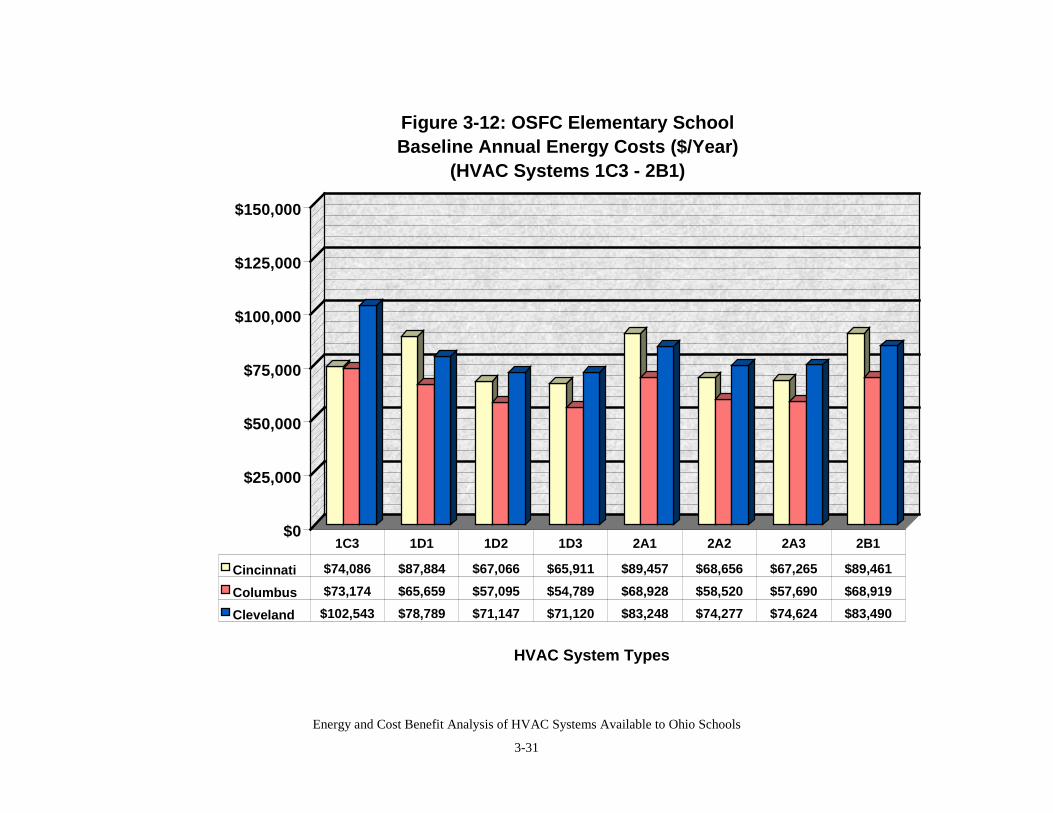
Energy and Cost Benefit Analysis of HVAC Systems Available to Ohio Schools
3-31
$0
$25,000
$50,000
$75,000
$100,000
$125,000
$150,000
HVAC System Types
Figure 3-12: OSFC Elementary School Baseline Annual Energy Costs ($/Year)
(HVAC Systems 1C3 - 2B1)
Cincinnati $74,086 $87,884 $67,066 $65,911 $89,457 $68,656 $67,265 $89,461
Columbus $73,174 $65,659 $57,095 $54,789 $68,928 $58,520 $57,690 $68,919
Cleveland $102,543 $78,789 $71,147 $71,120 $83,248 $74,277 $74,624 $83,490
1C3 1D1 1D2 1D3 2A1 2A2 2A3 2B1
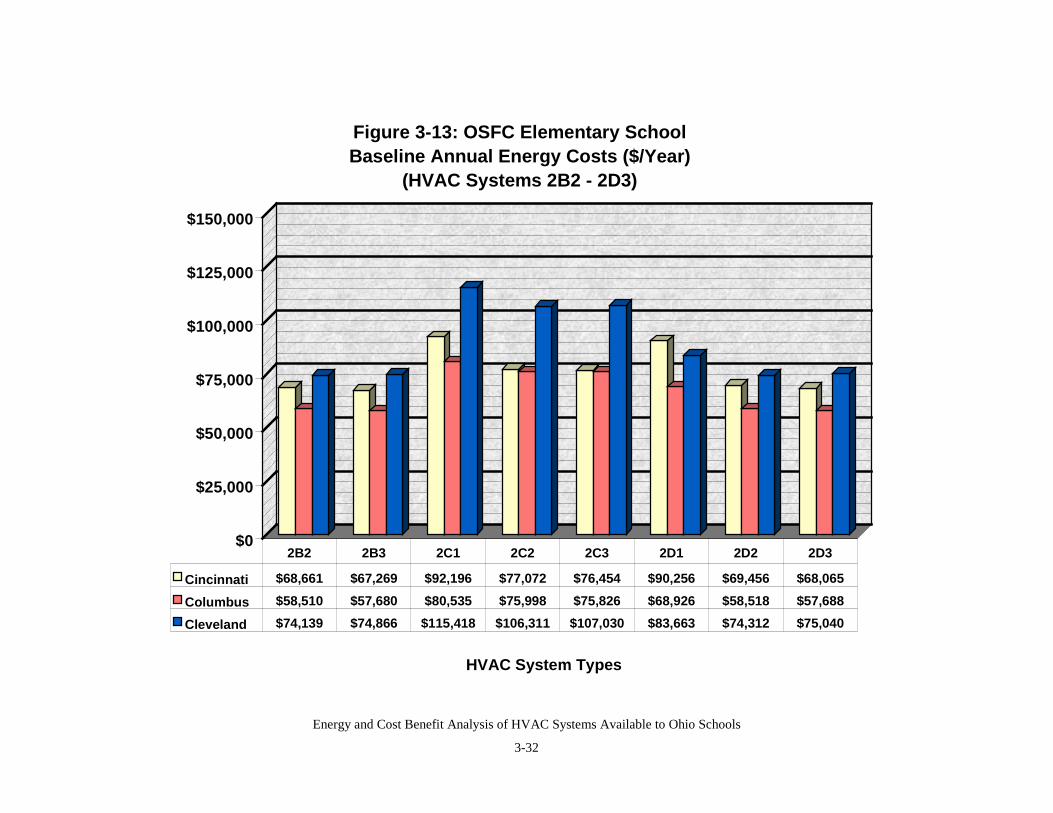
Energy and Cost Benefit Analysis of HVAC Systems Available to Ohio Schools
3-32
$0
$25,000
$50,000
$75,000
$100,000
$125,000
$150,000
HVAC System Types
Figure 3-13: OSFC Elementary School Baseline Annual Energy Costs ($/Year)
(HVAC Systems 2B2 - 2D3)
Cincinnati $68,661 $67,269 $92,196 $77,072 $76,454 $90,256 $69,456 $68,065
Columbus $58,510 $57,680 $80,535 $75,998 $75,826 $68,926 $58,518 $57,688
Cleveland $74,139 $74,866 $115,418 $106,311 $107,030 $83,663 $74,312 $75,040
2B2 2B3 2C1 2C2 2C3 2D1 2D2 2D3
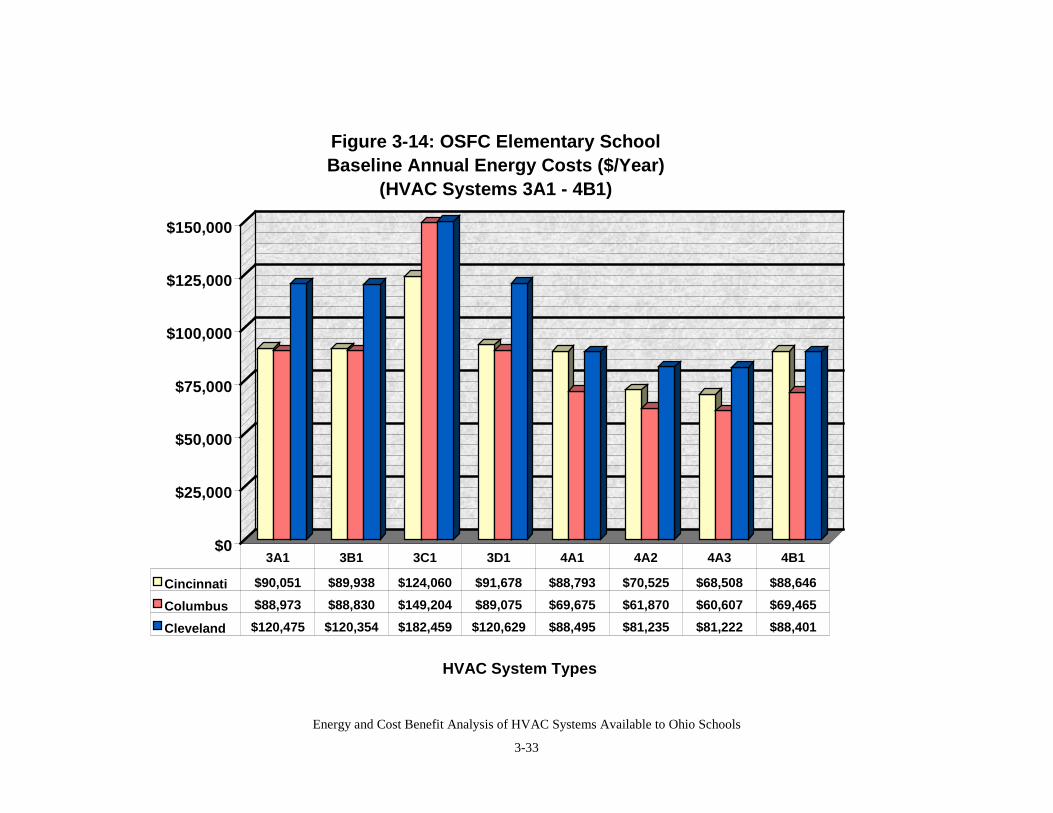
Energy and Cost Benefit Analysis of HVAC Systems Available to Ohio Schools
3-33
$0
$25,000
$50,000
$75,000
$100,000
$125,000
$150,000
HVAC System Types
Figure 3-14: OSFC Elementary School Baseline Annual Energy Costs ($/Year)
(HVAC Systems 3A1 - 4B1)
Cincinnati $90,051 $89,938 $124,060 $91,678 $88,793 $70,525 $68,508 $88,646
Columbus $88,973 $88,830 $149,204 $89,075 $69,675 $61,870 $60,607 $69,465
Cleveland $120,475 $120,354 $182,459 $120,629 $88,495 $81,235 $81,222 $88,401
3A1 3B1 3C1 3D1 4A1 4A2 4A3 4B1
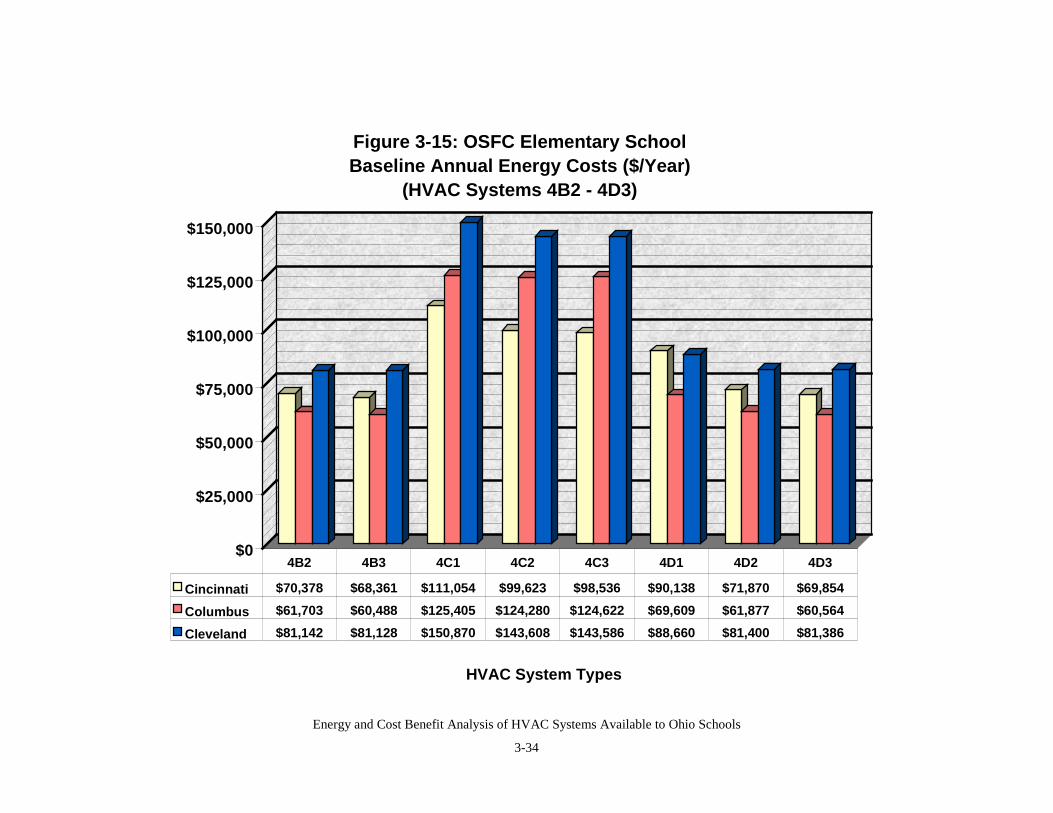
Energy and Cost Benefit Analysis of HVAC Systems Available to Ohio Schools
3-34
$0
$25,000
$50,000
$75,000
$100,000
$125,000
$150,000
HVAC System Types
Figure 3-15: OSFC Elementary School Baseline Annual Energy Costs ($/Year)
(HVAC Systems 4B2 - 4D3)
Cincinnati $70,378 $68,361 $111,054 $99,623 $98,536 $90,138 $71,870 $69,854
Columbus $61,703 $60,488 $125,405 $124,280 $124,622 $69,609 $61,877 $60,564
Cleveland $81,142 $81,128 $150,870 $143,608 $143,586 $88,660 $81,400 $81,386
4B2 4B3 4C1 4C2 4C3 4D1 4D2 4D3
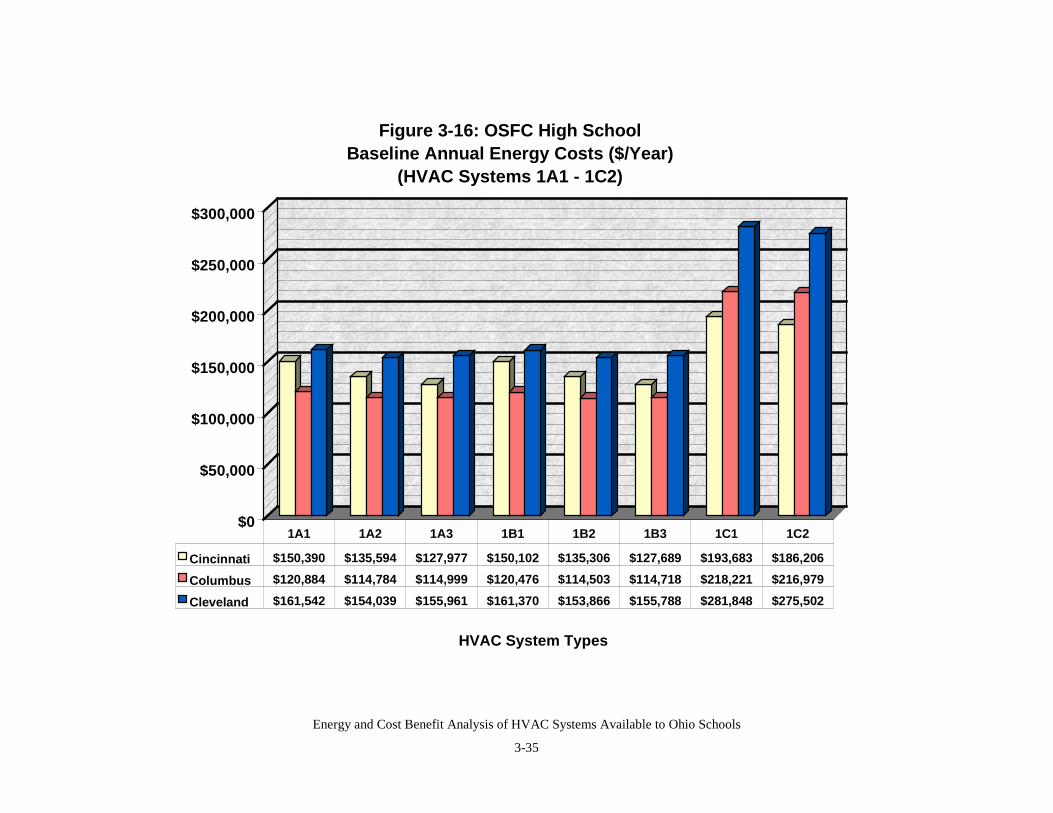
Energy and Cost Benefit Analysis of HVAC Systems Available to Ohio Schools
3-35
$0
$50,000
$100,000
$150,000
$200,000
$250,000
$300,000
HVAC System Types
Figure 3-16: OSFC High School Baseline Annual Energy Costs ($/Year)
(HVAC Systems 1A1 - 1C2)
Cincinnati $150,390 $135,594 $127,977 $150,102 $135,306 $127,689 $193,683 $186,206
Columbus $120,884 $114,784 $114,999 $120,476 $114,503 $114,718 $218,221 $216,979
Cleveland $161,542 $154,039 $155,961 $161,370 $153,866 $155,788 $281,848 $275,502
1A1 1A2 1A3 1B1 1B2 1B3 1C1 1C2
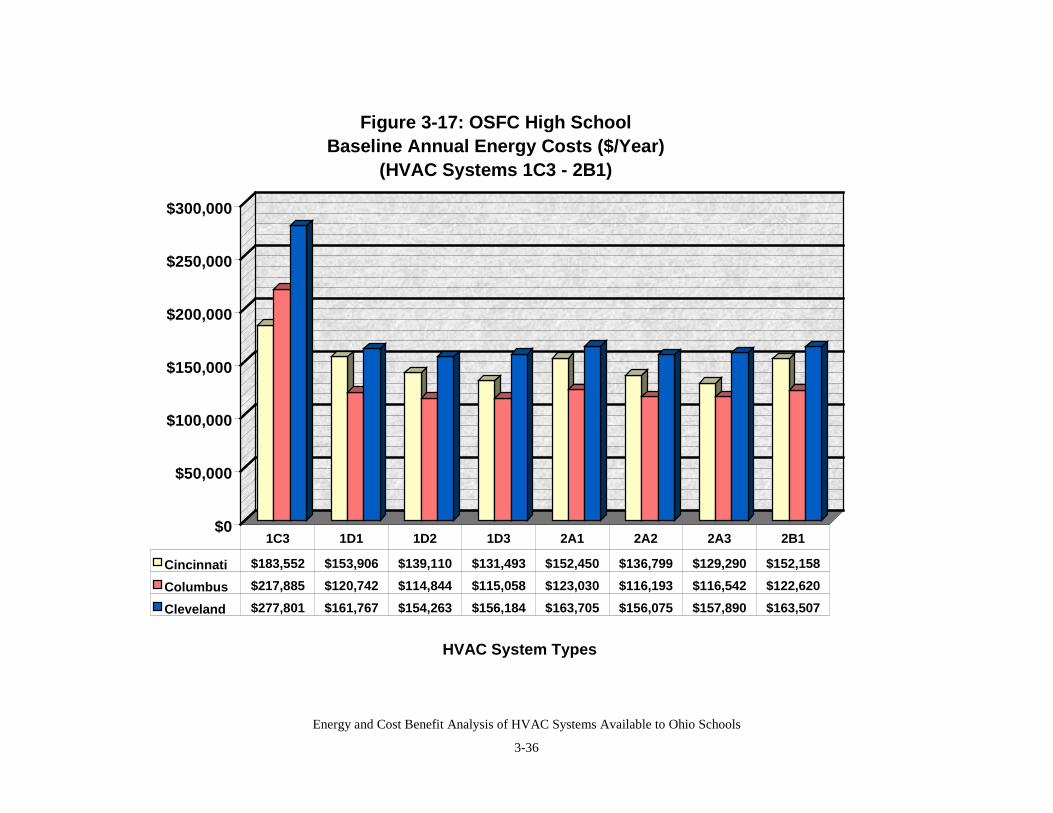
Energy and Cost Benefit Analysis of HVAC Systems Available to Ohio Schools
3-36
$0
$50,000
$100,000
$150,000
$200,000
$250,000
$300,000
HVAC System Types
Figure 3-17: OSFC High School Baseline Annual Energy Costs ($/Year)
(HVAC Systems 1C3 - 2B1)
Cincinnati $183,552 $153,906 $139,110 $131,493 $152,450 $136,799 $129,290 $152,158
Columbus $217,885 $120,742 $114,844 $115,058 $123,030 $116,193 $116,542 $122,620
Cleveland $277,801 $161,767 $154,263 $156,184 $163,705 $156,075 $157,890 $163,507
1C3 1D1 1D2 1D3 2A1 2A2 2A3 2B1
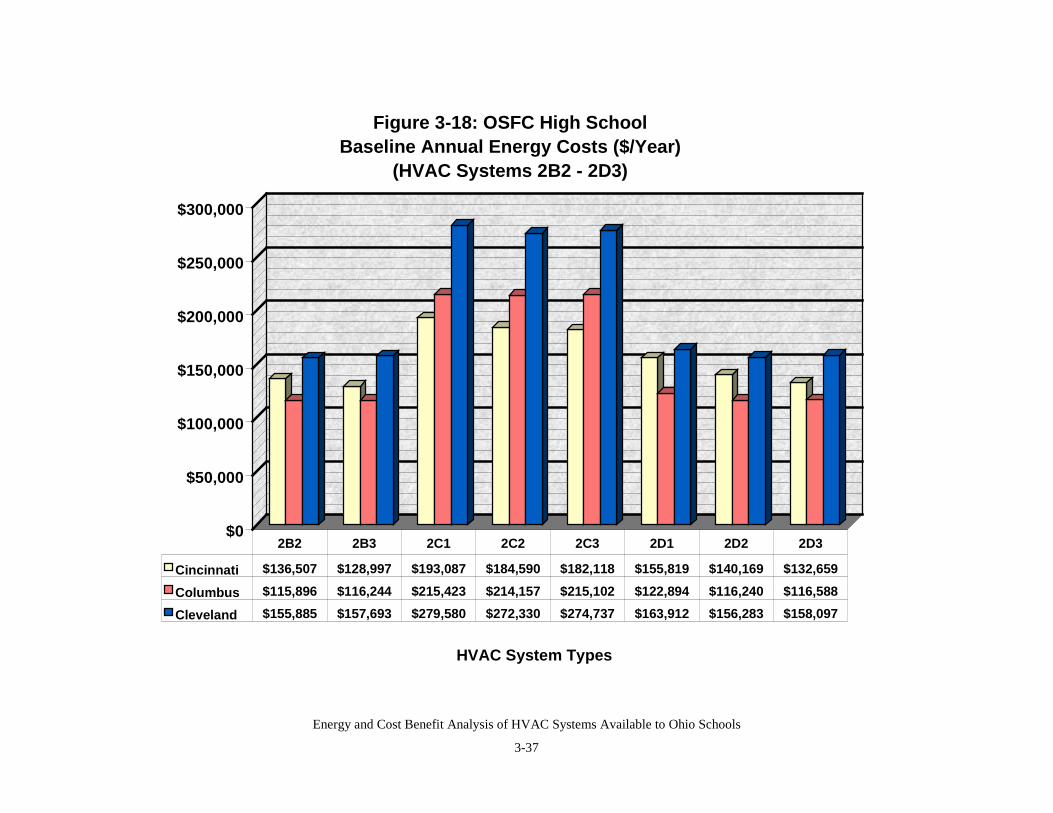
Energy and Cost Benefit Analysis of HVAC Systems Available to Ohio Schools
3-37
$0
$50,000
$100,000
$150,000
$200,000
$250,000
$300,000
HVAC System Types
Figure 3-18: OSFC High School Baseline Annual Energy Costs ($/Year)
(HVAC Systems 2B2 - 2D3)
Cincinnati $136,507 $128,997 $193,087 $184,590 $182,118 $155,819 $140,169 $132,659
Columbus $115,896 $116,244 $215,423 $214,157 $215,102 $122,894 $116,240 $116,588
Cleveland $155,885 $157,693 $279,580 $272,330 $274,737 $163,912 $156,283 $158,097
2B2 2B3 2C1 2C2 2C3 2D1 2D2 2D3
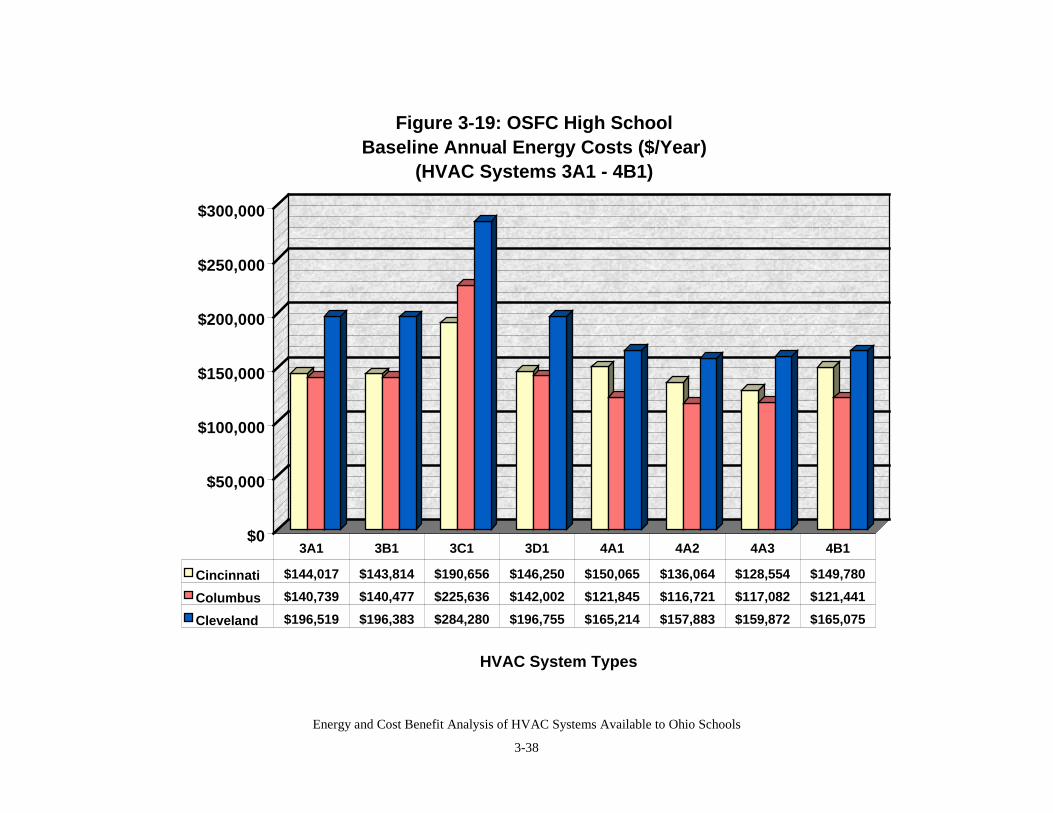
Energy and Cost Benefit Analysis of HVAC Systems Available to Ohio Schools
3-38
$0
$50,000
$100,000
$150,000
$200,000
$250,000
$300,000
HVAC System Types
Figure 3-19: OSFC High School Baseline Annual Energy Costs ($/Year)
(HVAC Systems 3A1 - 4B1)
Cincinnati $144,017 $143,814 $190,656 $146,250 $150,065 $136,064 $128,554 $149,780
Columbus $140,739 $140,477 $225,636 $142,002 $121,845 $116,721 $117,082 $121,441
Cleveland $196,519 $196,383 $284,280 $196,755 $165,214 $157,883 $159,872 $165,075
3A1 3B1 3C1 3D1 4A1 4A2 4A3 4B1
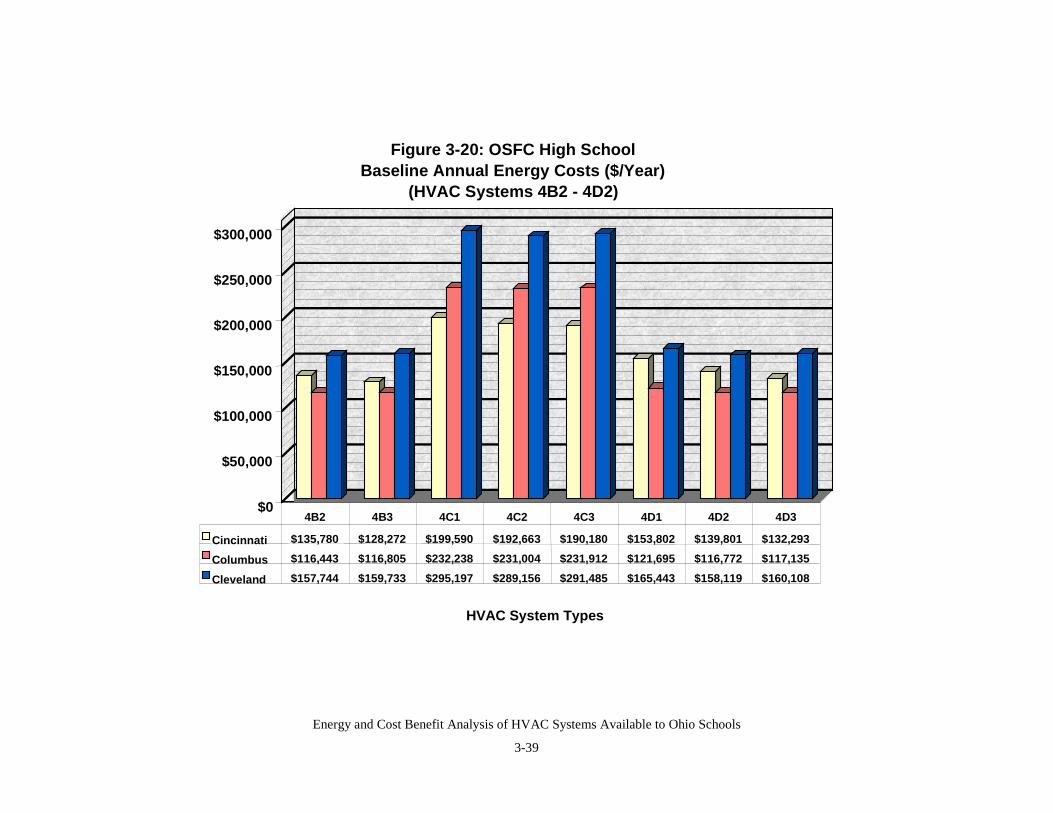
Energy and Cost Benefit Analysis of HVAC Systems Available to Ohio Schools
3-39
$0
$50,000
$100,000
$150,000
$200,000
$250,000
$300,000
HVAC System Types
Figure 3-20: OSFC High SchoolBaseline Annual Energy Costs ($/Year)
(HVAC Systems 4B2 - 4D2)
Cincinnati $135,780 $128,272 $199,590 $192,663 $190,180 $153,802 $139,801 $132,293
Columbus $116,443 $116,805 $232,238 $231,004 $231,912 $121,695 $116,772 $117,135
Cleveland $157,744 $159,733 $295,197 $289,156 $291,485 $165,443 $158,119 $160,108
4B2 4B3 4C1 4C2 4C3 4D1 4D2 4D3
Energy and Cost Benefit Analysis of HVAC Systems Available to Ohio Schools
3-40
To provide further insight into the nature of annual energy costs, plots of annual energy costs byfuel form were produced. An example of such a plot is provided in Figure 3-21; all other casesare shown in Appendix A. For example, the 1A1 case in Figure 3-21 shows an overall annualcost of $65,656. This is based on an annual cost of $0 for fuel oil, $5,374 for natural gas and$60,282 for electricity. Note that only the “D” cases in this figure use fuel oil. In all cases, thecost of electricity dominates overall annual energy costs
3.3 Baseline Data - General Observations
The following general observations were found in reviewing baseline analyses presented in thisChapter:
Baseline results show the VAV reheat system utilizing a natural gas fired boiler and water cooledcentrifugal chiller have the lowest annual energy cost. The lowest cost systems in Columbus andCincinnati use a natural gas fired boiler with a power burner whereas, in Cleveland, the naturalgas boiler employs an atmospheric burner. The highest cost systems are associated with use ofelectric boilers for heating.
The Cleveland data shows that area to have higher annual energy costs than Cincinnati andColumbus for similar HVAC systems; Columbus has the lowest annual energy costs.
VAV reheat and series fan powered VAV tend to operate at a lower annual energy cost than dualduct VAV and WSHP systems. However, in comparing elementary schools to high schools,some high school applications show dual-duct systems performing relatively well from an annualenergy cost standpoint.
Water-cooled chilled water plants operate at lower annual energy cost than their air-cooledcounterparts.
Energy and Cost Benefit Analyses of HVAC Systems Available to Ohio Schools
4-1
4.0 Life-Cycle Analyses for Base Systems
Since annual energy costs only represent a portion of the overall cost of providing spaceconditioning to school buildings, the authors prepared detailed life-cycle costs for each of theHVAC alternatives modeled. This chapter provides an overview of the approach used tocomplete these analyses as well as results from the analyses.
4.1 Approach To Life-Cycle Analyses
Components of the life cycle analyses included:
• Equipment first costs
• Annual energy costs
• Preventive Maintenance (PM) repair and replacement
To maintain consistency in the analyses, major cost data bases were reviewed as part of thiswork. Ultimately, the 2000 edition of RSMeans CostWorks® (RSMeans 2000®) was selectedand used as a database engine for our cost estimates for equipment plant and terminal unit firstcosts and annualized service and maintenance costs. Ductwork costs were obtained fromarchitects and engineers specializing in the design of schools. All national costs were correctedby RSMeans 2000® city cost corrections for each of the three cities considered in this work.These factors were 0.958, 1.044 and 0.977 for Cincinnati, Cleveland and Columbus respectively.
Equipment first costs included three major elements:
• Plant (heating and cooling plant equipment)
• Ductwork
• Terminal units
Plant first costs were derived by developing cost versus size curve-fits from RSMeans 2000®
databases and then applying these curves to the size of the plant equipment for a particularHVAC option. For each of the four heat pump HVAC cases, 76 separate heat pumps were sizedand costed for the elementary school and 99 heat pumps were sized and costed for the highschool. These numbers reflect the number of zones designed into each building. Ductwork costswere based on cost per square foot for the four air systems considered. Terminal units werecosted similarly to the plant equipment, sizing was taken from architect drawing schedules andour own modeling.
Equipment sizes for the baseline cooling and heating plants are shown in Tables 4-1 and 4-2respectively. Baseline plant equipment costs are shown in Tables 4-3 and 4-4 respectively.
Heat pump sizes and first costs are summarized in Table 4-5.
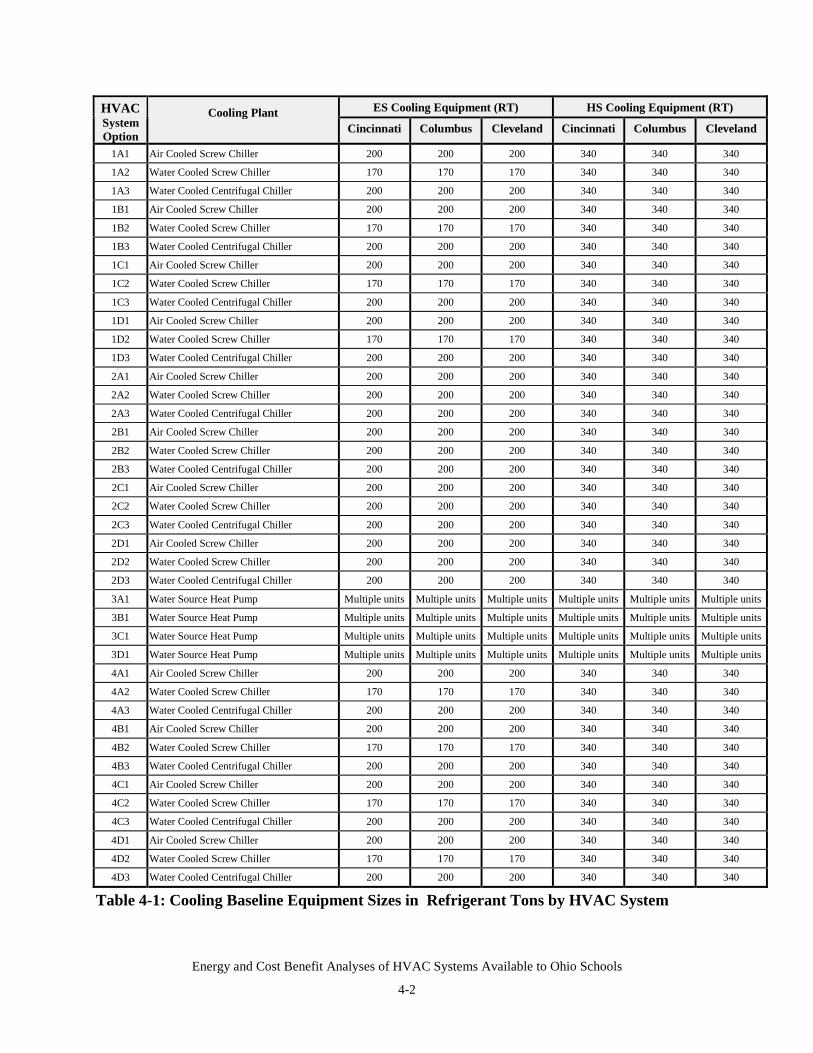
Energy and Cost Benefit Analyses of HVAC Systems Available to Ohio Schools
4-2
ES Cooling Equipment (RT) HS Cooling Equipment (RT)HVACSystemOption
Cooling PlantCincinnati Columbus Cleveland Cincinnati Columbus Cleveland
1A1 Air Cooled Screw Chiller 200 200 200 340 340 340
1A2 Water Cooled Screw Chiller 170 170 170 340 340 340
1A3 Water Cooled Centrifugal Chiller 200 200 200 340 340 340
1B1 Air Cooled Screw Chiller 200 200 200 340 340 340
1B2 Water Cooled Screw Chiller 170 170 170 340 340 340
1B3 Water Cooled Centrifugal Chiller 200 200 200 340 340 340
1C1 Air Cooled Screw Chiller 200 200 200 340 340 340
1C2 Water Cooled Screw Chiller 170 170 170 340 340 340
1C3 Water Cooled Centrifugal Chiller 200 200 200 340 340 340
1D1 Air Cooled Screw Chiller 200 200 200 340 340 340
1D2 Water Cooled Screw Chiller 170 170 170 340 340 340
1D3 Water Cooled Centrifugal Chiller 200 200 200 340 340 340
2A1 Air Cooled Screw Chiller 200 200 200 340 340 340
2A2 Water Cooled Screw Chiller 200 200 200 340 340 340
2A3 Water Cooled Centrifugal Chiller 200 200 200 340 340 340
2B1 Air Cooled Screw Chiller 200 200 200 340 340 340
2B2 Water Cooled Screw Chiller 200 200 200 340 340 340
2B3 Water Cooled Centrifugal Chiller 200 200 200 340 340 340
2C1 Air Cooled Screw Chiller 200 200 200 340 340 340
2C2 Water Cooled Screw Chiller 200 200 200 340 340 340
2C3 Water Cooled Centrifugal Chiller 200 200 200 340 340 340
2D1 Air Cooled Screw Chiller 200 200 200 340 340 340
2D2 Water Cooled Screw Chiller 200 200 200 340 340 340
2D3 Water Cooled Centrifugal Chiller 200 200 200 340 340 340
3A1 Water Source Heat Pump Multiple units Multiple units Multiple units Multiple units Multiple units Multiple units
3B1 Water Source Heat Pump Multiple units Multiple units Multiple units Multiple units Multiple units Multiple units
3C1 Water Source Heat Pump Multiple units Multiple units Multiple units Multiple units Multiple units Multiple units
3D1 Water Source Heat Pump Multiple units Multiple units Multiple units Multiple units Multiple units Multiple units
4A1 Air Cooled Screw Chiller 200 200 200 340 340 340
4A2 Water Cooled Screw Chiller 170 170 170 340 340 340
4A3 Water Cooled Centrifugal Chiller 200 200 200 340 340 340
4B1 Air Cooled Screw Chiller 200 200 200 340 340 340
4B2 Water Cooled Screw Chiller 170 170 170 340 340 340
4B3 Water Cooled Centrifugal Chiller 200 200 200 340 340 340
4C1 Air Cooled Screw Chiller 200 200 200 340 340 340
4C2 Water Cooled Screw Chiller 170 170 170 340 340 340
4C3 Water Cooled Centrifugal Chiller 200 200 200 340 340 340
4D1 Air Cooled Screw Chiller 200 200 200 340 340 340
4D2 Water Cooled Screw Chiller 170 170 170 340 340 340
4D3 Water Cooled Centrifugal Chiller 200 200 200 340 340 340
Table 4-1: Cooling Baseline Equipment Sizes in Refrigerant Tons by HVAC System
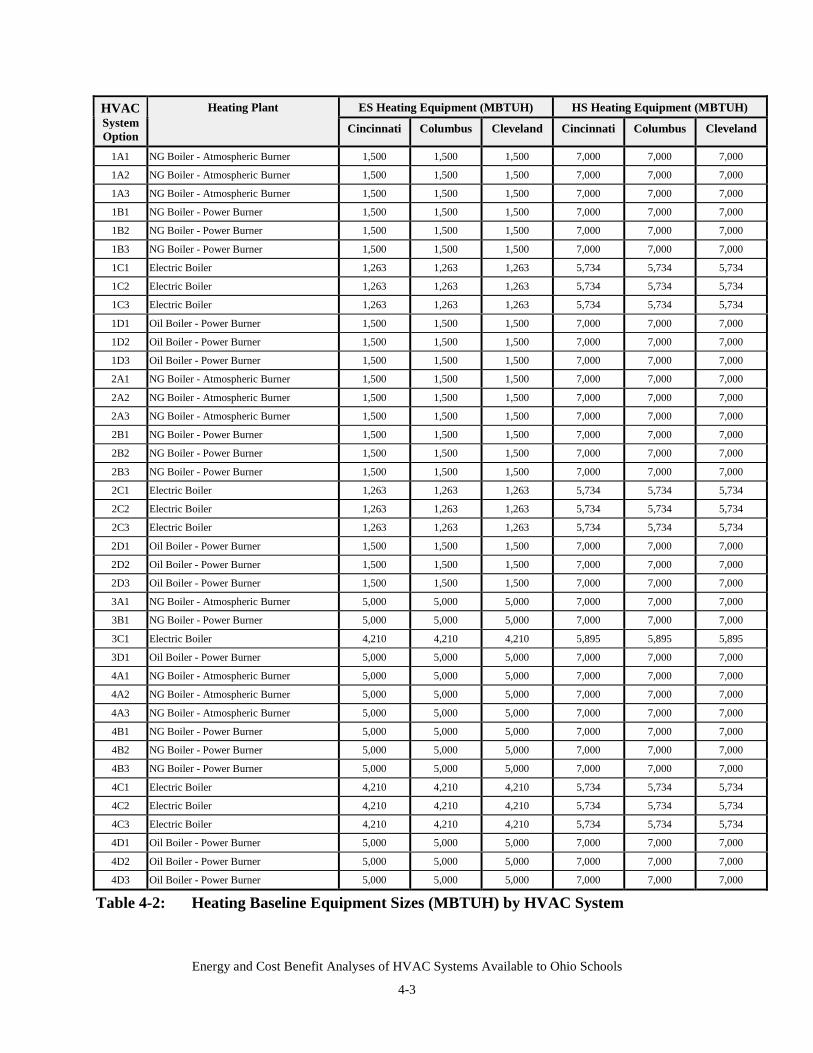
Energy and Cost Benefit Analyses of HVAC Systems Available to Ohio Schools
4-3
ES Heating Equipment (MBTUH) HS Heating Equipment (MBTUH)HVACSystemOption
Heating Plant
Cincinnati Columbus Cleveland Cincinnati Columbus Cleveland
1A1 NG Boiler - Atmospheric Burner 1,500 1,500 1,500 7,000 7,000 7,000
1A2 NG Boiler - Atmospheric Burner 1,500 1,500 1,500 7,000 7,000 7,000
1A3 NG Boiler - Atmospheric Burner 1,500 1,500 1,500 7,000 7,000 7,000
1B1 NG Boiler - Power Burner 1,500 1,500 1,500 7,000 7,000 7,000
1B2 NG Boiler - Power Burner 1,500 1,500 1,500 7,000 7,000 7,000
1B3 NG Boiler - Power Burner 1,500 1,500 1,500 7,000 7,000 7,000
1C1 Electric Boiler 1,263 1,263 1,263 5,734 5,734 5,734
1C2 Electric Boiler 1,263 1,263 1,263 5,734 5,734 5,734
1C3 Electric Boiler 1,263 1,263 1,263 5,734 5,734 5,734
1D1 Oil Boiler - Power Burner 1,500 1,500 1,500 7,000 7,000 7,000
1D2 Oil Boiler - Power Burner 1,500 1,500 1,500 7,000 7,000 7,000
1D3 Oil Boiler - Power Burner 1,500 1,500 1,500 7,000 7,000 7,000
2A1 NG Boiler - Atmospheric Burner 1,500 1,500 1,500 7,000 7,000 7,000
2A2 NG Boiler - Atmospheric Burner 1,500 1,500 1,500 7,000 7,000 7,000
2A3 NG Boiler - Atmospheric Burner 1,500 1,500 1,500 7,000 7,000 7,000
2B1 NG Boiler - Power Burner 1,500 1,500 1,500 7,000 7,000 7,000
2B2 NG Boiler - Power Burner 1,500 1,500 1,500 7,000 7,000 7,000
2B3 NG Boiler - Power Burner 1,500 1,500 1,500 7,000 7,000 7,000
2C1 Electric Boiler 1,263 1,263 1,263 5,734 5,734 5,734
2C2 Electric Boiler 1,263 1,263 1,263 5,734 5,734 5,734
2C3 Electric Boiler 1,263 1,263 1,263 5,734 5,734 5,734
2D1 Oil Boiler - Power Burner 1,500 1,500 1,500 7,000 7,000 7,000
2D2 Oil Boiler - Power Burner 1,500 1,500 1,500 7,000 7,000 7,000
2D3 Oil Boiler - Power Burner 1,500 1,500 1,500 7,000 7,000 7,000
3A1 NG Boiler - Atmospheric Burner 5,000 5,000 5,000 7,000 7,000 7,000
3B1 NG Boiler - Power Burner 5,000 5,000 5,000 7,000 7,000 7,000
3C1 Electric Boiler 4,210 4,210 4,210 5,895 5,895 5,895
3D1 Oil Boiler - Power Burner 5,000 5,000 5,000 7,000 7,000 7,000
4A1 NG Boiler - Atmospheric Burner 5,000 5,000 5,000 7,000 7,000 7,000
4A2 NG Boiler - Atmospheric Burner 5,000 5,000 5,000 7,000 7,000 7,000
4A3 NG Boiler - Atmospheric Burner 5,000 5,000 5,000 7,000 7,000 7,000
4B1 NG Boiler - Power Burner 5,000 5,000 5,000 7,000 7,000 7,000
4B2 NG Boiler - Power Burner 5,000 5,000 5,000 7,000 7,000 7,000
4B3 NG Boiler - Power Burner 5,000 5,000 5,000 7,000 7,000 7,000
4C1 Electric Boiler 4,210 4,210 4,210 5,734 5,734 5,734
4C2 Electric Boiler 4,210 4,210 4,210 5,734 5,734 5,734
4C3 Electric Boiler 4,210 4,210 4,210 5,734 5,734 5,734
4D1 Oil Boiler - Power Burner 5,000 5,000 5,000 7,000 7,000 7,000
4D2 Oil Boiler - Power Burner 5,000 5,000 5,000 7,000 7,000 7,000
4D3 Oil Boiler - Power Burner 5,000 5,000 5,000 7,000 7,000 7,000
Table 4-2: Heating Baseline Equipment Sizes (MBTUH) by HVAC System
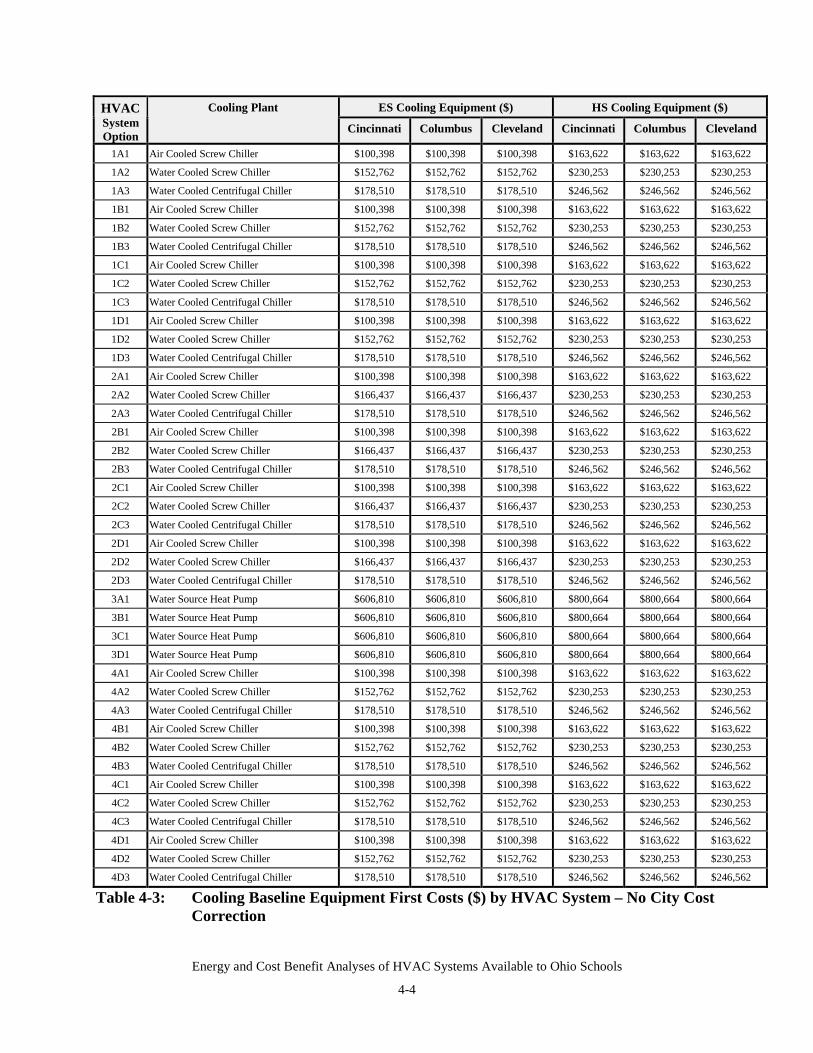
Energy and Cost Benefit Analyses of HVAC Systems Available to Ohio Schools
4-4
ES Cooling Equipment ($) HS Cooling Equipment ($)HVACSystemOption
Cooling Plant
Cincinnati Columbus Cleveland Cincinnati Columbus Cleveland
1A1 Air Cooled Screw Chiller $100,398 $100,398 $100,398 $163,622 $163,622 $163,622
1A2 Water Cooled Screw Chiller $152,762 $152,762 $152,762 $230,253 $230,253 $230,253
1A3 Water Cooled Centrifugal Chiller $178,510 $178,510 $178,510 $246,562 $246,562 $246,562
1B1 Air Cooled Screw Chiller $100,398 $100,398 $100,398 $163,622 $163,622 $163,622
1B2 Water Cooled Screw Chiller $152,762 $152,762 $152,762 $230,253 $230,253 $230,253
1B3 Water Cooled Centrifugal Chiller $178,510 $178,510 $178,510 $246,562 $246,562 $246,562
1C1 Air Cooled Screw Chiller $100,398 $100,398 $100,398 $163,622 $163,622 $163,622
1C2 Water Cooled Screw Chiller $152,762 $152,762 $152,762 $230,253 $230,253 $230,253
1C3 Water Cooled Centrifugal Chiller $178,510 $178,510 $178,510 $246,562 $246,562 $246,562
1D1 Air Cooled Screw Chiller $100,398 $100,398 $100,398 $163,622 $163,622 $163,622
1D2 Water Cooled Screw Chiller $152,762 $152,762 $152,762 $230,253 $230,253 $230,253
1D3 Water Cooled Centrifugal Chiller $178,510 $178,510 $178,510 $246,562 $246,562 $246,562
2A1 Air Cooled Screw Chiller $100,398 $100,398 $100,398 $163,622 $163,622 $163,622
2A2 Water Cooled Screw Chiller $166,437 $166,437 $166,437 $230,253 $230,253 $230,253
2A3 Water Cooled Centrifugal Chiller $178,510 $178,510 $178,510 $246,562 $246,562 $246,562
2B1 Air Cooled Screw Chiller $100,398 $100,398 $100,398 $163,622 $163,622 $163,622
2B2 Water Cooled Screw Chiller $166,437 $166,437 $166,437 $230,253 $230,253 $230,253
2B3 Water Cooled Centrifugal Chiller $178,510 $178,510 $178,510 $246,562 $246,562 $246,562
2C1 Air Cooled Screw Chiller $100,398 $100,398 $100,398 $163,622 $163,622 $163,622
2C2 Water Cooled Screw Chiller $166,437 $166,437 $166,437 $230,253 $230,253 $230,253
2C3 Water Cooled Centrifugal Chiller $178,510 $178,510 $178,510 $246,562 $246,562 $246,562
2D1 Air Cooled Screw Chiller $100,398 $100,398 $100,398 $163,622 $163,622 $163,622
2D2 Water Cooled Screw Chiller $166,437 $166,437 $166,437 $230,253 $230,253 $230,253
2D3 Water Cooled Centrifugal Chiller $178,510 $178,510 $178,510 $246,562 $246,562 $246,562
3A1 Water Source Heat Pump $606,810 $606,810 $606,810 $800,664 $800,664 $800,664
3B1 Water Source Heat Pump $606,810 $606,810 $606,810 $800,664 $800,664 $800,664
3C1 Water Source Heat Pump $606,810 $606,810 $606,810 $800,664 $800,664 $800,664
3D1 Water Source Heat Pump $606,810 $606,810 $606,810 $800,664 $800,664 $800,664
4A1 Air Cooled Screw Chiller $100,398 $100,398 $100,398 $163,622 $163,622 $163,622
4A2 Water Cooled Screw Chiller $152,762 $152,762 $152,762 $230,253 $230,253 $230,253
4A3 Water Cooled Centrifugal Chiller $178,510 $178,510 $178,510 $246,562 $246,562 $246,562
4B1 Air Cooled Screw Chiller $100,398 $100,398 $100,398 $163,622 $163,622 $163,622
4B2 Water Cooled Screw Chiller $152,762 $152,762 $152,762 $230,253 $230,253 $230,253
4B3 Water Cooled Centrifugal Chiller $178,510 $178,510 $178,510 $246,562 $246,562 $246,562
4C1 Air Cooled Screw Chiller $100,398 $100,398 $100,398 $163,622 $163,622 $163,622
4C2 Water Cooled Screw Chiller $152,762 $152,762 $152,762 $230,253 $230,253 $230,253
4C3 Water Cooled Centrifugal Chiller $178,510 $178,510 $178,510 $246,562 $246,562 $246,562
4D1 Air Cooled Screw Chiller $100,398 $100,398 $100,398 $163,622 $163,622 $163,622
4D2 Water Cooled Screw Chiller $152,762 $152,762 $152,762 $230,253 $230,253 $230,253
4D3 Water Cooled Centrifugal Chiller $178,510 $178,510 $178,510 $246,562 $246,562 $246,562
Table 4-3: Cooling Baseline Equipment First Costs ($) by HVAC System – No City CostCorrection
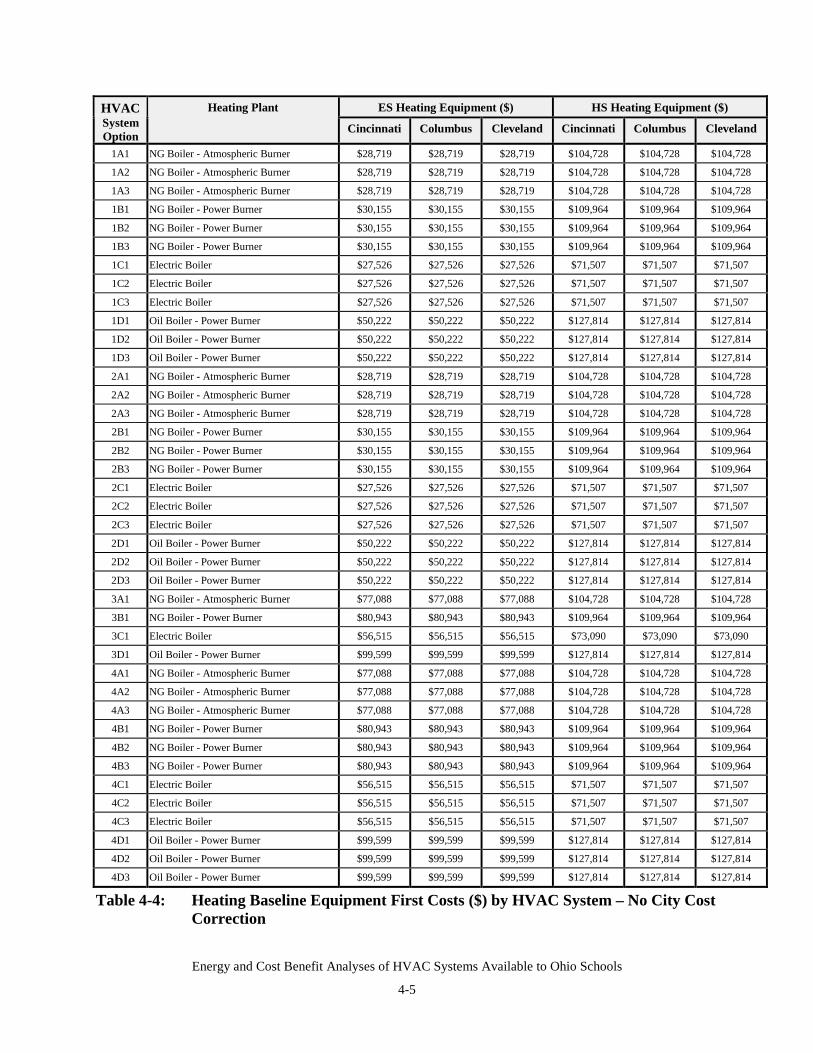
Energy and Cost Benefit Analyses of HVAC Systems Available to Ohio Schools
4-5
ES Heating Equipment ($) HS Heating Equipment ($)HVACSystemOption
Heating Plant
Cincinnati Columbus Cleveland Cincinnati Columbus Cleveland
1A1 NG Boiler - Atmospheric Burner $28,719 $28,719 $28,719 $104,728 $104,728 $104,728
1A2 NG Boiler - Atmospheric Burner $28,719 $28,719 $28,719 $104,728 $104,728 $104,728
1A3 NG Boiler - Atmospheric Burner $28,719 $28,719 $28,719 $104,728 $104,728 $104,728
1B1 NG Boiler - Power Burner $30,155 $30,155 $30,155 $109,964 $109,964 $109,964
1B2 NG Boiler - Power Burner $30,155 $30,155 $30,155 $109,964 $109,964 $109,964
1B3 NG Boiler - Power Burner $30,155 $30,155 $30,155 $109,964 $109,964 $109,964
1C1 Electric Boiler $27,526 $27,526 $27,526 $71,507 $71,507 $71,507
1C2 Electric Boiler $27,526 $27,526 $27,526 $71,507 $71,507 $71,507
1C3 Electric Boiler $27,526 $27,526 $27,526 $71,507 $71,507 $71,507
1D1 Oil Boiler - Power Burner $50,222 $50,222 $50,222 $127,814 $127,814 $127,814
1D2 Oil Boiler - Power Burner $50,222 $50,222 $50,222 $127,814 $127,814 $127,814
1D3 Oil Boiler - Power Burner $50,222 $50,222 $50,222 $127,814 $127,814 $127,814
2A1 NG Boiler - Atmospheric Burner $28,719 $28,719 $28,719 $104,728 $104,728 $104,728
2A2 NG Boiler - Atmospheric Burner $28,719 $28,719 $28,719 $104,728 $104,728 $104,728
2A3 NG Boiler - Atmospheric Burner $28,719 $28,719 $28,719 $104,728 $104,728 $104,728
2B1 NG Boiler - Power Burner $30,155 $30,155 $30,155 $109,964 $109,964 $109,964
2B2 NG Boiler - Power Burner $30,155 $30,155 $30,155 $109,964 $109,964 $109,964
2B3 NG Boiler - Power Burner $30,155 $30,155 $30,155 $109,964 $109,964 $109,964
2C1 Electric Boiler $27,526 $27,526 $27,526 $71,507 $71,507 $71,507
2C2 Electric Boiler $27,526 $27,526 $27,526 $71,507 $71,507 $71,507
2C3 Electric Boiler $27,526 $27,526 $27,526 $71,507 $71,507 $71,507
2D1 Oil Boiler - Power Burner $50,222 $50,222 $50,222 $127,814 $127,814 $127,814
2D2 Oil Boiler - Power Burner $50,222 $50,222 $50,222 $127,814 $127,814 $127,814
2D3 Oil Boiler - Power Burner $50,222 $50,222 $50,222 $127,814 $127,814 $127,814
3A1 NG Boiler - Atmospheric Burner $77,088 $77,088 $77,088 $104,728 $104,728 $104,728
3B1 NG Boiler - Power Burner $80,943 $80,943 $80,943 $109,964 $109,964 $109,964
3C1 Electric Boiler $56,515 $56,515 $56,515 $73,090 $73,090 $73,090
3D1 Oil Boiler - Power Burner $99,599 $99,599 $99,599 $127,814 $127,814 $127,814
4A1 NG Boiler - Atmospheric Burner $77,088 $77,088 $77,088 $104,728 $104,728 $104,728
4A2 NG Boiler - Atmospheric Burner $77,088 $77,088 $77,088 $104,728 $104,728 $104,728
4A3 NG Boiler - Atmospheric Burner $77,088 $77,088 $77,088 $104,728 $104,728 $104,728
4B1 NG Boiler - Power Burner $80,943 $80,943 $80,943 $109,964 $109,964 $109,964
4B2 NG Boiler - Power Burner $80,943 $80,943 $80,943 $109,964 $109,964 $109,964
4B3 NG Boiler - Power Burner $80,943 $80,943 $80,943 $109,964 $109,964 $109,964
4C1 Electric Boiler $56,515 $56,515 $56,515 $71,507 $71,507 $71,507
4C2 Electric Boiler $56,515 $56,515 $56,515 $71,507 $71,507 $71,507
4C3 Electric Boiler $56,515 $56,515 $56,515 $71,507 $71,507 $71,507
4D1 Oil Boiler - Power Burner $99,599 $99,599 $99,599 $127,814 $127,814 $127,814
4D2 Oil Boiler - Power Burner $99,599 $99,599 $99,599 $127,814 $127,814 $127,814
4D3 Oil Boiler - Power Burner $99,599 $99,599 $99,599 $127,814 $127,814 $127,814
Table 4-4: Heating Baseline Equipment First Costs ($) by HVAC System – No City CostCorrection
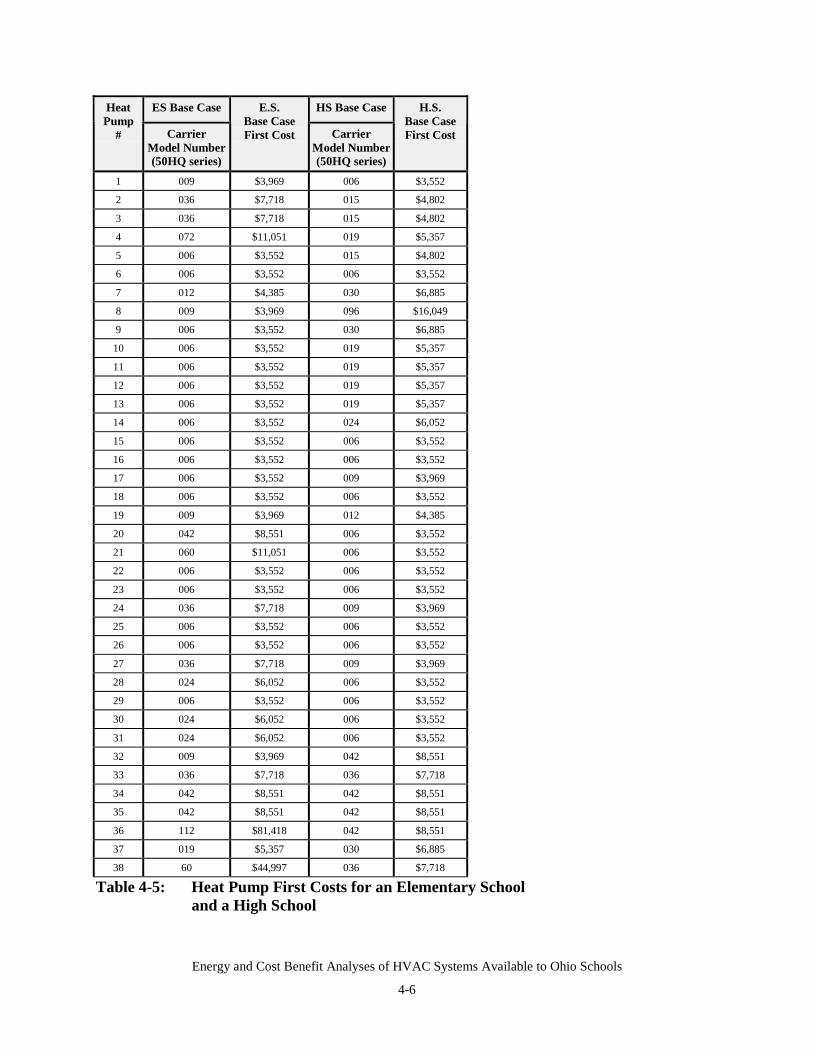
Energy and Cost Benefit Analyses of HVAC Systems Available to Ohio Schools
4-6
ES Base Case HS Base CaseHeatPump
# CarrierModel Number(50HQ series)
E.S.Base CaseFirst Cost Carrier
Model Number(50HQ series)
H.S.Base CaseFirst Cost
1 009 $3,969 006 $3,552
2 036 $7,718 015 $4,802
3 036 $7,718 015 $4,802
4 072 $11,051 019 $5,357
5 006 $3,552 015 $4,802
6 006 $3,552 006 $3,552
7 012 $4,385 030 $6,885
8 009 $3,969 096 $16,049
9 006 $3,552 030 $6,885
10 006 $3,552 019 $5,357
11 006 $3,552 019 $5,357
12 006 $3,552 019 $5,357
13 006 $3,552 019 $5,357
14 006 $3,552 024 $6,052
15 006 $3,552 006 $3,552
16 006 $3,552 006 $3,552
17 006 $3,552 009 $3,969
18 006 $3,552 006 $3,552
19 009 $3,969 012 $4,385
20 042 $8,551 006 $3,552
21 060 $11,051 006 $3,552
22 006 $3,552 006 $3,552
23 006 $3,552 006 $3,552
24 036 $7,718 009 $3,969
25 006 $3,552 006 $3,552
26 006 $3,552 006 $3,552
27 036 $7,718 009 $3,969
28 024 $6,052 006 $3,552
29 006 $3,552 006 $3,552
30 024 $6,052 006 $3,552
31 024 $6,052 006 $3,552
32 009 $3,969 042 $8,551
33 036 $7,718 036 $7,718
34 042 $8,551 042 $8,551
35 042 $8,551 042 $8,551
36 112 $81,418 042 $8,551
37 019 $5,357 030 $6,885
38 60 $44,997 036 $7,718
Table 4-5: Heat Pump First Costs for an Elementary Schooland a High School
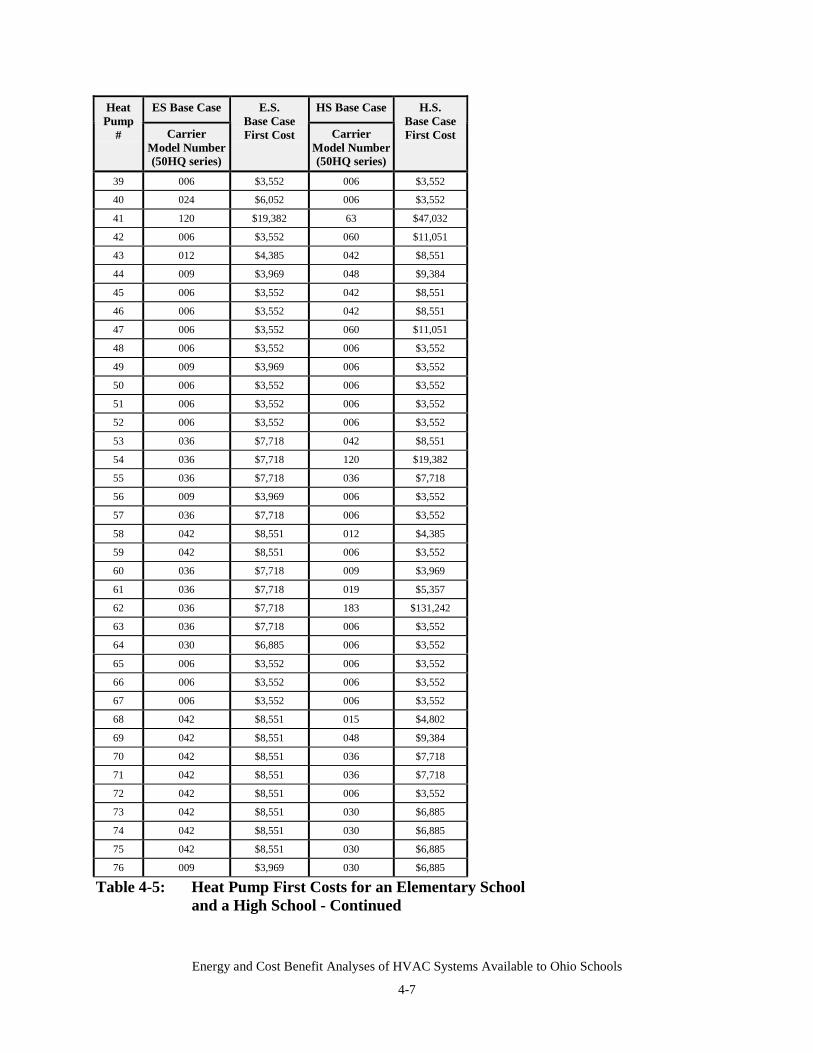
Energy and Cost Benefit Analyses of HVAC Systems Available to Ohio Schools
4-7
ES Base Case HS Base CaseHeatPump
# CarrierModel Number(50HQ series)
E.S.Base CaseFirst Cost Carrier
Model Number(50HQ series)
H.S.Base CaseFirst Cost
39 006 $3,552 006 $3,552
40 024 $6,052 006 $3,552
41 120 $19,382 63 $47,032
42 006 $3,552 060 $11,051
43 012 $4,385 042 $8,551
44 009 $3,969 048 $9,384
45 006 $3,552 042 $8,551
46 006 $3,552 042 $8,551
47 006 $3,552 060 $11,051
48 006 $3,552 006 $3,552
49 009 $3,969 006 $3,552
50 006 $3,552 006 $3,552
51 006 $3,552 006 $3,552
52 006 $3,552 006 $3,552
53 036 $7,718 042 $8,551
54 036 $7,718 120 $19,382
55 036 $7,718 036 $7,718
56 009 $3,969 006 $3,552
57 036 $7,718 006 $3,552
58 042 $8,551 012 $4,385
59 042 $8,551 006 $3,552
60 036 $7,718 009 $3,969
61 036 $7,718 019 $5,357
62 036 $7,718 183 $131,242
63 036 $7,718 006 $3,552
64 030 $6,885 006 $3,552
65 006 $3,552 006 $3,552
66 006 $3,552 006 $3,552
67 006 $3,552 006 $3,552
68 042 $8,551 015 $4,802
69 042 $8,551 048 $9,384
70 042 $8,551 036 $7,718
71 042 $8,551 036 $7,718
72 042 $8,551 006 $3,552
73 042 $8,551 030 $6,885
74 042 $8,551 030 $6,885
75 042 $8,551 030 $6,885
76 009 $3,969 030 $6,885
Table 4-5: Heat Pump First Costs for an Elementary Schooland a High School - Continued
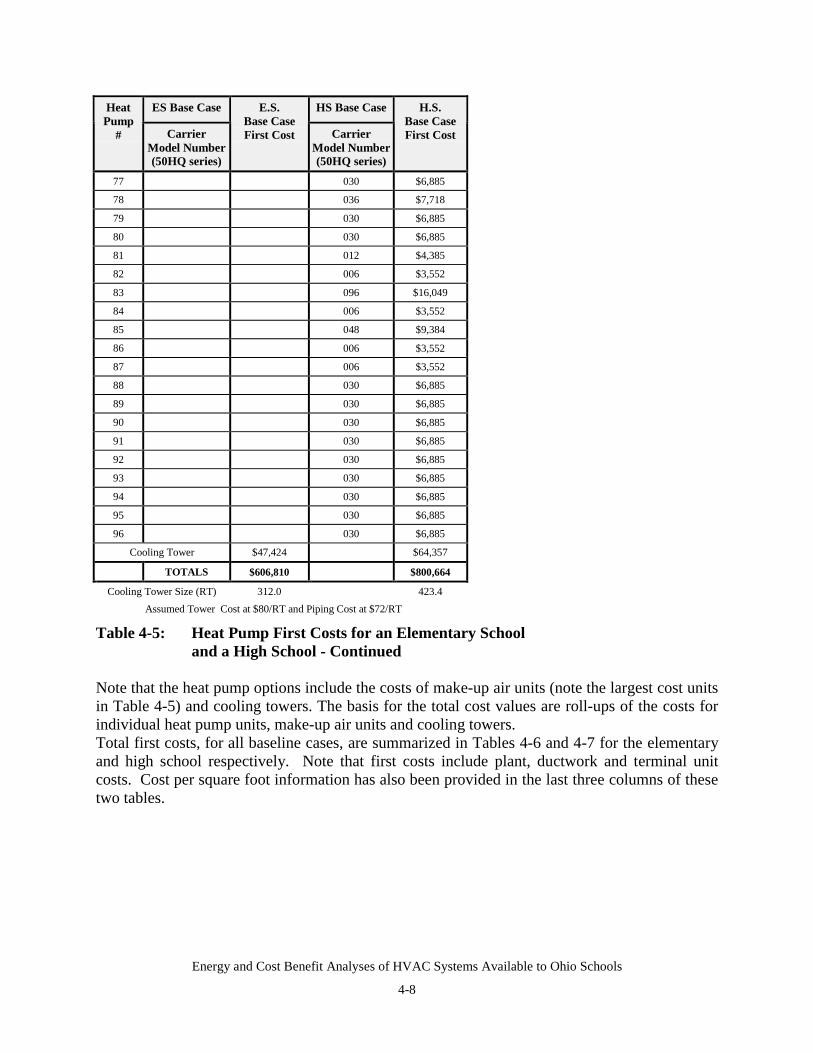
Energy and Cost Benefit Analyses of HVAC Systems Available to Ohio Schools
4-8
ES Base Case HS Base CaseHeatPump
# CarrierModel Number(50HQ series)
E.S.Base CaseFirst Cost Carrier
Model Number(50HQ series)
H.S.Base CaseFirst Cost
77 030 $6,885
78 036 $7,718
79 030 $6,885
80 030 $6,885
81 012 $4,385
82 006 $3,552
83 096 $16,049
84 006 $3,552
85 048 $9,384
86 006 $3,552
87 006 $3,552
88 030 $6,885
89 030 $6,885
90 030 $6,885
91 030 $6,885
92 030 $6,885
93 030 $6,885
94 030 $6,885
95 030 $6,885
96 030 $6,885
Cooling Tower $47,424 $64,357
TOTALS $606,810 $800,664
Cooling Tower Size (RT) 312.0 423.4Assumed Tower Cost at $80/RT and Piping Cost at $72/RT
Table 4-5: Heat Pump First Costs for an Elementary Schooland a High School - Continued
Note that the heat pump options include the costs of make-up air units (note the largest cost unitsin Table 4-5) and cooling towers. The basis for the total cost values are roll-ups of the costs forindividual heat pump units, make-up air units and cooling towers.Total first costs, for all baseline cases, are summarized in Tables 4-6 and 4-7 for the elementaryand high school respectively. Note that first costs include plant, ductwork and terminal unitcosts. Cost per square foot information has also been provided in the last three columns of thesetwo tables.
Energy and Cost Benefit Analyses of HVAC Systems Available to Ohio Schools
4-9
In general, these costs per square foot appear to be $2 to $3 dollars per square foot less thenthose seen in actual projects. This is probably due to how equipment was sized during HAPsimulations and the lack of consideration of central control system costs. While running HAP,only the next largest logical (catalog size offered by the major vendors) size of equipment wasused to simulate a given case. No safety margin/percentage or factor was added while operatingHAP. (It is our experience that this practice can compound the over design utilized whenequipment is selected, is not necessary since the modeling is based on loads using locationspecific design day limits and would blur real cost differences between HVAC alternatives). Theauthors recognize that it is common practice to oversize cooling equipment by upwards of 20%and heating equipment by 40%, but chose to select only the next logical size of equipmentneeded to meet the load(s). This may imply that the overall costs are somewhat low, but theapproach provides the most defensible comparison between system costs. Central controlsystems can add 10 to 15% to the installed system costs. Incremental heating margins and A/Ecosts would appear to account for the balance of the differences.
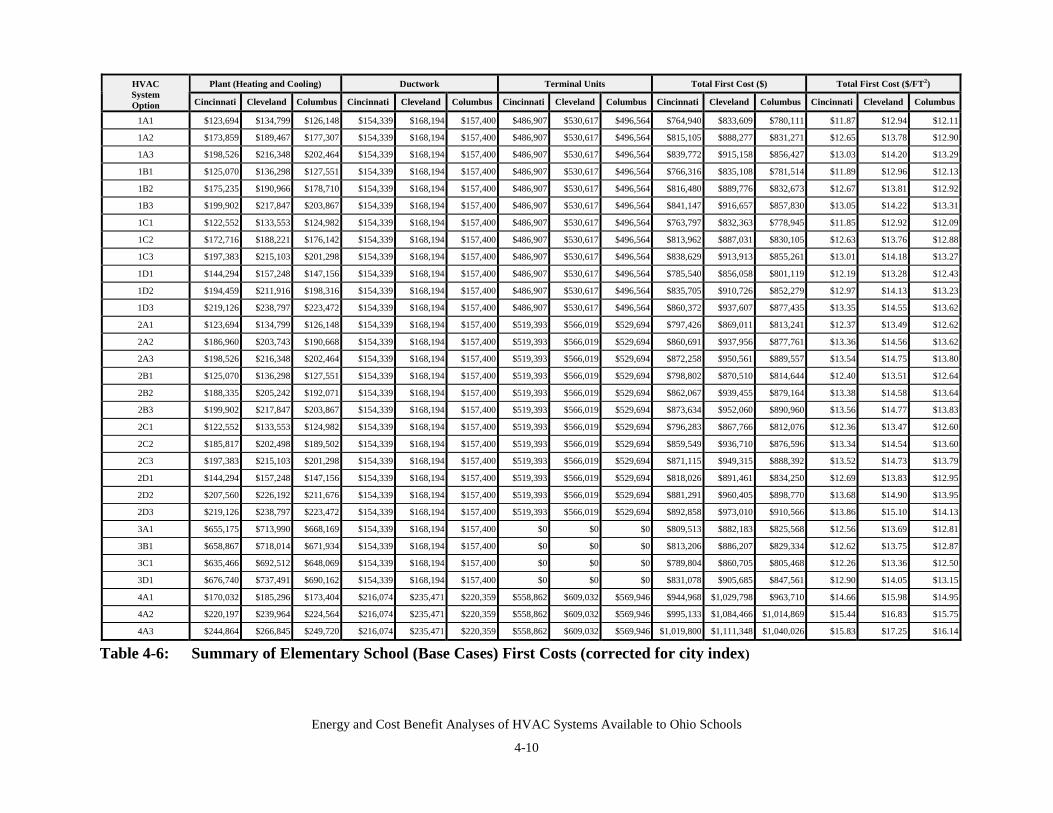
Energy and Cost Benefit Analyses of HVAC Systems Available to Ohio Schools
4-10
Plant (Heating and Cooling) Ductwork Terminal Units Total First Cost ($) Total First Cost ($/FT2)HVACSystemOption Cincinnati Cleveland Columbus Cincinnati Cleveland Columbus Cincinnati Cleveland Columbus Cincinnati Cleveland Columbus Cincinnati Cleveland Columbus
1A1 $123,694 $134,799 $126,148 $154,339 $168,194 $157,400 $486,907 $530,617 $496,564 $764,940 $833,609 $780,111 $11.87 $12.94 $12.11
1A2 $173,859 $189,467 $177,307 $154,339 $168,194 $157,400 $486,907 $530,617 $496,564 $815,105 $888,277 $831,271 $12.65 $13.78 $12.90
1A3 $198,526 $216,348 $202,464 $154,339 $168,194 $157,400 $486,907 $530,617 $496,564 $839,772 $915,158 $856,427 $13.03 $14.20 $13.29
1B1 $125,070 $136,298 $127,551 $154,339 $168,194 $157,400 $486,907 $530,617 $496,564 $766,316 $835,108 $781,514 $11.89 $12.96 $12.13
1B2 $175,235 $190,966 $178,710 $154,339 $168,194 $157,400 $486,907 $530,617 $496,564 $816,480 $889,776 $832,673 $12.67 $13.81 $12.92
1B3 $199,902 $217,847 $203,867 $154,339 $168,194 $157,400 $486,907 $530,617 $496,564 $841,147 $916,657 $857,830 $13.05 $14.22 $13.31
1C1 $122,552 $133,553 $124,982 $154,339 $168,194 $157,400 $486,907 $530,617 $496,564 $763,797 $832,363 $778,945 $11.85 $12.92 $12.09
1C2 $172,716 $188,221 $176,142 $154,339 $168,194 $157,400 $486,907 $530,617 $496,564 $813,962 $887,031 $830,105 $12.63 $13.76 $12.88
1C3 $197,383 $215,103 $201,298 $154,339 $168,194 $157,400 $486,907 $530,617 $496,564 $838,629 $913,913 $855,261 $13.01 $14.18 $13.27
1D1 $144,294 $157,248 $147,156 $154,339 $168,194 $157,400 $486,907 $530,617 $496,564 $785,540 $856,058 $801,119 $12.19 $13.28 $12.43
1D2 $194,459 $211,916 $198,316 $154,339 $168,194 $157,400 $486,907 $530,617 $496,564 $835,705 $910,726 $852,279 $12.97 $14.13 $13.23
1D3 $219,126 $238,797 $223,472 $154,339 $168,194 $157,400 $486,907 $530,617 $496,564 $860,372 $937,607 $877,435 $13.35 $14.55 $13.62
2A1 $123,694 $134,799 $126,148 $154,339 $168,194 $157,400 $519,393 $566,019 $529,694 $797,426 $869,011 $813,241 $12.37 $13.49 $12.62
2A2 $186,960 $203,743 $190,668 $154,339 $168,194 $157,400 $519,393 $566,019 $529,694 $860,691 $937,956 $877,761 $13.36 $14.56 $13.62
2A3 $198,526 $216,348 $202,464 $154,339 $168,194 $157,400 $519,393 $566,019 $529,694 $872,258 $950,561 $889,557 $13.54 $14.75 $13.80
2B1 $125,070 $136,298 $127,551 $154,339 $168,194 $157,400 $519,393 $566,019 $529,694 $798,802 $870,510 $814,644 $12.40 $13.51 $12.64
2B2 $188,335 $205,242 $192,071 $154,339 $168,194 $157,400 $519,393 $566,019 $529,694 $862,067 $939,455 $879,164 $13.38 $14.58 $13.64
2B3 $199,902 $217,847 $203,867 $154,339 $168,194 $157,400 $519,393 $566,019 $529,694 $873,634 $952,060 $890,960 $13.56 $14.77 $13.83
2C1 $122,552 $133,553 $124,982 $154,339 $168,194 $157,400 $519,393 $566,019 $529,694 $796,283 $867,766 $812,076 $12.36 $13.47 $12.60
2C2 $185,817 $202,498 $189,502 $154,339 $168,194 $157,400 $519,393 $566,019 $529,694 $859,549 $936,710 $876,596 $13.34 $14.54 $13.60
2C3 $197,383 $215,103 $201,298 $154,339 $168,194 $157,400 $519,393 $566,019 $529,694 $871,115 $949,315 $888,392 $13.52 $14.73 $13.79
2D1 $144,294 $157,248 $147,156 $154,339 $168,194 $157,400 $519,393 $566,019 $529,694 $818,026 $891,461 $834,250 $12.69 $13.83 $12.95
2D2 $207,560 $226,192 $211,676 $154,339 $168,194 $157,400 $519,393 $566,019 $529,694 $881,291 $960,405 $898,770 $13.68 $14.90 $13.95
2D3 $219,126 $238,797 $223,472 $154,339 $168,194 $157,400 $519,393 $566,019 $529,694 $892,858 $973,010 $910,566 $13.86 $15.10 $14.13
3A1 $655,175 $713,990 $668,169 $154,339 $168,194 $157,400 $0 $0 $0 $809,513 $882,183 $825,568 $12.56 $13.69 $12.81
3B1 $658,867 $718,014 $671,934 $154,339 $168,194 $157,400 $0 $0 $0 $813,206 $886,207 $829,334 $12.62 $13.75 $12.87
3C1 $635,466 $692,512 $648,069 $154,339 $168,194 $157,400 $0 $0 $0 $789,804 $860,705 $805,468 $12.26 $13.36 $12.50
3D1 $676,740 $737,491 $690,162 $154,339 $168,194 $157,400 $0 $0 $0 $831,078 $905,685 $847,561 $12.90 $14.05 $13.15
4A1 $170,032 $185,296 $173,404 $216,074 $235,471 $220,359 $558,862 $609,032 $569,946 $944,968 $1,029,798 $963,710 $14.66 $15.98 $14.95
4A2 $220,197 $239,964 $224,564 $216,074 $235,471 $220,359 $558,862 $609,032 $569,946 $995,133 $1,084,466 $1,014,869 $15.44 $16.83 $15.75
4A3 $244,864 $266,845 $249,720 $216,074 $235,471 $220,359 $558,862 $609,032 $569,946 $1,019,800 $1,111,348 $1,040,026 $15.83 $17.25 $16.14
Table 4-6: Summary of Elementary School (Base Cases) First Costs (corrected for city index)
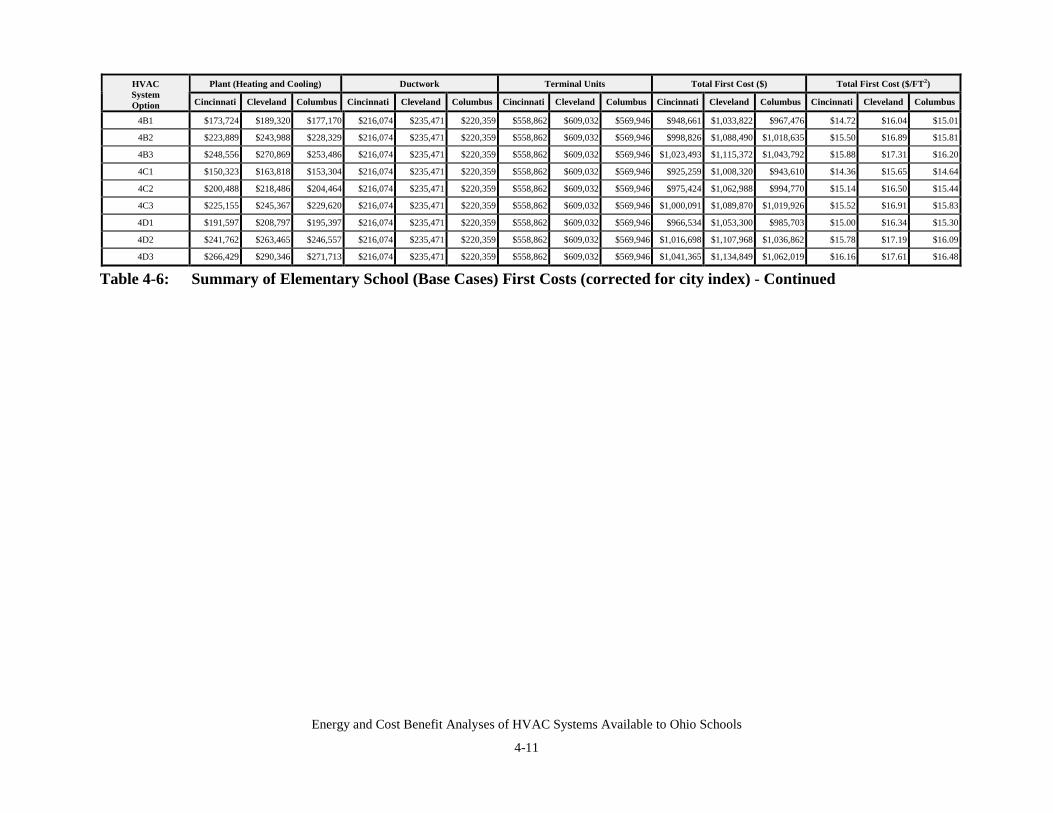
Energy and Cost Benefit Analyses of HVAC Systems Available to Ohio Schools
4-11
Plant (Heating and Cooling) Ductwork Terminal Units Total First Cost ($) Total First Cost ($/FT2)HVACSystemOption Cincinnati Cleveland Columbus Cincinnati Cleveland Columbus Cincinnati Cleveland Columbus Cincinnati Cleveland Columbus Cincinnati Cleveland Columbus
4B1 $173,724 $189,320 $177,170 $216,074 $235,471 $220,359 $558,862 $609,032 $569,946 $948,661 $1,033,822 $967,476 $14.72 $16.04 $15.01
4B2 $223,889 $243,988 $228,329 $216,074 $235,471 $220,359 $558,862 $609,032 $569,946 $998,826 $1,088,490 $1,018,635 $15.50 $16.89 $15.81
4B3 $248,556 $270,869 $253,486 $216,074 $235,471 $220,359 $558,862 $609,032 $569,946 $1,023,493 $1,115,372 $1,043,792 $15.88 $17.31 $16.20
4C1 $150,323 $163,818 $153,304 $216,074 $235,471 $220,359 $558,862 $609,032 $569,946 $925,259 $1,008,320 $943,610 $14.36 $15.65 $14.64
4C2 $200,488 $218,486 $204,464 $216,074 $235,471 $220,359 $558,862 $609,032 $569,946 $975,424 $1,062,988 $994,770 $15.14 $16.50 $15.44
4C3 $225,155 $245,367 $229,620 $216,074 $235,471 $220,359 $558,862 $609,032 $569,946 $1,000,091 $1,089,870 $1,019,926 $15.52 $16.91 $15.83
4D1 $191,597 $208,797 $195,397 $216,074 $235,471 $220,359 $558,862 $609,032 $569,946 $966,534 $1,053,300 $985,703 $15.00 $16.34 $15.30
4D2 $241,762 $263,465 $246,557 $216,074 $235,471 $220,359 $558,862 $609,032 $569,946 $1,016,698 $1,107,968 $1,036,862 $15.78 $17.19 $16.09
4D3 $266,429 $290,346 $271,713 $216,074 $235,471 $220,359 $558,862 $609,032 $569,946 $1,041,365 $1,134,849 $1,062,019 $16.16 $17.61 $16.48
Table 4-6: Summary of Elementary School (Base Cases) First Costs (corrected for city index) - Continued
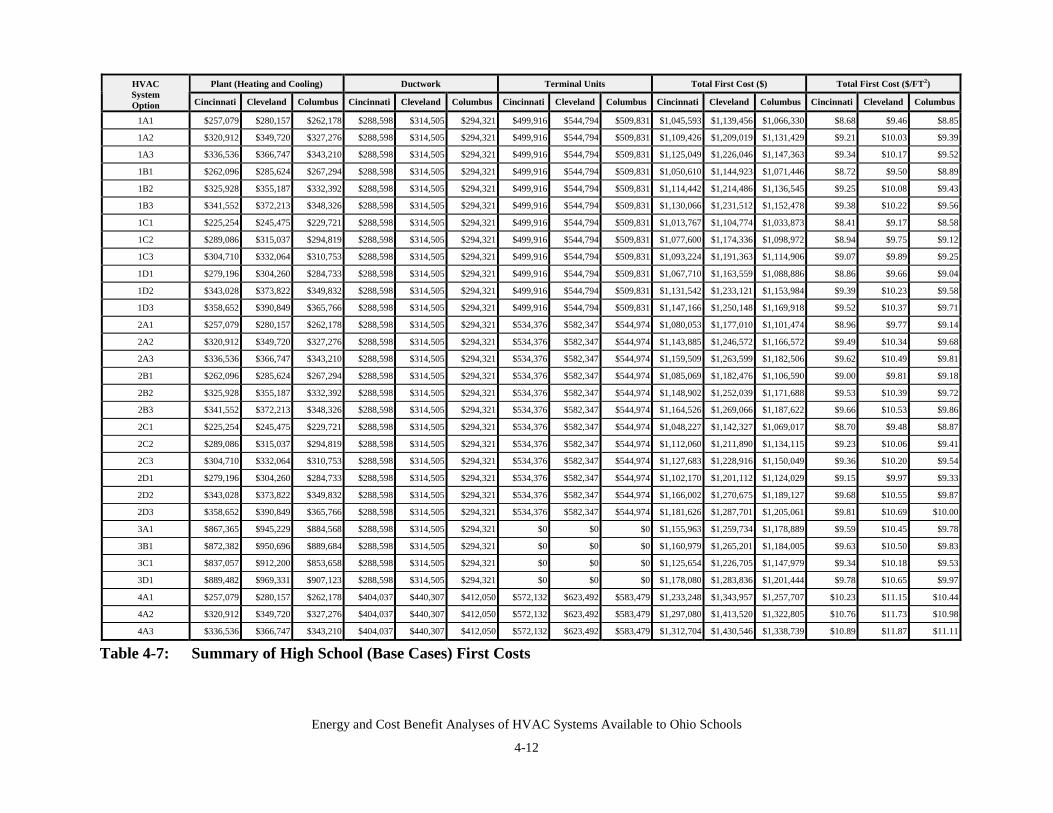
Energy and Cost Benefit Analyses of HVAC Systems Available to Ohio Schools
4-12
Plant (Heating and Cooling) Ductwork Terminal Units Total First Cost ($) Total First Cost ($/FT2)HVACSystemOption Cincinnati Cleveland Columbus Cincinnati Cleveland Columbus Cincinnati Cleveland Columbus Cincinnati Cleveland Columbus Cincinnati Cleveland Columbus
1A1 $257,079 $280,157 $262,178 $288,598 $314,505 $294,321 $499,916 $544,794 $509,831 $1,045,593 $1,139,456 $1,066,330 $8.68 $9.46 $8.85
1A2 $320,912 $349,720 $327,276 $288,598 $314,505 $294,321 $499,916 $544,794 $509,831 $1,109,426 $1,209,019 $1,131,429 $9.21 $10.03 $9.39
1A3 $336,536 $366,747 $343,210 $288,598 $314,505 $294,321 $499,916 $544,794 $509,831 $1,125,049 $1,226,046 $1,147,363 $9.34 $10.17 $9.52
1B1 $262,096 $285,624 $267,294 $288,598 $314,505 $294,321 $499,916 $544,794 $509,831 $1,050,610 $1,144,923 $1,071,446 $8.72 $9.50 $8.89
1B2 $325,928 $355,187 $332,392 $288,598 $314,505 $294,321 $499,916 $544,794 $509,831 $1,114,442 $1,214,486 $1,136,545 $9.25 $10.08 $9.43
1B3 $341,552 $372,213 $348,326 $288,598 $314,505 $294,321 $499,916 $544,794 $509,831 $1,130,066 $1,231,512 $1,152,478 $9.38 $10.22 $9.56
1C1 $225,254 $245,475 $229,721 $288,598 $314,505 $294,321 $499,916 $544,794 $509,831 $1,013,767 $1,104,774 $1,033,873 $8.41 $9.17 $8.58
1C2 $289,086 $315,037 $294,819 $288,598 $314,505 $294,321 $499,916 $544,794 $509,831 $1,077,600 $1,174,336 $1,098,972 $8.94 $9.75 $9.12
1C3 $304,710 $332,064 $310,753 $288,598 $314,505 $294,321 $499,916 $544,794 $509,831 $1,093,224 $1,191,363 $1,114,906 $9.07 $9.89 $9.25
1D1 $279,196 $304,260 $284,733 $288,598 $314,505 $294,321 $499,916 $544,794 $509,831 $1,067,710 $1,163,559 $1,088,886 $8.86 $9.66 $9.04
1D2 $343,028 $373,822 $349,832 $288,598 $314,505 $294,321 $499,916 $544,794 $509,831 $1,131,542 $1,233,121 $1,153,984 $9.39 $10.23 $9.58
1D3 $358,652 $390,849 $365,766 $288,598 $314,505 $294,321 $499,916 $544,794 $509,831 $1,147,166 $1,250,148 $1,169,918 $9.52 $10.37 $9.71
2A1 $257,079 $280,157 $262,178 $288,598 $314,505 $294,321 $534,376 $582,347 $544,974 $1,080,053 $1,177,010 $1,101,474 $8.96 $9.77 $9.14
2A2 $320,912 $349,720 $327,276 $288,598 $314,505 $294,321 $534,376 $582,347 $544,974 $1,143,885 $1,246,572 $1,166,572 $9.49 $10.34 $9.68
2A3 $336,536 $366,747 $343,210 $288,598 $314,505 $294,321 $534,376 $582,347 $544,974 $1,159,509 $1,263,599 $1,182,506 $9.62 $10.49 $9.81
2B1 $262,096 $285,624 $267,294 $288,598 $314,505 $294,321 $534,376 $582,347 $544,974 $1,085,069 $1,182,476 $1,106,590 $9.00 $9.81 $9.18
2B2 $325,928 $355,187 $332,392 $288,598 $314,505 $294,321 $534,376 $582,347 $544,974 $1,148,902 $1,252,039 $1,171,688 $9.53 $10.39 $9.72
2B3 $341,552 $372,213 $348,326 $288,598 $314,505 $294,321 $534,376 $582,347 $544,974 $1,164,526 $1,269,066 $1,187,622 $9.66 $10.53 $9.86
2C1 $225,254 $245,475 $229,721 $288,598 $314,505 $294,321 $534,376 $582,347 $544,974 $1,048,227 $1,142,327 $1,069,017 $8.70 $9.48 $8.87
2C2 $289,086 $315,037 $294,819 $288,598 $314,505 $294,321 $534,376 $582,347 $544,974 $1,112,060 $1,211,890 $1,134,115 $9.23 $10.06 $9.41
2C3 $304,710 $332,064 $310,753 $288,598 $314,505 $294,321 $534,376 $582,347 $544,974 $1,127,683 $1,228,916 $1,150,049 $9.36 $10.20 $9.54
2D1 $279,196 $304,260 $284,733 $288,598 $314,505 $294,321 $534,376 $582,347 $544,974 $1,102,170 $1,201,112 $1,124,029 $9.15 $9.97 $9.33
2D2 $343,028 $373,822 $349,832 $288,598 $314,505 $294,321 $534,376 $582,347 $544,974 $1,166,002 $1,270,675 $1,189,127 $9.68 $10.55 $9.87
2D3 $358,652 $390,849 $365,766 $288,598 $314,505 $294,321 $534,376 $582,347 $544,974 $1,181,626 $1,287,701 $1,205,061 $9.81 $10.69 $10.00
3A1 $867,365 $945,229 $884,568 $288,598 $314,505 $294,321 $0 $0 $0 $1,155,963 $1,259,734 $1,178,889 $9.59 $10.45 $9.78
3B1 $872,382 $950,696 $889,684 $288,598 $314,505 $294,321 $0 $0 $0 $1,160,979 $1,265,201 $1,184,005 $9.63 $10.50 $9.83
3C1 $837,057 $912,200 $853,658 $288,598 $314,505 $294,321 $0 $0 $0 $1,125,654 $1,226,705 $1,147,979 $9.34 $10.18 $9.53
3D1 $889,482 $969,331 $907,123 $288,598 $314,505 $294,321 $0 $0 $0 $1,178,080 $1,283,836 $1,201,444 $9.78 $10.65 $9.97
4A1 $257,079 $280,157 $262,178 $404,037 $440,307 $412,050 $572,132 $623,492 $583,479 $1,233,248 $1,343,957 $1,257,707 $10.23 $11.15 $10.44
4A2 $320,912 $349,720 $327,276 $404,037 $440,307 $412,050 $572,132 $623,492 $583,479 $1,297,080 $1,413,520 $1,322,805 $10.76 $11.73 $10.98
4A3 $336,536 $366,747 $343,210 $404,037 $440,307 $412,050 $572,132 $623,492 $583,479 $1,312,704 $1,430,546 $1,338,739 $10.89 $11.87 $11.11
Table 4-7: Summary of High School (Base Cases) First Costs
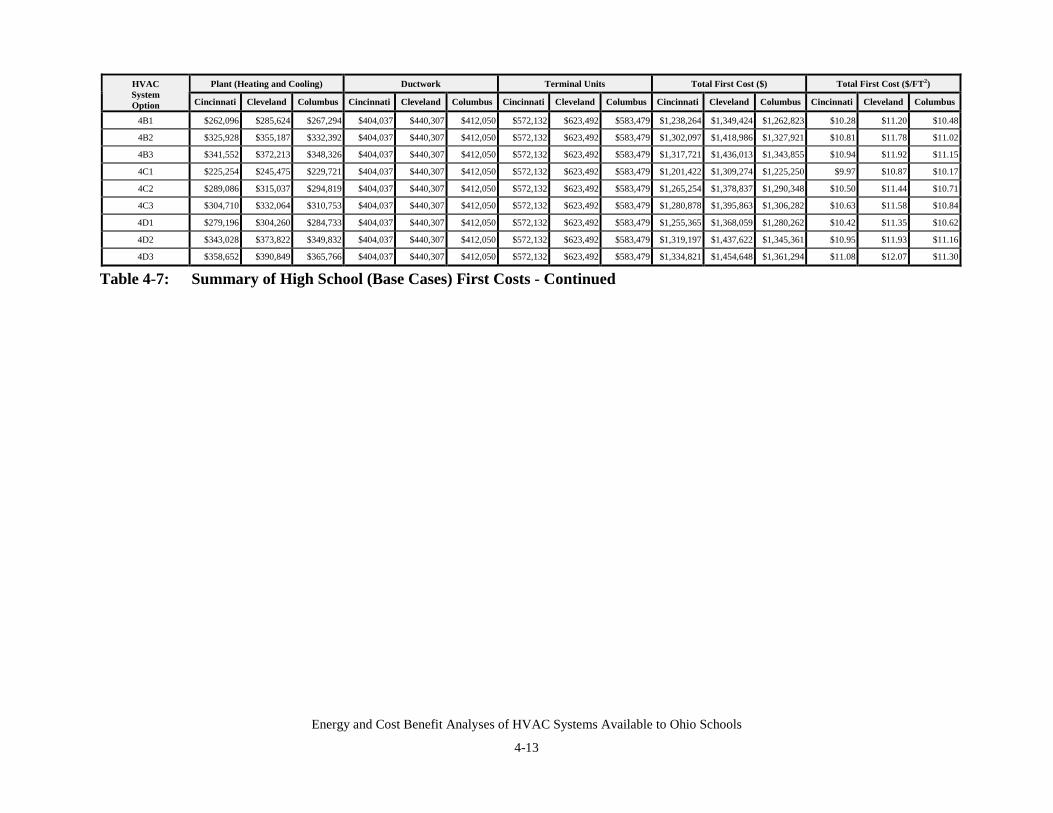
Energy and Cost Benefit Analyses of HVAC Systems Available to Ohio Schools
4-13
Plant (Heating and Cooling) Ductwork Terminal Units Total First Cost ($) Total First Cost ($/FT2)HVACSystemOption Cincinnati Cleveland Columbus Cincinnati Cleveland Columbus Cincinnati Cleveland Columbus Cincinnati Cleveland Columbus Cincinnati Cleveland Columbus
4B1 $262,096 $285,624 $267,294 $404,037 $440,307 $412,050 $572,132 $623,492 $583,479 $1,238,264 $1,349,424 $1,262,823 $10.28 $11.20 $10.48
4B2 $325,928 $355,187 $332,392 $404,037 $440,307 $412,050 $572,132 $623,492 $583,479 $1,302,097 $1,418,986 $1,327,921 $10.81 $11.78 $11.02
4B3 $341,552 $372,213 $348,326 $404,037 $440,307 $412,050 $572,132 $623,492 $583,479 $1,317,721 $1,436,013 $1,343,855 $10.94 $11.92 $11.15
4C1 $225,254 $245,475 $229,721 $404,037 $440,307 $412,050 $572,132 $623,492 $583,479 $1,201,422 $1,309,274 $1,225,250 $9.97 $10.87 $10.17
4C2 $289,086 $315,037 $294,819 $404,037 $440,307 $412,050 $572,132 $623,492 $583,479 $1,265,254 $1,378,837 $1,290,348 $10.50 $11.44 $10.71
4C3 $304,710 $332,064 $310,753 $404,037 $440,307 $412,050 $572,132 $623,492 $583,479 $1,280,878 $1,395,863 $1,306,282 $10.63 $11.58 $10.84
4D1 $279,196 $304,260 $284,733 $404,037 $440,307 $412,050 $572,132 $623,492 $583,479 $1,255,365 $1,368,059 $1,280,262 $10.42 $11.35 $10.62
4D2 $343,028 $373,822 $349,832 $404,037 $440,307 $412,050 $572,132 $623,492 $583,479 $1,319,197 $1,437,622 $1,345,361 $10.95 $11.93 $11.16
4D3 $358,652 $390,849 $365,766 $404,037 $440,307 $412,050 $572,132 $623,492 $583,479 $1,334,821 $1,454,648 $1,361,294 $11.08 $12.07 $11.30
Table 4-7: Summary of High School (Base Cases) First Costs - Continued
Energy and Cost Benefit Analyses of HVAC Systems Available to Ohio Schools
4-14
The balance of the life-cycle calculation includes annual energy costs savings, and service andmaintenance costs, discounted over a period of 20 years. Annual energy operating costs used inthe life-cycle analyses are the same as those presented earlier in Chapter 3. These include siteenergy costs for electricity, natural gas and fuel oil.
Service and maintenance costs were calculated in the same fashion as the approach used tocalculate equipment first costs. Note that service and maintenance costs include annualizedpreventive maintenance (PM) repair and replacement costs. These costs were developed fromdata in the databases. RSMeans 2000® breaks Service and Maintenance into two major elements:
• Preventive (Scheduled) Maintenance (PM)• Repair and Replacement Service and Maintenance
Since repair and replacement times vary for different types of equipment, annualized (costdivided by time interval in years for repair or equipment life), cost factors were developed foreach type of equipment. These costs included a scaling factor for equipment sizes to reflect size-cost factors. Each of the equipment repair/replacement cost curves was of the slope-interceptform. Costs were determined as a function of equipment size. Ductwork service and maintenancecosts were assumed to be zero. Finally, the cost curves for both service and maintenanceelements were combined mathematically to allow one to calculate overall service andmaintenance costs for a given type of equipment. For the four heat pump cases, this process wasrepeated 76 and 99 times (number of zones and individual pieces of equipment) for theelementary and high school respectively.
Plant cooling and heating equipment service, maintenance and replacement costs were calculatedusing cost-size curve fits, along with heat pump service and maintenance costs. Terminal unitservice, maintenance and replacement costs were also determined using this same approach. Thetotal of these costs was then added, by HVAC alternative, to provide an annualized service,maintenance and replacement cost for each option. A summary of these costs, by HVAC option,for the elementary and high schools, is provided in Tables 4-8 and 4-9 respectively.
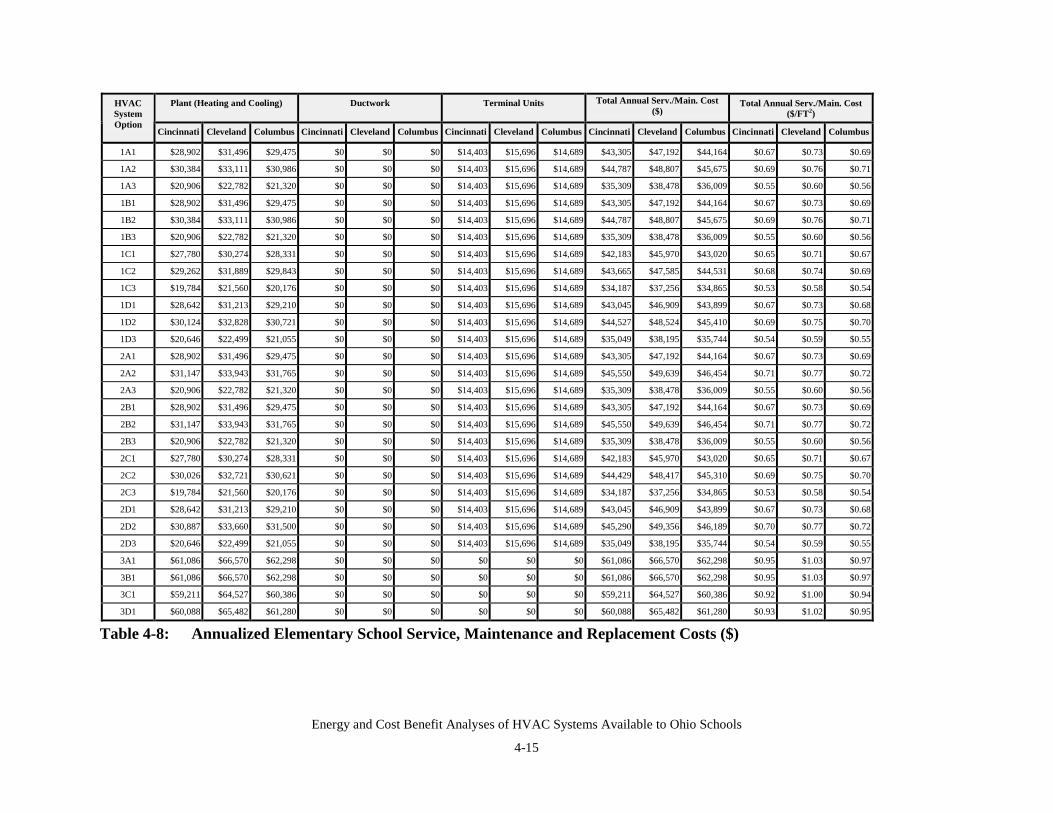
Energy and Cost Benefit Analyses of HVAC Systems Available to Ohio Schools
4-15
Plant (Heating and Cooling) Ductwork Terminal Units Total Annual Serv./Main. Cost($)
Total Annual Serv./Main. Cost($/FT2)
HVACSystemOption
Cincinnati Cleveland Columbus Cincinnati Cleveland Columbus Cincinnati Cleveland Columbus Cincinnati Cleveland Columbus Cincinnati Cleveland Columbus
1A1 $28,902 $31,496 $29,475 $0 $0 $0 $14,403 $15,696 $14,689 $43,305 $47,192 $44,164 $0.67 $0.73 $0.69
1A2 $30,384 $33,111 $30,986 $0 $0 $0 $14,403 $15,696 $14,689 $44,787 $48,807 $45,675 $0.69 $0.76 $0.71
1A3 $20,906 $22,782 $21,320 $0 $0 $0 $14,403 $15,696 $14,689 $35,309 $38,478 $36,009 $0.55 $0.60 $0.56
1B1 $28,902 $31,496 $29,475 $0 $0 $0 $14,403 $15,696 $14,689 $43,305 $47,192 $44,164 $0.67 $0.73 $0.69
1B2 $30,384 $33,111 $30,986 $0 $0 $0 $14,403 $15,696 $14,689 $44,787 $48,807 $45,675 $0.69 $0.76 $0.71
1B3 $20,906 $22,782 $21,320 $0 $0 $0 $14,403 $15,696 $14,689 $35,309 $38,478 $36,009 $0.55 $0.60 $0.56
1C1 $27,780 $30,274 $28,331 $0 $0 $0 $14,403 $15,696 $14,689 $42,183 $45,970 $43,020 $0.65 $0.71 $0.67
1C2 $29,262 $31,889 $29,843 $0 $0 $0 $14,403 $15,696 $14,689 $43,665 $47,585 $44,531 $0.68 $0.74 $0.69
1C3 $19,784 $21,560 $20,176 $0 $0 $0 $14,403 $15,696 $14,689 $34,187 $37,256 $34,865 $0.53 $0.58 $0.54
1D1 $28,642 $31,213 $29,210 $0 $0 $0 $14,403 $15,696 $14,689 $43,045 $46,909 $43,899 $0.67 $0.73 $0.68
1D2 $30,124 $32,828 $30,721 $0 $0 $0 $14,403 $15,696 $14,689 $44,527 $48,524 $45,410 $0.69 $0.75 $0.70
1D3 $20,646 $22,499 $21,055 $0 $0 $0 $14,403 $15,696 $14,689 $35,049 $38,195 $35,744 $0.54 $0.59 $0.55
2A1 $28,902 $31,496 $29,475 $0 $0 $0 $14,403 $15,696 $14,689 $43,305 $47,192 $44,164 $0.67 $0.73 $0.69
2A2 $31,147 $33,943 $31,765 $0 $0 $0 $14,403 $15,696 $14,689 $45,550 $49,639 $46,454 $0.71 $0.77 $0.72
2A3 $20,906 $22,782 $21,320 $0 $0 $0 $14,403 $15,696 $14,689 $35,309 $38,478 $36,009 $0.55 $0.60 $0.56
2B1 $28,902 $31,496 $29,475 $0 $0 $0 $14,403 $15,696 $14,689 $43,305 $47,192 $44,164 $0.67 $0.73 $0.69
2B2 $31,147 $33,943 $31,765 $0 $0 $0 $14,403 $15,696 $14,689 $45,550 $49,639 $46,454 $0.71 $0.77 $0.72
2B3 $20,906 $22,782 $21,320 $0 $0 $0 $14,403 $15,696 $14,689 $35,309 $38,478 $36,009 $0.55 $0.60 $0.56
2C1 $27,780 $30,274 $28,331 $0 $0 $0 $14,403 $15,696 $14,689 $42,183 $45,970 $43,020 $0.65 $0.71 $0.67
2C2 $30,026 $32,721 $30,621 $0 $0 $0 $14,403 $15,696 $14,689 $44,429 $48,417 $45,310 $0.69 $0.75 $0.70
2C3 $19,784 $21,560 $20,176 $0 $0 $0 $14,403 $15,696 $14,689 $34,187 $37,256 $34,865 $0.53 $0.58 $0.54
2D1 $28,642 $31,213 $29,210 $0 $0 $0 $14,403 $15,696 $14,689 $43,045 $46,909 $43,899 $0.67 $0.73 $0.68
2D2 $30,887 $33,660 $31,500 $0 $0 $0 $14,403 $15,696 $14,689 $45,290 $49,356 $46,189 $0.70 $0.77 $0.72
2D3 $20,646 $22,499 $21,055 $0 $0 $0 $14,403 $15,696 $14,689 $35,049 $38,195 $35,744 $0.54 $0.59 $0.55
3A1 $61,086 $66,570 $62,298 $0 $0 $0 $0 $0 $0 $61,086 $66,570 $62,298 $0.95 $1.03 $0.97
3B1 $61,086 $66,570 $62,298 $0 $0 $0 $0 $0 $0 $61,086 $66,570 $62,298 $0.95 $1.03 $0.97
3C1 $59,211 $64,527 $60,386 $0 $0 $0 $0 $0 $0 $59,211 $64,527 $60,386 $0.92 $1.00 $0.94
3D1 $60,088 $65,482 $61,280 $0 $0 $0 $0 $0 $0 $60,088 $65,482 $61,280 $0.93 $1.02 $0.95
Table 4-8: Annualized Elementary School Service, Maintenance and Replacement Costs ($)

Energy and Cost Benefit Analyses of HVAC Systems Available to Ohio Schools
4-16
Plant (Heating and Cooling) Ductwork Terminal Units Total Annual Serv./Main. Cost($)
Total Annual Serv./Main. Cost($/FT2)
HVACSystemOption
Cincinnati Cleveland Columbus Cincinnati Cleveland Columbus Cincinnati Cleveland Columbus Cincinnati Cleveland Columbus Cincinnati Cleveland Columbus
4A1 $31,211 $34,012 $31,830 $0 $0 $0 $14,403 $15,696 $14,689 $45,614 $49,709 $46,519 $0.71 $0.77 $0.72
4A2 $32,693 $35,627 $33,341 $0 $0 $0 $14,403 $15,696 $14,689 $47,096 $51,324 $48,030 $0.73 $0.80 $0.75
4A3 $23,215 $25,299 $23,675 $0 $0 $0 $14,403 $15,696 $14,689 $37,618 $40,995 $38,364 $0.58 $0.64 $0.60
4B1 $31,211 $34,012 $31,830 $0 $0 $0 $14,403 $15,696 $14,689 $45,614 $49,709 $46,519 $0.71 $0.77 $0.72
4B2 $32,693 $35,627 $33,341 $0 $0 $0 $14,403 $15,696 $14,689 $47,096 $51,324 $48,030 $0.73 $0.80 $0.75
4B3 $23,215 $25,299 $23,675 $0 $0 $0 $14,403 $15,696 $14,689 $37,618 $40,995 $38,364 $0.58 $0.64 $0.60
4C1 $29,335 $31,969 $29,917 $0 $0 $0 $14,403 $15,696 $14,689 $43,739 $47,665 $44,606 $0.68 $0.74 $0.69
4C2 $30,817 $33,584 $31,429 $0 $0 $0 $14,403 $15,696 $14,689 $45,221 $49,280 $46,118 $0.70 $0.76 $0.72
4C3 $21,339 $23,255 $21,763 $0 $0 $0 $14,403 $15,696 $14,689 $35,743 $38,951 $36,451 $0.55 $0.60 $0.57
4D1 $30,213 $32,925 $30,812 $0 $0 $0 $14,403 $15,696 $14,689 $44,616 $48,621 $45,501 $0.69 $0.75 $0.71
4D2 $31,695 $34,540 $32,323 $0 $0 $0 $14,403 $15,696 $14,689 $46,098 $50,236 $47,012 $0.72 $0.78 $0.73
4D3 $22,216 $24,211 $22,657 $0 $0 $0 $14,403 $15,696 $14,689 $36,620 $39,907 $37,346 $0.57 $0.62 $0.58
Table 4-8: Annualized Elementary School Service, Maintenance and Replacement Costs ($) - Continued
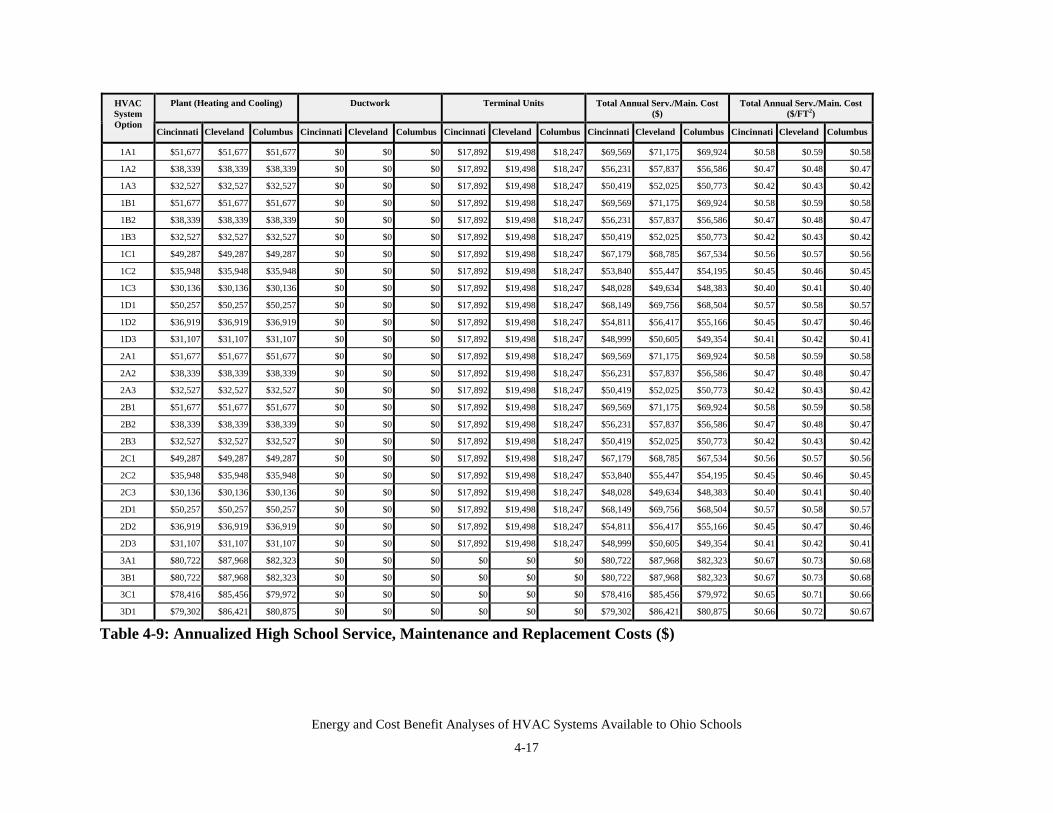
Energy and Cost Benefit Analyses of HVAC Systems Available to Ohio Schools
4-17
Plant (Heating and Cooling) Ductwork Terminal Units Total Annual Serv./Main. Cost($)
Total Annual Serv./Main. Cost($/FT2)
HVACSystemOption
Cincinnati Cleveland Columbus Cincinnati Cleveland Columbus Cincinnati Cleveland Columbus Cincinnati Cleveland Columbus Cincinnati Cleveland Columbus
1A1 $51,677 $51,677 $51,677 $0 $0 $0 $17,892 $19,498 $18,247 $69,569 $71,175 $69,924 $0.58 $0.59 $0.58
1A2 $38,339 $38,339 $38,339 $0 $0 $0 $17,892 $19,498 $18,247 $56,231 $57,837 $56,586 $0.47 $0.48 $0.47
1A3 $32,527 $32,527 $32,527 $0 $0 $0 $17,892 $19,498 $18,247 $50,419 $52,025 $50,773 $0.42 $0.43 $0.42
1B1 $51,677 $51,677 $51,677 $0 $0 $0 $17,892 $19,498 $18,247 $69,569 $71,175 $69,924 $0.58 $0.59 $0.58
1B2 $38,339 $38,339 $38,339 $0 $0 $0 $17,892 $19,498 $18,247 $56,231 $57,837 $56,586 $0.47 $0.48 $0.47
1B3 $32,527 $32,527 $32,527 $0 $0 $0 $17,892 $19,498 $18,247 $50,419 $52,025 $50,773 $0.42 $0.43 $0.42
1C1 $49,287 $49,287 $49,287 $0 $0 $0 $17,892 $19,498 $18,247 $67,179 $68,785 $67,534 $0.56 $0.57 $0.56
1C2 $35,948 $35,948 $35,948 $0 $0 $0 $17,892 $19,498 $18,247 $53,840 $55,447 $54,195 $0.45 $0.46 $0.45
1C3 $30,136 $30,136 $30,136 $0 $0 $0 $17,892 $19,498 $18,247 $48,028 $49,634 $48,383 $0.40 $0.41 $0.40
1D1 $50,257 $50,257 $50,257 $0 $0 $0 $17,892 $19,498 $18,247 $68,149 $69,756 $68,504 $0.57 $0.58 $0.57
1D2 $36,919 $36,919 $36,919 $0 $0 $0 $17,892 $19,498 $18,247 $54,811 $56,417 $55,166 $0.45 $0.47 $0.46
1D3 $31,107 $31,107 $31,107 $0 $0 $0 $17,892 $19,498 $18,247 $48,999 $50,605 $49,354 $0.41 $0.42 $0.41
2A1 $51,677 $51,677 $51,677 $0 $0 $0 $17,892 $19,498 $18,247 $69,569 $71,175 $69,924 $0.58 $0.59 $0.58
2A2 $38,339 $38,339 $38,339 $0 $0 $0 $17,892 $19,498 $18,247 $56,231 $57,837 $56,586 $0.47 $0.48 $0.47
2A3 $32,527 $32,527 $32,527 $0 $0 $0 $17,892 $19,498 $18,247 $50,419 $52,025 $50,773 $0.42 $0.43 $0.42
2B1 $51,677 $51,677 $51,677 $0 $0 $0 $17,892 $19,498 $18,247 $69,569 $71,175 $69,924 $0.58 $0.59 $0.58
2B2 $38,339 $38,339 $38,339 $0 $0 $0 $17,892 $19,498 $18,247 $56,231 $57,837 $56,586 $0.47 $0.48 $0.47
2B3 $32,527 $32,527 $32,527 $0 $0 $0 $17,892 $19,498 $18,247 $50,419 $52,025 $50,773 $0.42 $0.43 $0.42
2C1 $49,287 $49,287 $49,287 $0 $0 $0 $17,892 $19,498 $18,247 $67,179 $68,785 $67,534 $0.56 $0.57 $0.56
2C2 $35,948 $35,948 $35,948 $0 $0 $0 $17,892 $19,498 $18,247 $53,840 $55,447 $54,195 $0.45 $0.46 $0.45
2C3 $30,136 $30,136 $30,136 $0 $0 $0 $17,892 $19,498 $18,247 $48,028 $49,634 $48,383 $0.40 $0.41 $0.40
2D1 $50,257 $50,257 $50,257 $0 $0 $0 $17,892 $19,498 $18,247 $68,149 $69,756 $68,504 $0.57 $0.58 $0.57
2D2 $36,919 $36,919 $36,919 $0 $0 $0 $17,892 $19,498 $18,247 $54,811 $56,417 $55,166 $0.45 $0.47 $0.46
2D3 $31,107 $31,107 $31,107 $0 $0 $0 $17,892 $19,498 $18,247 $48,999 $50,605 $49,354 $0.41 $0.42 $0.41
3A1 $80,722 $87,968 $82,323 $0 $0 $0 $0 $0 $0 $80,722 $87,968 $82,323 $0.67 $0.73 $0.68
3B1 $80,722 $87,968 $82,323 $0 $0 $0 $0 $0 $0 $80,722 $87,968 $82,323 $0.67 $0.73 $0.68
3C1 $78,416 $85,456 $79,972 $0 $0 $0 $0 $0 $0 $78,416 $85,456 $79,972 $0.65 $0.71 $0.66
3D1 $79,302 $86,421 $80,875 $0 $0 $0 $0 $0 $0 $79,302 $86,421 $80,875 $0.66 $0.72 $0.67
Table 4-9: Annualized High School Service, Maintenance and Replacement Costs ($)
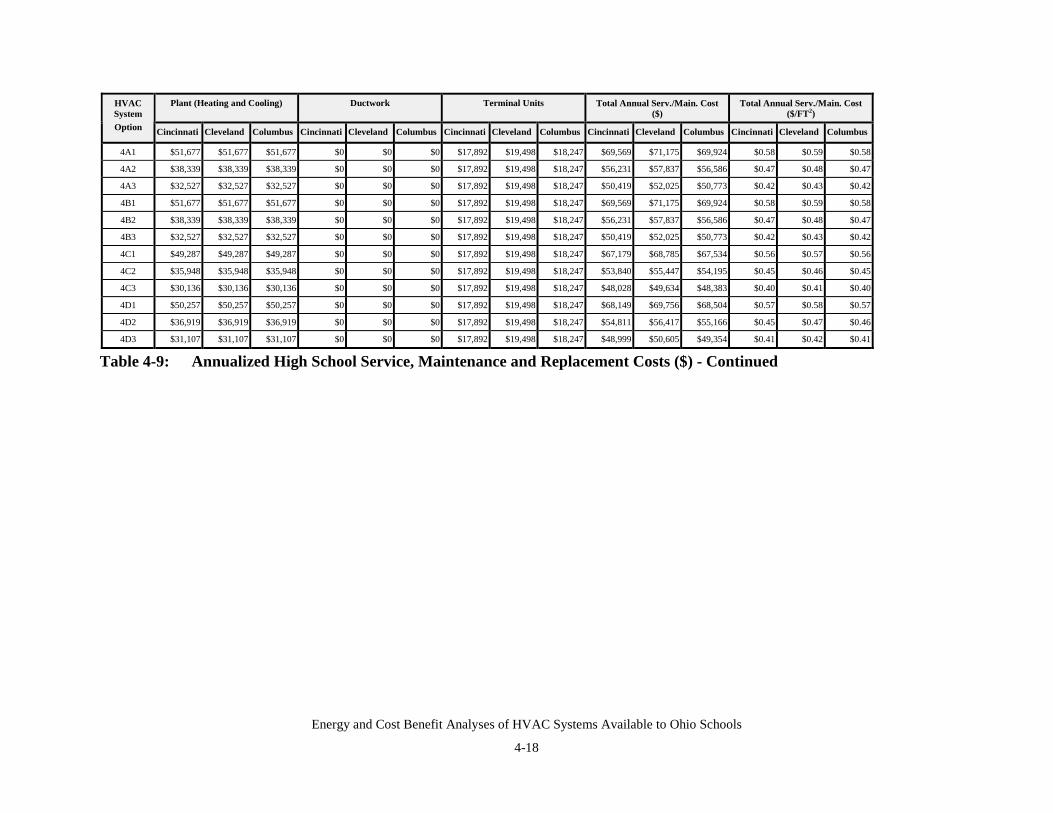
Energy and Cost Benefit Analyses of HVAC Systems Available to Ohio Schools
4-18
Plant (Heating and Cooling) Ductwork Terminal Units Total Annual Serv./Main. Cost($)
Total Annual Serv./Main. Cost($/FT2)
HVACSystemOption Cincinnati Cleveland Columbus Cincinnati Cleveland Columbus Cincinnati Cleveland Columbus Cincinnati Cleveland Columbus Cincinnati Cleveland Columbus
4A1 $51,677 $51,677 $51,677 $0 $0 $0 $17,892 $19,498 $18,247 $69,569 $71,175 $69,924 $0.58 $0.59 $0.58
4A2 $38,339 $38,339 $38,339 $0 $0 $0 $17,892 $19,498 $18,247 $56,231 $57,837 $56,586 $0.47 $0.48 $0.47
4A3 $32,527 $32,527 $32,527 $0 $0 $0 $17,892 $19,498 $18,247 $50,419 $52,025 $50,773 $0.42 $0.43 $0.42
4B1 $51,677 $51,677 $51,677 $0 $0 $0 $17,892 $19,498 $18,247 $69,569 $71,175 $69,924 $0.58 $0.59 $0.58
4B2 $38,339 $38,339 $38,339 $0 $0 $0 $17,892 $19,498 $18,247 $56,231 $57,837 $56,586 $0.47 $0.48 $0.47
4B3 $32,527 $32,527 $32,527 $0 $0 $0 $17,892 $19,498 $18,247 $50,419 $52,025 $50,773 $0.42 $0.43 $0.42
4C1 $49,287 $49,287 $49,287 $0 $0 $0 $17,892 $19,498 $18,247 $67,179 $68,785 $67,534 $0.56 $0.57 $0.56
4C2 $35,948 $35,948 $35,948 $0 $0 $0 $17,892 $19,498 $18,247 $53,840 $55,447 $54,195 $0.45 $0.46 $0.45
4C3 $30,136 $30,136 $30,136 $0 $0 $0 $17,892 $19,498 $18,247 $48,028 $49,634 $48,383 $0.40 $0.41 $0.40
4D1 $50,257 $50,257 $50,257 $0 $0 $0 $17,892 $19,498 $18,247 $68,149 $69,756 $68,504 $0.57 $0.58 $0.57
4D2 $36,919 $36,919 $36,919 $0 $0 $0 $17,892 $19,498 $18,247 $54,811 $56,417 $55,166 $0.45 $0.47 $0.46
4D3 $31,107 $31,107 $31,107 $0 $0 $0 $17,892 $19,498 $18,247 $48,999 $50,605 $49,354 $0.41 $0.42 $0.41
Table 4-9: Annualized High School Service, Maintenance and Replacement Costs ($) - Continued
Energy and Cost Benefit Analyses of HVAC Systems Available to Ohio Schools
4-19
Life cycle costs (present values) for each of the 40 HVAC options, in each city and school type,were calculated by adding:
• Total plant cost
• Present value of annual energy costs for a period of 20 years discounted at 6%
• Present value of service and maintenance costs for a period of 20 years discounted at 6%
4.2 Life-Cycle Results
The resulting life cycle, or present value costs, can be used to compare the 40 HVAC optionsagainst one another for a twenty-year period. Results, by HVAC system option, building typeand location (city) are presented in Table 4-10.
A example plot of the first eight systems, for all three cities, in the elementary school, is shownin Figure 4-1. The balance of the data plots can be found in Appendix B.
For all baseline cases, Tables 4-11 and 4-12 present the data sorted by systems, for theelementary and high school respectively.

Energy and Cost Benefit Analyses of HVAC Systems Available to Ohio Schools
4-20
Elementary School PV High School PVHVACSystemOption Cincinnati Cleveland Columbus Cincinnati Cleveland Columbus
1A1 $2,261,461 $2,273,597 $2,039,729 $3,568,508 $3,790,284 $3,254,888
1A2 $2,089,820 $2,259,071 $2,009,998 $3,309,636 $3,620,795 $3,097,026
1A3 $1,992,541 $2,167,169 $1,897,806 $3,171,234 $3,593,209 $3,048,756
1B1 $2,262,805 $2,277,957 $2,040,889 $3,570,224 $3,793,776 $3,255,317
1B2 $2,091,178 $2,263,431 $2,011,158 $3,311,351 $3,624,279 $3,098,918
1B3 $1,993,885 $2,171,512 $1,898,981 $3,172,949 $3,596,682 $3,050,648
1C1 $2,273,361 $2,623,904 $2,160,979 $4,005,833 $5,108,087 $4,311,459
1C2 $2,171,692 $2,609,503 $2,188,021 $3,830,911 $4,951,865 $4,209,323
1C3 $2,080,509 $2,517,401 $2,094,461 $3,749,436 $4,928,594 $4,168,980
1D1 $2,287,288 $2,297,804 $2,057,735 $3,614,668 $3,800,680 $3,259,530
1D2 $2,115,661 $2,283,345 $2,028,004 $3,355,795 $3,631,178 $3,103,976
1D3 $2,018,368 $2,191,439 $1,915,842 $3,217,393 $3,603,582 $3,055,706
2A1 $2,320,189 $2,365,151 $2,110,400 $3,626,601 $3,852,642 $3,314,642
2A2 $2,170,636 $2,359,263 $2,081,798 $3,357,926 $3,681,699 $3,148,333
2A3 $2,048,769 $2,247,842 $1,964,275 $3,220,747 $3,652,887 $3,101,595
2B1 $2,321,616 $2,369,426 $2,111,690 $3,628,266 $3,855,846 $3,315,053
2B2 $2,172,063 $2,359,184 $2,083,087 $3,359,591 $3,684,994 $3,150,042
2B3 $2,050,196 $2,252,116 $1,965,565 $3,222,413 $3,656,084 $3,103,304
2C1 $2,337,603 $2,718,873 $2,229,238 $4,033,456 $5,119,622 $4,314,507
2C2 $2,253,149 $2,711,426 $2,267,987 $3,846,842 $4,953,038 $4,212,096
2C3 $2,140,160 $2,604,273 $2,158,017 $3,767,441 $4,931,011 $4,172,208
2D1 $2,346,980 $2,389,114 $2,128,345 $3,671,074 $3,862,841 $3,319,349
2D2 $2,197,426 $2,378,873 $2,099,743 $3,402,399 $3,691,899 $3,155,138
2D3 $2,075,560 $2,271,805 $1,982,220 $3,265,221 $3,663,075 $3,108,400
3A1 $2,543,046 $3,027,582 $2,560,640 $3,733,698 $4,439,659 $3,737,391
3B1 $2,545,447 $3,030,219 $2,562,762 $3,736,381 $4,443,574 $3,739,500
3C1 $2,891,908 $3,693,610 $3,209,445 $4,211,895 $5,386,801 $4,653,274
3D1 $2,571,823 $3,040,369 $2,572,124 $3,765,145 $4,450,181 $3,757,817
4A1 $2,486,601 $2,614,983 $2,296,441 $3,752,433 $4,036,898 $3,457,288
4A2 $2,344,233 $2,604,909 $2,275,409 $3,502,689 $3,869,390 $3,310,622
4A3 $2,237,056 $2,513,164 $2,175,216 $3,365,500 $3,842,568 $3,264,028
4B1 $2,488,608 $2,617,931 $2,297,803 $3,754,188 $4,040,770 $3,457,762
4B2 $2,346,239 $2,607,857 $2,277,269 $3,504,443 $3,873,259 $3,312,544
4B3 $2,239,062 $2,516,112 $2,177,619 $3,367,282 $3,846,432 $3,265,968
4C1 $2,700,720 $3,285,501 $2,893,625 $4,261,246 $5,465,692 $4,663,607
4C2 $2,636,775 $3,275,394 $2,949,214 $4,092,624 $5,312,976 $4,561,566
4C3 $2,540,251 $3,183,553 $2,867,422 $4,013,104 $5,290,055 $4,521,240
4D1 $2,512,151 $2,627,896 $2,305,998 $3,801,126 $4,047,341 $3,461,836
4D2 $2,369,783 $2,617,822 $2,285,811 $3,551,382 $3,879,910 $3,317,477
4D3 $2,262,606 $2,526,074 $2,185,040 $3,414,221 $3,853,082 $3,270,901
Table 4-10: Life Cycle Costs for All Baseline Options
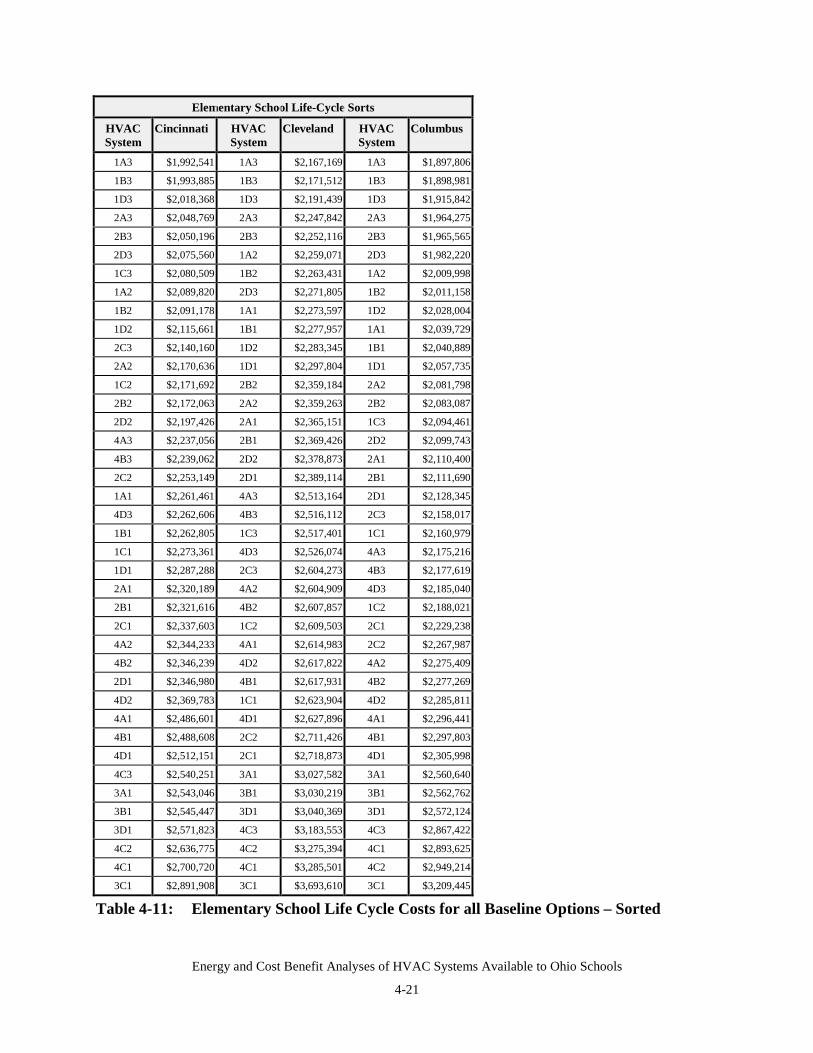
Energy and Cost Benefit Analyses of HVAC Systems Available to Ohio Schools
4-21
Elementary School Life-Cycle Sorts
HVACSystem
Cincinnati HVACSystem
Cleveland HVACSystem
Columbus
1A3 $1,992,541 1A3 $2,167,169 1A3 $1,897,806
1B3 $1,993,885 1B3 $2,171,512 1B3 $1,898,981
1D3 $2,018,368 1D3 $2,191,439 1D3 $1,915,842
2A3 $2,048,769 2A3 $2,247,842 2A3 $1,964,275
2B3 $2,050,196 2B3 $2,252,116 2B3 $1,965,565
2D3 $2,075,560 1A2 $2,259,071 2D3 $1,982,220
1C3 $2,080,509 1B2 $2,263,431 1A2 $2,009,998
1A2 $2,089,820 2D3 $2,271,805 1B2 $2,011,158
1B2 $2,091,178 1A1 $2,273,597 1D2 $2,028,004
1D2 $2,115,661 1B1 $2,277,957 1A1 $2,039,729
2C3 $2,140,160 1D2 $2,283,345 1B1 $2,040,889
2A2 $2,170,636 1D1 $2,297,804 1D1 $2,057,735
1C2 $2,171,692 2B2 $2,359,184 2A2 $2,081,798
2B2 $2,172,063 2A2 $2,359,263 2B2 $2,083,087
2D2 $2,197,426 2A1 $2,365,151 1C3 $2,094,461
4A3 $2,237,056 2B1 $2,369,426 2D2 $2,099,743
4B3 $2,239,062 2D2 $2,378,873 2A1 $2,110,400
2C2 $2,253,149 2D1 $2,389,114 2B1 $2,111,690
1A1 $2,261,461 4A3 $2,513,164 2D1 $2,128,345
4D3 $2,262,606 4B3 $2,516,112 2C3 $2,158,017
1B1 $2,262,805 1C3 $2,517,401 1C1 $2,160,979
1C1 $2,273,361 4D3 $2,526,074 4A3 $2,175,216
1D1 $2,287,288 2C3 $2,604,273 4B3 $2,177,619
2A1 $2,320,189 4A2 $2,604,909 4D3 $2,185,040
2B1 $2,321,616 4B2 $2,607,857 1C2 $2,188,021
2C1 $2,337,603 1C2 $2,609,503 2C1 $2,229,238
4A2 $2,344,233 4A1 $2,614,983 2C2 $2,267,987
4B2 $2,346,239 4D2 $2,617,822 4A2 $2,275,409
2D1 $2,346,980 4B1 $2,617,931 4B2 $2,277,269
4D2 $2,369,783 1C1 $2,623,904 4D2 $2,285,811
4A1 $2,486,601 4D1 $2,627,896 4A1 $2,296,441
4B1 $2,488,608 2C2 $2,711,426 4B1 $2,297,803
4D1 $2,512,151 2C1 $2,718,873 4D1 $2,305,998
4C3 $2,540,251 3A1 $3,027,582 3A1 $2,560,640
3A1 $2,543,046 3B1 $3,030,219 3B1 $2,562,762
3B1 $2,545,447 3D1 $3,040,369 3D1 $2,572,124
3D1 $2,571,823 4C3 $3,183,553 4C3 $2,867,422
4C2 $2,636,775 4C2 $3,275,394 4C1 $2,893,625
4C1 $2,700,720 4C1 $3,285,501 4C2 $2,949,214
3C1 $2,891,908 3C1 $3,693,610 3C1 $3,209,445
Table 4-11: Elementary School Life Cycle Costs for all Baseline Options – Sorted
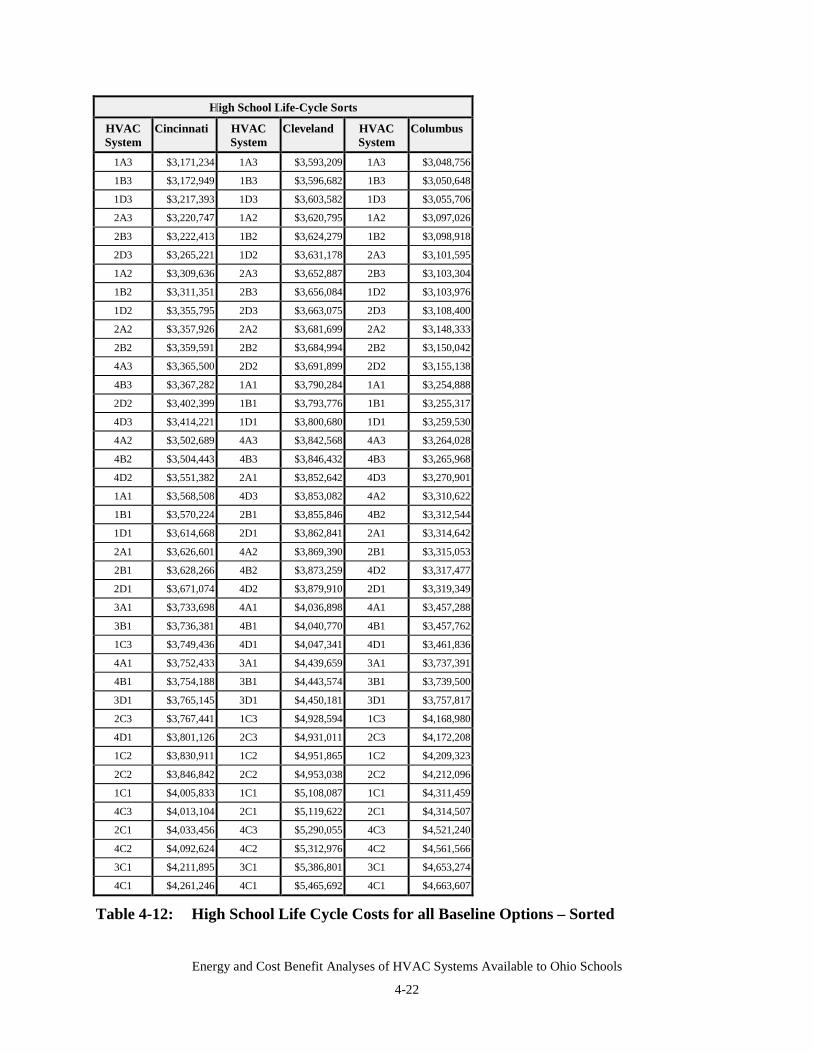
Energy and Cost Benefit Analyses of HVAC Systems Available to Ohio Schools
4-22
High School Life-Cycle Sorts
HVACSystem
Cincinnati HVACSystem
Cleveland HVACSystem
Columbus
1A3 $3,171,234 1A3 $3,593,209 1A3 $3,048,756
1B3 $3,172,949 1B3 $3,596,682 1B3 $3,050,648
1D3 $3,217,393 1D3 $3,603,582 1D3 $3,055,706
2A3 $3,220,747 1A2 $3,620,795 1A2 $3,097,026
2B3 $3,222,413 1B2 $3,624,279 1B2 $3,098,918
2D3 $3,265,221 1D2 $3,631,178 2A3 $3,101,595
1A2 $3,309,636 2A3 $3,652,887 2B3 $3,103,304
1B2 $3,311,351 2B3 $3,656,084 1D2 $3,103,976
1D2 $3,355,795 2D3 $3,663,075 2D3 $3,108,400
2A2 $3,357,926 2A2 $3,681,699 2A2 $3,148,333
2B2 $3,359,591 2B2 $3,684,994 2B2 $3,150,042
4A3 $3,365,500 2D2 $3,691,899 2D2 $3,155,138
4B3 $3,367,282 1A1 $3,790,284 1A1 $3,254,888
2D2 $3,402,399 1B1 $3,793,776 1B1 $3,255,317
4D3 $3,414,221 1D1 $3,800,680 1D1 $3,259,530
4A2 $3,502,689 4A3 $3,842,568 4A3 $3,264,028
4B2 $3,504,443 4B3 $3,846,432 4B3 $3,265,968
4D2 $3,551,382 2A1 $3,852,642 4D3 $3,270,901
1A1 $3,568,508 4D3 $3,853,082 4A2 $3,310,622
1B1 $3,570,224 2B1 $3,855,846 4B2 $3,312,544
1D1 $3,614,668 2D1 $3,862,841 2A1 $3,314,642
2A1 $3,626,601 4A2 $3,869,390 2B1 $3,315,053
2B1 $3,628,266 4B2 $3,873,259 4D2 $3,317,477
2D1 $3,671,074 4D2 $3,879,910 2D1 $3,319,349
3A1 $3,733,698 4A1 $4,036,898 4A1 $3,457,288
3B1 $3,736,381 4B1 $4,040,770 4B1 $3,457,762
1C3 $3,749,436 4D1 $4,047,341 4D1 $3,461,836
4A1 $3,752,433 3A1 $4,439,659 3A1 $3,737,391
4B1 $3,754,188 3B1 $4,443,574 3B1 $3,739,500
3D1 $3,765,145 3D1 $4,450,181 3D1 $3,757,817
2C3 $3,767,441 1C3 $4,928,594 1C3 $4,168,980
4D1 $3,801,126 2C3 $4,931,011 2C3 $4,172,208
1C2 $3,830,911 1C2 $4,951,865 1C2 $4,209,323
2C2 $3,846,842 2C2 $4,953,038 2C2 $4,212,096
1C1 $4,005,833 1C1 $5,108,087 1C1 $4,311,459
4C3 $4,013,104 2C1 $5,119,622 2C1 $4,314,507
2C1 $4,033,456 4C3 $5,290,055 4C3 $4,521,240
4C2 $4,092,624 4C2 $5,312,976 4C2 $4,561,566
3C1 $4,211,895 3C1 $5,386,801 3C1 $4,653,274
4C1 $4,261,246 4C1 $5,465,692 4C1 $4,663,607
Table 4-12: High School Life Cycle Costs for all Baseline Options – Sorted
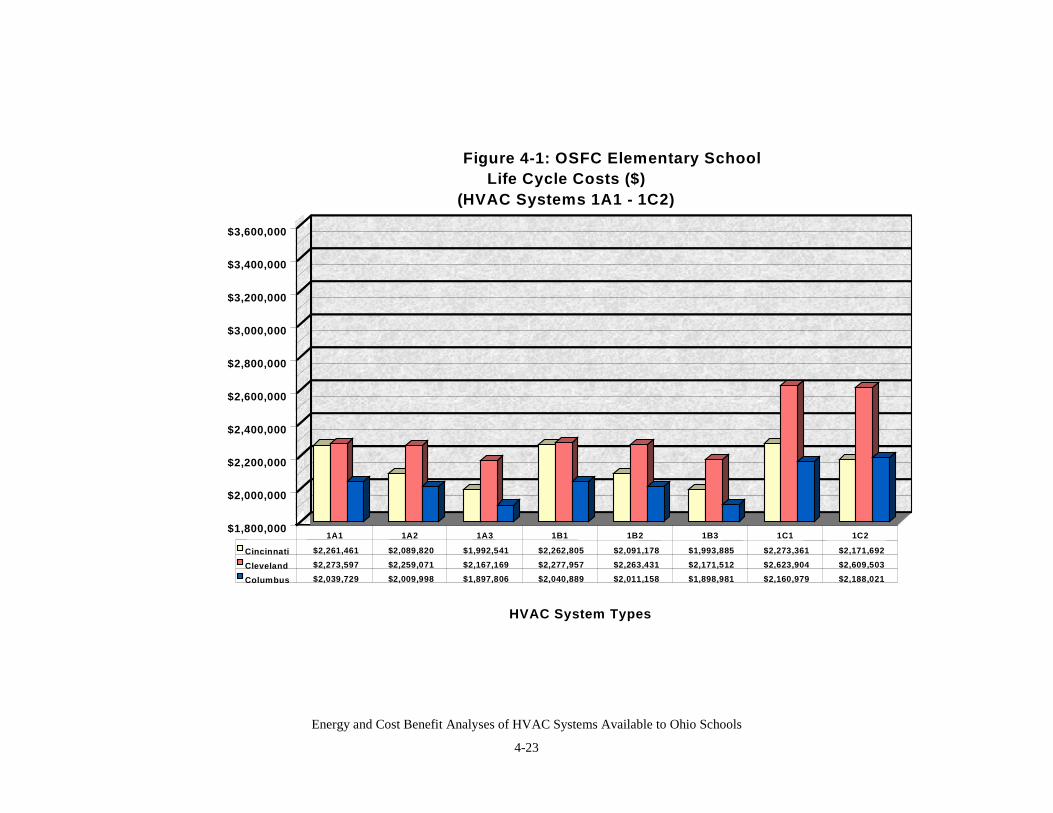
Energy and Cost Benefit Analyses of HVAC Systems Available to Ohio Schools
4-23
$1,800,000
$2,000,000
$2,200,000
$2,400,000
$2,600,000
$2,800,000
$3,000,000
$3,200,000
$3,400,000
$3,600,000
HVAC System Types
Figure 4-1: OSFC Elementary SchoolLife Cycle Costs ($)
(HVAC Systems 1A1 - 1C2)
Cincinnati $2,261,461 $2,089,820 $1,992,541 $2,262,805 $2,091,178 $1,993,885 $2,273,361 $2,171,692
Cleveland $2,273,597 $2,259,071 $2,167,169 $2,277,957 $2,263,431 $2,171,512 $2,623,904 $2,609,503
Columbus $2,039,729 $2,009,998 $1,897,806 $2,040,889 $2,011,158 $1,898,981 $2,160,979 $2,188,021
1A1 1A2 1A3 1B1 1B2 1B3 1C1 1C2
Energy and Cost Benefit Analyses of HVAC Systems Available to Ohio Schools
4-24
4.3 Life-Cycle Results – Observations
In reviewing the data shown in Tables 4-10 through 4-12, and the related figures, the followingobservations were made:
• For the elementary school, the least cost life-cycle system was $1,897,806 {Columbus, 1A3HVAC option} (VAV with reheat air option, atmospheric natural gas boiler heating optionwith a water-cooled centrifugal chiller cooler option) and the highest cost life-cycle systemwas $3,693,610 (Cleveland, 3C1 HVAC option). The ratio of the highest to the lowest life-cycle costs for Cincinnati, Cleveland and Columbus were 1.45, 1.70 and 1.69 respectively.This implies the highest cost HVAC options were 45%, 70% and 69% higher than the lowercost HVAC options respectively.
• For the high school, the least cost life-cycle system was $3,048,756 (Columbus, 1A3 HVACoption) and the highest cost life-cycle system was $5,465,692 (Cleveland, 3C1 HVACoption). The ratio of the highest to the lowest life-cycle costs for Cincinnati, Cleveland andColumbus were 1.34, 1.52 and 1.53 respectively. This implies the highest cost HVACoptions were 34%, 52% and 53% higher than the lower cost HVAC options respectively.
• Life cycle costs for a given HVAC option were usually highest in Cleveland, followed byColumbus and then Cincinnati.
• The least, and highest cost HVAC systems tended to be independent of location and buildingtype. In other words, the least cost and the highest cost HVAC options in all three locations,and for the elementary and high schools, tended to be the same HVAC options.
• Least cost HVAC options tended to be VAV with reheat air systems using water-cooledcentrifugal chillers.
• Highest cost HVAC options tended to be all electric systems using air-cooled chillers or theall-electric heat pump options.
Energy and Cost Benefit Analyses of HVAC Systems Available to Ohio Schools
5-1
5.0 PHASE 2 APPROACH
Phase 2, and related additional activities, were intended to consider sustainable energy savingsalternatives that might provide cost-effective savings to equipment used in future school designs.In discussions with ODOD staff, including advisors to ODOD, it was generally agreed that theproject team should use the following approach to selecting energy alternatives:
• Use the HB 264 web page list of energy alternatives as a list of available energy savingsalternatives
• Select energy saving alternatives not already included in the Ohio School Design Manual(e.g., T-8 lighting)
• Select energy saving alternatives that have the potential to provide significant energy savings
• Select energy saving alternatives that reflect on-going issues of concern for school buildings(e.g., indoor air quality) or design trends (e.g., geothermal heat pumps).
As recommended, the initial list of alternatives considered was drawn directly from the OhioState School Facilities Commission web page (i.e., http://www.osfc.state.oh.us/264/HB264Conserv.htm) which contains an extensive list of alternatives. This list is reproducedbelow:
Building Envelope• Insulation• Roof• Walls• Ceiling• Floor• Slab• Soffits & roof facias• Windows• Double or triple glazed windows low emmitance• Eliminate unneeded windows with insulated walls• Insulated panels• Reduce window size• Reflective films• Shading devices• Solar control devices - minimize summer heat gain• Storm windows• Thermally insulated barriers, night curtains
Energy and Cost Benefit Analyses of HVAC Systems Available to Ohio Schools
5-2
• Weather stripping• Infiltration• Replace jalouse windows• Replace horizontal sliders• Revolving doors• Tight closing air dampers• Vestibules• Vinyl curtains• Ventilate attic space
Air Conditioning• Chilled water temperature reset• Chiller conversion/efficiency improvement• Chillers powered by recovered heat• Compressor demand controller• Desiccant dehumidification• Economizer cycle cooling• Evaporative cooling• Geothermal heat pumps• High efficiency electric chilling• High efficiency screw compressors• Install or modify zoning to match occupancy• Modular of localized units• Natural gas engine driven chillers• Natural gas engine driven compressors• Package units• Premium efficiency motors• Pump optimization• Reduce fan & pump speeds• Replace air cooled condensers with cooling towers• Thermal storage
Energy and Cost Benefit Analyses of HVAC Systems Available to Ohio Schools
5-3
Ventilation• Air side economizer cycle• Ceiling Fans - de-stratification• CO2 and Occupancy based ventilation• Duty cycle exhaust fans• Eliminate/reduce 100% outside air• Eliminate dual duct/reheat systems - replace with VAV• High efficiency drive belts• High velocity, low-volume exhaust hoods with baffles• Low leakage dampers• Low resistance duct systems• Low resistance air filters• Premium efficiency motors• Re-circulate exhaust air using charcoal filters• Replace with blow through air handlers, not draw through• Separate make-up air for exhaust hoods• Variable speed motors• Wire exhaust fans to light circuits• Heating Systems• Automatic ignition device• Automatic flue damper• Automatic water treatment system• Blow-down heat recovery• Boiler stack economizer• Boiler replacement - modular or localized• Condensate tank insulation• Controls to adjust water temperature with load• Convert to wood, biomass, refuse• Destratification fans• Enthalpy controls• Flash tank heat recovery• Flue gas analyzer and controls• High efficiency burners• Humidification device
Energy and Cost Benefit Analyses of HVAC Systems Available to Ohio Schools
5-4
• Infrared heaters• Efficient rooftop heating and cooling units• Non-electric thermostatic control valves on hydronic and steam heating terminal units• Outdoor temperature reset/cut-out controls on boilers• Preheat combustion air or make up water with waste heat• Pressure reducing valves in low pressure lines• Replace electric boilers with boilers using fossil fuels• Return steam condensate to boiler• Stake heat reclamation• Thermal energy storage tanks• Turbulators• Ultrasonic humidification• Vent dampers
Domestic Hot Water Heating• Automatic spa or pool heaters• Booster heaters• Controls - night shutoff, circulating pump• Demand type, tankless hot water heaters• Flow regulators, restrictors• Heat recovery water heaters• Hot water tank insulation• Localized units - replace central system• Optimized water temperature control• Replace with more efficient DHW heater• Summertime DHW heater to supplement boilers• Tempering tank• Vent dampers• Waste heat recovery for hot water production• Compressed Air Systems• Automatic traps - condensate removal• Energy efficient motors• Heat of compression air drying• Heat recovery from compressors• High efficiency compressors
Energy and Cost Benefit Analyses of HVAC Systems Available to Ohio Schools
5-5
• Natural gas driven compressors• System leakage control• Vent waste heat – summer• Distribution Systems• Booster pumps for long runs• Damper modifications• Insulate condensate return line, pipes, ducts & tanks• Localized/zone equipment• Low resistance filters• Premium efficiency motors• Pumps - reduce resistance, speed• Reduce air flow (fan speed)• Two speed motors• Zoning modifications
Lighting• Daylighting (where applicable)• Install reflectors• High Intensity Discharge (HID) Lighting• High efficiency fluorescent ballasts• LED technology for exit signs• Multiple level HID lighting• Occupancy sensors• Outdoor lighting conversions• Photosensors• Localized switching• Reduce light levels,(i.e., current timers, dimmers, tasklighting)• Reduce number of fixtures• Replace lenses and louvers• Replace incandescent with fluorescent, HID• T-8 fluorescent technology• Power Systems• High efficiency transformers• Power factor correction• Controls
Energy and Cost Benefit Analyses of HVAC Systems Available to Ohio Schools
5-6
• 24 hour time clocks on exhaust fans• Automatic radiator valves• Automatic temperature controls on radiators• Direct Digital Control Technology• Energy management systems/central control• Establish EMS objective & function• Select appropriate system to match needs & resources• Install suitable monitoring procedures• Develop reporting procedures and summaries (preventive maintenance)• Establish procedure to monitor energy use• Enthalpy controls• Outside air controls on HVAC systems• Optimum start stop controls• Relocate improperly placed thermostats• Shut down/shut off devices• Tamper proof boxes on controls• Temperature reset devices
Miscellaneous/Other• Cogeneration• Passive solar systems• Solar space heating or cooling• Solar electric generating systems• Solar domestic hot water systems• Transportation - alternative fuels (natural gas, propane, electric)• Wind generating equipment
Computers & Office Equipment
• Energy Star equipment• Specialty controls for sleep-mode control
Kitchen – Cooking• Replace conventional equipment with high efficiency equipment• Use exhaust system efficiently
Energy and Cost Benefit Analyses of HVAC Systems Available to Ohio Schools
5-7
Kitchen – Refrigeration• Control refrigeration environment by design• Defrost control• Modify or replace inefficient units• Recover/use waste heat
Kitchen - Dishwashing• Replace electric resistance booster heater with natural gas booster heater• Install low temp, low-water-volume washer with chemical sanitation
Elevators• Auto temporary shutoff control for low use periods• Install energy efficient motors• Select most efficient type of elevator for application
Water - Domestic Use• Automatic flashometers• Automatic faucets• Flow restrictors• Lavatory optimization• Shower optimization• Urinal optimization• Water closed optimization• Waterless urinals
Water - Non-domestic Use• High flow on-site equipment• Irrigation conservation systems• Laundry conservation systems• R/O systems
Energy and Cost Benefit Analyses of HVAC Systems Available to Ohio Schools
5-8
Based on the criteria listed earlier, this HB 264 list and requests from the Ohio School FacilitiesCommission, the following alternatives were selected for further evaluation:
• Controls (energy load management)
• Latent and sensible heat recovery (enthalpy) wheels
• Occupancy-based ventilation (e.g., IAQ)
• Geothermal heat pumps
• Daylighting
In addition, Phase 2 deliverables included preparation of Microsoft® PowerPoint® presentationsfor the following four audiences:
• National
• State School Officials and Policy Makers
• State School Operating Staff
• Professional Design Community
The controls area was selected because it was observed that shifting the peak demand loads,especially in Columbus, could dramatically reduce projected annual electric costs. Enthalpywheels are an existing option under the OSDM and is a technology generally recognized as alow-cost method to reduce energy consumption in buildings. Desiccant technology was alsodiscussed under this option, but adequate design tools are just emerging and do not readily lendthemselves to be used by HAP. The occupancy-based ventilation reflects on-going interest aboutthe appropriate levels of fresh air to provide to spaces assuming no active treatment of the air isplanned. In general, reducing the amount of energy used in a space negatively impact IAQ.Also, ASHRAE continues to debate this issue under planned revisions to ASHRAE 62, the IAQstandard. To address this issue, the energy and cost impacts supplying 10 CFM/person and 20CFM/person were compared against supplying the base case ventilation air rate of 15CFM/person. Geothermal heat pumps were selected for analyses under the supplementalactivities task because of their widespread consideration by many districts. This task wascomplicated by the fact that adequate design tools are just emerging to properly evaluate thistechnology on a hour by hour basis. Considerable discussion and work was completed to agreeon a set of optimal field fluid temperatures for modeling purposes. Daylighting has emerged as atechnology which appears to enhance the learning environment; this work focused on anevaluation of the energy impacts of daylighting should it begin to be used again in schools.
Energy and Cost Benefit Analyses of HVAC Systems Available to Ohio Schools
5-9
5.1 Overview of Scope of Work For Each of the Energy ConservingAlternatives Selected
To determine cost-benefits for each of the energy alternatives, energy savings, capital costs andeconomic cost benefits from the combination of energy savings and capital costs weredetermined. The overall scope of work for each of the five additional tasks are brieflysummarized as follows:
Controls:
Energy costs: Incremental energy savings were calculated for both the high school and theelementary school in all three cities. This resulted in an additional 240 runs of the HAP model.The focus was on the all-electric rate HVAC options, since they represent the best, and in mostcases, the only (rate-based) opportunities for cost savings through load shifting.
Capital costs: Capital cost calculations were dependent on the city of interest (due to localelectric rate structures). Cincinnati capital costs are $0; one simply has to request the rate.Cleveland requires separate electric metering of certain loads. L&A determined a first-cutestimate of the cost of separate electrical metering of these circuits. Both the RSMeans 2000®
Mechanical Cost Estimation Handbook (2000 ed.) and local vender quotes were used to obtaincost values. Columbus is the most complex city covered in that load shifts must beaccomplished by controls, thermal storage, etc. to obtain special electric rates. For Columbus,the selection, design and evaluation of load shifting alternatives was beyond the scope of thisproject. It is recommended that these options be selected, designed and evaluated in future work.
Enthalpy Heat Recovery:
Energy costs: Incremental energy savings were calculated for both the high school and theelementary school in all three cities. This resulted in an additional 240 runs of the HAP model.
Capital costs: Incremental capital costs were calculated based on a cost per CFM given in thecost specifications (one for the high school and one for the elementary school). This value willbe multiplied by the actual CFM for the system modeled times the cost per CFM provided by theOSFC. This analyses included the impact of the enthalpy heat recovery systems are reductions tothe balance of plant (including both capital costs and service and maintenance cost impacts).
Occupancy-Based Ventilation (i.e., IAQ):
Energy costs: Incremental energy savings were calculated for the high school in Columbusassuming fresh air levels change from 15 SCFM/person to 10 SCFM/person and from 15SCFM/person to 20 SCFM/person. This resulted in an additional 80 (two times 40) runs of theHAP model.
Capital costs: Incremental capital costs of equipment (Plant, air systems and terminal units),service repair and maintenance costs and annual energy costs, which change as a result of both ofthese options, were determined as part of this work. Present value, and present value differences
Energy and Cost Benefit Analyses of HVAC Systems Available to Ohio Schools
5-10
between Occupancy-Based Ventilation and Baseline scenarios, were calculated as part of thiswork.
Geothermal Heat Pumps:
Energy costs: Incremental energy savings were calculated for both the elementary and highschools in all three cities. Critical to these analyses was the selection of “down hole” hydronicloop temperatures. Data from actual systems installed in Kansas and Kentucky were evaluatedto determine reasonable loop temperatures. Extreme loop temperatures affect the efficiency ofequipment and comfort conditions, while modest conditions require excessive down-hole capitalequipment costs. The authors selected loop temperatures consistent with ARI Standardsrecommendations.
Capital costs: Incremental capital costs of equipment (Plant, air systems and terminal units),service repair and maintenance costs and annual energy costs, which change as a result of both ofthese options, were determined as part of this work. Costs for the geothermal down hole costswere determined from the average of three sources for this data. Two of the sources were fromgeothermal heat pump installers in Ohio and one was an ASHRAE paper for an actual project inNebraska. Present value, and present value differences between Occupancy-Based Ventilationand Baseline scenarios, were calculated as part of this work.
Daylighting:
Energy costs: Incremental energy savings/costs for all 40 HVAC options were calculated fortwo daylighting options for both the elementary and high school at one location (Columbus). Itwas found that the baseline schools had been specified with lighting levels greater than thoserecommended in the OSDM. To properly quantify the energy impacts of daylighting, anintermediate set of 80 analyses were completed using lower lighting levels. Then the daylighting(80) analyses were completed using these revised baseline conditions. This allows one todirectly observe the energy impacts of daylighting without taking credit for lower lighting levelsone would normally see in daylighted schools. This resulted in the completion of an additional160 runs of the HAP model.
Capital costs: Not evaluated.
5.2 Detailed Description of Phase 2 Approaches
For each of the five areas considered under the Phase 2 work (i.e., controls, enthalpy heatexchange, ventilation (IAQ), geothermal heat pumps and daylighting), a separate chapter followsdetailing the approach used, results of the analyses and general conclusions and observationsreached in reviewing these results.
Energy and Cost Benefit Analyses of HVAC Systems Available to Ohio Schools
6-1
6.0 CONTROLS ANALYSES
As seen in the baseline analyses, much of the annual energy costs, and cost differences can betraced to electrical energy consumption, particularly differences in peak power usage (i.e.,demand charges). In many cases, a user has the ability to alter rate structures by controlling thepeak power levels used, by sub-metering specific loads or by requesting special rates that may beavailable. However, often these rates are available for all-electric buildings. This chapterprovides a detailed review of how one can minimize electrical demand charges by usingalternative electric rate structures available in the three cities considered in this work.
6.1 APPROACH TO CONTROLS ANALYSES
The approach used in completing these analyses was to:
1. Re-run all 240 HAP runs (40 HVAC options for two buildings in three cities) assuming thespecific peak electrical power could be reduced, or priced at a different, lower rate wherespecial rates may apply. These conditions varied by the individual city under consideration(e.g., Cleveland, Cincinnati or Columbus).
2. Estimate incremental capital and operating costs for control options based on equipment sizesand RS Means CostWorks 2000® Mechanical Cost Data.
3. Complete cost-benefits [Net Present Value (NPV) and Payback (PB)] for an elementary andhigh school located in Cleveland.
Annual energy costs for both the elementary school and the high school were calculated by usingdifferent rates or assuming peak power could be removed from the peak. In most cases, this willrequire some equipment additions (e.g., controls) to shift load or obtain discounted energypricing. However, as one might expect, each city (and corresponding electric utility) hasdifferent conditions that must be met to use alternative rate structures. These conditions, orcontrols, are summarized in Table 6-1:
City Base Conditions Alternative Conditions
Cleveland Single Meter – CEI SS electric rate CEI SS and CEI second meter electric rates
Cincinnati CG&E DS electric rate CG&E DS and EH electric rates
Columbus AEP CSP GS3 electric rate AEP CSP GS3 and GS3 with rider 18 electric rates
Table 6-1: Controls Options by City and Case Modeled
In Cleveland, if certain electric loads are metered using a second meter, then that load can bebilled at a lower, second meter, rate. The Cleveland Electric Illuminating (CEI) Electric SpaceConditioning Schedule is available and applicable to schools (new and existing) that are wiredsuch that space heating and air conditioning equipment can be separately metered. Waterheating equipment may also be separately metered.

Energy and Cost Benefit Analyses of HVAC Systems Available to Ohio Schools
6-2
HAND INSERT FIGURE
Figure 6-1: Cleveland Elementary School Circuits Metered to Obtain Lower Electric Rates

Energy and Cost Benefit Analyses of HVAC Systems Available to Ohio Schools
6-3
HAND INSERT FIGURE
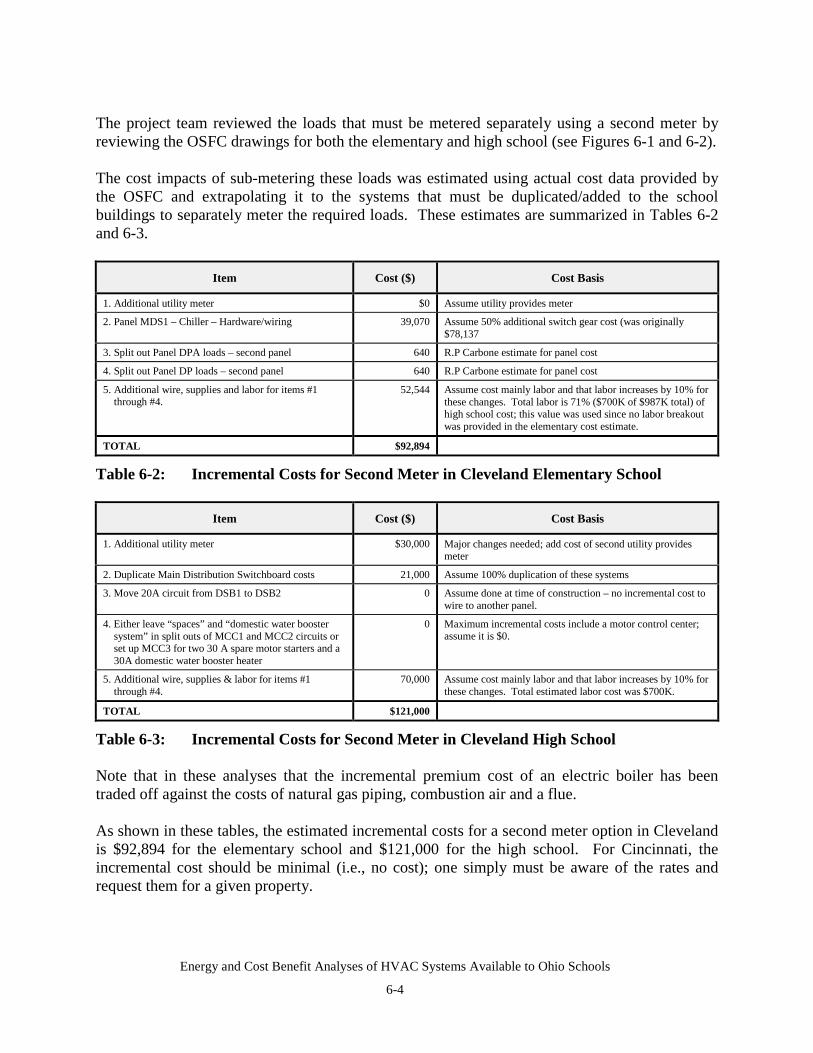
Energy and Cost Benefit Analyses of HVAC Systems Available to Ohio Schools
6-4
The project team reviewed the loads that must be metered separately using a second meter byreviewing the OSFC drawings for both the elementary and high school (see Figures 6-1 and 6-2).
The cost impacts of sub-metering these loads was estimated using actual cost data provided bythe OSFC and extrapolating it to the systems that must be duplicated/added to the schoolbuildings to separately meter the required loads. These estimates are summarized in Tables 6-2and 6-3.
Item Cost ($) Cost Basis
1. Additional utility meter $0 Assume utility provides meter
2. Panel MDS1 – Chiller – Hardware/wiring 39,070 Assume 50% additional switch gear cost (was originally$78,137
3. Split out Panel DPA loads – second panel 640 R.P Carbone estimate for panel cost
4. Split out Panel DP loads – second panel 640 R.P Carbone estimate for panel cost
5. Additional wire, supplies and labor for items #1through #4.
52,544 Assume cost mainly labor and that labor increases by 10% forthese changes. Total labor is 71% ($700K of $987K total) ofhigh school cost; this value was used since no labor breakoutwas provided in the elementary cost estimate.
TOTAL $92,894
Table 6-2: Incremental Costs for Second Meter in Cleveland Elementary School
Item Cost ($) Cost Basis
1. Additional utility meter $30,000 Major changes needed; add cost of second utility providesmeter
2. Duplicate Main Distribution Switchboard costs 21,000 Assume 100% duplication of these systems
3. Move 20A circuit from DSB1 to DSB2 0 Assume done at time of construction – no incremental cost towire to another panel.
4. Either leave “spaces” and “domestic water boostersystem” in split outs of MCC1 and MCC2 circuits orset up MCC3 for two 30 A spare motor starters and a30A domestic water booster heater
0 Maximum incremental costs include a motor control center;assume it is $0.
5. Additional wire, supplies & labor for items #1through #4.
70,000 Assume cost mainly labor and that labor increases by 10% forthese changes. Total estimated labor cost was $700K.
TOTAL $121,000
Table 6-3: Incremental Costs for Second Meter in Cleveland High School
Note that in these analyses that the incremental premium cost of an electric boiler has beentraded off against the costs of natural gas piping, combustion air and a flue.
As shown in these tables, the estimated incremental costs for a second meter option in Clevelandis $92,894 for the elementary school and $121,000 for the high school. For Cincinnati, theincremental cost should be minimal (i.e., no cost); one simply must be aware of the rates andrequest them for a given property.
Energy and Cost Benefit Analyses of HVAC Systems Available to Ohio Schools
6-5
Cincinnati Gas and Electric (CG&E) offers an optional electric rate for facilities using electricspace heating. This “EH” rate is available to any public school, parochial school, private schoolor church as long as the facility is supplied at a single point of delivery and that the permanentlyconnected, regularly used electric equipment, is the primary source of heating, or heating andcooling for human comfort. As long as these requirements are met, the entity simply requests the“EH” rate from CG&E. In this case, the annual savings for all 40 options has been calculated,but no NPV or PB have been computed since no incremental costs are likely to implement thisoption. The payback is instantaneous.
For Columbus, it was observed in the modeling efforts that often the peak power occurred near8:00 AM. Columbus and Southern Power (CSP) offers an optional rider for churches andschools which effectively forgives 50% of the demand charges for these facilities if the peakdemand occurs between the hours of 9:00 PM and 7:00 AM on weekdays and all hours for theweekend and holidays. Provided all, or some portion, of this peak could be shifted to earlier inthe morning, substantial energy cost savings are possible. This level of savings is available foronly the all-electric equipment options and would occur only if the air-conditioning peak loadcould be shifted to off-peak periods. To obtain these savings, costs must be incurred to shift thisload. These costs will be associated with control systems and some thermal capacitance.Designing and costing these systems for each of these buildings is very dependent on the optionsselected and was deferred to future activities.
6.2 CONTROLS RESULTS
Results of the controls analyses are presented in three separate categories:
• Annual site energy savings for both buildings in all three cities.• Annual energy cost savings for both buildings in all three cities• NPVs and paybacks for all 40 HVAC options in Cleveland
Note that the amount of energy consumed remains the same as with the baseline cases; only theannual energy costs changed as a result of using different utility rates.
Tables and figures summarizing these results follow:
Annual Site Energy Savings
Annual site energy savings for all 40 HVAC systems in all three cities are summarized in Tables6-4 and 6-5 for the elementary and Tables 6-6 and 6-7 for the high school respectively

Energy and Cost Benefit Analyses of HVAC Systems Available to Ohio Schools
6-6
Cincinnati Cleveland ColumbusHVACSystemOption Baseline
EnergyControlsEnergy
AnnualSavings
BaselineEnergy
ControlsEnergy
AnnualSavings
BaselineEnergy
ControlsEnergy
AnnualSavings
1A1 $87,169 $87,344 -$175 $78,352 $77,216 $1,137 $65,656 $64,738 $918
1A2 $66,349 $66,524 -$175 $70,705 $69,568 $1,137 $57,092 $56,174 $918
1A3 $65,195 $65,370 -$175 $70,678 $69,541 $1,137 $54,783 $53,865 $918
1B1 $87,166 $87,338 -$173 $78,602 $77,476 $1,125 $65,634 $64,728 $906
1B2 $66,347 $66,520 -$173 $70,954 $69,829 $1,125 $57,071 $56,164 $906
1B3 $65,192 $65,365 -$173 $70,925 $69,800 $1,125 $54,763 $53,857 $906
1C1 $89,427 $53,753 $35,674 $110,225 $71,543 $38,681 $77,472 $48,333 $29,139
1C2 $74,708 $45,263 $29,445 $102,588 $66,192 $36,396 $73,858 $45,945 $27,913
1C3 $74,086 $45,145 $28,941 $102,543 $67,050 $35,493 $73,174 $45,769 $27,405
1D1 $87,884 $87,884 $0 $78,789 $78,789 $0 $65,659 $65,659 $0
1D2 $67,066 $67,066 $0 $71,147 $71,147 $0 $57,095 $57,095 $0
1D3 $65,911 $65,911 $0 $71,120 $71,120 $0 $54,789 $54,789 $0
2A1 $89,457 $89,652 -$195 $83,248 $82,026 $1,222 $68,928 $67,988 $941
2A2 $68,656 $68,852 -$195 $74,277 $73,055 $1,222 $58,520 $57,579 $941
2A3 $67,265 $67,460 -$195 $74,624 $73,403 $1,222 $57,690 $56,749 $941
2B1 $89,461 $89,654 -$193 $83,490 $82,279 $1,210 $68,919 $67,987 $931
2B2 $68,661 $68,854 -$193 $74,139 $72,929 $1,210 $58,510 $57,578 $931
2B3 $67,269 $67,462 -$193 $74,866 $73,656 $1,210 $57,680 $56,749 $931
2C1 $92,196 $56,654 $35,542 $115,418 $72,453 $42,964 $80,535 $50,245 $30,289
2C2 $77,072 $47,836 $29,235 $106,311 $68,256 $38,055 $75,998 $47,331 $28,667
2C3 $76,454 $47,785 $28,669 $107,030 $68,731 $38,299 $75,826 $47,442 $28,385
2D1 $90,256 $90,256 $0 $83,663 $83,663 $0 $68,926 $68,926 $0
2D2 $69,456 $69,456 $0 $74,312 $74,312 $0 $58,518 $58,518 $0
2D3 $68,065 $68,065 $0 $75,040 $75,040 $0 $57,688 $57,688 $0
3A1 $90,051 $90,435 -$384 $120,475 $118,314 $2,161 $88,973 $87,153 $1,820
3B1 $89,938 $90,312 -$374 $120,354 $118,245 $2,109 $88,830 $87,056 $1,774
3C1 $124,060 $72,001 $52,059 $182,459 $89,157 $93,302 $149,204 $90,061 $59,143
3D1 $91,678 $91,678 $0 $120,629 $120,629 $0 $89,075 $89,075 $0
4A1 $88,793 $89,133 -$340 $88,495 $86,468 $2,027 $69,675 $68,058 $1,617
4A2 $70,525 $70,865 -$340 $81,235 $79,209 $2,027 $61,870 $60,252 $1,617
4A3 $68,508 $68,848 -$340 $81,222 $79,195 $2,027 $60,607 $58,990 $1,617
4B1 $88,646 $88,977 -$331 $88,401 $86,421 $1,980 $69,465 $67,888 $1,577
4B2 $70,378 $70,709 -$331 $81,142 $79,162 $1,980 $61,703 $60,126 $1,577
4B3 $68,361 $68,693 -$331 $81,128 $79,148 $1,980 $60,488 $58,911 $1,577
4C1 $111,054 $61,967 $49,087 $150,870 $79,862 $71,008 $125,405 $74,706 $50,699
4C2 $99,623 $54,423 $45,201 $143,608 $75,702 $67,905 $124,280 $73,581 $50,699
4C3 $98,536 $54,012 $44,524 $143,586 $76,585 $67,000 $124,622 $73,922 $50,699
4D1 $90,138 $90,138 $0 $88,660 $88,660 $0 $69,609 $69,609 $0
4D2 $71,870 $71,870 $0 $81,400 $81,400 $0 $61,877 $61,877 $0
4D3 $69,854 $69,854 $0 $81,386 $81,386 $0 $60,564 $60,564 $0
Table 6-4: Controls – Annual Energy Costs Savings ($) for Elementary Schools

Energy and Cost Benefit Analyses of HVAC Systems Available to Ohio Schools
6-7
Cincinnati Cleveland ColumbusHVACSystemOption Baseline
EnergyControlsEnergy
AnnualSavings
BaselineEnergy
ControlsEnergy
AnnualSavings
BaselineEnergy
ControlsEnergy
AnnualSavings
1A1 $1.35 $1.36 $0.00 $1.22 $1.20 $0.02 $1.02 $1.00 $0.01
1A2 $1.03 $1.03 $0.00 $1.10 $1.08 $0.02 $0.89 $0.87 $0.01
1A3 $1.01 $1.01 $0.00 $1.10 $1.08 $0.02 $0.85 $0.84 $0.01
1B1 $1.35 $1.36 $0.00 $1.22 $1.20 $0.02 $1.02 $1.00 $0.01
1B2 $1.03 $1.03 $0.00 $1.10 $1.08 $0.02 $0.89 $0.87 $0.01
1B3 $1.01 $1.01 $0.00 $1.10 $1.08 $0.02 $0.85 $0.84 $0.01
1C1 $1.39 $0.83 $0.55 $1.71 $1.11 $0.60 $1.20 $0.75 $0.45
1C2 $1.16 $0.70 $0.46 $1.59 $1.03 $0.56 $1.15 $0.71 $0.43
1C3 $1.15 $0.70 $0.45 $1.59 $1.04 $0.55 $1.14 $0.71 $0.43
1D1 $1.36 $1.36 $0.00 $1.22 $1.22 $0.00 $1.02 $1.02 $0.00
1D2 $1.04 $1.04 $0.00 $1.10 $1.10 $0.00 $0.89 $0.89 $0.00
1D3 $1.02 $1.02 $0.00 $1.10 $1.10 $0.00 $0.85 $0.85 $0.00
2A1 $1.39 $1.39 $0.00 $1.29 $1.27 $0.02 $1.07 $1.06 $0.01
2A2 $1.07 $1.07 $0.00 $1.15 $1.13 $0.02 $0.91 $0.89 $0.01
2A3 $1.04 $1.05 $0.00 $1.16 $1.14 $0.02 $0.90 $0.88 $0.01
2B1 $1.39 $1.39 $0.00 $1.30 $1.28 $0.02 $1.07 $1.06 $0.01
2B2 $1.07 $1.07 $0.00 $1.15 $1.13 $0.02 $0.91 $0.89 $0.01
2B3 $1.04 $1.05 $0.00 $1.16 $1.14 $0.02 $0.90 $0.88 $0.01
2C1 $1.43 $0.88 $0.55 $1.79 $1.12 $0.67 $1.25 $0.78 $0.47
2C2 $1.20 $0.74 $0.45 $1.65 $1.06 $0.59 $1.18 $0.73 $0.44
2C3 $1.19 $0.74 $0.44 $1.66 $1.07 $0.59 $1.18 $0.74 $0.44
2D1 $1.40 $1.40 $0.00 $1.30 $1.30 $0.00 $1.07 $1.07 $0.00
2D2 $1.08 $1.08 $0.00 $1.15 $1.15 $0.00 $0.91 $0.91 $0.00
2D3 $1.06 $1.06 $0.00 $1.16 $1.16 $0.00 $0.90 $0.90 $0.00
3A1 $1.40 $1.40 -$0.01 $1.87 $1.84 $0.03 $1.38 $1.35 $0.03
3B1 $1.40 $1.40 -$0.01 $1.87 $1.83 $0.03 $1.38 $1.35 $0.03
3C1 $1.93 $1.12 $0.81 $2.83 $1.38 $1.45 $2.32 $1.40 $0.92
3D1 $1.42 $1.42 $0.00 $1.87 $1.87 $0.00 $1.38 $1.38 $0.00
4A1 $1.38 $1.38 -$0.01 $1.37 $1.34 $0.03 $1.08 $1.06 $0.03
4A2 $1.09 $1.10 -$0.01 $1.26 $1.23 $0.03 $0.96 $0.93 $0.03
4A3 $1.06 $1.07 -$0.01 $1.26 $1.23 $0.03 $0.94 $0.92 $0.03
4B1 $1.38 $1.38 -$0.01 $1.37 $1.34 $0.03 $1.08 $1.05 $0.02
4B2 $1.09 $1.10 -$0.01 $1.26 $1.23 $0.03 $0.96 $0.93 $0.02
4B3 $1.06 $1.07 -$0.01 $1.26 $1.23 $0.03 $0.94 $0.91 $0.02
4C1 $1.72 $0.96 $0.76 $2.34 $1.24 $1.10 $1.95 $1.16 $0.79
4C2 $1.55 $0.84 $0.70 $2.23 $1.17 $1.05 $1.93 $1.14 $0.79
4C3 $1.53 $0.84 $0.69 $2.23 $1.19 $1.04 $1.93 $1.15 $0.79
4D1 $1.40 $1.40 $0.00 $1.38 $1.38 $0.00 $1.08 $1.08 $0.00
4D2 $1.12 $1.12 $0.00 $1.26 $1.26 $0.00 $0.96 $0.96 $0.00
4D3 $1.08 $1.08 $0.00 $1.26 $1.26 $0.00 $0.94 $0.94 $0.00
Table 6-5: Controls – Annual Energy Costs Savings per Square Foot for ElementarySchools

Energy and Cost Benefit Analyses of HVAC Systems Available to Ohio Schools
6-8
Cincinnati Cleveland ColumbusHVACSystemOption Baseline
EnergyControlsEnergy
AnnualSavings
BaselineEnergy
ControlsEnergy
AnnualSavings
BaselineEnergy
ControlsEnergy
AnnualSavings
1A1 $150,390 $151,251 -$861 $161,542 $156,980 $4,561 $120,884 $116,908 $3,977
1A2 $135,594 $136,454 -$861 $154,039 $149,477 $4,561 $114,784 $110,807 $3,977
1A3 $127,977 $128,838 -$861 $155,961 $151,400 $4,561 $114,999 $111,022 $3,977
1B1 $150,102 $150,945 -$843 $161,370 $156,894 $4,476 $120,476 $116,581 $3,895
1B2 $135,306 $136,149 -$843 $153,866 $149,390 $4,476 $114,503 $110,608 $3,895
1B3 $127,689 $128,532 -$843 $155,788 $151,311 $4,476 $114,718 $110,822 $3,895
1C1 $193,683 $121,250 $72,433 $281,848 $154,072 $127,776 $218,221 $134,141 $84,080
1C2 $186,206 $114,793 $71,413 $275,502 $149,611 $125,891 $216,979 $132,899 $84,080
1C3 $183,552 $113,036 $70,516 $277,801 $152,695 $125,106 $217,885 $133,805 $84,080
1D1 $153,906 $153,906 $0 $161,767 $161,767 $0 $120,742 $120,742 $0
1D2 $139,110 $139,110 $0 $154,263 $154,263 $0 $114,844 $114,844 $0
1D3 $131,493 $131,493 $0 $156,184 $156,184 $0 $115,058 $115,058 $0
2A1 $152,450 $153,276 -$826 $163,705 $159,271 $4,433 $123,030 $119,202 $3,828
2A2 $136,799 $137,626 -$826 $156,075 $151,641 $4,433 $116,193 $112,366 $3,828
2A3 $129,290 $130,116 -$826 $157,890 $153,457 $4,433 $116,542 $112,714 $3,828
2B1 $152,158 $152,966 -$808 $163,507 $159,159 $4,348 $122,620 $118,873 $3,747
2B2 $136,507 $137,315 -$808 $155,885 $151,537 $4,348 $115,896 $112,150 $3,747
2B3 $128,997 $129,806 -$808 $157,693 $153,344 $4,348 $116,244 $112,498 $3,747
2C1 $193,087 $121,363 $71,724 $279,580 $153,547 $126,032 $215,423 $132,505 $82,918
2C2 $184,590 $114,459 $70,131 $272,330 $148,993 $123,337 $214,157 $131,239 $82,918
2C3 $182,118 $112,840 $69,277 $274,737 $152,090 $122,647 $215,102 $132,185 $82,918
2D1 $155,819 $155,819 $0 $163,912 $163,912 $0 $122,894 $122,894 $0
2D2 $140,169 $140,169 $0 $156,283 $156,283 $0 $116,240 $116,240 $0
2D3 $132,659 $132,659 $0 $158,097 $158,097 $0 $116,588 $116,588 $0
3A1 $144,017 $144,552 -$535 $196,519 $193,527 $2,992 $140,739 $138,201 $2,539
3B1 $143,814 $144,334 -$521 $196,383 $193,466 $2,917 $140,477 $138,005 $2,472
3C1 $190,656 $115,649 $75,007 $284,280 $150,152 $134,128 $225,636 $137,385 $88,251
3D1 $146,250 $146,250 $0 $196,755 $196,755 $0 $142,002 $142,002 $0
4A1 $150,065 $150,979 -$914 $165,214 $160,337 $4,877 $121,845 $117,620 $4,225
4A2 $136,064 $136,979 -$914 $157,883 $153,007 $4,877 $116,721 $112,496 $4,225
4A3 $128,554 $129,468 -$914 $159,872 $154,996 $4,877 $117,082 $112,857 $4,225
4B1 $149,780 $150,676 -$896 $165,075 $160,283 $4,791 $121,441 $117,298 $4,143
4B2 $135,780 $136,676 -$896 $157,744 $152,953 $4,791 $116,443 $112,300 $4,143
4B3 $128,272 $129,168 -$896 $159,733 $154,942 $4,791 $116,805 $112,662 $4,143
4C1 $199,590 $124,079 $75,512 $295,197 $157,833 $137,363 $232,238 $142,164 $90,074
4C2 $192,663 $117,914 $74,749 $289,156 $153,443 $135,713 $231,004 $140,930 $90,074
4C3 $190,180 $116,305 $73,874 $291,485 $156,542 $134,943 $231,912 $141,837 $90,074
4D1 $153,802 $153,802 $0 $165,443 $165,443 $0 $121,695 $121,695 $0
4D2 $139,801 $139,801 $0 $158,119 $158,119 $0 $116,772 $116,772 $0
4D3 $132,293 $132,293 $0 $160,108 $160,108 $0 $117,135 $117,135 $0
Table 6-6: Controls – Annual Energy Costs Savings ($) for High Schools
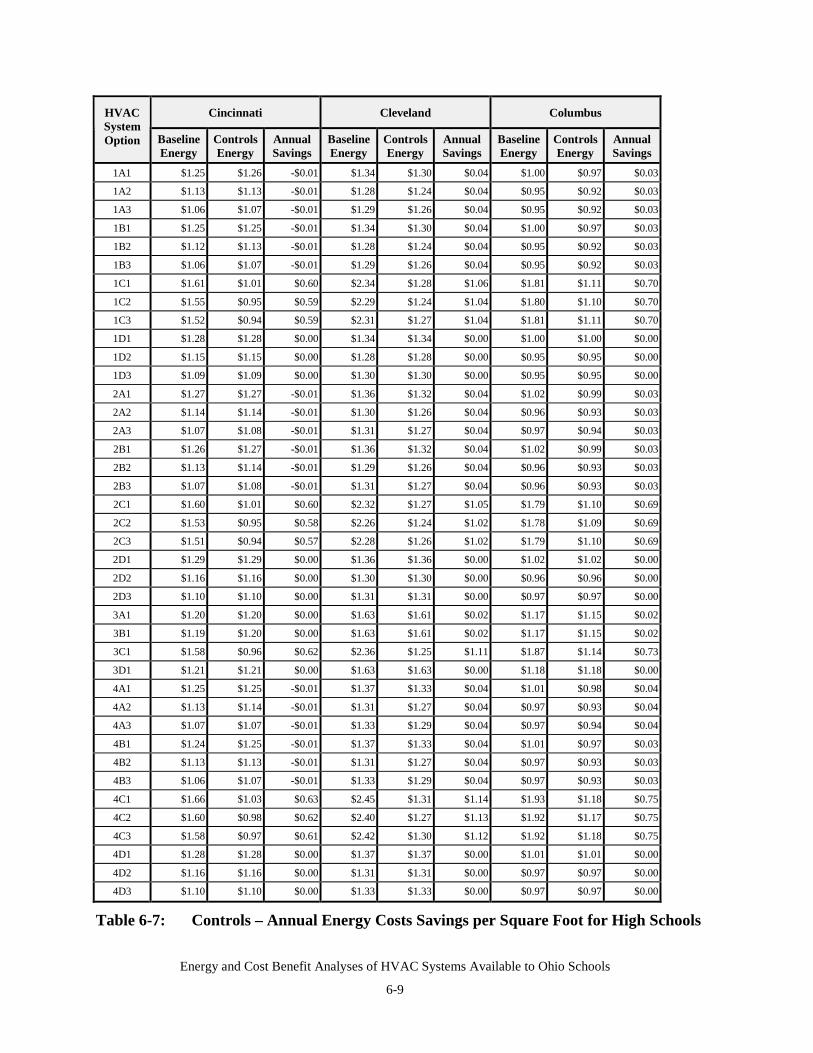
Energy and Cost Benefit Analyses of HVAC Systems Available to Ohio Schools
6-9
Cincinnati Cleveland ColumbusHVACSystemOption Baseline
EnergyControlsEnergy
AnnualSavings
BaselineEnergy
ControlsEnergy
AnnualSavings
BaselineEnergy
ControlsEnergy
AnnualSavings
1A1 $1.25 $1.26 -$0.01 $1.34 $1.30 $0.04 $1.00 $0.97 $0.03
1A2 $1.13 $1.13 -$0.01 $1.28 $1.24 $0.04 $0.95 $0.92 $0.03
1A3 $1.06 $1.07 -$0.01 $1.29 $1.26 $0.04 $0.95 $0.92 $0.03
1B1 $1.25 $1.25 -$0.01 $1.34 $1.30 $0.04 $1.00 $0.97 $0.03
1B2 $1.12 $1.13 -$0.01 $1.28 $1.24 $0.04 $0.95 $0.92 $0.03
1B3 $1.06 $1.07 -$0.01 $1.29 $1.26 $0.04 $0.95 $0.92 $0.03
1C1 $1.61 $1.01 $0.60 $2.34 $1.28 $1.06 $1.81 $1.11 $0.70
1C2 $1.55 $0.95 $0.59 $2.29 $1.24 $1.04 $1.80 $1.10 $0.70
1C3 $1.52 $0.94 $0.59 $2.31 $1.27 $1.04 $1.81 $1.11 $0.70
1D1 $1.28 $1.28 $0.00 $1.34 $1.34 $0.00 $1.00 $1.00 $0.00
1D2 $1.15 $1.15 $0.00 $1.28 $1.28 $0.00 $0.95 $0.95 $0.00
1D3 $1.09 $1.09 $0.00 $1.30 $1.30 $0.00 $0.95 $0.95 $0.00
2A1 $1.27 $1.27 -$0.01 $1.36 $1.32 $0.04 $1.02 $0.99 $0.03
2A2 $1.14 $1.14 -$0.01 $1.30 $1.26 $0.04 $0.96 $0.93 $0.03
2A3 $1.07 $1.08 -$0.01 $1.31 $1.27 $0.04 $0.97 $0.94 $0.03
2B1 $1.26 $1.27 -$0.01 $1.36 $1.32 $0.04 $1.02 $0.99 $0.03
2B2 $1.13 $1.14 -$0.01 $1.29 $1.26 $0.04 $0.96 $0.93 $0.03
2B3 $1.07 $1.08 -$0.01 $1.31 $1.27 $0.04 $0.96 $0.93 $0.03
2C1 $1.60 $1.01 $0.60 $2.32 $1.27 $1.05 $1.79 $1.10 $0.69
2C2 $1.53 $0.95 $0.58 $2.26 $1.24 $1.02 $1.78 $1.09 $0.69
2C3 $1.51 $0.94 $0.57 $2.28 $1.26 $1.02 $1.79 $1.10 $0.69
2D1 $1.29 $1.29 $0.00 $1.36 $1.36 $0.00 $1.02 $1.02 $0.00
2D2 $1.16 $1.16 $0.00 $1.30 $1.30 $0.00 $0.96 $0.96 $0.00
2D3 $1.10 $1.10 $0.00 $1.31 $1.31 $0.00 $0.97 $0.97 $0.00
3A1 $1.20 $1.20 $0.00 $1.63 $1.61 $0.02 $1.17 $1.15 $0.02
3B1 $1.19 $1.20 $0.00 $1.63 $1.61 $0.02 $1.17 $1.15 $0.02
3C1 $1.58 $0.96 $0.62 $2.36 $1.25 $1.11 $1.87 $1.14 $0.73
3D1 $1.21 $1.21 $0.00 $1.63 $1.63 $0.00 $1.18 $1.18 $0.00
4A1 $1.25 $1.25 -$0.01 $1.37 $1.33 $0.04 $1.01 $0.98 $0.04
4A2 $1.13 $1.14 -$0.01 $1.31 $1.27 $0.04 $0.97 $0.93 $0.04
4A3 $1.07 $1.07 -$0.01 $1.33 $1.29 $0.04 $0.97 $0.94 $0.04
4B1 $1.24 $1.25 -$0.01 $1.37 $1.33 $0.04 $1.01 $0.97 $0.03
4B2 $1.13 $1.13 -$0.01 $1.31 $1.27 $0.04 $0.97 $0.93 $0.03
4B3 $1.06 $1.07 -$0.01 $1.33 $1.29 $0.04 $0.97 $0.93 $0.03
4C1 $1.66 $1.03 $0.63 $2.45 $1.31 $1.14 $1.93 $1.18 $0.75
4C2 $1.60 $0.98 $0.62 $2.40 $1.27 $1.13 $1.92 $1.17 $0.75
4C3 $1.58 $0.97 $0.61 $2.42 $1.30 $1.12 $1.92 $1.18 $0.75
4D1 $1.28 $1.28 $0.00 $1.37 $1.37 $0.00 $1.01 $1.01 $0.00
4D2 $1.16 $1.16 $0.00 $1.31 $1.31 $0.00 $0.97 $0.97 $0.00
4D3 $1.10 $1.10 $0.00 $1.33 $1.33 $0.00 $0.97 $0.97 $0.00
Table 6-7: Controls – Annual Energy Costs Savings per Square Foot for High Schools
Energy and Cost Benefit Analyses of HVAC Systems Available to Ohio Schools
6-10
For the elementary school, annual energy savings can range from no negative savings (Table 6-4,Cincinnati) to $93,302 (Cleveland, HVAC option 3C1). In all cases, the greatest cost savings areassociated with all electric HVAC options. In Cincinnati, there is no benefit to using the listedalternative rate structure unless all-electric HVAC options are being considered. Of the threecities, the greatest savings are in Cleveland which has the highest baseline electric rate structuresof the three cities. Annual energy cost savings can be as high as 42% in Cincinnati, 51% inCleveland and 63% in Columbus. These savings can be as high as $1.45 per square foot(Cleveland, HVAC option 3C1). In fact, these alternative rates often bring the annual energycosts for all electric options to values very near some of the low cost HVAC options seen in thebaseline results.
For the high school, annual energy savings can range from a slightly negative savings (Table 6-6,Cincinnati) to $134,128 (Cleveland, HVAC option 3C1). As before, in all cases, the greatestcost savings are associated with all electric HVAC options. Again, in Cincinnati, there is nobenefit to using the listed alternative rate structure unless all-electric HVAC options are beingconsidered. Annual energy cost savings can be as high as 39% in Cincinnati, 47% in Clevelandand 39% in Columbus. These savings can be as high as $1.11 per square foot (Cleveland,HVAC option 3C1).
Plots of annual energy cost savings using controls are summarized in Figures 6-3 to 6-7 for theelementary school and Figures 6-8 to 6-12 for the high school. These figures clearly illustratethe savings possible using these alternative rate schedules for all-electric HVAC options.
A detailed breakout of the costs for controls options by fuel form is shown in Figure 6-13 for thefirst ten elementary school HVAC options. The all-electric options are highlighted in this Figure(HVAC options 1C1, 1C2 and 1C3). Similar figures for the balance of the elementary and highschool options can be found in Appendix C.
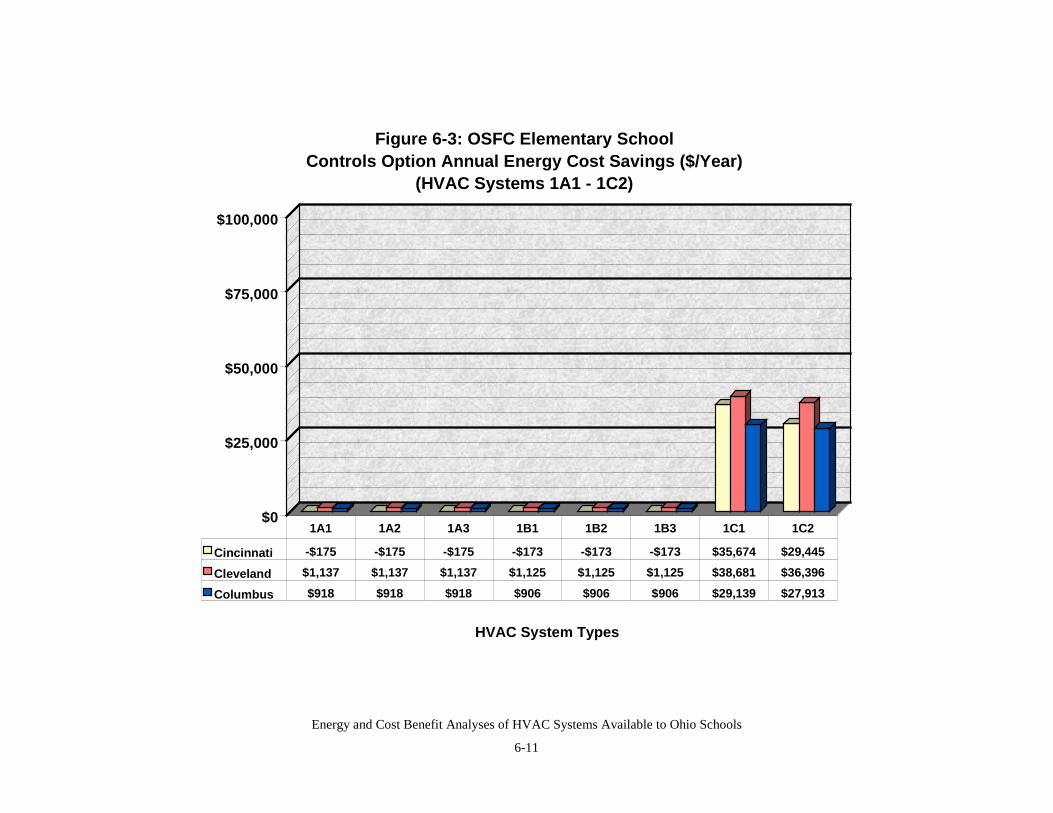
Energy and Cost Benefit Analyses of HVAC Systems Available to Ohio Schools
6-11
$0
$25,000
$50,000
$75,000
$100,000
HVAC System Types
Figure 6-3: OSFC Elementary School Controls Option Annual Energy Cost Savings ($/Year)
(HVAC Systems 1A1 - 1C2)
Cincinnati -$175 -$175 -$175 -$173 -$173 -$173 $35,674 $29,445
Cleveland $1,137 $1,137 $1,137 $1,125 $1,125 $1,125 $38,681 $36,396
Columbus $918 $918 $918 $906 $906 $906 $29,139 $27,913
1A1 1A2 1A3 1B1 1B2 1B3 1C1 1C2
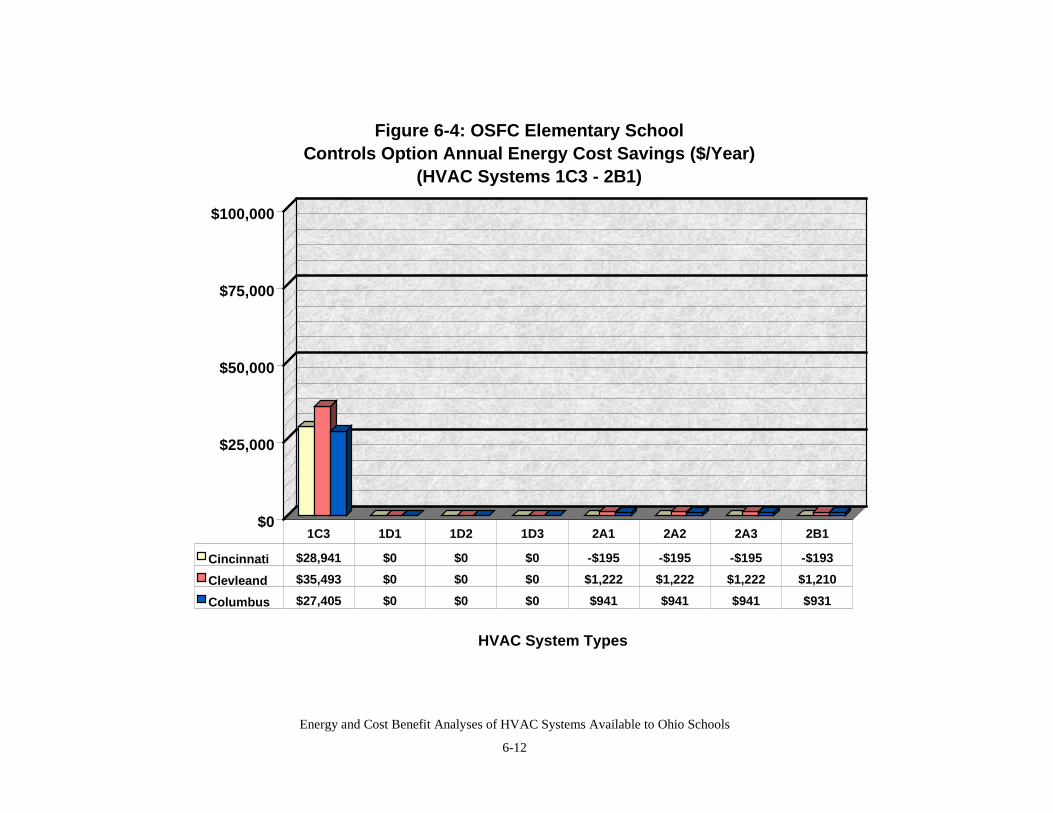
Energy and Cost Benefit Analyses of HVAC Systems Available to Ohio Schools
6-12
$0
$25,000
$50,000
$75,000
$100,000
HVAC System Types
Figure 6-4: OSFC Elementary School Controls Option Annual Energy Cost Savings ($/Year)
(HVAC Systems 1C3 - 2B1)
Cincinnati $28,941 $0 $0 $0 -$195 -$195 -$195 -$193
Clevleand $35,493 $0 $0 $0 $1,222 $1,222 $1,222 $1,210
Columbus $27,405 $0 $0 $0 $941 $941 $941 $931
1C3 1D1 1D2 1D3 2A1 2A2 2A3 2B1
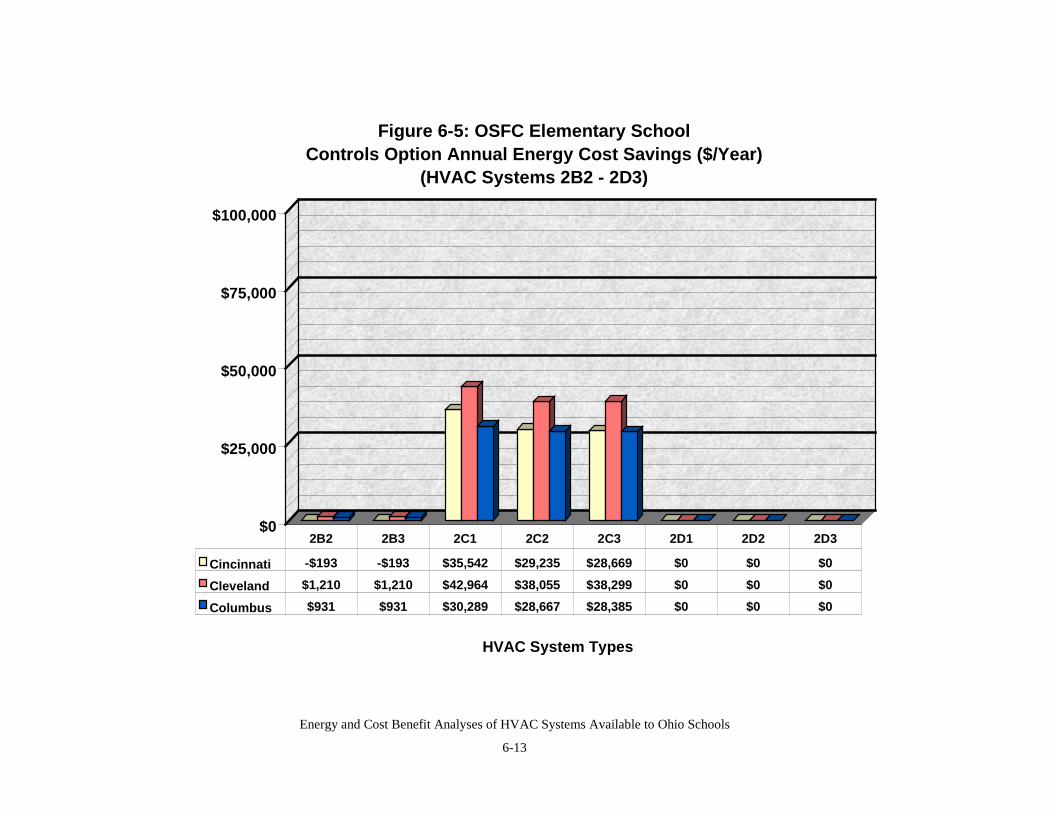
Energy and Cost Benefit Analyses of HVAC Systems Available to Ohio Schools
6-13
$0
$25,000
$50,000
$75,000
$100,000
HVAC System Types
Figure 6-5: OSFC Elementary School Controls Option Annual Energy Cost Savings ($/Year)
(HVAC Systems 2B2 - 2D3)
Cincinnati -$193 -$193 $35,542 $29,235 $28,669 $0 $0 $0
Cleveland $1,210 $1,210 $42,964 $38,055 $38,299 $0 $0 $0
Columbus $931 $931 $30,289 $28,667 $28,385 $0 $0 $0
2B2 2B3 2C1 2C2 2C3 2D1 2D2 2D3
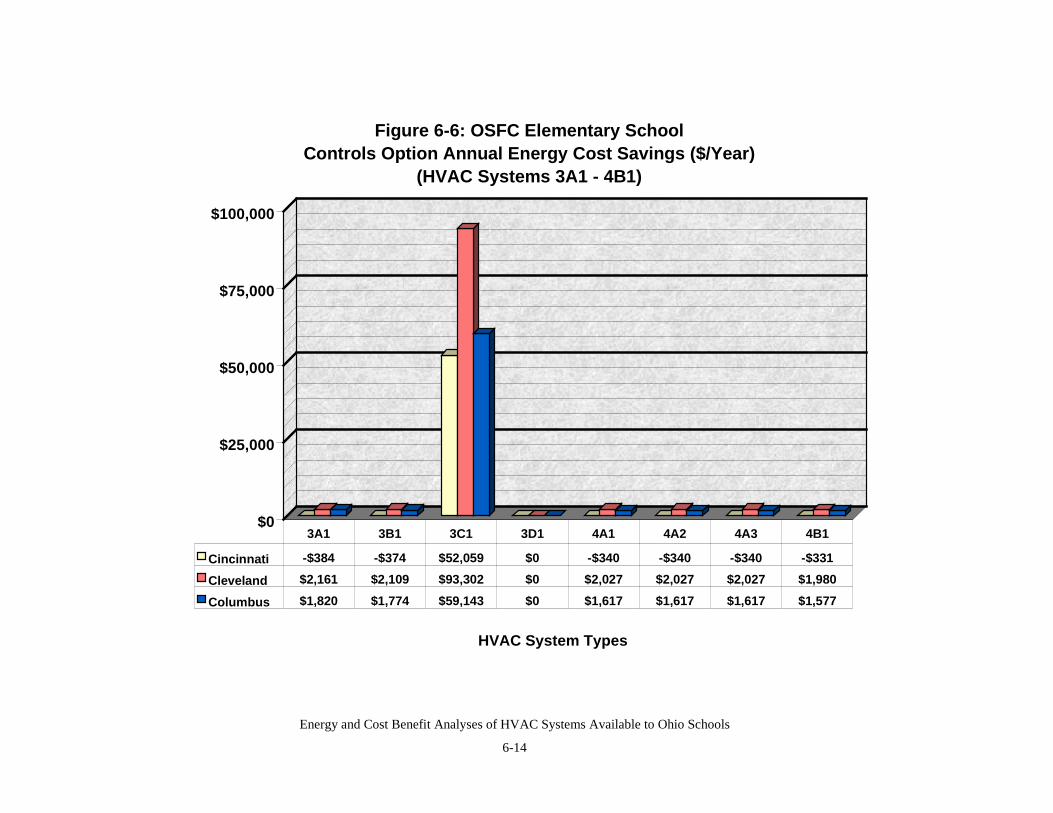
Energy and Cost Benefit Analyses of HVAC Systems Available to Ohio Schools
6-14
$0
$25,000
$50,000
$75,000
$100,000
HVAC System Types
Figure 6-6: OSFC Elementary School Controls Option Annual Energy Cost Savings ($/Year)
(HVAC Systems 3A1 - 4B1)
Cincinnati -$384 -$374 $52,059 $0 -$340 -$340 -$340 -$331
Cleveland $2,161 $2,109 $93,302 $0 $2,027 $2,027 $2,027 $1,980
Columbus $1,820 $1,774 $59,143 $0 $1,617 $1,617 $1,617 $1,577
3A1 3B1 3C1 3D1 4A1 4A2 4A3 4B1
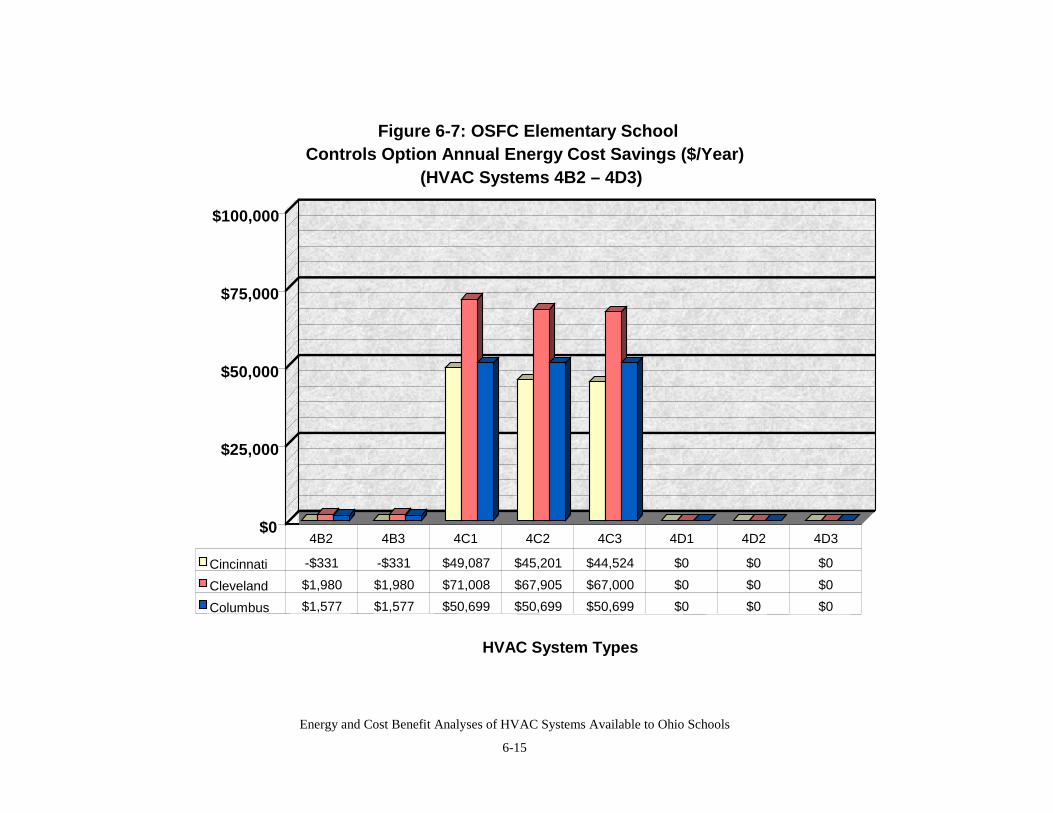
Energy and Cost Benefit Analyses of HVAC Systems Available to Ohio Schools
6-15
$0
$25,000
$50,000
$75,000
$100,000
HVAC System Types
Figure 6-7: OSFC Elementary School Controls Option Annual Energy Cost Savings ($/Year)
(HVAC Systems 4B2 – 4D3)
Cincinnati -$331 -$331 $49,087 $45,201 $44,524 $0 $0 $0
Cleveland $1,980 $1,980 $71,008 $67,905 $67,000 $0 $0 $0
Columbus $1,577 $1,577 $50,699 $50,699 $50,699 $0 $0 $0
4B2 4B3 4C1 4C2 4C3 4D1 4D2 4D3
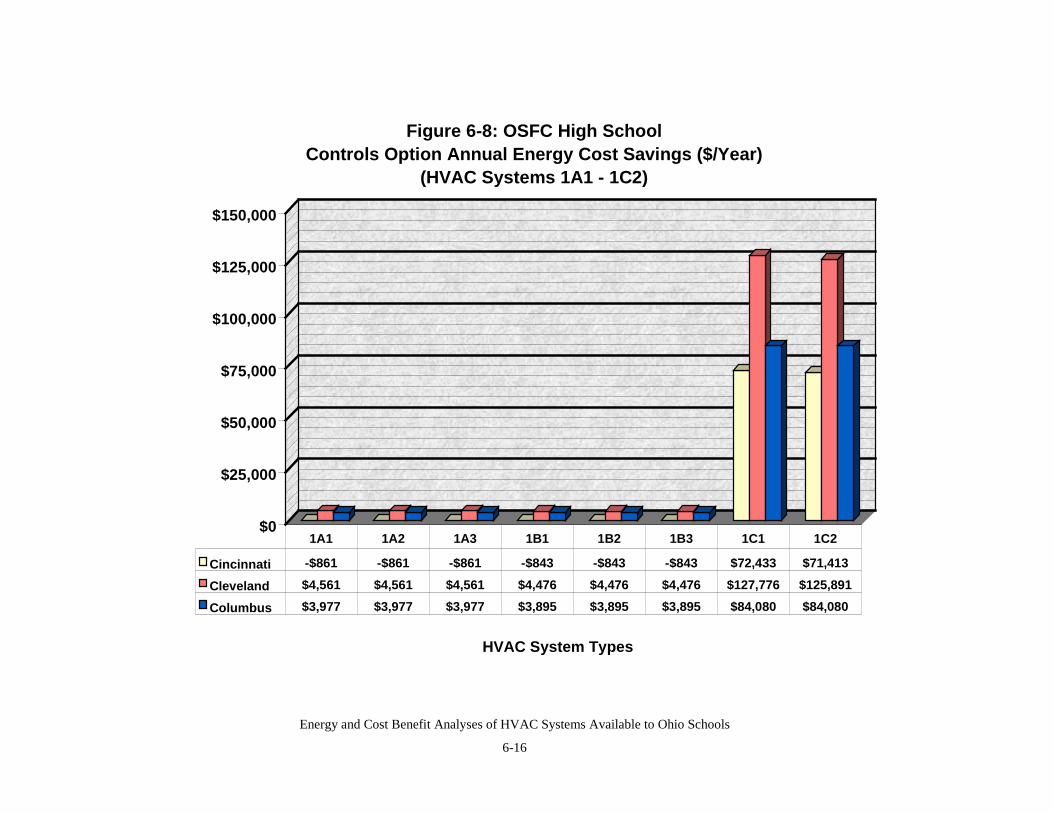
Energy and Cost Benefit Analyses of HVAC Systems Available to Ohio Schools
6-16
$0
$25,000
$50,000
$75,000
$100,000
$125,000
$150,000
HVAC System Types
Figure 6-8: OSFC High School Controls Option Annual Energy Cost Savings ($/Year)
(HVAC Systems 1A1 - 1C2)
Cincinnati -$861 -$861 -$861 -$843 -$843 -$843 $72,433 $71,413
Cleveland $4,561 $4,561 $4,561 $4,476 $4,476 $4,476 $127,776 $125,891
Columbus $3,977 $3,977 $3,977 $3,895 $3,895 $3,895 $84,080 $84,080
1A1 1A2 1A3 1B1 1B2 1B3 1C1 1C2
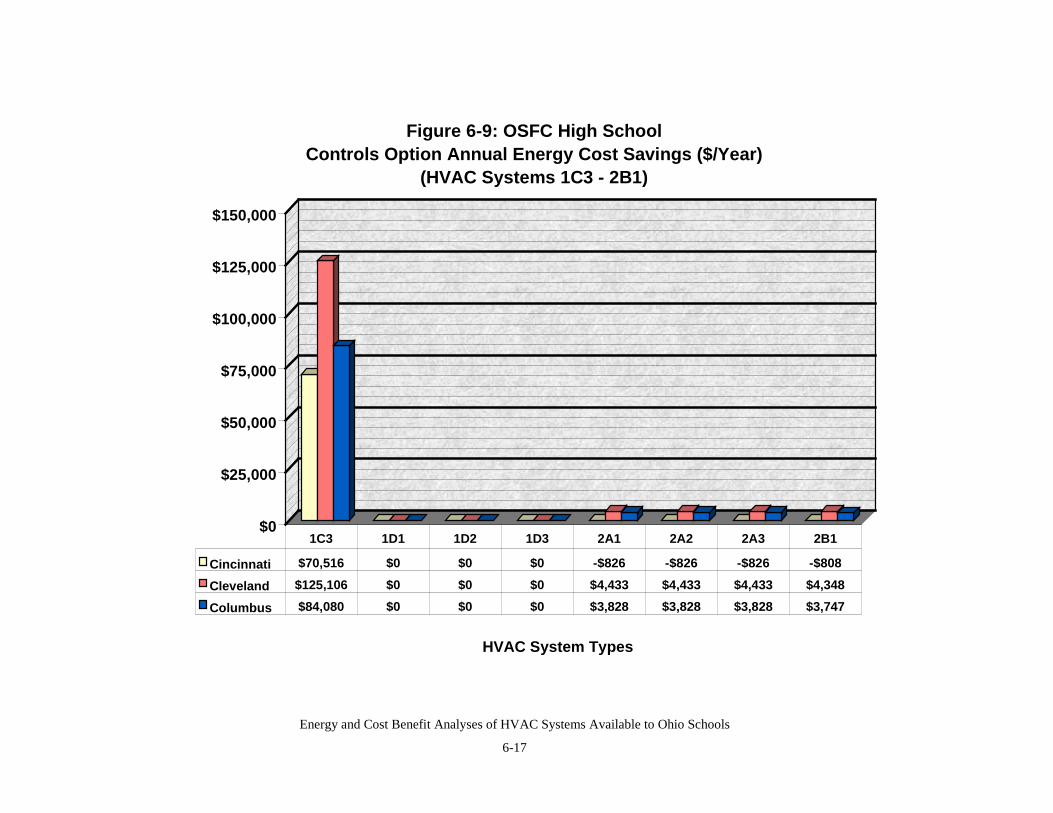
Energy and Cost Benefit Analyses of HVAC Systems Available to Ohio Schools
6-17
$0
$25,000
$50,000
$75,000
$100,000
$125,000
$150,000
HVAC System Types
Figure 6-9: OSFC High School Controls Option Annual Energy Cost Savings ($/Year)
(HVAC Systems 1C3 - 2B1)
Cincinnati $70,516 $0 $0 $0 -$826 -$826 -$826 -$808
Cleveland $125,106 $0 $0 $0 $4,433 $4,433 $4,433 $4,348
Columbus $84,080 $0 $0 $0 $3,828 $3,828 $3,828 $3,747
1C3 1D1 1D2 1D3 2A1 2A2 2A3 2B1
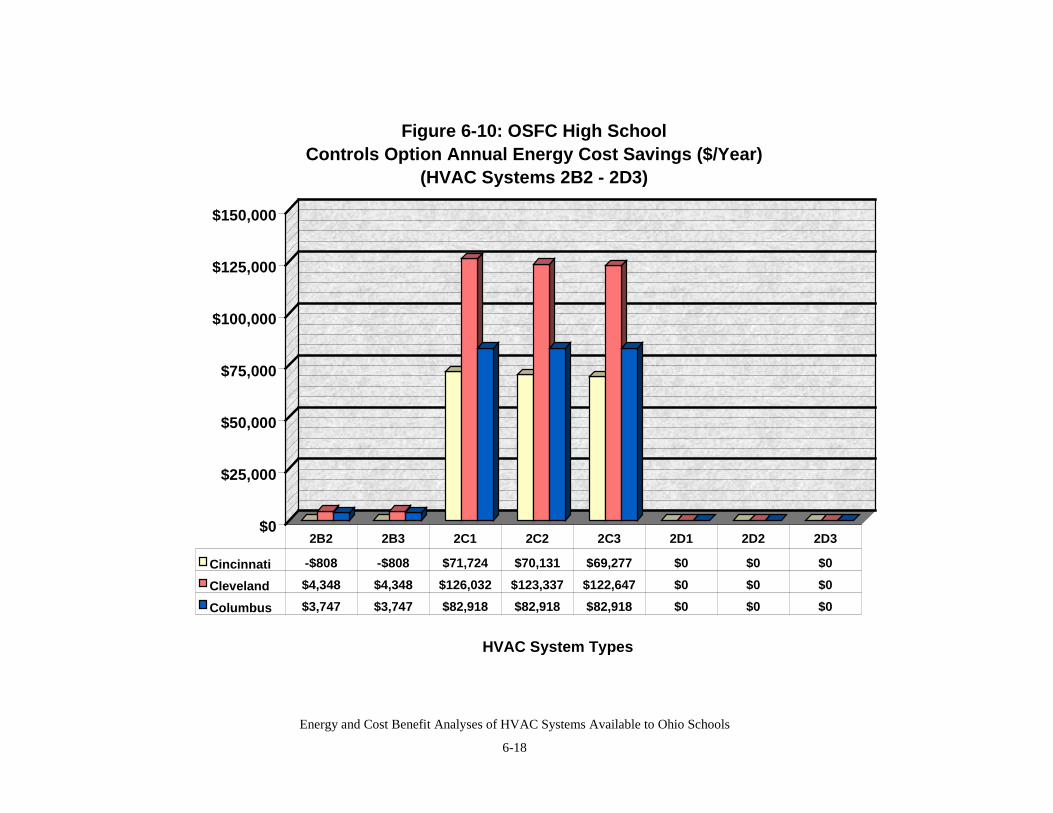
Energy and Cost Benefit Analyses of HVAC Systems Available to Ohio Schools
6-18
$0
$25,000
$50,000
$75,000
$100,000
$125,000
$150,000
HVAC System Types
Figure 6-10: OSFC High School Controls Option Annual Energy Cost Savings ($/Year)
(HVAC Systems 2B2 - 2D3)
Cincinnati -$808 -$808 $71,724 $70,131 $69,277 $0 $0 $0
Cleveland $4,348 $4,348 $126,032 $123,337 $122,647 $0 $0 $0
Columbus $3,747 $3,747 $82,918 $82,918 $82,918 $0 $0 $0
2B2 2B3 2C1 2C2 2C3 2D1 2D2 2D3
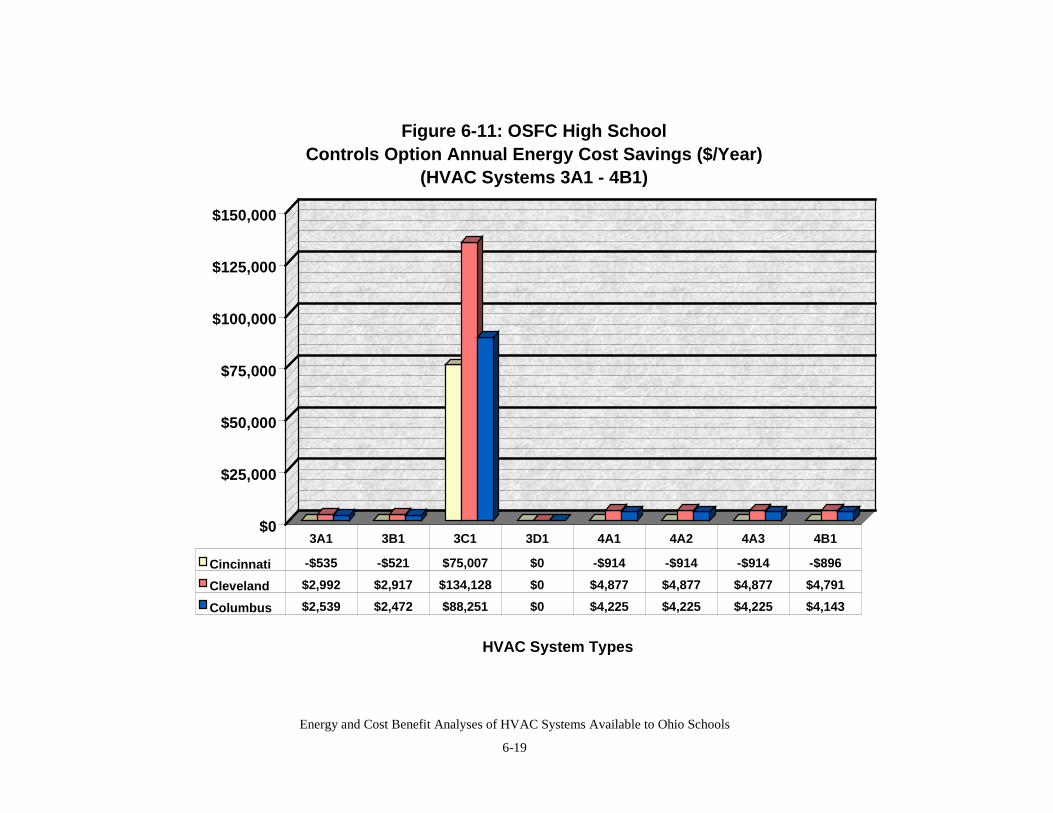
Energy and Cost Benefit Analyses of HVAC Systems Available to Ohio Schools
6-19
$0
$25,000
$50,000
$75,000
$100,000
$125,000
$150,000
HVAC System Types
Figure 6-11: OSFC High School Controls Option Annual Energy Cost Savings ($/Year)
(HVAC Systems 3A1 - 4B1)
Cincinnati -$535 -$521 $75,007 $0 -$914 -$914 -$914 -$896
Cleveland $2,992 $2,917 $134,128 $0 $4,877 $4,877 $4,877 $4,791
Columbus $2,539 $2,472 $88,251 $0 $4,225 $4,225 $4,225 $4,143
3A1 3B1 3C1 3D1 4A1 4A2 4A3 4B1
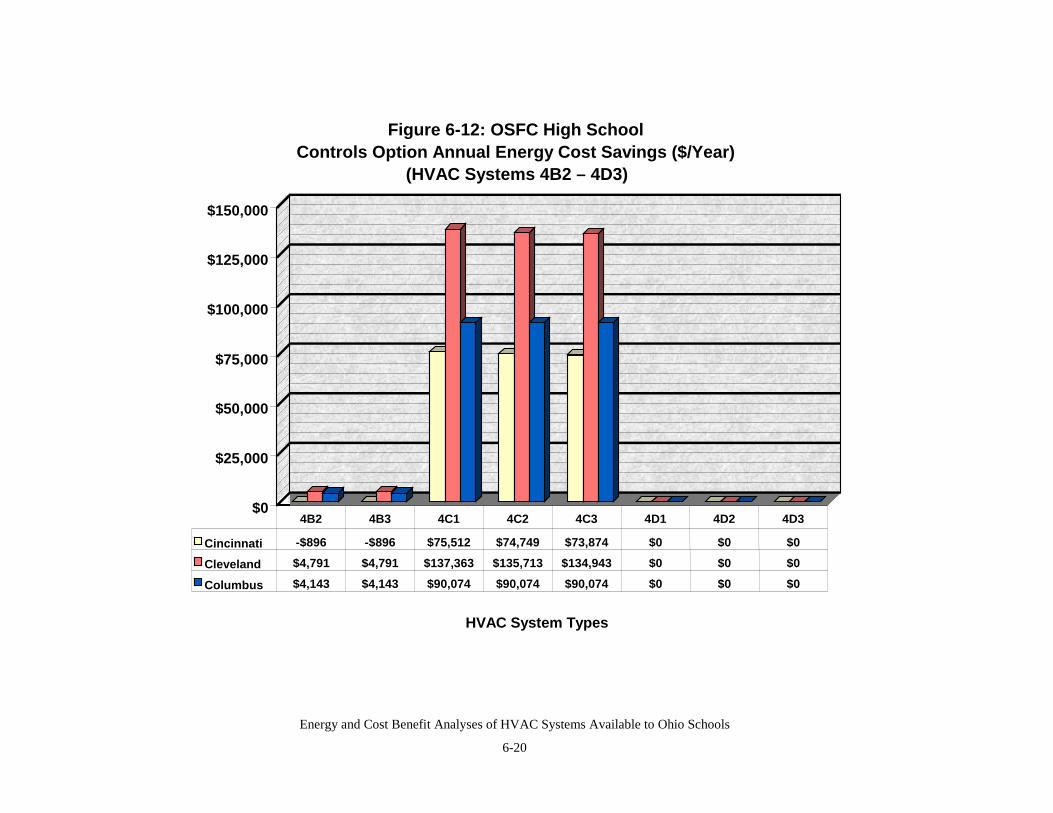
Energy and Cost Benefit Analyses of HVAC Systems Available to Ohio Schools
6-20
$0
$25,000
$50,000
$75,000
$100,000
$125,000
$150,000
HVAC System Types
Figure 6-12: OSFC High School Controls Option Annual Energy Cost Savings ($/Year)
(HVAC Systems 4B2 – 4D3)
Cincinnati -$896 -$896 $75,512 $74,749 $73,874 $0 $0 $0
Cleveland $4,791 $4,791 $137,363 $135,713 $134,943 $0 $0 $0
Columbus $4,143 $4,143 $90,074 $90,074 $90,074 $0 $0 $0
4B2 4B3 4C1 4C2 4C3 4D1 4D2 4D3
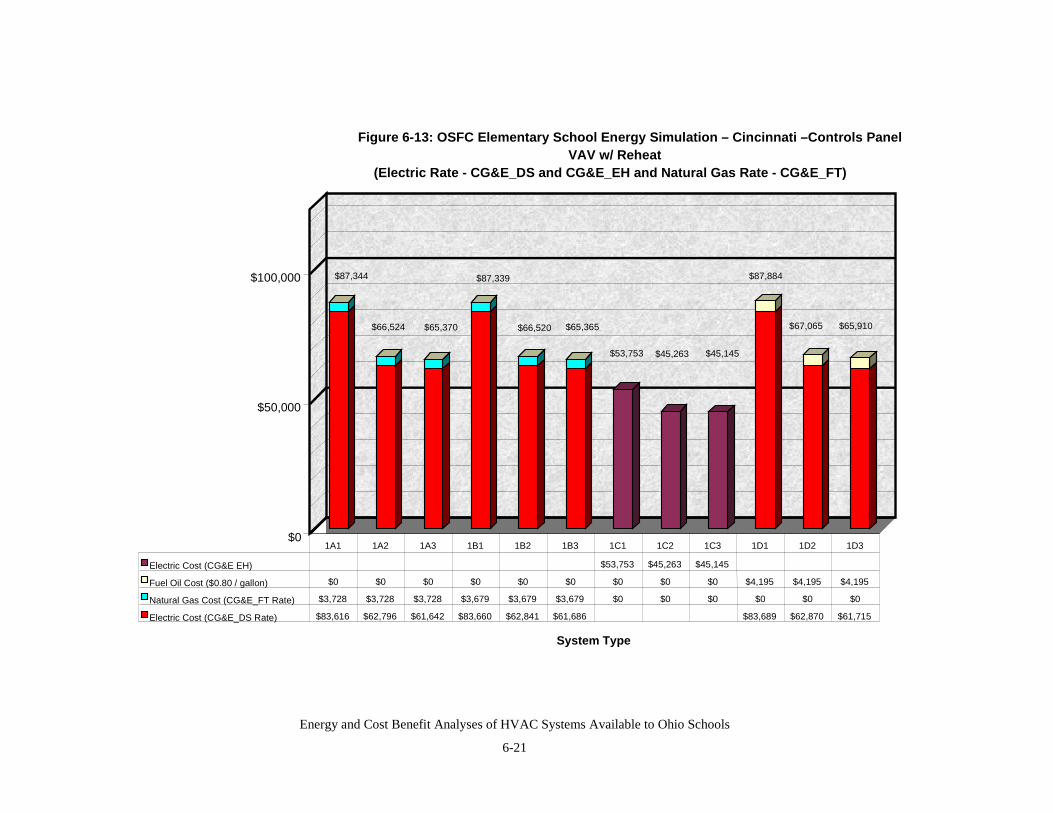
Energy and Cost Benefit Analyses of HVAC Systems Available to Ohio Schools
6-21
$0
$50,000
$100,000
System Type
Figure 6-13: OSFC Elementary School Energy Simulation – Cincinnati –Controls PanelVAV w/ Reheat
(Electric Rate - CG&E_DS and CG&E_EH and Natural Gas Rate - CG&E_FT)
Electric Cost (CG&E EH) $53,753 $45,263 $45,145
Fuel Oil Cost ($0.80 / gallon) $0 $0 $0 $0 $0 $0 $0 $0 $0 $4,195 $4,195 $4,195
Natural Gas Cost (CG&E_FT Rate) $3,728 $3,728 $3,728 $3,679 $3,679 $3,679 $0 $0 $0 $0 $0 $0
Electric Cost (CG&E_DS Rate) $83,616 $62,796 $61,642 $83,660 $62,841 $61,686 $83,689 $62,870 $61,715
1A1 1A2 1A3 1B1 1B2 1B3 1C1 1C2 1C3 1D1 1D2 1D3
$87,344
$66,524 $65,370
$87,339
$65,365$66,520
$53,753 $45,263 $45,145
$87,884
$67,065 $65,910
Energy and Cost Benefit Analyses of HVAC Systems Available to Ohio Schools
6-22
To determine controls economics, net present values of savings (NPV) and paybacks (PB) werecomputed for all HVAC options for the elementary and high school in Cleveland and Cincinnati.For Cleveland, the cost of adding a second meter was determined and compared against energysavings of the various options for 20 years discounted by 6% per year. Similar calculations wererun for Cincinnati, but since there is no cost for the lower rate, the NPVs are always positive(where annual operating cost savings exist) and the PBs are instantaneous. Columbus NPVs andPBs were not calculated due to the complexity of options for demand shedding and the resultingdesign and costing of such options.
For the Cleveland, elementary school case, NPVs range from -$92,894 (HVAC options 1D1,1D2, 1D3 and several others) to $977,274 (HVAC option 3C1) and PBs range from about 1 to 82years. In general when paybacks approach 8 to 10 years, the NPV is $0. In all cases, the all-electric options have very positive NPVs; in the mixed fuel cases, the NPVs are normallynegative.
Similarly, for the Cleveland, high school case, NPVs range from -$87,537 (HVAC options 3B1)to $1,454,543 (HVAC option 4C1) and PBs range from about 1 to 42 years. Again, in all cases,the all-electric options have very positive NPVs; in the mixed fuel cases, the NPVs are normallynegative.
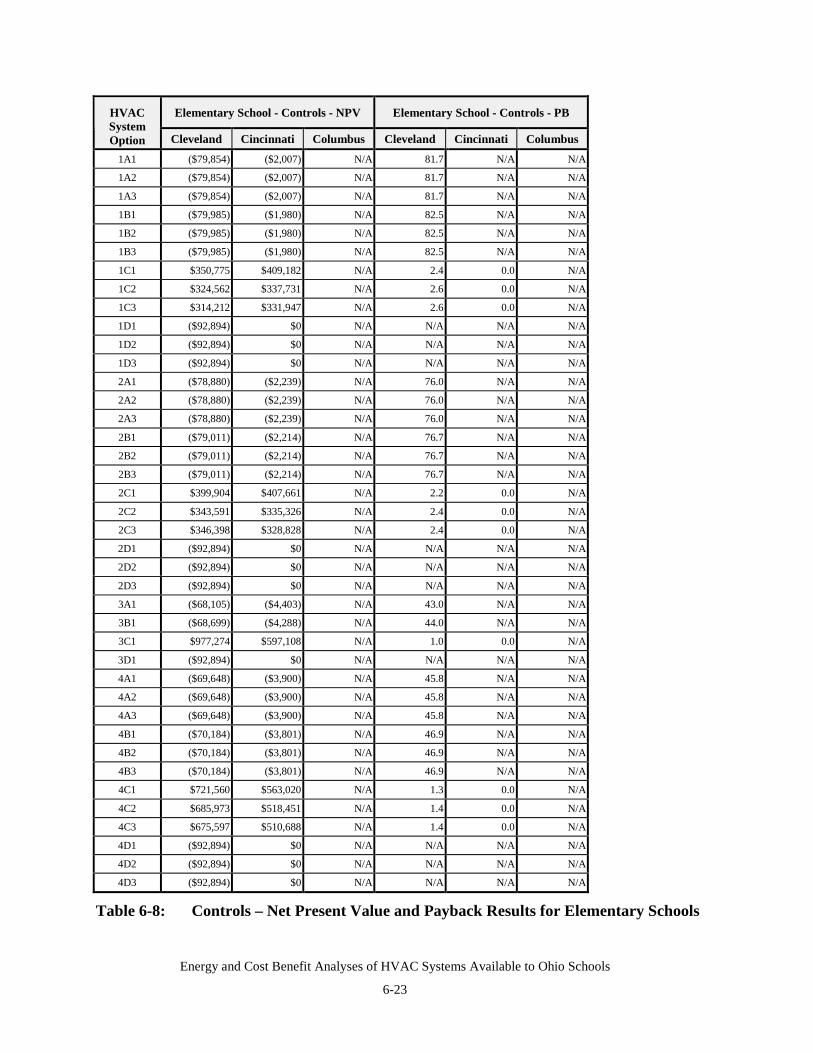
Energy and Cost Benefit Analyses of HVAC Systems Available to Ohio Schools
6-23
Elementary School - Controls - NPV Elementary School - Controls - PBHVACSystemOption Cleveland Cincinnati Columbus Cleveland Cincinnati Columbus
1A1 ($79,854) ($2,007) N/A 81.7 N/A N/A
1A2 ($79,854) ($2,007) N/A 81.7 N/A N/A
1A3 ($79,854) ($2,007) N/A 81.7 N/A N/A
1B1 ($79,985) ($1,980) N/A 82.5 N/A N/A
1B2 ($79,985) ($1,980) N/A 82.5 N/A N/A
1B3 ($79,985) ($1,980) N/A 82.5 N/A N/A
1C1 $350,775 $409,182 N/A 2.4 0.0 N/A
1C2 $324,562 $337,731 N/A 2.6 0.0 N/A
1C3 $314,212 $331,947 N/A 2.6 0.0 N/A
1D1 ($92,894) $0 N/A N/A N/A N/A
1D2 ($92,894) $0 N/A N/A N/A N/A
1D3 ($92,894) $0 N/A N/A N/A N/A
2A1 ($78,880) ($2,239) N/A 76.0 N/A N/A
2A2 ($78,880) ($2,239) N/A 76.0 N/A N/A
2A3 ($78,880) ($2,239) N/A 76.0 N/A N/A
2B1 ($79,011) ($2,214) N/A 76.7 N/A N/A
2B2 ($79,011) ($2,214) N/A 76.7 N/A N/A
2B3 ($79,011) ($2,214) N/A 76.7 N/A N/A
2C1 $399,904 $407,661 N/A 2.2 0.0 N/A
2C2 $343,591 $335,326 N/A 2.4 0.0 N/A
2C3 $346,398 $328,828 N/A 2.4 0.0 N/A
2D1 ($92,894) $0 N/A N/A N/A N/A
2D2 ($92,894) $0 N/A N/A N/A N/A
2D3 ($92,894) $0 N/A N/A N/A N/A
3A1 ($68,105) ($4,403) N/A 43.0 N/A N/A
3B1 ($68,699) ($4,288) N/A 44.0 N/A N/A
3C1 $977,274 $597,108 N/A 1.0 0.0 N/A
3D1 ($92,894) $0 N/A N/A N/A N/A
4A1 ($69,648) ($3,900) N/A 45.8 N/A N/A
4A2 ($69,648) ($3,900) N/A 45.8 N/A N/A
4A3 ($69,648) ($3,900) N/A 45.8 N/A N/A
4B1 ($70,184) ($3,801) N/A 46.9 N/A N/A
4B2 ($70,184) ($3,801) N/A 46.9 N/A N/A
4B3 ($70,184) ($3,801) N/A 46.9 N/A N/A
4C1 $721,560 $563,020 N/A 1.3 0.0 N/A
4C2 $685,973 $518,451 N/A 1.4 0.0 N/A
4C3 $675,597 $510,688 N/A 1.4 0.0 N/A
4D1 ($92,894) $0 N/A N/A N/A N/A
4D2 ($92,894) $0 N/A N/A N/A N/A
4D3 ($92,894) $0 N/A N/A N/A N/A
Table 6-8: Controls – Net Present Value and Payback Results for Elementary Schools
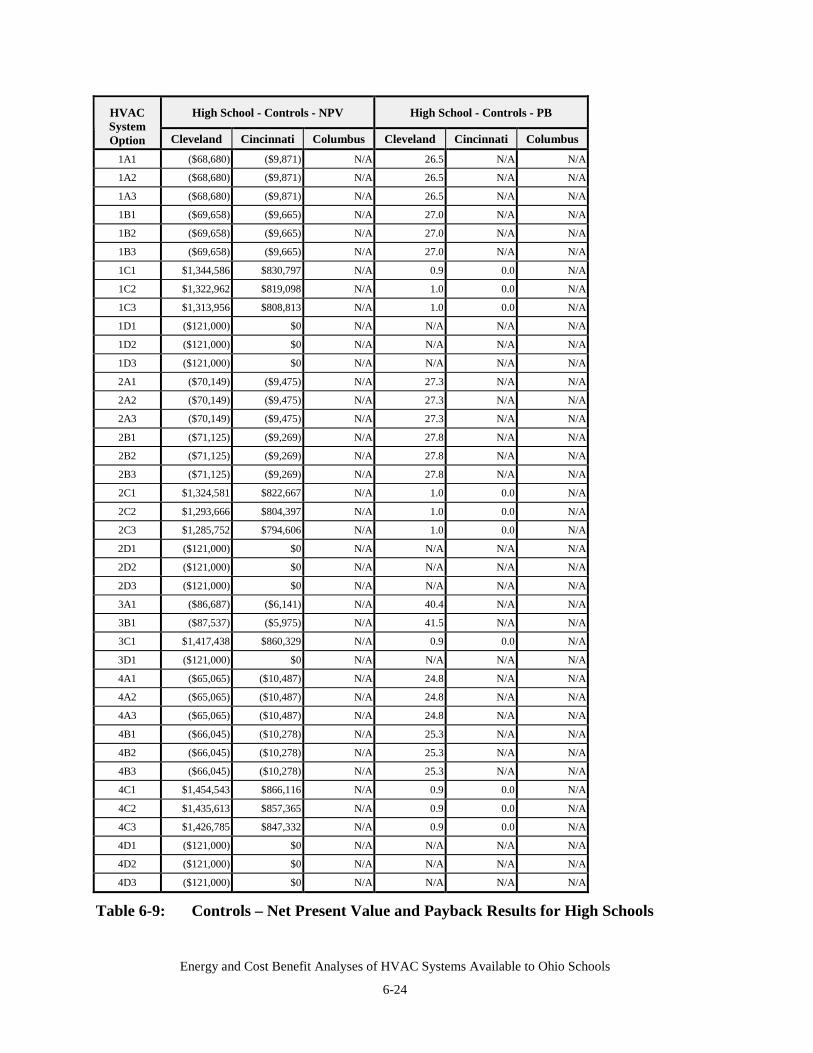
Energy and Cost Benefit Analyses of HVAC Systems Available to Ohio Schools
6-24
High School - Controls - NPV High School - Controls - PBHVACSystemOption Cleveland Cincinnati Columbus Cleveland Cincinnati Columbus
1A1 ($68,680) ($9,871) N/A 26.5 N/A N/A
1A2 ($68,680) ($9,871) N/A 26.5 N/A N/A
1A3 ($68,680) ($9,871) N/A 26.5 N/A N/A
1B1 ($69,658) ($9,665) N/A 27.0 N/A N/A
1B2 ($69,658) ($9,665) N/A 27.0 N/A N/A
1B3 ($69,658) ($9,665) N/A 27.0 N/A N/A
1C1 $1,344,586 $830,797 N/A 0.9 0.0 N/A
1C2 $1,322,962 $819,098 N/A 1.0 0.0 N/A
1C3 $1,313,956 $808,813 N/A 1.0 0.0 N/A
1D1 ($121,000) $0 N/A N/A N/A N/A
1D2 ($121,000) $0 N/A N/A N/A N/A
1D3 ($121,000) $0 N/A N/A N/A N/A
2A1 ($70,149) ($9,475) N/A 27.3 N/A N/A
2A2 ($70,149) ($9,475) N/A 27.3 N/A N/A
2A3 ($70,149) ($9,475) N/A 27.3 N/A N/A
2B1 ($71,125) ($9,269) N/A 27.8 N/A N/A
2B2 ($71,125) ($9,269) N/A 27.8 N/A N/A
2B3 ($71,125) ($9,269) N/A 27.8 N/A N/A
2C1 $1,324,581 $822,667 N/A 1.0 0.0 N/A
2C2 $1,293,666 $804,397 N/A 1.0 0.0 N/A
2C3 $1,285,752 $794,606 N/A 1.0 0.0 N/A
2D1 ($121,000) $0 N/A N/A N/A N/A
2D2 ($121,000) $0 N/A N/A N/A N/A
2D3 ($121,000) $0 N/A N/A N/A N/A
3A1 ($86,687) ($6,141) N/A 40.4 N/A N/A
3B1 ($87,537) ($5,975) N/A 41.5 N/A N/A
3C1 $1,417,438 $860,329 N/A 0.9 0.0 N/A
3D1 ($121,000) $0 N/A N/A N/A N/A
4A1 ($65,065) ($10,487) N/A 24.8 N/A N/A
4A2 ($65,065) ($10,487) N/A 24.8 N/A N/A
4A3 ($65,065) ($10,487) N/A 24.8 N/A N/A
4B1 ($66,045) ($10,278) N/A 25.3 N/A N/A
4B2 ($66,045) ($10,278) N/A 25.3 N/A N/A
4B3 ($66,045) ($10,278) N/A 25.3 N/A N/A
4C1 $1,454,543 $866,116 N/A 0.9 0.0 N/A
4C2 $1,435,613 $857,365 N/A 0.9 0.0 N/A
4C3 $1,426,785 $847,332 N/A 0.9 0.0 N/A
4D1 ($121,000) $0 N/A N/A N/A N/A
4D2 ($121,000) $0 N/A N/A N/A N/A
4D3 ($121,000) $0 N/A N/A N/A N/A
Table 6-9: Controls – Net Present Value and Payback Results for High Schools
Energy and Cost Benefit Analyses of HVAC Systems Available to Ohio Schools
6-25
6.3 CONTROLS RESULTS - OBSERVATIONS
In summary, for the controls analyses, the following observations were seen:
• Many locations have discounted electric rate structures for all-electric buildings or forbuildings where electric demand controls are installed. Further, some locations like withCincinnati, offer special rates for certain classes of customers. In this case, schools areoffered a lower rate. The cost to provide such controls can vary significantly; the three citiescovered in this analysis illustrate this point.
• In general, the higher the electric demand rate structure, the greater the potential for overallenergy cost savings. Cleveland, with the highest electric rates of the three cities evaluated,provided the greatest controls annual energy cost savings opportunities. The all-electricHVAC options for both buildings always provided the greatest cost savings.
• Cleveland NPVs approached $1 million and PBs were less than one year for all-electricHVAC options. For other HVAC options the results were marginal with negative NPVs andPBs up to 42 years.
• Using alternative rate structures with demand controls, all-electric option annual operatingcosts approach the lower range of baseline annual energy cost HVAC options.
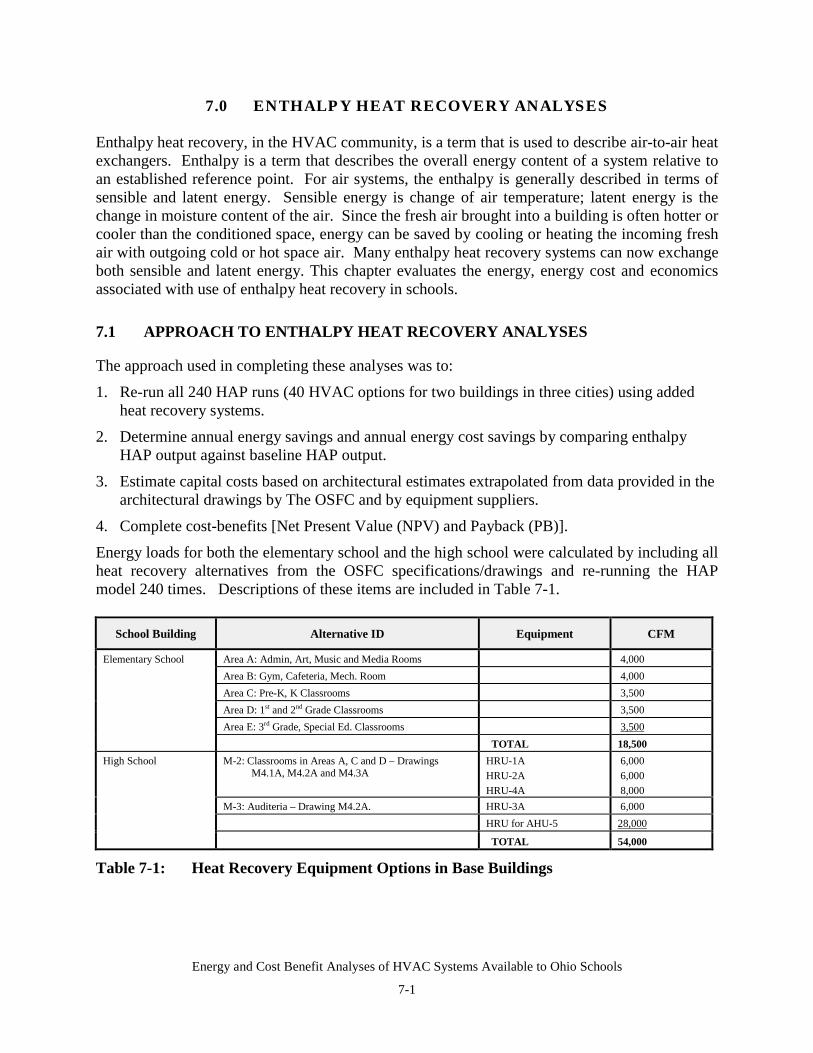
Energy and Cost Benefit Analyses of HVAC Systems Available to Ohio Schools
7-1
7.0 ENTHALPY HEAT RECOVERY ANALYSES
Enthalpy heat recovery, in the HVAC community, is a term that is used to describe air-to-air heatexchangers. Enthalpy is a term that describes the overall energy content of a system relative toan established reference point. For air systems, the enthalpy is generally described in terms ofsensible and latent energy. Sensible energy is change of air temperature; latent energy is thechange in moisture content of the air. Since the fresh air brought into a building is often hotter orcooler than the conditioned space, energy can be saved by cooling or heating the incoming freshair with outgoing cold or hot space air. Many enthalpy heat recovery systems can now exchangeboth sensible and latent energy. This chapter evaluates the energy, energy cost and economicsassociated with use of enthalpy heat recovery in schools.
7.1 APPROACH TO ENTHALPY HEAT RECOVERY ANALYSES
The approach used in completing these analyses was to:
1. Re-run all 240 HAP runs (40 HVAC options for two buildings in three cities) using addedheat recovery systems.
2. Determine annual energy savings and annual energy cost savings by comparing enthalpyHAP output against baseline HAP output.
3. Estimate capital costs based on architectural estimates extrapolated from data provided in thearchitectural drawings by The OSFC and by equipment suppliers.
4. Complete cost-benefits [Net Present Value (NPV) and Payback (PB)].
Energy loads for both the elementary school and the high school were calculated by including allheat recovery alternatives from the OSFC specifications/drawings and re-running the HAPmodel 240 times. Descriptions of these items are included in Table 7-1.
School Building Alternative ID Equipment CFM
Area A: Admin, Art, Music and Media Rooms 4,000Area B: Gym, Cafeteria, Mech. Room 4,000Area C: Pre-K, K Classrooms 3,500Area D: 1st and 2nd Grade Classrooms 3,500Area E: 3rd Grade, Special Ed. Classrooms 3,500
Elementary School
TOTAL 18,500M-2: Classrooms in Areas A, C and D – Drawings
M4.1A, M4.2A and M4.3AHRU-1AHRU-2AHRU-4A
6,000 6,000 8,000
M-3: Auditeria – Drawing M4.2A. HRU-3A 6,000HRU for AHU-5 28,000
High School
TOTAL 54,000
Table 7-1: Heat Recovery Equipment Options in Base Buildings
Energy and Cost Benefit Analyses of HVAC Systems Available to Ohio Schools
7-2
A total of 18,500 cubic feet per minute (CFM) of heat recovery equipment was specified for theelementary school and 54,000 CFM was specified for the high school. Not all conditionedspaces in the high school actually included heat recovery HVAC equipment, but for modelingpurposes heat recovery equipment was assumed to be used in all areas. This assumptionprovides an estimate of the best energy savings one could have in school buildings using suchequipment.
For each of the 240 cases, an annual energy load and annual energy cost was calculated,assuming the use of an enthalph heat recovery system. These values were subtracted from thebase case annual energy costs shown in Chapter 3 results to determine annual net energy savingsassociated with the installation of heat recovery enthalpy equipment.
Documents provided by the OSFC provided cost estimates for the heat recovery systems for thehigh school. The estimated cost for alternative M2 was $141,000 ($7.05/CFM), whereas theestimated cost for alternative M3 was $64,100 ($16.03/CFM) for an overall average rate of$8.55/CFM.
These estimates appeared high and were compared to Carrier, Trane, Fresh Air Solutions and RSMeans CostWorks 2000® data for enthalpy-wheel heat recovery packages. Installed prices fromthese sources averaged approximately $4.50/CFM. In reviewing the architectural drawings, itwould appear that the systems as designed were stand-alone air systems (separate box) ratherthan integrated air systems (single box). The RS Means CostWorks 2000® data appear to reflectthe incremental cost of adding a heat recovery package to an air system. Since RS MeansCostWorks 2000® cost data have been used throughout this work, and appear to better matchcommercial prices, the installed cost used for the economic analyses was assumed an installedcost of $4.50/CFM). Using $4.50/CFM, the elementary and high school costs for enthalpy heatexchangers are $83,250 and $243,000 respectively.
Using estimated differential installed equipment costs, annualized incremental energy andservice, maintenance and replacement cost savings, an interest rate of 6% and a period of 20years, NPVs and paybacks were calculated for all 40 equipment options in three cities for bothbuilding types. Incremental installed costs were determined by subtracting the decreased size ofheating and cooling plant costs from the cost of the enthalpy system. The original plant size wasdropped due to the heat recovery associated with the enthalpy system. Net annual operating costsavings were calculated as the sum of the differential annual energy cost savings plus reducedservice and maintenance costs due to reduced equipment sizes.
7.2 ENTHALPY HEAT RECOVERY RESULTS
To determine the cost effectiveness of enthalpy heat recovery systems, Carrier HAP was rerunassuming use of enthalpy heat recovery systems as described earlier. Predicted equipment sizesusing enthalpy heat recovery are summarized in Tables 7-2 and 7-3.
Reduced cooling and heating plant sizes are summarized in Tables 7-4 and 7-5.
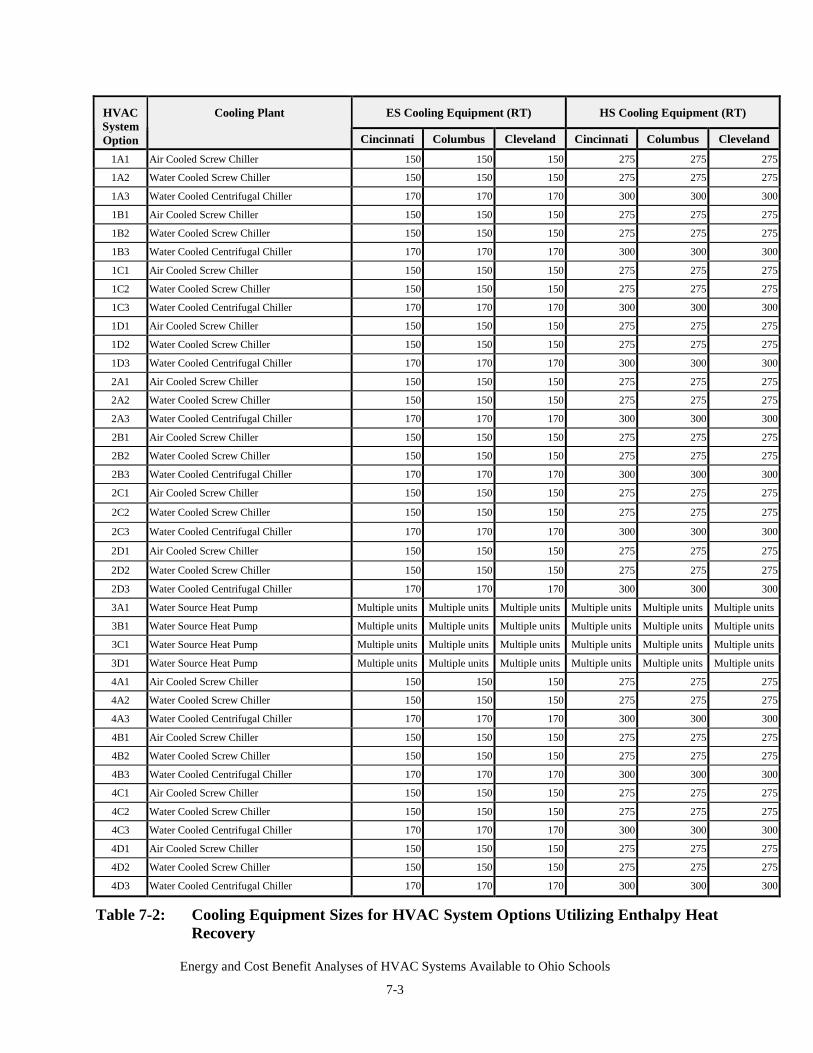
Energy and Cost Benefit Analyses of HVAC Systems Available to Ohio Schools
7-3
ES Cooling Equipment (RT) HS Cooling Equipment (RT)HVACSystemOption
Cooling Plant
Cincinnati Columbus Cleveland Cincinnati Columbus Cleveland1A1 Air Cooled Screw Chiller 150 150 150 275 275 275
1A2 Water Cooled Screw Chiller 150 150 150 275 275 275
1A3 Water Cooled Centrifugal Chiller 170 170 170 300 300 300
1B1 Air Cooled Screw Chiller 150 150 150 275 275 275
1B2 Water Cooled Screw Chiller 150 150 150 275 275 275
1B3 Water Cooled Centrifugal Chiller 170 170 170 300 300 300
1C1 Air Cooled Screw Chiller 150 150 150 275 275 275
1C2 Water Cooled Screw Chiller 150 150 150 275 275 275
1C3 Water Cooled Centrifugal Chiller 170 170 170 300 300 300
1D1 Air Cooled Screw Chiller 150 150 150 275 275 275
1D2 Water Cooled Screw Chiller 150 150 150 275 275 275
1D3 Water Cooled Centrifugal Chiller 170 170 170 300 300 300
2A1 Air Cooled Screw Chiller 150 150 150 275 275 275
2A2 Water Cooled Screw Chiller 150 150 150 275 275 275
2A3 Water Cooled Centrifugal Chiller 170 170 170 300 300 300
2B1 Air Cooled Screw Chiller 150 150 150 275 275 275
2B2 Water Cooled Screw Chiller 150 150 150 275 275 275
2B3 Water Cooled Centrifugal Chiller 170 170 170 300 300 300
2C1 Air Cooled Screw Chiller 150 150 150 275 275 275
2C2 Water Cooled Screw Chiller 150 150 150 275 275 275
2C3 Water Cooled Centrifugal Chiller 170 170 170 300 300 300
2D1 Air Cooled Screw Chiller 150 150 150 275 275 275
2D2 Water Cooled Screw Chiller 150 150 150 275 275 275
2D3 Water Cooled Centrifugal Chiller 170 170 170 300 300 300
3A1 Water Source Heat Pump Multiple units Multiple units Multiple units Multiple units Multiple units Multiple units
3B1 Water Source Heat Pump Multiple units Multiple units Multiple units Multiple units Multiple units Multiple units
3C1 Water Source Heat Pump Multiple units Multiple units Multiple units Multiple units Multiple units Multiple units
3D1 Water Source Heat Pump Multiple units Multiple units Multiple units Multiple units Multiple units Multiple units
4A1 Air Cooled Screw Chiller 150 150 150 275 275 275
4A2 Water Cooled Screw Chiller 150 150 150 275 275 275
4A3 Water Cooled Centrifugal Chiller 170 170 170 300 300 300
4B1 Air Cooled Screw Chiller 150 150 150 275 275 275
4B2 Water Cooled Screw Chiller 150 150 150 275 275 275
4B3 Water Cooled Centrifugal Chiller 170 170 170 300 300 300
4C1 Air Cooled Screw Chiller 150 150 150 275 275 275
4C2 Water Cooled Screw Chiller 150 150 150 275 275 275
4C3 Water Cooled Centrifugal Chiller 170 170 170 300 300 300
4D1 Air Cooled Screw Chiller 150 150 150 275 275 275
4D2 Water Cooled Screw Chiller 150 150 150 275 275 275
4D3 Water Cooled Centrifugal Chiller 170 170 170 300 300 300
Table 7-2: Cooling Equipment Sizes for HVAC System Options Utilizing Enthalpy HeatRecovery
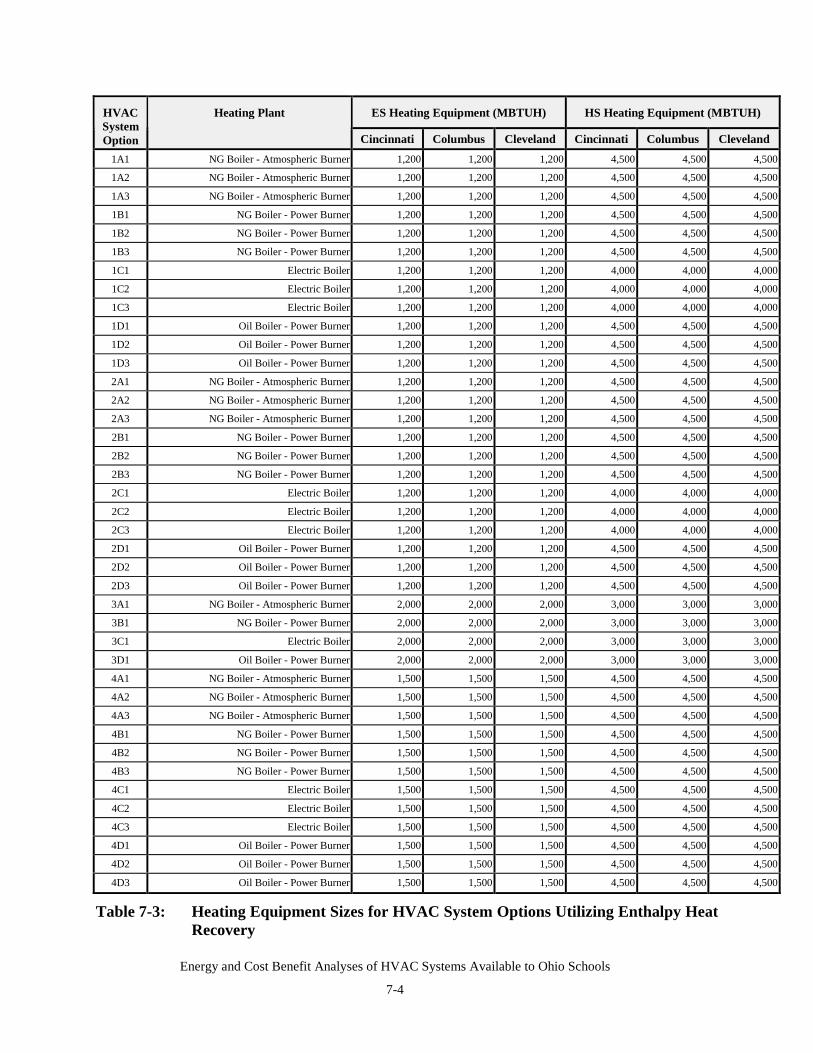
Energy and Cost Benefit Analyses of HVAC Systems Available to Ohio Schools
7-4
ES Heating Equipment (MBTUH) HS Heating Equipment (MBTUH)HVACSystemOption
Heating Plant
Cincinnati Columbus Cleveland Cincinnati Columbus Cleveland1A1 NG Boiler - Atmospheric Burner 1,200 1,200 1,200 4,500 4,500 4,500
1A2 NG Boiler - Atmospheric Burner 1,200 1,200 1,200 4,500 4,500 4,500
1A3 NG Boiler - Atmospheric Burner 1,200 1,200 1,200 4,500 4,500 4,500
1B1 NG Boiler - Power Burner 1,200 1,200 1,200 4,500 4,500 4,500
1B2 NG Boiler - Power Burner 1,200 1,200 1,200 4,500 4,500 4,500
1B3 NG Boiler - Power Burner 1,200 1,200 1,200 4,500 4,500 4,500
1C1 Electric Boiler 1,200 1,200 1,200 4,000 4,000 4,000
1C2 Electric Boiler 1,200 1,200 1,200 4,000 4,000 4,000
1C3 Electric Boiler 1,200 1,200 1,200 4,000 4,000 4,000
1D1 Oil Boiler - Power Burner 1,200 1,200 1,200 4,500 4,500 4,500
1D2 Oil Boiler - Power Burner 1,200 1,200 1,200 4,500 4,500 4,500
1D3 Oil Boiler - Power Burner 1,200 1,200 1,200 4,500 4,500 4,500
2A1 NG Boiler - Atmospheric Burner 1,200 1,200 1,200 4,500 4,500 4,500
2A2 NG Boiler - Atmospheric Burner 1,200 1,200 1,200 4,500 4,500 4,500
2A3 NG Boiler - Atmospheric Burner 1,200 1,200 1,200 4,500 4,500 4,500
2B1 NG Boiler - Power Burner 1,200 1,200 1,200 4,500 4,500 4,500
2B2 NG Boiler - Power Burner 1,200 1,200 1,200 4,500 4,500 4,500
2B3 NG Boiler - Power Burner 1,200 1,200 1,200 4,500 4,500 4,500
2C1 Electric Boiler 1,200 1,200 1,200 4,000 4,000 4,000
2C2 Electric Boiler 1,200 1,200 1,200 4,000 4,000 4,000
2C3 Electric Boiler 1,200 1,200 1,200 4,000 4,000 4,000
2D1 Oil Boiler - Power Burner 1,200 1,200 1,200 4,500 4,500 4,500
2D2 Oil Boiler - Power Burner 1,200 1,200 1,200 4,500 4,500 4,500
2D3 Oil Boiler - Power Burner 1,200 1,200 1,200 4,500 4,500 4,500
3A1 NG Boiler - Atmospheric Burner 2,000 2,000 2,000 3,000 3,000 3,000
3B1 NG Boiler - Power Burner 2,000 2,000 2,000 3,000 3,000 3,000
3C1 Electric Boiler 2,000 2,000 2,000 3,000 3,000 3,000
3D1 Oil Boiler - Power Burner 2,000 2,000 2,000 3,000 3,000 3,000
4A1 NG Boiler - Atmospheric Burner 1,500 1,500 1,500 4,500 4,500 4,500
4A2 NG Boiler - Atmospheric Burner 1,500 1,500 1,500 4,500 4,500 4,500
4A3 NG Boiler - Atmospheric Burner 1,500 1,500 1,500 4,500 4,500 4,500
4B1 NG Boiler - Power Burner 1,500 1,500 1,500 4,500 4,500 4,500
4B2 NG Boiler - Power Burner 1,500 1,500 1,500 4,500 4,500 4,500
4B3 NG Boiler - Power Burner 1,500 1,500 1,500 4,500 4,500 4,500
4C1 Electric Boiler 1,500 1,500 1,500 4,500 4,500 4,500
4C2 Electric Boiler 1,500 1,500 1,500 4,500 4,500 4,500
4C3 Electric Boiler 1,500 1,500 1,500 4,500 4,500 4,500
4D1 Oil Boiler - Power Burner 1,500 1,500 1,500 4,500 4,500 4,500
4D2 Oil Boiler - Power Burner 1,500 1,500 1,500 4,500 4,500 4,500
4D3 Oil Boiler - Power Burner 1,500 1,500 1,500 4,500 4,500 4,500
Table 7-3: Heating Equipment Sizes for HVAC System Options Utilizing Enthalpy HeatRecovery
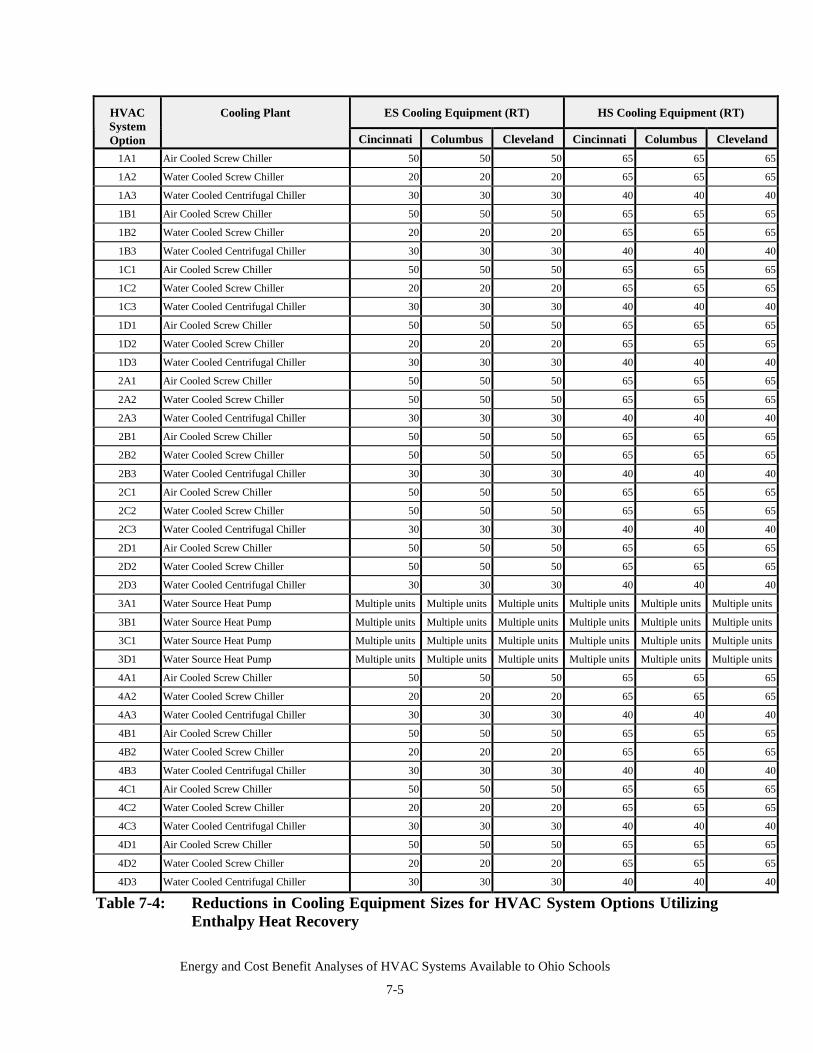
Energy and Cost Benefit Analyses of HVAC Systems Available to Ohio Schools
7-5
ES Cooling Equipment (RT) HS Cooling Equipment (RT)HVACSystemOption
Cooling Plant
Cincinnati Columbus Cleveland Cincinnati Columbus Cleveland1A1 Air Cooled Screw Chiller 50 50 50 65 65 65
1A2 Water Cooled Screw Chiller 20 20 20 65 65 65
1A3 Water Cooled Centrifugal Chiller 30 30 30 40 40 40
1B1 Air Cooled Screw Chiller 50 50 50 65 65 65
1B2 Water Cooled Screw Chiller 20 20 20 65 65 65
1B3 Water Cooled Centrifugal Chiller 30 30 30 40 40 40
1C1 Air Cooled Screw Chiller 50 50 50 65 65 65
1C2 Water Cooled Screw Chiller 20 20 20 65 65 65
1C3 Water Cooled Centrifugal Chiller 30 30 30 40 40 40
1D1 Air Cooled Screw Chiller 50 50 50 65 65 65
1D2 Water Cooled Screw Chiller 20 20 20 65 65 65
1D3 Water Cooled Centrifugal Chiller 30 30 30 40 40 40
2A1 Air Cooled Screw Chiller 50 50 50 65 65 65
2A2 Water Cooled Screw Chiller 50 50 50 65 65 65
2A3 Water Cooled Centrifugal Chiller 30 30 30 40 40 40
2B1 Air Cooled Screw Chiller 50 50 50 65 65 65
2B2 Water Cooled Screw Chiller 50 50 50 65 65 65
2B3 Water Cooled Centrifugal Chiller 30 30 30 40 40 40
2C1 Air Cooled Screw Chiller 50 50 50 65 65 65
2C2 Water Cooled Screw Chiller 50 50 50 65 65 65
2C3 Water Cooled Centrifugal Chiller 30 30 30 40 40 40
2D1 Air Cooled Screw Chiller 50 50 50 65 65 65
2D2 Water Cooled Screw Chiller 50 50 50 65 65 65
2D3 Water Cooled Centrifugal Chiller 30 30 30 40 40 40
3A1 Water Source Heat Pump Multiple units Multiple units Multiple units Multiple units Multiple units Multiple units
3B1 Water Source Heat Pump Multiple units Multiple units Multiple units Multiple units Multiple units Multiple units
3C1 Water Source Heat Pump Multiple units Multiple units Multiple units Multiple units Multiple units Multiple units
3D1 Water Source Heat Pump Multiple units Multiple units Multiple units Multiple units Multiple units Multiple units
4A1 Air Cooled Screw Chiller 50 50 50 65 65 65
4A2 Water Cooled Screw Chiller 20 20 20 65 65 65
4A3 Water Cooled Centrifugal Chiller 30 30 30 40 40 40
4B1 Air Cooled Screw Chiller 50 50 50 65 65 65
4B2 Water Cooled Screw Chiller 20 20 20 65 65 65
4B3 Water Cooled Centrifugal Chiller 30 30 30 40 40 40
4C1 Air Cooled Screw Chiller 50 50 50 65 65 65
4C2 Water Cooled Screw Chiller 20 20 20 65 65 65
4C3 Water Cooled Centrifugal Chiller 30 30 30 40 40 40
4D1 Air Cooled Screw Chiller 50 50 50 65 65 65
4D2 Water Cooled Screw Chiller 20 20 20 65 65 65
4D3 Water Cooled Centrifugal Chiller 30 30 30 40 40 40
Table 7-4: Reductions in Cooling Equipment Sizes for HVAC System Options UtilizingEnthalpy Heat Recovery
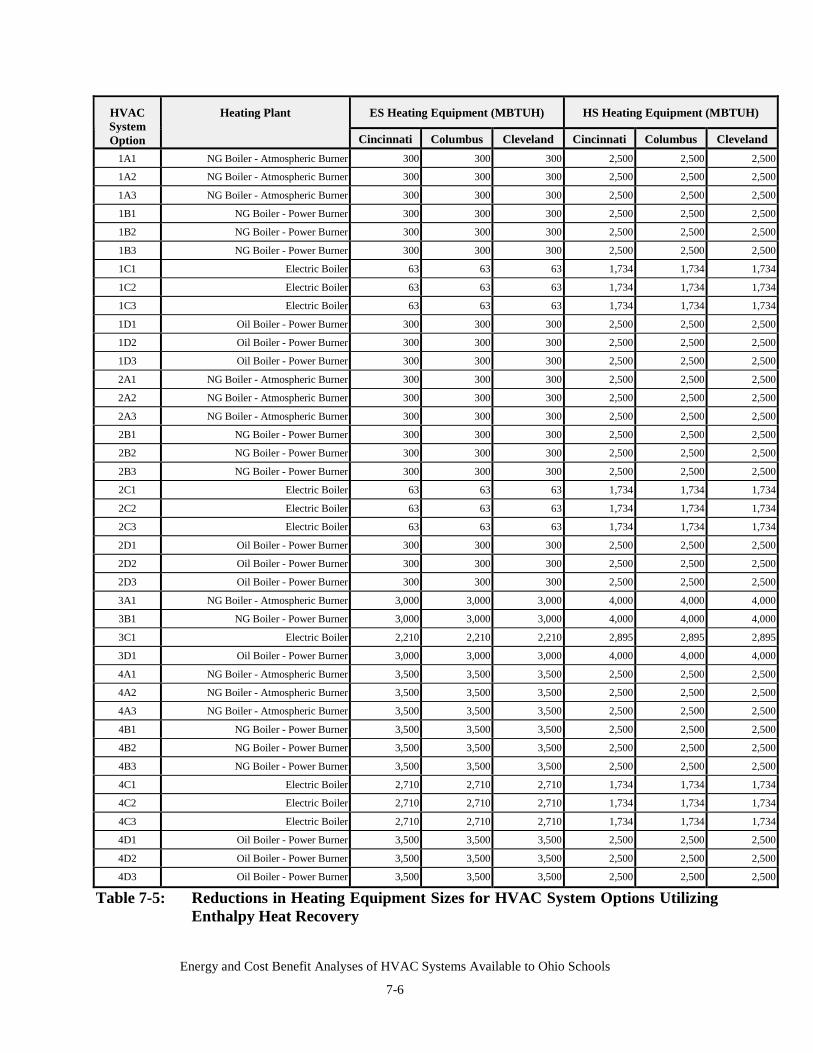
Energy and Cost Benefit Analyses of HVAC Systems Available to Ohio Schools
7-6
ES Heating Equipment (MBTUH) HS Heating Equipment (MBTUH)HVACSystemOption
Heating Plant
Cincinnati Columbus Cleveland Cincinnati Columbus Cleveland1A1 NG Boiler - Atmospheric Burner 300 300 300 2,500 2,500 2,500
1A2 NG Boiler - Atmospheric Burner 300 300 300 2,500 2,500 2,500
1A3 NG Boiler - Atmospheric Burner 300 300 300 2,500 2,500 2,500
1B1 NG Boiler - Power Burner 300 300 300 2,500 2,500 2,500
1B2 NG Boiler - Power Burner 300 300 300 2,500 2,500 2,500
1B3 NG Boiler - Power Burner 300 300 300 2,500 2,500 2,500
1C1 Electric Boiler 63 63 63 1,734 1,734 1,734
1C2 Electric Boiler 63 63 63 1,734 1,734 1,734
1C3 Electric Boiler 63 63 63 1,734 1,734 1,734
1D1 Oil Boiler - Power Burner 300 300 300 2,500 2,500 2,500
1D2 Oil Boiler - Power Burner 300 300 300 2,500 2,500 2,500
1D3 Oil Boiler - Power Burner 300 300 300 2,500 2,500 2,500
2A1 NG Boiler - Atmospheric Burner 300 300 300 2,500 2,500 2,500
2A2 NG Boiler - Atmospheric Burner 300 300 300 2,500 2,500 2,500
2A3 NG Boiler - Atmospheric Burner 300 300 300 2,500 2,500 2,500
2B1 NG Boiler - Power Burner 300 300 300 2,500 2,500 2,500
2B2 NG Boiler - Power Burner 300 300 300 2,500 2,500 2,500
2B3 NG Boiler - Power Burner 300 300 300 2,500 2,500 2,500
2C1 Electric Boiler 63 63 63 1,734 1,734 1,734
2C2 Electric Boiler 63 63 63 1,734 1,734 1,734
2C3 Electric Boiler 63 63 63 1,734 1,734 1,734
2D1 Oil Boiler - Power Burner 300 300 300 2,500 2,500 2,500
2D2 Oil Boiler - Power Burner 300 300 300 2,500 2,500 2,500
2D3 Oil Boiler - Power Burner 300 300 300 2,500 2,500 2,500
3A1 NG Boiler - Atmospheric Burner 3,000 3,000 3,000 4,000 4,000 4,000
3B1 NG Boiler - Power Burner 3,000 3,000 3,000 4,000 4,000 4,000
3C1 Electric Boiler 2,210 2,210 2,210 2,895 2,895 2,895
3D1 Oil Boiler - Power Burner 3,000 3,000 3,000 4,000 4,000 4,000
4A1 NG Boiler - Atmospheric Burner 3,500 3,500 3,500 2,500 2,500 2,500
4A2 NG Boiler - Atmospheric Burner 3,500 3,500 3,500 2,500 2,500 2,500
4A3 NG Boiler - Atmospheric Burner 3,500 3,500 3,500 2,500 2,500 2,500
4B1 NG Boiler - Power Burner 3,500 3,500 3,500 2,500 2,500 2,500
4B2 NG Boiler - Power Burner 3,500 3,500 3,500 2,500 2,500 2,500
4B3 NG Boiler - Power Burner 3,500 3,500 3,500 2,500 2,500 2,500
4C1 Electric Boiler 2,710 2,710 2,710 1,734 1,734 1,734
4C2 Electric Boiler 2,710 2,710 2,710 1,734 1,734 1,734
4C3 Electric Boiler 2,710 2,710 2,710 1,734 1,734 1,734
4D1 Oil Boiler - Power Burner 3,500 3,500 3,500 2,500 2,500 2,500
4D2 Oil Boiler - Power Burner 3,500 3,500 3,500 2,500 2,500 2,500
4D3 Oil Boiler - Power Burner 3,500 3,500 3,500 2,500 2,500 2,500
Table 7-5: Reductions in Heating Equipment Sizes for HVAC System Options UtilizingEnthalpy Heat Recovery
Energy and Cost Benefit Analyses of HVAC Systems Available to Ohio Schools
7-7
Reductions in plant sizes for each HVAC system option are shown in Table 7-3 (cooling plantreduction in refrigerant tons) and Table 7-4 (heating plant reduction in MBTUH). Enthalpy heatrecovery can save up to 50 RT of cooling capacity in the elementary school and 65 RT in thehigh school. Similarly, for heating, boiler sizes can be reduced by 3,400 MBTUH for theelementary school and 4,000 MBTUH for the high school. As will be shown, these aresignificant reductions in both cooling and heating plant equipment and related installed andservice, maintenance and repair costs.
The net capital costs for both the elementary school and the high school for all 40 HVAC systemoptions for all three cities are summarized in Tables 7-6 and 7-7. The net capital costs include:
• Costs of the enthalpy heat exchange systems• Credit for reduced chiller and boiler equipment due to heat recovery.
Net capital costs range from -$82,261 (Cleveland, 3B1) to $73,067 (Cleveland, 1A2) for theelementary school HVAC system options. For the high school, these costs range from $34,238(Cincinnati, 3B1) to $220,720 (Cleveland, 4C3). Significant plant equipment cost reductionsoccurred with the heat pump cases (3X1 series). The capital cost savings for reduced equipmentdue to heat recovery range from $9,512 (Columbus, 1C2) to $169,174 (Cleveland, 3B1) for theelementary school and from $ 30,255 (Cincinnati, 4C3) to $216,380 (Cleveland, 3B1) for thehigh school.
Annual energy savings for use of enthalpy heat recovery were determined by calculating annualenergy use for all enthalpy cases and subtracting the results from the baseline annual energyusage presented in Chapter 3. All values are site energy values. Results for both the elementaryand high school, both on an absolute and per square foot basis, are summarized in Tables 7-8 and7-9 and Tables 7-10 and 7-11 respectively. Example results for the first eight HVAC systems(1A1 to 1C2) for both the elementary and the high school are plotted in Figure 7-1 and 7-2; thebalance of these enthalpy energy savings data can be found in plots presented in Appendix D.Reduced annual energy consumption for elementary schools using enthalpy heat exchangeranged from a low of 337 million BTU per year (Cincinnati, 1C2) to a high of 1,520 millionBTU per year (Cleveland, 4B1). On a per square foot basis, this ranged from a low of 5.2thousand BTU per square foot per year (Cincinnati, 1C2) to a high of 23.6 thousand BTU persquare foot per year (Cleveland, 4B1). Similarly, for the high school, reduced annual energyconsumption using enthalpy heat exchange ranged from a low of 1,410 million BTU per year(Cincinnati, 3C1) to a high of 2,559 million BTU per year (Columbus, 4A1). On a per squarefoot basis, this ranged from a low of 11.7 thousand BTU per square foot per year (Cincinnati,3C1) to a high of 21.2 thousand BTU per square foot per year (Columbus, 4A1). As seen inFigures 7-1 and 7-2, the maximum savings are seen in Cleveland for the elementary school andin Columbus for the high school. Climate and building design appear to be responsible for thesetrends.
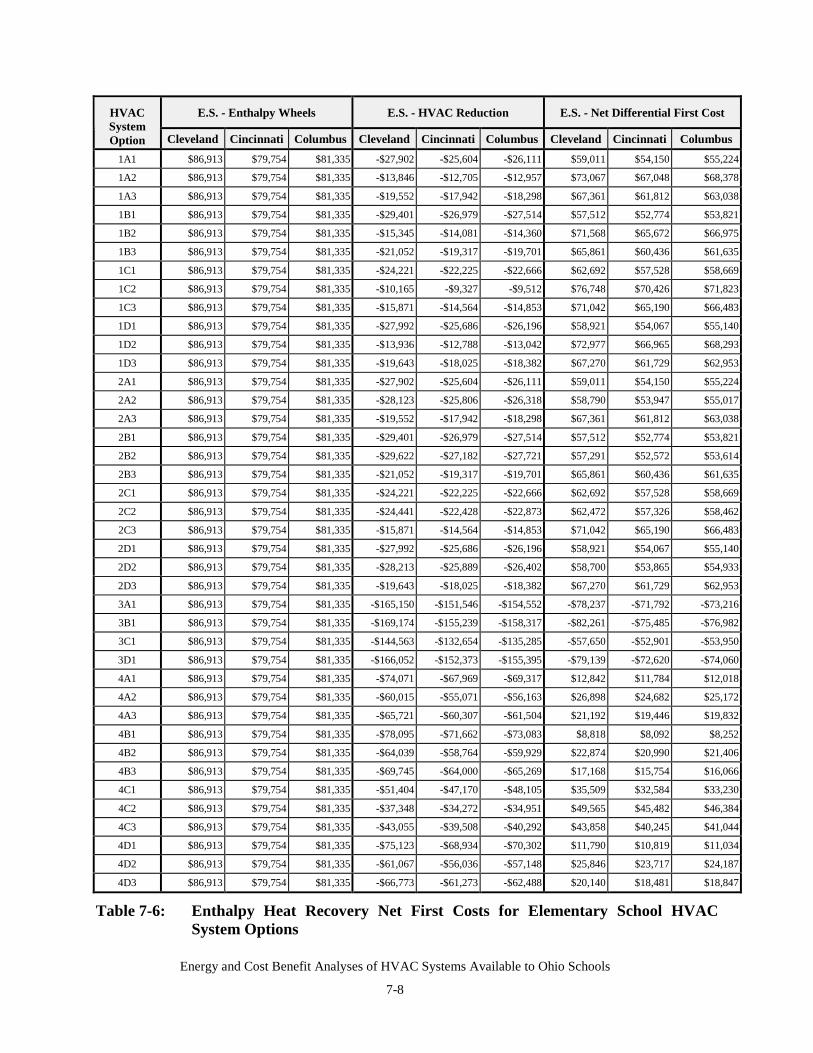
Energy and Cost Benefit Analyses of HVAC Systems Available to Ohio Schools
7-8
E.S. - Enthalpy Wheels E.S. - HVAC Reduction E.S. - Net Differential First CostHVACSystemOption Cleveland Cincinnati Columbus Cleveland Cincinnati Columbus Cleveland Cincinnati Columbus
1A1 $86,913 $79,754 $81,335 -$27,902 -$25,604 -$26,111 $59,011 $54,150 $55,224
1A2 $86,913 $79,754 $81,335 -$13,846 -$12,705 -$12,957 $73,067 $67,048 $68,378
1A3 $86,913 $79,754 $81,335 -$19,552 -$17,942 -$18,298 $67,361 $61,812 $63,038
1B1 $86,913 $79,754 $81,335 -$29,401 -$26,979 -$27,514 $57,512 $52,774 $53,821
1B2 $86,913 $79,754 $81,335 -$15,345 -$14,081 -$14,360 $71,568 $65,672 $66,975
1B3 $86,913 $79,754 $81,335 -$21,052 -$19,317 -$19,701 $65,861 $60,436 $61,635
1C1 $86,913 $79,754 $81,335 -$24,221 -$22,225 -$22,666 $62,692 $57,528 $58,669
1C2 $86,913 $79,754 $81,335 -$10,165 -$9,327 -$9,512 $76,748 $70,426 $71,823
1C3 $86,913 $79,754 $81,335 -$15,871 -$14,564 -$14,853 $71,042 $65,190 $66,483
1D1 $86,913 $79,754 $81,335 -$27,992 -$25,686 -$26,196 $58,921 $54,067 $55,140
1D2 $86,913 $79,754 $81,335 -$13,936 -$12,788 -$13,042 $72,977 $66,965 $68,293
1D3 $86,913 $79,754 $81,335 -$19,643 -$18,025 -$18,382 $67,270 $61,729 $62,953
2A1 $86,913 $79,754 $81,335 -$27,902 -$25,604 -$26,111 $59,011 $54,150 $55,224
2A2 $86,913 $79,754 $81,335 -$28,123 -$25,806 -$26,318 $58,790 $53,947 $55,017
2A3 $86,913 $79,754 $81,335 -$19,552 -$17,942 -$18,298 $67,361 $61,812 $63,038
2B1 $86,913 $79,754 $81,335 -$29,401 -$26,979 -$27,514 $57,512 $52,774 $53,821
2B2 $86,913 $79,754 $81,335 -$29,622 -$27,182 -$27,721 $57,291 $52,572 $53,614
2B3 $86,913 $79,754 $81,335 -$21,052 -$19,317 -$19,701 $65,861 $60,436 $61,635
2C1 $86,913 $79,754 $81,335 -$24,221 -$22,225 -$22,666 $62,692 $57,528 $58,669
2C2 $86,913 $79,754 $81,335 -$24,441 -$22,428 -$22,873 $62,472 $57,326 $58,462
2C3 $86,913 $79,754 $81,335 -$15,871 -$14,564 -$14,853 $71,042 $65,190 $66,483
2D1 $86,913 $79,754 $81,335 -$27,992 -$25,686 -$26,196 $58,921 $54,067 $55,140
2D2 $86,913 $79,754 $81,335 -$28,213 -$25,889 -$26,402 $58,700 $53,865 $54,933
2D3 $86,913 $79,754 $81,335 -$19,643 -$18,025 -$18,382 $67,270 $61,729 $62,953
3A1 $86,913 $79,754 $81,335 -$165,150 -$151,546 -$154,552 -$78,237 -$71,792 -$73,216
3B1 $86,913 $79,754 $81,335 -$169,174 -$155,239 -$158,317 -$82,261 -$75,485 -$76,982
3C1 $86,913 $79,754 $81,335 -$144,563 -$132,654 -$135,285 -$57,650 -$52,901 -$53,950
3D1 $86,913 $79,754 $81,335 -$166,052 -$152,373 -$155,395 -$79,139 -$72,620 -$74,060
4A1 $86,913 $79,754 $81,335 -$74,071 -$67,969 -$69,317 $12,842 $11,784 $12,018
4A2 $86,913 $79,754 $81,335 -$60,015 -$55,071 -$56,163 $26,898 $24,682 $25,172
4A3 $86,913 $79,754 $81,335 -$65,721 -$60,307 -$61,504 $21,192 $19,446 $19,832
4B1 $86,913 $79,754 $81,335 -$78,095 -$71,662 -$73,083 $8,818 $8,092 $8,252
4B2 $86,913 $79,754 $81,335 -$64,039 -$58,764 -$59,929 $22,874 $20,990 $21,406
4B3 $86,913 $79,754 $81,335 -$69,745 -$64,000 -$65,269 $17,168 $15,754 $16,066
4C1 $86,913 $79,754 $81,335 -$51,404 -$47,170 -$48,105 $35,509 $32,584 $33,230
4C2 $86,913 $79,754 $81,335 -$37,348 -$34,272 -$34,951 $49,565 $45,482 $46,384
4C3 $86,913 $79,754 $81,335 -$43,055 -$39,508 -$40,292 $43,858 $40,245 $41,044
4D1 $86,913 $79,754 $81,335 -$75,123 -$68,934 -$70,302 $11,790 $10,819 $11,034
4D2 $86,913 $79,754 $81,335 -$61,067 -$56,036 -$57,148 $25,846 $23,717 $24,187
4D3 $86,913 $79,754 $81,335 -$66,773 -$61,273 -$62,488 $20,140 $18,481 $18,847
Table 7-6: Enthalpy Heat Recovery Net First Costs for Elementary School HVACSystem Options
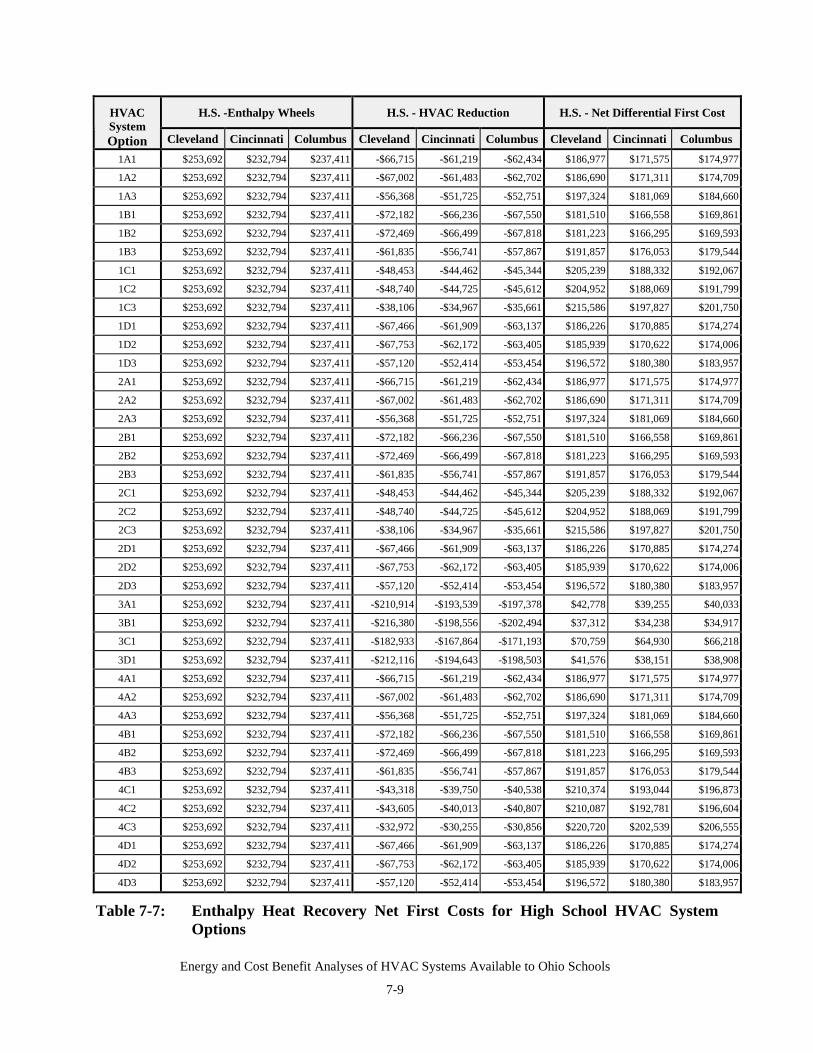
Energy and Cost Benefit Analyses of HVAC Systems Available to Ohio Schools
7-9
H.S. -Enthalpy Wheels H.S. - HVAC Reduction H.S. - Net Differential First CostHVACSystemOption Cleveland Cincinnati Columbus Cleveland Cincinnati Columbus Cleveland Cincinnati Columbus
1A1 $253,692 $232,794 $237,411 -$66,715 -$61,219 -$62,434 $186,977 $171,575 $174,977
1A2 $253,692 $232,794 $237,411 -$67,002 -$61,483 -$62,702 $186,690 $171,311 $174,709
1A3 $253,692 $232,794 $237,411 -$56,368 -$51,725 -$52,751 $197,324 $181,069 $184,660
1B1 $253,692 $232,794 $237,411 -$72,182 -$66,236 -$67,550 $181,510 $166,558 $169,861
1B2 $253,692 $232,794 $237,411 -$72,469 -$66,499 -$67,818 $181,223 $166,295 $169,593
1B3 $253,692 $232,794 $237,411 -$61,835 -$56,741 -$57,867 $191,857 $176,053 $179,544
1C1 $253,692 $232,794 $237,411 -$48,453 -$44,462 -$45,344 $205,239 $188,332 $192,067
1C2 $253,692 $232,794 $237,411 -$48,740 -$44,725 -$45,612 $204,952 $188,069 $191,799
1C3 $253,692 $232,794 $237,411 -$38,106 -$34,967 -$35,661 $215,586 $197,827 $201,750
1D1 $253,692 $232,794 $237,411 -$67,466 -$61,909 -$63,137 $186,226 $170,885 $174,274
1D2 $253,692 $232,794 $237,411 -$67,753 -$62,172 -$63,405 $185,939 $170,622 $174,006
1D3 $253,692 $232,794 $237,411 -$57,120 -$52,414 -$53,454 $196,572 $180,380 $183,957
2A1 $253,692 $232,794 $237,411 -$66,715 -$61,219 -$62,434 $186,977 $171,575 $174,977
2A2 $253,692 $232,794 $237,411 -$67,002 -$61,483 -$62,702 $186,690 $171,311 $174,709
2A3 $253,692 $232,794 $237,411 -$56,368 -$51,725 -$52,751 $197,324 $181,069 $184,660
2B1 $253,692 $232,794 $237,411 -$72,182 -$66,236 -$67,550 $181,510 $166,558 $169,861
2B2 $253,692 $232,794 $237,411 -$72,469 -$66,499 -$67,818 $181,223 $166,295 $169,593
2B3 $253,692 $232,794 $237,411 -$61,835 -$56,741 -$57,867 $191,857 $176,053 $179,544
2C1 $253,692 $232,794 $237,411 -$48,453 -$44,462 -$45,344 $205,239 $188,332 $192,067
2C2 $253,692 $232,794 $237,411 -$48,740 -$44,725 -$45,612 $204,952 $188,069 $191,799
2C3 $253,692 $232,794 $237,411 -$38,106 -$34,967 -$35,661 $215,586 $197,827 $201,750
2D1 $253,692 $232,794 $237,411 -$67,466 -$61,909 -$63,137 $186,226 $170,885 $174,274
2D2 $253,692 $232,794 $237,411 -$67,753 -$62,172 -$63,405 $185,939 $170,622 $174,006
2D3 $253,692 $232,794 $237,411 -$57,120 -$52,414 -$53,454 $196,572 $180,380 $183,957
3A1 $253,692 $232,794 $237,411 -$210,914 -$193,539 -$197,378 $42,778 $39,255 $40,033
3B1 $253,692 $232,794 $237,411 -$216,380 -$198,556 -$202,494 $37,312 $34,238 $34,917
3C1 $253,692 $232,794 $237,411 -$182,933 -$167,864 -$171,193 $70,759 $64,930 $66,218
3D1 $253,692 $232,794 $237,411 -$212,116 -$194,643 -$198,503 $41,576 $38,151 $38,908
4A1 $253,692 $232,794 $237,411 -$66,715 -$61,219 -$62,434 $186,977 $171,575 $174,977
4A2 $253,692 $232,794 $237,411 -$67,002 -$61,483 -$62,702 $186,690 $171,311 $174,709
4A3 $253,692 $232,794 $237,411 -$56,368 -$51,725 -$52,751 $197,324 $181,069 $184,660
4B1 $253,692 $232,794 $237,411 -$72,182 -$66,236 -$67,550 $181,510 $166,558 $169,861
4B2 $253,692 $232,794 $237,411 -$72,469 -$66,499 -$67,818 $181,223 $166,295 $169,593
4B3 $253,692 $232,794 $237,411 -$61,835 -$56,741 -$57,867 $191,857 $176,053 $179,544
4C1 $253,692 $232,794 $237,411 -$43,318 -$39,750 -$40,538 $210,374 $193,044 $196,873
4C2 $253,692 $232,794 $237,411 -$43,605 -$40,013 -$40,807 $210,087 $192,781 $196,604
4C3 $253,692 $232,794 $237,411 -$32,972 -$30,255 -$30,856 $220,720 $202,539 $206,555
4D1 $253,692 $232,794 $237,411 -$67,466 -$61,909 -$63,137 $186,226 $170,885 $174,274
4D2 $253,692 $232,794 $237,411 -$67,753 -$62,172 -$63,405 $185,939 $170,622 $174,006
4D3 $253,692 $232,794 $237,411 -$57,120 -$52,414 -$53,454 $196,572 $180,380 $183,957
Table 7-7: Enthalpy Heat Recovery Net First Costs for High School HVAC SystemOptions
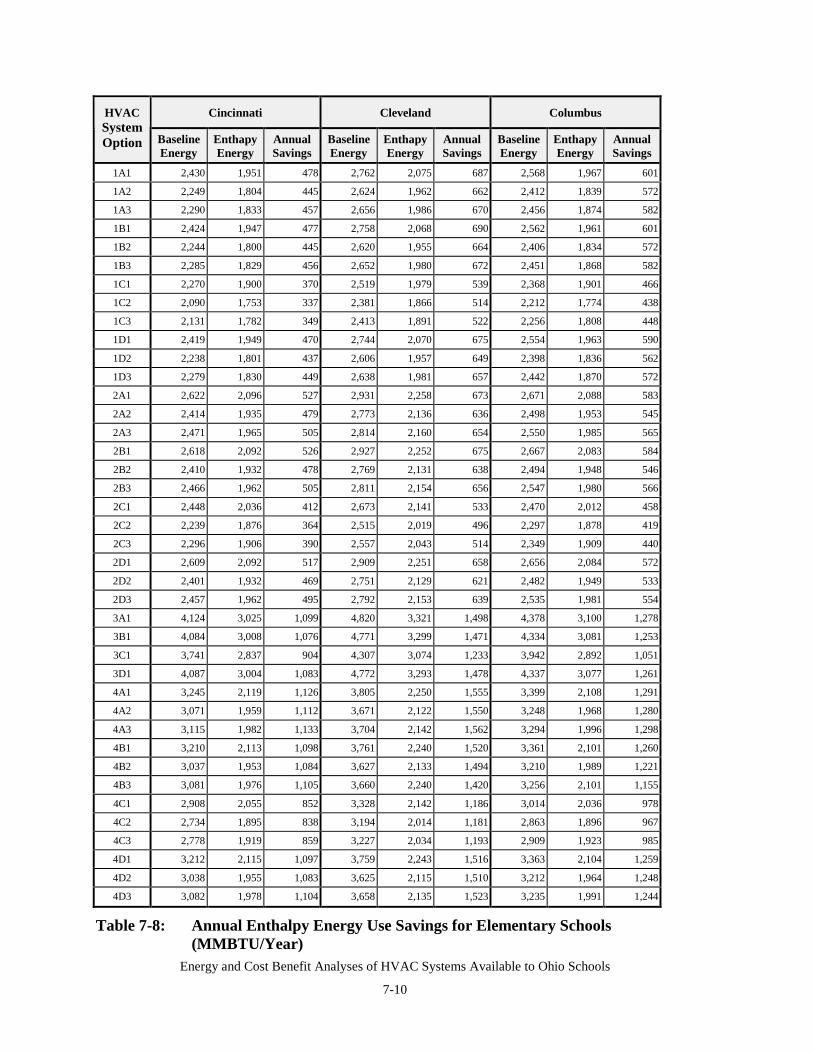
Energy and Cost Benefit Analyses of HVAC Systems Available to Ohio Schools
7-10
Cincinnati Cleveland ColumbusHVACSystemOption Baseline
EnergyEnthapyEnergy
AnnualSavings
BaselineEnergy
EnthapyEnergy
AnnualSavings
BaselineEnergy
EnthapyEnergy
AnnualSavings
1A1 2,430 1,951 478 2,762 2,075 687 2,568 1,967 601
1A2 2,249 1,804 445 2,624 1,962 662 2,412 1,839 572
1A3 2,290 1,833 457 2,656 1,986 670 2,456 1,874 582
1B1 2,424 1,947 477 2,758 2,068 690 2,562 1,961 601
1B2 2,244 1,800 445 2,620 1,955 664 2,406 1,834 572
1B3 2,285 1,829 456 2,652 1,980 672 2,451 1,868 582
1C1 2,270 1,900 370 2,519 1,979 539 2,368 1,901 466
1C2 2,090 1,753 337 2,381 1,866 514 2,212 1,774 438
1C3 2,131 1,782 349 2,413 1,891 522 2,256 1,808 448
1D1 2,419 1,949 470 2,744 2,070 675 2,554 1,963 590
1D2 2,238 1,801 437 2,606 1,957 649 2,398 1,836 562
1D3 2,279 1,830 449 2,638 1,981 657 2,442 1,870 572
2A1 2,622 2,096 527 2,931 2,258 673 2,671 2,088 583
2A2 2,414 1,935 479 2,773 2,136 636 2,498 1,953 545
2A3 2,471 1,965 505 2,814 2,160 654 2,550 1,985 565
2B1 2,618 2,092 526 2,927 2,252 675 2,667 2,083 584
2B2 2,410 1,932 478 2,769 2,131 638 2,494 1,948 546
2B3 2,466 1,962 505 2,811 2,154 656 2,547 1,980 566
2C1 2,448 2,036 412 2,673 2,141 533 2,470 2,012 458
2C2 2,239 1,876 364 2,515 2,019 496 2,297 1,878 419
2C3 2,296 1,906 390 2,557 2,043 514 2,349 1,909 440
2D1 2,609 2,092 517 2,909 2,251 658 2,656 2,084 572
2D2 2,401 1,932 469 2,751 2,129 621 2,482 1,949 533
2D3 2,457 1,962 495 2,792 2,153 639 2,535 1,981 554
3A1 4,124 3,025 1,099 4,820 3,321 1,498 4,378 3,100 1,278
3B1 4,084 3,008 1,076 4,771 3,299 1,471 4,334 3,081 1,253
3C1 3,741 2,837 904 4,307 3,074 1,233 3,942 2,892 1,051
3D1 4,087 3,004 1,083 4,772 3,293 1,478 4,337 3,077 1,261
4A1 3,245 2,119 1,126 3,805 2,250 1,555 3,399 2,108 1,291
4A2 3,071 1,959 1,112 3,671 2,122 1,550 3,248 1,968 1,280
4A3 3,115 1,982 1,133 3,704 2,142 1,562 3,294 1,996 1,298
4B1 3,210 2,113 1,098 3,761 2,240 1,520 3,361 2,101 1,260
4B2 3,037 1,953 1,084 3,627 2,133 1,494 3,210 1,989 1,221
4B3 3,081 1,976 1,105 3,660 2,240 1,420 3,256 2,101 1,155
4C1 2,908 2,055 852 3,328 2,142 1,186 3,014 2,036 978
4C2 2,734 1,895 838 3,194 2,014 1,181 2,863 1,896 967
4C3 2,778 1,919 859 3,227 2,034 1,193 2,909 1,923 985
4D1 3,212 2,115 1,097 3,759 2,243 1,516 3,363 2,104 1,259
4D2 3,038 1,955 1,083 3,625 2,115 1,510 3,212 1,964 1,248
4D3 3,082 1,978 1,104 3,658 2,135 1,523 3,235 1,991 1,244
Table 7-8: Annual Enthalpy Energy Use Savings for Elementary Schools(MMBTU/Year)
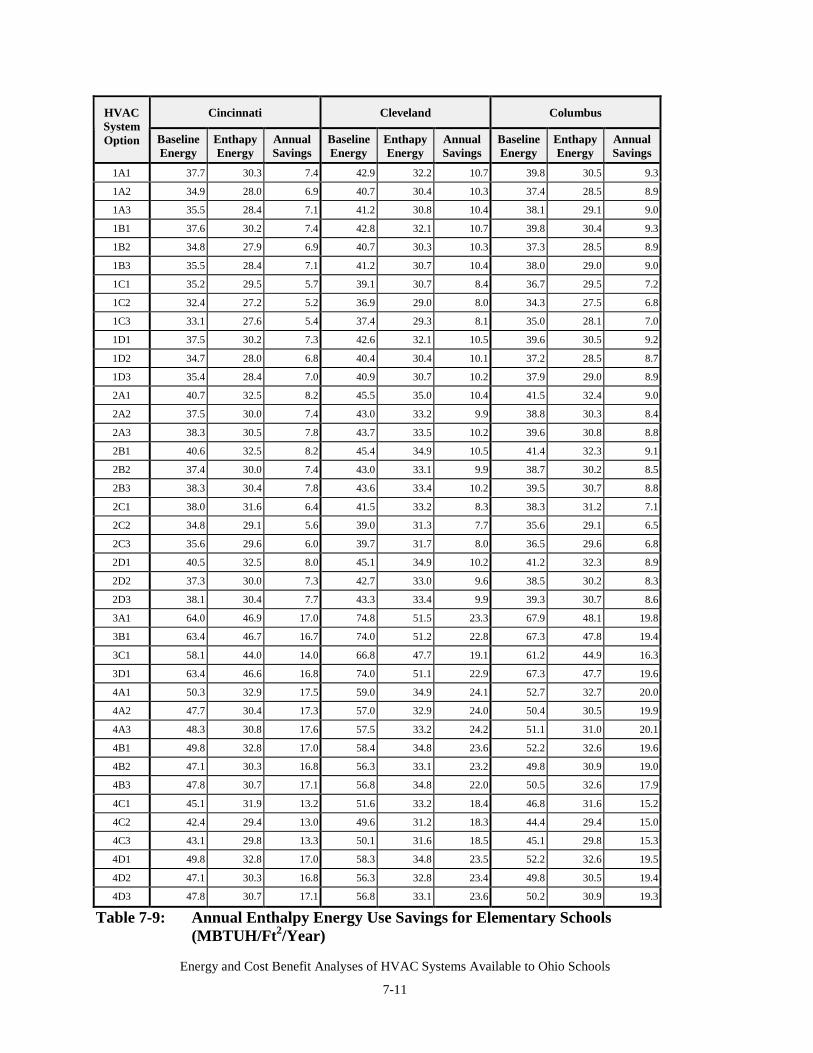
Energy and Cost Benefit Analyses of HVAC Systems Available to Ohio Schools
7-11
Cincinnati Cleveland ColumbusHVACSystemOption Baseline
EnergyEnthapyEnergy
AnnualSavings
BaselineEnergy
EnthapyEnergy
AnnualSavings
BaselineEnergy
EnthapyEnergy
AnnualSavings
1A1 37.7 30.3 7.4 42.9 32.2 10.7 39.8 30.5 9.3
1A2 34.9 28.0 6.9 40.7 30.4 10.3 37.4 28.5 8.9
1A3 35.5 28.4 7.1 41.2 30.8 10.4 38.1 29.1 9.0
1B1 37.6 30.2 7.4 42.8 32.1 10.7 39.8 30.4 9.3
1B2 34.8 27.9 6.9 40.7 30.3 10.3 37.3 28.5 8.9
1B3 35.5 28.4 7.1 41.2 30.7 10.4 38.0 29.0 9.0
1C1 35.2 29.5 5.7 39.1 30.7 8.4 36.7 29.5 7.2
1C2 32.4 27.2 5.2 36.9 29.0 8.0 34.3 27.5 6.8
1C3 33.1 27.6 5.4 37.4 29.3 8.1 35.0 28.1 7.0
1D1 37.5 30.2 7.3 42.6 32.1 10.5 39.6 30.5 9.2
1D2 34.7 28.0 6.8 40.4 30.4 10.1 37.2 28.5 8.7
1D3 35.4 28.4 7.0 40.9 30.7 10.2 37.9 29.0 8.9
2A1 40.7 32.5 8.2 45.5 35.0 10.4 41.5 32.4 9.0
2A2 37.5 30.0 7.4 43.0 33.2 9.9 38.8 30.3 8.4
2A3 38.3 30.5 7.8 43.7 33.5 10.2 39.6 30.8 8.8
2B1 40.6 32.5 8.2 45.4 34.9 10.5 41.4 32.3 9.1
2B2 37.4 30.0 7.4 43.0 33.1 9.9 38.7 30.2 8.5
2B3 38.3 30.4 7.8 43.6 33.4 10.2 39.5 30.7 8.8
2C1 38.0 31.6 6.4 41.5 33.2 8.3 38.3 31.2 7.1
2C2 34.8 29.1 5.6 39.0 31.3 7.7 35.6 29.1 6.5
2C3 35.6 29.6 6.0 39.7 31.7 8.0 36.5 29.6 6.8
2D1 40.5 32.5 8.0 45.1 34.9 10.2 41.2 32.3 8.9
2D2 37.3 30.0 7.3 42.7 33.0 9.6 38.5 30.2 8.3
2D3 38.1 30.4 7.7 43.3 33.4 9.9 39.3 30.7 8.6
3A1 64.0 46.9 17.0 74.8 51.5 23.3 67.9 48.1 19.8
3B1 63.4 46.7 16.7 74.0 51.2 22.8 67.3 47.8 19.4
3C1 58.1 44.0 14.0 66.8 47.7 19.1 61.2 44.9 16.3
3D1 63.4 46.6 16.8 74.0 51.1 22.9 67.3 47.7 19.6
4A1 50.3 32.9 17.5 59.0 34.9 24.1 52.7 32.7 20.0
4A2 47.7 30.4 17.3 57.0 32.9 24.0 50.4 30.5 19.9
4A3 48.3 30.8 17.6 57.5 33.2 24.2 51.1 31.0 20.1
4B1 49.8 32.8 17.0 58.4 34.8 23.6 52.2 32.6 19.6
4B2 47.1 30.3 16.8 56.3 33.1 23.2 49.8 30.9 19.0
4B3 47.8 30.7 17.1 56.8 34.8 22.0 50.5 32.6 17.9
4C1 45.1 31.9 13.2 51.6 33.2 18.4 46.8 31.6 15.2
4C2 42.4 29.4 13.0 49.6 31.2 18.3 44.4 29.4 15.0
4C3 43.1 29.8 13.3 50.1 31.6 18.5 45.1 29.8 15.3
4D1 49.8 32.8 17.0 58.3 34.8 23.5 52.2 32.6 19.5
4D2 47.1 30.3 16.8 56.3 32.8 23.4 49.8 30.5 19.4
4D3 47.8 30.7 17.1 56.8 33.1 23.6 50.2 30.9 19.3
Table 7-9: Annual Enthalpy Energy Use Savings for Elementary Schools(MBTUH/Ft2/Year)
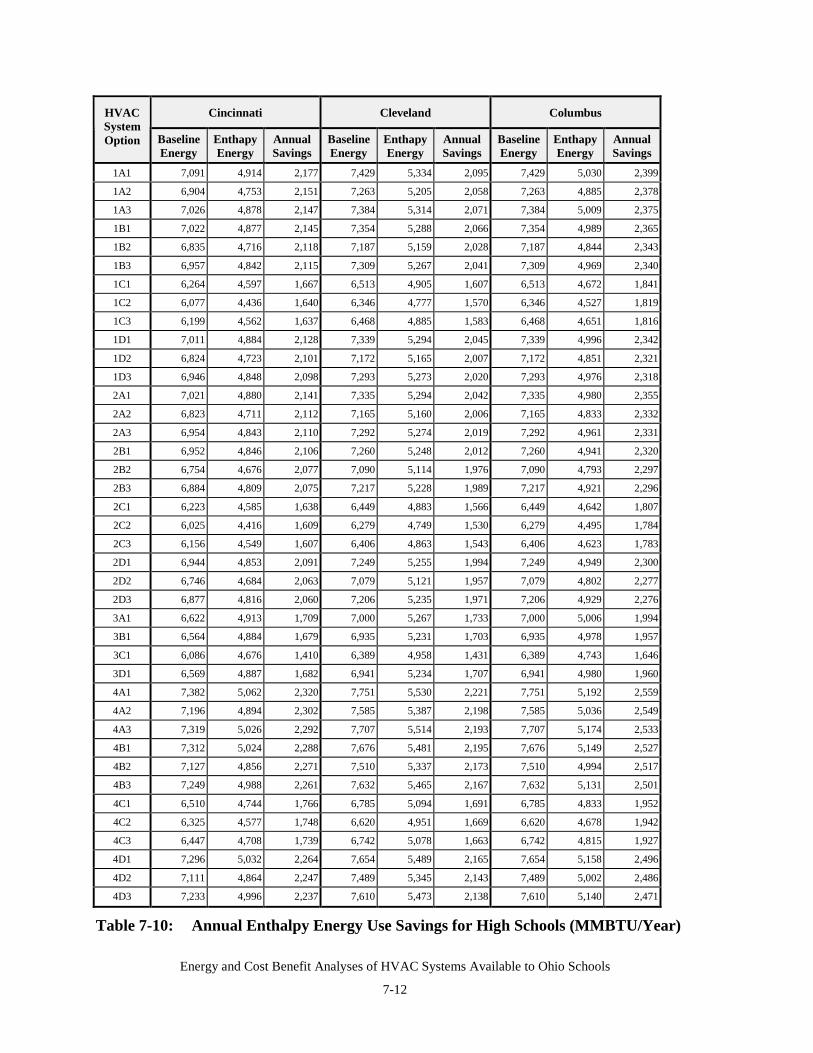
Energy and Cost Benefit Analyses of HVAC Systems Available to Ohio Schools
7-12
Cincinnati Cleveland ColumbusHVACSystemOption Baseline
EnergyEnthapyEnergy
AnnualSavings
BaselineEnergy
EnthapyEnergy
AnnualSavings
BaselineEnergy
EnthapyEnergy
AnnualSavings
1A1 7,091 4,914 2,177 7,429 5,334 2,095 7,429 5,030 2,399
1A2 6,904 4,753 2,151 7,263 5,205 2,058 7,263 4,885 2,378
1A3 7,026 4,878 2,147 7,384 5,314 2,071 7,384 5,009 2,375
1B1 7,022 4,877 2,145 7,354 5,288 2,066 7,354 4,989 2,365
1B2 6,835 4,716 2,118 7,187 5,159 2,028 7,187 4,844 2,343
1B3 6,957 4,842 2,115 7,309 5,267 2,041 7,309 4,969 2,340
1C1 6,264 4,597 1,667 6,513 4,905 1,607 6,513 4,672 1,841
1C2 6,077 4,436 1,640 6,346 4,777 1,570 6,346 4,527 1,819
1C3 6,199 4,562 1,637 6,468 4,885 1,583 6,468 4,651 1,816
1D1 7,011 4,884 2,128 7,339 5,294 2,045 7,339 4,996 2,342
1D2 6,824 4,723 2,101 7,172 5,165 2,007 7,172 4,851 2,321
1D3 6,946 4,848 2,098 7,293 5,273 2,020 7,293 4,976 2,318
2A1 7,021 4,880 2,141 7,335 5,294 2,042 7,335 4,980 2,355
2A2 6,823 4,711 2,112 7,165 5,160 2,006 7,165 4,833 2,332
2A3 6,954 4,843 2,110 7,292 5,274 2,019 7,292 4,961 2,331
2B1 6,952 4,846 2,106 7,260 5,248 2,012 7,260 4,941 2,320
2B2 6,754 4,676 2,077 7,090 5,114 1,976 7,090 4,793 2,297
2B3 6,884 4,809 2,075 7,217 5,228 1,989 7,217 4,921 2,296
2C1 6,223 4,585 1,638 6,449 4,883 1,566 6,449 4,642 1,807
2C2 6,025 4,416 1,609 6,279 4,749 1,530 6,279 4,495 1,784
2C3 6,156 4,549 1,607 6,406 4,863 1,543 6,406 4,623 1,783
2D1 6,944 4,853 2,091 7,249 5,255 1,994 7,249 4,949 2,300
2D2 6,746 4,684 2,063 7,079 5,121 1,957 7,079 4,802 2,277
2D3 6,877 4,816 2,060 7,206 5,235 1,971 7,206 4,929 2,276
3A1 6,622 4,913 1,709 7,000 5,267 1,733 7,000 5,006 1,994
3B1 6,564 4,884 1,679 6,935 5,231 1,703 6,935 4,978 1,957
3C1 6,086 4,676 1,410 6,389 4,958 1,431 6,389 4,743 1,646
3D1 6,569 4,887 1,682 6,941 5,234 1,707 6,941 4,980 1,960
4A1 7,382 5,062 2,320 7,751 5,530 2,221 7,751 5,192 2,559
4A2 7,196 4,894 2,302 7,585 5,387 2,198 7,585 5,036 2,549
4A3 7,319 5,026 2,292 7,707 5,514 2,193 7,707 5,174 2,533
4B1 7,312 5,024 2,288 7,676 5,481 2,195 7,676 5,149 2,527
4B2 7,127 4,856 2,271 7,510 5,337 2,173 7,510 4,994 2,517
4B3 7,249 4,988 2,261 7,632 5,465 2,167 7,632 5,131 2,501
4C1 6,510 4,744 1,766 6,785 5,094 1,691 6,785 4,833 1,952
4C2 6,325 4,577 1,748 6,620 4,951 1,669 6,620 4,678 1,942
4C3 6,447 4,708 1,739 6,742 5,078 1,663 6,742 4,815 1,927
4D1 7,296 5,032 2,264 7,654 5,489 2,165 7,654 5,158 2,496
4D2 7,111 4,864 2,247 7,489 5,345 2,143 7,489 5,002 2,486
4D3 7,233 4,996 2,237 7,610 5,473 2,138 7,610 5,140 2,471
Table 7-10: Annual Enthalpy Energy Use Savings for High Schools (MMBTU/Year)
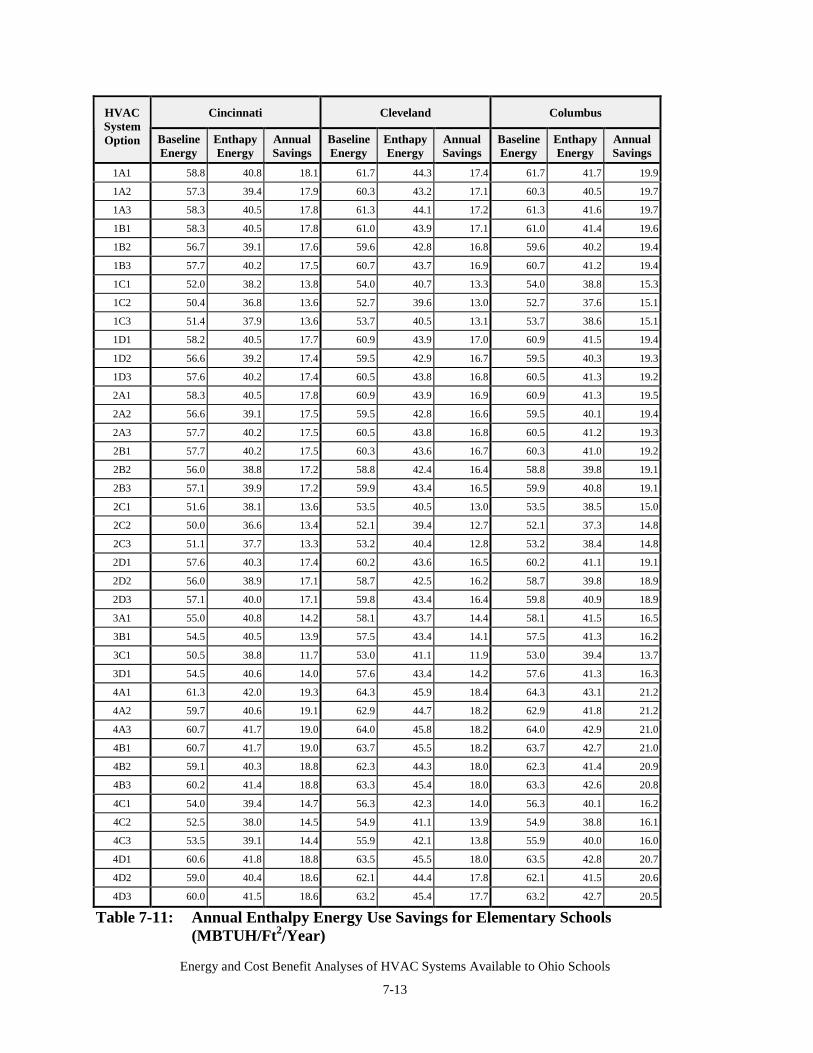
Energy and Cost Benefit Analyses of HVAC Systems Available to Ohio Schools
7-13
Cincinnati Cleveland ColumbusHVACSystemOption Baseline
EnergyEnthapyEnergy
AnnualSavings
BaselineEnergy
EnthapyEnergy
AnnualSavings
BaselineEnergy
EnthapyEnergy
AnnualSavings
1A1 58.8 40.8 18.1 61.7 44.3 17.4 61.7 41.7 19.9
1A2 57.3 39.4 17.9 60.3 43.2 17.1 60.3 40.5 19.7
1A3 58.3 40.5 17.8 61.3 44.1 17.2 61.3 41.6 19.7
1B1 58.3 40.5 17.8 61.0 43.9 17.1 61.0 41.4 19.6
1B2 56.7 39.1 17.6 59.6 42.8 16.8 59.6 40.2 19.4
1B3 57.7 40.2 17.5 60.7 43.7 16.9 60.7 41.2 19.4
1C1 52.0 38.2 13.8 54.0 40.7 13.3 54.0 38.8 15.3
1C2 50.4 36.8 13.6 52.7 39.6 13.0 52.7 37.6 15.1
1C3 51.4 37.9 13.6 53.7 40.5 13.1 53.7 38.6 15.1
1D1 58.2 40.5 17.7 60.9 43.9 17.0 60.9 41.5 19.4
1D2 56.6 39.2 17.4 59.5 42.9 16.7 59.5 40.3 19.3
1D3 57.6 40.2 17.4 60.5 43.8 16.8 60.5 41.3 19.2
2A1 58.3 40.5 17.8 60.9 43.9 16.9 60.9 41.3 19.5
2A2 56.6 39.1 17.5 59.5 42.8 16.6 59.5 40.1 19.4
2A3 57.7 40.2 17.5 60.5 43.8 16.8 60.5 41.2 19.3
2B1 57.7 40.2 17.5 60.3 43.6 16.7 60.3 41.0 19.2
2B2 56.0 38.8 17.2 58.8 42.4 16.4 58.8 39.8 19.1
2B3 57.1 39.9 17.2 59.9 43.4 16.5 59.9 40.8 19.1
2C1 51.6 38.1 13.6 53.5 40.5 13.0 53.5 38.5 15.0
2C2 50.0 36.6 13.4 52.1 39.4 12.7 52.1 37.3 14.8
2C3 51.1 37.7 13.3 53.2 40.4 12.8 53.2 38.4 14.8
2D1 57.6 40.3 17.4 60.2 43.6 16.5 60.2 41.1 19.1
2D2 56.0 38.9 17.1 58.7 42.5 16.2 58.7 39.8 18.9
2D3 57.1 40.0 17.1 59.8 43.4 16.4 59.8 40.9 18.9
3A1 55.0 40.8 14.2 58.1 43.7 14.4 58.1 41.5 16.5
3B1 54.5 40.5 13.9 57.5 43.4 14.1 57.5 41.3 16.2
3C1 50.5 38.8 11.7 53.0 41.1 11.9 53.0 39.4 13.7
3D1 54.5 40.6 14.0 57.6 43.4 14.2 57.6 41.3 16.3
4A1 61.3 42.0 19.3 64.3 45.9 18.4 64.3 43.1 21.2
4A2 59.7 40.6 19.1 62.9 44.7 18.2 62.9 41.8 21.2
4A3 60.7 41.7 19.0 64.0 45.8 18.2 64.0 42.9 21.0
4B1 60.7 41.7 19.0 63.7 45.5 18.2 63.7 42.7 21.0
4B2 59.1 40.3 18.8 62.3 44.3 18.0 62.3 41.4 20.9
4B3 60.2 41.4 18.8 63.3 45.4 18.0 63.3 42.6 20.8
4C1 54.0 39.4 14.7 56.3 42.3 14.0 56.3 40.1 16.2
4C2 52.5 38.0 14.5 54.9 41.1 13.9 54.9 38.8 16.1
4C3 53.5 39.1 14.4 55.9 42.1 13.8 55.9 40.0 16.0
4D1 60.6 41.8 18.8 63.5 45.5 18.0 63.5 42.8 20.7
4D2 59.0 40.4 18.6 62.1 44.4 17.8 62.1 41.5 20.6
4D3 60.0 41.5 18.6 63.2 45.4 17.7 63.2 42.7 20.5
Table 7-11: Annual Enthalpy Energy Use Savings for Elementary Schools(MBTUH/Ft2/Year)
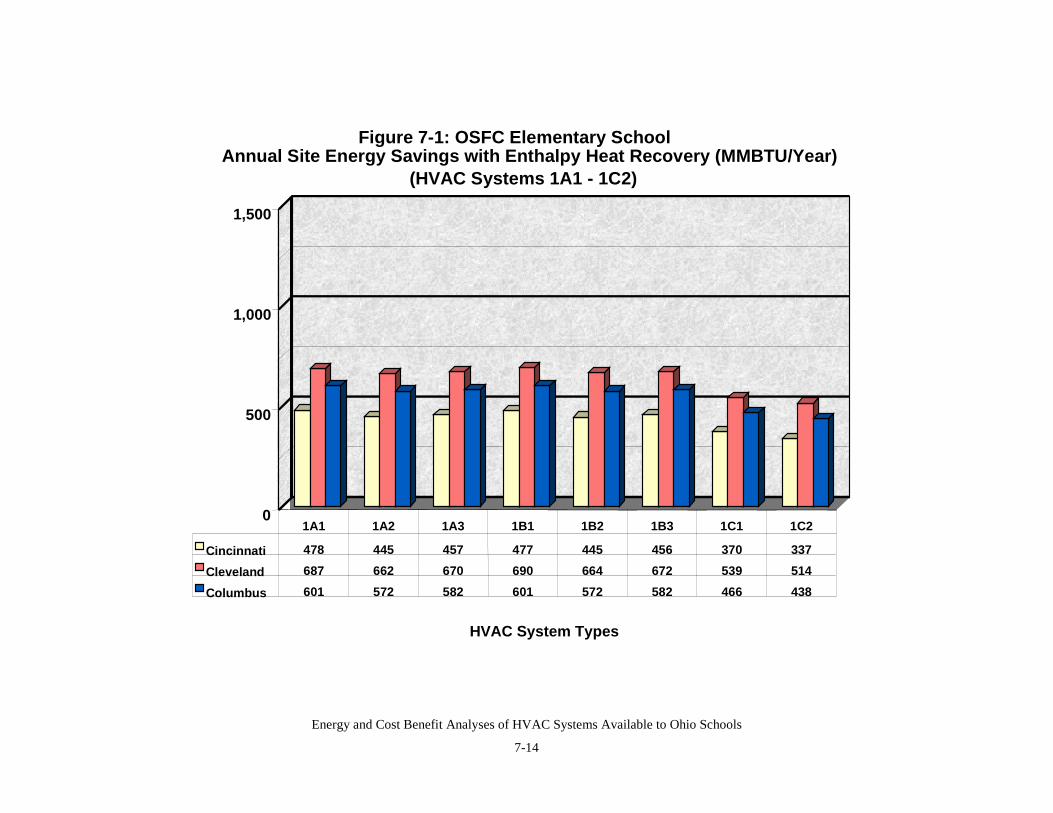
Energy and Cost Benefit Analyses of HVAC Systems Available to Ohio Schools
7-14
0
500
1,000
1,500
HVAC System Types
Figure 7-1: OSFC Elementary SchoolAnnual Site Energy Savings with Enthalpy Heat Recovery (MMBTU/Year)
(HVAC Systems 1A1 - 1C2)
Cincinnati 478 445 457 477 445 456 370 337
Cleveland 687 662 670 690 664 672 539 514
Columbus 601 572 582 601 572 582 466 438
1A1 1A2 1A3 1B1 1B2 1B3 1C1 1C2
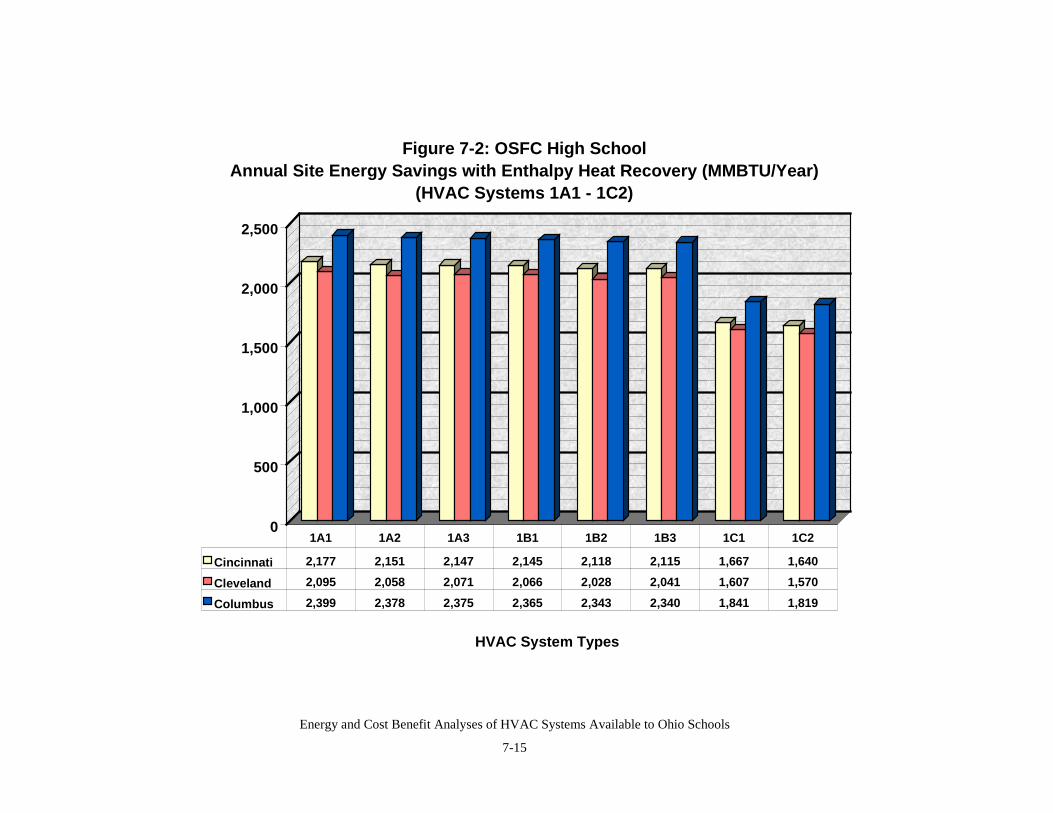
Energy and Cost Benefit Analyses of HVAC Systems Available to Ohio Schools
7-15
0
500
1,000
1,500
2,000
2,500
HVAC System Types
Figure 7-2: OSFC High School Annual Site Energy Savings with Enthalpy Heat Recovery (MMBTU/Year)
(HVAC Systems 1A1 - 1C2)
Cincinnati 2,177 2,151 2,147 2,145 2,118 2,115 1,667 1,640
Cleveland 2,095 2,058 2,071 2,066 2,028 2,041 1,607 1,570
Columbus 2,399 2,378 2,375 2,365 2,343 2,340 1,841 1,819
1A1 1A2 1A3 1B1 1B2 1B3 1C1 1C2
Energy and Cost Benefit Analyses of HVAC Systems Available to Ohio Schools
7-16
Annual energy cost savings associated with the use of enthalpy heat recovery were determinedby calculating annual energy costs for all enthalpy cases and subtracting the results from thebaseline annual energy costs presented in Chapter 3. Results for both the elementary and highschool, both on an absolute and per square foot basis, are summarized in Tables 7-12 and 7-13and Tables 7-14 and 7-15 respectively. Example results for the first eight HVAC systems (1A1to 1C2) for both the elementary and the high school are plotted in Figure 7-3 and 7-4; the balanceof these enthalpy energy savings data can be found in plots presented in Appendix D. Reducedannual energy costs for elementary schools using enthalpy heat exchange ranged from a low of$3,005 per year (Cincinnati, 1B2) to a high of $66,387 per year (Columbus, 4C3). On a persquare foot basis, this ranged from a low of $0.05 savings per square foot per year (Cincinnati,1B2) to a high of $1.03 savings per square foot per year (Cleveland, 4C3). Similarly, for thehigh school, reduced annual energy costs using enthalpy heat exchange ranged from a low of$8,928 per year (Cleveland, 4B3) to a high of $95,640 per year (Columbus, 4C3). On a persquare foot basis, this ranged from a low of $0.07 savings per square foot per year (Cleveland,4B3) to a high of $0.79 savings per square foot per year (Columbus, 4C3). As seen in Figures 7-3 and 7-4, the maximum savings are somewhat independent of a given location. Climate,building design and the amount of demand electrical energy consumed appear to be responsiblefor the results shown.
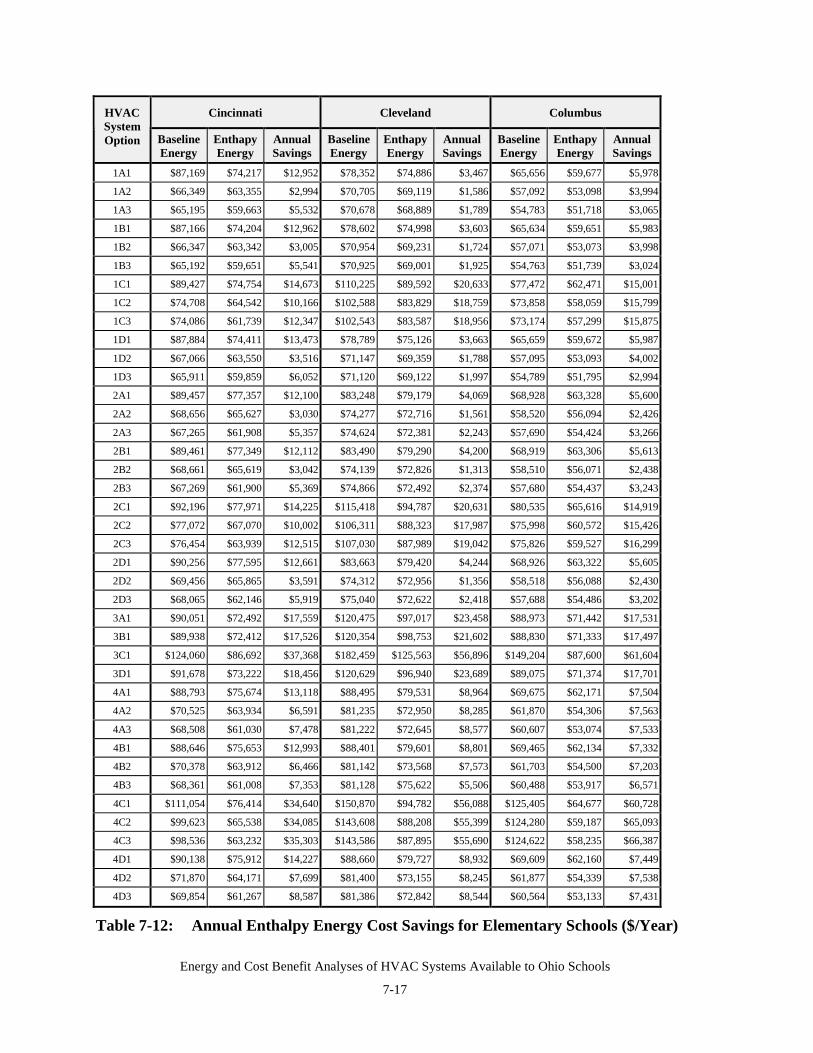
Energy and Cost Benefit Analyses of HVAC Systems Available to Ohio Schools
7-17
Cincinnati Cleveland ColumbusHVACSystemOption Baseline
EnergyEnthapyEnergy
AnnualSavings
BaselineEnergy
EnthapyEnergy
AnnualSavings
BaselineEnergy
EnthapyEnergy
AnnualSavings
1A1 $87,169 $74,217 $12,952 $78,352 $74,886 $3,467 $65,656 $59,677 $5,978
1A2 $66,349 $63,355 $2,994 $70,705 $69,119 $1,586 $57,092 $53,098 $3,994
1A3 $65,195 $59,663 $5,532 $70,678 $68,889 $1,789 $54,783 $51,718 $3,065
1B1 $87,166 $74,204 $12,962 $78,602 $74,998 $3,603 $65,634 $59,651 $5,983
1B2 $66,347 $63,342 $3,005 $70,954 $69,231 $1,724 $57,071 $53,073 $3,998
1B3 $65,192 $59,651 $5,541 $70,925 $69,001 $1,925 $54,763 $51,739 $3,024
1C1 $89,427 $74,754 $14,673 $110,225 $89,592 $20,633 $77,472 $62,471 $15,001
1C2 $74,708 $64,542 $10,166 $102,588 $83,829 $18,759 $73,858 $58,059 $15,799
1C3 $74,086 $61,739 $12,347 $102,543 $83,587 $18,956 $73,174 $57,299 $15,875
1D1 $87,884 $74,411 $13,473 $78,789 $75,126 $3,663 $65,659 $59,672 $5,987
1D2 $67,066 $63,550 $3,516 $71,147 $69,359 $1,788 $57,095 $53,093 $4,002
1D3 $65,911 $59,859 $6,052 $71,120 $69,122 $1,997 $54,789 $51,795 $2,994
2A1 $89,457 $77,357 $12,100 $83,248 $79,179 $4,069 $68,928 $63,328 $5,600
2A2 $68,656 $65,627 $3,030 $74,277 $72,716 $1,561 $58,520 $56,094 $2,426
2A3 $67,265 $61,908 $5,357 $74,624 $72,381 $2,243 $57,690 $54,424 $3,266
2B1 $89,461 $77,349 $12,112 $83,490 $79,290 $4,200 $68,919 $63,306 $5,613
2B2 $68,661 $65,619 $3,042 $74,139 $72,826 $1,313 $58,510 $56,071 $2,438
2B3 $67,269 $61,900 $5,369 $74,866 $72,492 $2,374 $57,680 $54,437 $3,243
2C1 $92,196 $77,971 $14,225 $115,418 $94,787 $20,631 $80,535 $65,616 $14,919
2C2 $77,072 $67,070 $10,002 $106,311 $88,323 $17,987 $75,998 $60,572 $15,426
2C3 $76,454 $63,939 $12,515 $107,030 $87,989 $19,042 $75,826 $59,527 $16,299
2D1 $90,256 $77,595 $12,661 $83,663 $79,420 $4,244 $68,926 $63,322 $5,605
2D2 $69,456 $65,865 $3,591 $74,312 $72,956 $1,356 $58,518 $56,088 $2,430
2D3 $68,065 $62,146 $5,919 $75,040 $72,622 $2,418 $57,688 $54,486 $3,202
3A1 $90,051 $72,492 $17,559 $120,475 $97,017 $23,458 $88,973 $71,442 $17,531
3B1 $89,938 $72,412 $17,526 $120,354 $98,753 $21,602 $88,830 $71,333 $17,497
3C1 $124,060 $86,692 $37,368 $182,459 $125,563 $56,896 $149,204 $87,600 $61,604
3D1 $91,678 $73,222 $18,456 $120,629 $96,940 $23,689 $89,075 $71,374 $17,701
4A1 $88,793 $75,674 $13,118 $88,495 $79,531 $8,964 $69,675 $62,171 $7,504
4A2 $70,525 $63,934 $6,591 $81,235 $72,950 $8,285 $61,870 $54,306 $7,563
4A3 $68,508 $61,030 $7,478 $81,222 $72,645 $8,577 $60,607 $53,074 $7,533
4B1 $88,646 $75,653 $12,993 $88,401 $79,601 $8,801 $69,465 $62,134 $7,332
4B2 $70,378 $63,912 $6,466 $81,142 $73,568 $7,573 $61,703 $54,500 $7,203
4B3 $68,361 $61,008 $7,353 $81,128 $75,622 $5,506 $60,488 $53,917 $6,571
4C1 $111,054 $76,414 $34,640 $150,870 $94,782 $56,088 $125,405 $64,677 $60,728
4C2 $99,623 $65,538 $34,085 $143,608 $88,208 $55,399 $124,280 $59,187 $65,093
4C3 $98,536 $63,232 $35,303 $143,586 $87,895 $55,690 $124,622 $58,235 $66,387
4D1 $90,138 $75,912 $14,227 $88,660 $79,727 $8,932 $69,609 $62,160 $7,449
4D2 $71,870 $64,171 $7,699 $81,400 $73,155 $8,245 $61,877 $54,339 $7,538
4D3 $69,854 $61,267 $8,587 $81,386 $72,842 $8,544 $60,564 $53,133 $7,431
Table 7-12: Annual Enthalpy Energy Cost Savings for Elementary Schools ($/Year)

Energy and Cost Benefit Analyses of HVAC Systems Available to Ohio Schools
7-18
Cincinnati Cleveland ColumbusHVACSystemOption Baseline
EnergyEnthapyEnergy
AnnualSavings
BaselineEnergy
EnthapyEnergy
AnnualSavings
BaselineEnergy
EnthapyEnergy
AnnualSavings
1A1 $1.35 $1.15 $0.20 $1.22 $1.16 $0.05 $1.02 $0.93 $0.09
1A2 $1.03 $0.98 $0.05 $1.10 $1.07 $0.02 $0.89 $0.82 $0.06
1A3 $1.01 $0.93 $0.09 $1.10 $1.07 $0.03 $0.85 $0.80 $0.05
1B1 $1.35 $1.15 $0.20 $1.22 $1.16 $0.06 $1.02 $0.93 $0.09
1B2 $1.03 $0.98 $0.05 $1.10 $1.07 $0.03 $0.89 $0.82 $0.06
1B3 $1.01 $0.93 $0.09 $1.10 $1.07 $0.03 $0.85 $0.80 $0.05
1C1 $1.39 $1.16 $0.23 $1.71 $1.39 $0.32 $1.20 $0.97 $0.23
1C2 $1.16 $1.00 $0.16 $1.59 $1.30 $0.29 $1.15 $0.90 $0.25
1C3 $1.15 $0.96 $0.19 $1.59 $1.30 $0.29 $1.14 $0.89 $0.25
1D1 $1.36 $1.15 $0.21 $1.22 $1.17 $0.06 $1.02 $0.93 $0.09
1D2 $1.04 $0.99 $0.05 $1.10 $1.08 $0.03 $0.89 $0.82 $0.06
1D3 $1.02 $0.93 $0.09 $1.10 $1.07 $0.03 $0.85 $0.80 $0.05
2A1 $1.39 $1.20 $0.19 $1.29 $1.23 $0.06 $1.07 $0.98 $0.09
2A2 $1.07 $1.02 $0.05 $1.15 $1.13 $0.02 $0.91 $0.87 $0.04
2A3 $1.04 $0.96 $0.08 $1.16 $1.12 $0.03 $0.90 $0.84 $0.05
2B1 $1.39 $1.20 $0.19 $1.30 $1.23 $0.07 $1.07 $0.98 $0.09
2B2 $1.07 $1.02 $0.05 $1.15 $1.13 $0.02 $0.91 $0.87 $0.04
2B3 $1.04 $0.96 $0.08 $1.16 $1.12 $0.04 $0.90 $0.84 $0.05
2C1 $1.43 $1.21 $0.22 $1.79 $1.47 $0.32 $1.25 $1.02 $0.23
2C2 $1.20 $1.04 $0.16 $1.65 $1.37 $0.28 $1.18 $0.94 $0.24
2C3 $1.19 $0.99 $0.19 $1.66 $1.37 $0.30 $1.18 $0.92 $0.25
2D1 $1.40 $1.20 $0.20 $1.30 $1.23 $0.07 $1.07 $0.98 $0.09
2D2 $1.08 $1.02 $0.06 $1.15 $1.13 $0.02 $0.91 $0.87 $0.04
2D3 $1.06 $0.96 $0.09 $1.16 $1.13 $0.04 $0.90 $0.85 $0.05
3A1 $1.40 $1.12 $0.27 $1.87 $1.51 $0.36 $1.38 $1.11 $0.27
3B1 $1.40 $1.12 $0.27 $1.87 $1.53 $0.34 $1.38 $1.11 $0.27
3C1 $1.93 $1.35 $0.58 $2.83 $1.95 $0.88 $2.32 $1.36 $0.96
3D1 $1.42 $1.14 $0.29 $1.87 $1.50 $0.37 $1.38 $1.11 $0.27
4A1 $1.38 $1.17 $0.20 $1.37 $1.23 $0.14 $1.08 $0.96 $0.12
4A2 $1.09 $0.99 $0.10 $1.26 $1.13 $0.13 $0.96 $0.84 $0.12
4A3 $1.06 $0.95 $0.12 $1.26 $1.13 $0.13 $0.94 $0.82 $0.12
4B1 $1.38 $1.17 $0.20 $1.37 $1.24 $0.14 $1.08 $0.96 $0.11
4B2 $1.09 $0.99 $0.10 $1.26 $1.14 $0.12 $0.96 $0.85 $0.11
4B3 $1.06 $0.95 $0.11 $1.26 $1.17 $0.09 $0.94 $0.84 $0.10
4C1 $1.72 $1.19 $0.54 $2.34 $1.47 $0.87 $1.95 $1.00 $0.94
4C2 $1.55 $1.02 $0.53 $2.23 $1.37 $0.86 $1.93 $0.92 $1.01
4C3 $1.53 $0.98 $0.55 $2.23 $1.36 $0.86 $1.93 $0.90 $1.03
4D1 $1.40 $1.18 $0.22 $1.38 $1.24 $0.14 $1.08 $0.96 $0.12
4D2 $1.12 $1.00 $0.12 $1.26 $1.14 $0.13 $0.96 $0.84 $0.12
4D3 $1.08 $0.95 $0.13 $1.26 $1.13 $0.13 $0.94 $0.82 $0.12
Table 7-13: Annual Enthalpy Energy Cost Savings for Elementary Schools ($/Ft2/Year)
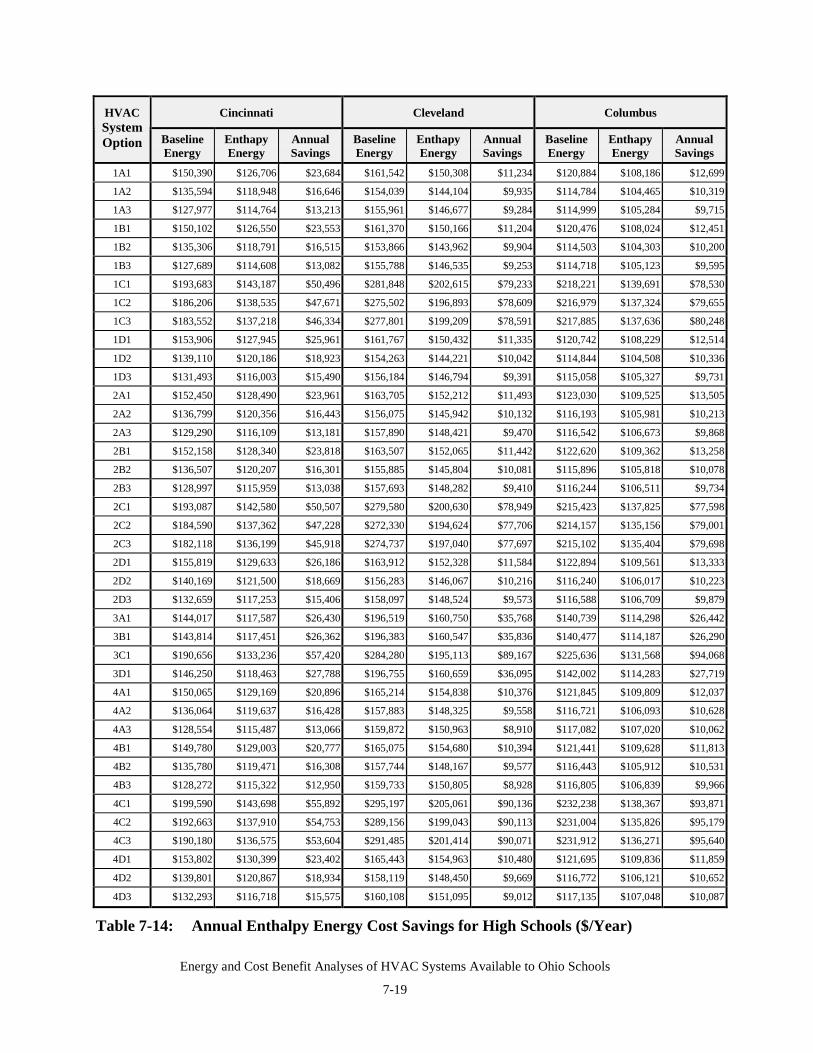
Energy and Cost Benefit Analyses of HVAC Systems Available to Ohio Schools
7-19
Cincinnati Cleveland ColumbusHVACSystemOption Baseline
EnergyEnthapyEnergy
AnnualSavings
BaselineEnergy
EnthapyEnergy
AnnualSavings
BaselineEnergy
EnthapyEnergy
AnnualSavings
1A1 $150,390 $126,706 $23,684 $161,542 $150,308 $11,234 $120,884 $108,186 $12,699
1A2 $135,594 $118,948 $16,646 $154,039 $144,104 $9,935 $114,784 $104,465 $10,319
1A3 $127,977 $114,764 $13,213 $155,961 $146,677 $9,284 $114,999 $105,284 $9,715
1B1 $150,102 $126,550 $23,553 $161,370 $150,166 $11,204 $120,476 $108,024 $12,451
1B2 $135,306 $118,791 $16,515 $153,866 $143,962 $9,904 $114,503 $104,303 $10,200
1B3 $127,689 $114,608 $13,082 $155,788 $146,535 $9,253 $114,718 $105,123 $9,595
1C1 $193,683 $143,187 $50,496 $281,848 $202,615 $79,233 $218,221 $139,691 $78,530
1C2 $186,206 $138,535 $47,671 $275,502 $196,893 $78,609 $216,979 $137,324 $79,655
1C3 $183,552 $137,218 $46,334 $277,801 $199,209 $78,591 $217,885 $137,636 $80,248
1D1 $153,906 $127,945 $25,961 $161,767 $150,432 $11,335 $120,742 $108,229 $12,514
1D2 $139,110 $120,186 $18,923 $154,263 $144,221 $10,042 $114,844 $104,508 $10,336
1D3 $131,493 $116,003 $15,490 $156,184 $146,794 $9,391 $115,058 $105,327 $9,731
2A1 $152,450 $128,490 $23,961 $163,705 $152,212 $11,493 $123,030 $109,525 $13,505
2A2 $136,799 $120,356 $16,443 $156,075 $145,942 $10,132 $116,193 $105,981 $10,213
2A3 $129,290 $116,109 $13,181 $157,890 $148,421 $9,470 $116,542 $106,673 $9,868
2B1 $152,158 $128,340 $23,818 $163,507 $152,065 $11,442 $122,620 $109,362 $13,258
2B2 $136,507 $120,207 $16,301 $155,885 $145,804 $10,081 $115,896 $105,818 $10,078
2B3 $128,997 $115,959 $13,038 $157,693 $148,282 $9,410 $116,244 $106,511 $9,734
2C1 $193,087 $142,580 $50,507 $279,580 $200,630 $78,949 $215,423 $137,825 $77,598
2C2 $184,590 $137,362 $47,228 $272,330 $194,624 $77,706 $214,157 $135,156 $79,001
2C3 $182,118 $136,199 $45,918 $274,737 $197,040 $77,697 $215,102 $135,404 $79,698
2D1 $155,819 $129,633 $26,186 $163,912 $152,328 $11,584 $122,894 $109,561 $13,333
2D2 $140,169 $121,500 $18,669 $156,283 $146,067 $10,216 $116,240 $106,017 $10,223
2D3 $132,659 $117,253 $15,406 $158,097 $148,524 $9,573 $116,588 $106,709 $9,879
3A1 $144,017 $117,587 $26,430 $196,519 $160,750 $35,768 $140,739 $114,298 $26,442
3B1 $143,814 $117,451 $26,362 $196,383 $160,547 $35,836 $140,477 $114,187 $26,290
3C1 $190,656 $133,236 $57,420 $284,280 $195,113 $89,167 $225,636 $131,568 $94,068
3D1 $146,250 $118,463 $27,788 $196,755 $160,659 $36,095 $142,002 $114,283 $27,719
4A1 $150,065 $129,169 $20,896 $165,214 $154,838 $10,376 $121,845 $109,809 $12,037
4A2 $136,064 $119,637 $16,428 $157,883 $148,325 $9,558 $116,721 $106,093 $10,628
4A3 $128,554 $115,487 $13,066 $159,872 $150,963 $8,910 $117,082 $107,020 $10,062
4B1 $149,780 $129,003 $20,777 $165,075 $154,680 $10,394 $121,441 $109,628 $11,813
4B2 $135,780 $119,471 $16,308 $157,744 $148,167 $9,577 $116,443 $105,912 $10,531
4B3 $128,272 $115,322 $12,950 $159,733 $150,805 $8,928 $116,805 $106,839 $9,966
4C1 $199,590 $143,698 $55,892 $295,197 $205,061 $90,136 $232,238 $138,367 $93,871
4C2 $192,663 $137,910 $54,753 $289,156 $199,043 $90,113 $231,004 $135,826 $95,179
4C3 $190,180 $136,575 $53,604 $291,485 $201,414 $90,071 $231,912 $136,271 $95,640
4D1 $153,802 $130,399 $23,402 $165,443 $154,963 $10,480 $121,695 $109,836 $11,859
4D2 $139,801 $120,867 $18,934 $158,119 $148,450 $9,669 $116,772 $106,121 $10,652
4D3 $132,293 $116,718 $15,575 $160,108 $151,095 $9,012 $117,135 $107,048 $10,087
Table 7-14: Annual Enthalpy Energy Cost Savings for High Schools ($/Year)
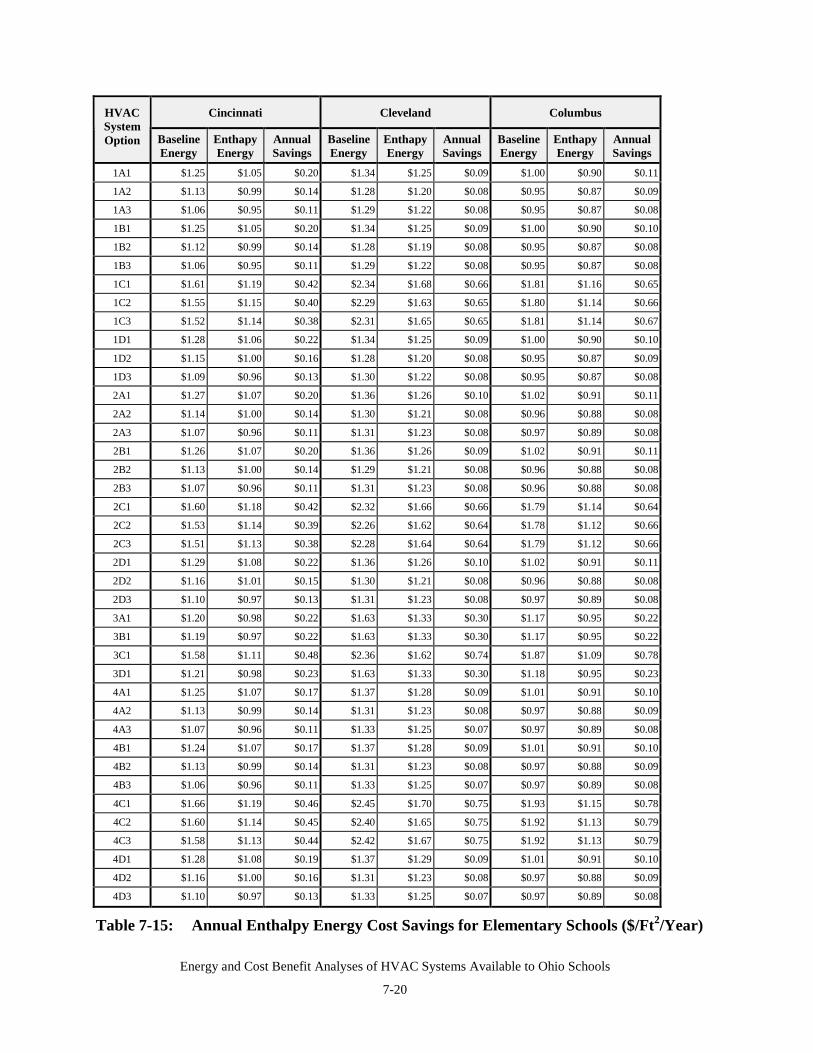
Energy and Cost Benefit Analyses of HVAC Systems Available to Ohio Schools
7-20
Cincinnati Cleveland ColumbusHVACSystemOption Baseline
EnergyEnthapyEnergy
AnnualSavings
BaselineEnergy
EnthapyEnergy
AnnualSavings
BaselineEnergy
EnthapyEnergy
AnnualSavings
1A1 $1.25 $1.05 $0.20 $1.34 $1.25 $0.09 $1.00 $0.90 $0.11
1A2 $1.13 $0.99 $0.14 $1.28 $1.20 $0.08 $0.95 $0.87 $0.09
1A3 $1.06 $0.95 $0.11 $1.29 $1.22 $0.08 $0.95 $0.87 $0.08
1B1 $1.25 $1.05 $0.20 $1.34 $1.25 $0.09 $1.00 $0.90 $0.10
1B2 $1.12 $0.99 $0.14 $1.28 $1.19 $0.08 $0.95 $0.87 $0.08
1B3 $1.06 $0.95 $0.11 $1.29 $1.22 $0.08 $0.95 $0.87 $0.08
1C1 $1.61 $1.19 $0.42 $2.34 $1.68 $0.66 $1.81 $1.16 $0.65
1C2 $1.55 $1.15 $0.40 $2.29 $1.63 $0.65 $1.80 $1.14 $0.66
1C3 $1.52 $1.14 $0.38 $2.31 $1.65 $0.65 $1.81 $1.14 $0.67
1D1 $1.28 $1.06 $0.22 $1.34 $1.25 $0.09 $1.00 $0.90 $0.10
1D2 $1.15 $1.00 $0.16 $1.28 $1.20 $0.08 $0.95 $0.87 $0.09
1D3 $1.09 $0.96 $0.13 $1.30 $1.22 $0.08 $0.95 $0.87 $0.08
2A1 $1.27 $1.07 $0.20 $1.36 $1.26 $0.10 $1.02 $0.91 $0.11
2A2 $1.14 $1.00 $0.14 $1.30 $1.21 $0.08 $0.96 $0.88 $0.08
2A3 $1.07 $0.96 $0.11 $1.31 $1.23 $0.08 $0.97 $0.89 $0.08
2B1 $1.26 $1.07 $0.20 $1.36 $1.26 $0.09 $1.02 $0.91 $0.11
2B2 $1.13 $1.00 $0.14 $1.29 $1.21 $0.08 $0.96 $0.88 $0.08
2B3 $1.07 $0.96 $0.11 $1.31 $1.23 $0.08 $0.96 $0.88 $0.08
2C1 $1.60 $1.18 $0.42 $2.32 $1.66 $0.66 $1.79 $1.14 $0.64
2C2 $1.53 $1.14 $0.39 $2.26 $1.62 $0.64 $1.78 $1.12 $0.66
2C3 $1.51 $1.13 $0.38 $2.28 $1.64 $0.64 $1.79 $1.12 $0.66
2D1 $1.29 $1.08 $0.22 $1.36 $1.26 $0.10 $1.02 $0.91 $0.11
2D2 $1.16 $1.01 $0.15 $1.30 $1.21 $0.08 $0.96 $0.88 $0.08
2D3 $1.10 $0.97 $0.13 $1.31 $1.23 $0.08 $0.97 $0.89 $0.08
3A1 $1.20 $0.98 $0.22 $1.63 $1.33 $0.30 $1.17 $0.95 $0.22
3B1 $1.19 $0.97 $0.22 $1.63 $1.33 $0.30 $1.17 $0.95 $0.22
3C1 $1.58 $1.11 $0.48 $2.36 $1.62 $0.74 $1.87 $1.09 $0.78
3D1 $1.21 $0.98 $0.23 $1.63 $1.33 $0.30 $1.18 $0.95 $0.23
4A1 $1.25 $1.07 $0.17 $1.37 $1.28 $0.09 $1.01 $0.91 $0.10
4A2 $1.13 $0.99 $0.14 $1.31 $1.23 $0.08 $0.97 $0.88 $0.09
4A3 $1.07 $0.96 $0.11 $1.33 $1.25 $0.07 $0.97 $0.89 $0.08
4B1 $1.24 $1.07 $0.17 $1.37 $1.28 $0.09 $1.01 $0.91 $0.10
4B2 $1.13 $0.99 $0.14 $1.31 $1.23 $0.08 $0.97 $0.88 $0.09
4B3 $1.06 $0.96 $0.11 $1.33 $1.25 $0.07 $0.97 $0.89 $0.08
4C1 $1.66 $1.19 $0.46 $2.45 $1.70 $0.75 $1.93 $1.15 $0.78
4C2 $1.60 $1.14 $0.45 $2.40 $1.65 $0.75 $1.92 $1.13 $0.79
4C3 $1.58 $1.13 $0.44 $2.42 $1.67 $0.75 $1.92 $1.13 $0.79
4D1 $1.28 $1.08 $0.19 $1.37 $1.29 $0.09 $1.01 $0.91 $0.10
4D2 $1.16 $1.00 $0.16 $1.31 $1.23 $0.08 $0.97 $0.88 $0.09
4D3 $1.10 $0.97 $0.13 $1.33 $1.25 $0.07 $0.97 $0.89 $0.08
Table 7-15: Annual Enthalpy Energy Cost Savings for Elementary Schools ($/Ft2/Year)
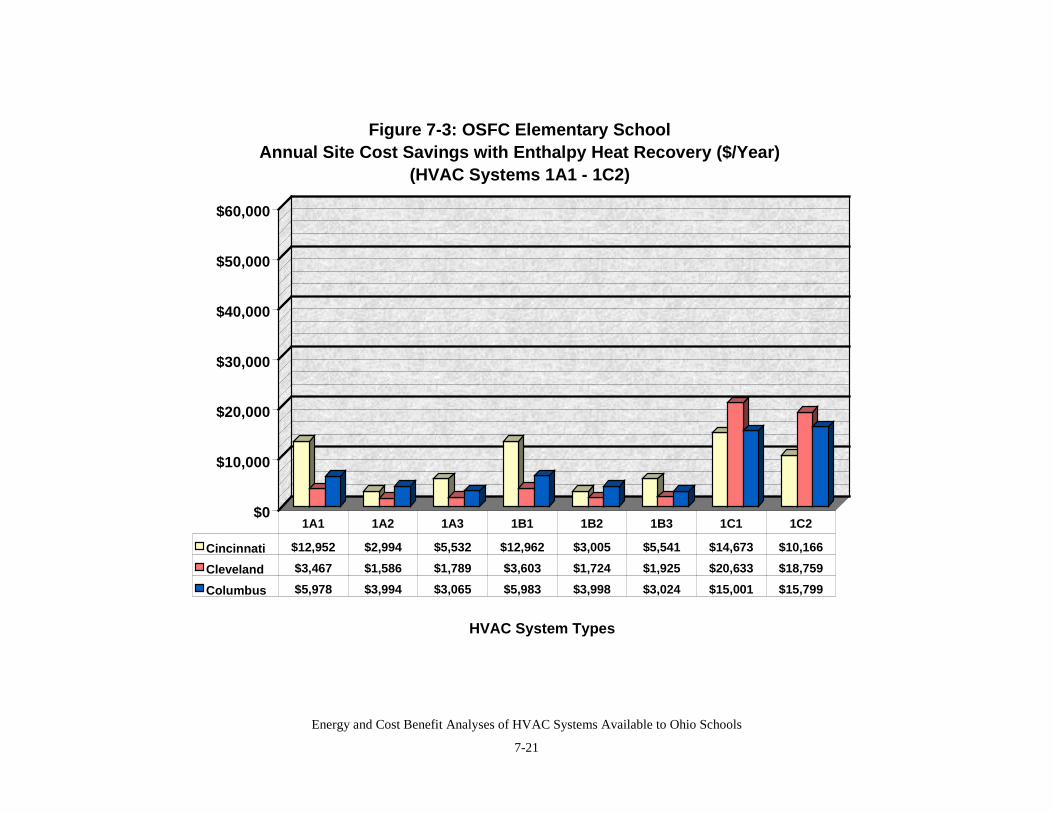
Energy and Cost Benefit Analyses of HVAC Systems Available to Ohio Schools
7-21
$0
$10,000
$20,000
$30,000
$40,000
$50,000
$60,000
HVAC System Types
Figure 7-3: OSFC Elementary School Annual Site Cost Savings with Enthalpy Heat Recovery ($/Year)
(HVAC Systems 1A1 - 1C2)
Cincinnati $12,952 $2,994 $5,532 $12,962 $3,005 $5,541 $14,673 $10,166
Cleveland $3,467 $1,586 $1,789 $3,603 $1,724 $1,925 $20,633 $18,759
Columbus $5,978 $3,994 $3,065 $5,983 $3,998 $3,024 $15,001 $15,799
1A1 1A2 1A3 1B1 1B2 1B3 1C1 1C2
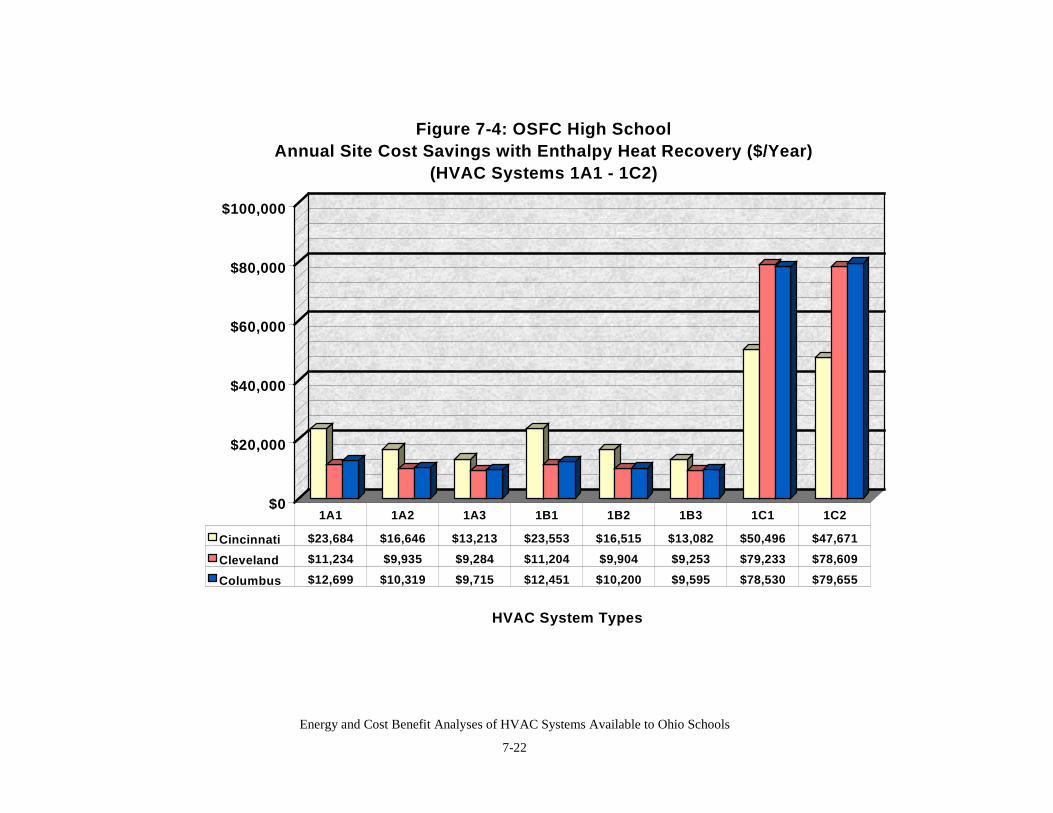
Energy and Cost Benefit Analyses of HVAC Systems Available to Ohio Schools
7-22
$0
$20,000
$40,000
$60,000
$80,000
$100,000
HVAC System Types
Figure 7-4: OSFC High School Annual Site Cost Savings with Enthalpy Heat Recovery ($/Year)
(HVAC Systems 1A1 - 1C2)
Cincinnati $23,684 $16,646 $13,213 $23,553 $16,515 $13,082 $50,496 $47,671
Cleveland $11,234 $9,935 $9,284 $11,204 $9,904 $9,253 $79,233 $78,609
Columbus $12,699 $10,319 $9,715 $12,451 $10,200 $9,595 $78,530 $79,655
1A1 1A2 1A3 1B1 1B2 1B3 1C1 1C2
Energy and Cost Benefit Analyses of HVAC Systems Available to Ohio Schools
7-23
In addition to net first costs, and differential annual energy costs, it is necessary to determinedifferential service and maintenance costs to estimate the cost effectiveness (i.e., differential life-cycle costs) of enthalpy heat recovery systems. Differential service, maintenance and repaircosts associated with reduced plant cooling and heating systems were determined on anannualized basis. Annual preventative maintenance costs for the enthalpy heat exchangers wereincluded in these costs. The methods used to determine these values can be found in Chapter 4.The combination of annualized energy savings and service, maintenance and repair savings forthe elementary and the high school are summarized in Tables 7-16 and 7-17. Columns 2-4 foreach of the tables summarize annual energy cost savings for the three cities described in detail inTables 7-12 and 7-14. Columns 5-7 of each table summarize differential service, maintenanceand replacement costs for each HVAC system in all three cities for both building types. The lastthree columns of each table summarize combined annual savings of energy and service,maintenance and replacement that can be used to offset differential first costs for enthalpy heatrecovery equipment.
Overall cost benefits of enthalpy heat recovery equipment were determined by computing bothnet present values (NPV) and paybacks (PB). In each case, the differential first cost of a givenoption was compared to differential energy savings as described earlier. NPV’s were calculatedby discounting 20 years of savings using a 6% hurdle rate.
Results are presented in Tables 7-18 and 7-19 for the elementary and high schools respectively.Examples of payback results (HVAC system options 1A1- 1C2) are shown in Figures 7-5 and 7-6 for the elementary and high school respectively; the balance of the system options can be foundin Appendix D.
For the elementary school, NPVs ranged from -$65,045 (Cleveland, 1A2) to $887,794(Columbus, 3C1) and paybacks ranged from nearly instantaneous (Columbus, 3C1) to 104.5years (Cleveland, 1A2). However, most of the paybacks were less than 25 years and over halfwere less than six years. Consistently, systems based on water-cooled screw chillers produce thepoorest NPVs and PBs. This is tied directly back to the smallest equipment size reduction forthese systems as shown in Table 7-4. For the high school, NPVs ranged from -$83,915(Cleveland, 4D3) to $1,166,479 (Columbus, 3C1) and paybacks ranged from nearlyinstantaneous (Columbus, 3C1) to 20.0 years (Cleveland, 1A2). In all cases the benefits wouldbe lower if only a portion of the building systems used enthalpy heat recovery. In addition, theresults are dependent on the interest rate and time intervals selected for the analyses.
Given school building lives are generally in excess of 20 years, it would appear that enthalpyheat recovery should be considered for all high school cases and a majority of elementary schoolcases.
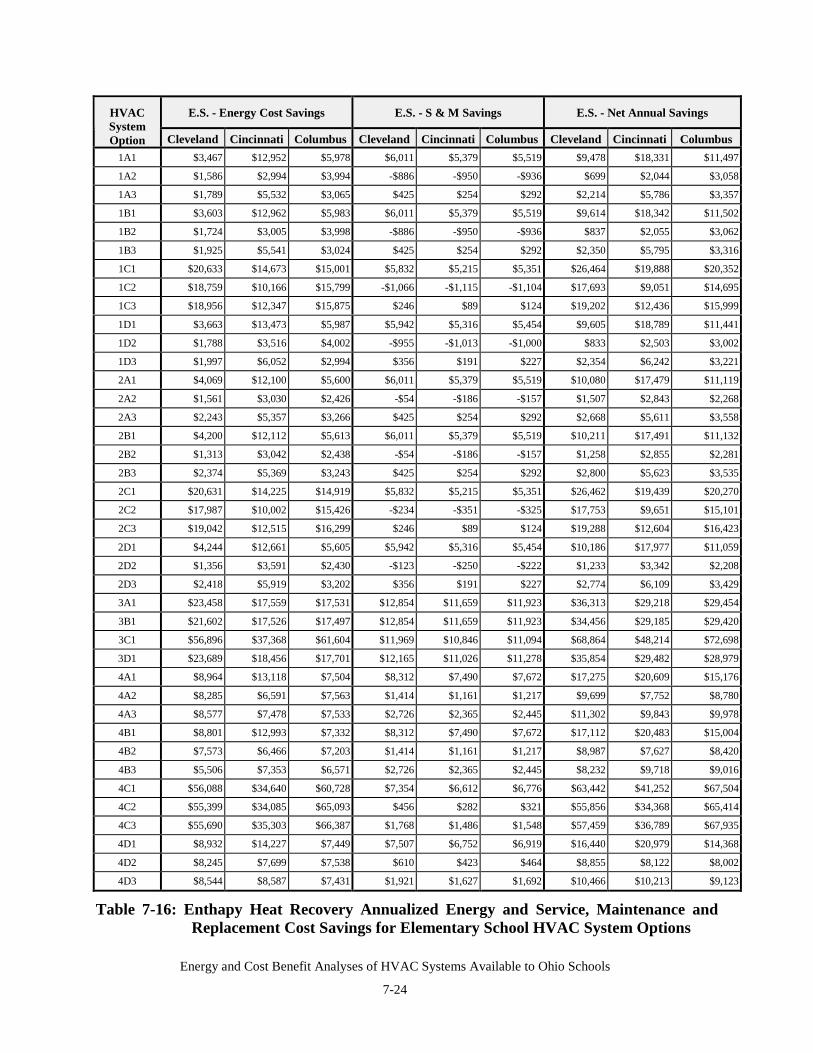
Energy and Cost Benefit Analyses of HVAC Systems Available to Ohio Schools
7-24
E.S. - Energy Cost Savings E.S. - S & M Savings E.S. - Net Annual SavingsHVACSystemOption Cleveland Cincinnati Columbus Cleveland Cincinnati Columbus Cleveland Cincinnati Columbus
1A1 $3,467 $12,952 $5,978 $6,011 $5,379 $5,519 $9,478 $18,331 $11,497
1A2 $1,586 $2,994 $3,994 -$886 -$950 -$936 $699 $2,044 $3,058
1A3 $1,789 $5,532 $3,065 $425 $254 $292 $2,214 $5,786 $3,357
1B1 $3,603 $12,962 $5,983 $6,011 $5,379 $5,519 $9,614 $18,342 $11,502
1B2 $1,724 $3,005 $3,998 -$886 -$950 -$936 $837 $2,055 $3,062
1B3 $1,925 $5,541 $3,024 $425 $254 $292 $2,350 $5,795 $3,316
1C1 $20,633 $14,673 $15,001 $5,832 $5,215 $5,351 $26,464 $19,888 $20,352
1C2 $18,759 $10,166 $15,799 -$1,066 -$1,115 -$1,104 $17,693 $9,051 $14,695
1C3 $18,956 $12,347 $15,875 $246 $89 $124 $19,202 $12,436 $15,999
1D1 $3,663 $13,473 $5,987 $5,942 $5,316 $5,454 $9,605 $18,789 $11,441
1D2 $1,788 $3,516 $4,002 -$955 -$1,013 -$1,000 $833 $2,503 $3,002
1D3 $1,997 $6,052 $2,994 $356 $191 $227 $2,354 $6,242 $3,221
2A1 $4,069 $12,100 $5,600 $6,011 $5,379 $5,519 $10,080 $17,479 $11,119
2A2 $1,561 $3,030 $2,426 -$54 -$186 -$157 $1,507 $2,843 $2,268
2A3 $2,243 $5,357 $3,266 $425 $254 $292 $2,668 $5,611 $3,558
2B1 $4,200 $12,112 $5,613 $6,011 $5,379 $5,519 $10,211 $17,491 $11,132
2B2 $1,313 $3,042 $2,438 -$54 -$186 -$157 $1,258 $2,855 $2,281
2B3 $2,374 $5,369 $3,243 $425 $254 $292 $2,800 $5,623 $3,535
2C1 $20,631 $14,225 $14,919 $5,832 $5,215 $5,351 $26,462 $19,439 $20,270
2C2 $17,987 $10,002 $15,426 -$234 -$351 -$325 $17,753 $9,651 $15,101
2C3 $19,042 $12,515 $16,299 $246 $89 $124 $19,288 $12,604 $16,423
2D1 $4,244 $12,661 $5,605 $5,942 $5,316 $5,454 $10,186 $17,977 $11,059
2D2 $1,356 $3,591 $2,430 -$123 -$250 -$222 $1,233 $3,342 $2,208
2D3 $2,418 $5,919 $3,202 $356 $191 $227 $2,774 $6,109 $3,429
3A1 $23,458 $17,559 $17,531 $12,854 $11,659 $11,923 $36,313 $29,218 $29,454
3B1 $21,602 $17,526 $17,497 $12,854 $11,659 $11,923 $34,456 $29,185 $29,420
3C1 $56,896 $37,368 $61,604 $11,969 $10,846 $11,094 $68,864 $48,214 $72,698
3D1 $23,689 $18,456 $17,701 $12,165 $11,026 $11,278 $35,854 $29,482 $28,979
4A1 $8,964 $13,118 $7,504 $8,312 $7,490 $7,672 $17,275 $20,609 $15,176
4A2 $8,285 $6,591 $7,563 $1,414 $1,161 $1,217 $9,699 $7,752 $8,780
4A3 $8,577 $7,478 $7,533 $2,726 $2,365 $2,445 $11,302 $9,843 $9,978
4B1 $8,801 $12,993 $7,332 $8,312 $7,490 $7,672 $17,112 $20,483 $15,004
4B2 $7,573 $6,466 $7,203 $1,414 $1,161 $1,217 $8,987 $7,627 $8,420
4B3 $5,506 $7,353 $6,571 $2,726 $2,365 $2,445 $8,232 $9,718 $9,016
4C1 $56,088 $34,640 $60,728 $7,354 $6,612 $6,776 $63,442 $41,252 $67,504
4C2 $55,399 $34,085 $65,093 $456 $282 $321 $55,856 $34,368 $65,414
4C3 $55,690 $35,303 $66,387 $1,768 $1,486 $1,548 $57,459 $36,789 $67,935
4D1 $8,932 $14,227 $7,449 $7,507 $6,752 $6,919 $16,440 $20,979 $14,368
4D2 $8,245 $7,699 $7,538 $610 $423 $464 $8,855 $8,122 $8,002
4D3 $8,544 $8,587 $7,431 $1,921 $1,627 $1,692 $10,466 $10,213 $9,123
Table 7-16: Enthapy Heat Recovery Annualized Energy and Service, Maintenance andReplacement Cost Savings for Elementary School HVAC System Options
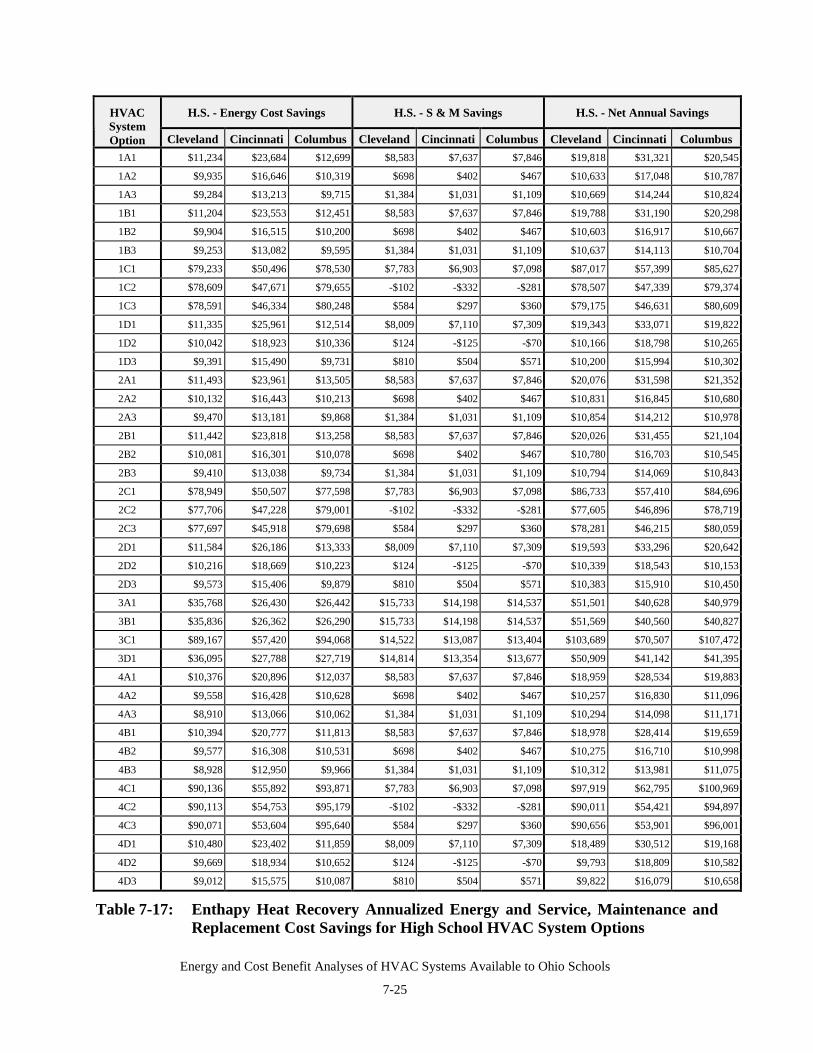
Energy and Cost Benefit Analyses of HVAC Systems Available to Ohio Schools
7-25
H.S. - Energy Cost Savings H.S. - S & M Savings H.S. - Net Annual SavingsHVACSystemOption Cleveland Cincinnati Columbus Cleveland Cincinnati Columbus Cleveland Cincinnati Columbus
1A1 $11,234 $23,684 $12,699 $8,583 $7,637 $7,846 $19,818 $31,321 $20,545
1A2 $9,935 $16,646 $10,319 $698 $402 $467 $10,633 $17,048 $10,787
1A3 $9,284 $13,213 $9,715 $1,384 $1,031 $1,109 $10,669 $14,244 $10,824
1B1 $11,204 $23,553 $12,451 $8,583 $7,637 $7,846 $19,788 $31,190 $20,298
1B2 $9,904 $16,515 $10,200 $698 $402 $467 $10,603 $16,917 $10,667
1B3 $9,253 $13,082 $9,595 $1,384 $1,031 $1,109 $10,637 $14,113 $10,704
1C1 $79,233 $50,496 $78,530 $7,783 $6,903 $7,098 $87,017 $57,399 $85,627
1C2 $78,609 $47,671 $79,655 -$102 -$332 -$281 $78,507 $47,339 $79,374
1C3 $78,591 $46,334 $80,248 $584 $297 $360 $79,175 $46,631 $80,609
1D1 $11,335 $25,961 $12,514 $8,009 $7,110 $7,309 $19,343 $33,071 $19,822
1D2 $10,042 $18,923 $10,336 $124 -$125 -$70 $10,166 $18,798 $10,265
1D3 $9,391 $15,490 $9,731 $810 $504 $571 $10,200 $15,994 $10,302
2A1 $11,493 $23,961 $13,505 $8,583 $7,637 $7,846 $20,076 $31,598 $21,352
2A2 $10,132 $16,443 $10,213 $698 $402 $467 $10,831 $16,845 $10,680
2A3 $9,470 $13,181 $9,868 $1,384 $1,031 $1,109 $10,854 $14,212 $10,978
2B1 $11,442 $23,818 $13,258 $8,583 $7,637 $7,846 $20,026 $31,455 $21,104
2B2 $10,081 $16,301 $10,078 $698 $402 $467 $10,780 $16,703 $10,545
2B3 $9,410 $13,038 $9,734 $1,384 $1,031 $1,109 $10,794 $14,069 $10,843
2C1 $78,949 $50,507 $77,598 $7,783 $6,903 $7,098 $86,733 $57,410 $84,696
2C2 $77,706 $47,228 $79,001 -$102 -$332 -$281 $77,605 $46,896 $78,719
2C3 $77,697 $45,918 $79,698 $584 $297 $360 $78,281 $46,215 $80,059
2D1 $11,584 $26,186 $13,333 $8,009 $7,110 $7,309 $19,593 $33,296 $20,642
2D2 $10,216 $18,669 $10,223 $124 -$125 -$70 $10,339 $18,543 $10,153
2D3 $9,573 $15,406 $9,879 $810 $504 $571 $10,383 $15,910 $10,450
3A1 $35,768 $26,430 $26,442 $15,733 $14,198 $14,537 $51,501 $40,628 $40,979
3B1 $35,836 $26,362 $26,290 $15,733 $14,198 $14,537 $51,569 $40,560 $40,827
3C1 $89,167 $57,420 $94,068 $14,522 $13,087 $13,404 $103,689 $70,507 $107,472
3D1 $36,095 $27,788 $27,719 $14,814 $13,354 $13,677 $50,909 $41,142 $41,395
4A1 $10,376 $20,896 $12,037 $8,583 $7,637 $7,846 $18,959 $28,534 $19,883
4A2 $9,558 $16,428 $10,628 $698 $402 $467 $10,257 $16,830 $11,096
4A3 $8,910 $13,066 $10,062 $1,384 $1,031 $1,109 $10,294 $14,098 $11,171
4B1 $10,394 $20,777 $11,813 $8,583 $7,637 $7,846 $18,978 $28,414 $19,659
4B2 $9,577 $16,308 $10,531 $698 $402 $467 $10,275 $16,710 $10,998
4B3 $8,928 $12,950 $9,966 $1,384 $1,031 $1,109 $10,312 $13,981 $11,075
4C1 $90,136 $55,892 $93,871 $7,783 $6,903 $7,098 $97,919 $62,795 $100,969
4C2 $90,113 $54,753 $95,179 -$102 -$332 -$281 $90,011 $54,421 $94,897
4C3 $90,071 $53,604 $95,640 $584 $297 $360 $90,656 $53,901 $96,001
4D1 $10,480 $23,402 $11,859 $8,009 $7,110 $7,309 $18,489 $30,512 $19,168
4D2 $9,669 $18,934 $10,652 $124 -$125 -$70 $9,793 $18,809 $10,582
4D3 $9,012 $15,575 $10,087 $810 $504 $571 $9,822 $16,079 $10,658
Table 7-17: Enthapy Heat Recovery Annualized Energy and Service, Maintenance andReplacement Cost Savings for High School HVAC System Options

Energy and Cost Benefit Analyses of HVAC Systems Available to Ohio Schools
7-26
E. S. School - Enthalpy-NPV E. S. School - Enthalpy-PBHVACSystemOption Cleveland Cincinnati Columbus Cleveland Cincinnati Columbus
1A1 $49,696 $156,109 $76,650 6.2 3.0 4.8
1A2 -$65,045 -$43,606 -$33,300 104.5 32.8 22.4
1A3 -$41,962 $4,548 -$24,535 30.4 10.7 18.8
1B1 $52,763 $157,603 $78,110 6.0 2.9 4.7
1B2 -$61,967 -$42,099 -$31,855 85.5 32.0 21.9
1B3 -$38,908 $6,028 -$23,603 28.0 10.4 18.6
1C1 $240,853 $170,586 $174,763 2.4 2.9 2.9
1C2 $126,191 $33,390 $96,729 4.3 7.8 4.9
1C3 $149,198 $77,447 $117,023 3.7 5.2 4.2
1D1 $51,248 $161,443 $76,087 6.1 2.9 4.8
1D2 -$63,421 -$38,260 -$33,864 87.6 26.8 22.8
1D3 -$40,274 $9,868 -$26,003 28.6 9.9 19.5
2A1 $56,603 $146,333 $72,311 5.9 3.1 5.0
2A2 -$41,509 -$21,336 -$28,999 39.0 19.0 24.3
2A3 -$36,753 $2,545 -$22,233 25.2 11.0 17.7
2B1 $59,606 $147,850 $73,859 5.6 3.0 4.8
2B2 -$42,859 -$19,819 -$27,451 45.5 18.4 23.5
2B3 -$33,750 $4,062 -$21,092 23.5 10.7 17.4
2C1 $240,827 $165,439 $173,823 2.4 3.0 2.9
2C2 $141,156 $53,367 $114,741 3.5 5.9 3.9
2C3 $150,187 $79,381 $121,886 3.7 5.2 4.0
2D1 $57,908 $152,132 $71,707 5.8 3.0 5.0
2D2 -$44,557 -$15,537 -$29,603 47.6 16.1 24.9
2D3 -$35,448 $8,345 -$23,622 24.2 10.1 18.4
3A1 $494,741 $406,919 $411,056 0.0 0.0 0.0
3B1 $477,473 $410,233 $414,426 0.0 0.0 0.0
3C1 $847,519 $605,913 $887,794 0.0 0.0 0.0
3D1 $490,387 $410,777 $406,446 0.0 0.0 0.0
4A1 $185,306 $224,596 $162,049 0.7 0.6 0.8
4A2 $84,351 $64,234 $75,537 2.8 3.2 2.9
4A3 $108,445 $93,455 $94,610 1.9 2.0 2.0
4B1 $187,457 $226,852 $163,839 0.5 0.4 0.6
4B2 $80,211 $66,491 $75,173 2.5 2.8 2.5
4B3 $77,254 $95,711 $87,343 2.1 1.6 1.8
4C1 $692,167 $440,572 $741,035 0.6 0.8 0.5
4C2 $591,096 $348,712 $703,908 0.9 1.3 0.7
4C3 $615,188 $381,727 $738,169 0.8 1.1 0.6
4D1 $176,770 $229,807 $153,765 0.7 0.5 0.8
4D2 $75,720 $69,445 $67,599 2.9 2.9 3.0
4D3 $99,899 $98,665 $85,792 1.9 1.8 2.1
Table 7-18: Enthalpy Heat Recovery NPVs and PBs for the Elementary School Cases
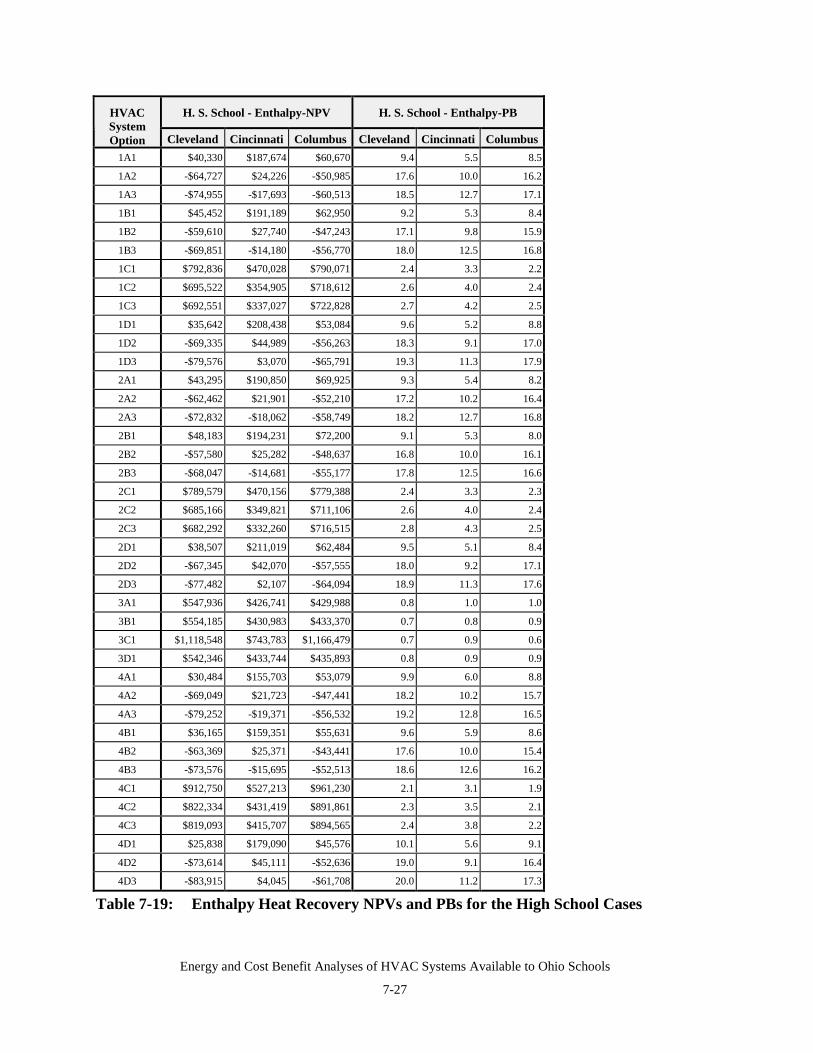
Energy and Cost Benefit Analyses of HVAC Systems Available to Ohio Schools
7-27
H. S. School - Enthalpy-NPV H. S. School - Enthalpy-PBHVACSystemOption Cleveland Cincinnati Columbus Cleveland Cincinnati Columbus
1A1 $40,330 $187,674 $60,670 9.4 5.5 8.5
1A2 -$64,727 $24,226 -$50,985 17.6 10.0 16.2
1A3 -$74,955 -$17,693 -$60,513 18.5 12.7 17.1
1B1 $45,452 $191,189 $62,950 9.2 5.3 8.4
1B2 -$59,610 $27,740 -$47,243 17.1 9.8 15.9
1B3 -$69,851 -$14,180 -$56,770 18.0 12.5 16.8
1C1 $792,836 $470,028 $790,071 2.4 3.3 2.2
1C2 $695,522 $354,905 $718,612 2.6 4.0 2.4
1C3 $692,551 $337,027 $722,828 2.7 4.2 2.5
1D1 $35,642 $208,438 $53,084 9.6 5.2 8.8
1D2 -$69,335 $44,989 -$56,263 18.3 9.1 17.0
1D3 -$79,576 $3,070 -$65,791 19.3 11.3 17.9
2A1 $43,295 $190,850 $69,925 9.3 5.4 8.2
2A2 -$62,462 $21,901 -$52,210 17.2 10.2 16.4
2A3 -$72,832 -$18,062 -$58,749 18.2 12.7 16.8
2B1 $48,183 $194,231 $72,200 9.1 5.3 8.0
2B2 -$57,580 $25,282 -$48,637 16.8 10.0 16.1
2B3 -$68,047 -$14,681 -$55,177 17.8 12.5 16.6
2C1 $789,579 $470,156 $779,388 2.4 3.3 2.3
2C2 $685,166 $349,821 $711,106 2.6 4.0 2.4
2C3 $682,292 $332,260 $716,515 2.8 4.3 2.5
2D1 $38,507 $211,019 $62,484 9.5 5.1 8.4
2D2 -$67,345 $42,070 -$57,555 18.0 9.2 17.1
2D3 -$77,482 $2,107 -$64,094 18.9 11.3 17.6
3A1 $547,936 $426,741 $429,988 0.8 1.0 1.0
3B1 $554,185 $430,983 $433,370 0.7 0.8 0.9
3C1 $1,118,548 $743,783 $1,166,479 0.7 0.9 0.6
3D1 $542,346 $433,744 $435,893 0.8 0.9 0.9
4A1 $30,484 $155,703 $53,079 9.9 6.0 8.8
4A2 -$69,049 $21,723 -$47,441 18.2 10.2 15.7
4A3 -$79,252 -$19,371 -$56,532 19.2 12.8 16.5
4B1 $36,165 $159,351 $55,631 9.6 5.9 8.6
4B2 -$63,369 $25,371 -$43,441 17.6 10.0 15.4
4B3 -$73,576 -$15,695 -$52,513 18.6 12.6 16.2
4C1 $912,750 $527,213 $961,230 2.1 3.1 1.9
4C2 $822,334 $431,419 $891,861 2.3 3.5 2.1
4C3 $819,093 $415,707 $894,565 2.4 3.8 2.2
4D1 $25,838 $179,090 $45,576 10.1 5.6 9.1
4D2 -$73,614 $45,111 -$52,636 19.0 9.1 16.4
4D3 -$83,915 $4,045 -$61,708 20.0 11.2 17.3
Table 7-19: Enthalpy Heat Recovery NPVs and PBs for the High School Cases
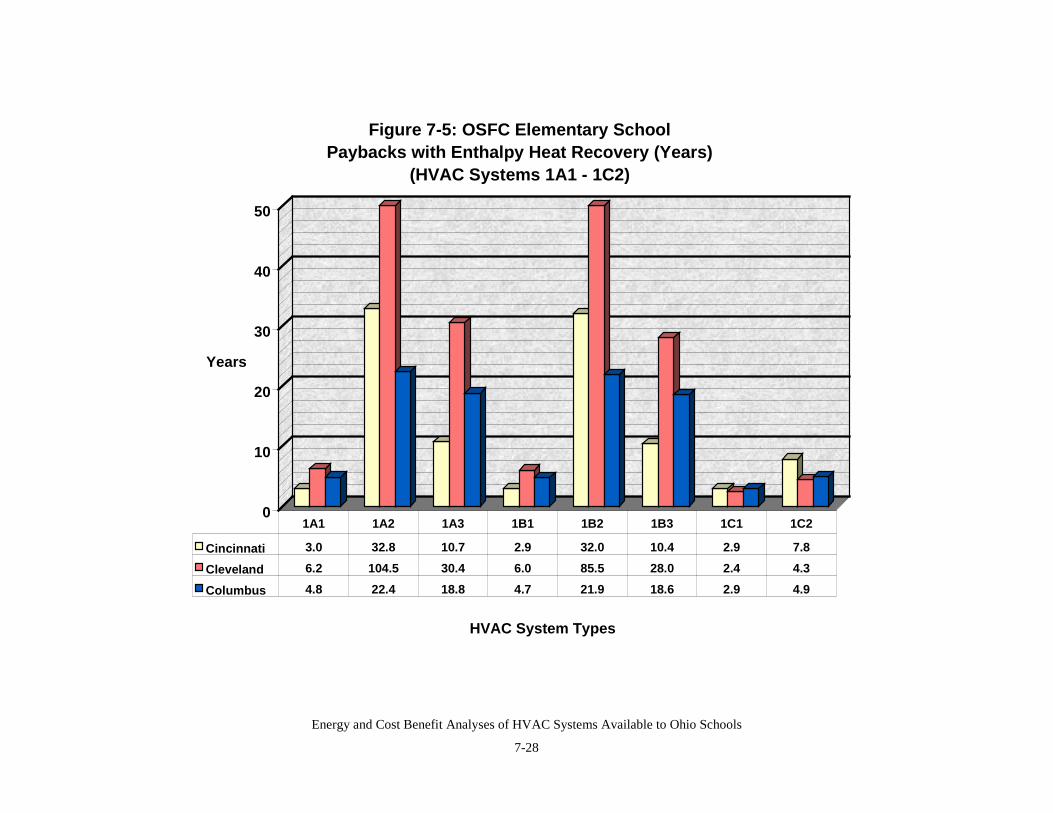
Energy and Cost Benefit Analyses of HVAC Systems Available to Ohio Schools
7-28
0
10
20
30
40
50
Years
HVAC System Types
Figure 7-5: OSFC Elementary School Paybacks with Enthalpy Heat Recovery (Years)
(HVAC Systems 1A1 - 1C2)
Cincinnati 3.0 32.8 10.7 2.9 32.0 10.4 2.9 7.8
Cleveland 6.2 104.5 30.4 6.0 85.5 28.0 2.4 4.3
Columbus 4.8 22.4 18.8 4.7 21.9 18.6 2.9 4.9
1A1 1A2 1A3 1B1 1B2 1B3 1C1 1C2
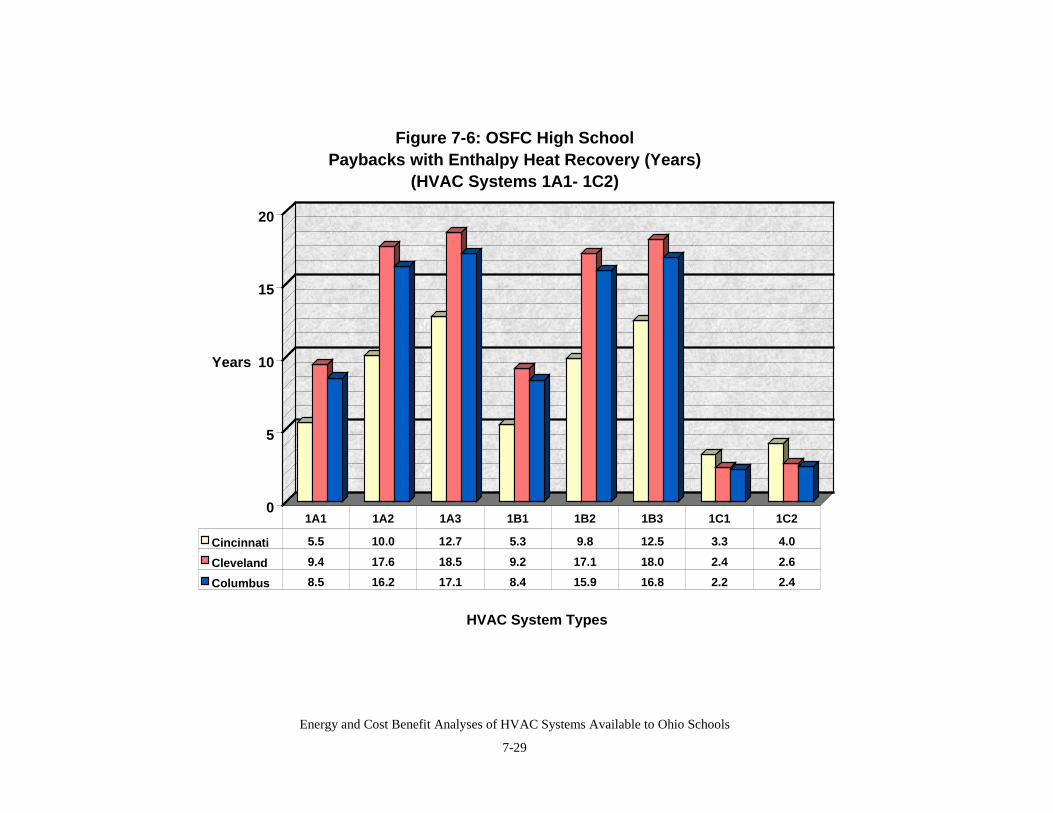
Energy and Cost Benefit Analyses of HVAC Systems Available to Ohio Schools
7-29
0
5
10
15
20
Years
HVAC System Types
Figure 7-6: OSFC High School Paybacks with Enthalpy Heat Recovery (Years)
(HVAC Systems 1A1- 1C2)
Cincinnati 5.5 10.0 12.7 5.3 9.8 12.5 3.3 4.0
Cleveland 9.4 17.6 18.5 9.2 17.1 18.0 2.4 2.6
Columbus 8.5 16.2 17.1 8.4 15.9 16.8 2.2 2.4
1A1 1A2 1A3 1B1 1B2 1B3 1C1 1C2
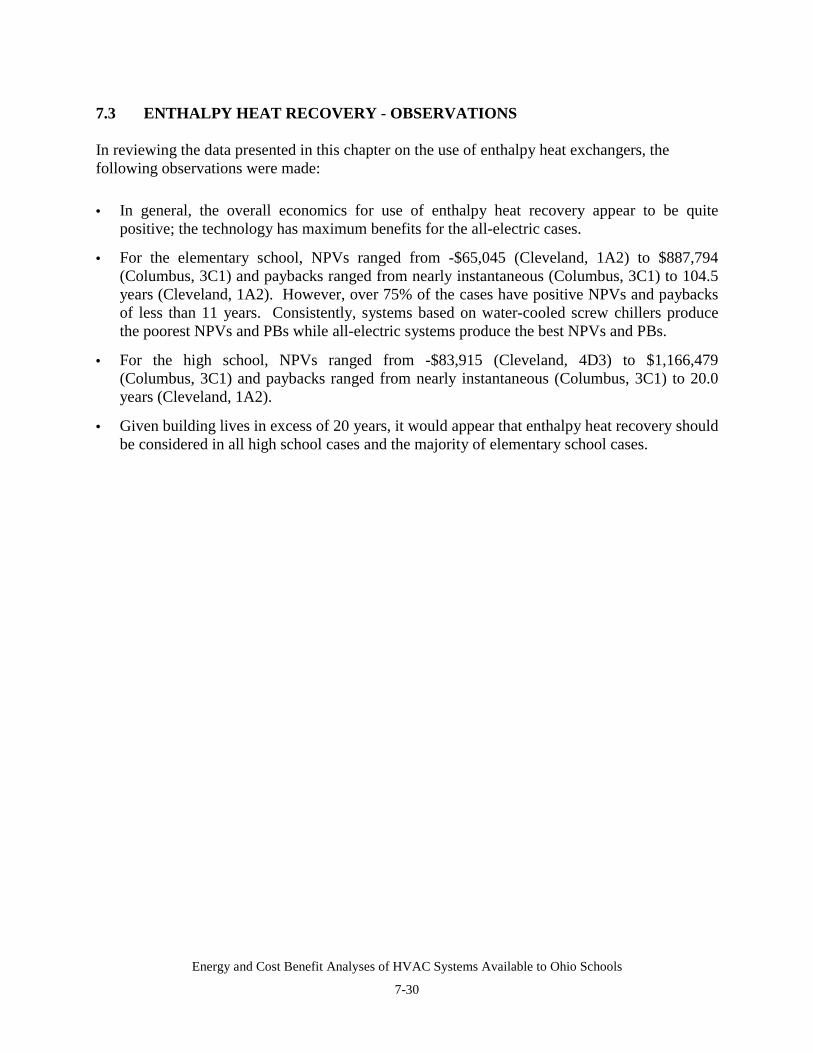
Energy and Cost Benefit Analyses of HVAC Systems Available to Ohio Schools
7-30
7.3 ENTHALPY HEAT RECOVERY - OBSERVATIONS
In reviewing the data presented in this chapter on the use of enthalpy heat exchangers, thefollowing observations were made:
• In general, the overall economics for use of enthalpy heat recovery appear to be quitepositive; the technology has maximum benefits for the all-electric cases.
• For the elementary school, NPVs ranged from -$65,045 (Cleveland, 1A2) to $887,794(Columbus, 3C1) and paybacks ranged from nearly instantaneous (Columbus, 3C1) to 104.5years (Cleveland, 1A2). However, over 75% of the cases have positive NPVs and paybacksof less than 11 years. Consistently, systems based on water-cooled screw chillers producethe poorest NPVs and PBs while all-electric systems produce the best NPVs and PBs.
• For the high school, NPVs ranged from -$83,915 (Cleveland, 4D3) to $1,166,479(Columbus, 3C1) and paybacks ranged from nearly instantaneous (Columbus, 3C1) to 20.0years (Cleveland, 1A2).
• Given building lives in excess of 20 years, it would appear that enthalpy heat recovery shouldbe considered in all high school cases and the majority of elementary school cases.
Energy and Cost Benefit Analyses of HVAC Systems Available to Ohio Schools
8-1
8.0 OCCUPANCY-BASED VENTILATION ANALYSES
Increasingly, there is interest in determining how changes to ventilation (or fresh air) flow ratesinto schools would impact HVAC costs. Revisions to the American Society of Heating,Refrigeration and Air Conditioning Engineers (ASHRAE) Standard 62 regarding the amount ofventilation air to provide to building occupants and indoor spaces over the past 75 years reflectsthe on-going debate as to how much fresh air is enough. One of the issues affecting this debateis the cost of providing given amounts of fresh air to indoor spaces. During this work, the HAPbaseline work assumed 15 CFM/person of fresh air is provided to all spaces. In this Chapter, theenergy and cost impacts of less (10 vs 15 CFM/person) and more (20 vs 15 CFM/person)ventilation or fresh air to school spaces is summarized. The scope of this evaluation was all 40HVAC system options for a high school building located in Columbus, Ohio.
8.1 APPROACH TO OCCUPANCY-BASED VENTILATION (i.e., IAQ) ANALYSES
The approach used in completing these analyses was to:
1. Re-run HAP 80 times (re-run 40 Columbus High School HVAC options for two differentventilation rates – 10 and 20 CFM/person in a single city – Columbus, OH).
2. Estimate differential life cycle costs for all 80 cases based re-sized equipment needsassociated with lower (10 CFM/person) or greater (20 CFM/person) ventilation air systems.The base system used 15 CFM/person. Develop incremental first equipment costs andannualized energy and service, maintenance and replacement costs to determine differentiallife-cycle costs for each of the 80 cases. Cost data were based on information obtained fromRS Means CostWorks 2000®.
3. Complete cost-benefit [Net Present Value (NPV) based on incremental first costs anddiscounted (6%) annualized savings or costs over a 20-year period. Note, paybacks were notcalculated for the IAQ cases since they are instantaneous for the 10 vs 15 CFM/person cases(less plant equipment used and lower annual energy and service, maintenance andreplacement costs) and are always significant for the 20 vs 15 CFM/person cases (more plantequipment and higher energy and service, maintenance and replacement costs).
4. Summarize NPV results and observations.
8.2 OCCUPANCY-BASED VENTILATION RESULTS
To complete this analysis, HAP was rerun assuming lower and higher ventilation air rates (10CFM per person and 20 CFM per person respectively. This provided changes in equipment sizesand energy consumption needed to maintain space comfort at different fresh air flowrates. Asummary of equipment size changes is presented in Tables 8-1, 8-2 and 8-3. Table 8-1summarizes cooling equipment sizes for 36 of the cases (all but heat pump cases), Table 8-2summarizes heating equipment sizes for the same 36 cases and Table 8-3 summarizes the fourheat pump cases.
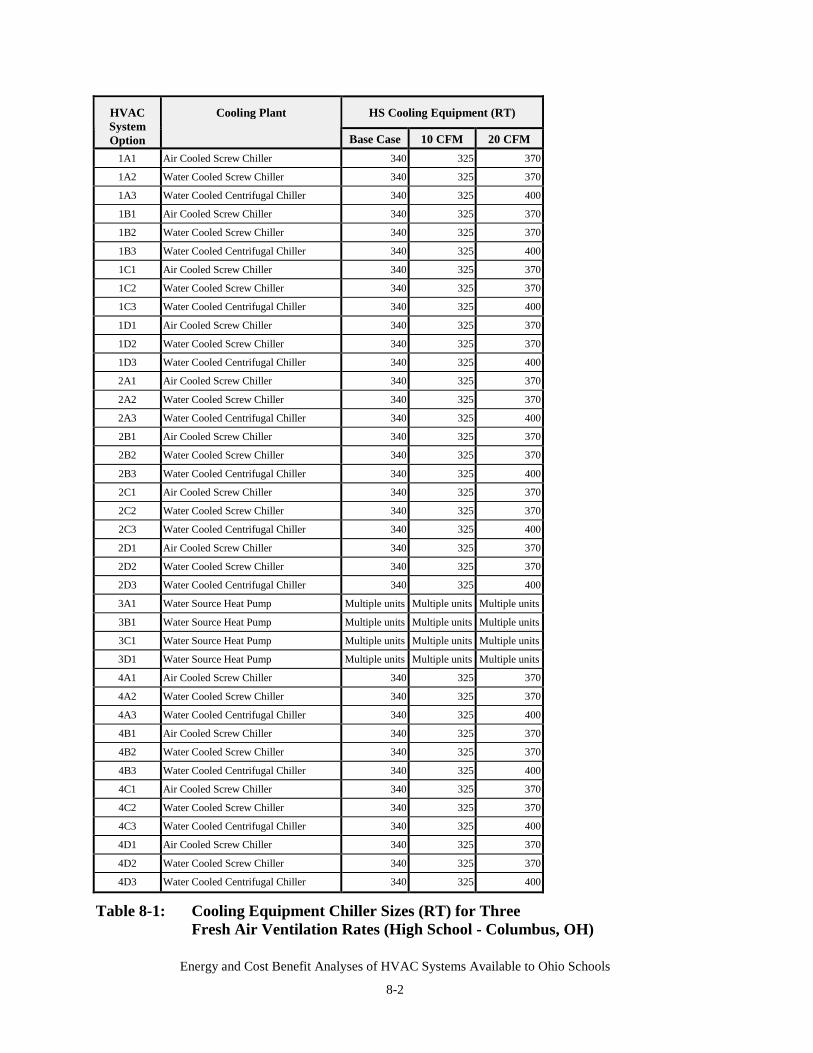
Energy and Cost Benefit Analyses of HVAC Systems Available to Ohio Schools
8-2
HS Cooling Equipment (RT)HVACSystemOption
Cooling Plant
Base Case 10 CFM 20 CFM1A1 Air Cooled Screw Chiller 340 325 370
1A2 Water Cooled Screw Chiller 340 325 370
1A3 Water Cooled Centrifugal Chiller 340 325 400
1B1 Air Cooled Screw Chiller 340 325 370
1B2 Water Cooled Screw Chiller 340 325 370
1B3 Water Cooled Centrifugal Chiller 340 325 400
1C1 Air Cooled Screw Chiller 340 325 370
1C2 Water Cooled Screw Chiller 340 325 370
1C3 Water Cooled Centrifugal Chiller 340 325 400
1D1 Air Cooled Screw Chiller 340 325 370
1D2 Water Cooled Screw Chiller 340 325 370
1D3 Water Cooled Centrifugal Chiller 340 325 400
2A1 Air Cooled Screw Chiller 340 325 370
2A2 Water Cooled Screw Chiller 340 325 370
2A3 Water Cooled Centrifugal Chiller 340 325 400
2B1 Air Cooled Screw Chiller 340 325 370
2B2 Water Cooled Screw Chiller 340 325 370
2B3 Water Cooled Centrifugal Chiller 340 325 400
2C1 Air Cooled Screw Chiller 340 325 370
2C2 Water Cooled Screw Chiller 340 325 370
2C3 Water Cooled Centrifugal Chiller 340 325 400
2D1 Air Cooled Screw Chiller 340 325 370
2D2 Water Cooled Screw Chiller 340 325 370
2D3 Water Cooled Centrifugal Chiller 340 325 400
3A1 Water Source Heat Pump Multiple units Multiple units Multiple units
3B1 Water Source Heat Pump Multiple units Multiple units Multiple units
3C1 Water Source Heat Pump Multiple units Multiple units Multiple units
3D1 Water Source Heat Pump Multiple units Multiple units Multiple units
4A1 Air Cooled Screw Chiller 340 325 370
4A2 Water Cooled Screw Chiller 340 325 370
4A3 Water Cooled Centrifugal Chiller 340 325 400
4B1 Air Cooled Screw Chiller 340 325 370
4B2 Water Cooled Screw Chiller 340 325 370
4B3 Water Cooled Centrifugal Chiller 340 325 400
4C1 Air Cooled Screw Chiller 340 325 370
4C2 Water Cooled Screw Chiller 340 325 370
4C3 Water Cooled Centrifugal Chiller 340 325 400
4D1 Air Cooled Screw Chiller 340 325 370
4D2 Water Cooled Screw Chiller 340 325 370
4D3 Water Cooled Centrifugal Chiller 340 325 400
Table 8-1: Cooling Equipment Chiller Sizes (RT) for ThreeFresh Air Ventilation Rates (High School - Columbus, OH)
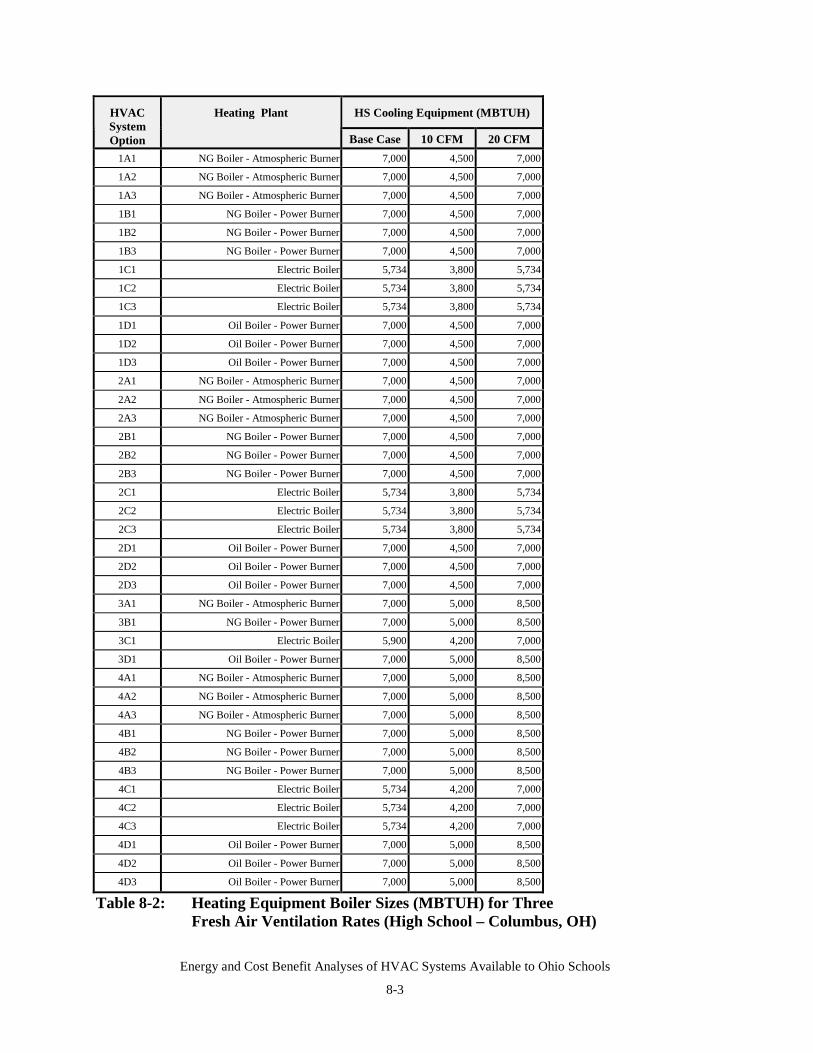
Energy and Cost Benefit Analyses of HVAC Systems Available to Ohio Schools
8-3
HS Cooling Equipment (MBTUH)HVACSystemOption
Heating Plant
Base Case 10 CFM 20 CFM1A1 NG Boiler - Atmospheric Burner 7,000 4,500 7,000
1A2 NG Boiler - Atmospheric Burner 7,000 4,500 7,000
1A3 NG Boiler - Atmospheric Burner 7,000 4,500 7,000
1B1 NG Boiler - Power Burner 7,000 4,500 7,000
1B2 NG Boiler - Power Burner 7,000 4,500 7,000
1B3 NG Boiler - Power Burner 7,000 4,500 7,000
1C1 Electric Boiler 5,734 3,800 5,734
1C2 Electric Boiler 5,734 3,800 5,734
1C3 Electric Boiler 5,734 3,800 5,734
1D1 Oil Boiler - Power Burner 7,000 4,500 7,000
1D2 Oil Boiler - Power Burner 7,000 4,500 7,000
1D3 Oil Boiler - Power Burner 7,000 4,500 7,000
2A1 NG Boiler - Atmospheric Burner 7,000 4,500 7,000
2A2 NG Boiler - Atmospheric Burner 7,000 4,500 7,000
2A3 NG Boiler - Atmospheric Burner 7,000 4,500 7,000
2B1 NG Boiler - Power Burner 7,000 4,500 7,000
2B2 NG Boiler - Power Burner 7,000 4,500 7,000
2B3 NG Boiler - Power Burner 7,000 4,500 7,000
2C1 Electric Boiler 5,734 3,800 5,734
2C2 Electric Boiler 5,734 3,800 5,734
2C3 Electric Boiler 5,734 3,800 5,734
2D1 Oil Boiler - Power Burner 7,000 4,500 7,000
2D2 Oil Boiler - Power Burner 7,000 4,500 7,000
2D3 Oil Boiler - Power Burner 7,000 4,500 7,000
3A1 NG Boiler - Atmospheric Burner 7,000 5,000 8,500
3B1 NG Boiler - Power Burner 7,000 5,000 8,500
3C1 Electric Boiler 5,900 4,200 7,000
3D1 Oil Boiler - Power Burner 7,000 5,000 8,500
4A1 NG Boiler - Atmospheric Burner 7,000 5,000 8,500
4A2 NG Boiler - Atmospheric Burner 7,000 5,000 8,500
4A3 NG Boiler - Atmospheric Burner 7,000 5,000 8,500
4B1 NG Boiler - Power Burner 7,000 5,000 8,500
4B2 NG Boiler - Power Burner 7,000 5,000 8,500
4B3 NG Boiler - Power Burner 7,000 5,000 8,500
4C1 Electric Boiler 5,734 4,200 7,000
4C2 Electric Boiler 5,734 4,200 7,000
4C3 Electric Boiler 5,734 4,200 7,000
4D1 Oil Boiler - Power Burner 7,000 5,000 8,500
4D2 Oil Boiler - Power Burner 7,000 5,000 8,500
4D3 Oil Boiler - Power Burner 7,000 5,000 8,500
Table 8-2: Heating Equipment Boiler Sizes (MBTUH) for ThreeFresh Air Ventilation Rates (High School – Columbus, OH)
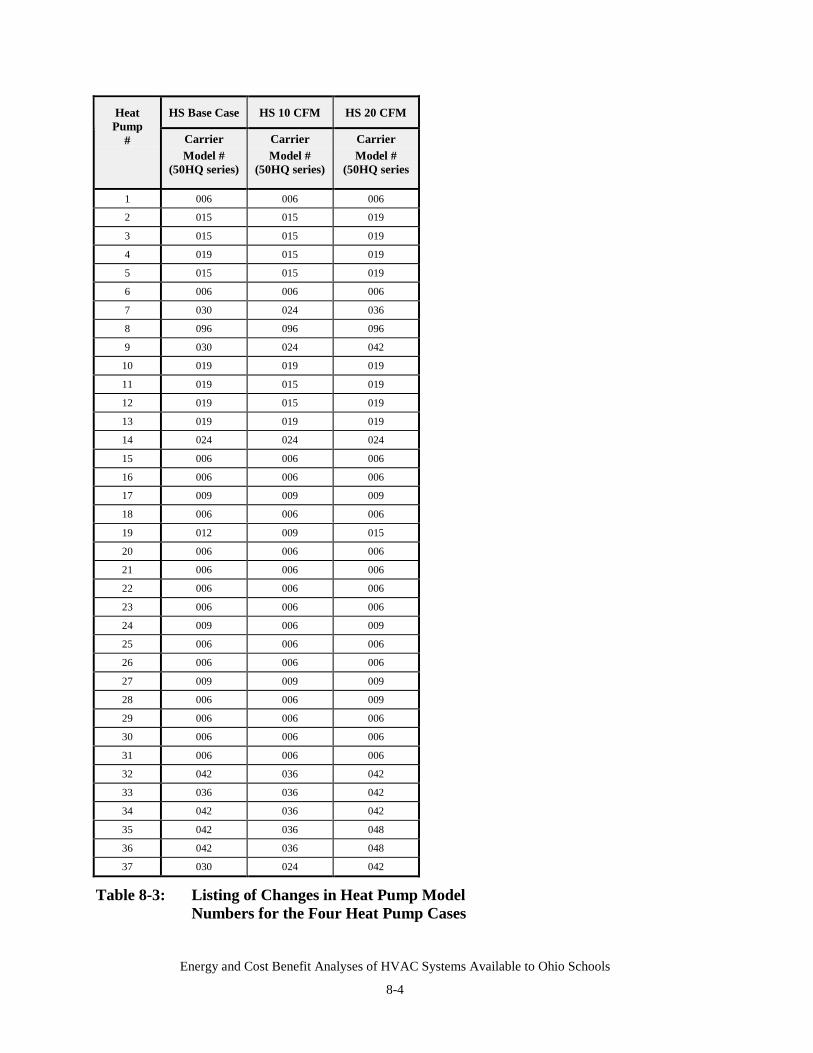
Energy and Cost Benefit Analyses of HVAC Systems Available to Ohio Schools
8-4
HS Base Case HS 10 CFM HS 20 CFMHeatPump
# CarrierModel #
(50HQ series)
CarrierModel #
(50HQ series)
CarrierModel #
(50HQ series
1 006 006 006
2 015 015 019
3 015 015 019
4 019 015 019
5 015 015 019
6 006 006 006
7 030 024 036
8 096 096 096
9 030 024 042
10 019 019 019
11 019 015 019
12 019 015 019
13 019 019 019
14 024 024 024
15 006 006 006
16 006 006 006
17 009 009 009
18 006 006 006
19 012 009 015
20 006 006 006
21 006 006 006
22 006 006 006
23 006 006 006
24 009 006 009
25 006 006 006
26 006 006 006
27 009 009 009
28 006 006 009
29 006 006 006
30 006 006 006
31 006 006 006
32 042 036 042
33 036 036 042
34 042 036 042
35 042 036 048
36 042 036 048
37 030 024 042
Table 8-3: Listing of Changes in Heat Pump ModelNumbers for the Four Heat Pump Cases
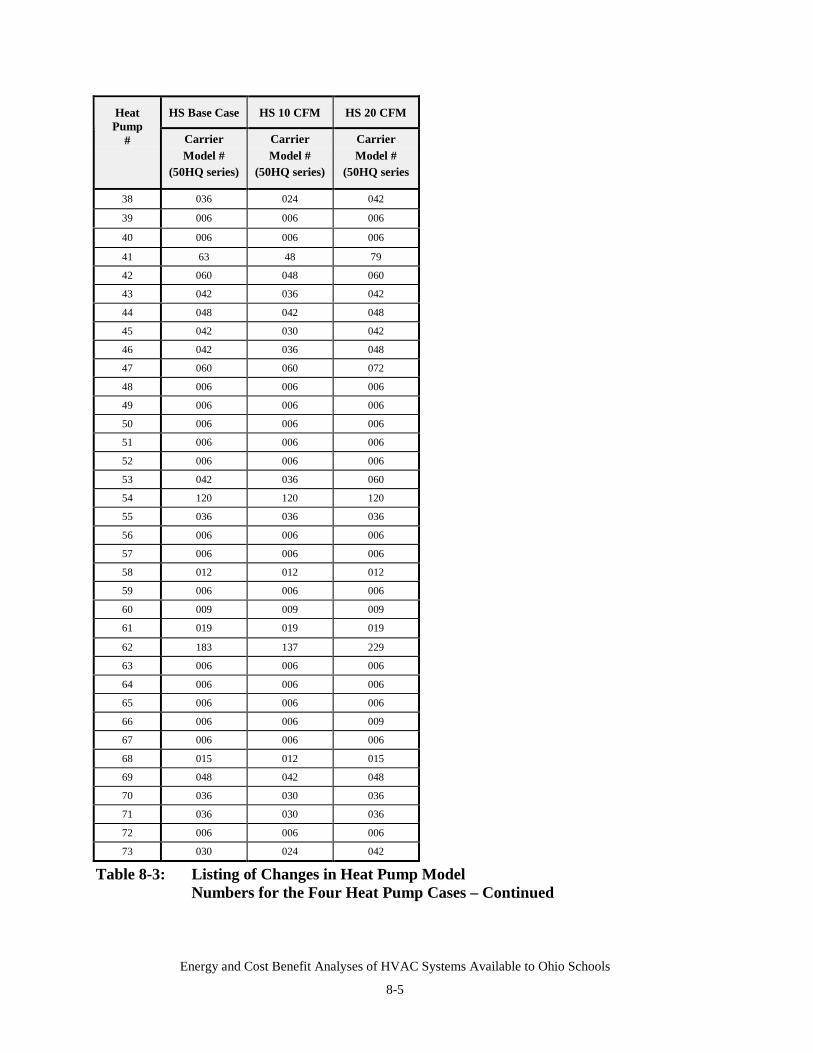
Energy and Cost Benefit Analyses of HVAC Systems Available to Ohio Schools
8-5
HS Base Case HS 10 CFM HS 20 CFMHeatPump
# CarrierModel #
(50HQ series)
CarrierModel #
(50HQ series)
CarrierModel #
(50HQ series
38 036 024 042
39 006 006 006
40 006 006 006
41 63 48 79
42 060 048 060
43 042 036 042
44 048 042 048
45 042 030 042
46 042 036 048
47 060 060 072
48 006 006 006
49 006 006 006
50 006 006 006
51 006 006 006
52 006 006 006
53 042 036 060
54 120 120 120
55 036 036 036
56 006 006 006
57 006 006 006
58 012 012 012
59 006 006 006
60 009 009 009
61 019 019 019
62 183 137 229
63 006 006 006
64 006 006 006
65 006 006 006
66 006 006 009
67 006 006 006
68 015 012 015
69 048 042 048
70 036 030 036
71 036 030 036
72 006 006 006
73 030 024 042
Table 8-3: Listing of Changes in Heat Pump ModelNumbers for the Four Heat Pump Cases – Continued
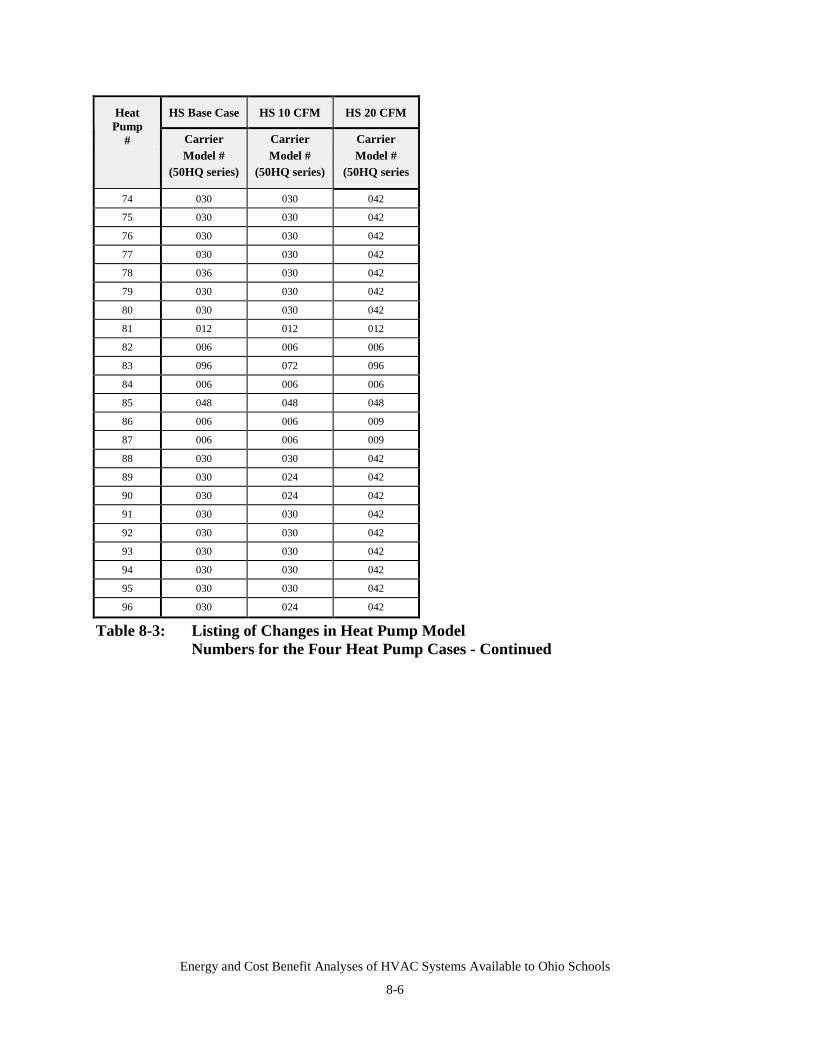
Energy and Cost Benefit Analyses of HVAC Systems Available to Ohio Schools
8-6
HS Base Case HS 10 CFM HS 20 CFMHeatPump
# CarrierModel #
(50HQ series)
CarrierModel #
(50HQ series)
CarrierModel #
(50HQ series
74 030 030 042
75 030 030 042
76 030 030 042
77 030 030 042
78 036 030 042
79 030 030 042
80 030 030 042
81 012 012 012
82 006 006 006
83 096 072 096
84 006 006 006
85 048 048 048
86 006 006 009
87 006 006 009
88 030 030 042
89 030 024 042
90 030 024 042
91 030 030 042
92 030 030 042
93 030 030 042
94 030 030 042
95 030 030 042
96 030 024 042
Table 8-3: Listing of Changes in Heat Pump ModelNumbers for the Four Heat Pump Cases - Continued

Energy and Cost Benefit Analyses of HVAC Systems Available to Ohio Schools
8-7
Columbus - 20 vs 15 CFM Columbus - 10 vs 15 CFMHVACSystemOption Baseline
Energy20 CFMEnergy
IncreasedEnergy Use
BaselineEnergy
10 CFMEnergy
DecreasedEnergy Use
1A1 7,429 8,694 1,265 7,429 6,329 1,101
1A2 7,263 8,518 1,256 7,263 6,167 1,095
1A3 7,384 8,670 1,286 7,384 6,289 1,096
1B1 7,354 8,622 1,268 7,354 6,285 1,069
1B2 7,187 8,446 1,259 7,187 6,123 1,064
1B3 7,309 8,598 1,289 7,309 6,244 1,064
1C1 6,513 7,569 1,057 6,513 5,647 866
1C2 6,346 7,394 1,048 6,346 5,486 860
1C3 6,468 7,546 1,078 6,468 5,607 861
1D1 7,339 8,573 1,235 7,339 6,260 1,079
1D2 7,172 8,398 1,226 7,172 6,098 1,074
1D3 7,293 8,549 1,256 7,293 6,219 1,074
2A1 7,335 8,601 1,266 7,335 6,252 1,084
2A2 7,165 8,421 1,255 7,165 6,087 1,078
2A3 7,292 8,581 1,288 7,292 6,238 1,054
2B1 7,260 8,527 1,267 7,260 6,205 1,055
2B2 7,090 8,346 1,256 7,090 6,041 1,049
2B3 7,217 8,506 1,289 7,217 6,192 1,025
2C1 6,449 7,504 1,055 6,449 5,595 855
2C2 6,279 7,324 1,044 6,279 5,430 849
2C3 6,406 7,484 1,078 6,406 5,581 825
2D1 7,249 8,483 1,235 7,249 6,185 1,064
2D2 7,079 8,303 1,224 7,079 6,020 1,058
2D3 7,206 8,463 1,257 7,206 6,171 1,035
3A1 7,000 8,565 1,565 7,000 5,468 1,532
3B1 6,935 8,480 1,546 6,935 5,428 1,506
3C1 6,389 7,718 1,329 6,389 5,100 1,289
3D1 6,941 8,483 1,542 6,941 5,433 1,508
4A1 7,751 9,206 1,455 7,751 6,508 1,243
4A2 7,585 9,031 1,446 7,585 6,348 1,237
4A3 7,707 9,183 1,476 7,707 6,469 1,238
4B1 7,676 9,212 1,536 7,676 6,452 1,223
4B2 7,510 9,037 1,527 7,510 6,292 1,218
4B3 7,632 9,189 1,557 7,632 6,413 1,219
4C1 6,785 7,963 1,177 6,785 5,787 999
4C2 6,620 7,788 1,168 6,620 5,626 993
4C3 6,742 7,940 1,198 6,742 5,748 994
4D1 7,654 9,072 1,418 7,654 6,434 1,220
4D2 7,489 8,897 1,409 7,489 6,274 1,214
4D3 7,610 9,049 1,439 7,610 6,396 1,215
Table 8-4: Annual Site Energy Savings and Incremental Use for 15 vs 10and 15 vs 20 CFM/Person Ventilation Scenarios (MMBTUH/Year)
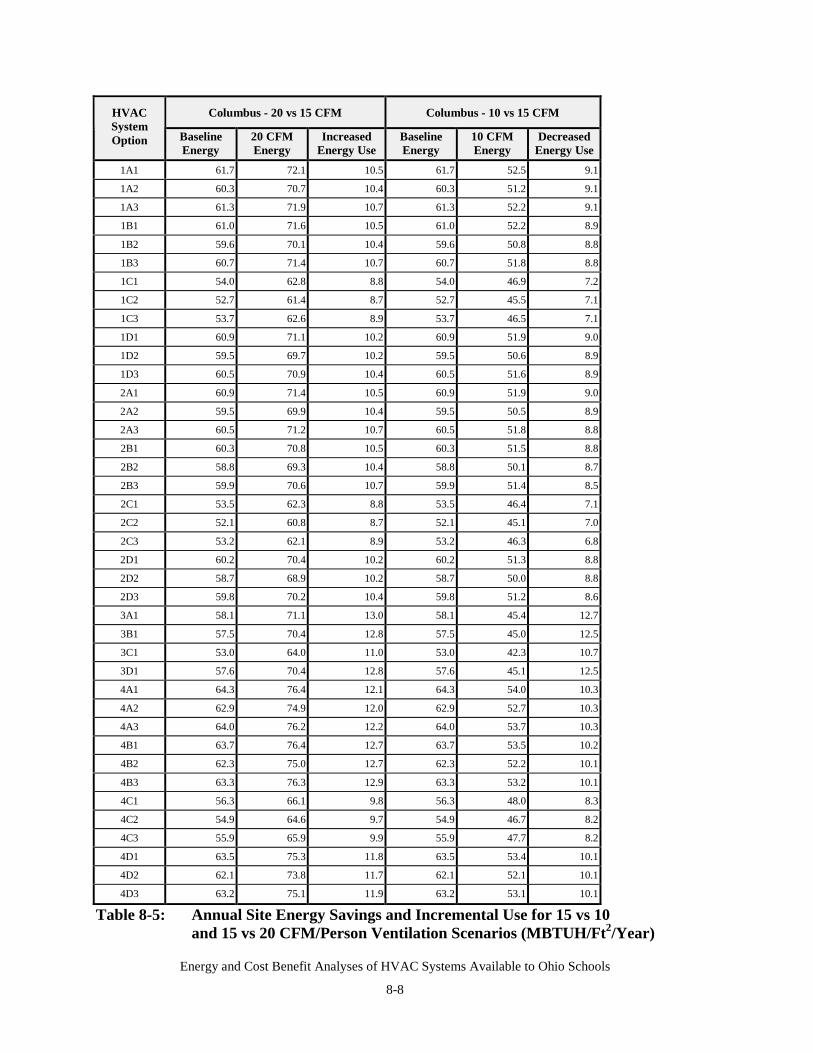
Energy and Cost Benefit Analyses of HVAC Systems Available to Ohio Schools
8-8
Columbus - 20 vs 15 CFM Columbus - 10 vs 15 CFMHVACSystemOption Baseline
Energy20 CFMEnergy
IncreasedEnergy Use
BaselineEnergy
10 CFMEnergy
DecreasedEnergy Use
1A1 61.7 72.1 10.5 61.7 52.5 9.1
1A2 60.3 70.7 10.4 60.3 51.2 9.1
1A3 61.3 71.9 10.7 61.3 52.2 9.1
1B1 61.0 71.6 10.5 61.0 52.2 8.9
1B2 59.6 70.1 10.4 59.6 50.8 8.8
1B3 60.7 71.4 10.7 60.7 51.8 8.8
1C1 54.0 62.8 8.8 54.0 46.9 7.2
1C2 52.7 61.4 8.7 52.7 45.5 7.1
1C3 53.7 62.6 8.9 53.7 46.5 7.1
1D1 60.9 71.1 10.2 60.9 51.9 9.0
1D2 59.5 69.7 10.2 59.5 50.6 8.9
1D3 60.5 70.9 10.4 60.5 51.6 8.9
2A1 60.9 71.4 10.5 60.9 51.9 9.0
2A2 59.5 69.9 10.4 59.5 50.5 8.9
2A3 60.5 71.2 10.7 60.5 51.8 8.8
2B1 60.3 70.8 10.5 60.3 51.5 8.8
2B2 58.8 69.3 10.4 58.8 50.1 8.7
2B3 59.9 70.6 10.7 59.9 51.4 8.5
2C1 53.5 62.3 8.8 53.5 46.4 7.1
2C2 52.1 60.8 8.7 52.1 45.1 7.0
2C3 53.2 62.1 8.9 53.2 46.3 6.8
2D1 60.2 70.4 10.2 60.2 51.3 8.8
2D2 58.7 68.9 10.2 58.7 50.0 8.8
2D3 59.8 70.2 10.4 59.8 51.2 8.6
3A1 58.1 71.1 13.0 58.1 45.4 12.7
3B1 57.5 70.4 12.8 57.5 45.0 12.5
3C1 53.0 64.0 11.0 53.0 42.3 10.7
3D1 57.6 70.4 12.8 57.6 45.1 12.5
4A1 64.3 76.4 12.1 64.3 54.0 10.3
4A2 62.9 74.9 12.0 62.9 52.7 10.3
4A3 64.0 76.2 12.2 64.0 53.7 10.3
4B1 63.7 76.4 12.7 63.7 53.5 10.2
4B2 62.3 75.0 12.7 62.3 52.2 10.1
4B3 63.3 76.3 12.9 63.3 53.2 10.1
4C1 56.3 66.1 9.8 56.3 48.0 8.3
4C2 54.9 64.6 9.7 54.9 46.7 8.2
4C3 55.9 65.9 9.9 55.9 47.7 8.2
4D1 63.5 75.3 11.8 63.5 53.4 10.1
4D2 62.1 73.8 11.7 62.1 52.1 10.1
4D3 63.2 75.1 11.9 63.2 53.1 10.1
Table 8-5: Annual Site Energy Savings and Incremental Use for 15 vs 10and 15 vs 20 CFM/Person Ventilation Scenarios (MBTUH/Ft2/Year)
Energy and Cost Benefit Analyses of HVAC Systems Available to Ohio Schools
8-9
For the 10 CFM/person case, most cooling systems were 15 RT smaller than for the base caseand for the 20 CFM/person case, the cooling systems were generally 30 to 60 RT larger than forthe base case. Similarly, for heating, the 10 CFM/person case, the heating systems were 1,534to 2,500 MBTU smaller than the base case and for the 20 CFM/person case, the heating systemswere 0 to 1,500 larger than for the base case. The heat pump data are Carrier equipmentnumbers; a “006” model number implies a 0.5 RT unit, a “012” model number implies a 1-RTunit. Total tonnage for the heat pump cases is provided later during the first cost discussion.
Annual reduced site energy consumption for the 10 CFM/person cases and increased site energyconsumption for the 20 CFM/person cases are summarized in Table 8-4 (MMBTUH/Year) andTable 8-5 (MBTUH/Ft2/Year). For the 10 CFM/person case, Figure 8-1 summarizes energysavings for the first eight HVAC options (1A1 to 1C2). For the 20 CFM/person case, Figure 8-2summarizes energy costs for the first eight HVAC options (1A1 to 1C2). Plots of all the datacontained in Table 8-4 are contained in Appendix E. In comparing the 10 vs 15 CFM/personcases, annual energy savings ranged a low of 825 million BTUH per year (2C3) to a high of1,532 million BTUH per year (3A1). On a per square foot basis, this ranged from a low of 6.8thousand BTUH per square foot per year (2C3) to a high of 12.7 thousand BTUH per square footper year (3A1). In comparing the 20 vs 15 CFM/person cases, annual site energy increased froma low of 1,048 million BTUH per year (1C2) to a high of 1,565 per year (3A1). On a per squarefoot basis, this ranged from a low of 8.7 thousand BTUH per square foot per year (1C2) to a highof 13.0 BTUH per square foot per year (3A1).
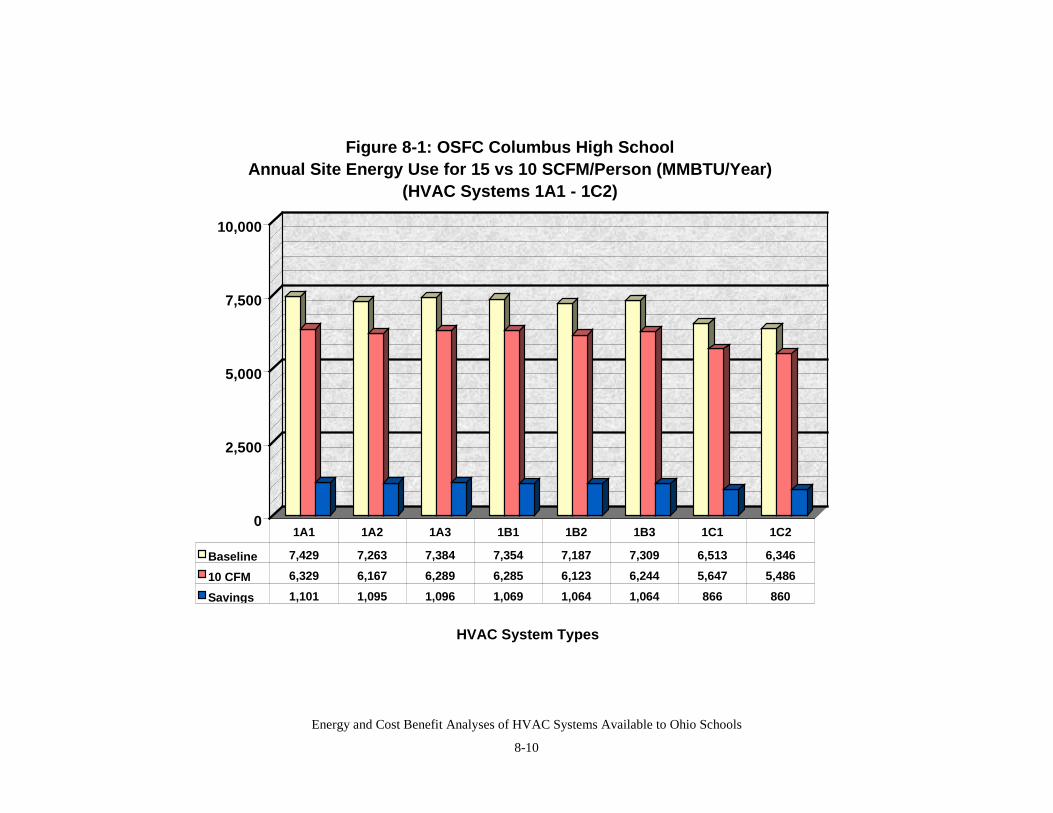
Energy and Cost Benefit Analyses of HVAC Systems Available to Ohio Schools
8-10
0
2,500
5,000
7,500
10,000
HVAC System Types
Figure 8-1: OSFC Columbus High School Annual Site Energy Use for 15 vs 10 SCFM/Person (MMBTU/Year)
(HVAC Systems 1A1 - 1C2)
Baseline 7,429 7,263 7,384 7,354 7,187 7,309 6,513 6,346
10 CFM 6,329 6,167 6,289 6,285 6,123 6,244 5,647 5,486
Savings 1,101 1,095 1,096 1,069 1,064 1,064 866 860
1A1 1A2 1A3 1B1 1B2 1B3 1C1 1C2
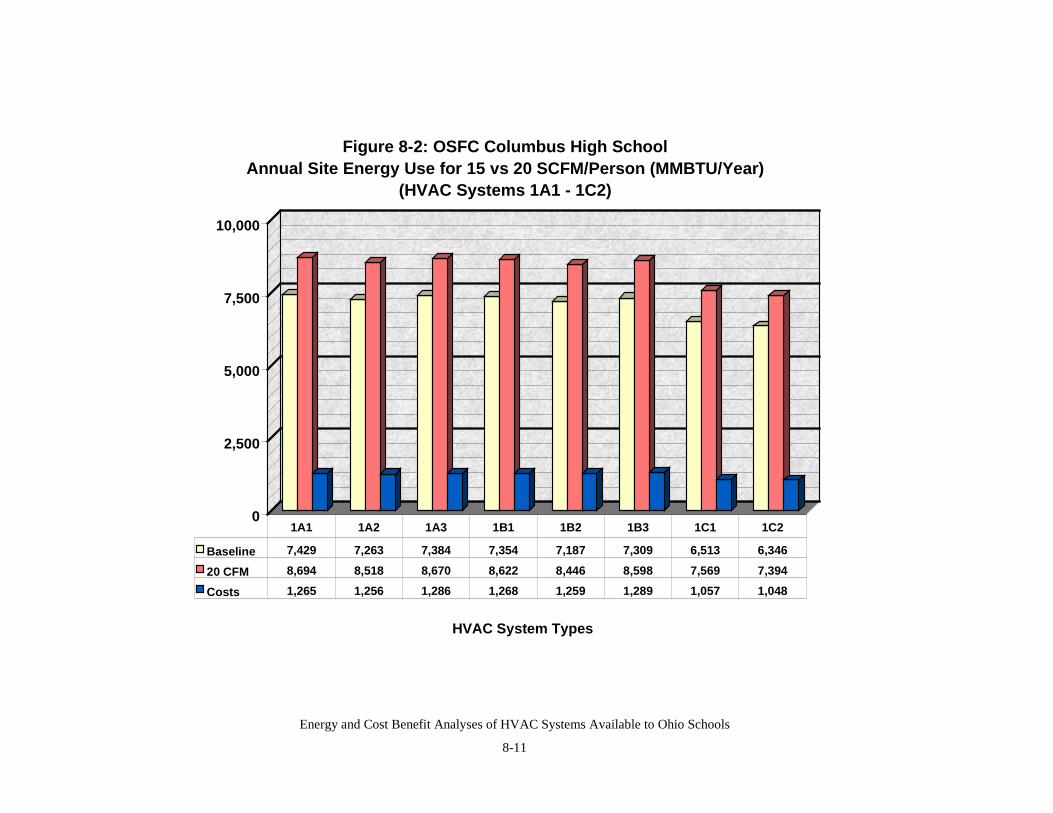
Energy and Cost Benefit Analyses of HVAC Systems Available to Ohio Schools
8-11
0
2,500
5,000
7,500
10,000
HVAC System Types
Figure 8-2: OSFC Columbus High School Annual Site Energy Use for 15 vs 20 SCFM/Person (MMBTU/Year)
(HVAC Systems 1A1 - 1C2)
Baseline 7,429 7,263 7,384 7,354 7,187 7,309 6,513 6,346
20 CFM 8,694 8,518 8,670 8,622 8,446 8,598 7,569 7,394
Costs 1,265 1,256 1,286 1,268 1,259 1,289 1,057 1,048
1A1 1A2 1A3 1B1 1B2 1B3 1C1 1C2
Energy and Cost Benefit Analyses of HVAC Systems Available to Ohio Schools
8-12
Annual energy savings for the 10 CFM/person cases and costs for the 20 CFM/person cases aresummarized in Table 8-6 ($/Year) and Table 8-7 ($/Ft2/Year). For the 10 CFM/person case,Figure 8-3 summarizes energy savings for the first eight HVAC options (1A1 to 1C2). For the20 CFM/person case, Figure 8-4 summarizes energy costs for the first eight HVAC options (1A1to 1C2). Plots of all the data contained in Table 8-6 are contained in Appendix E. In comparingthe 10 vs 15 CFM/person cases, annual energy savings ranged a low of $7,627 per year (2B3) toa high of $55,022 per year (3C1). On a per square foot basis, this ranged from a low of $0.06 persquare foot per year (2B3) to a high of $0.46 per square foot per year (3C1). In comparing the20 vs 15 CFM/person cases, annual energy costs ranged a low of $10,186 per year (1D2) to ahigh of $54,740 per year (3C1). On a per square foot basis, this ranged from a low of $0.08 persquare foot per year (1D2) to a high of $0.46 per square foot per year (3C1).
In all cases, the maximum savings (10 CFM/person cases), or maximum increased (20CFM/person cases) annual energy costs are associated with the all electric HVAC systemoptions. This is primarily related to reduced or increased electric demand charges associatedwith smaller or larger plant equipment requirements tied to the treatment of less or more freshair. In addition, the HVAC system options with water-based chiller plants tended to have theleast amount of savings or lowest increased annual energy costs of all the options evaluated.
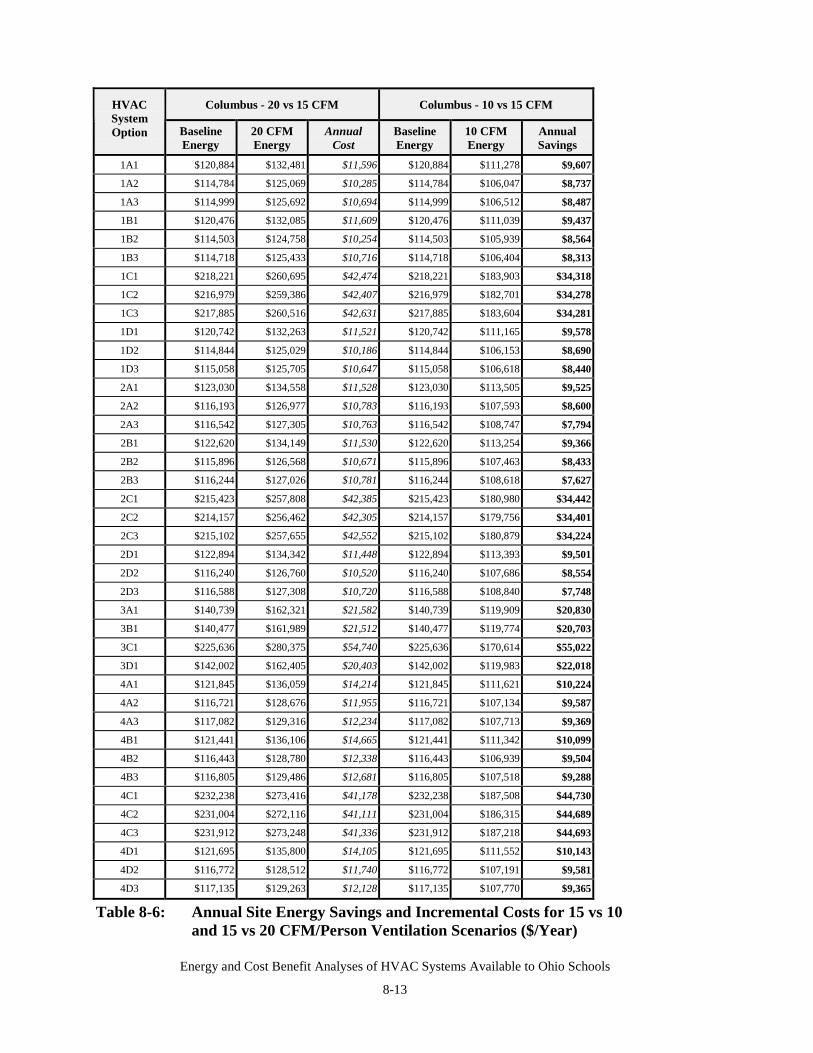
Energy and Cost Benefit Analyses of HVAC Systems Available to Ohio Schools
8-13
Columbus - 20 vs 15 CFM Columbus - 10 vs 15 CFMHVACSystemOption Baseline
Energy20 CFMEnergy
AnnualCost
BaselineEnergy
10 CFMEnergy
AnnualSavings
1A1 $120,884 $132,481 $11,596 $120,884 $111,278 $9,607
1A2 $114,784 $125,069 $10,285 $114,784 $106,047 $8,737
1A3 $114,999 $125,692 $10,694 $114,999 $106,512 $8,487
1B1 $120,476 $132,085 $11,609 $120,476 $111,039 $9,437
1B2 $114,503 $124,758 $10,254 $114,503 $105,939 $8,564
1B3 $114,718 $125,433 $10,716 $114,718 $106,404 $8,313
1C1 $218,221 $260,695 $42,474 $218,221 $183,903 $34,318
1C2 $216,979 $259,386 $42,407 $216,979 $182,701 $34,278
1C3 $217,885 $260,516 $42,631 $217,885 $183,604 $34,281
1D1 $120,742 $132,263 $11,521 $120,742 $111,165 $9,578
1D2 $114,844 $125,029 $10,186 $114,844 $106,153 $8,690
1D3 $115,058 $125,705 $10,647 $115,058 $106,618 $8,440
2A1 $123,030 $134,558 $11,528 $123,030 $113,505 $9,525
2A2 $116,193 $126,977 $10,783 $116,193 $107,593 $8,600
2A3 $116,542 $127,305 $10,763 $116,542 $108,747 $7,794
2B1 $122,620 $134,149 $11,530 $122,620 $113,254 $9,366
2B2 $115,896 $126,568 $10,671 $115,896 $107,463 $8,433
2B3 $116,244 $127,026 $10,781 $116,244 $108,618 $7,627
2C1 $215,423 $257,808 $42,385 $215,423 $180,980 $34,442
2C2 $214,157 $256,462 $42,305 $214,157 $179,756 $34,401
2C3 $215,102 $257,655 $42,552 $215,102 $180,879 $34,224
2D1 $122,894 $134,342 $11,448 $122,894 $113,393 $9,501
2D2 $116,240 $126,760 $10,520 $116,240 $107,686 $8,554
2D3 $116,588 $127,308 $10,720 $116,588 $108,840 $7,748
3A1 $140,739 $162,321 $21,582 $140,739 $119,909 $20,830
3B1 $140,477 $161,989 $21,512 $140,477 $119,774 $20,703
3C1 $225,636 $280,375 $54,740 $225,636 $170,614 $55,022
3D1 $142,002 $162,405 $20,403 $142,002 $119,983 $22,018
4A1 $121,845 $136,059 $14,214 $121,845 $111,621 $10,224
4A2 $116,721 $128,676 $11,955 $116,721 $107,134 $9,587
4A3 $117,082 $129,316 $12,234 $117,082 $107,713 $9,369
4B1 $121,441 $136,106 $14,665 $121,441 $111,342 $10,099
4B2 $116,443 $128,780 $12,338 $116,443 $106,939 $9,504
4B3 $116,805 $129,486 $12,681 $116,805 $107,518 $9,288
4C1 $232,238 $273,416 $41,178 $232,238 $187,508 $44,730
4C2 $231,004 $272,116 $41,111 $231,004 $186,315 $44,689
4C3 $231,912 $273,248 $41,336 $231,912 $187,218 $44,693
4D1 $121,695 $135,800 $14,105 $121,695 $111,552 $10,143
4D2 $116,772 $128,512 $11,740 $116,772 $107,191 $9,581
4D3 $117,135 $129,263 $12,128 $117,135 $107,770 $9,365
Table 8-6: Annual Site Energy Savings and Incremental Costs for 15 vs 10and 15 vs 20 CFM/Person Ventilation Scenarios ($/Year)
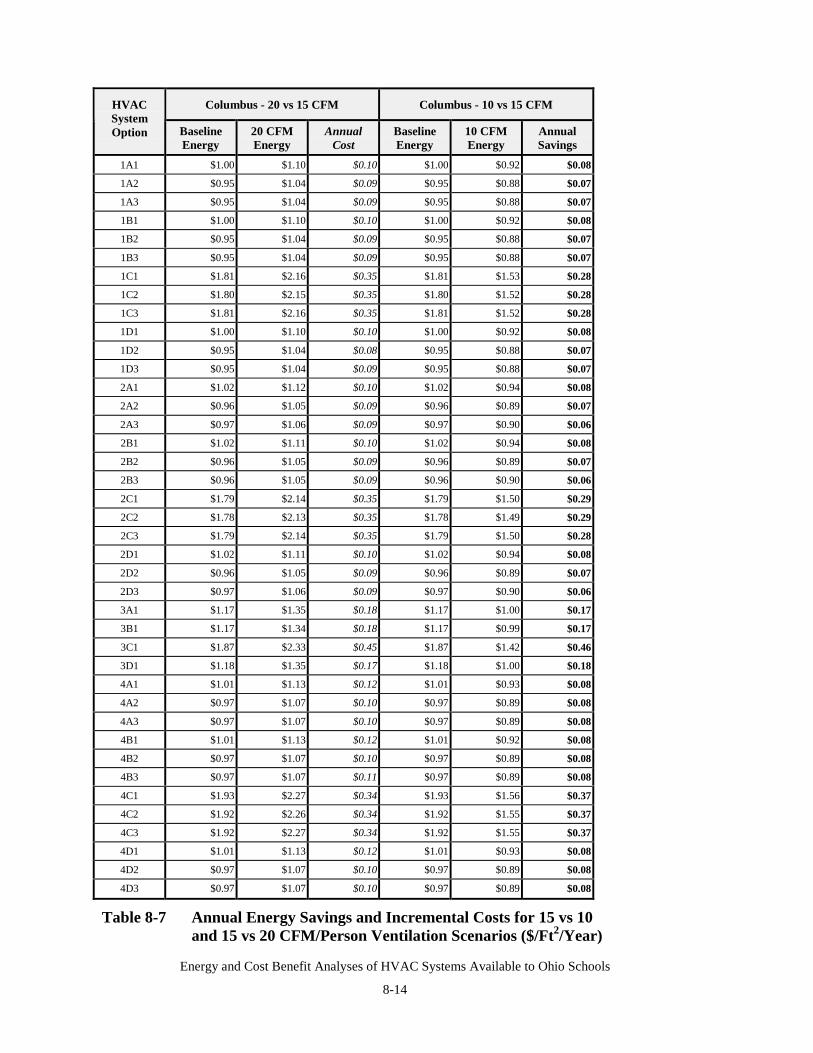
Energy and Cost Benefit Analyses of HVAC Systems Available to Ohio Schools
8-14
Columbus - 20 vs 15 CFM Columbus - 10 vs 15 CFMHVACSystemOption Baseline
Energy20 CFMEnergy
AnnualCost
BaselineEnergy
10 CFMEnergy
AnnualSavings
1A1 $1.00 $1.10 $0.10 $1.00 $0.92 $0.08
1A2 $0.95 $1.04 $0.09 $0.95 $0.88 $0.07
1A3 $0.95 $1.04 $0.09 $0.95 $0.88 $0.07
1B1 $1.00 $1.10 $0.10 $1.00 $0.92 $0.08
1B2 $0.95 $1.04 $0.09 $0.95 $0.88 $0.07
1B3 $0.95 $1.04 $0.09 $0.95 $0.88 $0.07
1C1 $1.81 $2.16 $0.35 $1.81 $1.53 $0.28
1C2 $1.80 $2.15 $0.35 $1.80 $1.52 $0.28
1C3 $1.81 $2.16 $0.35 $1.81 $1.52 $0.28
1D1 $1.00 $1.10 $0.10 $1.00 $0.92 $0.08
1D2 $0.95 $1.04 $0.08 $0.95 $0.88 $0.07
1D3 $0.95 $1.04 $0.09 $0.95 $0.88 $0.07
2A1 $1.02 $1.12 $0.10 $1.02 $0.94 $0.08
2A2 $0.96 $1.05 $0.09 $0.96 $0.89 $0.07
2A3 $0.97 $1.06 $0.09 $0.97 $0.90 $0.06
2B1 $1.02 $1.11 $0.10 $1.02 $0.94 $0.08
2B2 $0.96 $1.05 $0.09 $0.96 $0.89 $0.07
2B3 $0.96 $1.05 $0.09 $0.96 $0.90 $0.06
2C1 $1.79 $2.14 $0.35 $1.79 $1.50 $0.29
2C2 $1.78 $2.13 $0.35 $1.78 $1.49 $0.29
2C3 $1.79 $2.14 $0.35 $1.79 $1.50 $0.28
2D1 $1.02 $1.11 $0.10 $1.02 $0.94 $0.08
2D2 $0.96 $1.05 $0.09 $0.96 $0.89 $0.07
2D3 $0.97 $1.06 $0.09 $0.97 $0.90 $0.06
3A1 $1.17 $1.35 $0.18 $1.17 $1.00 $0.17
3B1 $1.17 $1.34 $0.18 $1.17 $0.99 $0.17
3C1 $1.87 $2.33 $0.45 $1.87 $1.42 $0.46
3D1 $1.18 $1.35 $0.17 $1.18 $1.00 $0.18
4A1 $1.01 $1.13 $0.12 $1.01 $0.93 $0.08
4A2 $0.97 $1.07 $0.10 $0.97 $0.89 $0.08
4A3 $0.97 $1.07 $0.10 $0.97 $0.89 $0.08
4B1 $1.01 $1.13 $0.12 $1.01 $0.92 $0.08
4B2 $0.97 $1.07 $0.10 $0.97 $0.89 $0.08
4B3 $0.97 $1.07 $0.11 $0.97 $0.89 $0.08
4C1 $1.93 $2.27 $0.34 $1.93 $1.56 $0.37
4C2 $1.92 $2.26 $0.34 $1.92 $1.55 $0.37
4C3 $1.92 $2.27 $0.34 $1.92 $1.55 $0.37
4D1 $1.01 $1.13 $0.12 $1.01 $0.93 $0.08
4D2 $0.97 $1.07 $0.10 $0.97 $0.89 $0.08
4D3 $0.97 $1.07 $0.10 $0.97 $0.89 $0.08
Table 8-7 Annual Energy Savings and Incremental Costs for 15 vs 10and 15 vs 20 CFM/Person Ventilation Scenarios ($/Ft2/Year)
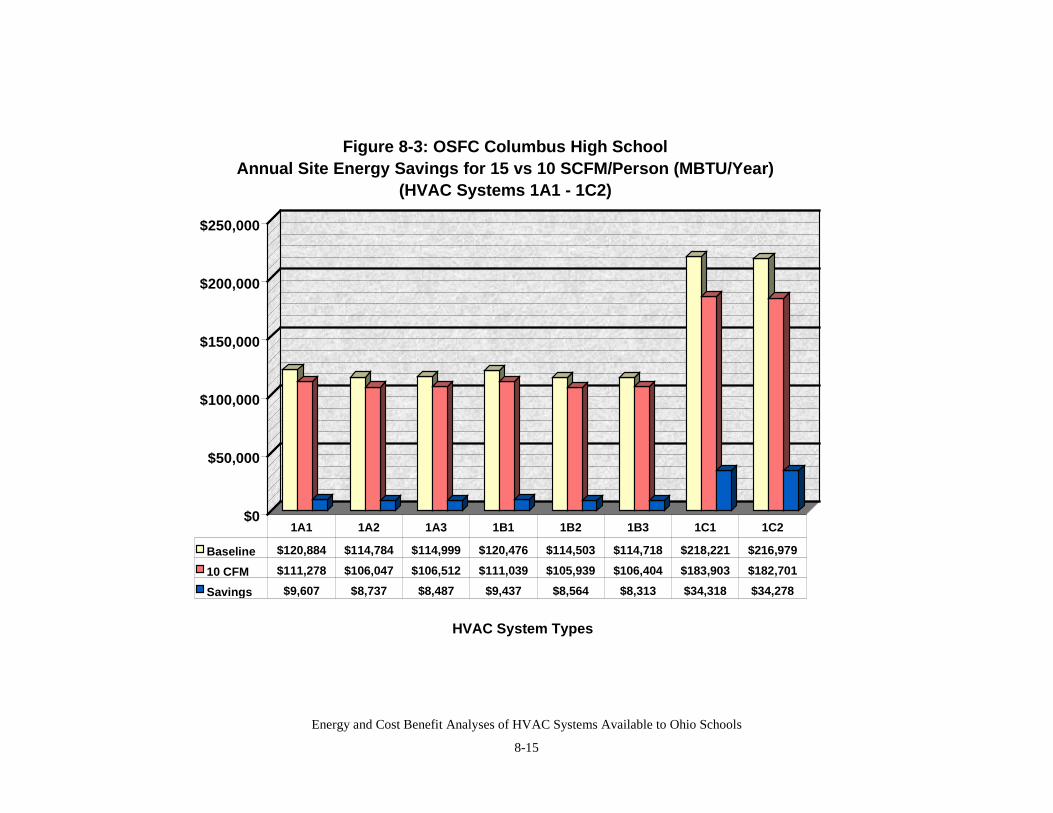
Energy and Cost Benefit Analyses of HVAC Systems Available to Ohio Schools
8-15
$0
$50,000
$100,000
$150,000
$200,000
$250,000
HVAC System Types
Figure 8-3: OSFC Columbus High School Annual Site Energy Savings for 15 vs 10 SCFM/Person (MBTU/Year)
(HVAC Systems 1A1 - 1C2)
Baseline $120,884 $114,784 $114,999 $120,476 $114,503 $114,718 $218,221 $216,979
10 CFM $111,278 $106,047 $106,512 $111,039 $105,939 $106,404 $183,903 $182,701
Savings $9,607 $8,737 $8,487 $9,437 $8,564 $8,313 $34,318 $34,278
1A1 1A2 1A3 1B1 1B2 1B3 1C1 1C2
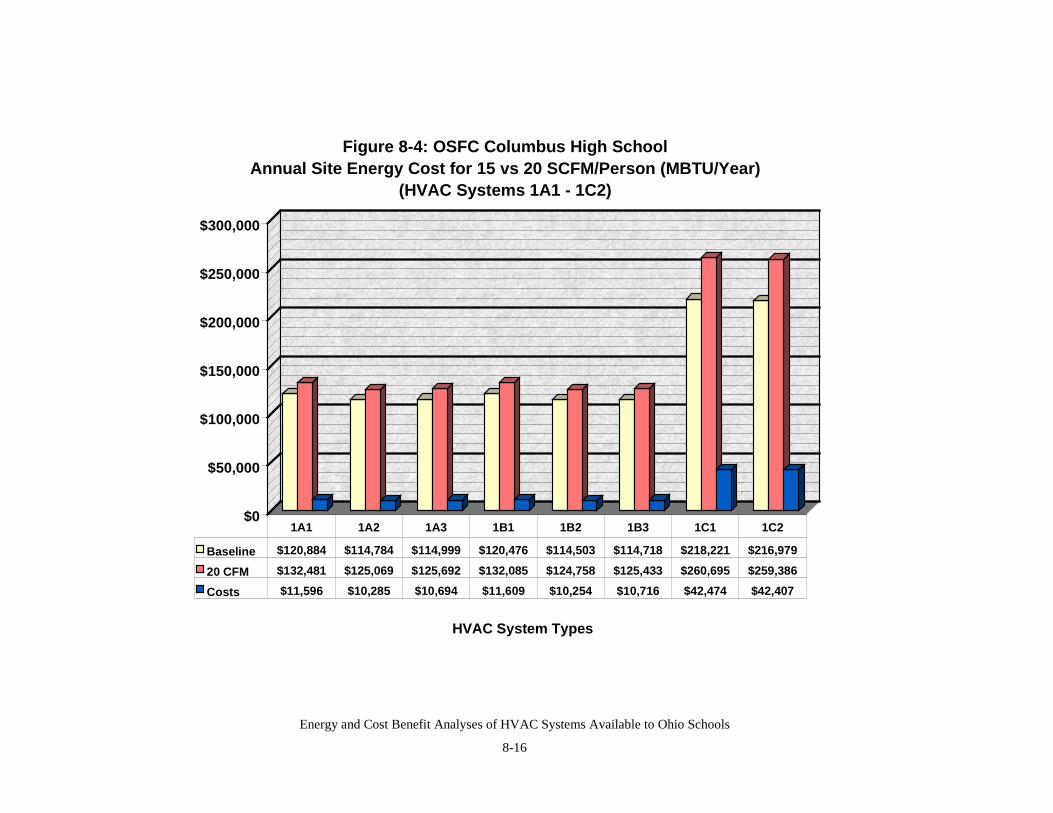
Energy and Cost Benefit Analyses of HVAC Systems Available to Ohio Schools
8-16
$0
$50,000
$100,000
$150,000
$200,000
$250,000
$300,000
HVAC System Types
Figure 8-4: OSFC Columbus High School Annual Site Energy Cost for 15 vs 20 SCFM/Person (MBTU/Year)
(HVAC Systems 1A1 - 1C2)
Baseline $120,884 $114,784 $114,999 $120,476 $114,503 $114,718 $218,221 $216,979
20 CFM $132,481 $125,069 $125,692 $132,085 $124,758 $125,433 $260,695 $259,386
Costs $11,596 $10,285 $10,694 $11,609 $10,254 $10,716 $42,474 $42,407
1A1 1A2 1A3 1B1 1B2 1B3 1C1 1C2
Energy and Cost Benefit Analyses of HVAC Systems Available to Ohio Schools
8-17
Incremental equipment first costs were calculated by subtracting or adding the cost of coolingand heating plant costs from either the 10 CFM/person, or the 20 CFM/person HVAC systemoptions from their equivalent baseline plant costs presented initially in Chapter 3. It wasassumed that ductwork and terminal unit costs would remain constant over the range of sizechanges considered.
Reduced first costs for the 10 CFM/person cases and increased first costs for the 20 CFM/personcases are summarized in Table 8-6. For the 10 CFM/person cases, reduced costs ranged from alow of $21,361 (4C1) to a high of $106,530 (3D1) and for the 20 CFM/person cases, increasedcosts ranged from a low of $13,236 (multiple cases) to a high of $113,496 (3D1). Table 8-7displays this same information on a 1 ft.2/year basis.
Table 8-8 summarizes differential HVAC system option first costs. They were derived fromcooling, heating and heat pump differential costs. Plant first cost differences for the coolingportion of the plant, the heating portion of the plant and the heat pumps are shown in Tables 8-9,8-10 and 8-11 respectively. Note that summary data contained in Table 8-8 includes the RSMeans CostWorks 2000® City Index correction factor for Columbus, Ohio of 0.977 whereas thedata contained in Tables 8-9, 8-10 and 8-11 do not. Thus, to obtain the total differential cost fora given HVAC system option, one must add up the cooling and heating differential costs andthen multiply this total by the city correction factor.
Table 8-11 provides details on the build-up of differential first costs for the cooling portion of thefour heat pump HVAC system options contained in Table 8-8. For all 96 zones, the heat pumpswere sized, costed and compared for the baseline cases, the 10 CFM/person cases and the 20CFM/person cases. Costing included cooling tower costs as indicated at the bottom of the table.The total heat pump plant capacity for the baseline case was 423 RT. For the 10 CFM/personcase, the total capacity dropped to 362 RT whereas for the 20 CFM/person case, the totalcapacity increased to 485 RT.
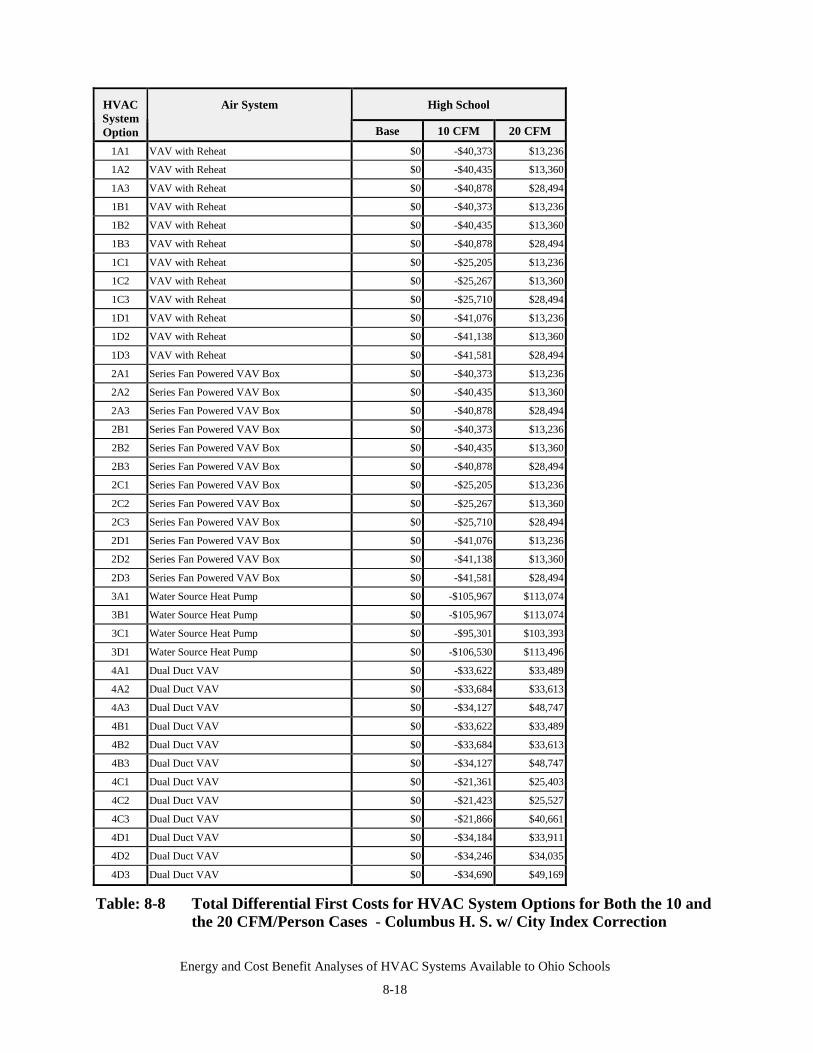
Energy and Cost Benefit Analyses of HVAC Systems Available to Ohio Schools
8-18
High SchoolHVACSystemOption
Air System
Base 10 CFM 20 CFM1A1 VAV with Reheat $0 -$40,373 $13,236
1A2 VAV with Reheat $0 -$40,435 $13,360
1A3 VAV with Reheat $0 -$40,878 $28,494
1B1 VAV with Reheat $0 -$40,373 $13,236
1B2 VAV with Reheat $0 -$40,435 $13,360
1B3 VAV with Reheat $0 -$40,878 $28,494
1C1 VAV with Reheat $0 -$25,205 $13,236
1C2 VAV with Reheat $0 -$25,267 $13,360
1C3 VAV with Reheat $0 -$25,710 $28,494
1D1 VAV with Reheat $0 -$41,076 $13,236
1D2 VAV with Reheat $0 -$41,138 $13,360
1D3 VAV with Reheat $0 -$41,581 $28,494
2A1 Series Fan Powered VAV Box $0 -$40,373 $13,236
2A2 Series Fan Powered VAV Box $0 -$40,435 $13,360
2A3 Series Fan Powered VAV Box $0 -$40,878 $28,494
2B1 Series Fan Powered VAV Box $0 -$40,373 $13,236
2B2 Series Fan Powered VAV Box $0 -$40,435 $13,360
2B3 Series Fan Powered VAV Box $0 -$40,878 $28,494
2C1 Series Fan Powered VAV Box $0 -$25,205 $13,236
2C2 Series Fan Powered VAV Box $0 -$25,267 $13,360
2C3 Series Fan Powered VAV Box $0 -$25,710 $28,494
2D1 Series Fan Powered VAV Box $0 -$41,076 $13,236
2D2 Series Fan Powered VAV Box $0 -$41,138 $13,360
2D3 Series Fan Powered VAV Box $0 -$41,581 $28,494
3A1 Water Source Heat Pump $0 -$105,967 $113,074
3B1 Water Source Heat Pump $0 -$105,967 $113,074
3C1 Water Source Heat Pump $0 -$95,301 $103,393
3D1 Water Source Heat Pump $0 -$106,530 $113,496
4A1 Dual Duct VAV $0 -$33,622 $33,489
4A2 Dual Duct VAV $0 -$33,684 $33,613
4A3 Dual Duct VAV $0 -$34,127 $48,747
4B1 Dual Duct VAV $0 -$33,622 $33,489
4B2 Dual Duct VAV $0 -$33,684 $33,613
4B3 Dual Duct VAV $0 -$34,127 $48,747
4C1 Dual Duct VAV $0 -$21,361 $25,403
4C2 Dual Duct VAV $0 -$21,423 $25,527
4C3 Dual Duct VAV $0 -$21,866 $40,661
4D1 Dual Duct VAV $0 -$34,184 $33,911
4D2 Dual Duct VAV $0 -$34,246 $34,035
4D3 Dual Duct VAV $0 -$34,690 $49,169
Table: 8-8 Total Differential First Costs for HVAC System Options for Both the 10 andthe 20 CFM/Person Cases - Columbus H. S. w/ City Index Correction
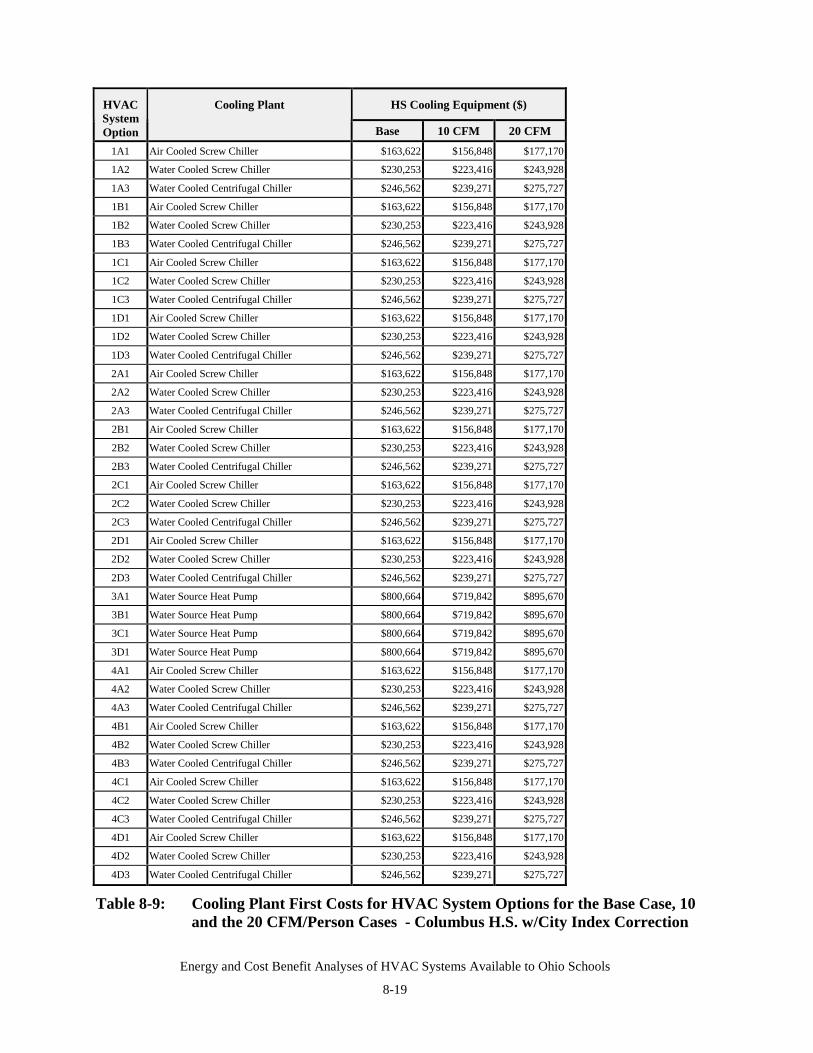
Energy and Cost Benefit Analyses of HVAC Systems Available to Ohio Schools
8-19
HS Cooling Equipment ($)HVACSystemOption
Cooling Plant
Base 10 CFM 20 CFM1A1 Air Cooled Screw Chiller $163,622 $156,848 $177,170
1A2 Water Cooled Screw Chiller $230,253 $223,416 $243,928
1A3 Water Cooled Centrifugal Chiller $246,562 $239,271 $275,727
1B1 Air Cooled Screw Chiller $163,622 $156,848 $177,170
1B2 Water Cooled Screw Chiller $230,253 $223,416 $243,928
1B3 Water Cooled Centrifugal Chiller $246,562 $239,271 $275,727
1C1 Air Cooled Screw Chiller $163,622 $156,848 $177,170
1C2 Water Cooled Screw Chiller $230,253 $223,416 $243,928
1C3 Water Cooled Centrifugal Chiller $246,562 $239,271 $275,727
1D1 Air Cooled Screw Chiller $163,622 $156,848 $177,170
1D2 Water Cooled Screw Chiller $230,253 $223,416 $243,928
1D3 Water Cooled Centrifugal Chiller $246,562 $239,271 $275,727
2A1 Air Cooled Screw Chiller $163,622 $156,848 $177,170
2A2 Water Cooled Screw Chiller $230,253 $223,416 $243,928
2A3 Water Cooled Centrifugal Chiller $246,562 $239,271 $275,727
2B1 Air Cooled Screw Chiller $163,622 $156,848 $177,170
2B2 Water Cooled Screw Chiller $230,253 $223,416 $243,928
2B3 Water Cooled Centrifugal Chiller $246,562 $239,271 $275,727
2C1 Air Cooled Screw Chiller $163,622 $156,848 $177,170
2C2 Water Cooled Screw Chiller $230,253 $223,416 $243,928
2C3 Water Cooled Centrifugal Chiller $246,562 $239,271 $275,727
2D1 Air Cooled Screw Chiller $163,622 $156,848 $177,170
2D2 Water Cooled Screw Chiller $230,253 $223,416 $243,928
2D3 Water Cooled Centrifugal Chiller $246,562 $239,271 $275,727
3A1 Water Source Heat Pump $800,664 $719,842 $895,670
3B1 Water Source Heat Pump $800,664 $719,842 $895,670
3C1 Water Source Heat Pump $800,664 $719,842 $895,670
3D1 Water Source Heat Pump $800,664 $719,842 $895,670
4A1 Air Cooled Screw Chiller $163,622 $156,848 $177,170
4A2 Water Cooled Screw Chiller $230,253 $223,416 $243,928
4A3 Water Cooled Centrifugal Chiller $246,562 $239,271 $275,727
4B1 Air Cooled Screw Chiller $163,622 $156,848 $177,170
4B2 Water Cooled Screw Chiller $230,253 $223,416 $243,928
4B3 Water Cooled Centrifugal Chiller $246,562 $239,271 $275,727
4C1 Air Cooled Screw Chiller $163,622 $156,848 $177,170
4C2 Water Cooled Screw Chiller $230,253 $223,416 $243,928
4C3 Water Cooled Centrifugal Chiller $246,562 $239,271 $275,727
4D1 Air Cooled Screw Chiller $163,622 $156,848 $177,170
4D2 Water Cooled Screw Chiller $230,253 $223,416 $243,928
4D3 Water Cooled Centrifugal Chiller $246,562 $239,271 $275,727
Table 8-9: Cooling Plant First Costs for HVAC System Options for the Base Case, 10and the 20 CFM/Person Cases - Columbus H.S. w/City Index Correction
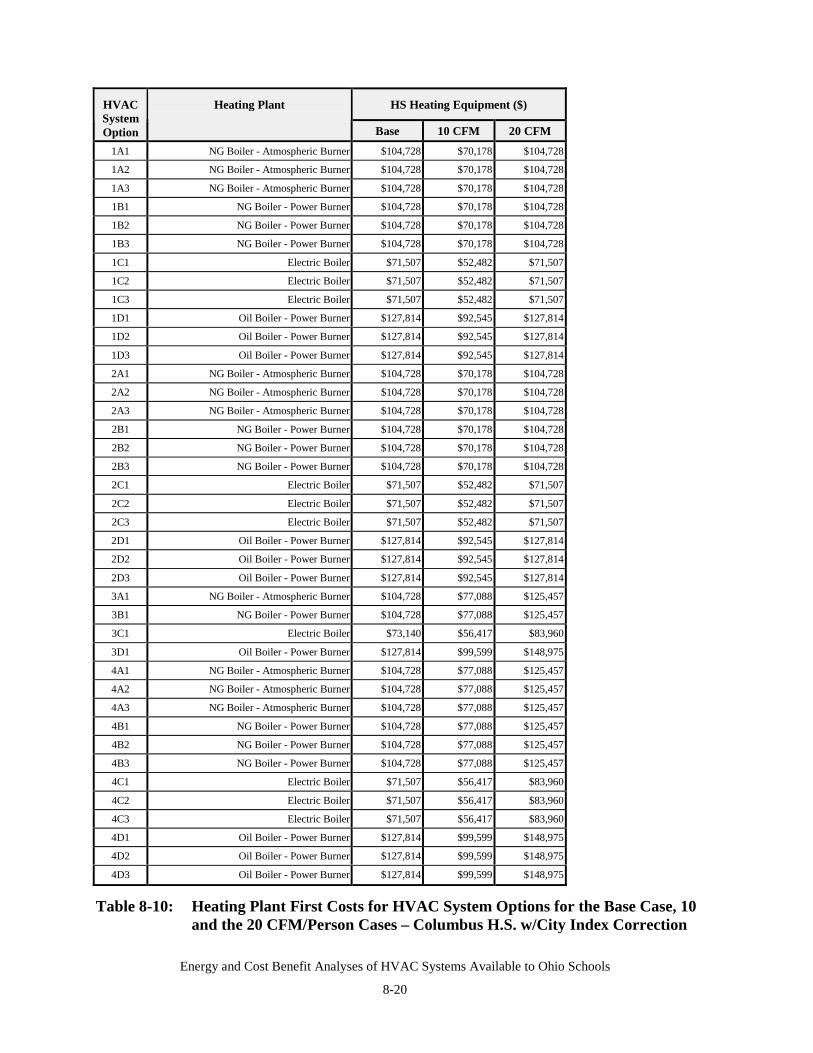
Energy and Cost Benefit Analyses of HVAC Systems Available to Ohio Schools
8-20
HS Heating Equipment ($)HVACSystemOption
Heating Plant
Base 10 CFM 20 CFM1A1 NG Boiler - Atmospheric Burner $104,728 $70,178 $104,728
1A2 NG Boiler - Atmospheric Burner $104,728 $70,178 $104,728
1A3 NG Boiler - Atmospheric Burner $104,728 $70,178 $104,728
1B1 NG Boiler - Power Burner $104,728 $70,178 $104,728
1B2 NG Boiler - Power Burner $104,728 $70,178 $104,728
1B3 NG Boiler - Power Burner $104,728 $70,178 $104,728
1C1 Electric Boiler $71,507 $52,482 $71,507
1C2 Electric Boiler $71,507 $52,482 $71,507
1C3 Electric Boiler $71,507 $52,482 $71,507
1D1 Oil Boiler - Power Burner $127,814 $92,545 $127,814
1D2 Oil Boiler - Power Burner $127,814 $92,545 $127,814
1D3 Oil Boiler - Power Burner $127,814 $92,545 $127,814
2A1 NG Boiler - Atmospheric Burner $104,728 $70,178 $104,728
2A2 NG Boiler - Atmospheric Burner $104,728 $70,178 $104,728
2A3 NG Boiler - Atmospheric Burner $104,728 $70,178 $104,728
2B1 NG Boiler - Power Burner $104,728 $70,178 $104,728
2B2 NG Boiler - Power Burner $104,728 $70,178 $104,728
2B3 NG Boiler - Power Burner $104,728 $70,178 $104,728
2C1 Electric Boiler $71,507 $52,482 $71,507
2C2 Electric Boiler $71,507 $52,482 $71,507
2C3 Electric Boiler $71,507 $52,482 $71,507
2D1 Oil Boiler - Power Burner $127,814 $92,545 $127,814
2D2 Oil Boiler - Power Burner $127,814 $92,545 $127,814
2D3 Oil Boiler - Power Burner $127,814 $92,545 $127,814
3A1 NG Boiler - Atmospheric Burner $104,728 $77,088 $125,457
3B1 NG Boiler - Power Burner $104,728 $77,088 $125,457
3C1 Electric Boiler $73,140 $56,417 $83,960
3D1 Oil Boiler - Power Burner $127,814 $99,599 $148,975
4A1 NG Boiler - Atmospheric Burner $104,728 $77,088 $125,457
4A2 NG Boiler - Atmospheric Burner $104,728 $77,088 $125,457
4A3 NG Boiler - Atmospheric Burner $104,728 $77,088 $125,457
4B1 NG Boiler - Power Burner $104,728 $77,088 $125,457
4B2 NG Boiler - Power Burner $104,728 $77,088 $125,457
4B3 NG Boiler - Power Burner $104,728 $77,088 $125,457
4C1 Electric Boiler $71,507 $56,417 $83,960
4C2 Electric Boiler $71,507 $56,417 $83,960
4C3 Electric Boiler $71,507 $56,417 $83,960
4D1 Oil Boiler - Power Burner $127,814 $99,599 $148,975
4D2 Oil Boiler - Power Burner $127,814 $99,599 $148,975
4D3 Oil Boiler - Power Burner $127,814 $99,599 $148,975
Table 8-10: Heating Plant First Costs for HVAC System Options for the Base Case, 10and the 20 CFM/Person Cases – Columbus H.S. w/City Index Correction
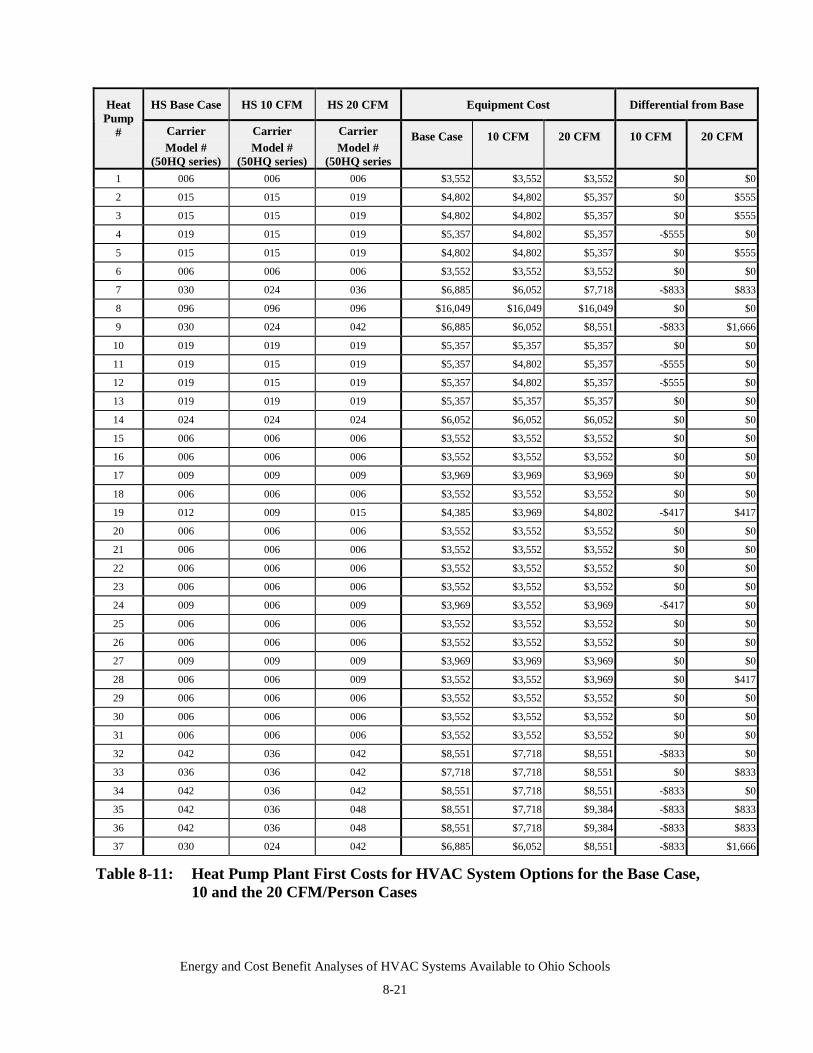
Energy and Cost Benefit Analyses of HVAC Systems Available to Ohio Schools
8-21
HS Base Case HS 10 CFM HS 20 CFM Equipment Cost Differential from BaseHeatPump
# CarrierModel #
(50HQ series)
CarrierModel #
(50HQ series)
CarrierModel #
(50HQ series
Base Case 10 CFM 20 CFM 10 CFM 20 CFM
1 006 006 006 $3,552 $3,552 $3,552 $0 $0
2 015 015 019 $4,802 $4,802 $5,357 $0 $555
3 015 015 019 $4,802 $4,802 $5,357 $0 $555
4 019 015 019 $5,357 $4,802 $5,357 -$555 $0
5 015 015 019 $4,802 $4,802 $5,357 $0 $555
6 006 006 006 $3,552 $3,552 $3,552 $0 $0
7 030 024 036 $6,885 $6,052 $7,718 -$833 $833
8 096 096 096 $16,049 $16,049 $16,049 $0 $0
9 030 024 042 $6,885 $6,052 $8,551 -$833 $1,666
10 019 019 019 $5,357 $5,357 $5,357 $0 $0
11 019 015 019 $5,357 $4,802 $5,357 -$555 $0
12 019 015 019 $5,357 $4,802 $5,357 -$555 $0
13 019 019 019 $5,357 $5,357 $5,357 $0 $0
14 024 024 024 $6,052 $6,052 $6,052 $0 $0
15 006 006 006 $3,552 $3,552 $3,552 $0 $0
16 006 006 006 $3,552 $3,552 $3,552 $0 $0
17 009 009 009 $3,969 $3,969 $3,969 $0 $0
18 006 006 006 $3,552 $3,552 $3,552 $0 $0
19 012 009 015 $4,385 $3,969 $4,802 -$417 $417
20 006 006 006 $3,552 $3,552 $3,552 $0 $0
21 006 006 006 $3,552 $3,552 $3,552 $0 $0
22 006 006 006 $3,552 $3,552 $3,552 $0 $0
23 006 006 006 $3,552 $3,552 $3,552 $0 $0
24 009 006 009 $3,969 $3,552 $3,969 -$417 $0
25 006 006 006 $3,552 $3,552 $3,552 $0 $0
26 006 006 006 $3,552 $3,552 $3,552 $0 $0
27 009 009 009 $3,969 $3,969 $3,969 $0 $0
28 006 006 009 $3,552 $3,552 $3,969 $0 $417
29 006 006 006 $3,552 $3,552 $3,552 $0 $0
30 006 006 006 $3,552 $3,552 $3,552 $0 $0
31 006 006 006 $3,552 $3,552 $3,552 $0 $0
32 042 036 042 $8,551 $7,718 $8,551 -$833 $0
33 036 036 042 $7,718 $7,718 $8,551 $0 $833
34 042 036 042 $8,551 $7,718 $8,551 -$833 $0
35 042 036 048 $8,551 $7,718 $9,384 -$833 $833
36 042 036 048 $8,551 $7,718 $9,384 -$833 $833
37 030 024 042 $6,885 $6,052 $8,551 -$833 $1,666
Table 8-11: Heat Pump Plant First Costs for HVAC System Options for the Base Case,10 and the 20 CFM/Person Cases
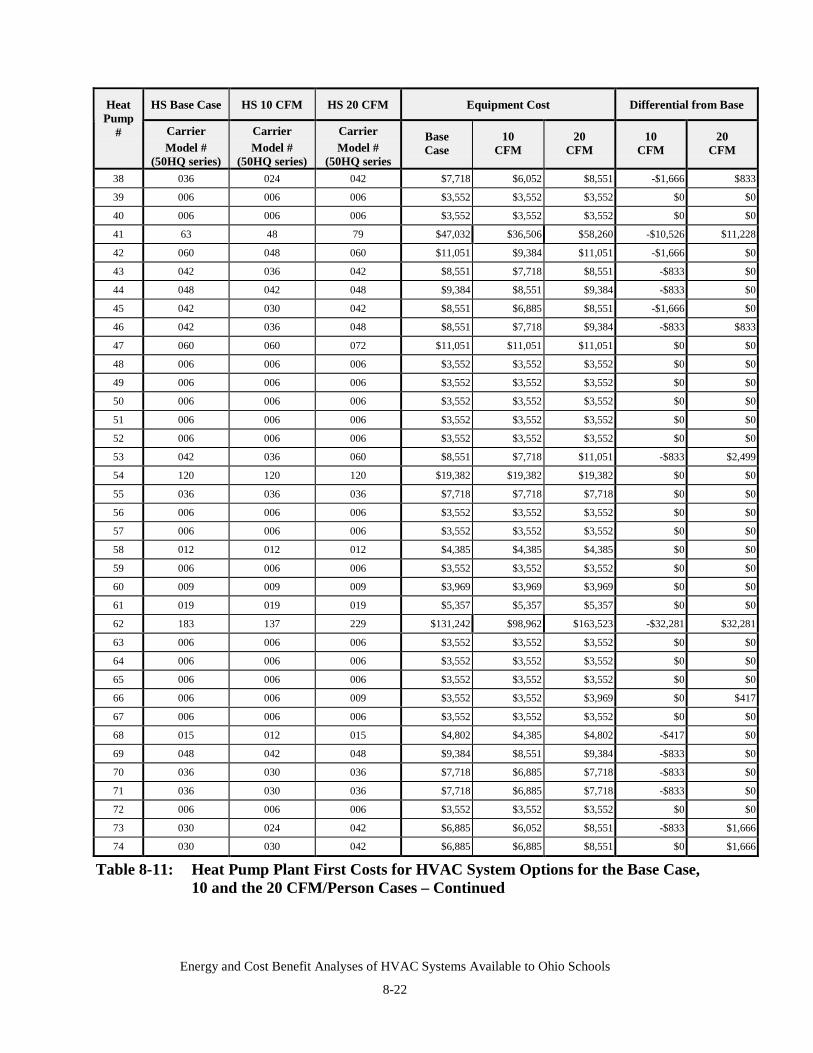
Energy and Cost Benefit Analyses of HVAC Systems Available to Ohio Schools
8-22
HS Base Case HS 10 CFM HS 20 CFM Equipment Cost Differential from BaseHeatPump
# CarrierModel #
(50HQ series)
CarrierModel #
(50HQ series)
CarrierModel #
(50HQ series
BaseCase
10CFM
20CFM
10CFM
20CFM
38 036 024 042 $7,718 $6,052 $8,551 -$1,666 $833
39 006 006 006 $3,552 $3,552 $3,552 $0 $0
40 006 006 006 $3,552 $3,552 $3,552 $0 $0
41 63 48 79 $47,032 $36,506 $58,260 -$10,526 $11,228
42 060 048 060 $11,051 $9,384 $11,051 -$1,666 $0
43 042 036 042 $8,551 $7,718 $8,551 -$833 $0
44 048 042 048 $9,384 $8,551 $9,384 -$833 $0
45 042 030 042 $8,551 $6,885 $8,551 -$1,666 $0
46 042 036 048 $8,551 $7,718 $9,384 -$833 $833
47 060 060 072 $11,051 $11,051 $11,051 $0 $0
48 006 006 006 $3,552 $3,552 $3,552 $0 $0
49 006 006 006 $3,552 $3,552 $3,552 $0 $0
50 006 006 006 $3,552 $3,552 $3,552 $0 $0
51 006 006 006 $3,552 $3,552 $3,552 $0 $0
52 006 006 006 $3,552 $3,552 $3,552 $0 $0
53 042 036 060 $8,551 $7,718 $11,051 -$833 $2,499
54 120 120 120 $19,382 $19,382 $19,382 $0 $0
55 036 036 036 $7,718 $7,718 $7,718 $0 $0
56 006 006 006 $3,552 $3,552 $3,552 $0 $0
57 006 006 006 $3,552 $3,552 $3,552 $0 $0
58 012 012 012 $4,385 $4,385 $4,385 $0 $0
59 006 006 006 $3,552 $3,552 $3,552 $0 $0
60 009 009 009 $3,969 $3,969 $3,969 $0 $0
61 019 019 019 $5,357 $5,357 $5,357 $0 $0
62 183 137 229 $131,242 $98,962 $163,523 -$32,281 $32,281
63 006 006 006 $3,552 $3,552 $3,552 $0 $0
64 006 006 006 $3,552 $3,552 $3,552 $0 $0
65 006 006 006 $3,552 $3,552 $3,552 $0 $0
66 006 006 009 $3,552 $3,552 $3,969 $0 $417
67 006 006 006 $3,552 $3,552 $3,552 $0 $0
68 015 012 015 $4,802 $4,385 $4,802 -$417 $0
69 048 042 048 $9,384 $8,551 $9,384 -$833 $0
70 036 030 036 $7,718 $6,885 $7,718 -$833 $0
71 036 030 036 $7,718 $6,885 $7,718 -$833 $0
72 006 006 006 $3,552 $3,552 $3,552 $0 $0
73 030 024 042 $6,885 $6,052 $8,551 -$833 $1,666
74 030 030 042 $6,885 $6,885 $8,551 $0 $1,666
Table 8-11: Heat Pump Plant First Costs for HVAC System Options for the Base Case,10 and the 20 CFM/Person Cases – Continued
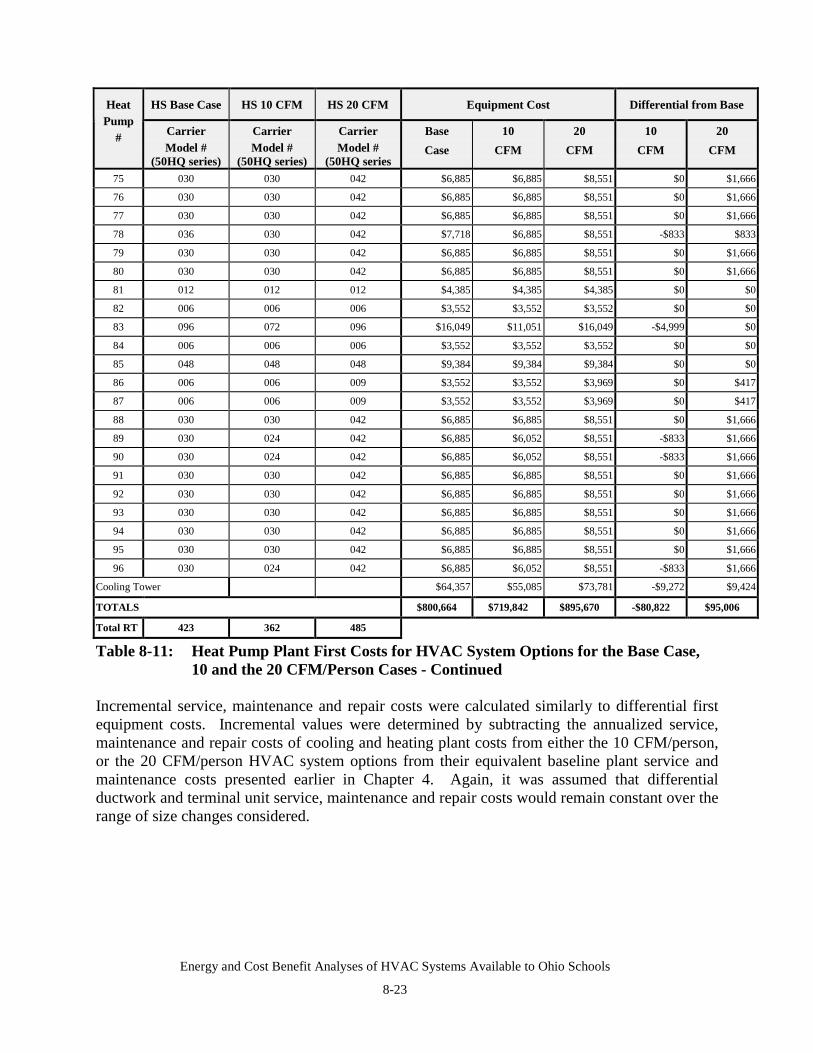
Energy and Cost Benefit Analyses of HVAC Systems Available to Ohio Schools
8-23
HS Base Case HS 10 CFM HS 20 CFM Equipment Cost Differential from BaseHeatPump
# CarrierModel #
(50HQ series)
CarrierModel #
(50HQ series)
CarrierModel #
(50HQ series
BaseCase
10CFM
20CFM
10CFM
20CFM
75 030 030 042 $6,885 $6,885 $8,551 $0 $1,666
76 030 030 042 $6,885 $6,885 $8,551 $0 $1,666
77 030 030 042 $6,885 $6,885 $8,551 $0 $1,666
78 036 030 042 $7,718 $6,885 $8,551 -$833 $833
79 030 030 042 $6,885 $6,885 $8,551 $0 $1,666
80 030 030 042 $6,885 $6,885 $8,551 $0 $1,666
81 012 012 012 $4,385 $4,385 $4,385 $0 $0
82 006 006 006 $3,552 $3,552 $3,552 $0 $0
83 096 072 096 $16,049 $11,051 $16,049 -$4,999 $0
84 006 006 006 $3,552 $3,552 $3,552 $0 $0
85 048 048 048 $9,384 $9,384 $9,384 $0 $0
86 006 006 009 $3,552 $3,552 $3,969 $0 $417
87 006 006 009 $3,552 $3,552 $3,969 $0 $417
88 030 030 042 $6,885 $6,885 $8,551 $0 $1,666
89 030 024 042 $6,885 $6,052 $8,551 -$833 $1,666
90 030 024 042 $6,885 $6,052 $8,551 -$833 $1,666
91 030 030 042 $6,885 $6,885 $8,551 $0 $1,666
92 030 030 042 $6,885 $6,885 $8,551 $0 $1,666
93 030 030 042 $6,885 $6,885 $8,551 $0 $1,666
94 030 030 042 $6,885 $6,885 $8,551 $0 $1,666
95 030 030 042 $6,885 $6,885 $8,551 $0 $1,666
96 030 024 042 $6,885 $6,052 $8,551 -$833 $1,666
Cooling Tower $64,357 $55,085 $73,781 -$9,272 $9,424
TOTALS $800,664 $719,842 $895,670 -$80,822 $95,006
Total RT 423 362 485
Table 8-11: Heat Pump Plant First Costs for HVAC System Options for the Base Case,10 and the 20 CFM/Person Cases - Continued
Incremental service, maintenance and repair costs were calculated similarly to differential firstequipment costs. Incremental values were determined by subtracting the annualized service,maintenance and repair costs of cooling and heating plant costs from either the 10 CFM/person,or the 20 CFM/person HVAC system options from their equivalent baseline plant service andmaintenance costs presented earlier in Chapter 4. Again, it was assumed that differentialductwork and terminal unit service, maintenance and repair costs would remain constant over therange of size changes considered.
Energy and Cost Benefit Analyses of HVAC Systems Available to Ohio Schools
8-24
Reduced annual service, maintenance and repair costs for the 10 CFM/person cases andincreased annual service, maintenance and repair costs for the 20 CFM/person cases aresummarized in Table 8-12. For the 10 CFM/person cases, reduced annual costs ranged from alow of $1,215 (4C2) to a high of $9,519 (3A1 and 3B1) and for the 20 CFM/person cases,increased annual costs ranged from a low of $779 (multiple cases) to a high of $10,093 (3A1 and3B1).
Table 8-12 was derived from cooling, heating and heat pump differential annual/servicemaintenance and repair costs. Service, maintenance and repair cost differences for the coolingportion of the plant, the heating portion of the plant and the heat pumps are shown in Tables 8-13, 8-14 and 8-15 respectively. Note that summary data contained in Table 8-12 includes the RSMeans CostWorks 2000® City Index correction factor for Columbus, Ohio of 0.977 whereas thedata contained in Tables 8-13, 8-14 and 8-15 do not.
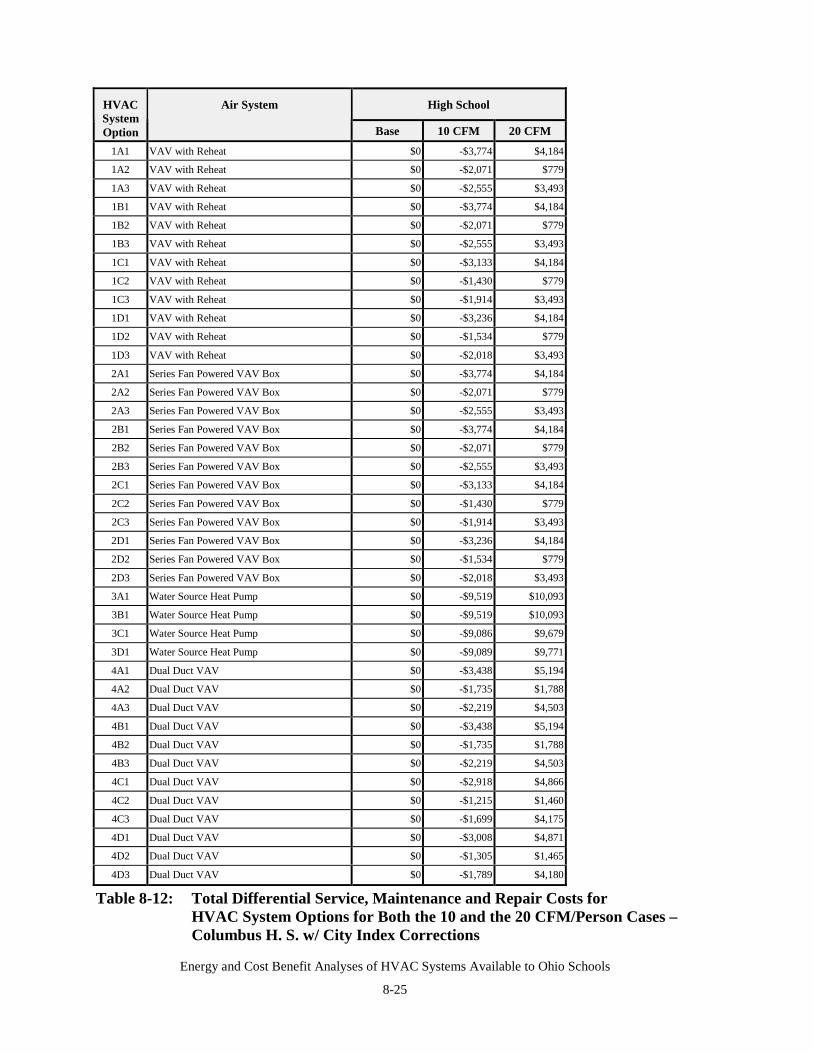
Energy and Cost Benefit Analyses of HVAC Systems Available to Ohio Schools
8-25
High SchoolHVACSystemOption
Air System
Base 10 CFM 20 CFM1A1 VAV with Reheat $0 -$3,774 $4,184
1A2 VAV with Reheat $0 -$2,071 $779
1A3 VAV with Reheat $0 -$2,555 $3,493
1B1 VAV with Reheat $0 -$3,774 $4,184
1B2 VAV with Reheat $0 -$2,071 $779
1B3 VAV with Reheat $0 -$2,555 $3,493
1C1 VAV with Reheat $0 -$3,133 $4,184
1C2 VAV with Reheat $0 -$1,430 $779
1C3 VAV with Reheat $0 -$1,914 $3,493
1D1 VAV with Reheat $0 -$3,236 $4,184
1D2 VAV with Reheat $0 -$1,534 $779
1D3 VAV with Reheat $0 -$2,018 $3,493
2A1 Series Fan Powered VAV Box $0 -$3,774 $4,184
2A2 Series Fan Powered VAV Box $0 -$2,071 $779
2A3 Series Fan Powered VAV Box $0 -$2,555 $3,493
2B1 Series Fan Powered VAV Box $0 -$3,774 $4,184
2B2 Series Fan Powered VAV Box $0 -$2,071 $779
2B3 Series Fan Powered VAV Box $0 -$2,555 $3,493
2C1 Series Fan Powered VAV Box $0 -$3,133 $4,184
2C2 Series Fan Powered VAV Box $0 -$1,430 $779
2C3 Series Fan Powered VAV Box $0 -$1,914 $3,493
2D1 Series Fan Powered VAV Box $0 -$3,236 $4,184
2D2 Series Fan Powered VAV Box $0 -$1,534 $779
2D3 Series Fan Powered VAV Box $0 -$2,018 $3,493
3A1 Water Source Heat Pump $0 -$9,519 $10,093
3B1 Water Source Heat Pump $0 -$9,519 $10,093
3C1 Water Source Heat Pump $0 -$9,086 $9,679
3D1 Water Source Heat Pump $0 -$9,089 $9,771
4A1 Dual Duct VAV $0 -$3,438 $5,194
4A2 Dual Duct VAV $0 -$1,735 $1,788
4A3 Dual Duct VAV $0 -$2,219 $4,503
4B1 Dual Duct VAV $0 -$3,438 $5,194
4B2 Dual Duct VAV $0 -$1,735 $1,788
4B3 Dual Duct VAV $0 -$2,219 $4,503
4C1 Dual Duct VAV $0 -$2,918 $4,866
4C2 Dual Duct VAV $0 -$1,215 $1,460
4C3 Dual Duct VAV $0 -$1,699 $4,175
4D1 Dual Duct VAV $0 -$3,008 $4,871
4D2 Dual Duct VAV $0 -$1,305 $1,465
4D3 Dual Duct VAV $0 -$1,789 $4,180
Table 8-12: Total Differential Service, Maintenance and Repair Costs forHVAC System Options for Both the 10 and the 20 CFM/Person Cases –Columbus H. S. w/ City Index Corrections
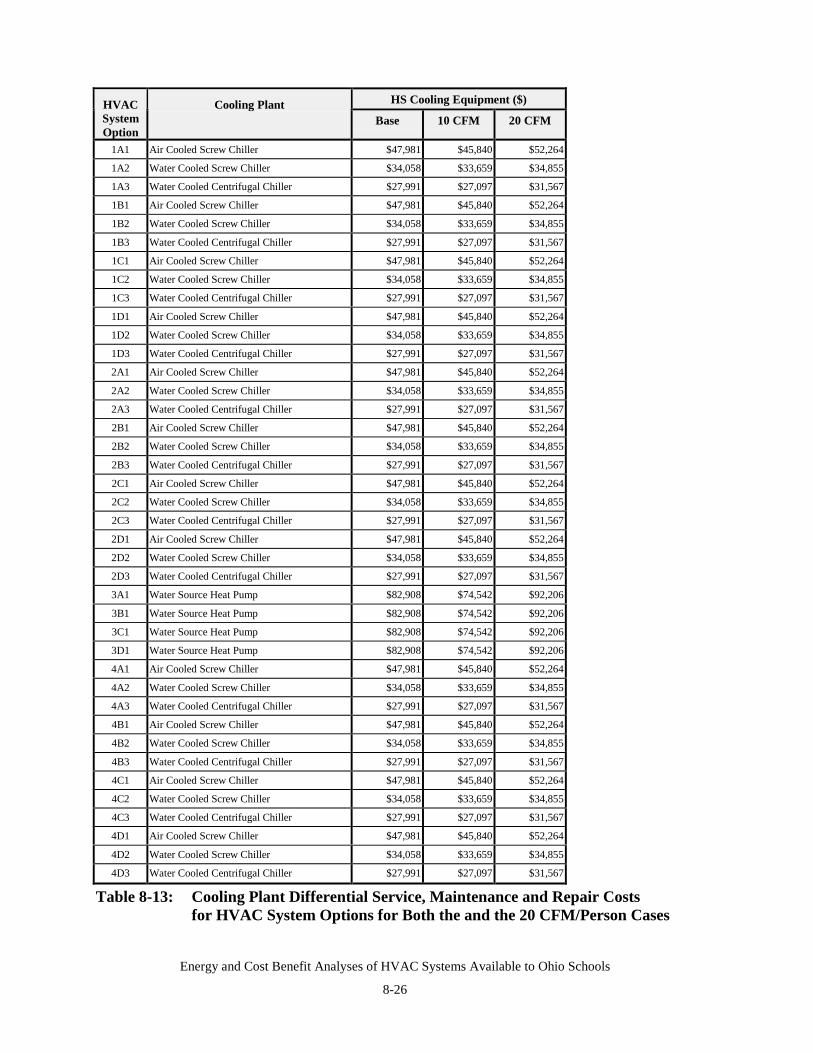
Energy and Cost Benefit Analyses of HVAC Systems Available to Ohio Schools
8-26
HS Cooling Equipment ($)HVACSystemOption
Cooling PlantBase 10 CFM 20 CFM
1A1 Air Cooled Screw Chiller $47,981 $45,840 $52,264
1A2 Water Cooled Screw Chiller $34,058 $33,659 $34,855
1A3 Water Cooled Centrifugal Chiller $27,991 $27,097 $31,567
1B1 Air Cooled Screw Chiller $47,981 $45,840 $52,264
1B2 Water Cooled Screw Chiller $34,058 $33,659 $34,855
1B3 Water Cooled Centrifugal Chiller $27,991 $27,097 $31,567
1C1 Air Cooled Screw Chiller $47,981 $45,840 $52,264
1C2 Water Cooled Screw Chiller $34,058 $33,659 $34,855
1C3 Water Cooled Centrifugal Chiller $27,991 $27,097 $31,567
1D1 Air Cooled Screw Chiller $47,981 $45,840 $52,264
1D2 Water Cooled Screw Chiller $34,058 $33,659 $34,855
1D3 Water Cooled Centrifugal Chiller $27,991 $27,097 $31,567
2A1 Air Cooled Screw Chiller $47,981 $45,840 $52,264
2A2 Water Cooled Screw Chiller $34,058 $33,659 $34,855
2A3 Water Cooled Centrifugal Chiller $27,991 $27,097 $31,567
2B1 Air Cooled Screw Chiller $47,981 $45,840 $52,264
2B2 Water Cooled Screw Chiller $34,058 $33,659 $34,855
2B3 Water Cooled Centrifugal Chiller $27,991 $27,097 $31,567
2C1 Air Cooled Screw Chiller $47,981 $45,840 $52,264
2C2 Water Cooled Screw Chiller $34,058 $33,659 $34,855
2C3 Water Cooled Centrifugal Chiller $27,991 $27,097 $31,567
2D1 Air Cooled Screw Chiller $47,981 $45,840 $52,264
2D2 Water Cooled Screw Chiller $34,058 $33,659 $34,855
2D3 Water Cooled Centrifugal Chiller $27,991 $27,097 $31,567
3A1 Water Source Heat Pump $82,908 $74,542 $92,206
3B1 Water Source Heat Pump $82,908 $74,542 $92,206
3C1 Water Source Heat Pump $82,908 $74,542 $92,206
3D1 Water Source Heat Pump $82,908 $74,542 $92,206
4A1 Air Cooled Screw Chiller $47,981 $45,840 $52,264
4A2 Water Cooled Screw Chiller $34,058 $33,659 $34,855
4A3 Water Cooled Centrifugal Chiller $27,991 $27,097 $31,567
4B1 Air Cooled Screw Chiller $47,981 $45,840 $52,264
4B2 Water Cooled Screw Chiller $34,058 $33,659 $34,855
4B3 Water Cooled Centrifugal Chiller $27,991 $27,097 $31,567
4C1 Air Cooled Screw Chiller $47,981 $45,840 $52,264
4C2 Water Cooled Screw Chiller $34,058 $33,659 $34,855
4C3 Water Cooled Centrifugal Chiller $27,991 $27,097 $31,567
4D1 Air Cooled Screw Chiller $47,981 $45,840 $52,264
4D2 Water Cooled Screw Chiller $34,058 $33,659 $34,855
4D3 Water Cooled Centrifugal Chiller $27,991 $27,097 $31,567
Table 8-13: Cooling Plant Differential Service, Maintenance and Repair Costsfor HVAC System Options for Both the and the 20 CFM/Person Cases
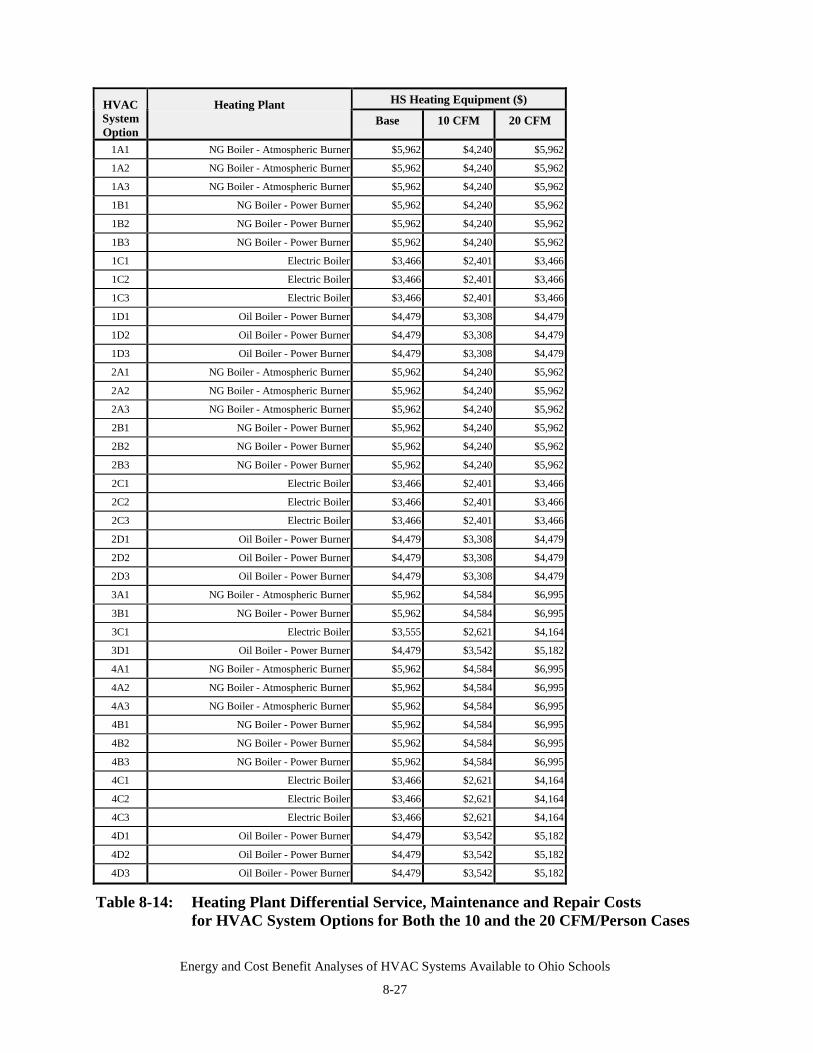
Energy and Cost Benefit Analyses of HVAC Systems Available to Ohio Schools
8-27
HS Heating Equipment ($)HVACSystemOption
Heating PlantBase 10 CFM 20 CFM
1A1 NG Boiler - Atmospheric Burner $5,962 $4,240 $5,962
1A2 NG Boiler - Atmospheric Burner $5,962 $4,240 $5,962
1A3 NG Boiler - Atmospheric Burner $5,962 $4,240 $5,962
1B1 NG Boiler - Power Burner $5,962 $4,240 $5,962
1B2 NG Boiler - Power Burner $5,962 $4,240 $5,962
1B3 NG Boiler - Power Burner $5,962 $4,240 $5,962
1C1 Electric Boiler $3,466 $2,401 $3,466
1C2 Electric Boiler $3,466 $2,401 $3,466
1C3 Electric Boiler $3,466 $2,401 $3,466
1D1 Oil Boiler - Power Burner $4,479 $3,308 $4,479
1D2 Oil Boiler - Power Burner $4,479 $3,308 $4,479
1D3 Oil Boiler - Power Burner $4,479 $3,308 $4,479
2A1 NG Boiler - Atmospheric Burner $5,962 $4,240 $5,962
2A2 NG Boiler - Atmospheric Burner $5,962 $4,240 $5,962
2A3 NG Boiler - Atmospheric Burner $5,962 $4,240 $5,962
2B1 NG Boiler - Power Burner $5,962 $4,240 $5,962
2B2 NG Boiler - Power Burner $5,962 $4,240 $5,962
2B3 NG Boiler - Power Burner $5,962 $4,240 $5,962
2C1 Electric Boiler $3,466 $2,401 $3,466
2C2 Electric Boiler $3,466 $2,401 $3,466
2C3 Electric Boiler $3,466 $2,401 $3,466
2D1 Oil Boiler - Power Burner $4,479 $3,308 $4,479
2D2 Oil Boiler - Power Burner $4,479 $3,308 $4,479
2D3 Oil Boiler - Power Burner $4,479 $3,308 $4,479
3A1 NG Boiler - Atmospheric Burner $5,962 $4,584 $6,995
3B1 NG Boiler - Power Burner $5,962 $4,584 $6,995
3C1 Electric Boiler $3,555 $2,621 $4,164
3D1 Oil Boiler - Power Burner $4,479 $3,542 $5,182
4A1 NG Boiler - Atmospheric Burner $5,962 $4,584 $6,995
4A2 NG Boiler - Atmospheric Burner $5,962 $4,584 $6,995
4A3 NG Boiler - Atmospheric Burner $5,962 $4,584 $6,995
4B1 NG Boiler - Power Burner $5,962 $4,584 $6,995
4B2 NG Boiler - Power Burner $5,962 $4,584 $6,995
4B3 NG Boiler - Power Burner $5,962 $4,584 $6,995
4C1 Electric Boiler $3,466 $2,621 $4,164
4C2 Electric Boiler $3,466 $2,621 $4,164
4C3 Electric Boiler $3,466 $2,621 $4,164
4D1 Oil Boiler - Power Burner $4,479 $3,542 $5,182
4D2 Oil Boiler - Power Burner $4,479 $3,542 $5,182
4D3 Oil Boiler - Power Burner $4,479 $3,542 $5,182
Table 8-14: Heating Plant Differential Service, Maintenance and Repair Costsfor HVAC System Options for Both the 10 and the 20 CFM/Person Cases
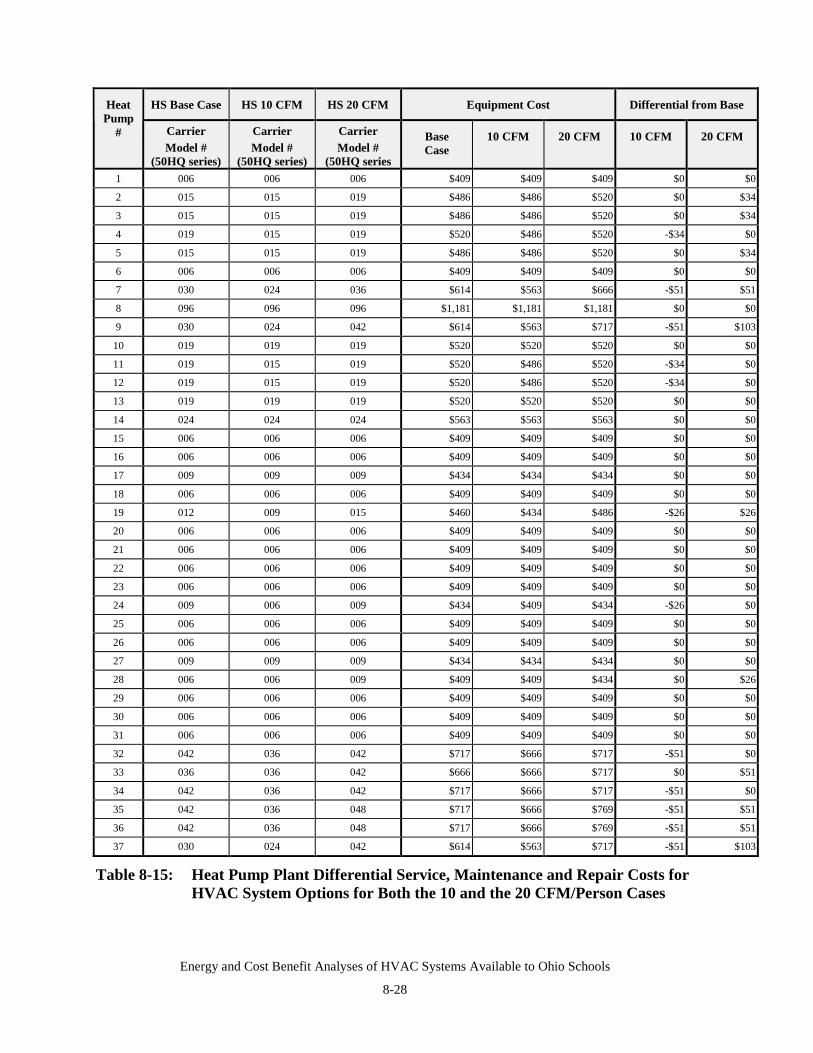
Energy and Cost Benefit Analyses of HVAC Systems Available to Ohio Schools
8-28
HS Base Case HS 10 CFM HS 20 CFM Equipment Cost Differential from BaseHeatPump
# CarrierModel #
(50HQ series)
CarrierModel #
(50HQ series)
CarrierModel #
(50HQ series
BaseCase
10 CFM 20 CFM 10 CFM 20 CFM
1 006 006 006 $409 $409 $409 $0 $0
2 015 015 019 $486 $486 $520 $0 $34
3 015 015 019 $486 $486 $520 $0 $34
4 019 015 019 $520 $486 $520 -$34 $0
5 015 015 019 $486 $486 $520 $0 $34
6 006 006 006 $409 $409 $409 $0 $0
7 030 024 036 $614 $563 $666 -$51 $51
8 096 096 096 $1,181 $1,181 $1,181 $0 $0
9 030 024 042 $614 $563 $717 -$51 $103
10 019 019 019 $520 $520 $520 $0 $0
11 019 015 019 $520 $486 $520 -$34 $0
12 019 015 019 $520 $486 $520 -$34 $0
13 019 019 019 $520 $520 $520 $0 $0
14 024 024 024 $563 $563 $563 $0 $0
15 006 006 006 $409 $409 $409 $0 $0
16 006 006 006 $409 $409 $409 $0 $0
17 009 009 009 $434 $434 $434 $0 $0
18 006 006 006 $409 $409 $409 $0 $0
19 012 009 015 $460 $434 $486 -$26 $26
20 006 006 006 $409 $409 $409 $0 $0
21 006 006 006 $409 $409 $409 $0 $0
22 006 006 006 $409 $409 $409 $0 $0
23 006 006 006 $409 $409 $409 $0 $0
24 009 006 009 $434 $409 $434 -$26 $0
25 006 006 006 $409 $409 $409 $0 $0
26 006 006 006 $409 $409 $409 $0 $0
27 009 009 009 $434 $434 $434 $0 $0
28 006 006 009 $409 $409 $434 $0 $26
29 006 006 006 $409 $409 $409 $0 $0
30 006 006 006 $409 $409 $409 $0 $0
31 006 006 006 $409 $409 $409 $0 $0
32 042 036 042 $717 $666 $717 -$51 $0
33 036 036 042 $666 $666 $717 $0 $51
34 042 036 042 $717 $666 $717 -$51 $0
35 042 036 048 $717 $666 $769 -$51 $51
36 042 036 048 $717 $666 $769 -$51 $51
37 030 024 042 $614 $563 $717 -$51 $103
Table 8-15: Heat Pump Plant Differential Service, Maintenance and Repair Costs forHVAC System Options for Both the 10 and the 20 CFM/Person Cases
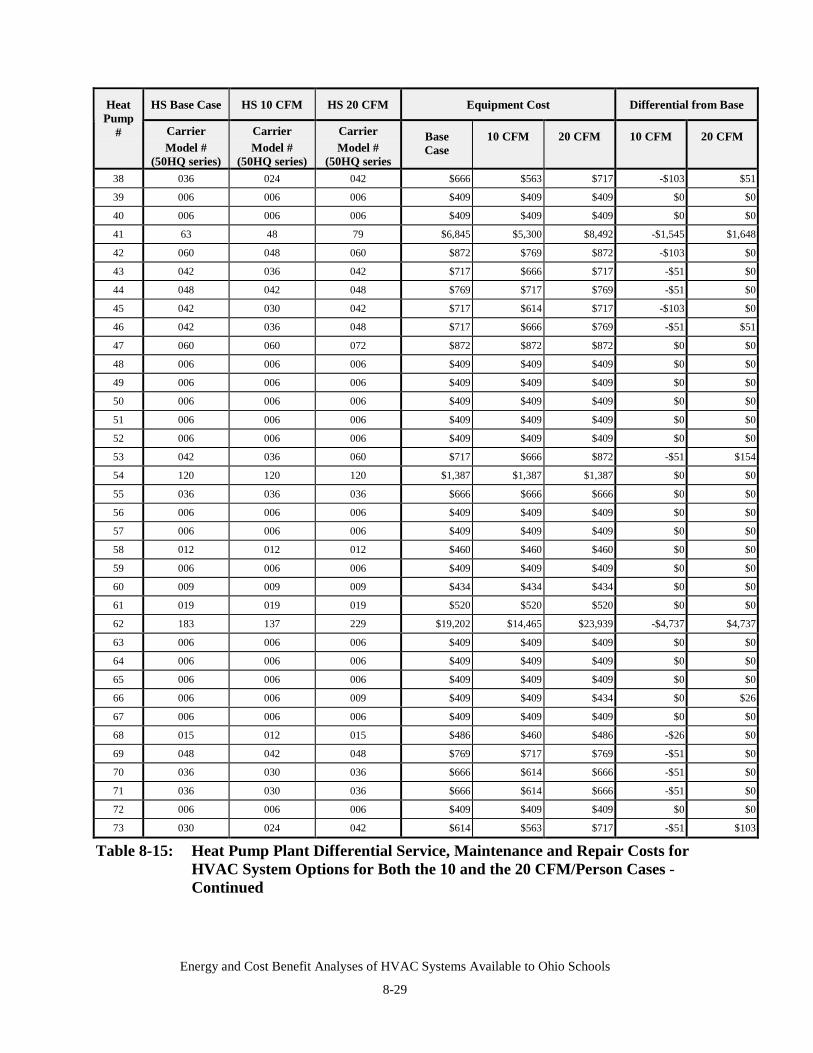
Energy and Cost Benefit Analyses of HVAC Systems Available to Ohio Schools
8-29
HS Base Case HS 10 CFM HS 20 CFM Equipment Cost Differential from BaseHeatPump
# CarrierModel #
(50HQ series)
CarrierModel #
(50HQ series)
CarrierModel #
(50HQ series
BaseCase
10 CFM 20 CFM 10 CFM 20 CFM
38 036 024 042 $666 $563 $717 -$103 $51
39 006 006 006 $409 $409 $409 $0 $0
40 006 006 006 $409 $409 $409 $0 $0
41 63 48 79 $6,845 $5,300 $8,492 -$1,545 $1,648
42 060 048 060 $872 $769 $872 -$103 $0
43 042 036 042 $717 $666 $717 -$51 $0
44 048 042 048 $769 $717 $769 -$51 $0
45 042 030 042 $717 $614 $717 -$103 $0
46 042 036 048 $717 $666 $769 -$51 $51
47 060 060 072 $872 $872 $872 $0 $0
48 006 006 006 $409 $409 $409 $0 $0
49 006 006 006 $409 $409 $409 $0 $0
50 006 006 006 $409 $409 $409 $0 $0
51 006 006 006 $409 $409 $409 $0 $0
52 006 006 006 $409 $409 $409 $0 $0
53 042 036 060 $717 $666 $872 -$51 $154
54 120 120 120 $1,387 $1,387 $1,387 $0 $0
55 036 036 036 $666 $666 $666 $0 $0
56 006 006 006 $409 $409 $409 $0 $0
57 006 006 006 $409 $409 $409 $0 $0
58 012 012 012 $460 $460 $460 $0 $0
59 006 006 006 $409 $409 $409 $0 $0
60 009 009 009 $434 $434 $434 $0 $0
61 019 019 019 $520 $520 $520 $0 $0
62 183 137 229 $19,202 $14,465 $23,939 -$4,737 $4,737
63 006 006 006 $409 $409 $409 $0 $0
64 006 006 006 $409 $409 $409 $0 $0
65 006 006 006 $409 $409 $409 $0 $0
66 006 006 009 $409 $409 $434 $0 $26
67 006 006 006 $409 $409 $409 $0 $0
68 015 012 015 $486 $460 $486 -$26 $0
69 048 042 048 $769 $717 $769 -$51 $0
70 036 030 036 $666 $614 $666 -$51 $0
71 036 030 036 $666 $614 $666 -$51 $0
72 006 006 006 $409 $409 $409 $0 $0
73 030 024 042 $614 $563 $717 -$51 $103
Table 8-15: Heat Pump Plant Differential Service, Maintenance and Repair Costs forHVAC System Options for Both the 10 and the 20 CFM/Person Cases -Continued
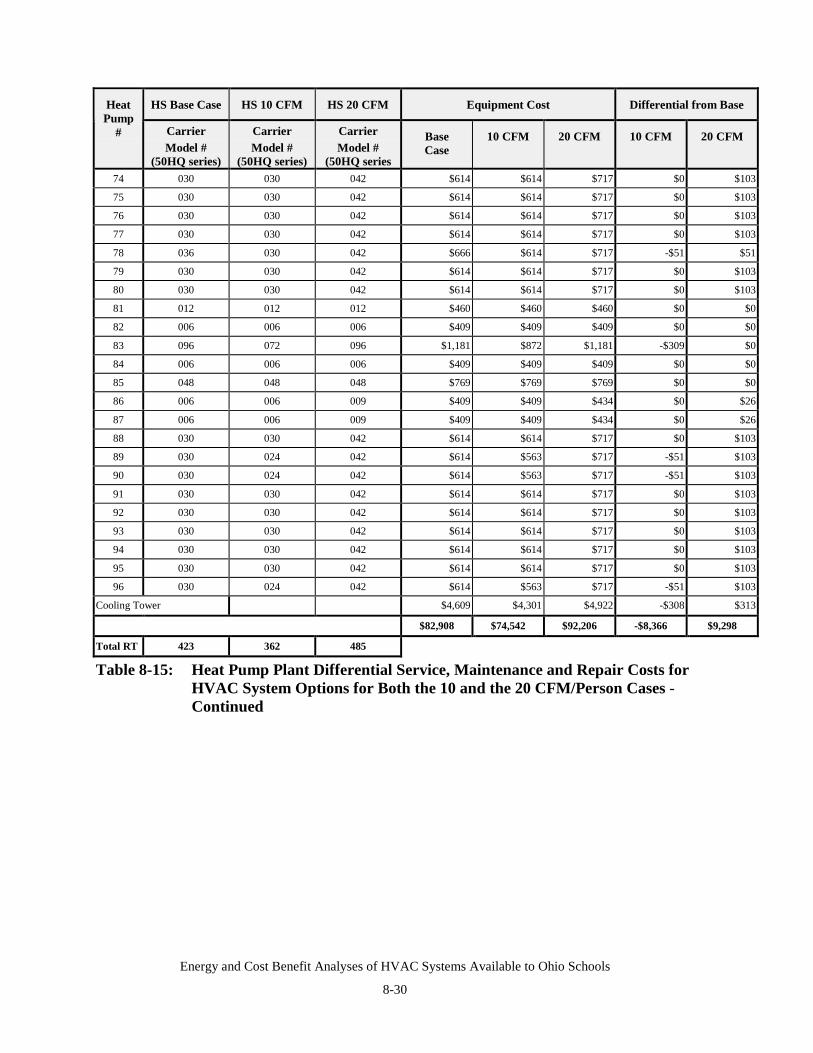
Energy and Cost Benefit Analyses of HVAC Systems Available to Ohio Schools
8-30
HS Base Case HS 10 CFM HS 20 CFM Equipment Cost Differential from BaseHeatPump
# CarrierModel #
(50HQ series)
CarrierModel #
(50HQ series)
CarrierModel #
(50HQ series
BaseCase
10 CFM 20 CFM 10 CFM 20 CFM
74 030 030 042 $614 $614 $717 $0 $103
75 030 030 042 $614 $614 $717 $0 $103
76 030 030 042 $614 $614 $717 $0 $103
77 030 030 042 $614 $614 $717 $0 $103
78 036 030 042 $666 $614 $717 -$51 $51
79 030 030 042 $614 $614 $717 $0 $103
80 030 030 042 $614 $614 $717 $0 $103
81 012 012 012 $460 $460 $460 $0 $0
82 006 006 006 $409 $409 $409 $0 $0
83 096 072 096 $1,181 $872 $1,181 -$309 $0
84 006 006 006 $409 $409 $409 $0 $0
85 048 048 048 $769 $769 $769 $0 $0
86 006 006 009 $409 $409 $434 $0 $26
87 006 006 009 $409 $409 $434 $0 $26
88 030 030 042 $614 $614 $717 $0 $103
89 030 024 042 $614 $563 $717 -$51 $103
90 030 024 042 $614 $563 $717 -$51 $103
91 030 030 042 $614 $614 $717 $0 $103
92 030 030 042 $614 $614 $717 $0 $103
93 030 030 042 $614 $614 $717 $0 $103
94 030 030 042 $614 $614 $717 $0 $103
95 030 030 042 $614 $614 $717 $0 $103
96 030 024 042 $614 $563 $717 -$51 $103
Cooling Tower $4,609 $4,301 $4,922 -$308 $313
$82,908 $74,542 $92,206 -$8,366 $9,298
Total RT 423 362 485
Table 8-15: Heat Pump Plant Differential Service, Maintenance and Repair Costs forHVAC System Options for Both the 10 and the 20 CFM/Person Cases -Continued
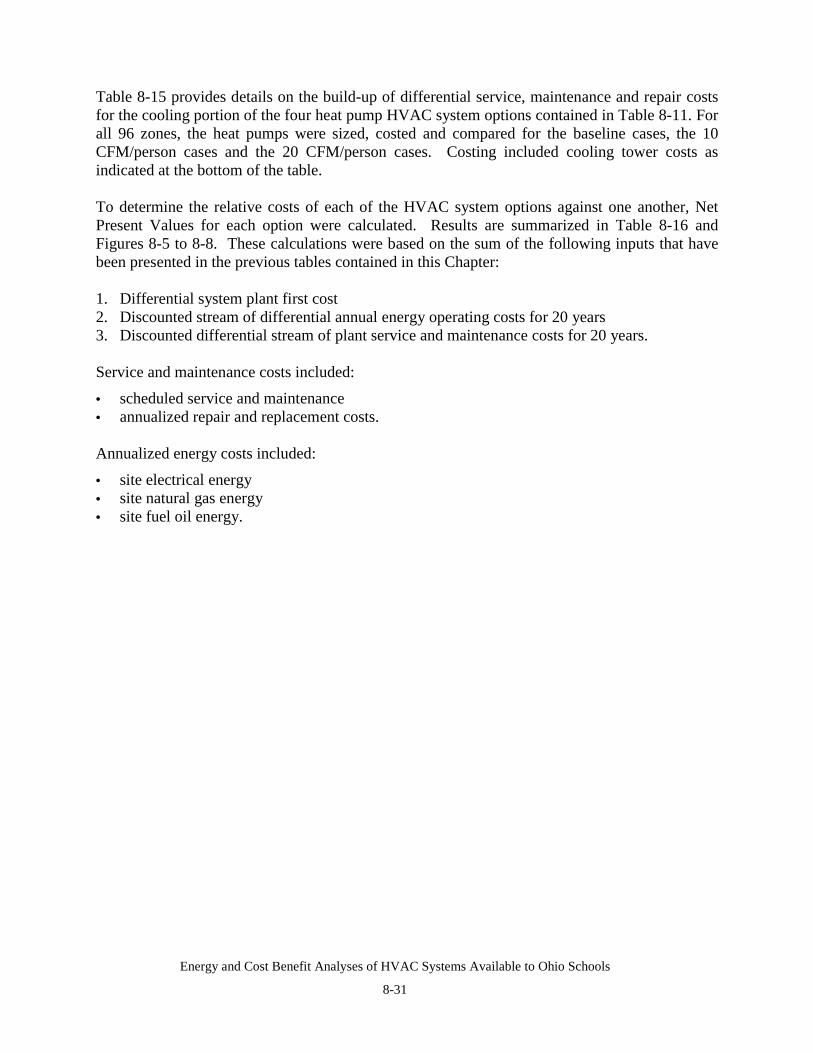
Energy and Cost Benefit Analyses of HVAC Systems Available to Ohio Schools
8-31
Table 8-15 provides details on the build-up of differential service, maintenance and repair costsfor the cooling portion of the four heat pump HVAC system options contained in Table 8-11. Forall 96 zones, the heat pumps were sized, costed and compared for the baseline cases, the 10CFM/person cases and the 20 CFM/person cases. Costing included cooling tower costs asindicated at the bottom of the table.
To determine the relative costs of each of the HVAC system options against one another, NetPresent Values for each option were calculated. Results are summarized in Table 8-16 andFigures 8-5 to 8-8. These calculations were based on the sum of the following inputs that havebeen presented in the previous tables contained in this Chapter:
1. Differential system plant first cost2. Discounted stream of differential annual energy operating costs for 20 years3. Discounted differential stream of plant service and maintenance costs for 20 years.
Service and maintenance costs included:
• scheduled service and maintenance• annualized repair and replacement costs.
Annualized energy costs included:
• site electrical energy• site natural gas energy• site fuel oil energy.
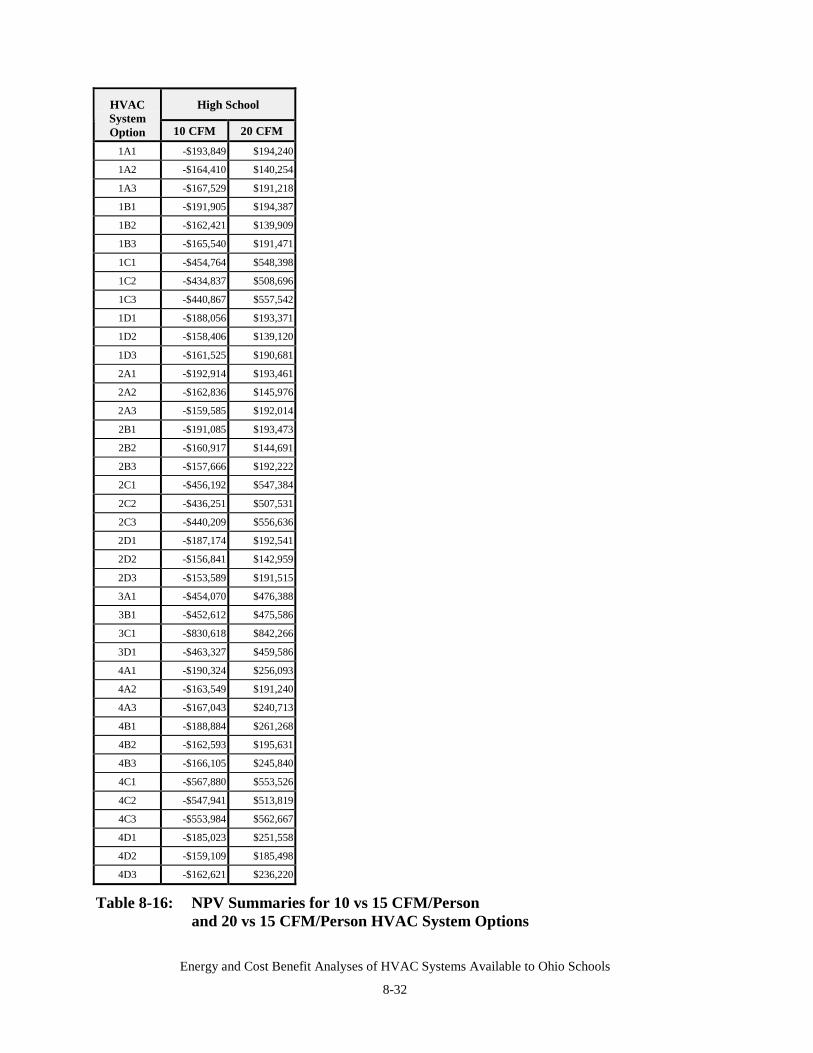
Energy and Cost Benefit Analyses of HVAC Systems Available to Ohio Schools
8-32
High SchoolHVACSystemOption 10 CFM 20 CFM
1A1 -$193,849 $194,240
1A2 -$164,410 $140,254
1A3 -$167,529 $191,218
1B1 -$191,905 $194,387
1B2 -$162,421 $139,909
1B3 -$165,540 $191,471
1C1 -$454,764 $548,398
1C2 -$434,837 $508,696
1C3 -$440,867 $557,542
1D1 -$188,056 $193,371
1D2 -$158,406 $139,120
1D3 -$161,525 $190,681
2A1 -$192,914 $193,461
2A2 -$162,836 $145,976
2A3 -$159,585 $192,014
2B1 -$191,085 $193,473
2B2 -$160,917 $144,691
2B3 -$157,666 $192,222
2C1 -$456,192 $547,384
2C2 -$436,251 $507,531
2C3 -$440,209 $556,636
2D1 -$187,174 $192,541
2D2 -$156,841 $142,959
2D3 -$153,589 $191,515
3A1 -$454,070 $476,388
3B1 -$452,612 $475,586
3C1 -$830,618 $842,266
3D1 -$463,327 $459,586
4A1 -$190,324 $256,093
4A2 -$163,549 $191,240
4A3 -$167,043 $240,713
4B1 -$188,884 $261,268
4B2 -$162,593 $195,631
4B3 -$166,105 $245,840
4C1 -$567,880 $553,526
4C2 -$547,941 $513,819
4C3 -$553,984 $562,667
4D1 -$185,023 $251,558
4D2 -$159,109 $185,498
4D3 -$162,621 $236,220
Table 8-16: NPV Summaries for 10 vs 15 CFM/Personand 20 vs 15 CFM/Person HVAC System Options
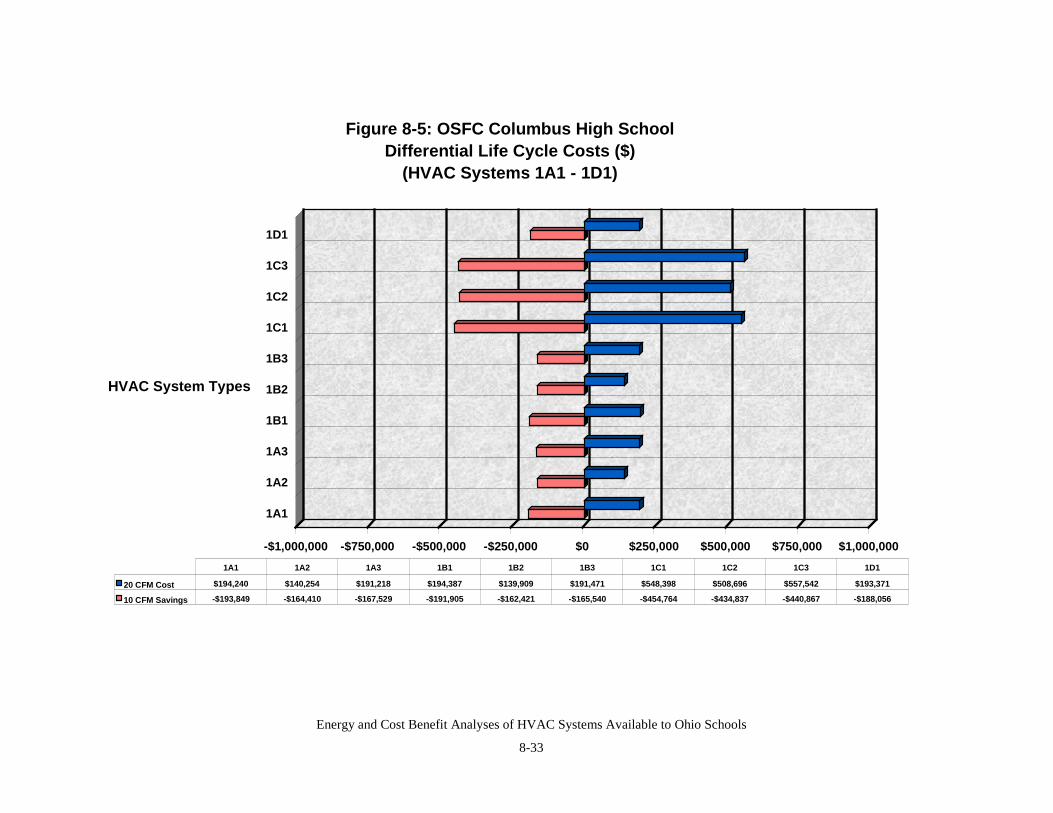
Energy and Cost Benefit Analyses of HVAC Systems Available to Ohio Schools
8-33
-$1,000,000 -$750,000 -$500,000 -$250,000 $0 $250,000 $500,000 $750,000 $1,000,000
1A1
1A2
1A3
1B1
1B2
1B3
1C1
1C2
1C3
1D1
HVAC System Types
Figure 8-5: OSFC Columbus High School Differential Life Cycle Costs ($)
(HVAC Systems 1A1 - 1D1)
20 CFM Cost $194,240 $140,254 $191,218 $194,387 $139,909 $191,471 $548,398 $508,696 $557,542 $193,371
10 CFM Savings -$193,849 -$164,410 -$167,529 -$191,905 -$162,421 -$165,540 -$454,764 -$434,837 -$440,867 -$188,056
1A1 1A2 1A3 1B1 1B2 1B3 1C1 1C2 1C3 1D1
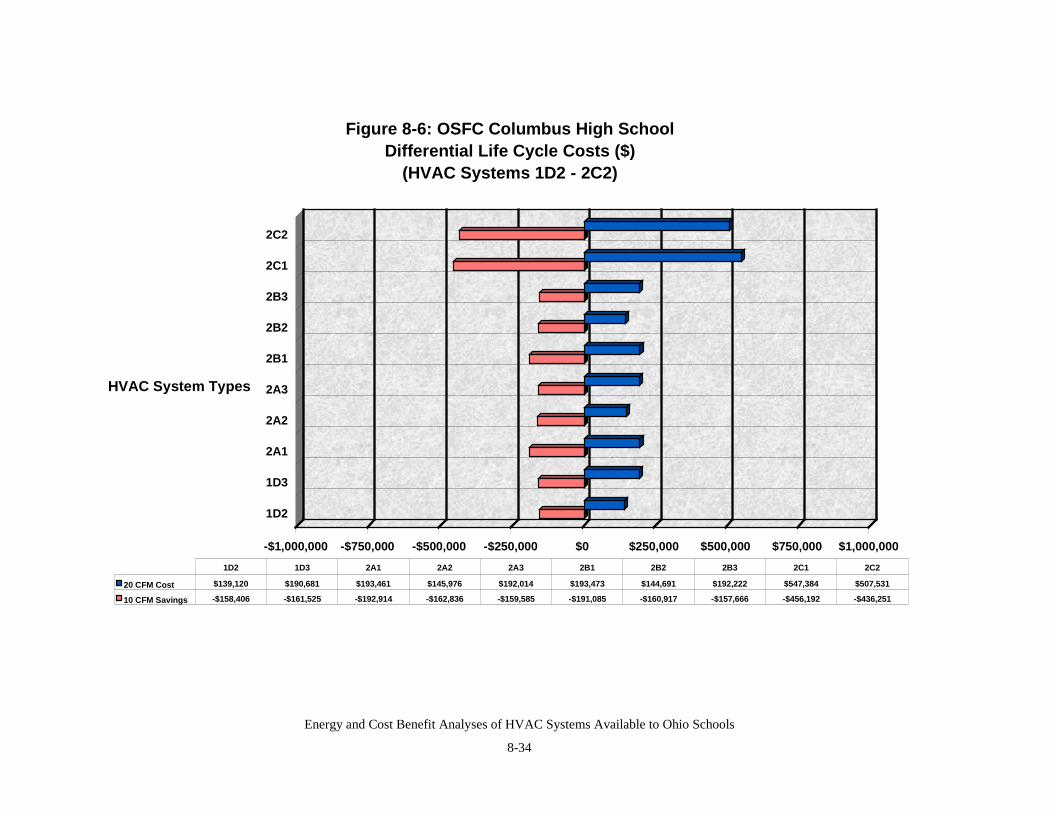
Energy and Cost Benefit Analyses of HVAC Systems Available to Ohio Schools
8-34
-$1,000,000 -$750,000 -$500,000 -$250,000 $0 $250,000 $500,000 $750,000 $1,000,000
1D2
1D3
2A1
2A2
2A3
2B1
2B2
2B3
2C1
2C2
HVAC System Types
Figure 8-6: OSFC Columbus High School Differential Life Cycle Costs ($)
(HVAC Systems 1D2 - 2C2)
20 CFM Cost $139,120 $190,681 $193,461 $145,976 $192,014 $193,473 $144,691 $192,222 $547,384 $507,531
10 CFM Savings -$158,406 -$161,525 -$192,914 -$162,836 -$159,585 -$191,085 -$160,917 -$157,666 -$456,192 -$436,251
1D2 1D3 2A1 2A2 2A3 2B1 2B2 2B3 2C1 2C2
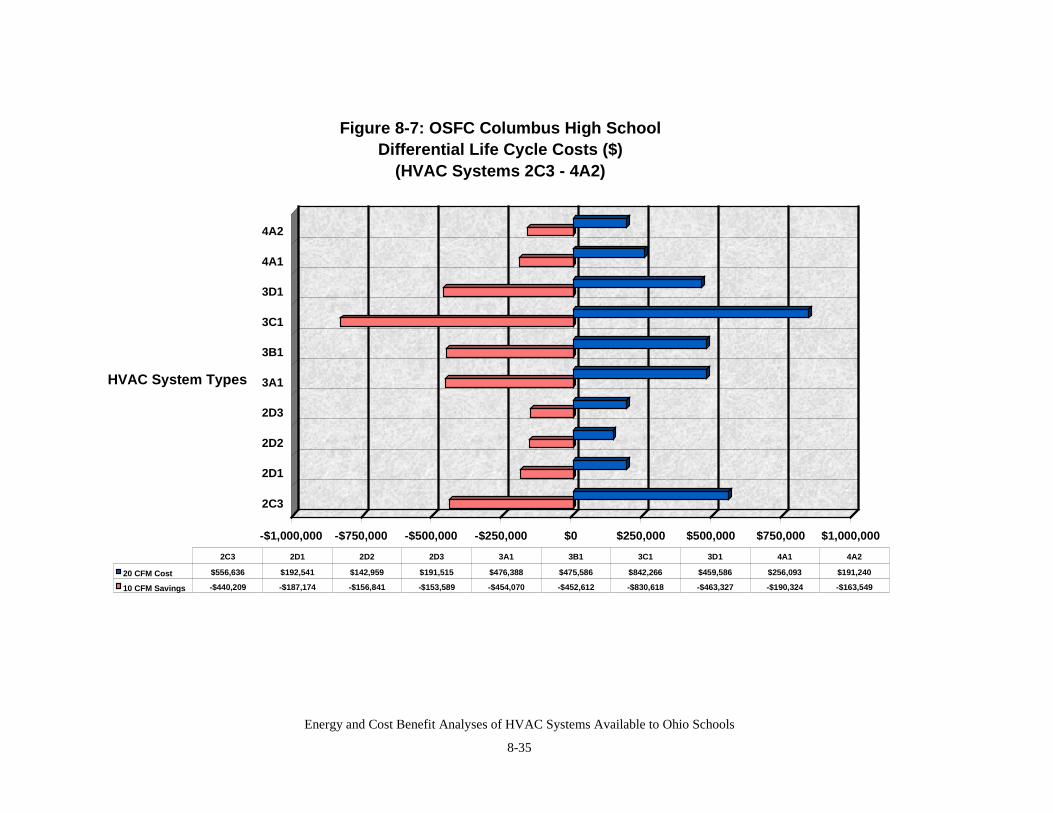
Energy and Cost Benefit Analyses of HVAC Systems Available to Ohio Schools
8-35
-$1,000,000 -$750,000 -$500,000 -$250,000 $0 $250,000 $500,000 $750,000 $1,000,000
2C3
2D1
2D2
2D3
3A1
3B1
3C1
3D1
4A1
4A2
HVAC System Types
Figure 8-7: OSFC Columbus High School Differential Life Cycle Costs ($)
(HVAC Systems 2C3 - 4A2)
20 CFM Cost $556,636 $192,541 $142,959 $191,515 $476,388 $475,586 $842,266 $459,586 $256,093 $191,240
10 CFM Savings -$440,209 -$187,174 -$156,841 -$153,589 -$454,070 -$452,612 -$830,618 -$463,327 -$190,324 -$163,549
2C3 2D1 2D2 2D3 3A1 3B1 3C1 3D1 4A1 4A2
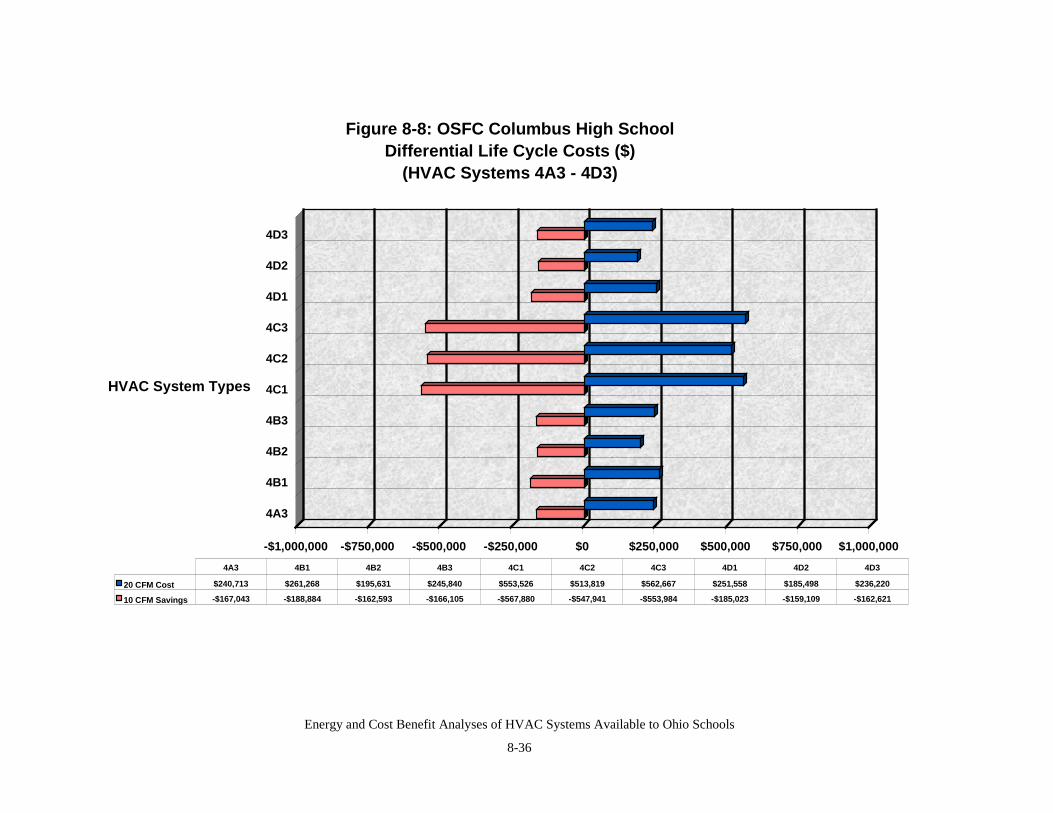
Energy and Cost Benefit Analyses of HVAC Systems Available to Ohio Schools
8-36
-$1,000,000 -$750,000 -$500,000 -$250,000 $0 $250,000 $500,000 $750,000 $1,000,000
4A3
4B1
4B2
4B3
4C1
4C2
4C3
4D1
4D2
4D3
HVAC System Types
Figure 8-8: OSFC Columbus High School Differential Life Cycle Costs ($)
(HVAC Systems 4A3 - 4D3)
20 CFM Cost $240,713 $261,268 $195,631 $245,840 $553,526 $513,819 $562,667 $251,558 $185,498 $236,220
10 CFM Savings -$167,043 -$188,884 -$162,593 -$166,105 -$567,880 -$547,941 -$553,984 -$185,023 -$159,109 -$162,621
4A3 4B1 4B2 4B3 4C1 4C2 4C3 4D1 4D2 4D3
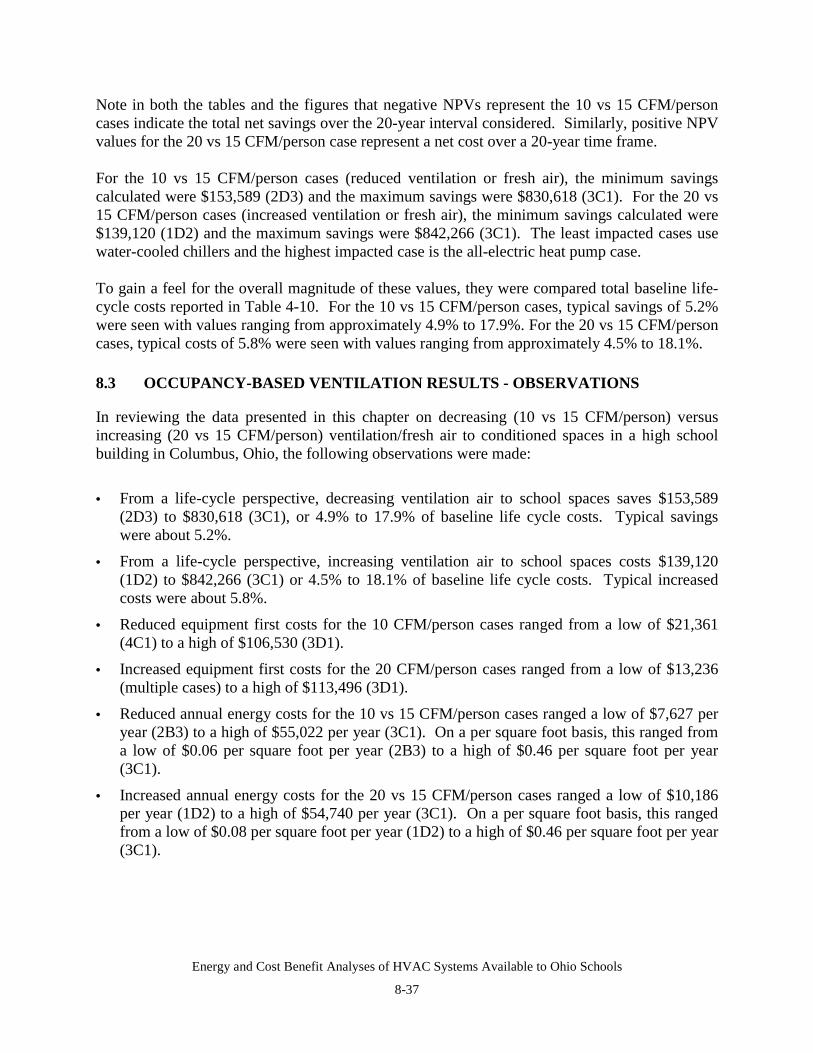
Energy and Cost Benefit Analyses of HVAC Systems Available to Ohio Schools
8-37
Note in both the tables and the figures that negative NPVs represent the 10 vs 15 CFM/personcases indicate the total net savings over the 20-year interval considered. Similarly, positive NPVvalues for the 20 vs 15 CFM/person case represent a net cost over a 20-year time frame.
For the 10 vs 15 CFM/person cases (reduced ventilation or fresh air), the minimum savingscalculated were $153,589 (2D3) and the maximum savings were $830,618 (3C1). For the 20 vs15 CFM/person cases (increased ventilation or fresh air), the minimum savings calculated were$139,120 (1D2) and the maximum savings were $842,266 (3C1). The least impacted cases usewater-cooled chillers and the highest impacted case is the all-electric heat pump case.
To gain a feel for the overall magnitude of these values, they were compared total baseline life-cycle costs reported in Table 4-10. For the 10 vs 15 CFM/person cases, typical savings of 5.2%were seen with values ranging from approximately 4.9% to 17.9%. For the 20 vs 15 CFM/personcases, typical costs of 5.8% were seen with values ranging from approximately 4.5% to 18.1%.
8.3 OCCUPANCY-BASED VENTILATION RESULTS - OBSERVATIONS
In reviewing the data presented in this chapter on decreasing (10 vs 15 CFM/person) versusincreasing (20 vs 15 CFM/person) ventilation/fresh air to conditioned spaces in a high schoolbuilding in Columbus, Ohio, the following observations were made:
• From a life-cycle perspective, decreasing ventilation air to school spaces saves $153,589(2D3) to $830,618 (3C1), or 4.9% to 17.9% of baseline life cycle costs. Typical savingswere about 5.2%.
• From a life-cycle perspective, increasing ventilation air to school spaces costs $139,120(1D2) to $842,266 (3C1) or 4.5% to 18.1% of baseline life cycle costs. Typical increasedcosts were about 5.8%.
• Reduced equipment first costs for the 10 CFM/person cases ranged from a low of $21,361(4C1) to a high of $106,530 (3D1).
• Increased equipment first costs for the 20 CFM/person cases ranged from a low of $13,236(multiple cases) to a high of $113,496 (3D1).
• Reduced annual energy costs for the 10 vs 15 CFM/person cases ranged a low of $7,627 peryear (2B3) to a high of $55,022 per year (3C1). On a per square foot basis, this ranged froma low of $0.06 per square foot per year (2B3) to a high of $0.46 per square foot per year(3C1).
• Increased annual energy costs for the 20 vs 15 CFM/person cases ranged a low of $10,186per year (1D2) to a high of $54,740 per year (3C1). On a per square foot basis, this rangedfrom a low of $0.08 per square foot per year (1D2) to a high of $0.46 per square foot per year(3C1).
Energy and Cost Benefit Analyses of HVAC Systems Available to Ohio Schools
9-1
9.0 GEOTHERMAL HEAT PUMP ANALYSES
Geothermal heat pumps are increasingly being touted as a high efficiency alternative forproviding space heating and cooling to buildings. Conceptually, the technology is very similar inoperation to conventional air to air heat pumps except that for geothermal heat pumps the airreservoir is replaced by the earth. In this case, the ground provides a consistent, moderatetemperature source (for heating energy) and sink (for cooling energy) to provide heating andcooling for buildings. Many public and private studies and demonstrations have been completedregarding the design, application and performance of geothermal heat pumps. The GeothermalHeat Pump Consortium (http://www.geoexchange.org/) and the Energy Information Agency(EIA) (http://www.eia.doe.gov/index.html) and the Geothermal Heat Pump Consortium(http://www.geoexchange.com) web sites provide excellent resources for work in this area.
This work focuses specifically on comparison of the annual energy consumption and cost ofgeothermal heat pumps in an elementary school and high school in Cincinnati, Cleveland andColumbus, OH and compares these results against the 40 baseline systems discussed earlier.
9.1 APPROACH TO GEOTHERMAL HEAT PUMP ANALYSES
As described earlier, the geothermal heat pump is analogous to the air to air heat pumps (Cases3A1, 3B1, 3C1 and 3D1) evaluated earlier in Chapters 3 and 4 except that the earth, rather thanthe air serves as the heat source or sink. For these analyses, we have assumed that vertical,closed-loop ground-loops would be used to provide the source or sink conditions. Perhaps themost critical element for determining geothermal annual energy loads and costs is the variationin down-hole (or reservoir) temperature with time. The variations in the ground-looptemperature will impact the performance or efficiency of the individual heat pump units. Thisdecision is critical because one can either:
• Install insufficient ground-loop heat exchange surface which may not allow the heat pumpsto provide design day capacities.
• Install too much ground-loop heat exchange surface which allows the heat pumps to easilyprovide design day capacities, but penalizes the systems from a first-cost perspective.
The key is to provide sufficient ground-loop heat exchange surface such that the design daycapacities can be meet while keeping the annual mean ground reservoir temperature essentiallyconstant. In reviewing actual data from two demonstration schools, one in Kentucky and one inNebraska, the month-to-month ground loop temperatures remained essentially constant duringthe year suggesting that the design could be overly conservative and would penalize life-cycleeconomics for these systems. Unfortunately, very little data exists on optimal ground-looptemperatures (hour-by hour or even month-to-month) to use for running energy models like HAPon an hour-by hour basis.
In the absence of established “curves” for ground-loop temperatures, L&A derived thesetemperatures by reviewing several ground-source heat pump design articles (e.g., OklahomaState University "Geothermal Heat Pumps Introductory Guide"), ARI geothermal heat pump test
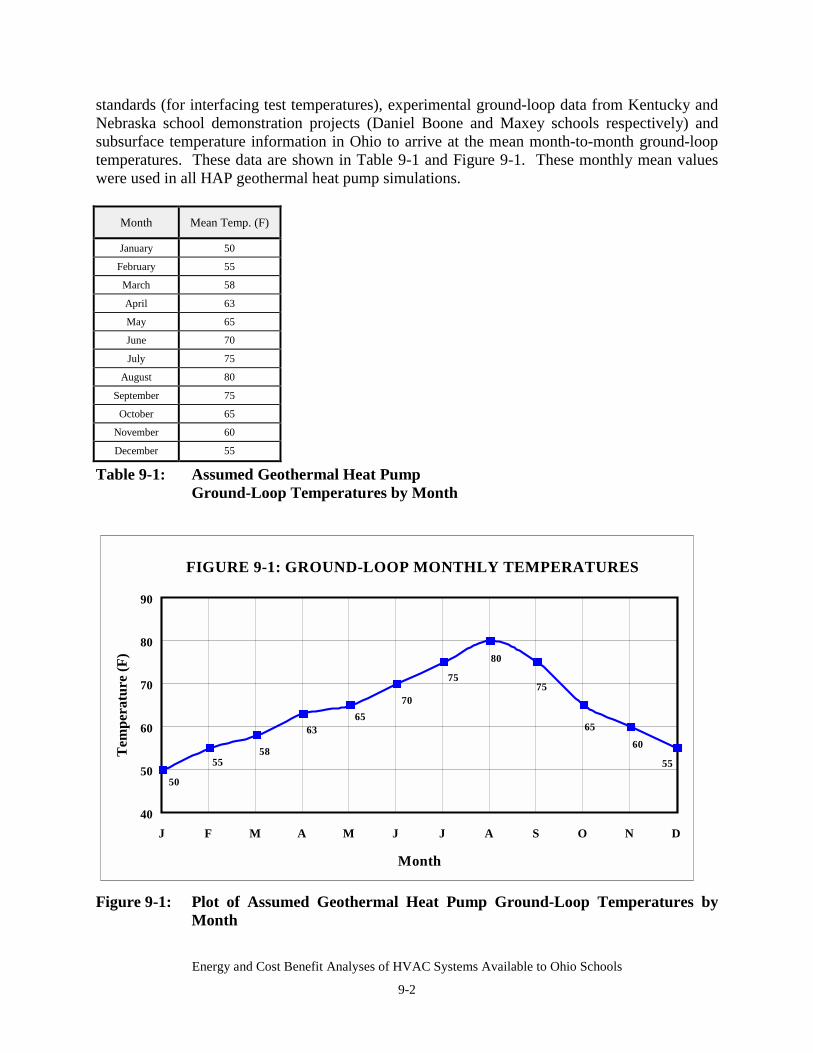
Energy and Cost Benefit Analyses of HVAC Systems Available to Ohio Schools
9-2
standards (for interfacing test temperatures), experimental ground-loop data from Kentucky andNebraska school demonstration projects (Daniel Boone and Maxey schools respectively) andsubsurface temperature information in Ohio to arrive at the mean month-to-month ground-looptemperatures. These data are shown in Table 9-1 and Figure 9-1. These monthly mean valueswere used in all HAP geothermal heat pump simulations.
Month Mean Temp. (F)
January 50
February 55
March 58
April 63
May 65
June 70
July 75
August 80
September 75
October 65
November 60
December 55
Table 9-1: Assumed Geothermal Heat PumpGround-Loop Temperatures by Month
Figure 9-1: Plot of Assumed Geothermal Heat Pump Ground-Loop Temperatures byMonth
FIGURE 9-1: GROUND-LOOP MONTHLY TEMPERATURES
50
5558
6365
70
75
80
75
65
60
55
40
50
60
70
80
90
J F M A M J J A S O N D
Month
Tem
pera
ture
(F)
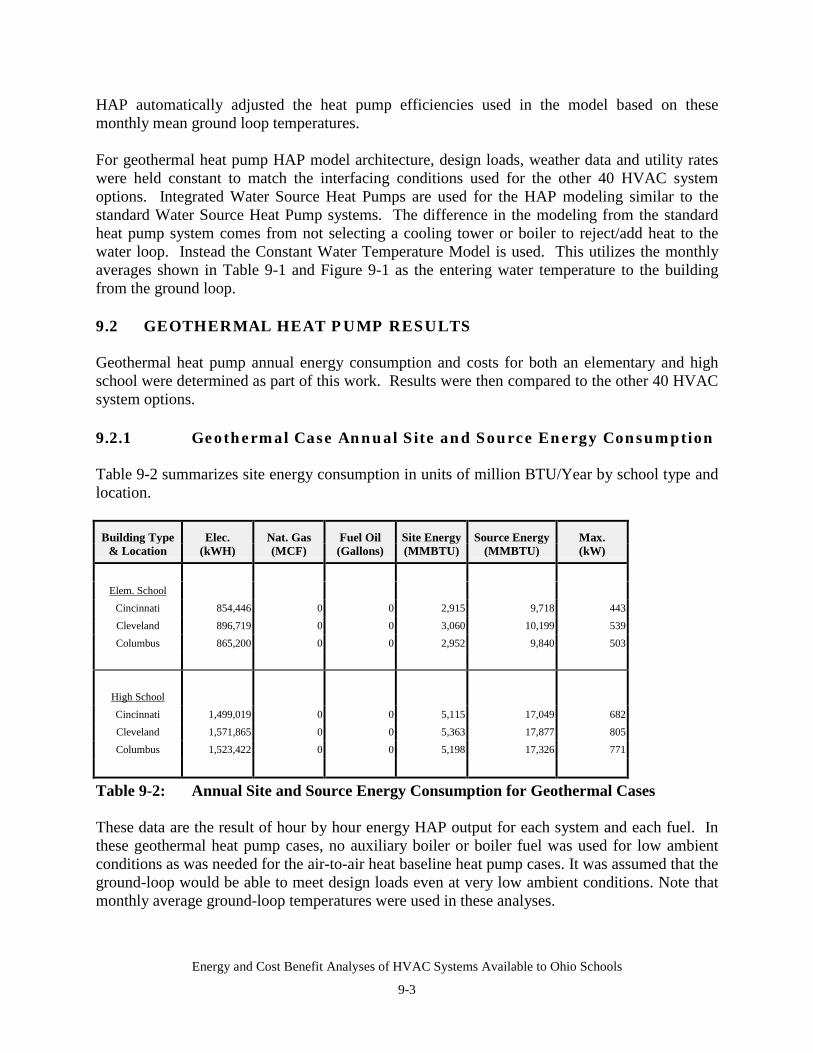
Energy and Cost Benefit Analyses of HVAC Systems Available to Ohio Schools
9-3
HAP automatically adjusted the heat pump efficiencies used in the model based on thesemonthly mean ground loop temperatures.
For geothermal heat pump HAP model architecture, design loads, weather data and utility rateswere held constant to match the interfacing conditions used for the other 40 HVAC systemoptions. Integrated Water Source Heat Pumps are used for the HAP modeling similar to thestandard Water Source Heat Pump systems. The difference in the modeling from the standardheat pump system comes from not selecting a cooling tower or boiler to reject/add heat to thewater loop. Instead the Constant Water Temperature Model is used. This utilizes the monthlyaverages shown in Table 9-1 and Figure 9-1 as the entering water temperature to the buildingfrom the ground loop.
9.2 GEOTHERMAL HEAT PUMP RESULTS
Geothermal heat pump annual energy consumption and costs for both an elementary and highschool were determined as part of this work. Results were then compared to the other 40 HVACsystem options.
9.2.1 Geothermal Case Annual Site and Source Energy Consumption
Table 9-2 summarizes site energy consumption in units of million BTU/Year by school type andlocation.
Building Type Elec. Nat. Gas Fuel Oil Site Energy Source Energy Max.& Location (kWH) (MCF) (Gallons) (MMBTU) (MMBTU) (kW)
Elem. SchoolCincinnati 854,446 0 0 2,915 9,718 443Cleveland 896,719 0 0 3,060 10,199 539Columbus 865,200 0 0 2,952 9,840 503
High SchoolCincinnati 1,499,019 0 0 5,115 17,049 682Cleveland 1,571,865 0 0 5,363 17,877 805Columbus 1,523,422 0 0 5,198 17,326 771
Table 9-2: Annual Site and Source Energy Consumption for Geothermal Cases
These data are the result of hour by hour energy HAP output for each system and each fuel. Inthese geothermal heat pump cases, no auxiliary boiler or boiler fuel was used for low ambientconditions as was needed for the air-to-air heat baseline heat pump cases. It was assumed that theground-loop would be able to meet design loads even at very low ambient conditions. Note thatmonthly average ground-loop temperatures were used in these analyses.
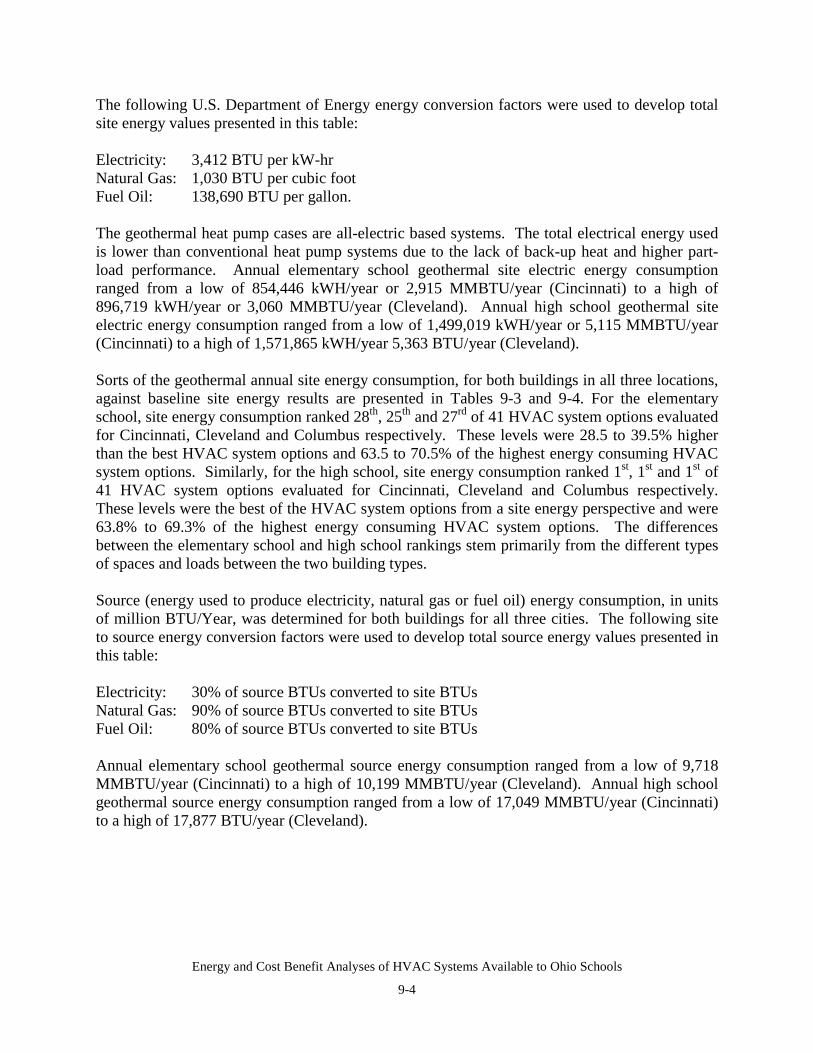
Energy and Cost Benefit Analyses of HVAC Systems Available to Ohio Schools
9-4
The following U.S. Department of Energy energy conversion factors were used to develop totalsite energy values presented in this table:
Electricity: 3,412 BTU per kW-hrNatural Gas: 1,030 BTU per cubic footFuel Oil: 138,690 BTU per gallon.
The geothermal heat pump cases are all-electric based systems. The total electrical energy usedis lower than conventional heat pump systems due to the lack of back-up heat and higher part-load performance. Annual elementary school geothermal site electric energy consumptionranged from a low of 854,446 kWH/year or 2,915 MMBTU/year (Cincinnati) to a high of896,719 kWH/year or 3,060 MMBTU/year (Cleveland). Annual high school geothermal siteelectric energy consumption ranged from a low of 1,499,019 kWH/year or 5,115 MMBTU/year(Cincinnati) to a high of 1,571,865 kWH/year 5,363 BTU/year (Cleveland).
Sorts of the geothermal annual site energy consumption, for both buildings in all three locations,against baseline site energy results are presented in Tables 9-3 and 9-4. For the elementaryschool, site energy consumption ranked 28th, 25th and 27rd of 41 HVAC system options evaluatedfor Cincinnati, Cleveland and Columbus respectively. These levels were 28.5 to 39.5% higherthan the best HVAC system options and 63.5 to 70.5% of the highest energy consuming HVACsystem options. Similarly, for the high school, site energy consumption ranked 1st, 1st and 1st of41 HVAC system options evaluated for Cincinnati, Cleveland and Columbus respectively.These levels were the best of the HVAC system options from a site energy perspective and were63.8% to 69.3% of the highest energy consuming HVAC system options. The differencesbetween the elementary school and high school rankings stem primarily from the different typesof spaces and loads between the two building types.
Source (energy used to produce electricity, natural gas or fuel oil) energy consumption, in unitsof million BTU/Year, was determined for both buildings for all three cities. The following siteto source energy conversion factors were used to develop total source energy values presented inthis table:
Electricity: 30% of source BTUs converted to site BTUsNatural Gas: 90% of source BTUs converted to site BTUsFuel Oil: 80% of source BTUs converted to site BTUs
Annual elementary school geothermal source energy consumption ranged from a low of 9,718MMBTU/year (Cincinnati) to a high of 10,199 MMBTU/year (Cleveland). Annual high schoolgeothermal source energy consumption ranged from a low of 17,049 MMBTU/year (Cincinnati)to a high of 17,877 BTU/year (Cleveland).
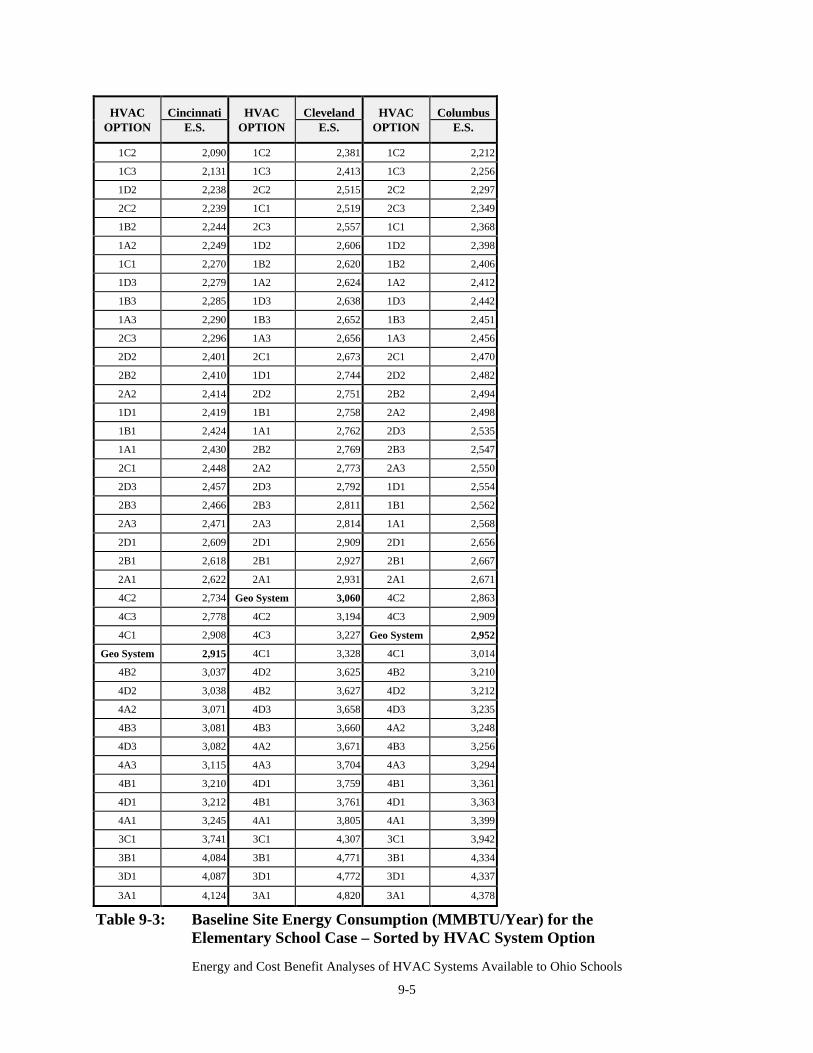
Energy and Cost Benefit Analyses of HVAC Systems Available to Ohio Schools
9-5
HVAC Cincinnati HVAC Cleveland HVAC ColumbusOPTION E.S. OPTION E.S. OPTION E.S.
1C2 2,090 1C2 2,381 1C2 2,212
1C3 2,131 1C3 2,413 1C3 2,256
1D2 2,238 2C2 2,515 2C2 2,297
2C2 2,239 1C1 2,519 2C3 2,349
1B2 2,244 2C3 2,557 1C1 2,368
1A2 2,249 1D2 2,606 1D2 2,398
1C1 2,270 1B2 2,620 1B2 2,406
1D3 2,279 1A2 2,624 1A2 2,412
1B3 2,285 1D3 2,638 1D3 2,442
1A3 2,290 1B3 2,652 1B3 2,451
2C3 2,296 1A3 2,656 1A3 2,456
2D2 2,401 2C1 2,673 2C1 2,470
2B2 2,410 1D1 2,744 2D2 2,482
2A2 2,414 2D2 2,751 2B2 2,494
1D1 2,419 1B1 2,758 2A2 2,498
1B1 2,424 1A1 2,762 2D3 2,535
1A1 2,430 2B2 2,769 2B3 2,547
2C1 2,448 2A2 2,773 2A3 2,550
2D3 2,457 2D3 2,792 1D1 2,554
2B3 2,466 2B3 2,811 1B1 2,562
2A3 2,471 2A3 2,814 1A1 2,568
2D1 2,609 2D1 2,909 2D1 2,656
2B1 2,618 2B1 2,927 2B1 2,667
2A1 2,622 2A1 2,931 2A1 2,671
4C2 2,734 Geo System 3,060 4C2 2,863
4C3 2,778 4C2 3,194 4C3 2,909
4C1 2,908 4C3 3,227 Geo System 2,952
Geo System 2,915 4C1 3,328 4C1 3,014
4B2 3,037 4D2 3,625 4B2 3,210
4D2 3,038 4B2 3,627 4D2 3,212
4A2 3,071 4D3 3,658 4D3 3,235
4B3 3,081 4B3 3,660 4A2 3,248
4D3 3,082 4A2 3,671 4B3 3,256
4A3 3,115 4A3 3,704 4A3 3,294
4B1 3,210 4D1 3,759 4B1 3,361
4D1 3,212 4B1 3,761 4D1 3,363
4A1 3,245 4A1 3,805 4A1 3,399
3C1 3,741 3C1 4,307 3C1 3,942
3B1 4,084 3B1 4,771 3B1 4,334
3D1 4,087 3D1 4,772 3D1 4,337
3A1 4,124 3A1 4,820 3A1 4,378
Table 9-3: Baseline Site Energy Consumption (MMBTU/Year) for theElementary School Case – Sorted by HVAC System Option
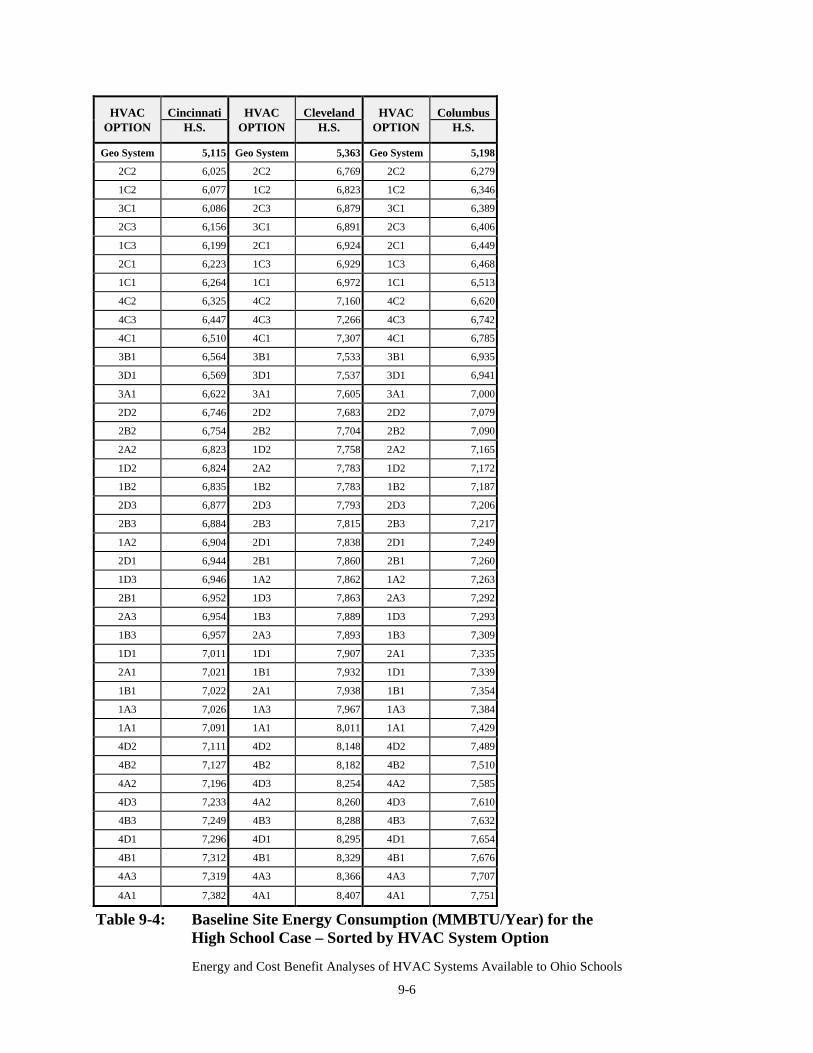
Energy and Cost Benefit Analyses of HVAC Systems Available to Ohio Schools
9-6
HVAC Cincinnati HVAC Cleveland HVAC ColumbusOPTION H.S. OPTION H.S. OPTION H.S.
Geo System 5,115 Geo System 5,363 Geo System 5,198
2C2 6,025 2C2 6,769 2C2 6,279
1C2 6,077 1C2 6,823 1C2 6,346
3C1 6,086 2C3 6,879 3C1 6,389
2C3 6,156 3C1 6,891 2C3 6,406
1C3 6,199 2C1 6,924 2C1 6,449
2C1 6,223 1C3 6,929 1C3 6,468
1C1 6,264 1C1 6,972 1C1 6,513
4C2 6,325 4C2 7,160 4C2 6,620
4C3 6,447 4C3 7,266 4C3 6,742
4C1 6,510 4C1 7,307 4C1 6,785
3B1 6,564 3B1 7,533 3B1 6,935
3D1 6,569 3D1 7,537 3D1 6,941
3A1 6,622 3A1 7,605 3A1 7,000
2D2 6,746 2D2 7,683 2D2 7,079
2B2 6,754 2B2 7,704 2B2 7,090
2A2 6,823 1D2 7,758 2A2 7,165
1D2 6,824 2A2 7,783 1D2 7,172
1B2 6,835 1B2 7,783 1B2 7,187
2D3 6,877 2D3 7,793 2D3 7,206
2B3 6,884 2B3 7,815 2B3 7,217
1A2 6,904 2D1 7,838 2D1 7,249
2D1 6,944 2B1 7,860 2B1 7,260
1D3 6,946 1A2 7,862 1A2 7,263
2B1 6,952 1D3 7,863 2A3 7,292
2A3 6,954 1B3 7,889 1D3 7,293
1B3 6,957 2A3 7,893 1B3 7,309
1D1 7,011 1D1 7,907 2A1 7,335
2A1 7,021 1B1 7,932 1D1 7,339
1B1 7,022 2A1 7,938 1B1 7,354
1A3 7,026 1A3 7,967 1A3 7,384
1A1 7,091 1A1 8,011 1A1 7,429
4D2 7,111 4D2 8,148 4D2 7,489
4B2 7,127 4B2 8,182 4B2 7,510
4A2 7,196 4D3 8,254 4A2 7,585
4D3 7,233 4A2 8,260 4D3 7,610
4B3 7,249 4B3 8,288 4B3 7,632
4D1 7,296 4D1 8,295 4D1 7,654
4B1 7,312 4B1 8,329 4B1 7,676
4A3 7,319 4A3 8,366 4A3 7,707
4A1 7,382 4A1 8,407 4A1 7,751
Table 9-4: Baseline Site Energy Consumption (MMBTU/Year) for theHigh School Case – Sorted by HVAC System Option
Energy and Cost Benefit Analyses of HVAC Systems Available to Ohio Schools
9-7
Sorts of the geothermal annual source energy consumption, for both buildings in all threelocations, against baseline source energy results are presented in Tables 9-5 and 9-6. For theelementary school, source energy consumption ranked 37th, 33th and 28rd of 41 HVAC systemoptions evaluated for Cincinnati, Cleveland and Columbus respectively. These levels were 60.1to 65.6% higher than the best HVAC system options and 71.4 to 77.9% of the highest energyconsuming HVAC system options. Similarly, for the high school, source energy consumptionranked 28st, 27st and 27st of 41 HVAC system options evaluated for Cincinnati, Cleveland andColumbus respectively. These levels were 13.7 to 15.3% higher than the best of the HVACsystem options from a site energy perspective and were 73.4% to 78.6% of the highest energyconsuming HVAC system options.
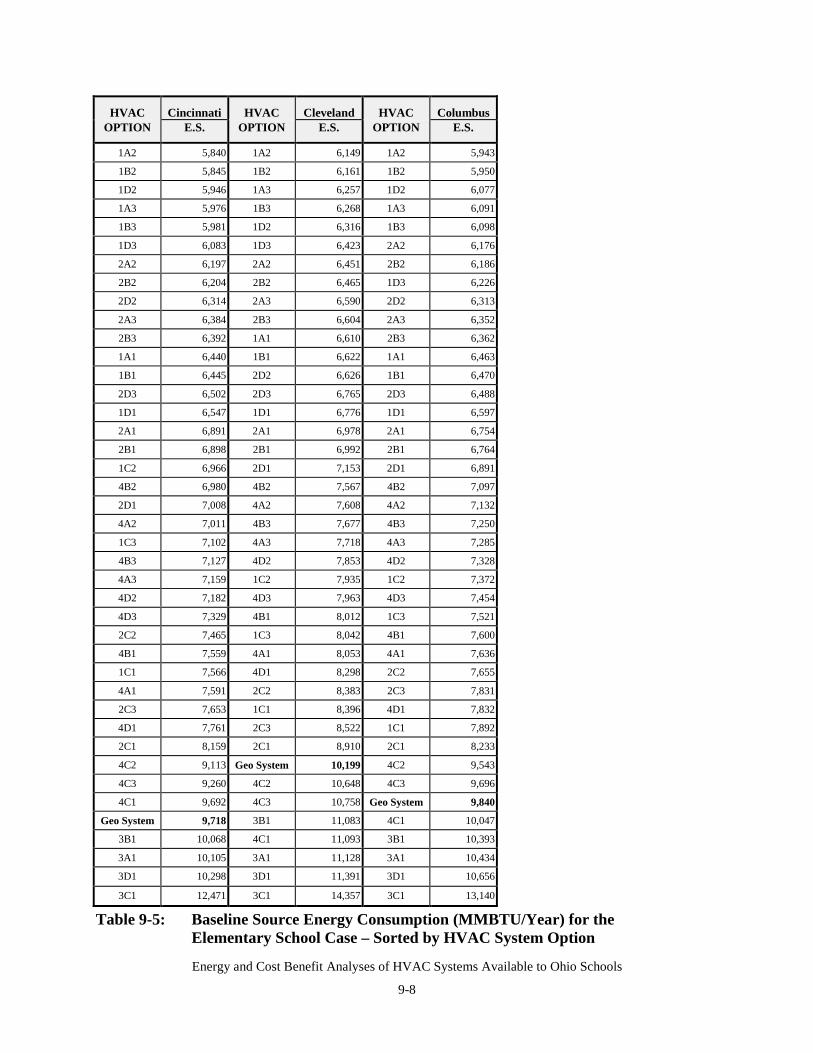
Energy and Cost Benefit Analyses of HVAC Systems Available to Ohio Schools
9-8
HVAC Cincinnati HVAC Cleveland HVAC ColumbusOPTION E.S. OPTION E.S. OPTION E.S.
1A2 5,840 1A2 6,149 1A2 5,943
1B2 5,845 1B2 6,161 1B2 5,950
1D2 5,946 1A3 6,257 1D2 6,077
1A3 5,976 1B3 6,268 1A3 6,091
1B3 5,981 1D2 6,316 1B3 6,098
1D3 6,083 1D3 6,423 2A2 6,176
2A2 6,197 2A2 6,451 2B2 6,186
2B2 6,204 2B2 6,465 1D3 6,226
2D2 6,314 2A3 6,590 2D2 6,313
2A3 6,384 2B3 6,604 2A3 6,352
2B3 6,392 1A1 6,610 2B3 6,362
1A1 6,440 1B1 6,622 1A1 6,463
1B1 6,445 2D2 6,626 1B1 6,470
2D3 6,502 2D3 6,765 2D3 6,488
1D1 6,547 1D1 6,776 1D1 6,597
2A1 6,891 2A1 6,978 2A1 6,754
2B1 6,898 2B1 6,992 2B1 6,764
1C2 6,966 2D1 7,153 2D1 6,891
4B2 6,980 4B2 7,567 4B2 7,097
2D1 7,008 4A2 7,608 4A2 7,132
4A2 7,011 4B3 7,677 4B3 7,250
1C3 7,102 4A3 7,718 4A3 7,285
4B3 7,127 4D2 7,853 4D2 7,328
4A3 7,159 1C2 7,935 1C2 7,372
4D2 7,182 4D3 7,963 4D3 7,454
4D3 7,329 4B1 8,012 1C3 7,521
2C2 7,465 1C3 8,042 4B1 7,600
4B1 7,559 4A1 8,053 4A1 7,636
1C1 7,566 4D1 8,298 2C2 7,655
4A1 7,591 2C2 8,383 2C3 7,831
2C3 7,653 1C1 8,396 4D1 7,832
4D1 7,761 2C3 8,522 1C1 7,892
2C1 8,159 2C1 8,910 2C1 8,233
4C2 9,113 Geo System 10,199 4C2 9,543
4C3 9,260 4C2 10,648 4C3 9,696
4C1 9,692 4C3 10,758 Geo System 9,840
Geo System 9,718 3B1 11,083 4C1 10,047
3B1 10,068 4C1 11,093 3B1 10,393
3A1 10,105 3A1 11,128 3A1 10,434
3D1 10,298 3D1 11,391 3D1 10,656
3C1 12,471 3C1 14,357 3C1 13,140
Table 9-5: Baseline Source Energy Consumption (MMBTU/Year) for theElementary School Case – Sorted by HVAC System Option
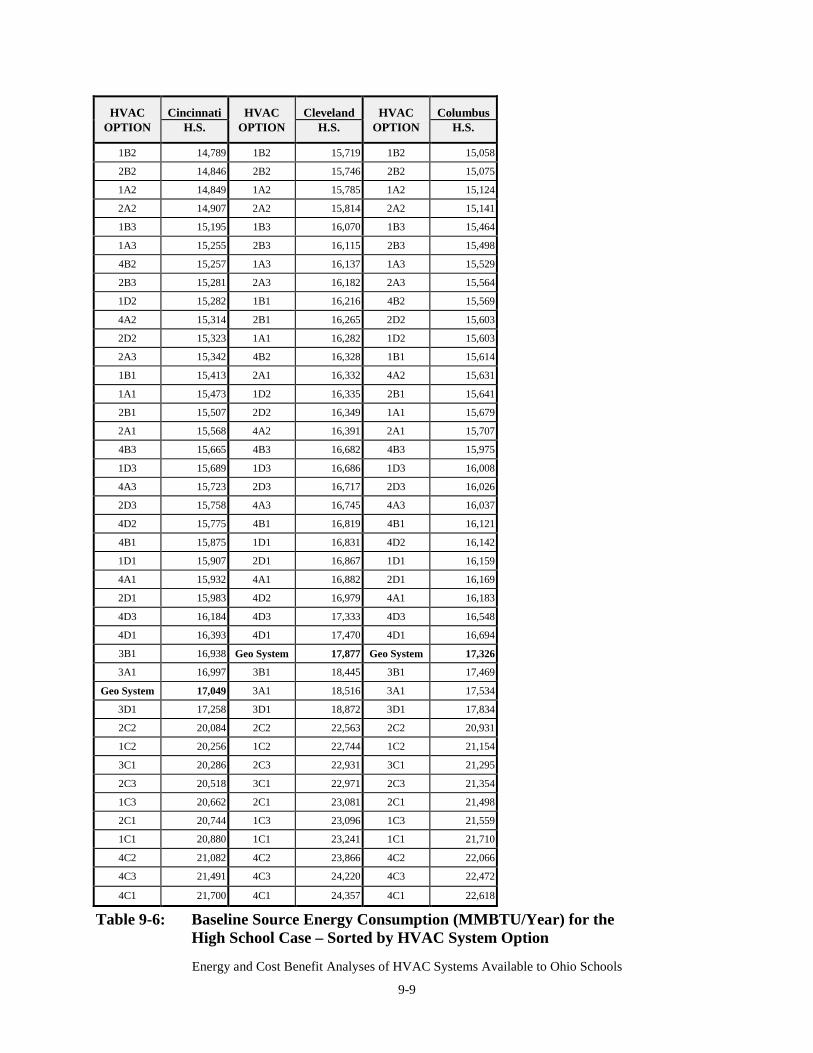
Energy and Cost Benefit Analyses of HVAC Systems Available to Ohio Schools
9-9
HVAC Cincinnati HVAC Cleveland HVAC ColumbusOPTION H.S. OPTION H.S. OPTION H.S.
1B2 14,789 1B2 15,719 1B2 15,058
2B2 14,846 2B2 15,746 2B2 15,075
1A2 14,849 1A2 15,785 1A2 15,124
2A2 14,907 2A2 15,814 2A2 15,141
1B3 15,195 1B3 16,070 1B3 15,464
1A3 15,255 2B3 16,115 2B3 15,498
4B2 15,257 1A3 16,137 1A3 15,529
2B3 15,281 2A3 16,182 2A3 15,564
1D2 15,282 1B1 16,216 4B2 15,569
4A2 15,314 2B1 16,265 2D2 15,603
2D2 15,323 1A1 16,282 1D2 15,603
2A3 15,342 4B2 16,328 1B1 15,614
1B1 15,413 2A1 16,332 4A2 15,631
1A1 15,473 1D2 16,335 2B1 15,641
2B1 15,507 2D2 16,349 1A1 15,679
2A1 15,568 4A2 16,391 2A1 15,707
4B3 15,665 4B3 16,682 4B3 15,975
1D3 15,689 1D3 16,686 1D3 16,008
4A3 15,723 2D3 16,717 2D3 16,026
2D3 15,758 4A3 16,745 4A3 16,037
4D2 15,775 4B1 16,819 4B1 16,121
4B1 15,875 1D1 16,831 4D2 16,142
1D1 15,907 2D1 16,867 1D1 16,159
4A1 15,932 4A1 16,882 2D1 16,169
2D1 15,983 4D2 16,979 4A1 16,183
4D3 16,184 4D3 17,333 4D3 16,548
4D1 16,393 4D1 17,470 4D1 16,694
3B1 16,938 Geo System 17,877 Geo System 17,326
3A1 16,997 3B1 18,445 3B1 17,469
Geo System 17,049 3A1 18,516 3A1 17,534
3D1 17,258 3D1 18,872 3D1 17,834
2C2 20,084 2C2 22,563 2C2 20,931
1C2 20,256 1C2 22,744 1C2 21,154
3C1 20,286 2C3 22,931 3C1 21,295
2C3 20,518 3C1 22,971 2C3 21,354
1C3 20,662 2C1 23,081 2C1 21,498
2C1 20,744 1C3 23,096 1C3 21,559
1C1 20,880 1C1 23,241 1C1 21,710
4C2 21,082 4C2 23,866 4C2 22,066
4C3 21,491 4C3 24,220 4C3 22,472
4C1 21,700 4C1 24,357 4C1 22,618
Table 9-6: Baseline Source Energy Consumption (MMBTU/Year) for theHigh School Case – Sorted by HVAC System Option
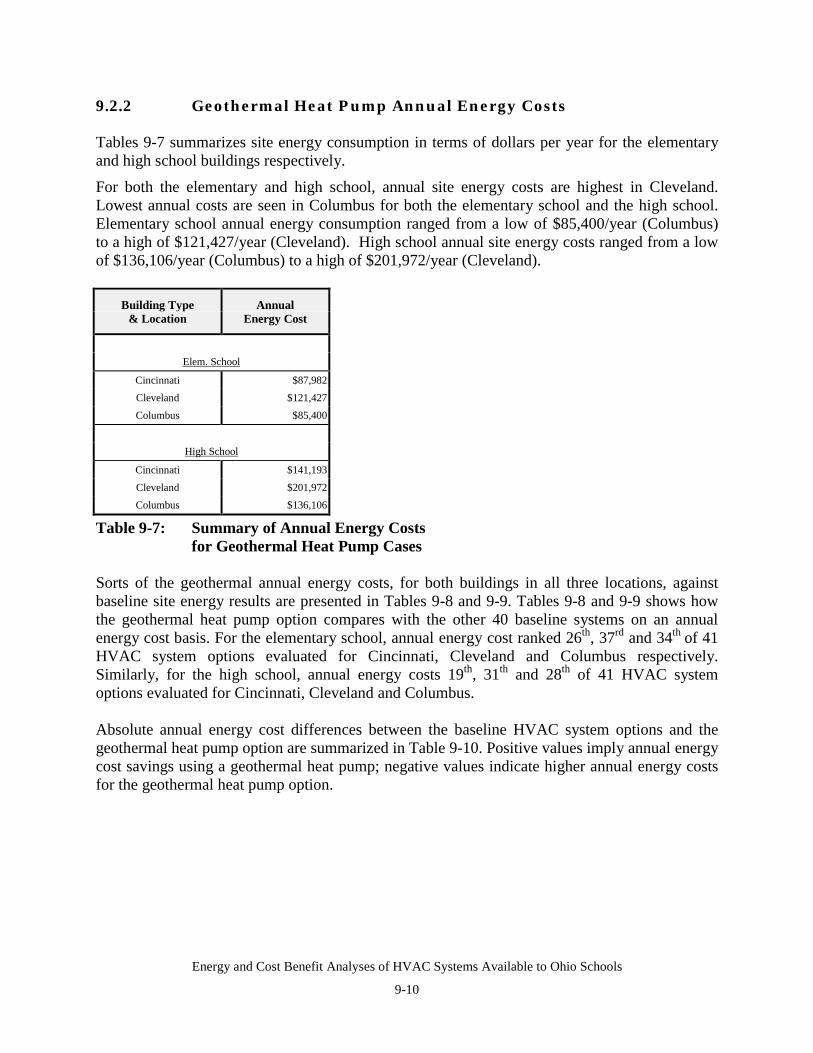
Energy and Cost Benefit Analyses of HVAC Systems Available to Ohio Schools
9-10
9.2.2 Geothermal Heat Pump Annual Energy Costs
Tables 9-7 summarizes site energy consumption in terms of dollars per year for the elementaryand high school buildings respectively.
For both the elementary and high school, annual site energy costs are highest in Cleveland.Lowest annual costs are seen in Columbus for both the elementary school and the high school.Elementary school annual energy consumption ranged from a low of $85,400/year (Columbus)to a high of $121,427/year (Cleveland). High school annual site energy costs ranged from a lowof $136,106/year (Columbus) to a high of $201,972/year (Cleveland).
Building Type Annual& Location Energy Cost
Elem. School
Cincinnati $87,982Cleveland $121,427Columbus $85,400
High School
Cincinnati $141,193Cleveland $201,972Columbus $136,106
Table 9-7: Summary of Annual Energy Costsfor Geothermal Heat Pump Cases
Sorts of the geothermal annual energy costs, for both buildings in all three locations, againstbaseline site energy results are presented in Tables 9-8 and 9-9. Tables 9-8 and 9-9 shows howthe geothermal heat pump option compares with the other 40 baseline systems on an annualenergy cost basis. For the elementary school, annual energy cost ranked 26th, 37rd and 34th of 41HVAC system options evaluated for Cincinnati, Cleveland and Columbus respectively.Similarly, for the high school, annual energy costs 19th, 31th and 28th of 41 HVAC systemoptions evaluated for Cincinnati, Cleveland and Columbus.
Absolute annual energy cost differences between the baseline HVAC system options and thegeothermal heat pump option are summarized in Table 9-10. Positive values imply annual energycost savings using a geothermal heat pump; negative values indicate higher annual energy costsfor the geothermal heat pump option.
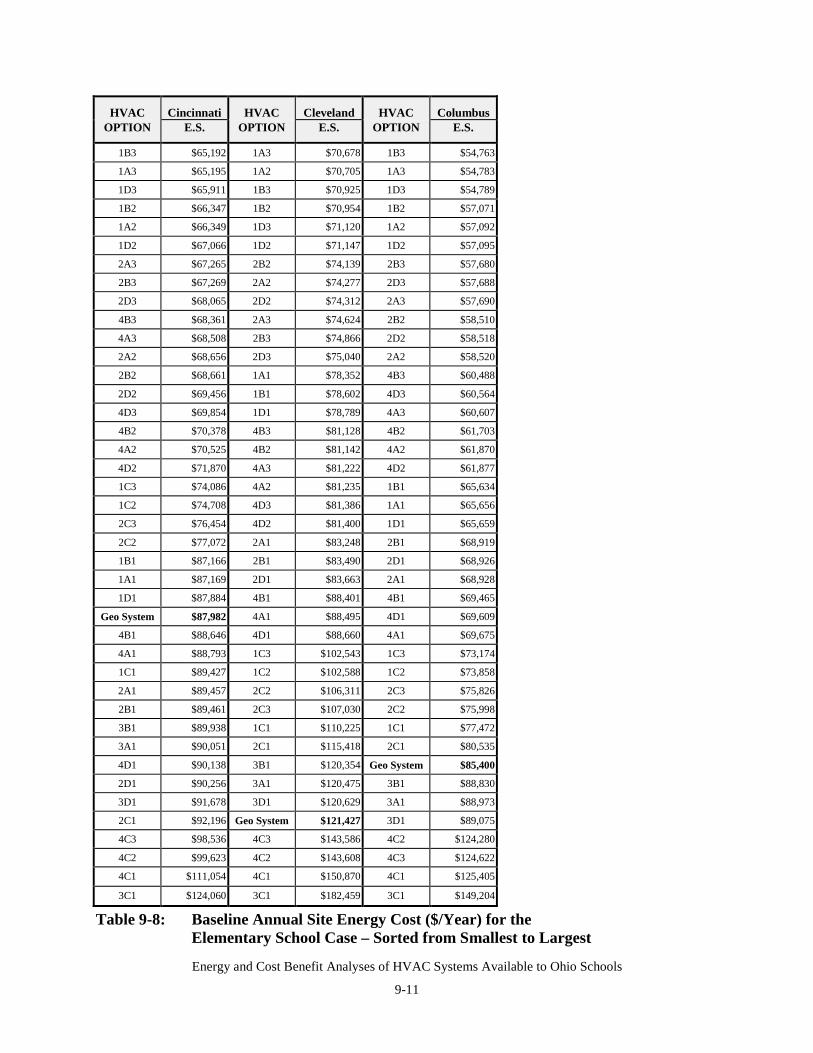
Energy and Cost Benefit Analyses of HVAC Systems Available to Ohio Schools
9-11
HVAC Cincinnati HVAC Cleveland HVAC ColumbusOPTION E.S. OPTION E.S. OPTION E.S.
1B3 $65,192 1A3 $70,678 1B3 $54,763
1A3 $65,195 1A2 $70,705 1A3 $54,783
1D3 $65,911 1B3 $70,925 1D3 $54,789
1B2 $66,347 1B2 $70,954 1B2 $57,071
1A2 $66,349 1D3 $71,120 1A2 $57,092
1D2 $67,066 1D2 $71,147 1D2 $57,095
2A3 $67,265 2B2 $74,139 2B3 $57,680
2B3 $67,269 2A2 $74,277 2D3 $57,688
2D3 $68,065 2D2 $74,312 2A3 $57,690
4B3 $68,361 2A3 $74,624 2B2 $58,510
4A3 $68,508 2B3 $74,866 2D2 $58,518
2A2 $68,656 2D3 $75,040 2A2 $58,520
2B2 $68,661 1A1 $78,352 4B3 $60,488
2D2 $69,456 1B1 $78,602 4D3 $60,564
4D3 $69,854 1D1 $78,789 4A3 $60,607
4B2 $70,378 4B3 $81,128 4B2 $61,703
4A2 $70,525 4B2 $81,142 4A2 $61,870
4D2 $71,870 4A3 $81,222 4D2 $61,877
1C3 $74,086 4A2 $81,235 1B1 $65,634
1C2 $74,708 4D3 $81,386 1A1 $65,656
2C3 $76,454 4D2 $81,400 1D1 $65,659
2C2 $77,072 2A1 $83,248 2B1 $68,919
1B1 $87,166 2B1 $83,490 2D1 $68,926
1A1 $87,169 2D1 $83,663 2A1 $68,928
1D1 $87,884 4B1 $88,401 4B1 $69,465
Geo System $87,982 4A1 $88,495 4D1 $69,609
4B1 $88,646 4D1 $88,660 4A1 $69,675
4A1 $88,793 1C3 $102,543 1C3 $73,174
1C1 $89,427 1C2 $102,588 1C2 $73,858
2A1 $89,457 2C2 $106,311 2C3 $75,826
2B1 $89,461 2C3 $107,030 2C2 $75,998
3B1 $89,938 1C1 $110,225 1C1 $77,472
3A1 $90,051 2C1 $115,418 2C1 $80,535
4D1 $90,138 3B1 $120,354 Geo System $85,400
2D1 $90,256 3A1 $120,475 3B1 $88,830
3D1 $91,678 3D1 $120,629 3A1 $88,973
2C1 $92,196 Geo System $121,427 3D1 $89,075
4C3 $98,536 4C3 $143,586 4C2 $124,280
4C2 $99,623 4C2 $143,608 4C3 $124,622
4C1 $111,054 4C1 $150,870 4C1 $125,405
3C1 $124,060 3C1 $182,459 3C1 $149,204
Table 9-8: Baseline Annual Site Energy Cost ($/Year) for theElementary School Case – Sorted from Smallest to Largest
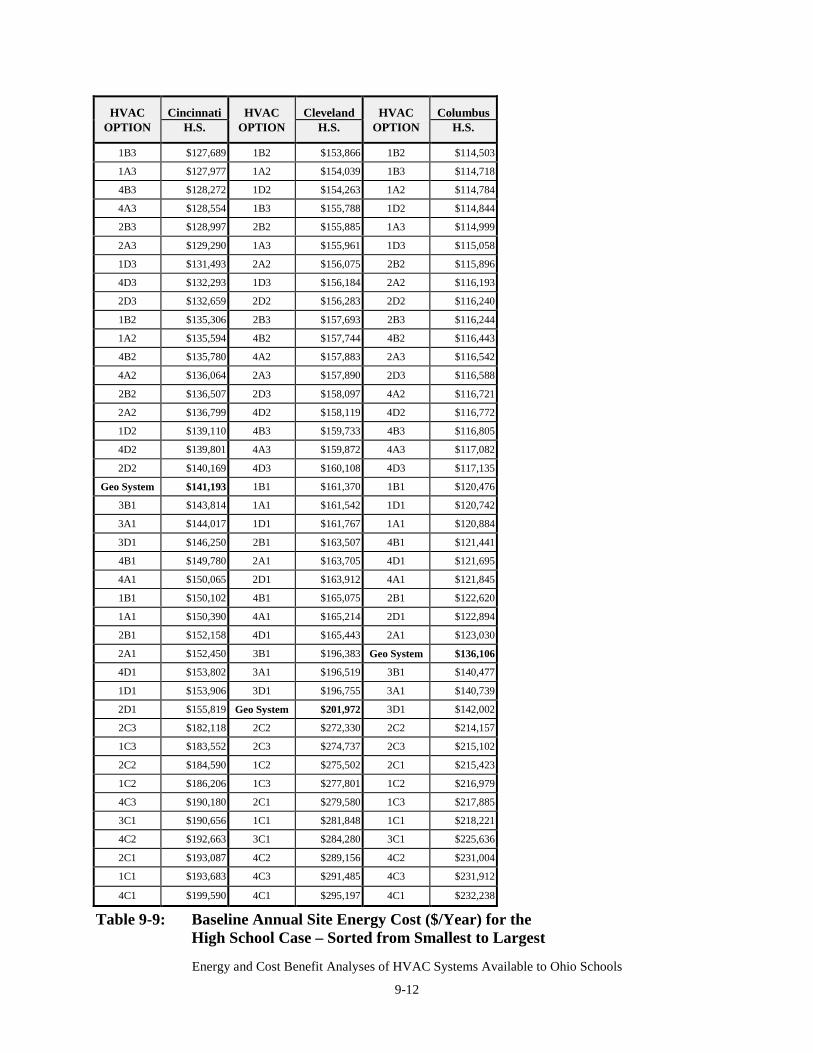
Energy and Cost Benefit Analyses of HVAC Systems Available to Ohio Schools
9-12
HVAC Cincinnati HVAC Cleveland HVAC ColumbusOPTION H.S. OPTION H.S. OPTION H.S.
1B3 $127,689 1B2 $153,866 1B2 $114,503
1A3 $127,977 1A2 $154,039 1B3 $114,718
4B3 $128,272 1D2 $154,263 1A2 $114,784
4A3 $128,554 1B3 $155,788 1D2 $114,844
2B3 $128,997 2B2 $155,885 1A3 $114,999
2A3 $129,290 1A3 $155,961 1D3 $115,058
1D3 $131,493 2A2 $156,075 2B2 $115,896
4D3 $132,293 1D3 $156,184 2A2 $116,193
2D3 $132,659 2D2 $156,283 2D2 $116,240
1B2 $135,306 2B3 $157,693 2B3 $116,244
1A2 $135,594 4B2 $157,744 4B2 $116,443
4B2 $135,780 4A2 $157,883 2A3 $116,542
4A2 $136,064 2A3 $157,890 2D3 $116,588
2B2 $136,507 2D3 $158,097 4A2 $116,721
2A2 $136,799 4D2 $158,119 4D2 $116,772
1D2 $139,110 4B3 $159,733 4B3 $116,805
4D2 $139,801 4A3 $159,872 4A3 $117,082
2D2 $140,169 4D3 $160,108 4D3 $117,135
Geo System $141,193 1B1 $161,370 1B1 $120,476
3B1 $143,814 1A1 $161,542 1D1 $120,742
3A1 $144,017 1D1 $161,767 1A1 $120,884
3D1 $146,250 2B1 $163,507 4B1 $121,441
4B1 $149,780 2A1 $163,705 4D1 $121,695
4A1 $150,065 2D1 $163,912 4A1 $121,845
1B1 $150,102 4B1 $165,075 2B1 $122,620
1A1 $150,390 4A1 $165,214 2D1 $122,894
2B1 $152,158 4D1 $165,443 2A1 $123,030
2A1 $152,450 3B1 $196,383 Geo System $136,106
4D1 $153,802 3A1 $196,519 3B1 $140,477
1D1 $153,906 3D1 $196,755 3A1 $140,739
2D1 $155,819 Geo System $201,972 3D1 $142,002
2C3 $182,118 2C2 $272,330 2C2 $214,157
1C3 $183,552 2C3 $274,737 2C3 $215,102
2C2 $184,590 1C2 $275,502 2C1 $215,423
1C2 $186,206 1C3 $277,801 1C2 $216,979
4C3 $190,180 2C1 $279,580 1C3 $217,885
3C1 $190,656 1C1 $281,848 1C1 $218,221
4C2 $192,663 3C1 $284,280 3C1 $225,636
2C1 $193,087 4C2 $289,156 4C2 $231,004
1C1 $193,683 4C3 $291,485 4C3 $231,912
4C1 $199,590 4C1 $295,197 4C1 $232,238
Table 9-9: Baseline Annual Site Energy Cost ($/Year) for theHigh School Case – Sorted from Smallest to Largest
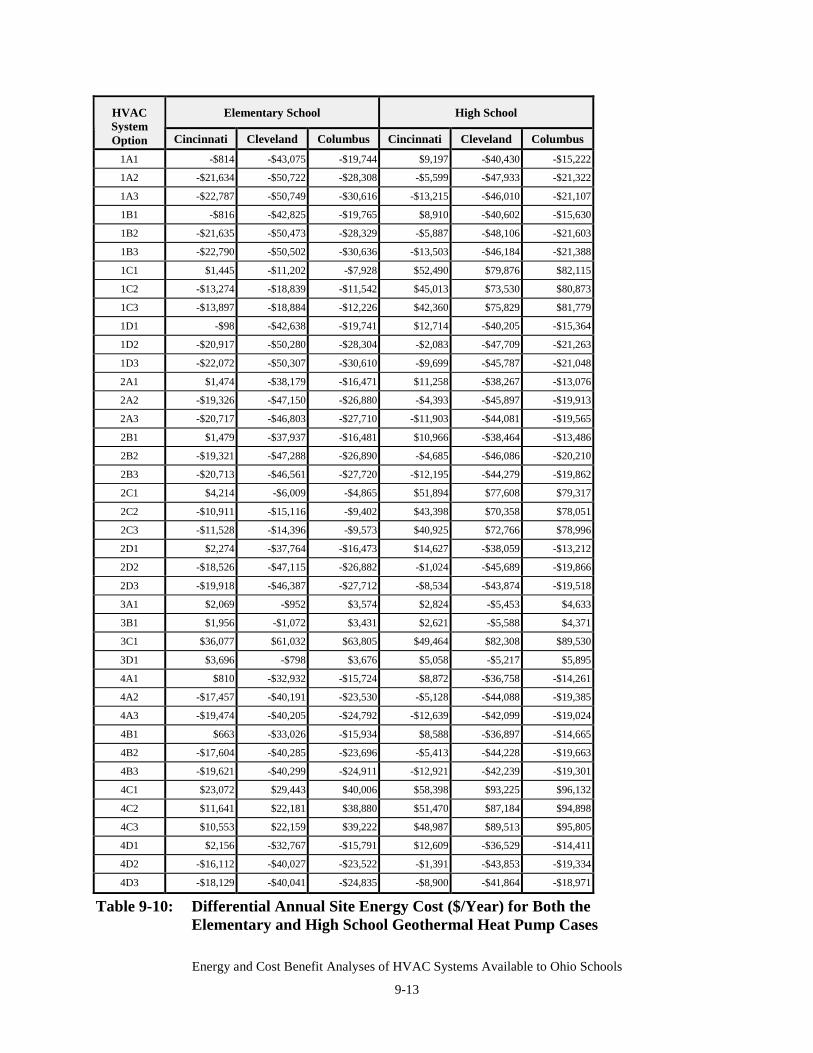
Energy and Cost Benefit Analyses of HVAC Systems Available to Ohio Schools
9-13
Elementary School High SchoolHVACSystemOption Cincinnati Cleveland Columbus Cincinnati Cleveland Columbus
1A1 -$814 -$43,075 -$19,744 $9,197 -$40,430 -$15,222
1A2 -$21,634 -$50,722 -$28,308 -$5,599 -$47,933 -$21,322
1A3 -$22,787 -$50,749 -$30,616 -$13,215 -$46,010 -$21,107
1B1 -$816 -$42,825 -$19,765 $8,910 -$40,602 -$15,630
1B2 -$21,635 -$50,473 -$28,329 -$5,887 -$48,106 -$21,603
1B3 -$22,790 -$50,502 -$30,636 -$13,503 -$46,184 -$21,388
1C1 $1,445 -$11,202 -$7,928 $52,490 $79,876 $82,115
1C2 -$13,274 -$18,839 -$11,542 $45,013 $73,530 $80,873
1C3 -$13,897 -$18,884 -$12,226 $42,360 $75,829 $81,779
1D1 -$98 -$42,638 -$19,741 $12,714 -$40,205 -$15,364
1D2 -$20,917 -$50,280 -$28,304 -$2,083 -$47,709 -$21,263
1D3 -$22,072 -$50,307 -$30,610 -$9,699 -$45,787 -$21,048
2A1 $1,474 -$38,179 -$16,471 $11,258 -$38,267 -$13,076
2A2 -$19,326 -$47,150 -$26,880 -$4,393 -$45,897 -$19,913
2A3 -$20,717 -$46,803 -$27,710 -$11,903 -$44,081 -$19,565
2B1 $1,479 -$37,937 -$16,481 $10,966 -$38,464 -$13,486
2B2 -$19,321 -$47,288 -$26,890 -$4,685 -$46,086 -$20,210
2B3 -$20,713 -$46,561 -$27,720 -$12,195 -$44,279 -$19,862
2C1 $4,214 -$6,009 -$4,865 $51,894 $77,608 $79,317
2C2 -$10,911 -$15,116 -$9,402 $43,398 $70,358 $78,051
2C3 -$11,528 -$14,396 -$9,573 $40,925 $72,766 $78,996
2D1 $2,274 -$37,764 -$16,473 $14,627 -$38,059 -$13,212
2D2 -$18,526 -$47,115 -$26,882 -$1,024 -$45,689 -$19,866
2D3 -$19,918 -$46,387 -$27,712 -$8,534 -$43,874 -$19,518
3A1 $2,069 -$952 $3,574 $2,824 -$5,453 $4,633
3B1 $1,956 -$1,072 $3,431 $2,621 -$5,588 $4,371
3C1 $36,077 $61,032 $63,805 $49,464 $82,308 $89,530
3D1 $3,696 -$798 $3,676 $5,058 -$5,217 $5,895
4A1 $810 -$32,932 -$15,724 $8,872 -$36,758 -$14,261
4A2 -$17,457 -$40,191 -$23,530 -$5,128 -$44,088 -$19,385
4A3 -$19,474 -$40,205 -$24,792 -$12,639 -$42,099 -$19,024
4B1 $663 -$33,026 -$15,934 $8,588 -$36,897 -$14,665
4B2 -$17,604 -$40,285 -$23,696 -$5,413 -$44,228 -$19,663
4B3 -$19,621 -$40,299 -$24,911 -$12,921 -$42,239 -$19,301
4C1 $23,072 $29,443 $40,006 $58,398 $93,225 $96,132
4C2 $11,641 $22,181 $38,880 $51,470 $87,184 $94,898
4C3 $10,553 $22,159 $39,222 $48,987 $89,513 $95,805
4D1 $2,156 -$32,767 -$15,791 $12,609 -$36,529 -$14,411
4D2 -$16,112 -$40,027 -$23,522 -$1,391 -$43,853 -$19,334
4D3 -$18,129 -$40,041 -$24,835 -$8,900 -$41,864 -$18,971
Table 9-10: Differential Annual Site Energy Cost ($/Year) for Both theElementary and High School Geothermal Heat Pump Cases
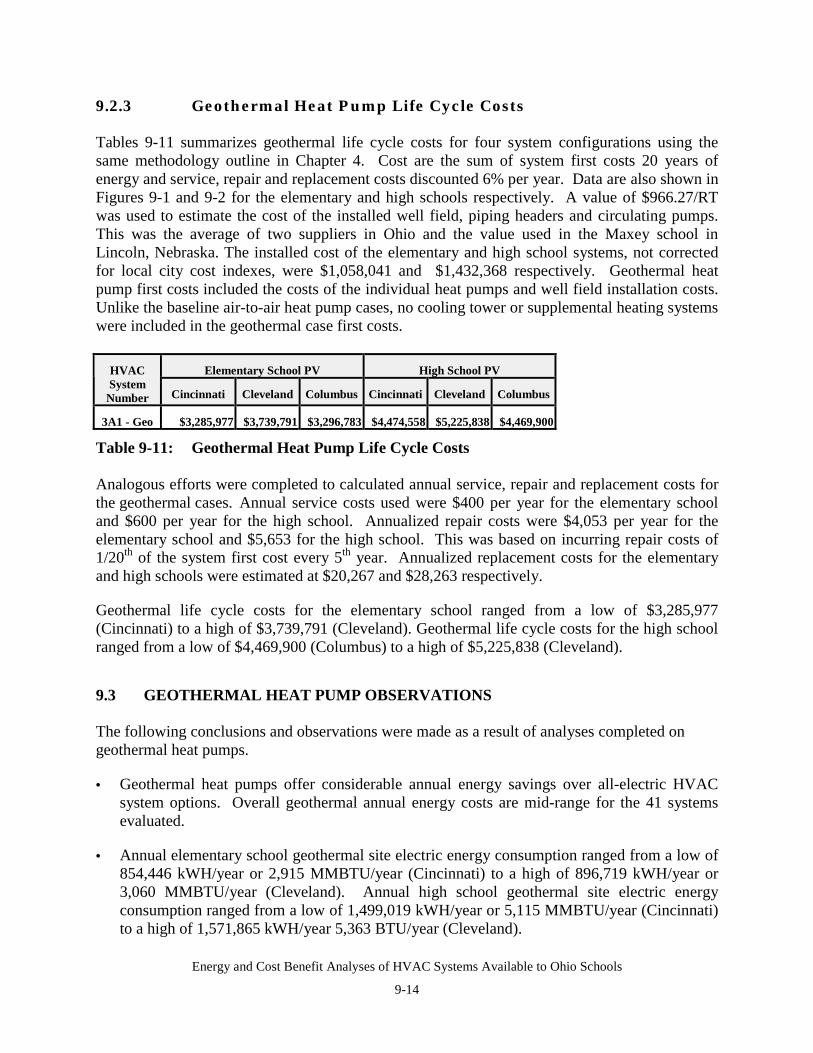
Energy and Cost Benefit Analyses of HVAC Systems Available to Ohio Schools
9-14
9.2.3 Geothermal Heat Pump Life Cycle Costs
Tables 9-11 summarizes geothermal life cycle costs for four system configurations using thesame methodology outline in Chapter 4. Cost are the sum of system first costs 20 years ofenergy and service, repair and replacement costs discounted 6% per year. Data are also shown inFigures 9-1 and 9-2 for the elementary and high schools respectively. A value of $966.27/RTwas used to estimate the cost of the installed well field, piping headers and circulating pumps.This was the average of two suppliers in Ohio and the value used in the Maxey school inLincoln, Nebraska. The installed cost of the elementary and high school systems, not correctedfor local city cost indexes, were $1,058,041 and $1,432,368 respectively. Geothermal heatpump first costs included the costs of the individual heat pumps and well field installation costs.Unlike the baseline air-to-air heat pump cases, no cooling tower or supplemental heating systemswere included in the geothermal case first costs.
Elementary School PV High School PVHVACSystem
Number Cincinnati Cleveland Columbus Cincinnati Cleveland Columbus
3A1 - Geo $3,285,977 $3,739,791 $3,296,783 $4,474,558 $5,225,838 $4,469,900
Table 9-11: Geothermal Heat Pump Life Cycle Costs
Analogous efforts were completed to calculated annual service, repair and replacement costs forthe geothermal cases. Annual service costs used were $400 per year for the elementary schooland $600 per year for the high school. Annualized repair costs were $4,053 per year for theelementary school and $5,653 for the high school. This was based on incurring repair costs of1/20th of the system first cost every 5th year. Annualized replacement costs for the elementaryand high schools were estimated at $20,267 and $28,263 respectively.
Geothermal life cycle costs for the elementary school ranged from a low of $3,285,977(Cincinnati) to a high of $3,739,791 (Cleveland). Geothermal life cycle costs for the high schoolranged from a low of $4,469,900 (Columbus) to a high of $5,225,838 (Cleveland).
9.3 GEOTHERMAL HEAT PUMP OBSERVATIONS
The following conclusions and observations were made as a result of analyses completed ongeothermal heat pumps.
• Geothermal heat pumps offer considerable annual energy savings over all-electric HVACsystem options. Overall geothermal annual energy costs are mid-range for the 41 systemsevaluated.
• Annual elementary school geothermal site electric energy consumption ranged from a low of854,446 kWH/year or 2,915 MMBTU/year (Cincinnati) to a high of 896,719 kWH/year or3,060 MMBTU/year (Cleveland). Annual high school geothermal site electric energyconsumption ranged from a low of 1,499,019 kWH/year or 5,115 MMBTU/year (Cincinnati)to a high of 1,571,865 kWH/year 5,363 BTU/year (Cleveland).
Energy and Cost Benefit Analyses of HVAC Systems Available to Ohio Schools
9-15
• For the elementary school, site energy consumption ranked 28th, 25th and 27rd of 41 HVACsystem options evaluated for Cincinnati, Cleveland and Columbus respectively. These levelswere 28.5 to 39.5% higher than the best HVAC system options and 63.5 to 70.5% of thehighest energy consuming HVAC system options.
• Similarly, for the high school, site energy consumption ranked 1st, 1st and 1st of 41 HVACsystem options evaluated for Cincinnati, Cleveland and Columbus respectively. These levelswere the best of the HVAC system options from a site energy perspective and were 63.8% to69.3% of the highest energy consuming HVAC system options.
• For both the elementary and high school, annual site energy costs are highest in Cleveland.Lowest annual costs are seen in Columbus for both the elementary school and the highschool. Elementary school annual energy consumption ranged from a low of $85,400/year(Columbus) to a high of $121,427/year (Cleveland). High school annual site energy costsranged from a low of $136,106/year (Columbus) to a high of $201,972/year (Cleveland).
• For the elementary school, annual energy cost ranked 26th, 37rd and 34th of 41 HVAC systemoptions evaluated for Cincinnati, Cleveland and Columbus respectively. Similarly, for thehigh school, annual energy costs 19th, 31th and 28th of 41 HVAC system options evaluated forCincinnati, Cleveland and Columbus.
Energy and Cost Benefit Analyses of HVAC Systems Available to Ohio Schools
10-1
10.0 DAYLIGHTING ANALYSES
Daylighting, or the use of natural light to illuminate building spaces, has recently receivedincreased attention in the popular press. Perhaps of most interest to schools have been reportssuggesting certain forms of daylighting are responsible for improved student test scores onstandardized tests. In general, diffused light has been found to be more effective than directdaylight found on clear days. These impacts were recognized in the 1950s and 1960s but largelyforgotten with energy conservation measures built into school architecture in the 1970s as aresponse to the energy crises of that period. From 1980 until the present, windows have beenused in classrooms in a limited manner, principally to provide views to the outdoors by thebuilding occupants. To help the reader with terminology used in this section, a list of daylightingrelated definitions follows this section of the report.
The objective of this daylighting work was to evaluate two daylighting approaches and todetermine the impact of each one on annual energy costs. Daylighting may be economicallyattractive on educational benefits if the trade-off between increased HVAC loads and reducedlighting loads associated with daylighting options is nearly neutral from an annual energyperspective.
10.1 APPROACH TO DAYLIGHTING ANALYSES
Daylighting is the method of lighting classrooms using diffuse natural light. The amount ofavailable daylight varies over the day and by season. Geographic location and local conditionsdetermine the extent to which daylighting can be implemented – including the orientation of thebuilding. Overheating from solar gain and heat loss because of insufficient thermal insulationmust be minimized in daylighting design to minimize HVAC system effects.
Daylighting cannot be a total substitute for classroom electric lighting. Electric lighting is neededwhen daylight levels are too low to provide general ambient levels and at night.
Classrooms can be effectively lighted using sidelighting from windows. The quantity of lightadmitted depends on the glazing and the width and height of the windows. 30 to 50% glass towall area is the optimum range. The effectiveness of the sidelight technique is limited to adistance of about 2.5 times the height of the opening. The north exposure is best, south is nextbest and the east and west exposures should be avoided, due to direct sunlight that causes criticalbrightness and thermal problems.
10.1.1 Window Glazing Characteristics
The key to daylighting classrooms lies in the window specification. Using proper glazingtechnology and appropriate design can create a net reduction in building energy. The importantcharacteristics are visible light transmittance, solar heat gain coefficient, shading coefficient, andU-value. For effective “cool” daylighting, glazing is chosen that has high visible lighttransmittance VLT or Tvis, low solar heat gain coefficient (SHGC), and low overall heat transfer(U-value).
Energy and Cost Benefit Analyses of HVAC Systems Available to Ohio Schools
10-2
10.1.2 Cool Daylighting
As its name implies, the techniques of cool daylighting, provide natural light without theadmittance of unnecessary solar heat gains and glare. Cool daylighting is the successfulapplication of daylighting to today’s challenge of internally load-dominated buildings. The goalis to use daylight to reduce the need for electric lighting while simultaneously reducing the needfor space cooling.
The questions to be answered from the analysis are:
1. Is there sufficient daylight available in Ohio to consider a daylighting strategy forlighting classrooms?
2. How does adding window area to allow more daylight in classrooms affect the HVACsystems with regard to annual kWh consumption and cost?
3. How much savings can be realized by using photo-sensors and electronic dimming ballastsfor classroom fluorescent systems to provide a daylight harvesting control strategy?
10.1.3 Daylighting Modeling Method
Building Spaces Selected for Daylighting
Two classrooms from the high school plans and two classrooms in the elementary school planswere selected as the daylighting prototypes. The reason two classrooms were selected is so thatclassrooms with north-facing glass and south-facing glass were modeled for their impact on thebuilding energy use. Typical layouts with students facing a whiteboard at the short end of theroom and daylight coming into the space at the student’s left or right hand side were maintained.
Analysis of Elementary School Plans
Architectural Characteristics:
The elementary school is sited correctly for daylight access with classroom windows either onthe north wall or on the south wall. The long dimension of the classrooms is along the windowwall, providing good penetration for daylighting. However, the ceiling height is only 9 feet,which is usually too low for effective daylight penetration from windows. The windowsspecified are for view only and are low-e, insulating glass with the bottom pane moveable (tiltingout) with aluminum frames. The window area is less than 20% of the wall area, which is notenough to provide adequate daylight levels.
Energy and Cost Benefit Analyses of HVAC Systems Available to Ohio Schools
10-3
Lighting
The lighting of several classrooms in the elementary school plan was analyzed. In each case,lighting was overdesigned. Although energy-efficient T8 lamps and electronic ballasts werespecified, the light level at the desktops calculated to 100 foot candles (FC) from the electriclighting systems. Two wall-mounted switches in each classroom control two, 2-lamp ballasts ineach 4-lamp fixture to provide two lighting levels (100% and 50%) by in-board/out-boardswitching.
Analysis of High School Plans
Architectural Characteristics
The high school is oriented well for daylight access with either north or south facing classroomwindows. However, the longest dimension of most rooms runs north and south and is too deepfor good daylight penetration. Ceiling height is 10 feet, which is a good height for daylightpenetration using high windows. However, the windows specified are not high windows and arefor view only. They are single pane clear glass with aluminum frames. The window area is only20% of the wall area, which is not enough to provide adequate daylight levels.
Lighting
The lighting design of several classrooms was analyzed. In each case, lighting was overdesigned.Although new technology, T8 lamps and electronic ballasts were specified, the light level at thedesktops calculated to 100 FC from only the electric lighting systems. Two wall-mountedswitches in each classroom provide two lighting levels (100% and 50%) by in-board/out-boardswitching.
10.1.4 Modeling Trade-offs and Assumptions
As the designs of the elementary school and the high school were evaluated from the daylightingperspective, it became apparent that the current designs are not ideal for daylighting. Some ofthe major findings were:
1. The classrooms are overlighted. During the initial phase of this work, it was discovered thatthe fluorescent classroom lighting in both school plans was overdesigned. Both classroomscalculated to 100 FC. To avoid skewing the energy results when lighting levels were loweredfor the daylighting case, the base case was modified using the lower (60 FC level). Reducingthe lighting to the design manual recommendations of 50 – 60 FC results in reducing both theelectrical and thermal loads, which would unfairly reward the daylighting cases beforedaylighting were even applied.
In addition, most daylighting baselines assume the use of low-E glazings; low-E glazingswere not used in the architectural plans of the original energy baselines.
Energy and Cost Benefit Analyses of HVAC Systems Available to Ohio Schools
10-4
2. The geometry of the high school classrooms is not conducive to good daylighting.Specifically, the designs with the long wall dimension perpendicular to the window wallimpacts daylighting options.
3. The current ceiling heights of the elementary school classrooms are too low for gooddaylighting design.
To address the first item, two intermediate levels of modeling were completed that created anintermediate set of baselines using low E glazings and lower lighting levels. These intermediatebaselines allowed both a direct comparison with baseline modeling results as well as adetermination of the direct energy impacts of daylighting. Items 2 and 3 were not addressed inthis work but are offered as suggestions for future school designs incorporating daylighting.
10.1.5 Modeling Method
A method was devised to evaluate the impact of daylighting on the energy use of the selectedschools by using a combination of computer models since HAP does not directly allow for theevaluation of daylighting. Lighting Technologies’ LumenMicro (LM) 7.5, a lighting designprogram, was used for the lighting design. Output from this model was then entered into HAP tocomplete energy simulations.
As noted in the previous section, an intermediate baseline case was developed where the lightingdesign was done with no daylight contribution using lighting equipment similar to that specifiedin the school plans used in this study. The target Illuminance was set to achieve 60 FC(maintained) at the desktops to meet the Ohio Schools architectural manual lighting requirement.Two-lamp and three-lamp T8 fixtures were used in early models. Two-lamp fixtures proved tobe the most energy-effective solution and were used for the prototype daylight designs.
The daylighting calculations part of the LumenMicro program was then used to determine thedaylight contribution using proto-typical classrooms with a larger percentage of view windowsthan originally specified (~30% for south facing glass and ~40% for north facing glass). Severalcombinations of Tvis values, SHGC and U-values for the actual windows were used to determinea good window solution to provide adequate daylighting with high Tvis values, low SHGC, andlow U-values. LM requires geographical location (latitude and longitude), date, and skycondition to complete the daylighting calculations.
10.1.6 Modeling Method – Details
Sky conditions were derived from local climatological data published by the National ClimaticData Center 1999 data for Columbus, Ohio (40 degrees latitude, 82 degrees, 53' longitude).
Sky condition data provided from the 3-hour observations of the monthly local (NOAA)climatological reports required some manipulation to obtain the three categories of skyconditions required by the LumenMicro program. Table 10-1 below shows these inputconditions.
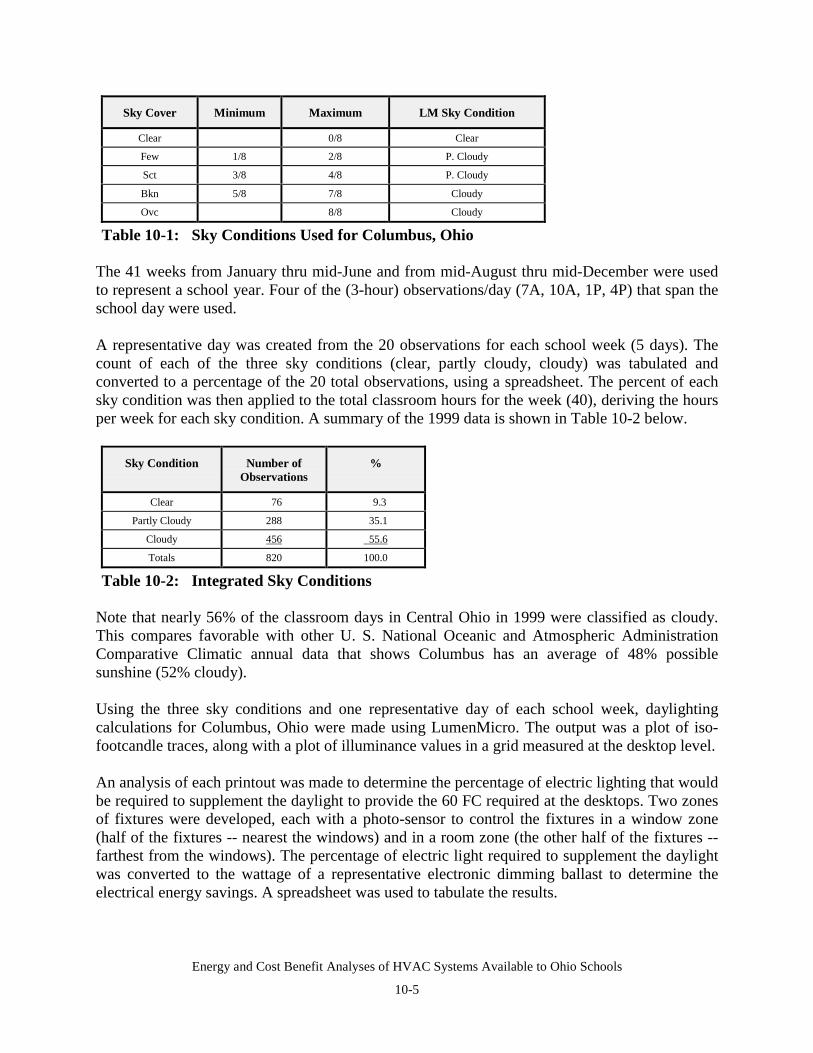
Energy and Cost Benefit Analyses of HVAC Systems Available to Ohio Schools
10-5
Sky Cover Minimum Maximum LM Sky Condition
Clear 0/8 Clear
Few 1/8 2/8 P. Cloudy
Sct 3/8 4/8 P. Cloudy
Bkn 5/8 7/8 Cloudy
Ovc 8/8 Cloudy
Table 10-1: Sky Conditions Used for Columbus, Ohio
The 41 weeks from January thru mid-June and from mid-August thru mid-December were usedto represent a school year. Four of the (3-hour) observations/day (7A, 10A, 1P, 4P) that span theschool day were used.
A representative day was created from the 20 observations for each school week (5 days). Thecount of each of the three sky conditions (clear, partly cloudy, cloudy) was tabulated andconverted to a percentage of the 20 total observations, using a spreadsheet. The percent of eachsky condition was then applied to the total classroom hours for the week (40), deriving the hoursper week for each sky condition. A summary of the 1999 data is shown in Table 10-2 below.
Sky Condition Number ofObservations
%
Clear 76 9.3
Partly Cloudy 288 35.1
Cloudy 456 55.6
Totals 820 100.0
Table 10-2: Integrated Sky Conditions
Note that nearly 56% of the classroom days in Central Ohio in 1999 were classified as cloudy.This compares favorable with other U. S. National Oceanic and Atmospheric AdministrationComparative Climatic annual data that shows Columbus has an average of 48% possiblesunshine (52% cloudy).
Using the three sky conditions and one representative day of each school week, daylightingcalculations for Columbus, Ohio were made using LumenMicro. The output was a plot of iso-footcandle traces, along with a plot of illuminance values in a grid measured at the desktop level.
An analysis of each printout was made to determine the percentage of electric lighting that wouldbe required to supplement the daylight to provide the 60 FC required at the desktops. Two zonesof fixtures were developed, each with a photo-sensor to control the fixtures in a window zone(half of the fixtures -- nearest the windows) and in a room zone (the other half of the fixtures --farthest from the windows). The percentage of electric light required to supplement the daylightwas converted to the wattage of a representative electronic dimming ballast to determine theelectrical energy savings. A spreadsheet was used to tabulate the results.
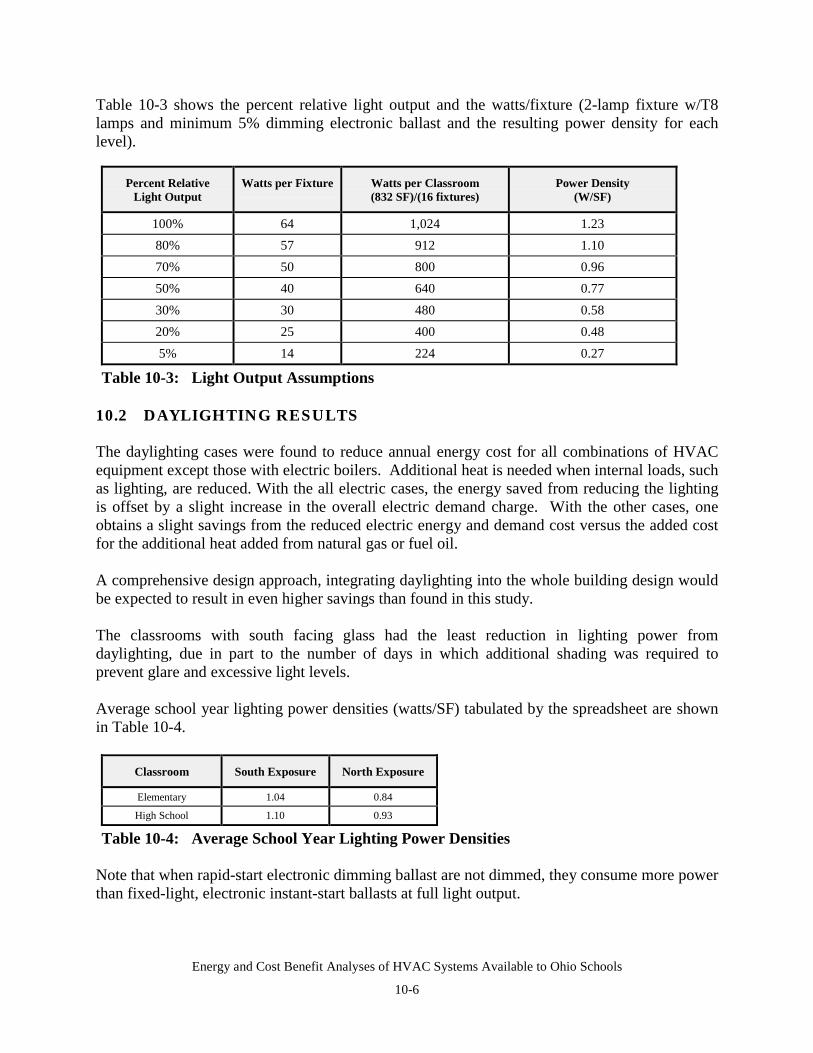
Energy and Cost Benefit Analyses of HVAC Systems Available to Ohio Schools
10-6
Table 10-3 shows the percent relative light output and the watts/fixture (2-lamp fixture w/T8lamps and minimum 5% dimming electronic ballast and the resulting power density for eachlevel).
Percent RelativeLight Output
Watts per Fixture Watts per Classroom(832 SF)/(16 fixtures)
Power Density(W/SF)
100% 64 1,024 1.2380% 57 912 1.1070% 50 800 0.9650% 40 640 0.7730% 30 480 0.5820% 25 400 0.485% 14 224 0.27
Table 10-3: Light Output Assumptions
10.2 DAYLIGHTING RESULTS
The daylighting cases were found to reduce annual energy cost for all combinations of HVACequipment except those with electric boilers. Additional heat is needed when internal loads, suchas lighting, are reduced. With the all electric cases, the energy saved from reducing the lightingis offset by a slight increase in the overall electric demand charge. With the other cases, oneobtains a slight savings from the reduced electric energy and demand cost versus the added costfor the additional heat added from natural gas or fuel oil.
A comprehensive design approach, integrating daylighting into the whole building design wouldbe expected to result in even higher savings than found in this study.
The classrooms with south facing glass had the least reduction in lighting power fromdaylighting, due in part to the number of days in which additional shading was required toprevent glare and excessive light levels.
Average school year lighting power densities (watts/SF) tabulated by the spreadsheet are shownin Table 10-4.
Classroom South Exposure North Exposure
Elementary 1.04 0.84
High School 1.10 0.93
Table 10-4: Average School Year Lighting Power Densities
Note that when rapid-start electronic dimming ballast are not dimmed, they consume more powerthan fixed-light, electronic instant-start ballasts at full light output.
Energy and Cost Benefit Analyses of HVAC Systems Available to Ohio Schools
10-7
The values of lighting power densities shown in the Table 10-4 were used as inputs to the HAPcomputer simulations to determine the effects on HVAC performance for each of 40 systemcombinations.
However, before these runs could be performed, two adjustments were required. Since there wasno low E window glazing included in the original base cases, and since the classroom lightingwas overdesigned, two intermediate baseline cases were developed to allow for a directcalculation of annual daylighting energy costs or benefits.
10.2.1 Elementary School Results
The adjusted baseline (low E glazing and lower lighting levels) and the daylighting results fromthe HAP simulations for the elementary school are shown in Tables 10-5 and 10-6 respectively.Annual energy savings in terms of energy (kWh), and energy cost ($), do not provide the samedegree of savings due to the impact of demand charges in the cost calculations. Using low Eglazing in the original windows provided annual energy savings ranging from 0.3% to 4.3% andannual energy cost savings ($/year) ranging from –0.5% to 2.8%. When the classroom lightingreduced to 60 FC (maintained), annual energy savings (including low E glass) ranged from 3.1%to 13.3% and annual cost savings ranged from 1.0% to 10.4%. For the daylighting cases, theglass areas were increased and low E glass and daylight harvesting control were used in thesimulations. Annual energy savings for the daylighting-only cases ranged from –1.6% to 3.1%and annual energy cost savings ranged from –1.2% to 2.7%. The negative annual energy costsavings occur for the HVAC system options that employed electric boilers. All others casesprovided positive savings.
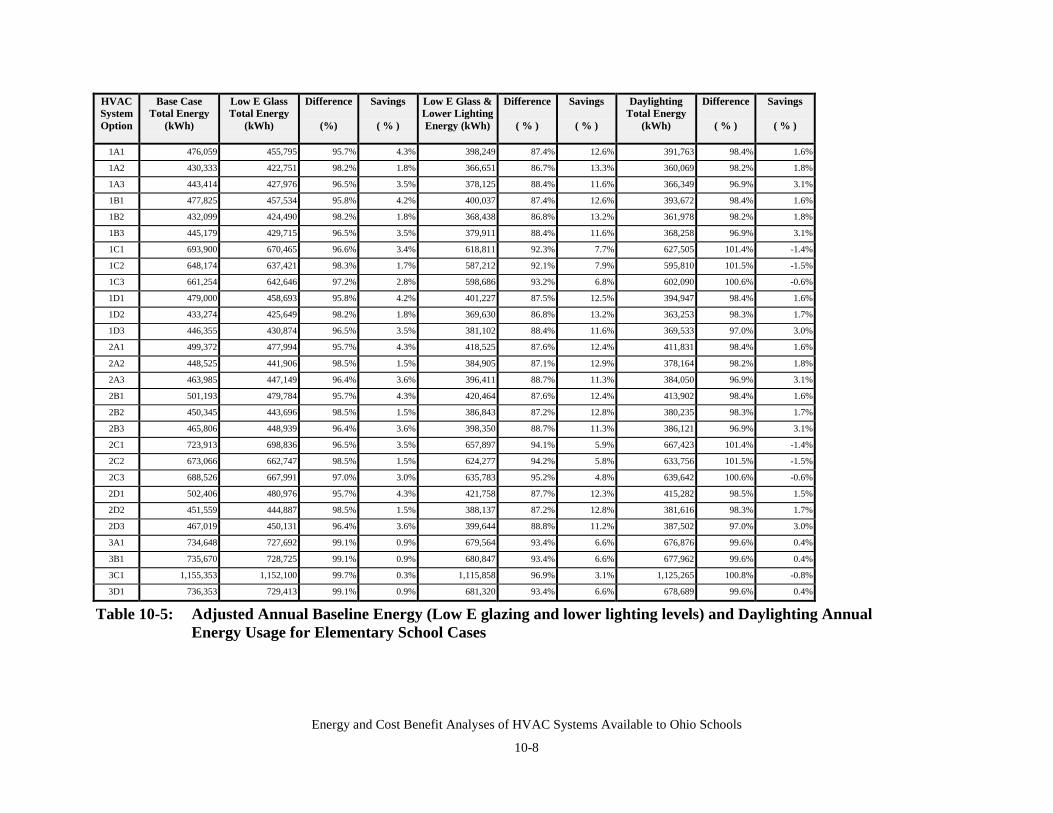
Energy and Cost Benefit Analyses of HVAC Systems Available to Ohio Schools
10-8
HVACSystemOption
Base CaseTotal Energy
(kWh)
Low E GlassTotal Energy
(kWh)
Difference
(%)
Savings
( % )
Low E Glass &Lower LightingEnergy (kWh)
Difference
( % )
Savings
( % )
DaylightingTotal Energy
(kWh)
Difference
( % )
Savings
( % )
1A1 476,059 455,795 95.7% 4.3% 398,249 87.4% 12.6% 391,763 98.4% 1.6%
1A2 430,333 422,751 98.2% 1.8% 366,651 86.7% 13.3% 360,069 98.2% 1.8%
1A3 443,414 427,976 96.5% 3.5% 378,125 88.4% 11.6% 366,349 96.9% 3.1%
1B1 477,825 457,534 95.8% 4.2% 400,037 87.4% 12.6% 393,672 98.4% 1.6%
1B2 432,099 424,490 98.2% 1.8% 368,438 86.8% 13.2% 361,978 98.2% 1.8%
1B3 445,179 429,715 96.5% 3.5% 379,911 88.4% 11.6% 368,258 96.9% 3.1%
1C1 693,900 670,465 96.6% 3.4% 618,811 92.3% 7.7% 627,505 101.4% -1.4%
1C2 648,174 637,421 98.3% 1.7% 587,212 92.1% 7.9% 595,810 101.5% -1.5%
1C3 661,254 642,646 97.2% 2.8% 598,686 93.2% 6.8% 602,090 100.6% -0.6%
1D1 479,000 458,693 95.8% 4.2% 401,227 87.5% 12.5% 394,947 98.4% 1.6%
1D2 433,274 425,649 98.2% 1.8% 369,630 86.8% 13.2% 363,253 98.3% 1.7%
1D3 446,355 430,874 96.5% 3.5% 381,102 88.4% 11.6% 369,533 97.0% 3.0%
2A1 499,372 477,994 95.7% 4.3% 418,525 87.6% 12.4% 411,831 98.4% 1.6%
2A2 448,525 441,906 98.5% 1.5% 384,905 87.1% 12.9% 378,164 98.2% 1.8%
2A3 463,985 447,149 96.4% 3.6% 396,411 88.7% 11.3% 384,050 96.9% 3.1%
2B1 501,193 479,784 95.7% 4.3% 420,464 87.6% 12.4% 413,902 98.4% 1.6%
2B2 450,345 443,696 98.5% 1.5% 386,843 87.2% 12.8% 380,235 98.3% 1.7%
2B3 465,806 448,939 96.4% 3.6% 398,350 88.7% 11.3% 386,121 96.9% 3.1%
2C1 723,913 698,836 96.5% 3.5% 657,897 94.1% 5.9% 667,423 101.4% -1.4%
2C2 673,066 662,747 98.5% 1.5% 624,277 94.2% 5.8% 633,756 101.5% -1.5%
2C3 688,526 667,991 97.0% 3.0% 635,783 95.2% 4.8% 639,642 100.6% -0.6%
2D1 502,406 480,976 95.7% 4.3% 421,758 87.7% 12.3% 415,282 98.5% 1.5%
2D2 451,559 444,887 98.5% 1.5% 388,137 87.2% 12.8% 381,616 98.3% 1.7%
2D3 467,019 450,131 96.4% 3.6% 399,644 88.8% 11.2% 387,502 97.0% 3.0%
3A1 734,648 727,692 99.1% 0.9% 679,564 93.4% 6.6% 676,876 99.6% 0.4%
3B1 735,670 728,725 99.1% 0.9% 680,847 93.4% 6.6% 677,962 99.6% 0.4%
3C1 1,155,353 1,152,100 99.7% 0.3% 1,115,858 96.9% 3.1% 1,125,265 100.8% -0.8%
3D1 736,353 729,413 99.1% 0.9% 681,320 93.4% 6.6% 678,689 99.6% 0.4%
Table 10-5: Adjusted Annual Baseline Energy (Low E glazing and lower lighting levels) and Daylighting AnnualEnergy Usage for Elementary School Cases
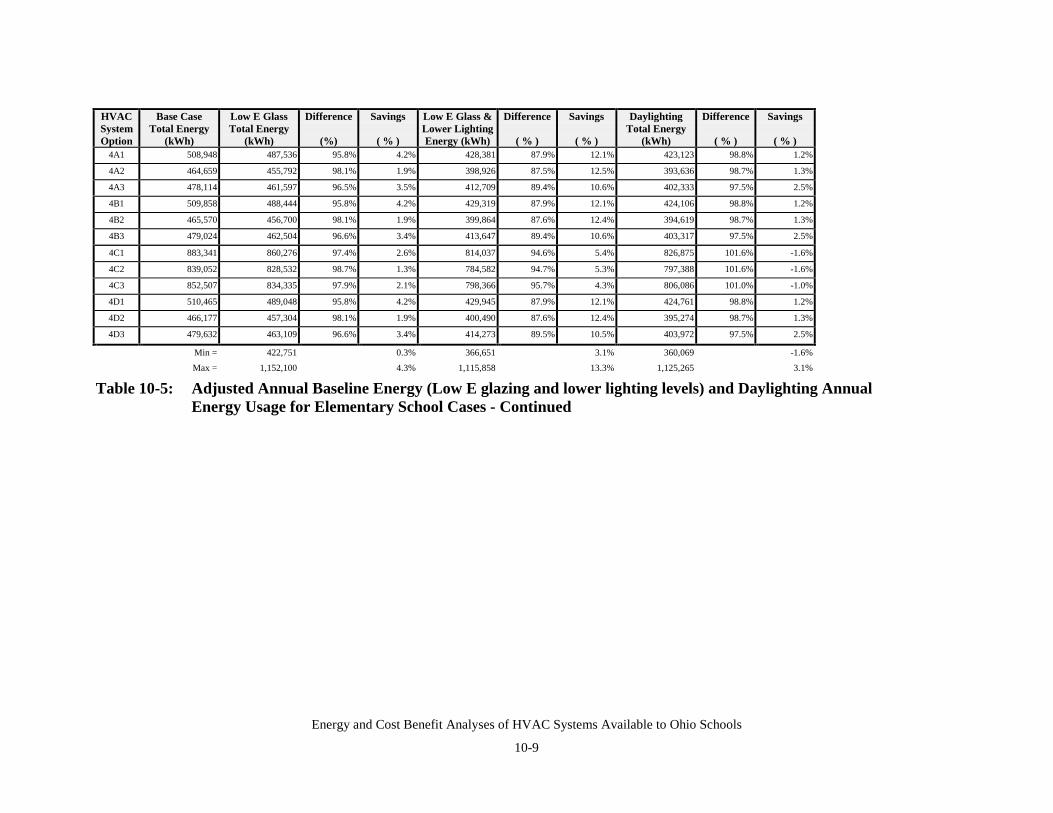
Energy and Cost Benefit Analyses of HVAC Systems Available to Ohio Schools
10-9
HVACSystemOption
Base CaseTotal Energy
(kWh)
Low E GlassTotal Energy
(kWh)
Difference
(%)
Savings
( % )
Low E Glass &Lower LightingEnergy (kWh)
Difference
( % )
Savings
( % )
DaylightingTotal Energy
(kWh)
Difference
( % )
Savings
( % )4A1 508,948 487,536 95.8% 4.2% 428,381 87.9% 12.1% 423,123 98.8% 1.2%
4A2 464,659 455,792 98.1% 1.9% 398,926 87.5% 12.5% 393,636 98.7% 1.3%
4A3 478,114 461,597 96.5% 3.5% 412,709 89.4% 10.6% 402,333 97.5% 2.5%
4B1 509,858 488,444 95.8% 4.2% 429,319 87.9% 12.1% 424,106 98.8% 1.2%
4B2 465,570 456,700 98.1% 1.9% 399,864 87.6% 12.4% 394,619 98.7% 1.3%
4B3 479,024 462,504 96.6% 3.4% 413,647 89.4% 10.6% 403,317 97.5% 2.5%
4C1 883,341 860,276 97.4% 2.6% 814,037 94.6% 5.4% 826,875 101.6% -1.6%
4C2 839,052 828,532 98.7% 1.3% 784,582 94.7% 5.3% 797,388 101.6% -1.6%
4C3 852,507 834,335 97.9% 2.1% 798,366 95.7% 4.3% 806,086 101.0% -1.0%
4D1 510,465 489,048 95.8% 4.2% 429,945 87.9% 12.1% 424,761 98.8% 1.2%
4D2 466,177 457,304 98.1% 1.9% 400,490 87.6% 12.4% 395,274 98.7% 1.3%
4D3 479,632 463,109 96.6% 3.4% 414,273 89.5% 10.5% 403,972 97.5% 2.5%
Min = 422,751 0.3% 366,651 3.1% 360,069 -1.6%
Max = 1,152,100 4.3% 1,115,858 13.3% 1,125,265 3.1%
Table 10-5: Adjusted Annual Baseline Energy (Low E glazing and lower lighting levels) and Daylighting AnnualEnergy Usage for Elementary School Cases - Continued
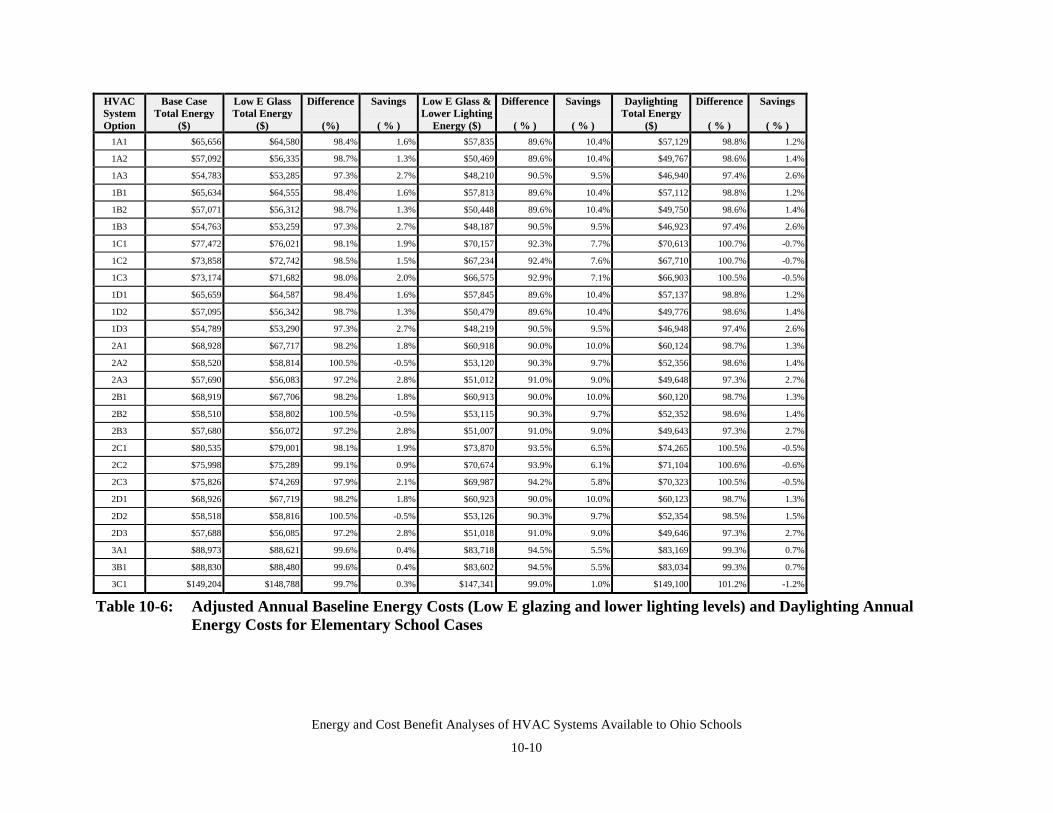
Energy and Cost Benefit Analyses of HVAC Systems Available to Ohio Schools
10-10
HVACSystemOption
Base CaseTotal Energy
($)
Low E GlassTotal Energy
($)
Difference
(%)
Savings
( % )
Low E Glass &Lower Lighting
Energy ($)
Difference
( % )
Savings
( % )
DaylightingTotal Energy
($)
Difference
( % )
Savings
( % )1A1 $65,656 $64,580 98.4% 1.6% $57,835 89.6% 10.4% $57,129 98.8% 1.2%
1A2 $57,092 $56,335 98.7% 1.3% $50,469 89.6% 10.4% $49,767 98.6% 1.4%
1A3 $54,783 $53,285 97.3% 2.7% $48,210 90.5% 9.5% $46,940 97.4% 2.6%
1B1 $65,634 $64,555 98.4% 1.6% $57,813 89.6% 10.4% $57,112 98.8% 1.2%
1B2 $57,071 $56,312 98.7% 1.3% $50,448 89.6% 10.4% $49,750 98.6% 1.4%
1B3 $54,763 $53,259 97.3% 2.7% $48,187 90.5% 9.5% $46,923 97.4% 2.6%
1C1 $77,472 $76,021 98.1% 1.9% $70,157 92.3% 7.7% $70,613 100.7% -0.7%
1C2 $73,858 $72,742 98.5% 1.5% $67,234 92.4% 7.6% $67,710 100.7% -0.7%
1C3 $73,174 $71,682 98.0% 2.0% $66,575 92.9% 7.1% $66,903 100.5% -0.5%
1D1 $65,659 $64,587 98.4% 1.6% $57,845 89.6% 10.4% $57,137 98.8% 1.2%
1D2 $57,095 $56,342 98.7% 1.3% $50,479 89.6% 10.4% $49,776 98.6% 1.4%
1D3 $54,789 $53,290 97.3% 2.7% $48,219 90.5% 9.5% $46,948 97.4% 2.6%
2A1 $68,928 $67,717 98.2% 1.8% $60,918 90.0% 10.0% $60,124 98.7% 1.3%
2A2 $58,520 $58,814 100.5% -0.5% $53,120 90.3% 9.7% $52,356 98.6% 1.4%
2A3 $57,690 $56,083 97.2% 2.8% $51,012 91.0% 9.0% $49,648 97.3% 2.7%
2B1 $68,919 $67,706 98.2% 1.8% $60,913 90.0% 10.0% $60,120 98.7% 1.3%
2B2 $58,510 $58,802 100.5% -0.5% $53,115 90.3% 9.7% $52,352 98.6% 1.4%
2B3 $57,680 $56,072 97.2% 2.8% $51,007 91.0% 9.0% $49,643 97.3% 2.7%
2C1 $80,535 $79,001 98.1% 1.9% $73,870 93.5% 6.5% $74,265 100.5% -0.5%
2C2 $75,998 $75,289 99.1% 0.9% $70,674 93.9% 6.1% $71,104 100.6% -0.6%
2C3 $75,826 $74,269 97.9% 2.1% $69,987 94.2% 5.8% $70,323 100.5% -0.5%
2D1 $68,926 $67,719 98.2% 1.8% $60,923 90.0% 10.0% $60,123 98.7% 1.3%
2D2 $58,518 $58,816 100.5% -0.5% $53,126 90.3% 9.7% $52,354 98.5% 1.5%
2D3 $57,688 $56,085 97.2% 2.8% $51,018 91.0% 9.0% $49,646 97.3% 2.7%
3A1 $88,973 $88,621 99.6% 0.4% $83,718 94.5% 5.5% $83,169 99.3% 0.7%
3B1 $88,830 $88,480 99.6% 0.4% $83,602 94.5% 5.5% $83,034 99.3% 0.7%
3C1 $149,204 $148,788 99.7% 0.3% $147,341 99.0% 1.0% $149,100 101.2% -1.2%
Table 10-6: Adjusted Annual Baseline Energy Costs (Low E glazing and lower lighting levels) and Daylighting AnnualEnergy Costs for Elementary School Cases
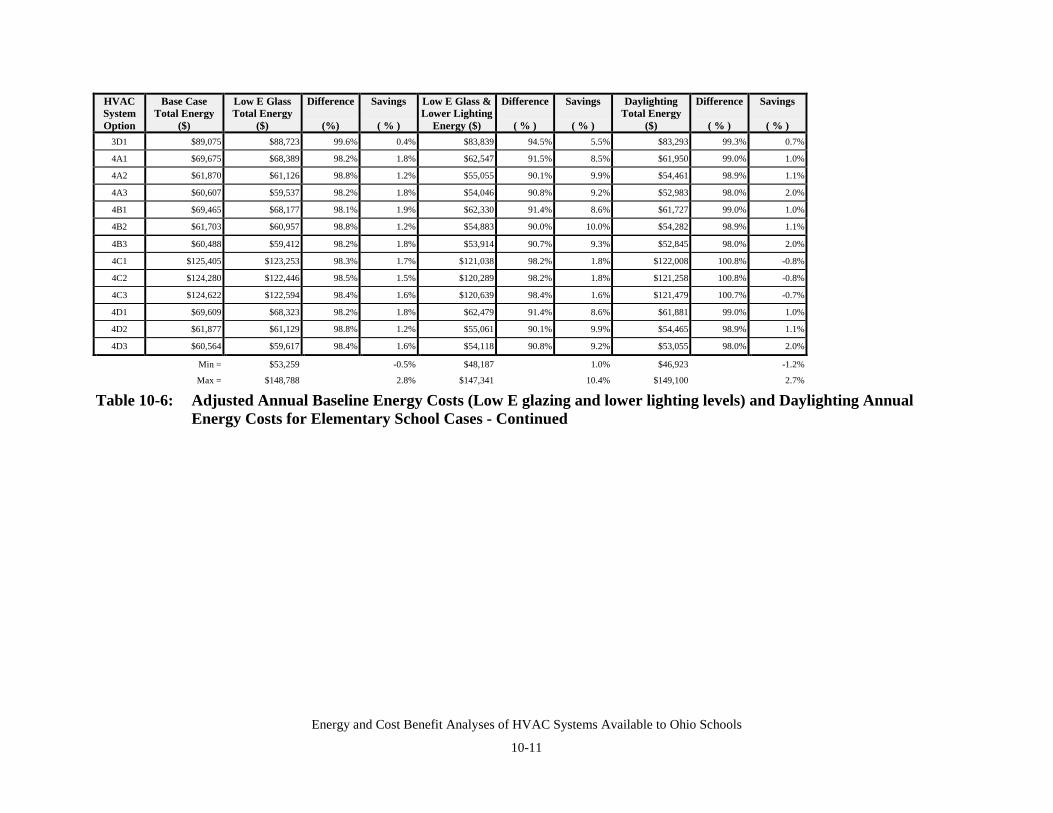
Energy and Cost Benefit Analyses of HVAC Systems Available to Ohio Schools
10-11
HVACSystemOption
Base CaseTotal Energy
($)
Low E GlassTotal Energy
($)
Difference
(%)
Savings
( % )
Low E Glass &Lower Lighting
Energy ($)
Difference
( % )
Savings
( % )
DaylightingTotal Energy
($)
Difference
( % )
Savings
( % )3D1 $89,075 $88,723 99.6% 0.4% $83,839 94.5% 5.5% $83,293 99.3% 0.7%
4A1 $69,675 $68,389 98.2% 1.8% $62,547 91.5% 8.5% $61,950 99.0% 1.0%
4A2 $61,870 $61,126 98.8% 1.2% $55,055 90.1% 9.9% $54,461 98.9% 1.1%
4A3 $60,607 $59,537 98.2% 1.8% $54,046 90.8% 9.2% $52,983 98.0% 2.0%
4B1 $69,465 $68,177 98.1% 1.9% $62,330 91.4% 8.6% $61,727 99.0% 1.0%
4B2 $61,703 $60,957 98.8% 1.2% $54,883 90.0% 10.0% $54,282 98.9% 1.1%
4B3 $60,488 $59,412 98.2% 1.8% $53,914 90.7% 9.3% $52,845 98.0% 2.0%
4C1 $125,405 $123,253 98.3% 1.7% $121,038 98.2% 1.8% $122,008 100.8% -0.8%
4C2 $124,280 $122,446 98.5% 1.5% $120,289 98.2% 1.8% $121,258 100.8% -0.8%
4C3 $124,622 $122,594 98.4% 1.6% $120,639 98.4% 1.6% $121,479 100.7% -0.7%
4D1 $69,609 $68,323 98.2% 1.8% $62,479 91.4% 8.6% $61,881 99.0% 1.0%
4D2 $61,877 $61,129 98.8% 1.2% $55,061 90.1% 9.9% $54,465 98.9% 1.1%
4D3 $60,564 $59,617 98.4% 1.6% $54,118 90.8% 9.2% $53,055 98.0% 2.0%
Min = $53,259 -0.5% $48,187 1.0% $46,923 -1.2%
Max = $148,788 2.8% $147,341 10.4% $149,100 2.7%
Table 10-6: Adjusted Annual Baseline Energy Costs (Low E glazing and lower lighting levels) and Daylighting AnnualEnergy Costs for Elementary School Cases - Continued
Energy and Cost Benefit Analyses of HVAC Systems Available to Ohio Schools
10-12
10.2.2 High School Results
The adjusted baseline results and the daylighting results from the HAP simulations for the highschool are shown in Tables 10-7 and 10-8 respectively. Using low E glazings for the originalwindows provided annual energy savings that ranged from 0.1% to 0.4% and annual cost savingsthat ranged from 0.2% to 1.0%. When the classroom lighting was reduced to 60 FC, annualenergy savings (including low E glass) ranged from 2.0 to 6.8% and annual cost savings rangedfrom 1.2% to 5.9%. For the daylighting-only cases, annual energy savings ranged from –0.3% to2.3% and annual energy cost savings ranged from –0.6% to 2.4%. The negative savings occur forHVAC system options that employed electric boilers. As noted earlier, when interior electricalloads that produce heat are reduced (such as lighting), the heating system is required to make upthis loss.
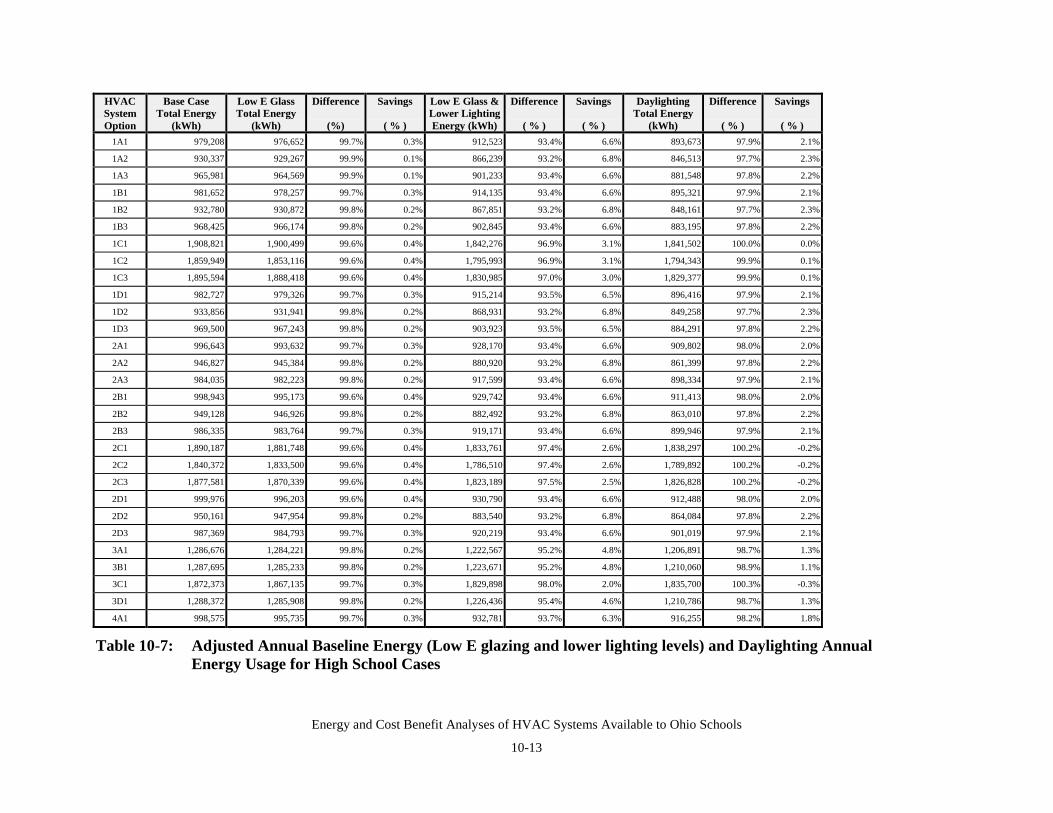
Energy and Cost Benefit Analyses of HVAC Systems Available to Ohio Schools
10-13
HVACSystemOption
Base CaseTotal Energy
(kWh)
Low E GlassTotal Energy
(kWh)
Difference
(%)
Savings
( % )
Low E Glass &Lower LightingEnergy (kWh)
Difference
( % )
Savings
( % )
DaylightingTotal Energy
(kWh)
Difference
( % )
Savings
( % )1A1 979,208 976,652 99.7% 0.3% 912,523 93.4% 6.6% 893,673 97.9% 2.1%
1A2 930,337 929,267 99.9% 0.1% 866,239 93.2% 6.8% 846,513 97.7% 2.3%
1A3 965,981 964,569 99.9% 0.1% 901,233 93.4% 6.6% 881,548 97.8% 2.2%
1B1 981,652 978,257 99.7% 0.3% 914,135 93.4% 6.6% 895,321 97.9% 2.1%
1B2 932,780 930,872 99.8% 0.2% 867,851 93.2% 6.8% 848,161 97.7% 2.3%
1B3 968,425 966,174 99.8% 0.2% 902,845 93.4% 6.6% 883,195 97.8% 2.2%
1C1 1,908,821 1,900,499 99.6% 0.4% 1,842,276 96.9% 3.1% 1,841,502 100.0% 0.0%
1C2 1,859,949 1,853,116 99.6% 0.4% 1,795,993 96.9% 3.1% 1,794,343 99.9% 0.1%
1C3 1,895,594 1,888,418 99.6% 0.4% 1,830,985 97.0% 3.0% 1,829,377 99.9% 0.1%
1D1 982,727 979,326 99.7% 0.3% 915,214 93.5% 6.5% 896,416 97.9% 2.1%
1D2 933,856 931,941 99.8% 0.2% 868,931 93.2% 6.8% 849,258 97.7% 2.3%
1D3 969,500 967,243 99.8% 0.2% 903,923 93.5% 6.5% 884,291 97.8% 2.2%
2A1 996,643 993,632 99.7% 0.3% 928,170 93.4% 6.6% 909,802 98.0% 2.0%
2A2 946,827 945,384 99.8% 0.2% 880,920 93.2% 6.8% 861,399 97.8% 2.2%
2A3 984,035 982,223 99.8% 0.2% 917,599 93.4% 6.6% 898,334 97.9% 2.1%
2B1 998,943 995,173 99.6% 0.4% 929,742 93.4% 6.6% 911,413 98.0% 2.0%
2B2 949,128 946,926 99.8% 0.2% 882,492 93.2% 6.8% 863,010 97.8% 2.2%
2B3 986,335 983,764 99.7% 0.3% 919,171 93.4% 6.6% 899,946 97.9% 2.1%
2C1 1,890,187 1,881,748 99.6% 0.4% 1,833,761 97.4% 2.6% 1,838,297 100.2% -0.2%
2C2 1,840,372 1,833,500 99.6% 0.4% 1,786,510 97.4% 2.6% 1,789,892 100.2% -0.2%
2C3 1,877,581 1,870,339 99.6% 0.4% 1,823,189 97.5% 2.5% 1,826,828 100.2% -0.2%
2D1 999,976 996,203 99.6% 0.4% 930,790 93.4% 6.6% 912,488 98.0% 2.0%
2D2 950,161 947,954 99.8% 0.2% 883,540 93.2% 6.8% 864,084 97.8% 2.2%
2D3 987,369 984,793 99.7% 0.3% 920,219 93.4% 6.6% 901,019 97.9% 2.1%
3A1 1,286,676 1,284,221 99.8% 0.2% 1,222,567 95.2% 4.8% 1,206,891 98.7% 1.3%
3B1 1,287,695 1,285,233 99.8% 0.2% 1,223,671 95.2% 4.8% 1,210,060 98.9% 1.1%
3C1 1,872,373 1,867,135 99.7% 0.3% 1,829,898 98.0% 2.0% 1,835,700 100.3% -0.3%
3D1 1,288,372 1,285,908 99.8% 0.2% 1,226,436 95.4% 4.6% 1,210,786 98.7% 1.3%
4A1 998,575 995,735 99.7% 0.3% 932,781 93.7% 6.3% 916,255 98.2% 1.8%
Table 10-7: Adjusted Annual Baseline Energy (Low E glazing and lower lighting levels) and Daylighting AnnualEnergy Usage for High School Cases
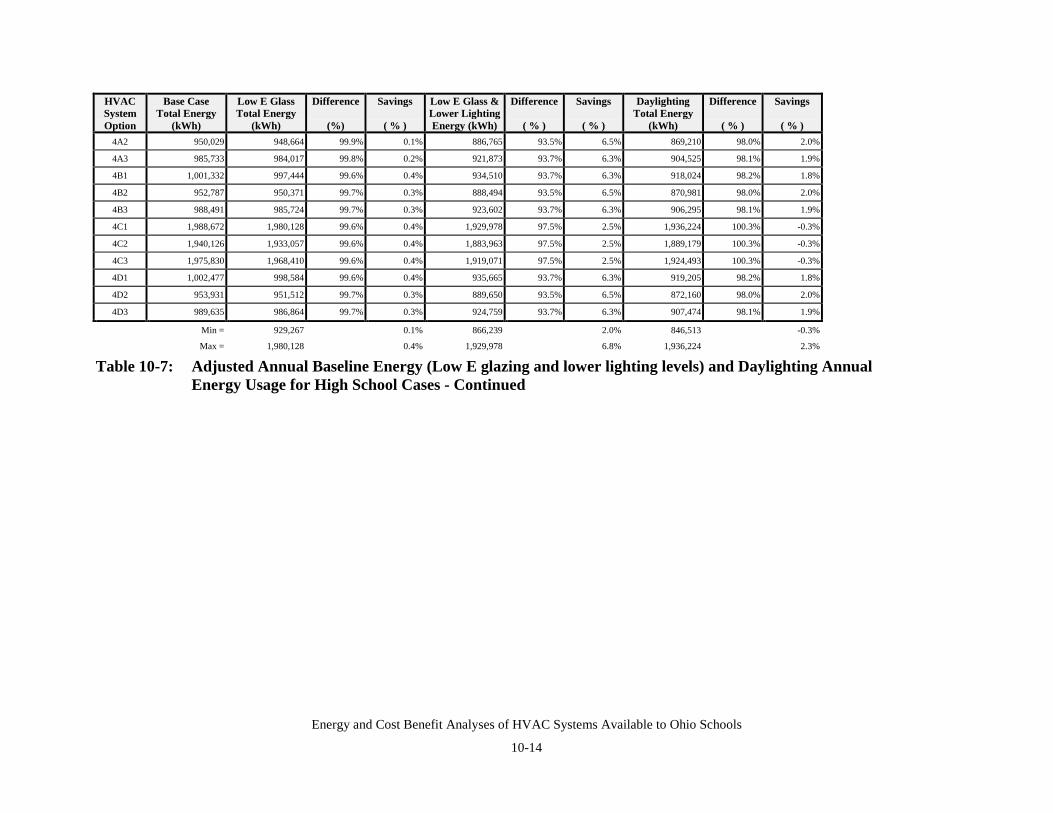
Energy and Cost Benefit Analyses of HVAC Systems Available to Ohio Schools
10-14
HVACSystemOption
Base CaseTotal Energy
(kWh)
Low E GlassTotal Energy
(kWh)
Difference
(%)
Savings
( % )
Low E Glass &Lower LightingEnergy (kWh)
Difference
( % )
Savings
( % )
DaylightingTotal Energy
(kWh)
Difference
( % )
Savings
( % )4A2 950,029 948,664 99.9% 0.1% 886,765 93.5% 6.5% 869,210 98.0% 2.0%
4A3 985,733 984,017 99.8% 0.2% 921,873 93.7% 6.3% 904,525 98.1% 1.9%
4B1 1,001,332 997,444 99.6% 0.4% 934,510 93.7% 6.3% 918,024 98.2% 1.8%
4B2 952,787 950,371 99.7% 0.3% 888,494 93.5% 6.5% 870,981 98.0% 2.0%
4B3 988,491 985,724 99.7% 0.3% 923,602 93.7% 6.3% 906,295 98.1% 1.9%
4C1 1,988,672 1,980,128 99.6% 0.4% 1,929,978 97.5% 2.5% 1,936,224 100.3% -0.3%
4C2 1,940,126 1,933,057 99.6% 0.4% 1,883,963 97.5% 2.5% 1,889,179 100.3% -0.3%
4C3 1,975,830 1,968,410 99.6% 0.4% 1,919,071 97.5% 2.5% 1,924,493 100.3% -0.3%
4D1 1,002,477 998,584 99.6% 0.4% 935,665 93.7% 6.3% 919,205 98.2% 1.8%
4D2 953,931 951,512 99.7% 0.3% 889,650 93.5% 6.5% 872,160 98.0% 2.0%
4D3 989,635 986,864 99.7% 0.3% 924,759 93.7% 6.3% 907,474 98.1% 1.9%
Min = 929,267 0.1% 866,239 2.0% 846,513 -0.3%
Max = 1,980,128 0.4% 1,929,978 6.8% 1,936,224 2.3%
Table 10-7: Adjusted Annual Baseline Energy (Low E glazing and lower lighting levels) and Daylighting AnnualEnergy Usage for High School Cases - Continued
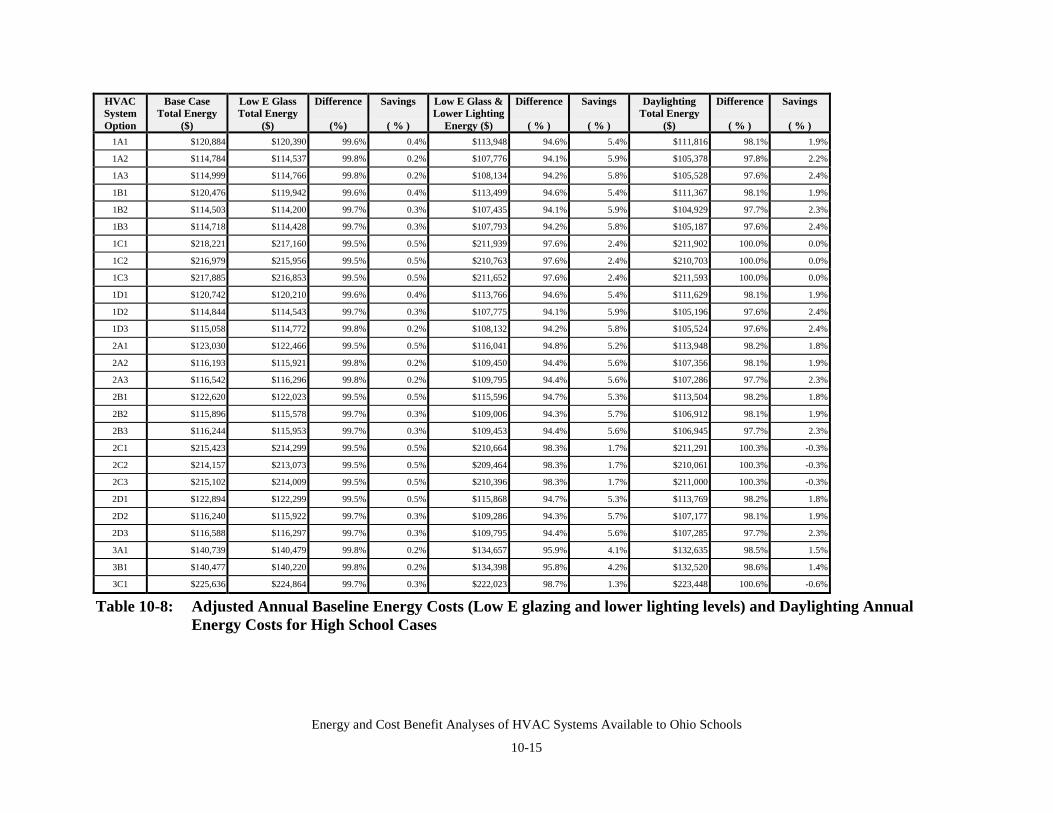
Energy and Cost Benefit Analyses of HVAC Systems Available to Ohio Schools
10-15
HVACSystemOption
Base CaseTotal Energy
($)
Low E GlassTotal Energy
($)
Difference
(%)
Savings
( % )
Low E Glass &Lower Lighting
Energy ($)
Difference
( % )
Savings
( % )
DaylightingTotal Energy
($)
Difference
( % )
Savings
( % )1A1 $120,884 $120,390 99.6% 0.4% $113,948 94.6% 5.4% $111,816 98.1% 1.9%
1A2 $114,784 $114,537 99.8% 0.2% $107,776 94.1% 5.9% $105,378 97.8% 2.2%
1A3 $114,999 $114,766 99.8% 0.2% $108,134 94.2% 5.8% $105,528 97.6% 2.4%
1B1 $120,476 $119,942 99.6% 0.4% $113,499 94.6% 5.4% $111,367 98.1% 1.9%
1B2 $114,503 $114,200 99.7% 0.3% $107,435 94.1% 5.9% $104,929 97.7% 2.3%
1B3 $114,718 $114,428 99.7% 0.3% $107,793 94.2% 5.8% $105,187 97.6% 2.4%
1C1 $218,221 $217,160 99.5% 0.5% $211,939 97.6% 2.4% $211,902 100.0% 0.0%
1C2 $216,979 $215,956 99.5% 0.5% $210,763 97.6% 2.4% $210,703 100.0% 0.0%
1C3 $217,885 $216,853 99.5% 0.5% $211,652 97.6% 2.4% $211,593 100.0% 0.0%
1D1 $120,742 $120,210 99.6% 0.4% $113,766 94.6% 5.4% $111,629 98.1% 1.9%
1D2 $114,844 $114,543 99.7% 0.3% $107,775 94.1% 5.9% $105,196 97.6% 2.4%
1D3 $115,058 $114,772 99.8% 0.2% $108,132 94.2% 5.8% $105,524 97.6% 2.4%
2A1 $123,030 $122,466 99.5% 0.5% $116,041 94.8% 5.2% $113,948 98.2% 1.8%
2A2 $116,193 $115,921 99.8% 0.2% $109,450 94.4% 5.6% $107,356 98.1% 1.9%
2A3 $116,542 $116,296 99.8% 0.2% $109,795 94.4% 5.6% $107,286 97.7% 2.3%
2B1 $122,620 $122,023 99.5% 0.5% $115,596 94.7% 5.3% $113,504 98.2% 1.8%
2B2 $115,896 $115,578 99.7% 0.3% $109,006 94.3% 5.7% $106,912 98.1% 1.9%
2B3 $116,244 $115,953 99.7% 0.3% $109,453 94.4% 5.6% $106,945 97.7% 2.3%
2C1 $215,423 $214,299 99.5% 0.5% $210,664 98.3% 1.7% $211,291 100.3% -0.3%
2C2 $214,157 $213,073 99.5% 0.5% $209,464 98.3% 1.7% $210,061 100.3% -0.3%
2C3 $215,102 $214,009 99.5% 0.5% $210,396 98.3% 1.7% $211,000 100.3% -0.3%
2D1 $122,894 $122,299 99.5% 0.5% $115,868 94.7% 5.3% $113,769 98.2% 1.8%
2D2 $116,240 $115,922 99.7% 0.3% $109,286 94.3% 5.7% $107,177 98.1% 1.9%
2D3 $116,588 $116,297 99.7% 0.3% $109,795 94.4% 5.6% $107,285 97.7% 2.3%
3A1 $140,739 $140,479 99.8% 0.2% $134,657 95.9% 4.1% $132,635 98.5% 1.5%
3B1 $140,477 $140,220 99.8% 0.2% $134,398 95.8% 4.2% $132,520 98.6% 1.4%
3C1 $225,636 $224,864 99.7% 0.3% $222,023 98.7% 1.3% $223,448 100.6% -0.6%
Table 10-8: Adjusted Annual Baseline Energy Costs (Low E glazing and lower lighting levels) and Daylighting AnnualEnergy Costs for High School Cases
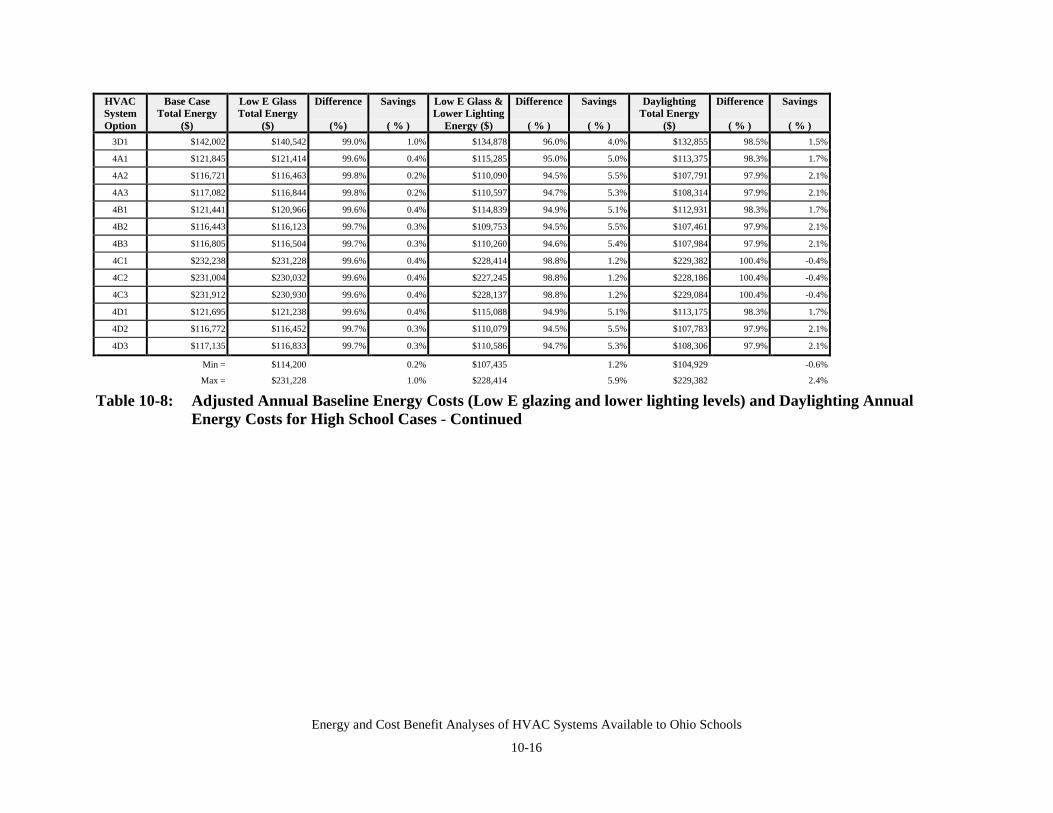
Energy and Cost Benefit Analyses of HVAC Systems Available to Ohio Schools
10-16
HVACSystemOption
Base CaseTotal Energy
($)
Low E GlassTotal Energy
($)
Difference
(%)
Savings
( % )
Low E Glass &Lower Lighting
Energy ($)
Difference
( % )
Savings
( % )
DaylightingTotal Energy
($)
Difference
( % )
Savings
( % )3D1 $142,002 $140,542 99.0% 1.0% $134,878 96.0% 4.0% $132,855 98.5% 1.5%
4A1 $121,845 $121,414 99.6% 0.4% $115,285 95.0% 5.0% $113,375 98.3% 1.7%
4A2 $116,721 $116,463 99.8% 0.2% $110,090 94.5% 5.5% $107,791 97.9% 2.1%
4A3 $117,082 $116,844 99.8% 0.2% $110,597 94.7% 5.3% $108,314 97.9% 2.1%
4B1 $121,441 $120,966 99.6% 0.4% $114,839 94.9% 5.1% $112,931 98.3% 1.7%
4B2 $116,443 $116,123 99.7% 0.3% $109,753 94.5% 5.5% $107,461 97.9% 2.1%
4B3 $116,805 $116,504 99.7% 0.3% $110,260 94.6% 5.4% $107,984 97.9% 2.1%
4C1 $232,238 $231,228 99.6% 0.4% $228,414 98.8% 1.2% $229,382 100.4% -0.4%
4C2 $231,004 $230,032 99.6% 0.4% $227,245 98.8% 1.2% $228,186 100.4% -0.4%
4C3 $231,912 $230,930 99.6% 0.4% $228,137 98.8% 1.2% $229,084 100.4% -0.4%
4D1 $121,695 $121,238 99.6% 0.4% $115,088 94.9% 5.1% $113,175 98.3% 1.7%
4D2 $116,772 $116,452 99.7% 0.3% $110,079 94.5% 5.5% $107,783 97.9% 2.1%
4D3 $117,135 $116,833 99.7% 0.3% $110,586 94.7% 5.3% $108,306 97.9% 2.1%
Min = $114,200 0.2% $107,435 1.2% $104,929 -0.6%
Max = $231,228 1.0% $228,414 5.9% $229,382 2.4%
Table 10-8: Adjusted Annual Baseline Energy Costs (Low E glazing and lower lighting levels) and Daylighting AnnualEnergy Costs for High School Cases - Continued
Energy and Cost Benefit Analyses of HVAC Systems Available to Ohio Schools
10-17
10.3 DAYLIGHTING RESULTS – OBSERVATIONS AND RECOMMENDATIONS
In reviewing the data shown in section 10.2, the following observations were made:
• There is sufficient diffuse daylight available in Ohio to consider using daylighting as a sourcefor lighting Ohio school classrooms
• The additional glass area required for daylighting will not cause any significant heating orcooling load changes (unless electric boilers are used to heat the building)
• Daylighting can be used without incurring higher energy cost
• The use of a second control zone, identified as the room zone in actual architectural drawings(comprising the second half of the classroom fixtures located farthest from the windows),does not provide enough control savings to be practical.
• The higher initial cost to implement daylight harvesting controls will be incurred only for themanual (teacher) control stations and the photo-sensors (1 per classroom). These controlcosts could be paid from the annual savings. Costs of the dimming ballasts should notexceed the cost of existing specified two electronic ballasts for each fixture required toprovide two-level in-board/out-board control.
• The higher initial cost of the additional window area could be covered by the expected chillerplant downsizing when daylighting is integrated into the building design right from the outset
Recommendations:
The following recommendations are offered as a result of completing these daylighting analyses:
• From an architectural standpoint, consider high window head heights up to 11 feet. Alsoconsider raising the head height to the ceiling to eliminate the contrast between the dark wallarea above the window and a bright window in current designs. When compared withcontinuous windows, daylight distribution with high head heights is more uniform andpenetrates deeper into the room. However, the use of higher head heights may require ahigher floor-to-floor height than used in current practice. Higher floor-to-floor height wouldalso increase the volume of each room to be heated and cooled. Another alternative would beto raise the ceiling near the window.
• Consider the “finger” plan building layout with multiple rows of single classrooms, each withwindows on two sides. This is sometimes called the California plan, popular in the 1950’sand early 60’s when it was specified by the California Department of Education architecturaldesign.
• Orient the building so that the longest facades face north or south. This orientation exposesthe majority of windows to sun angles that are easy to manage.
• Classrooms with south facing glass require that some additional shading be added to accountfor those times of the year where low sun angles are seen. Also, horizontal blinds, manuallycontrolled by the classroom teacher, could provide this shading function. Use of blinds onthe south facing windows is also recommended to prevent glare and over lighting.
Energy and Cost Benefit Analyses of HVAC Systems Available to Ohio Schools
10-18
• Light shelves may be more effective than manually controlled blinds on south facingclassroom windows and should be investigated further.
• Finally, orient lighting so that the long direction of the fluorescent fixtures is parallel to thewindows. When the building is oriented with the longest facades facing north or south, thewhiteboard should be along one of the short ends. The architectural design manual requiresthe long direction of the lighting fixtures to be parallel to the whiteboard.
• Design the classroom lighting so that it meets the prescribed light levels of 50 – 60 FC.Integrate the fluorescent lighting system with the daylighting. Indirect lighting systemsprovide uniform light reflected from the ceiling and integrate well with daylighting.Illuminance levels on the desktops can usually be set 25 – 35% lower than direct systems.Indirect systems are not the energy hogs they once were with energy performance in schoolapplications about 1 watt/SF.
• Use high color temperature (4100K or 5000K) and high color rendering (85 CRI) fluorescent(T8 or T5-HO) lamps to best complement the daylight.
• Use one zone of dimming control for those fluorescent fixtures closest to the window.
• Provide a manual control in each classroom where the fluorescent lighting is automaticallycontrolled to supplement the available daylight. Teachers are much more likely to accept theautomatic dimming of classroom lighting when a manual control is incorporated to allowthem to adjust the lighting level for local control such as for audio-visual, TV, or computerusage.
• Completion of a more detailed study of daylighting that is integrated into a school buildingdesign to evaluate the full impact of daylighting on new designs should be considered.Computer tools now in development will provide hourly simulation of daylighting as part ofthe HVAC interaction study instead of the two-part methodology used in this study.
Energy and Cost Benefit Analyses of HVAC Systems Available to Ohio Schools
10-19
Daylighting Definitions
Daylight: Diffuse sunlight.
Daylighting: Method of lighting building interiors using diffuse natural light.
Double-glazing: Term applied to two thicknesses of glass separated by an air space within anopening to improve insulation against heat transfer.
Glazing: Glass or plastic panes in a window, door, or skylight.
Header: The upper horizontal member of a window frame.
Illuminance: The total amount of visible light incident upon a point on a surface from alldirections above the surface. Illuminance is commonly called light level and is measured infootcandles (FC) in the U.S. and in lux in other parts of the world. (1 fc = 10.76 lux)
Low-emittance (low-E) coatings: Glazing coated with a microscopically thin, virtually invisiblemetal or a metal oxide layer deposited on a window-glazing surface to reduce the U-factor bysuppressing radiative heat flow. Low-e coatings are transparent to the solar spectrum (visiblelight and short-wave infrared (IR) radiation) and reflect long-wave IR radiation.
Solar heat gain coefficient (SHGC) and shading coefficient (SC): Window-glazing metricsthat compare the amount of total solar heat gain that enters a space through the glazing. Theglazing industry is replacing the older SC measure with the newer SHGC. SHGC is the ratio oftotal transmitted solar heat to incident solar energy on the outside of the window. The lower theSHGC, the lower the heat gain. SC = 1.15 x SHGC.
Solar radiation: The total radiant energy from the sun, including ultraviolet and infraredwavelengths as well as visible light.
Transmittance: The percentage of radiation that can pass through glazing. Transmittance can bedefined for different types of light or energy, e.g., visible transmittance, UV transmittance, ortotal solar energy transmittance.
U-value: The window glazing measure of overall heat transfer through the glazing due to theindoor and outdoor temperature difference. Units are Btu/h-ft2-ºF. The lower the U-value, thegreater a window’s resistance to heat flow and the better its insulating value.
Visible light: The portion of the electromagnetic spectrum that produces light that can be seen.Wavelengths range from 380 to 720 nanometers.

Energy and Cost Benefit Analyses of HVAC Systems Available to Ohio Schools
10-20
Visible light transmittance (VLT) or Tvis: This is a window-glazing characteristic thatmeasures the percentage of visible light striking the window glazing that enters the space.Glazings with high Tvis values appear relatively clear and provide good views.
Window: A glazed opening in an external wall of a building - an entire unit consisting of aframe sash and glazing, and any operable elements.

List of Appendices
A Through E
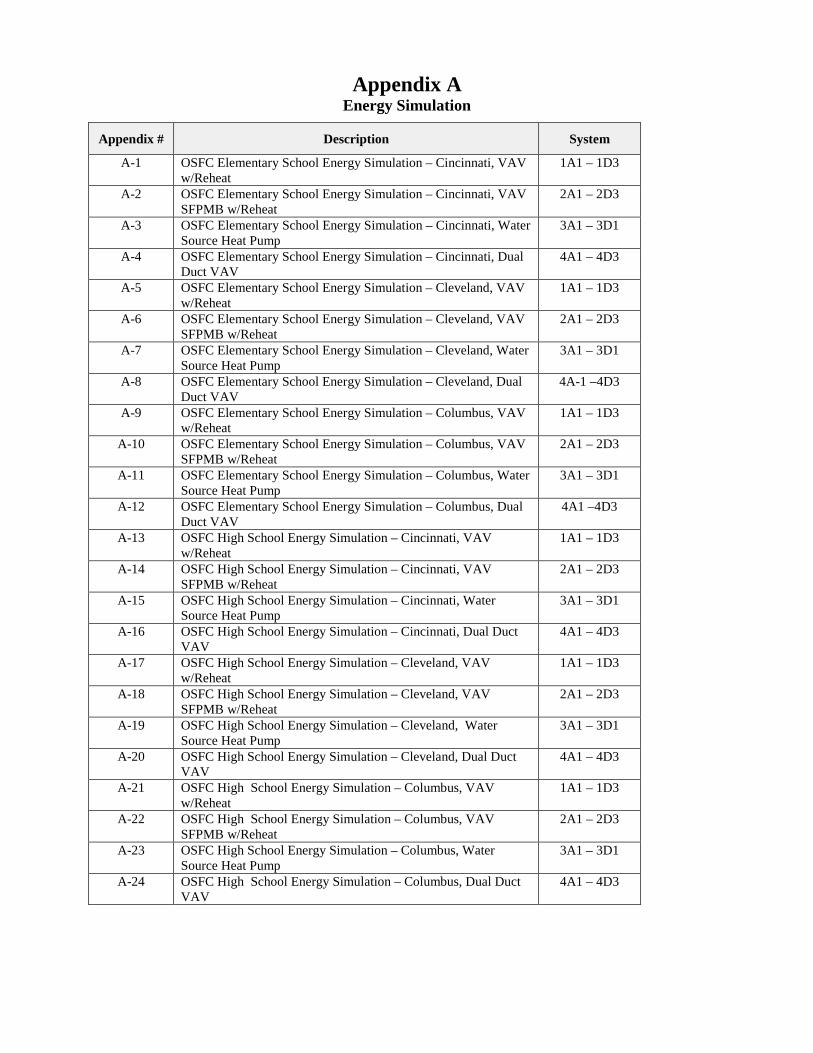
Appendix AEnergy Simulation
Appendix # Description System
A-1 OSFC Elementary School Energy Simulation – Cincinnati, VAVw/Reheat
1A1 – 1D3
A-2 OSFC Elementary School Energy Simulation – Cincinnati, VAVSFPMB w/Reheat
2A1 – 2D3
A-3 OSFC Elementary School Energy Simulation – Cincinnati, WaterSource Heat Pump
3A1 – 3D1
A-4 OSFC Elementary School Energy Simulation – Cincinnati, DualDuct VAV
4A1 – 4D3
A-5 OSFC Elementary School Energy Simulation – Cleveland, VAVw/Reheat
1A1 – 1D3
A-6 OSFC Elementary School Energy Simulation – Cleveland, VAVSFPMB w/Reheat
2A1 – 2D3
A-7 OSFC Elementary School Energy Simulation – Cleveland, WaterSource Heat Pump
3A1 – 3D1
A-8 OSFC Elementary School Energy Simulation – Cleveland, DualDuct VAV
4A-1 –4D3
A-9 OSFC Elementary School Energy Simulation – Columbus, VAVw/Reheat
1A1 – 1D3
A-10 OSFC Elementary School Energy Simulation – Columbus, VAVSFPMB w/Reheat
2A1 – 2D3
A-11 OSFC Elementary School Energy Simulation – Columbus, WaterSource Heat Pump
3A1 – 3D1
A-12 OSFC Elementary School Energy Simulation – Columbus, DualDuct VAV
4A1 –4D3
A-13 OSFC High School Energy Simulation – Cincinnati, VAVw/Reheat
1A1 – 1D3
A-14 OSFC High School Energy Simulation – Cincinnati, VAVSFPMB w/Reheat
2A1 – 2D3
A-15 OSFC High School Energy Simulation – Cincinnati, WaterSource Heat Pump
3A1 – 3D1
A-16 OSFC High School Energy Simulation – Cincinnati, Dual DuctVAV
4A1 – 4D3
A-17 OSFC High School Energy Simulation – Cleveland, VAVw/Reheat
1A1 – 1D3
A-18 OSFC High School Energy Simulation – Cleveland, VAVSFPMB w/Reheat
2A1 – 2D3
A-19 OSFC High School Energy Simulation – Cleveland, WaterSource Heat Pump
3A1 – 3D1
A-20 OSFC High School Energy Simulation – Cleveland, Dual DuctVAV
4A1 – 4D3
A-21 OSFC High School Energy Simulation – Columbus, VAVw/Reheat
1A1 – 1D3
A-22 OSFC High School Energy Simulation – Columbus, VAVSFPMB w/Reheat
2A1 – 2D3
A-23 OSFC High School Energy Simulation – Columbus, WaterSource Heat Pump
3A1 – 3D1
A-24 OSFC High School Energy Simulation – Columbus, Dual DuctVAV
4A1 – 4D3
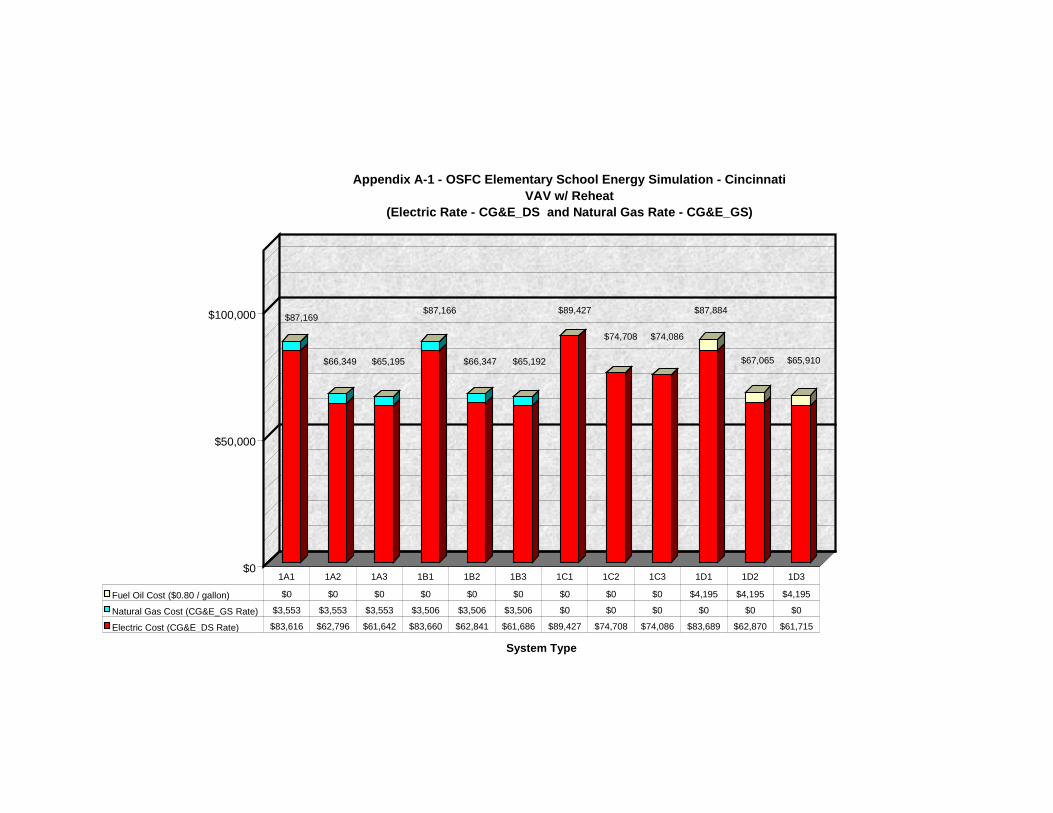
$0
$50,000
$100,000
System Type
Appendix A-1 - OSFC Elementary School Energy Simulation - CincinnatiVAV w/ Reheat
(Electric Rate - CG&E_DS and Natural Gas Rate - CG&E_GS)
Fuel Oil Cost ($0.80 / gallon) $0 $0 $0 $0 $0 $0 $0 $0 $0 $4,195 $4,195 $4,195
Natural Gas Cost (CG&E_GS Rate) $3,553 $3,553 $3,553 $3,506 $3,506 $3,506 $0 $0 $0 $0 $0 $0
Electric Cost (CG&E_DS Rate) $83,616 $62,796 $61,642 $83,660 $62,841 $61,686 $89,427 $74,708 $74,086 $83,689 $62,870 $61,715
1A1 1A2 1A3 1B1 1B2 1B3 1C1 1C2 1C3 1D1 1D2 1D3
$87,169
$66,349 $65,195
$87,166
$65,192$66,347
$89,427
$74,708 $74,086
$87,884
$67,065 $65,910
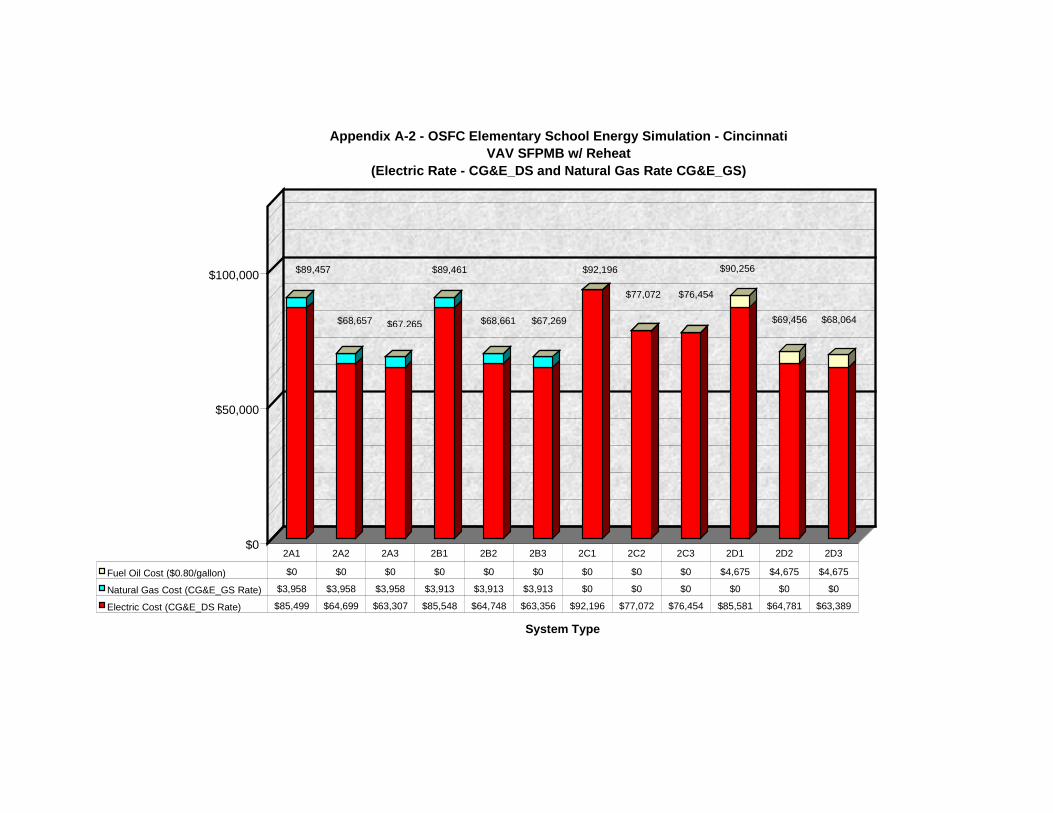
$0
$50,000
$100,000
System Type
Appendix A-2 - OSFC Elementary School Energy Simulation - CincinnatiVAV SFPMB w/ Reheat
(Electric Rate - CG&E_DS and Natural Gas Rate CG&E_GS)
Fuel Oil Cost ($0.80/gallon) $0 $0 $0 $0 $0 $0 $0 $0 $0 $4,675 $4,675 $4,675
Natural Gas Cost (CG&E_GS Rate) $3,958 $3,958 $3,958 $3,913 $3,913 $3,913 $0 $0 $0 $0 $0 $0
Electric Cost (CG&E_DS Rate) $85,499 $64,699 $63,307 $85,548 $64,748 $63,356 $92,196 $77,072 $76,454 $85,581 $64,781 $63,389
2A1 2A2 2A3 2B1 2B2 2B3 2C1 2C2 2C3 2D1 2D2 2D3
$89,457
$68,657 $67,265
$89,461
$68,661 $67,269
$92,196
$76,454$77,072
$90,256
$69,456 $68,064
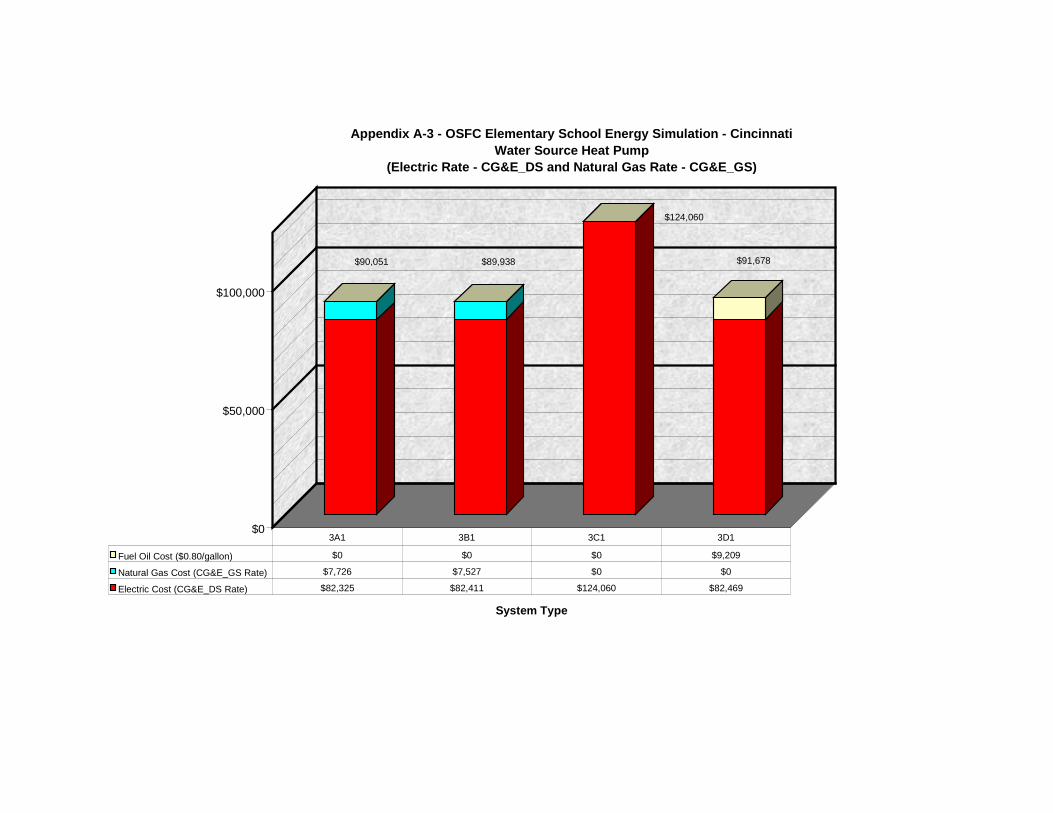
$0
$50,000
$100,000
System Type
Appendix A-3 - OSFC Elementary School Energy Simulation - CincinnatiWater Source Heat Pump
(Electric Rate - CG&E_DS and Natural Gas Rate - CG&E_GS)
Fuel Oil Cost ($0.80/gallon) $0 $0 $0 $9,209
Natural Gas Cost (CG&E_GS Rate) $7,726 $7,527 $0 $0
Electric Cost (CG&E_DS Rate) $82,325 $82,411 $124,060 $82,469
3A1 3B1 3C1 3D1
$90,051 $89,938
$124,060
$91,678
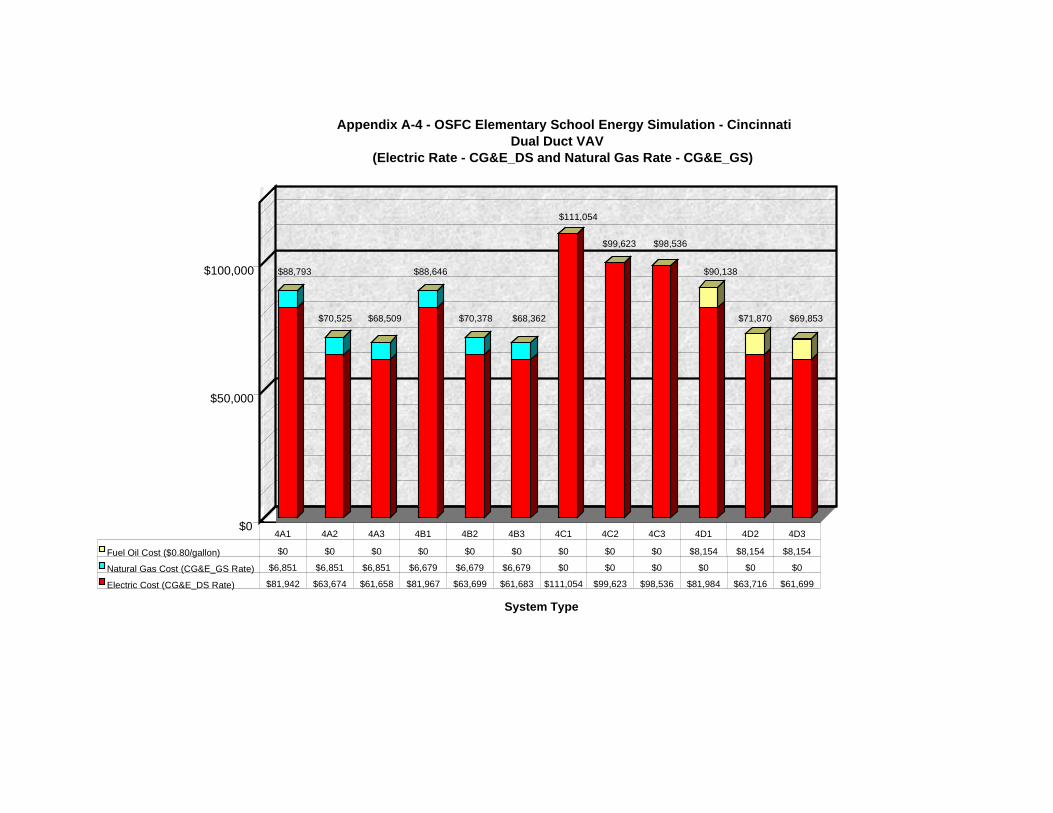
$0
$50,000
$100,000
System Type
Appendix A-4 - OSFC Elementary School Energy Simulation - CincinnatiDual Duct VAV
(Electric Rate - CG&E_DS and Natural Gas Rate - CG&E_GS)
Fuel Oil Cost ($0.80/gallon) $0 $0 $0 $0 $0 $0 $0 $0 $0 $8,154 $8,154 $8,154
Natural Gas Cost (CG&E_GS Rate) $6,851 $6,851 $6,851 $6,679 $6,679 $6,679 $0 $0 $0 $0 $0 $0
Electric Cost (CG&E_DS Rate) $81,942 $63,674 $61,658 $81,967 $63,699 $61,683 $111,054 $99,623 $98,536 $81,984 $63,716 $61,699
4A1 4A2 4A3 4B1 4B2 4B3 4C1 4C2 4C3 4D1 4D2 4D3
$88,793
$70,525 $68,509
$88,646
$70,378 $68,362
$111,054
$99,623 $98,536
$90,138
$71,870 $69,853
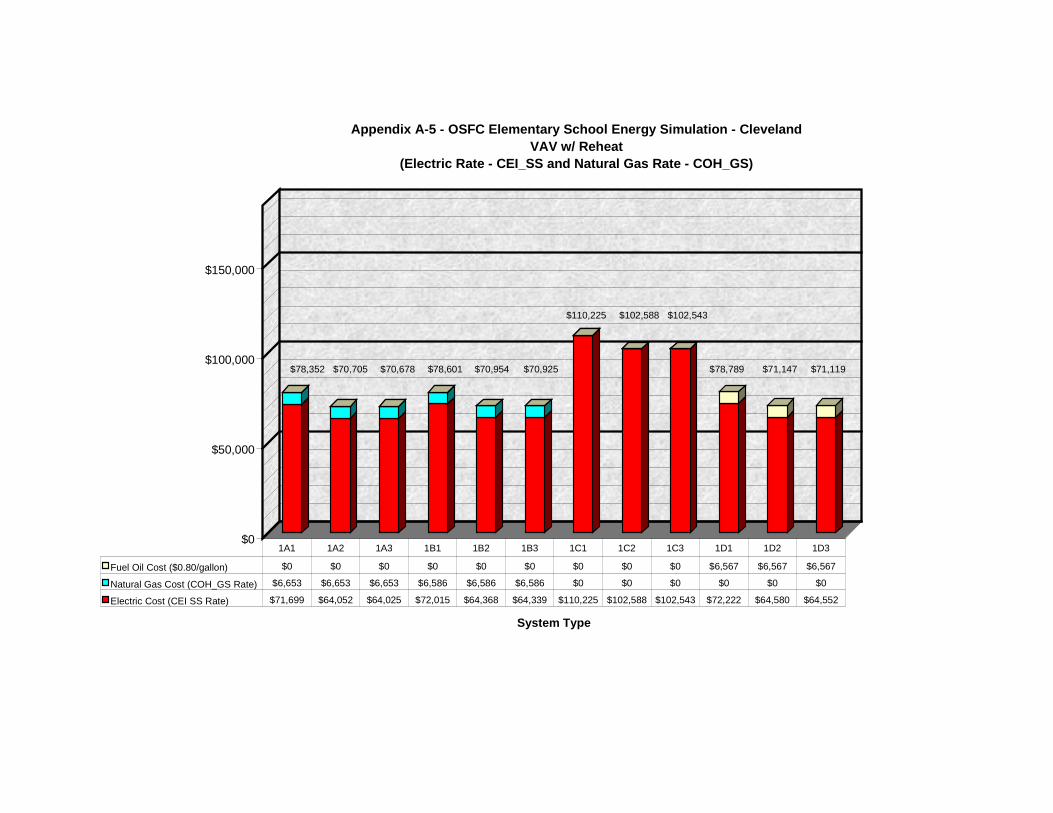
$0
$50,000
$100,000
$150,000
System Type
Appendix A-5 - OSFC Elementary School Energy Simulation - ClevelandVAV w/ Reheat
(Electric Rate - CEI_SS and Natural Gas Rate - COH_GS)
Fuel Oil Cost ($0.80/gallon) $0 $0 $0 $0 $0 $0 $0 $0 $0 $6,567 $6,567 $6,567
Natural Gas Cost (COH_GS Rate) $6,653 $6,653 $6,653 $6,586 $6,586 $6,586 $0 $0 $0 $0 $0 $0
Electric Cost (CEI SS Rate) $71,699 $64,052 $64,025 $72,015 $64,368 $64,339 $110,225 $102,588 $102,543 $72,222 $64,580 $64,552
1A1 1A2 1A3 1B1 1B2 1B3 1C1 1C2 1C3 1D1 1D2 1D3
$78,352 $70,705 $70,678 $78,601 $70,954 $70,925
$110,225 $102,588 $102,543
$78,789 $71,147 $71,119
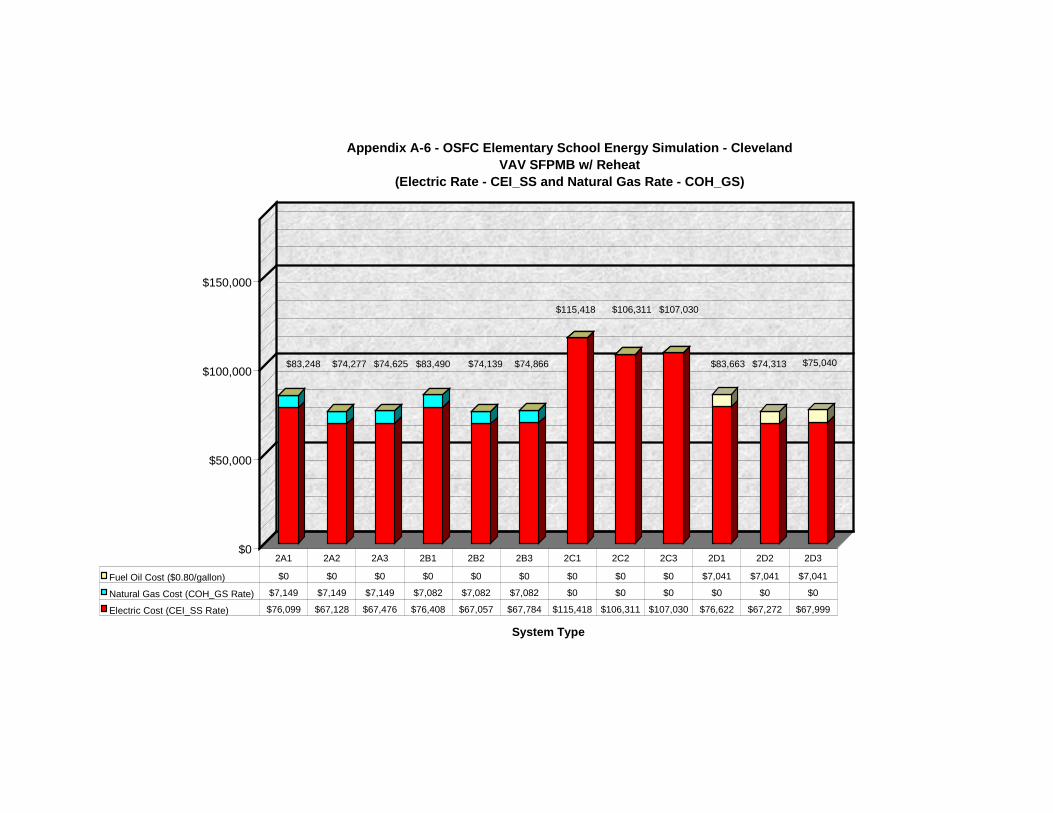
$0
$50,000
$100,000
$150,000
System Type
Appendix A-6 - OSFC Elementary School Energy Simulation - ClevelandVAV SFPMB w/ Reheat
(Electric Rate - CEI_SS and Natural Gas Rate - COH_GS)
Fuel Oil Cost ($0.80/gallon) $0 $0 $0 $0 $0 $0 $0 $0 $0 $7,041 $7,041 $7,041
Natural Gas Cost (COH_GS Rate) $7,149 $7,149 $7,149 $7,082 $7,082 $7,082 $0 $0 $0 $0 $0 $0
Electric Cost (CEI_SS Rate) $76,099 $67,128 $67,476 $76,408 $67,057 $67,784 $115,418 $106,311 $107,030 $76,622 $67,272 $67,999
2A1 2A2 2A3 2B1 2B2 2B3 2C1 2C2 2C3 2D1 2D2 2D3
$83,248 $74,277 $74,625 $83,490 $74,139 $74,866
$115,418 $106,311 $107,030
$83,663 $74,313 $75,040
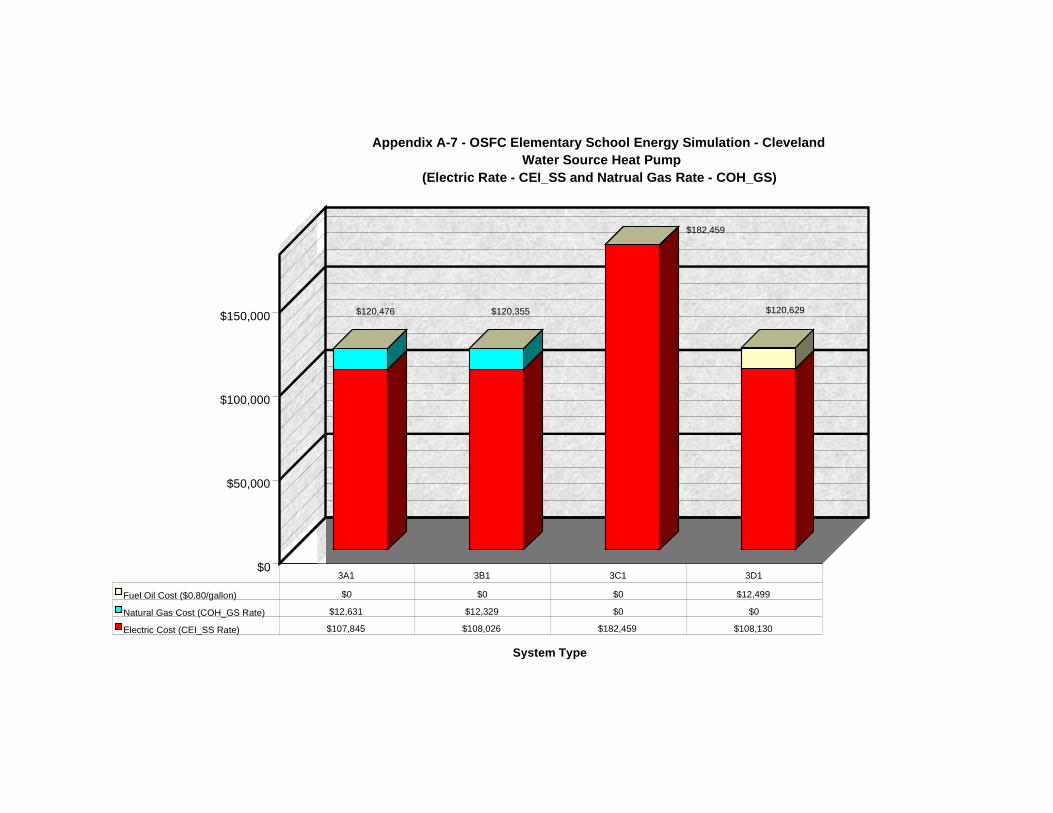
$0
$50,000
$100,000
$150,000
System Type
Appendix A-7 - OSFC Elementary School Energy Simulation - ClevelandWater Source Heat Pump
(Electric Rate - CEI_SS and Natrual Gas Rate - COH_GS)
Fuel Oil Cost ($0.80/gallon) $0 $0 $0 $12,499
Natural Gas Cost (COH_GS Rate) $12,631 $12,329 $0 $0
Electric Cost (CEI_SS Rate) $107,845 $108,026 $182,459 $108,130
3A1 3B1 3C1 3D1
$120,476 $120,355 $120,629
$182,459
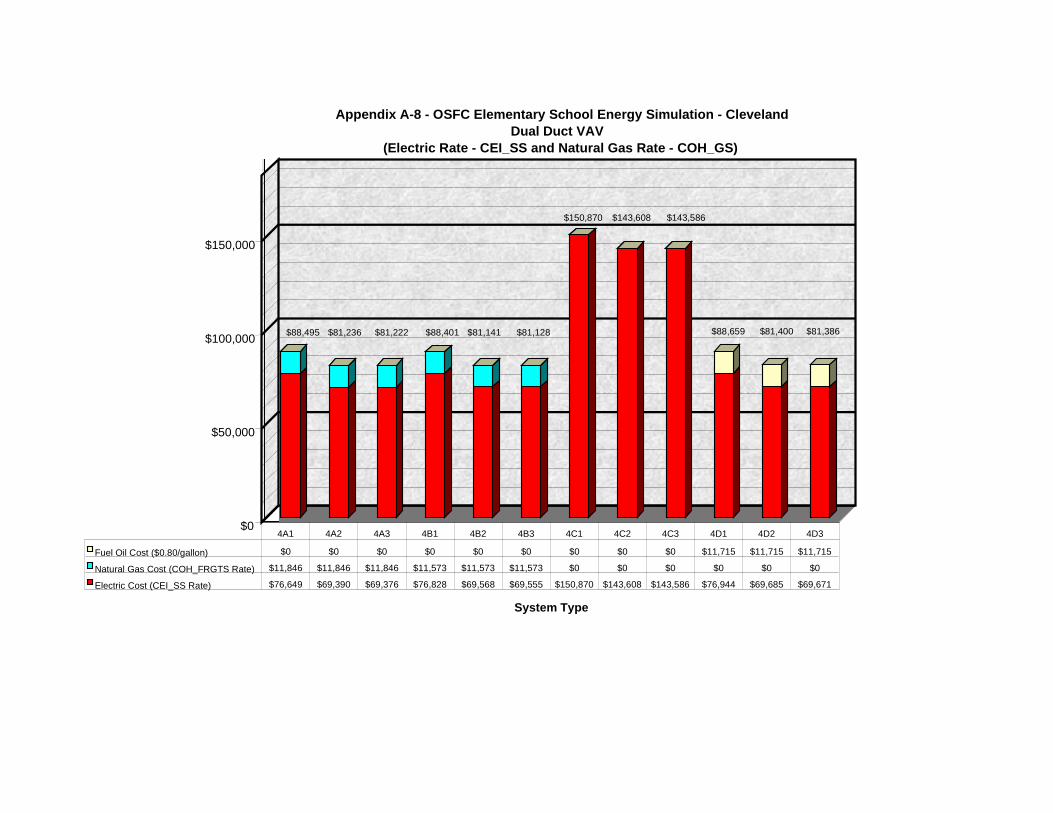
$0
$50,000
$100,000
$150,000
System Type
Appendix A-8 - OSFC Elementary School Energy Simulation - ClevelandDual Duct VAV
(Electric Rate - CEI_SS and Natural Gas Rate - COH_GS)
Fuel Oil Cost ($0.80/gallon) $0 $0 $0 $0 $0 $0 $0 $0 $0 $11,715 $11,715 $11,715
Natural Gas Cost (COH_FRGTS Rate) $11,846 $11,846 $11,846 $11,573 $11,573 $11,573 $0 $0 $0 $0 $0 $0
Electric Cost (CEI_SS Rate) $76,649 $69,390 $69,376 $76,828 $69,568 $69,555 $150,870 $143,608 $143,586 $76,944 $69,685 $69,671
4A1 4A2 4A3 4B1 4B2 4B3 4C1 4C2 4C3 4D1 4D2 4D3
$88,495 $81,236 $81,222 $88,401 $81,141 $81,128
$150,870 $143,608 $143,586
$88,659 $81,400 $81,386
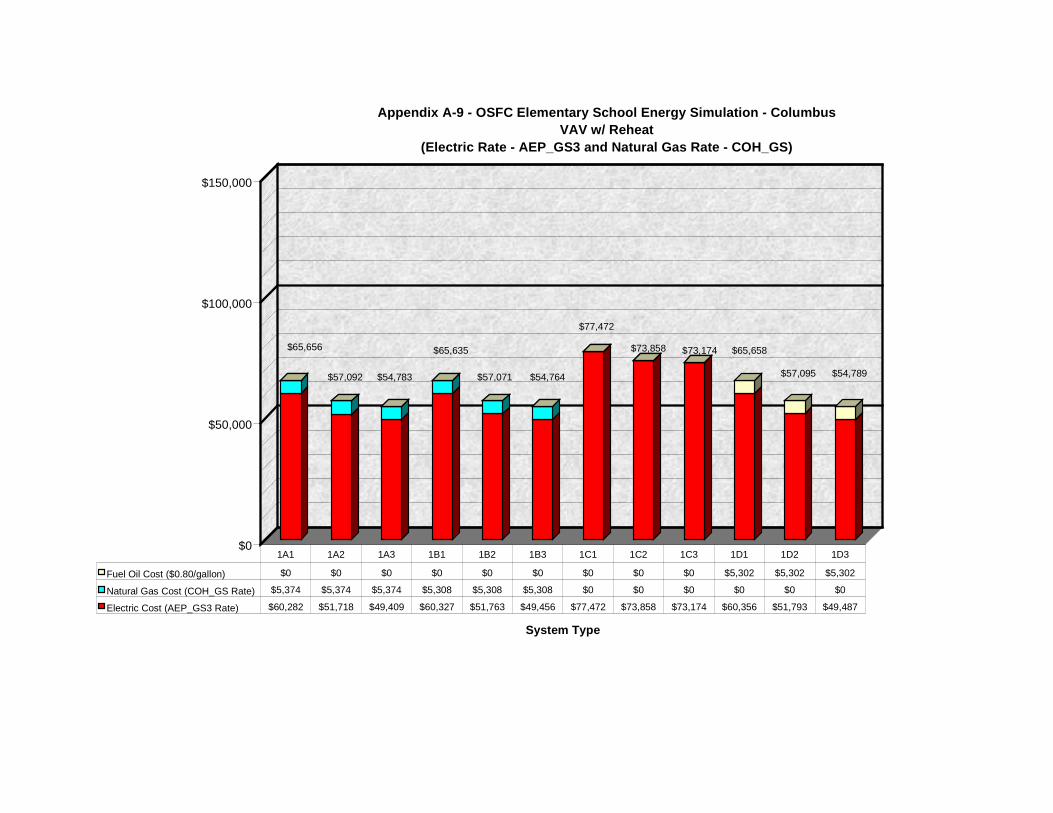
$0
$50,000
$100,000
$150,000
System Type
Appendix A-9 - OSFC Elementary School Energy Simulation - ColumbusVAV w/ Reheat
(Electric Rate - AEP_GS3 and Natural Gas Rate - COH_GS)
Fuel Oil Cost ($0.80/gallon) $0 $0 $0 $0 $0 $0 $0 $0 $0 $5,302 $5,302 $5,302
Natural Gas Cost (COH_GS Rate) $5,374 $5,374 $5,374 $5,308 $5,308 $5,308 $0 $0 $0 $0 $0 $0
Electric Cost (AEP_GS3 Rate) $60,282 $51,718 $49,409 $60,327 $51,763 $49,456 $77,472 $73,858 $73,174 $60,356 $51,793 $49,487
1A1 1A2 1A3 1B1 1B2 1B3 1C1 1C2 1C3 1D1 1D2 1D3
$65,656
$57,092 $54,783
$65,635
$57,071 $54,764
$77,472
$73,858 $73,174 $65,658
$57,095 $54,789

$0
$50,000
$100,000
$150,000
System Type
Appendix A-10 - OSFC Elementary School Energy Simulation - ColumbusVAV SFPMB w/ Reheat
(Electric Rate - AEP_GS3 and Natural Gas Rate - COH_GS)
Fuel Oil Cost ($0.80/gallon) $0 $0 $0 $0 $0 $0 $0 $0 $0 $5,430 $5,430 $5,430
Natural Gas Cost (COH_GS Rate) $5,509 $5,509 $5,509 $5,453 $5,453 $5,453 $0 $0 $0 $0 $0 $0
Electric Cost (AEP_GS3 Rate) $63,419 $53,010 $52,180 $63,465 $53,056 $52,227 $80,535 $75,998 $75,826 $63,496 $53,087 $52,257
2A1 2A2 2A3 2B1 2B2 2B3 2C1 2C2 2C3 2D1 2D2 2D3
$68,928
$58,519 $57,689
$68,918
$58,509 $57,680
$80,535 $75,998 $75,826
$68,926
$58,517 $57,687
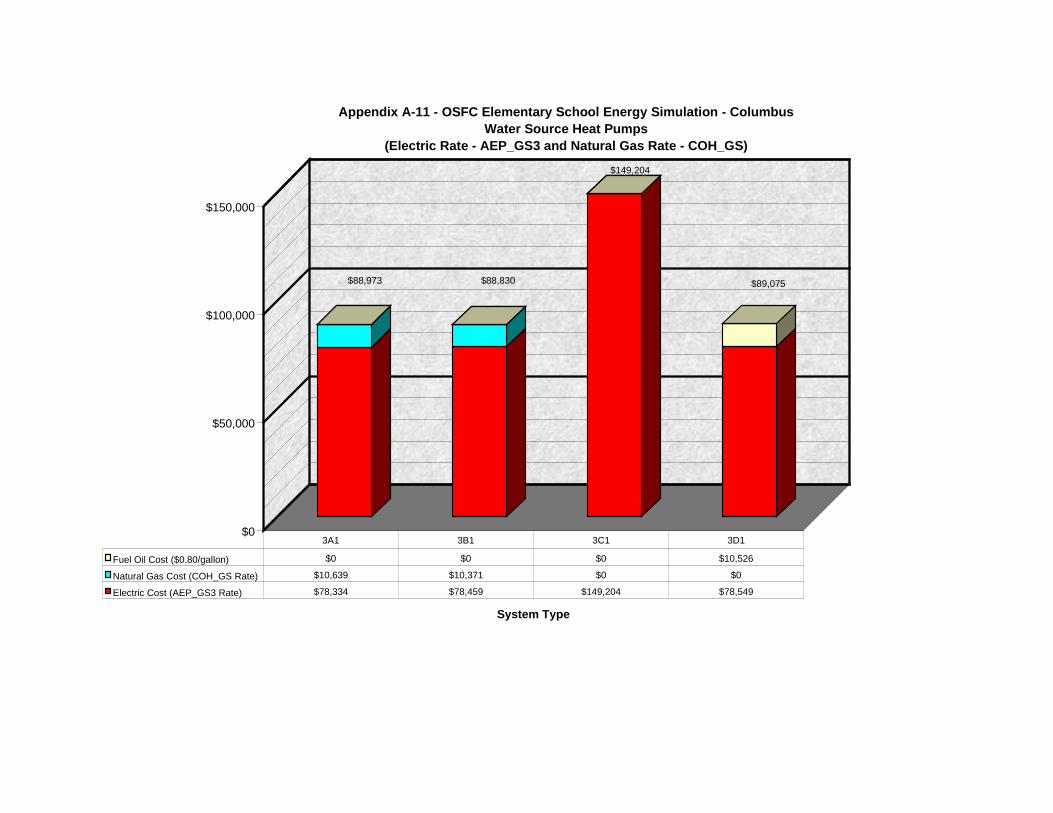
$0
$50,000
$100,000
$150,000
System Type
Appendix A-11 - OSFC Elementary School Energy Simulation - ColumbusWater Source Heat Pumps
(Electric Rate - AEP_GS3 and Natural Gas Rate - COH_GS)
Fuel Oil Cost ($0.80/gallon) $0 $0 $0 $10,526
Natural Gas Cost (COH_GS Rate) $10,639 $10,371 $0 $0
Electric Cost (AEP_GS3 Rate) $78,334 $78,459 $149,204 $78,549
3A1 3B1 3C1 3D1
$88,973 $88,830
$149,204
$89,075
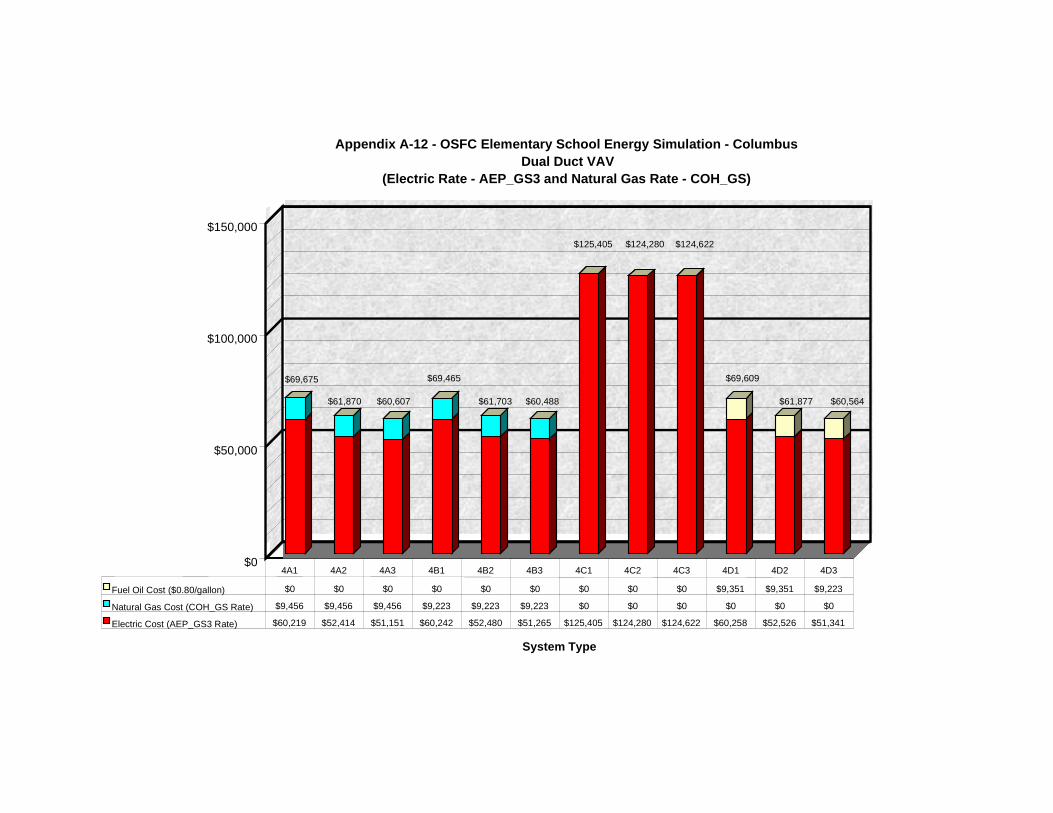
$0
$50,000
$100,000
$150,000
System Type
Appendix A-12 - OSFC Elementary School Energy Simulation - ColumbusDual Duct VAV
(Electric Rate - AEP_GS3 and Natural Gas Rate - COH_GS)
Fuel Oil Cost ($0.80/gallon) $0 $0 $0 $0 $0 $0 $0 $0 $0 $9,351 $9,351 $9,223
Natural Gas Cost (COH_GS Rate) $9,456 $9,456 $9,456 $9,223 $9,223 $9,223 $0 $0 $0 $0 $0 $0
Electric Cost (AEP_GS3 Rate) $60,219 $52,414 $51,151 $60,242 $52,480 $51,265 $125,405 $124,280 $124,622 $60,258 $52,526 $51,341
4A1 4A2 4A3 4B1 4B2 4B3 4C1 4C2 4C3 4D1 4D2 4D3
$69,675
$61,870 $60,607
$69,465
$61,703 $60,488
$125,405 $124,280 $124,622
$69,609
$61,877 $60,564
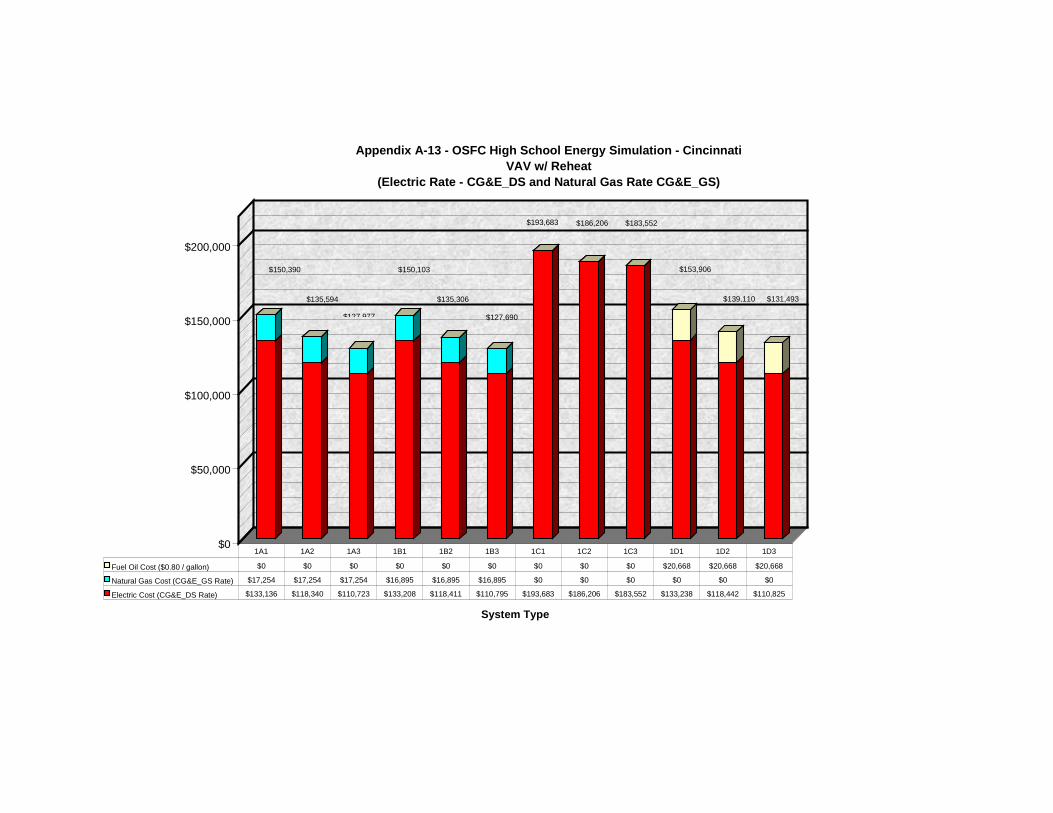
$0
$50,000
$100,000
$150,000
$200,000
System Type
Appendix A-13 - OSFC High School Energy Simulation - CincinnatiVAV w/ Reheat
(Electric Rate - CG&E_DS and Natural Gas Rate CG&E_GS)
Fuel Oil Cost ($0.80 / gallon) $0 $0 $0 $0 $0 $0 $0 $0 $0 $20,668 $20,668 $20,668
Natural Gas Cost (CG&E_GS Rate) $17,254 $17,254 $17,254 $16,895 $16,895 $16,895 $0 $0 $0 $0 $0 $0
Electric Cost (CG&E_DS Rate) $133,136 $118,340 $110,723 $133,208 $118,411 $110,795 $193,683 $186,206 $183,552 $133,238 $118,442 $110,825
1A1 1A2 1A3 1B1 1B2 1B3 1C1 1C2 1C3 1D1 1D2 1D3
$150,390
$135,594
$127 977
$150,103
$135,306
$127,690
$193,683 $186,206 $183,552
$153,906
$139,110 $131,493
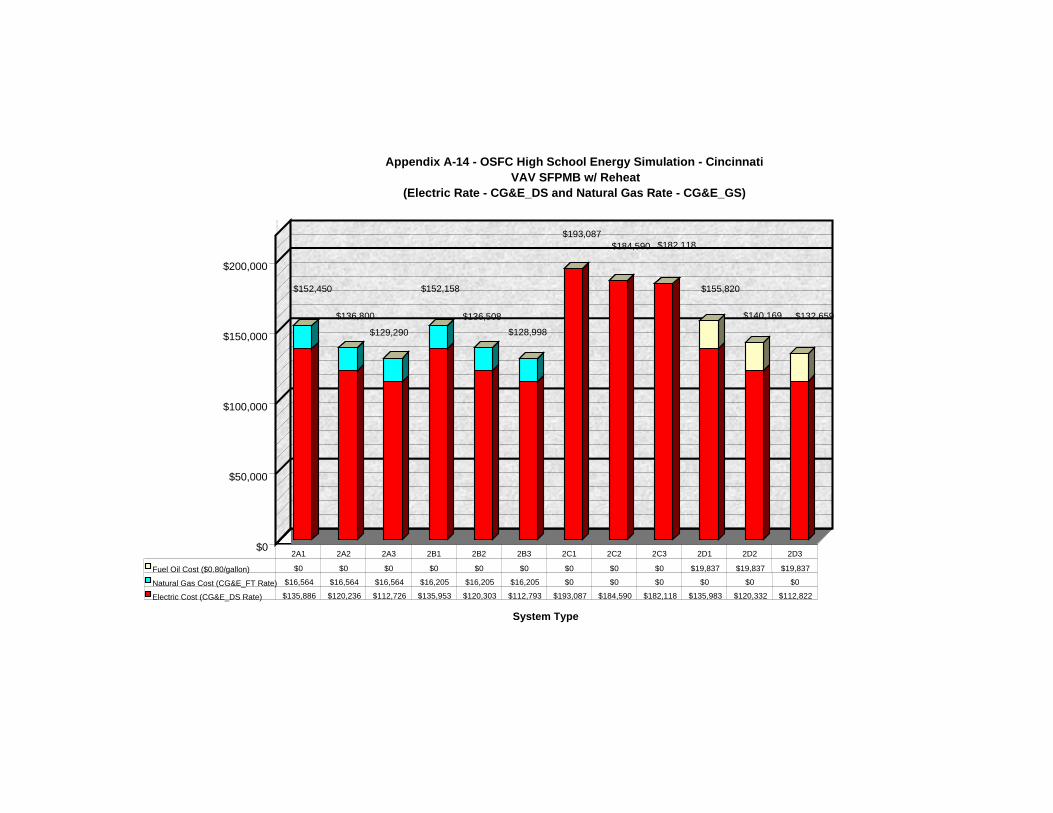
$0
$50,000
$100,000
$150,000
$200,000
System Type
Appendix A-14 - OSFC High School Energy Simulation - CincinnatiVAV SFPMB w/ Reheat
(Electric Rate - CG&E_DS and Natural Gas Rate - CG&E_GS)
Fuel Oil Cost ($0.80/gallon) $0 $0 $0 $0 $0 $0 $0 $0 $0 $19,837 $19,837 $19,837
Natural Gas Cost (CG&E_FT Rate) $16,564 $16,564 $16,564 $16,205 $16,205 $16,205 $0 $0 $0 $0 $0 $0
Electric Cost (CG&E_DS Rate) $135,886 $120,236 $112,726 $135,953 $120,303 $112,793 $193,087 $184,590 $182,118 $135,983 $120,332 $112,822
2A1 2A2 2A3 2B1 2B2 2B3 2C1 2C2 2C3 2D1 2D2 2D3
$152,450
$136,800
$129,290
$152,158
$136,508$128,998
$193,087$184,590 $182,118
$155,820
$140,169 $132,659
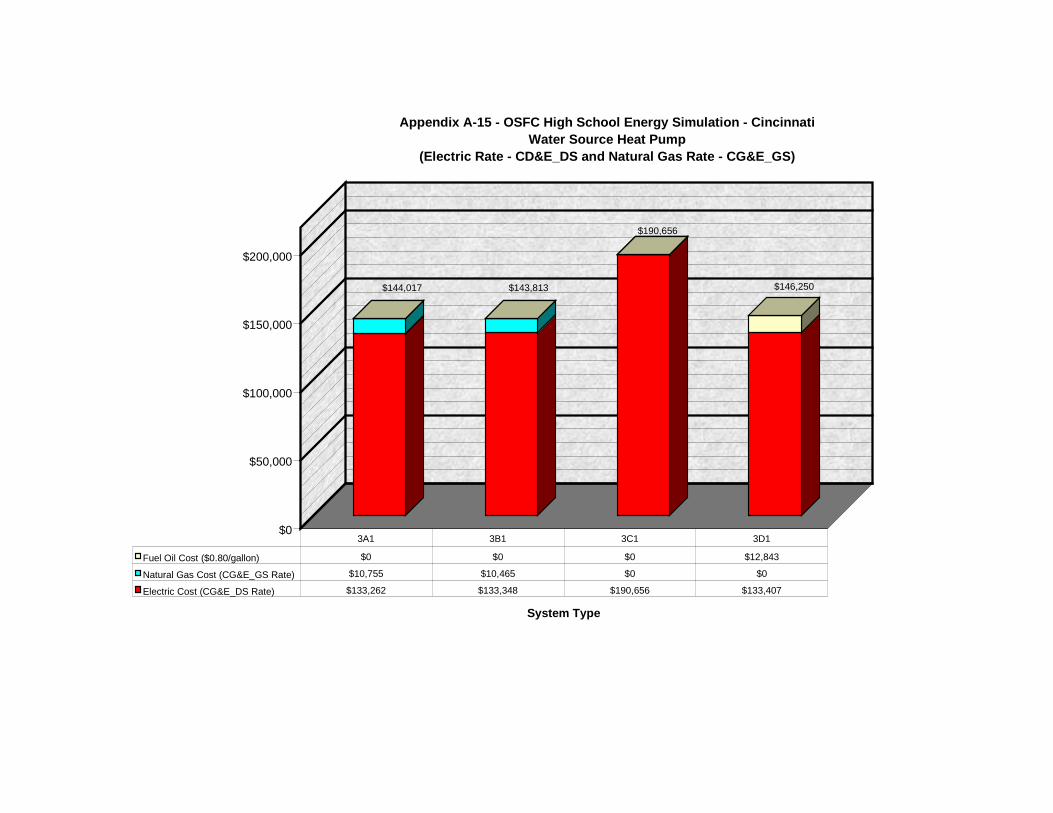
$0
$50,000
$100,000
$150,000
$200,000
System Type
Appendix A-15 - OSFC High School Energy Simulation - CincinnatiWater Source Heat Pump
(Electric Rate - CD&E_DS and Natural Gas Rate - CG&E_GS)
Fuel Oil Cost ($0.80/gallon) $0 $0 $0 $12,843
Natural Gas Cost (CG&E_GS Rate) $10,755 $10,465 $0 $0
Electric Cost (CG&E_DS Rate) $133,262 $133,348 $190,656 $133,407
3A1 3B1 3C1 3D1
$144,017 $143,813
$190,656
$146,250
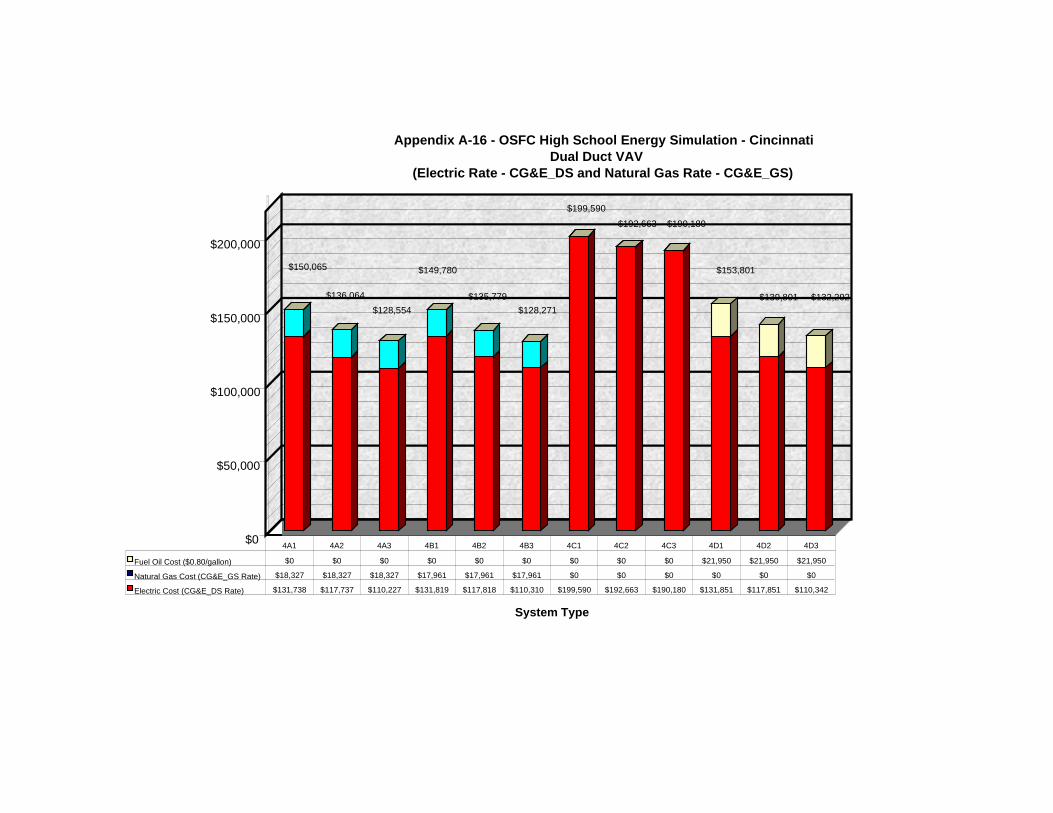
$0
$50,000
$100,000
$150,000
$200,000
System Type
Appendix A-16 - OSFC High School Energy Simulation - CincinnatiDual Duct VAV
(Electric Rate - CG&E_DS and Natural Gas Rate - CG&E_GS)
Fuel Oil Cost ($0.80/gallon) $0 $0 $0 $0 $0 $0 $0 $0 $0 $21,950 $21,950 $21,950
Natural Gas Cost (CG&E_GS Rate) $18,327 $18,327 $18,327 $17,961 $17,961 $17,961 $0 $0 $0 $0 $0 $0
Electric Cost (CG&E_DS Rate) $131,738 $117,737 $110,227 $131,819 $117,818 $110,310 $199,590 $192,663 $190,180 $131,851 $117,851 $110,342
4A1 4A2 4A3 4B1 4B2 4B3 4C1 4C2 4C3 4D1 4D2 4D3
$150,065
$128,554
$149,780
$135,779$128,271
$199,590$192,663 $190,180
$153,801
$139,801 $132,292$136,064
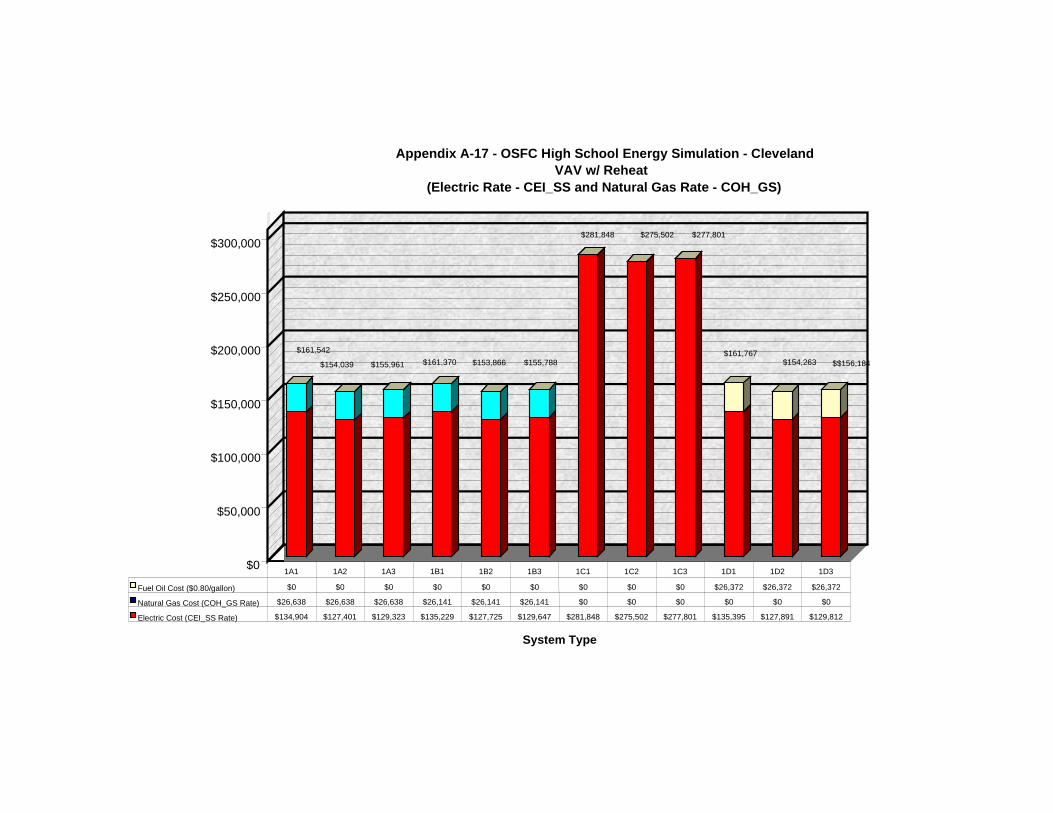
$0
$50,000
$100,000
$150,000
$200,000
$250,000
$300,000
System Type
Appendix A-17 - OSFC High School Energy Simulation - ClevelandVAV w/ Reheat
(Electric Rate - CEI_SS and Natural Gas Rate - COH_GS)
Fuel Oil Cost ($0.80/gallon) $0 $0 $0 $0 $0 $0 $0 $0 $0 $26,372 $26,372 $26,372
Natural Gas Cost (COH_GS Rate) $26,638 $26,638 $26,638 $26,141 $26,141 $26,141 $0 $0 $0 $0 $0 $0
Electric Cost (CEI_SS Rate) $134,904 $127,401 $129,323 $135,229 $127,725 $129,647 $281,848 $275,502 $277,801 $135,395 $127,891 $129,812
1A1 1A2 1A3 1B1 1B2 1B3 1C1 1C2 1C3 1D1 1D2 1D3
$161,542
$154,039 $155,961 $161,370 $153,866 $155,788
$281,848 $275,502 $277,801
$161,767$154,263 $$156,184
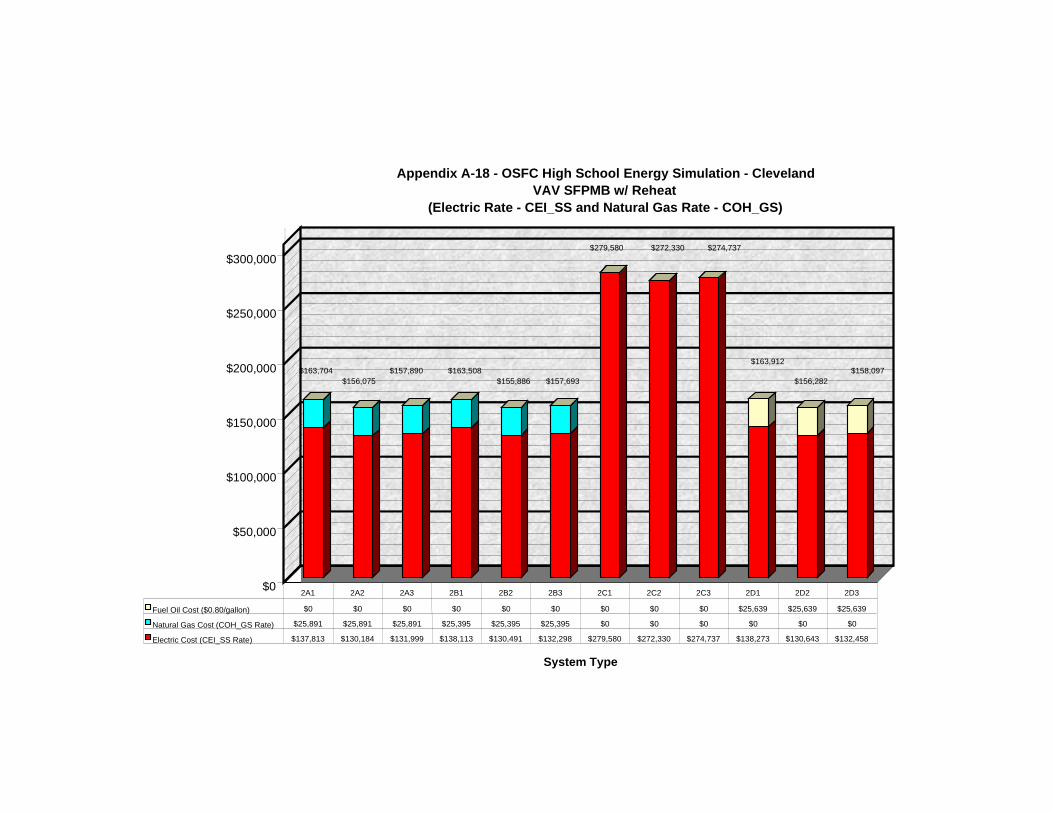
$0
$50,000
$100,000
$150,000
$200,000
$250,000
$300,000
System Type
Appendix A-18 - OSFC High School Energy Simulation - ClevelandVAV SFPMB w/ Reheat
(Electric Rate - CEI_SS and Natural Gas Rate - COH_GS)
Fuel Oil Cost ($0.80/gallon) $0 $0 $0 $0 $0 $0 $0 $0 $0 $25,639 $25,639 $25,639
Natural Gas Cost (COH_GS Rate) $25,891 $25,891 $25,891 $25,395 $25,395 $25,395 $0 $0 $0 $0 $0 $0
Electric Cost (CEI_SS Rate) $137,813 $130,184 $131,999 $138,113 $130,491 $132,298 $279,580 $272,330 $274,737 $138,273 $130,643 $132,458
2A1 2A2 2A3 2B1 2B2 2B3 2C1 2C2 2C3 2D1 2D2 2D3
$156,075$157,890 $163,508
$155,886 $157,693
$279,580 $272,330 $274,737
$163,912
$156,282$158,097$163,704
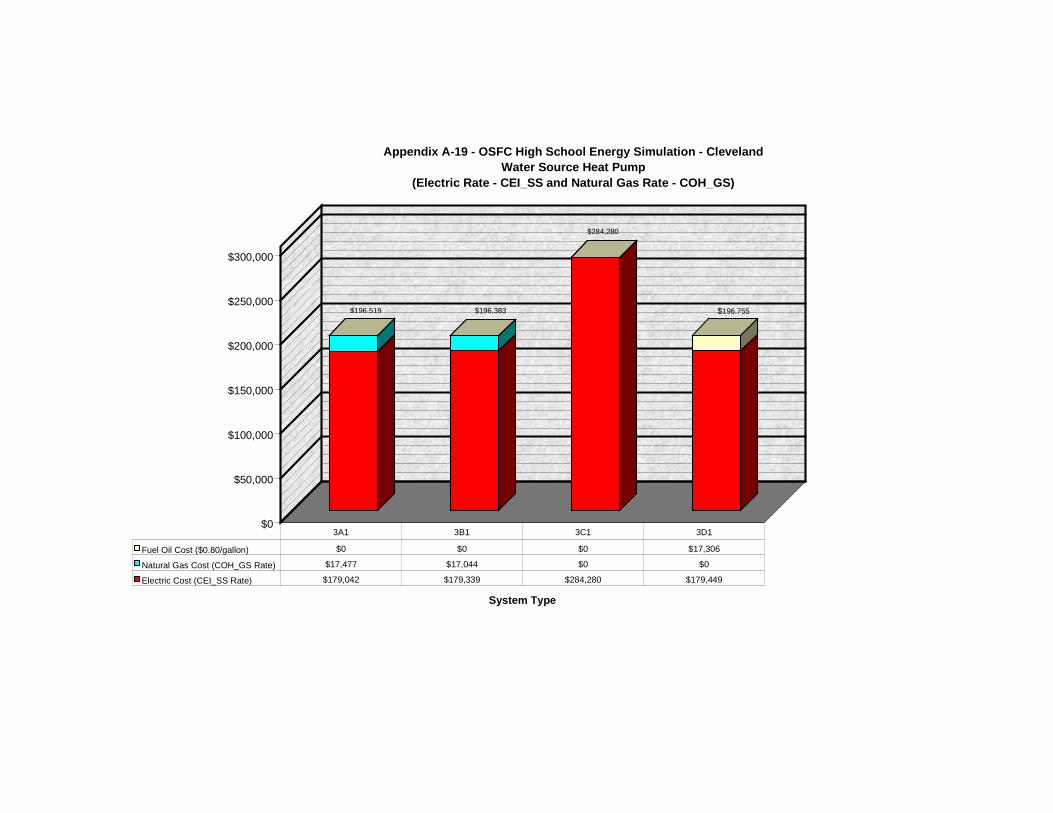
$0
$50,000
$100,000
$150,000
$200,000
$250,000
$300,000
System Type
Appendix A-19 - OSFC High School Energy Simulation - ClevelandWater Source Heat Pump
(Electric Rate - CEI_SS and Natural Gas Rate - COH_GS)
Fuel Oil Cost ($0.80/gallon) $0 $0 $0 $17,306
Natural Gas Cost (COH_GS Rate) $17,477 $17,044 $0 $0
Electric Cost (CEI_SS Rate) $179,042 $179,339 $284,280 $179,449
3A1 3B1 3C1 3D1
$196,519 $196,383 $196,755
$284,280
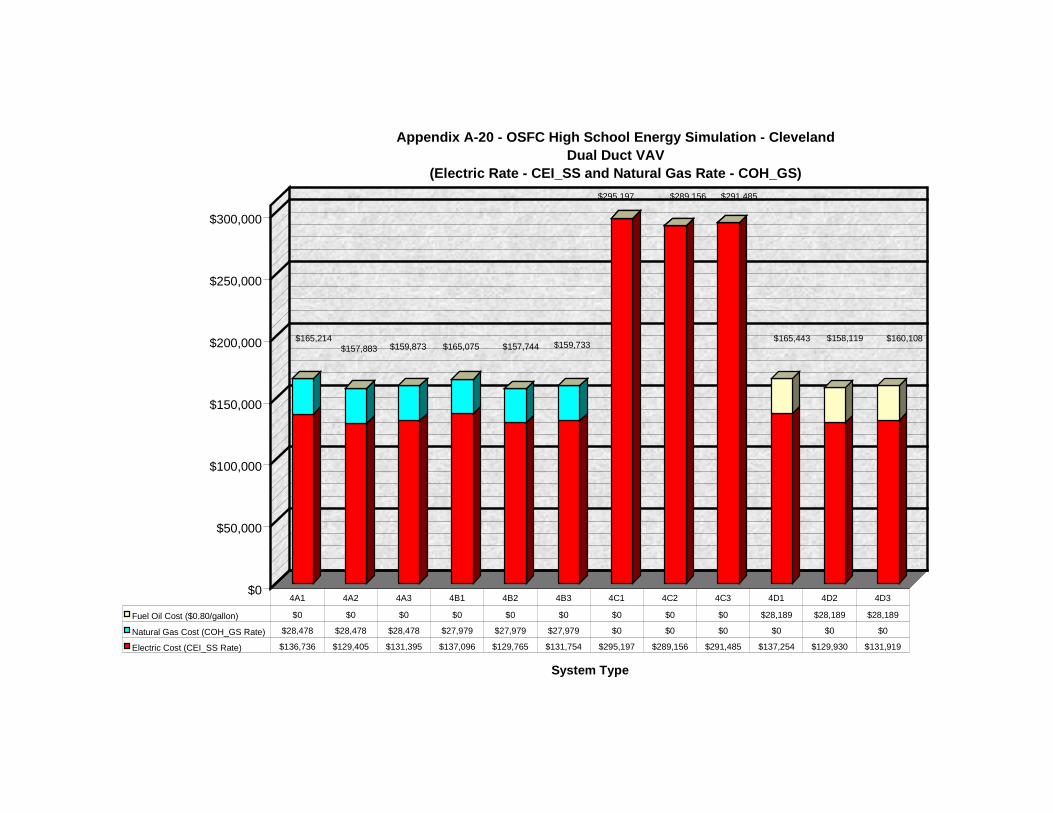
$0
$50,000
$100,000
$150,000
$200,000
$250,000
$300,000
System Type
Appendix A-20 - OSFC High School Energy Simulation - ClevelandDual Duct VAV
(Electric Rate - CEI_SS and Natural Gas Rate - COH_GS)
Fuel Oil Cost ($0.80/gallon) $0 $0 $0 $0 $0 $0 $0 $0 $0 $28,189 $28,189 $28,189
Natural Gas Cost (COH_GS Rate) $28,478 $28,478 $28,478 $27,979 $27,979 $27,979 $0 $0 $0 $0 $0 $0
Electric Cost (CEI_SS Rate) $136,736 $129,405 $131,395 $137,096 $129,765 $131,754 $295,197 $289,156 $291,485 $137,254 $129,930 $131,919
4A1 4A2 4A3 4B1 4B2 4B3 4C1 4C2 4C3 4D1 4D2 4D3
$165,214 $157,883 $159,873 $165,075 $157,744 $159,733
$295,197 $289,156 $291,485
$165,443 $158,119 $160,108
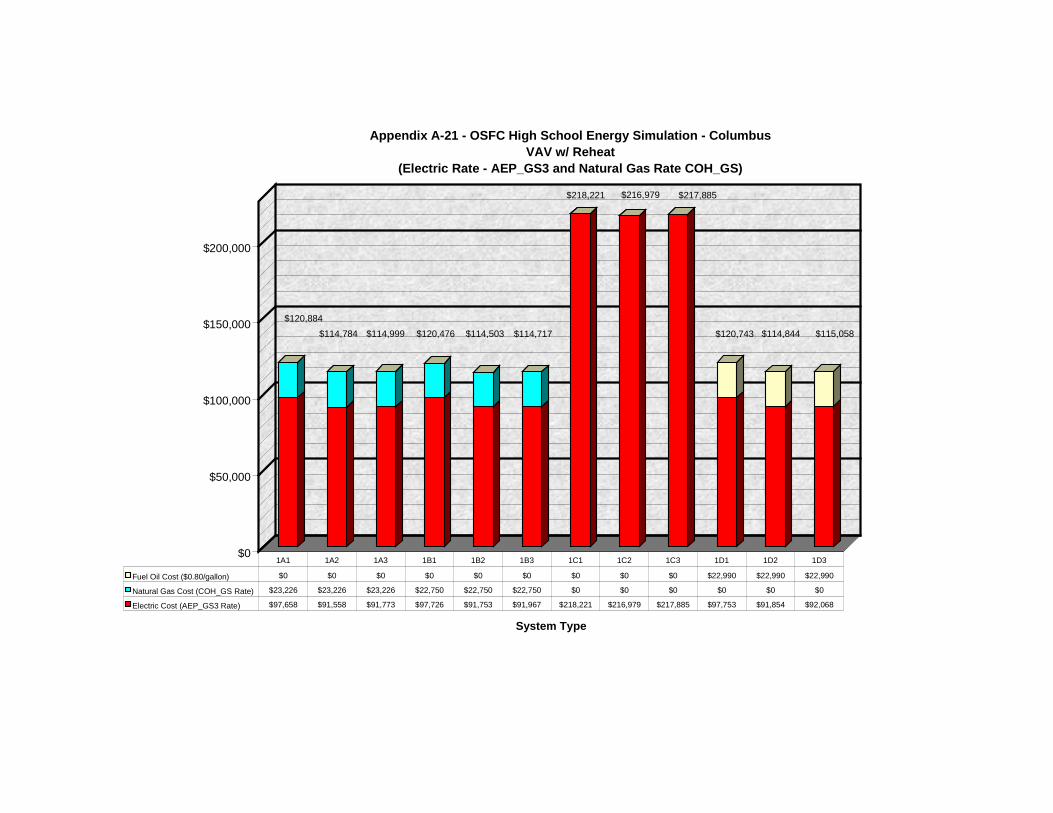
$0
$50,000
$100,000
$150,000
$200,000
System Type
Appendix A-21 - OSFC High School Energy Simulation - ColumbusVAV w/ Reheat
(Electric Rate - AEP_GS3 and Natural Gas Rate COH_GS)
Fuel Oil Cost ($0.80/gallon) $0 $0 $0 $0 $0 $0 $0 $0 $0 $22,990 $22,990 $22,990
Natural Gas Cost (COH_GS Rate) $23,226 $23,226 $23,226 $22,750 $22,750 $22,750 $0 $0 $0 $0 $0 $0
Electric Cost (AEP_GS3 Rate) $97,658 $91,558 $91,773 $97,726 $91,753 $91,967 $218,221 $216,979 $217,885 $97,753 $91,854 $92,068
1A1 1A2 1A3 1B1 1B2 1B3 1C1 1C2 1C3 1D1 1D2 1D3
$120,884$114,784 $114,999 $120,476 $114,503 $114,717
$218,221 $216,979 $217,885
$120,743 $114,844 $115,058
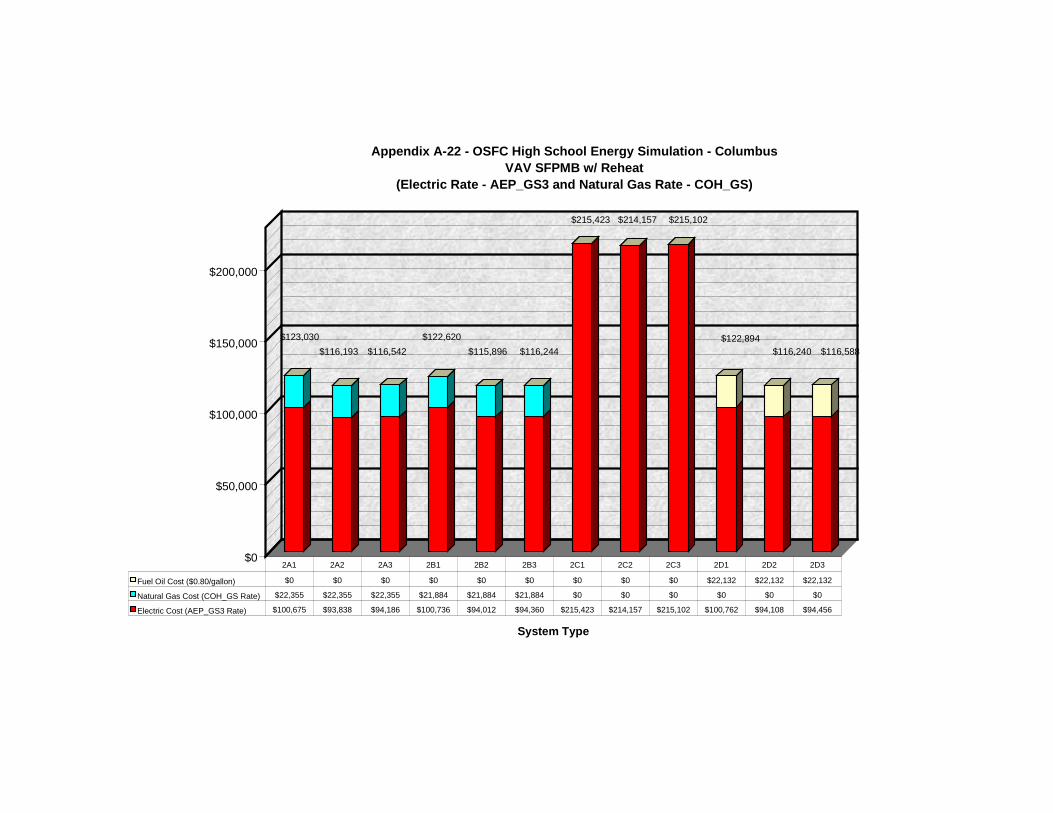
$0
$50,000
$100,000
$150,000
$200,000
System Type
Appendix A-22 - OSFC High School Energy Simulation - ColumbusVAV SFPMB w/ Reheat
(Electric Rate - AEP_GS3 and Natural Gas Rate - COH_GS)
Fuel Oil Cost ($0.80/gallon) $0 $0 $0 $0 $0 $0 $0 $0 $0 $22,132 $22,132 $22,132
Natural Gas Cost (COH_GS Rate) $22,355 $22,355 $22,355 $21,884 $21,884 $21,884 $0 $0 $0 $0 $0 $0
Electric Cost (AEP_GS3 Rate) $100,675 $93,838 $94,186 $100,736 $94,012 $94,360 $215,423 $214,157 $215,102 $100,762 $94,108 $94,456
2A1 2A2 2A3 2B1 2B2 2B3 2C1 2C2 2C3 2D1 2D2 2D3
$123,030 $116,193 $116,542
$122,620 $115,896 $116,244
$215,423 $214,157 $215,102
$122,894 $116,240 $116,588
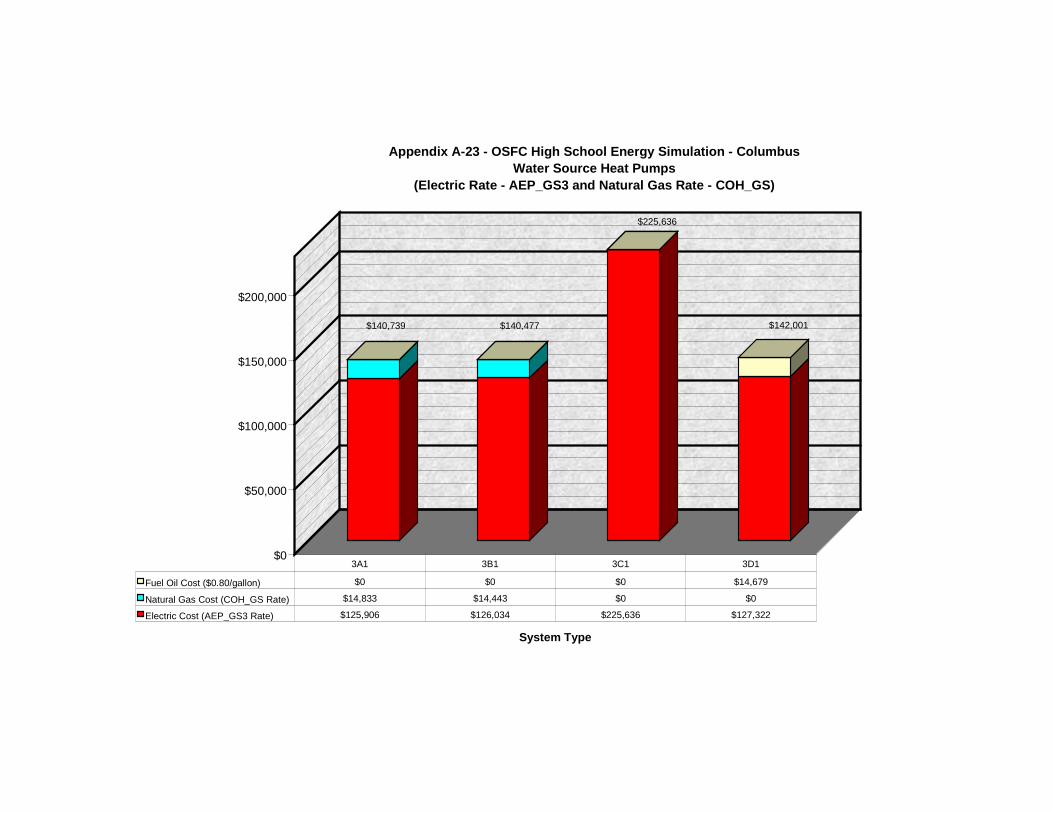
$0
$50,000
$100,000
$150,000
$200,000
System Type
Appendix A-23 - OSFC High School Energy Simulation - ColumbusWater Source Heat Pumps
(Electric Rate - AEP_GS3 and Natural Gas Rate - COH_GS)
Fuel Oil Cost ($0.80/gallon) $0 $0 $0 $14,679
Natural Gas Cost (COH_GS Rate) $14,833 $14,443 $0 $0
Electric Cost (AEP_GS3 Rate) $125,906 $126,034 $225,636 $127,322
3A1 3B1 3C1 3D1
$140,739 $140,477
$225,636
$142,001
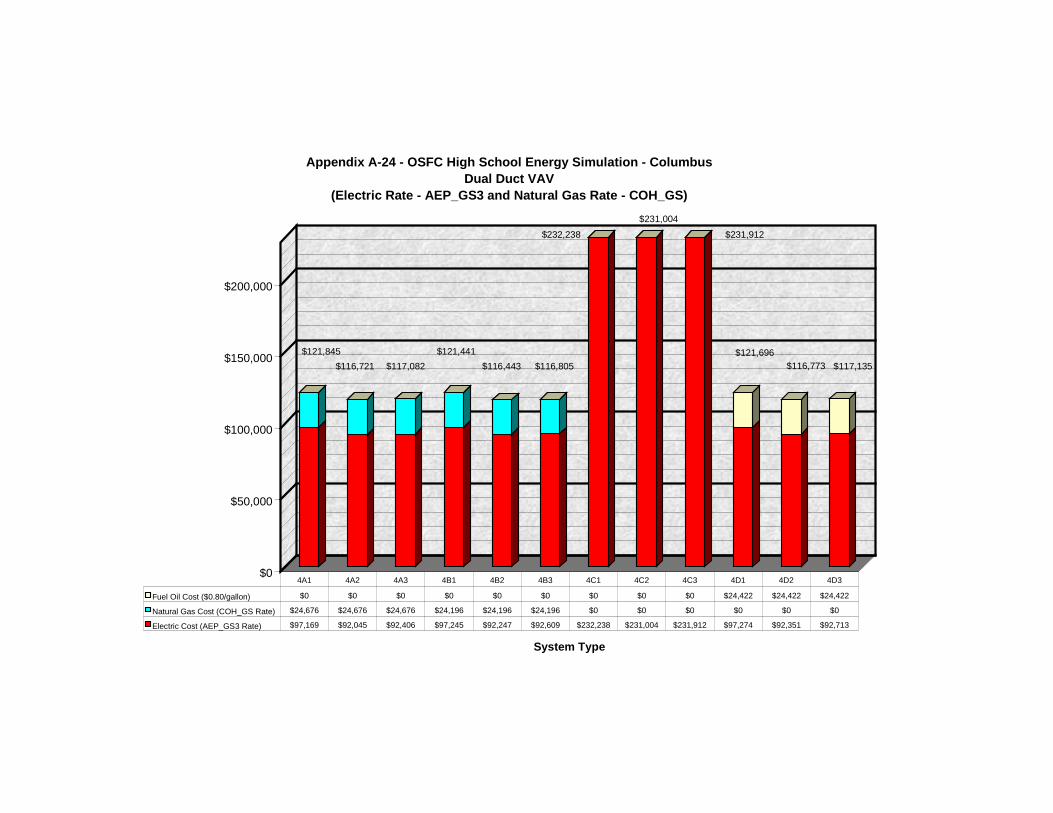
$0
$50,000
$100,000
$150,000
$200,000
System Type
Appendix A-24 - OSFC High School Energy Simulation - ColumbusDual Duct VAV
(Electric Rate - AEP_GS3 and Natural Gas Rate - COH_GS)
Fuel Oil Cost ($0.80/gallon) $0 $0 $0 $0 $0 $0 $0 $0 $0 $24,422 $24,422 $24,422
Natural Gas Cost (COH_GS Rate) $24,676 $24,676 $24,676 $24,196 $24,196 $24,196 $0 $0 $0 $0 $0 $0
Electric Cost (AEP_GS3 Rate) $97,169 $92,045 $92,406 $97,245 $92,247 $92,609 $232,238 $231,004 $231,912 $97,274 $92,351 $92,713
4A1 4A2 4A3 4B1 4B2 4B3 4C1 4C2 4C3 4D1 4D2 4D3
$121,845 $116,721 $117,082
$121,441 $116,443 $116,805
$232,238 $231,004
$231,912
$121,696 $116,773 $117,135
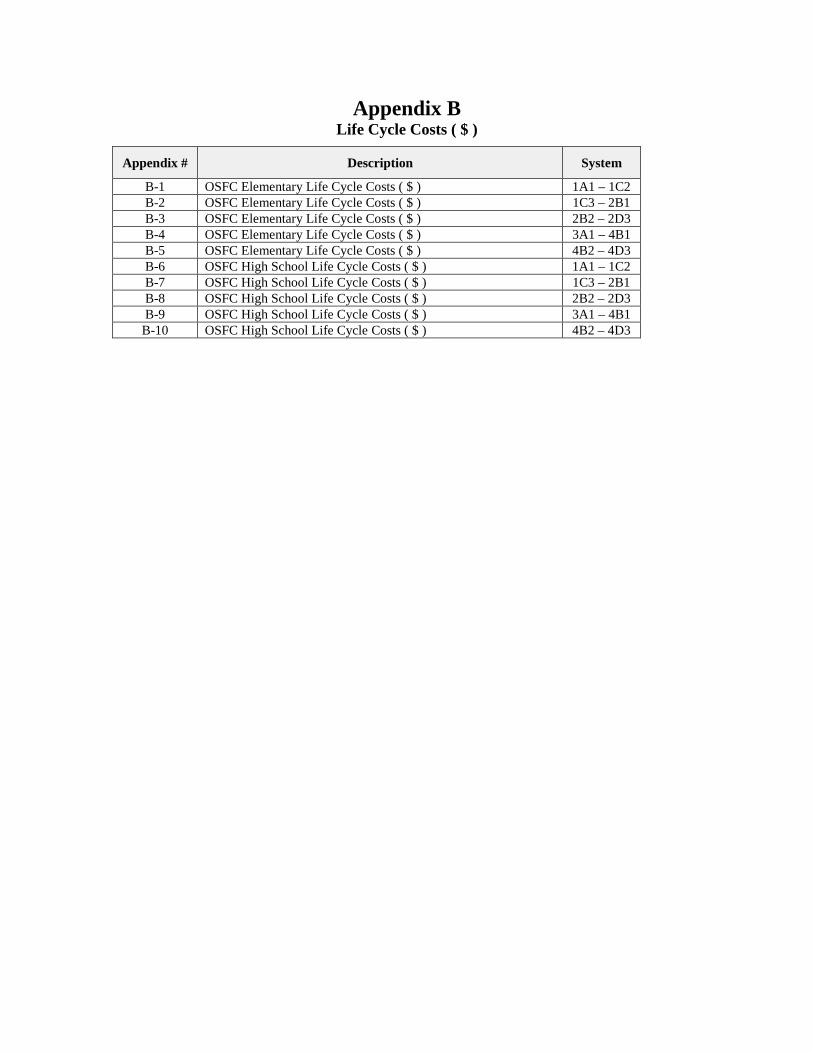
Appendix BLife Cycle Costs ( $ )
Appendix # Description System
B-1 OSFC Elementary Life Cycle Costs ( $ ) 1A1 – 1C2B-2 OSFC Elementary Life Cycle Costs ( $ ) 1C3 – 2B1B-3 OSFC Elementary Life Cycle Costs ( $ ) 2B2 – 2D3B-4 OSFC Elementary Life Cycle Costs ( $ ) 3A1 – 4B1B-5 OSFC Elementary Life Cycle Costs ( $ ) 4B2 – 4D3B-6 OSFC High School Life Cycle Costs ( $ ) 1A1 – 1C2B-7 OSFC High School Life Cycle Costs ( $ ) 1C3 – 2B1B-8 OSFC High School Life Cycle Costs ( $ ) 2B2 – 2D3B-9 OSFC High School Life Cycle Costs ( $ ) 3A1 – 4B1
B-10 OSFC High School Life Cycle Costs ( $ ) 4B2 – 4D3
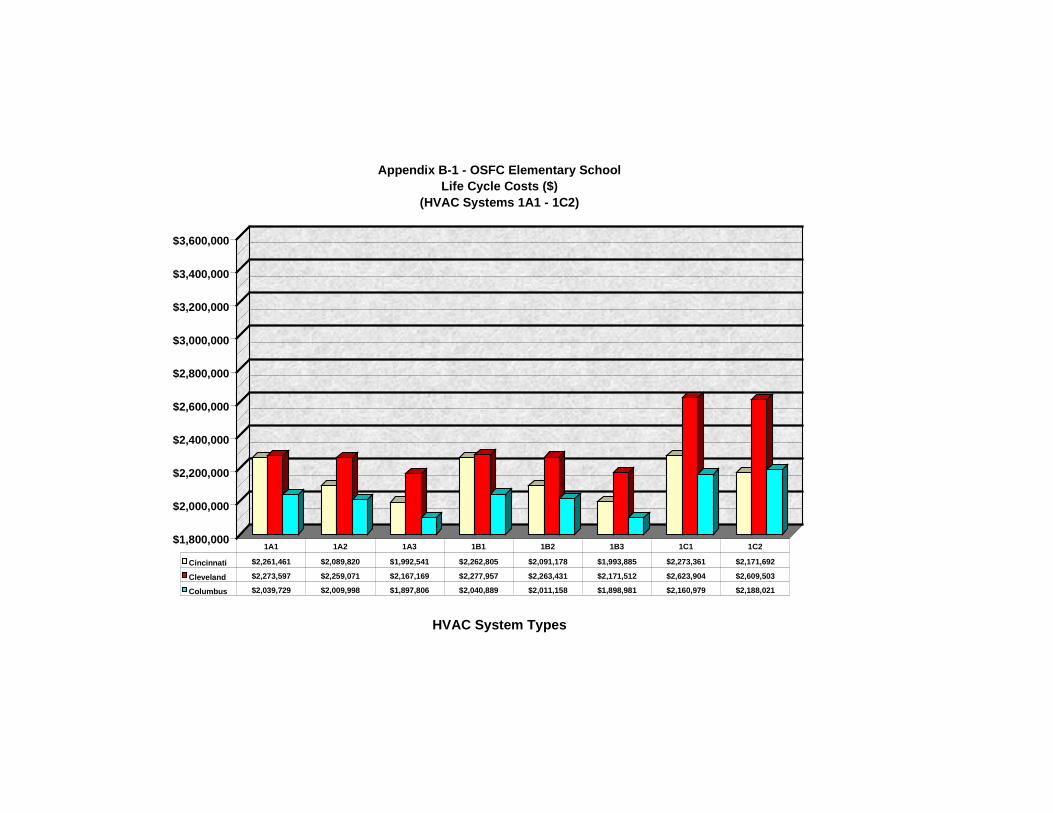
$1,800,000
$2,000,000
$2,200,000
$2,400,000
$2,600,000
$2,800,000
$3,000,000
$3,200,000
$3,400,000
$3,600,000
HVAC System Types
Appendix B-1 - OSFC Elementary School Life Cycle Costs ($)
(HVAC Systems 1A1 - 1C2)
Cincinnati $2,261,461 $2,089,820 $1,992,541 $2,262,805 $2,091,178 $1,993,885 $2,273,361 $2,171,692
Cleveland $2,273,597 $2,259,071 $2,167,169 $2,277,957 $2,263,431 $2,171,512 $2,623,904 $2,609,503
Columbus $2,039,729 $2,009,998 $1,897,806 $2,040,889 $2,011,158 $1,898,981 $2,160,979 $2,188,021
1A1 1A2 1A3 1B1 1B2 1B3 1C1 1C2
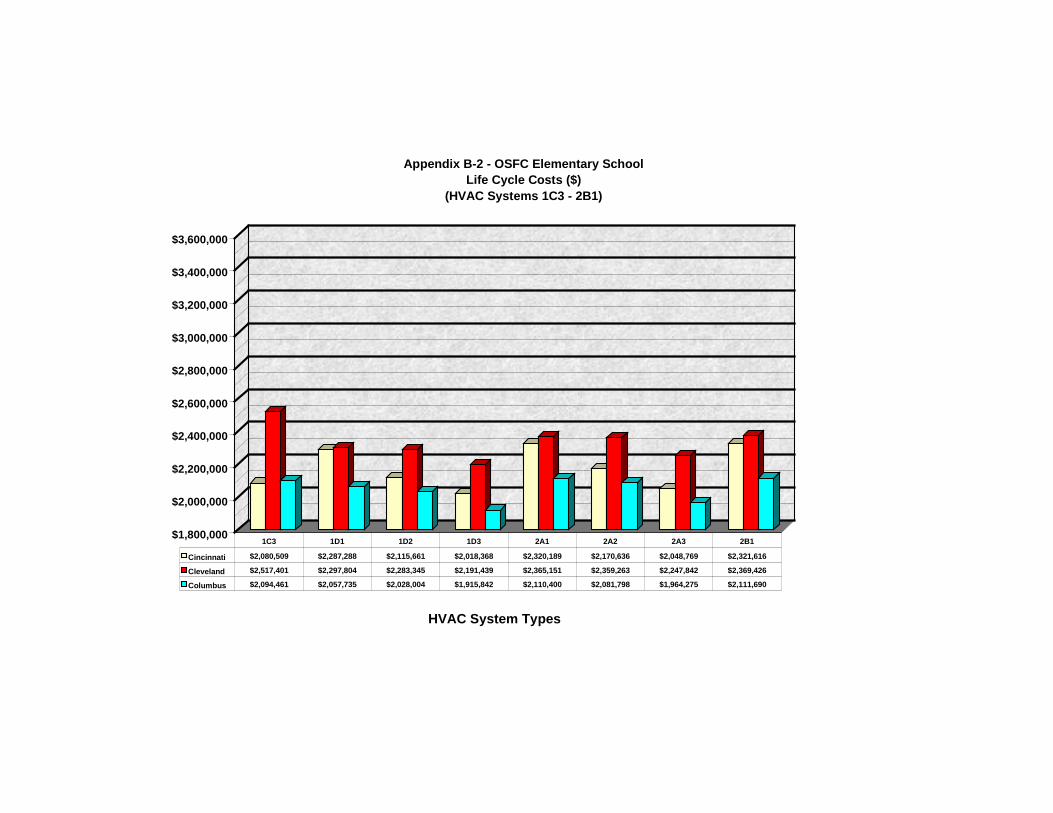
$1,800,000
$2,000,000
$2,200,000
$2,400,000
$2,600,000
$2,800,000
$3,000,000
$3,200,000
$3,400,000
$3,600,000
HVAC System Types
Appendix B-2 - OSFC Elementary School Life Cycle Costs ($)
(HVAC Systems 1C3 - 2B1)
Cincinnati $2,080,509 $2,287,288 $2,115,661 $2,018,368 $2,320,189 $2,170,636 $2,048,769 $2,321,616
Cleveland $2,517,401 $2,297,804 $2,283,345 $2,191,439 $2,365,151 $2,359,263 $2,247,842 $2,369,426
Columbus $2,094,461 $2,057,735 $2,028,004 $1,915,842 $2,110,400 $2,081,798 $1,964,275 $2,111,690
1C3 1D1 1D2 1D3 2A1 2A2 2A3 2B1
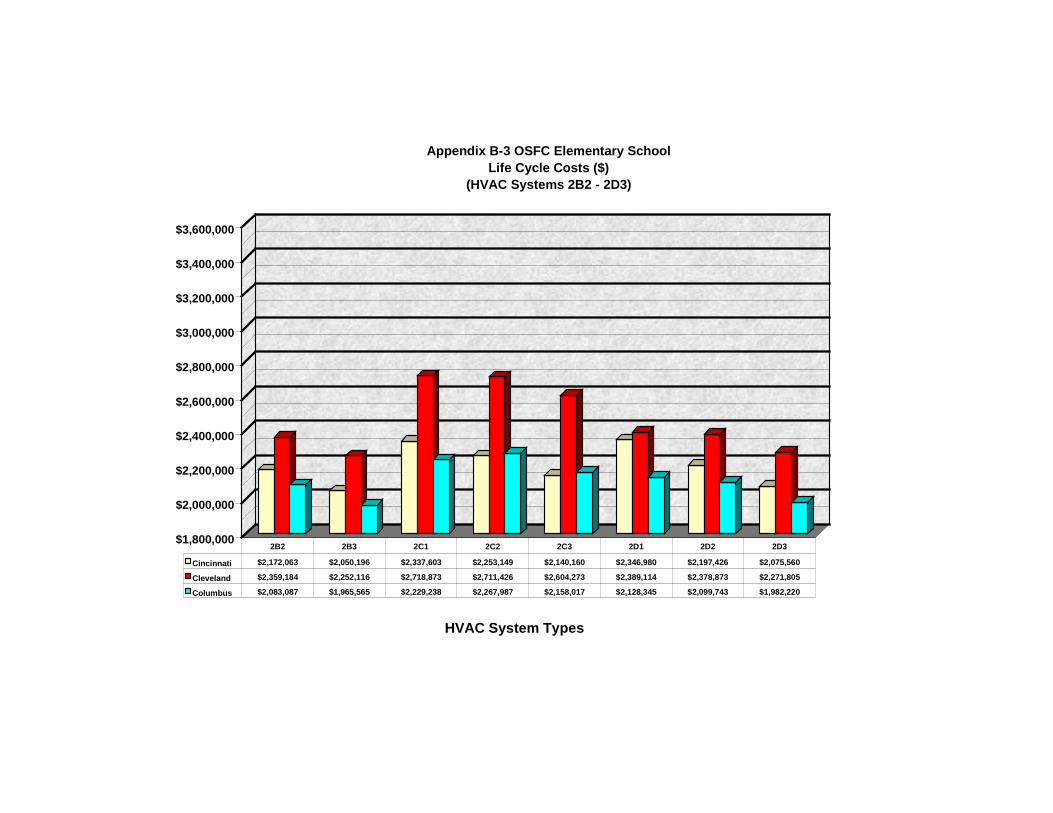
$1,800,000
$2,000,000
$2,200,000
$2,400,000
$2,600,000
$2,800,000
$3,000,000
$3,200,000
$3,400,000
$3,600,000
HVAC System Types
Appendix B-3 OSFC Elementary School Life Cycle Costs ($)
(HVAC Systems 2B2 - 2D3)
Cincinnati $2,172,063 $2,050,196 $2,337,603 $2,253,149 $2,140,160 $2,346,980 $2,197,426 $2,075,560
Cleveland $2,359,184 $2,252,116 $2,718,873 $2,711,426 $2,604,273 $2,389,114 $2,378,873 $2,271,805
Columbus $2,083,087 $1,965,565 $2,229,238 $2,267,987 $2,158,017 $2,128,345 $2,099,743 $1,982,220
2B2 2B3 2C1 2C2 2C3 2D1 2D2 2D3
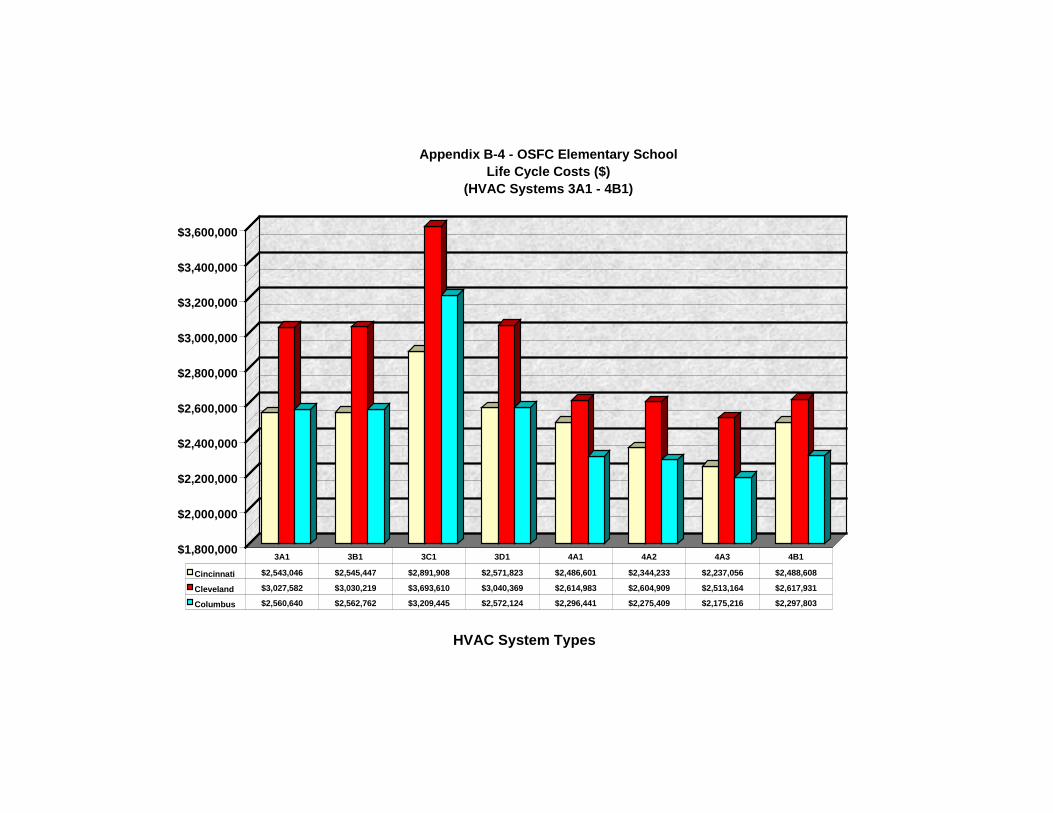
$1,800,000
$2,000,000
$2,200,000
$2,400,000
$2,600,000
$2,800,000
$3,000,000
$3,200,000
$3,400,000
$3,600,000
HVAC System Types
Appendix B-4 - OSFC Elementary School Life Cycle Costs ($)
(HVAC Systems 3A1 - 4B1)
Cincinnati $2,543,046 $2,545,447 $2,891,908 $2,571,823 $2,486,601 $2,344,233 $2,237,056 $2,488,608
Cleveland $3,027,582 $3,030,219 $3,693,610 $3,040,369 $2,614,983 $2,604,909 $2,513,164 $2,617,931
Columbus $2,560,640 $2,562,762 $3,209,445 $2,572,124 $2,296,441 $2,275,409 $2,175,216 $2,297,803
3A1 3B1 3C1 3D1 4A1 4A2 4A3 4B1
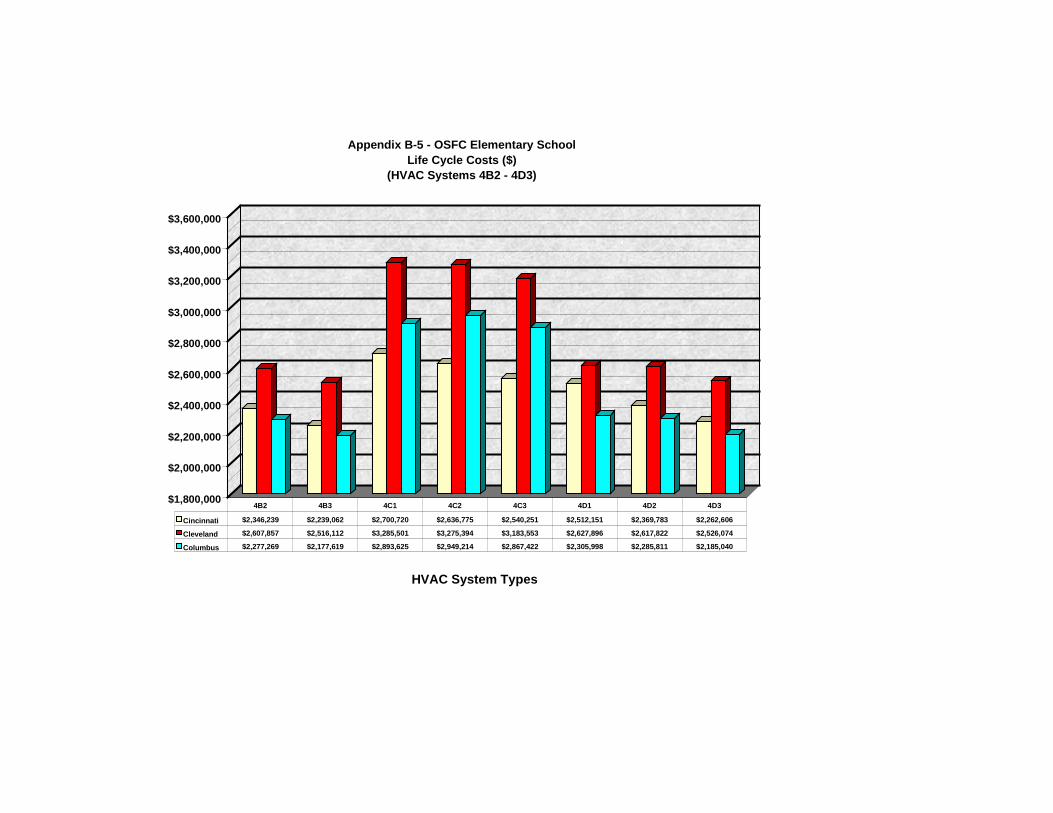
$1,800,000
$2,000,000
$2,200,000
$2,400,000
$2,600,000
$2,800,000
$3,000,000
$3,200,000
$3,400,000
$3,600,000
HVAC System Types
Appendix B-5 - OSFC Elementary School Life Cycle Costs ($)
(HVAC Systems 4B2 - 4D3)
Cincinnati $2,346,239 $2,239,062 $2,700,720 $2,636,775 $2,540,251 $2,512,151 $2,369,783 $2,262,606
Cleveland $2,607,857 $2,516,112 $3,285,501 $3,275,394 $3,183,553 $2,627,896 $2,617,822 $2,526,074
Columbus $2,277,269 $2,177,619 $2,893,625 $2,949,214 $2,867,422 $2,305,998 $2,285,811 $2,185,040
4B2 4B3 4C1 4C2 4C3 4D1 4D2 4D3
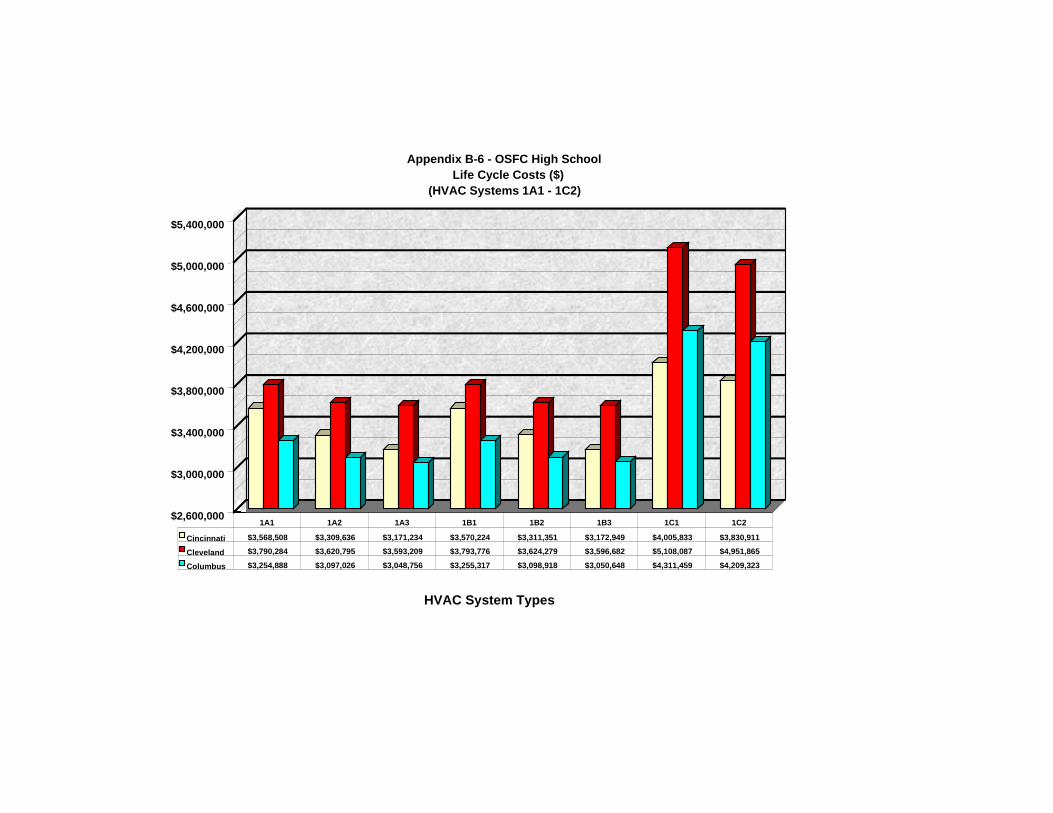
$2,600,000
$3,000,000
$3,400,000
$3,800,000
$4,200,000
$4,600,000
$5,000,000
$5,400,000
HVAC System Types
Appendix B-6 - OSFC High School Life Cycle Costs ($)
(HVAC Systems 1A1 - 1C2)
Cincinnati $3,568,508 $3,309,636 $3,171,234 $3,570,224 $3,311,351 $3,172,949 $4,005,833 $3,830,911
Cleveland $3,790,284 $3,620,795 $3,593,209 $3,793,776 $3,624,279 $3,596,682 $5,108,087 $4,951,865
Columbus $3,254,888 $3,097,026 $3,048,756 $3,255,317 $3,098,918 $3,050,648 $4,311,459 $4,209,323
1A1 1A2 1A3 1B1 1B2 1B3 1C1 1C2
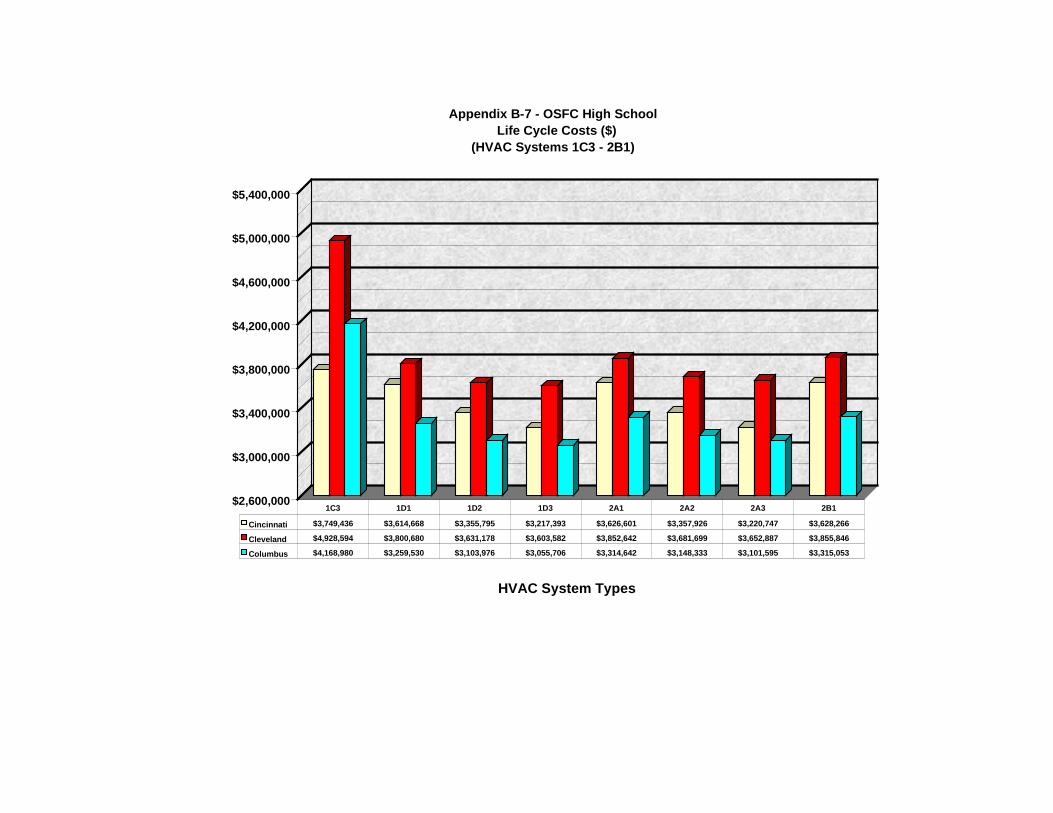
$2,600,000
$3,000,000
$3,400,000
$3,800,000
$4,200,000
$4,600,000
$5,000,000
$5,400,000
HVAC System Types
Appendix B-7 - OSFC High School Life Cycle Costs ($)
(HVAC Systems 1C3 - 2B1)
Cincinnati $3,749,436 $3,614,668 $3,355,795 $3,217,393 $3,626,601 $3,357,926 $3,220,747 $3,628,266
Cleveland $4,928,594 $3,800,680 $3,631,178 $3,603,582 $3,852,642 $3,681,699 $3,652,887 $3,855,846
Columbus $4,168,980 $3,259,530 $3,103,976 $3,055,706 $3,314,642 $3,148,333 $3,101,595 $3,315,053
1C3 1D1 1D2 1D3 2A1 2A2 2A3 2B1
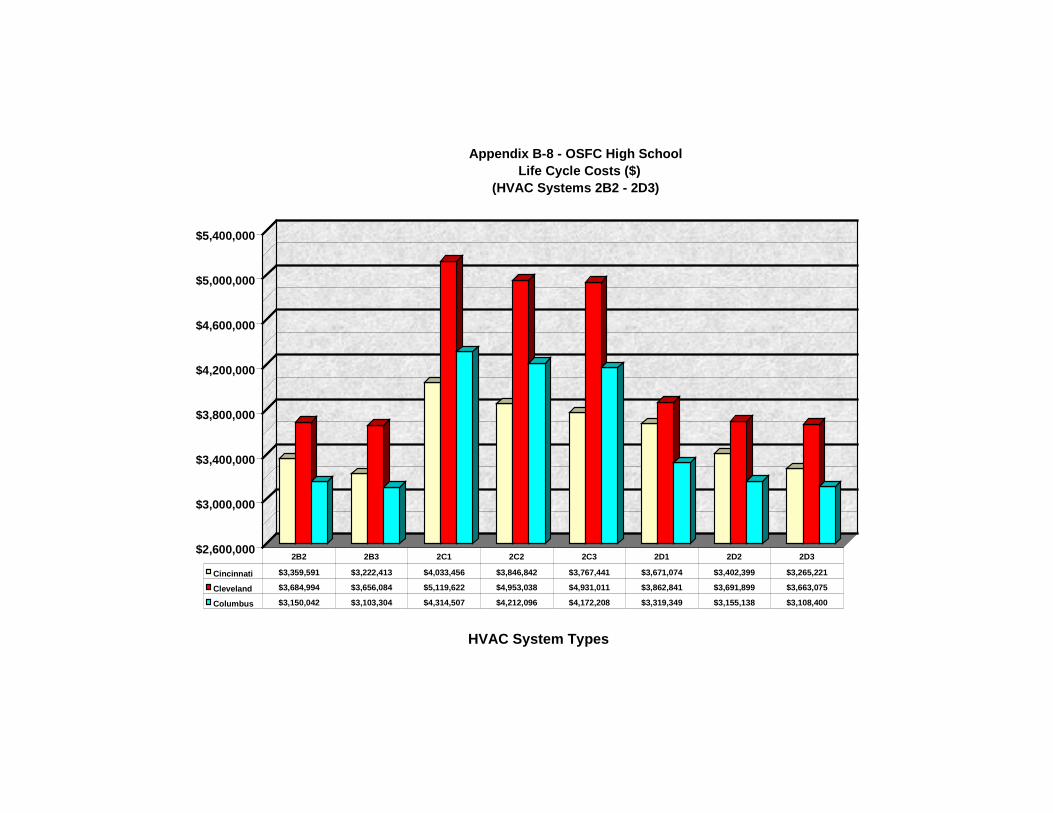
$2,600,000
$3,000,000
$3,400,000
$3,800,000
$4,200,000
$4,600,000
$5,000,000
$5,400,000
HVAC System Types
Appendix B-8 - OSFC High School Life Cycle Costs ($)
(HVAC Systems 2B2 - 2D3)
Cincinnati $3,359,591 $3,222,413 $4,033,456 $3,846,842 $3,767,441 $3,671,074 $3,402,399 $3,265,221
Cleveland $3,684,994 $3,656,084 $5,119,622 $4,953,038 $4,931,011 $3,862,841 $3,691,899 $3,663,075
Columbus $3,150,042 $3,103,304 $4,314,507 $4,212,096 $4,172,208 $3,319,349 $3,155,138 $3,108,400
2B2 2B3 2C1 2C2 2C3 2D1 2D2 2D3
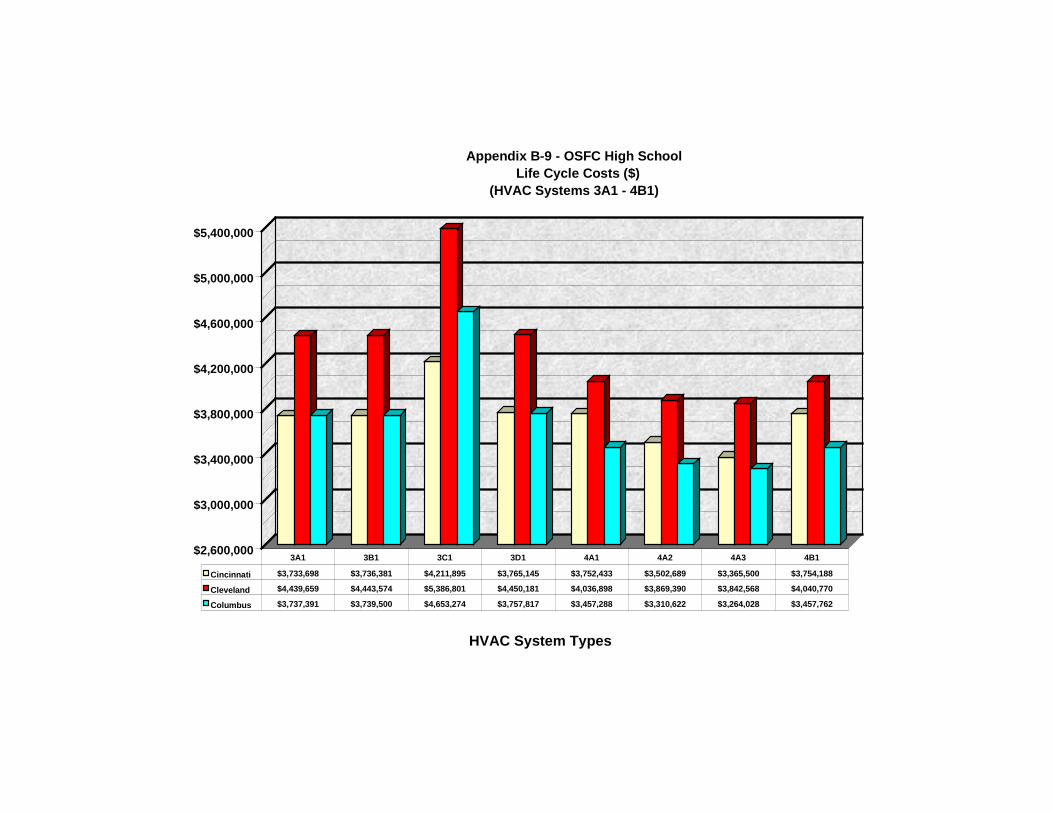
$2,600,000
$3,000,000
$3,400,000
$3,800,000
$4,200,000
$4,600,000
$5,000,000
$5,400,000
HVAC System Types
Appendix B-9 - OSFC High School Life Cycle Costs ($)
(HVAC Systems 3A1 - 4B1)
Cincinnati $3,733,698 $3,736,381 $4,211,895 $3,765,145 $3,752,433 $3,502,689 $3,365,500 $3,754,188
Cleveland $4,439,659 $4,443,574 $5,386,801 $4,450,181 $4,036,898 $3,869,390 $3,842,568 $4,040,770
Columbus $3,737,391 $3,739,500 $4,653,274 $3,757,817 $3,457,288 $3,310,622 $3,264,028 $3,457,762
3A1 3B1 3C1 3D1 4A1 4A2 4A3 4B1
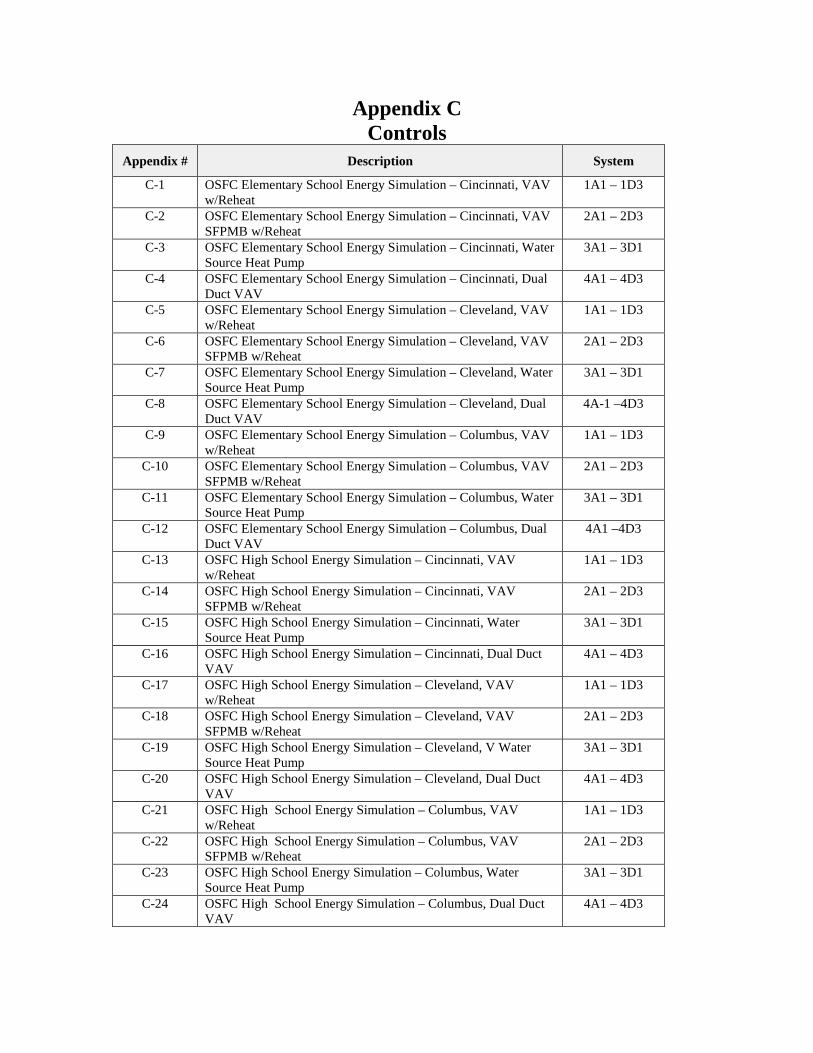
Appendix CControls
Appendix # Description System
C-1 OSFC Elementary School Energy Simulation – Cincinnati, VAVw/Reheat
1A1 – 1D3
C-2 OSFC Elementary School Energy Simulation – Cincinnati, VAVSFPMB w/Reheat
2A1 – 2D3
C-3 OSFC Elementary School Energy Simulation – Cincinnati, WaterSource Heat Pump
3A1 – 3D1
C-4 OSFC Elementary School Energy Simulation – Cincinnati, DualDuct VAV
4A1 – 4D3
C-5 OSFC Elementary School Energy Simulation – Cleveland, VAVw/Reheat
1A1 – 1D3
C-6 OSFC Elementary School Energy Simulation – Cleveland, VAVSFPMB w/Reheat
2A1 – 2D3
C-7 OSFC Elementary School Energy Simulation – Cleveland, WaterSource Heat Pump
3A1 – 3D1
C-8 OSFC Elementary School Energy Simulation – Cleveland, DualDuct VAV
4A-1 –4D3
C-9 OSFC Elementary School Energy Simulation – Columbus, VAVw/Reheat
1A1 – 1D3
C-10 OSFC Elementary School Energy Simulation – Columbus, VAVSFPMB w/Reheat
2A1 – 2D3
C-11 OSFC Elementary School Energy Simulation – Columbus, WaterSource Heat Pump
3A1 – 3D1
C-12 OSFC Elementary School Energy Simulation – Columbus, DualDuct VAV
4A1 –4D3
C-13 OSFC High School Energy Simulation – Cincinnati, VAVw/Reheat
1A1 – 1D3
C-14 OSFC High School Energy Simulation – Cincinnati, VAVSFPMB w/Reheat
2A1 – 2D3
C-15 OSFC High School Energy Simulation – Cincinnati, WaterSource Heat Pump
3A1 – 3D1
C-16 OSFC High School Energy Simulation – Cincinnati, Dual DuctVAV
4A1 – 4D3
C-17 OSFC High School Energy Simulation – Cleveland, VAVw/Reheat
1A1 – 1D3
C-18 OSFC High School Energy Simulation – Cleveland, VAVSFPMB w/Reheat
2A1 – 2D3
C-19 OSFC High School Energy Simulation – Cleveland, V WaterSource Heat Pump
3A1 – 3D1
C-20 OSFC High School Energy Simulation – Cleveland, Dual DuctVAV
4A1 – 4D3
C-21 OSFC High School Energy Simulation – Columbus, VAVw/Reheat
1A1 – 1D3
C-22 OSFC High School Energy Simulation – Columbus, VAVSFPMB w/Reheat
2A1 – 2D3
C-23 OSFC High School Energy Simulation – Columbus, WaterSource Heat Pump
3A1 – 3D1
C-24 OSFC High School Energy Simulation – Columbus, Dual DuctVAV
4A1 – 4D3
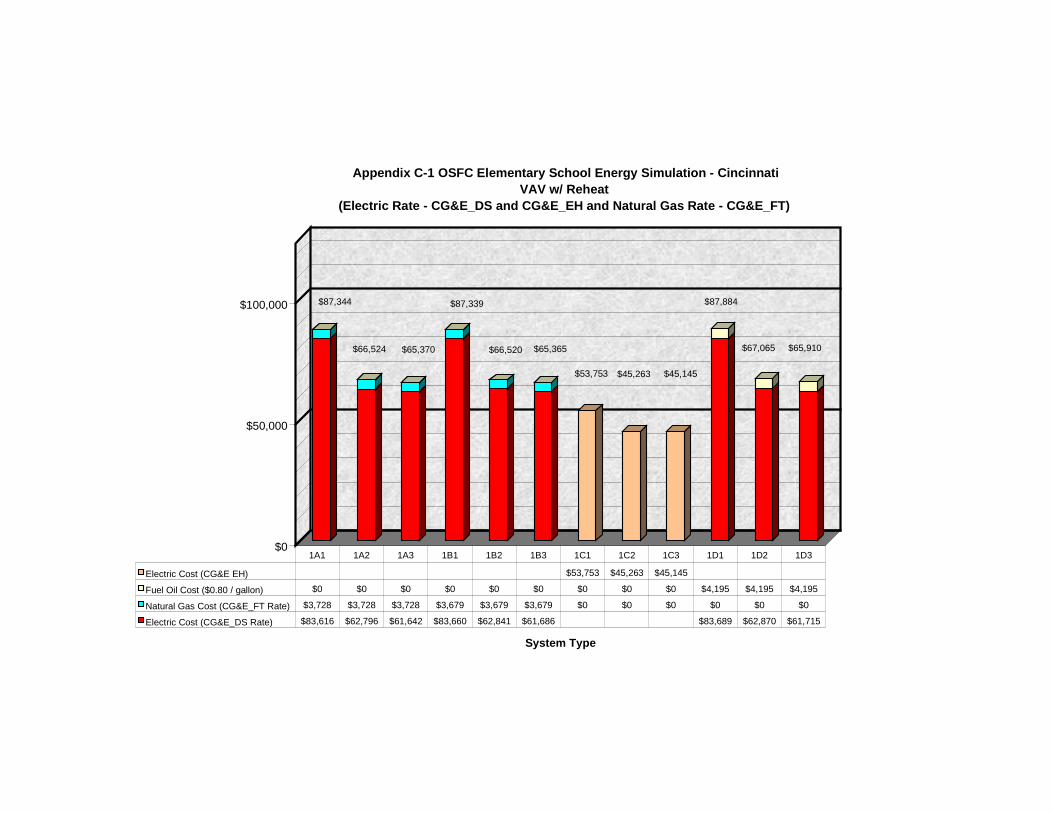
$0
$50,000
$100,000
System Type
Appendix C-1 OSFC Elementary School Energy Simulation - CincinnatiVAV w/ Reheat
(Electric Rate - CG&E_DS and CG&E_EH and Natural Gas Rate - CG&E_FT)
Electric Cost (CG&E EH) $53,753 $45,263 $45,145
Fuel Oil Cost ($0.80 / gallon) $0 $0 $0 $0 $0 $0 $0 $0 $0 $4,195 $4,195 $4,195
Natural Gas Cost (CG&E_FT Rate) $3,728 $3,728 $3,728 $3,679 $3,679 $3,679 $0 $0 $0 $0 $0 $0
Electric Cost (CG&E_DS Rate) $83,616 $62,796 $61,642 $83,660 $62,841 $61,686 $83,689 $62,870 $61,715
1A1 1A2 1A3 1B1 1B2 1B3 1C1 1C2 1C3 1D1 1D2 1D3
$87,344
$66,524 $65,370
$87,339
$65,365$66,520
$53,753 $45,263 $45,145
$87,884
$67,065 $65,910
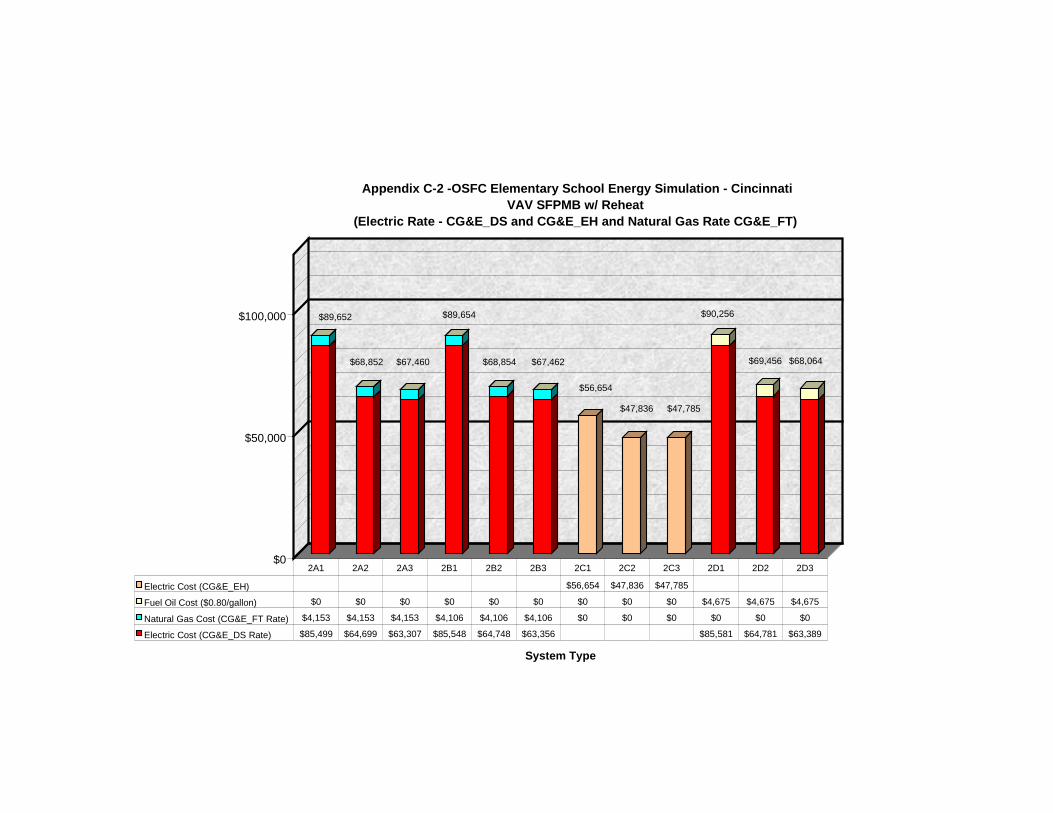
$0
$50,000
$100,000
System Type
Appendix C-2 -OSFC Elementary School Energy Simulation - CincinnatiVAV SFPMB w/ Reheat
(Electric Rate - CG&E_DS and CG&E_EH and Natural Gas Rate CG&E_FT)
Electric Cost (CG&E_EH) $56,654 $47,836 $47,785
Fuel Oil Cost ($0.80/gallon) $0 $0 $0 $0 $0 $0 $0 $0 $0 $4,675 $4,675 $4,675
Natural Gas Cost (CG&E_FT Rate) $4,153 $4,153 $4,153 $4,106 $4,106 $4,106 $0 $0 $0 $0 $0 $0
Electric Cost (CG&E_DS Rate) $85,499 $64,699 $63,307 $85,548 $64,748 $63,356 $85,581 $64,781 $63,389
2A1 2A2 2A3 2B1 2B2 2B3 2C1 2C2 2C3 2D1 2D2 2D3
$89,652
$68,852 $67,460
$89,654
$68,854 $67,462
$56,654
$47,785$47,836
$90,256
$69,456 $68,064
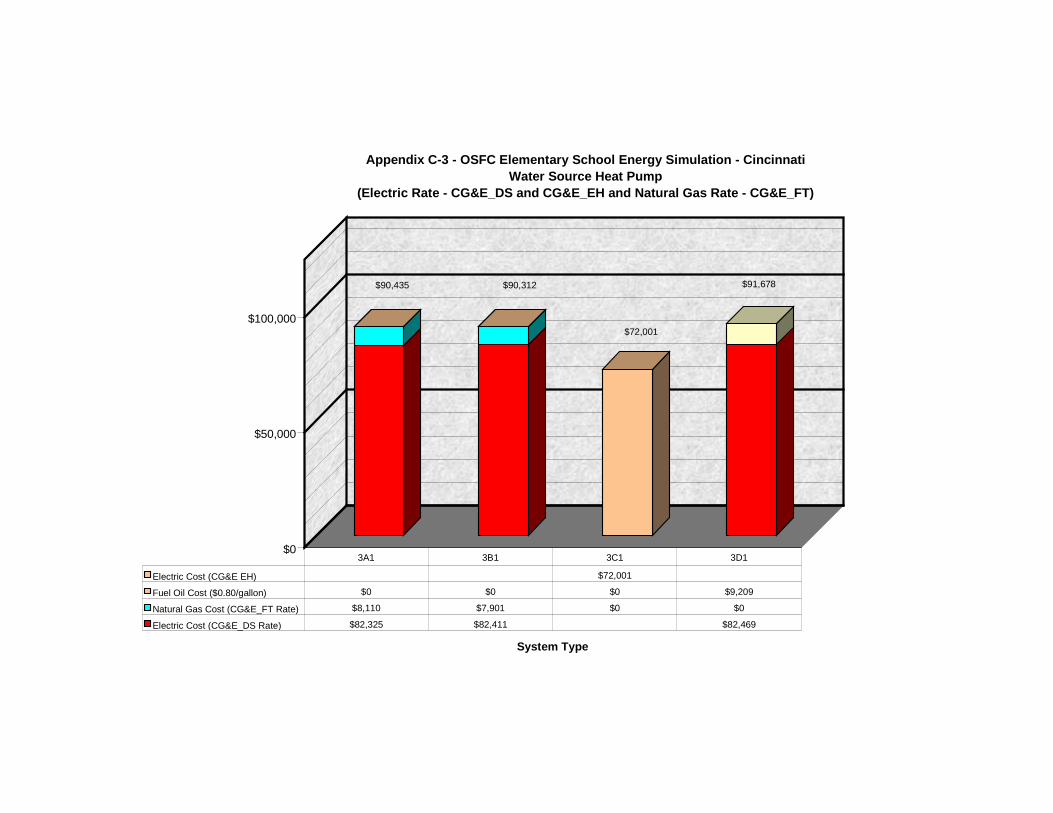
$0
$50,000
$100,000
System Type
Appendix C-3 - OSFC Elementary School Energy Simulation - CincinnatiWater Source Heat Pump
(Electric Rate - CG&E_DS and CG&E_EH and Natural Gas Rate - CG&E_FT)
Electric Cost (CG&E EH) $72,001
Fuel Oil Cost ($0.80/gallon) $0 $0 $0 $9,209
Natural Gas Cost (CG&E_FT Rate) $8,110 $7,901 $0 $0
Electric Cost (CG&E_DS Rate) $82,325 $82,411 $82,469
3A1 3B1 3C1 3D1
$90,435 $90,312
$72,001
$91,678
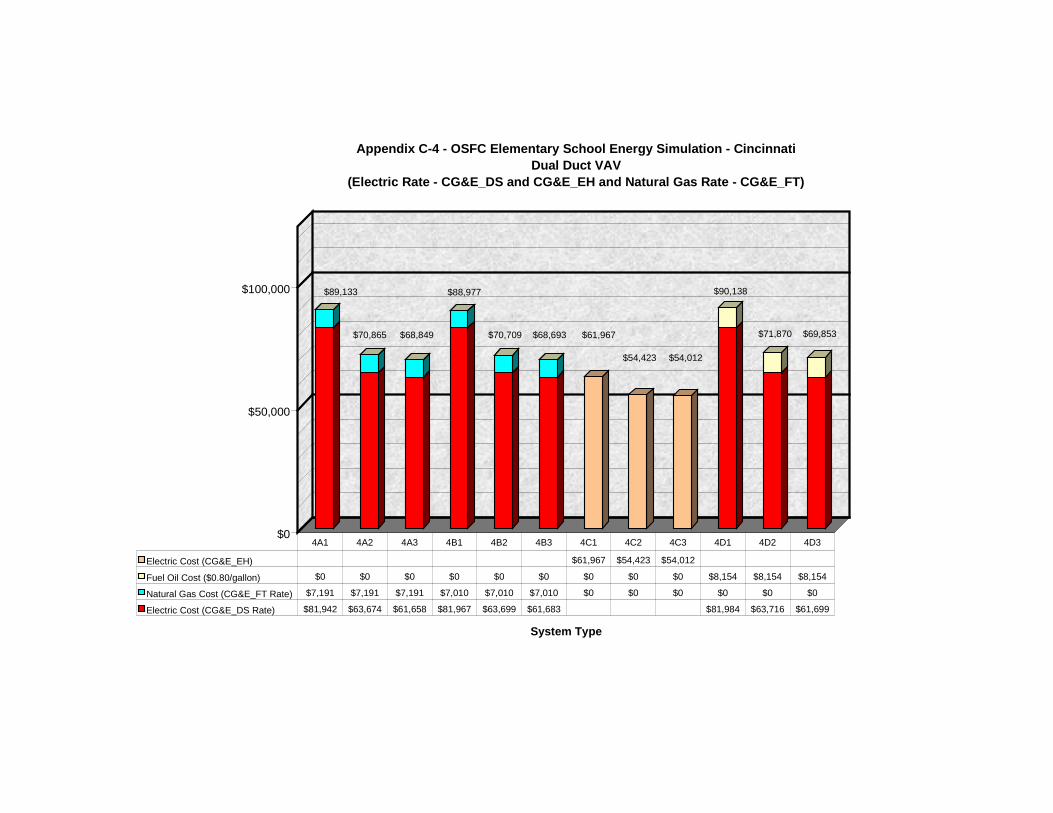
$0
$50,000
$100,000
System Type
Appendix C-4 - OSFC Elementary School Energy Simulation - CincinnatiDual Duct VAV
(Electric Rate - CG&E_DS and CG&E_EH and Natural Gas Rate - CG&E_FT)
Electric Cost (CG&E_EH) $61,967 $54,423 $54,012
Fuel Oil Cost ($0.80/gallon) $0 $0 $0 $0 $0 $0 $0 $0 $0 $8,154 $8,154 $8,154
Natural Gas Cost (CG&E_FT Rate) $7,191 $7,191 $7,191 $7,010 $7,010 $7,010 $0 $0 $0 $0 $0 $0
Electric Cost (CG&E_DS Rate) $81,942 $63,674 $61,658 $81,967 $63,699 $61,683 $81,984 $63,716 $61,699
4A1 4A2 4A3 4B1 4B2 4B3 4C1 4C2 4C3 4D1 4D2 4D3
$89,133
$70,865 $68,849
$88,977
$70,709 $68,693 $61,967
$54,423 $54,012
$90,138
$71,870 $69,853
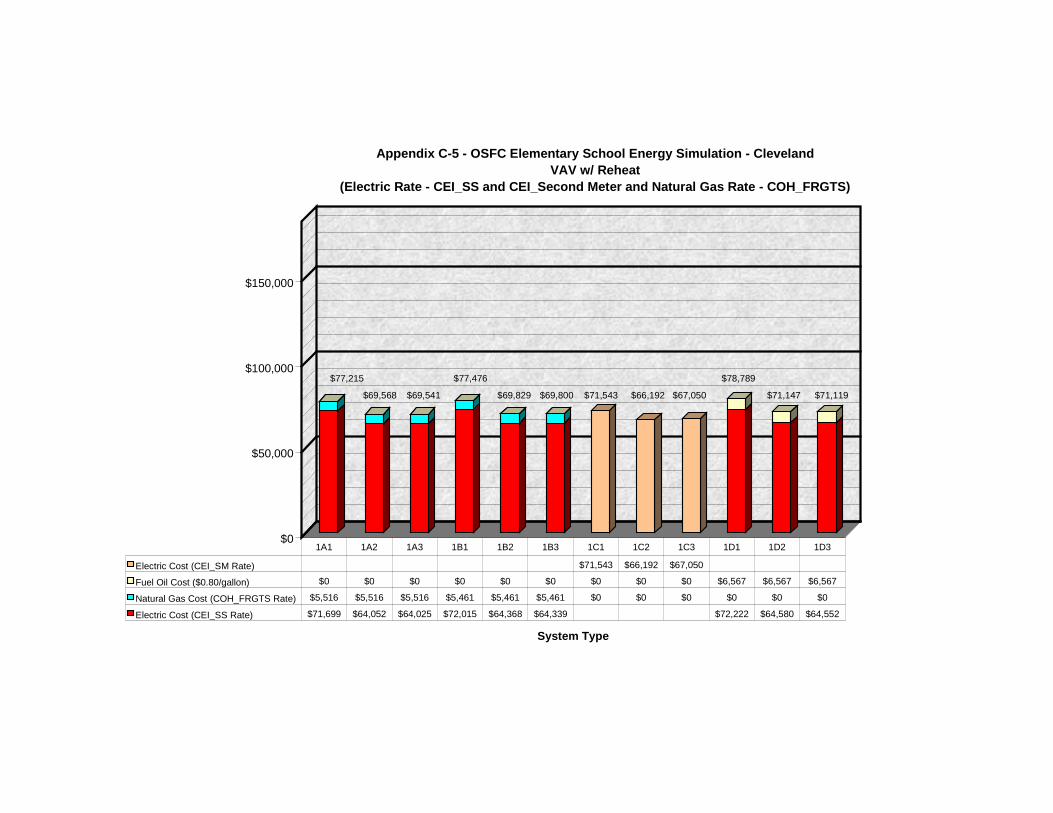
$0
$50,000
$100,000
$150,000
System Type
Appendix C-5 - OSFC Elementary School Energy Simulation - ClevelandVAV w/ Reheat
(Electric Rate - CEI_SS and CEI_Second Meter and Natural Gas Rate - COH_FRGTS)
Electric Cost (CEI_SM Rate) $71,543 $66,192 $67,050
Fuel Oil Cost ($0.80/gallon) $0 $0 $0 $0 $0 $0 $0 $0 $0 $6,567 $6,567 $6,567
Natural Gas Cost (COH_FRGTS Rate) $5,516 $5,516 $5,516 $5,461 $5,461 $5,461 $0 $0 $0 $0 $0 $0
Electric Cost (CEI_SS Rate) $71,699 $64,052 $64,025 $72,015 $64,368 $64,339 $72,222 $64,580 $64,552
1A1 1A2 1A3 1B1 1B2 1B3 1C1 1C2 1C3 1D1 1D2 1D3
$77,215
$69,568 $69,541
$77,476
$69,829 $69,800 $71,543 $66,192 $67,050
$78,789
$71,147 $71,119
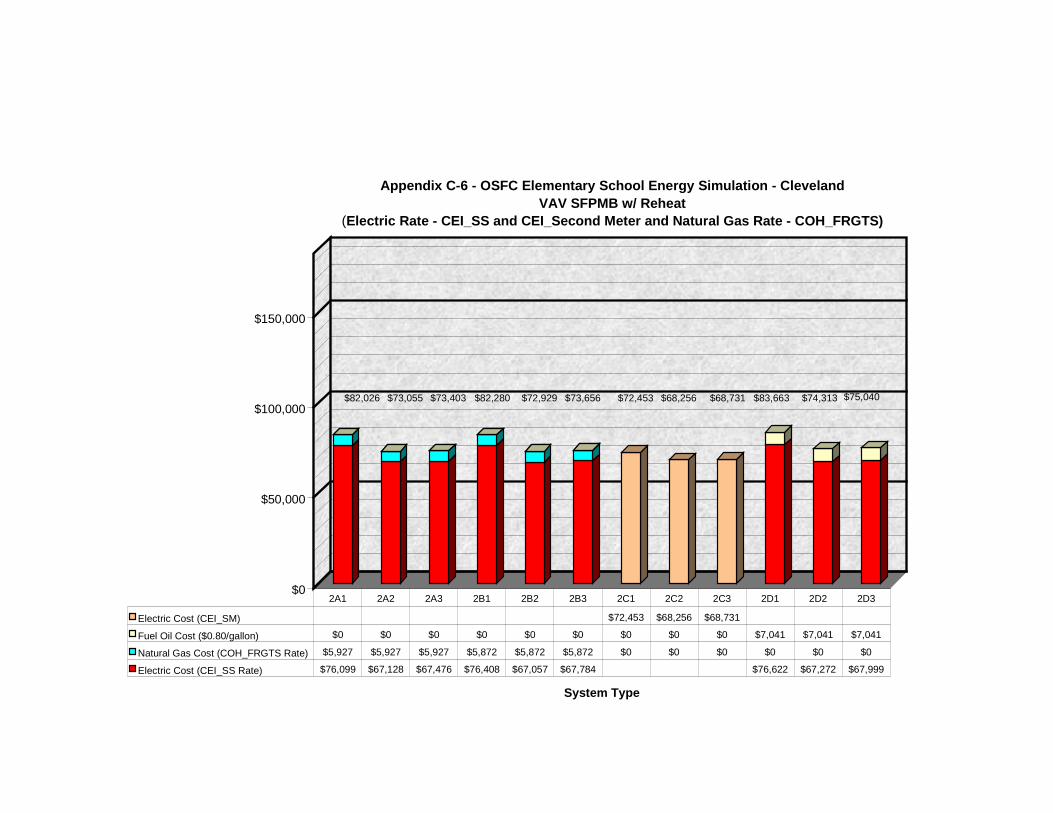
$0
$50,000
$100,000
$150,000
System Type
Appendix C-6 - OSFC Elementary School Energy Simulation - ClevelandVAV SFPMB w/ Reheat
(Electric Rate - CEI_SS and CEI_Second Meter and Natural Gas Rate - COH_FRGTS)
Electric Cost (CEI_SM) $72,453 $68,256 $68,731
Fuel Oil Cost ($0.80/gallon) $0 $0 $0 $0 $0 $0 $0 $0 $0 $7,041 $7,041 $7,041
Natural Gas Cost (COH_FRGTS Rate) $5,927 $5,927 $5,927 $5,872 $5,872 $5,872 $0 $0 $0 $0 $0 $0
Electric Cost (CEI_SS Rate) $76,099 $67,128 $67,476 $76,408 $67,057 $67,784 $76,622 $67,272 $67,999
2A1 2A2 2A3 2B1 2B2 2B3 2C1 2C2 2C3 2D1 2D2 2D3
$82,026 $73,055 $73,403 $82,280 $72,929 $73,656 $72,453 $68,256 $68,731 $83,663 $74,313 $75,040
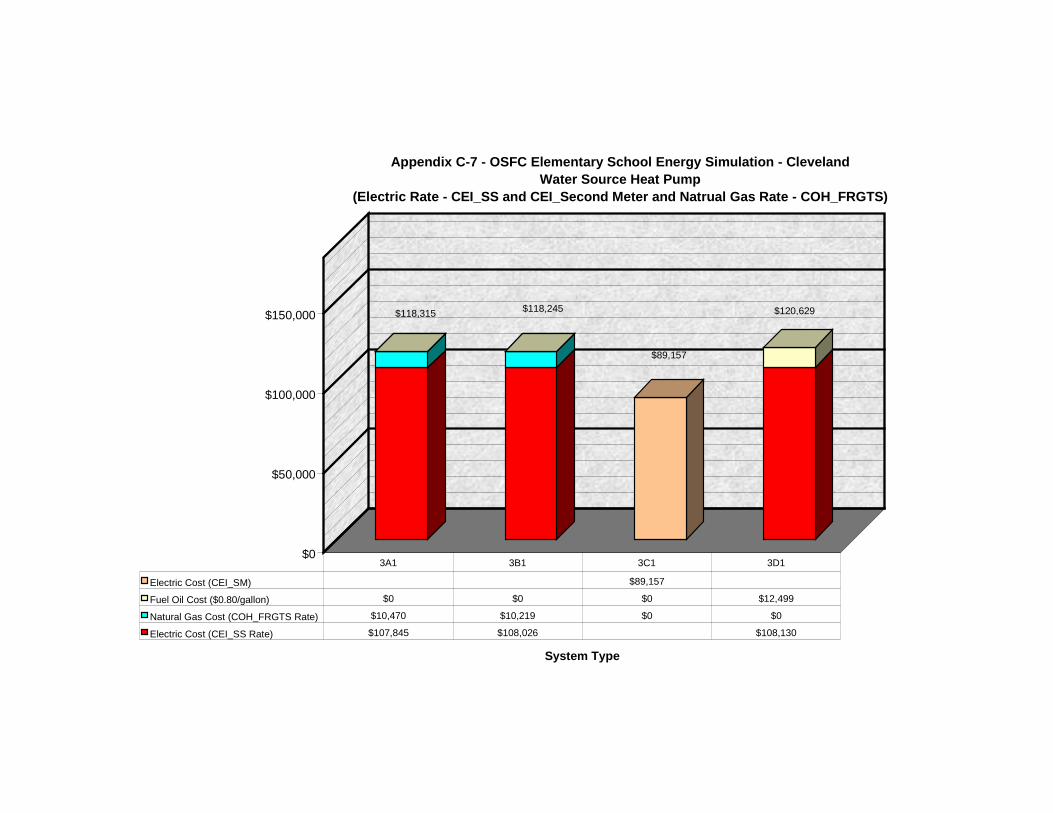
$0
$50,000
$100,000
$150,000
System Type
Appendix C-7 - OSFC Elementary School Energy Simulation - ClevelandWater Source Heat Pump
(Electric Rate - CEI_SS and CEI_Second Meter and Natrual Gas Rate - COH_FRGTS)
Electric Cost (CEI_SM) $89,157
Fuel Oil Cost ($0.80/gallon) $0 $0 $0 $12,499
Natural Gas Cost (COH_FRGTS Rate) $10,470 $10,219 $0 $0
Electric Cost (CEI_SS Rate) $107,845 $108,026 $108,130
3A1 3B1 3C1 3D1
$118,315 $118,245 $120,629
$89,157
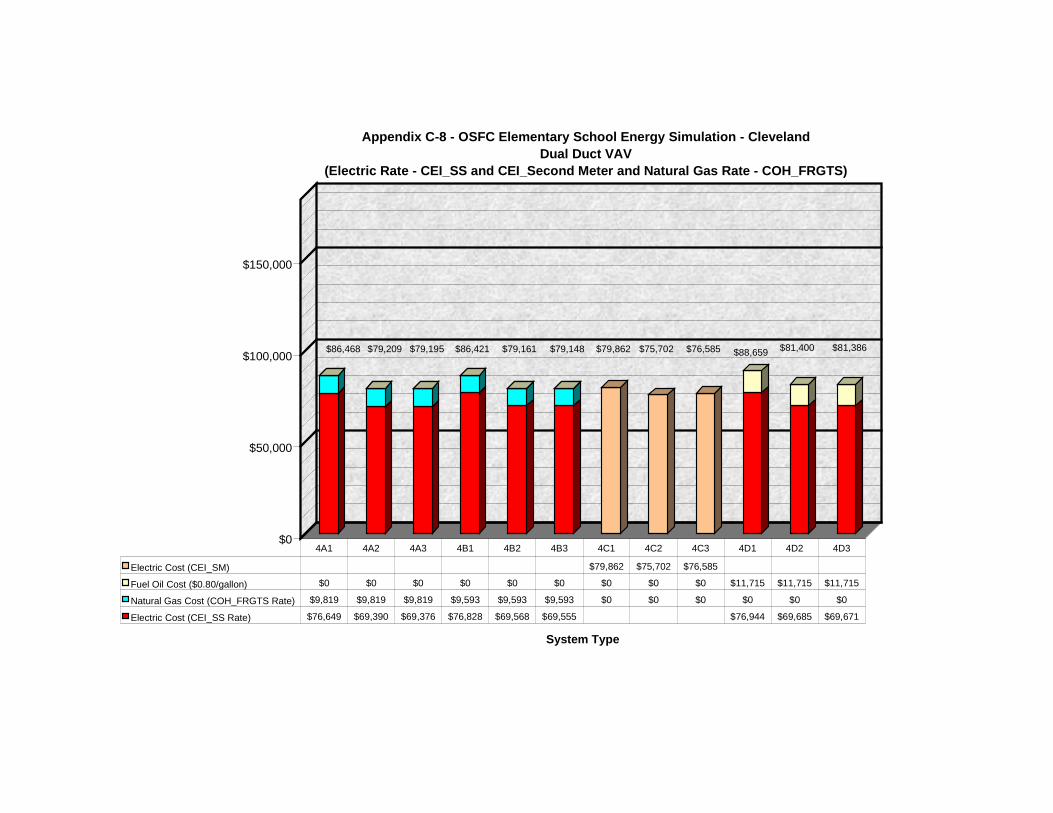
$0
$50,000
$100,000
$150,000
System Type
Appendix C-8 - OSFC Elementary School Energy Simulation - ClevelandDual Duct VAV
(Electric Rate - CEI_SS and CEI_Second Meter and Natural Gas Rate - COH_FRGTS)
Electric Cost (CEI_SM) $79,862 $75,702 $76,585
Fuel Oil Cost ($0.80/gallon) $0 $0 $0 $0 $0 $0 $0 $0 $0 $11,715 $11,715 $11,715
Natural Gas Cost (COH_FRGTS Rate) $9,819 $9,819 $9,819 $9,593 $9,593 $9,593 $0 $0 $0 $0 $0 $0
Electric Cost (CEI_SS Rate) $76,649 $69,390 $69,376 $76,828 $69,568 $69,555 $76,944 $69,685 $69,671
4A1 4A2 4A3 4B1 4B2 4B3 4C1 4C2 4C3 4D1 4D2 4D3
$86,468 $79,209 $79,195 $86,421 $79,161 $79,148 $79,862 $75,702 $76,585 $88,659 $81,400 $81,386
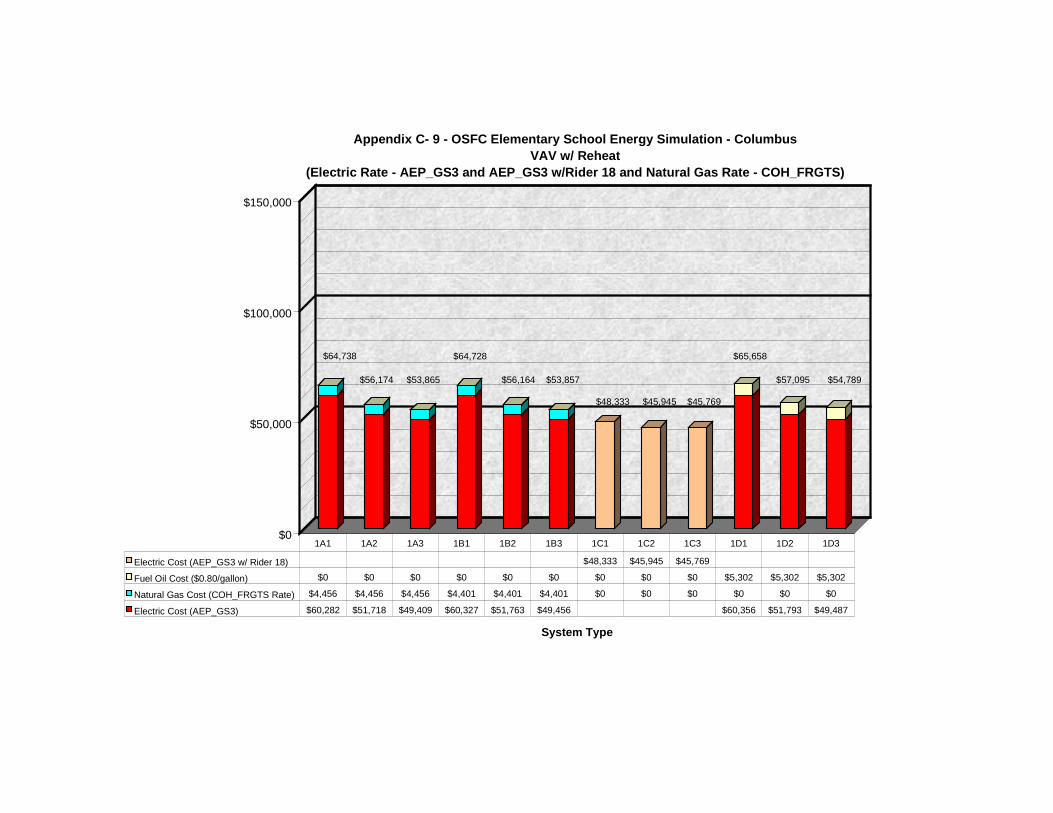
$0
$50,000
$100,000
$150,000
System Type
Appendix C- 9 - OSFC Elementary School Energy Simulation - ColumbusVAV w/ Reheat
(Electric Rate - AEP_GS3 and AEP_GS3 w/Rider 18 and Natural Gas Rate - COH_FRGTS)
Electric Cost (AEP_GS3 w/ Rider 18) $48,333 $45,945 $45,769
Fuel Oil Cost ($0.80/gallon) $0 $0 $0 $0 $0 $0 $0 $0 $0 $5,302 $5,302 $5,302
Natural Gas Cost (COH_FRGTS Rate) $4,456 $4,456 $4,456 $4,401 $4,401 $4,401 $0 $0 $0 $0 $0 $0
Electric Cost (AEP_GS3) $60,282 $51,718 $49,409 $60,327 $51,763 $49,456 $60,356 $51,793 $49,487
1A1 1A2 1A3 1B1 1B2 1B3 1C1 1C2 1C3 1D1 1D2 1D3
$64,738
$56,174 $53,865
$64,728
$56,164 $53,857
$48,333 $45,945 $45,769
$65,658
$57,095 $54,789
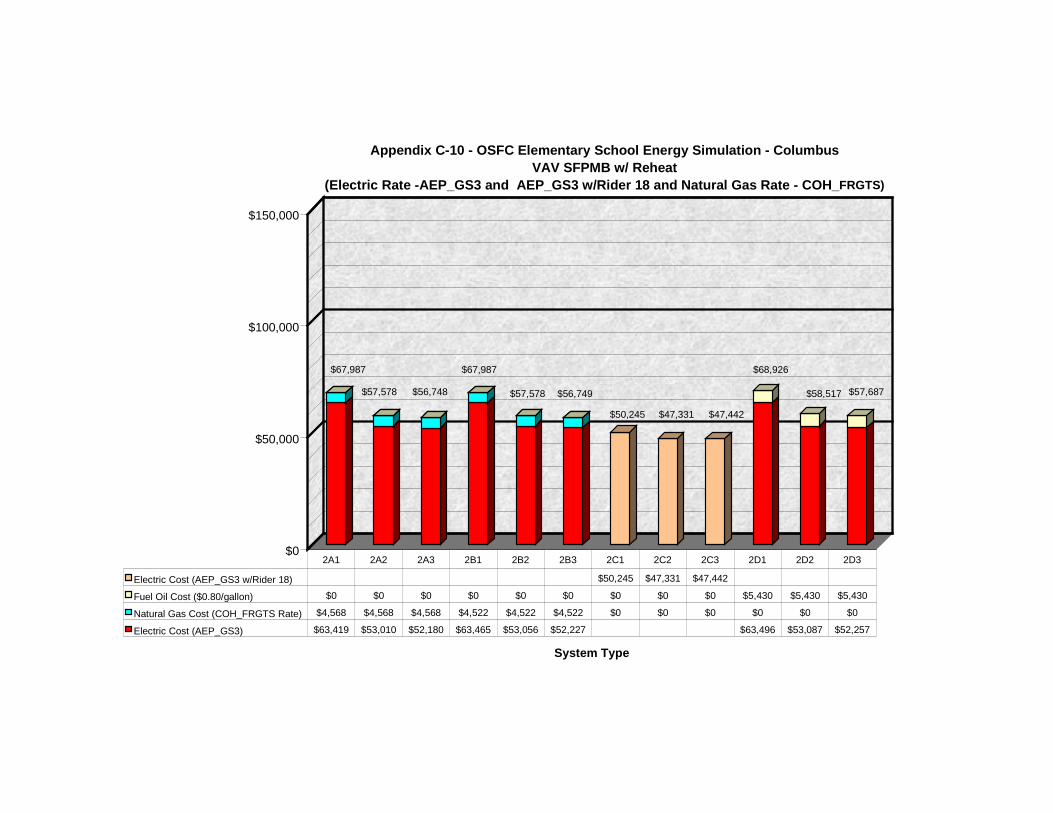
$0
$50,000
$100,000
$150,000
System Type
Appendix C-10 - OSFC Elementary School Energy Simulation - ColumbusVAV SFPMB w/ Reheat
(Electric Rate -AEP_GS3 and AEP_GS3 w/Rider 18 and Natural Gas Rate - COH_FRGTS)
Electric Cost (AEP_GS3 w/Rider 18) $50,245 $47,331 $47,442
Fuel Oil Cost ($0.80/gallon) $0 $0 $0 $0 $0 $0 $0 $0 $0 $5,430 $5,430 $5,430
Natural Gas Cost (COH_FRGTS Rate) $4,568 $4,568 $4,568 $4,522 $4,522 $4,522 $0 $0 $0 $0 $0 $0
Electric Cost (AEP_GS3) $63,419 $53,010 $52,180 $63,465 $53,056 $52,227 $63,496 $53,087 $52,257
2A1 2A2 2A3 2B1 2B2 2B3 2C1 2C2 2C3 2D1 2D2 2D3
$67,987
$57,578 $56,748
$67,987
$57,578 $56,749
$50,245 $47,331 $47,442
$68,926
$58,517 $57,687
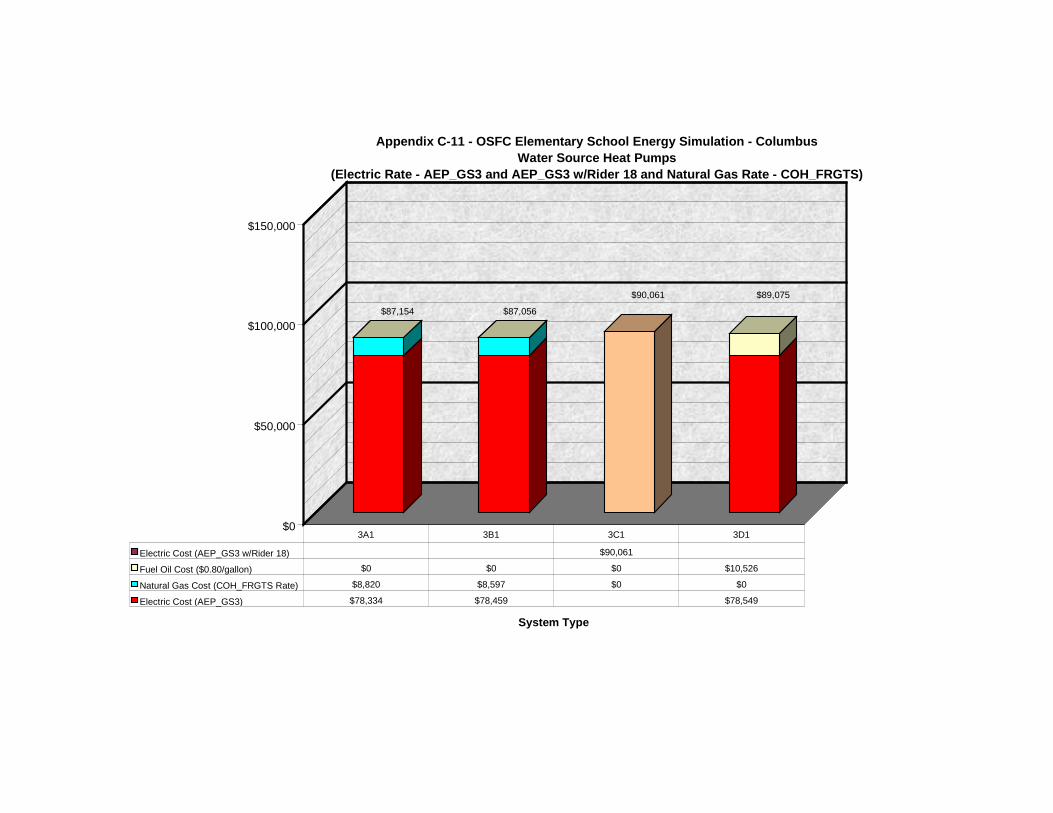
$0
$50,000
$100,000
$150,000
System Type
Appendix C-11 - OSFC Elementary School Energy Simulation - ColumbusWater Source Heat Pumps
(Electric Rate - AEP_GS3 and AEP_GS3 w/Rider 18 and Natural Gas Rate - COH_FRGTS)
Electric Cost (AEP_GS3 w/Rider 18) $90,061
Fuel Oil Cost ($0.80/gallon) $0 $0 $0 $10,526
Natural Gas Cost (COH_FRGTS Rate) $8,820 $8,597 $0 $0
Electric Cost (AEP_GS3) $78,334 $78,459 $78,549
3A1 3B1 3C1 3D1
$87,154 $87,056
$90,061 $89,075
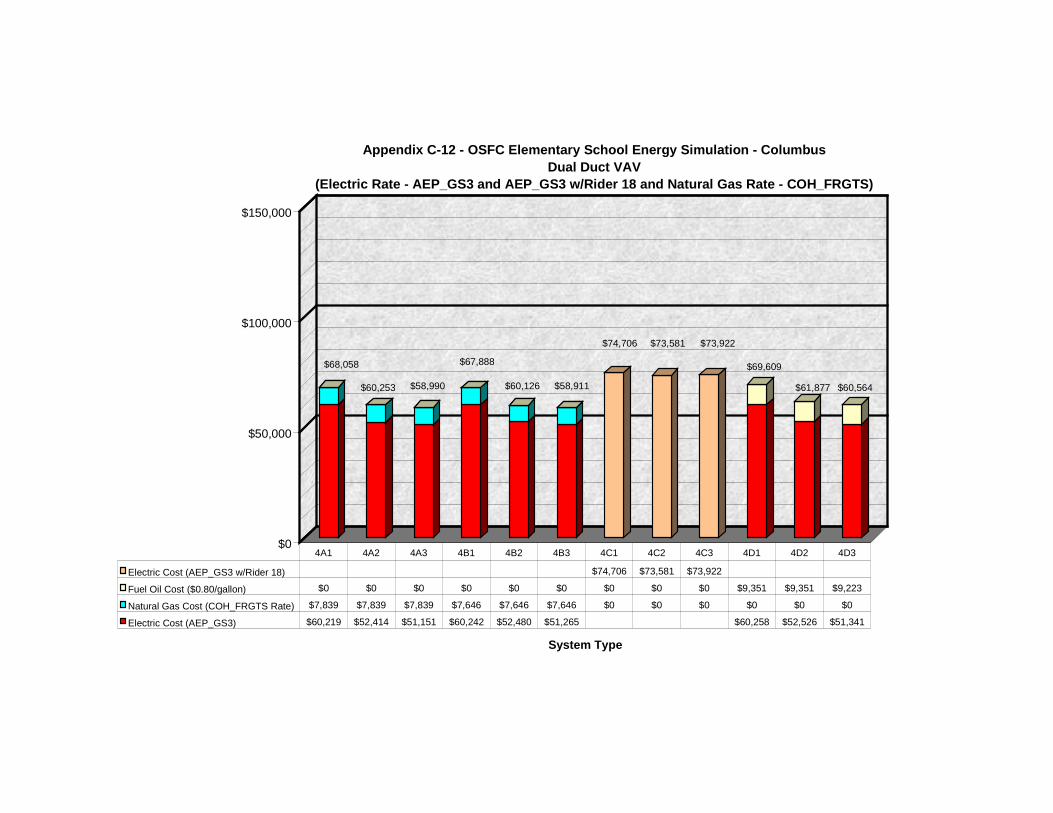
$0
$50,000
$100,000
$150,000
System Type
Appendix C-12 - OSFC Elementary School Energy Simulation - ColumbusDual Duct VAV
(Electric Rate - AEP_GS3 and AEP_GS3 w/Rider 18 and Natural Gas Rate - COH_FRGTS)
Electric Cost (AEP_GS3 w/Rider 18) $74,706 $73,581 $73,922
Fuel Oil Cost ($0.80/gallon) $0 $0 $0 $0 $0 $0 $0 $0 $0 $9,351 $9,351 $9,223
Natural Gas Cost (COH_FRGTS Rate) $7,839 $7,839 $7,839 $7,646 $7,646 $7,646 $0 $0 $0 $0 $0 $0
Electric Cost (AEP_GS3) $60,219 $52,414 $51,151 $60,242 $52,480 $51,265 $60,258 $52,526 $51,341
4A1 4A2 4A3 4B1 4B2 4B3 4C1 4C2 4C3 4D1 4D2 4D3
$68,058
$60,253 $58,990
$67,888
$60,126 $58,911
$74,706 $73,581 $73,922
$69,609
$61,877 $60,564
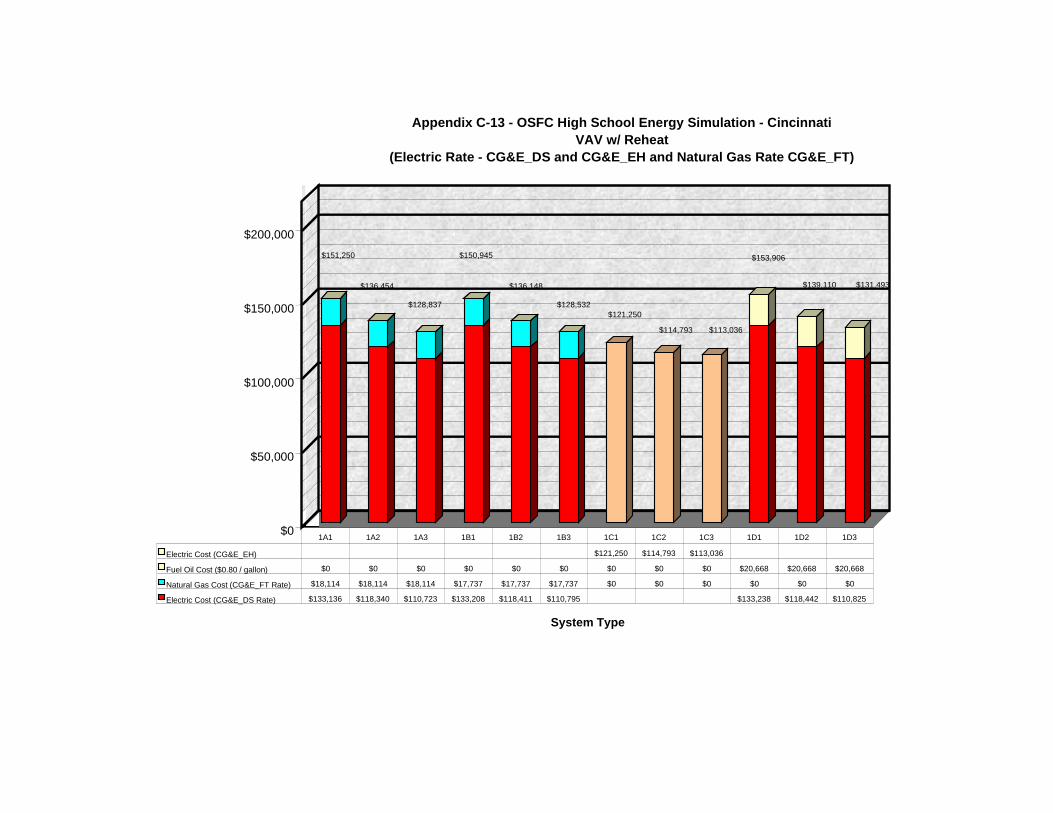
$0
$50,000
$100,000
$150,000
$200,000
System Type
Appendix C-13 - OSFC High School Energy Simulation - CincinnatiVAV w/ Reheat
(Electric Rate - CG&E_DS and CG&E_EH and Natural Gas Rate CG&E_FT)
Electric Cost (CG&E_EH) $121,250 $114,793 $113,036
Fuel Oil Cost ($0.80 / gallon) $0 $0 $0 $0 $0 $0 $0 $0 $0 $20,668 $20,668 $20,668
Natural Gas Cost (CG&E_FT Rate) $18,114 $18,114 $18,114 $17,737 $17,737 $17,737 $0 $0 $0 $0 $0 $0
Electric Cost (CG&E_DS Rate) $133,136 $118,340 $110,723 $133,208 $118,411 $110,795 $133,238 $118,442 $110,825
1A1 1A2 1A3 1B1 1B2 1B3 1C1 1C2 1C3 1D1 1D2 1D3
$151,250
$136,454
$128,837
$150,945
$136,148
$128,532$121,250
$114,793 $113,036
$153,906
$139,110 $131,493
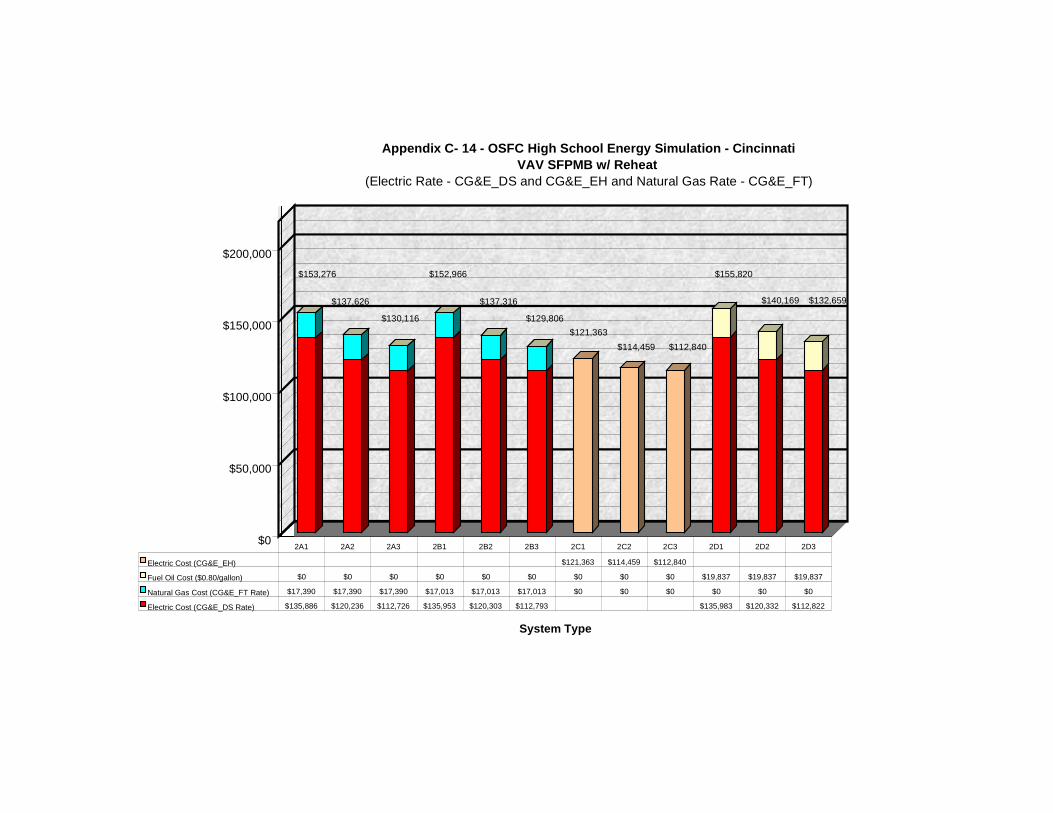
$0
$50,000
$100,000
$150,000
$200,000
System Type
Appendix C- 14 - OSFC High School Energy Simulation - CincinnatiVAV SFPMB w/ Reheat
(Electric Rate - CG&E_DS and CG&E_EH and Natural Gas Rate - CG&E_FT)
Electric Cost (CG&E_EH) $121,363 $114,459 $112,840
Fuel Oil Cost ($0.80/gallon) $0 $0 $0 $0 $0 $0 $0 $0 $0 $19,837 $19,837 $19,837
Natural Gas Cost (CG&E_FT Rate) $17,390 $17,390 $17,390 $17,013 $17,013 $17,013 $0 $0 $0 $0 $0 $0
Electric Cost (CG&E_DS Rate) $135,886 $120,236 $112,726 $135,953 $120,303 $112,793 $135,983 $120,332 $112,822
2A1 2A2 2A3 2B1 2B2 2B3 2C1 2C2 2C3 2D1 2D2 2D3
$153,276
$137,626
$130,116
$152,966
$137,316
$129,806$121,363
$114,459 $112,840
$155,820
$140,169 $132,659
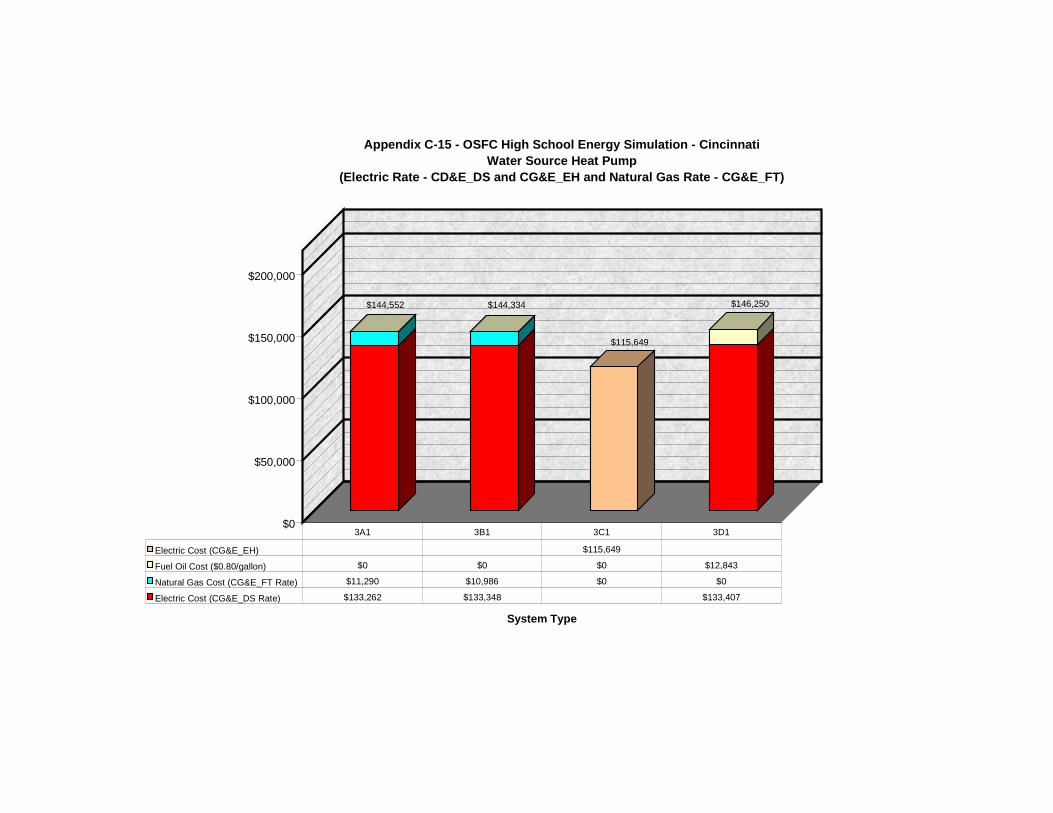
$0
$50,000
$100,000
$150,000
$200,000
System Type
Appendix C-15 - OSFC High School Energy Simulation - CincinnatiWater Source Heat Pump
(Electric Rate - CD&E_DS and CG&E_EH and Natural Gas Rate - CG&E_FT)
Electric Cost (CG&E_EH) $115,649
Fuel Oil Cost ($0.80/gallon) $0 $0 $0 $12,843
Natural Gas Cost (CG&E_FT Rate) $11,290 $10,986 $0 $0
Electric Cost (CG&E_DS Rate) $133,262 $133,348 $133,407
3A1 3B1 3C1 3D1
$144,552 $144,334
$115,649
$146,250
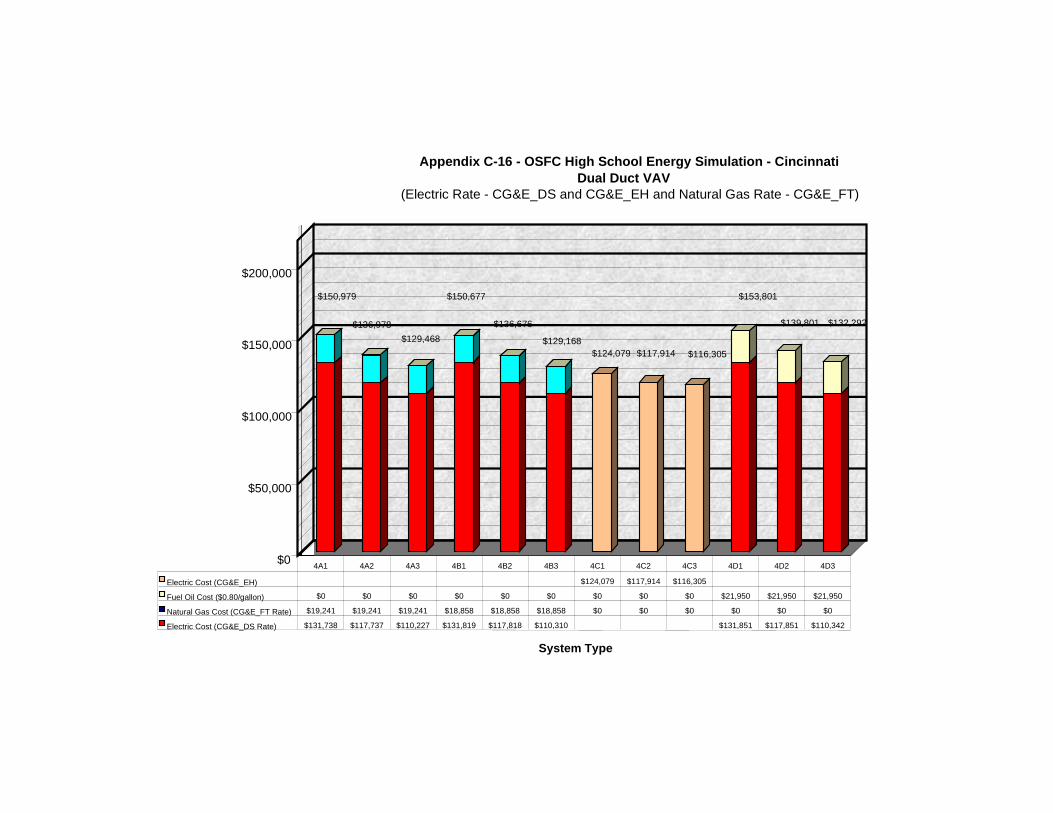
$0
$50,000
$100,000
$150,000
$200,000
System Type
Appendix C-16 - OSFC High School Energy Simulation - CincinnatiDual Duct VAV
(Electric Rate - CG&E_DS and CG&E_EH and Natural Gas Rate - CG&E_FT)
Electric Cost (CG&E_EH) $124,079 $117,914 $116,305
Fuel Oil Cost ($0.80/gallon) $0 $0 $0 $0 $0 $0 $0 $0 $0 $21,950 $21,950 $21,950
Natural Gas Cost (CG&E_FT Rate) $19,241 $19,241 $19,241 $18,858 $18,858 $18,858 $0 $0 $0 $0 $0 $0
Electric Cost (CG&E_DS Rate) $131,738 $117,737 $110,227 $131,819 $117,818 $110,310 $131,851 $117,851 $110,342
4A1 4A2 4A3 4B1 4B2 4B3 4C1 4C2 4C3 4D1 4D2 4D3
$150,979
$129,468
$150,677
$136,676
$129,168$124,079 $117,914 $116,305
$153,801
$139,801 $132,292$136,978
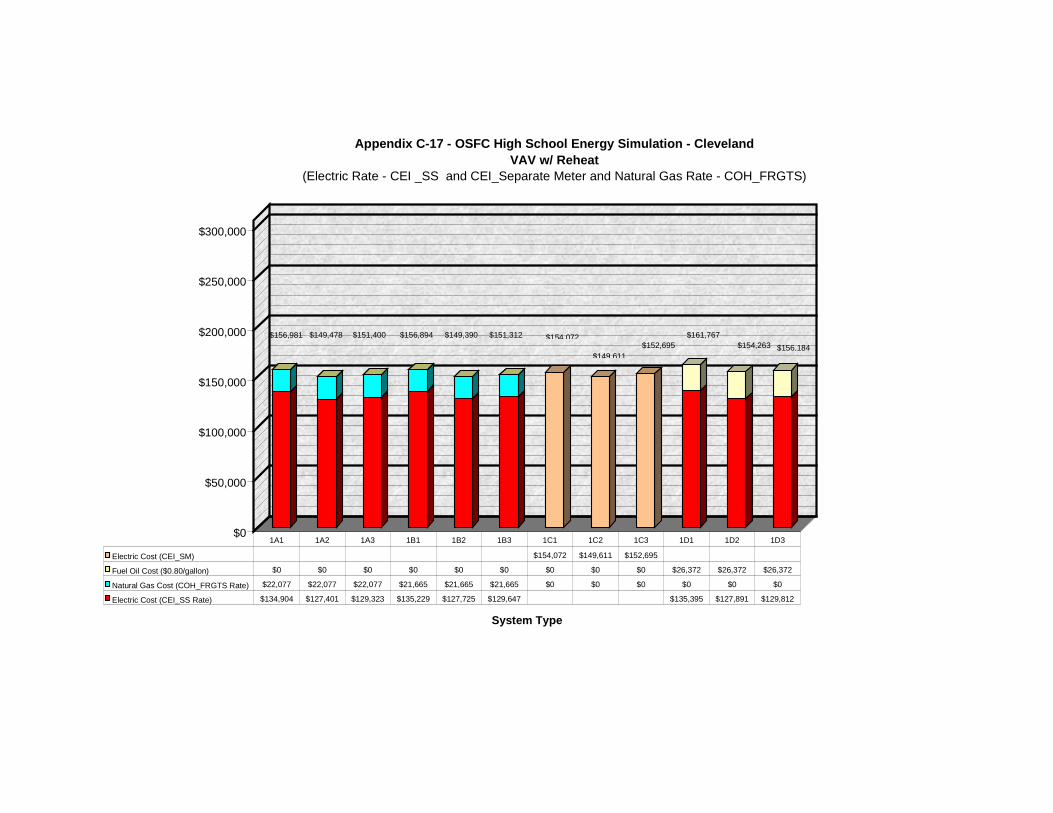
$0
$50,000
$100,000
$150,000
$200,000
$250,000
$300,000
System Type
Appendix C-17 - OSFC High School Energy Simulation - ClevelandVAV w/ Reheat
(Electric Rate - CEI _SS and CEI_Separate Meter and Natural Gas Rate - COH_FRGTS)
Electric Cost (CEI_SM) $154,072 $149,611 $152,695
Fuel Oil Cost ($0.80/gallon) $0 $0 $0 $0 $0 $0 $0 $0 $0 $26,372 $26,372 $26,372
Natural Gas Cost (COH_FRGTS Rate) $22,077 $22,077 $22,077 $21,665 $21,665 $21,665 $0 $0 $0 $0 $0 $0
Electric Cost (CEI_SS Rate) $134,904 $127,401 $129,323 $135,229 $127,725 $129,647 $135,395 $127,891 $129,812
1A1 1A2 1A3 1B1 1B2 1B3 1C1 1C2 1C3 1D1 1D2 1D3
$156,981 $149,478 $151,400 $156,894 $149,390 $151,312 $154 072
$149,611$152,695
$161,767 $154,263 $156,184
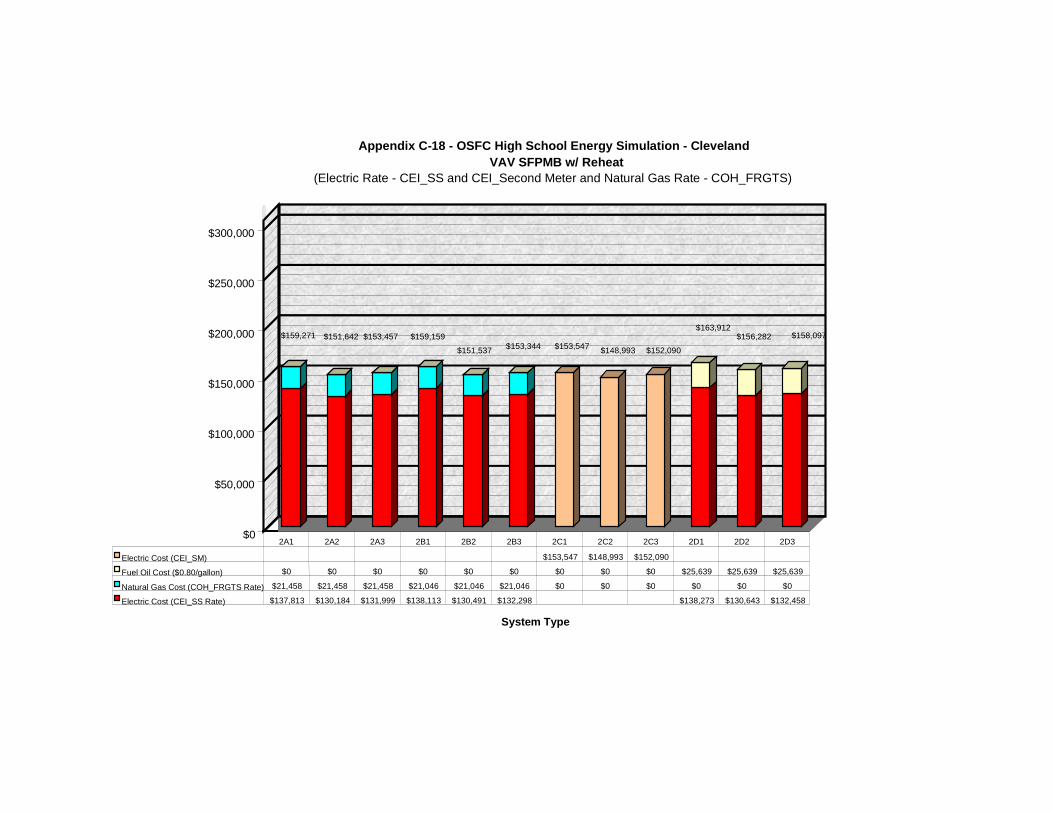
$0
$50,000
$100,000
$150,000
$200,000
$250,000
$300,000
System Type
Appendix C-18 - OSFC High School Energy Simulation - ClevelandVAV SFPMB w/ Reheat
(Electric Rate - CEI_SS and CEI_Second Meter and Natural Gas Rate - COH_FRGTS)
Electric Cost (CEI_SM) $153,547 $148,993 $152,090
Fuel Oil Cost ($0.80/gallon) $0 $0 $0 $0 $0 $0 $0 $0 $0 $25,639 $25,639 $25,639
Natural Gas Cost (COH_FRGTS Rate) $21,458 $21,458 $21,458 $21,046 $21,046 $21,046 $0 $0 $0 $0 $0 $0
Electric Cost (CEI_SS Rate) $137,813 $130,184 $131,999 $138,113 $130,491 $132,298 $138,273 $130,643 $132,458
2A1 2A2 2A3 2B1 2B2 2B3 2C1 2C2 2C3 2D1 2D2 2D3
$151,642 $153,457 $159,159$151,537 $153,344 $153,547 $148,993 $152,090
$156,282$163,912
$158,097$159,271
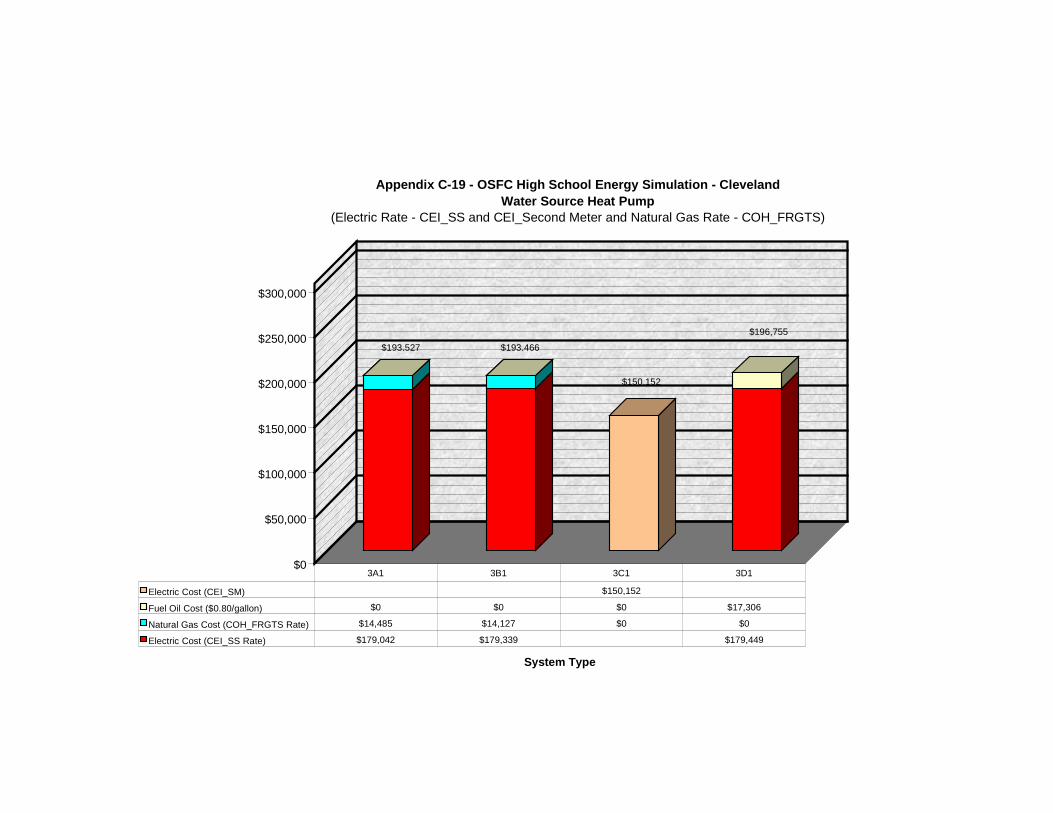
$0
$50,000
$100,000
$150,000
$200,000
$250,000
$300,000
System Type
Appendix C-19 - OSFC High School Energy Simulation - ClevelandWater Source Heat Pump
(Electric Rate - CEI_SS and CEI_Second Meter and Natural Gas Rate - COH_FRGTS)
Electric Cost (CEI_SM) $150,152
Fuel Oil Cost ($0.80/gallon) $0 $0 $0 $17,306
Natural Gas Cost (COH_FRGTS Rate) $14,485 $14,127 $0 $0
Electric Cost (CEI_SS Rate) $179,042 $179,339 $179,449
3A1 3B1 3C1 3D1
$193,527 $193,466
$196,755
$150,152
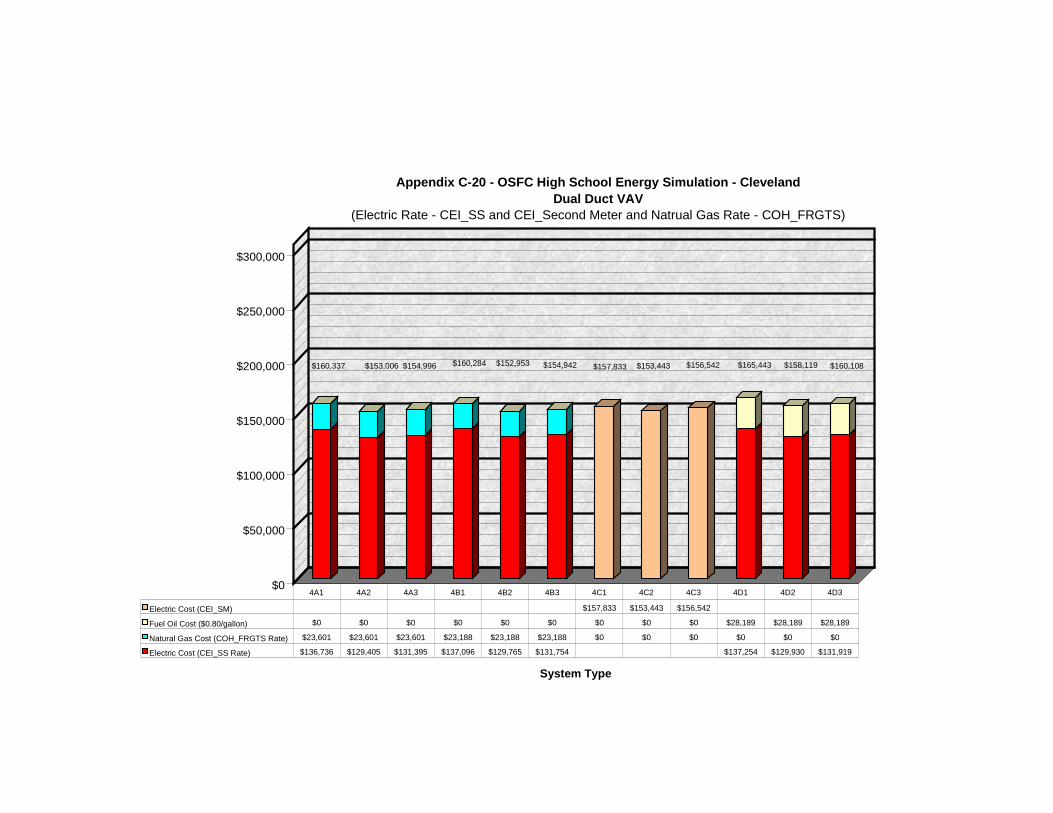
$0
$50,000
$100,000
$150,000
$200,000
$250,000
$300,000
System Type
Appendix C-20 - OSFC High School Energy Simulation - ClevelandDual Duct VAV
(Electric Rate - CEI_SS and CEI_Second Meter and Natrual Gas Rate - COH_FRGTS)
Electric Cost (CEI_SM) $157,833 $153,443 $156,542
Fuel Oil Cost ($0.80/gallon) $0 $0 $0 $0 $0 $0 $0 $0 $0 $28,189 $28,189 $28,189
Natural Gas Cost (COH_FRGTS Rate) $23,601 $23,601 $23,601 $23,188 $23,188 $23,188 $0 $0 $0 $0 $0 $0
Electric Cost (CEI_SS Rate) $136,736 $129,405 $131,395 $137,096 $129,765 $131,754 $137,254 $129,930 $131,919
4A1 4A2 4A3 4B1 4B2 4B3 4C1 4C2 4C3 4D1 4D2 4D3
$160,337 $153,006 $154,996 $160,284 $152,953 $154,942 $157,833 $153,443 $156,542 $165,443 $158,119 $160,108
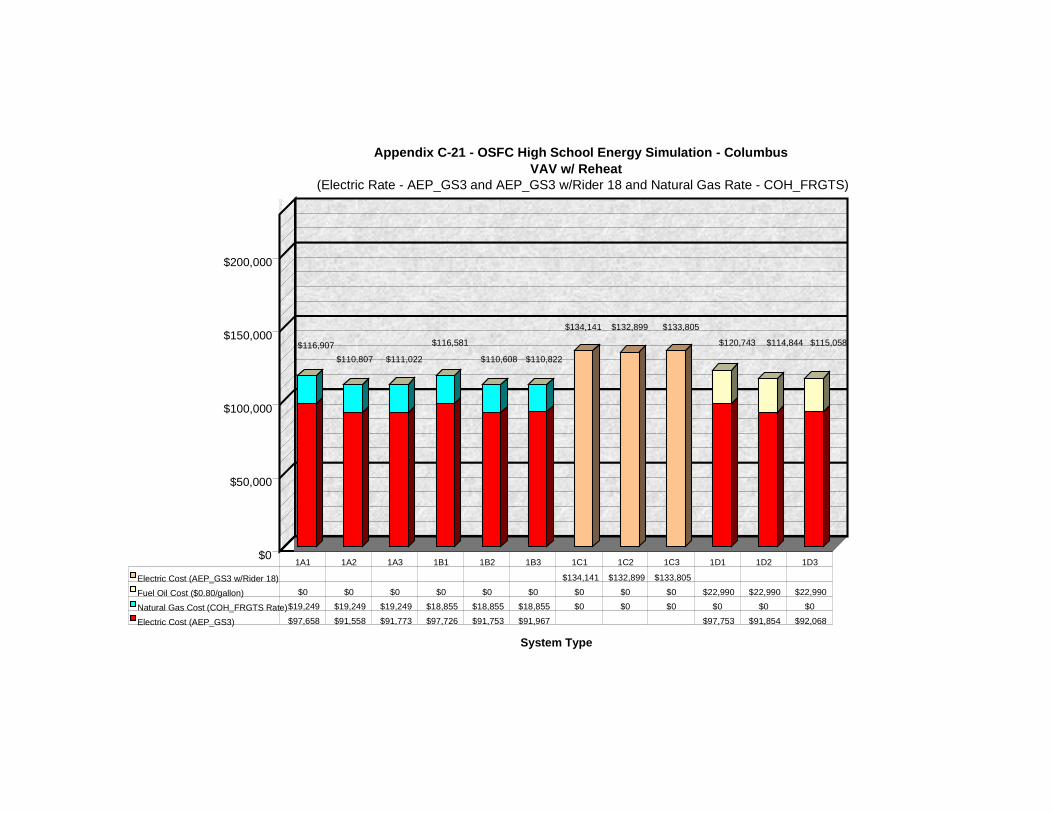
$0
$50,000
$100,000
$150,000
$200,000
System Type
Appendix C-21 - OSFC High School Energy Simulation - ColumbusVAV w/ Reheat
(Electric Rate - AEP_GS3 and AEP_GS3 w/Rider 18 and Natural Gas Rate - COH_FRGTS)
Electric Cost (AEP_GS3 w/Rider 18) $134,141 $132,899 $133,805
Fuel Oil Cost ($0.80/gallon) $0 $0 $0 $0 $0 $0 $0 $0 $0 $22,990 $22,990 $22,990
Natural Gas Cost (COH_FRGTS Rate)$19,249 $19,249 $19,249 $18,855 $18,855 $18,855 $0 $0 $0 $0 $0 $0
Electric Cost (AEP_GS3) $97,658 $91,558 $91,773 $97,726 $91,753 $91,967 $97,753 $91,854 $92,068
1A1 1A2 1A3 1B1 1B2 1B3 1C1 1C2 1C3 1D1 1D2 1D3
$116,907$110,807 $111,022
$116,581
$110,608 $110,822
$134,141 $132,899 $133,805
$120,743 $114,844 $115,058
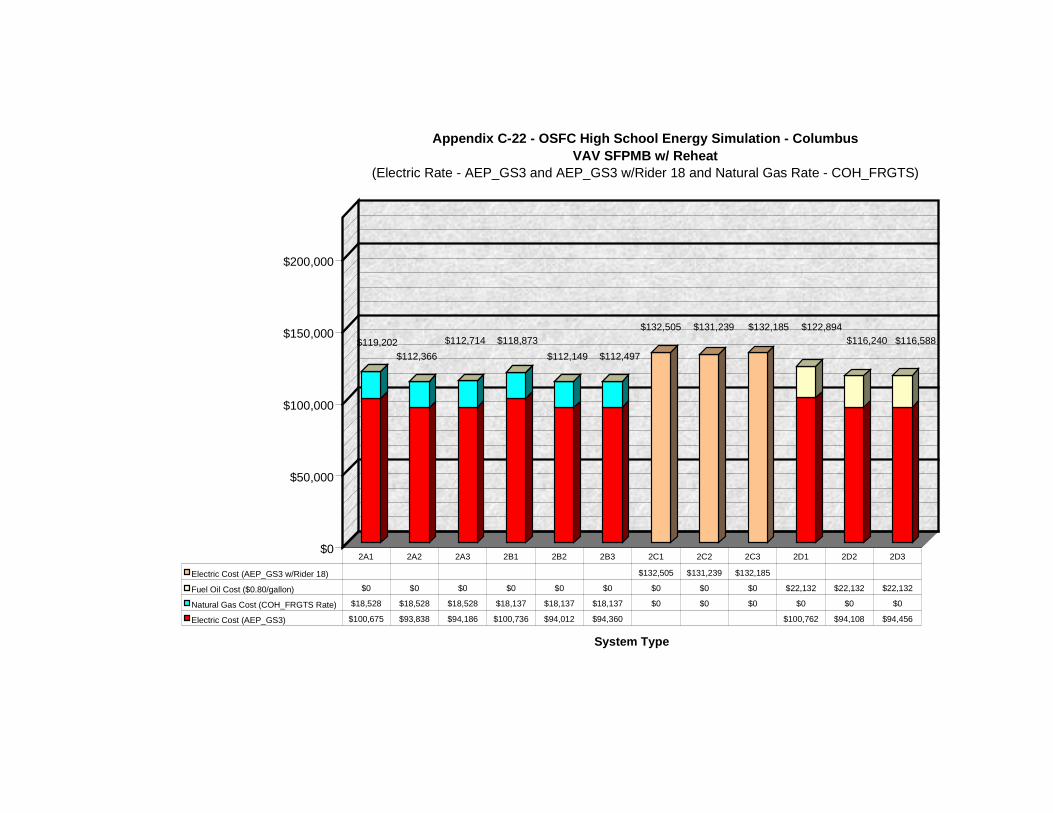
$0
$50,000
$100,000
$150,000
$200,000
System Type
Appendix C-22 - OSFC High School Energy Simulation - ColumbusVAV SFPMB w/ Reheat
(Electric Rate - AEP_GS3 and AEP_GS3 w/Rider 18 and Natural Gas Rate - COH_FRGTS)
Electric Cost (AEP_GS3 w/Rider 18) $132,505 $131,239 $132,185
Fuel Oil Cost ($0.80/gallon) $0 $0 $0 $0 $0 $0 $0 $0 $0 $22,132 $22,132 $22,132
Natural Gas Cost (COH_FRGTS Rate) $18,528 $18,528 $18,528 $18,137 $18,137 $18,137 $0 $0 $0 $0 $0 $0
Electric Cost (AEP_GS3) $100,675 $93,838 $94,186 $100,736 $94,012 $94,360 $100,762 $94,108 $94,456
2A1 2A2 2A3 2B1 2B2 2B3 2C1 2C2 2C3 2D1 2D2 2D3
$119,202$112,366
$112,714 $118,873$112,149 $112,497
$132,505 $131,239 $132,185 $122,894$116,240 $116,588
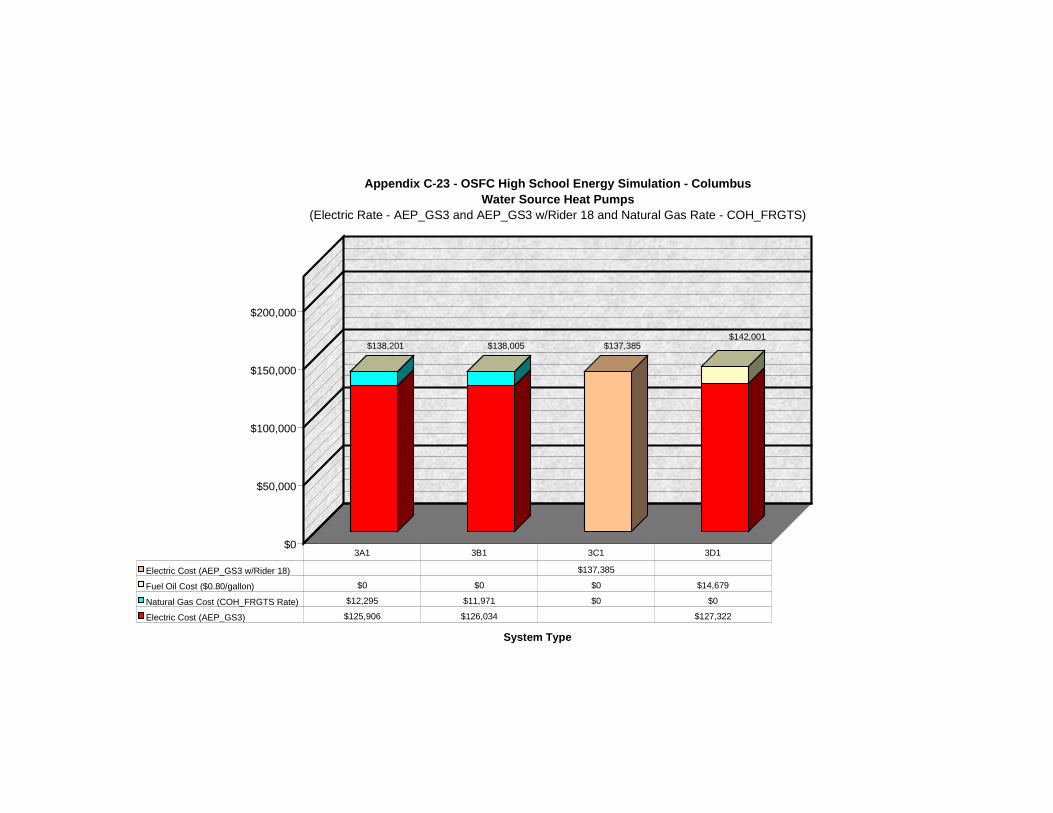
$0
$50,000
$100,000
$150,000
$200,000
System Type
Appendix C-23 - OSFC High School Energy Simulation - ColumbusWater Source Heat Pumps
(Electric Rate - AEP_GS3 and AEP_GS3 w/Rider 18 and Natural Gas Rate - COH_FRGTS)
Electric Cost (AEP_GS3 w/Rider 18) $137,385
Fuel Oil Cost ($0.80/gallon) $0 $0 $0 $14,679
Natural Gas Cost (COH_FRGTS Rate) $12,295 $11,971 $0 $0
Electric Cost (AEP_GS3) $125,906 $126,034 $127,322
3A1 3B1 3C1 3D1
$138,201 $138,005 $137,385 $142,001
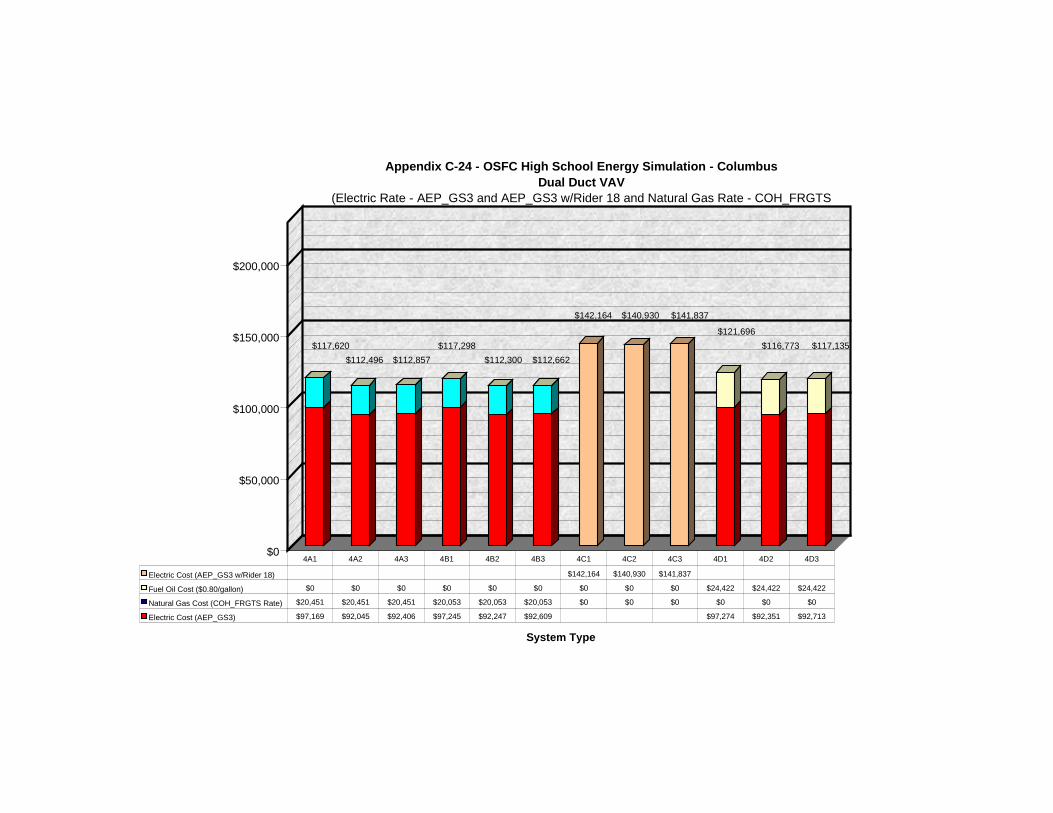
$0
$50,000
$100,000
$150,000
$200,000
System Type
Appendix C-24 - OSFC High School Energy Simulation - ColumbusDual Duct VAV
(Electric Rate - AEP_GS3 and AEP_GS3 w/Rider 18 and Natural Gas Rate - COH_FRGTS
Electric Cost (AEP_GS3 w/Rider 18) $142,164 $140,930 $141,837
Fuel Oil Cost ($0.80/gallon) $0 $0 $0 $0 $0 $0 $0 $0 $0 $24,422 $24,422 $24,422
Natural Gas Cost (COH_FRGTS Rate) $20,451 $20,451 $20,451 $20,053 $20,053 $20,053 $0 $0 $0 $0 $0 $0
Electric Cost (AEP_GS3) $97,169 $92,045 $92,406 $97,245 $92,247 $92,609 $97,274 $92,351 $92,713
4A1 4A2 4A3 4B1 4B2 4B3 4C1 4C2 4C3 4D1 4D2 4D3
$117,620$112,496 $112,857
$117,298$112,300 $112,662
$142,164
$116,773 $117,135
$140,930 $141,837
$121,696
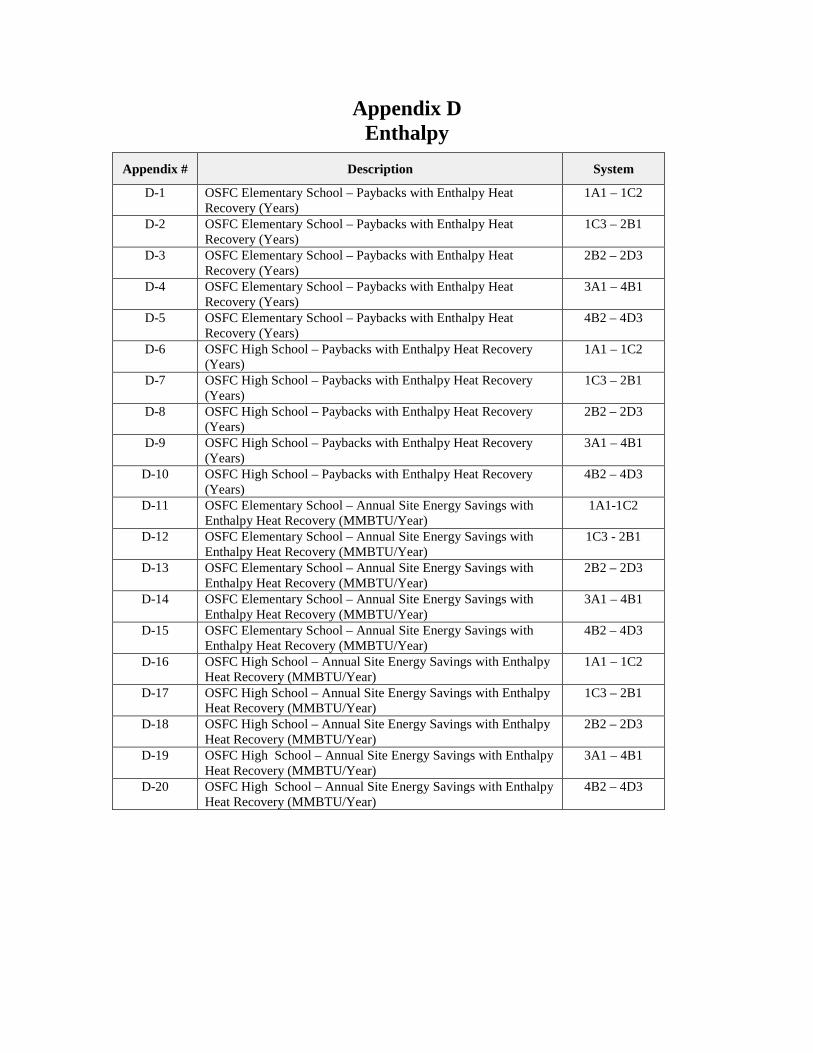
Appendix DEnthalpy
Appendix # Description System
D-1 OSFC Elementary School – Paybacks with Enthalpy HeatRecovery (Years)
1A1 – 1C2
D-2 OSFC Elementary School – Paybacks with Enthalpy HeatRecovery (Years)
1C3 – 2B1
D-3 OSFC Elementary School – Paybacks with Enthalpy HeatRecovery (Years)
2B2 – 2D3
D-4 OSFC Elementary School – Paybacks with Enthalpy HeatRecovery (Years)
3A1 – 4B1
D-5 OSFC Elementary School – Paybacks with Enthalpy HeatRecovery (Years)
4B2 – 4D3
D-6 OSFC High School – Paybacks with Enthalpy Heat Recovery(Years)
1A1 – 1C2
D-7 OSFC High School – Paybacks with Enthalpy Heat Recovery(Years)
1C3 – 2B1
D-8 OSFC High School – Paybacks with Enthalpy Heat Recovery(Years)
2B2 – 2D3
D-9 OSFC High School – Paybacks with Enthalpy Heat Recovery(Years)
3A1 – 4B1
D-10 OSFC High School – Paybacks with Enthalpy Heat Recovery(Years)
4B2 – 4D3
D-11 OSFC Elementary School – Annual Site Energy Savings withEnthalpy Heat Recovery (MMBTU/Year)
1A1-1C2
D-12 OSFC Elementary School – Annual Site Energy Savings withEnthalpy Heat Recovery (MMBTU/Year)
1C3 - 2B1
D-13 OSFC Elementary School – Annual Site Energy Savings withEnthalpy Heat Recovery (MMBTU/Year)
2B2 – 2D3
D-14 OSFC Elementary School – Annual Site Energy Savings withEnthalpy Heat Recovery (MMBTU/Year)
3A1 – 4B1
D-15 OSFC Elementary School – Annual Site Energy Savings withEnthalpy Heat Recovery (MMBTU/Year)
4B2 – 4D3
D-16 OSFC High School – Annual Site Energy Savings with EnthalpyHeat Recovery (MMBTU/Year)
1A1 – 1C2
D-17 OSFC High School – Annual Site Energy Savings with EnthalpyHeat Recovery (MMBTU/Year)
1C3 – 2B1
D-18 OSFC High School – Annual Site Energy Savings with EnthalpyHeat Recovery (MMBTU/Year)
2B2 – 2D3
D-19 OSFC High School – Annual Site Energy Savings with EnthalpyHeat Recovery (MMBTU/Year)
3A1 – 4B1
D-20 OSFC High School – Annual Site Energy Savings with EnthalpyHeat Recovery (MMBTU/Year)
4B2 – 4D3
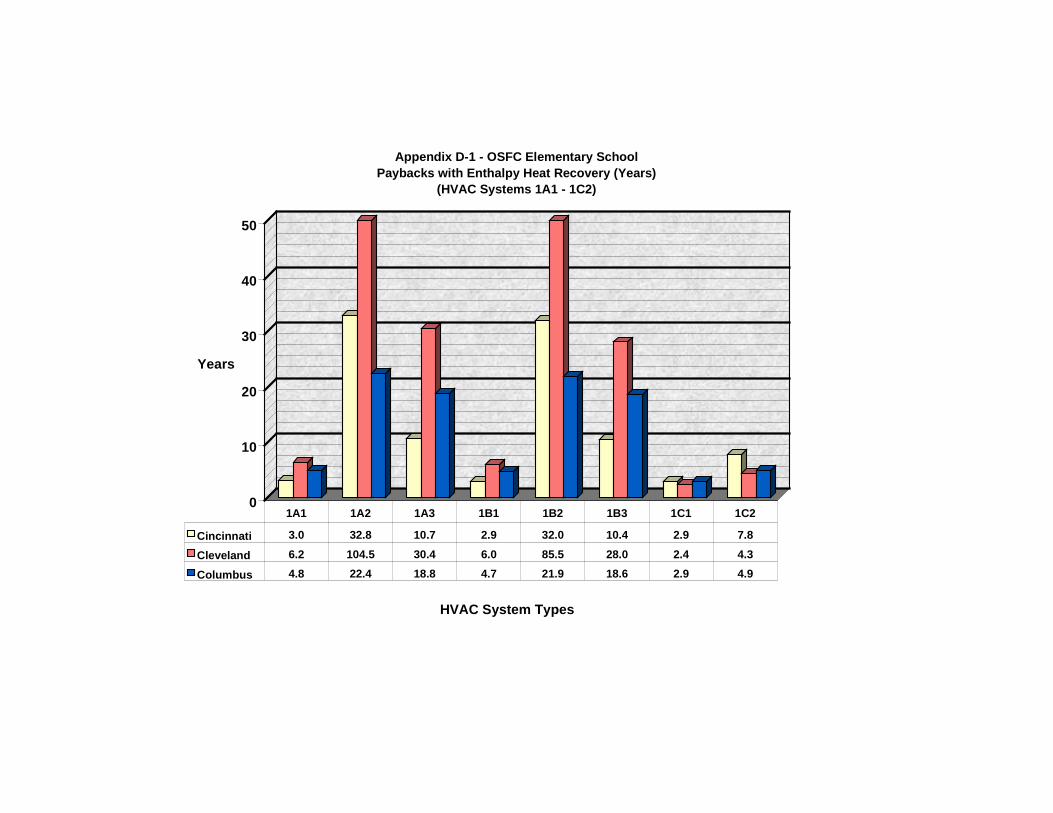
0
10
20
30
40
50
Years
HVAC System Types
Appendix D-1 - OSFC Elementary School Paybacks with Enthalpy Heat Recovery (Years)
(HVAC Systems 1A1 - 1C2)
Cincinnati 3.0 32.8 10.7 2.9 32.0 10.4 2.9 7.8
Cleveland 6.2 104.5 30.4 6.0 85.5 28.0 2.4 4.3
Columbus 4.8 22.4 18.8 4.7 21.9 18.6 2.9 4.9
1A1 1A2 1A3 1B1 1B2 1B3 1C1 1C2
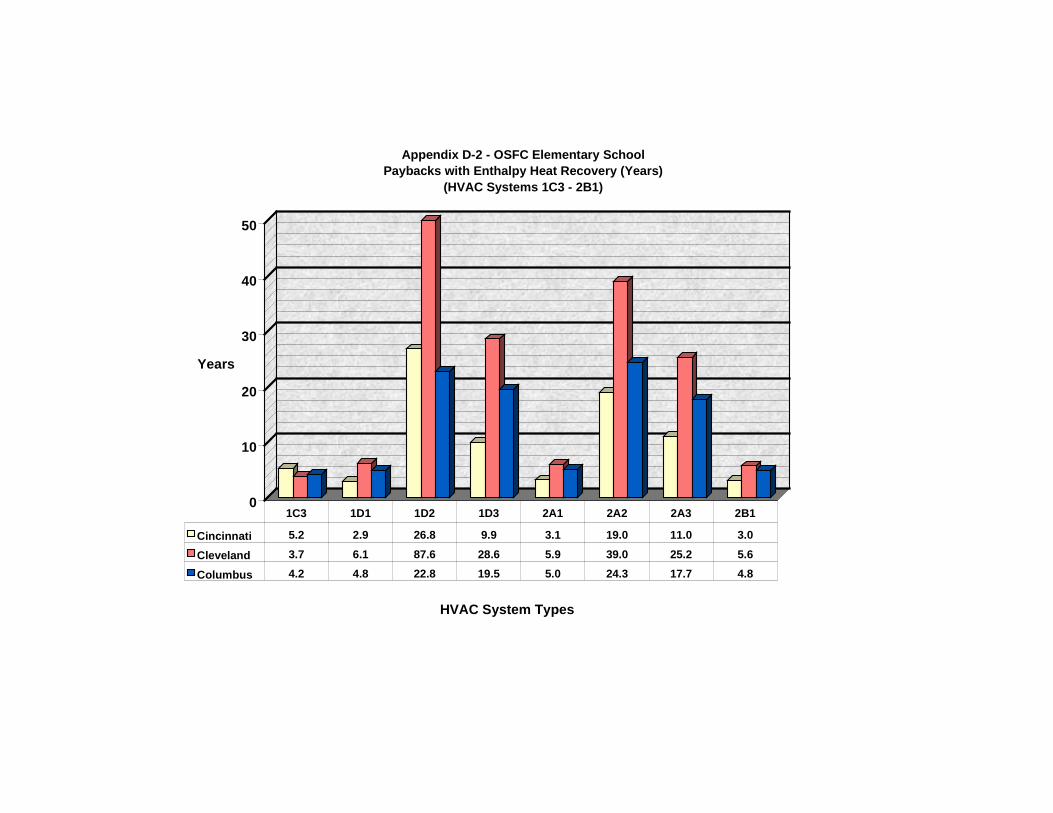
0
10
20
30
40
50
Years
HVAC System Types
Appendix D-2 - OSFC Elementary School Paybacks with Enthalpy Heat Recovery (Years)
(HVAC Systems 1C3 - 2B1)
Cincinnati 5.2 2.9 26.8 9.9 3.1 19.0 11.0 3.0
Cleveland 3.7 6.1 87.6 28.6 5.9 39.0 25.2 5.6
Columbus 4.2 4.8 22.8 19.5 5.0 24.3 17.7 4.8
1C3 1D1 1D2 1D3 2A1 2A2 2A3 2B1
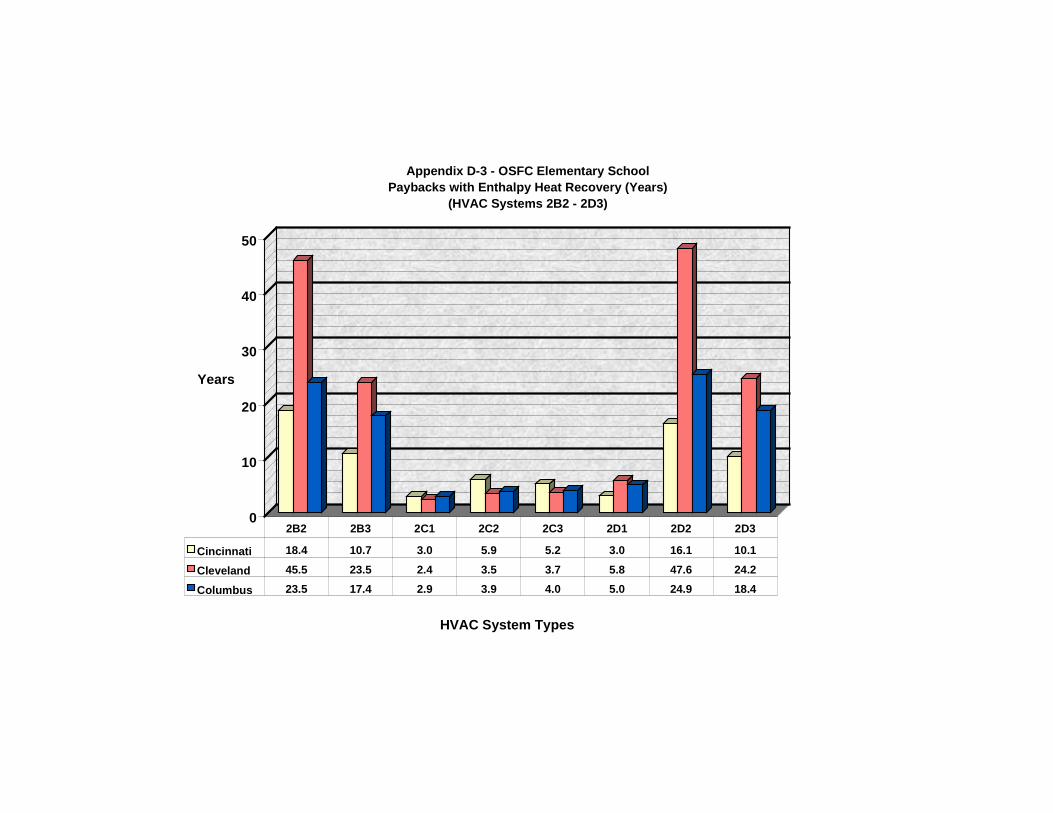
0
10
20
30
40
50
Years
HVAC System Types
Appendix D-3 - OSFC Elementary School Paybacks with Enthalpy Heat Recovery (Years)
(HVAC Systems 2B2 - 2D3)
Cincinnati 18.4 10.7 3.0 5.9 5.2 3.0 16.1 10.1
Cleveland 45.5 23.5 2.4 3.5 3.7 5.8 47.6 24.2
Columbus 23.5 17.4 2.9 3.9 4.0 5.0 24.9 18.4
2B2 2B3 2C1 2C2 2C3 2D1 2D2 2D3
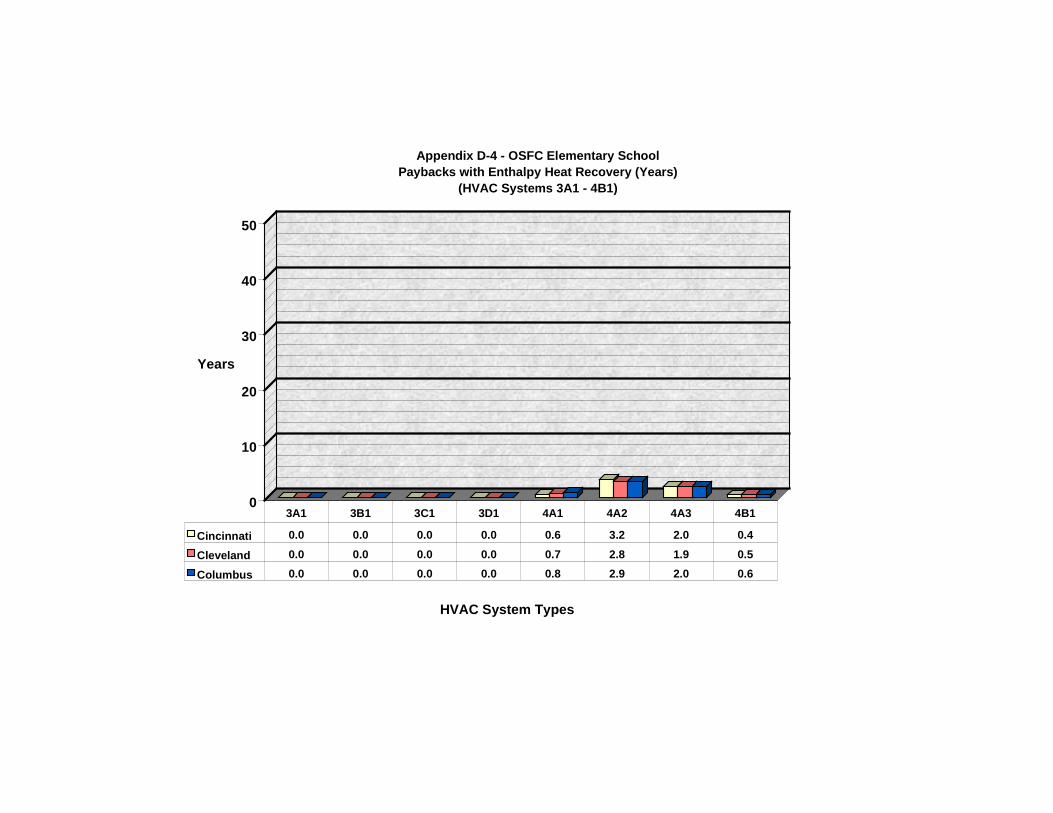
0
10
20
30
40
50
Years
HVAC System Types
Appendix D-4 - OSFC Elementary School Paybacks with Enthalpy Heat Recovery (Years)
(HVAC Systems 3A1 - 4B1)
Cincinnati 0.0 0.0 0.0 0.0 0.6 3.2 2.0 0.4
Cleveland 0.0 0.0 0.0 0.0 0.7 2.8 1.9 0.5
Columbus 0.0 0.0 0.0 0.0 0.8 2.9 2.0 0.6
3A1 3B1 3C1 3D1 4A1 4A2 4A3 4B1
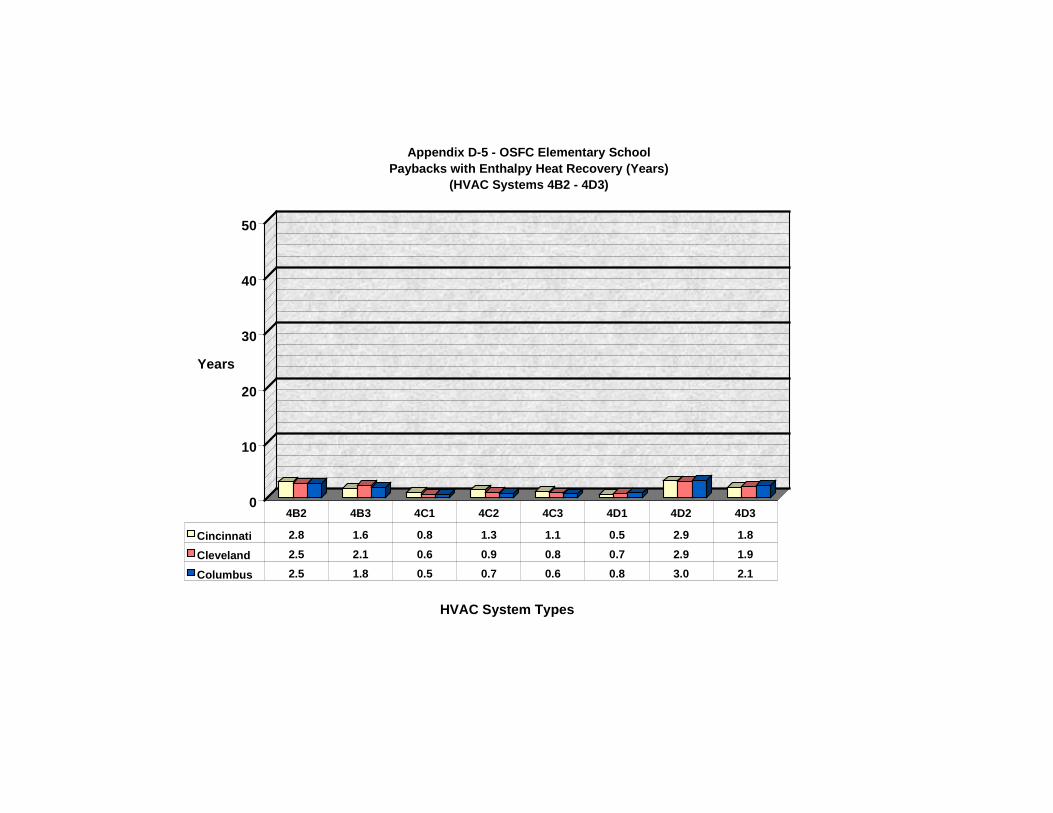
0
10
20
30
40
50
Years
HVAC System Types
Appendix D-5 - OSFC Elementary School Paybacks with Enthalpy Heat Recovery (Years)
(HVAC Systems 4B2 - 4D3)
Cincinnati 2.8 1.6 0.8 1.3 1.1 0.5 2.9 1.8
Cleveland 2.5 2.1 0.6 0.9 0.8 0.7 2.9 1.9
Columbus 2.5 1.8 0.5 0.7 0.6 0.8 3.0 2.1
4B2 4B3 4C1 4C2 4C3 4D1 4D2 4D3
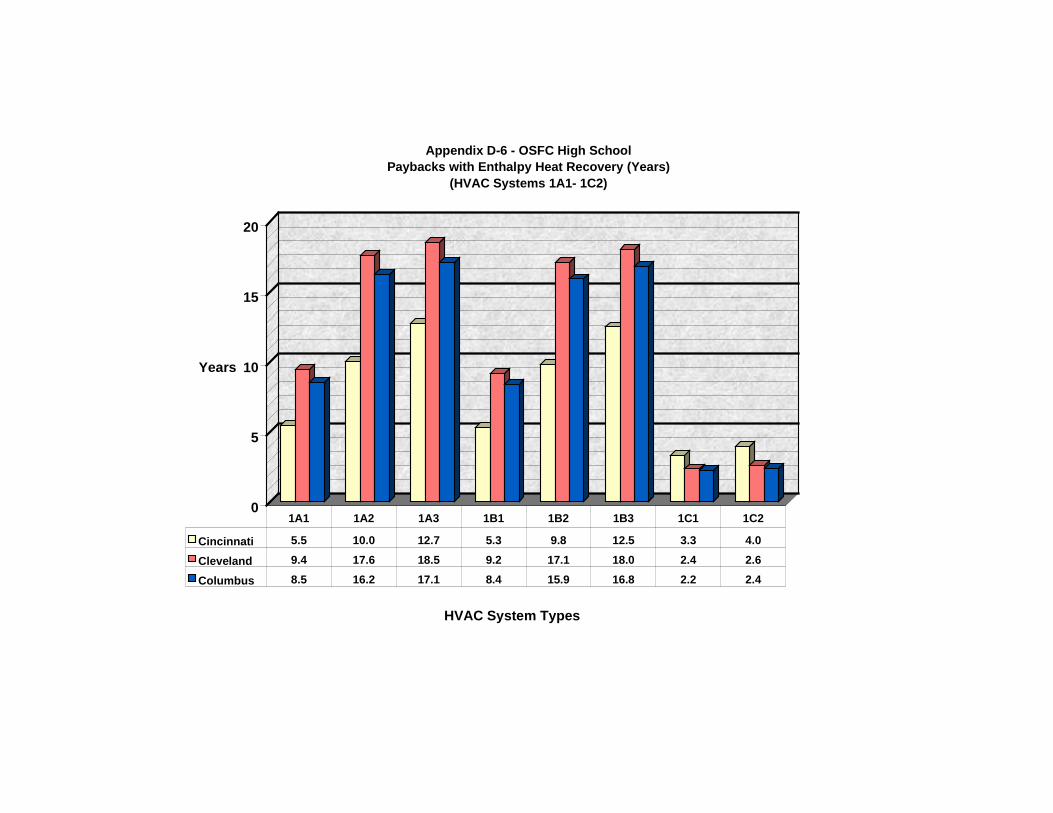
0
5
10
15
20
Years
HVAC System Types
Appendix D-6 - OSFC High School Paybacks with Enthalpy Heat Recovery (Years)
(HVAC Systems 1A1- 1C2)
Cincinnati 5.5 10.0 12.7 5.3 9.8 12.5 3.3 4.0
Cleveland 9.4 17.6 18.5 9.2 17.1 18.0 2.4 2.6
Columbus 8.5 16.2 17.1 8.4 15.9 16.8 2.2 2.4
1A1 1A2 1A3 1B1 1B2 1B3 1C1 1C2
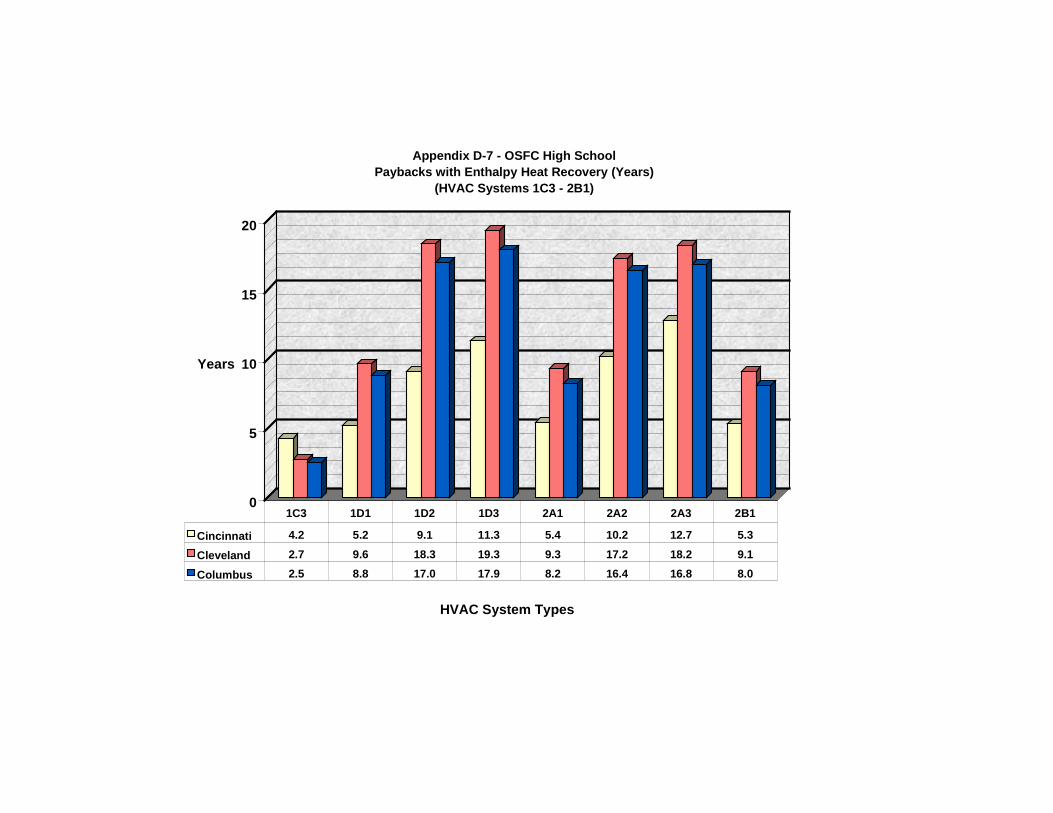
0
5
10
15
20
Years
HVAC System Types
Appendix D-7 - OSFC High School Paybacks with Enthalpy Heat Recovery (Years)
(HVAC Systems 1C3 - 2B1)
Cincinnati 4.2 5.2 9.1 11.3 5.4 10.2 12.7 5.3
Cleveland 2.7 9.6 18.3 19.3 9.3 17.2 18.2 9.1
Columbus 2.5 8.8 17.0 17.9 8.2 16.4 16.8 8.0
1C3 1D1 1D2 1D3 2A1 2A2 2A3 2B1
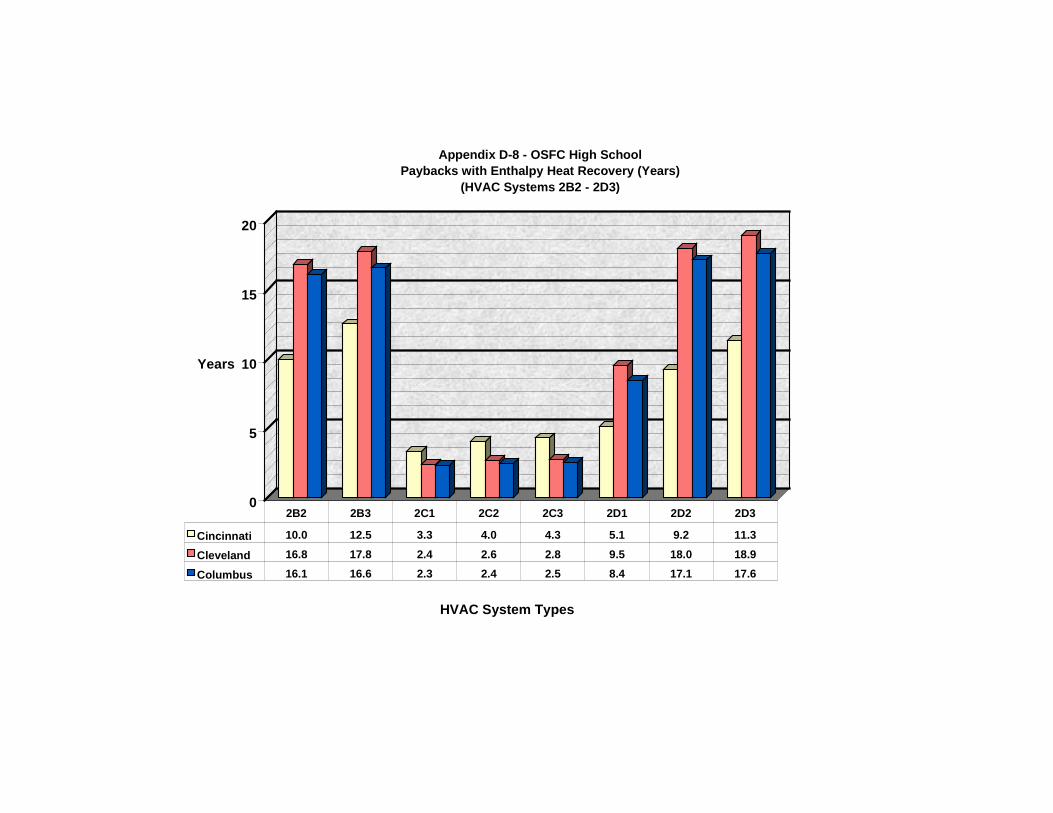
0
5
10
15
20
Years
HVAC System Types
Appendix D-8 - OSFC High School Paybacks with Enthalpy Heat Recovery (Years)
(HVAC Systems 2B2 - 2D3)
Cincinnati 10.0 12.5 3.3 4.0 4.3 5.1 9.2 11.3
Cleveland 16.8 17.8 2.4 2.6 2.8 9.5 18.0 18.9
Columbus 16.1 16.6 2.3 2.4 2.5 8.4 17.1 17.6
2B2 2B3 2C1 2C2 2C3 2D1 2D2 2D3
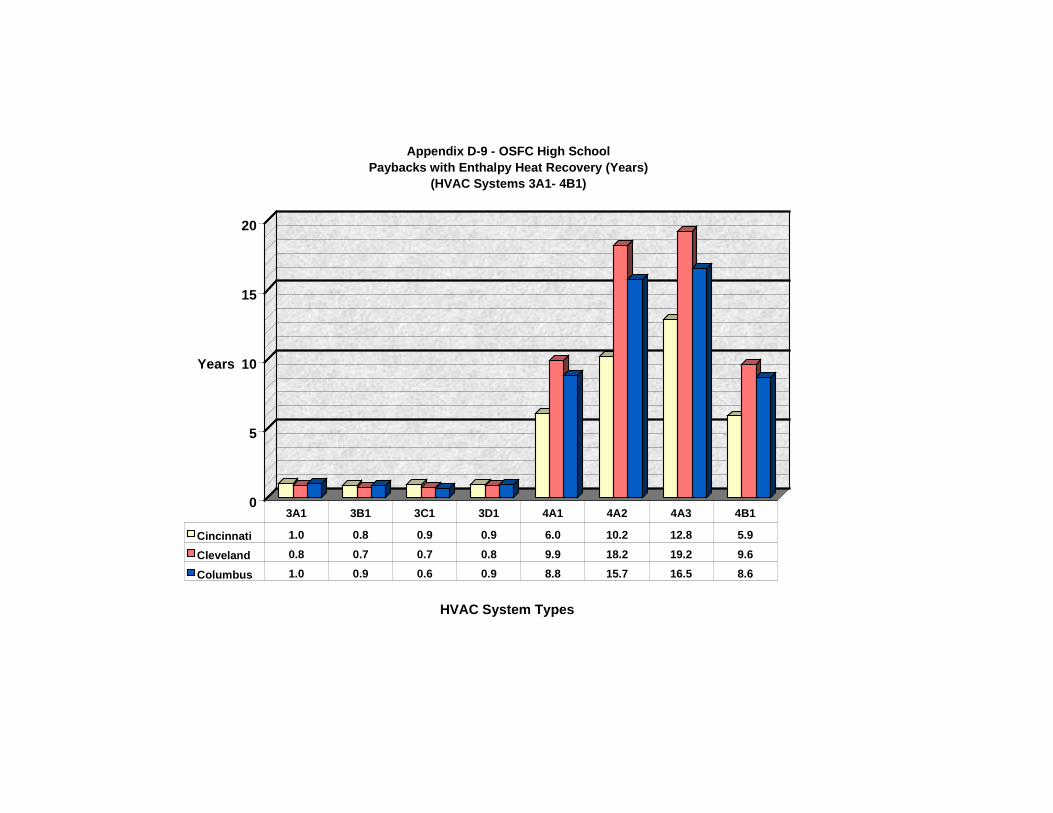
0
5
10
15
20
Years
HVAC System Types
Appendix D-9 - OSFC High School Paybacks with Enthalpy Heat Recovery (Years)
(HVAC Systems 3A1- 4B1)
Cincinnati 1.0 0.8 0.9 0.9 6.0 10.2 12.8 5.9
Cleveland 0.8 0.7 0.7 0.8 9.9 18.2 19.2 9.6
Columbus 1.0 0.9 0.6 0.9 8.8 15.7 16.5 8.6
3A1 3B1 3C1 3D1 4A1 4A2 4A3 4B1
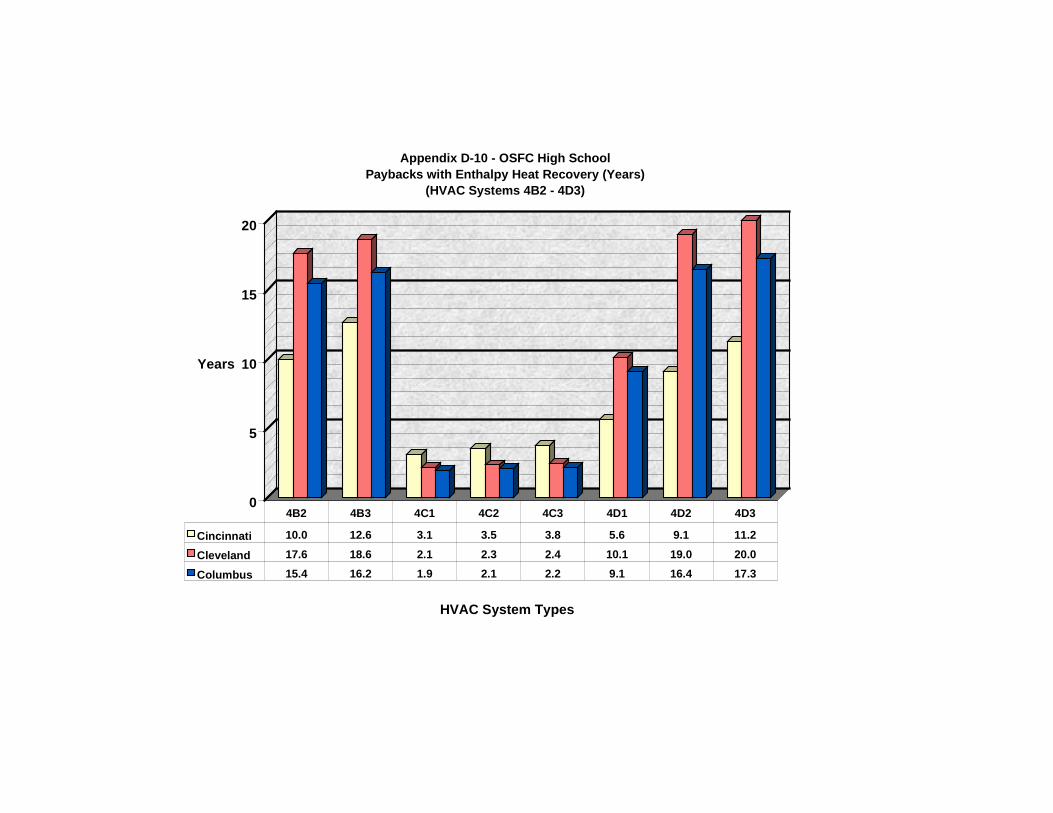
0
5
10
15
20
Years
HVAC System Types
Appendix D-10 - OSFC High School Paybacks with Enthalpy Heat Recovery (Years)
(HVAC Systems 4B2 - 4D3)
Cincinnati 10.0 12.6 3.1 3.5 3.8 5.6 9.1 11.2
Cleveland 17.6 18.6 2.1 2.3 2.4 10.1 19.0 20.0
Columbus 15.4 16.2 1.9 2.1 2.2 9.1 16.4 17.3
4B2 4B3 4C1 4C2 4C3 4D1 4D2 4D3
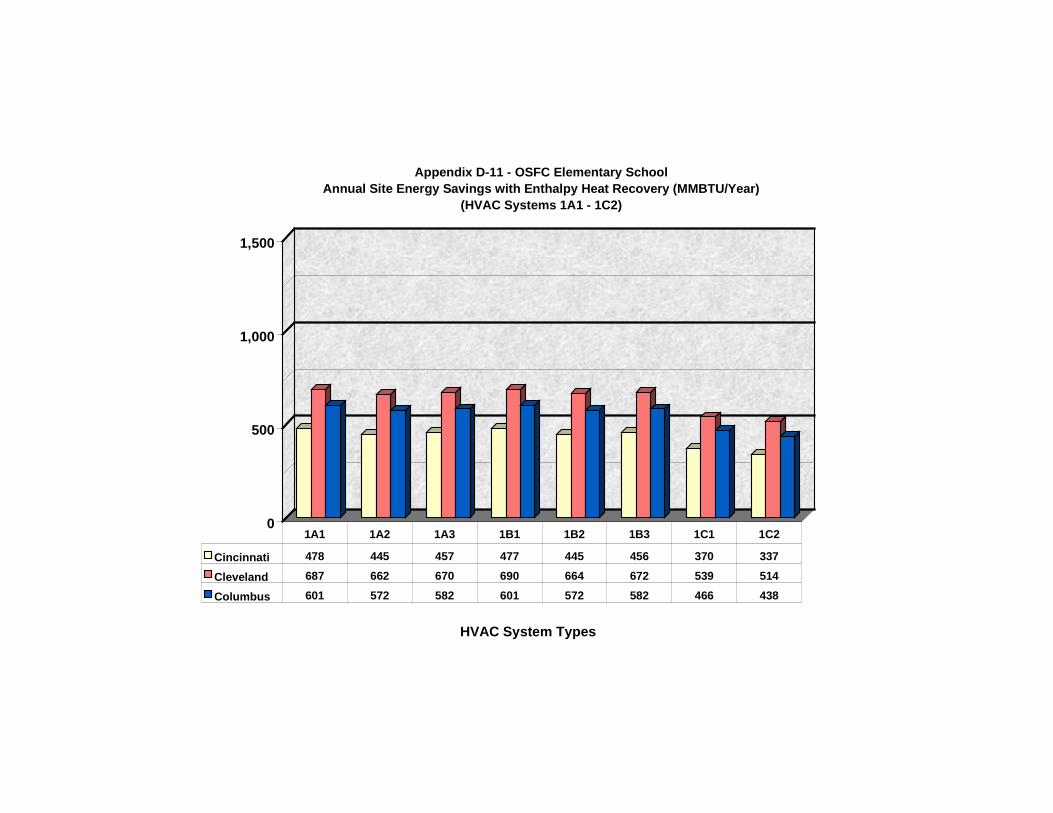
0
500
1,000
1,500
HVAC System Types
Appendix D-11 - OSFC Elementary School Annual Site Energy Savings with Enthalpy Heat Recovery (MMBTU/Year)
(HVAC Systems 1A1 - 1C2)
Cincinnati 478 445 457 477 445 456 370 337
Cleveland 687 662 670 690 664 672 539 514
Columbus 601 572 582 601 572 582 466 438
1A1 1A2 1A3 1B1 1B2 1B3 1C1 1C2
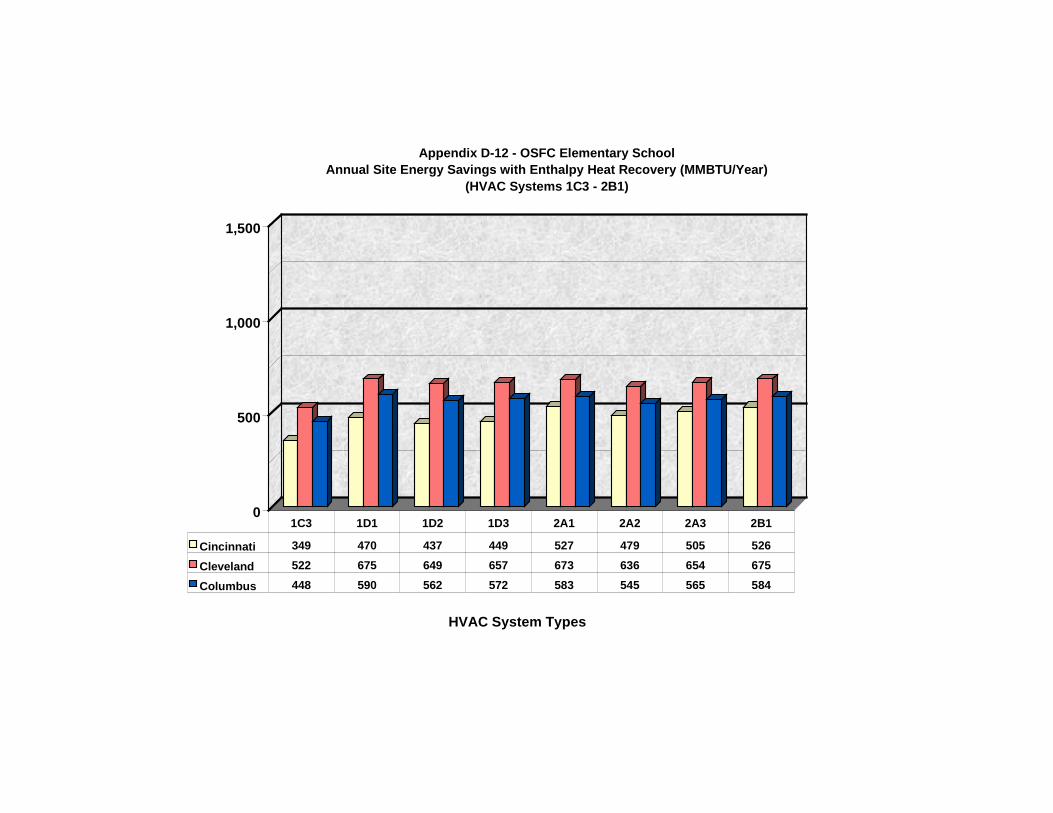
0
500
1,000
1,500
HVAC System Types
Appendix D-12 - OSFC Elementary School Annual Site Energy Savings with Enthalpy Heat Recovery (MMBTU/Year)
(HVAC Systems 1C3 - 2B1)
Cincinnati 349 470 437 449 527 479 505 526
Cleveland 522 675 649 657 673 636 654 675
Columbus 448 590 562 572 583 545 565 584
1C3 1D1 1D2 1D3 2A1 2A2 2A3 2B1
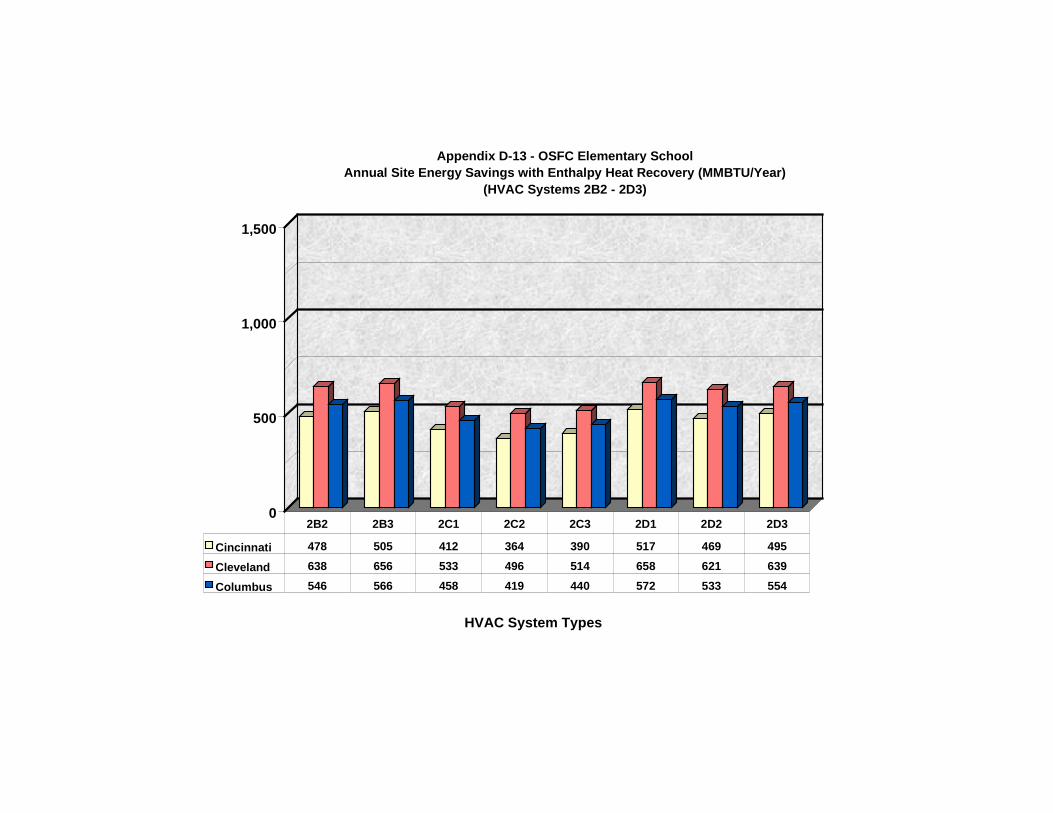
0
500
1,000
1,500
HVAC System Types
Appendix D-13 - OSFC Elementary School Annual Site Energy Savings with Enthalpy Heat Recovery (MMBTU/Year)
(HVAC Systems 2B2 - 2D3)
Cincinnati 478 505 412 364 390 517 469 495
Cleveland 638 656 533 496 514 658 621 639
Columbus 546 566 458 419 440 572 533 554
2B2 2B3 2C1 2C2 2C3 2D1 2D2 2D3
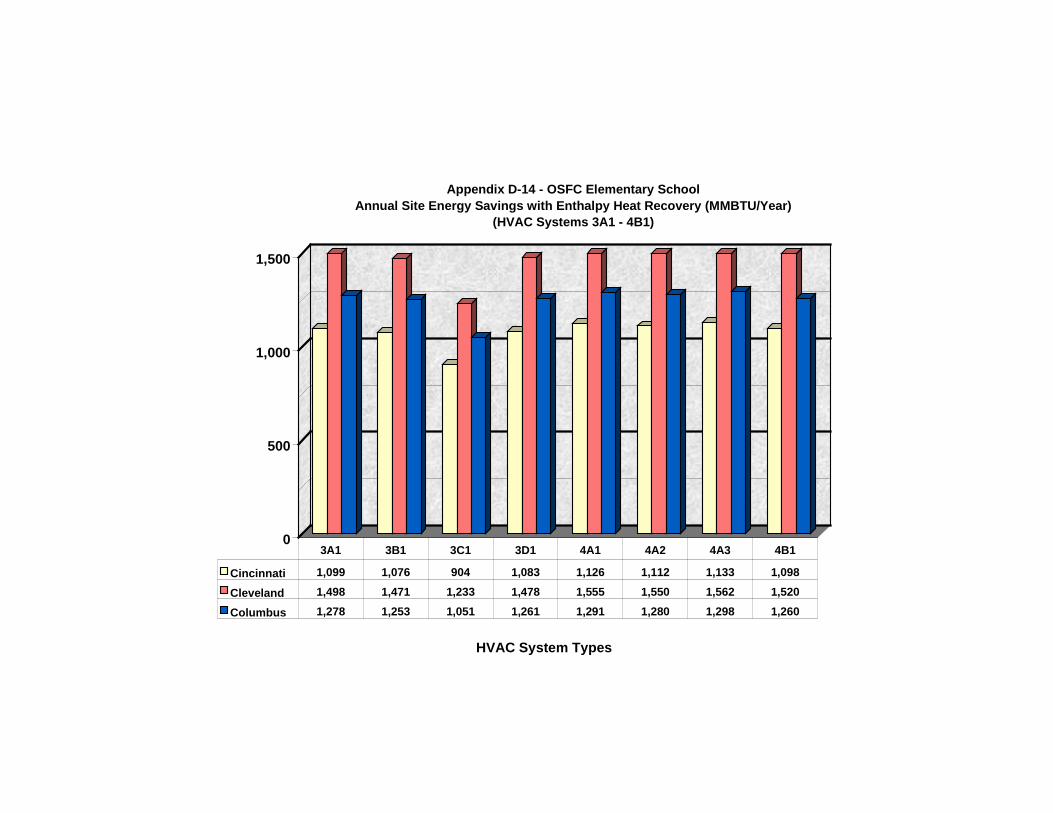
0
500
1,000
1,500
HVAC System Types
Appendix D-14 - OSFC Elementary School Annual Site Energy Savings with Enthalpy Heat Recovery (MMBTU/Year)
(HVAC Systems 3A1 - 4B1)
Cincinnati 1,099 1,076 904 1,083 1,126 1,112 1,133 1,098
Cleveland 1,498 1,471 1,233 1,478 1,555 1,550 1,562 1,520
Columbus 1,278 1,253 1,051 1,261 1,291 1,280 1,298 1,260
3A1 3B1 3C1 3D1 4A1 4A2 4A3 4B1
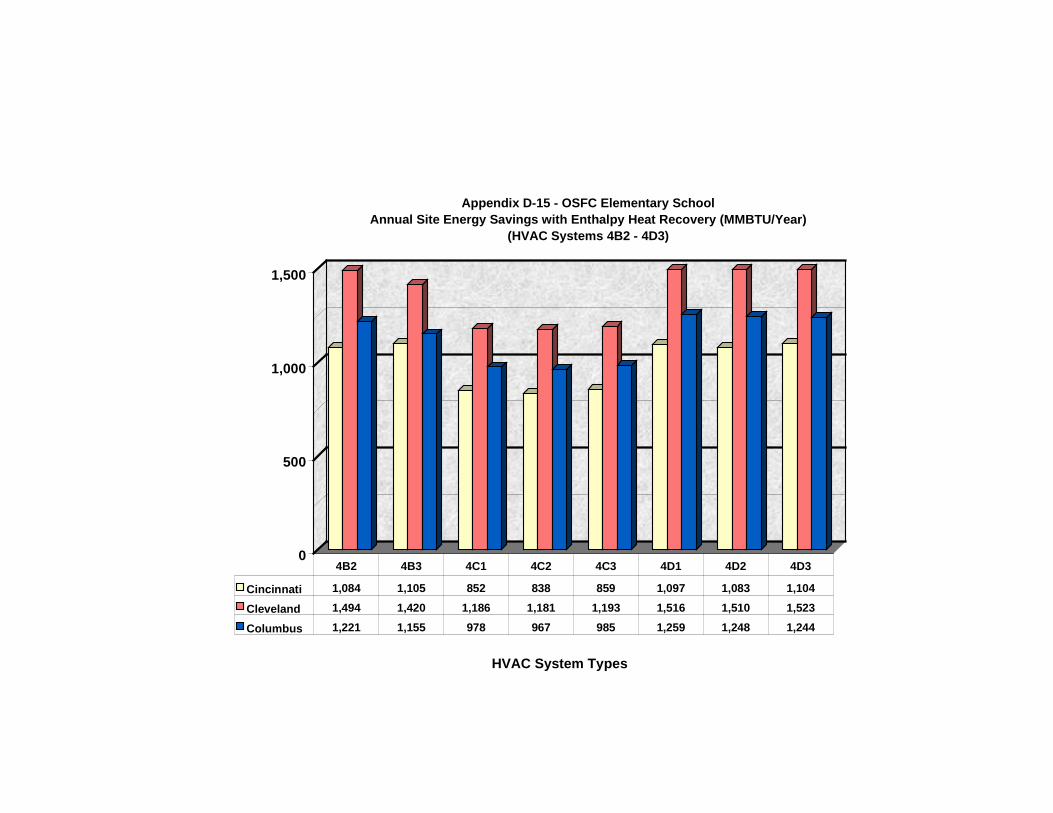
0
500
1,000
1,500
HVAC System Types
Appendix D-15 - OSFC Elementary School Annual Site Energy Savings with Enthalpy Heat Recovery (MMBTU/Year)
(HVAC Systems 4B2 - 4D3)
Cincinnati 1,084 1,105 852 838 859 1,097 1,083 1,104
Cleveland 1,494 1,420 1,186 1,181 1,193 1,516 1,510 1,523
Columbus 1,221 1,155 978 967 985 1,259 1,248 1,244
4B2 4B3 4C1 4C2 4C3 4D1 4D2 4D3
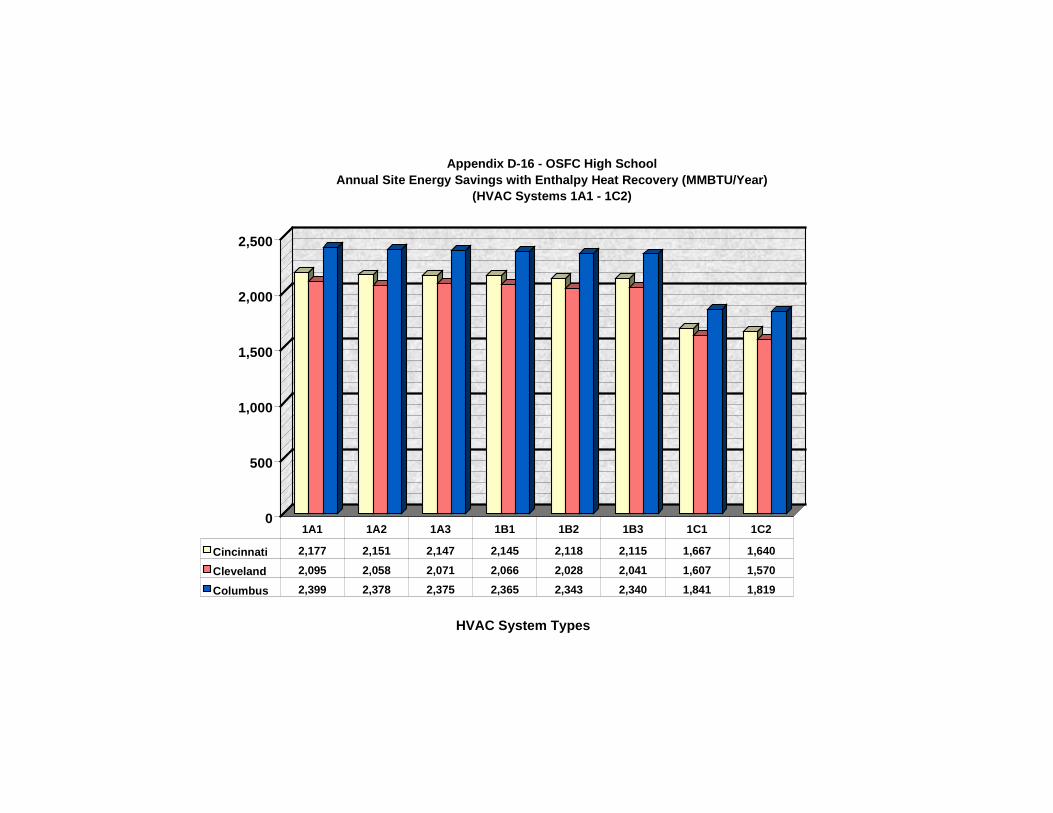
0
500
1,000
1,500
2,000
2,500
HVAC System Types
Appendix D-16 - OSFC High School Annual Site Energy Savings with Enthalpy Heat Recovery (MMBTU/Year)
(HVAC Systems 1A1 - 1C2)
Cincinnati 2,177 2,151 2,147 2,145 2,118 2,115 1,667 1,640
Cleveland 2,095 2,058 2,071 2,066 2,028 2,041 1,607 1,570
Columbus 2,399 2,378 2,375 2,365 2,343 2,340 1,841 1,819
1A1 1A2 1A3 1B1 1B2 1B3 1C1 1C2
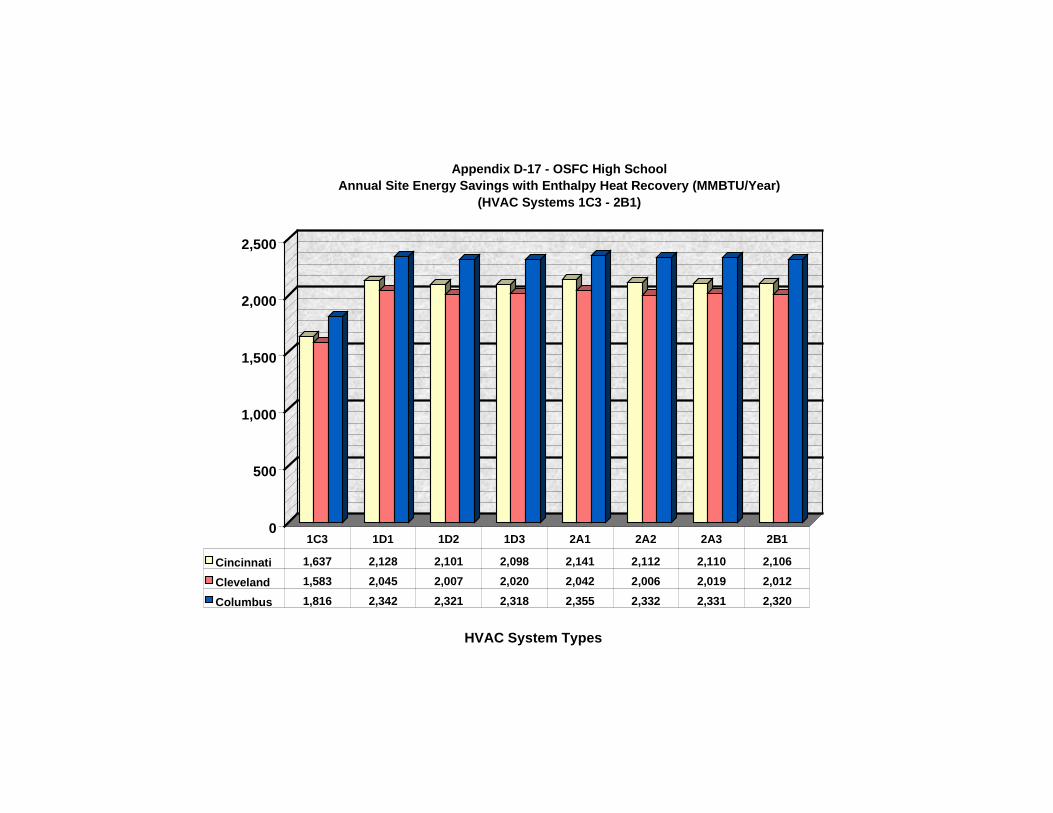
0
500
1,000
1,500
2,000
2,500
HVAC System Types
Appendix D-17 - OSFC High School Annual Site Energy Savings with Enthalpy Heat Recovery (MMBTU/Year)
(HVAC Systems 1C3 - 2B1)
Cincinnati 1,637 2,128 2,101 2,098 2,141 2,112 2,110 2,106
Cleveland 1,583 2,045 2,007 2,020 2,042 2,006 2,019 2,012
Columbus 1,816 2,342 2,321 2,318 2,355 2,332 2,331 2,320
1C3 1D1 1D2 1D3 2A1 2A2 2A3 2B1
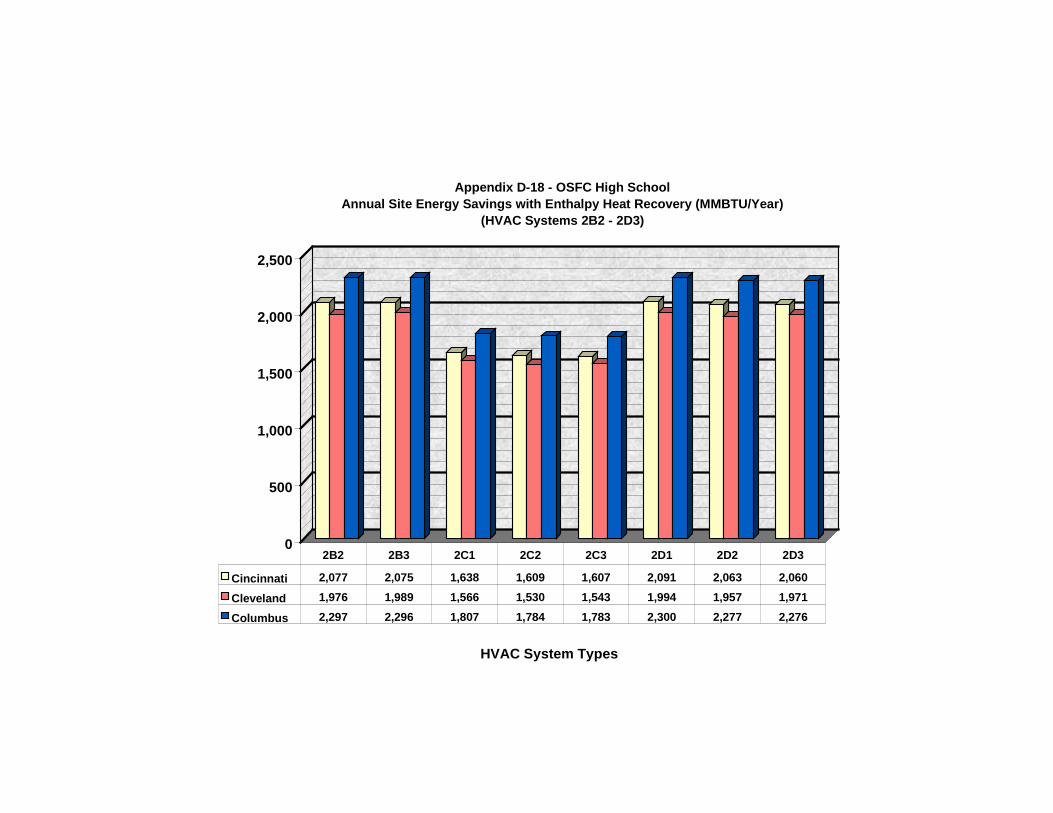
0
500
1,000
1,500
2,000
2,500
HVAC System Types
Appendix D-18 - OSFC High School Annual Site Energy Savings with Enthalpy Heat Recovery (MMBTU/Year)
(HVAC Systems 2B2 - 2D3)
Cincinnati 2,077 2,075 1,638 1,609 1,607 2,091 2,063 2,060
Cleveland 1,976 1,989 1,566 1,530 1,543 1,994 1,957 1,971
Columbus 2,297 2,296 1,807 1,784 1,783 2,300 2,277 2,276
2B2 2B3 2C1 2C2 2C3 2D1 2D2 2D3
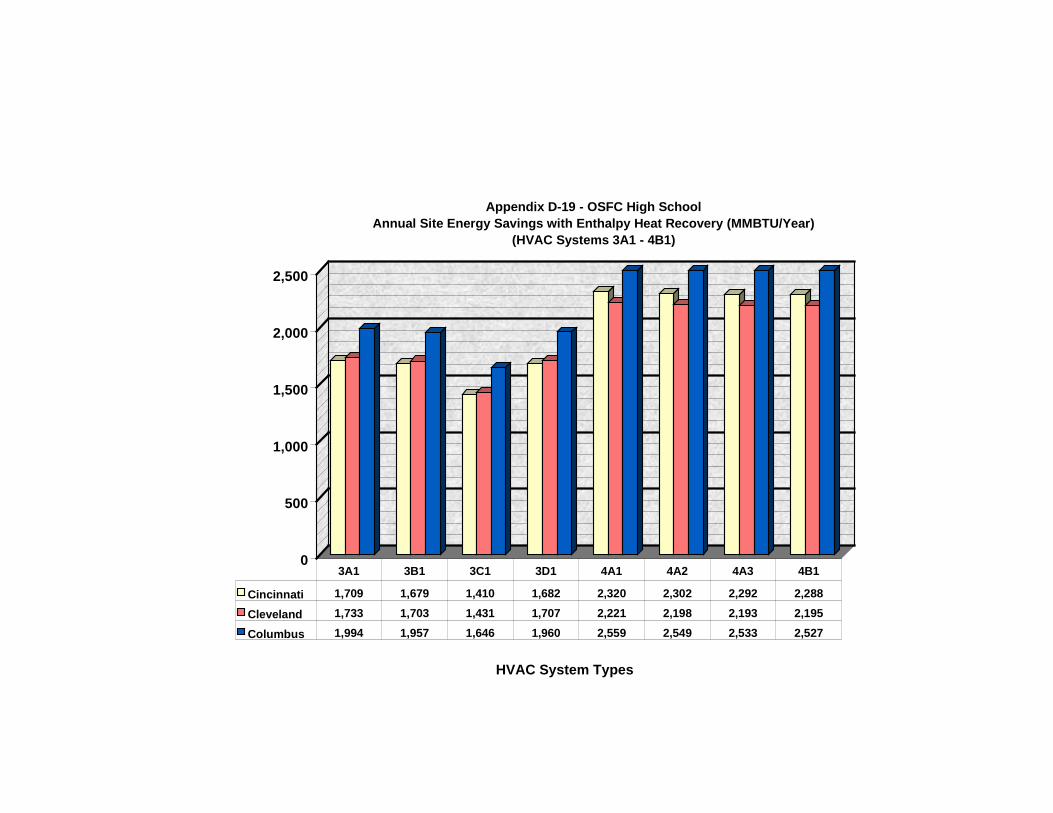
0
500
1,000
1,500
2,000
2,500
HVAC System Types
Appendix D-19 - OSFC High School Annual Site Energy Savings with Enthalpy Heat Recovery (MMBTU/Year)
(HVAC Systems 3A1 - 4B1)
Cincinnati 1,709 1,679 1,410 1,682 2,320 2,302 2,292 2,288
Cleveland 1,733 1,703 1,431 1,707 2,221 2,198 2,193 2,195
Columbus 1,994 1,957 1,646 1,960 2,559 2,549 2,533 2,527
3A1 3B1 3C1 3D1 4A1 4A2 4A3 4B1
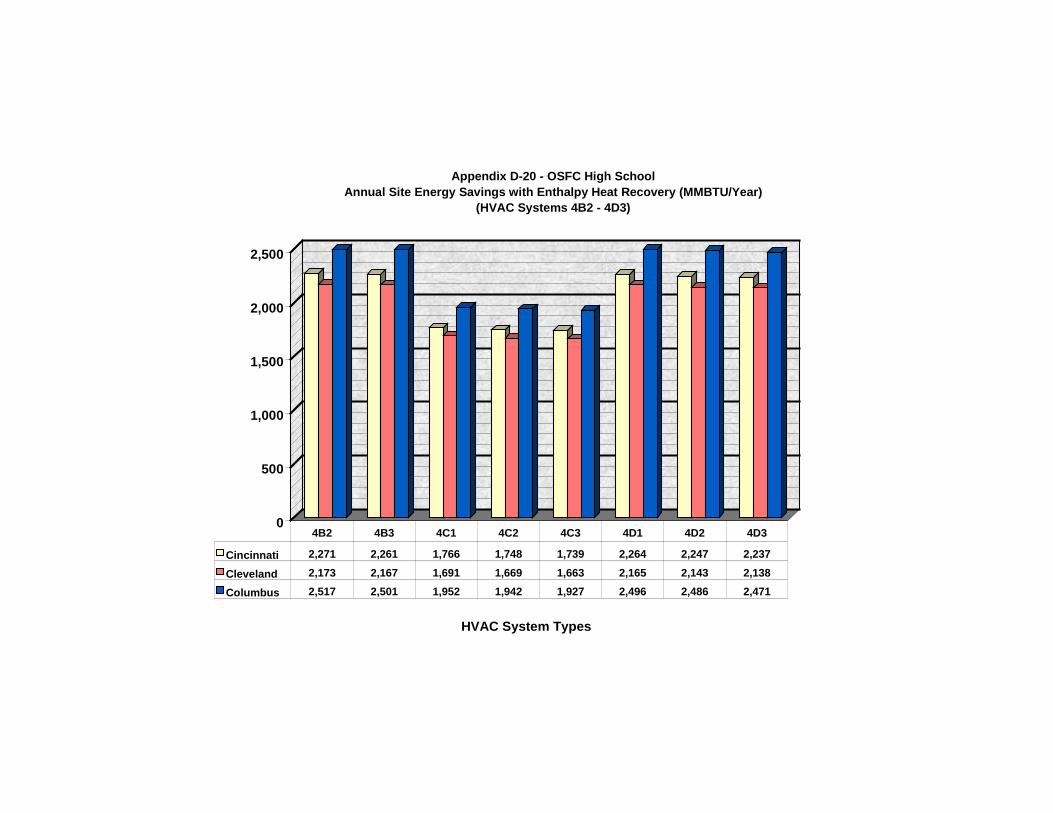
0
500
1,000
1,500
2,000
2,500
HVAC System Types
Appendix D-20 - OSFC High School Annual Site Energy Savings with Enthalpy Heat Recovery (MMBTU/Year)
(HVAC Systems 4B2 - 4D3)
Cincinnati 2,271 2,261 1,766 1,748 1,739 2,264 2,247 2,237
Cleveland 2,173 2,167 1,691 1,669 1,663 2,165 2,143 2,138
Columbus 2,517 2,501 1,952 1,942 1,927 2,496 2,486 2,471
4B2 4B3 4C1 4C2 4C3 4D1 4D2 4D3
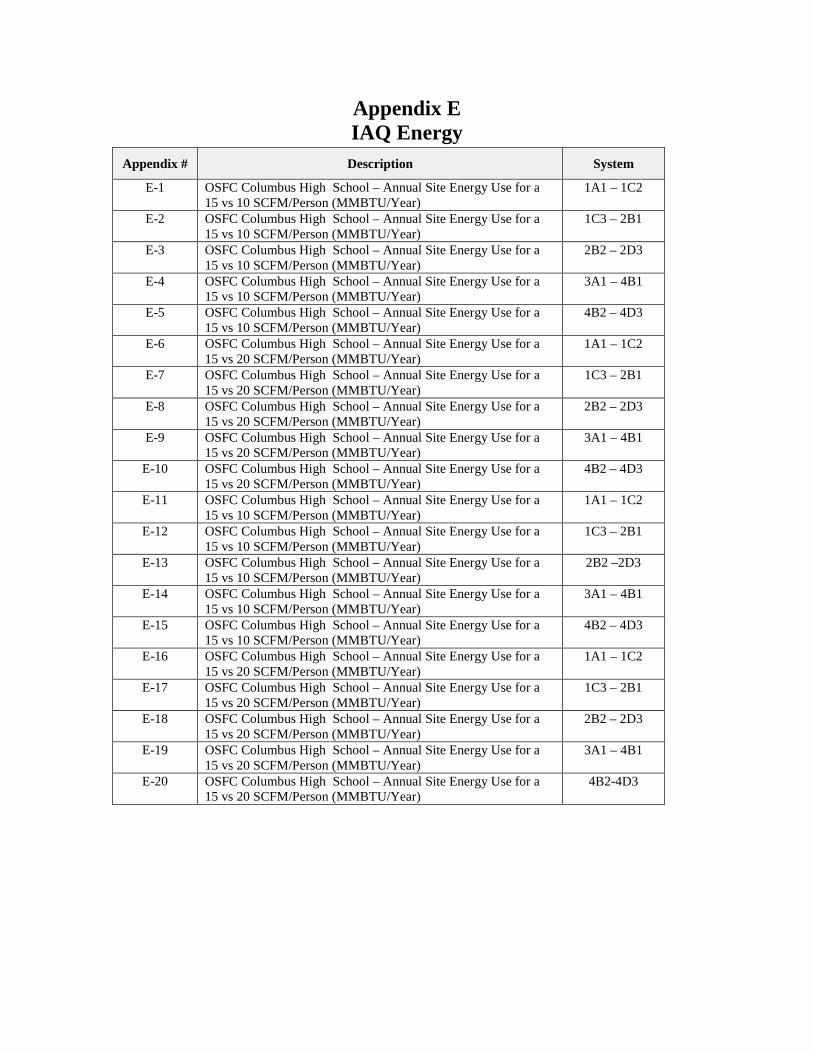
Appendix EIAQ Energy
Appendix # Description System
E-1 OSFC Columbus High School – Annual Site Energy Use for a15 vs 10 SCFM/Person (MMBTU/Year)
1A1 – 1C2
E-2 OSFC Columbus High School – Annual Site Energy Use for a15 vs 10 SCFM/Person (MMBTU/Year)
1C3 – 2B1
E-3 OSFC Columbus High School – Annual Site Energy Use for a15 vs 10 SCFM/Person (MMBTU/Year)
2B2 – 2D3
E-4 OSFC Columbus High School – Annual Site Energy Use for a15 vs 10 SCFM/Person (MMBTU/Year)
3A1 – 4B1
E-5 OSFC Columbus High School – Annual Site Energy Use for a15 vs 10 SCFM/Person (MMBTU/Year)
4B2 – 4D3
E-6 OSFC Columbus High School – Annual Site Energy Use for a15 vs 20 SCFM/Person (MMBTU/Year)
1A1 – 1C2
E-7 OSFC Columbus High School – Annual Site Energy Use for a15 vs 20 SCFM/Person (MMBTU/Year)
1C3 – 2B1
E-8 OSFC Columbus High School – Annual Site Energy Use for a15 vs 20 SCFM/Person (MMBTU/Year)
2B2 – 2D3
E-9 OSFC Columbus High School – Annual Site Energy Use for a15 vs 20 SCFM/Person (MMBTU/Year)
3A1 – 4B1
E-10 OSFC Columbus High School – Annual Site Energy Use for a15 vs 20 SCFM/Person (MMBTU/Year)
4B2 – 4D3
E-11 OSFC Columbus High School – Annual Site Energy Use for a15 vs 10 SCFM/Person (MMBTU/Year)
1A1 – 1C2
E-12 OSFC Columbus High School – Annual Site Energy Use for a15 vs 10 SCFM/Person (MMBTU/Year)
1C3 – 2B1
E-13 OSFC Columbus High School – Annual Site Energy Use for a15 vs 10 SCFM/Person (MMBTU/Year)
2B2 –2D3
E-14 OSFC Columbus High School – Annual Site Energy Use for a15 vs 10 SCFM/Person (MMBTU/Year)
3A1 – 4B1
E-15 OSFC Columbus High School – Annual Site Energy Use for a15 vs 10 SCFM/Person (MMBTU/Year)
4B2 – 4D3
E-16 OSFC Columbus High School – Annual Site Energy Use for a15 vs 20 SCFM/Person (MMBTU/Year)
1A1 – 1C2
E-17 OSFC Columbus High School – Annual Site Energy Use for a15 vs 20 SCFM/Person (MMBTU/Year)
1C3 – 2B1
E-18 OSFC Columbus High School – Annual Site Energy Use for a15 vs 20 SCFM/Person (MMBTU/Year)
2B2 – 2D3
E-19 OSFC Columbus High School – Annual Site Energy Use for a15 vs 20 SCFM/Person (MMBTU/Year)
3A1 – 4B1
E-20 OSFC Columbus High School – Annual Site Energy Use for a15 vs 20 SCFM/Person (MMBTU/Year)
4B2-4D3
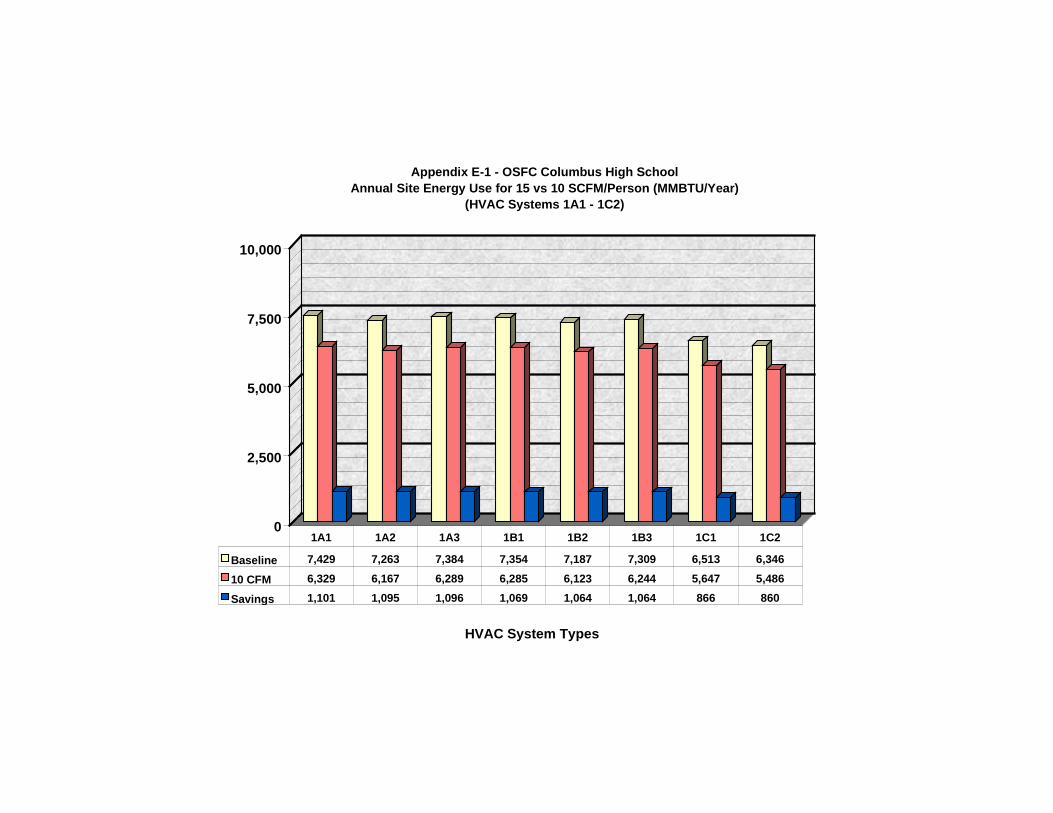
0
2,500
5,000
7,500
10,000
HVAC System Types
Appendix E-1 - OSFC Columbus High School Annual Site Energy Use for 15 vs 10 SCFM/Person (MMBTU/Year)
(HVAC Systems 1A1 - 1C2)
Baseline 7,429 7,263 7,384 7,354 7,187 7,309 6,513 6,346
10 CFM 6,329 6,167 6,289 6,285 6,123 6,244 5,647 5,486
Savings 1,101 1,095 1,096 1,069 1,064 1,064 866 860
1A1 1A2 1A3 1B1 1B2 1B3 1C1 1C2
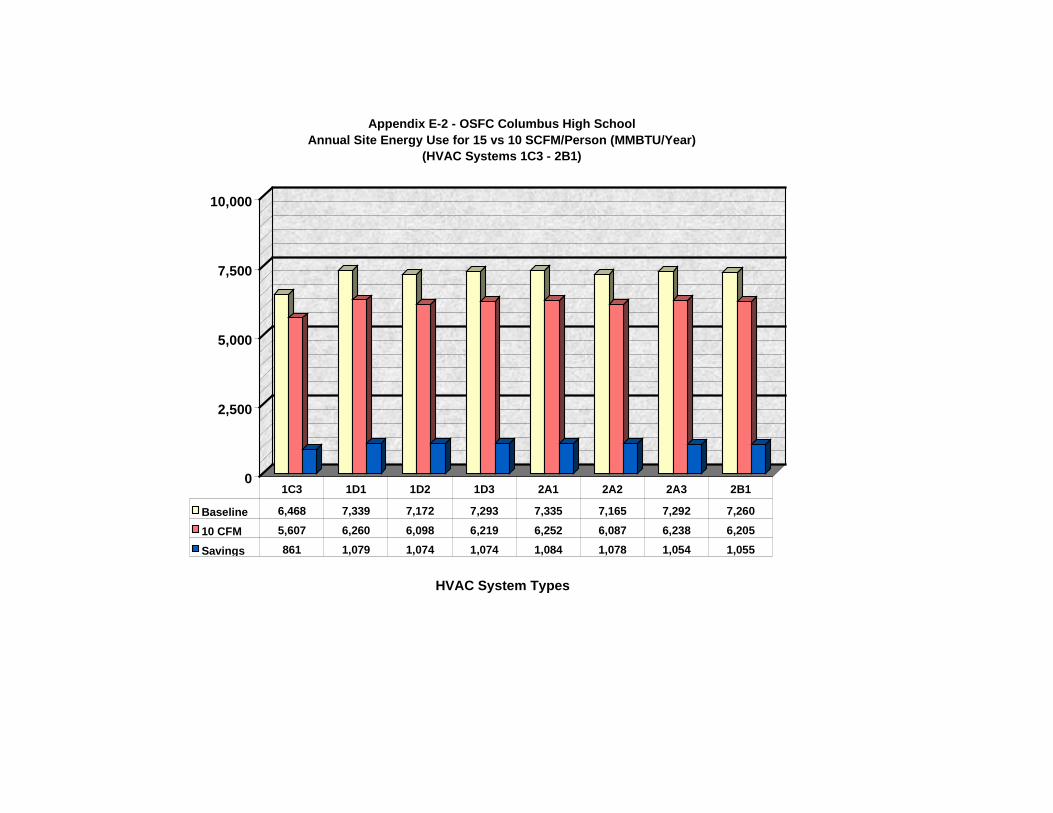
0
2,500
5,000
7,500
10,000
HVAC System Types
Appendix E-2 - OSFC Columbus High School Annual Site Energy Use for 15 vs 10 SCFM/Person (MMBTU/Year)
(HVAC Systems 1C3 - 2B1)
Baseline 6,468 7,339 7,172 7,293 7,335 7,165 7,292 7,260
10 CFM 5,607 6,260 6,098 6,219 6,252 6,087 6,238 6,205
Savings 861 1,079 1,074 1,074 1,084 1,078 1,054 1,055
1C3 1D1 1D2 1D3 2A1 2A2 2A3 2B1
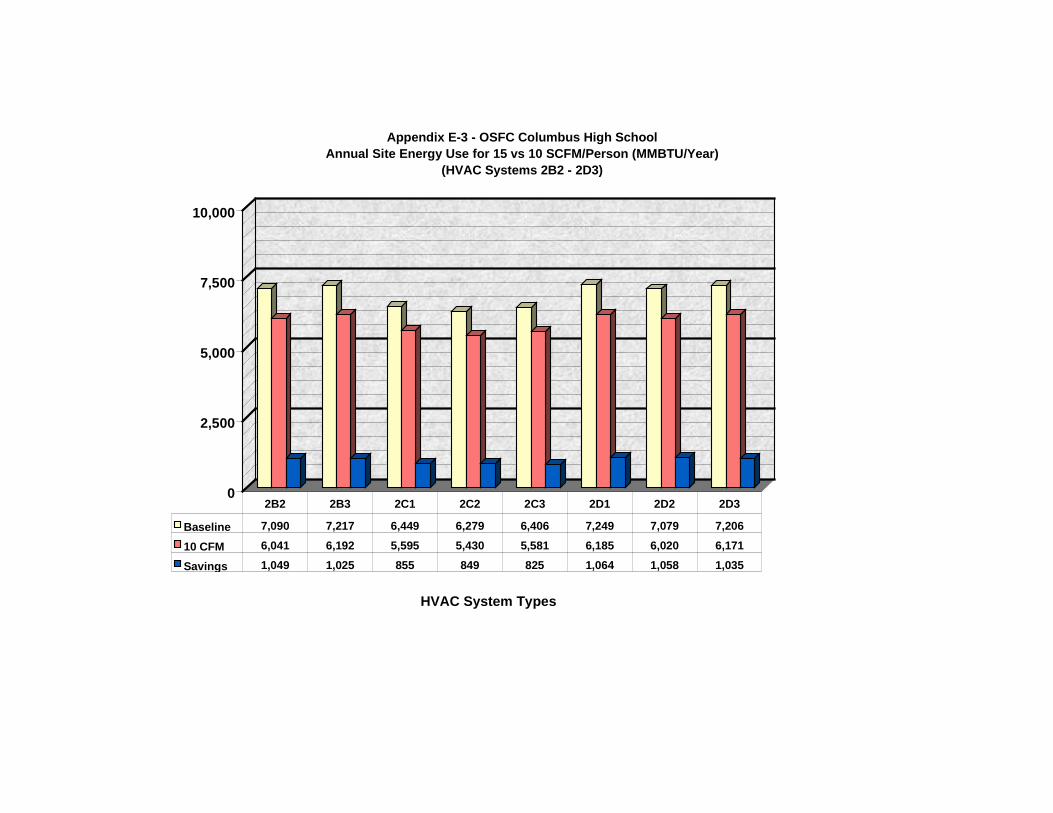
0
2,500
5,000
7,500
10,000
HVAC System Types
Appendix E-3 - OSFC Columbus High School Annual Site Energy Use for 15 vs 10 SCFM/Person (MMBTU/Year)
(HVAC Systems 2B2 - 2D3)
Baseline 7,090 7,217 6,449 6,279 6,406 7,249 7,079 7,206
10 CFM 6,041 6,192 5,595 5,430 5,581 6,185 6,020 6,171
Savings 1,049 1,025 855 849 825 1,064 1,058 1,035
2B2 2B3 2C1 2C2 2C3 2D1 2D2 2D3
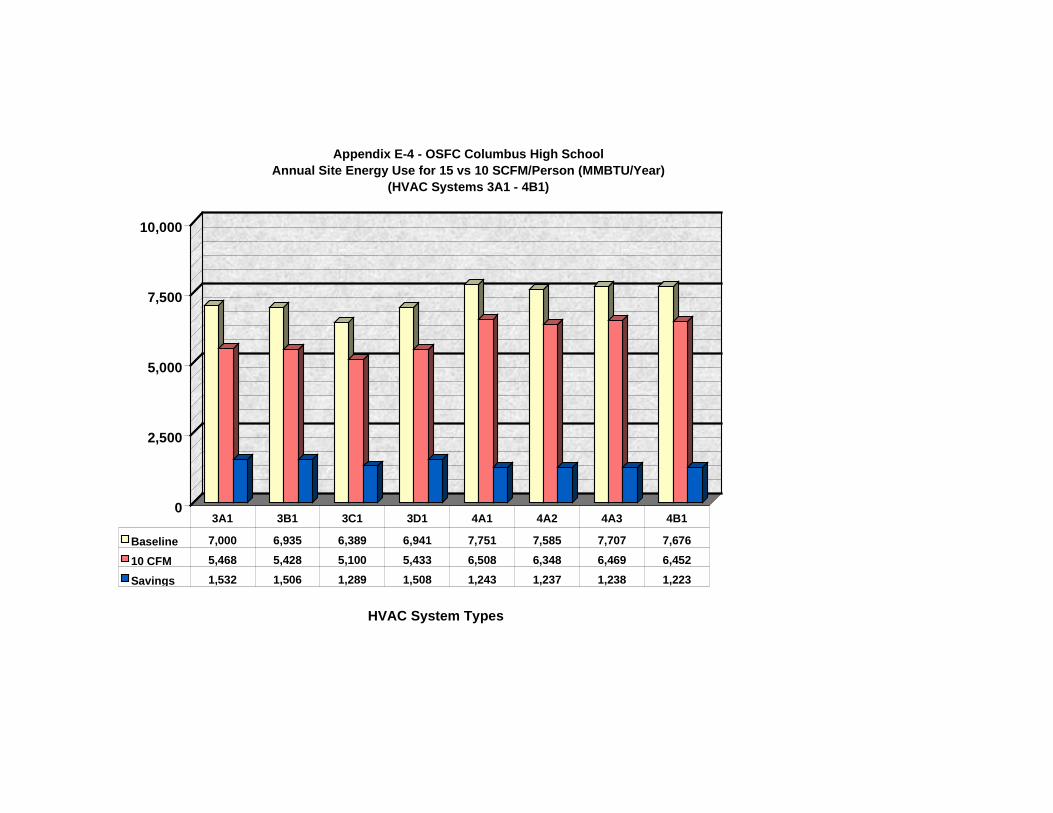
0
2,500
5,000
7,500
10,000
HVAC System Types
Appendix E-4 - OSFC Columbus High School Annual Site Energy Use for 15 vs 10 SCFM/Person (MMBTU/Year)
(HVAC Systems 3A1 - 4B1)
Baseline 7,000 6,935 6,389 6,941 7,751 7,585 7,707 7,676
10 CFM 5,468 5,428 5,100 5,433 6,508 6,348 6,469 6,452
Savings 1,532 1,506 1,289 1,508 1,243 1,237 1,238 1,223
3A1 3B1 3C1 3D1 4A1 4A2 4A3 4B1
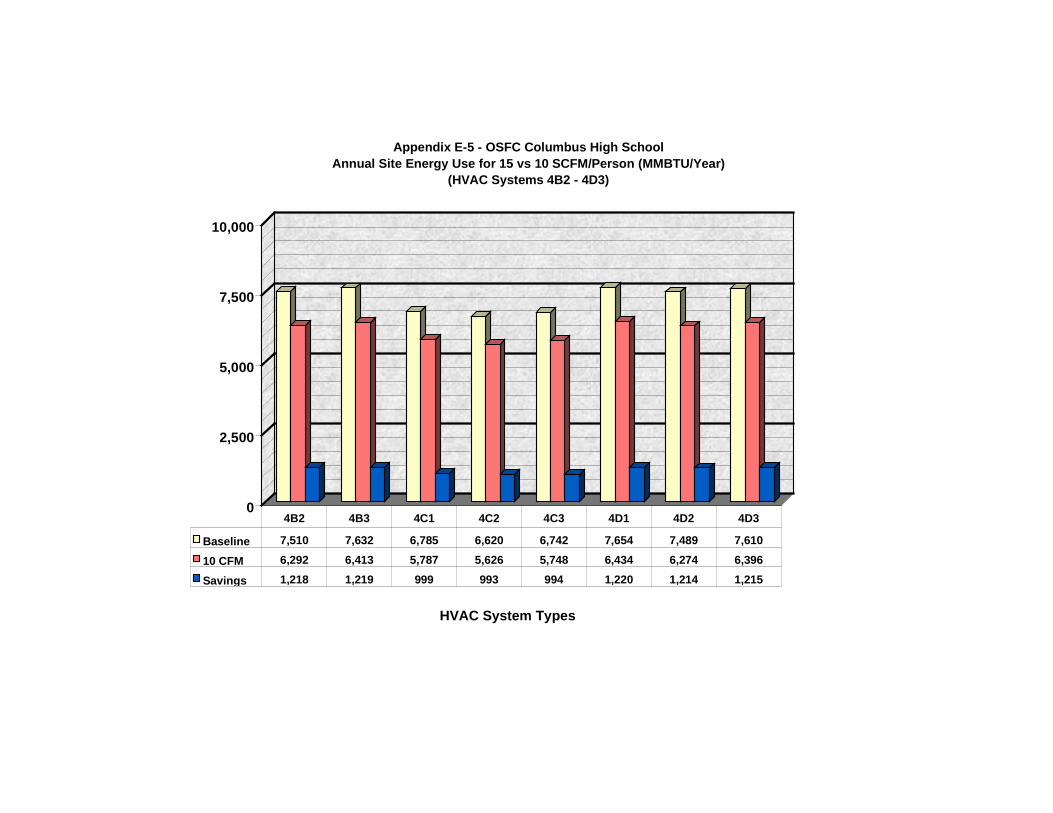
0
2,500
5,000
7,500
10,000
HVAC System Types
Appendix E-5 - OSFC Columbus High School Annual Site Energy Use for 15 vs 10 SCFM/Person (MMBTU/Year)
(HVAC Systems 4B2 - 4D3)
Baseline 7,510 7,632 6,785 6,620 6,742 7,654 7,489 7,610
10 CFM 6,292 6,413 5,787 5,626 5,748 6,434 6,274 6,396
Savings 1,218 1,219 999 993 994 1,220 1,214 1,215
4B2 4B3 4C1 4C2 4C3 4D1 4D2 4D3
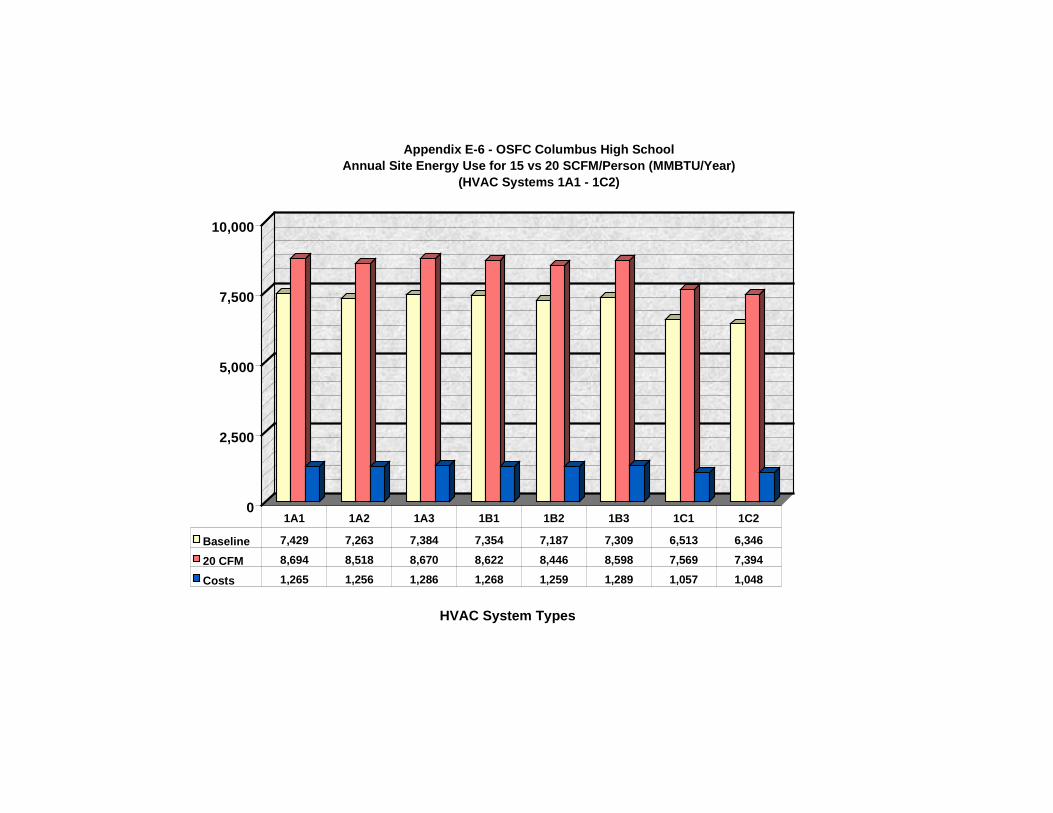
0
2,500
5,000
7,500
10,000
HVAC System Types
Appendix E-6 - OSFC Columbus High School Annual Site Energy Use for 15 vs 20 SCFM/Person (MMBTU/Year)
(HVAC Systems 1A1 - 1C2)
Baseline 7,429 7,263 7,384 7,354 7,187 7,309 6,513 6,346
20 CFM 8,694 8,518 8,670 8,622 8,446 8,598 7,569 7,394
Costs 1,265 1,256 1,286 1,268 1,259 1,289 1,057 1,048
1A1 1A2 1A3 1B1 1B2 1B3 1C1 1C2
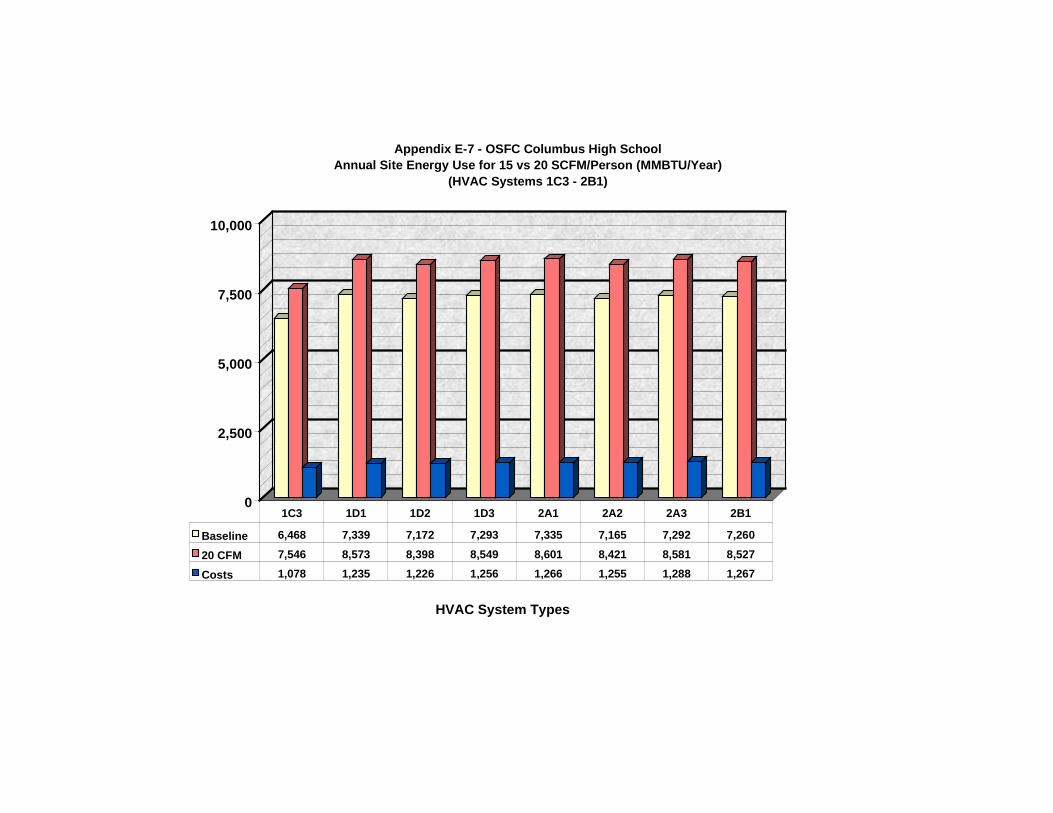
0
2,500
5,000
7,500
10,000
HVAC System Types
Appendix E-7 - OSFC Columbus High School Annual Site Energy Use for 15 vs 20 SCFM/Person (MMBTU/Year)
(HVAC Systems 1C3 - 2B1)
Baseline 6,468 7,339 7,172 7,293 7,335 7,165 7,292 7,260
20 CFM 7,546 8,573 8,398 8,549 8,601 8,421 8,581 8,527
Costs 1,078 1,235 1,226 1,256 1,266 1,255 1,288 1,267
1C3 1D1 1D2 1D3 2A1 2A2 2A3 2B1
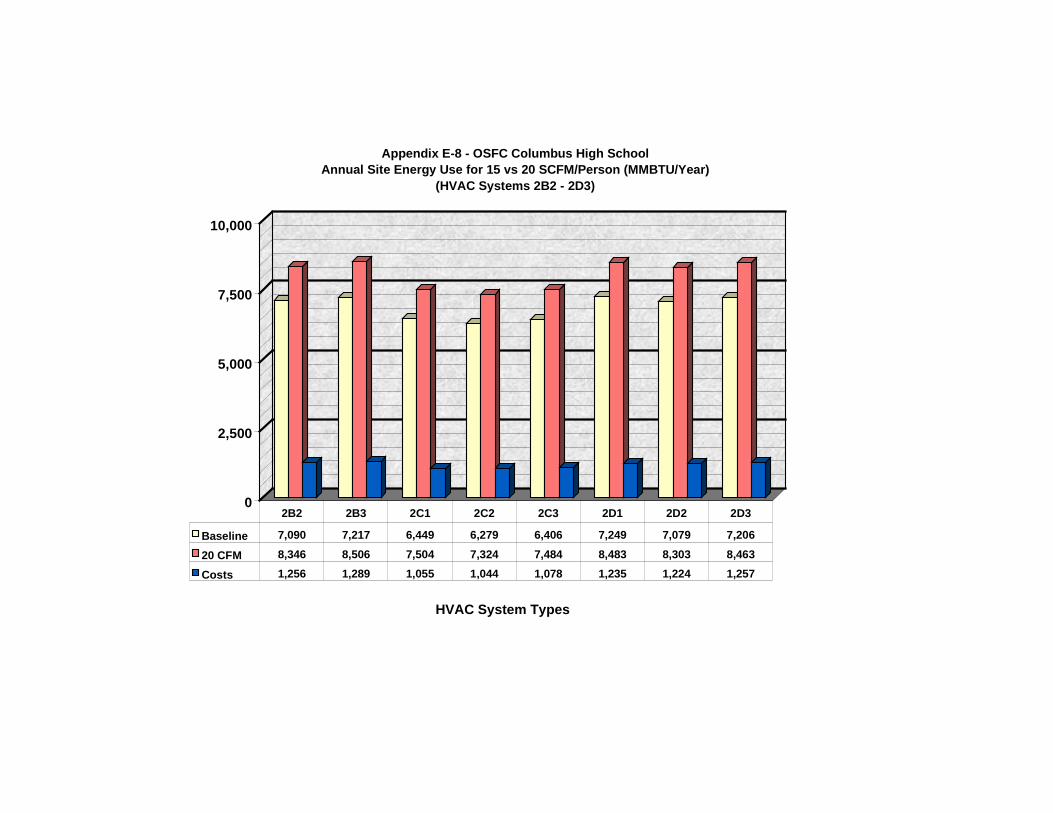
0
2,500
5,000
7,500
10,000
HVAC System Types
Appendix E-8 - OSFC Columbus High School Annual Site Energy Use for 15 vs 20 SCFM/Person (MMBTU/Year)
(HVAC Systems 2B2 - 2D3)
Baseline 7,090 7,217 6,449 6,279 6,406 7,249 7,079 7,206
20 CFM 8,346 8,506 7,504 7,324 7,484 8,483 8,303 8,463
Costs 1,256 1,289 1,055 1,044 1,078 1,235 1,224 1,257
2B2 2B3 2C1 2C2 2C3 2D1 2D2 2D3
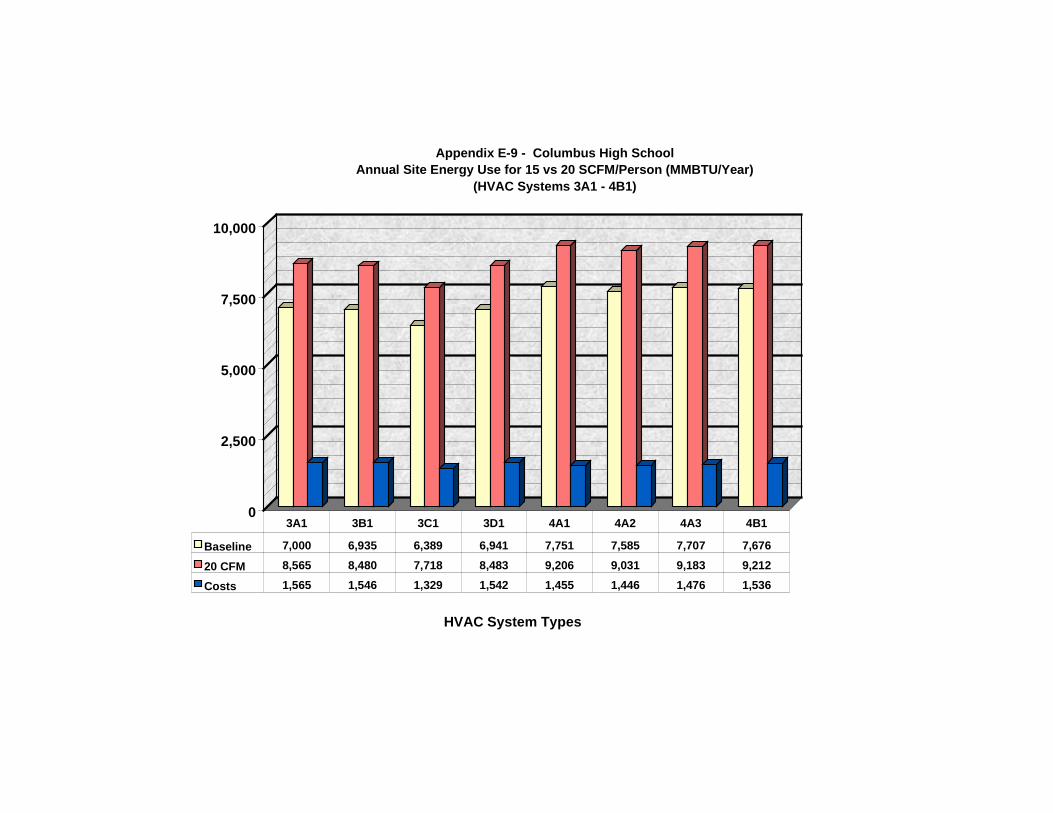
0
2,500
5,000
7,500
10,000
HVAC System Types
Appendix E-9 - Columbus High School Annual Site Energy Use for 15 vs 20 SCFM/Person (MMBTU/Year)
(HVAC Systems 3A1 - 4B1)
Baseline 7,000 6,935 6,389 6,941 7,751 7,585 7,707 7,676
20 CFM 8,565 8,480 7,718 8,483 9,206 9,031 9,183 9,212
Costs 1,565 1,546 1,329 1,542 1,455 1,446 1,476 1,536
3A1 3B1 3C1 3D1 4A1 4A2 4A3 4B1
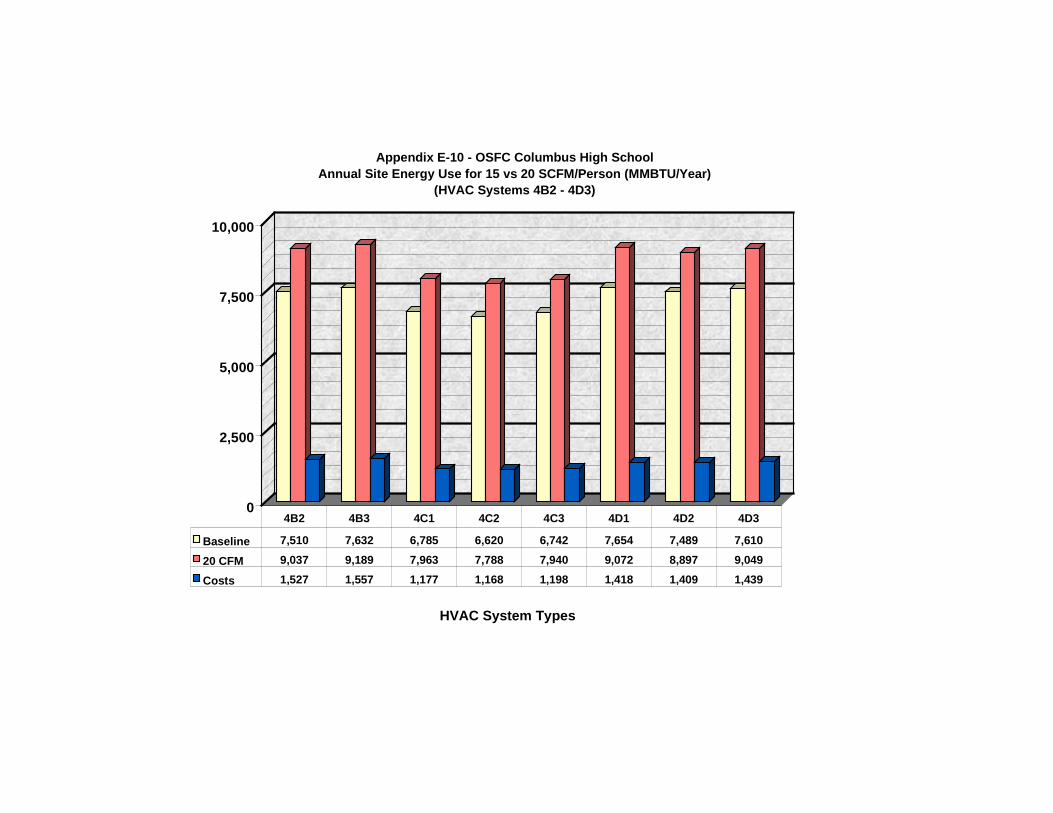
0
2,500
5,000
7,500
10,000
HVAC System Types
Appendix E-10 - OSFC Columbus High School Annual Site Energy Use for 15 vs 20 SCFM/Person (MMBTU/Year)
(HVAC Systems 4B2 - 4D3)
Baseline 7,510 7,632 6,785 6,620 6,742 7,654 7,489 7,610
20 CFM 9,037 9,189 7,963 7,788 7,940 9,072 8,897 9,049
Costs 1,527 1,557 1,177 1,168 1,198 1,418 1,409 1,439
4B2 4B3 4C1 4C2 4C3 4D1 4D2 4D3
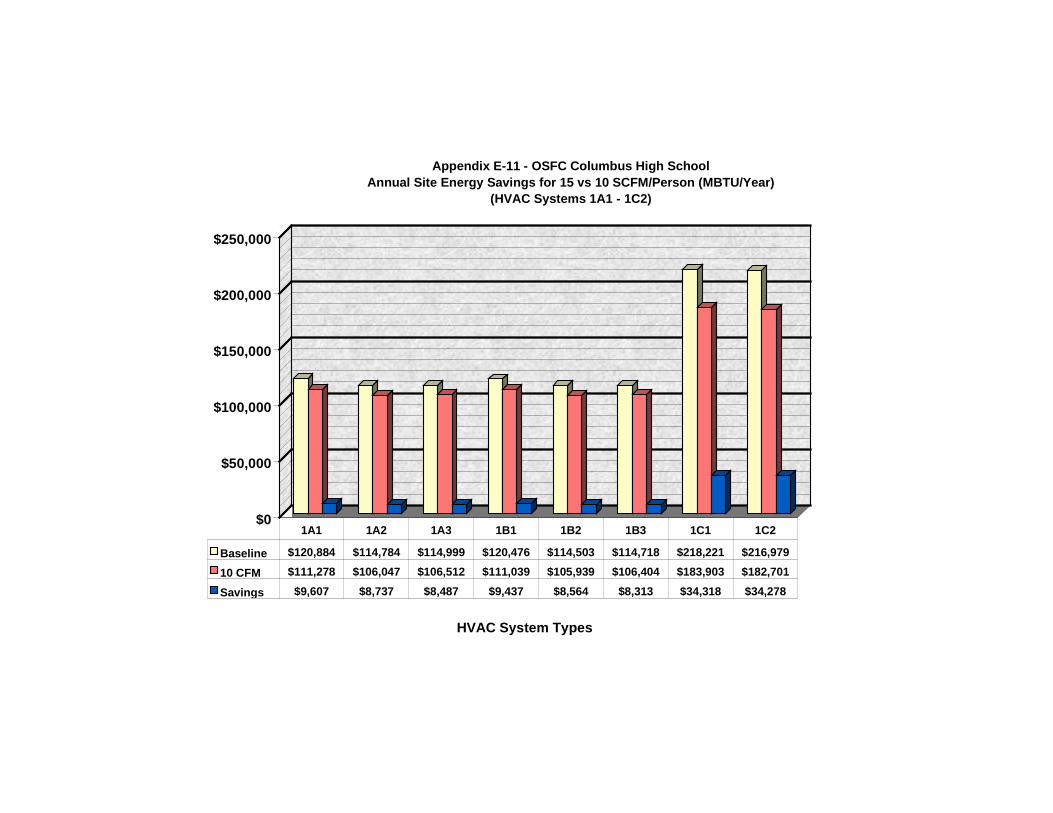
$0
$50,000
$100,000
$150,000
$200,000
$250,000
HVAC System Types
Appendix E-11 - OSFC Columbus High School Annual Site Energy Savings for 15 vs 10 SCFM/Person (MBTU/Year)
(HVAC Systems 1A1 - 1C2)
Baseline $120,884 $114,784 $114,999 $120,476 $114,503 $114,718 $218,221 $216,979
10 CFM $111,278 $106,047 $106,512 $111,039 $105,939 $106,404 $183,903 $182,701
Savings $9,607 $8,737 $8,487 $9,437 $8,564 $8,313 $34,318 $34,278
1A1 1A2 1A3 1B1 1B2 1B3 1C1 1C2
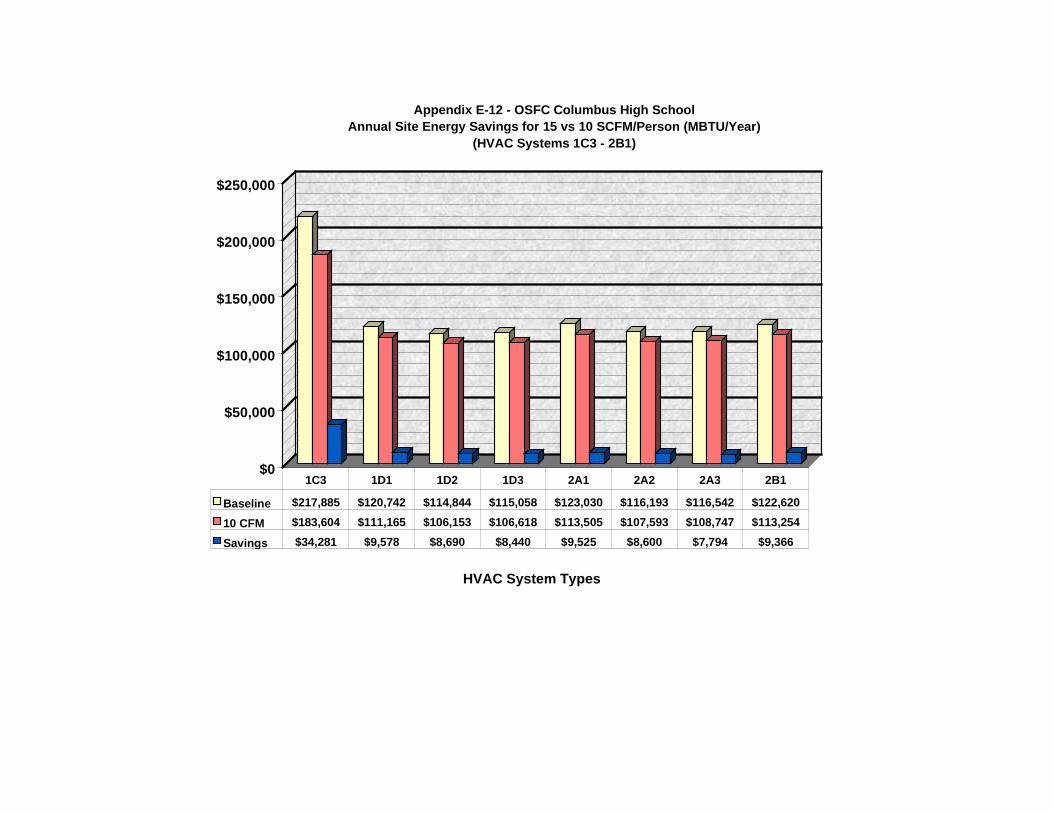
$0
$50,000
$100,000
$150,000
$200,000
$250,000
HVAC System Types
Appendix E-12 - OSFC Columbus High School Annual Site Energy Savings for 15 vs 10 SCFM/Person (MBTU/Year)
(HVAC Systems 1C3 - 2B1)
Baseline $217,885 $120,742 $114,844 $115,058 $123,030 $116,193 $116,542 $122,620
10 CFM $183,604 $111,165 $106,153 $106,618 $113,505 $107,593 $108,747 $113,254
Savings $34,281 $9,578 $8,690 $8,440 $9,525 $8,600 $7,794 $9,366
1C3 1D1 1D2 1D3 2A1 2A2 2A3 2B1
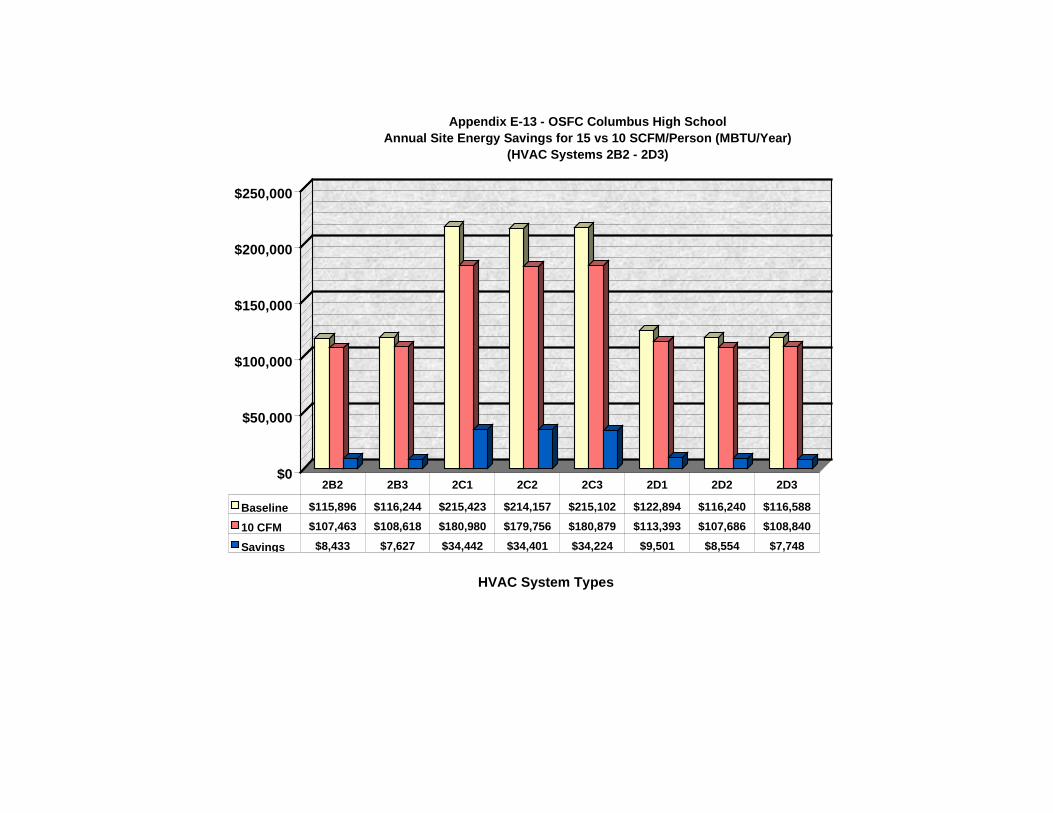
$0
$50,000
$100,000
$150,000
$200,000
$250,000
HVAC System Types
Appendix E-13 - OSFC Columbus High School Annual Site Energy Savings for 15 vs 10 SCFM/Person (MBTU/Year)
(HVAC Systems 2B2 - 2D3)
Baseline $115,896 $116,244 $215,423 $214,157 $215,102 $122,894 $116,240 $116,588
10 CFM $107,463 $108,618 $180,980 $179,756 $180,879 $113,393 $107,686 $108,840
Savings $8,433 $7,627 $34,442 $34,401 $34,224 $9,501 $8,554 $7,748
2B2 2B3 2C1 2C2 2C3 2D1 2D2 2D3
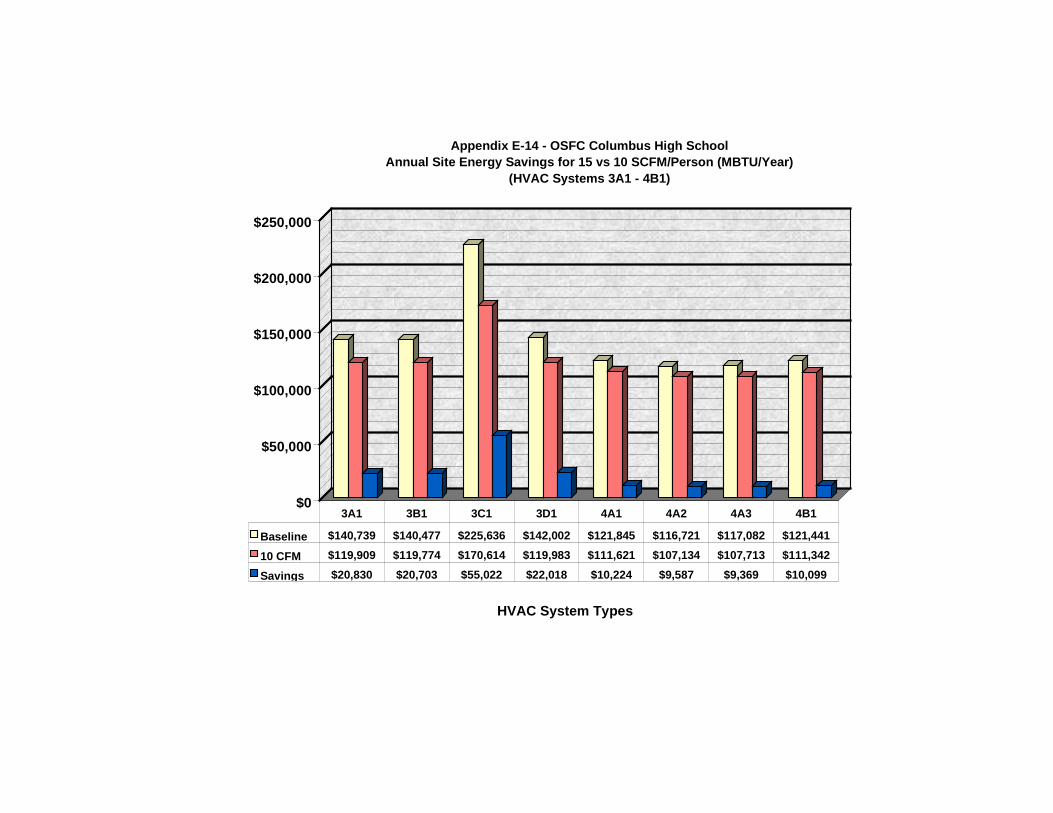
$0
$50,000
$100,000
$150,000
$200,000
$250,000
HVAC System Types
Appendix E-14 - OSFC Columbus High School Annual Site Energy Savings for 15 vs 10 SCFM/Person (MBTU/Year)
(HVAC Systems 3A1 - 4B1)
Baseline $140,739 $140,477 $225,636 $142,002 $121,845 $116,721 $117,082 $121,441
10 CFM $119,909 $119,774 $170,614 $119,983 $111,621 $107,134 $107,713 $111,342
Savings $20,830 $20,703 $55,022 $22,018 $10,224 $9,587 $9,369 $10,099
3A1 3B1 3C1 3D1 4A1 4A2 4A3 4B1
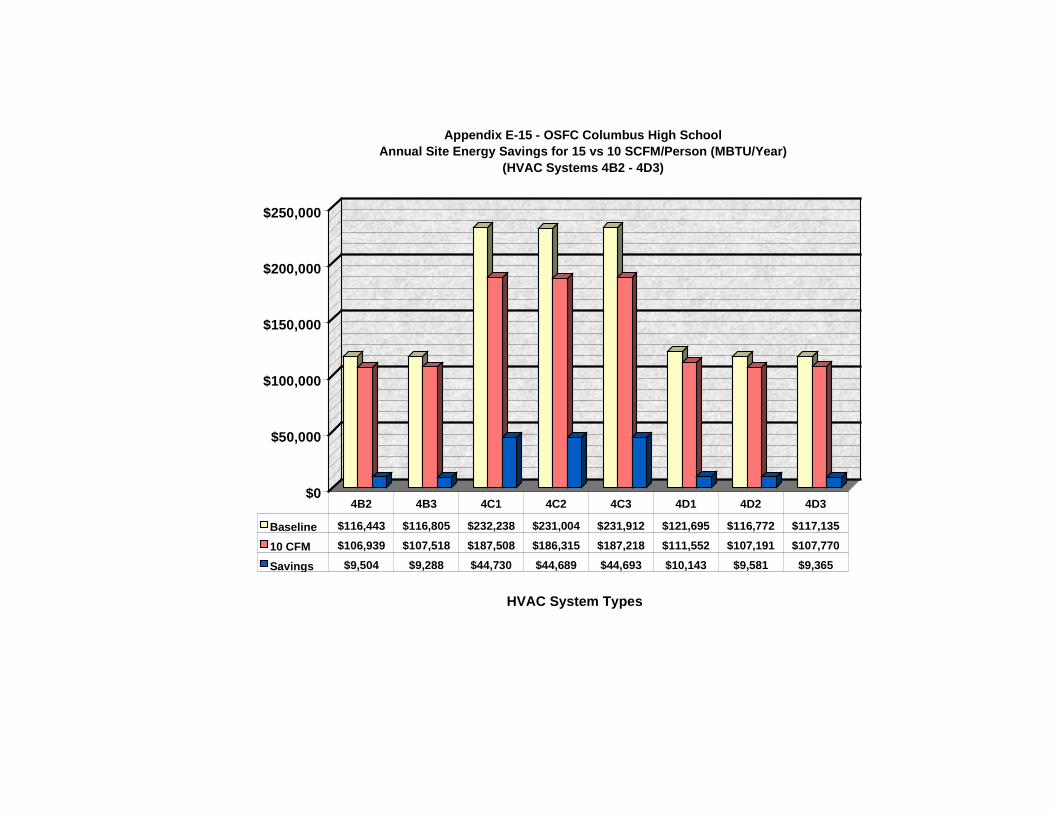
$0
$50,000
$100,000
$150,000
$200,000
$250,000
HVAC System Types
Appendix E-15 - OSFC Columbus High School Annual Site Energy Savings for 15 vs 10 SCFM/Person (MBTU/Year)
(HVAC Systems 4B2 - 4D3)
Baseline $116,443 $116,805 $232,238 $231,004 $231,912 $121,695 $116,772 $117,135
10 CFM $106,939 $107,518 $187,508 $186,315 $187,218 $111,552 $107,191 $107,770
Savings $9,504 $9,288 $44,730 $44,689 $44,693 $10,143 $9,581 $9,365
4B2 4B3 4C1 4C2 4C3 4D1 4D2 4D3
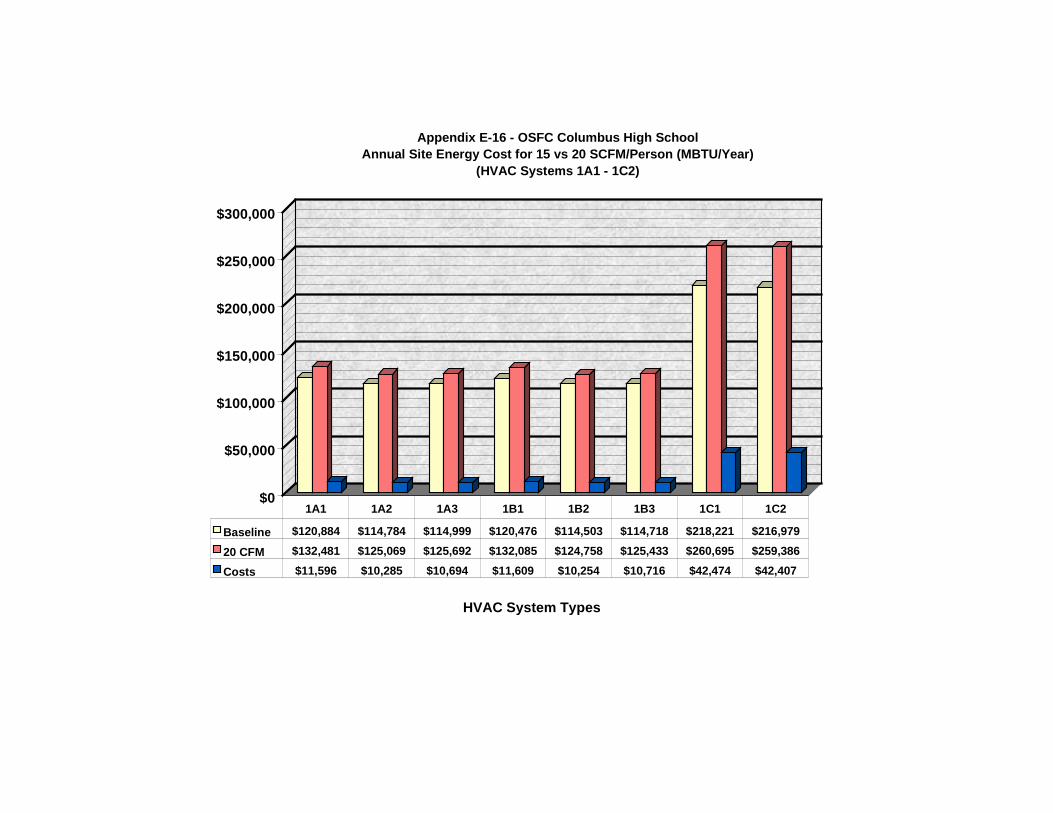
$0
$50,000
$100,000
$150,000
$200,000
$250,000
$300,000
HVAC System Types
Appendix E-16 - OSFC Columbus High School Annual Site Energy Cost for 15 vs 20 SCFM/Person (MBTU/Year)
(HVAC Systems 1A1 - 1C2)
Baseline $120,884 $114,784 $114,999 $120,476 $114,503 $114,718 $218,221 $216,979
20 CFM $132,481 $125,069 $125,692 $132,085 $124,758 $125,433 $260,695 $259,386
Costs $11,596 $10,285 $10,694 $11,609 $10,254 $10,716 $42,474 $42,407
1A1 1A2 1A3 1B1 1B2 1B3 1C1 1C2
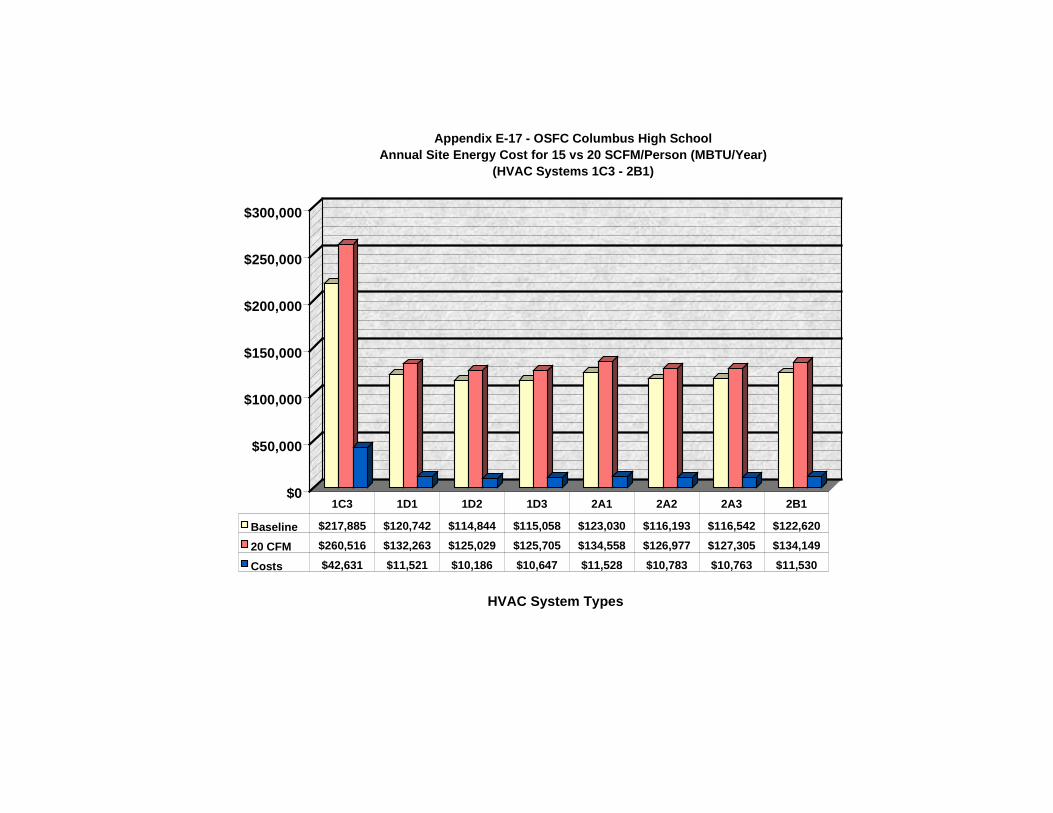
$0
$50,000
$100,000
$150,000
$200,000
$250,000
$300,000
HVAC System Types
Appendix E-17 - OSFC Columbus High School Annual Site Energy Cost for 15 vs 20 SCFM/Person (MBTU/Year)
(HVAC Systems 1C3 - 2B1)
Baseline $217,885 $120,742 $114,844 $115,058 $123,030 $116,193 $116,542 $122,620
20 CFM $260,516 $132,263 $125,029 $125,705 $134,558 $126,977 $127,305 $134,149
Costs $42,631 $11,521 $10,186 $10,647 $11,528 $10,783 $10,763 $11,530
1C3 1D1 1D2 1D3 2A1 2A2 2A3 2B1
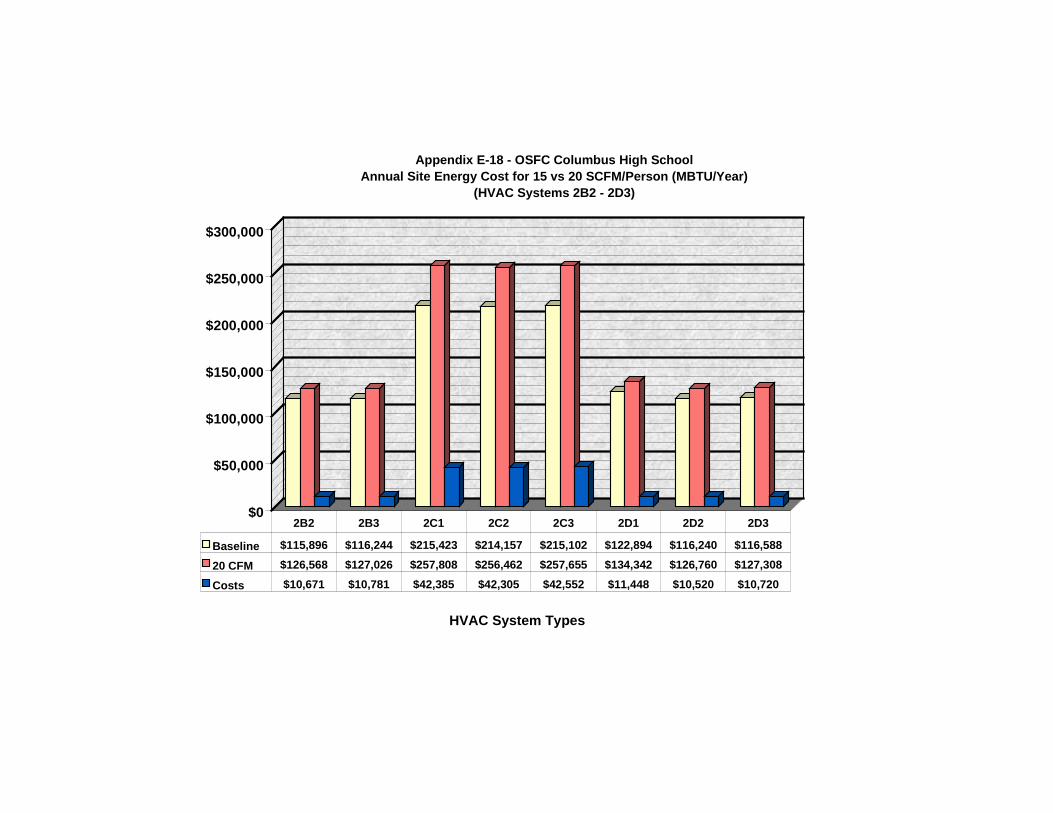
$0
$50,000
$100,000
$150,000
$200,000
$250,000
$300,000
HVAC System Types
Appendix E-18 - OSFC Columbus High School Annual Site Energy Cost for 15 vs 20 SCFM/Person (MBTU/Year)
(HVAC Systems 2B2 - 2D3)
Baseline $115,896 $116,244 $215,423 $214,157 $215,102 $122,894 $116,240 $116,588
20 CFM $126,568 $127,026 $257,808 $256,462 $257,655 $134,342 $126,760 $127,308
Costs $10,671 $10,781 $42,385 $42,305 $42,552 $11,448 $10,520 $10,720
2B2 2B3 2C1 2C2 2C3 2D1 2D2 2D3
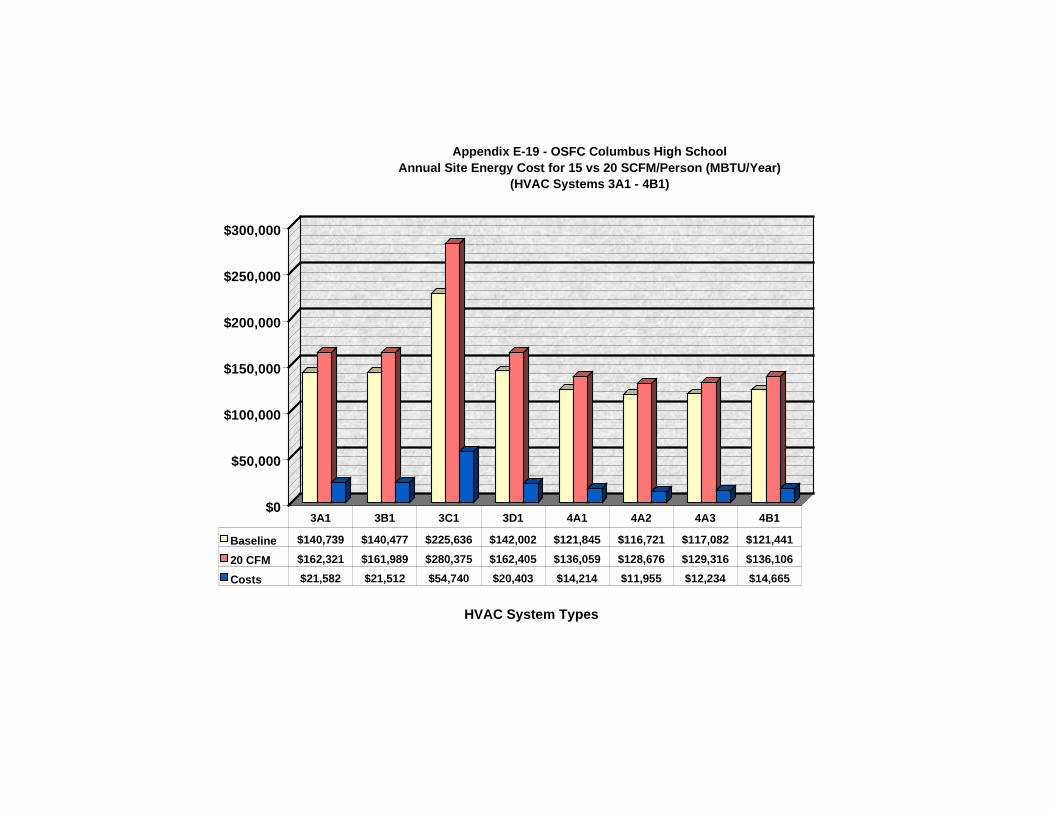
$0
$50,000
$100,000
$150,000
$200,000
$250,000
$300,000
HVAC System Types
Appendix E-19 - OSFC Columbus High School Annual Site Energy Cost for 15 vs 20 SCFM/Person (MBTU/Year)
(HVAC Systems 3A1 - 4B1)
Baseline $140,739 $140,477 $225,636 $142,002 $121,845 $116,721 $117,082 $121,441
20 CFM $162,321 $161,989 $280,375 $162,405 $136,059 $128,676 $129,316 $136,106
Costs $21,582 $21,512 $54,740 $20,403 $14,214 $11,955 $12,234 $14,665
3A1 3B1 3C1 3D1 4A1 4A2 4A3 4B1
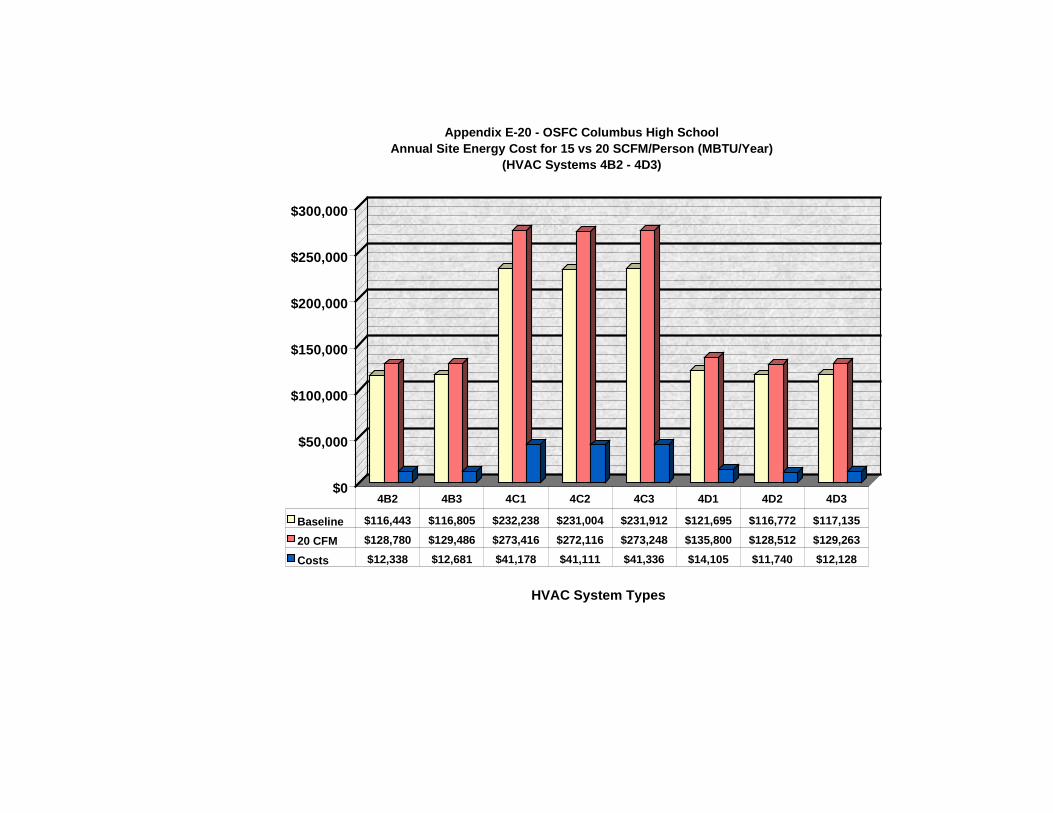
$0
$50,000
$100,000
$150,000
$200,000
$250,000
$300,000
HVAC System Types
Appendix E-20 - OSFC Columbus High School Annual Site Energy Cost for 15 vs 20 SCFM/Person (MBTU/Year)
(HVAC Systems 4B2 - 4D3)
Baseline $116,443 $116,805 $232,238 $231,004 $231,912 $121,695 $116,772 $117,135
20 CFM $128,780 $129,486 $273,416 $272,116 $273,248 $135,800 $128,512 $129,263
Costs $12,338 $12,681 $41,178 $41,111 $41,336 $14,105 $11,740 $12,128
4B2 4B3 4C1 4C2 4C3 4D1 4D2 4D3