Embed Size (px)
Citation preview
Energy requirements in size reduction of solids
* L G. Reddy
INTRODUCTION
It is no exageration to state that of the
many approaches to understand different aspects
of process of comminution, perhaps the most
important one is the search for the sound rela-
tionship between the size and the energy used.
Basic laboratory investigations of comminution
have been concerned mainly with 3 phases of
the problem :
1) the micro crack pattern and its progress,
2) fragment size distribution of commuted
products,
3) new surface production as a relation to
energy input.
In the present analysis emphasis is on the
relationship between the energy utilised in
comminution and new surface produced although
various other criteria have also been discussed
and compared with the theoretical to practical
results.
Energy input and comminution efficiency :
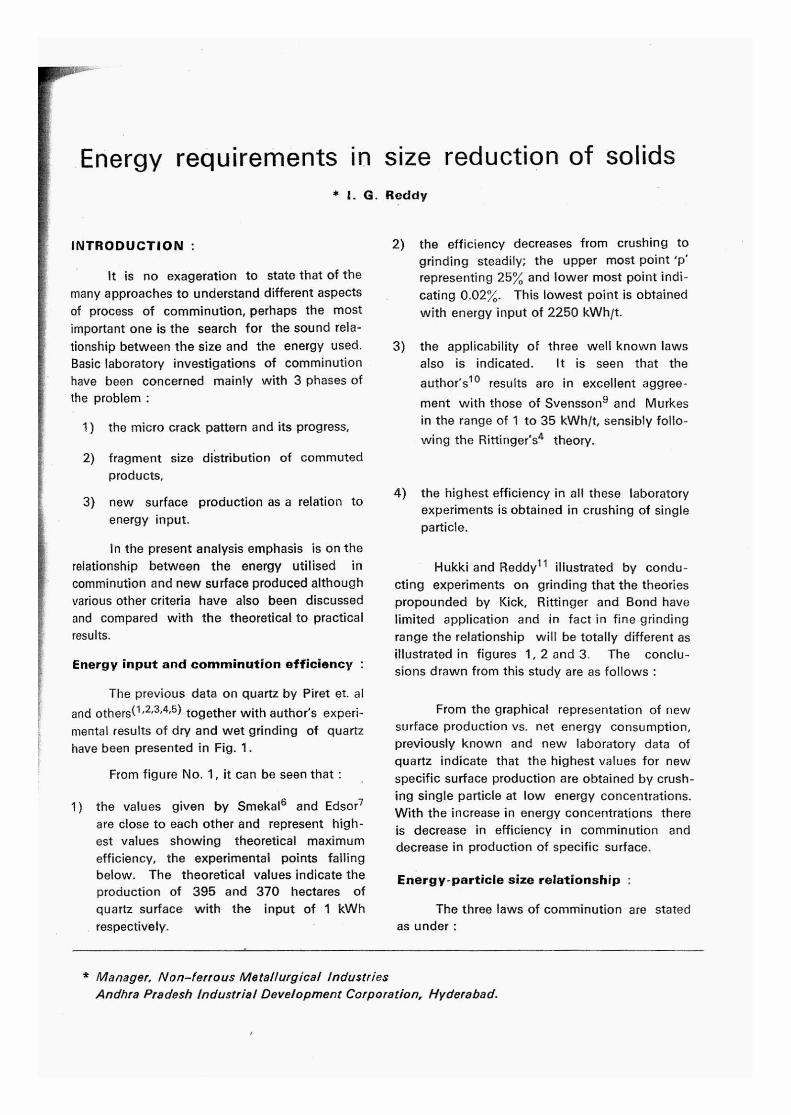
The previous data on quartz by Piret et. at
and others(1•2'3A5) together with author's experi-
mental results of dry and wet grinding of quartz
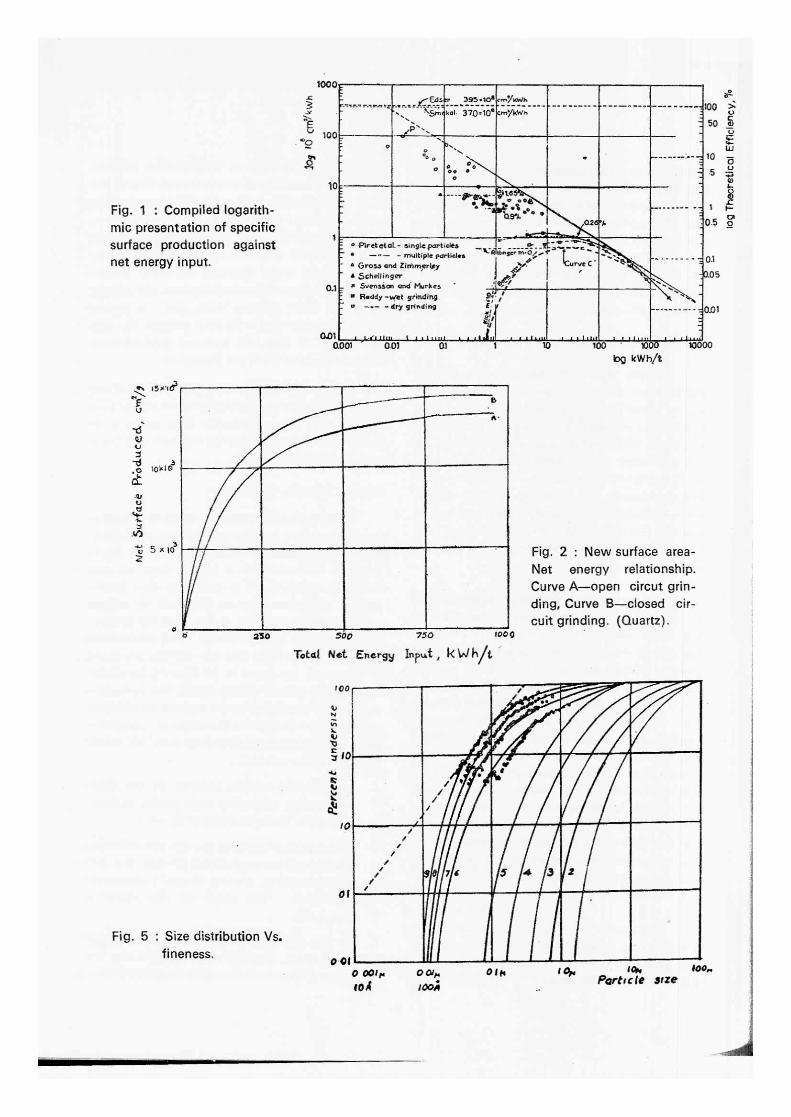
have been presented in Fig. 1.
From figure No. 1, it can be seen that :
1) the values given by Smekal6 and Edsor7
are close to each other and represent high-
est values showing theoretical maximum
efficiency, the experimental points falling
below. The theoretical values indicate the
production of 395 and 370 hectares of
quartz surface with the input of 1 kWh
respectively.
2) the efficiency decreases from crushing to
grinding steadily; the upper most point 'p'
representing 25% and lower most point indi-
cating 0.02%. This lowest point is obtained
with energy input of 2250 kWh/t.
3) the applicability of three well known laws
also is indicated. It is seen that the
author's" results are in excellent aggree-
ment with those of Svensson9 and Murkes
in the range of 1 to 35 kWh/t, sensibly follo-
wing the Rittinger's4 theory.
4) the highest efficiency in all these laboratory
experiments is obtained in crushing of single
particle.
Hukki and Reddy" illustrated by condu-
cting experiments on grinding that the theories
propounded by Kick, Rittinger and Bond have
limited application and in fact in fine grinding
range the relationship will be totally different as
illustrated in figures 1, 2 and 3. The conclu-
sions drawn from this study are as follows :
From the graphical representation of new
surface production vs. net energy consumption,
previously known and new laboratory data of
quartz indicate that the highest values for new
specific surface production are obtained by crush-
ing single particle at low energy concentrations.
With the increase in energy concentrations there
is decrease in efficiency in comminution and
decrease in production of specific surface.
Energy-particle size relationship :
The three laws of comminution are stated
as under :
* Manager, Non—ferrous Metallurgical Industries
Andhra Pradesh Industrial Development Corporation, Hyderabad.
1) Kick's law12 Kick stated that the energy
required to bring analogous changes in con-
figuration of geometrically similar bodies of
equal technological character is proportional
to the volumes of these bodies.
2) Rittinger's theory4 : Von Rittinger proposed
a theory stating that the energy consumed
in comminution is proportional to new sur-
face produced.
3) Bond's theory13 Bond's so called third
theory of comminution states that the energy
required is proportional to the length of
crack initiating breakage.
Each of the three well known laws of
comminution can be represented as a special case of general equation (1) derived by Walker,
Lewis. McAdams" and Gilliland.
— Cdx xn (1)
Where E is the net energy for unit weight
of the material in a particular comminution pro-
cess, x is a factor indicating the fineness of
material, n is an exponential factor indicating the
order of the process and C is an experimental
constant depending upon the material, units
chosen ---- etc.
If in the equation (1), the exponent n is
replaced by numerical figures 2, 1 and 11 the
integrated form of the general equation leads to
the well known fundamental theories of Rittin-
ger, Kick and Bond respectively.
The total net energies ( Et ) (kWh/0 from
infinite feed size to a product of size x are given
as follows :
Rittinger's theory Et = C 1 /x (2)
Kick's law Et / n x (3)
Bond's theory Et = 2C 1/1/x . (4)
For all practical purposes measurement of
net energy to bring about size reduction of
known feed size to desired .product size is of
importance. The corresponding net energies (E)
(kWh/t) required for feed x1 to product x2 are
Rittinger's theory E = C ( 1 /x2 —1 /x1 )
Kick's law E — / n (x2 / x1 ) . . .
Bond E — 2 C (1/NT2 1/-671 )
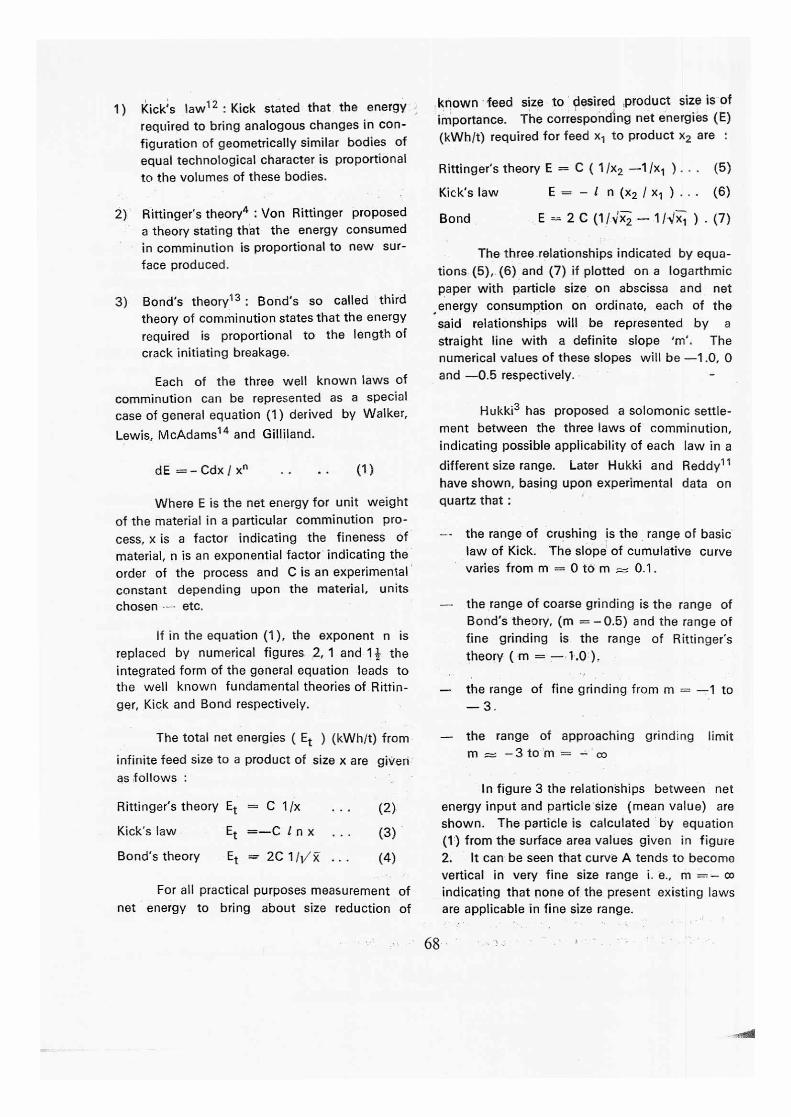
The three relationships indicated by equa-
tions (5), (6) and (7) if plotted on a logarthmic
paper with particle size on abscissa and net
energy consumption on ordinate, each of the
said relationships will be represented by a
straight line with a definite slope 'rn`. The
numerical values of these slopes will be —1.0, 0
and —0.5 respectively.
Hukki3 has proposed a solomonic settle-
ment between the three laws of comminution,
indicating possible applicability of each law in a
different size range. Later Hukki and Reddy"
have shown, basing upon experimental data on
quartz that :
--- the range of crushing is the range of basic
law of Kick. The slope of cumulative curve
varies from m = 0 to m 0.1.
the range of coarse grinding is the range of
Bond's theory, (rn = — 0.5) and the range of
fine grinding is the range of Rittinger's
theory ( m = — 1.0 ).
- the range of fine grinding from m = —1 to
— 3,
— the range of approaching grinding limit
m —3 torn — co
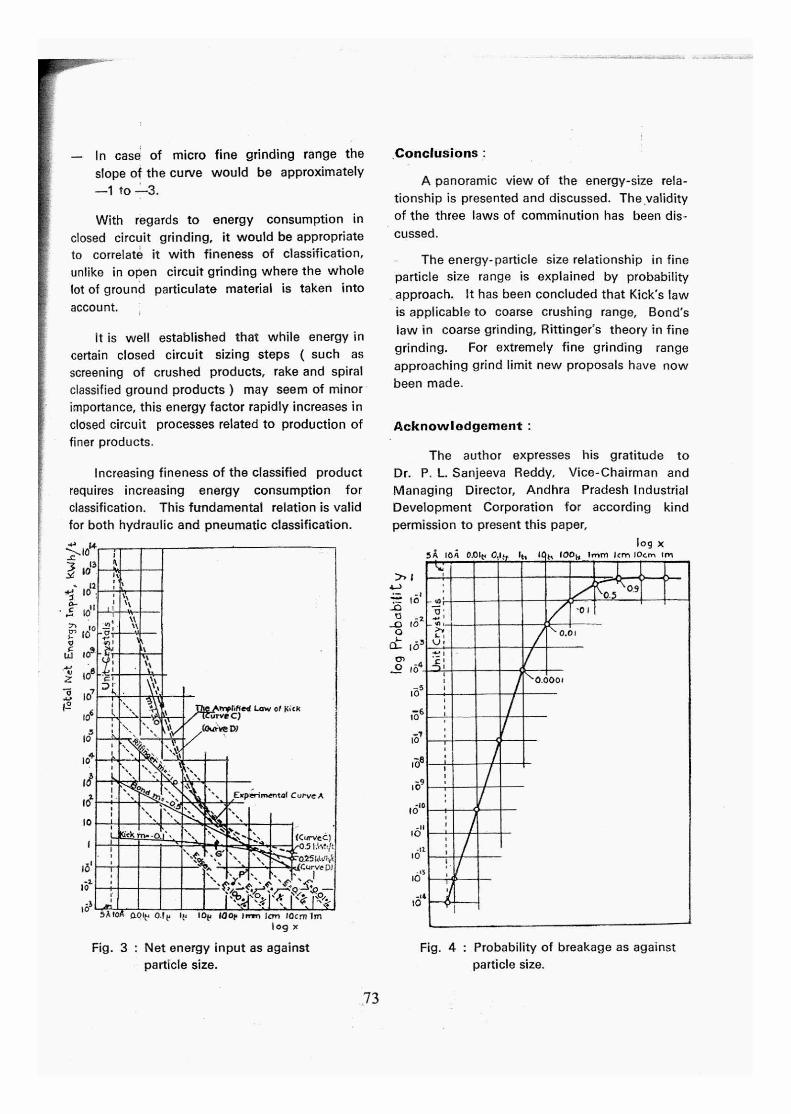
In figure 3 the relationships between net
energy input and particle size (mean value) are
shown. The particle is calculated by equation
(1) from the surface area values given in figure
2. It can be seen that curve A tends to become
vertical in very fine size range i. e., m = — co
indicating that none of the present existing laws
are applicable in fine size range.
68
It may be said that extremely fine particles
do exist even when bulk of the material is in
coarse form. The grind limit is conveniently
defined here as the limiting particle size after
which further size reduction is almost impossible
under a given set of operating conditions. The
mean particle size is a rational measure of the
whole lot and is not necessarily the finest size.
It may be recalled that Kondo and Gaudin13 have
found that finest particles in a ground product
could fall in the size range of 0.03
Probability of breakage :
In crushing operations overall probability
of particle being crushed in comminution is re-
presented by figure 4 which indicates that under
the conditions where all particles are broken the
probability of breakage is 1.0, if one half of the
mass of the particle is broken the probability
factor is 0.5 and if none of the particles are
broken the probability factor is zero. In crushing
large material it is expected that the probability
factor is high. In fine grinding it is low. In sub-
micron grinding by conventional means it appro-
aches zero. The nature of phenomena encoun-
tered in grinding powders is demonstrated in the
Table 1.
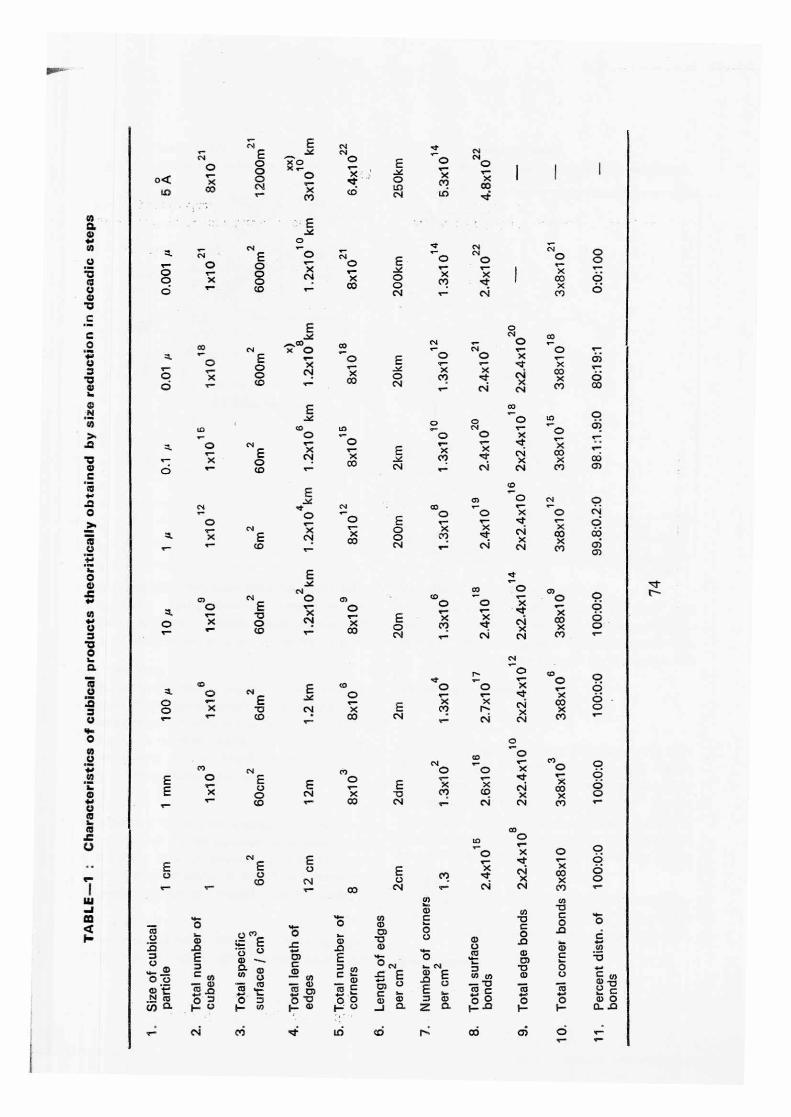
The data given in the Table 1 gives a
panoramic presentation of the theoretical sub-
division of a 1 cm cube in decadic steps down to
the cubical unit crystals. The following obser-
vations can be made :
The total number of cubes formed increases
in 1000—fold steps for each 10—fold step
of size reduction.
— The total specific surface increases in 10—
fold steps. The overall area on elementary
5 A° cubes totalling 1 cm3 in volume =
12,000 m2 or 1.2 hectares.
The total edge length increases again in
1000—fold steps. The length of edges on
0.01 micron cubes totalling 1 cm3 in volume
= 1.2 x 10⁸ km; the mean distance bet-
ween earth and sun is about 1.5 x 10⁸ km.
The length of edges on elementary 5 A°
cubes totalling 1 cm3 in volume x 1010
km; this corresponds to 320 times the mean
distance between earth and sun.
Thus in the micron size range the coarsest
particles loose their individuality, and the charge,
both wet and dry behaves on the whole rather
like a homogeneous, fluid mass
Probability Approach :
The phenomena that occurs in comminu-
tion with reference to the behaviour of particle
size with the energy input breakage can perhaps
be best explained by attributing probability
approach to the process of comminution. Any
solid matter is composed of unit crystals which
can be assumed as the smallest basic limits show-
ing the basic characteristics of the substance.
In single particle breakage it is expected that the
probability of achieving the breakage is high and
in case of multiple particle assemblage the pro-
bability of breakage of each particle would be
drastically reduced. The particle calculation with
reference to the behaviour of quartz particle
when subjected to comminution in 10 fold steps
is indicated in table 1. Assuming that in the
actual operation also a similar situation occurs if
not exactly as in the particle calculations the
operation of crushing and grinding can be ex -
plained by a simple model as under :
The model can be assumed as a typical
laboratory ball mill of convenient size. Assum-
ing that relative grinding capacity of 1,000 of
the base mill (100 cm x 100 cm) the dimensions
in centimetres obtained would be 26.8 cm s.
26.8 cm. The total volume of this mill will be 15
dm3 . A 30% volumetric ball mill corresponds to
4.5 dm3 of steel balls weighing about 4.8 kg.
10 mm ball would weigh about 4.1 grns. The
total number of balls in the charge will then be
5,270. In the mill a batch of material 1.5 kg
can conveniently be ground. Assuming a density
69
of 3.0 for volume of 1.5 Ica material to be ground
would be 500 cm3 However for the simplified
model as proposed, now the original batch can
be considered to consist of 500 pieces of 1 cm
cubes. The 500 pieces of 1 cm cubes are now
reduced ideally step by step to imaginary cubes
of succeeding decadic size classes. As illustrated
in Table 2, the theoretical number of particles and
number of 10 mm balls available in the batch
when ground step wise in the said laboratory
mill the phenomena can be observed as follows :
a) The number of grinding balls remains un-
changed.
b) The number of contact points, i.e., the points
where further size reduction can take place,
between the balls themselves and the balls
and the mill lining remains unchanged.
c) With the increasing fineness the number of cubes to be broken increases at a tremen-
dous rate for each 10—fold size reduction
step the said number increases 1000—fold
steps.
d) For each 10-fold size reduction step, the
number of cubes for ball available in the
batch increases in 1000 fold steps.
The probability of breakage as against the
particle size is shown in figure 4. The curve
obtained in this figure fairly approximates with
the actual practice. However, depending on the
grinding environment the range of size reduction
etc. its position may be different but the trend
of the curve would more or less be seen for
all the materials.
In comminution, the probability of a par-
ticle being broken varies with the size of the
particle from a top value of 1.0 applicable in the
coarse range to extremely small values applica-
ble in the extreme fine range. On a logarithmic
paper showing particle size on the abscissa and
the probability factor on the ordinate, the pro
bability is represented by a curve characterized
by the following features :
Starting from the coarsest size treated, the
curve has an upper horizontal straight line
section with slope m=0 extending substan-
tially over the whole range covered by crush-
ing; the probability factor = 1.0.
a curved middle section with its positive
slope increasing gradually from m = 0 to
m = 3.0 with decreasing particle size, the
probability factor decreases from 1.0 at a
rapid rate. This section corresponds to the
common range of industrial grinding.
a lower linear section having steep slope of
m = 3.0; the probability factor decreases in
1000—fold steps for each 10—fold size redu-
ction step. This section corresponds to the
very finest size classes.
The probability concept can also be ex-
plained in terms of the efficiency of the applica-
tion of mechanical energy in comminution. It is
easy to visualise that the said efficiency of the
positively acting crusher is high. The net power
(the total power minus the idling power) is used
for reduction of particle size. in a rod mill the
net power (total power minus the idling power
of an empty mill) is used for tumbling the rod
load and the material change. It can be under-
stood that while the probability of a rod to hit
relatively coarse particles is high, a rod may also
strike another rod or the mill lining without a
properly directed blow on the material to be
ground. The overall efficiency of the application
of mechanical energy is now lower than that of a
crusher. Toward fine grinding in ball mills, the
said efficiency decreases at a rapid rate with
decreasing particle size and with vastly increasing
particle numbers.
Practical Approach
in conventional industrial coarse crushing
about 0.5 kWh of net energy is needed to crush one ton of ore or rock from an initial size of 1 m
down to 10 cm. Assuming this basic 0.5 kWh/t as
net energy consumption figure needed in each
decadic size reduction step, in order to get the
70
actual net energy consumption in each step, the
basic figure should be corrected regarding the
relative probability of breakage in each reduction
step. The correction factor is the inverse value
of probability factor. An example illustrating the
evaluation of energy consumption in successive
decadic steps of size reduction is given in table 3.
The respective probability factors are obtained
from the curve shown in figure 4.
Weight Distribution Vs. Fineness :
Surface area relationship is the weight
distribution — fineness in ground products. On
log-log paper the well known Gates—Gaudin-
Schuhmann relationship plotted as straightline.
As early as 1909 a similar straightline relationship
was presented by Richards. Rosin, Rammler
and Sperling formulated another straightline rela-
tionship plotted on a log-log vs. log paper.
These relationships fortunately have been widely
accepted although these pre-opinions have not
discussed the limitations relative to the particle
size range.
However, one of the practical advantages
in support of these straightline relationships is
that they provide a basis for mathematical
estimates of the specific surface area of a ground
product. These estimates of specific surface
area based on the size distribution of particles
should be accepted within reasonable limits to
agree with the surface area actually measured.
However, they usually do not. One of the attri-
butes for this discrepancy is that the mathemati-
cal estimates do not incorporate the values for
samples of lower particle size limit. In fact it is
difficult to estimate because the basic informa-
tion does not exist and as such no reasonable
recommendation is proposed for establishing its
value and consequent connections to be made to
reconcile between the estimated and actual sur-
face area of any powder.
Subsequent studies have indicated that
contrary to the conventional method of plotting
as proposed by Gaudin—Gates---Schuhmann are
limited to certain size range only and not applica-
ble for the whole range of comminution starting
from coarse crushing to fine grinding. In fact the
data covering the full range of comminution
when plotted as proposed by Gates- Gaudin-
Schuhmann reveals that it is no more straightline
with a definite slope but in fact smooth curve.
In the coarse range however the curve is nor-
mally straightline with a definite slope but slightly
taking at 100% passing mesh size. A typical
example is presented in figure 5 wherein the size
distribution of ball mill feed and products have
different times of grind are illustrated.
The range approaching grind limit of any
particular mineral is expected that the slope vary
from – 3 to – co . Generally this range is of
purely theoretical importance and can not have
any practical applications.
Closed Circuit Grinding
The general response of solids to breakage
process resulting in a parabolic shape curve when
plotted on log-log paper such as shown in figure
3 is well illustrated for a typical case of size
reduction of quartz. It is expected that similar
pattern of curves can be obtained for various
other minerals also. So is the case for commi-
nuted products in close circuit. The relationship
between energy input and new surface produced
is illustrated by curve B in figure 2 by Hukki.
However, in case of closed circuit, the correspon-
ding energy requirements for a given particle size
will be lesser throughout the range of comminu-
tion. The following conclusions can be drawn
from the above analysis :
The crushing range is covered by the basic
law of Kick, where the slope of the cumula-
tive curve varies between 0 to —0.1.
In the case of grinding i.e., the size reduction
carried out in conventional product and ball
mill operations, Bond's theory is reasonably
applicable. The slope of the curve is
about 0.5.
In fine grinding range such as grinding of
cement etc. Rittinger's law is applicable. The
slope of the curve would be approximately-1,
71
100 0
100 UO
0 Cr,
10
Fig. 1 Compiled logarith-
mic presentation of specific surface production against net energy input.
1
10000 10 100 • 1000 log kW h/t
0 r4 0 001 p. 10A
0 04, 100;4
" '-".''''' '..r.
.e...- Eost• .". 4 ---r--
'-' '-- - -t 5;
395.103 .
kal. 370.105
cn,Y.,/h .. ... ....
CmYkWh
-, — - .. - ....— — ----- .- ,...
...
O o0 p ■
o
••
:.
- - -64"INV - - .. ".... . 165 • s e 004
.%,, saTio -
,,,
_ ------ _ Q2, /.
....-o---7Ai,,
1 ... . ,'.. urve C ' \Nlit -.
o pir et et al. - Single port‘c3ts . .-- - muitiple porlicies a Gr.05.3 and ZireirnrtgY • ScheMnger . Svensson 0,4 MurXes 0 Reddy -wet grinding u -.- - dry grinding
- • - 41ii,rwr m.0,::.,
'''ap". j, ...., ., - S' .., E =5"
1 / 1 .
7.'
log
The
o ret i
cal
Effic
ien
cy, 7
0
Fig. 2 : New surface area-Net energy relationship. Curve A—open circut grin-ding, Curve B—closed cir-cuit grinding. (Quartz).
Fig. 5 : Size distribution Vs.
fineness.
0.001 0.01 01 1
Total Net Energy input k 1A/ in
25.0 0
0
0.1
0.01
100
50
10
5
1
0.5
0.1
.05
0.01
100
100,. Particle srze
0 01
Low of P wive G)
ripraietf 1.;; C
CCkll'Ve
1111 MIS Nil 11111 PAN
. • 1111111 0.51,W1:it Oc.211t./D/.
* s, • .kc., P, L.
P1111111. 11111 ‘4r
16'
to
Erptrimental Curve A
5A10 (1O IN 01N I{, 10t, 100? 1trr>fn Ian lOcrn In tog x
4, >10
1,4
3 103
- 10 7, to Itri: 10
IA 10
10
**Er
10
5 I0
1 10
2
0
10
10
10
>>
IC
tO2 0
0— 1
• 6
3 cn O 154
105
— 10
6
to
IO
109
10
10
- to
10
— In case of micro fine grinding range the
slope of the curve would be approximately
—1 to —3.
With regards to energy consumption in
closed circuit grinding, it would be appropriate to correlate it with fineness of classification, unlike in open circuit grinding where the whole
lot of ground particulate material is taken into
account.
it is well established that while energy in
certain closed circuit sizing steps ( such as screening of crushed products, rake and spiral
classified ground products ) may seem of minor importance, this energy factor rapidly increases in
closed circuit processes related to production of
finer products.
Increasing fineness of the classified product
requires increasing energy consumption for classification. This fundamental relation is valid for both hydraulic and pneumatic classification.
Conclusions :
A panoramic view of the energy-size rela-
tionship is presented and discussed. The validity
of the three laws of comminution has been dis-
cussed.
The energy-particle size relationship in fine particle size range is explained by probability
approach. It has been concluded that Kick's law
is applicable to coarse crushing range, Bond's
law in coarse grinding, Rittinger's theory in fine
grinding. For extremely fine grinding range
approaching grind limit new proposals have now
been made.
Acknowledgement :
The author expresses his gratitude to
Dr. P. L. Sanjeeva Reddy, Vice-Chairman and
Managing Director, Andhra Pradesh Industrial Development Corporation for according kind
permission to present this paper,
log X 5A 10A 0.010 0 It It, 1001 lrrtrn Icrn 10cm Im
loml .
IN wow 1111M 0• 0111
-,-,, • rT5 ° ' l..)
OM
II 0.01
lil Fr1 0.000'
■
1 ri
114
III■III 1111111,1 MIMI
VA EN 15
Fig. 3 : Net energy input as against particle size.
Fig. 4 : Probability of breakage as against particle size.
73
- N E N ,t.
E...,c N ,-- N N 0 0 0 X 0 E o o x - 7.< ,--- X I I x c,< 7
— o Tr o co co tr) CO (NI
,.- 7 cci L.0 CrN IC) -4
E 0
N .- t C7J Z., N E 0 7.1 - O N o o
3 o o x o .-- E _x .-- o
7< ! ..-- x 0 co 6 0 'cc o 0 N X 0 X CY) •Ct-
6 r co ,--- co 0 N V—. N
X co 6
E 0
...Y N CO CO N ,••-■
CEO 0 co (NI ,-- iti 0 ,--
0 v-- ,,— 0 0 T-X. el) • E 0 E ,-- '— ...,.
•
o __ 7 x co —
JO 7 o N 7 o cl .1- N x 6
6 ,..-- cc --- co N .-- N X N Cr) CO
E co --
_Ne 0 co g O cp .- co co co .-
N .i--
0 0).
0 .-- 0 0 x r-- 0 N e-- 0 v-• .,:t 7: ,-- E X
N ,-- x E x 7.< c:i co .,---
... cY) 4.... ,-- x o co N x x CO
N N CO 0) 6 ,--- co !--- .-- o -
.E
o) .. 0 cq 9 N '1' N CO e- .-- ..- 0 •-- 0 0 X 0 CN! 0 0 E .4- ,---
N 7 0 7.< 7 c.i x 9. `7<. et co c°. O co • 7 E N CO X ,-- c0 N N I- N C'e) .--- ,-- (A
E -̀1.0 N 07._
o o)o C) N 0 cr) to V< • 0 E o 0
.--.. - 9
7.< x c:i co o 7 0 N >-< CY) izt 0 0 X X ‘-- CO r.... CO N .4--" N N CO ,-
C
,4 0 cD
0 0 ,io
,7----0 m 0 7 6 • 0 N E ‘-- 0 x 6 0 7( c.i co
0 x -o N 7 E CO N X X C) ,-, e- CO co N N N CO a-- ,-- .--
0 CO N ,- T-- C.)0 9 CO N (0 0 0 x
E 0 E 0 , .ct- 7 9
E E x ̀;.< cNi c)o o E 7c 0 o N 7 -o co co x o ,-- co — CO N 1-- N CN CO ..--
E N
U CO CO
E C.) N E.! 0)
'O. `8
(,) a) E 17) 6 co o O - a) c.) co
za e a3 -o 0 -5 ..c) a) ES 0 '45 • E a, --.... E U g 4-6 a) z o. a, z u, 3.... N 2 0 a , u-, c 8 -c E 2 c_ o c.) LI
U E. 7€ . 2 . 7. 4 . . To & 73 E cs) ° E -: N as .8 5 45 t 0 C h3 -C3 a) CD .73 a)
in a 1-- c-) t- cn I-- 4) I— 0 —I C. Z C.
TA
BLE
-1
Ch
ar a
cte
r isti
cs o
f c
ub
ical
pro
du
cts
th
eo
riti
call
y o
bta
ine
d b
y s
ize r
ed
ucti
on
in
de
cad
ic s
tep
s
N
C)
O
X
N
X
N
To
tal edg
e bon
ds
To
tal co
rne
r bon
ds 3
x8
x10
—0
ce) Ct
O 9 O 0
a) ca
C) 4cf5
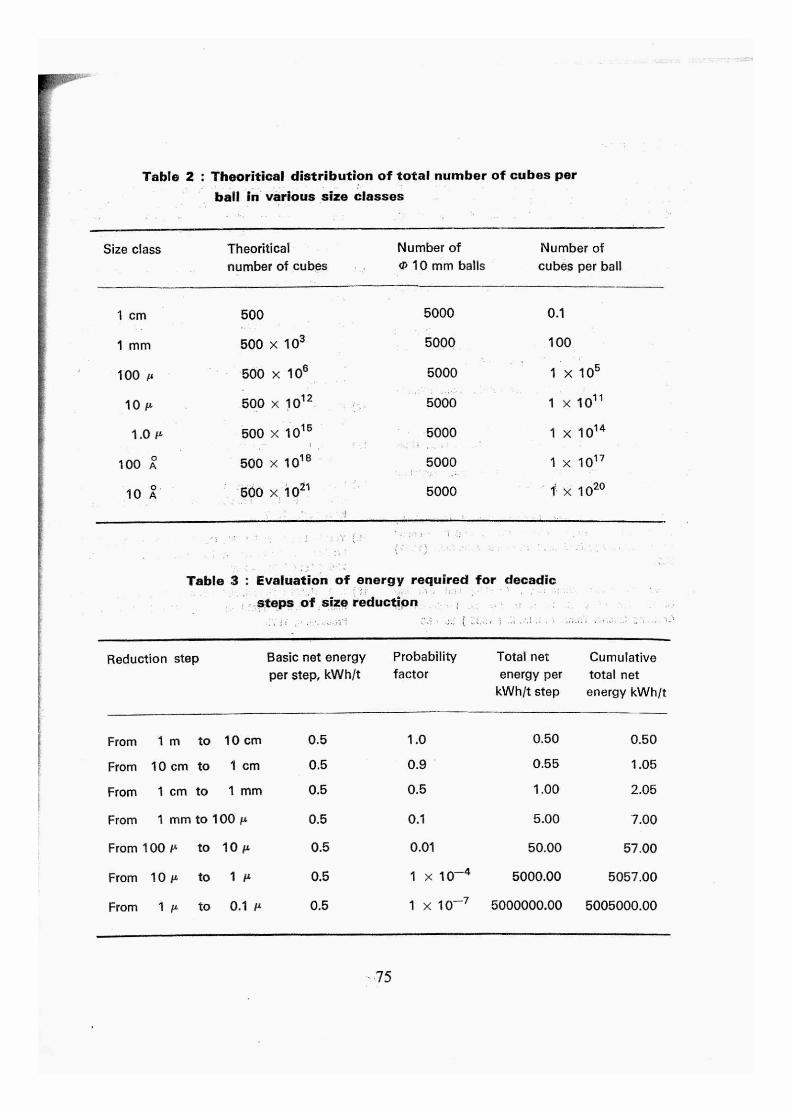
Table 2 : Theoritical distribution of total number of cubes per
ball in various size classes
Size class Theoritical
number of cubes
Number of
0 10 mm balls
Number of
cubes per ball
1 cm
1 mm
500
500 x 103
5000
5000
0.1
100
100 A 500 x 106 5000 1 x 10⁵
10 p 500 x 1012 5000 1 x 10¹¹
1.0 tt 500 x 1015 5000 1 x 10¹⁴
100 X 500 x 1018 5000 1 x 10¹⁷
10 X 500 x. 1021 5000 1' x 1020
Table 3 : Evaluation of energy required for decadic
steps of size reduction
Reduction step Basic net energy
per step, kWh/t
Probability
factor Total net
energy per kWh/t step
Cumulative total net energy kWh/t
From 1 m to 10 cm 0.5 1.0 0.50 0.50
From 10 cm to 1 cm 0.5 0.9 0.55 1.05
From 1 cm to 1 mm 0.5 0.5 1.00 2.05
From 1 mm to 100 p 0.5 0.1 5.00 7.00
From 100 i to 10 p. 0.5 0.01 50.00 57.00
From 10 p to 1 IL 0.5 1 x 10⁻⁴ 5000.00 5057.00
From 1 tz to 0.1 ti, 0.5 1 x 10⁻⁷ 5000000.00 5005000.00
75
Bibliography
1) J. W. Axelson, J. T. Adams, Jr. , J. F. Johnson, J. N.
S. Kwong and E. L. Piret : Basic Laboratory Studies in
the Unit Operation of Crushing. Trans. A. I. M. E. 190
( 1951 ) 1061 - 1069.
2) A. Kenneth Schellinger : Solid Surface Energy and
Calorimetric Determinations of Surface-Energy Relation-
ships for Some Common Minerals. Trans. A. I. M. E. 193
( 1952) 369 - 374.
3) R. T. Hukki : A Proposal for a Solomonic Settlement
between the Theories of von Rittinger, Kick and Bond.
Trans, A. I. M. E. 220 ( 1961) 403 - 408.
4) Von Rittinger, P. R. , Lehrbuch der Aufbereitungs Kunde,
Berlin, 1887.
5) Bond, F. C. : Confirmation of the Third Theory, A. I.
M. E. Annual Meeting, San Francisco, Calif., Feb., 1959.
6) Smekal, A. : Bruchtheorie Sproder Korper, Zetschrift
fur Physik 103 ( 1936 ), 495 - 925.
7) Edser and Edwin The Concentration of Minerals by
Flotation, Fourth Rept. Coloidal Chem. and its General
and Industrial Applications, Brit. Assoc. Adv. Sci.. (1922)
281.
8) J. Gross and S. R. Zimmerley ; Crushing and Grinding
Ill Relation of Work Input to Surface Produced in
Crushing Quartz. Trans. A. I. M. E. ( 1930 ) 35 - 50
9) Jonas Svensson and Jakob Murkes ; An Empirical Rela-
tionship between Work input and Particle Size Dist-
ribution before and after Grinding. Progress in Mineral
Dressing. Trans. Int. Min. Pore. Congr., Stockholm,
1957, 37- 66.
10) Reddy, I. G. ; A study of open and closed circuit grin-
ding, Thesis submitted to inst. of Technology, Helsinki,
Finland.
11) Hukki, R. T. and Reddy, I. G. ; The relationship between
net energy input and fineness in comminution, Procee-
dings of Second European Symposium on Comminution
( 1967 ), Verlag Chemie, GmbH, Frankfurt an Main, W.
Gremany.
12) Kick, F. : Das Gasetz du Propertionalen Widerstande
and Seine Anmendung, Leipzig, 1885.
13) Bond, F. C. : The Third Theory of Comminution, Trans.
A. I. M.E. 193 ( 1952 ), 484 - 494.
14) Walker, D, H., Lewis, W. H., McAdams, W. H. and
Gilliland, E. K. : Principles of Chemical Engineering,
New York, 1937.
15) Yoshio Kondo and A. M. Gaudin Sizing Comminution
Products in the extremely Fine Range. Trans. A. I. M. E.
229 ( 1964) 292 - 299,
16) R. T. Hukki : The principles of comminution : An Analy-
tical summary, E/MJ operating Handbook of Mineral
Processing, 1975.
76