Embed Size (px)
Citation preview
Energy Storage Technologies – Status and Potential Applications
Venkat BanunarayananSenior Director, Integrated Grid
National Rural Electric Cooperatives Association
October 16, 2019

Agenda
• Introduction to NRECA – Business & Technology Strategies (BTS)
• Evolution of the Power System
• Energy Storage Technologies, Markets, & Trends

Operate Optimize Transform
Examples-Work rules | safety with DER-Market fundamentals-Reliability & resiliency-Cybersecurity
Examples Solar PV cost screening & system designs Energy storage | Community storage
Examples -Analytical tools-Understanding Consumer end-use load profiles-Uses for Carbon-IT network management
NRECA - Business & Technology Strategies

0200400600800
100012001400160018002000
2016 2017 2018 2019 2020 2021Cu
mul
ativ
e M
WHs
Battery Energy Storage Projection
Standards & CodesInverters & SafetyRate case studiesLocal generation
Community Storage
Community Solar
Battery Energy Storage Projections
Analytics, Resiliency
DER Implications & Cybersecurity
Co-op Competitiveness
Drones
Operate Optimize
13 Federal Awards - $20+M
TransformUses for Carbon
3
Applied R&D
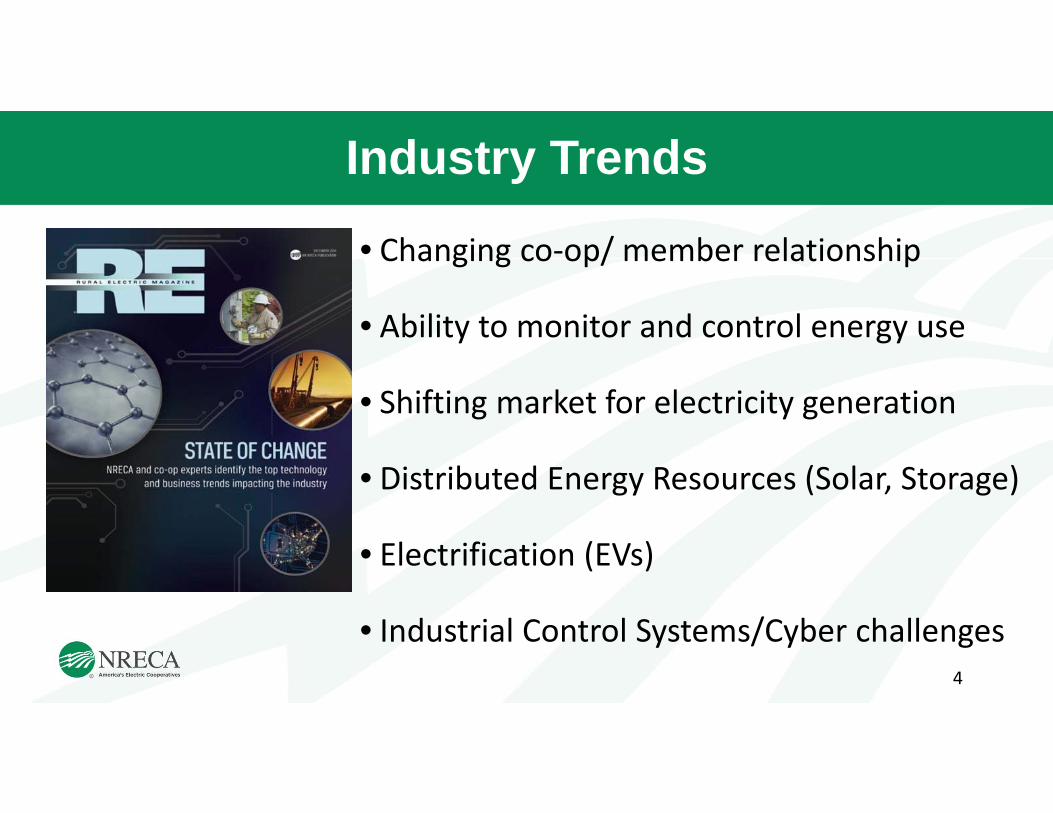
Industry Trends
• Changing co-op/ member relationship
• Ability to monitor and control energy use
• Shifting market for electricity generation
• Distributed Energy Resources (Solar, Storage)
• Electrification (EVs)
• Industrial Control Systems/Cyber challenges4
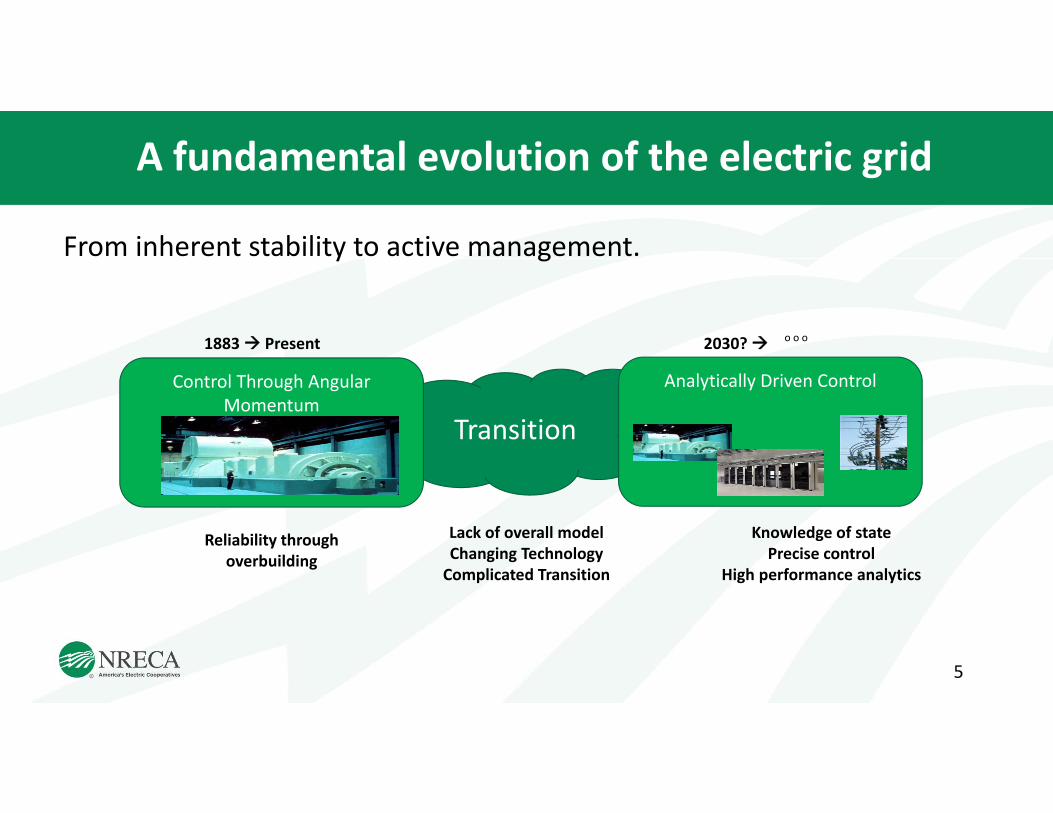
A fundamental evolution of the electric grid
From inherent stability to active management.
Transition
Control Through Angular Momentum
Analytically Driven Control
1883 Present 2030? o o o
Lack of overall modelChanging Technology
Complicated Transition
Reliability throughoverbuilding
Knowledge of statePrecise control
High performance analytics
5

Source U.S. Census Bureau
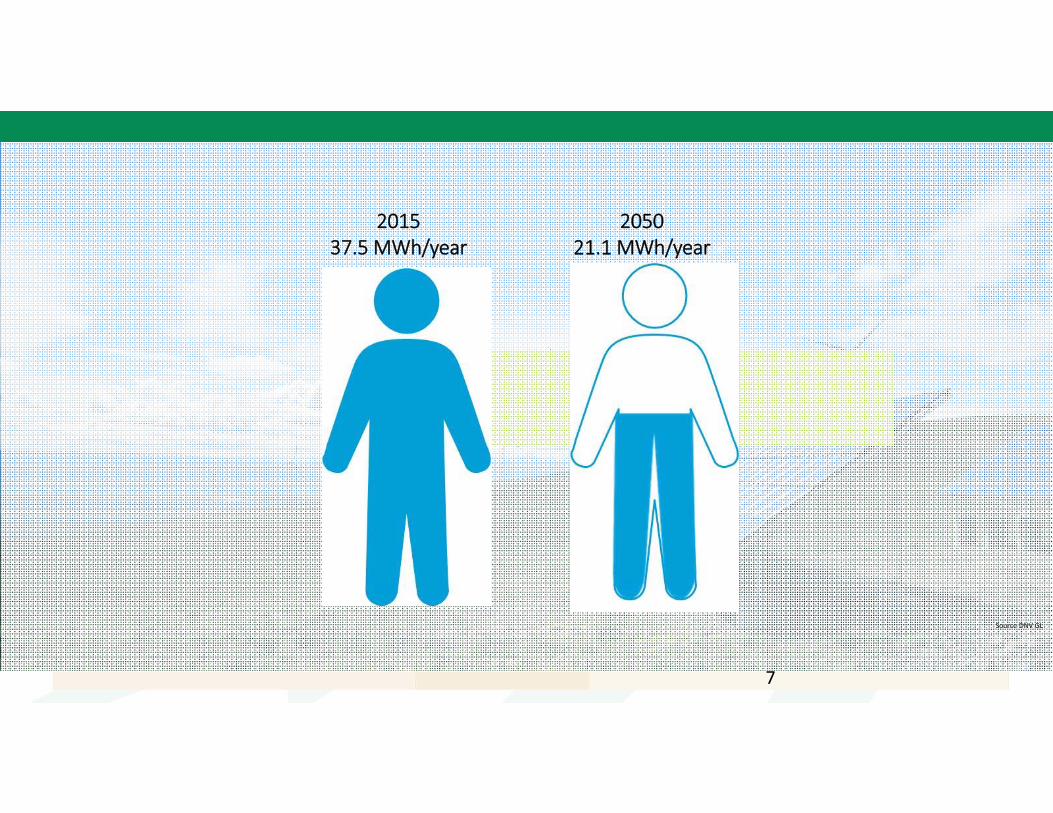
Changing Consumer Preferences
In progress
201537.5 MWh/year
205021.1 MWh/year
Source DNV GL
7

Digital Transformation—It’s Everywhere
| Pg. 8Source: World Economic Forum White Paper
The pace of technological change is accelerating. The plummeting cost of advanced technologies means that the world around us is becoming ever more connected.
In 2005, there were just 500 million devices connected to the Internet; today there are 8 billion. By 2030, it’s estimated that there will be 1 trillion.
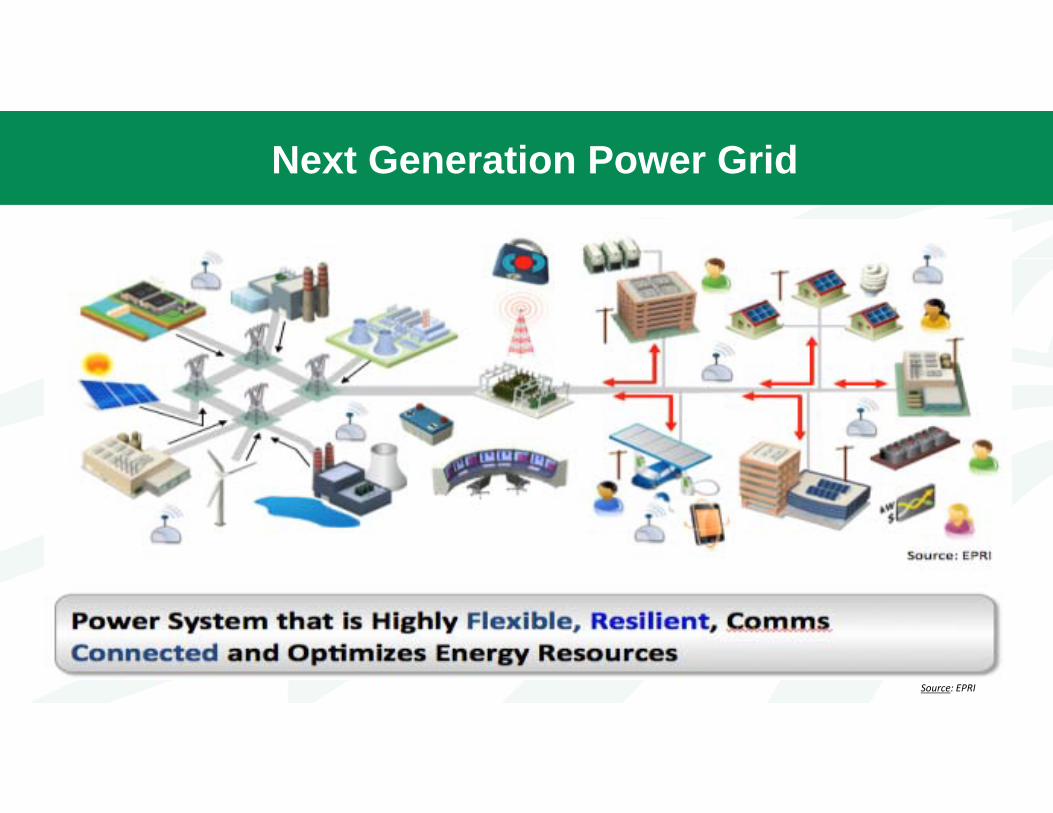
Next Generation Power Grid
Source: EPRI

2013
2014
2015
2016 Projected
Solar Generation at U.S. cooperatives
10

Energy Storage Application Categories
Source: Rocky Mount Institute
• Capable of many applications on the gridUtility ServicesISO/RTO ServicesCustomer Services
• Higher penetration of renewables makes batteries attractive
• Continuous cost declines
11
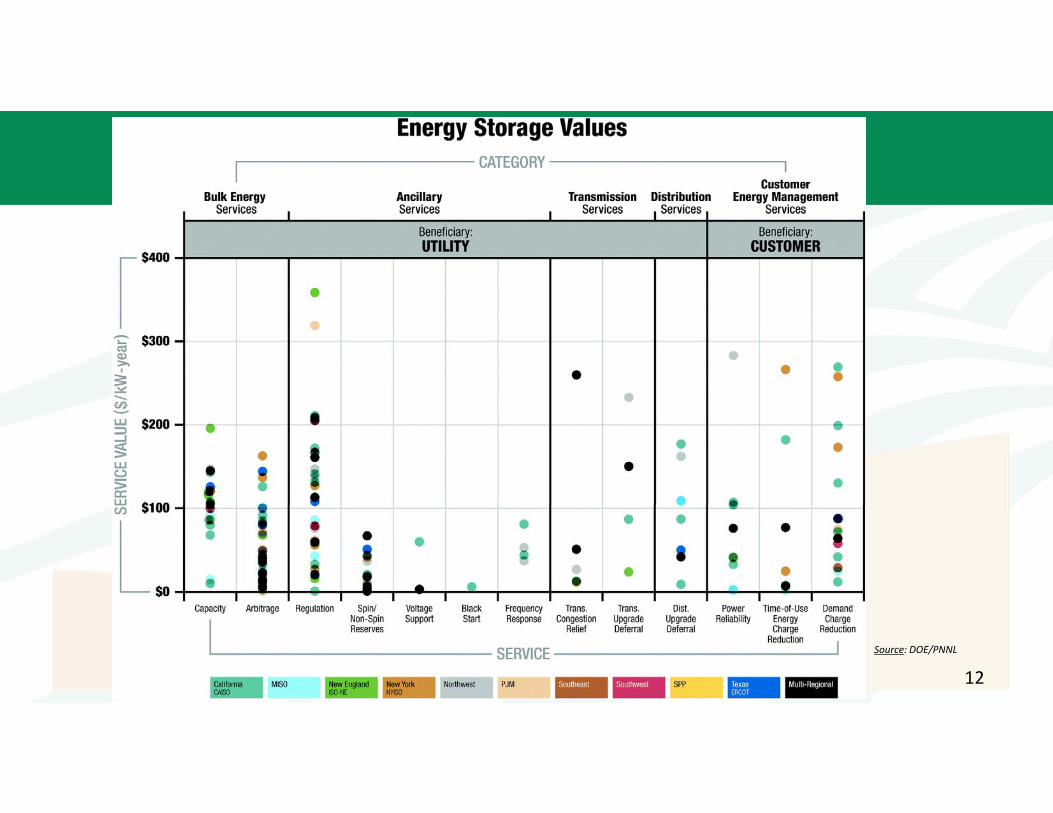
12Source: DOE/PNNL
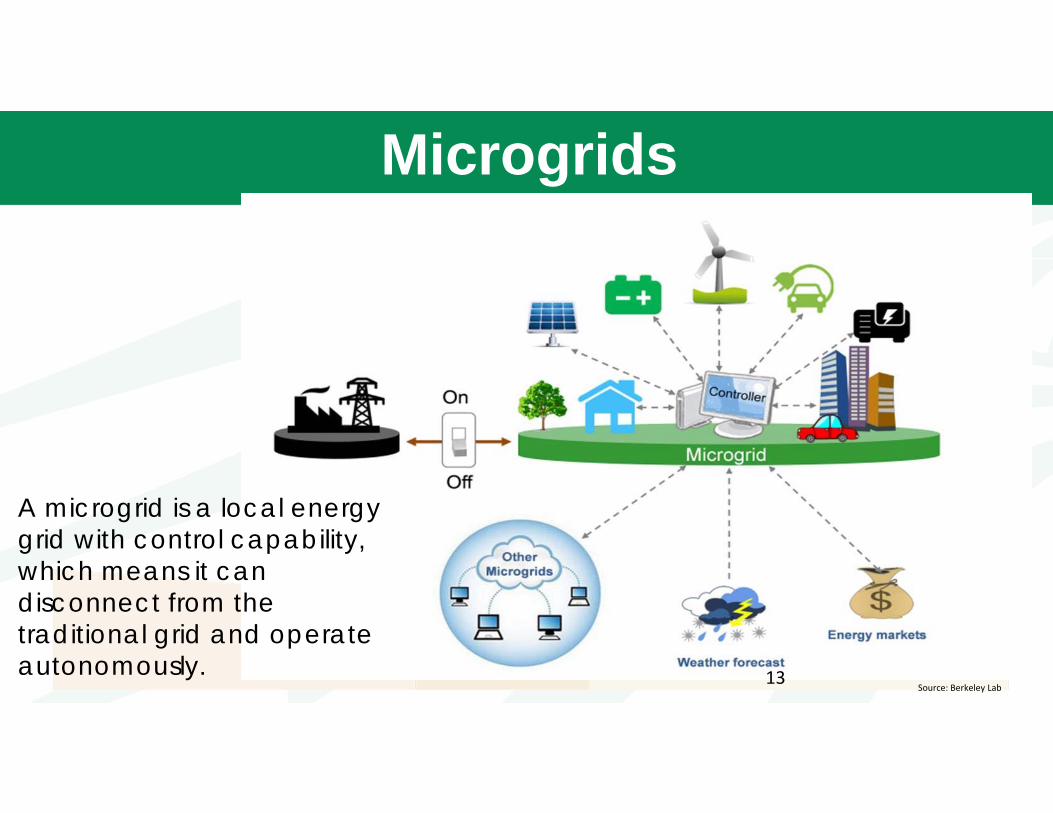
Microgrids
A microgrid is a local energy grid with control capability, which means it can disconnect from the traditional grid and operate autonomously.
Source: Berkeley Lab13
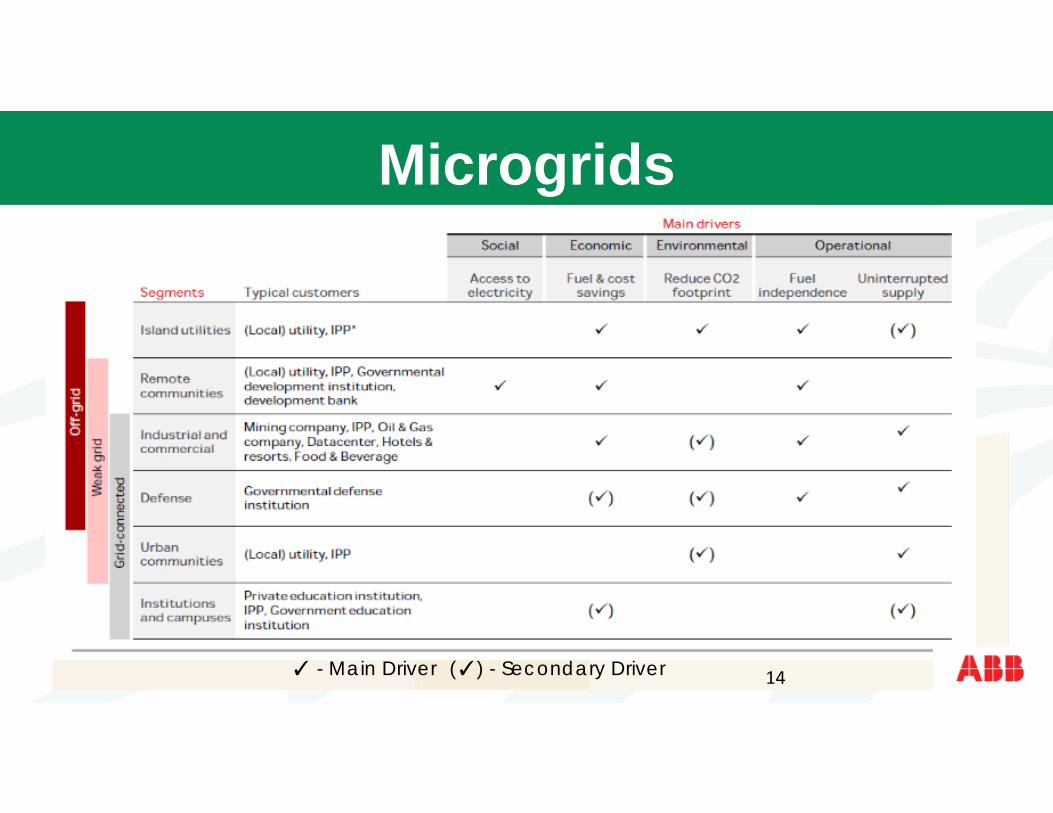
Microgrids
✓ - Main Driver (✓) - Secondary Driver 14

How Does the Smart Home Work?
| Pg. 15
Source: DOE/PNNL

Historical energy storage deployments by MWs
October 16, 2019 | Pg. 16Source: GTM Energy Storage Executive Summary

Projected energy storage deployments by MWs
October 16, 2019 | Pg. 17Source: GTM Energy Storage Executive Summary

Energy Storage Technologies
18

Energy Storage Types
Source: SBC Institute19

Energy Storage Technology Categories
October 16, 2019 | Pg. 20
Source: EPRI

Energy Storage Potential - Basics
October 16, 2019 | Pg. 21Source: Visual Capitalist

Energy Storage – Energy Density Comparison
October 16, 2019 | Pg. 22Source: Visual Capitalist

Energy Storage Technologies - Maturity
October 16, 2019 | Pg. 23
Source: Visual Capitalist
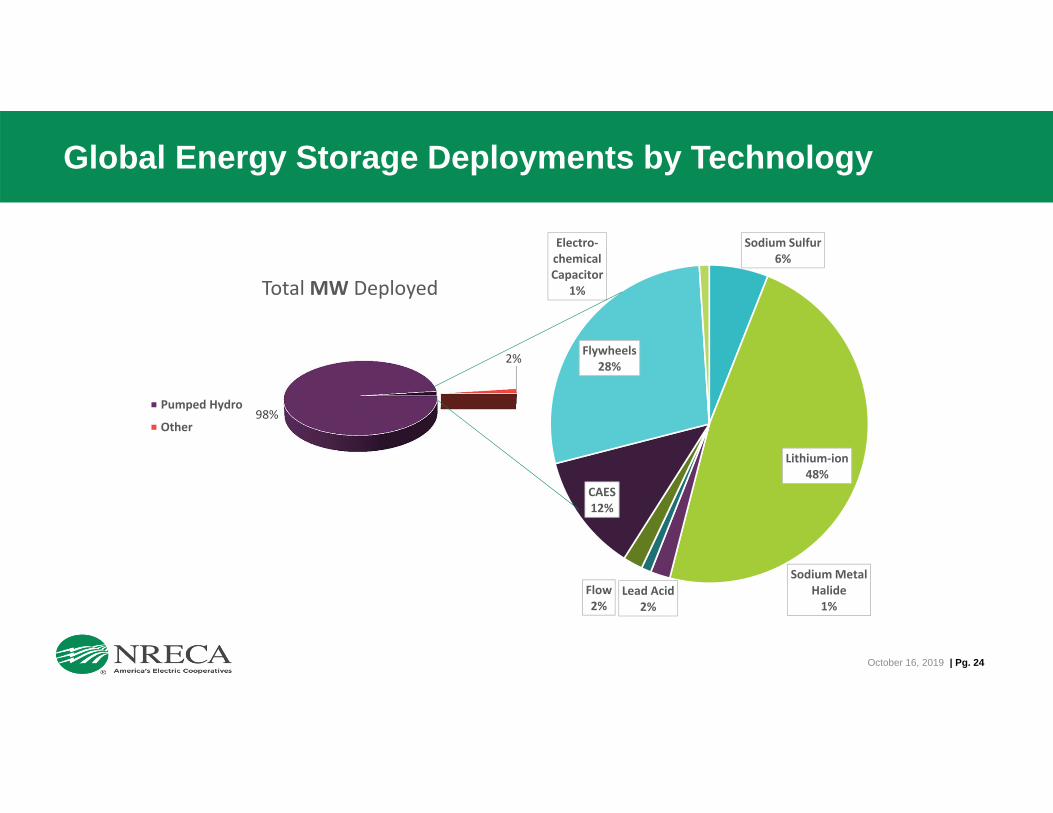
Global Energy Storage Deployments by Technology
October 16, 2019 | Pg. 24
98%
2%
Total MW Deployed
Pumped Hydro
Other
Sodium Sulfur6%
Lithium-ion48%
Lead Acid2%
Sodium Metal Halide
1%Flow2%
CAES12%
Flywheels28%
Electro-chemical Capacitor
1%

October 16, 2019 | Pg. 25
Energy Storage Technologies Applications
Source: EPRI

Battery Storage in Integrated Resource Plans of Utilities
October 16, 2019 | Pg. 26Source: PNNL

Benefits of Energy Storage Included in IRPs
October 16, 2019 | Pg. 27Source: PNNL

Lithium-Ion Batteries
October 16, 2019 | Pg. 28
Ocracoke Island li-on Battery System
• Advantages• High energy density• Flexible• Decreasing costs • Fast response
• Disadvantages• Flammable • Cycle life limited

Lithium-Ion Battery
October 16, 2019 | Pg. 29Source: EEE Community
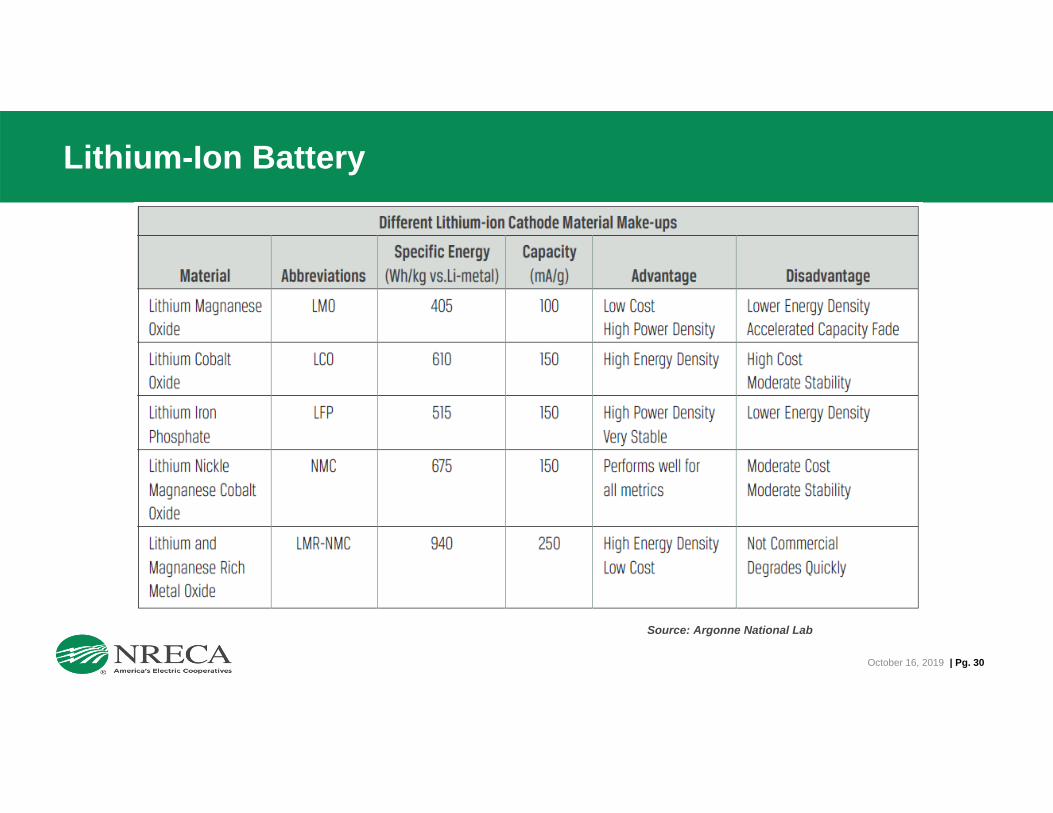
Lithium-Ion Battery
October 16, 2019 | Pg. 30
Source: Argonne National Lab

Lithium-Ion Batteries
October 16, 2019 | Pg. 31
Source: Visual Capitalist

Lithium Metal Polymer Batteries
October 16, 2019 | Pg. 32

Lithium Metal Polymer Batteries
October 16, 2019 | Pg. 33
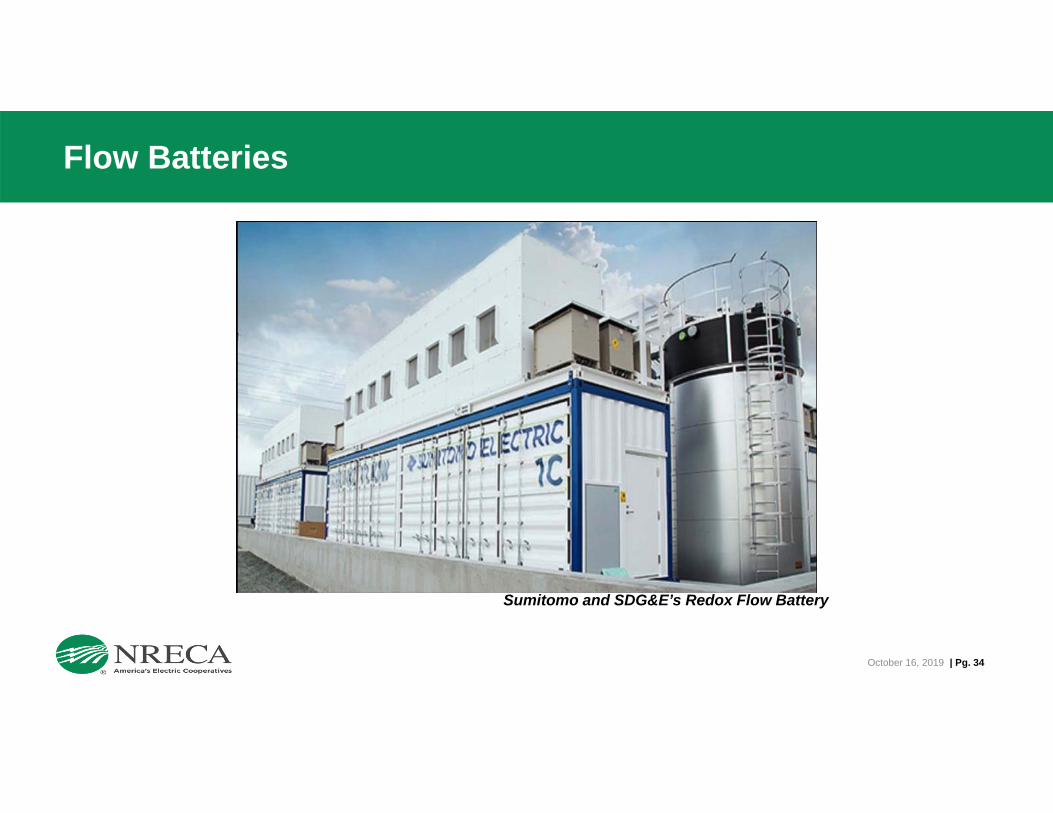
Flow Batteries
October 16, 2019 | Pg. 34
Sumitomo and SDG&E’s Redox Flow Battery

Redox Flow Batteries
October 16, 2019 | Pg. 35
• Redox flow batteries (RFB) represent one class of electrochemical energy storage devices.
• The name “redox” refers to chemical reduction and oxidation reactions employed in the RFB to store energy in liquid electrolyte solutions which flow through a battery of electrochemical cells during charge and discharge.
• The separation of power and energy is a key distinction of RFBs, compared to other electrochemical storage systems.
• The system energy is stored in the volume of electrolyte, which can be in the range of kilowatt-hours to megawatt-hours, depending on the size of the storage tanks.
• The power capability of the system is determined by the size of the stack of electrochemical cells. The amount of electrolyte flowing in the electrochemical stack at any moment is rarely more than a few percent of the total amount of electrolyte present.
• The system vulnerability to uncontrolled energy release in the case of RFBs is limited by system architecture to a few percent of the total energy stored. This feature is in contrast with packaged, integrated cell storage architectures (lead-acid, NAS, Li Ion), where the full energy of the system is connected at all times and available for discharge.
Source: Energy Storage Association

Avalon’s Vanadium Flow Batteries
October 16, 2019 | Pg. 36Source: Avalon

Zinc-Bromine (ZnBr) Flow Batteries
October 16, 2019 | Pg. 37
• The zinc-bromine battery is a hybrid redox flow battery,. The zinc-bromine flow battery was developed by Exxon as a hybrid flow battery system in the early 1970s. Much of the energy is stored by plating zinc metal as a solid onto the anode plates in the electrochemical stack during charge.
• In each cell of a zinc-bromine battery, two different electrolytes flow past carbon-plastic composite electrodes in two compartments, separated by a micro-porous polyolefin membrane.
• During charge, metallic zinc is plated (reduced) as a thick film on the anode side of the carbon-plastic composite electrode. During discharge, the zinc metal, plated on the anode during charge, is oxidized to Zn2+ ion and dissolved into the aqueous anolyte. The net DC-DC efficiency of this battery is reported to be in the range of 65-75%.
Source: Energy Storage Association

Zinc-Bromine (ZnBr) Flow Batteries
October 16, 2019 | Pg. 38
• However, the high cell voltage and highly oxidative element, bromine, demand cell electrodes, membranes, and fluid handling components that can withstand the chemical conditions. Bromine is a highly toxic material through inhalation and absorption. Special cell design and operating modes are required to achieve reliable operation.
• Integrated Zn/Br energy storage systems have been tested on transportable trailers (up to 1 MW/3 MWh) for utility-scale applications. Zn/Br systems are also being supplied at the 5-kW/20-kWh Community Energy Storage (CES) scale, and now being tested by utilities, mostly in Australia.
• The zinc-bromine redox battery offers one of the highest cell voltages and releases two electrons per atom of zinc. These attributes offer the highest energy density among flow batteries.
Source: Energy Storage Association

Iron-Chromium (ICB) Flow Batteries
October 16, 2019 | Pg. 39
• Iron-chromium flow batteries were pioneered and studied extensively by NASA in the 1970s – 1980s and by Mitsui in Japan. It is a redox flow battery (RFB). Energy is stored by employing the Fe2+ – Fe3+ and Cr2+ – Cr3+ redox couples. The active chemical species are fully dissolved in the aqueous electrolyte at all times.
• Like other RFBs, the power and energy ratings of the iron-chromium system are independent of each other, and each may be optimized separately for each application.
• During the discharge cycle, Cr2+ is oxidized to Cr3+ in the negative half-cell and an electron is released to do work in the external circuit through the negative and positive terminals of the AC/DC converter. In the positive half-cell during discharge, Fe3+ accepts an electron from the external circuit and is reduced to Fe2+. These reactions are reversed during charge, when current is supplied from the external circuit through the AC/DC converter.
• Iron-chromium flow batteries are available for telecom back-up at the 5 kW – 3 hour scale and have been demonstrated at utility scale. Current developers are working on reducing cost and enhancing reliability. These systems have the potential to be very cost effective at the MW – MWh scale.
Source: Energy Storage Association
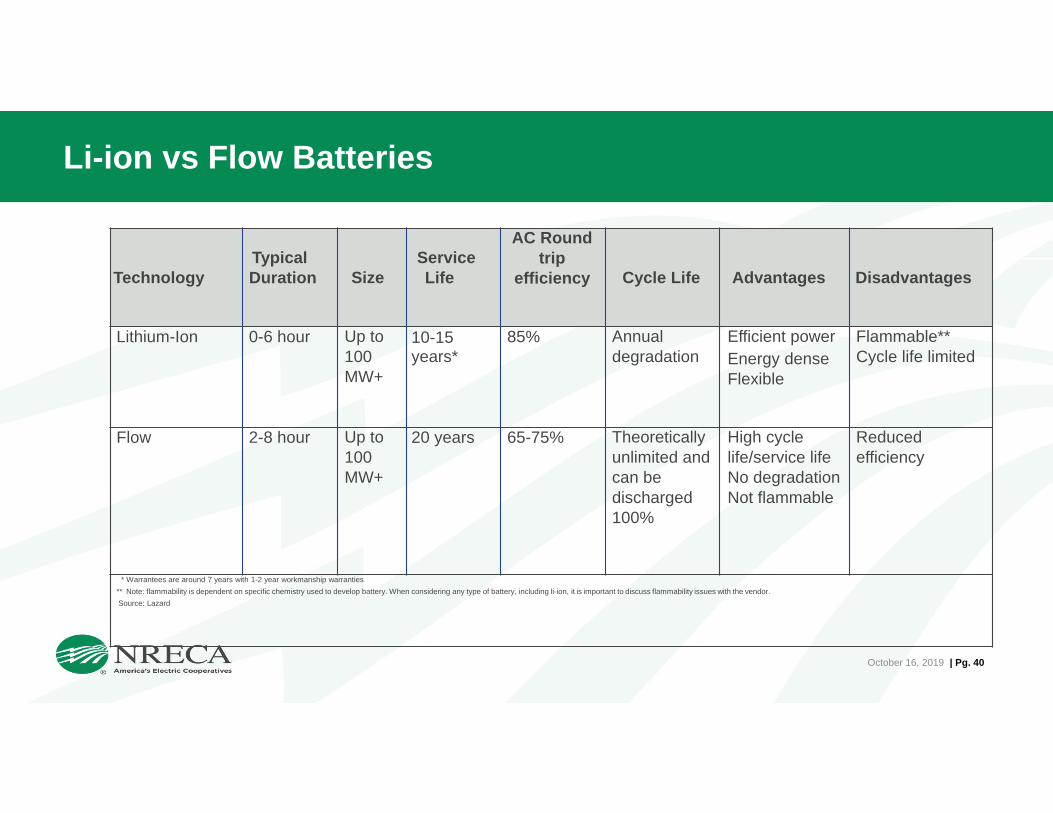
Li-ion vs Flow Batteries
October 16, 2019 | Pg. 40
TechnologyTypical Duration Size
Service Life
AC Round trip
efficiency Cycle Life Advantages Disadvantages
Lithium-Ion 0-6 hour Up to 100 MW+
10-15 years*
85% Annual degradation
Efficient power Energy dense Flexible
Flammable** Cycle life limited
Flow 2-8 hour Up to 100 MW+
20 years 65-75% Theoretically unlimited and can be discharged 100%
High cycle life/service life No degradation Not flammable
Reduced efficiency
* Warrantees are around 7 years with 1-2 year workmanship warranties** Note: flammability is dependent on specific chemistry used to develop battery. When considering any type of battery, including li-ion, it is important to discuss flammability issues with the vendor.Source: Lazard

Nickel-Cadmium (Ni-Cd) Batteries
October 16, 2019 | Pg. 41
• In commercial production since the 1910s, nickel-cadmium (Ni-Cd) is a traditional battery type that has seen periodic advances in electrode technology and packaging in order to remain viable.
• Early Ni-Cd cells used pocket-plate technology, a design that is still in production today. Sintered plates entered production in the mid-20th century, to be followed later by fiber plates, plastic-bonded electrodes and foam plates.
• All industrial Ni-Cd designs are vented types, allowing gases formed on overcharge to be dissipated but requiring some degree of water replenishment to compensate. This has led to the implementation of separator designs that allow varying levels of recombination, with some products designed for telecom or off-grid renewable energy applications achieving near maintenance-free operation with respect to the electrolyte.
• Ni-Cd batteries found use in some earlier energy-storage applications, most notably the Golden Valley Electric Association BESS, sized for 27 megawatts for 15 minutes and commissioned in 2003.
• Ni-Cd has also been used for stabilizing wind-energy systems, with a 3 megawatt system on the island of Bonaire commissioned in 2010 as part of a project for the island to become the first community with 100% of its power derived from sustainable sources.
Source: Energy Storage Association

Sodium Sulfur (NaS) Batteries
October 16, 2019 | Pg. 42
• Sodium Sulfur (NaS) Batteries were originally developed by Ford Motor Company in the 1960s and subsequently the technology was sold to the Japanese company NGK. NGK now manufactures the battery systems for stationary applications.
• The systems operate at a high temperature, 300 to 350 °C, which can be an operational issue for intermittent operation. Significant installations for energy storage have been used to facilitate distribution line construction deferral. The round trip efficiency is in the 90% range.
• The active materials in a NaS battery are molten sulfur as the positive electrode and molten sodium as the negative. The electrodes are separated by a solid ceramic, sodium alumina, which also serves as the electrolyte. This ceramic allows only positively charged sodium-ions to pass through. The battery must be kept hot (typically > 300 ºC) to facilitate the process (i.e., independent heaters are part of the battery system).
• NaS battery technology has been demonstrated at over 190 sites in Japan. More than 270 MW of stored energy suitable for 6 hours of daily peak shaving have been installed. In Abu Dhabi, fifteen NaS systems acting in coordination provide 108 MW / 648 MWh to defer fossil generation investment and provide frequency response and voltage control services.
Source: Energy Storage Association

Rechargeable Zn-MnO2 Batteries• Traditionally primary batteries at $18-25/kWh with a long shelf life• Lowest bill of materials cost, low manufacturing capex• Established supply chain for high volume manufacturing• Readily be produced in larger form factors for grid applications• Do not have the temperature limitations of Li-ion/Pb-acid• Inherently safer, e.g. EPA certified for landfill disposal• Can be recharged with a wide range of current and power rates• The challenge in Zn-MnO2 batteries is reversibility
Source: DOE/CUNY-NewYork/Banerjee

Energy generated by Niagara Falls: 60 GWh/day
Why Zinc Anodes for Energy Storage?
18mZinc
Lithium
Lead
Metal volume to electrochemically store the electricity generated by Niagara Falls/day
Materials cost to store electricity: Niagara Falls /day
Zinc
Lithium
Lead
$ 100 million
$ 400 million
$ 300 million
Known worldwide resources
Lead (83M MTon)
Zinc (230M MTon)
Lithium (14M MTon)
Source: DOE/CUNY-NewYork/Banerjee
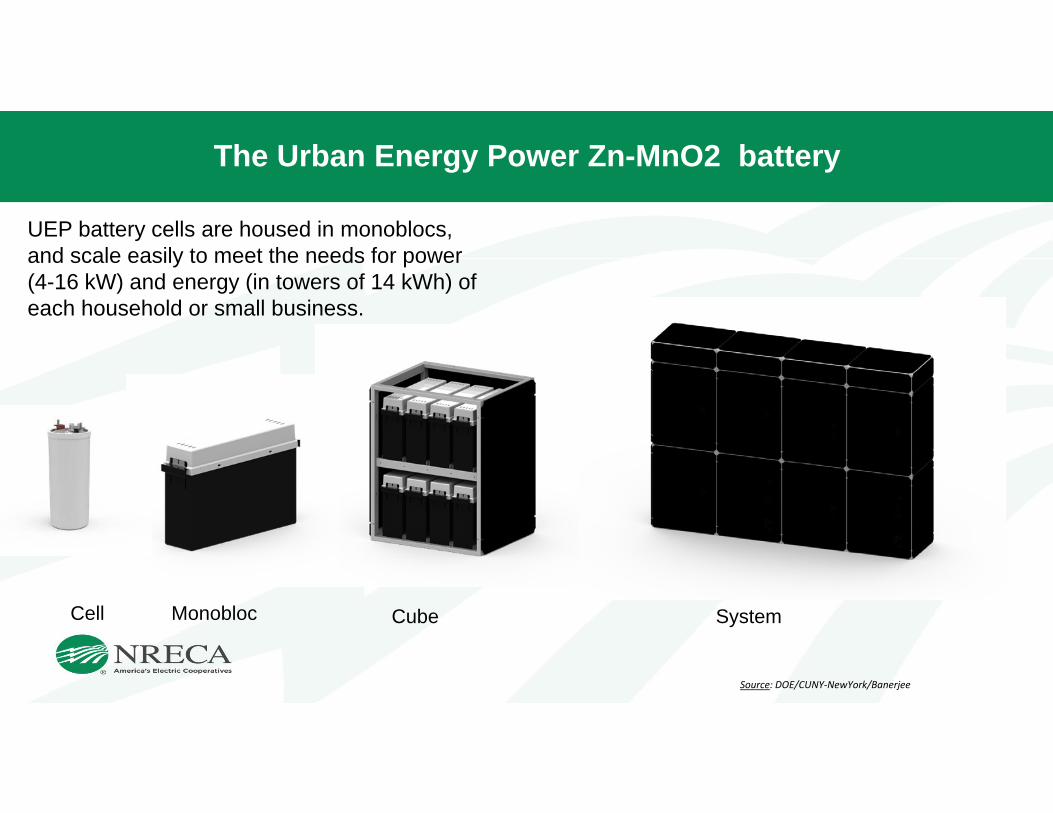
UEP battery cells are housed in monoblocs, and scale easily to meet the needs for power (4-16 kW) and energy (in towers of 14 kWh) of each household or small business.
Cell Monobloc Cube System
The Urban Energy Power Zn-MnO2 battery
Source: DOE/CUNY-NewYork/Banerjee

Tesla Powerwall 2
LG Chem Resu 10h
UEP Power Assurance
TowerRetail Price $6,700 $7,500 $5,500
Nominal Storage (kWh) 14.0 9.8 14.0
List Price per kWh $479 $765 $400
Current UEP product is cost competitive with lithium-ion home backup systems
Zn-MnO2 Battery solutions
Source: DOE/CUNY-NewYork/Banerjee
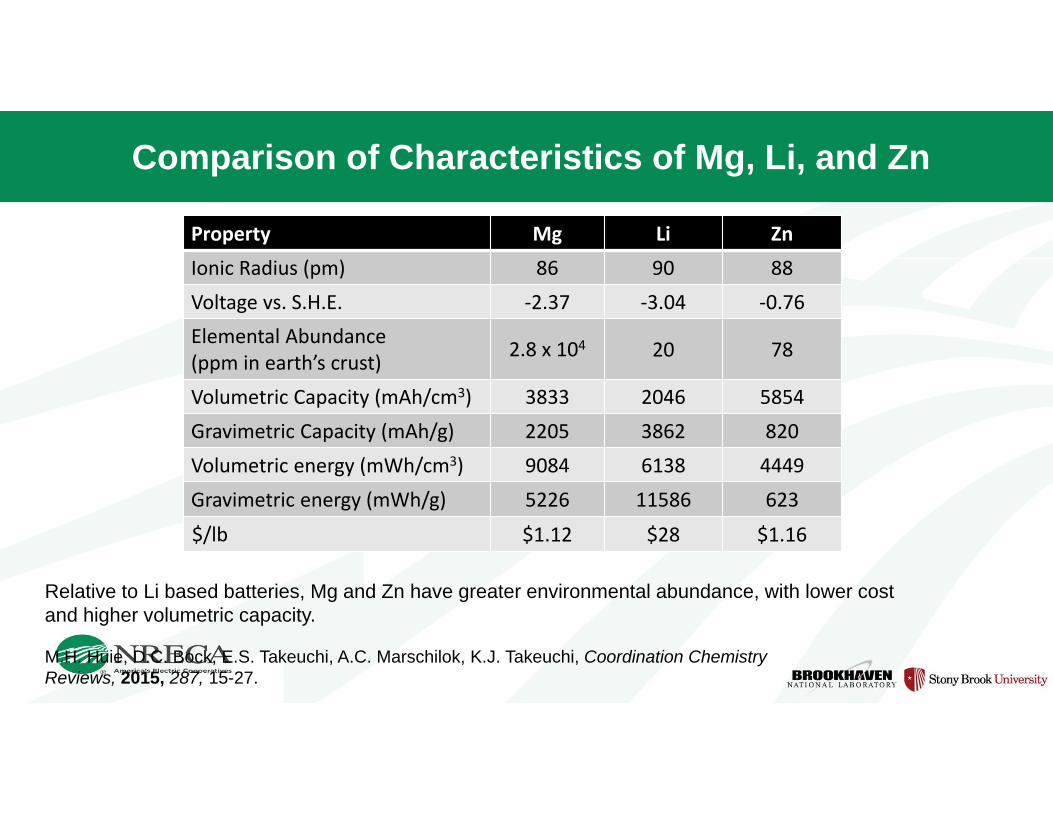
Comparison of Characteristics of Mg, Li, and Zn
Property Mg Li ZnIonic Radius (pm) 86 90 88Voltage vs. S.H.E. -2.37 -3.04 -0.76Elemental Abundance (ppm in earth’s crust) 2.8 x 10⁴ 20 78
Volumetric Capacity (mAh/cm3) 3833 2046 5854Gravimetric Capacity (mAh/g) 2205 3862 820Volumetric energy (mWh/cm3) 9084 6138 4449Gravimetric energy (mWh/g) 5226 11586 623$/lb $1.12 $28 $1.16
Relative to Li based batteries, Mg and Zn have greater environmental abundance, with lower cost and higher volumetric capacity.
M.H. Huie, D.C. Bock, E.S. Takeuchi, A.C. Marschilok, K.J. Takeuchi, Coordination Chemistry Reviews, 2015, 287, 15-27.
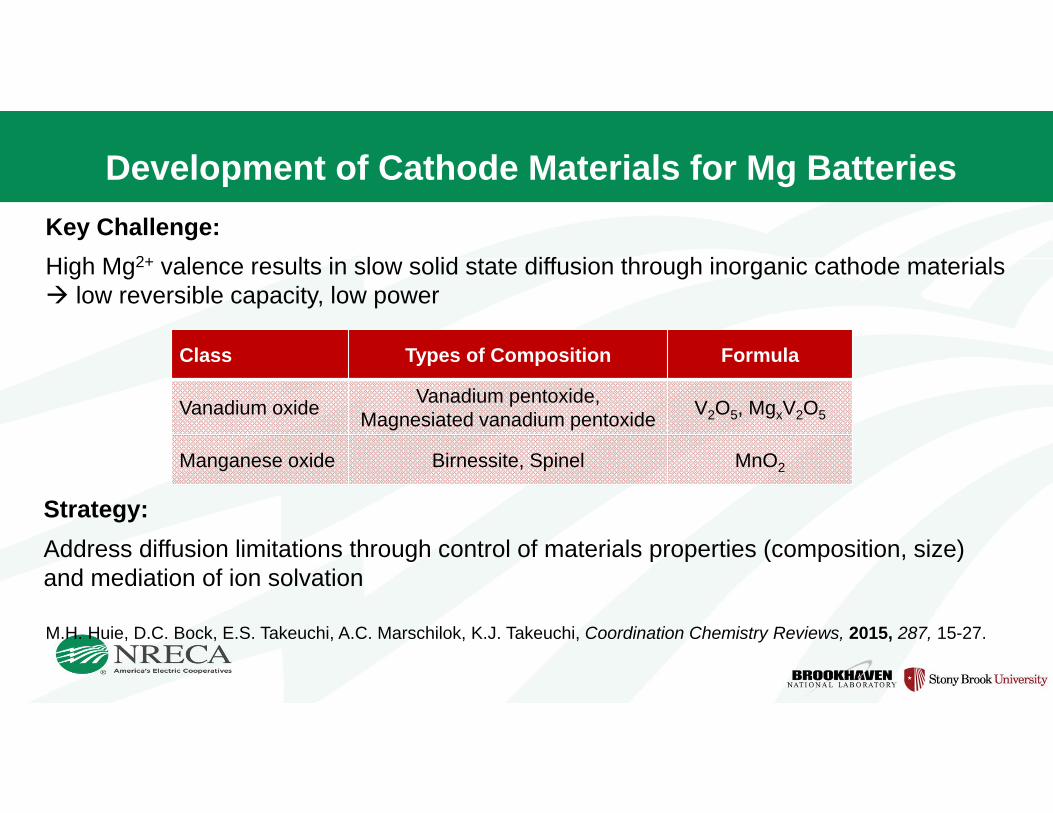
Development of Cathode Materials for Mg BatteriesKey Challenge:High Mg2+ valence results in slow solid state diffusion through inorganic cathode materials low reversible capacity, low power
Class Types of Composition Formula
Vanadium oxide Vanadium pentoxide, Magnesiated vanadium pentoxide V2O5, MgxV2O5
Manganese oxide Birnessite, Spinel MnO2
M.H. Huie, D.C. Bock, E.S. Takeuchi, A.C. Marschilok, K.J. Takeuchi, Coordination Chemistry Reviews, 2015, 287, 15-27.
Strategy:Address diffusion limitations through control of materials properties (composition, size) and mediation of ion solvation

Development of Cathode Materials for Mg BatteriesMgxV2O5
J. Yin, C.J. Pelliccione, S.H. Lee, E.S. Takeuchi, K.J. Takeuchi, A.C. Marschilok, J. Electrochem. Soc., 2016, 163(9), A1.
Mg0.1V2O5·2.35H2O yielded discharge capacity of 140 mAh/g with near 100% efficiency, and energy density of 420 mWh/g in Mg system.
Cu-Bir-I (Cu0/Cu2+) improved capacity retention over Cu-Bir-II (Cu2+) and Na-Bir (Na+) in Li system. Electrochemical activity in Mg system established.
CuxMnO2 and NaxMnO2
Y.R. Li, A.S. Poyraz, X. Hu, M. Cuiffo, C.R. Clayton, L. Wu, Y. Zhu, E.S. Takeuchi, A.C. Marschilok, K.J. Takeuchi, J. Electrochem. Soc., 2017, 164, A2151.
MgxMnO2
Small crystallite size yielded superior reversibility in Mg system.
MgxMn2O4
J. Yin, E.S. Takeuchi, K.J. Takeuchi, A.C. Marschilok, Inorg. Chim. Acta, 2016, 453, 230.
Small crystallite size with hydrous electrolyte maintained >160 mAh/g over 40 cycles in Mg system.J. Yin, A.B. Brady, E.S. Takeuchi, A.C.Marschilok, K.J. Takeuchi, Chem. Comm.2017, 53(26), 3665.
Source: DOE

Electrochemical Capacitors (EC)
October 16, 2019 | Pg. 50
• There are two types of ECs: those with 1) symmetric designs, where both positive and negative electrodes are made of the same material and 2) asymmetric designs with different materials for the two electrodes. Symmetric ECs have specific energy values up to ~6 Wh/kg and higher power performance than asymmetric capacitors which can have higher specific energy values.
• When the two electrodes of an EC are connected in an external current path, current flows until complete charge balance is achieved. The capacitor can then be returned to its charged state by applying voltage. Because the charge is stored physically, with no chemical or phase changes taking place, the process is fast and highly reversible.
• The operational voltage of one cell is limited only by the breakdown potential of the electrolyte and is usually less than 3 V. Thus, cells are connected in series for higher voltage operation, exactly like battery cells.
• ECs are suited for applications requiring high cycle life and charge or discharge times of 1 second or less. The largest barrierto market growth has been the lack of understanding of the technology and the applications for which it is best suited. Aqueous electrolyte asymmetric EC technology offers opportunities to achieve exceptionally low-cost bulk energy storage.
• Advantages of ECs include long cycle life, good efficiency, low life-cycle costs, and adequate energy density.
Source: Energy Storage Association

Hydrogen Storage
October 16, 2019 | Pg. 51
• Electricity can be converted into hydrogen by electrolysis. The hydrogen can be then stored and eventually re-electrified in fuel cells or burned in combined cycle gas power plants.
• The conversion efficiency currently is about 65%~70%. High temperature electrolyzers under development could increase efficiencies up to 90%.
• Small amounts of hydrogen can be stored in pressurized vessels, or solid metal hydrides or nanotubes can store hydrogen at a high density.
• Larger amounts of hydrogen can be stored in underground salt caverns of up to 500,000 cubic meters at 2,900 psi, which would mean about 100 GWh of stored electricity.
Source: Energy Storage Association
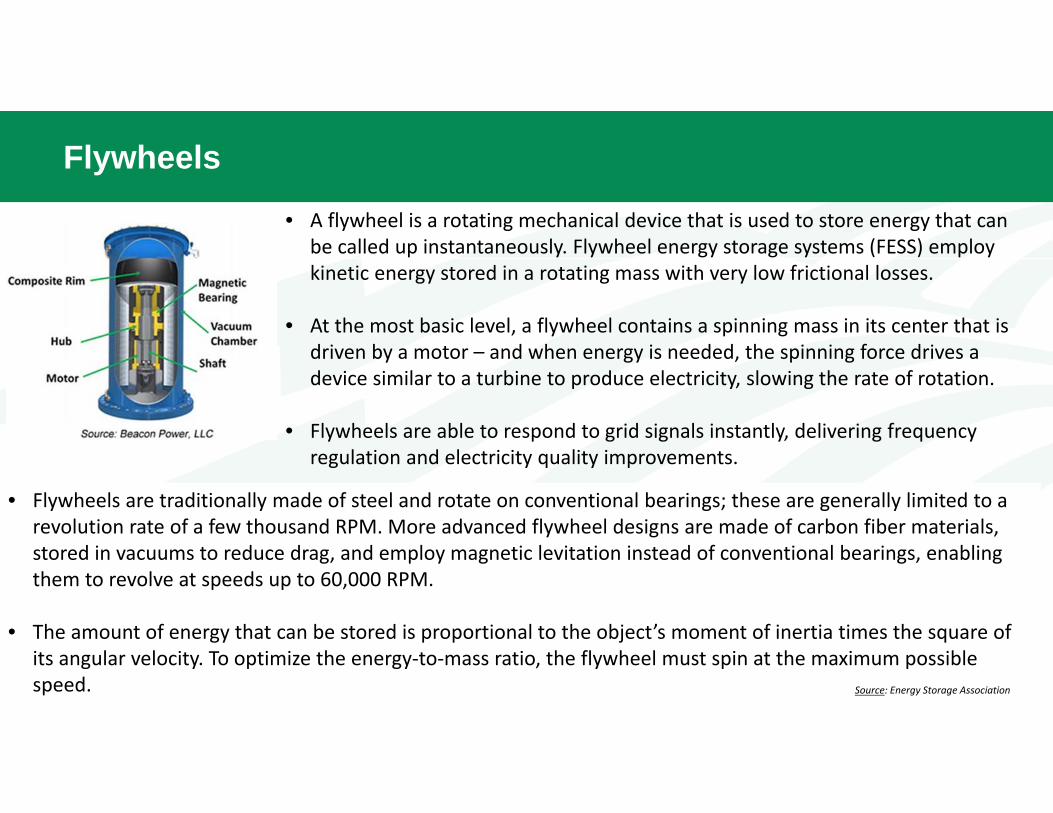
Flywheels
October 16, 2019 | Pg. 52
• A flywheel is a rotating mechanical device that is used to store energy that can be called up instantaneously. Flywheel energy storage systems (FESS) employ kinetic energy stored in a rotating mass with very low frictional losses.
• At the most basic level, a flywheel contains a spinning mass in its center that is driven by a motor – and when energy is needed, the spinning force drives a device similar to a turbine to produce electricity, slowing the rate of rotation.
• Flywheels are able to respond to grid signals instantly, delivering frequency regulation and electricity quality improvements.
• Flywheels are traditionally made of steel and rotate on conventional bearings; these are generally limited to a revolution rate of a few thousand RPM. More advanced flywheel designs are made of carbon fiber materials, stored in vacuums to reduce drag, and employ magnetic levitation instead of conventional bearings, enabling them to revolve at speeds up to 60,000 RPM.
• The amount of energy that can be stored is proportional to the object’s moment of inertia times the square of its angular velocity. To optimize the energy-to-mass ratio, the flywheel must spin at the maximum possible speed. Source: Energy Storage Association
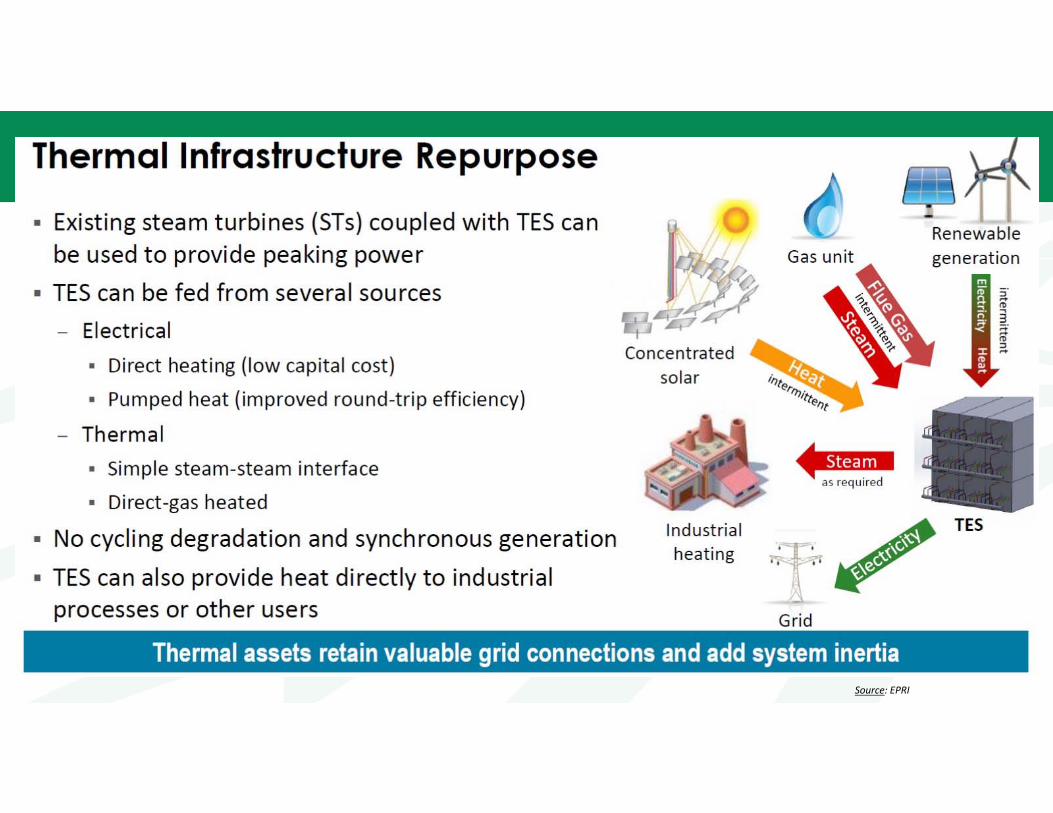
Concrete
Source: EPRI

Example: Concrete Thermal Energy Storage Integrated with Natural Gas Combined Cycle
CTES is flexible – delivering more peak power when needed
CTES decouples steam turbine plant from gas turbine (time and scale)
Concrete
Source: EPRI

Concrete
Source: Echogen/EPRI
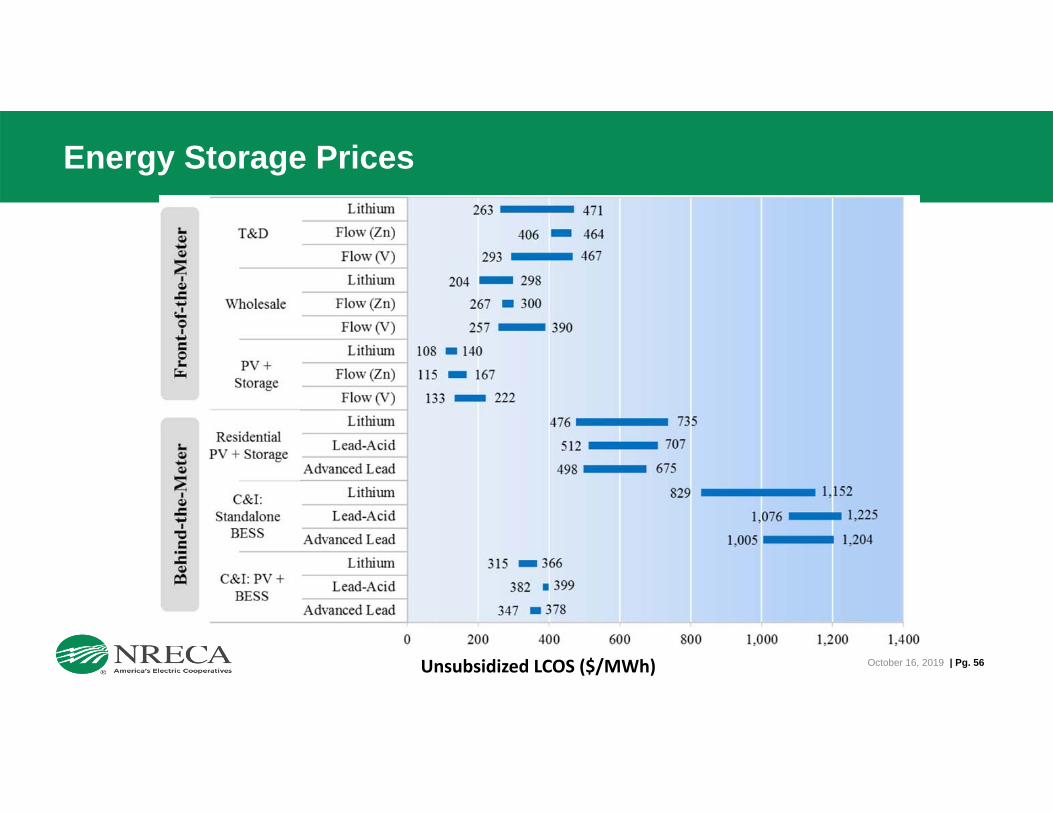
Energy Storage Prices
October 16, 2019 | Pg. 56Unsubsidized LCOS ($/MWh)

Li-ion Battery Module Costs Trends & Outlook
October 16, 2019 | Pg. 57

Another Perspective on battery cost reductions …
October 16, 2019 | Pg. 58

October 16, 2019 | Pg. 59
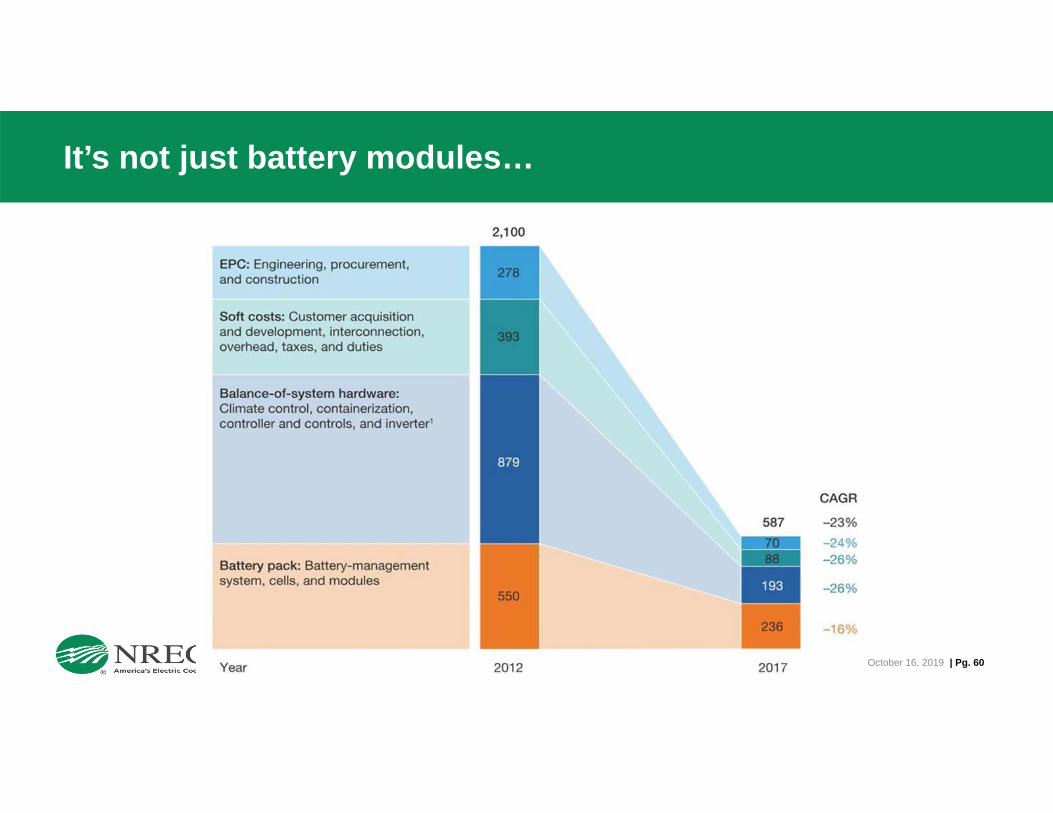
It’s not just battery modules…
October 16, 2019 | Pg. 60

Batteries cost components breakdown
October 16, 2019 | Pg. 61
Source: IHS-Markit

Costs for Various Battery raw materials
October 16, 2019 | Pg. 62
Source: Visual Capitalist

Li-ion Batteries Raw material price trajectories and risk mitigation
October 16, 2019 | Pg. 63Source: IHS-Markit

Li-ion Batteries (cells) $100/kWh
V/V Flow Batteries (stack+PE) $300/kWh___________________________________________________________________
Zinc Manganese Oxide (Zn-MnO2)2 Electron System $ 50/kWh
Low Temperature Na / Na-ionbased Batteries $ 60/kWh
Aqueous Soluble Organic (ASO) Redox Flow Batteries (stack+PE) $125/kWh_____________________________________________________________________
Advanced Lead Acid $ 35/kWh
DOE-OE-Energy Storage Program Cost Goals(Manufactured at Scale)
Source: DOE/Imre Gyuk

Chan
ge p
er N
orm
alize
d Cu
mul
ativ
e Di
scha
rge
Li-ion battery performance testing for grid servicesCapacity Loss
0.08%
0.06%
0.04%
0.02%
0.00%
LFP (2.6Ah) NCA (3.2Ah) NMC (3.2Ah) NMC (3.0Ah)
BS EV FR PS(higher Co) (higher Ni)
65
Source: DOE/PNNL

Li-ion battery performance testing for grid services
LFP cells have better aging, capacity, and energy retention. Frequency regulation service degrades the least per energy utilized. Almost twice large capacity loss is observed between two different
battery chemistries.
Higher SOC level degrades the battery the most. dV/dQ analyses and be applied for in-situ battery health monitoring.
Cathode dissolution occurs for NCA and NMC cells.
Source: DOE/PNNL

Li-ion battery performance – lessons learned from one project
• Calendar aging capacity loss of 1.5% per year, our chemistry is estimated at 0.5%• Capacity loss is kWh; kW remains near constant, round trip DC efficiency drops slightly• Deep cycling causes rapid loss of life, shallow cycling extends life and total kWh throughput• Frequency controls (small charges/discharges) can occur while bulk charging/discharging• Removal, recycling, replacing a full battery set can cost 60% of initial package cost.• Delivery times are fairly short, < 12 mo. From award to receipt• Factory warranties and required annual maintenance are expensive• Control algorithms are complex• Integration into a microgrid is costly and complex• Significant improvements can be expected through careful monitoring and iterative
optimizations
Source: Cordova Electric Cooperative/Clay Koplin

Coordination Across Safety, Reliability and Performance
Product/Reliability Standards
Installation Standards
NFPA, ICC, NEC
UL, IEC IEC, EPRIPerformance
Standards
Source: DOE/PNNL

Battery Standards and Model Codes Hierarchy
BUILT ENVIRONMENT
INSTALLATION / APPLICATION
ENERGY STORAGE SYSTEMS
SYSTEM COMPONENTS
NFPA 855 NFPA 70 UL 9540 A
DNVGL GRIDSTOR FM GLOBAL 5-33 NECA 416 & 416
UL 9540 ASME TES-1 NFPA 791
UL 1973 UL 1974 UL 810A UL1741
CSA 22.2 No. 340-201 IEEE 1547 IEEE 1679 Series
ICC IFC, ICC IRC, ICC IBC NFPA 5000 NFPA 1
IEEE C2 IEEE 1635/ASHRAE 21 IEEE P1578
Source: DOE/PNNL

Determining Infrastructure Challenges….

Battery Deployment Locations – Implications for utilities?
October 16, 2019 | Pg. 71

Thank you!Venkat BanunarayananBusiness & Technology Strategies National Rural Electric Cooperatives Association703 907 [email protected]
72