Embed Size (px)
Citation preview
NATURE CLIMATE CHANGE | VOL 5 | JUNE 2015 | www.nature.com/natureclimatechange 519
Avoiding ‘dangerous anthropogenic interference with the climate system’1 is the ultimate objective of international climate negotiations. This objective is explicitly sup-
ported by all 195 countries that are represented within the United Nations Framework Convention on Climate Change1 (UNFCCC). However, climate impacts are not distributed evenly over the globe2, and local capacities to adapt to or cope with these impacts can differ significantly among regions. This is one reason why, so far, no strong political consensus has been reached about what level of climate change is to be considered ‘dangerous’3, and there-fore what unambiguously defined level of global warming should be avoided.
Since the 2010 Cancún Agreements4, all countries represented within the UNFCCC have recognized that strong emission reduc-tions are required to achieve the long-term global goal of limiting warming to below 2 °C relative to pre-industrial levels. At the same time, a periodical review of the adequacy of this long-term goal with respect to the convention’s ultimate objective was decided on, the first of which is currently underway and is to be concluded by the end of 2015. This periodic review needs to be understood from the perspective that more than half of the world’s countries represented within the UNFCCC consider that the local impacts projected for a 2 °C world are already beyond what their societies would be able to cope with, in the short or long term. This group of countries, which includes the Alliance of Small Island States5,6 (AOSIS) and the least-developed countries6 (LDCs), therefore support and pur-sue the introduction of a more stringent global temperature limit of 1.5 °C as part of a future agreement. Furthermore, the IPCC’s assessment of incremental climate impacts (see ref. 7) has elevated the importance of considering a long-term global goal more strin-gent than 2 °C.
Options for limiting the global mean temperature increase to below 1.5 °C have therefore become of central interest to the
Energy system transformations for limiting end-of-century warming to below 1.5 °CJoeri Rogelj1,2*, Gunnar Luderer3*, Robert C. Pietzcker3, Elmar Kriegler3, Michiel Schaeffer4,5, Volker Krey1 and Keywan Riahi1,6
Many impacts projected for a global warming level of 2 °C relative to pre-industrial levels may exceed the coping capacities of particularly vulnerable countries. Therefore, many countries advocate limiting warming to below 1.5 °C. Here we analyse integrated energy–economy–environment scenarios that keep warming to below 1.5 °C by 2100. We find that in such scenar-ios, energy-system transformations are in many aspects similar to 2 °C-consistent scenarios, but show a faster scale-up of mitigation action in most sectors, leading to observable differences in emission reductions in 2030 and 2050. The move from a 2 °C- to a 1.5 °C-consistent world will be achieved mainly through additional reductions of CO2. This implies an earlier transition to net zero carbon emissions worldwide, to be achieved between 2045 and 2060. Energy efficiency and stringent early reduc-tions are key to retain a possibility for limiting warming to below 1.5 °C by 2100. The window for achieving this goal is small and rapidly closing.
UNFCCC process. Historical temperatures have already increased by a total of 0.78 °C (0.72–0.85 °C, 90% confidence interval)8 between 1850–1900 and 2003–2012. Furthermore, steadily increas-ing global carbon emissions8–10 are committing the world to increas-ing levels of long-term warming owing to cumulative historical emissions and lock-in of carbon-intensive energy infrastructure. Limiting warming to below 1.5 °C is thus undoubtedly a very chal-lenging task.
We here characterize scenarios consistent with a 1.5 °C tempera-ture limit by 2100 relative to pre-industrial levels and describe their differences with respect to scenarios that limit warming to below 2 °C. We base our study on the integrated assessment modelling lit-erature and look at six different aspects: (1) emissions in the short and long term; (2) the pace of the energy-system transformation; (3) the contribution of different sectors of the energy system; (4) the importance of critical technologies such as carbon capture and stor-age (CCS); (5) implications for climate policy; and (6) the costs and financial needs in terms of investments.
So far, only a few studies11–15 have reported scenarios consistent with a 1.5 °C limit, and no study focuses specifically on the energy-system characteristics of 1.5 °C scenarios or includes results from multiple integrated assessment models (IAMs). Here we fill this gap by drawing on a set of more than 200 low stabilization scenarios from the MESSAGE12,13 and REMIND11 IAMs. Owing to their representation of a wide variety of emission reduction options, MESSAGE and REMIND are classified as models that are ‘highly responsive’ to climate policy16. They are thus well-suited for ana-lysing very deep decarbonization pathways, which other models may not find feasible. Some other studies were not included here because they do not provide the desired sectorial detail15 or looked at the 1.5 °C target beyond the twenty-first century14. Future tem-perature change is projected with the MAGICC17 model in a proba-bilistic set-up18,19 (Methods). Despite being a simple carbon cycle
1Energy Program, International Institute for Applied Systems Analysis (IIASA), Schlossplatz 1, A-2361 Laxenburg, Austria. 2Institute for Atmospheric and Climate Science, ETH Zurich, Universitätstrasse 16, 8092 Zürich, Switzerland. 3Potsdam Institute for Climate Impact Research (PIK), PO Box 60 12 03, 14412 Potsdam, Germany. 4Climate Analytics, Telegrafenberg A26, 14412 Potsdam, Germany. 5Environmental Systems Analysis Group, Wageningen University and Research Centre, PO Box 47, 6700 AA Wageningen, The Netherlands. 6Graz University of Technology, Inffeldgasse, A-8010 Graz, Austria. *e-mail: [email protected]; [email protected]
PERSPECTIVEPUBLISHED ONLINE: 21 MAY 2015 | DOI: 10.1038/NCLIMATE2572
© 2016 Macmillan Publishers Limited. All rights reserved
520 NATURE CLIMATE CHANGE | VOL 5 | JUNE 2015 | www.nature.com/natureclimatechange
and climate model, global mean temperature changes computed with this set-up of MAGICC closely match the results of complex general circulation models (see refs 18, 20–22). The Supplementary Information compares this study to the IPCC Fifth Assessment Report (AR5).
The 1.5 °C targetClimate targets can be expressed in a variety of ways. However, there are uncertainties associated with how the Earth system responds to anthropogenic forcing. Therefore, temperature targets are com-monly expressed in terms of a specific temperature limit and a mini-mum probability of observing that limit23–25. These probabilities can be assessed at any point in time. Most 2 °C studies have focused on scenarios that do not fall below a certain probability during the entire century19,24,25. However, no scenarios that have a high proba-bility of limiting warming to below the 1.5 °C limit during the entire twenty-first century exist in the literature. Typically, 1.5 °C scenarios temporarily have lower probabilities of staying below 1.5 °C dur-ing a certain period of the twenty-first century than in 2100. This is referred to as a temperature ‘overshoot’.
Here we group the scenarios according to the end-of-century probability for limiting warming to below 1.5 °C and, in addi-tion, explore the likelihoods of not exceeding 2 °C at any point in time. In summary, we distinguish three categories that broadly reflect the most prominent temperature objectives discussed in policy circles24.
1.5 °C scenarios (or 1.5 °C-consistent scenarios). Scenarios that return warming to below 1.5 °C relative to pre-industrial levels by 2100 with greater than 50% chance. All these scenarios also have a likely26 (>66%) chance of keeping global warming below 2 °C in the twenty-first century.
Likely 2 °C scenarios. Scenarios that have a likely26 (>66%) chance of keeping maximum global warming in the twenty-first century below 2 °C relative to pre-industrial levels, but have a less than 50% chance of not returning warming to below 1.5 °C by 2100.
Medium 2 °C scenarios. Scenarios that have a medium (50–66%) chance24 of keeping maximum global warming in the twenty-first century below 2 °C relative to pre-industrial levels, and have yet a lower chance of limiting warming to below 1.5 °C by 2100.
Using the labels defined above, 1.5 °C scenarios are the focus here. We assess their difference with respect to likely and medium 2 °C scenarios. At times, the combination of likely 2 °C scenarios and medium 2 °C scenarios is referred to as ‘2 °C scenarios’ in short, if findings apply to both sets of scenarios.
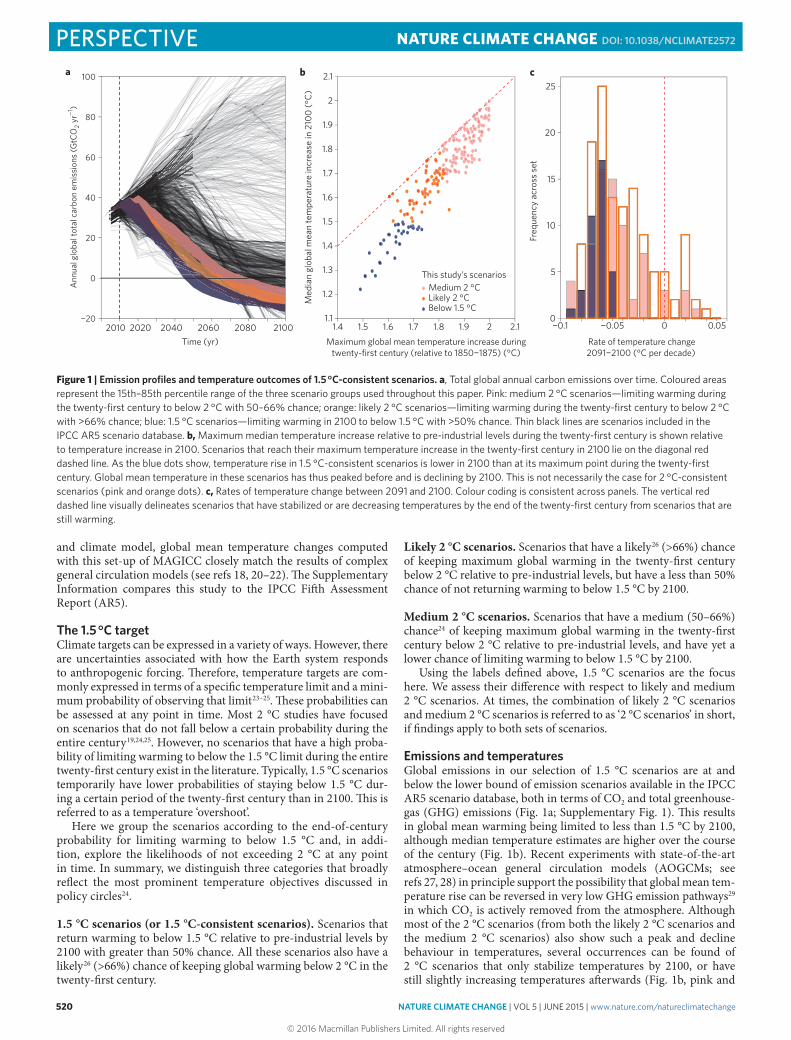
Emissions and temperaturesGlobal emissions in our selection of 1.5 °C scenarios are at and below the lower bound of emission scenarios available in the IPCC AR5 scenario database, both in terms of CO2 and total greenhouse-gas (GHG) emissions (Fig. 1a; Supplementary Fig. 1). This results in global mean warming being limited to less than 1.5 °C by 2100, although median temperature estimates are higher over the course of the century (Fig. 1b). Recent experiments with state-of-the-art atmosphere–ocean general circulation models (AOGCMs; see refs 27, 28) in principle support the possibility that global mean tem-perature rise can be reversed in very low GHG emission pathways29 in which CO2 is actively removed from the atmosphere. Although most of the 2 °C scenarios (from both the likely 2 °C scenarios and the medium 2 °C scenarios) also show such a peak and decline behaviour in temperatures, several occurrences can be found of 2 °C scenarios that only stabilize temperatures by 2100, or have still slightly increasing temperatures afterwards (Fig. 1b, pink and
−0.1 −0.05 0 0.050
5
10
15
20
25
Rate of temperature change2091−2100 (°C per decade)
Freq
uenc
y ac
ross
set
2010 2020 2040 2060 2080 2100−20
0
20
40
60
80
100
Time (yr)
Ann
ual g
loba
l tot
al c
arbo
n em
issi
ons
(GtC
O2 y
r−1)
Maximum global mean temperature increase duringtwenty-first century (relative to 1850−1875) (°C)
Med
ian
glob
al m
ean
tem
pera
ture
incr
ease
in 2
100
(°C
)
Medium 2 °CLikely 2 °CBelow 1.5 °C
This study’s scenarios
a
1.4 1.5 1.6 1.7 1.8 1.9 2 2.11.1
1.2
1.3
1.4
1.5
1.6
1.7
1.8
1.9
2
2.1b c
Figure 1 | Emission profiles and temperature outcomes of 1.5 °C-consistent scenarios. a, Total global annual carbon emissions over time. Coloured areas represent the 15th–85th percentile range of the three scenario groups used throughout this paper. Pink: medium 2 °C scenarios—limiting warming during the twenty-first century to below 2 °C with 50–66% chance; orange: likely 2 °C scenarios—limiting warming during the twenty-first century to below 2 °C with >66% chance; blue: 1.5 °C scenarios—limiting warming in 2100 to below 1.5 °C with >50% chance. Thin black lines are scenarios included in the IPCC AR5 scenario database. b, Maximum median temperature increase relative to pre-industrial levels during the twenty-first century is shown relative to temperature increase in 2100. Scenarios that reach their maximum temperature increase in the twenty-first century in 2100 lie on the diagonal red dashed line. As the blue dots show, temperature rise in 1.5 °C-consistent scenarios is lower in 2100 than at its maximum point during the twenty-first century. Global mean temperature in these scenarios has thus peaked before and is declining by 2100. This is not necessarily the case for 2 °C-consistent scenarios (pink and orange dots). c, Rates of temperature change between 2091 and 2100. Colour coding is consistent across panels. The vertical red dashed line visually delineates scenarios that have stabilized or are decreasing temperatures by the end of the twenty-first century from scenarios that are still warming.
PERSPECTIVE NATURE CLIMATE CHANGE DOI: 10.1038/NCLIMATE2572
© 2016 Macmillan Publishers Limited. All rights reserved
NATURE CLIMATE CHANGE | VOL 5 | JUNE 2015 | www.nature.com/natureclimatechange 521
orange symbols). In contrast, all the 1.5 °C scenarios show a peak and decline of temperature. By the end of the century (2091–2100) global mean temperatures are declining again by at least about 0.05 °C per decade (Fig. 1c).
The lower 2100 temperatures of 1.5 °C scenarios are driven by lower CO2-equivalent (CO2e) concentrations by the end of the century. The 1.5 °C scenarios assessed here have a range of 420–440 parts per million (ppm) CO2e in 2100, while likely and medium 2 °C scenarios show ranges of 455–480 and 480–515 ppm CO2e, respectively (all ranges in this paper refer to the 15th–85th percentile range unless explicitly indicated other-wise). For comparison, the lowest scenario category of the IPCC Working Group III contribution to AR5 has 430–480 ppm CO2e in 2100. In contrast to temperatures, CO2e concentrations peak and decline in virtually all 1.5 °C and 2 °C scenarios in our set (except for a few medium 2 °C scenarios).
Maximum global mean warming is proportional to the cumu-lative amount of long-lived GHG emissions (particularly CO2) until the peak of warming8,19,30–34. Although radiation-modify-ing species other than CO2 contribute to anthropogenic climate change, CO2-induced warming is the dominant factor35. In 1.5 °C scenarios, a long-term peak and decline of temperatures is asso-ciated with cumulative carbon emissions having peaked during the twenty-first century. At some point, CO2 is thus overall being (net) removed from—instead of emitted into—the atmosphere by the activities of the global energy and land-use system. How these scenarios achieve such CO2 removal is discussed in more detail below.
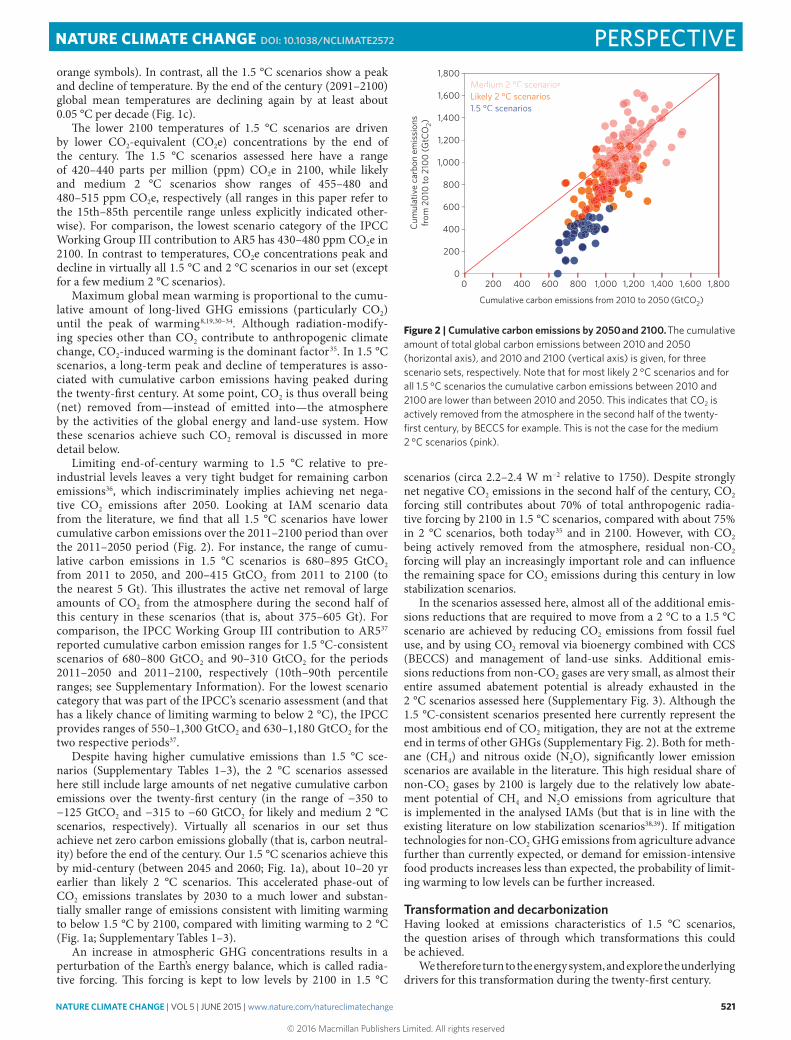
Limiting end-of-century warming to 1.5 °C relative to pre-industrial levels leaves a very tight budget for remaining carbon emissions36, which indiscriminately implies achieving net nega-tive CO2 emissions after 2050. Looking at IAM scenario data from the literature, we find that all 1.5 °C scenarios have lower cumulative carbon emissions over the 2011–2100 period than over the 2011–2050 period (Fig. 2). For instance, the range of cumu-lative carbon emissions in 1.5 °C scenarios is 680–895 GtCO2 from 2011 to 2050, and 200–415 GtCO2 from 2011 to 2100 (to the nearest 5 Gt). This illustrates the active net removal of large amounts of CO2 from the atmosphere during the second half of this century in these scenarios (that is, about 375–605 Gt). For comparison, the IPCC Working Group III contribution to AR537 reported cumulative carbon emission ranges for 1.5 °C-consistent scenarios of 680–800 GtCO2 and 90–310 GtCO2 for the periods 2011–2050 and 2011–2100, respectively (10th–90th percentile ranges; see Supplementary Information). For the lowest scenario category that was part of the IPCC’s scenario assessment (and that has a likely chance of limiting warming to below 2 °C), the IPCC provides ranges of 550–1,300 GtCO2 and 630–1,180 GtCO2 for the two respective periods37.
Despite having higher cumulative emissions than 1.5 °C sce-narios (Supplementary Tables 1–3), the 2 °C scenarios assessed here still include large amounts of net negative cumulative carbon emissions over the twenty-first century (in the range of −350 to −125 GtCO2 and −315 to −60 GtCO2 for likely and medium 2 °C scenarios, respectively). Virtually all scenarios in our set thus achieve net zero carbon emissions globally (that is, carbon neutral-ity) before the end of the century. Our 1.5 °C scenarios achieve this by mid-century (between 2045 and 2060; Fig. 1a), about 10–20 yr earlier than likely 2 °C scenarios. This accelerated phase-out of CO2 emissions translates by 2030 to a much lower and substan-tially smaller range of emissions consistent with limiting warming to below 1.5 °C by 2100, compared with limiting warming to 2 °C (Fig. 1a; Supplementary Tables 1–3).
An increase in atmospheric GHG concentrations results in a perturbation of the Earth’s energy balance, which is called radia-tive forcing. This forcing is kept to low levels by 2100 in 1.5 °C
scenarios (circa 2.2–2.4 W m−2 relative to 1750). Despite strongly net negative CO2 emissions in the second half of the century, CO2 forcing still contributes about 70% of total anthropogenic radia-tive forcing by 2100 in 1.5 °C scenarios, compared with about 75% in 2 °C scenarios, both today35 and in 2100. However, with CO2 being actively removed from the atmosphere, residual non-CO2 forcing will play an increasingly important role and can influence the remaining space for CO2 emissions during this century in low stabilization scenarios.
In the scenarios assessed here, almost all of the additional emis-sions reductions that are required to move from a 2 °C to a 1.5 °C scenario are achieved by reducing CO2 emissions from fossil fuel use, and by using CO2 removal via bioenergy combined with CCS (BECCS) and management of land-use sinks. Additional emis-sions reductions from non-CO2 gases are very small, as almost their entire assumed abatement potential is already exhausted in the 2 °C scenarios assessed here (Supplementary Fig. 3). Although the 1.5 °C-consistent scenarios presented here currently represent the most ambitious end of CO2 mitigation, they are not at the extreme end in terms of other GHGs (Supplementary Fig. 2). Both for meth-ane (CH4) and nitrous oxide (N2O), significantly lower emission scenarios are available in the literature. This high residual share of non-CO2 gases by 2100 is largely due to the relatively low abate-ment potential of CH4 and N2O emissions from agriculture that is implemented in the analysed IAMs (but that is in line with the existing literature on low stabilization scenarios38,39). If mitigation technologies for non-CO2 GHG emissions from agriculture advance further than currently expected, or demand for emission-intensive food products increases less than expected, the probability of limit-ing warming to low levels can be further increased.
Transformation and decarbonizationHaving looked at emissions characteristics of 1.5 °C scenarios, the question arises of through which transformations this could be achieved.
We therefore turn to the energy system, and explore the underlying drivers for this transformation during the twenty-first century.
0 200 400 600 800 1,000 1,200 1,400 1,600 1,8000
200
400
600
800
1,000
1,200
1,400
1,600
1,800
Cumulative carbon emissions from 2010 to 2050 (GtCO2)
Cum
ulat
ive
carb
on e
mis
sion
sfro
m 2
010
to 2
100
(GtC
O2)
Medium 2 °C scenariosLikely 2 °C scenarios1.5 °C scenarios
Figure 2 | Cumulative carbon emissions by 2050 and 2100. The cumulative amount of total global carbon emissions between 2010 and 2050 (horizontal axis), and 2010 and 2100 (vertical axis) is given, for three scenario sets, respectively. Note that for most likely 2 °C scenarios and for all 1.5 °C scenarios the cumulative carbon emissions between 2010 and 2100 are lower than between 2010 and 2050. This indicates that CO2 is actively removed from the atmosphere in the second half of the twenty-first century, by BECCS for example. This is not the case for the medium 2 °C scenarios (pink).
PERSPECTIVENATURE CLIMATE CHANGE DOI: 10.1038/NCLIMATE2572
© 2016 Macmillan Publishers Limited. All rights reserved
522 NATURE CLIMATE CHANGE | VOL 5 | JUNE 2015 | www.nature.com/natureclimatechange
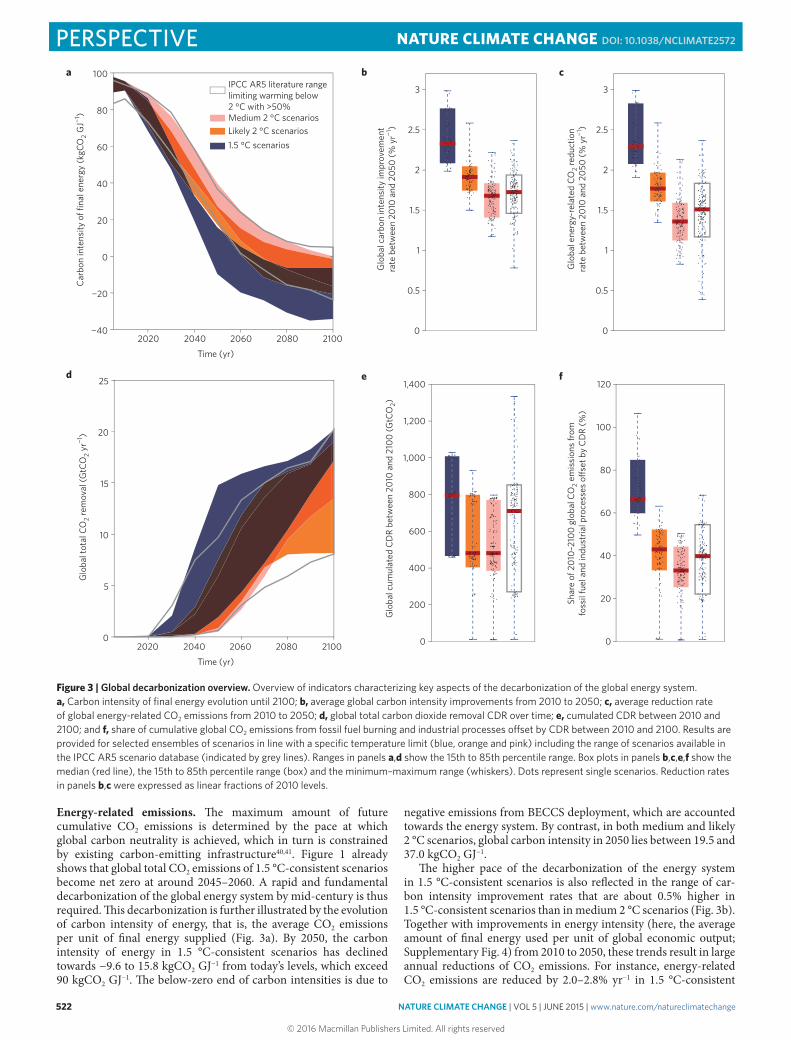
Energy-related emissions. The maximum amount of future cumulative CO2 emissions is determined by the pace at which global carbon neutrality is achieved, which in turn is constrained by existing carbon-emitting infrastructure40,41. Figure 1 already shows that global total CO2 emissions of 1.5 °C-consistent scenarios become net zero at around 2045–2060. A rapid and fundamental decarbonization of the global energy system by mid-century is thus required. This decarbonization is further illustrated by the evolution of carbon intensity of energy, that is, the average CO2 emissions per unit of final energy supplied (Fig. 3a). By 2050, the carbon intensity of energy in 1.5 °C-consistent scenarios has declined towards −9.6 to 15.8 kgCO2 GJ−1 from today’s levels, which exceed 90 kgCO2 GJ−1. The below-zero end of carbon intensities is due to
negative emissions from BECCS deployment, which are accounted towards the energy system. By contrast, in both medium and likely 2 °C scenarios, global carbon intensity in 2050 lies between 19.5 and 37.0 kgCO2 GJ−1.
The higher pace of the decarbonization of the energy system in 1.5 °C-consistent scenarios is also reflected in the range of car-bon intensity improvement rates that are about 0.5% higher in 1.5 °C-consistent scenarios than in medium 2 °C scenarios (Fig. 3b). Together with improvements in energy intensity (here, the average amount of final energy used per unit of global economic output; Supplementary Fig. 4) from 2010 to 2050, these trends result in large annual reductions of CO2 emissions. For instance, energy-related CO2 emissions are reduced by 2.0–2.8% yr−1 in 1.5 °C-consistent
2020 2040 2060 2080 2100−40
−20
0
20
40
60
80
100C
arbo
n in
tens
ity o
f fina
l ene
rgy
(kgC
O2 G
J−1)
0
0.5
1
1.5
2
2.5
3
Glo
bal e
nerg
y-re
late
d CO
2 red
uctio
nra
te b
etw
een
2010
and
205
0 (%
yr−1
)
0
0.5
1
1.5
2
2.5
3
Glo
bal c
arbo
n in
tens
ity im
prov
emen
tra
te b
etw
een
2010
and
205
0 (%
yr−1
)
0
20
40
60
80
100
120
0
200
400
600
800
1,000
1,200
1,400G
loba
l cum
ulat
ed C
DR
betw
een
2010
and
210
0 (G
tCO
2)
2020 2040 2060 2080 21000
5
10
15
20
25
Glo
bal t
otal
CO
2 rem
oval
(GtC
O2 y
r−1)
Time (yr)
Time (yr)
a b c
d e f
1.5 °C scenarios
Medium 2 °C scenarios
IPCC AR5 literature rangelimiting warming below2 °C with >50%
Likely 2 °C scenarios
Shar
e of
201
0–21
00 g
loba
l CO
2 em
issi
ons
from
foss
il fu
el a
nd in
dust
rial p
roce
sses
o�s
et b
y C
DR
(%)
Figure 3 | Global decarbonization overview. Overview of indicators characterizing key aspects of the decarbonization of the global energy system. a, Carbon intensity of final energy evolution until 2100; b, average global carbon intensity improvements from 2010 to 2050; c, average reduction rate of global energy-related CO2 emissions from 2010 to 2050; d, global total carbon dioxide removal CDR over time; e, cumulated CDR between 2010 and 2100; and f, share of cumulative global CO2 emissions from fossil fuel burning and industrial processes offset by CDR between 2010 and 2100. Results are provided for selected ensembles of scenarios in line with a specific temperature limit (blue, orange and pink) including the range of scenarios available in the IPCC AR5 scenario database (indicated by grey lines). Ranges in panels a,d show the 15th to 85th percentile range. Box plots in panels b,c,e,f show the median (red line), the 15th to 85th percentile range (box) and the minimum–maximum range (whiskers). Dots represent single scenarios. Reduction rates in panels b,c were expressed as linear fractions of 2010 levels.
PERSPECTIVE NATURE CLIMATE CHANGE DOI: 10.1038/NCLIMATE2572
© 2016 Macmillan Publishers Limited. All rights reserved
NATURE CLIMATE CHANGE | VOL 5 | JUNE 2015 | www.nature.com/natureclimatechange 523
scenarios relative to 2010 levels, compared with 1.2–1.8% yr−1 in 2 °C-consistent scenarios available in the IPCC scenario database (Fig. 3c). We here express annual reductions as a fraction of 2010 emission levels over time. Sometimes exponential growth rates are used to express annual reductions22. However, while the latter approach is well-suited to describe increasing or asymptotically declining trends, it cannot capture emission reductions of pathways that achieve net negative emissions levels at some point during the investigated period.
Disassembling accelerated decarbonization. The first step in a comprehensive transformation of the energy system is a decarboni-zation of the electricity system22,42–44. Both 1.5 °C and likely 2 °C sce-narios in our set emit almost zero carbon emissions from electricity by 2050. This transformation is achieved more quickly in 1.5 °C scenarios though, with median CO2 emissions from electricity in 1.5 °C scenarios being already about 35% (55%) lower in 2030 than in likely (medium) 2 °C scenarios (Supplementary Fig. 6a). Freely emitting fossil-based electricity generation is thus phased out ear-lier, and carbon-free technologies are ramped up at a faster pace. By 2030, the median share of low-carbon technologies, that is, renewa-bles, nuclear and CCS, in electricity generation is already more than 10% higher in 1.5 °C-consistent scenarios compared with likely 2 °C scenarios (Supplementary Fig. 5a). Other aspects that foster a decarbonization of the energy system, like the share of electricity in final energy, also show an accelerated increase in 1.5 °C-consistent scenarios (Supplementary Fig. 5b).
Besides the higher near-term pace of electricity decarboniza-tion, significantly greater efforts are required to reduce emissions during the first half of the twenty-first century from the indus-try, buildings, and transport sectors (Supplementary Fig. 6). For example, the transport sector is particularly hard to decarbonize owing to its current dependence on liquid fossil-based fuels com-bined with dispersed combustion45. The 1.5 °C-consistent sce-narios assessed here do not show an increased share of electricity use in the transport sector compared with likely 2 °C scenarios. By 2050, in both these scenario sets about 25% (5–30%) of the energy required in the transport sector comes from electricity (Supplementary Fig. 5d), which is a massive increase from the cur-rent share of lower than 1%. Emissions are thus further reduced by other means, in particular, by demand reductions and the increased use of biofuels in liquid energy carriers (Supplementary Fig. 5c). In summary, 2050 emissions in 1.5 °C scenarios in the industrial, transport and buildings (residential & commercial) sectors are about 25%, 40% and 50% lower than in likely 2 °C sce-narios, respectively. These reductions increase to 40%, 55% and 65% respectively, when compared with medium 2 °C scenarios (Supplementary Fig. 6b–d). Overall this indicates that 1.5 °C sce-narios have reduced flexibility for choosing between decarboniza-tion options and highlights the need to overcome barriers towards realizing the full mitigation potential in the transport and residen-tial sectors37.
Energy efficiency. Future energy demand is an important determi-nant of future CO2 emissions. Dedicated energy efficiency policies could result in an acceleration of energy intensity reductions, rela-tive to the rates observed historically, even in the absence of climate policies. In such low energy intensity scenarios, emission mitigation is less constrained than in scenarios with reference assumptions on energy intensity11–13. Most scenarios that are able to limit warm-ing to below 1.5 °C exemplify such low energy intensity. The set of 1.5 °C scenarios assessed here does not include a single scenario with an average annual energy demand (between 2010 and 2100) of more than 500 EJ yr−1 (in terms of ‘final energy’). In most 1.5 °C scenarios the average energy demand is below 400 EJ yr−1, reflect-ing an increase from today’s 350 EJ yr−1 to about 450 EJ yr−1 by 2100
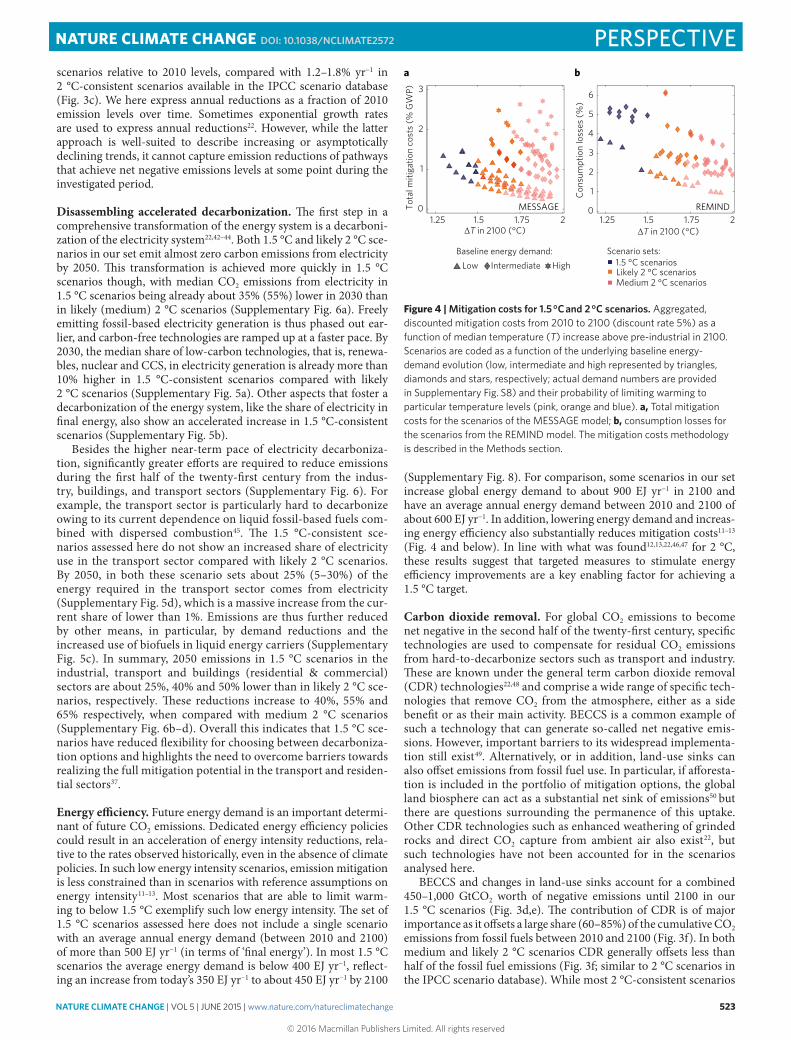
(Supplementary Fig. 8). For comparison, some scenarios in our set increase global energy demand to about 900 EJ yr−1 in 2100 and have an average annual energy demand between 2010 and 2100 of about 600 EJ yr−1. In addition, lowering energy demand and increas-ing energy efficiency also substantially reduces mitigation costs11–13 (Fig. 4 and below). In line with what was found12,13,22,46,47 for 2 °C, these results suggest that targeted measures to stimulate energy efficiency improvements are a key enabling factor for achieving a 1.5 °C target.
Carbon dioxide removal. For global CO2 emissions to become net negative in the second half of the twenty-first century, specific technologies are used to compensate for residual CO2 emissions from hard-to-decarbonize sectors such as transport and industry. These are known under the general term carbon dioxide removal (CDR) technologies22,48 and comprise a wide range of specific tech-nologies that remove CO2 from the atmosphere, either as a side benefit or as their main activity. BECCS is a common example of such a technology that can generate so-called net negative emis-sions. However, important barriers to its widespread implementa-tion still exist49. Alternatively, or in addition, land-use sinks can also offset emissions from fossil fuel use. In particular, if afforesta-tion is included in the portfolio of mitigation options, the global land biosphere can act as a substantial net sink of emissions50 but there are questions surrounding the permanence of this uptake. Other CDR technologies such as enhanced weathering of grinded rocks and direct CO2 capture from ambient air also exist22, but such technologies have not been accounted for in the scenarios analysed here.
BECCS and changes in land-use sinks account for a combined 450–1,000 GtCO2 worth of negative emissions until 2100 in our 1.5 °C scenarios (Fig. 3d,e). The contribution of CDR is of major importance as it offsets a large share (60–85%) of the cumulative CO2 emissions from fossil fuels between 2010 and 2100 (Fig. 3f). In both medium and likely 2 °C scenarios CDR generally offsets less than half of the fossil fuel emissions (Fig. 3f; similar to 2 °C scenarios in the IPCC scenario database). While most 2 °C-consistent scenarios
1.5 °C scenariosLikely 2 °C scenariosMedium 2 °C scenarios
∆T in 2100 (°C)1.25 1.5 1.75 2
0
1
2
3
Tota
l miti
gatio
n co
sts
(% G
WP)
∆T in 2100 (°C)1.25 1.5 1.75 2
0
1
2
3
4
5
6
Con
sum
ptio
n lo
sses
(%)
MESSAGE REMIND
Low Intermediate High Baseline energy demand: Scenario sets:
ba
Figure 4 | Mitigation costs for 1.5 °C and 2 °C scenarios. Aggregated, discounted mitigation costs from 2010 to 2100 (discount rate 5%) as a function of median temperature (T) increase above pre-industrial in 2100. Scenarios are coded as a function of the underlying baseline energy-demand evolution (low, intermediate and high represented by triangles, diamonds and stars, respectively; actual demand numbers are provided in Supplementary Fig. S8) and their probability of limiting warming to particular temperature levels (pink, orange and blue). a, Total mitigation costs for the scenarios of the MESSAGE model; b, consumption losses for the scenarios from the REMIND model. The mitigation costs methodology is described in the Methods section.
PERSPECTIVENATURE CLIMATE CHANGE DOI: 10.1038/NCLIMATE2572
© 2016 Macmillan Publishers Limited. All rights reserved
524 NATURE CLIMATE CHANGE | VOL 5 | JUNE 2015 | www.nature.com/natureclimatechange
thus also strongly rely on CDR, examples with a significantly lower or even zero contribution of negative emissions are available in the literature11–13,43 (albeit at substantially higher costs). Importantly, in all 1.5 °C-consistent scenarios, the bulk of negative emissions are achieved in the second half of the twenty-first century (Fig. 3d). Large-scale application of BECCS or alternative CDR technologies in the second half of the twenty-first century seem indispensable for 1.5 °C scenarios, as temperatures in such scenarios do not have only to stabilize but also to peak and decline. If CDR technologies such as BECCS do not become available on a large scale and at soci-etally acceptable costs, models11,12 are not able to limit cumulative emissions to a level that would restrict warming to 1.5 °C in 2100. This highlights the critical importance of research and demonstra-tion projects exploring the early implementation of large-scale BECCS to develop a real-world sense of the achievability and costs of this technology49.
Mitigation timing and contributionsThe policy assumptions that underlie the scenarios assessed here can inform us about the implications of near-term policy choices for the achievability of 1.5 °C-consistent scenarios. Previous studies11–13, model comparison exercises46,47,51 and the IPCC22 have already high-lighted that globally comprehensive emissions reductions starting in 2020 are instrumental for keeping the 2 °C target within reach. As indicated above, 1.5 °C scenarios have lower emissions in 2030 than 2 °C scenarios. Achieving these reductions by 2030 requires a clear and early signal, which can drive a more radical upscaling of low-carbon investments than in 2 °C-consistent scenarios, already by 2020. A longer delay of action would imply that temperatures would exceed possibly critical levels further and for longer, and that associated climate risks related to nonlinearities in the climate sys-tem response (for example, related to sea-level rise52) would thus be higher.
Countries have typically been subdivided in two main groups in the international climate talks: Annex I and Non-Annex I. Annex I (defined in an appendix to the Kyoto Protocol53) roughly represents developed countries and economies in transition (from the for-mer Soviet Union), whereas Non-Annex I roughly covers emerg-ing economies (such as Brazil or China) and developing countries. The distinctions between these groups are becoming increasingly less clear, for example, with some Non-Annex I countries having a higher gross domestic product per capita than some Annex I coun-tries. Nevertheless, because of their prominence in international climate negotiations, it remains interesting to look at the mitiga-tion contributions of these two groups. We find that, between 2011 and 2100, the cumulative amount of CO2 that is mitigated by Non-Annex I countries (relative to an idealized ‘no policy’ base-line) is about two to four times larger than that of Annex I coun-tries in low emission scenarios (Supplementary Fig. 7). The width of this range is mainly driven by assumptions about future energy demand. However, the main reasons for more mitigation occur-ring in Non-Annex I countries are twofold: (1) the much higher estimated baseline emissions in Non-Annex I countries, driven by population growth, economic growth and the absence of climate mitigation policies (causing estimated cumulative CO2 emissions between 2011 and 2100 under baseline conditions to be 2 to 3 times larger in Non-Annex I than in Annex I, based on the range assessed in ref. 12); and (2) the higher mitigation potentials in developing countries at a given carbon price. In our set, the rela-tive amount of mitigation taking place in Non-Annex I versus that in Annex I diminishes slightly but consistently when moving from 2 °C to 1.5 °C-consistent scenarios. This indicates that an increasing share of the additional mitigation required to move from a 2 °C to a 1.5 °C scenario is carried out in Annex I countries. Important to note is that absolute emissions reductions in both Annex I and Non-Annex I depend strongly on baseline assumptions about energy
Equivalent 2030carbon price Short-term costs
(2010–2030)
Long-term costs
(2010–2100)
CO2 reductions in2050 from industry†
CO2
redu
ctio
ns in
2050
from
bui
ldin
gs†
CO 2 reductio
ns in
2050 from tra
nsportCO
2 reductions in
2050 from electricity
Decarbonization
pace 2010–2050
Cum
ulat
ive
CDR
2010
–210
0
2030 electricity
price*
$
CO2
Cost metrics
CO2 reductionmetrics
100
%
200
%
Legend:
15th
50th
Rang
eof
resu
lts
85th
E�ort to limitwarming to 2 °C
Increased e�ortto achieve 1.5 °CPercentiles:
Relative e�ort increaseto achieve 1.5 °C
2 °C e�ort(66% chance)
Rela
tive
incr
ease
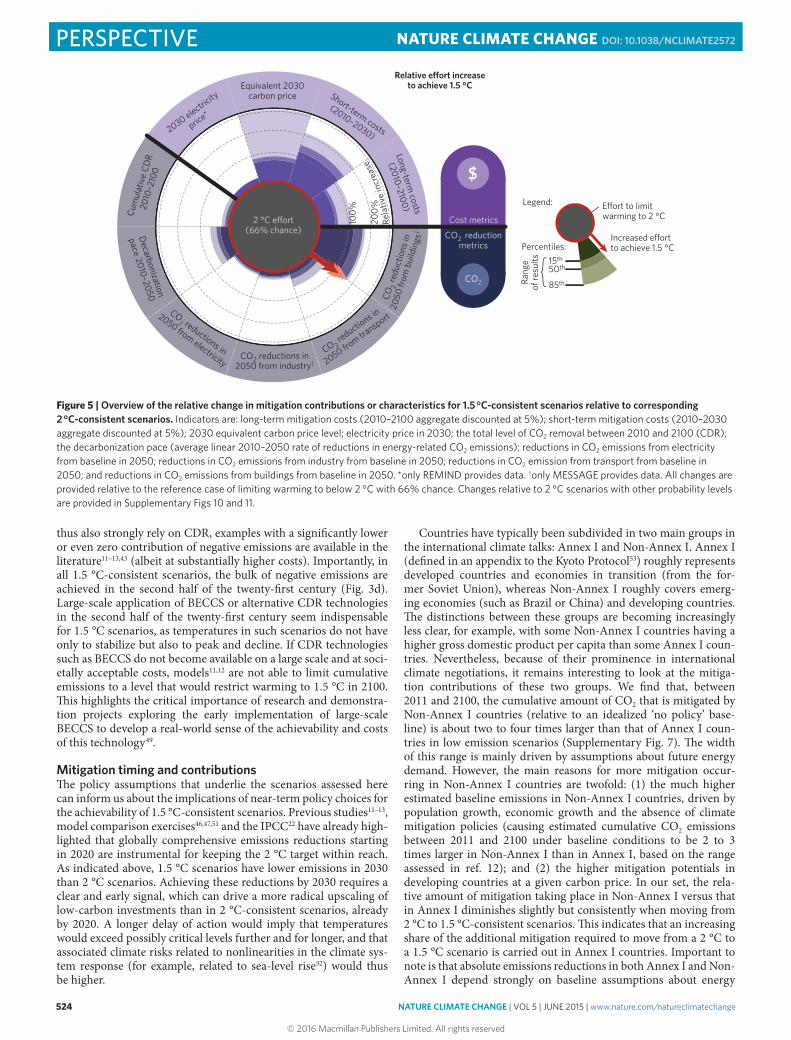
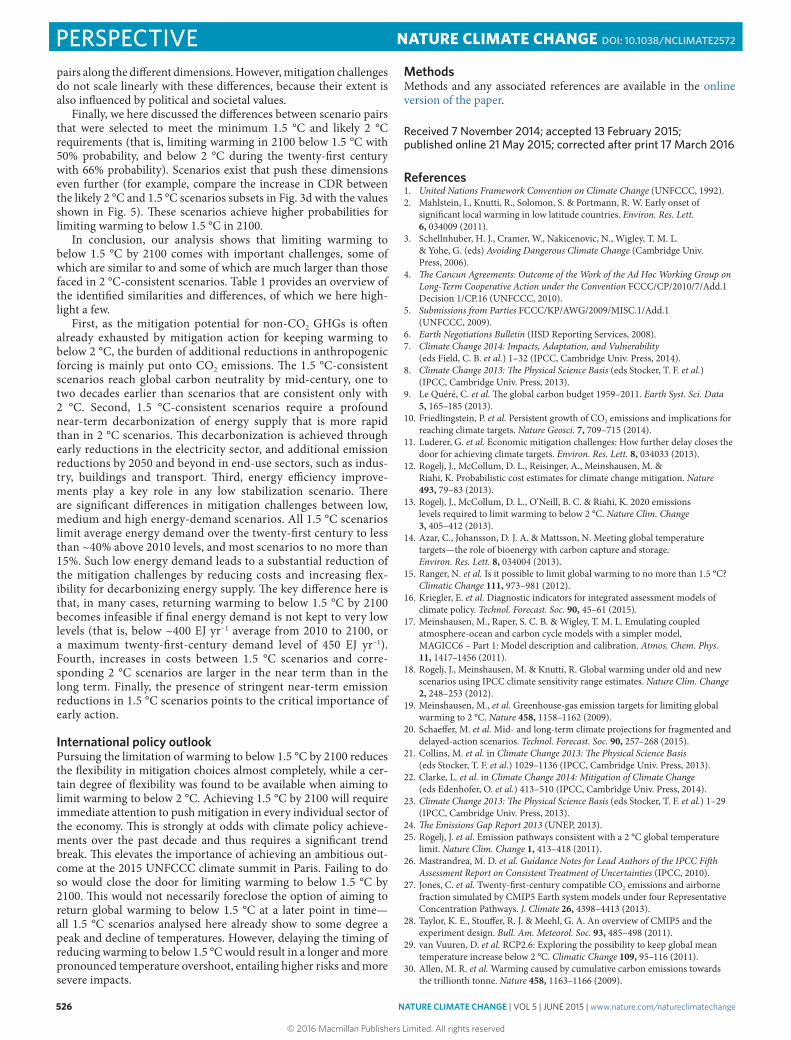
Figure 5 | Overview of the relative change in mitigation contributions or characteristics for 1.5 °C-consistent scenarios relative to corresponding 2 °C-consistent scenarios. Indicators are: long-term mitigation costs (2010–2100 aggregate discounted at 5%); short-term mitigation costs (2010–2030 aggregate discounted at 5%); 2030 equivalent carbon price level; electricity price in 2030; the total level of CO2 removal between 2010 and 2100 (CDR); the decarbonization pace (average linear 2010–2050 rate of reductions in energy-related CO2 emissions); reductions in CO2 emissions from electricity from baseline in 2050; reductions in CO2 emissions from industry from baseline in 2050; reductions in CO2 emission from transport from baseline in 2050; and reductions in CO2 emissions from buildings from baseline in 2050. *only REMIND provides data. †only MESSAGE provides data. All changes are provided relative to the reference case of limiting warming to below 2 °C with 66% chance. Changes relative to 2 °C scenarios with other probability levels are provided in Supplementary Figs 10 and 11.
PERSPECTIVE NATURE CLIMATE CHANGE DOI: 10.1038/NCLIMATE2572
© 2016 Macmillan Publishers Limited. All rights reserved
NATURE CLIMATE CHANGE | VOL 5 | JUNE 2015 | www.nature.com/natureclimatechange 525
intensity improvements and other factors. Those can have a larger impact on regional emissions reductions than the variation of miti-gating stringency (Supplementary Fig. 7).
Economic implicationsGiven the strong connection between emissions, energy use and economic activities, decarbonization efforts will inevitably affect the global economy. Relevant economic indicators of mitigation challenges include carbon prices, which quantify the marginal costs of emissions reductions, as well as aggregate long- or short-term mitigation costs.
As cheap mitigation options are already exhausted in 2 °C scenarios, higher carbon prices are required to further limit warm-ing to 1.5 °C. For example, moving from medium 2 °C scenarios to 1.5 °C scenarios when assuming a default mitigation portfolio implies three or five times higher carbon prices in 2020, based on the analyses of refs. 11 and 12, respectively. Relative to likely 2 °C scenarios, this would be two and three times higher, respec-tively. Many of the 1.5 °C scenarios assessed here assumed carbon prices to be applied from 2010 onwards. Only very few scenar-ios are available that start ramping up carbon prices from 2020 (Supplementary Fig. 9). The additional effort between 1.5 °C and 2 °C scenarios is also reflected in an increase in the mitigation costs aggregated from 2010 to 2100 (Fig. 4). Other assumptions kept the same, achieving a 1.5 °C-consistent scenario is roughly 1.5–2.1 times more costly than achieving a corresponding likely 2 °C scenario (Fig. 5; relative to a medium 2 °C scenario this range would be 2.2–3.7).
As keeping temperatures to below 1.5 °C by 2100 requires a much faster decarbonization of the economy in the coming dec-ades than is the case for 2 °C stabilization, the effect on near-term mitigation costs is particularly pronounced. We find that mitiga-tion costs of 1.5 °C-consistent scenarios between now and 2030 are higher by a factor of 5.2 (4.6–7.1) compared with medium 2 °C sce-narios, and by a factor of 2.5 (2.2–3.1) compared with likely 2 °C scenarios (Fig. 5). While the impact of such transformation path-ways on economic growth amounts to a few tenths of a percentage point per year, and thus constitutes only a modest reduction of the average yearly economic growth rate of around 3% assumed in the models, these costs might still be a relevant barrier to their politi-cal feasibility, particularly if costs are distributed unevenly among
different societal groups. At the same time, it is important to note that the mitigation cost estimates presented here do not account for the economic benefits from, for example, avoided climate damages, reduced air pollution and possibly improved energy security.
Incremental mitigation effortGiven the ongoing UNFCCC review of the long-term global goal, understanding the incremental mitigation efforts required when moving from a 2 °C-consistent towards a 1.5 °C-consistent world becomes important. Limiting warming to below 2 °C will already entail major global challenges11,12,22,24,47,51,54,55. The mini-mum requirements for scenarios in the 1.5 °C range are more ambitious than for the likely 2 °C scenarios, but contributions vary across indicators.
So far, we have focused on the general characteristics of 1.5 °C scenarios and the difference with 2 °C scenarios. To better explore the incremental mitigation effort between 1.5 °C and 2 °C, we now conduct a like-with-like comparison of pairs of scenarios (Fig. 5), that is, between a scenario limiting warming in 2100 to below 1.5 °C with 50% probability and a scenario limiting warming to below 2 °C with 66% probability during the twenty-first century, all other sce-nario aspects kept the same (Methods).
Along some of the dimensions, little difference exists between members of our 1.5 °C and 2 °C scenario pairs, whereas in other dimensions key differences becomes apparent. For instance, as highlighted earlier, most of the supply-side mitigation potential by 2050 is already used when aiming to keep warming to 2 °C with 66% probability. Moving to 1.5 °C thus does not push these 2050 contributions much further but relies on much stronger emission reductions on the end-use side. For example, by 2050, both the reductions in CO2 emissions related to electricity production and in the total amount of CDR during the century show small increases compared with the much stronger additional reductions in the end-use sectors such as industry and, in particular, transport and buildings. Earlier, we also found that 1.5 °C scenarios show a signifi-cantly higher pace of emissions reductions in the coming decades, therefore near-term costs show a much higher increase than the long-term costs over the entire century. We find that the near-term electricity price, however, is only slightly affected.
Importantly, the magnitudes of change shown in Fig. 5 give only an indication of the differences between 1.5 °C and 2 °C scenario
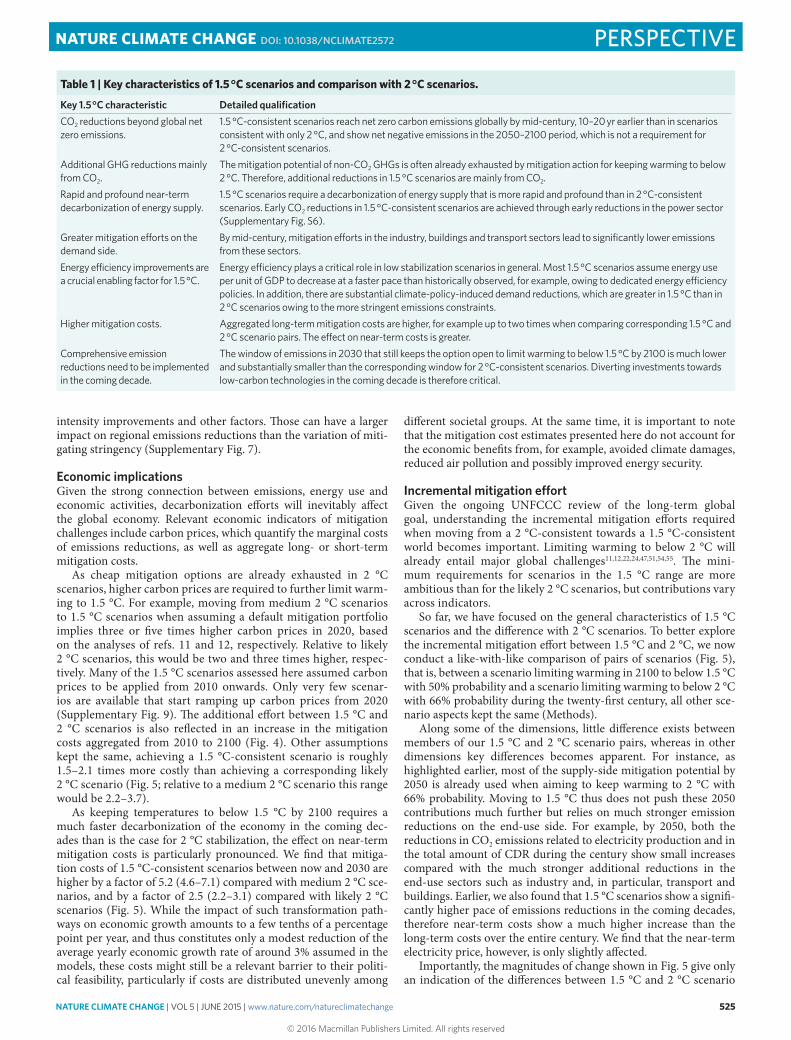
Table 1 | Key characteristics of 1.5 °C scenarios and comparison with 2 °C scenarios.
Key 1.5 °C characteristic Detailed qualificationCO2 reductions beyond global net zero emissions.
1.5 °C-consistent scenarios reach net zero carbon emissions globally by mid-century, 10–20 yr earlier than in scenarios consistent with only 2 °C, and show net negative emissions in the 2050–2100 period, which is not a requirement for 2 °C-consistent scenarios.
Additional GHG reductions mainly from CO2.
The mitigation potential of non-CO2 GHGs is often already exhausted by mitigation action for keeping warming to below 2 °C. Therefore, additional reductions in 1.5 °C scenarios are mainly from CO2.
Rapid and profound near-term decarbonization of energy supply.
1.5 °C scenarios require a decarbonization of energy supply that is more rapid and profound than in 2 °C-consistent scenarios. Early CO2 reductions in 1.5 °C-consistent scenarios are achieved through early reductions in the power sector (Supplementary Fig. S6).
Greater mitigation efforts on the demand side.
By mid-century, mitigation efforts in the industry, buildings and transport sectors lead to significantly lower emissions from these sectors.
Energy efficiency improvements are a crucial enabling factor for 1.5 °C.
Energy efficiency plays a critical role in low stabilization scenarios in general. Most 1.5 °C scenarios assume energy use per unit of GDP to decrease at a faster pace than historically observed, for example, owing to dedicated energy efficiency policies. In addition, there are substantial climate-policy-induced demand reductions, which are greater in 1.5 °C than in 2 °C scenarios owing to the more stringent emissions constraints.
Higher mitigation costs. Aggregated long-term mitigation costs are higher, for example up to two times when comparing corresponding 1.5 °C and 2 °C scenario pairs. The effect on near-term costs is greater.
Comprehensive emission reductions need to be implemented in the coming decade.
The window of emissions in 2030 that still keeps the option open to limit warming to below 1.5 °C by 2100 is much lower and substantially smaller than the corresponding window for 2 °C-consistent scenarios. Diverting investments towards low-carbon technologies in the coming decade is therefore critical.
PERSPECTIVENATURE CLIMATE CHANGE DOI: 10.1038/NCLIMATE2572
© 2016 Macmillan Publishers Limited. All rights reserved
526 NATURE CLIMATE CHANGE | VOL 5 | JUNE 2015 | www.nature.com/natureclimatechange
pairs along the different dimensions. However, mitigation challenges do not scale linearly with these differences, because their extent is also influenced by political and societal values.
Finally, we here discussed the differences between scenario pairs that were selected to meet the minimum 1.5 °C and likely 2 °C requirements (that is, limiting warming in 2100 below 1.5 °C with 50% probability, and below 2 °C during the twenty-first century with 66% probability). Scenarios exist that push these dimensions even further (for example, compare the increase in CDR between the likely 2 °C and 1.5 °C scenarios subsets in Fig. 3d with the values shown in Fig. 5). These scenarios achieve higher probabilities for limiting warming to below 1.5 °C in 2100.
In conclusion, our analysis shows that limiting warming to below 1.5 °C by 2100 comes with important challenges, some of which are similar to and some of which are much larger than those faced in 2 °C-consistent scenarios. Table 1 provides an overview of the identified similarities and differences, of which we here high-light a few.
First, as the mitigation potential for non-CO2 GHGs is often already exhausted by mitigation action for keeping warming to below 2 °C, the burden of additional reductions in anthropogenic forcing is mainly put onto CO2 emissions. The 1.5 °C-consistent scenarios reach global carbon neutrality by mid-century, one to two decades earlier than scenarios that are consistent only with 2 °C. Second, 1.5 °C-consistent scenarios require a profound near-term decarbonization of energy supply that is more rapid than in 2 °C scenarios. This decarbonization is achieved through early reductions in the electricity sector, and additional emission reductions by 2050 and beyond in end-use sectors, such as indus-try, buildings and transport. Third, energy efficiency improve-ments play a key role in any low stabilization scenario. There are significant differences in mitigation challenges between low, medium and high energy-demand scenarios. All 1.5 °C scenarios limit average energy demand over the twenty-first century to less than ~40% above 2010 levels, and most scenarios to no more than 15%. Such low energy demand leads to a substantial reduction of the mitigation challenges by reducing costs and increasing flex-ibility for decarbonizing energy supply. The key difference here is that, in many cases, returning warming to below 1.5 °C by 2100 becomes infeasible if final energy demand is not kept to very low levels (that is, below ~400 EJ yr−1 average from 2010 to 2100, or a maximum twenty-first-century demand level of 450 EJ yr−1). Fourth, increases in costs between 1.5 °C scenarios and corre-sponding 2 °C scenarios are larger in the near term than in the long term. Finally, the presence of stringent near-term emission reductions in 1.5 °C scenarios points to the critical importance of early action.
International policy outlookPursuing the limitation of warming to below 1.5 °C by 2100 reduces the flexibility in mitigation choices almost completely, while a cer-tain degree of flexibility was found to be available when aiming to limit warming to below 2 °C. Achieving 1.5 °C by 2100 will require immediate attention to push mitigation in every individual sector of the economy. This is strongly at odds with climate policy achieve-ments over the past decade and thus requires a significant trend break. This elevates the importance of achieving an ambitious out-come at the 2015 UNFCCC climate summit in Paris. Failing to do so would close the door for limiting warming to below 1.5 °C by 2100. This would not necessarily foreclose the option of aiming to return global warming to below 1.5 °C at a later point in time—all 1.5 °C scenarios analysed here already show to some degree a peak and decline of temperatures. However, delaying the timing of reducing warming to below 1.5 °C would result in a longer and more pronounced temperature overshoot, entailing higher risks and more severe impacts.
MethodsMethods and any associated references are available in the online version of the paper.
Received 7 November 2014; accepted 13 February 2015; published online 21 May 2015; corrected after print 17 March 2016
References1. United Nations Framework Convention on Climate Change (UNFCCC, 1992).2. Mahlstein, I., Knutti, R., Solomon, S. & Portmann, R. W. Early onset of
significant local warming in low latitude countries. Environ. Res. Lett. 6, 034009 (2011).
3. Schellnhuber, H. J., Cramer, W., Nakicenovic, N., Wigley, T. M. L. & Yohe, G. (eds) Avoiding Dangerous Climate Change (Cambridge Univ. Press, 2006).
4. The Cancun Agreements: Outcome of the Work of the Ad Hoc Working Group on Long-Term Cooperative Action under the Convention FCCC/CP/2010/7/Add.1 Decision 1/CP.16 (UNFCCC, 2010).
5. Submissions from Parties FCCC/KP/AWG/2009/MISC.1/Add.1 (UNFCCC, 2009).
6. Earth Negotiations Bulletin (IISD Reporting Services, 2008). 7. Climate Change 2014: Impacts, Adaptation, and Vulnerability
(eds Field, C. B. et al.) 1–32 (IPCC, Cambridge Univ. Press, 2014).8. Climate Change 2013: The Physical Science Basis (eds Stocker, T. F. et al.)
(IPCC, Cambridge Univ. Press, 2013).9. Le Quéré, C. et al. The global carbon budget 1959–2011. Earth Syst. Sci. Data
5, 165–185 (2013).10. Friedlingstein, P. et al. Persistent growth of CO2 emissions and implications for
reaching climate targets. Nature Geosci. 7, 709–715 (2014).11. Luderer, G. et al. Economic mitigation challenges: How further delay closes the
door for achieving climate targets. Environ. Res. Lett. 8, 034033 (2013).12. Rogelj, J., McCollum, D. L., Reisinger, A., Meinshausen, M. &
Riahi, K. Probabilistic cost estimates for climate change mitigation. Nature 493, 79–83 (2013).
13. Rogelj, J., McCollum, D. L., O’Neill, B. C. & Riahi, K. 2020 emissions levels required to limit warming to below 2 °C. Nature Clim. Change 3, 405–412 (2013).
14. Azar, C., Johansson, D. J. A. & Mattsson, N. Meeting global temperature targets—the role of bioenergy with carbon capture and storage. Environ. Res. Lett. 8, 034004 (2013).
15. Ranger, N. et al. Is it possible to limit global warming to no more than 1.5 °C? Climatic Change 111, 973–981 (2012).
16. Kriegler, E. et al. Diagnostic indicators for integrated assessment models of climate policy. Technol. Forecast. Soc. 90, 45–61 (2015).
17. Meinshausen, M., Raper, S. C. B. & Wigley, T. M. L. Emulating coupled atmosphere-ocean and carbon cycle models with a simpler model, MAGICC6 – Part 1: Model description and calibration. Atmos. Chem. Phys. 11, 1417–1456 (2011).
18. Rogelj, J., Meinshausen, M. & Knutti, R. Global warming under old and new scenarios using IPCC climate sensitivity range estimates. Nature Clim. Change 2, 248–253 (2012).
19. Meinshausen, M., et al. Greenhouse-gas emission targets for limiting global warming to 2 °C. Nature 458, 1158–1162 (2009).
20. Schaeffer, M. et al. Mid- and long-term climate projections for fragmented and delayed-action scenarios. Technol. Forecast. Soc. 90, 257–268 (2015).
21. Collins, M. et al. in Climate Change 2013: The Physical Science Basis (eds Stocker, T. F. et al.) 1029–1136 (IPCC, Cambridge Univ. Press, 2013).
22. Clarke, L. et al. in Climate Change 2014: Mitigation of Climate Change (eds Edenhofer, O. et al.) 413–510 (IPCC, Cambridge Univ. Press, 2014).
23. Climate Change 2013: The Physical Science Basis (eds Stocker, T. F. et al.) 1–29 (IPCC, Cambridge Univ. Press, 2013).
24. The Emissions Gap Report 2013 (UNEP, 2013).25. Rogelj, J. et al. Emission pathways consistent with a 2 °C global temperature
limit. Nature Clim. Change 1, 413–418 (2011).26. Mastrandrea, M. D. et al. Guidance Notes for Lead Authors of the IPCC Fifth
Assessment Report on Consistent Treatment of Uncertainties (IPCC, 2010).27. Jones, C. et al. Twenty-first-century compatible CO2 emissions and airborne
fraction simulated by CMIP5 Earth system models under four Representative Concentration Pathways. J. Climate 26, 4398–4413 (2013).
28. Taylor, K. E., Stouffer, R. J. & Meehl, G. A. An overview of CMIP5 and the experiment design. Bull. Am. Meteorol. Soc. 93, 485–498 (2011).
29. van Vuuren, D. et al. RCP2.6: Exploring the possibility to keep global mean temperature increase below 2 °C. Climatic Change 109, 95–116 (2011).
30. Allen, M. R. et al. Warming caused by cumulative carbon emissions towards the trillionth tonne. Nature 458, 1163–1166 (2009).
PERSPECTIVE NATURE CLIMATE CHANGE DOI: 10.1038/NCLIMATE2572
© 2016 Macmillan Publishers Limited. All rights reserved
NATURE CLIMATE CHANGE | VOL 5 | JUNE 2015 | www.nature.com/natureclimatechange 527
31. Matthews, H. D., Gillett, N. P., Stott, P. A. & Zickfeld, K. The proportionality of global warming to cumulative carbon emissions. Nature 459, 829–832 (2009).
32. Zickfeld, K., Eby, M., Matthews, H. D. & Weaver, A. J. Setting cumulative emissions targets to reduce the risk of dangerous climate change. Proc. Natl Acad. Sci. USA 106, 16129–16134 (2009).
33. Solomon, S. et al. Persistence of climate changes due to a range of greenhouse gases. Proc. Natl Acad. Sci. USA 107, 18354–18359 (2010).
34. Solomon, S., Plattner. G-K., Knutti, R. & Friedlingstein, P. Irreversible climate change due to carbon dioxide emissions. Proc. Natl Acad. Sci. USA 106, 1704–1709 (2009).
35. Myhre, G. et al. in Climate Change 2013: The Physical Science Basis (eds Stocker, T. F. et al.) 659–740 (IPCC, Cambridge Univ. Press, 2013).
36. Climate Change 2013: The Physical Science Basis (eds Stocker, T. F. et al.) 33–115 (IPCC, Cambridge Univ. Press, 2013).
37. Climate Change 2014: Mitigation of Climate Change (eds Edenhofer, O. et al.) (IPCC, Cambridge Univ. Press, 2014).
38. Weyant, J. P., de la Chesnaye, F. C. & Blanford, G. J. Overview of EMF-21: Multigas mitigation and climate policy. Energ. J. 27, 1–32 (2006).
39. Blanford, G., Kriegler, E. & Tavoni, M. Harmonization vs. fragmentation: Overview of climate policy scenarios in EMF27. Climatic Change 123, 383–396 (2014).
40. Johnson, N. et al. Stranded on a low-carbon planet: Implications of climate policy for the phase-out of coal-based power plants. Technol. Forecast. Soc. 90(A), 89–102 (2014).
41. Davis, S. J., Caldeira, K. & Matthews, H. D. Future CO2 emissions and climate change from existing energy infrastructure. Science 329, 1330–1333 (2010).
42. Krey, V., Luderer, G., Clarke, L. & Kriegler, E. Getting from here to there – energy technology transformation pathways in the EMF27 scenarios. Climatic Change 123, 369–382 (2014).
43. Riahi, K. et al. in Global Energy Assessment - Toward a Sustainable Future (eds Johansson, T. B. et al.) Ch. 17, 1203–1306 (Cambridge Univ. Press and International Institute for Applied Systems Analysis, 2012).
44. Luderer, G. et al. The economics of decarbonizing the energy system—results and insights from the RECIPE model intercomparison. Climatic Change 114, 9–37 (2012).
45. Pietzcker, R. C. et al. Long-term transport energy demand and climate policy: Alternative visions on transport decarbonization in energy-economy models. Energy 64, 95–108 (2014).
46. Luderer, G., Bertram, C., Calvin, K., De Cian, E. & Kriegler, E. Implications of weak near-term climate policies on long-term mitigation pathways. Climatic Change http://dx.doi.org/10.1007/s10584-013-0899-9 (2013).
47. Riahi, K. et al. Locked into Copenhagen pledges — Implications of short-term emission targets for the cost and feasibility of long-term climate goals. Technol. Forecast. Soc. 90, 8–23 (2015).
48. Tavoni, M. & Socolow, R. Modeling meets science and technology: An introduction to a special issue on negative emissions. Climatic Change 118, 1–14 (2013).
49. Fuss, S. et al. Betting on negative emissions. Nature Clim. Change 4, 850–853 (2014).
50. Popp, A. et al. Land-use transition for bioenergy and climate stabilization: Model comparison of drivers, impacts and interactions with other land use based mitigation options. Climatic Change 123, 495–509 (2014).
51. Kriegler, E. et al. What does the 2 °C target imply for a global climate agreement in 2020? The LIMITS study on Durban Platform scenarios. Clim. Change Econ. 4, 1340008 (2013).
52. Bouttes, N., Gregory, J. M. & Lowe, J. A. The reversibility of sea level rise. J. Climate 26, 2502–2513 (2012).
53. Kyoto Protocol to the United Nations Framework Convention on Climate Change (UNFCCC, 1998).
54. Rogelj, J. et al. Copenhagen Accord pledges are paltry. Nature 464, 1126–1128 (2010).
55. Kriegler, E. et al. The role of technology for achieving climate policy objectives: Overview of the EMF 27 study on global technology and climate policy strategies. Climatic Change 123, 353–367 (2014).
AcknowledgementsWe acknowledge the work by IAM modellers that contributed to the IPCC AR5 scenario database and thank IIASA for hosting the IPCC AR5 scenario database.
Author contributionsJ.R. and G.L. designed the research with input from all authors. J.R. coordinated the research. J.R., G.L., E.K., V.K. and R.C.P. carried out the research. J.R. and G.L. wrote the first draft of the manuscript. All authors contributed to analysing the results and writing the paper.
Additional informationSupplementary information is available in the online version of the paper. Reprints and permissions information is available online at www.nature.com/reprints. Correspondence should be addressed to J.R. or G.L.
Competing financial interestsThe authors declare no competing financial interests.
PERSPECTIVENATURE CLIMATE CHANGE DOI: 10.1038/NCLIMATE2572
© 2016 Macmillan Publishers Limited. All rights reserved
NATURE CLIMATE CHANGE | VOL 5 | JUNE 2015 | www.nature.com/natureclimatechange
MethodsThe scenarios assessed here are drawn from three earlier studies11–13. For each multi-gas emission scenario the compliance with a particu-lar global mean temperature target is computed based on a 600-mem-ber ensemble of carbon cycle and climate model simulations with the reduced-complexity carbon cycle and climate model MAGICC17,56, version 6, in a probabilistic set-up19. We use MAGICC in an updated set-up such that the marginal climate sensitivity distribution is consistent with the IPCC AR4 findings18. Consistency with AR5 is discussed in ref. 57. For each multi-gas pathway, the temperature increase is computed relative to pre-industrial levels (1850–1875). CO2-equivalent concentrations (C) are computed from the median total net anthropogenic radiative forcing provided by MAGICC with C = C0e(RF/5.35), in which C0 represents the level of pre-industrial con-centrations (278 ppm CO2), RF is the total net anthropogenic radia-tive forcing in W m−2 and e is Eulers number (approximately 2.72).
Incremental challenges (Fig. 5) between scenarios with a 50% chance of limiting warming to below 1.5 °C in 2100 and scenarios keeping warming to below 2 °C during the twenty-first century with 66% probability are computed by applying the methodologies described in refs 11, 12 and extracting data that corresponds to the respective climate targets. Incremental challenges of 1.5 °C scenar-ios compared with scenarios that keep warming to below 2 °C with 50% or 75% chance are provided in Supplementary Figs 10 and 11. Range estimates in Fig. 5 are based on eight scenario sets created by both the MESSAGE58 and REMIND59 model studies and are defined in Supplementary Table 2.
Figure 4 shows two different cost metrics for scenarios provided by the MESSAGE and REMIND models, respectively. For the REMIND model, mitigation costs are given as consumption losses, expressed relative to global consumption in the baseline scenario in the absence of climate mitigation. For the MESSAGE model, total mitigation costs are provided. These direct total mitigation costs include energy-related investments, operation and maintenance costs, fuel costs, demand-side efficiency costs and non-energy miti-gation costs, and are computed as the increase relative to the total system costs of the baseline scenario without climate mitigation (and with availability of the full technology portfolio). They are reported relative to gross world product (GWP) in the reference baseline. Although these metrics are not fully equivalent, they are comparable as indicators of the scale of the incremental costs incurred by more stringent climate targets.
References56. Meinshausen, M., Wigley, T. M. L. & Raper, S. C. B. Emulating atmosphere–
ocean and carbon cycle models with a simpler model, MAGICC6 – Part 2: Applications. Atmos. Chem. Phys. 11, 1457–1471 (2011).
57. Rogelj, J., Meinshausen, M., Sedláček, J. & Knutti, R. Implications of potentially lower climate sensitivity on climate projections and policy. Environ. Res. Lett. 9, 031003 (2014).
58. Riahi, K., Gruebler, A. & Nakicenovic, N. Scenarios of long-term socio-economic and environmental development under climate stabilization. Technol. Forecast. Soc. 74, 887–935 (2007).
59. Luderer, G. et al. Description of the REMIND model (Version 1.5) (SSRN, 2013).
PERSPECTIVE NATURE CLIMATE CHANGE DOI: 10.1038/NCLIMATE2572
© 2016 Macmillan Publishers Limited. All rights reserved
538 NATURE CLIMATE CHANGE | VOL 6 | MAY 2016 | www.nature.com/natureclimatechange
In the version of this Perspective originally published, the units in Fig. 3a and the corresponding main text should have read kgCO2 GJ−1, not tCO2 GJ−1. This error has been corrected in the online versions of this Perspective.
Corrigendum: Energy system transformations for limiting end-of-century warming to below 1.5 °CJoeri Rogelj, Gunnar Luderer, Robert C. Pietzcker, Elmar Kriegler, Michiel Schaeffer, Volker Krey and Keywan Riahi
Nature Climate Change 5, 519–527 (2015); published online 21 May 2015; corrected after print 17 March 2016
ARTICLES NATURE CLIMATE CHANGE DOI: 10.1038/NCLIMATE2572
© 2016 Macmillan Publishers Limited. All rights reserved