Embed Size (px)
DESCRIPTION
energyplus multizone
Citation preview

EnergyPlus Testing with IEA BESTEST Multi-Zone Non-Airflow In-Depth Diagnostic Cases MZ320 – MZ360 EnergyPlus Version 7.2.0.006 October 2012
Prepared for:
U.S. Department of Energy Energy Efficiency and Renewable Energy Office of Building Technologies Washington, D.C.
Prepared by:
Robert H. Henninger and Michael J. Witte
115 S. Wilke Road, Suite 105 Arlington Heights, IL 60005-1500 USA www.gard.com

This work was supported by the Department of Energy and the National Renewable Energy Laboratory (NREL) through the University of Central Florida. Any opinions, findings, and conclusions or recommendations expressed in this material are those of the author(s) and do not necessarily reflect those of the sponsor. Earlier work was supported by the Ernest Orlando Lawrence Berkeley National Laboratory and by the National Energy Technology Laboratory by subcontract through the University of Central Florida/Florida Solar Energy Center. This report was prepared as an account of work sponsored by an agency of the United States Government. Neither the United States Government nor any agency thereof, nor any of their employees, makes any warranty, express or implied, or assumes any legal liability or responsibility for the accuracy, completeness, or usefulness of any information, apparatus, product, or process disclosed, or represents that its use would not infringe privately owned rights. Reference herein to any specific commercial product, process, or services by trade name, trademark, manufacturer, or otherwise does not necessarily constitute or imply its endorsement, recommendation, or favoring by the United States Government or any agency thereof. The views and opinions of authors expressed herein do not necessarily state or reflect those of the United States Government or any agency thereof.
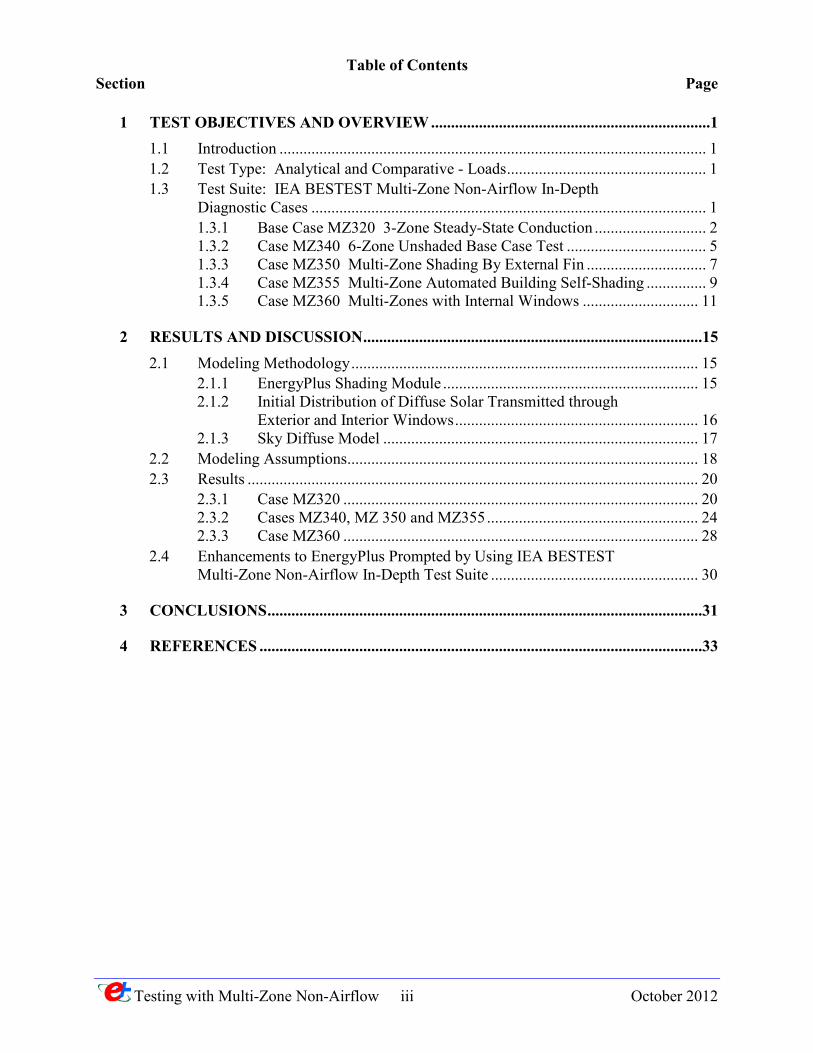
Table of Contents Section Page
Testing with Multi-Zone Non-Airflow iii October 2012
1 TEST OBJECTIVES AND OVERVIEW ......................................................................1
1.1 Introduction ........................................................................................................... 1 1.2 Test Type: Analytical and Comparative - Loads .................................................. 1 1.3 Test Suite: IEA BESTEST Multi-Zone Non-Airflow In-Depth
Diagnostic Cases ................................................................................................... 1 1.3.1 Base Case MZ320 3-Zone Steady-State Conduction ............................ 2 1.3.2 Case MZ340 6-Zone Unshaded Base Case Test ................................... 5 1.3.3 Case MZ350 Multi-Zone Shading By External Fin .............................. 7 1.3.4 Case MZ355 Multi-Zone Automated Building Self-Shading ............... 9 1.3.5 Case MZ360 Multi-Zones with Internal Windows ............................. 11
2 RESULTS AND DISCUSSION .....................................................................................15
2.1 Modeling Methodology ....................................................................................... 15 2.1.1 EnergyPlus Shading Module ................................................................ 15 2.1.2 Initial Distribution of Diffuse Solar Transmitted through
Exterior and Interior Windows ............................................................. 16 2.1.3 Sky Diffuse Model ............................................................................... 17
2.2 Modeling Assumptions ........................................................................................ 18 2.3 Results ................................................................................................................. 20
2.3.1 Case MZ320 ......................................................................................... 20 2.3.2 Cases MZ340, MZ 350 and MZ355 ..................................................... 24 2.3.3 Case MZ360 ......................................................................................... 28
2.4 Enhancements to EnergyPlus Prompted by Using IEA BESTEST Multi-Zone Non-Airflow In-Depth Test Suite .................................................... 30
3 CONCLUSIONS .............................................................................................................31
4 REFERENCES ...............................................................................................................33

Testing with Multi-Zone Non-Airflow iv October 2012
Testing with Multi-Zone Non-Airflow 1 October 2012
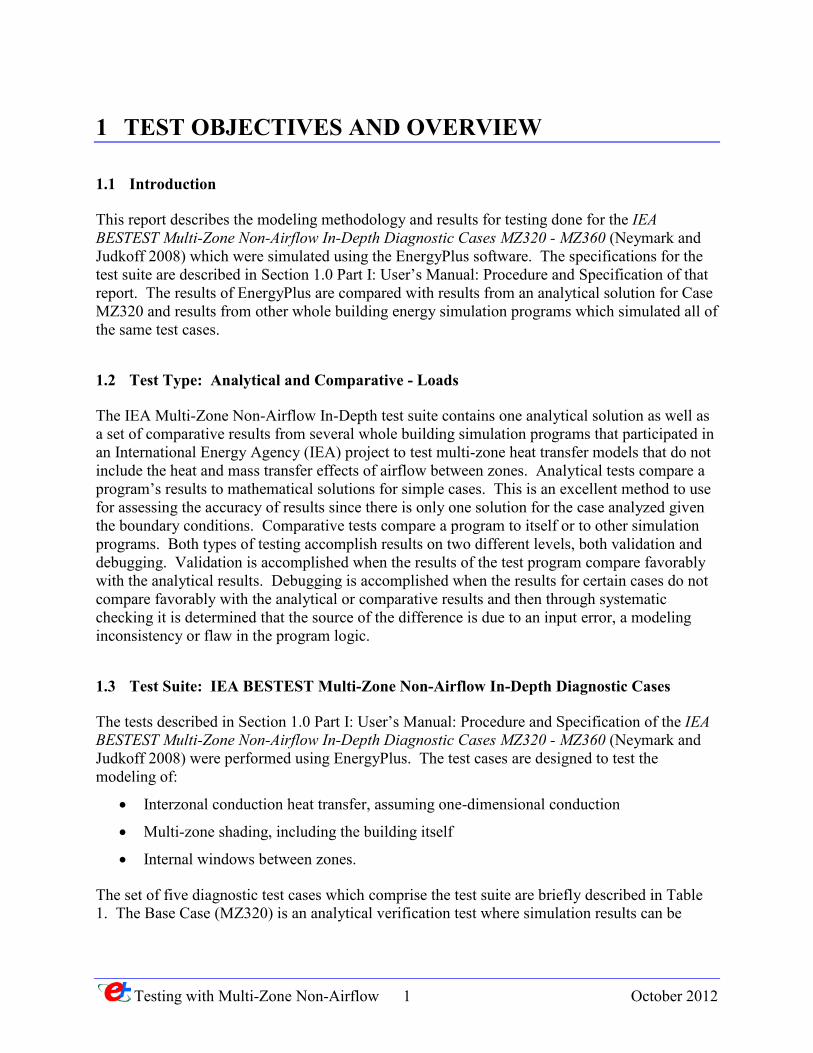
1 TEST OBJECTIVES AND OVERVIEW
1.1 Introduction
This report describes the modeling methodology and results for testing done for the IEA BESTEST Multi-Zone Non-Airflow In-Depth Diagnostic Cases MZ320 - MZ360 (Neymark and Judkoff 2008) which were simulated using the EnergyPlus software. The specifications for the test suite are described in Section 1.0 Part I: User’s Manual: Procedure and Specification of that report. The results of EnergyPlus are compared with results from an analytical solution for Case MZ320 and results from other whole building energy simulation programs which simulated all of the same test cases.
1.2 Test Type: Analytical and Comparative - Loads
The IEA Multi-Zone Non-Airflow In-Depth test suite contains one analytical solution as well as a set of comparative results from several whole building simulation programs that participated in an International Energy Agency (IEA) project to test multi-zone heat transfer models that do not include the heat and mass transfer effects of airflow between zones. Analytical tests compare a program’s results to mathematical solutions for simple cases. This is an excellent method to use for assessing the accuracy of results since there is only one solution for the case analyzed given the boundary conditions. Comparative tests compare a program to itself or to other simulation programs. Both types of testing accomplish results on two different levels, both validation and debugging. Validation is accomplished when the results of the test program compare favorably with the analytical results. Debugging is accomplished when the results for certain cases do not compare favorably with the analytical or comparative results and then through systematic checking it is determined that the source of the difference is due to an input error, a modeling inconsistency or flaw in the program logic.
1.3 Test Suite: IEA BESTEST Multi-Zone Non-Airflow In-Depth Diagnostic Cases
The tests described in Section 1.0 Part I: User’s Manual: Procedure and Specification of the IEA BESTEST Multi-Zone Non-Airflow In-Depth Diagnostic Cases MZ320 - MZ360 (Neymark and Judkoff 2008) were performed using EnergyPlus. The test cases are designed to test the modeling of:
• Interzonal conduction heat transfer, assuming one-dimensional conduction
• Multi-zone shading, including the building itself
• Internal windows between zones.
The set of five diagnostic test cases which comprise the test suite are briefly described in Table 1. The Base Case (MZ320) is an analytical verification test where simulation results can be

Testing with Multi-Zone Non-Airflow 2 October 2012
Table 1 – Multi-Zone Non-Airflow Test Cases (Table 1-1, Neymark & Judkoff 2008)
compared to an analytical solution. The remaining test cases are comparative tests where simulation results are compared to other program results.
1.3.1 Base Case MZ320 3-Zone Steady-State Conduction
This base case tests the steady-state heat conduction between zones in a three zone building with the temperature controlled in one zone and the temperature floating in the other two zones (Figure 1). Constant internal loads within Zones A and B create cooling loads in each zone. Interzonal heat transfer is driven by different temperatures in each zone. Heat transfer is assumed to be one-dimensional conduction. The outdoor air temperature is held constant at 20°C and solar radiation is locked out. A TMY2 format weather file designated as MZ320.TM2 was provided for use with this test. Other characteristics of the building include:
• Zone height 2.7 m
• Internal walls common to and separating the zones from each other have material properties as described in Table 2
• All exterior surfaces including exterior walls, floor and roof have material properties as described in Table 3
• Exterior solar absorptance is 0.0
• Interior solar absorptance is 0.0
• Ground reflectance is 0.0
• The floor is suspended above the ground such that it interacts with outdoor air
• No windows

Testing with Multi-Zone Non-Airflow 3 October 2012
• No infiltration or ventilation
• Internal gains are 100% convective, 0% radiative, 100% sensible, 0% latent
• Zones A and B have no heating or cooling equipment and those zone temperatures are allowed to float. Zone C has an ideal sensible cooling only system which is on if temperature >15°C; otherwise cooling is off. Heating is always off.
The simulation is to be run for one year and results are to be reported for the last hour of the year as follows:
• Sensible cooling load, Zone C, W
• Air temperature, Zone A, °C
• Air temperature, Zone B, °C
• Air temperature, Zone C, °C
Figure 1 – Schematic Diagram of Test Building for Test Case MZ320
Showing Dimensions and Boundary Conditions (Figure 1-1, Neymark and Judkoff 2008)

Testing with Multi-Zone Non-Airflow 4 October 2012
Table 2 – Common Wall Material Properties (Table 1-3a, Neymark & Judkoff 2008)
Table 3 – Exterior Wall Material Properties (Table 1-4a, Neymark & Judkoff 2008)
Testing with Multi-Zone Non-Airflow 5 October 2012
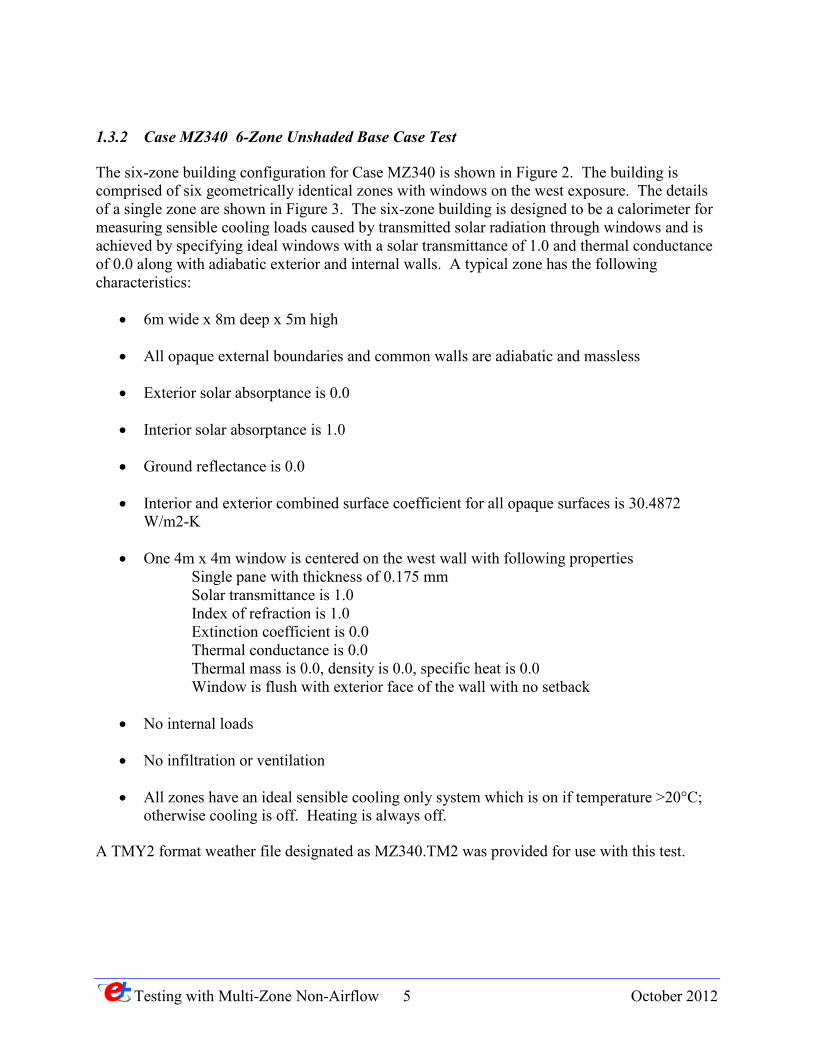
1.3.2 Case MZ340 6-Zone Unshaded Base Case Test
The six-zone building configuration for Case MZ340 is shown in Figure 2. The building is comprised of six geometrically identical zones with windows on the west exposure. The details of a single zone are shown in Figure 3. The six-zone building is designed to be a calorimeter for measuring sensible cooling loads caused by transmitted solar radiation through windows and is achieved by specifying ideal windows with a solar transmittance of 1.0 and thermal conductance of 0.0 along with adiabatic exterior and internal walls. A typical zone has the following characteristics:
• 6m wide x 8m deep x 5m high
• All opaque external boundaries and common walls are adiabatic and massless
• Exterior solar absorptance is 0.0
• Interior solar absorptance is 1.0
• Ground reflectance is 0.0
• Interior and exterior combined surface coefficient for all opaque surfaces is 30.4872 W/m2-K
• One 4m x 4m window is centered on the west wall with following properties Single pane with thickness of 0.175 mm Solar transmittance is 1.0 Index of refraction is 1.0 Extinction coefficient is 0.0 Thermal conductance is 0.0 Thermal mass is 0.0, density is 0.0, specific heat is 0.0 Window is flush with exterior face of the wall with no setback
• No internal loads
• No infiltration or ventilation
• All zones have an ideal sensible cooling only system which is on if temperature >20°C; otherwise cooling is off. Heating is always off.
A TMY2 format weather file designated as MZ340.TM2 was provided for use with this test.

Testing with Multi-Zone Non-Airflow 6 October 2012
Figure 2 – Schematic Diagram of Test Building for Test Case MZ340
(Figure 1-3, Neymark and Judkoff 2008)
Figure 3 – Single Zone Detail for Test Case MZ340
(Figure 1-4, Neymark and Judkoff 2008)

Testing with Multi-Zone Non-Airflow 7 October 2012
The simulation is to be run for one year and results are to be reported as follows:
• Annual sensible cooling load for the entire building and each zone (kWh)
• Annual hourly integrated maximum sensible cooling load and time of occurrence for the entire building and each zone (Wh/h)
• Annual average air temperature for each zone (°C)
• Annual hourly integrated maximum air temperature and time of occurrence for each zone (°C)
• Annual incident total solar radiation (diffuse + direct) and annual incident direct beam and diffuse solar radiation on west facing surface of Zone A (kWh/m2)
• Annual transmitted total solar radiation (diffuse + direct) and annual transmitted direct beam and diffuse solar radiation through each window (kWh)
• Daily hourly transmitted total solar radiation (Wh/h) for Zone A for March 15 (high direct normal radiation during afternoon) August 4 (high direct normal radiation after 18:00) October 14 (low direct normal radiation during afternoon)
• Daily hourly transmitted direct beam and diffuse solar radiation for Zone A for August 4 (Wh/h)
• Daily hourly sensible cooling load for Zone A for March 15 (Wh/h)
1.3.3 Case MZ350 Multi-Zone Shading By External Fin
Case MZ350 tests the effect of shading on neighboring zones by adding a shading fin that is not directly attached to any of the zones of the building. The test building is the same as that modeled for Case MZ340 but with the shading fin depicted in Figure 4. The shade fin is 24m x 24m and primarily shades zones A, B, D and E during the afternoon hours. The shade fin has the following properties:
• Solar absorptance is 1.0
• Infrared emittance is 0.0
• Both sides of the fin actively shade the building
If a program has several options for modeling a shading surface, each different option is to be simulated in separate runs and reported as results for:
• Case MZ350a – shading device associated with Zone C window

Testing with Multi-Zone Non-Airflow 8 October 2012
Figure 4 – Schematic Diagram of Test Building for Test Case MZ350
(Figure 1-5, Neymark and Judkoff 2008)

Testing with Multi-Zone Non-Airflow 9 October 2012
• Case MZ350b – shading device associated with Zone C exterior wall
• Case MZ350c – shading device defined as separate shading object
• Case MZ350d – other option
The simulations are to be run for one year using weather file MZ340.TM2 and results in addition to those reported for Case MZ340 are to include:
• Daily hourly transmitted total solar radiation (Wh/h) for Zones A, B, D and E for March 15 (high direct normal radiation during afternoon) October 14 (low direct normal radiation during afternoon)
• Daily hourly transmitted total solar radiation (Wh/h) for Zones C and F for August 4 (high direct normal radiation after 18:00) October 14 (low direct normal radiation during afternoon)
• Daily hourly sensible cooling load (Wh/h) for Zone B for March 15 and October 14
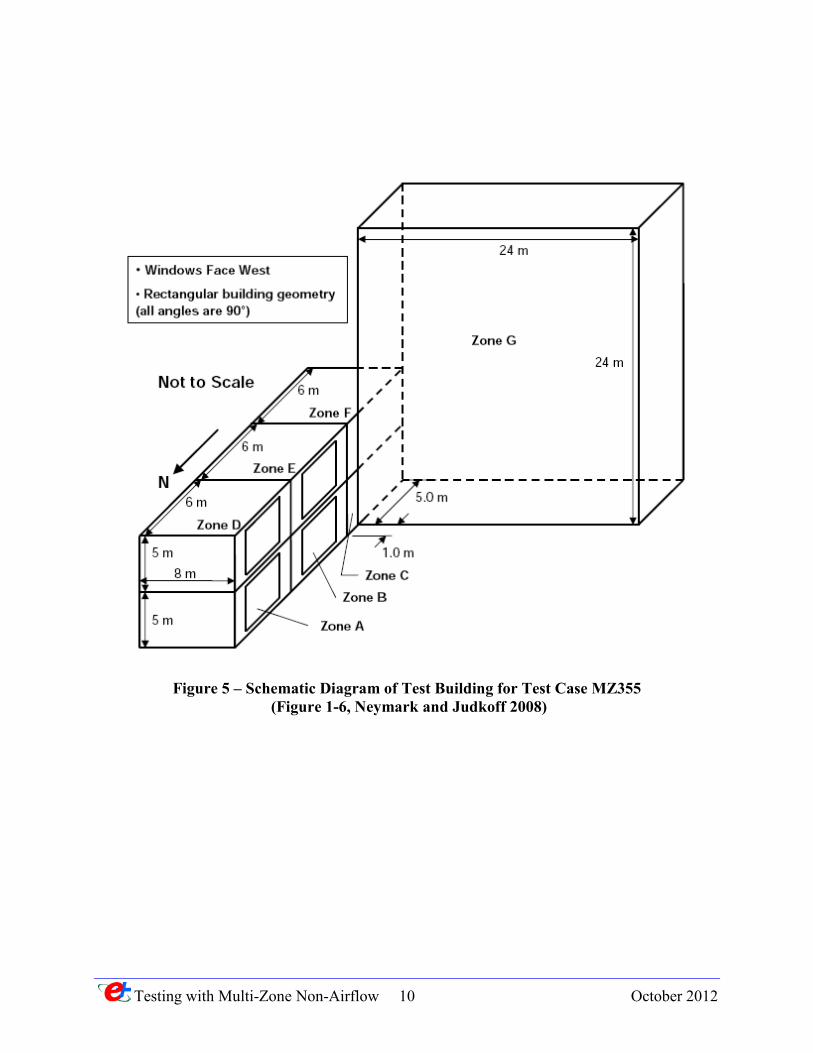
1.3.4 Case MZ355 Multi-Zone Automated Building Self-Shading
This case tests a program’s ability to accurately model the shading effect for a zone of a building by a neighboring zone of the same building. The building to be modeled (Figure 5) is the same building described in Case MZ340 except with the following changes:
• An additional adiabatic Zone G is added to the west side at the south end of the building partially covering Zones C and F and has the following properties 24m long x 5m deep x 24m high All opaque external surfaces and common walls (including all walls, floors and roofs) are massless and have a thermal conductance of 0 W/m2-K Exterior solar absorptance is 1.0 Exterior surface infrared emittance is 0.0 Exterior combined surface coefficients for all exterior surfaces is 25.4 W/m2-K Interior surface absorptance is 0.0 Interior surface coefficients are the same as for other zones No infiltration or ventilation No windows Same mechanical system and setpoints as other zones
• Replace the previous west wall and window of Zones C and F with Common walls adjoining Zone G with dimensions of 5m long x 5m high Exterior walls with dimensions of 1m long x 5m high as shown in Figure 5
Output requirements for this test case are the same as for Case MZ350 except no outputs are required for Zones C, F or G.
Testing with Multi-Zone Non-Airflow 10 October 2012
Figure 5 – Schematic Diagram of Test Building for Test Case MZ355 (Figure 1-6, Neymark and Judkoff 2008)
Testing with Multi-Zone Non-Airflow 11 October 2012
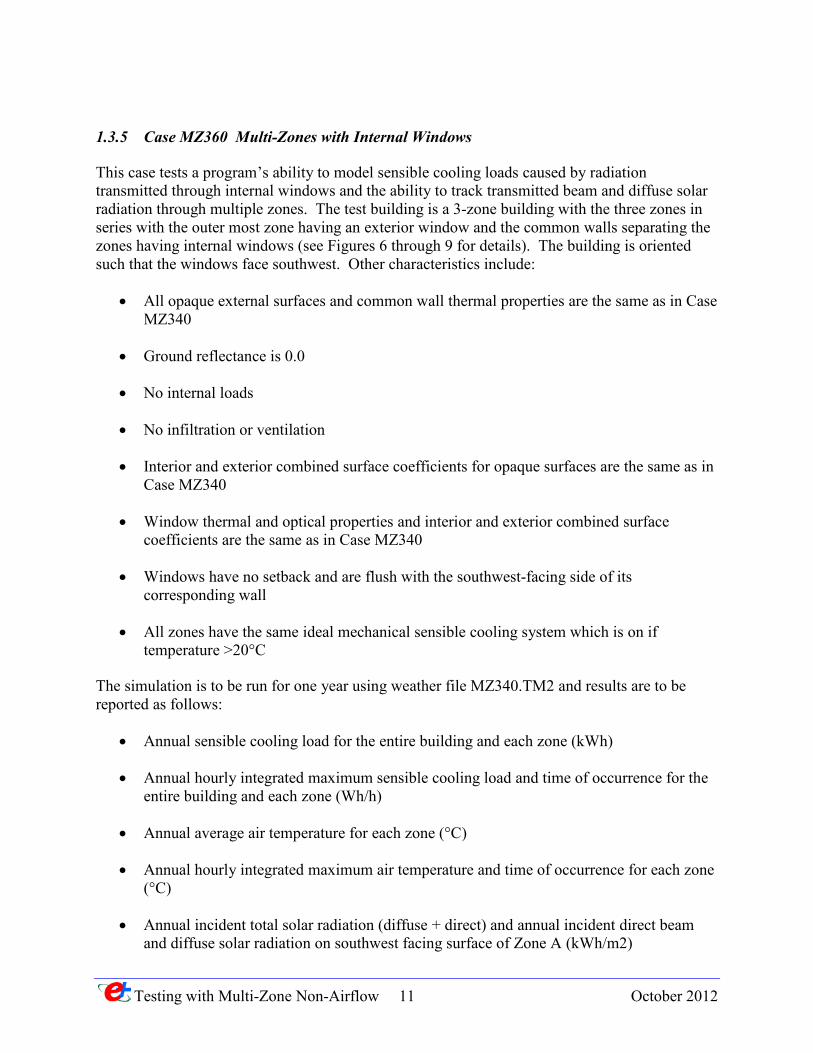
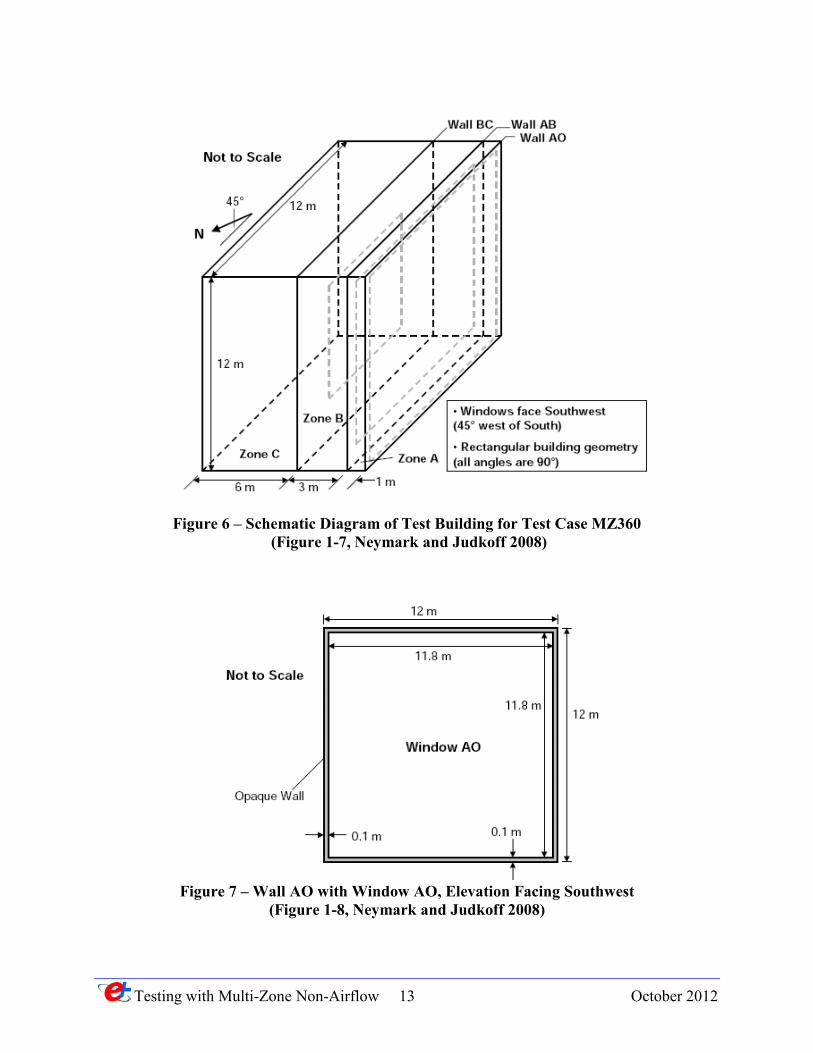
1.3.5 Case MZ360 Multi-Zones with Internal Windows
This case tests a program’s ability to model sensible cooling loads caused by radiation transmitted through internal windows and the ability to track transmitted beam and diffuse solar radiation through multiple zones. The test building is a 3-zone building with the three zones in series with the outer most zone having an exterior window and the common walls separating the zones having internal windows (see Figures 6 through 9 for details). The building is oriented such that the windows face southwest. Other characteristics include:
• All opaque external surfaces and common wall thermal properties are the same as in Case MZ340
• Ground reflectance is 0.0
• No internal loads
• No infiltration or ventilation
• Interior and exterior combined surface coefficients for opaque surfaces are the same as in Case MZ340
• Window thermal and optical properties and interior and exterior combined surface coefficients are the same as in Case MZ340
• Windows have no setback and are flush with the southwest-facing side of its corresponding wall
• All zones have the same ideal mechanical sensible cooling system which is on if temperature >20°C
The simulation is to be run for one year using weather file MZ340.TM2 and results are to be reported as follows:
• Annual sensible cooling load for the entire building and each zone (kWh)
• Annual hourly integrated maximum sensible cooling load and time of occurrence for the entire building and each zone (Wh/h)
• Annual average air temperature for each zone (°C)
• Annual hourly integrated maximum air temperature and time of occurrence for each zone (°C)
• Annual incident total solar radiation (diffuse + direct) and annual incident direct beam and diffuse solar radiation on southwest facing surface of Zone A (kWh/m2)
Testing with Multi-Zone Non-Airflow 12 October 2012
• Annual transmitted total solar radiation (diffuse + direct) and annual transmitted direct beam and diffuse solar radiation through each window (kWh)
• Daily hourly sensible cooling load for Zone B and daily hourly transmitted total solar radiation (Wh/h) for Zones A, B and C for March 15 (high direct normal radiation during afternoon) October 14 (low direct normal radiation during afternoon)
Testing with Multi-Zone Non-Airflow 13 October 2012
Figure 6 – Schematic Diagram of Test Building for Test Case MZ360 (Figure 1-7, Neymark and Judkoff 2008)
Figure 7 – Wall AO with Window AO, Elevation Facing Southwest
(Figure 1-8, Neymark and Judkoff 2008)

Testing with Multi-Zone Non-Airflow 14 October 2012
Figure 8 – Wall AB with Window AB, Elevation Facing Southwest
(Figure 1-9, Neymark and Judkoff 2008)
Figure 9 – Wall BC with Window BC, Elevation Facing Southwest
(Figure 1-10, Neymark and Judkoff 2008)

Testing with Multi-Zone Non-Airflow 15 October 2012
2 RESULTS AND DISCUSSION
2.1 Modeling Methodology
2.1.1 EnergyPlus Shading Module
When assessing heat gains in buildings due to solar radiation, it is necessary to know how much of each part of the building is shaded and how much is in direct sunlight. The sunlit area of each surface changes as the position of the sun changes during the day. The purpose of the EnergyPlus shadow algorithm is to compute such sunlit areas. Predecessors to the EnergyPlus shadowing concepts include the BLAST and TARP shadowing algorithms. The EnergyPlus shadow algorithm is based on coordinate transformation methods similar to Groth and Lokmanhekim 1969 and the shadow overlap method of Walton 1983.
Shading surfaces are entities outside of the building that may cast shadows on the building’s heat transfer surfaces. These entities do not typically have enough thermal mass to be described as part of the building’s thermal makeup.
The most important effect of shading surfaces is to reduce solar gain in windows that are shadowed. However, in some cases, shading surfaces can reflect solar onto a wall or window and increase solar gain..
There are two kinds of shading surfaces in EnergyPlus: detached and attached. A detached shading surface, such as a tree or neighboring building, is not connected to the building. An attached shading surface is typically an overhang or fin that is attached to a particular base surface of the building, usually a wall; attached shading surfaces are usually designed to shade specific windows.
EnergyPlus creates “bi-directional” shades from each shading surface entered. This means that the shade surface you input will cast a shadow no matter which side of the shade surface the sun is on. For example, a vertical fin will cast a shadow whether the sun is on the left side or right side of the fin.
It is important to note that EnergyPlus will automatically account for “self-shading” effects — such as in L-shaped buildings — in which some of the building’s wall and roof surfaces shade other parts of the building, especially windows. This means that you only need to describe shading elements that aren’t building heat-transfer surfaces.
Shading surfaces can also reflect solar radiation onto the building. This feature is simulated if you choose FullExteriorWithReflections or FullInteriorAndExteriorWithReflections in the Building input object Solar Distribution field. In this case, you specify the reflectance properties of a shading surface with the ShadingProperty:Reflectance input object.
Testing with Multi-Zone Non-Airflow 16 October 2012
Shading surfaces also automatically shade diffuse solar radiation (and long-wave radiation) from the sky. And they will automatically shade diffuse solar radiation from the ground if Solar Distribution Field = FullExteriorWithReflections or FullInteriorAndExteriorWithReflections in the Building input object. Otherwise, shading surfaces will not shade diffuse radiation from the ground unless you enter a reduced value for View Factor to Ground for those building surfaces that are shaded.
2.1.2 Initial Distribution of Diffuse Solar Transmitted through Exterior and Interior Windows
EnergyPlus calculates the distribution of short-wave radiation in the interior of each thermal zone. This radiation consists of beam solar radiation, diffuse solar radiation, and short-wave radiation from electric lights. The program determines the amount of this radiation that is (1) absorbed on the inside face of opaque surfaces, (2) absorbed in the glass and shading device layers of the zone’s exterior and interior windows, (3) transmitted through the zone’s interior windows to adjacent zones, and (4) transmitted back out of the exterior windows.
The algorithm for the distribution of diffuse solar was improved in EnergyPlus Version 2.1. Previous to that release, all diffuse solar entering the zone was distributed over all surfaces in the zone using a weighted distribution based on area and solar absorptance for opaque surfaces or reflectance for windows. For shallow zones with large windows, such as Case MZ360, this method caused a significant portion of the diffuse solar to incorrectly leave the zone through the windows. The new algorithm, described below (excerpted from EnergyPlus Engineering Reference, version 2.1.0, p.103), has corrected this problem.
“ As of Version 2.1 the treatment of diffuse solar transmitted first through exterior windows and subsequently through interior windows has been improved. Diffuse solar (from sky and ground sources) transmitted through exterior windows is first distributed to the interior heat transfer surfaces in the zone containing the exterior windows. This initial distribution apportions the transmitted diffuse solar to interior surfaces using the approximate view factors described above in "LW Radiation Exchange Among Zone Surfaces." The amount of this initially distributed diffuse solar absorbed by each interior surface, and each window material layer, is calculated and later added to the "short-wave radiation absorbed" values described below. The amount of this initially distributed diffuse solar that is reflected is accumulated for each zone and redistributed uniformly as part of the QD calculation described below. The amount of this initially distributed diffuse solar that is transmitted by interior windows to adjacent zones is initially distributed to the interior heat transfer surfaces in the adjacent zone in the same manner as just described. This new treatment of diffuse solar is intended to more accurately account for the initial absorption, transmittance, and reflection of short-wave radiation prior to the uniform distribution.”

Testing with Multi-Zone Non-Airflow 17 October 2012
2.1.3 Sky Diffuse Model
In EnergyPlus the calculation of diffuse solar radiation from the sky incident on an exterior surface takes into account the anisotropic radiance distribution of the sky. For this distribution, the diffuse sky irradiance on a surface is given by:
AnisoSkyMult(SurfNum) * DifSolarRad
Where DifSolarRad is the diffuse solar irradiance from the sky on the ground and SurfNum is the number of the surface.
AnisoSkyMult is determined by surface orientation and sky radiance distribution, and accounts for the effects of shading of sky diffuse radiation by shadowing surfaces such as overhangs. It does not account for reflection of sky diffuse radiation from shadowing surfaces.
The sky radiance distribution is based on an empirical model based on radiance measurements of real skies, as described in Perez et al., 1990. In this model the radiance of the sky is determined by three distributions that are superimposed
(1) An isotropic distribution that covers the entire sky dome
(2) A circumsolar brightening centered at the position of the sun
(3) A horizon brightening.
The proportions of these distributions depend on the sky condition, which is characterized by two quantities, clearness factor and brightness factor, which are determined from sun position and solar quantities from the weather file.
The circumsolar brightening is assumed to be concentrated at a point source at the center of the sun although this region actually begins at the periphery of the solar disk and falls off in intensity with increasing angular distance from the periphery.
The horizon brightening is assumed to be a linear source at the horizon and to be independent of azimuth. In actuality, for clear skies, the horizon brightening is highest at the horizon and decreases in intensity away from the horizon. For overcast skies the horizon brightening has a negative value since for such skies the sky radiance increases rather than decreases away from the horizon.
For further details regarding the EnergyPlus diffuse sky model refer to the EnergyPlus Engineering Reference Manual and the section titled Sky and Solar/Shading Calculations.

Testing with Multi-Zone Non-Airflow 18 October 2012
2.2 Modeling Assumptions
The following comments are provided in regards to user inputs that were used with EnergyPlus to model each of the cases described in the BESTEST Multi-Zone Non-Airflow specification. Except where discussed below, all other requirements of the specification were met.
Case MZ320
a) The exterior and interior surface solar absorptance could not be set to 0.0. EnergyPlus requires that this input have a value >0.0. Accordingly, the solar absorptance was set to 0.000001 for both the exterior and interior surfaces.
b) The exterior surface roughness was not specified and was set to VerySmooth (this impacts convection algorithms).
c) Number of timesteps per hour was set to 4 (15 minute timestep).
d) Building outdoor terrain was set to FlatOpenCountry.
Case MZ340
a) To simulate external walls which were adiabatic and massless and because the exterior and interior absorptance of the exterior wall surfaces were different, the exterior wall had to be described as two layers of glass insulation each with a thermal resistance of 500000 m2-K/W as follows: Material:Nomass, Wall-ExteriorLayer, !- Name VerySmooth, !- Roughness 500000.00, !- Thermal Resistance {m2-K/W} 0.000001, !- Absorptance:Thermal 0.000001, !- Absorptance:Solar 0.000001; !- Absorptance:Visible Material:Nomass, Wall-InteriorLayer, !- Name VerySmooth, !- Roughness 500000.00, !- Thermal Resistance {m2-K/W} 0.000001, !- Absorptance:Thermal 1.000000, !- Absorptance:Solar 1.000000; !- Absorptance:Visible Construction, ExtWall, !- Name Wall-ExteriorLayer, !- Outside Layer Wall-InteriorLayer; !- Layer 2
Testing with Multi-Zone Non-Airflow 19 October 2012
b) The common wall separating zones was defined as follows: Construction, ComWall, !- Name Wall-InteriorLayer, !- Outside Layer Wall-InteriorLayer; !- Layer 2
c) All opaque exterior surfaces (except for the west walls which contained windows) and all common walls were set to an outside boundary condition of “Surface” and the outside boundary surface set to itself so that they would be truly adiabatic and did not see external weather conditions.
d) The west walls which contained windows had to see external weather conditions including the sun and so had to be treated differently. For this case the ExtWall Construction of double layer insulation described above was used to simulate adiabatic conditions.
e) The ideal windows were simulated as described by input objects below. Transmittance values had to be <1.0 and reflectance, IR emittance and conductivity values had to be >0.0. WindowMaterial:Glazing, IDEAL GLASS, !- Name SpectralAverage, !- Optical Data Type , !- Name of Window Glass Spectral Data Set 0.003175, !- Thickness {m} 0.99999999, !- Solar Transmittance at Normal Incidence 0.000000001, !- Solar Reflectance at Normal Incidence: Front Side 0.000000001, !- Solar Reflectance at Normal Incidence: Back Side 0.99999999, !- Visible Transmittance at Normal Incidence 0.000000001, !- Visible Reflectance at Normal Incidence: Front Side 0.000000001, !- Visible Reflectance at Normal Incidence: Back Side 0.0, !- IR Transmittance at Normal Incidence 0.000000001, !- IR Hemispherical Emissivity: Front Side 0.000000001, !- IR Hemispherical Emissivity: Back Side 0.000000001; !- Conductivity {W/m-K} Construction, IDEAL WINDOW, !- Name IDEAL GLASS; !- Outside Layer During the hourly simulations the window transmittance in EnergyPlus varies based on solar incident angle and ranged from 0.989 to 1.007.

Testing with Multi-Zone Non-Airflow 20 October 2012
Case 350
a) Case 350a was simulated using the Shading:Fin input object associated with the Zone C window. Although attached to the Zone C window it can cast shadows on other surfaces of the building.
b) Case 350b was simulated using the Shading:Zone:Detailed input object where the shading surface was associated with the Zone C exterior wall. Although attached to the Zone C window it can cast shadows on other surfaces of the building.
c) Case 350c was simulated using the Shading:Site:Detailed input object where the shading surface is exterior to and separated from the building. If the building is rotated this shading surface will remain stationary.
d) Case 350d was simulated using the Shading:Building:Detailed input object where the shading surface is exterior to and separated from the building but if the building is rotated the shading surface rotates with it.
Case 355
a) No exceptions taken with the specification
Case 360
a) No exceptions taken with the specification
2.3 Results
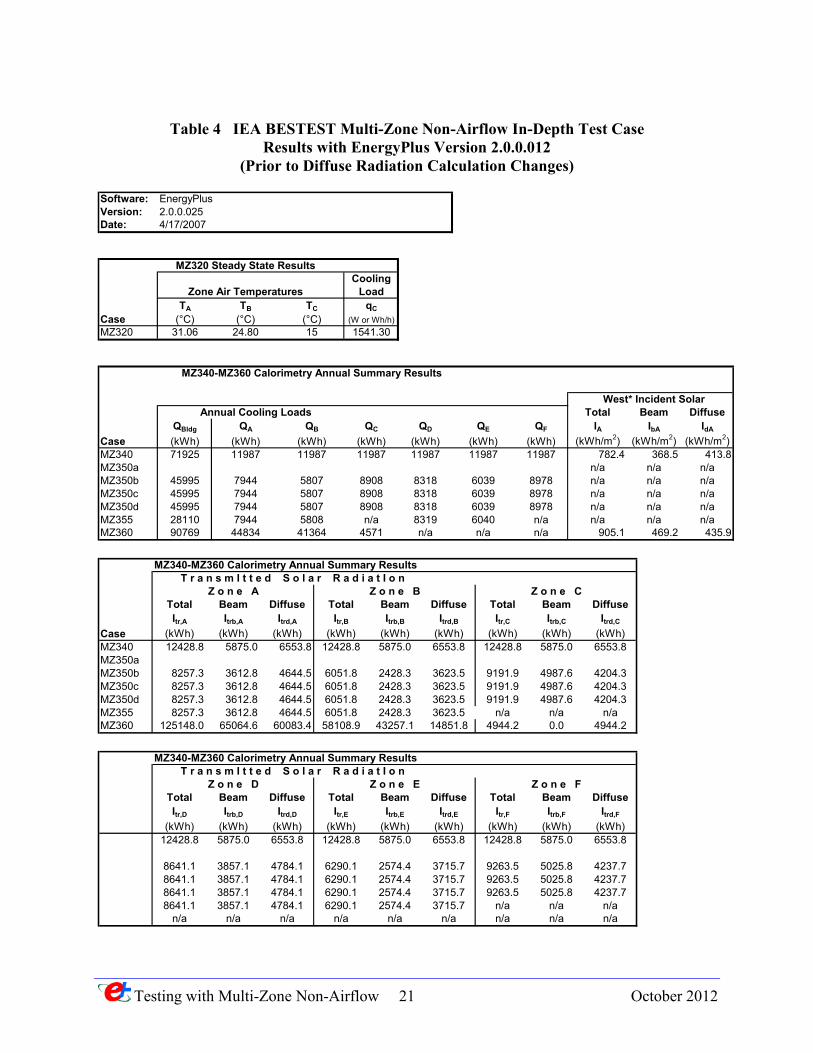
EnergyPlus results that were submitted as part of the initial rounds of IEA BESTEST testing prior to the time when the diffuse radiation algorithms were changed are shown in Table 4. Results which were submitted as part of the last round of the IEA BESTEST testing as reported in the IEA BESTEST final report (Neymark and Judkoff 2008) and which contain the diffuse radiation algorithm changes discussed above are shown in Table 5. As the full suite of test cases have been simulated with later releases of EnergyPlus, i.e. versions 2.1, 2.2, 3.0, 3.1, 4.0, 5.0, 6.0, 7.0, 7.1 and 7.2, results have remained unchanged.
The IEA final report published in September 2008 presents and compares the results for all programs that participated in the simulation of the Multi-Zone Non-Airflow test cases. Table 6 summarizes the participating programs. The IEA final report includes results for EnergyPlus version 2.1.0.012 but Figures 10 through 17 show EnergyPlus results for version 7.2.0.006.
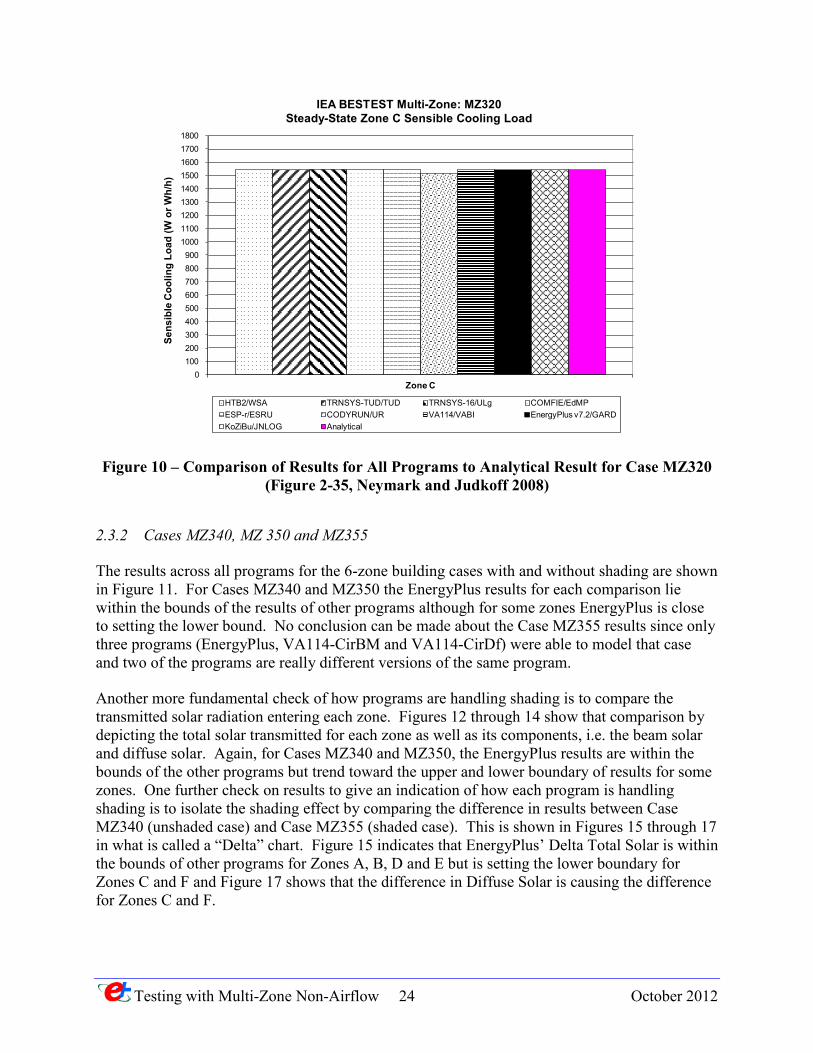
2.3.1 Case MZ320 A comparison of results for all programs for Case MZ320 is shown in Figure 10. This was the only test case which had analytical results to compare to. Excellent agreement was obtained for all programs including EnergyPlus with EnergyPlus results agreeing exactly with the analytical solution.
Testing with Multi-Zone Non-Airflow 21 October 2012
Table 4 IEA BESTEST Multi-Zone Non-Airflow In-Depth Test Case Results with EnergyPlus Version 2.0.0.012
(Prior to Diffuse Radiation Calculation Changes)
Software:Version:Date:
MZ320 Steady State ResultsCooling
Zone Air Temperatures LoadTA TB TC qC
Case (°C) (°C) (°C) (W or Wh/h)MZ320 31.06 24.80 15 1541.30
MZ340-MZ360 Calorimetry Annual Summary Results
West* Incident Solar Annual Cooling Loads Total Beam Diffuse
QBldg QA QB QC QD QE QF IA IbA IdA
Case (kWh) (kWh) (kWh) (kWh) (kWh) (kWh) (kWh) (kWh/m2) (kWh/m2) (kWh/m2)MZ340 71925 11987 11987 11987 11987 11987 11987 782.4 368.5 413.8MZ350a n/a n/a n/aMZ350b 45995 7944 5807 8908 8318 6039 8978 n/a n/a n/aMZ350c 45995 7944 5807 8908 8318 6039 8978 n/a n/a n/aMZ350d 45995 7944 5807 8908 8318 6039 8978 n/a n/a n/aMZ355 28110 7944 5808 n/a 8319 6040 n/a n/a n/a n/aMZ360 90769 44834 41364 4571 n/a n/a n/a 905.1 469.2 435.9
EnergyPlus
4/17/20072.0.0.025
MZ340-MZ360 Calorimetry Annual Summary Results T r a n s m I t t e d S o l a r R a d i a t I o n
Z o n e A Z o n e B Z o n e CTotal Beam Diffuse Total Beam Diffuse Total Beam DiffuseItr,A Itrb,A Itrd,A Itr,B Itrb,B Itrd,B Itr,C Itrb,C Itrd,C
Case (kWh) (kWh) (kWh) (kWh) (kWh) (kWh) (kWh) (kWh) (kWh)MZ340 12428.8 5875.0 6553.8 12428.8 5875.0 6553.8 12428.8 5875.0 6553.8MZ350aMZ350b 8257.3 3612.8 4644.5 6051.8 2428.3 3623.5 9191.9 4987.6 4204.3MZ350c 8257.3 3612.8 4644.5 6051.8 2428.3 3623.5 9191.9 4987.6 4204.3MZ350d 8257.3 3612.8 4644.5 6051.8 2428.3 3623.5 9191.9 4987.6 4204.3MZ355 8257.3 3612.8 4644.5 6051.8 2428.3 3623.5 n/a n/a n/aMZ360 125148.0 65064.6 60083.4 58108.9 43257.1 14851.8 4944.2 0.0 4944.2
MZ340-MZ360 Calorimetry Annual Summary Results T r a n s m I t t e d S o l a r R a d i a t I o n
Z o n e D Z o n e E Z o n e FTotal Beam Diffuse Total Beam Diffuse Total Beam DiffuseItr,D Itrb,D Itrd,D Itr,E Itrb,E Itrd,E Itr,F Itrb,F Itrd,F
(kWh) (kWh) (kWh) (kWh) (kWh) (kWh) (kWh) (kWh) (kWh)12428.8 5875.0 6553.8 12428.8 5875.0 6553.8 12428.8 5875.0 6553.8
8641.1 3857.1 4784.1 6290.1 2574.4 3715.7 9263.5 5025.8 4237.78641.1 3857.1 4784.1 6290.1 2574.4 3715.7 9263.5 5025.8 4237.78641.1 3857.1 4784.1 6290.1 2574.4 3715.7 9263.5 5025.8 4237.78641.1 3857.1 4784.1 6290.1 2574.4 3715.7 n/a n/a n/a
n/a n/a n/a n/a n/a n/a n/a n/a n/a

Testing with Multi-Zone Non-Airflow 22 October 2012
Table 5 IEA BESTEST Multi-Zone Non-Airflow In-Depth Test Case Results with EnergyPlus
Versions 2.1, 2.2, 3.0, 3.1, 4.0, 5.0, 6.0, 7.0, 7.1 and 7.2 (Subsequent to Diffuse Radiation Calculation Changes)
Software:Version:
Date:
MZ320 Steady State ResultsCooling
Zone Air Temperatures LoadTA TB TC qC
Case (°C) (°C) (°C) (W or Wh/h)MZ320 31.06 24.80 15 1541.30
MZ340-MZ360 Calorimetry Annual Summary Results
West* Incident Solar Annual Cooling Loads Total Beam Diffuse
QBldg QA QB QC QD QE QF IA IbA IdA
Case (kWh) (kWh) (kWh) (kWh) (kWh) (kWh) (kWh) (kWh/m2) (kWh/m2) (kWh/m2)MZ340 74585 12431 12431 12431 12431 12431 12431 782.4 368.5 413.8MZ350a 47699 8258 6052 9191 8642 6291 9264 n/a n/a n/aMZ350b 47701 8258 6052 9193 8642 6291 9264 n/a n/a n/aMZ350c 47701 8258 6052 9193 8642 6291 9264 n/a n/a n/aMZ350d 47701 8258 6052 9193 8642 6291 9264 n/a n/a n/aMZ355 29245 8259 6053 n/a 8642 6291 n/a n/a n/a n/aMZ360 120539 51113 59411 10014 n/a n/a n/a 905.1 469.2 435.9
EnergyPlus
October 2012
2.1.0, 2.2.0, 3.0.0, 3.1.0, 4.0.0, 5.0.0, 6.0.0,7.0.0, 7.1.0 and 7.2.0
MZ340-MZ360 Calorimetry Annual Summary Results T r a n s m I t t e d S o l a r R a d i a t I o n
Z o n e A Z o n e B Z o n e CTotal Beam Diffuse Total Beam Diffuse Total Beam DiffuseItr,A Itrb,A Itrd,A Itr,B Itrb,B Itrd,B Itr,C Itrb,C Itrd,C
Case (kWh) (kWh) (kWh) (kWh) (kWh) (kWh) (kWh) (kWh) (kWh)MZ340 12428.8 5875.1 6553.8 12428.8 5875.1 6553.8 12428.8 5875.1 6553.8MZ350a 8257.3 3612.8 4644.5 6051.8 2428.3 3623.5 9190.2 4986.7 4203.5MZ350b 8257.3 3612.8 4644.5 6051.8 2428.3 3623.5 9191.9 4987.6 4204.3MZ350c 8257.3 3612.8 4644.5 6051.8 2428.3 3623.5 9191.9 4987.6 4204.3MZ350d 8257.3 3612.8 4644.5 6051.8 2428.3 3623.5 9191.9 4987.6 4204.3MZ355 8257.3 3612.8 4644.5 6051.8 2428.3 3623.5 n/a n/a n/aMZ360 125148.0 65064.7 60083.4 44095.3 43257.1 838.2 3682.6 0.0 3682.6
MZ340-MZ360 Calorimetry Annual Summary Results
Z o n e D Z o n e E Z o n e FTotal Beam Diffuse Total Beam Diffuse Total Beam DiffuseItr,D Itrb,D Itrd,D Itr,E Itrb,E Itrd,E Itr,F Itrb,F Itrd,F
Case (kWh) (kWh) (kWh) (kWh) (kWh) (kWh) (kWh) (kWh) (kWh)MZ340 12428.8 5875.1 6553.8 12428.8 5875.1 6553.8 12428.8 5875.1 6553.8MZ350a 8641.1 3857.1 4784.0 6290.1 2574.4 3715.6 9263.5 5025.8 4237.7MZ350b 8641.1 3857.1 4784.0 6290.1 2574.4 3715.6 9263.5 5025.8 4237.7MZ350c 8641.1 3857.1 4784.0 6290.1 2574.4 3715.6 9263.5 5025.8 4237.7MZ350d 8641.1 3857.1 4784.0 6290.1 2574.4 3715.6 9263.5 5025.8 4237.7MZ355 8641.1 3857.1 4784.0 6290.1 2574.4 3715.6 n/a n/a n/aMZ360 n/a n/a n/a n/a n/a n/a n/a n/a n/a

Testing with Multi-Zone Non-Airflow 23 October 2012
Table 6 Participating Programs and Organizations (Table ES-1, Neymark and Judkoff 2008)
Simulation Program, (Case MZ320 Only)
Implemented by Authorizing Organization Abbreviation
CODYRUN University of Reunion Island, France
University of Reunion Island, France
UR
COMFIE EdMP,a EdMP/IZUBA, France a,b EdMP France
KoZiBu JNLOG,c INSA-Lyon/JNLOG, France d,c JNLOG France
Simulation Program (All other cases)
Implemented by Authorizing Organization Abbreviation
EnergyPlus 2.1.0.012
GARD Analytics, Inc., United States
LBNL/UIUC/DOE-BT,e,f,g EnergyPlus/GARD United States
ESP-r ESRU,h ESRU, United Kingdom h ESP-r/ESRU United Kingdom
HTB2 WSA,i WSA, United Kingdom i HTB2/WSA United Kingdom
TRNSYS-TUD Dresden University of Technology, Germany
University of Wisconsin/Dresden University of Technology, United States/Germany
TRNSYS-TUD/TUD
TRYSYS-16 University of Liege, Belgium University of Wisconsin, United States
TRNSYS-16/Ulg
VA114 2.25 VABI Software BV, The Netherlands
VABI Software BV, The Netherlands
VA114-CirBm/VABI VA114-CirDf/VABI
a Ecole des Mines de Paris, France b IZUBU Energies, France c Jean Noel, France d INSA-Lyon Thermal Center, France e LBNL: Lawrence Berkeley National Laboratory, United States f UIUC: University of Illinois Urbana/Champaign, United States g DOE-BT: U.S. Department of Energy, Office of Building Technologies, Energy Efficiency and Renewable Energy, United States h ESRU: Energy Systems Research Unit, University of Strathclyde, United Kingdom i Welsh School of Architecture, Cardiff University, United Kingdom
Testing with Multi-Zone Non-Airflow 24 October 2012
Figure 10 – Comparison of Results for All Programs to Analytical Result for Case MZ320 (Figure 2-35, Neymark and Judkoff 2008)
2.3.2 Cases MZ340, MZ 350 and MZ355
The results across all programs for the 6-zone building cases with and without shading are shown in Figure 11. For Cases MZ340 and MZ350 the EnergyPlus results for each comparison lie within the bounds of the results of other programs although for some zones EnergyPlus is close to setting the lower bound. No conclusion can be made about the Case MZ355 results since only three programs (EnergyPlus, VA114-CirBM and VA114-CirDf) were able to model that case and two of the programs are really different versions of the same program.
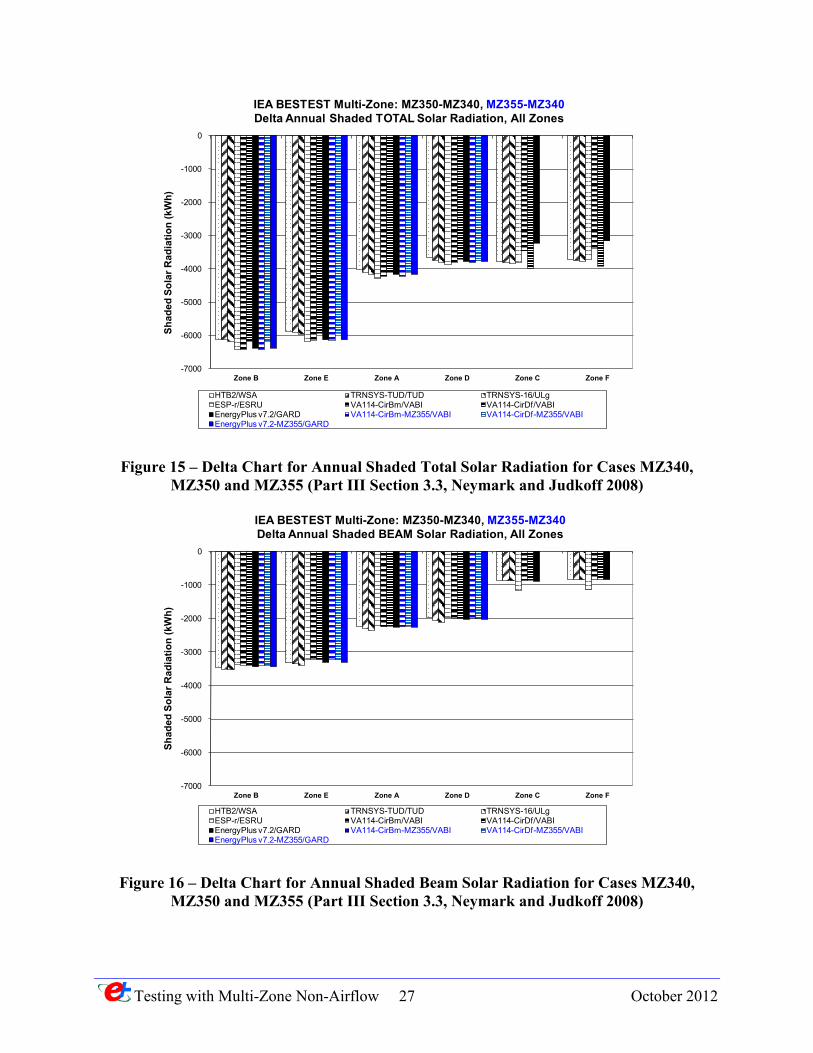
Another more fundamental check of how programs are handling shading is to compare the transmitted solar radiation entering each zone. Figures 12 through 14 show that comparison by depicting the total solar transmitted for each zone as well as its components, i.e. the beam solar and diffuse solar. Again, for Cases MZ340 and MZ350, the EnergyPlus results are within the bounds of the other programs but trend toward the upper and lower boundary of results for some zones. One further check on results to give an indication of how each program is handling shading is to isolate the shading effect by comparing the difference in results between Case MZ340 (unshaded case) and Case MZ355 (shaded case). This is shown in Figures 15 through 17 in what is called a “Delta” chart. Figure 15 indicates that EnergyPlus’ Delta Total Solar is within the bounds of other programs for Zones A, B, D and E but is setting the lower boundary for Zones C and F and Figure 17 shows that the difference in Diffuse Solar is causing the difference for Zones C and F.
0 100 200 300 400 500 600 700 800 900
1000 1100 1200 1300 1400 1500 1600 1700 1800
Zone C
Sens
ible
Coo
ling
Load
(W o
r Wh/
h)
IEA BESTEST Multi-Zone: MZ320 Steady-State Zone C Sensible Cooling Load
HTB2/WSA TRNSYS-TUD/TUD TRNSYS-16/ULg COMFIE/EdMPESP-r/ESRU CODYRUN/UR VA114/VABI EnergyPlus v7.2/GARDKoZiBu/JNLOG Analytical

Testing with Multi-Zone Non-Airflow 25 October 2012
Figure 11 – Annual Sensible Cooling Load Results for All Programs for Cases MZ340, MZ350 and MZ355 (Figure 2-37, Neymark and Judkoff 2008)
Figure 12 – Zone Annual Transmitted Total Solar Radiation Results for All Programs for Cases MZ340, MZ350 and MZ355 (Part III Section 3.3, Neymark and Judkoff 2008)
0
2000
4000
6000
8000
10000
12000
14000
MZ340 MZ350, MZ355 Zone B
MZ350, MZ355 Zone E
MZ350, MZ355 Zone A
MZ350, MZ355 Zone D
MZ350 Zone C
MZ350 Zone F
Sens
ible
Coo
ling
Load
(kW
h)
IEA BESTEST Multi-Zone: MZ340, MZ350, MZ355Annual Sensible Cooling Load, All Zones
HTB2/WSA TRNSYS-TUD/TUD TRNSYS-16/ULgESP-r/ESRU VA114-CirBm/VABI VA114-CirDf/VABIEnergyPlus v7.2/GARD VA114-CirBm-MZ355/VABI VA114-CirDf-MZ355/VABIEnergyPlus v7.2-MZ355/GARD
0
2000
4000
6000
8000
10000
12000
14000
MZ340 MZ350, MZ355 Zone B
MZ350, MZ355 Zone E
MZ350, MZ355 Zone A
MZ350, MZ355 Zone D
MZ350 Zone C
MZ350 Zone F
Tran
smitt
ed S
olar
Rad
iatio
n (k
Wh)
IEA BESTEST Multi-Zone: MZ340, MZ350, MZ355Annual Transmitted TOTAL Solar Radiation, All Zones
HTB2/WSA TRNSYS-TUD/TUD TRNSYS-16/ULgESP-r/ESRU VA114-CirBm/VABI VA114-CirDf/VABIEnergyPlus v7.2/GARD VA114-CirBm-MZ355/VABI VA114-CirDf-MZ355/VABIEnergyPlus v7.2-MZ355/GARD

Testing with Multi-Zone Non-Airflow 26 October 2012
Figure 13 – Zone Annual Transmitted Beam Solar Radiation Results for All Programs for Cases MZ340, MZ350 and MZ355 (Part III Section 3.3, Neymark and Judkoff 2008)
Figure 14 – Zone Annual Transmitted Diffuse Solar Radiation Results for All Programs for Cases MZ340, MZ350 and MZ355 (Part III Section 3.3, Neymark and Judkoff 2008)
0
2000
4000
6000
8000
10000
12000
14000
MZ340 MZ350, MZ355 Zone B
MZ350, MZ355 Zone E
MZ350, MZ355 Zone A
MZ350, MZ355 Zone D
MZ350 Zone C
MZ350 Zone F
Tran
smitt
ed S
olar
Rad
iatio
n (k
Wh)
IEA BESTEST Multi-Zone: MZ340, MZ350, MZ355Annual Transmitted BEAM Solar Radiation, All Zones
HTB2/WSA TRNSYS-TUD/TUD TRNSYS-16/ULgESP-r/ESRU VA114-CirBm/VABI VA114-CirDf/VABIEnergyPlus v7.2/GARD VA114-CirBm-MZ355/VABI VA114-CirDf-MZ355/VABIEnergyPlus v7.2-MZ355/GARD
0
2000
4000
6000
8000
10000
12000
14000
MZ340 MZ350, MZ355 Zone B
MZ350, MZ355 Zone E
MZ350, MZ355 Zone A
MZ350, MZ355 Zone D
MZ350 Zone C
MZ350 Zone F
Tran
smitt
ed S
olar
Rad
iatio
n (k
Wh)
IEA BESTEST Multi-Zone: MZ340, MZ350, MZ355Annual Transmitted DIFFUSE Solar Radiation, All Zones
HTB2/WSA TRNSYS-TUD/TUD TRNSYS-16/ULgESP-r/ESRU VA114-CirBm/VABI VA114-CirDf/VABIEnergyPlus v7.2/GARD VA114-CirBm-MZ355/VABI VA114-CirDf-MZ355/VABIEnergyPlus v7.2-MZ355/GARD
Testing with Multi-Zone Non-Airflow 27 October 2012
Figure 15 – Delta Chart for Annual Shaded Total Solar Radiation for Cases MZ340, MZ350 and MZ355 (Part III Section 3.3, Neymark and Judkoff 2008)
Figure 16 – Delta Chart for Annual Shaded Beam Solar Radiation for Cases MZ340, MZ350 and MZ355 (Part III Section 3.3, Neymark and Judkoff 2008)
-7000
-6000
-5000
-4000
-3000
-2000
-1000
0
Zone B Zone E Zone A Zone D Zone C Zone F
Shad
ed S
olar
Rad
iatio
n (k
Wh)
IEA BESTEST Multi-Zone: MZ350-MZ340, MZ355-MZ340Delta Annual Shaded TOTAL Solar Radiation, All Zones
HTB2/WSA TRNSYS-TUD/TUD TRNSYS-16/ULgESP-r/ESRU VA114-CirBm/VABI VA114-CirDf/VABIEnergyPlus v7.2/GARD VA114-CirBm-MZ355/VABI VA114-CirDf-MZ355/VABIEnergyPlus v7.2-MZ355/GARD
-7000
-6000
-5000
-4000
-3000
-2000
-1000
0
Zone B Zone E Zone A Zone D Zone C Zone F
Shad
ed S
olar
Rad
iatio
n (k
Wh)
IEA BESTEST Multi-Zone: MZ350-MZ340, MZ355-MZ340Delta Annual Shaded BEAM Solar Radiation, All Zones
HTB2/WSA TRNSYS-TUD/TUD TRNSYS-16/ULgESP-r/ESRU VA114-CirBm/VABI VA114-CirDf/VABIEnergyPlus v7.2/GARD VA114-CirBm-MZ355/VABI VA114-CirDf-MZ355/VABIEnergyPlus v7.2-MZ355/GARD

Testing with Multi-Zone Non-Airflow 28 October 2012
Figure 17 – Delta Chart for Annual Shaded Diffuse Solar Radiation for Cases MZ340, MZ350 and MZ355 (Part III Section 3.3, Neymark and Judkoff 2008)
The impact of the change in handling of diffuse solar radiation as described in Section 2.1.2 can be seen by comparing EnergyPlus results in Tables 5 and 6 for Cases MZ340, MZ350 and MZ355 where the result was an increase in total building annual cooling load of from 3.7% to 4.0%.
2.3.3 Case MZ360
Case MZ360 with three zones separated by interior windows with the first zone being very shallow, i.e. only 1 m deep, presents a difficult modeling situation. As was explained in Section 2.1.2, in the early rounds of IEA BESTEST Multi-Zone Non-Airflow testing it became evident that one of the reasons that the cooling load calculated for this case by EnergyPlus was lower than the other programs was due to the method for distributing diffuse solar radiation within a zone. Another reason is that EnergyPlus does not model direct beam radiation transmitted through the second internal window but rather assumes that all solar radiation entering Zone C was diffuse radiation. The impact of reworking the diffuse radiation algorithms in EnergyPlus is shown in Figure 18 by comparing the “Eplus/GARD Before Fix” with the “Eplus/GARD After Fix” results. The change in results was to increase the annual building cooling load by 33%.
Comparison of results for all programs for Case MZ360 is shown in Figure 19. For individual zones, the EnergyPlus results are within the bounds of other programs. For the total annual
-7000
-6000
-5000
-4000
-3000
-2000
-1000
0
Zone B Zone E Zone A Zone D Zone C Zone F
Shad
ed S
olar
Rad
iatio
n (k
Wh)
IEA BESTEST Multi-Zone: MZ350-MZ340, MZ355-MZ340Delta Annual Shaded DIFFUSE Solar Radiation, All Zones
HTB2/WSA TRNSYS-TUD/TUD TRNSYS-16/ULgESP-r/ESRU VA114-CirBm/VABI VA114-CirDf/VABIEnergyPlus v7.2/GARD VA114-CirBm-MZ355/VABI VA114-CirDf-MZ355/VABIEnergyPlus v7.2-MZ355/GARD

Testing with Multi-Zone Non-Airflow 29 October 2012
Figure 18 – EnergyPlus Annual Cooling Load Change Before and After Diffuse Solar
Radiation Algorithm Change for Case MZ360 (Part II Figure 2-3, Neymark and Judkoff 2008)
Figure 19 – Annual Sensible Cooling Loads Results for All Programs for Case MZ360
(Part III Section 3.3, Neymark and Judkoff 2008)
0
20000
40000
60000
80000
100000
120000
140000
Building, Qbldg Zone A, QA Zone B, QB Zone C, QC QB + QC
Sens
ible
Coo
ling
Load
(kW
h)
IEA BESTEST Multi-Zone: MZ360 Annual Sensible Cooling Loads
HTB2/WSA TRNSYS-TUD/TUD TRNSYS-16/ULg ESP-r/ESRU
VA114-CirBm/VABI VA114-CirDf/VABI EnergyPlus/GARD

Testing with Multi-Zone Non-Airflow 30 October 2012
building cooling load EnergyPlus is setting the lower boundary which may be due to EnergyPlus treating all solar radiation entering Zone C as diffuse.
2.4 Enhancements to EnergyPlus Prompted by Using IEA BESTEST Multi-Zone Non-Airflow In-Depth Test Suite
As a result of EnergyPlus participating in the IEA BESTEST Multi-Zone Non-Airflow In-Depth Diagnostic Tests program the following changes and enhancements were made:
• Version 2.0.0.025 – added output report variables for internal windows
• Version 2.1.0.023 – the methodology for handling solar diffuse radiation through a window was completely reworked and was changed from uniform interior distribution of transmitted diffuse solar to distribution based on approximate view factors between transmitting windows and zone heat transfer surfaces.

Testing with Multi-Zone Non-Airflow 31 October 2012
3 CONCLUSIONS
EnergyPlus Version 7.2.0.006 was used to model a range of multi-zone non-airflow configurations specified in IEA BESTEST Multi-Zone Non-Airflow In-Depth Diagnostic Cases: MZ320 – MZ360 (Neymark and Judkoff 2008). The ability of EnergyPlus to model multi-zone non-airflow configurations and predict zone loads and resulting zone temperatures was tested using a suite of 5 test cases which included multi-zone with no windows, multi-zone with unshaded windows, multi-zone with shaded windows for two configurations, and multi-zones in series with internal windows. The results predicted by EnergyPlus for the first case, multi-zone with no windows, was compared to an analytical solution. The results for the other 4 cases were compared to results from 5 other programs that participated in an International Energy Agency project which was completed in 2008. For Case MZ320, EnergyPlus results for steady state sensible cooling load agreed exactly with the analytical solution. For Cases MZ340 (6 zone, unshaded) and MZ350 (6 zone, shaded), EnergyPlus results were within the bounds of the other programs with a trend toward the upper and lower boundary of results for some zones. No conclusion could be made about Case MZ355 (self-shaded multi-zone building) since there were results from only one other program to compare to. For Case MZ360 (three zones in series with internal windows), the EnergyPlus results were mixed with annual cooling loads for individual zones being within the bounds of the other programs but with EnergyPlus setting the lower bounds of results when comparing total building sensible cooling load to other programs. This difference may be due to EnergyPlus not allowing any direct beam solar to enter the most inner zone but rather assumes all transmitted solar into that zone is diffuse radiation.

Testing with Multi-Zone Non-Airflow 32 October 2012

Testing with Multi-Zone Non-Airflow 33 October 2012
4 REFERENCES
EnergyPlus 2012. U.S. Department of Energy, Energy Efficiency and Renewable Energy, Office of Building Technologies. www.energyplus.gov
Groth, C. C., and Lokmanhekim, M. 1969. "Shadow - A New Technique for the Calculation of Shadow Shapes and Areas by Digital Computer," Second Hawaii International Conference on System Sciences, Honolulu, HI, January 22-24, 1969.
Neymark, J., and R. Judkoff. 2008. International Energy Agency Building Energy Simulation TEST and Diagnostic Method (IEA BESTEST) Multi-Zone Non-Airflow In-Depth Diagnostic Cases: MZ320 – MZ360, NREL/TP-550-43827, National Renewable Energy Laboratory, Golden, Colorado, September 2008. www.iea-shc.org/publications/task.aspx?Task=34
Perez, R., P. Ineichen, R. Seals, J. Michalsky and R. Stewart. 1990. Modeling Daylight Availability and Irradiance Components from Direct and Global Irradiance. Solar Energy 44,271-289.
Walton, G.N. 1983. “The Thermal Analysis Research Program Reference Manual Program (TARP)”, National Bureau of Standards (now National Institute of Standards and Technology).