Embed Size (px)
Citation preview
Contents lists available at ScienceDirect
Engineering Fracture Mechanics
journal homepage: www.elsevier.com/locate/engfracmech
On the distribution and scatter of fatigue lives obtained byintegration of crack growth curves: Does initial crack sizedistribution matter?
M. Ciavarellaa,⁎, A. Papangeloa,b
a Politecnico di Bari, 70125 Bari, ItalybDepartment of Mechanical Engineering, Hamburg University of Technology, Am Schwarzenberg-Campus 1, Hamburg 21073, Germany
A R T I C L E I N F O
Keywords:FatigueSN curvesScatterWeibull distributionParis’ law
A B S T R A C T
By integrating the simple deterministic Paris’ law from a distribution of initial defects, in the form of aFrechet extreme value distribution, it was known that a distribution of Weibull distribution of fatiguelives follows exactly. However, it had escaped previous researchers that the shape parameter of thisdistribution tends to very high values (meaning the scatter is extremely reduced) when Paris’ exponentm approaches 2, leading to the exponential growth of cracks with number of cycles. In view of the factthat values close to m=2 are of great importance in materials for example used for primary aircraftstructures as recognized by some certification requirements (and the so-called “lead crack” metho-dology), we believe this conclusion may have some immediate relevance for damage tolerance pro-cedures, or certification methods where accurate description of scatter is required. Indeed, we extendthe result also to the case when Paris’ constant C is distributed, and give also an estimate of the level ofscatter expected in propagation life in the most general case when C, m are both random variatealongwith the defect size distribution, based on first transforming them to uncorrelated form C0,m, andvalidate this with the famous Virkler set of data. We finally discuss that from known typical values offatigue life scatter of aeronautical alloys, it is very likely that an important contribution comes fromshort crack growth.
1. Introduction
The scatter of fatigue properties has been studied for long time but maintains a vivid interest because of the enormous techno-logical implications of maintaining safety in critical applications. Today, design and life management approaches for materials insafety-critical applications typically rely on large testing programs which produce extensive databases of fatigue data: improvedunderstanding of the underlying statistics would help materials engineer to improve materials, testing and certification procedures tobecome quicker and less expensive, and engineering applications to become more performant, cheaper and lighter because of theextensive use of more advanced probabilistic design. The statistical behavior of fatigue lifetimes has strong similarities with thestatistics of brittle materials, and indeed Weibull’s distribution was developed by Weibull exactly to describe the scatter of thestrength in brittle materials, for which often Weibull shape parameter is considered a “material constant” [1, and references therein].The classical interpretation of Weibull modulus in terms of a result of possible brittle fracture of the cracks, and the Weakest LinkTheory (WLT), connected brittle failure to the theory of extremes values. One example of physically significant distribution functionsof extreme values (here, the largest cracks) bears the name of Frechet, having Cumulative Distribution Function (CDF)
https://doi.org/10.1016/j.engfracmech.2018.01.019Received 15 October 2017; Received in revised form 1 January 2018; Accepted 22 January 2018
⁎ Corresponding author.E-mail address: [email protected] (M. Ciavarella).
Engineering Fracture Mechanics 191 (2018) 111–124
Available online 31 January 20180013-7944/ © 2018 Elsevier Ltd. All rights reserved.
T
⎜ ⎟= ⎡
⎣⎢−⎛
⎝⎞⎠
⎤
⎦⎥
−
P a aβ
( ) expaa
αa
(1)
where αa is a shape parameter, and βa a scale parameter. By using Griffith equation, such a distribution of crack sizes, under remoteuniform tension (assuming no interaction between cracks), can be converted into a distribution of strength which follows the Weibulldistribution
⎜ ⎟= − ⎡
⎣⎢−⎛
⎝⎞⎠
⎤
⎦⎥ =P a σ
σW α σ( ) 1 exp (2 , )σ
α
a0
2
0
a
(2)
where W α β( , ) stands for the Weibull 2-parameter CDF distribution of shape parameter α and scale parameter β. In other words, theobtained Weibull has shape parameter equal to double of the shape parameter of the original Frechet distribution. We mention theseresults despite we shall only deal with fatigue, just for introducing the concept of how the “scatter” in defects distribution affects thescatter in strength,1 although an interesting theory which connects static failure to fatigue, simplifying fatigue as a repeated attemptto cause static failure, has been proposed [2]. Murakami [3] has a very significant amount of work showing mainly the role of sizeand geometry of small defects on the fatigue limit, in particular with simple equations relating the hardness HV and size of defects, ornonmetallic inclusions – whereas our attention will be driven to scatter in fatigue lives far from the fatigue limit. Murakami [3]largely used the Frechet distribution for his rating of (non-metallic) inclusions in steels and in particular in most cases he seems tosuggest =α 1a , whereas Wallin [4] collects a few data from the literature in bearing steels or Q&T steels where =α 4–5a . Wang et al.[5] show some support to the fact that the fatigue lives of cast aluminum alloys do follow the “Paris law” prediction for the largestdefect size.
Wallin [4] discusses statistical aspects of both the fatigue life distribution, and the endurance limit. However, the emphasis of thatpaper is on size effects. In particular, he suggests that, using the WLT, high statistical uncertainty or physically non-realistic sizeeffects result from the Gumbel and the Weibull distributions, so he is strongly in favor of the Frechet distribution. For the latter, hederives approximately that the fatigue life, using a Paris’ law for the crack growth, will be described by a Weibull distribution, namely
=P W α β( , )N L Lf (3)
where “L” stands for Life, and he seems to suggest two different results for αL (his eqt. 43 and eqt. 50, neither of which we agree with,and with an important qualitative difference), although we are not able to follow the reason behind this double possibility. Ref. [4]discusses experimental data, but collects data either for scatter of fatigue lives, or for inclusion measurements, and not both data fromthe same case, so we are unable to judge the validity of this result for the scatter of fatigue lives quantitatively, and unfortunatelythere is no independent numerical validation. The reason why this is not a minor detail but will turn out quite important is thatWallin’s result does not give any special significance to the limit case of Paris’ constant =m 2, or the values close to this, which areextremely important for “damage tolerant” materials in use especially in aerospace applications. We shall derive Wallin’s resultdifferently and find asignificant discrepancy, namely that the coefficient αL tends to infinity when =m 2 and hence leads to extremelysmall scatter expected in fatigue lives. In other words, the statistics seems to suggest that, no matter how large is the dispersion of thedistribution of largest defects in the material, the fatigue life will be almost deterministic. We shall also find the value of βL, and thenwe move to generalize the results in the much more general case when Paris’ constants are themselves random variate, as it isimportant to consider especially for short crack growth.
We find in particular that by transforming the distribution of Paris’ constants C m, to an uncorrelated form C m,0 a very good andanalytical estimate of fatigue life scatter can be done by neglecting the variation in m and validate this result by means of theextensive set of data known in the Literature. We finally discuss some significance of these results, in view of possible deviations fromthe simple crack growth considerations made here, and we make also general comments about Damage Tolerance and Lead Crackgeneral philosophies.
2. Propagation of cracks with deterministic Paris law
Paris’ law [6] relates the crack advancement per cycle to the range of Irwin’s stress intensity factors as
=dadN
C KΔ m(4)
where C m, are Paris’ “material constants”. For many structural materials, m lies in the range from 1.8 to 4, but the value =m 2(which leads to an exponential growth of the crack) which was incidentally suggested in proposals before that of Paris, is attractingmore and more interest, especially for lead cracks in aircraft primary structures (Lo et al. [7] and many references therein, [8–10]), sothat the United States Air Force (USAF) certification requirement approach to assessing the risk of failure by fracture, makes extensiveuse of exponential crack growth.2 We will obtain results both for =m 2 or a general >m 2, but the significant new results will be
1 In reality, there are three types of possible distributions of extremes: starting as a parent distribution from the exponential, normal and lognormal distributions, thedistribution of largest values will be Gumbel. Starting from power-law tails, we obtain Frechet or Weibull itself.2 Certification for damage tolerance requires considering crack growth due to spectrum loading which may involve complex accounts of crack closure which induces
generally growth retardation.
M. Ciavarella, A. Papangelo Engineering Fracture Mechanics 191 (2018) 111–124
112
relevant for the case near =m 2. Deviations near a “threshold” KΔ th or near the critical condition of static failure have been observedquite early. Then, with improvements of measuring techniques, and interest in long lives, a different behavior for short cracksemerged, showing not only they can propagate, but actually quite fast, belowthe (long crack) threshold KΔ th. However, these authors[8,9, and many references therein] are suggesting more recently that the “lead” short cracks may propagate with an equation veryclose to the long crack Paris law (often in the form of Hartman—Schijve one, see more details in the following paragraph “The Virkler“old” data, and a new analysis”), except for a reduced threshold KΔ thr , which is close to zero (ASTM E647-13a, [11]), has little or noload ratio dependence and hence plasticity-induced crack closure effects (see more details in [8,9]). In this sense, there is even morescope to examine the consequences of the simplest form of Paris’ law in terms of scatter of fatigue lives, although we shall return tothe issue of short cracks later on.
Integration of the standard Paris’ law (4), neglecting the change of geometric factors g with crack size, gives for a constant stressrange, the number of cycles to failure as for >m 2
=−
−≃
−
− − −N
a aπ m C g σ
ag π m C σ( /2 1) ( Δ ) ( /2 1) Δf
im
fm
m mi
m
m m m
1 /2 1 /2
/2
1 /2
/2 (5)
where a a, ,i f are initial and final length of the crack. In the second step, we have neglected the final size of crack af , which isreasonable for conditions not too close to static failure (i.e. for a given sufficiently large number of cycles), and for >m 2.
Hence, having an initial distribution of defect sizes, results in a transformed distribution of fatigue lives Nf . Ref. [4] suggests usinga Frechet initial distribution of defect sizes (1) because “it cannot have negative particle sizes” and that other distributions “lead tohigh statistical uncertainty or physically non-realistic size effects”. We shall follow his suggestion, also because we are not muchinterested in small details which may result from different choices of initial distribution of defects, as we want to point to someimportant qualitative effects. Obviously, following Wallin in his paper [4], we are implicitly assuming that defects have a shape thatcan be approximate with that of a true defect for which a form of Paris’ law can be applied.
By making the power law transformation (5) of the distribution (1), we simply obtain for >m 2 the CDF of the fatigue lives as
= ⎛
⎝⎜ − −
⎞
⎠⎟
−
P W αm
βg π m C σ
22
,( /2 1) ΔN
a am
m m m
1 /2
/2f(6)
i.e. = −αLα
m2
2a . This result (6) is in contrast with what suggested by Ref. [4] (3), because Ref. [4]’s Eqs. (43) seems to suggest =αL
αm
2 a
while Eq. (50) =αLαm
a although we are not able to follow the reason behind this further result. The difference is of course verysignificant for low values of m. Indeed, in principle there would be infinite shape parameter with =m 2 which is a case of particularinterest. Naturally, we have obtained this result for >m 2 and hence we need to check the validity of the approximation. This willrequire considering also the final size of the crack in (5) and hence introducing a dependence on the final size of the crack and henceon toughness. Numerical experiments in the following paragraph will show that, despite the “deterministic limit” of = → ∞−αL
αm2
2a
will not be realistic (as expected), nevertheless the trend towards very high values is confirmed, and a special paragraph will considerin details the limit case =m 2. Indeed, on reflection we should not be too surprised by this result. For <m 2 integration of Paris’ lawsimply becomes dominated by the final size of the crack, which in turn depends on the toughness, and this is in our discussion adeterministic variable. In more elaborate treatments of course also the toughness would be a random variable.
Unfortunately, it is difficult to find data in the literature to directly support the finding of (6). Indeed, also Ref. [4] show onlylimited data. There are some examples of inclusions measurements in bearing steels or Q&T steel, having Frechet shape parameter
=α 4–5a whereas other data show Weibull fatigue lives =α 6–10; considering the data in Fig. 8 in Ref. [4] for example, S45C steel in3%NaCl solution with lack of threshold, from the SN curve we gather =m 4.2, while =α 9, and we obtain according to (6),
= − =α (4.2 2) 9.9a92 which seems too high compared to the measurement of Frechet shape =α 4–5a in the rest of the paper (although
unfortunately they are not from the same material). This is also possibly related to the very important aspect that we have neglectedthe initiation and short-crack phases which introduce additional scatter, and don’t permit to capture obviously the entire fatiguebehavior in SN curves of uncracked specimen with such simple estimates. We however move on to validate these results under theideal conditions of some numerical tests.
2.1. The special case =m 2
Integrating Paris’ law in the special case of =m 2 leads obviously to
=Na a
πCg σlog( / )
Δff i
2 2 (7)
and where g is a geometrical factor which we take constant during the integration. Moving to random variables for ai we obtainapproximately
⎜ ⎟= ⎛⎝
⎞⎠
P W α a βa β
πCg σlog( / ),
log( / )ΔN a f af a
2 2f(8)
where obviously the final size of the crack is given by a condition of meeting the toughness
M. Ciavarella, A. Papangelo Engineering Fracture Mechanics 191 (2018) 111–124
113
⎜ ⎟= ⎛⎝
⎞⎠
aπ
Kgσ
1f
Ic
max
2
In other words, considering the ratio a β/f a as a given fixed quantity, and generally large one, changing the shape parameter of theFrechet distribution has a linear effect on the shape parameter of the Weibull distribution of fatigue lives. Scatter in initial defectsleads to a much reduced scatter in fatigue lives, as it is not uncommon to think ≃a βlog( / ) 3f a , and if Frechet shape parameter isindeed =α 4–5a as we discussed earlier, this would be an almost deterministic fatigue life, in contrast to common experience (and incontrast with typical values known for metals, as we shall discuss later on). We conclude that this limit case elucidates well the effectof too many simplifying assumptions in crack propagation. However, we shall discuss below that this is not very far from some recentproposals.
Also, an overall increase of defect sizes, i.e. a shift of the Weibull distribution of initial defects with an increase of βa, leads to aslow decrease of fatigue lives but also to an increase of the scatter (lower shape parameter α). This effect was instead not present in the
>m 2 case, where the size of defects was not affecting the shape parameter of the life distribution. Notice that incidentally this alsoincludes a small effect of stress level on af – for example, an increase of stress σmax decrease af and so is similar to what we justdescribed for the increase of βa: the decrease of fatigue lives is expected, but the increase of scatter for the increase of stress level less so.To this, we would need to add the possible deviations due to interaction of mechanisms of fatigue with more extensive plasticity atcrack tip, particularly important for short cracks and uncracked specimens.
2.2. Numerical tests
In order to validate the result of (6), especially with regard to the limit =m 2 which doesn’t permit to make the approximation ofneglecting the final size of the crack, we generated some Frechet distributions of crack sizes, namely 104 specimen of a distributionhaving = =α β5; 10 μma a . We introduced as material some reasonable values of material properties, but since we want to examinethe effect of m, regardless of any other change, we take the liberty to fix toughness to = = −K C80 MPa m , 10 [m/cycles MPa ]Ic
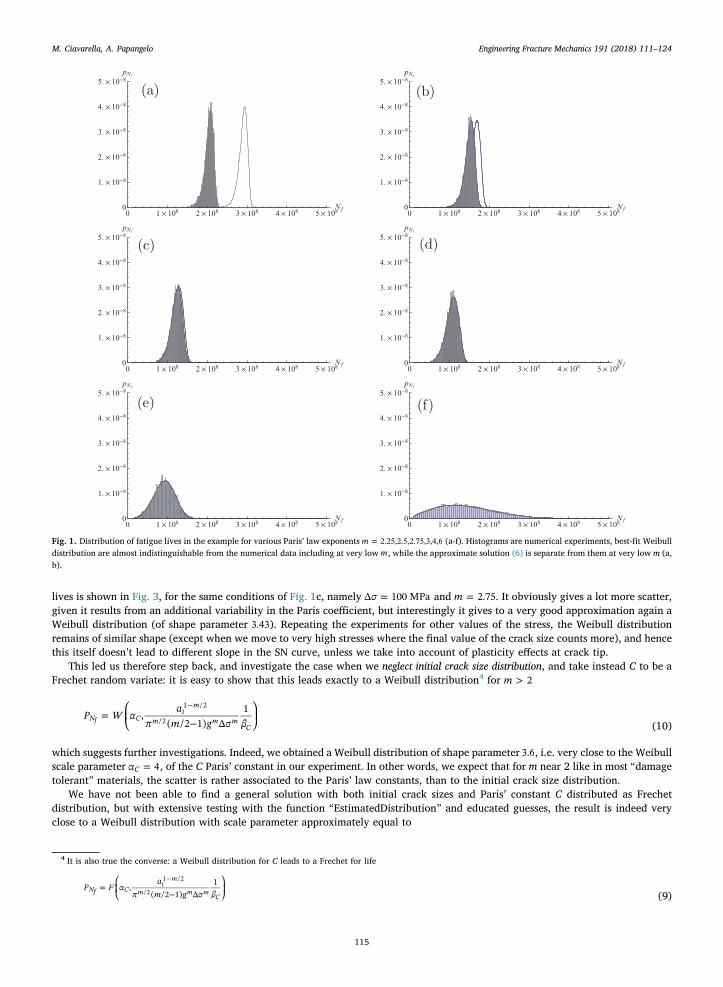
12 m ,=σΔ 100 MPa and vary =m 2.25,2.5,2.75,3,4,6 (Fig. 1 from a to f). Using the full version of (5), we obtain the results shown in Fig. 1(a-
f) as histograms – which were best-fitted to Weibull distribution with the Mathematica function “EstimatedDistribution”, and theresulting Weibull distribution is indistinguishable in the plots from the histograms. The results show clearly that Weibull distributionis always a quite good approximation (that is, also with low m), and that the scatter increases with larger m. The approximate solution(6) shown with (blue3) thin line, is extremely good, except at low m ( <m 2.5), where however it appears that the main discrepancy isa shift in the distribution, rather than a change on the shape parameter. That average life decreases with larger m is obviously aconsequence of the fact that we have kept C to be constant.
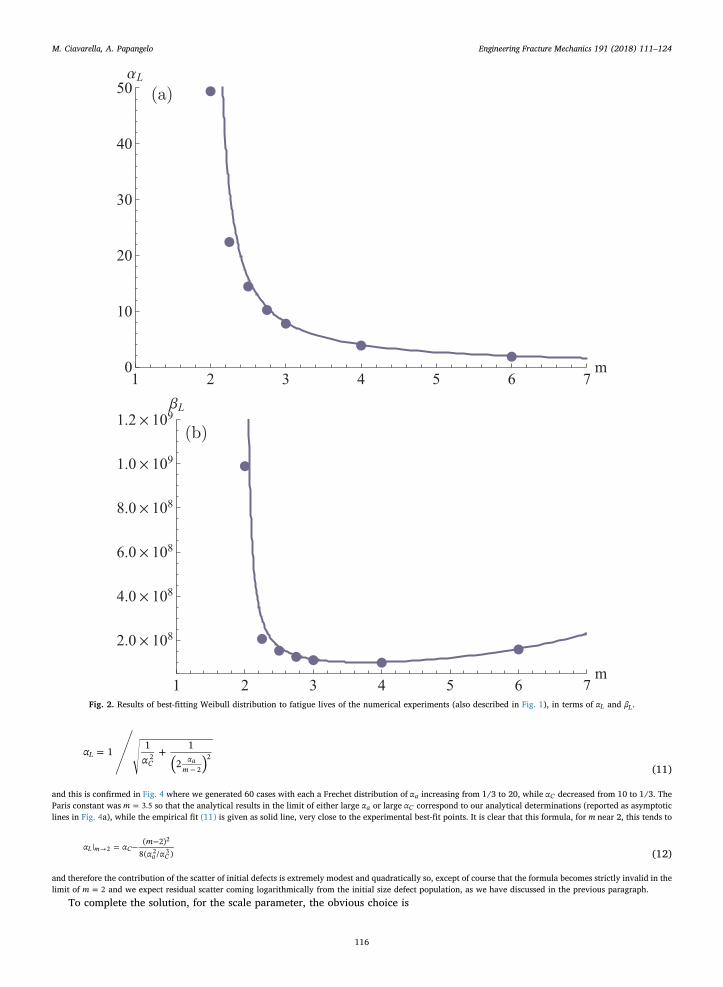
The results can be summarized in Fig. 2(a, b), showing respectively that the average life decreases with larger m, which isobviously a consequence of the fact that we have kept C to be constant. We have included also a numerical investigation using thelimit value =m 2, which results in a very high, but finite, Weibull shape parameter αL.
3. Scatter in Paris’ constants
So far, we have obtained results considering only a deterministic version of Paris’ law. However, especially when m is close to 2,and as the analysis indicates, scatter would seem to reduce significantly even in the presence of large scatter in initial defects, itbecomes important to assess if Paris’ constants, or in general, crack growth, is really deterministic or not. Also, a more general muchdebated question in fatigue is whether Paris law can be extended to cover also the case of “initiation” and “short crack” propagation[12–15]. A full discussion of all these aspects is not obvious, but we shall attempt to make some progress by considering progressivelymore complete cases, finally permitting to obtain some results for the general case of random distributions in initial defects size, andboth Paris’ constants.
3.1. Scatter in C
Recent models [16,17] seem to suggest that initiation in some important applications is practically negligible for lead cracksemerging from natural discontinuities, so that one should only consider the short crack propagation, by means of Paris’ type of laws.In turn, this is treated with equations very close to the original long crack Paris’ law, except for a threshold correction, which isdifferent for long and short cracks, being almost zero for the latter. However, it seems that these models suggest one important effectis that the Paris constant C is itself a random variable (see Fig. 12 of [16]) which varies almost an order of magnitude. More ingeneral, scatter is expected in Paris’ curves even in the long crack regime. We first consider the case when only C is a random variate,to introduce gradual level of complexity.
We therefore attempted to make a further experiment, by taking C to be itself a Frechet distribution with shape parameter= × −β 0.821 10 [m/cycles MPa ]C
12 m , and scale parameter =α 4C , which results in a mean value = × −C 1.01 10 [m/cycles MPa ]12 m ,very close to the value of the “deterministic” model described in the earlier paragraph ( = −C 10 [m/cycles MPa ]12 m ), and in practiseless than an order of magnitude but rather a factor 2 variation (more precisely, =SD mean/ 0.41). The resulting distribution of fatigue
3 For interpretation of color in Fig. 1, the reader is referred to the web version of this article.
M. Ciavarella, A. Papangelo Engineering Fracture Mechanics 191 (2018) 111–124
114
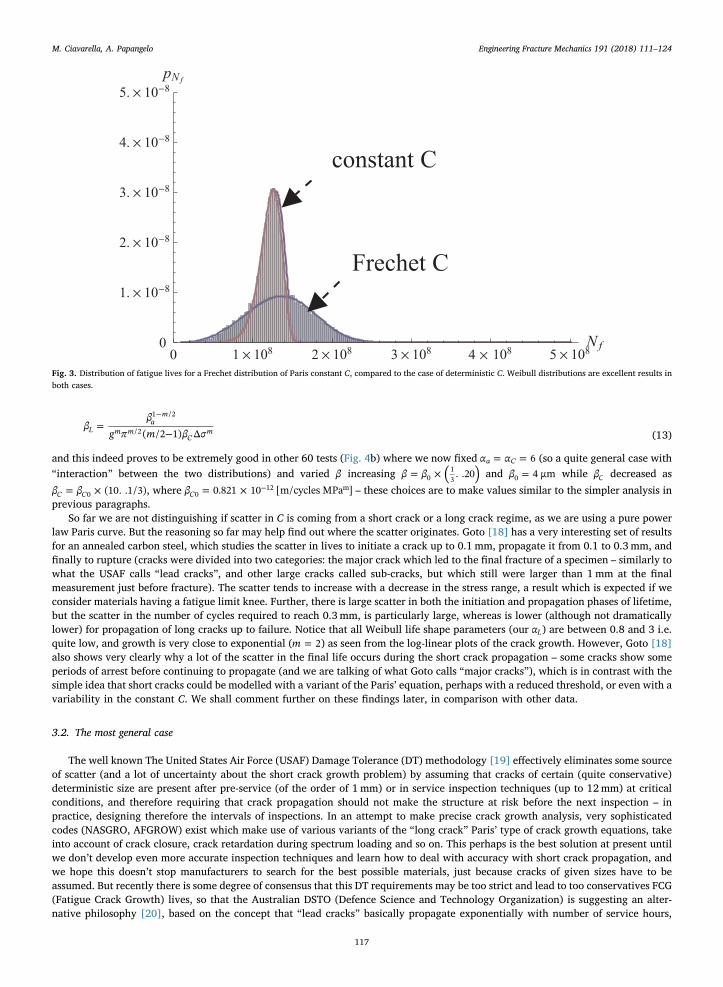
lives is shown in Fig. 3, for the same conditions of Fig. 1c, namely =σΔ 100 MPa and =m 2.75. It obviously gives a lot more scatter,given it results from an additional variability in the Paris coefficient, but interestingly it gives to a very good approximation again aWeibull distribution (of shape parameter 3.43). Repeating the experiments for other values of the stress, the Weibull distributionremains of similar shape (except when we move to very high stresses where the final value of the crack size counts more), and hencethis itself doesn’t lead to different slope in the SN curve, unless we take into account of plasticity effects at crack tip.
This led us therefore step back, and investigate the case when we neglect initial crack size distribution, and take instead C to be aFrechet random variate: it is easy to show that this leads exactly to a Weibull distribution4 for >m 2
⎜ ⎟= ⎛⎝ −
⎞⎠
−P W α
aπ m g σ β
,( /2 1) Δ
1N C
im
m m mC
1 /2
/2f(10)
which suggests further investigations. Indeed, we obtained a Weibull distribution of shape parameter 3.6, i.e. very close to the Weibullscale parameter =α 4C , of the C Paris’ constant in our experiment. In other words, we expect that for m near 2 like in most “damagetolerant” materials, the scatter is rather associated to the Paris’ law constants, than to the initial crack size distribution.
We have not been able to find a general solution with both initial crack sizes and Paris’ constant C distributed as Frechetdistribution, but with extensive testing with the function “EstimatedDistribution” and educated guesses, the result is indeed veryclose to a Weibull distribution with scale parameter approximately equal to
Fig. 1. Distribution of fatigue lives in the example for various Paris’ law exponents =m 2.25,2.5,2.75,3,4,6 (a-f). Histograms are numerical experiments, best-fit Weibulldistribution are almost indistinguishable from the numerical data including at very low m, while the approximate solution (6) is separate from them at very low m (a,b).
4 It is also true the converse: a Weibull distribution for C leads to a Frechet for life
⎜ ⎟= ⎛
⎝ −⎞
⎠
−P F α
aπ m g σ β
,( /2 1) Δ
1Nf C
im
m m mC
1 /2
/2 (9)
M. Ciavarella, A. Papangelo Engineering Fracture Mechanics 191 (2018) 111–124
115
= +−( )
αα
1 1 1
2L
C αm
2
2
2a(11)
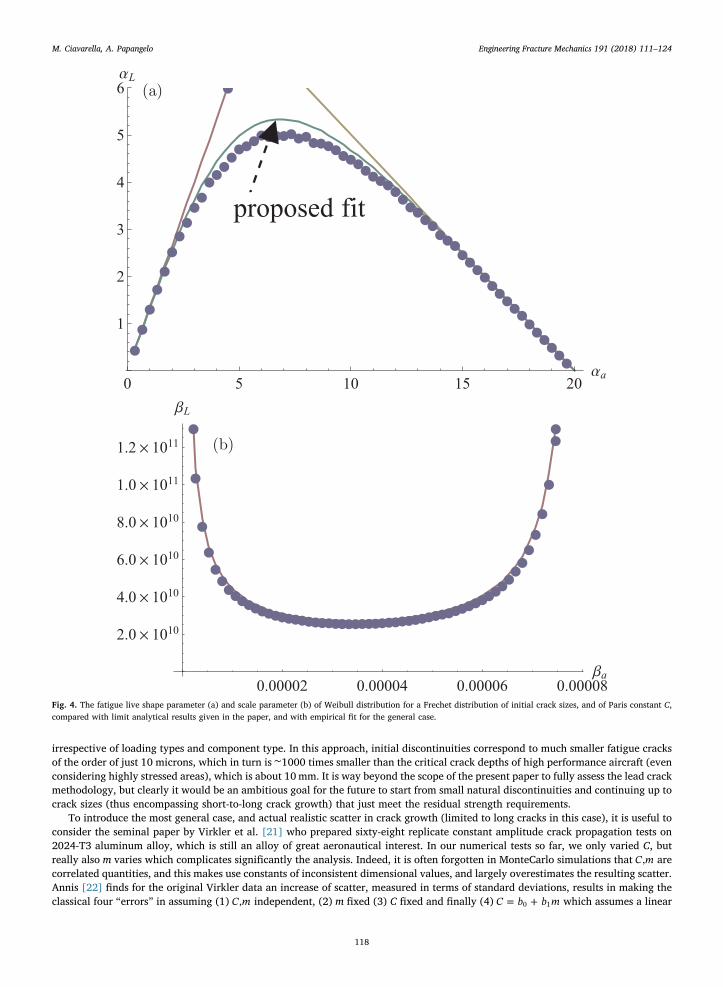
and this is confirmed in Fig. 4 where we generated 60 cases with each a Frechet distribution of αa increasing from 1/3 to 20, while αC decreased from 10 to 1/3. TheParis constant was =m 3.5 so that the analytical results in the limit of either large αa or large αC correspond to our analytical determinations (reported as asymptoticlines in Fig. 4a), while the empirical fit (11) is given as solid line, very close to the experimental best-fit points. It is clear that this formula, for m near 2, this tends to
= − −→α α m
α α| ( 2)
8( / )L m C
a C2
2
2 3 (12)
and therefore the contribution of the scatter of initial defects is extremely modest and quadratically so, except of course that the formula becomes strictly invalid in thelimit of =m 2 and we expect residual scatter coming logarithmically from the initial size defect population, as we have discussed in the previous paragraph.
To complete the solution, for the scale parameter, the obvious choice is
Fig. 2. Results of best-fitting Weibull distribution to fatigue lives of the numerical experiments (also described in Fig. 1), in terms of αL and βL.
M. Ciavarella, A. Papangelo Engineering Fracture Mechanics 191 (2018) 111–124
116
=−
−
ββ
g π m β σ( /2 1) ΔLa
m
m mC
m
1 /2
/2 (13)
and this indeed proves to be extremely good in other 60 tests (Fig. 4b) where we now fixed = =α α 6a C (so a quite general case with“interaction” between the two distributions) and varied β increasing = × ( )β β . .200
13 and =β 4 μm0 while βC decreased as
= ×β β (10. .1/3)C C0 , where = × −β 0.821 10 [m/cycles MPa ]C012 m – these choices are to make values similar to the simpler analysis in
previous paragraphs.So far we are not distinguishing if scatter in C is coming from a short crack or a long crack regime, as we are using a pure power
law Paris curve. But the reasoning so far may help find out where the scatter originates. Goto [18] has a very interesting set of resultsfor an annealed carbon steel, which studies the scatter in lives to initiate a crack up to 0.1 mm, propagate it from 0.1 to 0.3 mm, andfinally to rupture (cracks were divided into two categories: the major crack which led to the final fracture of a specimen – similarly towhat the USAF calls “lead cracks”, and other large cracks called sub-cracks, but which still were larger than 1mm at the finalmeasurement just before fracture). The scatter tends to increase with a decrease in the stress range, a result which is expected if weconsider materials having a fatigue limit knee. Further, there is large scatter in both the initiation and propagation phases of lifetime,but the scatter in the number of cycles required to reach 0.3mm, is particularly large, whereas is lower (although not dramaticallylower) for propagation of long cracks up to failure. Notice that all Weibull life shape parameters (our αL) are between 0.8 and 3 i.e.quite low, and growth is very close to exponential ( =m 2) as seen from the log-linear plots of the crack growth. However, Goto [18]also shows very clearly why a lot of the scatter in the final life occurs during the short crack propagation – some cracks show someperiods of arrest before continuing to propagate (and we are talking of what Goto calls “major cracks”), which is in contrast with thesimple idea that short cracks could be modelled with a variant of the Paris’ equation, perhaps with a reduced threshold, or even with avariability in the constant C. We shall comment further on these findings later, in comparison with other data.
3.2. The most general case
The well known The United States Air Force (USAF) Damage Tolerance (DT) methodology [19] effectively eliminates some sourceof scatter (and a lot of uncertainty about the short crack growth problem) by assuming that cracks of certain (quite conservative)deterministic size are present after pre-service (of the order of 1mm) or in service inspection techniques (up to 12mm) at criticalconditions, and therefore requiring that crack propagation should not make the structure at risk before the next inspection – inpractice, designing therefore the intervals of inspections. In an attempt to make precise crack growth analysis, very sophisticatedcodes (NASGRO, AFGROW) exist which make use of various variants of the “long crack” Paris’ type of crack growth equations, takeinto account of crack closure, crack retardation during spectrum loading and so on. This perhaps is the best solution at present untilwe don’t develop even more accurate inspection techniques and learn how to deal with accuracy with short crack propagation, andwe hope this doesn’t stop manufacturers to search for the best possible materials, just because cracks of given sizes have to beassumed. But recently there is some degree of consensus that this DT requirements may be too strict and lead to too conservatives FCG(Fatigue Crack Growth) lives, so that the Australian DSTO (Defence Science and Technology Organization) is suggesting an alter-native philosophy [20], based on the concept that “lead cracks” basically propagate exponentially with number of service hours,
Fig. 3. Distribution of fatigue lives for a Frechet distribution of Paris constant C, compared to the case of deterministic C. Weibull distributions are excellent results inboth cases.
M. Ciavarella, A. Papangelo Engineering Fracture Mechanics 191 (2018) 111–124
117
irrespective of loading types and component type. In this approach, initial discontinuities correspond to much smaller fatigue cracksof the order of just 10 microns, which in turn is ∼1000 times smaller than the critical crack depths of high performance aircraft (evenconsidering highly stressed areas), which is about 10mm. It is way beyond the scope of the present paper to fully assess the lead crackmethodology, but clearly it would be an ambitious goal for the future to start from small natural discontinuities and continuing up tocrack sizes (thus encompassing short-to-long crack growth) that just meet the residual strength requirements.
To introduce the most general case, and actual realistic scatter in crack growth (limited to long cracks in this case), it is useful toconsider the seminal paper by Virkler et al. [21] who prepared sixty-eight replicate constant amplitude crack propagation tests on2024-T3 aluminum alloy, which is still an alloy of great aeronautical interest. In our numerical tests so far, we only varied C, butreally also m varies which complicates significantly the analysis. Indeed, it is often forgotten in MonteCarlo simulations that C m, arecorrelated quantities, and this makes use constants of inconsistent dimensional values, and largely overestimates the resulting scatter.Annis [22] finds for the original Virkler data an increase of scatter, measured in terms of standard deviations, results in making theclassical four “errors” in assuming (1) C m, independent, (2) m fixed (3) C fixed and finally (4) = +C b b m0 1 which assumes a linear
Fig. 4. The fatigue live shape parameter (a) and scale parameter (b) of Weibull distribution for a Frechet distribution of initial crack sizes, and of Paris constant C,compared with limit analytical results given in the paper, and with empirical fit for the general case.
M. Ciavarella, A. Papangelo Engineering Fracture Mechanics 191 (2018) 111–124
118
correlation. All errors largely overestimate the scatter, up to factor 7×, except error 4 obviously which assuming too strict corre-lation, underestimates it. However, while Annis [22] suggests a Markov Chain Monte Carlo simulation using the joint density of C m,to solve the problem, we suggest here a perhaps more elegant way to solve this aspect and the dimensional inconsistency. We startfrom the idea by Bergner & Zouhar [23] who observed that, scaling Paris law so that the Irwin stress intensity factor is divided by aconstant value,
⎜ ⎟= ⎛⎝
⎞⎠
dadN
C KK
ΔΔ
m
00 (14)
where C0 in principle is arbitrary, =C C KΔ m0 0 , there is a specific value for which the quantities C m,0 become uncorrelated. This is
defined by the condition
=−
∑ −
∑ −=
=KΔ 10
m m C C
m m0
( )log( / )
( )j k j j g
j k j
1,
1,2
(15)
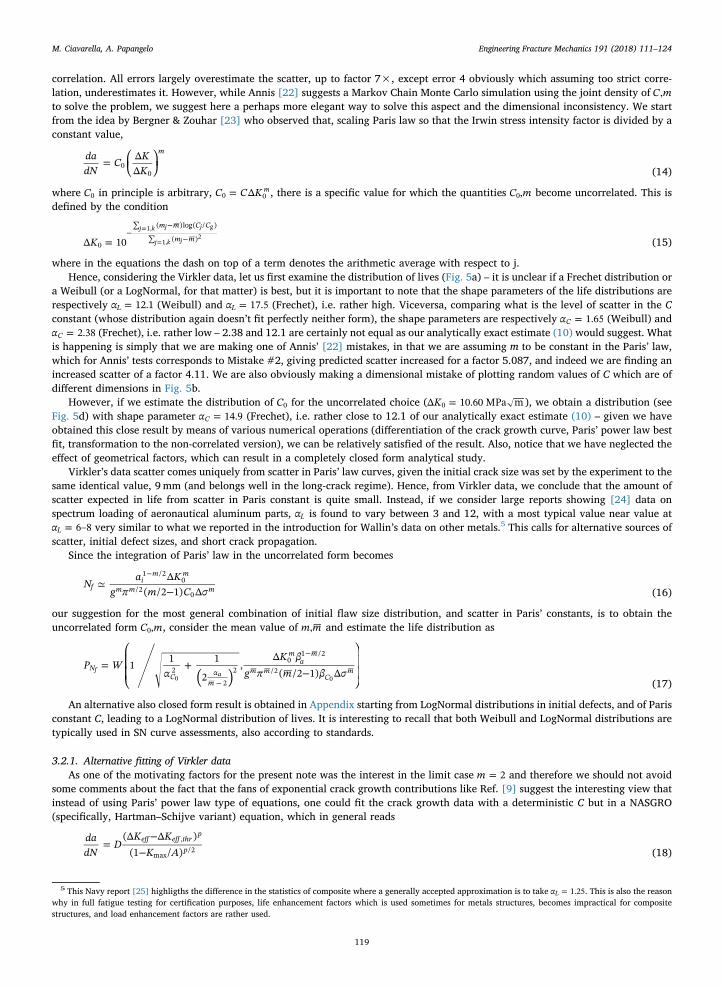
where in the equations the dash on top of a term denotes the arithmetic average with respect to j.Hence, considering the Virkler data, let us first examine the distribution of lives (Fig. 5a) – it is unclear if a Frechet distribution or
a Weibull (or a LogNormal, for that matter) is best, but it is important to note that the shape parameters of the life distributions arerespectively =α 12.1L (Weibull) and =α 17.5L (Frechet), i.e. rather high. Viceversa, comparing what is the level of scatter in the Cconstant (whose distribution again doesn’t fit perfectly neither form), the shape parameters are respectively =α 1.65C (Weibull) and
=α 2.38C (Frechet), i.e. rather low – 2.38 and 12.1 are certainly not equal as our analytically exact estimate (10) would suggest. Whatis happening is simply that we are making one of Annis’ [22] mistakes, in that we are assuming m to be constant in the Paris’ law,which for Annis’ tests corresponds to Mistake #2, giving predicted scatter increased for a factor 5.087, and indeed we are finding anincreased scatter of a factor 4.11. We are also obviously making a dimensional mistake of plotting random values of C which are ofdifferent dimensions in Fig. 5b.
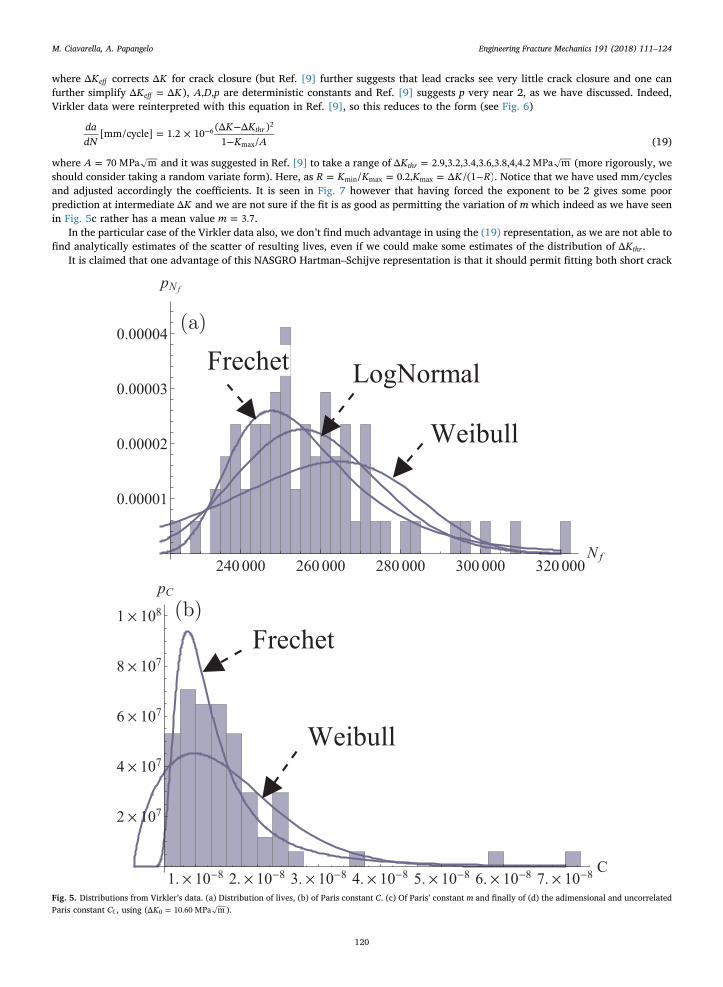
However, if we estimate the distribution of C0 for the uncorrelated choice ( =KΔ 10.60 MPa m0 ), we obtain a distribution (seeFig. 5d) with shape parameter =α 14.9C (Frechet), i.e. rather close to 12.1 of our analytically exact estimate (10) – given we haveobtained this close result by means of various numerical operations (differentiation of the crack growth curve, Paris’ power law bestfit, transformation to the non-correlated version), we can be relatively satisfied of the result. Also, notice that we have neglected theeffect of geometrical factors, which can result in a completely closed form analytical study.
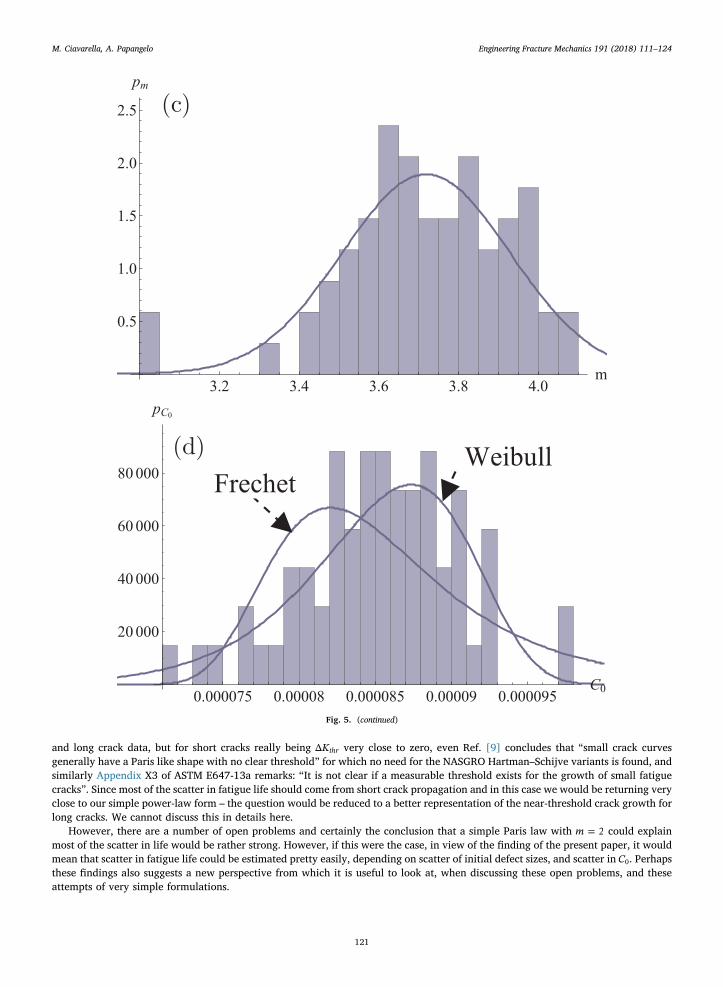
Virkler’s data scatter comes uniquely from scatter in Paris’ law curves, given the initial crack size was set by the experiment to thesame identical value, 9 mm (and belongs well in the long-crack regime). Hence, from Virkler data, we conclude that the amount ofscatter expected in life from scatter in Paris constant is quite small. Instead, if we consider large reports showing [24] data onspectrum loading of aeronautical aluminum parts, αL is found to vary between 3 and 12, with a most typical value near value at
=α 6–8L very similar to what we reported in the introduction for Wallin’s data on other metals.5 This calls for alternative sources ofscatter, initial defect sizes, and short crack propagation.
Since the integration of Paris’ law in the uncorrelated form becomes
≃−
−N
a Kg π m C σ
Δ( /2 1) Δf
im m
m m m
1 /20
/20 (16)
our suggestion for the most general combination of initial flaw size distribution, and scatter in Paris’ constants, is to obtain theuncorrelated form C m,0 , consider the mean value of m m, and estimate the life distribution as
=⎛
⎝
⎜⎜
+−
⎞
⎠
⎟⎟
−
−
( )P W
αK β
g π m β σ1 1 1
2,
Δ( /2 1) ΔN
C αm
ma
m
m mC
m2
2
20
1 /2
/2fa0 0 (17)
An alternative also closed form result is obtained in Appendix starting from LogNormal distributions in initial defects, and of Parisconstant C, leading to a LogNormal distribution of lives. It is interesting to recall that both Weibull and LogNormal distributions aretypically used in SN curve assessments, also according to standards.
3.2.1. Alternative fitting of Virkler dataAs one of the motivating factors for the present note was the interest in the limit case =m 2 and therefore we should not avoid
some comments about the fact that the fans of exponential crack growth contributions like Ref. [9] suggest the interesting view thatinstead of using Paris’ power law type of equations, one could fit the crack growth data with a deterministic C but in a NASGRO(specifically, Hartman–Schijve variant) equation, which in general reads
=−
−dadN
DK K
K A(Δ Δ )
(1 / )eff eff thr
p
p,
max/2 (18)
5 This Navy report [25] highligths the difference in the statistics of composite where a generally accepted approximation is to take =α 1.25L . This is also the reasonwhy in full fatigue testing for certification purposes, life enhancement factors which is used sometimes for metals structures, becomes impractical for compositestructures, and load enhancement factors are rather used.
M. Ciavarella, A. Papangelo Engineering Fracture Mechanics 191 (2018) 111–124
119
where KΔ eff corrects KΔ for crack closure (but Ref. [9] further suggests that lead cracks see very little crack closure and one canfurther simplify =K KΔ Δeff ), A D p, , are deterministic constants and Ref. [9] suggests p very near 2, as we have discussed. Indeed,Virkler data were reinterpreted with this equation in Ref. [9], so this reduces to the form (see Fig. 6)
= × −−
−dadN
K KK A
[mm/cycle] 1.2 10 (Δ Δ )1 /
thr62
max (19)
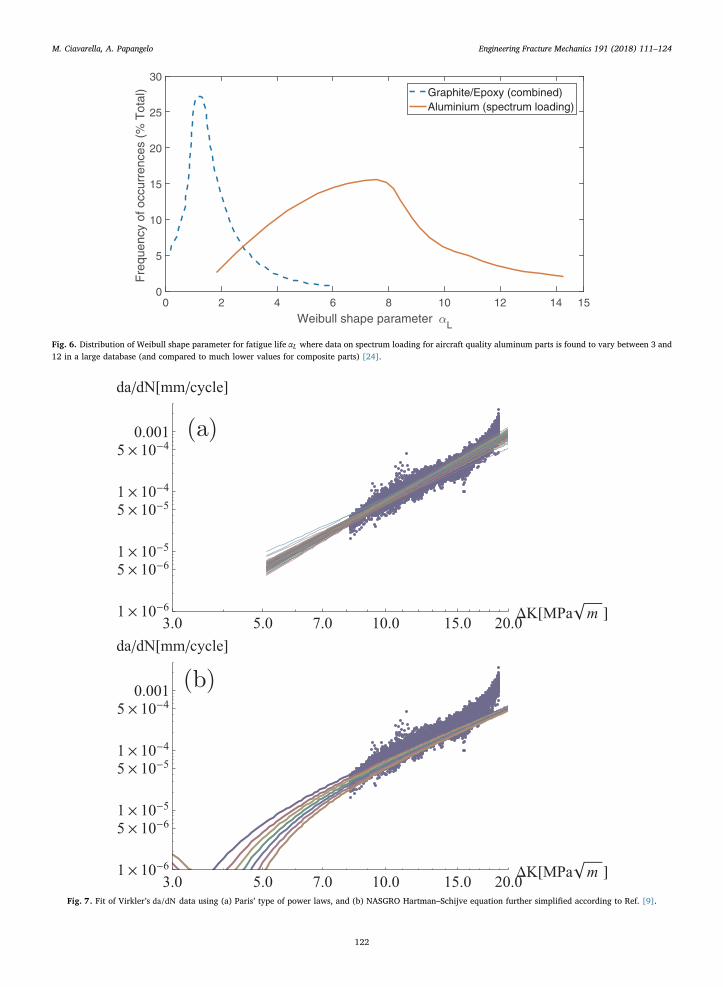
where =A 70 MPa m and it was suggested in Ref. [9] to take a range of =KΔ 2.9,3.2,3.4,3.6,3.8,4,4.2thr MPa m (more rigorously, weshould consider taking a random variate form). Here, as = = = −R K K K K R/ 0.2, Δ /(1 )min max max . Notice that we have used mm/cyclesand adjusted accordingly the coefficients. It is seen in Fig. 7 however that having forced the exponent to be 2 gives some poorprediction at intermediate KΔ and we are not sure if the fit is as good as permitting the variation of m which indeed as we have seenin Fig. 5c rather has a mean value =m 3.7.
In the particular case of the Virkler data also, we don’t find much advantage in using the (19) representation, as we are not able tofind analytically estimates of the scatter of resulting lives, even if we could make some estimates of the distribution of KΔ thr .
It is claimed that one advantage of this NASGRO Hartman–Schijve representation is that it should permit fitting both short crack
Fig. 5. Distributions from Virkler’s data. (a) Distribution of lives, (b) of Paris constant C. (c) Of Paris’ constant m and finally of (d) the adimensional and uncorrelatedParis constant C0, using ( =KΔ 10.60 MPa m0 ).
M. Ciavarella, A. Papangelo Engineering Fracture Mechanics 191 (2018) 111–124
120
and long crack data, but for short cracks really being KΔ thr very close to zero, even Ref. [9] concludes that “small crack curvesgenerally have a Paris like shape with no clear threshold” for which no need for the NASGRO Hartman–Schijve variants is found, andsimilarly Appendix X3 of ASTM E647-13a remarks: “It is not clear if a measurable threshold exists for the growth of small fatiguecracks”. Since most of the scatter in fatigue life should come from short crack propagation and in this case we would be returning veryclose to our simple power-law form – the question would be reduced to a better representation of the near-threshold crack growth forlong cracks. We cannot discuss this in details here.
However, there are a number of open problems and certainly the conclusion that a simple Paris law with =m 2 could explainmost of the scatter in life would be rather strong. However, if this were the case, in view of the finding of the present paper, it wouldmean that scatter in fatigue life could be estimated pretty easily, depending on scatter of initial defect sizes, and scatter in C0. Perhapsthese findings also suggests a new perspective from which it is useful to look at, when discussing these open problems, and theseattempts of very simple formulations.
Fig. 5. (continued)
M. Ciavarella, A. Papangelo Engineering Fracture Mechanics 191 (2018) 111–124
121
0 2 4 6 8 10 12 14 15
Weibull shape parameter L
0
5
10
15
20
25
30
Fre
quen
cy o
f occ
urre
nces
(%
Tot
al) Graphite/Epoxy (combined)
Aluminium (spectrum loading)
Fig. 6. Distribution of Weibull shape parameter for fatigue life αL where data on spectrum loading for aircraft quality aluminum parts is found to vary between 3 and12 in a large database (and compared to much lower values for composite parts) [24].
Fig. 7. Fit of Virkler’s da/dN data using (a) Paris’ type of power laws, and (b) NASGRO Hartman–Schijve equation further simplified according to Ref. [9].
M. Ciavarella, A. Papangelo Engineering Fracture Mechanics 191 (2018) 111–124
122
4. Discussion
In earlier studies [12–15], we have shown that, in order to permit Paris’ law to include also the behavior of SN curves foruncracked materials, one could in principle modify it so as to include also the “material properties” of (for example) Basquin law(which is the power law form of SN curves =σ N constΔ k ). In principle, we would be happy to have a model containing the twoconstants of Paris law and the 2 constants of Basquin law, together with the two fatigue “thresholds” – which amounts to six constantsin total. Adding to this, we would need a full statistical framework to be able to assess the scatter in fatigue life. Such a simple modelat present does not exist. Particularly when Paris law constant m is low, one finds that the SN curve for the material (when uncracked)generally is much less steep than the integrated form of Paris law suggests, that is ≫k m. Indeed, in medium life fatigue elasticanalysis is not sufficient and particularly for short cracks, in the transition range from low-cycle fatigue and high-cycle fatigue, plasticdeformation effects cannot be ignored: they may be taken into account approximately with an increase of the effective crack size witha plasticity correction [25], a proposal which is not too different from previous approaches to [12–15] insert SN curves of uncrackedspecimen in Paris’ crack growth curves. We therefore find quite optimistic that short crack propagation should simply obey an evensimpler form of Paris’ law than long-crack propagation, independent on stress level.
The small amount of scatter in long crack propagation data may explain the success of mainly deterministic DT procedures used inthe world, in the best of the authors’ knowledge. Further, if DT were really too conservative, as some people are claiming, there wouldbe not much sense to further investigate in this direction, if we are discussing structure which require this certification. But aircraftavailability has fallen to less than 50% in many countries,6 and helicopters in particular even less than 25%. Therefore, situations dooccur when cracks are detected in one aircraft and maintenance services want to know if they have to investigate, and perhapsreschedule all inspection intervals. The lead crack approach would be more prone to a statistical framework, but clearly insisting onthe exponential crack growth has serious implications that we discussed in the present paper, and further work should examine theseimplications.
5. Conclusions
We have shown that, as it was not noticed in previous studies (in the best of the author’s knowledge), the case of =m 2 is a limitcase in which the variability of fatigue lives becomes extremely small, i.e. independent on the distribution and scatter of initialdefects. In retrospects, this was to be expected, since =m 2 is the transition between the case when the life depends mostly on thefinal size of the crack ( <m 2), and when, as more common, the life depends mostly on the initial crack size. We have given thecorrect dependence for the special but important case of Frechet initial defect distribution, which results in a Weibull distribution oflives. We have then generalized the results in the case when Paris’ constant C is also a Frechet distribution, which may be of interestparticularly for some short crack law suggested recently. Finally, we have generalized the results by obtaining simple estimates in themost general case, when defect size and Paris’ constants are all random variate: in this case we have suggested to transform first C m,to the uncorrelated form C m,0 , and then considering the mean value of m, quite good estimates are possible without elaboratedmultivariate MonteCarlo simulations suggested previously. The final equations obtained in the Weibull form (17), and in the Log-Normal form (6). An alternative derivation of statistical distributions for LogNormal initial crack size and Paris’ constant C0 arepresented in Appendix, which however lead to similar conclusion, in perhaps less clear form.
Acknowledgements
The author thanks Prof. Rhys Jones (Monash U, Australia), Dr. Loris Molent from DSTO, Australia, for many entertaining scientificdiscussions, especially about the exponential crack growth, and the “lead crack”methodology. Also to Prof. Jan Drewes Achenbach ofNorthwestern U who pointed me to his former student Dr. Moshe Cohen who got the Virkler data from the late Professor Hillberry atPurdue, and kindly retrieved them for me. A.P. is thankful to the DFG (German Research Foundation) for funding the project HO3852/11-1.
Appendix A. Lognormal distributions of C0 and initial crack size
In the following, we shall intend for the Paris multiplier C the distribution obtained with zero correlation with the m constant, C0 –as otherwise using this approach is not recommended as it would greatly overestimate scatter. Integration of the Paris’ law (14),considering >m 2 is given by (16), which we could take in the log form (here for m we shall in general intend the mean value m)
≃ + − − − − −N m K m a C m gπ σ mlog logΔ (1 /2)log log log( Δ ) log( /2 1)f i0 01/2 (20)
Hence, it is easy to get the transformed distribution of fatigue lives Nlog f , starting from a lognormal distribution for both initialdistribution of defect sizes ai and of Paris constant C0,
=P LN μ σ( , )a a ai i i (21)
6 https://www.defensenews.com/air/2017/12/12/france-creates-office-to-improve-military-aircraft-readiness/.
M. Ciavarella, A. Papangelo Engineering Fracture Mechanics 191 (2018) 111–124
123
=P LN μ σ( , )C C C0 0 (22)
as alog i and Clog 0 will both be normal distributed, and where notice we use the notation μ σ,a ai i for the mean and the SD of the normaldistribution from which the LN is based: in other words, the mean and SD of the distribution when the quantities are in log scale (thisis the notation of Mathematica). The sum of normal distributions follows simple rules, permitting to get
= − − − + − − + −P N m gπ σ m m μ μ σ σ m( log( Δ ) log( /2 1) (1 /2) , (1 /2) )N a C C alog1/2 2 2 2
f i i0 0 (23)
i.e. the life is a log normal distribution, in agreement with many technical standards who suggest to take this distribution, alternativeto the Weibull form (17), which we have described in the main parts of the paper.
It is remarkable to observe in this result that in the limit case of → +m 2 , it seems both the mean and the variance of thedistribution tend to become unaffected by the distribution of initial defect sizes, as we have found already in the main part of thepaper. This result is valid only approximately in this limit, since we have neglected the final size of the crack.
Appendix B. Supplementary material
Supplementary data associated with this article can be found, in the online version, at http://dx.doi.org/10.1016/j.engfracmech.2018.01.019.
References
[1] Afferrante L, Ciavarella M, Valenza E. Is Weibull’s modulus really a material constant? Example case with interacting collinear cracks. Int J Solids Struct2006;43(17):5147–57.
[2] Ciavarella M, Vinogradov V, Carbone G. A critical assessment on Kassapoglou’s statistical model for composites fatigue; 2013. Available from: arXiv preprint1310.1455.
[3] Murakami Yukitaka. Metal fatigue: effects of small defects and nonmetallic inclusions. Elsevier; 2002.[4] Wallin K. Statistical aspects of fatigue life and endurance limit. Fatigue Fract Eng Mater Struct 2010;33(6):333–44.[5] Wang QG, Crepeau PN, Davidson CJ, Griffiths JR. Oxide films, pores and the fatigue lives of cast aluminum alloys. Metall Mater Trans B 2006;37(6):887–95.[6] Paris P, Erdogan F. A critical analysis of crack propagation laws. J Basic Eng, Trans Am Soc Mech Eng 1963:528–34.[7] Lo M, Jones R, Bowler A, Dorman M, Edwards D. Crack growth at fastener holes containing intergranular cracking. Fatigue Fract Eng Mater Struct
2017;40(10):1664–75.[8] Jones R, Peng D, Huang P, Singh RR. Crack growth from naturally occurring material discontinuities in operational aircraft. Procedia Eng 2015;101:227–34.[9] Jones R. Fatigue crack growth and damage tolerance. Fatigue Fract Eng Mater Struct 2014;37(5):463–83.[10] Ciavarella M, D’Antuono P, Papangelo A. On the connection between Palmgren-Miner’s rule and crack propagation laws. Fatigue Fract Eng Mater Struct 2018.
http://dx.doi.org/10.1111/ffe.12789.[11] ASTM. ASTM standard E647-13a Standard test method for measurement of fatigue crack growth rates. ASTM International; 2013.[12] Ciavarella M, Monno F. On the possible generalizations of the Kitagawa-Takahashi diagram and of the El Haddad equation to finite life. Int J Fatigue
2006;28(12):1826–37.[13] Pugno N, Ciavarella M, Cornetti P, Carpinteri A. A generalized Paris’ law for fatigue crack growth. J Mech Phys Solids 2006;54(7):1333–49.[14] Ciavarella M. A simple approximate expression for finite life fatigue behaviour in the presence of “crack-like” or “blunt” notches. Fatigue Fract Eng Mater Struct
2012;35(3):247–56.[15] Ciavarella M. Crack propagation laws corresponding to a generalized El Haddad equation. Int J Aerosp Lightweight Struct (IJALS) 2011;1(1).[16] Larsen JM, Jha SK, Szczepanski CJ, Caton MJ, John R, Rosenberger AH, et al. Reducing uncertainty in fatigue life limits of turbine engine alloys. Int J Fatigue
2013;57:103–12.[17] Jha SK, Caton MJ, Larsen JM. A new paradigm of fatigue variability behavior and implications for life prediction. Mater Sci Eng: A 2007;468:23–32.[18] Goto M. Scatter characteristics of fatigue life and the behaviour of small cracks. Fatigue Fract Eng Mater Struct 1992;15(10):953–63.[19] Military specification airplane damage tolerance requirements. MIL-A-83444 (USAF); 1974.[20] Molent L, Barter SA, Wanhill RJH. The lead crack fatigue lifing framework. Int J Fatigue 2011;33(3):323–31.[21] Virkler DA, Hillberry B, Goel PK. The statistical nature of fatigue crack propagation. J Eng Mater Technol 1979;101(2):148–53.[22] Annis C. Probabilistic life prediction isn’t as easy as it looks. J ASTM Int 2004;1(2):1–12.[23] Bergner F, Zouhar G. A new approach to the correlation between the coefficient and the exponent in the power law equation of fatigue crack growth. Int J
Fatigue 2000;22(3):229–39.[24] Whitehead RS, Kan HP, Cordero R, Saether ES. DOT/FAA/CT-86/39 (Navy Report Number NADC-87042-60) Certification Testing Methodology for Composite
Structures, Volumes I and II, Report No. NADC-87042-60; October 1986.<http://www.dtic.mil/dtic/tr/fulltext/u2/b112288.pdf > .[25] Liu Y, Mahadevan S. Probabilistic fatigue life prediction using an equivalent initial flaw size distribution. Int J Fatigue 2009;31(3):476–87.
M. Ciavarella, A. Papangelo Engineering Fracture Mechanics 191 (2018) 111–124
124