Embed Size (px)
Citation preview
Workshop Monitored Natural Attenuation (MNA)Using the Self Cleaning Capacity of Nature
Kraków, October 27/28, 2009, Qubus Hotel
Dr. Thomas Held
Enhanced Natural Attenuation (ENA)- Low Cost Remediation Technologies
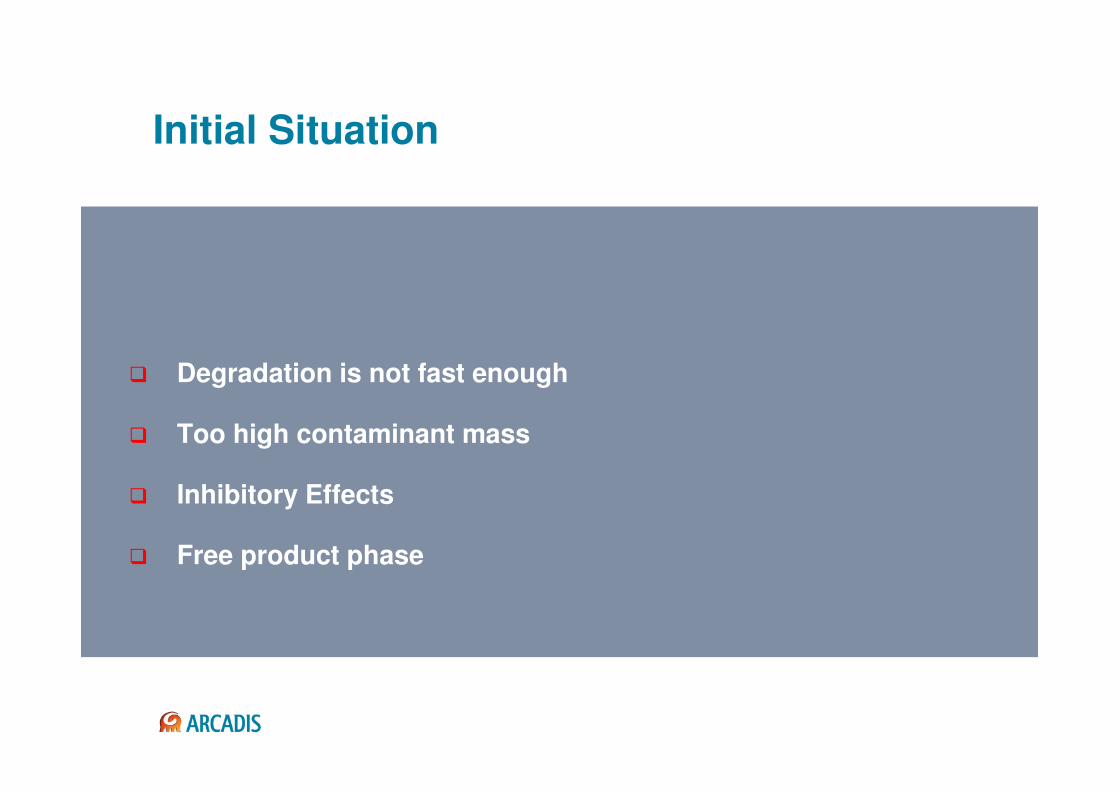
Initial Situation
� Degradation is not fast enough
� Too high contaminant mass
� Inhibitory Effects
� Free product phase
Initial Situation
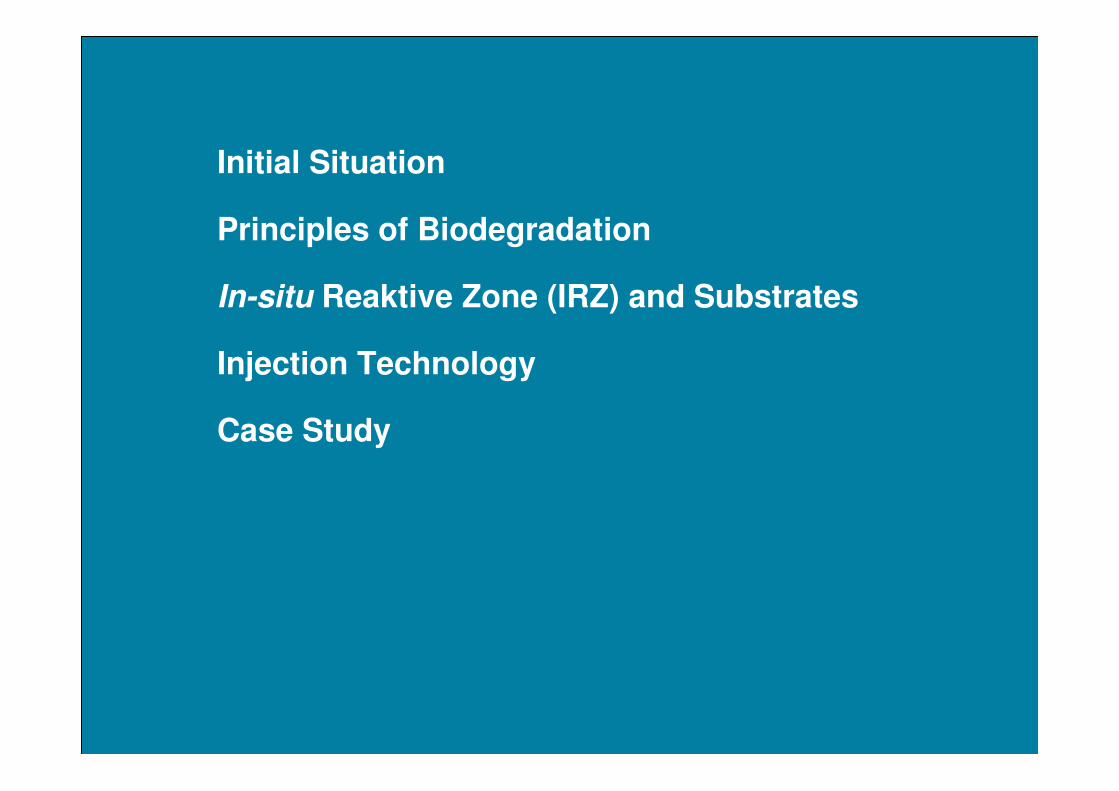
Principles of Biodegradation
In-situ Reaktive Zone (IRZ) and Substrates
Injection Technology
Case Study
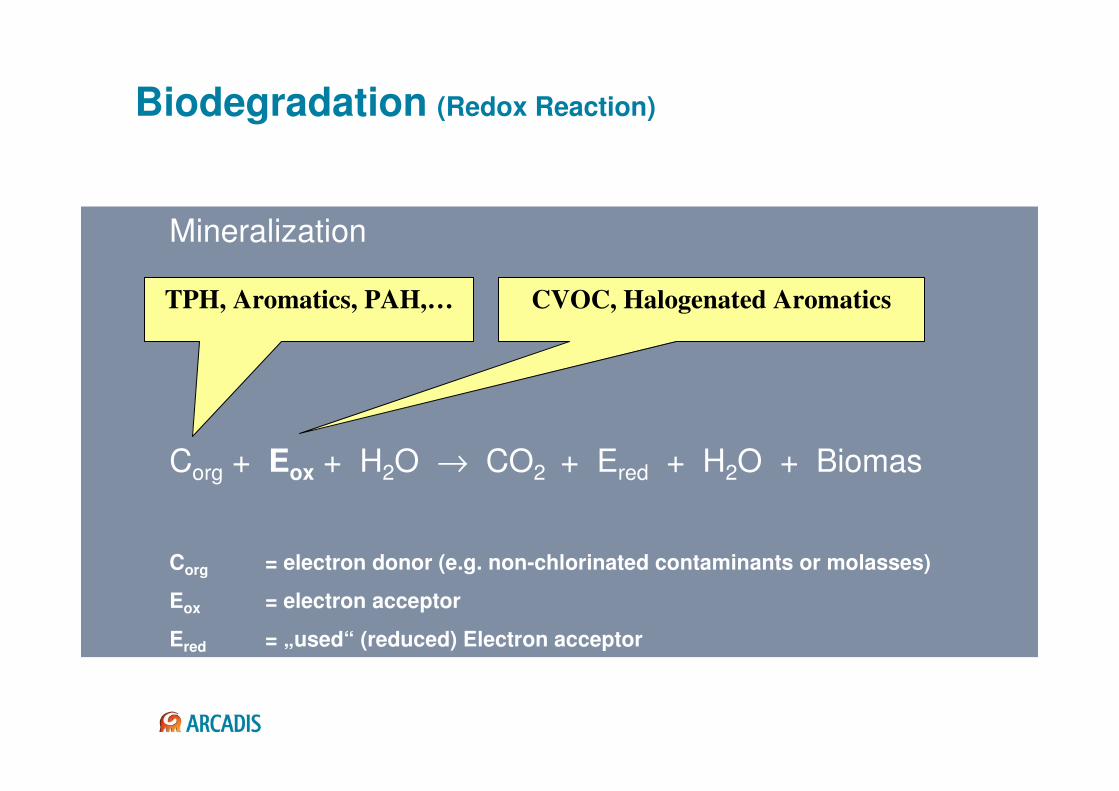
Biodegradation (Redox Reaction)
Mineralization
Corg + Eox + H2O → CO2 + Ered + H2O + Biomas
Corg = electron donor (e.g. non-chlorinated contaminants or molasses)
Eox = electron acceptor
Ered = „used“ (reduced) Electron acceptor
TPH, Aromatics, PAH,… CVOC, Halogenated Aromatics
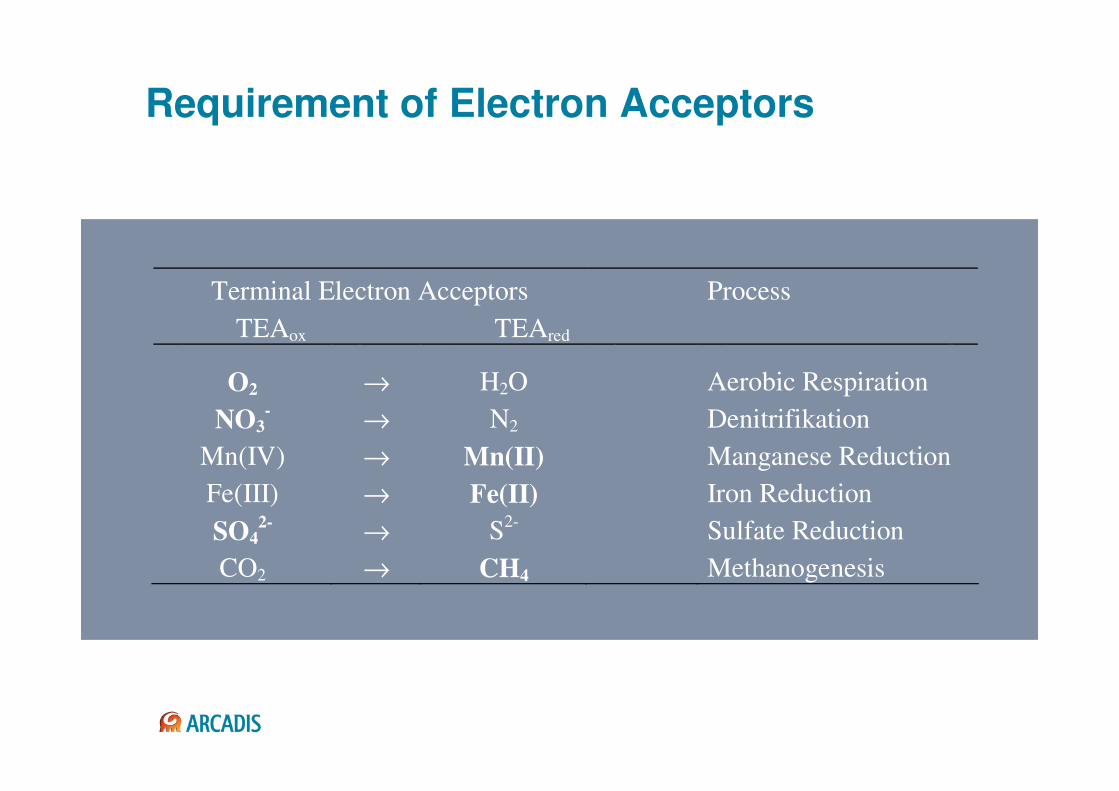
Terminal Electron Acceptors Process
TEAox TEAred
O2 → H2O Aerobic Respiration
NO3- → N2 Denitrifikation
Mn(IV) → Mn(II) Manganese Reduction
Fe(III) → Fe(II) Iron Reduction
SO42-
→ S2-
Sulfate Reduction
CO2 → CH4 Methanogenesis
Requirement of Electron Acceptors
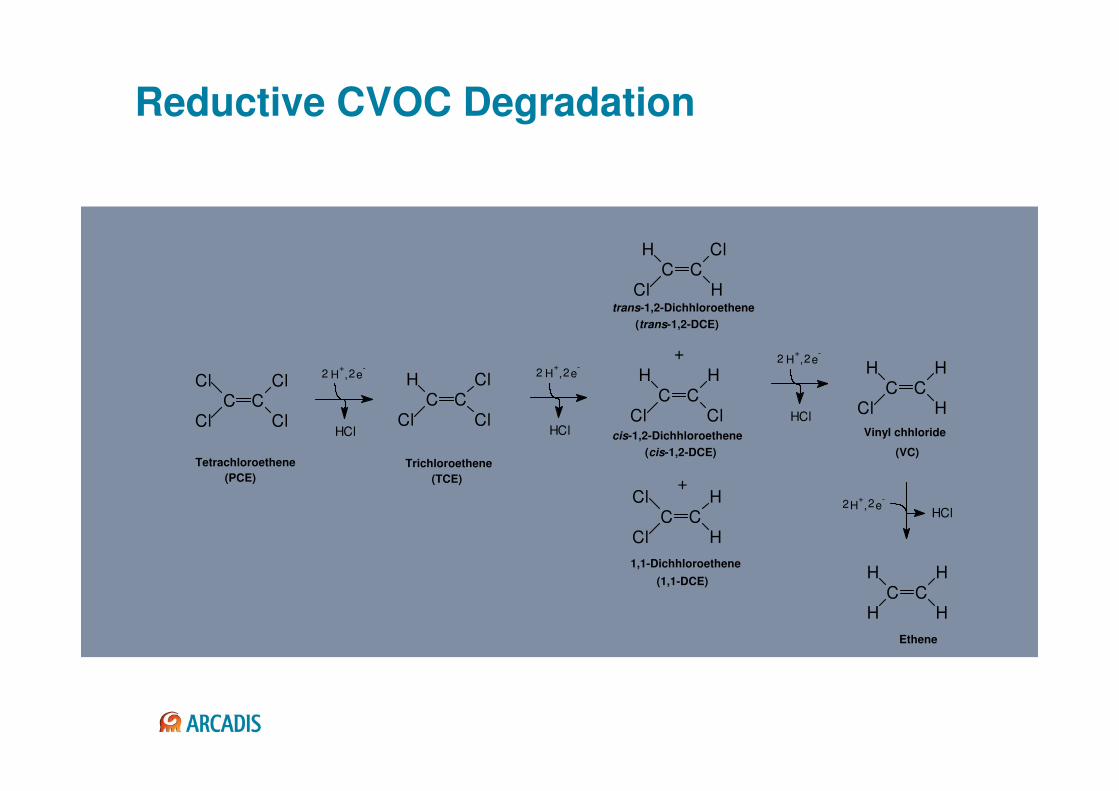
Reductive CVOC Degradation
C CH
Cl Cl
H
C CH
Cl H
Cl
(trans-1,2-DCE)
trans-1,2-Dichhloroethene
cis-1,2-Dichhloroethene
(cis-1,2-DCE)
+
C CH
Cl
H
H
H+, e
-22
HCl
HClH
+, e
-22
Vinyl chhloride
(VC)
C CH
H
H
H
Ethene
+
(1,1-DCE)
1,1-Dichhloroethene
C CCl
Cl H
H
C CCl
Cl
Cl
Cl
C CH
Cl Cl
ClH+, e
-22
HCl
H+, e
-22
HCl
Tetrachloroethene
(PCE) (TCE)
Trichloroethene

Initial Situation
Principles of Biodegradation
In-situ Reaktive Zone (IRZ) and Substrates
Injection Technology
Case Study
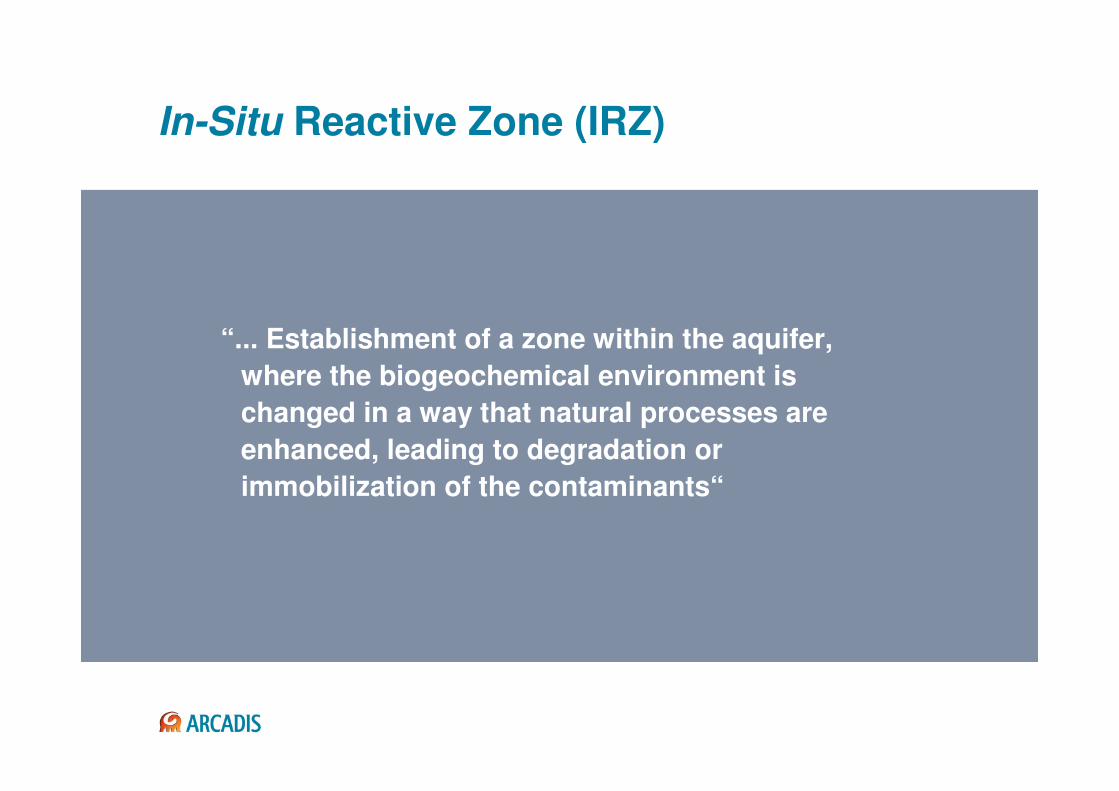
In-Situ Reactive Zone (IRZ)
“... Establishment of a zone within the aquifer,
where the biogeochemical environment is
changed in a way that natural processes are
enhanced, leading to degradation or
immobilization of the contaminants“
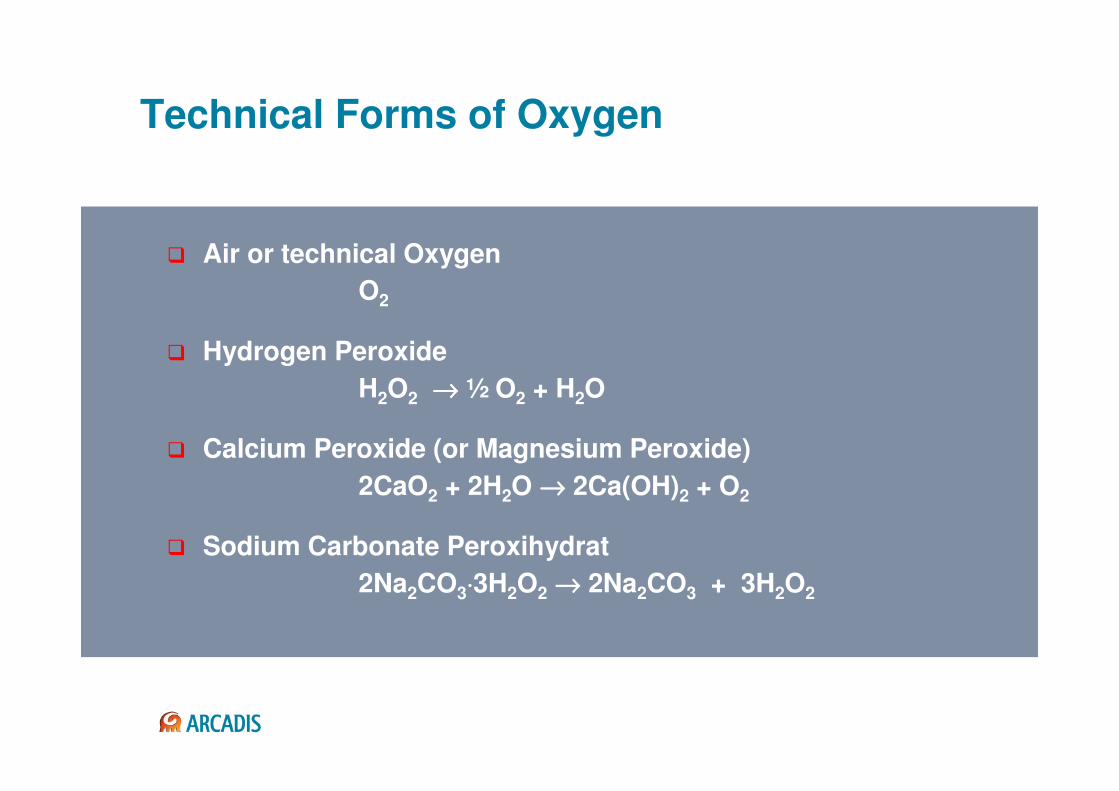
Technical Forms of Oxygen
� Air or technical Oxygen
O2
� Hydrogen Peroxide
H2O2 →→→→ ½ O2 + H2O
� Calcium Peroxide (or Magnesium Peroxide)
2CaO2 + 2H2O →→→→ 2Ca(OH)2 + O2
� Sodium Carbonate Peroxihydrat
2Na2CO3⋅⋅⋅⋅3H2O2 →→→→ 2Na2CO3 + 3H2O2
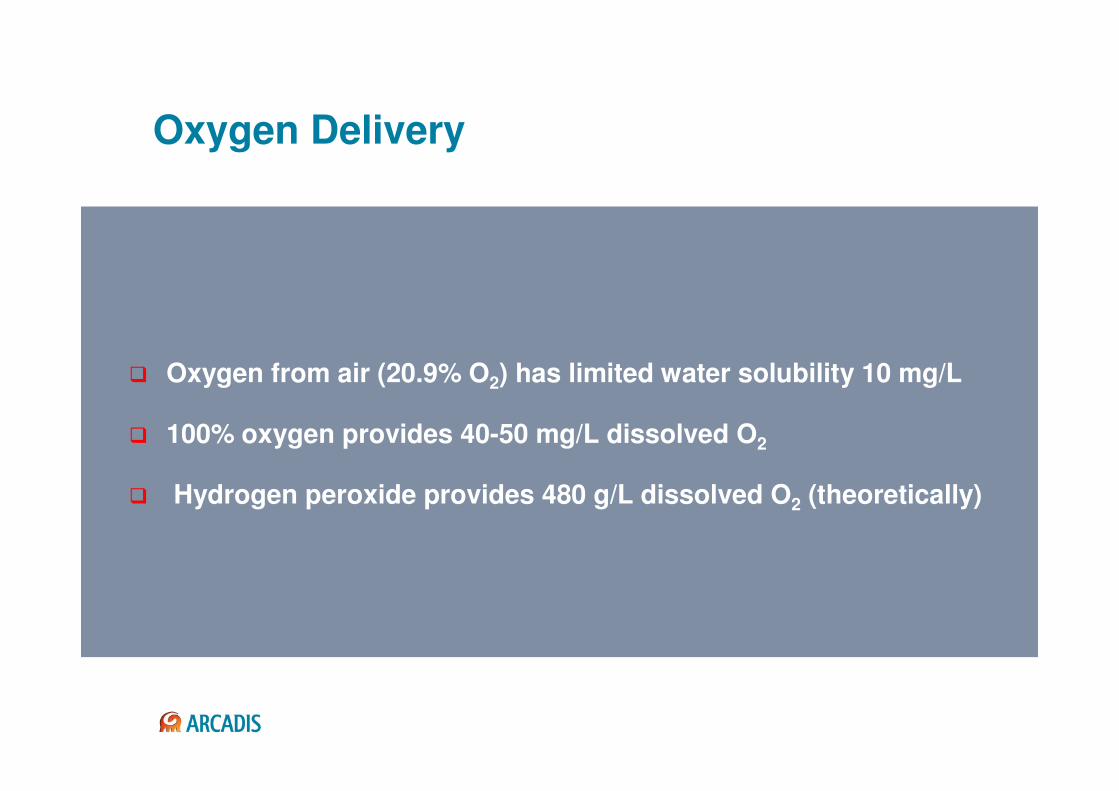
Oxygen Delivery
� Oxygen from air (20.9% O2) has limited water solubility 10 mg/L
� 100% oxygen provides 40-50 mg/L dissolved O2
� Hydrogen peroxide provides 480 g/L dissolved O2 (theoretically)
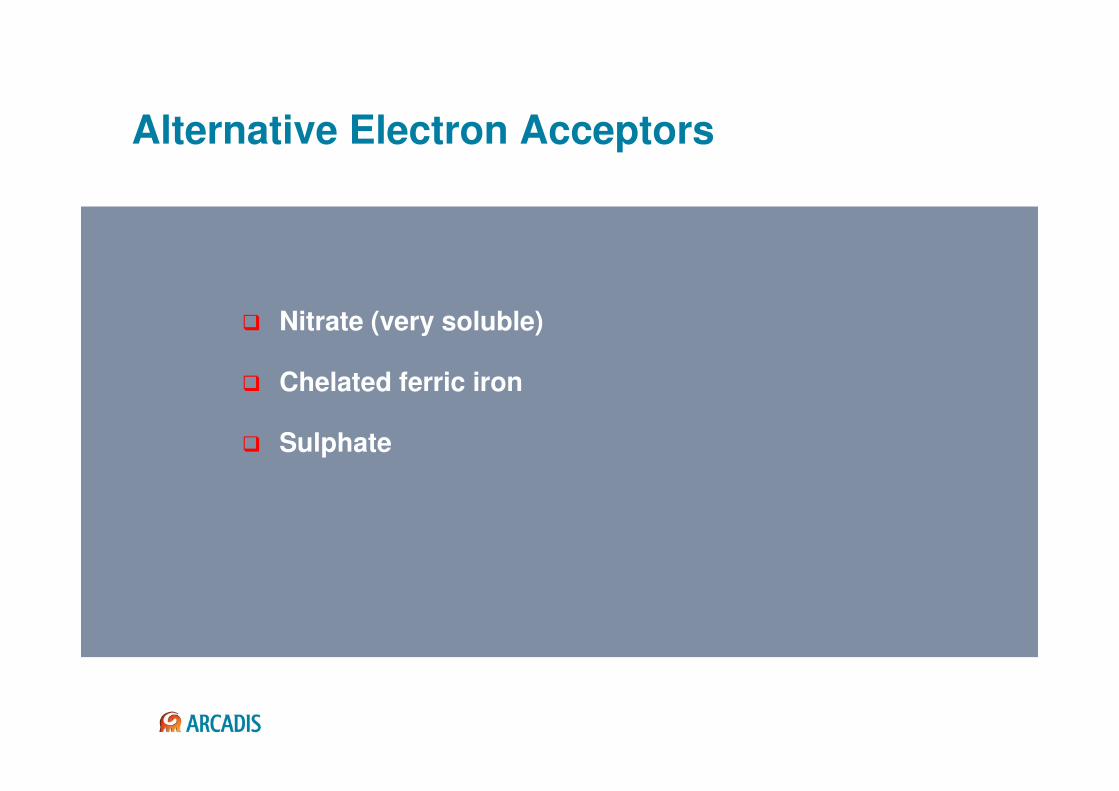
Alternative Electron Acceptors
� Nitrate (very soluble)
� Chelated ferric iron
� Sulphate
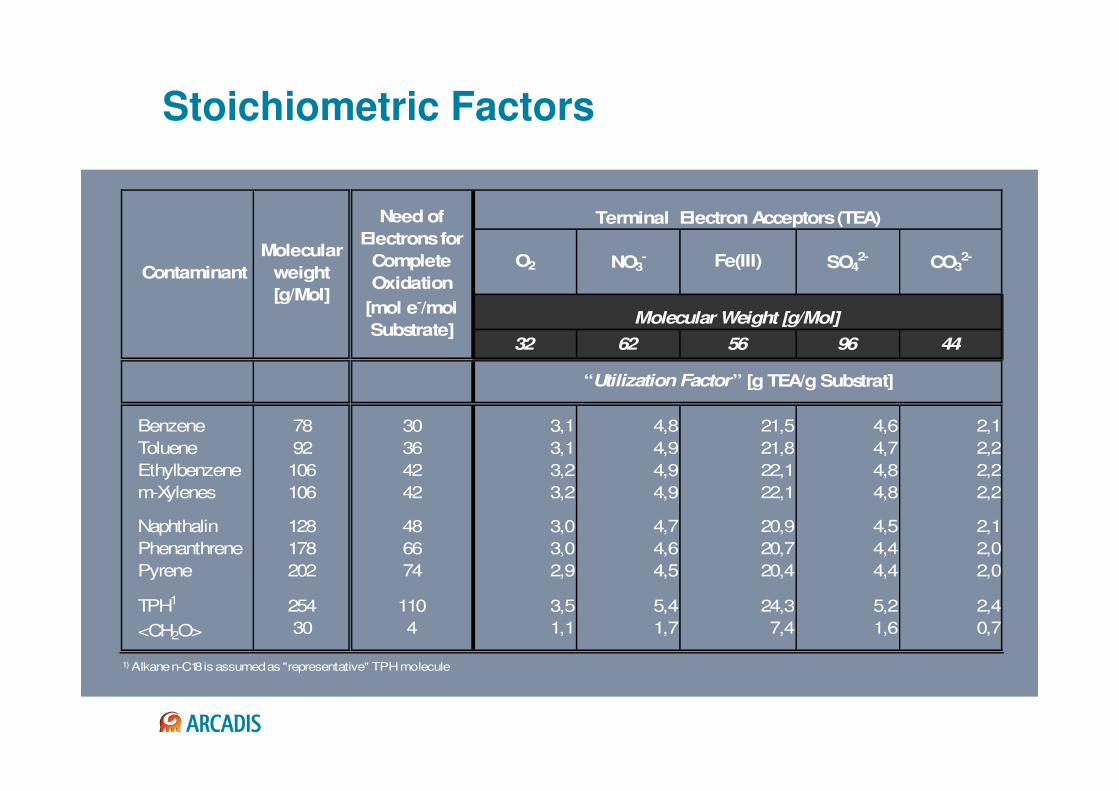
Stoichiometric Factors
O2 NO3- Fe(III) SO4
2- CO32-
32 62 56 96 44
Benzene 78 30 3,1 4,8 21,5 4,6 2,1
Toluene 92 36 3,1 4,9 21,8 4,7 2,2
Ethylbenzene 106 42 3,2 4,9 22,1 4,8 2,2
m-Xylenes 106 42 3,2 4,9 22,1 4,8 2,2
Naphthalin 128 48 3,0 4,7 20,9 4,5 2,1
Phenanthrene 178 66 3,0 4,6 20,7 4,4 2,0
Pyrene 202 74 2,9 4,5 20,4 4,4 2,0
TPH1 254 110 3,5 5,4 24,3 5,2 2,4
<CH2O> 30 4 1,1 1,7 7,4 1,6 0,7
“Utilization Factor” [g TEA/g Substrat]
1) Alkane n-C18 is assumed as "representative" TPH molecule
Contaminant
Molecular
weight
[g/Mol]
Need of
Electrons for
Complete
Oxidation
[mol e-/mol
Substrate]
Terminal Electron Acceptors (TEA)
Molecular Weight [g/Mol]
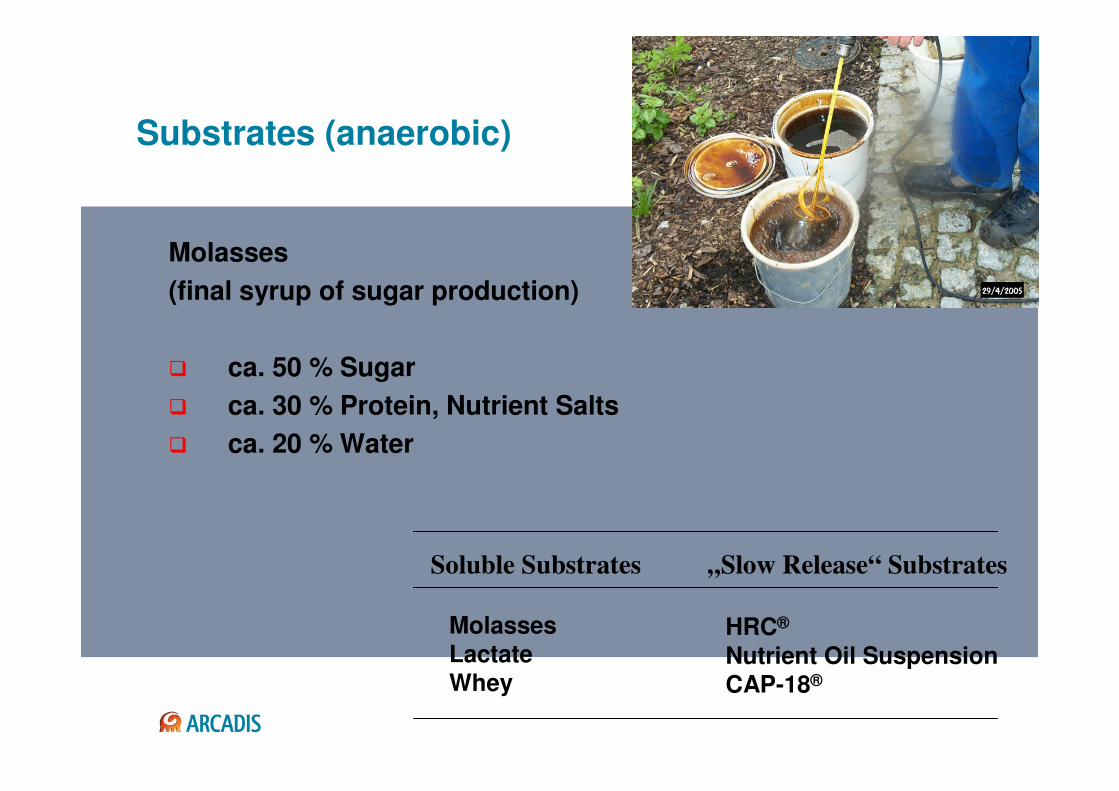
Substrates (anaerobic)
Molasses
(final syrup of sugar production)
� ca. 50 % Sugar
� ca. 30 % Protein, Nutrient Salts
� ca. 20 % Water
MolassesLactateWhey
Soluble Substrates „Slow Release“ Substrates
HRC®
Nutrient Oil SuspensionCAP-18®

Initial Situation
Principles of Biodegradation
In-situ Reaktive Zone (IRZ) and Substrates
Injection Technology
Case Study
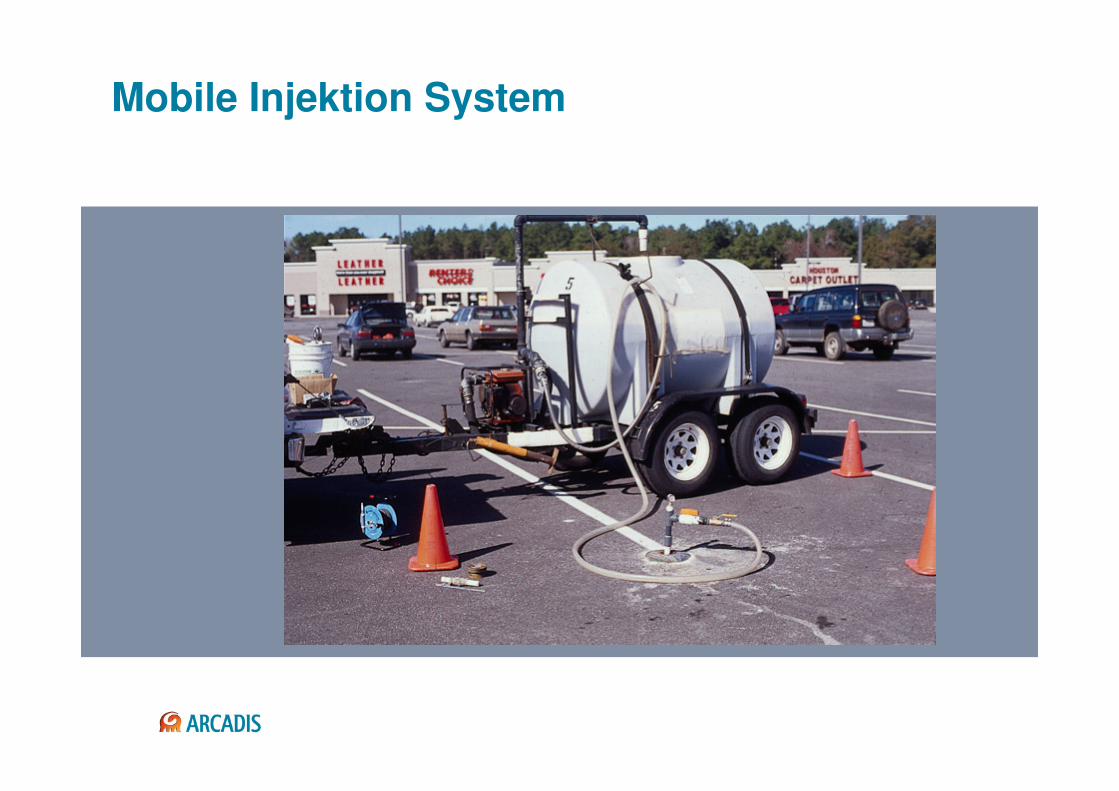
Mobile Injektion System
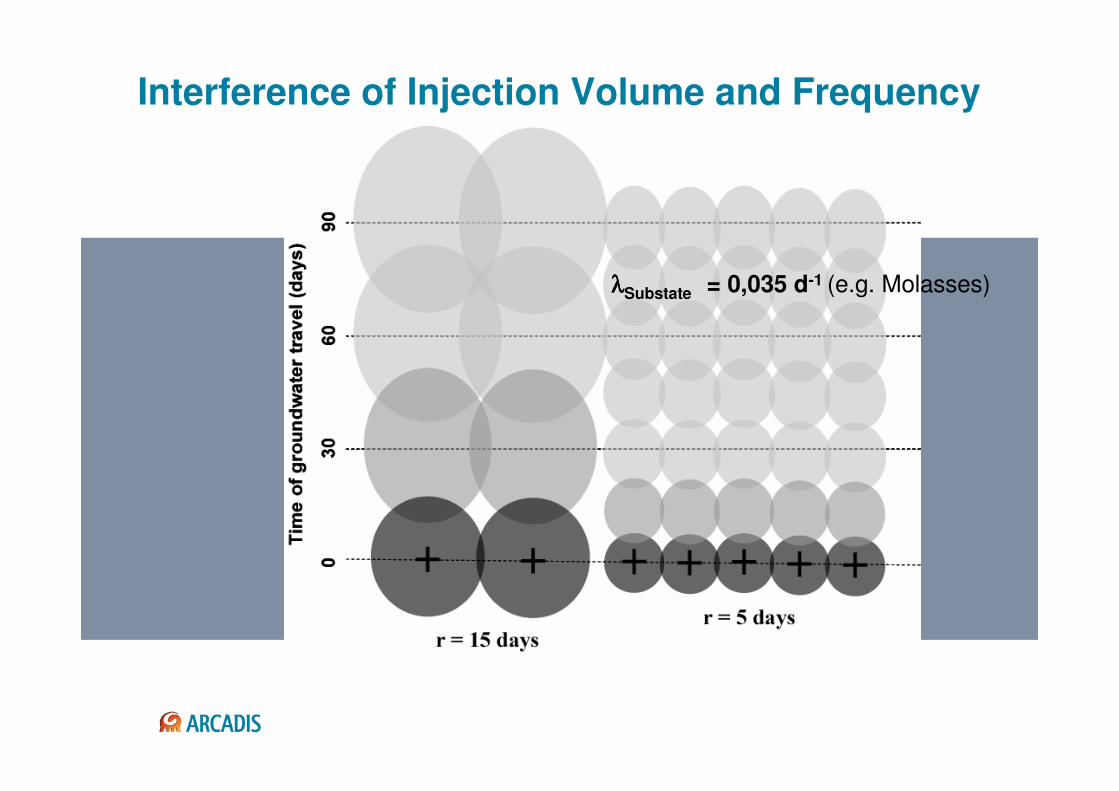
Interference of Injection Volume and Frequency
λλλλSubstate = 0,035 d-1 (e.g. Molasses)
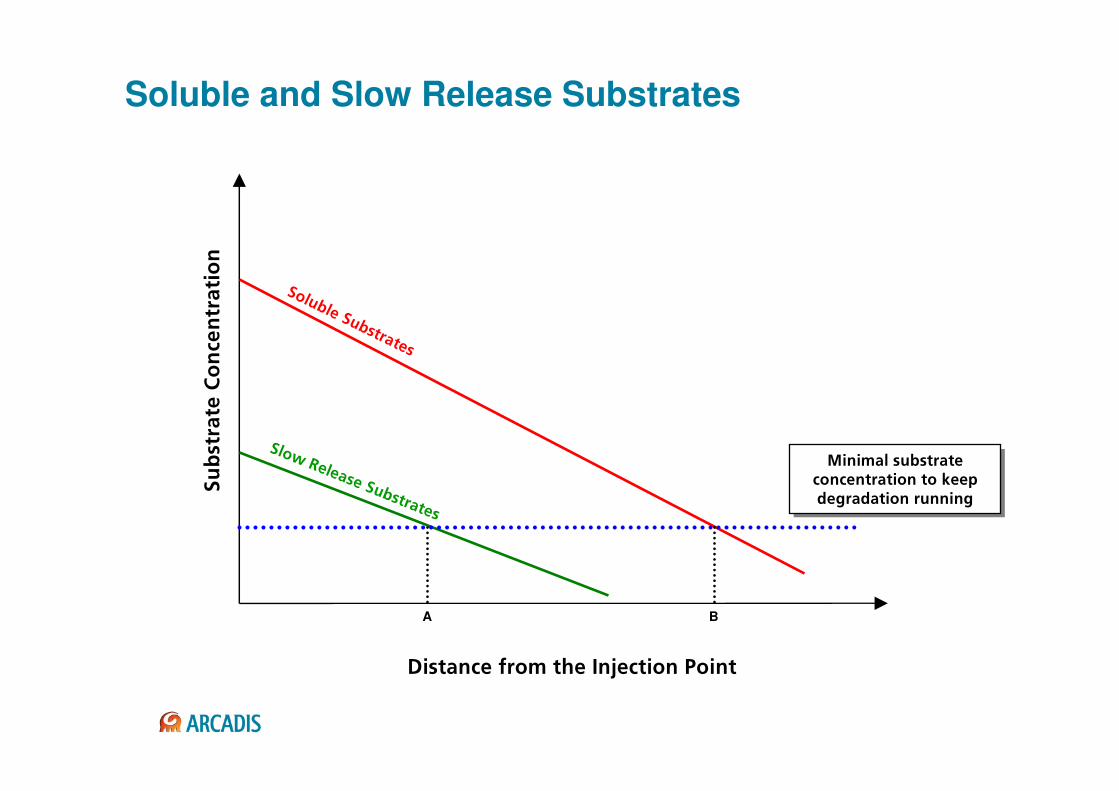
Soluble and Slow Release Substrates
A
aáëí~åÅÉ=Ñêçã=íÜÉ=fåàÉÅíáçå=mçáåí
pìÄëíê~íÉ=`çåÅÉåíê~íáçå
jáåáã~ä=ëìÄëíê~íÉ==ÅçåÅÉåíê~íáçå=íç=âÉÉé=ÇÉÖê~Ç~íáçå=êìååáåÖ
jáåáã~ä=ëìÄëíê~íÉ==ÅçåÅÉåíê~íáçå=íç=âÉÉé=ÇÉÖê~Ç~íáçå=êìååáåÖ
B
päçï oÉäÉ~ëÉ=pìÄëíê~íÉë
pçäìÄäÉ pìÄëíê~íÉë
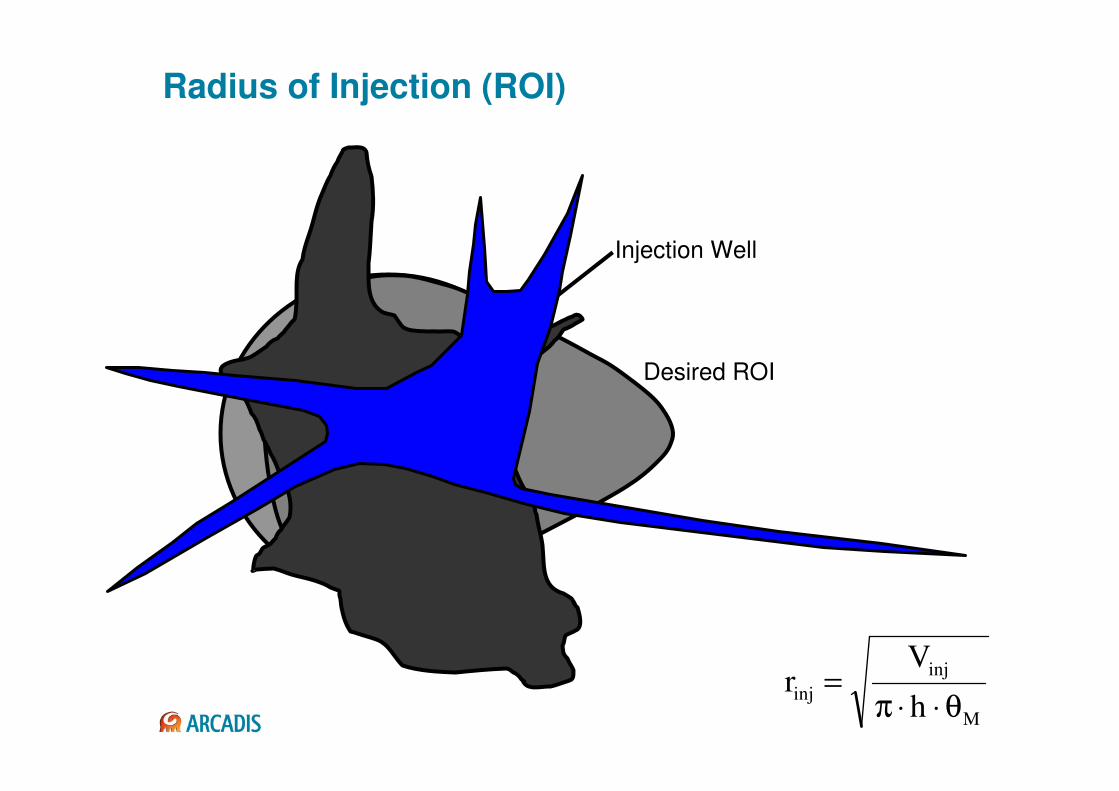
Radius of Injection (ROI)
Desired ROI
Injection Well
rinj
M
inj
injh
Vr
θ⋅⋅π=
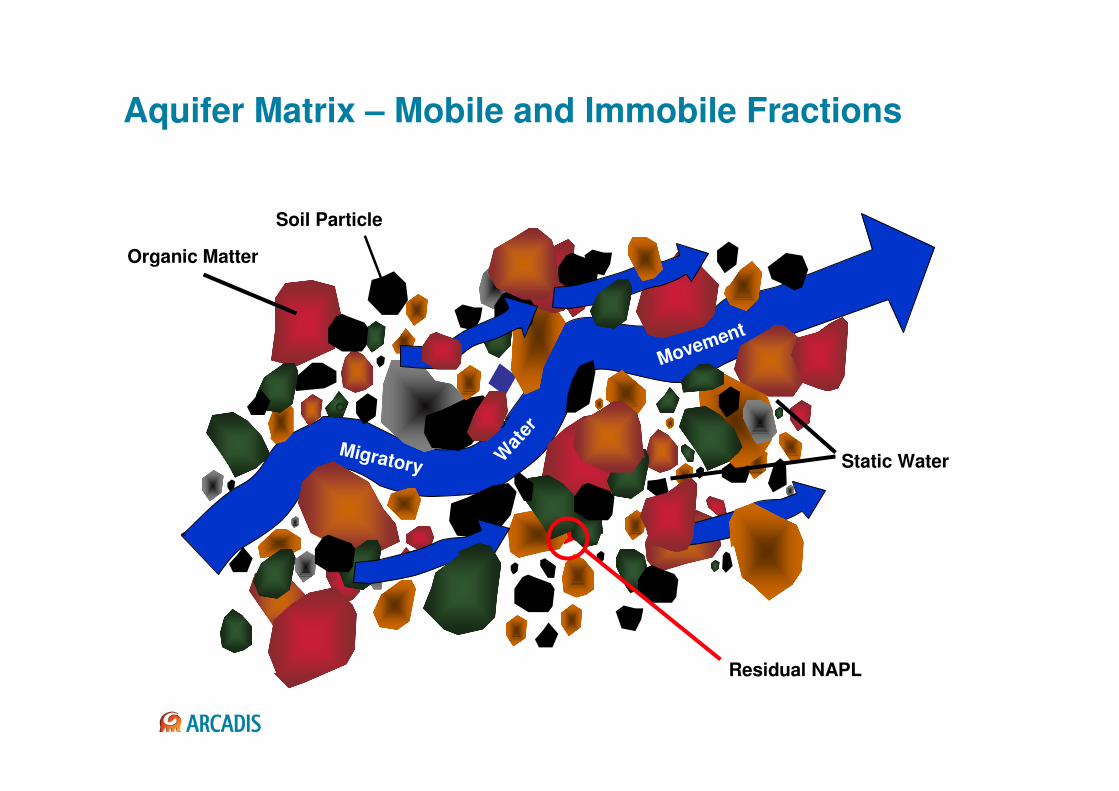
Aquifer Matrix – Mobile and Immobile Fractions
Migratory Wat
er
Static Water
Organic Matter
Movement
Residual NAPL
Soil Particle
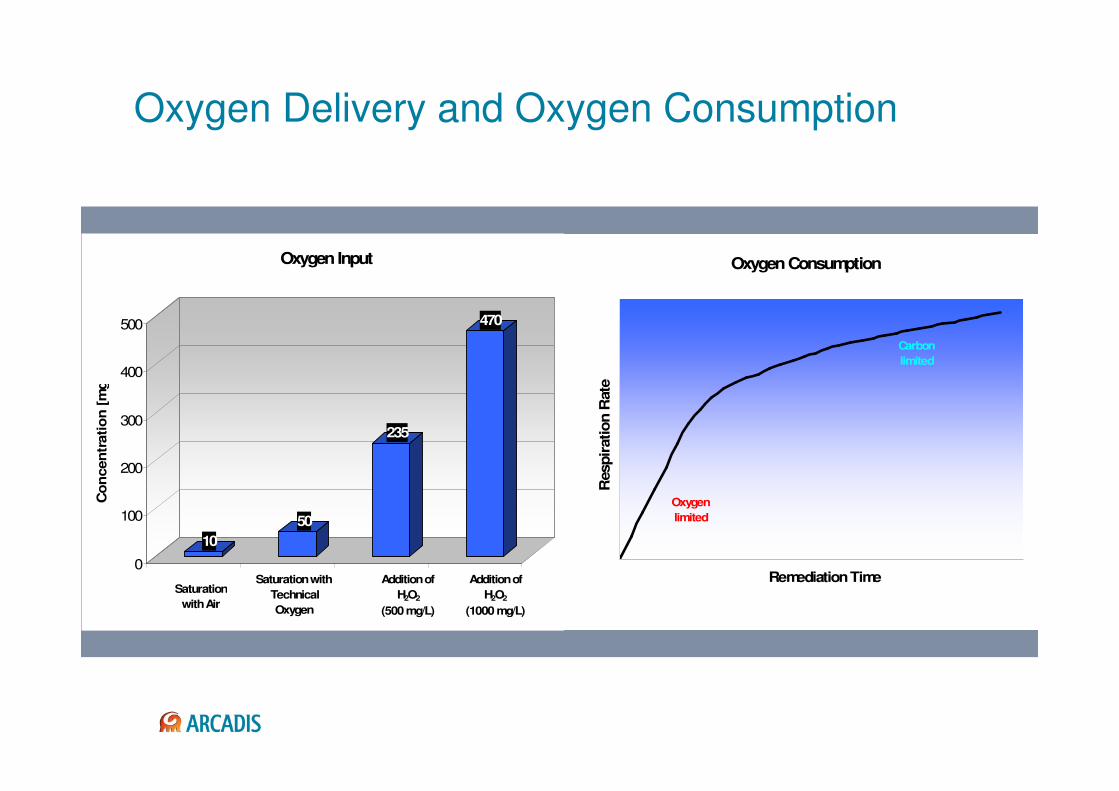
Oxygen Consumption
0
5
10
15
20
25
30
35
40
45
0 5 10 15 20 25 30 35Remediation Time
Respir
ation R
ate
'
Oxygen
limited
Carbon
limited
Oxygen Delivery and Oxygen Consumption
10
50
235
470
0
100
200
300
400
500
Co
ncen
trati
on
[m
g/L
]
Oxygen Input
Saturation
with Air
Saturation with
Technical
Oxygen
Addition of
H2O2
(500 mg/L)
Addition of
H2O2
(1000 mg/L)
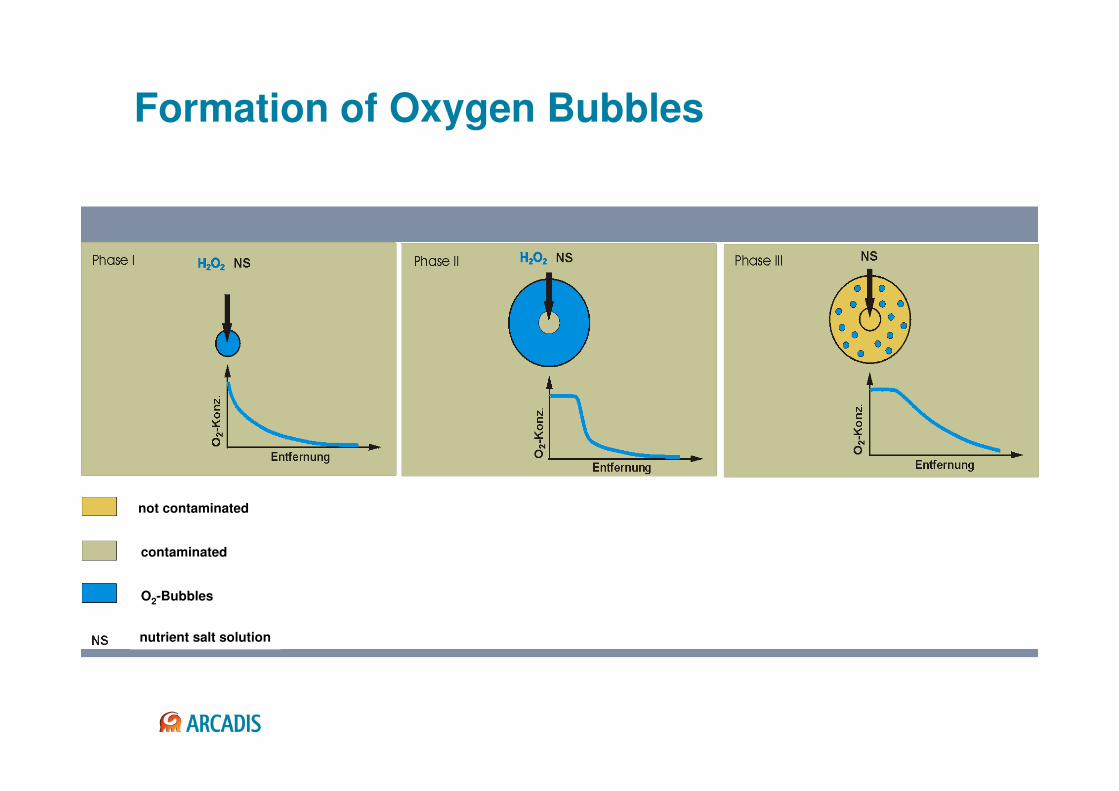
Formation of Oxygen Bubbles
not contaminated
contaminated
O2-Bubbles
nutrient salt solution
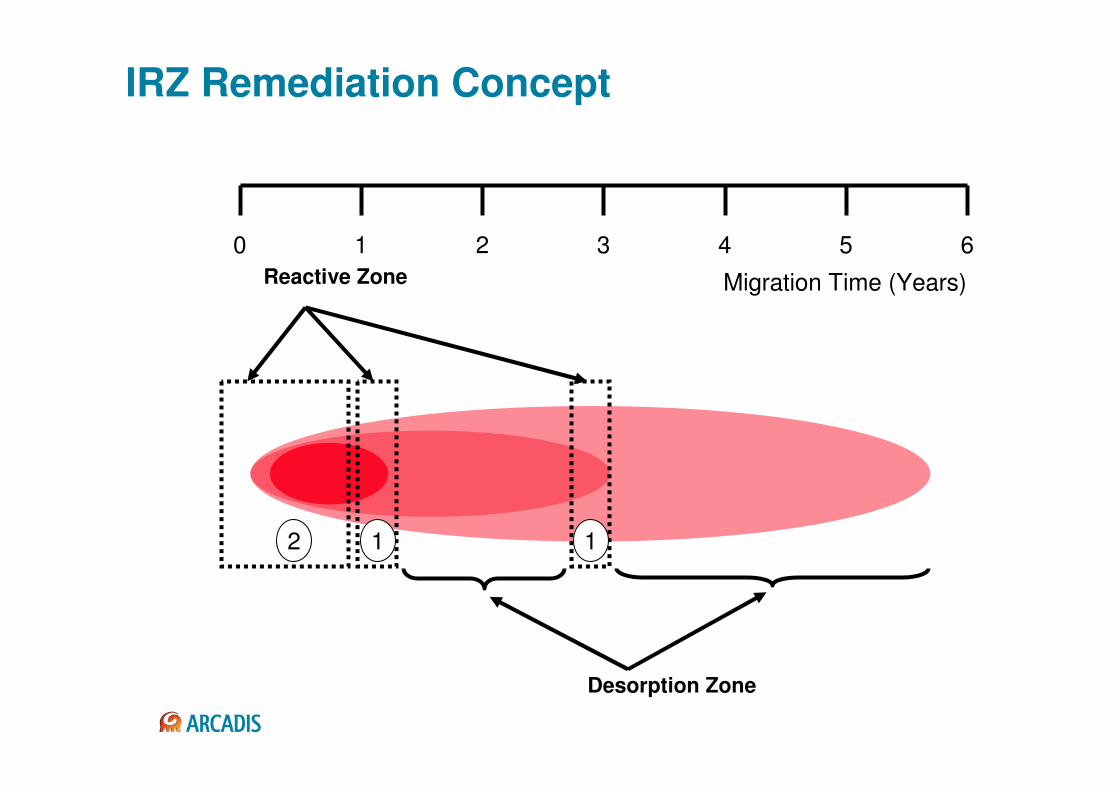
IRZ Remediation Concept
0 1 2 3 4 5 6
Migration Time (Years)Reactive Zone
Desorption Zone
1 12
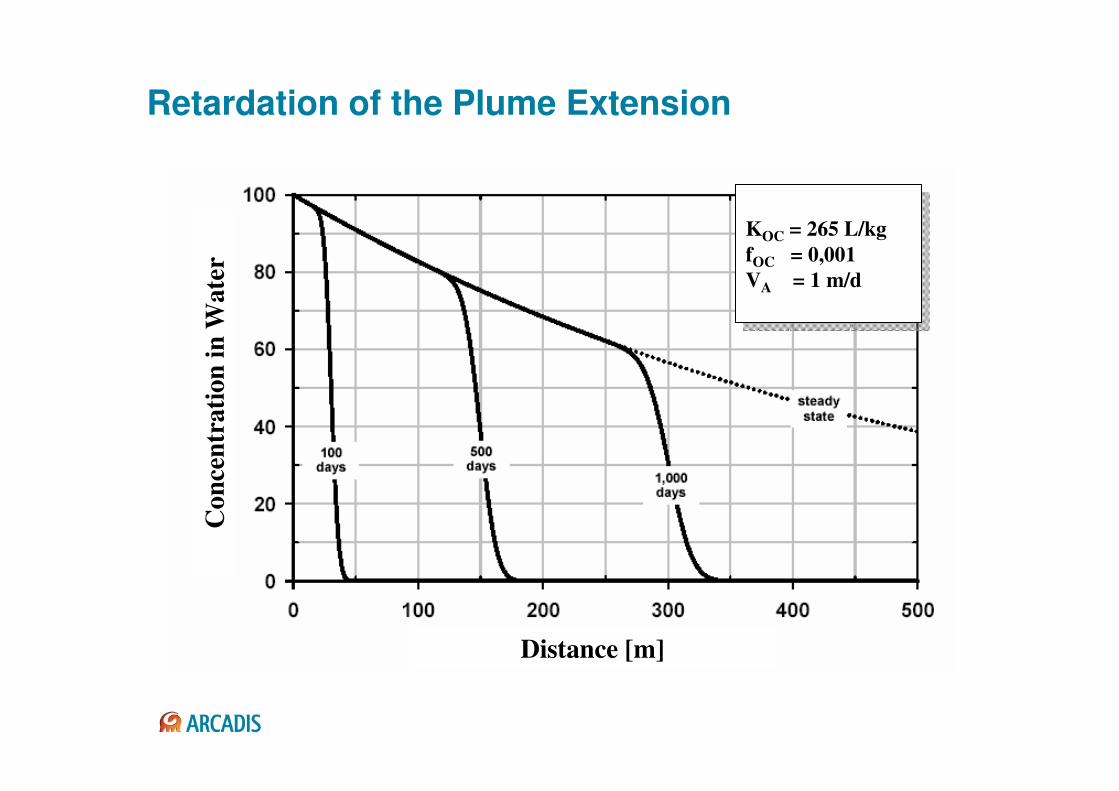
Retardation of the Plume Extension
Co
nce
ntr
ati
on
in
Wate
r
Distance [m]
KOC = 265 L/kg
fOC = 0,001
VA = 1 m/d
KOC = 265 L/kg
fOC = 0,001
VA = 1 m/d
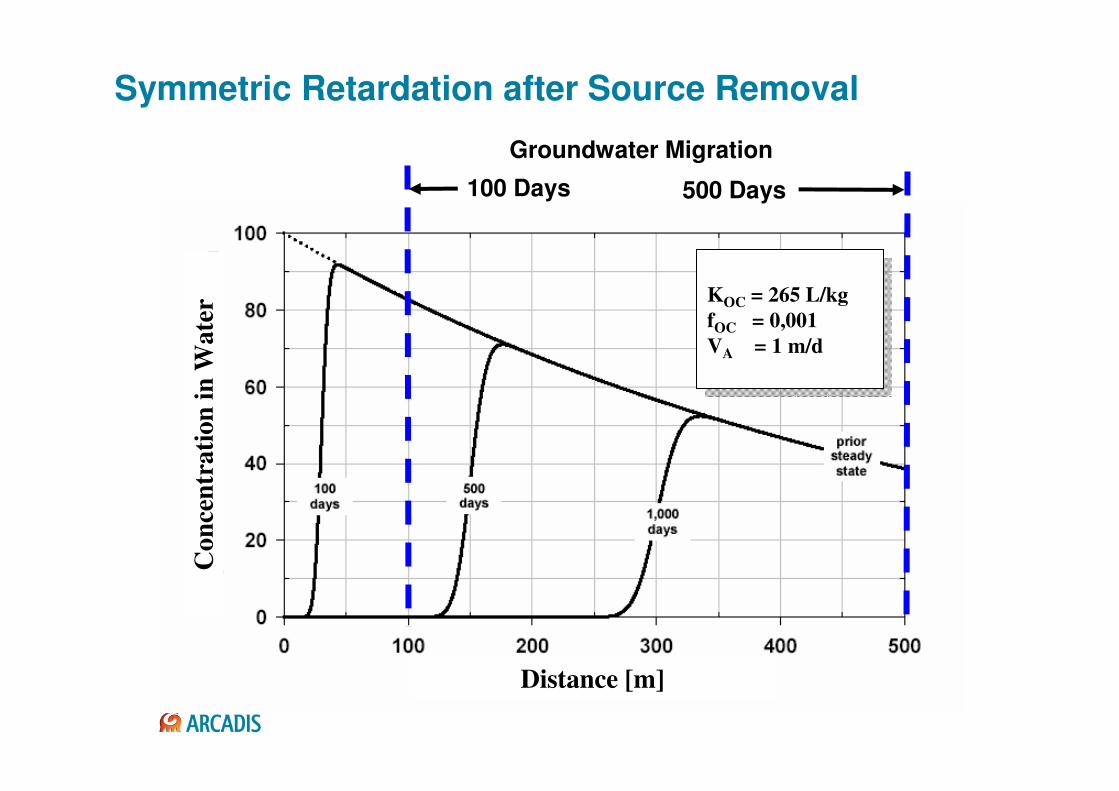
Symmetric Retardation after Source Removal
Groundwater Migration
100 Days 500 DaysC
on
cen
trati
on
in
Wate
r
Distance [m]
KOC = 265 L/kg
fOC = 0,001
VA = 1 m/d
KOC = 265 L/kg
fOC = 0,001
VA = 1 m/d
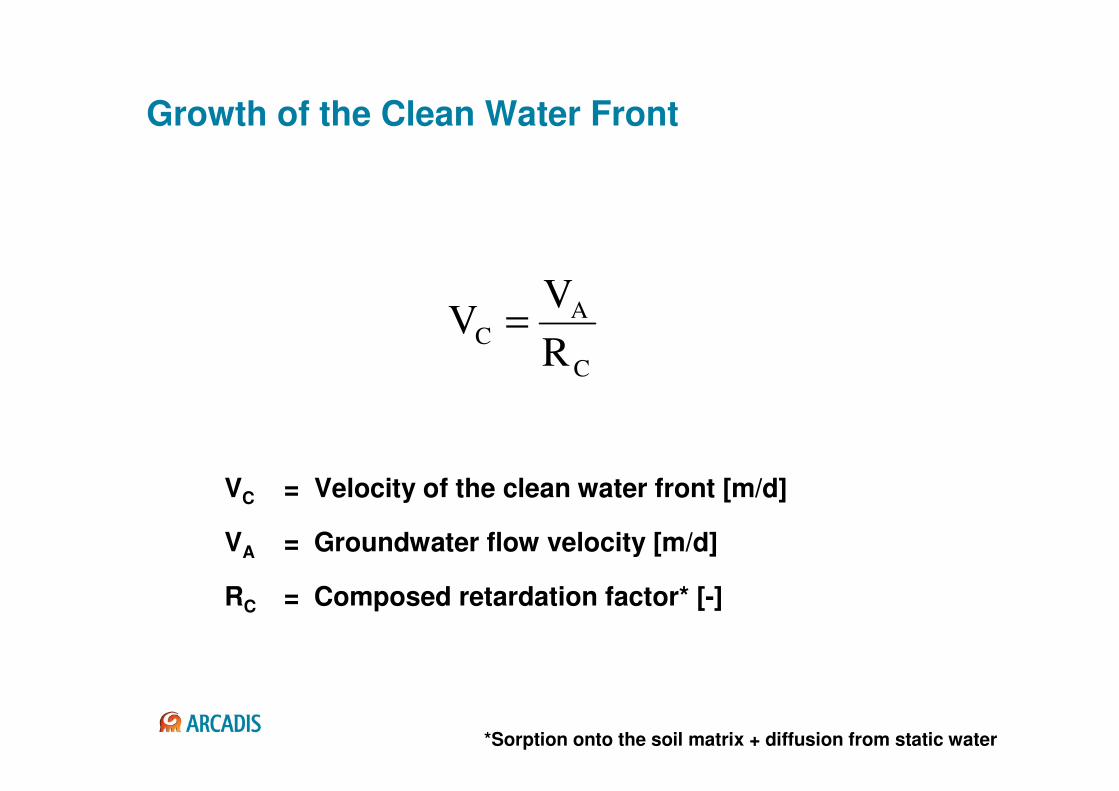
Growth of the Clean Water Front
VC = Velocity of the clean water front [m/d]
VA = Groundwater flow velocity [m/d]
RC = Composed retardation factor* [-]
C
AC
R
VV =
*Sorption onto the soil matrix + diffusion from static water
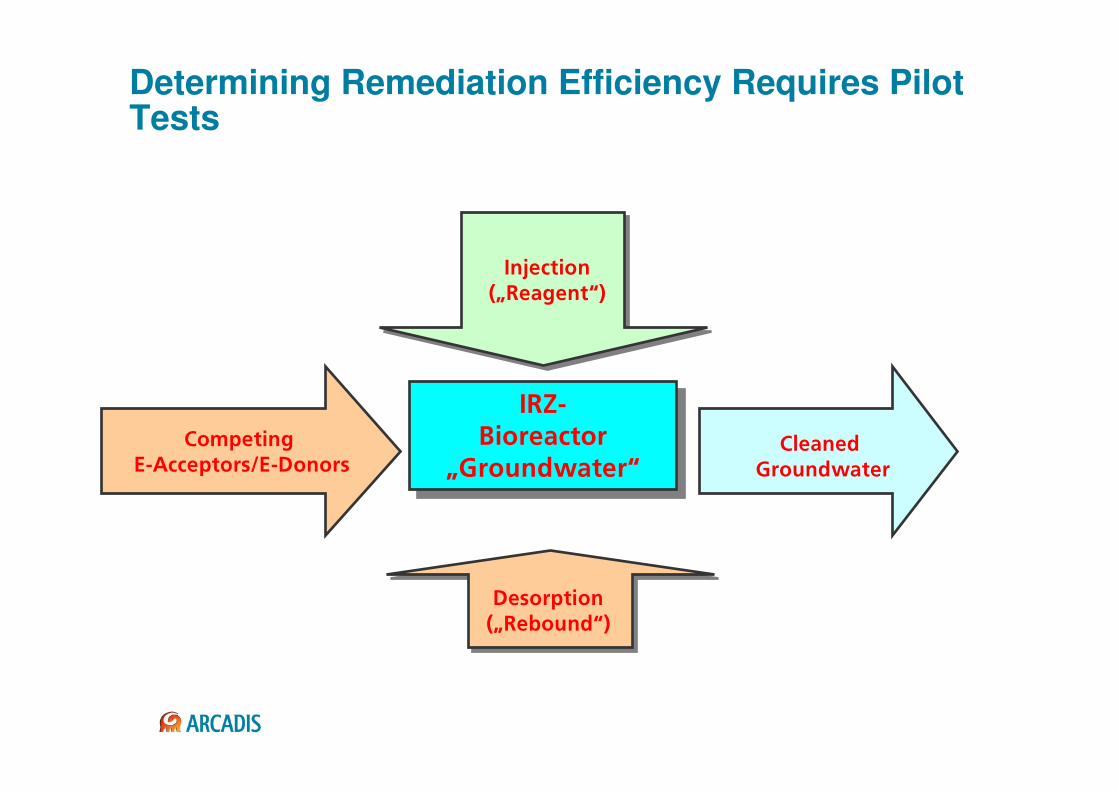
Determining Remediation Efficiency Requires Pilot Tests
fowJ_áçêÉ~Åíçê
łdêçìåÇï~íÉê#
fowJ_áçêÉ~Åíçê
łdêçìåÇï~íÉê#`çãéÉíáåÖ=
bJ^ÅÅÉéíçêëLbJaçåçêë
aÉëçêéíáçåEłoÉÄçìåÇ#F
`äÉ~åÉÇ=dêçìåÇï~íÉê
fåàÉÅíáçåEłoÉ~ÖÉåí#F

Initial Situation
Principles of Biodegradation
In-situ Reaktive Zone (IRZ) and Substrates
Injection Technology
Case Study
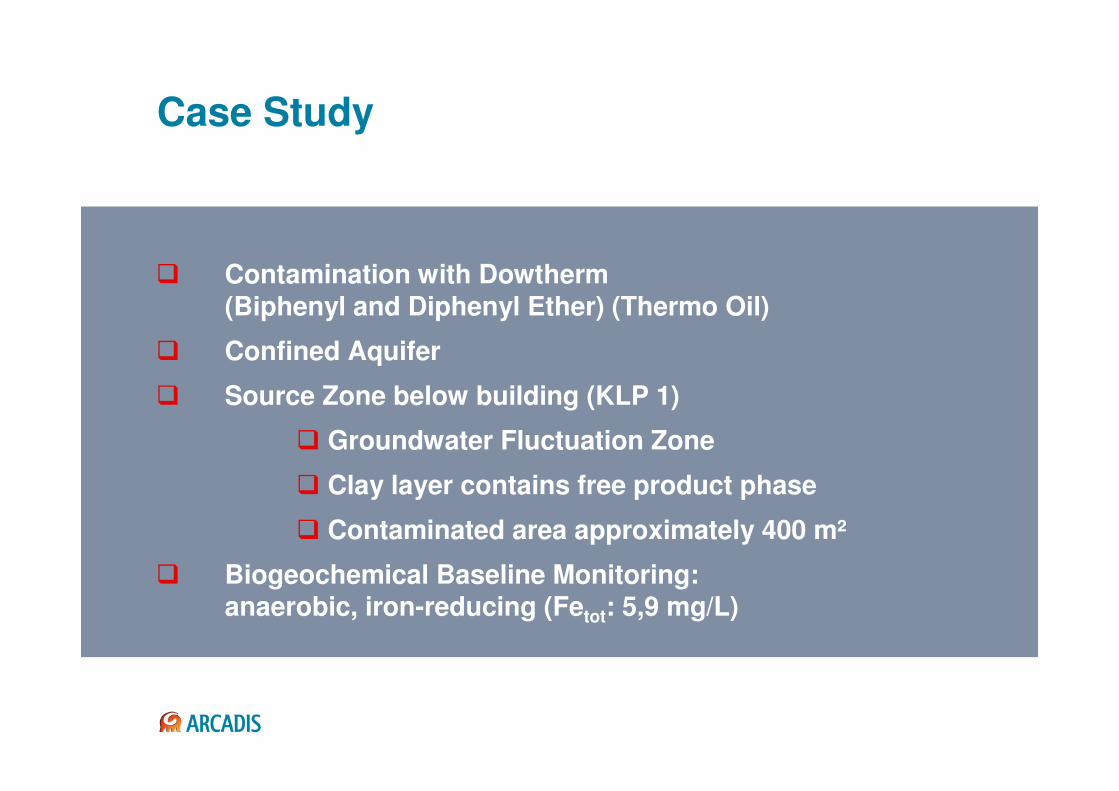
Case Study
� Contamination with Dowtherm(Biphenyl and Diphenyl Ether) (Thermo Oil)
� Confined Aquifer
� Source Zone below building (KLP 1)
� Groundwater Fluctuation Zone
� Clay layer contains free product phase
� Contaminated area approximately 400 m²
� Biogeochemical Baseline Monitoring: anaerobic, iron-reducing (Fetot: 5,9 mg/L)
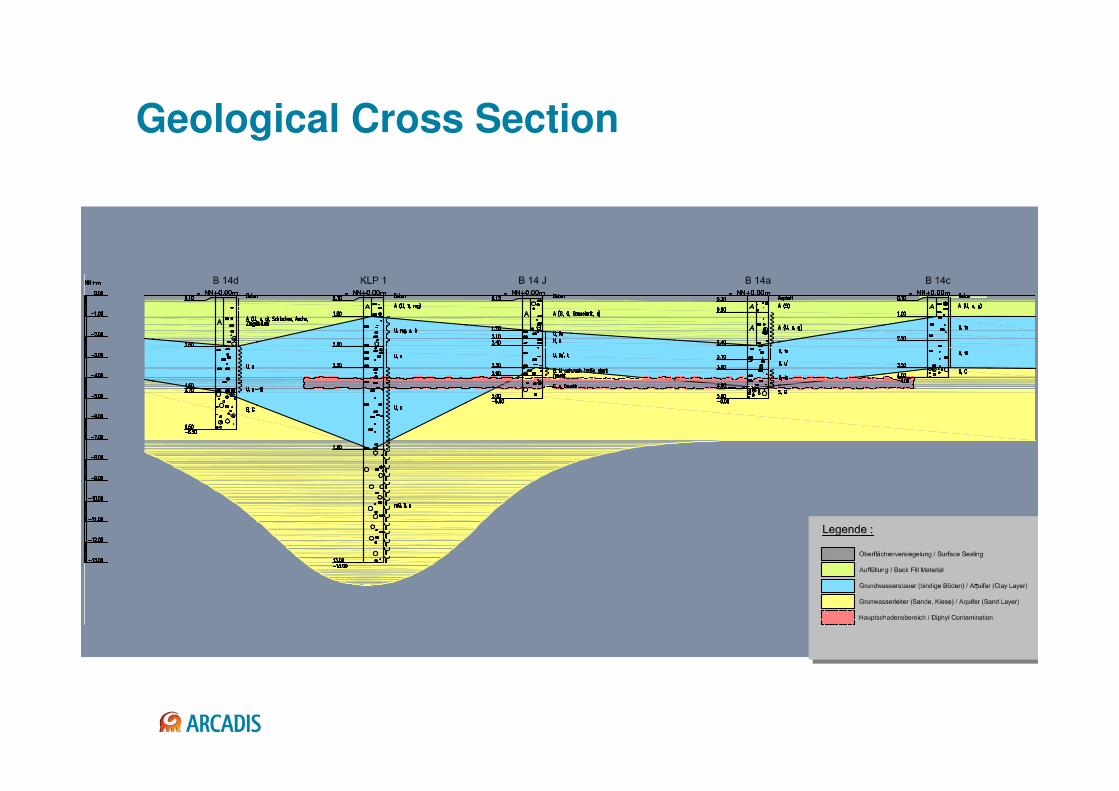
Geological Cross Section
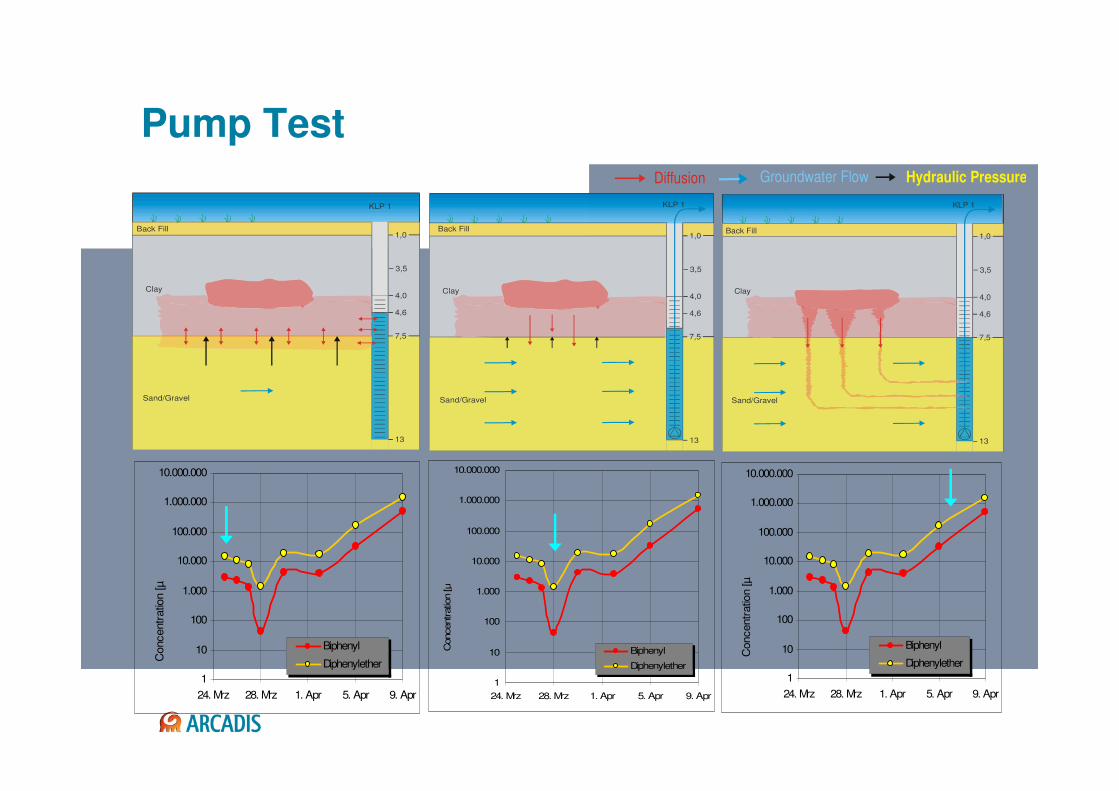
Pump Test
1
10
100
1.000
10.000
100.000
1.000.000
10.000.000
24. Mrz 28. Mrz 1. Apr 5. Apr 9. Apr
Concentr
atio
n [µg/l]
Biphenyl
Diphenylether
1
10
100
1.000
10.000
100.000
1.000.000
10.000.000
24. Mrz 28. Mrz 1. Apr 5. Apr 9. Apr
Concentr
atio
n [µg/l]
Biphenyl
Diphenylether
1
10
100
1.000
10.000
100.000
1.000.000
10.000.000
24. Mrz 28. Mrz 1. Apr 5. Apr 9. Apr
Concentratio
n [µg/l]
Biphenyl
Diphenylether
KLP 1
Sand/Gravel
Clay
Back Fill
13
4,6
3,5
4,0
1,0
7,5
KLP 1
13
4,6
3,5
4,0
1,0
7,5
Back Fill
Clay
Sand/Gravel
KLP 1
13
4,6
3,5
4,0
1,0
7,5
Sand/Gravel
Clay
Back Fill
Diffusion Groundwater Flow Hydraulic Pressure
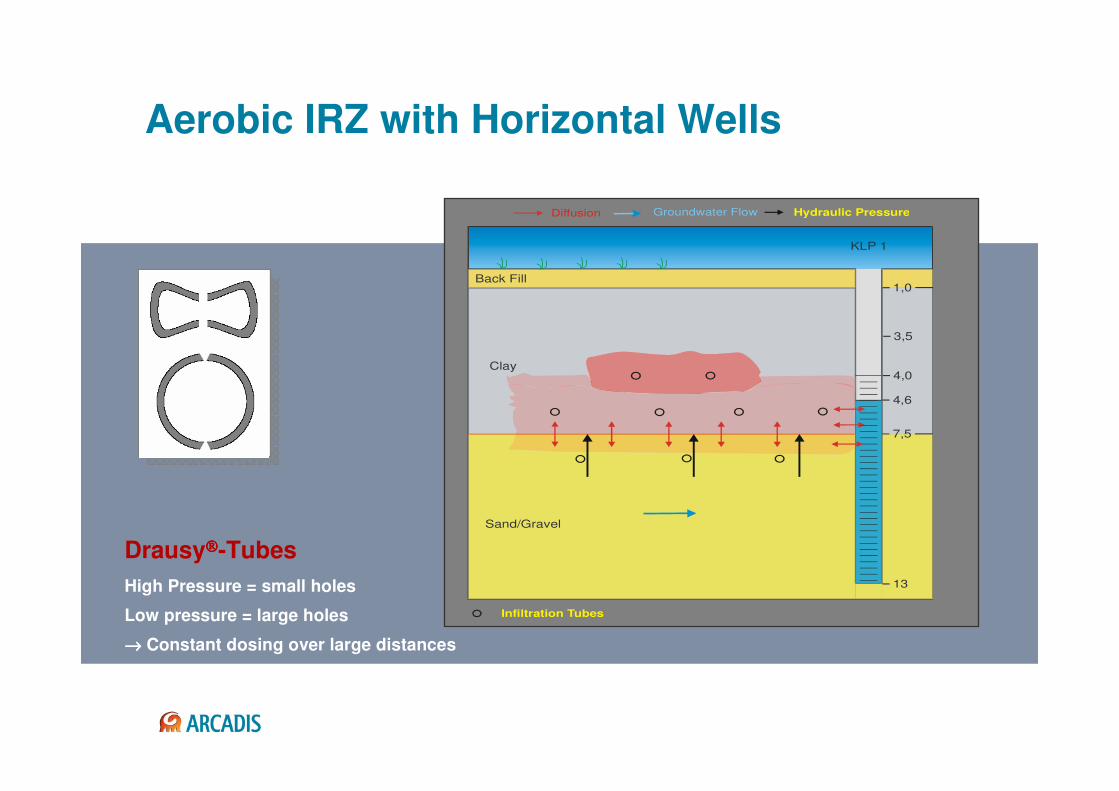
Aerobic IRZ with Horizontal Wells
KLP 1
13
4,6
3,5
4,0
1,0
7,5
Sand/Gravel
Clay
Back Fill
Diffusion Groundwater Flow Hydraulic Pressure
Infiltration Tubes
Drausy-Tubes
High Pressure = small holes
Low pressure = large holes
→→→→ Constant dosing over large distances
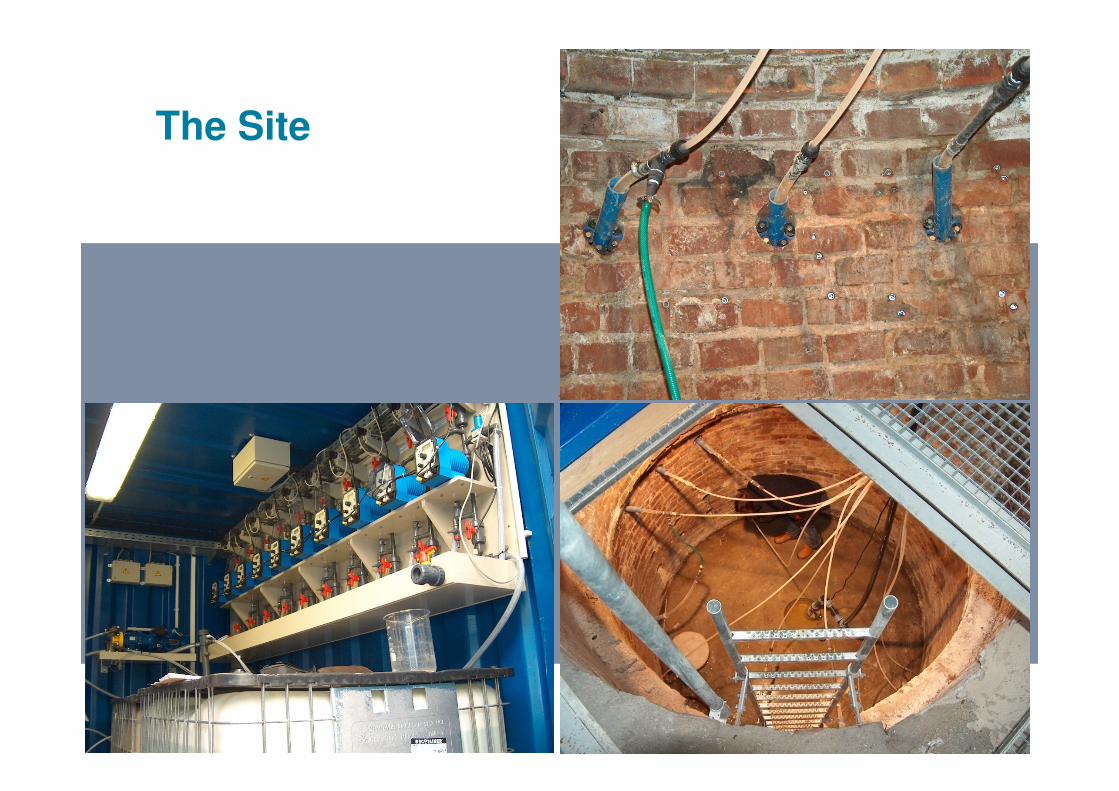
The Site
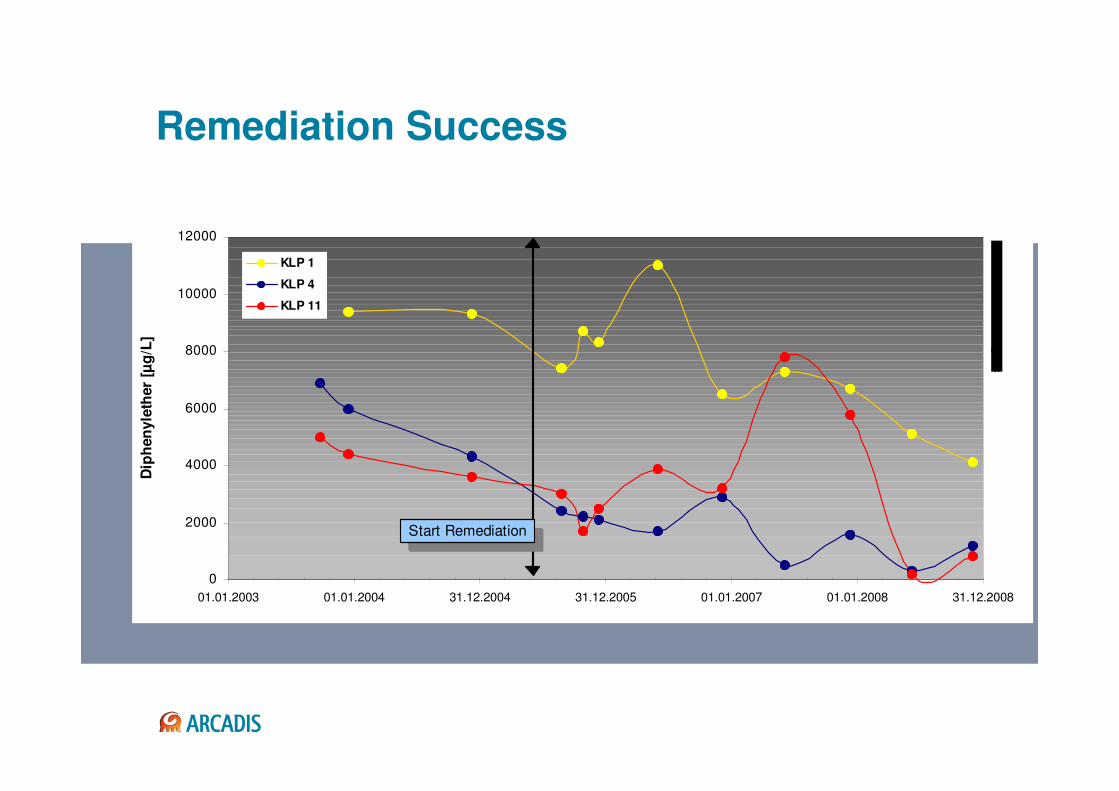
Remediation Success
0
2000
4000
6000
8000
10000
12000
01.01.2003 01.01.2004 31.12.2004 31.12.2005 01.01.2007 01.01.2008 31.12.2008
Dip
hen
yle
ther
[µg
/L]
KLP 1
KLP 4
KLP 11
Start Remediation
Take Home Message
� Low cost injection technologies are available
� These can be used to treat non-chlorinated and
chlorinated contaminants
� The technologies are of interest for site owners,
consulting companies and regulators
� Further details may be provided on request