Embed Size (px)
Citation preview
ENSO: Recent Evolution,
Current Status and Predictions
Update prepared by: Climate Prediction Center / NCEP
10 June 2019
Outline
Summary
Recent Evolution and Current Conditions
Oceanic Niño Index (ONI)
Pacific SST Outlook
U.S. Seasonal Precipitation and Temperature Outlooks
Summary
Summary
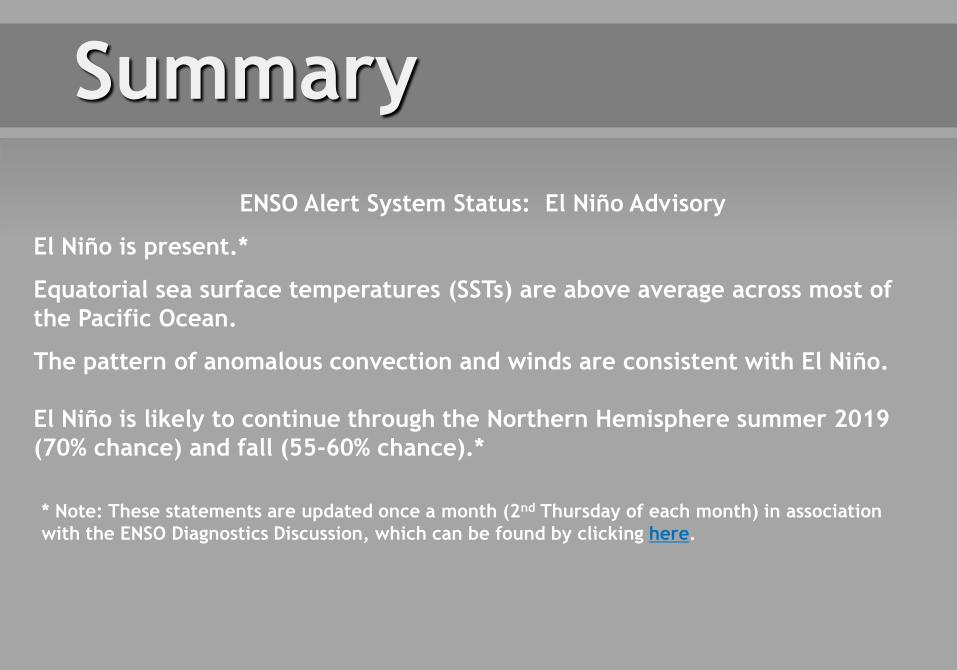
* Note: These statements are updated once a month (2nd Thursday of each month) in association
with the ENSO Diagnostics Discussion, which can be found by clicking here.
ENSO Alert System Status: El Niño Advisory
El Niño is present.*
Equatorial sea surface temperatures (SSTs) are above average across most of
the Pacific Ocean.
The pattern of anomalous convection and winds are consistent with El Niño.
El Niño is likely to continue through the Northern Hemisphere summer 2019
(70% chance) and fall (55-60% chance).*
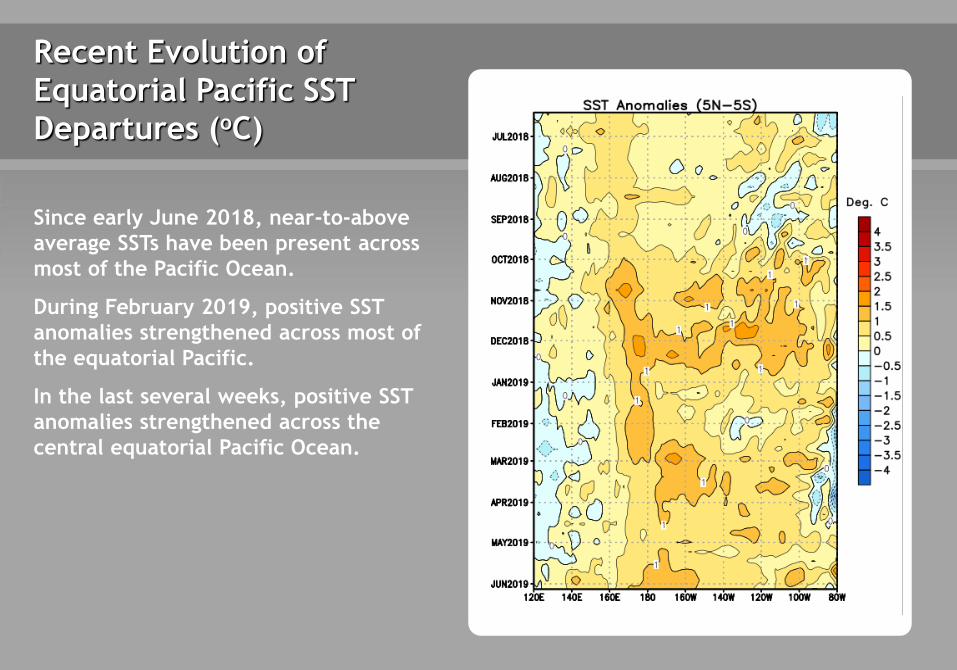
Since early June 2018, near-to-above
average SSTs have been present across
most of the Pacific Ocean.
During February 2019, positive SST
anomalies strengthened across most of
the equatorial Pacific.
In the last several weeks, positive SST
anomalies strengthened across the
central equatorial Pacific Ocean.
Recent Evolution of
Equatorial Pacific SST
Departures (oC)
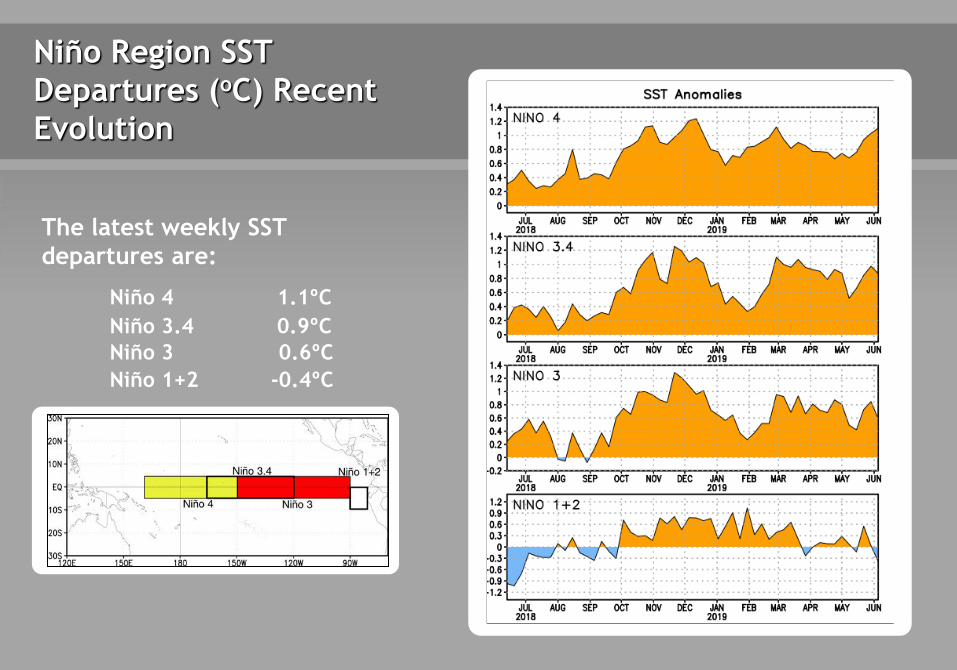
Niño Region SST
Departures (oC) Recent
Evolution
The latest weekly SST
departures are:
Niño 4 1.1ºC
Niño 3.4 0.9ºC
Niño 3 0.6ºC
Niño 1+2 -0.4ºC
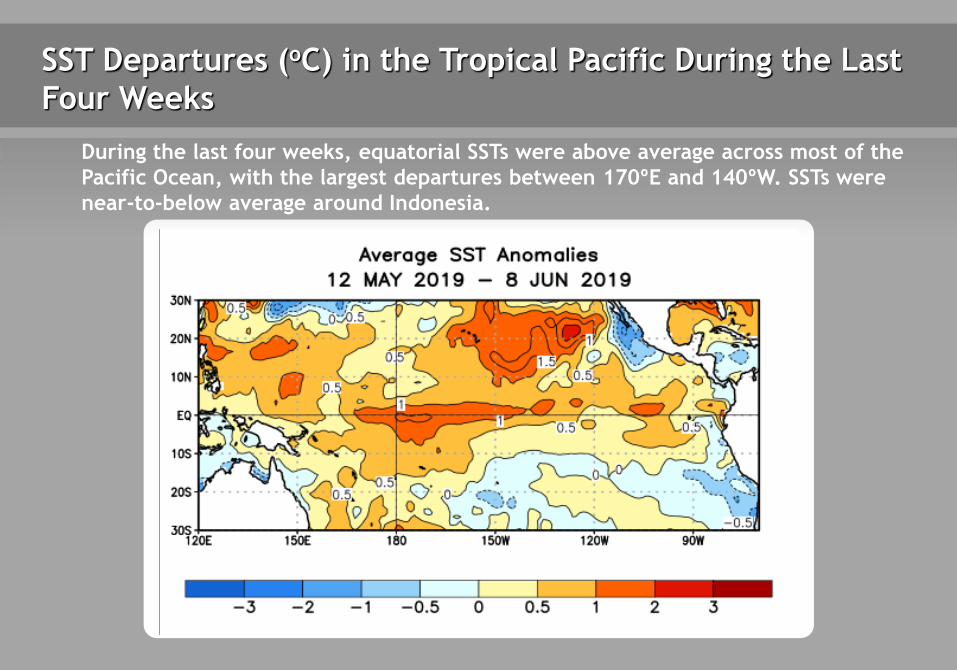
SST Departures (oC) in the Tropical Pacific During the Last
Four Weeks
During the last four weeks, equatorial SSTs were above average across most of the
Pacific Ocean, with the largest departures between 170ºE and 140ºW. SSTs were
near-to-below average around Indonesia.
26 30
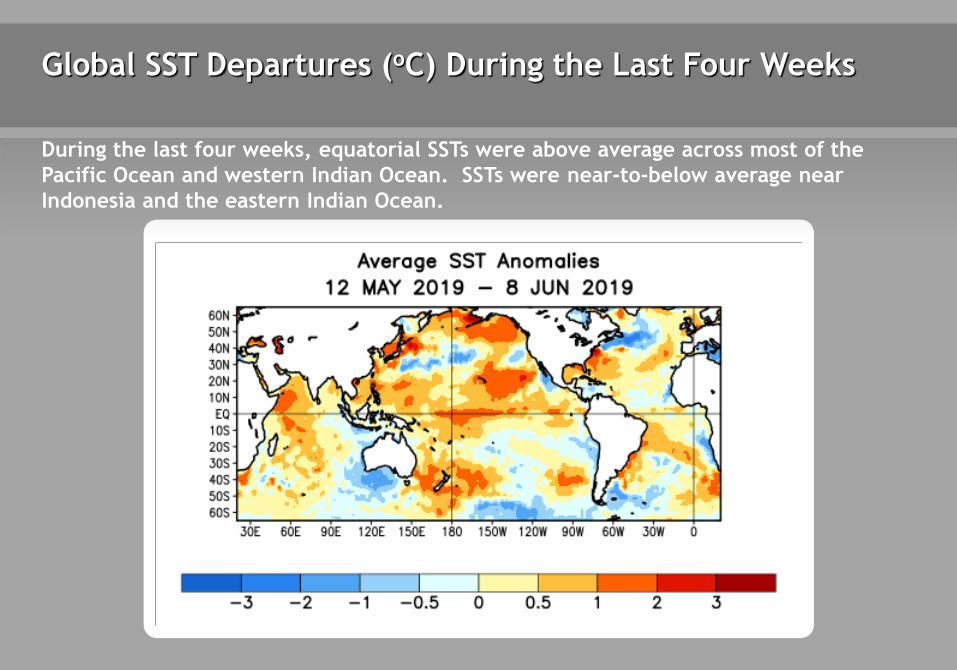
Global SST Departures (oC) During the Last Four Weeks
During the last four weeks, equatorial SSTs were above average across most of the
Pacific Ocean and western Indian Ocean. SSTs were near-to-below average near
Indonesia and the eastern Indian Ocean.
26 30
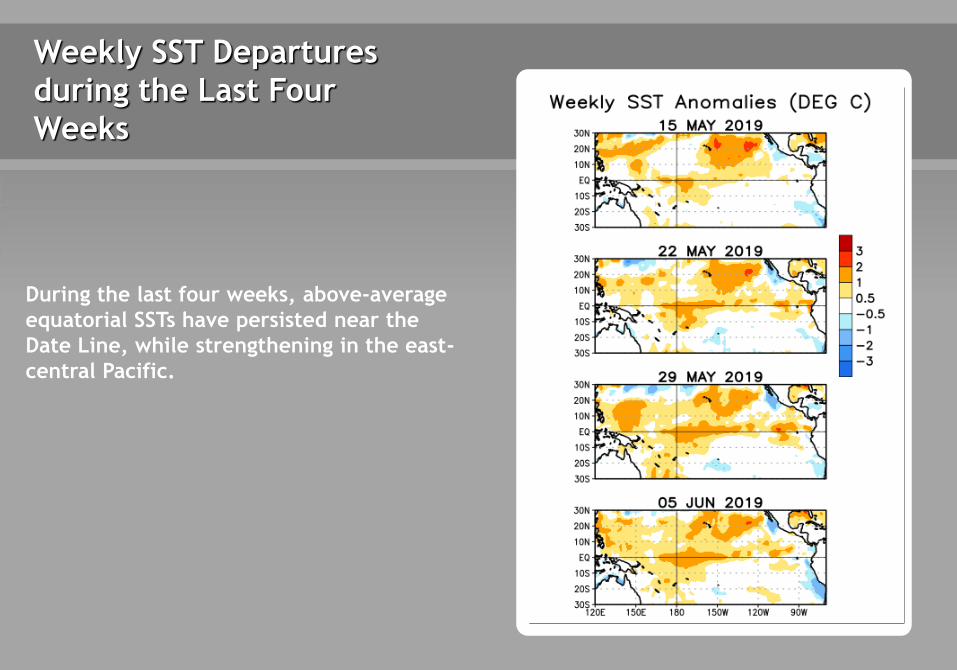
Weekly SST Departures
during the Last Four
Weeks
During the last four weeks, above-average
equatorial SSTs have persisted near the
Date Line, while strengthening in the east-
central Pacific.
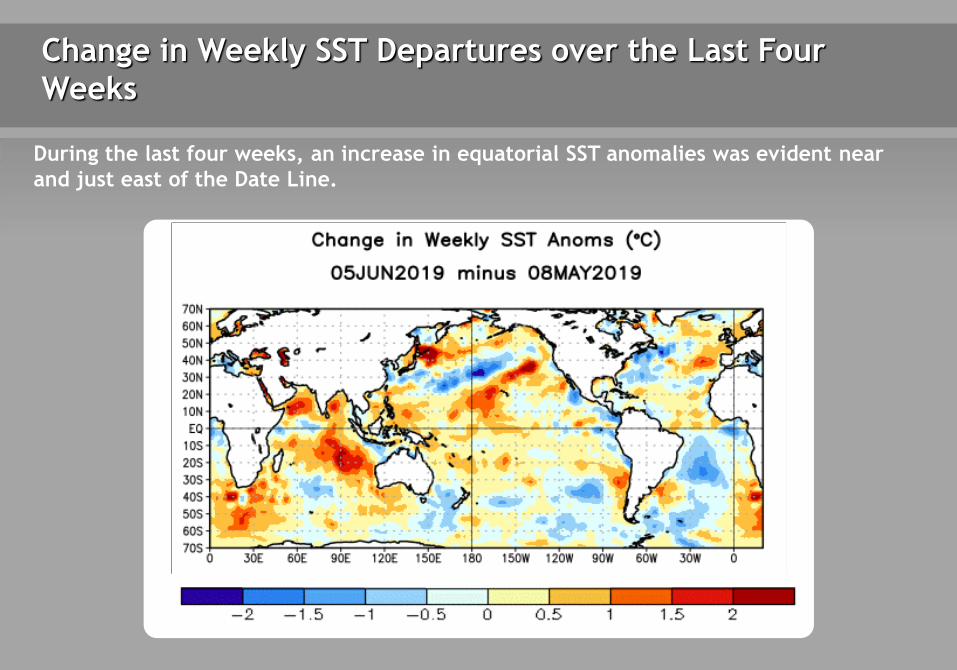
Change in Weekly SST Departures over the Last Four
Weeks
During the last four weeks, an increase in equatorial SST anomalies was evident near
and just east of the Date Line.
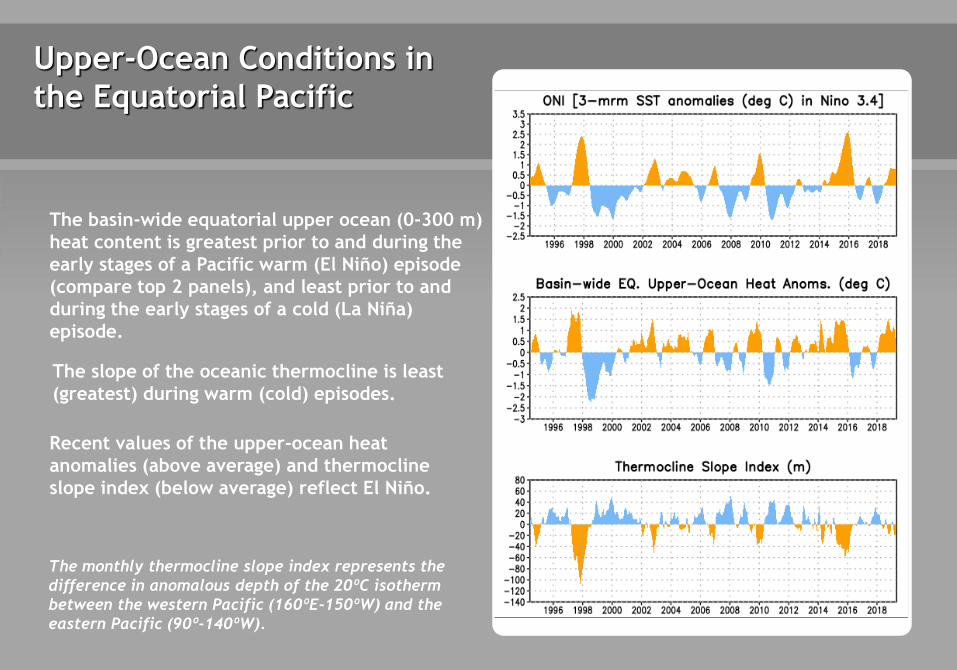
Upper-Ocean Conditions in
the Equatorial Pacific
The basin-wide equatorial upper ocean (0-300 m)
heat content is greatest prior to and during the
early stages of a Pacific warm (El Niño) episode
(compare top 2 panels), and least prior to and
during the early stages of a cold (La Niña)
episode.
The slope of the oceanic thermocline is least
(greatest) during warm (cold) episodes.
Recent values of the upper-ocean heat
anomalies (above average) and thermocline
slope index (below average) reflect El Niño.
The monthly thermocline slope index represents the
difference in anomalous depth of the 20ºC isotherm
between the western Pacific (160ºE-150ºW) and the
eastern Pacific (90º-140ºW).
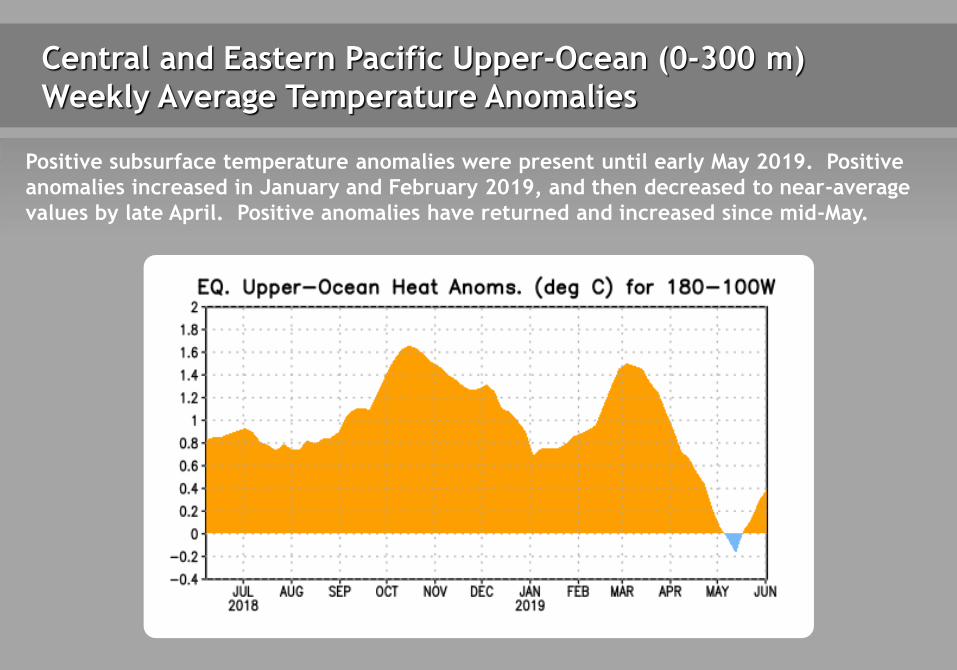
Central and Eastern Pacific Upper-Ocean (0-300 m)
Weekly Average Temperature Anomalies
Positive subsurface temperature anomalies were present until early May 2019. Positive
anomalies increased in January and February 2019, and then decreased to near-average
values by late April. Positive anomalies have returned and increased since mid-May.
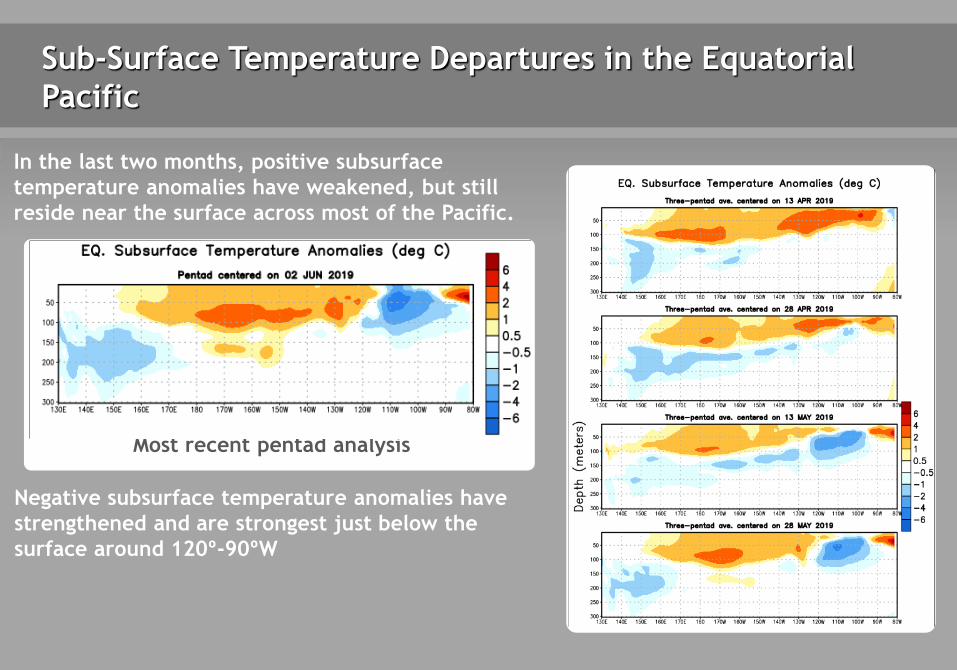
Sub-Surface Temperature Departures in the Equatorial
Pacific
Most recent pentad analysis
In the last two months, positive subsurface
temperature anomalies have weakened, but still
reside near the surface across most of the Pacific.
Negative subsurface temperature anomalies have
strengthened and are strongest just below the
surface around 120º-90ºW
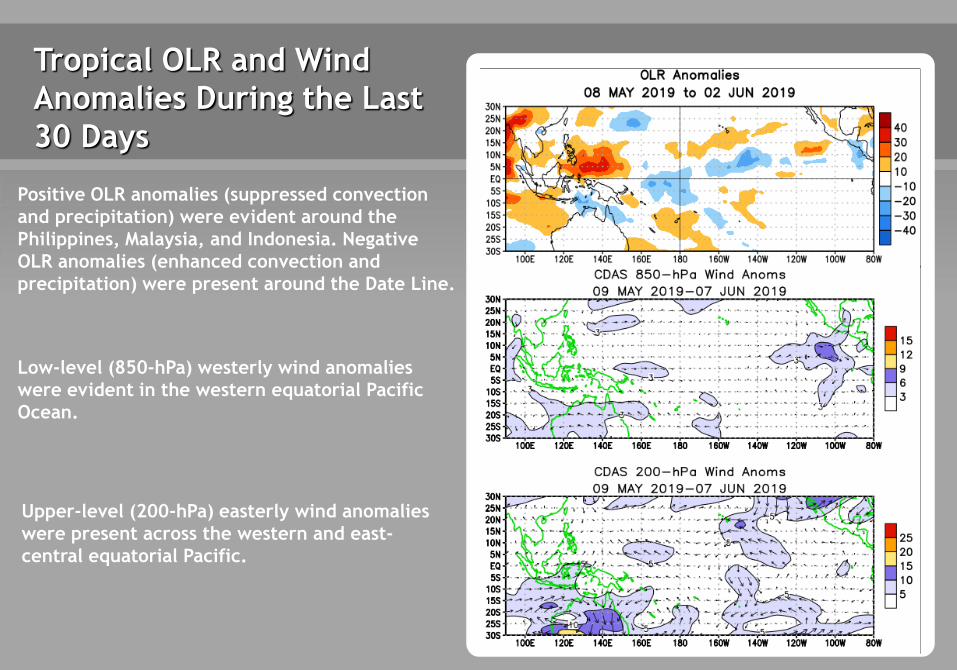
Tropical OLR and Wind
Anomalies During the Last
30 Days
Positive OLR anomalies (suppressed convection
and precipitation) were evident around the
Philippines, Malaysia, and Indonesia. Negative
OLR anomalies (enhanced convection and
precipitation) were present around the Date Line.
Low-level (850-hPa) westerly wind anomalies
were evident in the western equatorial Pacific
Ocean.
Upper-level (200-hPa) easterly wind anomalies
were present across the western and east-
central equatorial Pacific.
Intraseasonal Variability
Intraseasonal variability in the atmosphere (wind and pressure), which is often related
to the Madden-Julian Oscillation (MJO), can significantly impact surface and subsurface
conditions across the Pacific Ocean.
Related to this activity:
Significant weakening of the low-level easterly winds usually initiates an eastward-
propagating oceanic Kelvin wave.
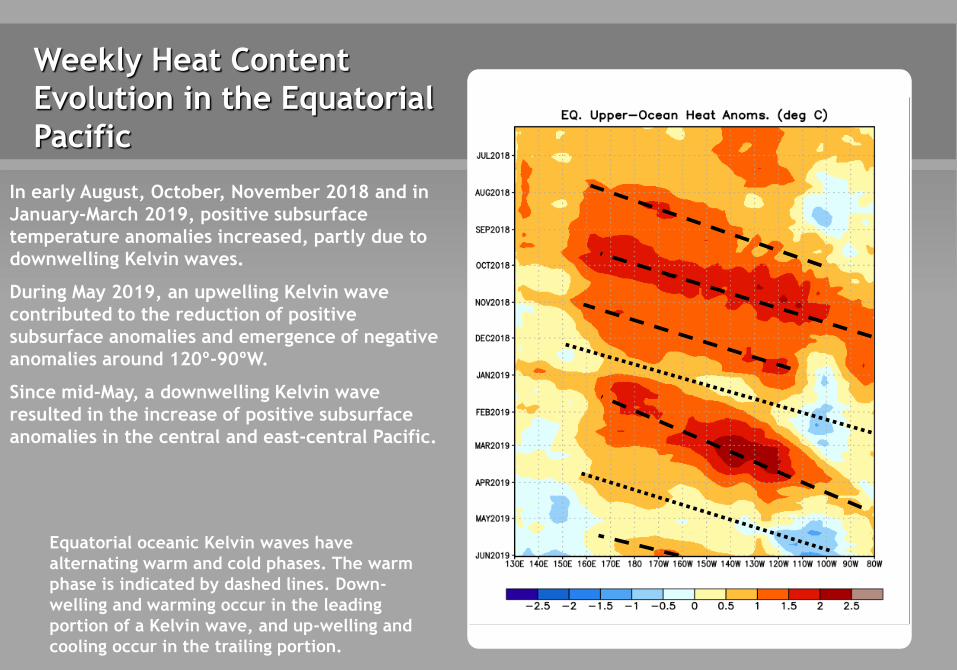
Weekly Heat Content
Evolution in the Equatorial
Pacific
Equatorial oceanic Kelvin waves have
alternating warm and cold phases. The warm
phase is indicated by dashed lines. Down-
welling and warming occur in the leading
portion of a Kelvin wave, and up-welling and
cooling occur in the trailing portion.
In early August, October, November 2018 and in
January-March 2019, positive subsurface
temperature anomalies increased, partly due to
downwelling Kelvin waves.
During May 2019, an upwelling Kelvin wave
contributed to the reduction of positive
subsurface anomalies and emergence of negative
anomalies around 120º-90ºW.
Since mid-May, a downwelling Kelvin wave
resulted in the increase of positive subsurface
anomalies in the central and east-central Pacific.
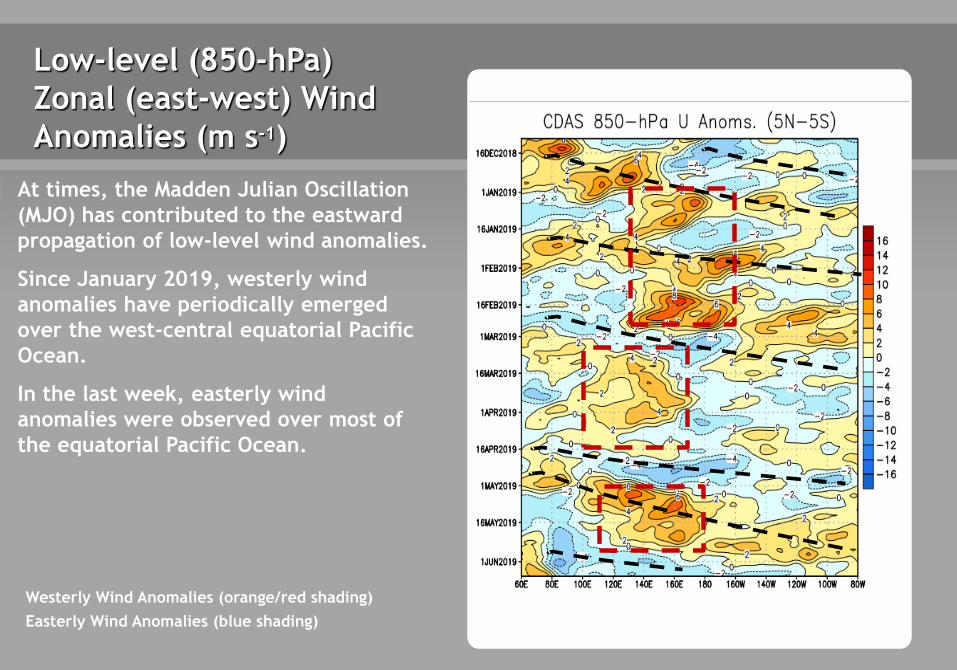
Low-level (850-hPa)
Zonal (east-west) Wind
Anomalies (m s-1)
At times, the Madden Julian Oscillation
(MJO) has contributed to the eastward
propagation of low-level wind anomalies.
Since January 2019, westerly wind
anomalies have periodically emerged
over the west-central equatorial Pacific
Ocean.
In the last week, easterly wind
anomalies were observed over most of
the equatorial Pacific Ocean.
Westerly Wind Anomalies (orange/red shading)
Easterly Wind Anomalies (blue shading)
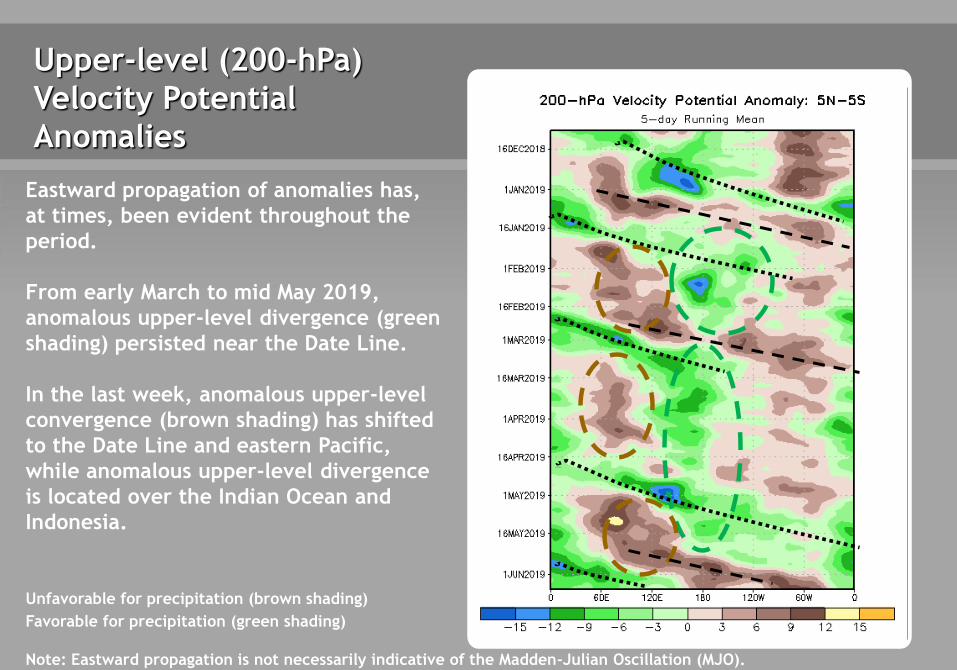
Upper-level (200-hPa)
Velocity Potential
Anomalies
Unfavorable for precipitation (brown shading)
Favorable for precipitation (green shading)
Note: Eastward propagation is not necessarily indicative of the Madden-Julian Oscillation (MJO).
Eastward propagation of anomalies has,
at times, been evident throughout the
period.
From early March to mid May 2019,
anomalous upper-level divergence (green
shading) persisted near the Date Line.
In the last week, anomalous upper-level
convergence (brown shading) has shifted
to the Date Line and eastern Pacific,
while anomalous upper-level divergence
is located over the Indian Ocean and
Indonesia.
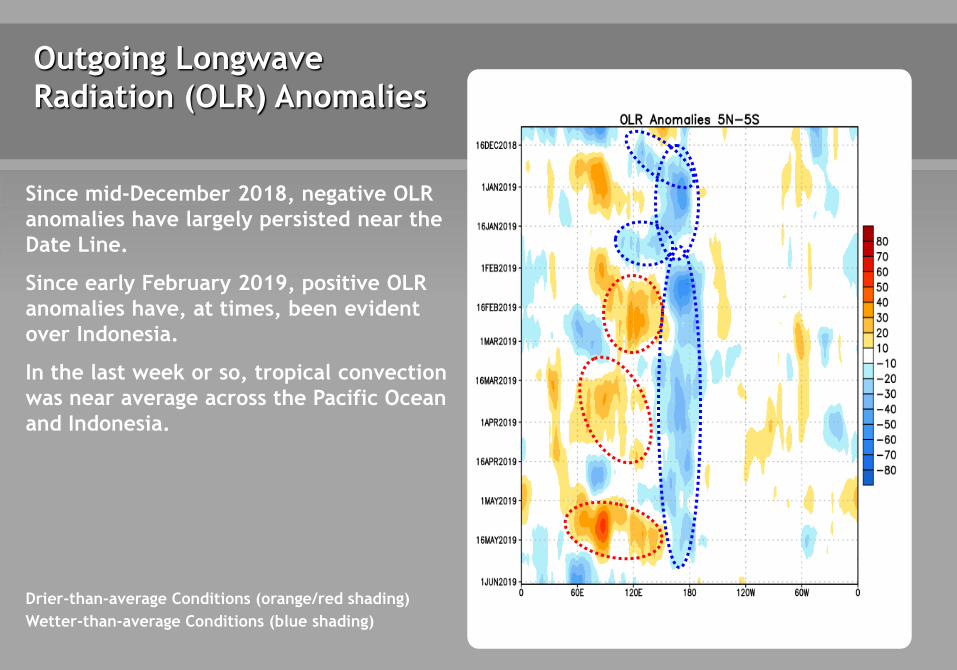
Outgoing Longwave
Radiation (OLR) Anomalies
Drier-than-average Conditions (orange/red shading)
Wetter-than-average Conditions (blue shading)
Since mid-December 2018, negative OLR
anomalies have largely persisted near the
Date Line.
Since early February 2019, positive OLR
anomalies have, at times, been evident
over Indonesia.
In the last week or so, tropical convection
was near average across the Pacific Ocean
and Indonesia.
Oceanic Niño Index (ONI)
The ONI is based on SST departures from average in the Niño 3.4 region, and is a
principal measure for monitoring, assessing, and predicting ENSO.
Defined as the three-month running-mean SST departures in the Niño 3.4 region.
Departures are based on a set of improved homogeneous historical SST analyses
(Extended Reconstructed SST – ERSST.v5). The SST reconstruction methodology is
described in Huang et al., 2017, J. Climate, vol. 30, 8179-8205.)
It is one index that helps to place current events into a historical perspective
NOAA Operational Definitions for El Niño and La Niña
El Niño: characterized by a positive ONI greater than or equal to +0.5ºC.
La Niña: characterized by a negative ONI less than or equal to -0.5ºC.
By historical standards, to be classified as a full-fledged El Niño or La Niña episode,
these thresholds must be exceeded for a period of at least 5 consecutive overlapping
3-month seasons.
CPC considers El Niño or La Niña conditions to occur when the monthly Niño3.4 OISST
departures meet or exceed +/- 0.5ºC along with consistent atmospheric features. These
anomalies must also be forecasted to persist for 3 consecutive months.
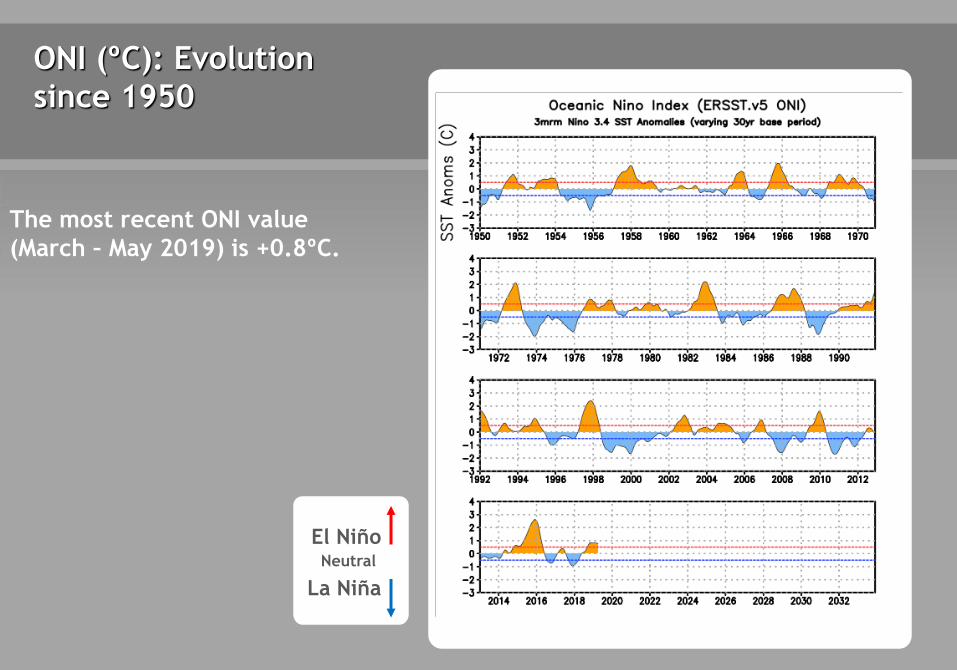
ONI (ºC): Evolution
since 1950
The most recent ONI value
(March – May 2019) is +0.8ºC.
El Niño
La Niña
Neutral
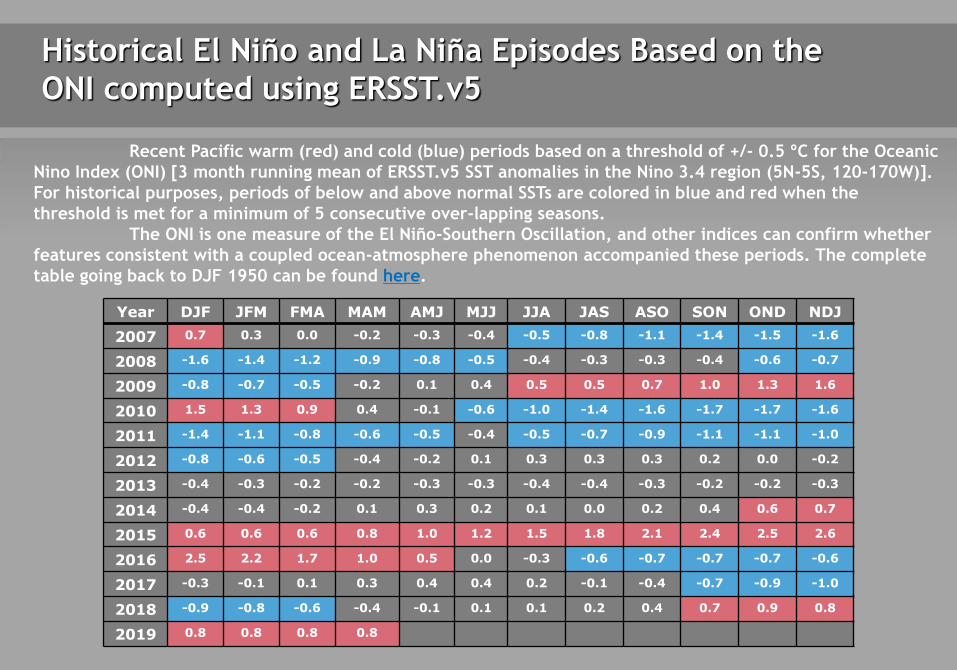
Historical El Niño and La Niña Episodes Based on the
ONI computed using ERSST.v5
Recent Pacific warm (red) and cold (blue) periods based on a threshold of +/- 0.5 ºC for the Oceanic
Nino Index (ONI) [3 month running mean of ERSST.v5 SST anomalies in the Nino 3.4 region (5N-5S, 120-170W)].
For historical purposes, periods of below and above normal SSTs are colored in blue and red when the
threshold is met for a minimum of 5 consecutive over-lapping seasons.
The ONI is one measure of the El Niño-Southern Oscillation, and other indices can confirm whether
features consistent with a coupled ocean-atmosphere phenomenon accompanied these periods. The complete
table going back to DJF 1950 can be found here.
Year DJF JFM FMA MAM AMJ MJJ JJA JAS ASO SON OND NDJ
2007 0.7 0.3 0.0 -0.2 -0.3 -0.4 -0.5 -0.8 -1.1 -1.4 -1.5 -1.6
2008 -1.6 -1.4 -1.2 -0.9 -0.8 -0.5 -0.4 -0.3 -0.3 -0.4 -0.6 -0.7
2009 -0.8 -0.7 -0.5 -0.2 0.1 0.4 0.5 0.5 0.7 1.0 1.3 1.6
2010 1.5 1.3 0.9 0.4 -0.1 -0.6 -1.0 -1.4 -1.6 -1.7 -1.7 -1.6
2011 -1.4 -1.1 -0.8 -0.6 -0.5 -0.4 -0.5 -0.7 -0.9 -1.1 -1.1 -1.0
2012 -0.8 -0.6 -0.5 -0.4 -0.2 0.1 0.3 0.3 0.3 0.2 0.0 -0.2
2013 -0.4 -0.3 -0.2 -0.2 -0.3 -0.3 -0.4 -0.4 -0.3 -0.2 -0.2 -0.3
2014 -0.4 -0.4 -0.2 0.1 0.3 0.2 0.1 0.0 0.2 0.4 0.6 0.7
2015 0.6 0.6 0.6 0.8 1.0 1.2 1.5 1.8 2.1 2.4 2.5 2.6
2016 2.5 2.2 1.7 1.0 0.5 0.0 -0.3 -0.6 -0.7 -0.7 -0.7 -0.6
2017 -0.3 -0.1 0.1 0.3 0.4 0.4 0.2 -0.1 -0.4 -0.7 -0.9 -1.0
2018 -0.9 -0.8 -0.6 -0.4 -0.1 0.1 0.1 0.2 0.4 0.7 0.9 0.8
2019 0.8 0.8 0.8 0.8
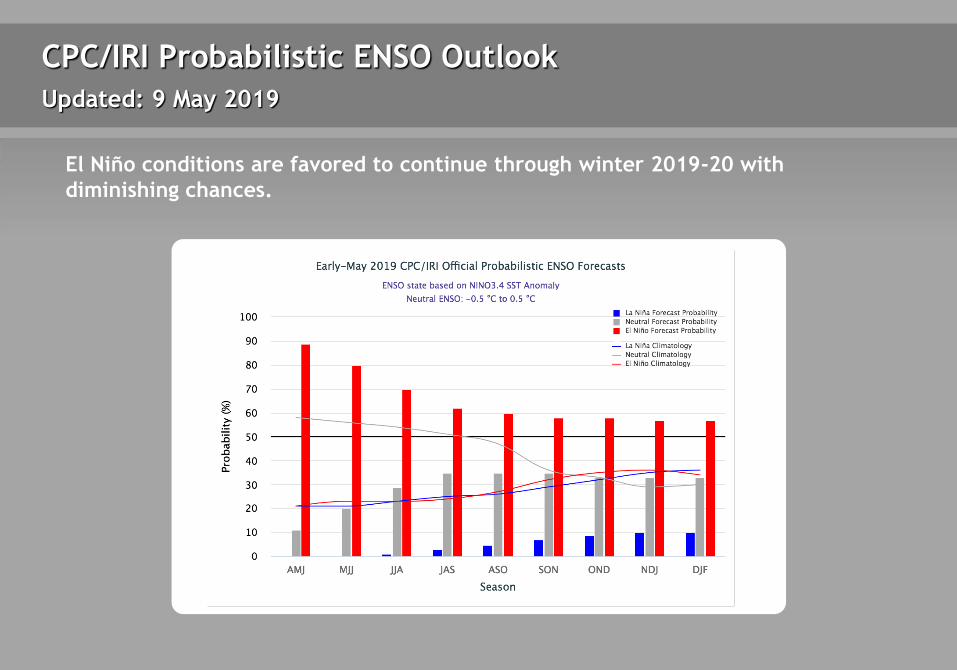
CPC/IRI Probabilistic ENSO Outlook
Updated: 9 May 2019
El Niño conditions are favored to continue through winter 2019-20 with
diminishing chances.
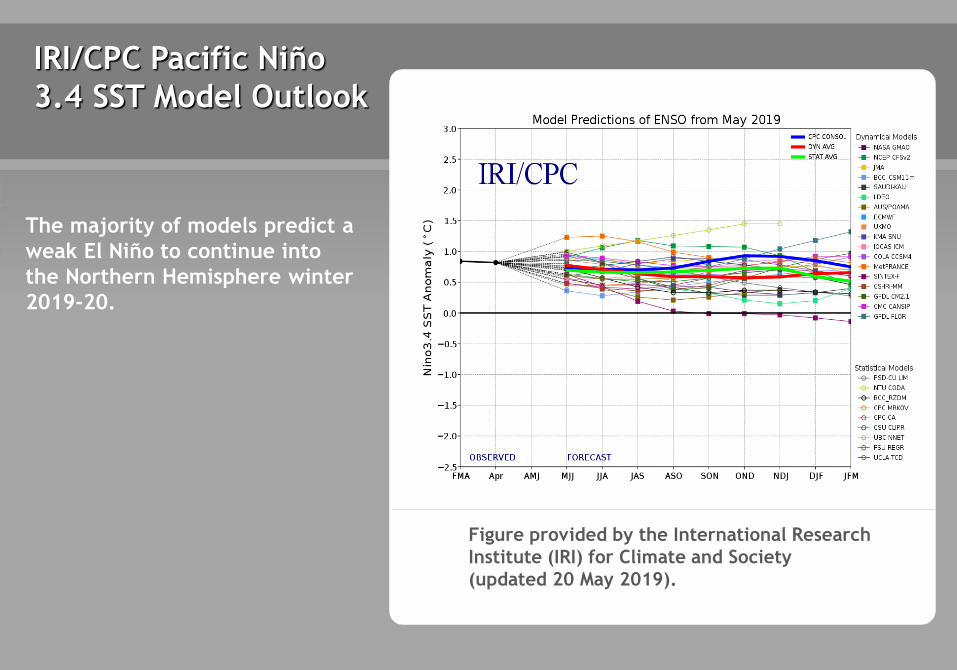
IRI/CPC Pacific Niño
3.4 SST Model Outlook
Figure provided by the International Research
Institute (IRI) for Climate and Society
(updated 20 May 2019).
The majority of models predict a
weak El Niño to continue into
the Northern Hemisphere winter
2019-20.
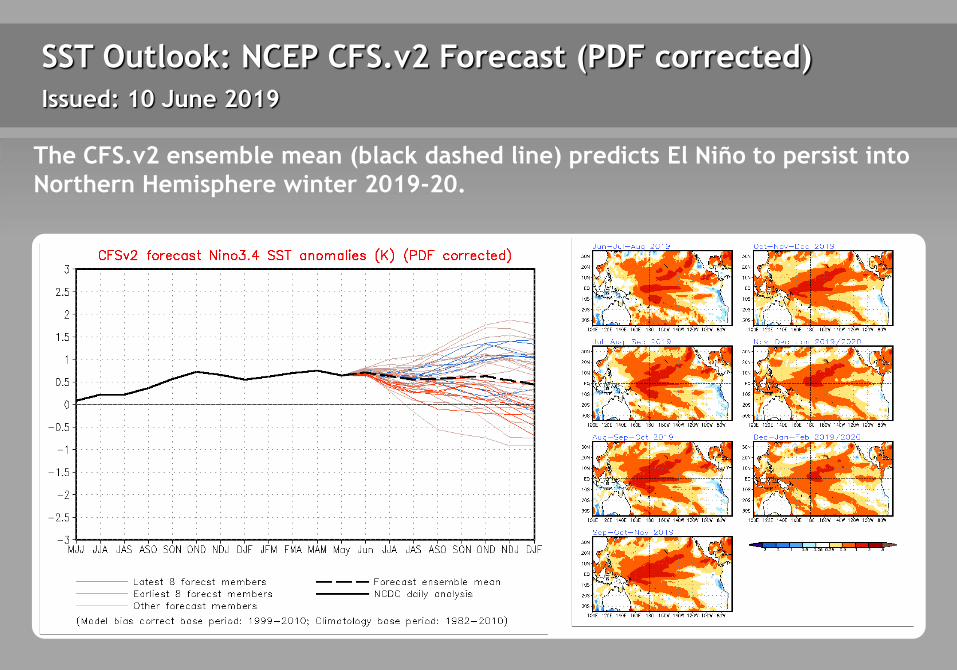
SST Outlook: NCEP CFS.v2 Forecast (PDF corrected)
Issued: 10 June 2019
The CFS.v2 ensemble mean (black dashed line) predicts El Niño to persist into
Northern Hemisphere winter 2019-20.
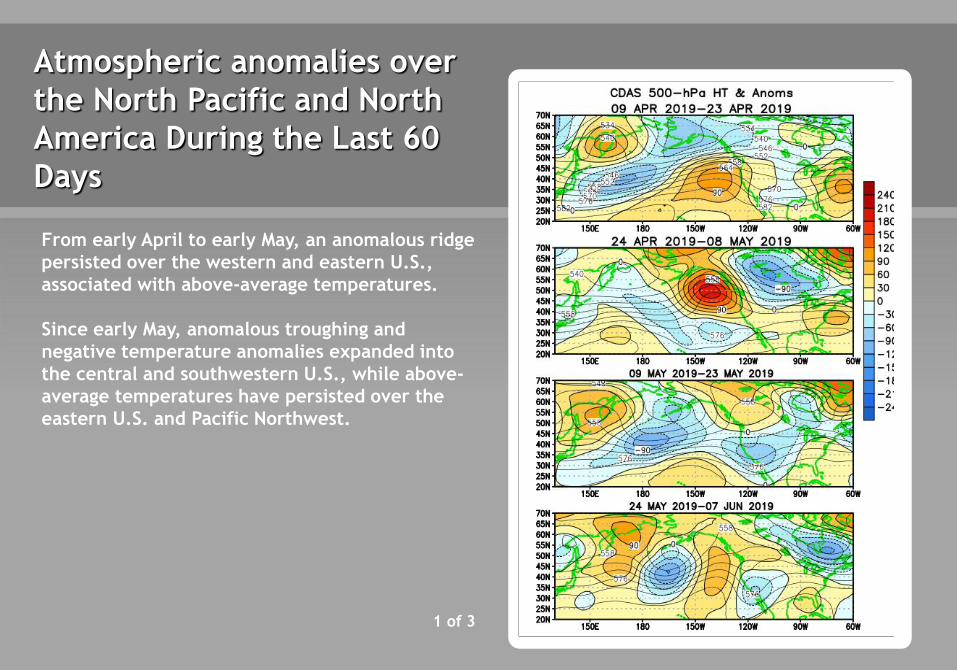
Atmospheric anomalies over
the North Pacific and North
America During the Last 60
Days
1 of 3
From early April to early May, an anomalous ridge
persisted over the western and eastern U.S.,
associated with above-average temperatures.
Since early May, anomalous troughing and
negative temperature anomalies expanded into
the central and southwestern U.S., while above-
average temperatures have persisted over the
eastern U.S. and Pacific Northwest.
2 of 3
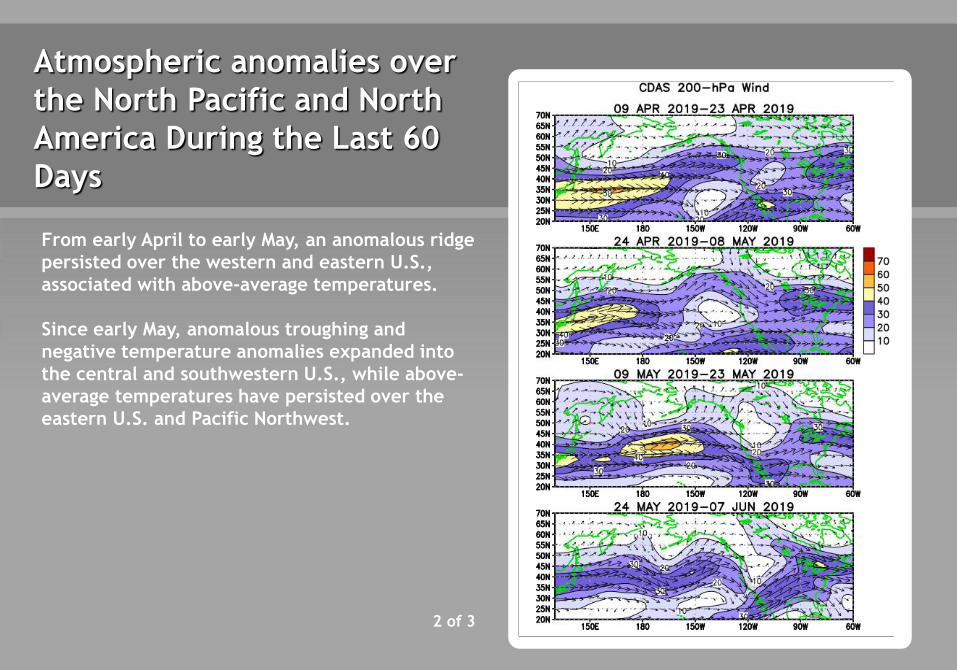
Atmospheric anomalies over
the North Pacific and North
America During the Last 60
Days
From early April to early May, an anomalous ridge
persisted over the western and eastern U.S.,
associated with above-average temperatures.
Since early May, anomalous troughing and
negative temperature anomalies expanded into
the central and southwestern U.S., while above-
average temperatures have persisted over the
eastern U.S. and Pacific Northwest.
3 of 3
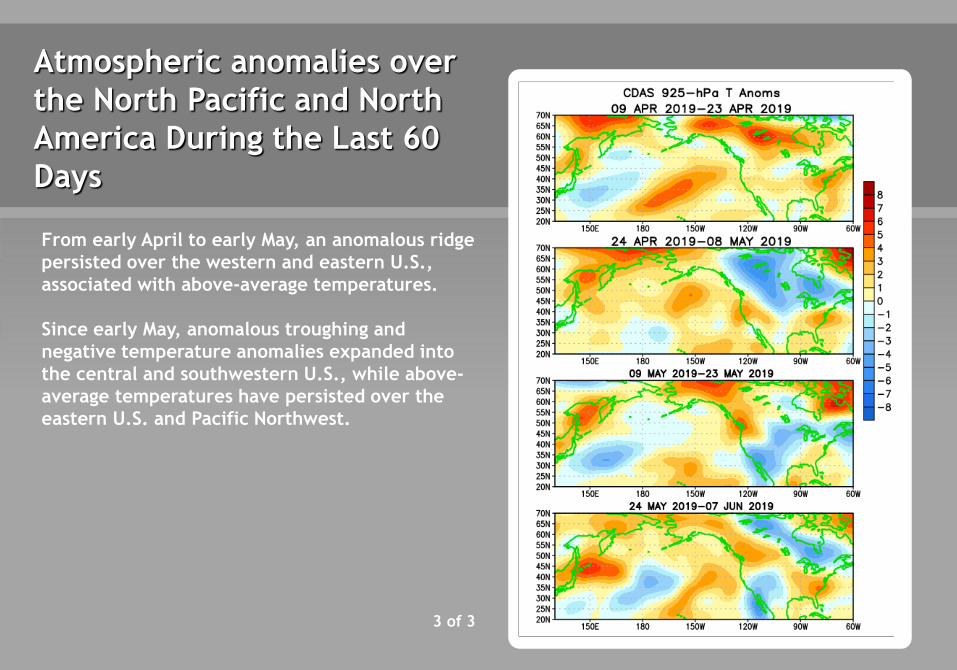
Atmospheric anomalies over
the North Pacific and North
America During the Last 60
Days
From early April to early May, an anomalous ridge
persisted over the western and eastern U.S.,
associated with above-average temperatures.
Since early May, anomalous troughing and
negative temperature anomalies expanded into
the central and southwestern U.S., while above-
average temperatures have persisted over the
eastern U.S. and Pacific Northwest.
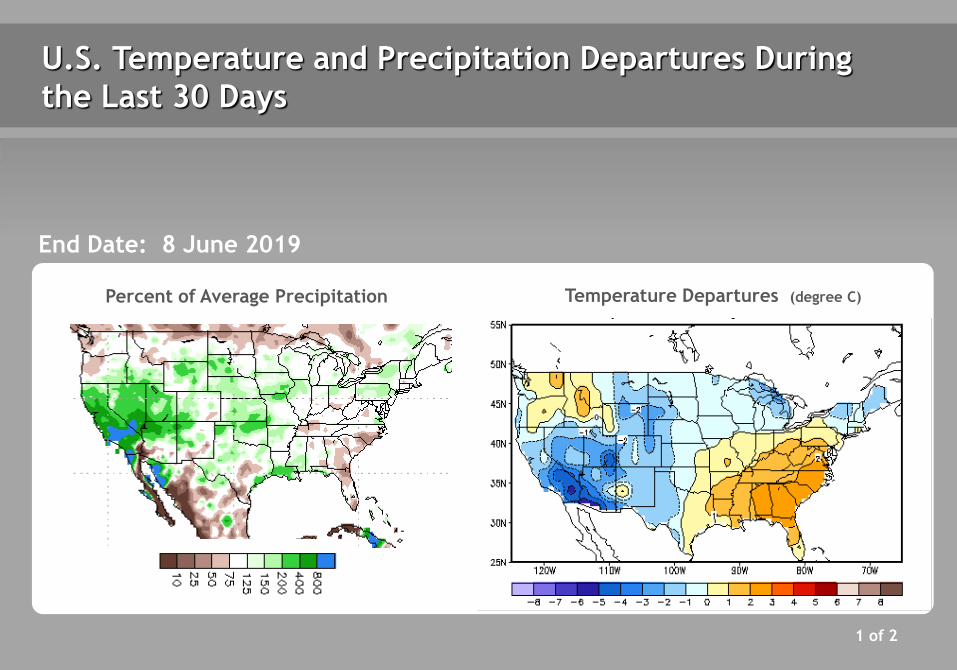
U.S. Temperature and Precipitation Departures During
the Last 30 Days
End Date: 8 June 2019
Percent of Average Precipitation Temperature Departures (degree C)
1 of 2
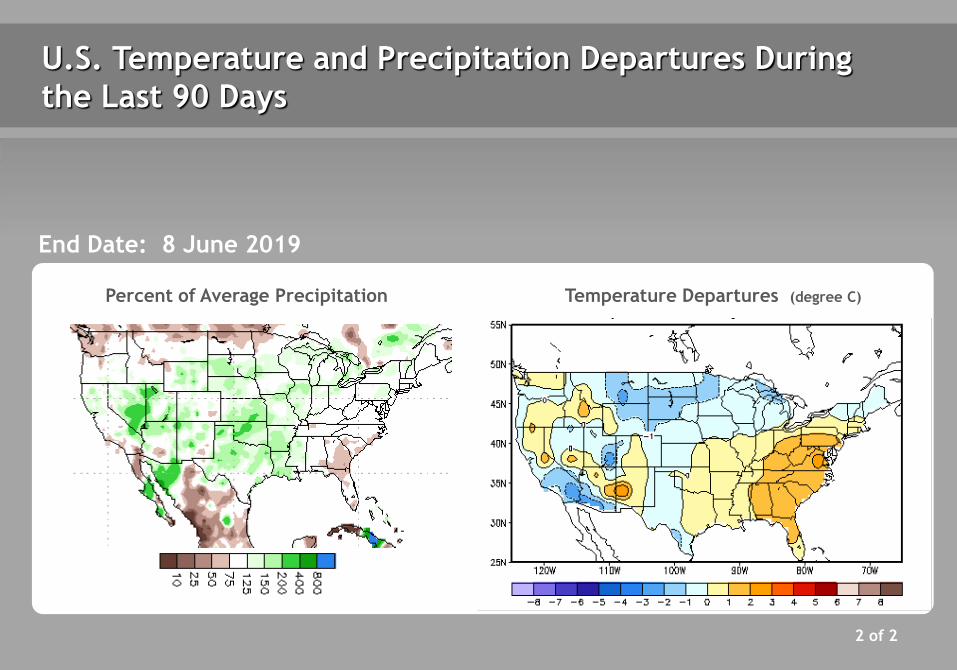
U.S. Temperature and Precipitation Departures During
the Last 90 Days
Percent of Average Precipitation Temperature Departures (degree C)
2 of 2
End Date: 8 June 2019
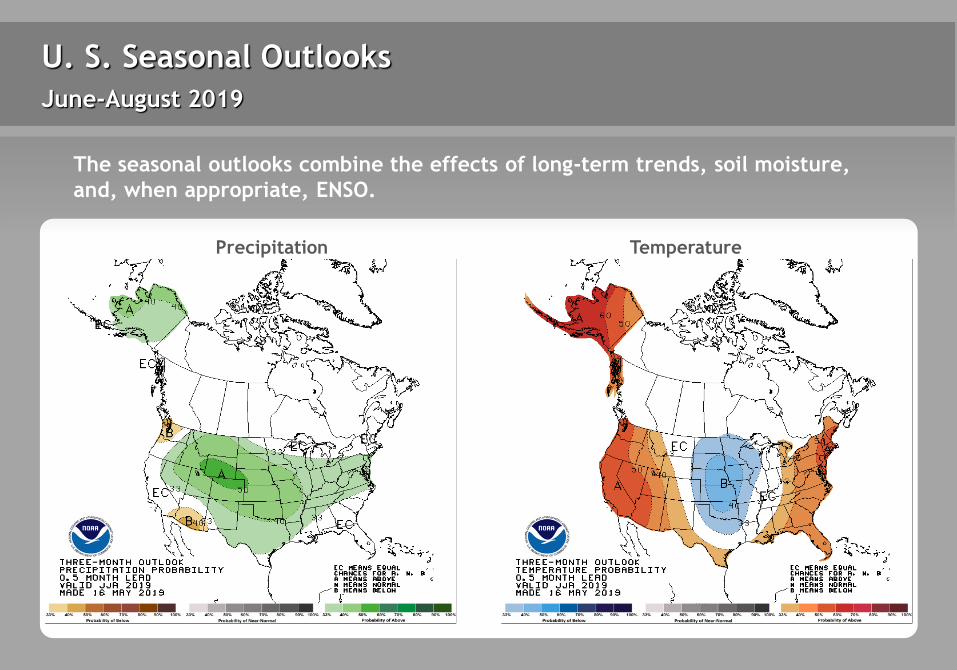
U. S. Seasonal Outlooks
Precipitation Temperature
June-August 2019
The seasonal outlooks combine the effects of long-term trends, soil moisture,
and, when appropriate, ENSO.

Summary
* Note: These statements are updated once a month (2nd Thursday of each month) in association
with the ENSO Diagnostics Discussion, which can be found by clicking here.
ENSO Alert System Status: El Niño Advisory
El Niño is present.*
Equatorial sea surface temperatures (SSTs) are above average across most of
the Pacific Ocean.
The pattern of anomalous convection and winds are consistent with El Niño.
El Niño is likely to continue through the Northern Hemisphere summer 2019
(70% chance) and fall (55-60% chance).*