Embed Size (px)
Citation preview
ENSO Cycle: Recent Evolution, Current
Status and Predictions
Vernon E. Kousky and R. Wayne HigginsClimate Prediction Center / NCEP
October 2004
Synopsis• Warm episode (El Niño) conditions are expected to continue through early 2005.
• Expected impacts over the U. S. during this winter include: wetter- and cooler-than-average conditions over Texas, and portions of the Gulf Coast and Southeast, drier-than-average conditions over the Pacific Northwest and the Ohio and Tennessee Valleys, warmer-than-average conditions over most of the West, and over the northern and central Great Plains.

Recent Evolution of Equatorial Pacific SST Departures
Longitude
Time
• Since early 2004 SSTs have been cooler-than-average in the eastern equatorial Pacific and warmer-than-average in the western and central equatorial Pacific.
• Departures increased substantially in the central equatorial Pacific during July.
• The warmth in the central equatorial Pacific has persisted and expanded eastward in recent months.
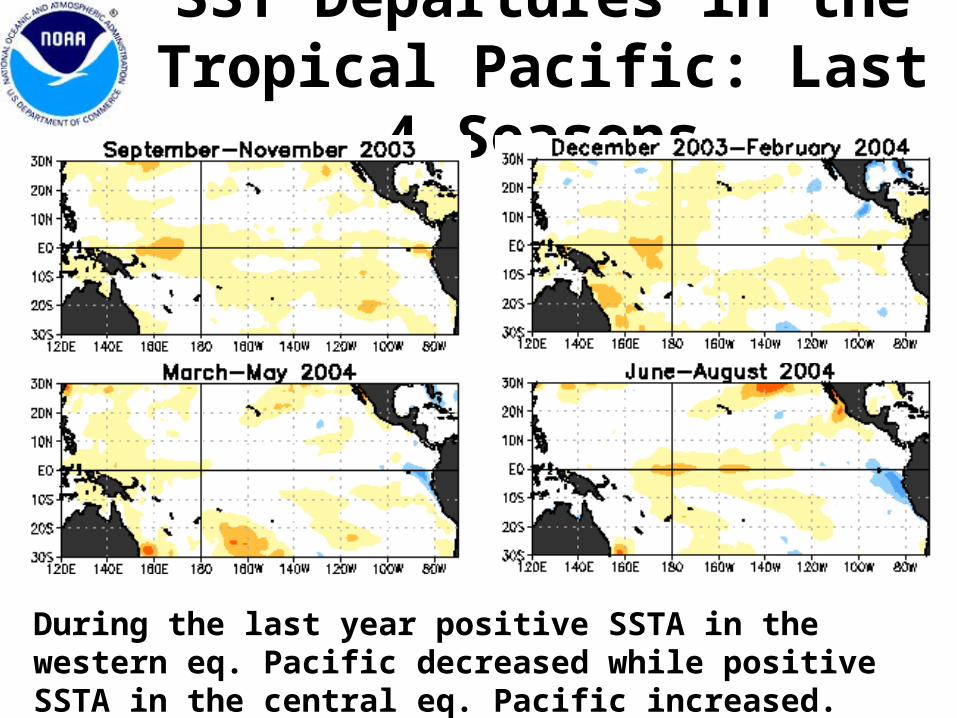
SST Departures in the Tropical Pacific: Last 4 Seasons
During the last year positive SSTA in the western eq. Pacific decreased while positive SSTA in the central eq. Pacific increased.
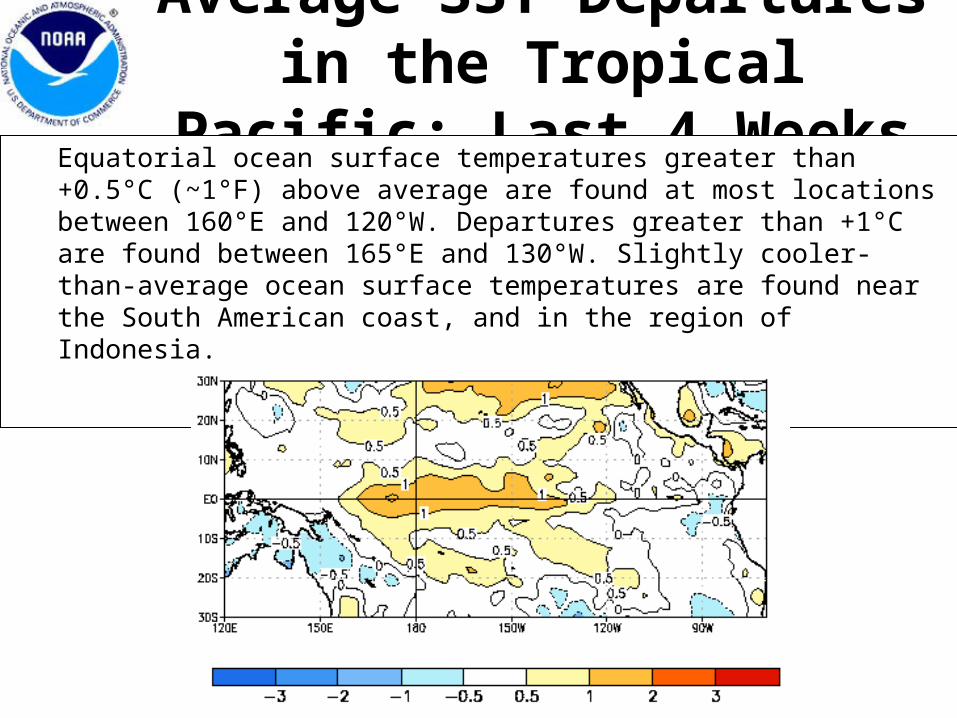
Average SST Departures in the Tropical Pacific: Last 4 Weeks
Equatorial ocean surface temperatures greater than +0.5°C (~1°F) above average are found at most locations between 160°E and 120°W. Departures greater than +1°C are found between 165°E and 130°W. Slightly cooler-than-average ocean surface temperatures are found near the South American coast, and in the region of Indonesia.
12 September-9 October 2004
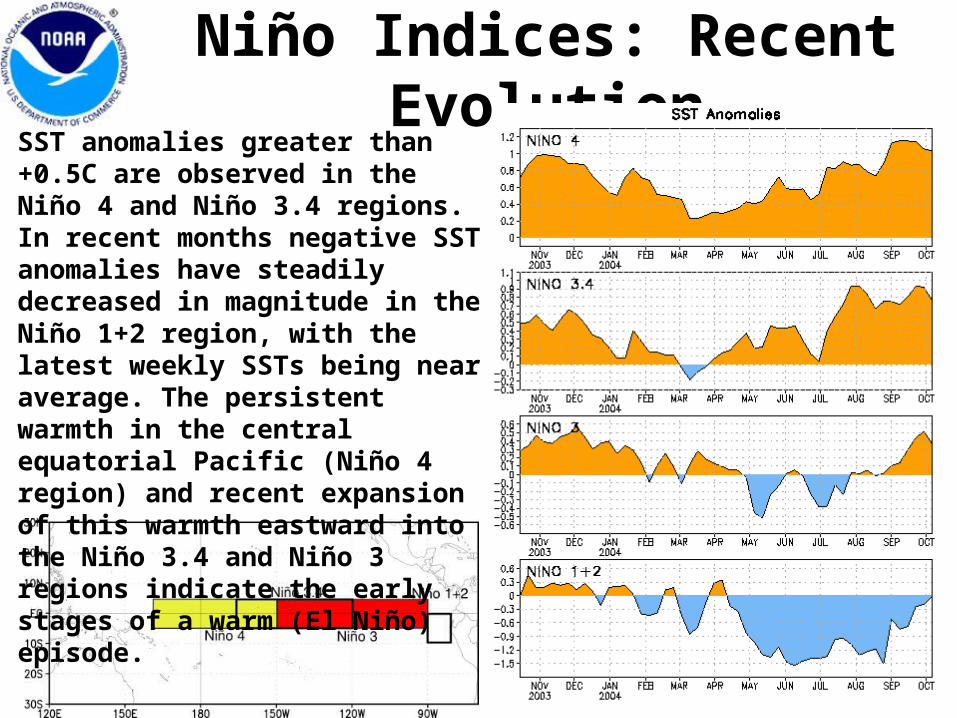
Niño Indices: Recent EvolutionSST anomalies greater than +0.5C are observed in the Niño 4 and Niño 3.4 regions. In recent months negative SST anomalies have steadily decreased in magnitude in the Niño 1+2 region, with the latest weekly SSTs being near average. The persistent warmth in the central equatorial Pacific (Niño 4 region) and recent expansion of this warmth eastward into the Niño 3.4 and Niño 3 regions indicate the early stages of a warm (El Niño) episode.
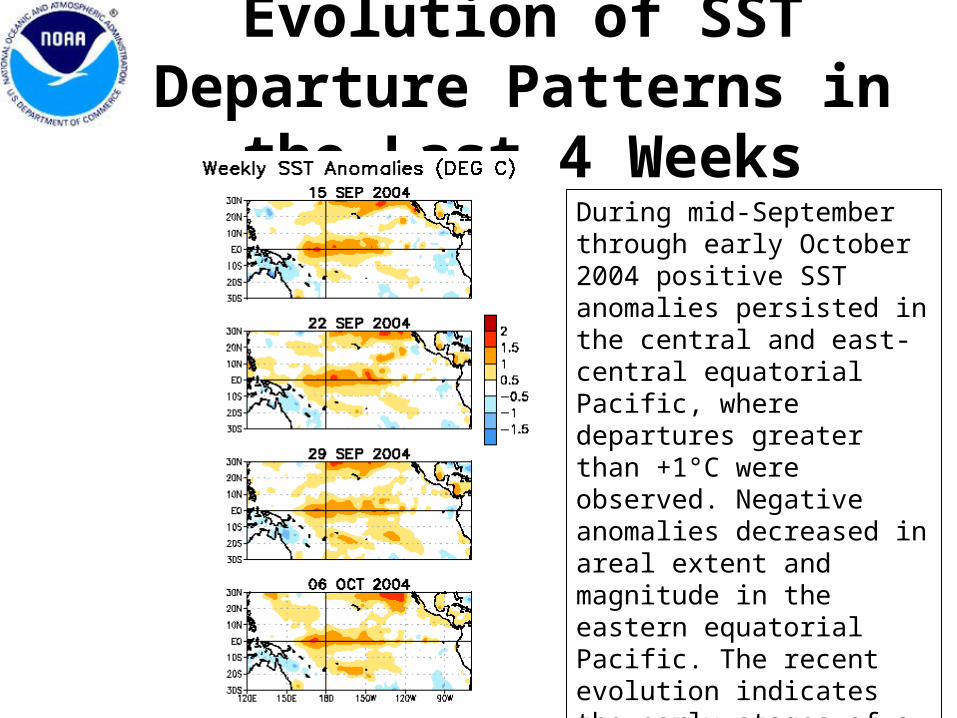
Evolution of SST Departure Patterns in the Last 4 Weeks
During mid-September through early October 2004 positive SST anomalies persisted in the central and east-central equatorial Pacific, where departures greater than +1°C were observed. Negative anomalies decreased in areal extent and magnitude in the eastern equatorial Pacific. The recent evolution indicates the early stages of a warm (El Niño) episode.
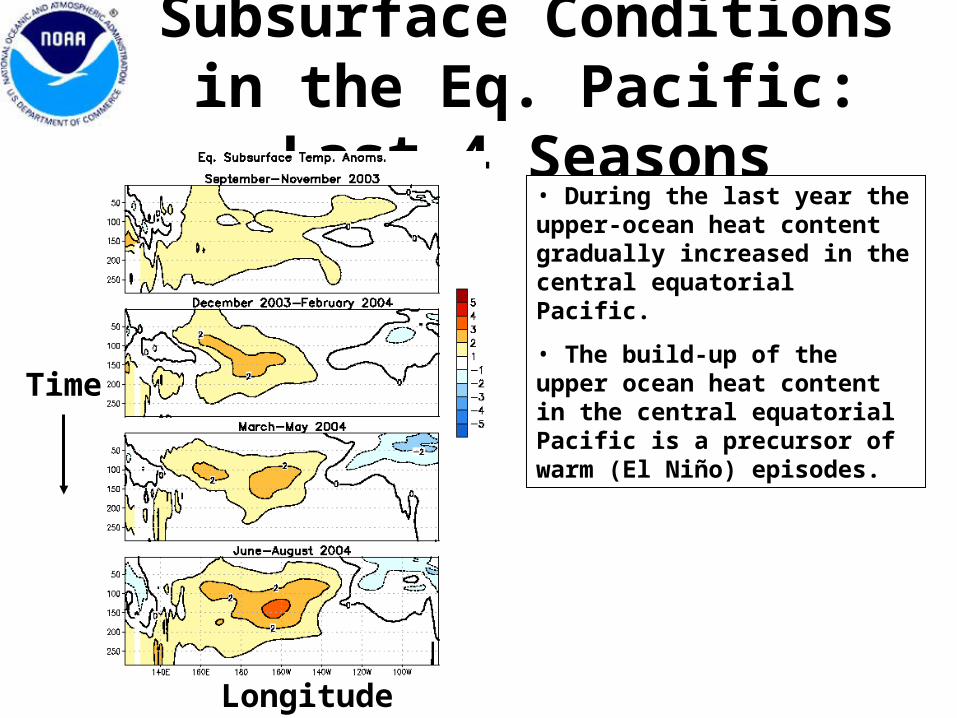
Subsurface Conditions in the Eq. Pacific: Last 4 Seasons
• During the last year the upper-ocean heat content gradually increased in the central equatorial Pacific.
• The build-up of the upper ocean heat content in the central equatorial Pacific is a precursor of warm (El Niño) episodes.
Time
Longitude
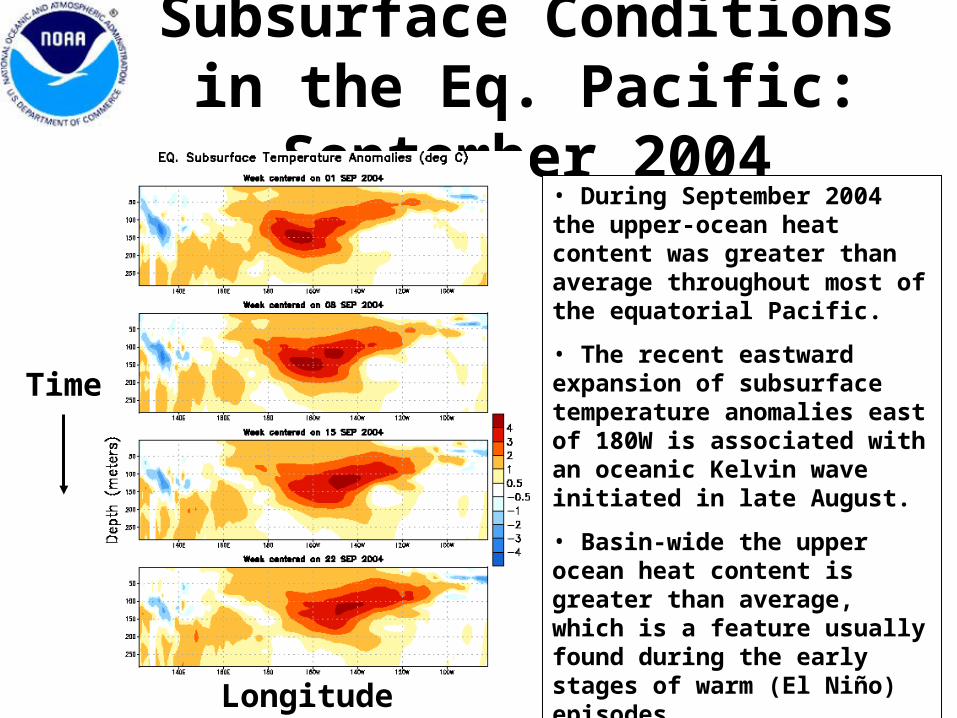
Subsurface Conditions in the Eq. Pacific: September 2004
• During September 2004 the upper-ocean heat content was greater than average throughout most of the equatorial Pacific.
• The recent eastward expansion of subsurface temperature anomalies east of 180W is associated with an oceanic Kelvin wave initiated in late August.
• Basin-wide the upper ocean heat content is greater than average, which is a feature usually found during the early stages of warm (El Niño) episodes.
Time
Longitude
MJO Intraseasonal Variability
• MJO activity in recent months has resulted in significant variability in the atmosphere (wind and pressure) and Pacific Ocean (surface and subsurface temperature).
• Related to this activity– a significant weakening of the low-level easterly winds
occurred over the equatorial Pacific during late June-early July 2004 and
– an eastward propagating Kelvin wave was initiated, which contributed to an increase in SST anomalies and upper ocean heat content in the central and east-central equatorial Pacific during August.
– the easterlies over the equatorial Pacific weakened again during late August-early September, initiating another Kelvin wave.
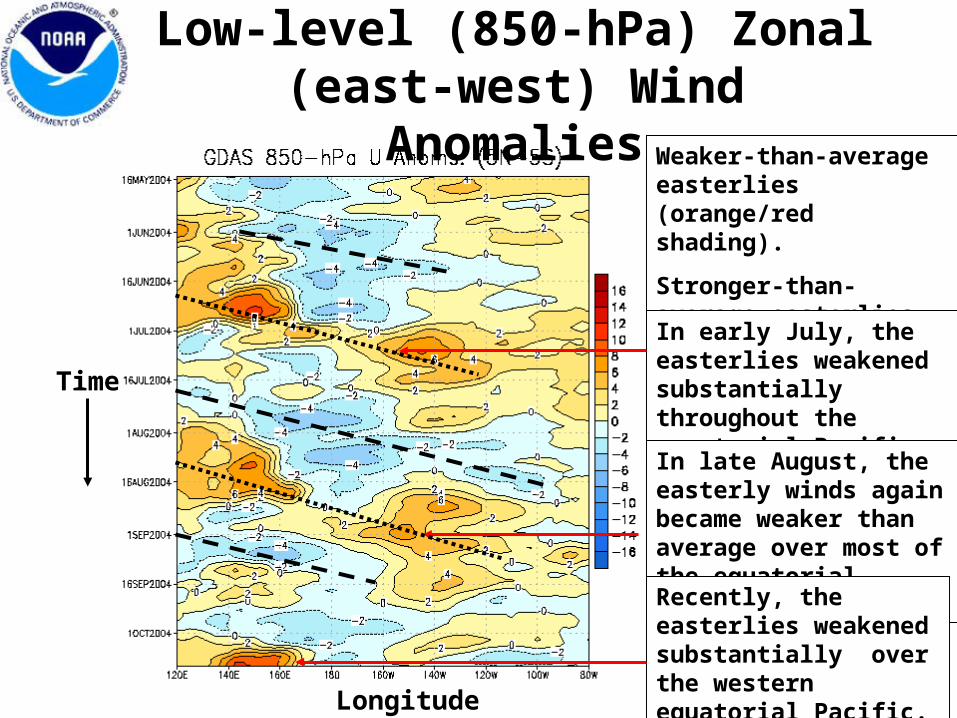
Low-level (850-hPa) Zonal (east-west) Wind Anomalies
Longitude
Time
Weaker-than-average easterlies (orange/red shading).
Stronger-than-average easterlies (blue shading).
In early July, the easterlies weakened substantially throughout the equatorial Pacific.
In late August, the easterly winds again became weaker than average over most of the equatorial Pacific.
Recently, the easterlies weakened substantially over the western equatorial Pacific.
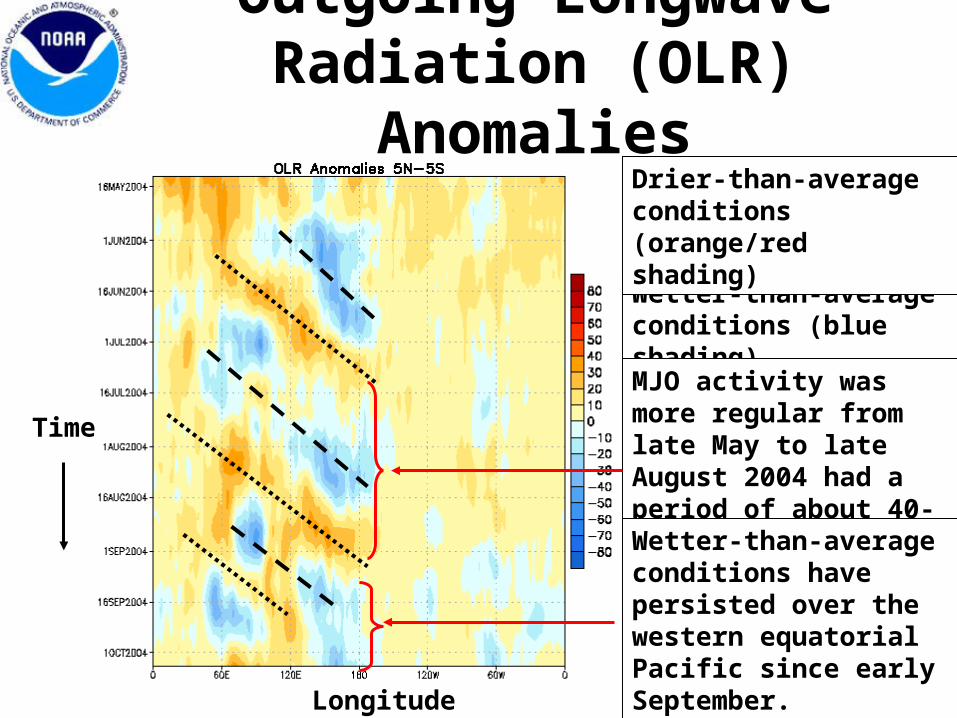
Outgoing Longwave Radiation (OLR) Anomalies
Wetter-than-average conditions (blue shading)
Drier-than-average conditions (orange/red shading)
Longitude
Time
MJO activity was more regular from late May to late August 2004 had a period of about 40-50 days.
Wetter-than-average conditions have persisted over the western equatorial Pacific since early September.
Oceanic Niño Index (ONI)
• Based on the principal measure for monitoring, assessment, and prediction of ENSO (SST departures from average in the Niño 3.4 region)
• Three-month running-mean values of SST departures from average in the Niño 3.4 region, based on a set of improved homogeneous historical SST analyses (Extended Reconstructed SST – ERSST.v2). The methodology is described in Smith and Reynolds, 2003, J. Climate, 16, 1495-1510.
• Used to place current conditions in historical perspective
• NOAA operational definitions of El Niño and La Niña are keyed to the index.
NOAA Operational Definitions for El Niño and La Niña
El Niño: characterized by a positive ONI greater than or equal to +0.5°C.
La Nia: characterized by a negative ONI less than or equal to 0.5°C.
To be classified as a full-fledged El Niño or La Niña episode these thresholds must be exceeded for a period of at least 5 consecutive months.
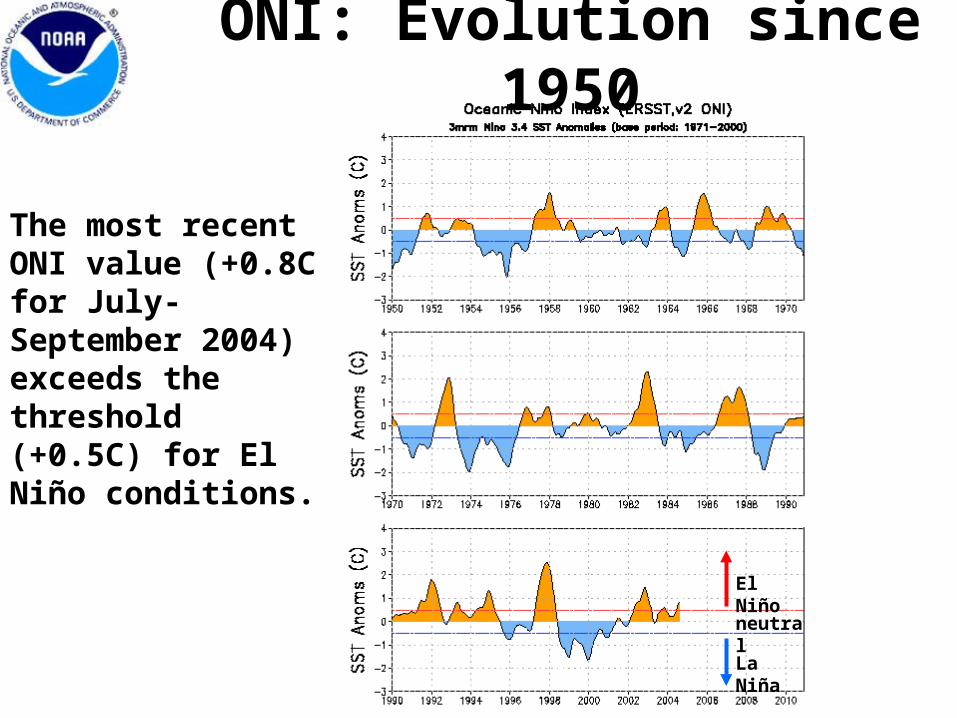
ONI: Evolution since 1950
The most recent ONI value (+0.8C for July-September 2004) exceeds the threshold (+0.5C) for El Niño conditions.
El Niño
La Niña
neutral
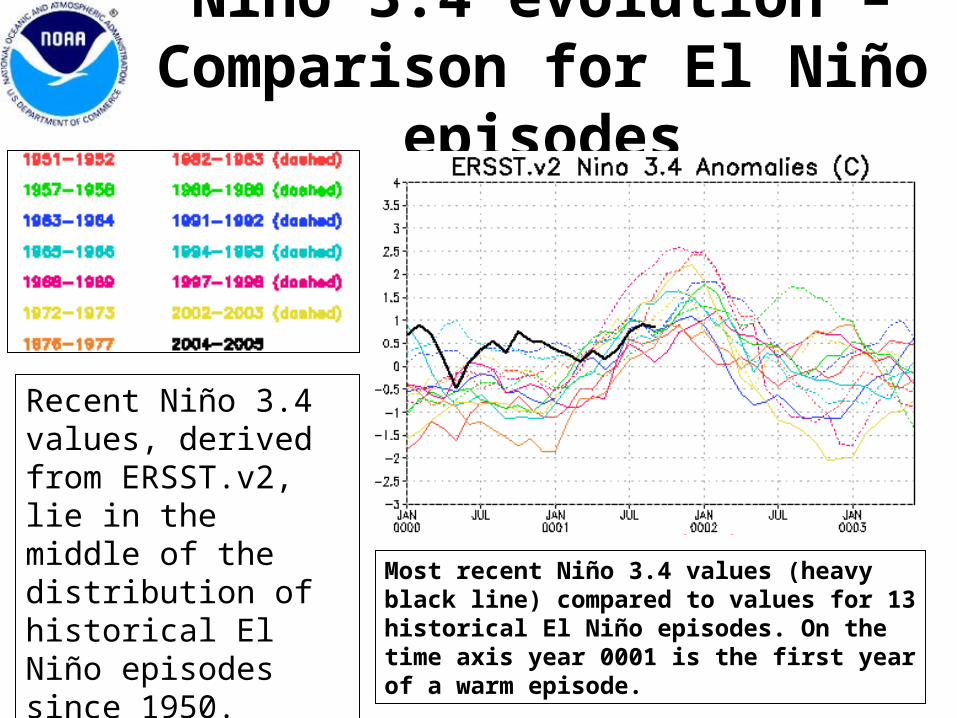
Niño 3.4 evolution – Comparison for El Niño episodes
Most recent Niño 3.4 values (heavy black line) compared to values for 13 historical El Niño episodes. On the time axis year 0001 is the first year of a warm episode.
Recent Niño 3.4 values, derived from ERSST.v2, lie in the middle of the distribution of historical El Niño episodes since 1950.
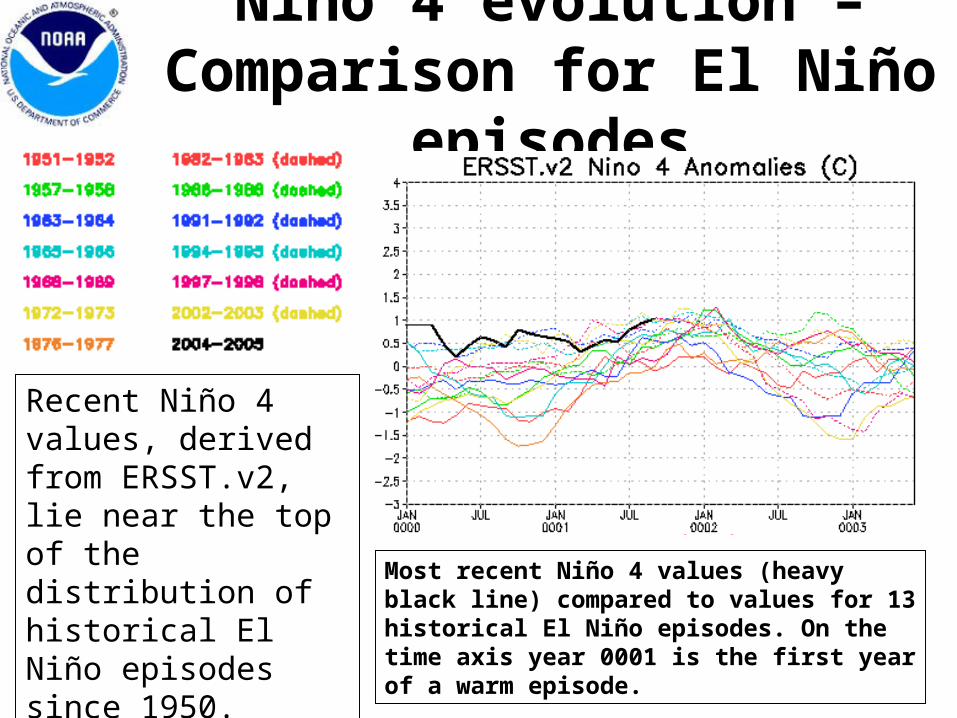
Niño 4 evolution – Comparison
for El Niño episodes
Most recent Niño 4 values (heavy black line) compared to values for 13 historical El Niño episodes. On the time axis year 0001 is the first year of a warm episode.
Recent Niño 4 values, derived from ERSST.v2, lie near the top of the distribution of historical El Niño episodes since 1950.
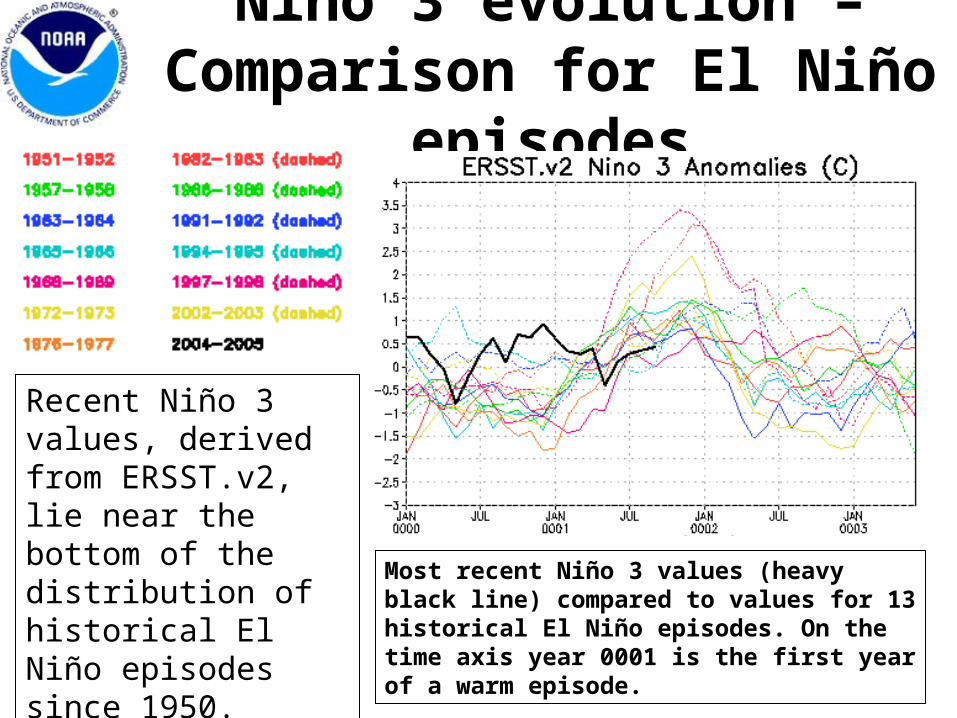
Niño 3 evolution – Comparison
for El Niño episodes
Most recent Niño 3 values (heavy black line) compared to values for 13 historical El Niño episodes. On the time axis year 0001 is the first year of a warm episode.
Recent Niño 3 values, derived from ERSST.v2, lie near the bottom of the distribution of historical El Niño episodes since 1950.
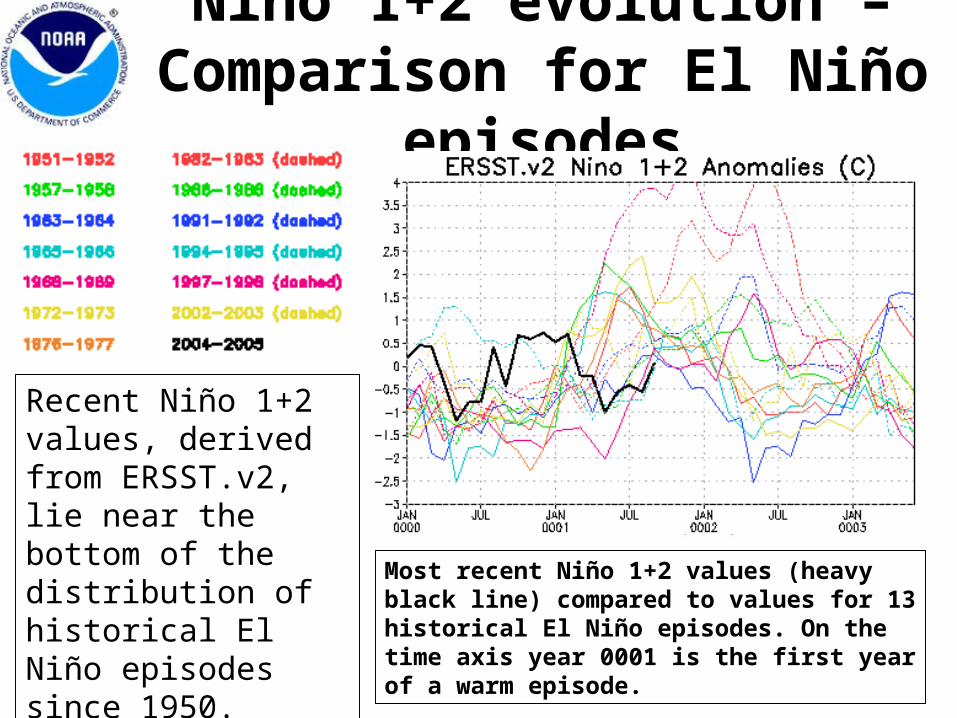
Niño 1+2 evolution – Comparison
for El Niño episodes
Most recent Niño 1+2 values (heavy black line) compared to values for 13 historical El Niño episodes. On the time axis year 0001 is the first year of a warm episode.
Recent Niño 1+2 values, derived from ERSST.v2, lie near the bottom of the distribution of historical El Niño episodes since 1950.
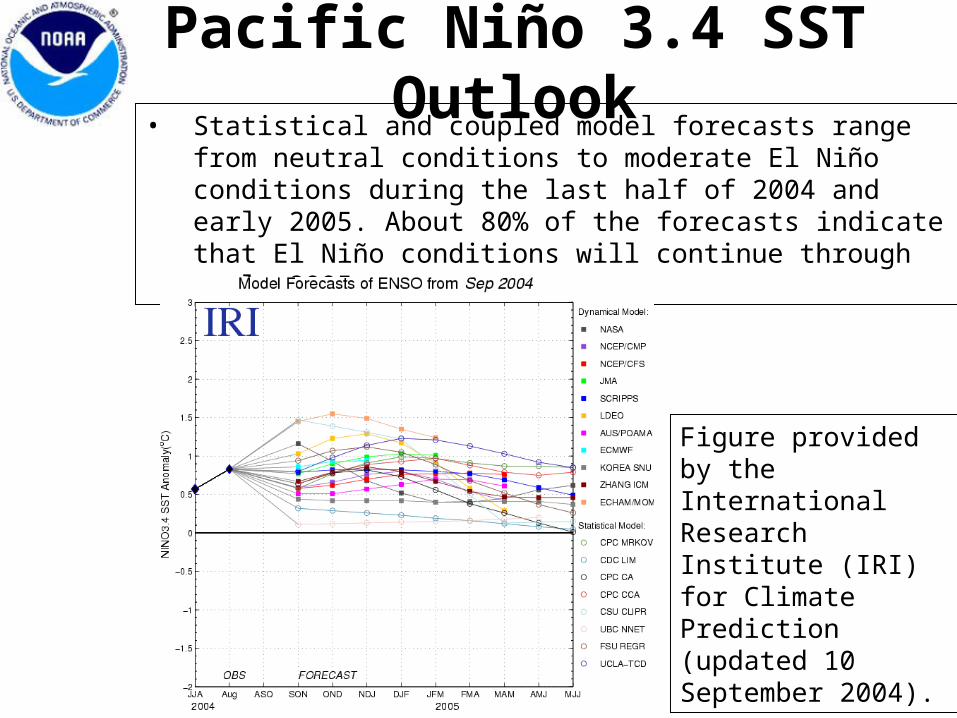
• Statistical and coupled model forecasts range from neutral conditions to moderate El Niño conditions during the last half of 2004 and early 2005. About 80% of the forecasts indicate that El Niño conditions will continue through early 2005.
Pacific Niño 3.4 SST Outlook
Figure provided by the International Research Institute (IRI) for Climate Prediction (updated 10 September 2004).
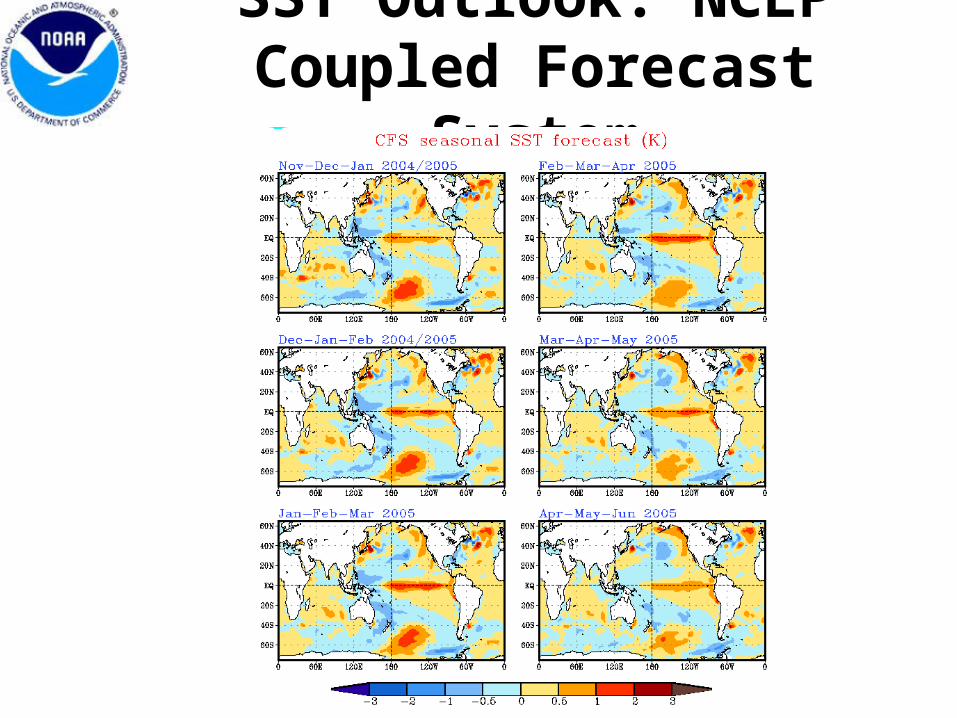
SST Outlook: NCEP Coupled Forecast System
Behind the Forecasts
• Tools– Tropical Pacific SST forecasts (mid-
Pacific, weak-to-moderate warm episode)– ENSO composites based on ONI
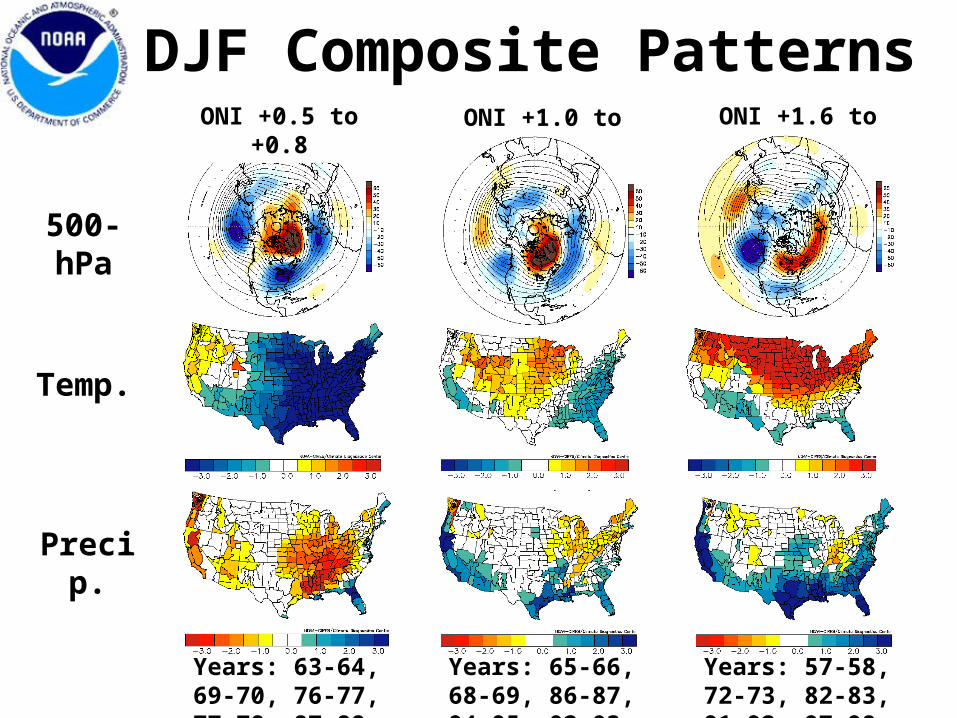
DJF Composite PatternsONI +0.5 to +0.8 ONI +1.0 to +1.3 ONI +1.6 to +2.4
500-hPa
Temp.
Years: 63-64, 69-70, 76-77, 77-78, 87-88
Years: 65-66, 68-69, 86-87, 94-95, 02-03
Years: 57-58, 72-73, 82-83, 91-92, 97-98
Precip.
DJF Composite Patterns• As the ONI increases the U.S. as a whole
becomes increasingly warmer and wetter.
• For DJF 2004-05 the expected ONI lies in the range +0.5 to +1.3.
• For the 10 historical events in this range, 8 featured colder-than-average conditions in the Southeast, 7 featured drier-than-average conditions over portions of the mid-Mississippi, Tennessee and Ohio Valleys and 5 were dry in California and 6 were wet in Florida.
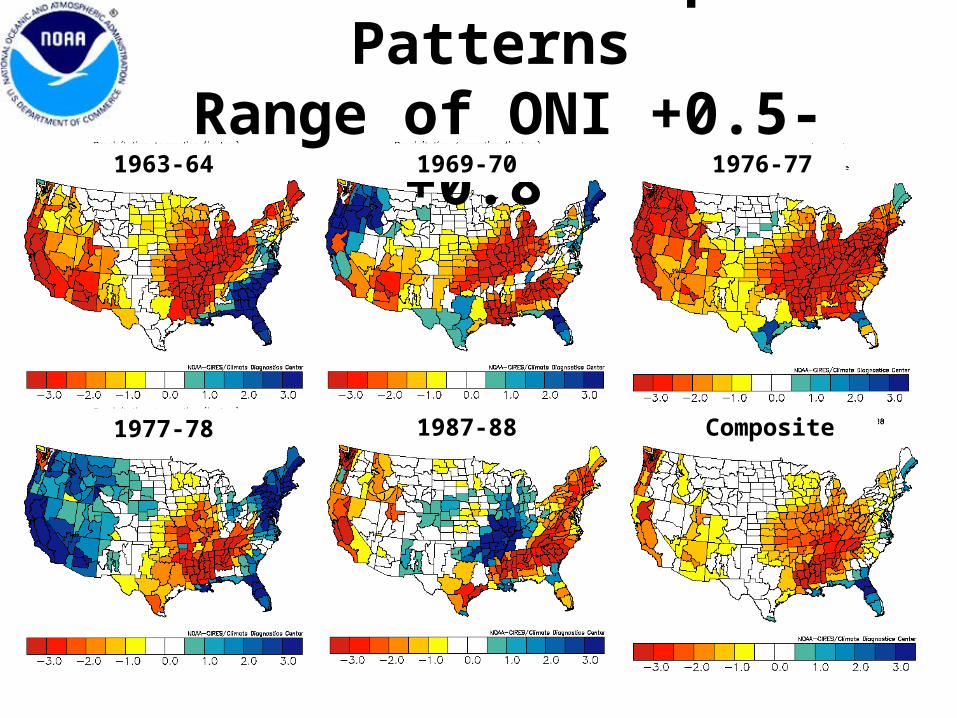
DJF US-Precip Patterns Range of ONI +0.5-+0.8
1963-64 1969-70 1976-77
1977-78 1987-88 Composite
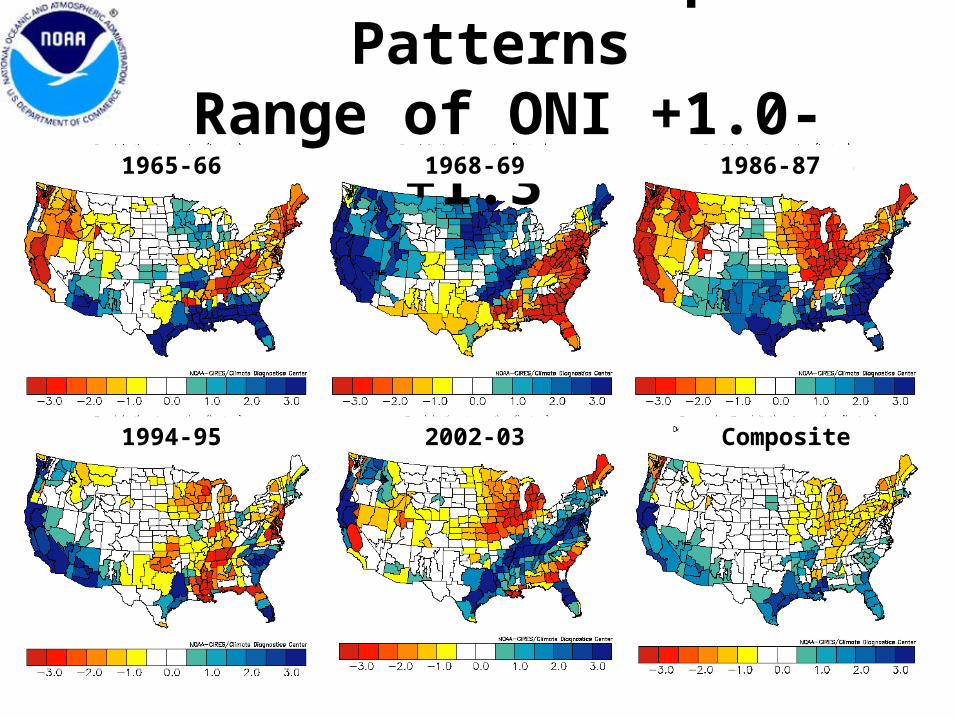
DJF US-Precip Patterns Range of ONI +1.0-+1.3
1965-66 1968-69 1986-87
1994-95 2002-03 Composite
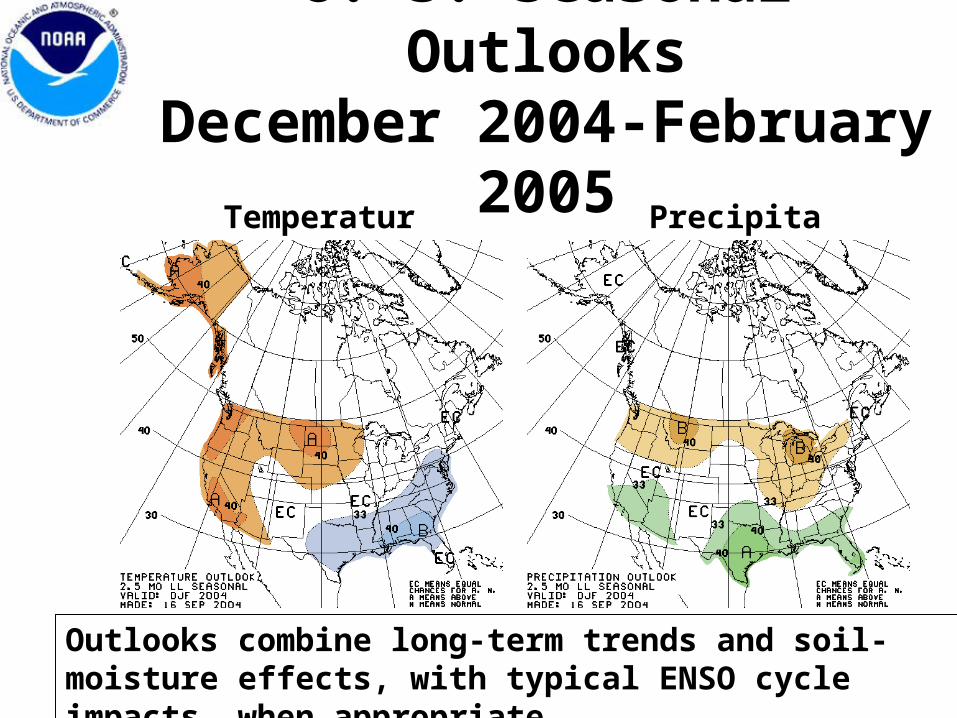
U. S. Seasonal OutlooksDecember 2004-February 2005
Temperature Precipitation
Outlooks combine long-term trends and soil-moisture effects, with typical ENSO cycle impacts, when appropriate.
Summary• Persistent warmth in the central equatorial Pacific and recent expansion of this warmth toward the east indicate that warm episode (El Niño) conditions have developed.
• The most recent value of the ONI is +0.8 (for the period July-September 2004), which satisfies the NOAA operational definition for El Niño. The most recent 5-month running mean value of the Southern Oscillation Index (SOI) is –0.5, which is consistent with the development of warm episode conditions.
• Based on statistical and coupled model forecasts and the recent evolution of oceanic and atmospheric conditions in the tropical Pacific, it seems most likely that SST anomalies in the Niño 3.4 region will remain positive, at or above +0.5°C, through early 2005.
• Expected impacts over the U. S. during this winter include: wetter- and cooler-than-average conditions over Texas, and portions of the Gulf Coast and Southeast, drier-than-average conditions over the Pacific Northwest and the Ohio and Tennessee Valleys, warmer-than-average conditions over most of the West, and over the northern and central Great Plains.