Embed Size (px)
DESCRIPTION
Asset Management Information
Citation preview
Website:
Phone: www.lifetime-reliability.com +61 (0) 402 731 563
Asset Management: Your Best Protection against Production
Failure & Loss!
No longer can administration, marketing, finance and operations be treated as „silos‟ that operate
separate to each other. In reality each affects the others in subtle ways that can either improve overall
corporate performance or degrade it.
To be sure the influenced of each on the others, and on the whole organisation, is productive, positive
and profit-boosting learn to apply Enterprise Asset Management and build the right procedures,
principles and philosophies into your business.
CONTENTS
1. A System to Solve Production and Maintenance Worries
2. Supply Chain Management for Maximum Performance
3. Identifying True Downtime Costs So You Can Rid Yourself of Them
4. Equipment Profit Contribution
5. Operations and Maintenance Defect Elimination and Failure Prevention
6. Low Cost Preventative and Predictive Maintenance
7. A New Technique Controls Accuracy and Stops Failure
8. A Japanese Equipment Criticality Method to Manage Risk
9. The Incredible Power of Visual Management
10. 5 Ways to Miss-Out on World-Class Operating Performance
11. Optimising Whole of Life Profitability
12. Standard Costs Improve Results in 30 Minutes
13. Workplace Failure and Defect Elimination
Website:
Phone: www.lifetime-reliability.com +61 (0) 402 731 563
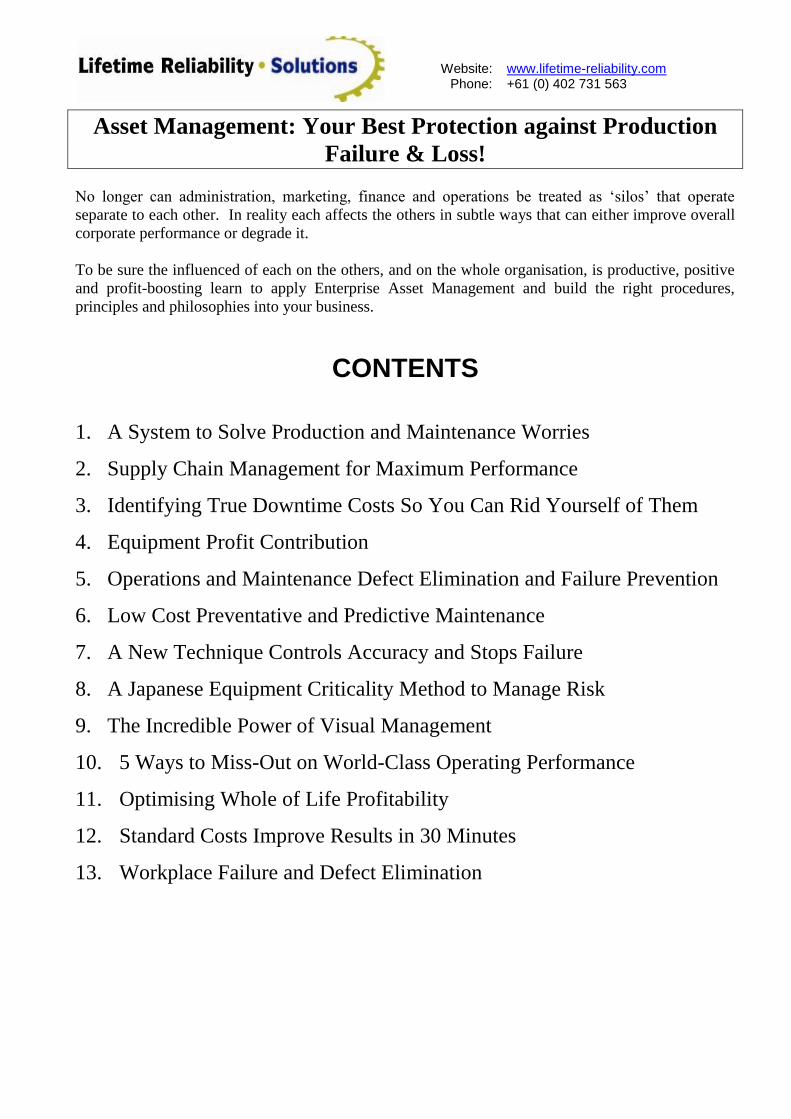
1. A System to Solve Production and Maintenance Worries
Investigate the details and specific operations‟ solutions „hidden‟ in the new international standard
PAS55: Asset Management. There are many techniques and methods available for users to integrate
asset management into their day to day activities. Each clause will be explained in enough detail for
you to understand how it can be applied to rapidly improve interactions and performance in your
operation.
Website:
Phone: www.lifetime-reliability.com +61 (0) 402 731 563
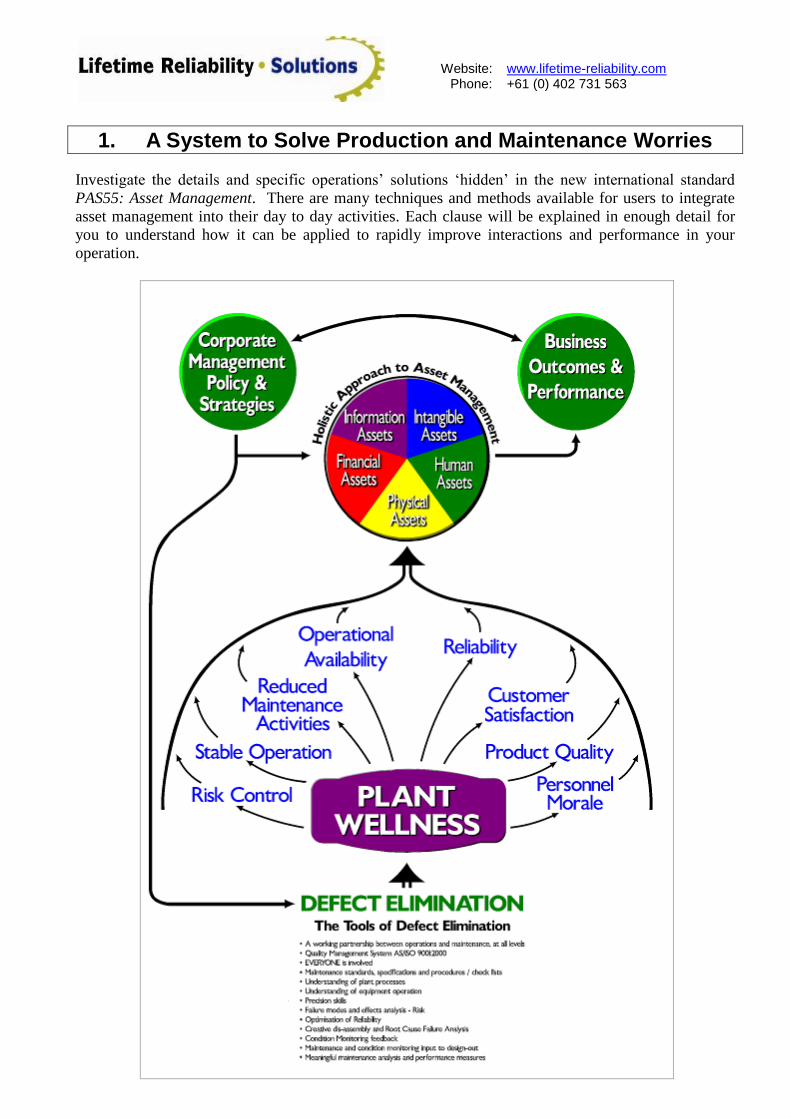
PAS55 – Asset Management Specification
Website:
Phone: www.lifetime-reliability.com +61 (0) 402 731 563
Website:
Phone: www.lifetime-reliability.com +61 (0) 402 731 563
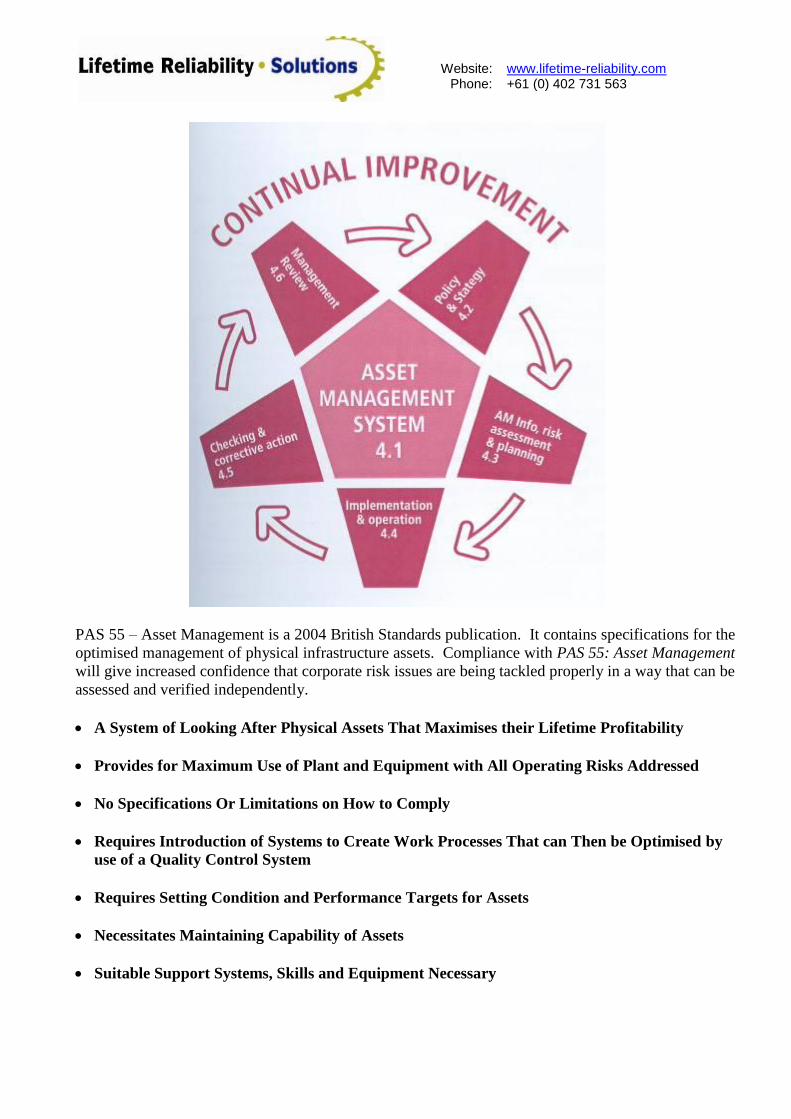
PAS 55 – Asset Management is a 2004 British Standards publication. It contains specifications for the
optimised management of physical infrastructure assets. Compliance with PAS 55: Asset Management
will give increased confidence that corporate risk issues are being tackled properly in a way that can be
assessed and verified independently.
A System of Looking After Physical Assets That Maximises their Lifetime Profitability
Provides for Maximum Use of Plant and Equipment with All Operating Risks Addressed
No Specifications Or Limitations on How to Comply
Requires Introduction of Systems to Create Work Processes That can Then be Optimised by
use of a Quality Control System
Requires Setting Condition and Performance Targets for Assets
Necessitates Maintaining Capability of Assets
Suitable Support Systems, Skills and Equipment Necessary
Website:
Phone: www.lifetime-reliability.com +61 (0) 402 731 563
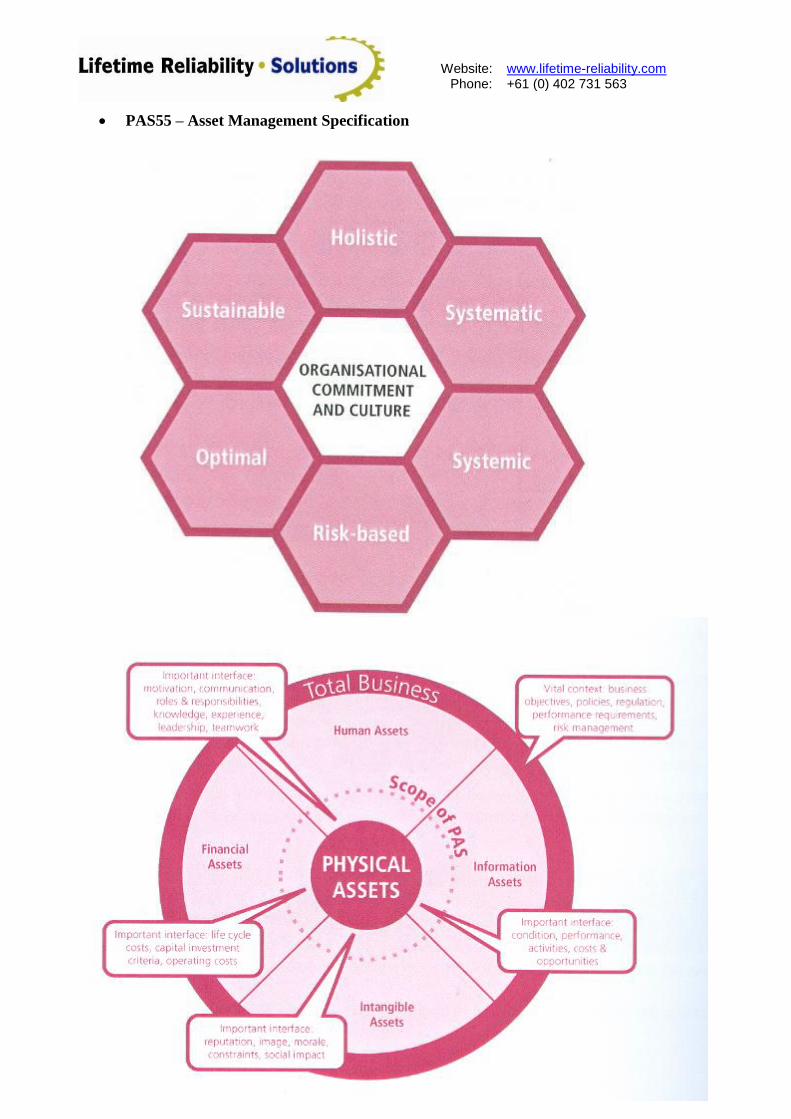
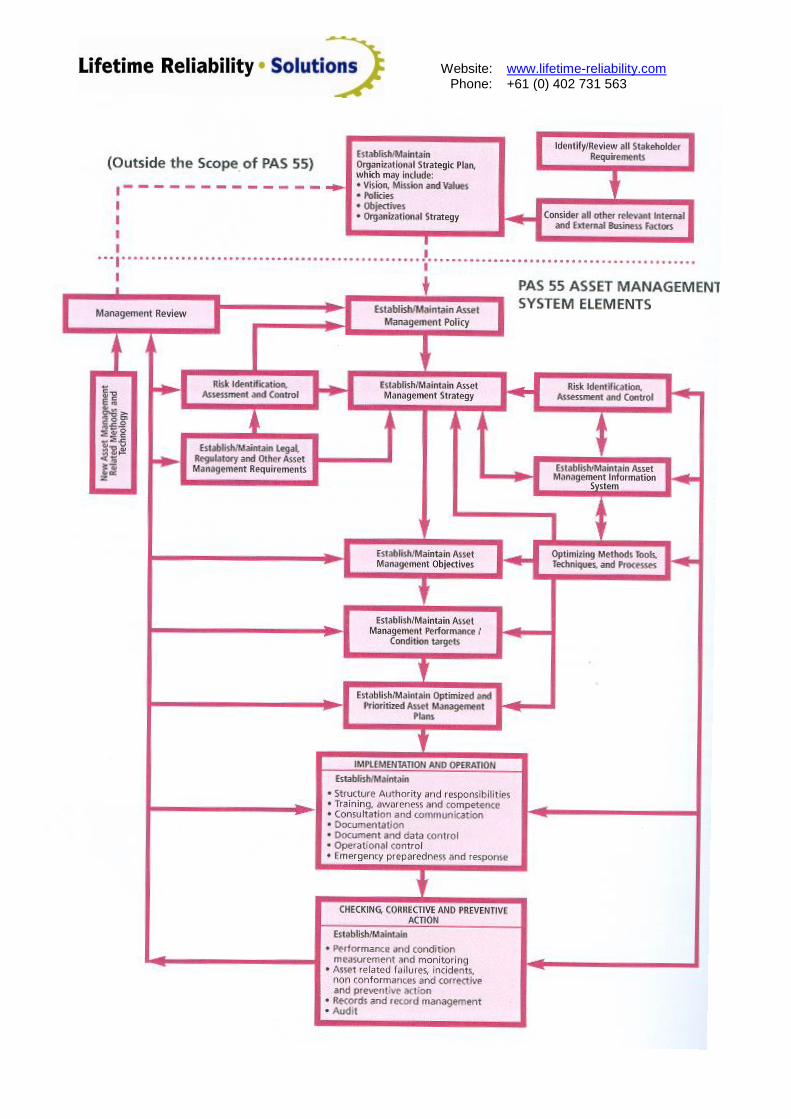
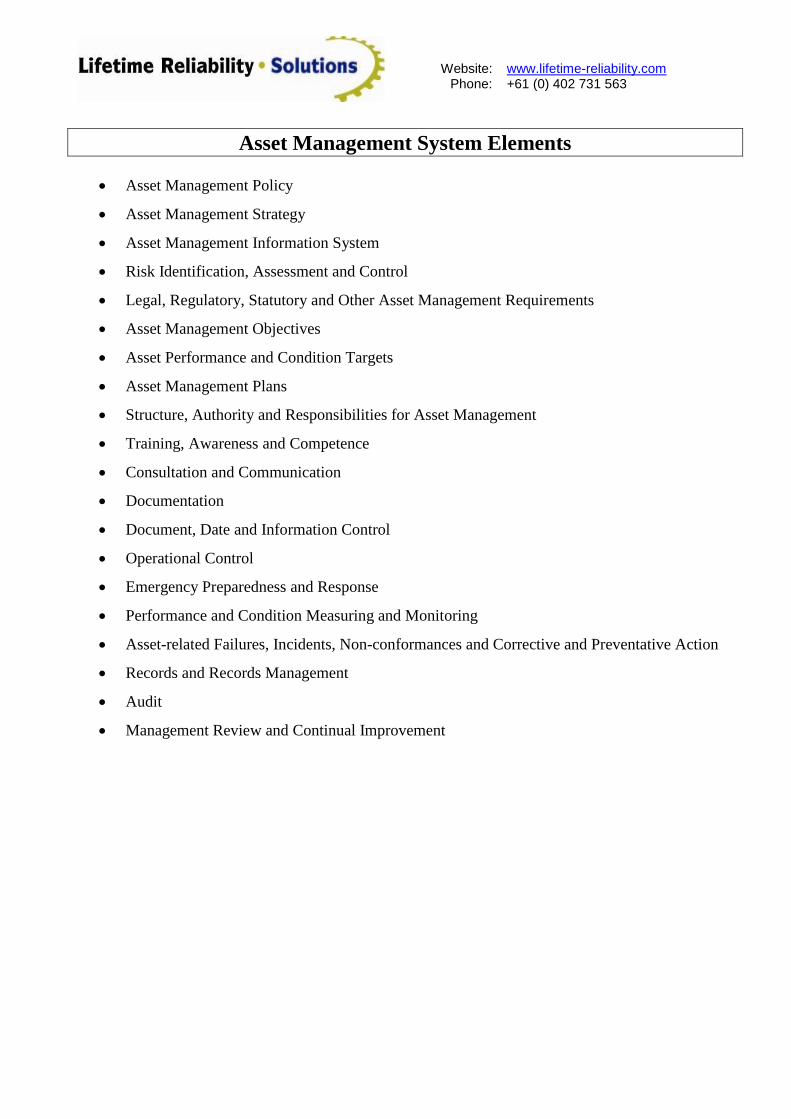
Asset Management System Elements
Asset Management Policy
Asset Management Strategy
Asset Management Information System
Risk Identification, Assessment and Control
Legal, Regulatory, Statutory and Other Asset Management Requirements
Asset Management Objectives
Asset Performance and Condition Targets
Asset Management Plans
Structure, Authority and Responsibilities for Asset Management
Training, Awareness and Competence
Consultation and Communication
Documentation
Document, Date and Information Control
Operational Control
Emergency Preparedness and Response
Performance and Condition Measuring and Monitoring
Asset-related Failures, Incidents, Non-conformances and Corrective and Preventative Action
Records and Records Management
Audit
Management Review and Continual Improvement
Website:
Phone: www.lifetime-reliability.com +61 (0) 402 731 563
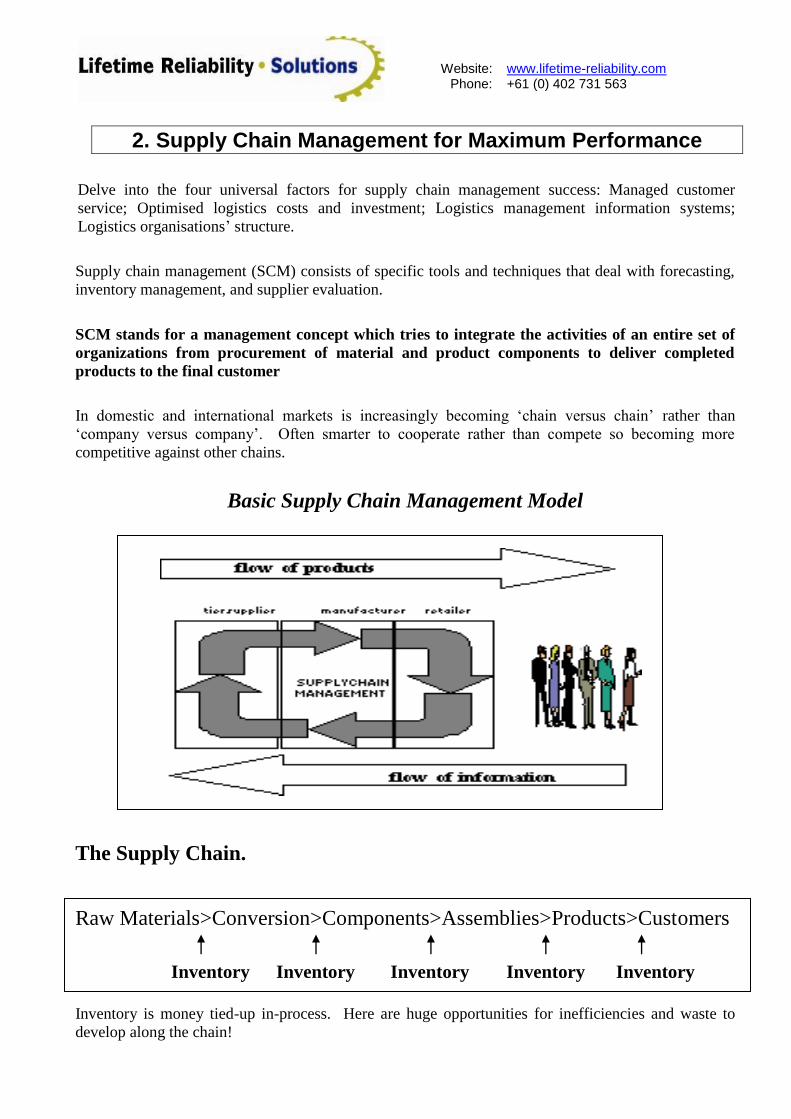
2. Supply Chain Management for Maximum Performance
Delve into the four universal factors for supply chain management success: Managed customer
service; Optimised logistics costs and investment; Logistics management information systems;
Logistics organisations‟ structure.
Supply chain management (SCM) consists of specific tools and techniques that deal with forecasting,
inventory management, and supplier evaluation.
SCM stands for a management concept which tries to integrate the activities of an entire set of
organizations from procurement of material and product components to deliver completed
products to the final customer
In domestic and international markets is increasingly becoming „chain versus chain‟ rather than
„company versus company‟. Often smarter to cooperate rather than compete so becoming more
competitive against other chains.
Basic Supply Chain Management Model
The Supply Chain.
Raw Materials>Conversion>Components>Assemblies>Products>Customers
Inventory Inventory Inventory Inventory Inventory
Inventory is money tied-up in-process. Here are huge opportunities for inefficiencies and waste to
develop along the chain!
Website:
Phone: www.lifetime-reliability.com +61 (0) 402 731 563
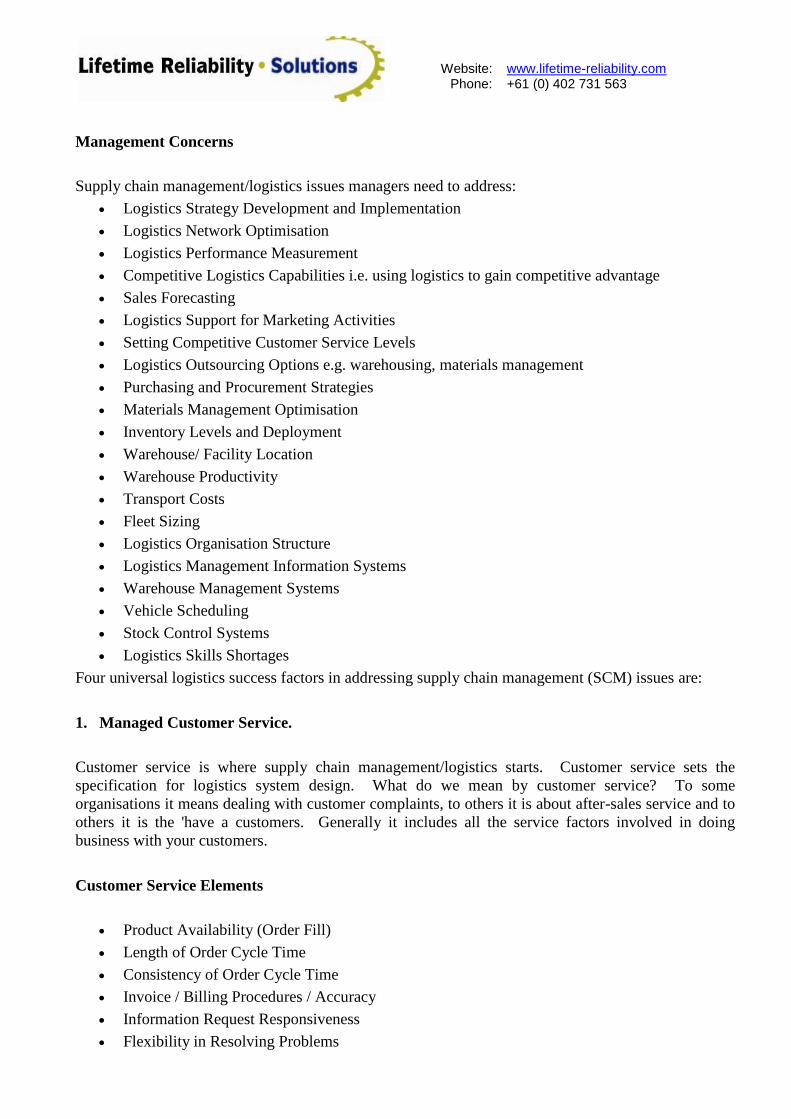
Management Concerns
Supply chain management/logistics issues managers need to address:
Logistics Strategy Development and Implementation
Logistics Network Optimisation
Logistics Performance Measurement
Competitive Logistics Capabilities i.e. using logistics to gain competitive advantage
Sales Forecasting
Logistics Support for Marketing Activities
Setting Competitive Customer Service Levels
Logistics Outsourcing Options e.g. warehousing, materials management
Purchasing and Procurement Strategies
Materials Management Optimisation
Inventory Levels and Deployment
Warehouse/ Facility Location
Warehouse Productivity
Transport Costs
Fleet Sizing
Logistics Organisation Structure
Logistics Management Information Systems
Warehouse Management Systems
Vehicle Scheduling
Stock Control Systems
Logistics Skills Shortages
Four universal logistics success factors in addressing supply chain management (SCM) issues are:
1. Managed Customer Service.
Customer service is where supply chain management/logistics starts. Customer service sets the
specification for logistics system design. What do we mean by customer service? To some
organisations it means dealing with customer complaints, to others it is about after-sales service and to
others it is the 'have a customers. Generally it includes all the service factors involved in doing
business with your customers.
Customer Service Elements
Product Availability (Order Fill)
Length of Order Cycle Time
Consistency of Order Cycle Time
Invoice / Billing Procedures / Accuracy
Information Request Responsiveness
Flexibility in Resolving Problems
Website:
Phone: www.lifetime-reliability.com +61 (0) 402 731 563
Distance to Suppliers Warehouse
Special Customer Requests
Frequency of Damaged Goods
Quality of Order Department
Emergency Coverage
On-time Delivery
If you surveyed your customers about how they rank the reasons they do business with you, you might
be surprised to find customer service coming second only to product quality and usually more
important than price. Customer service is very important factor in your customer's decision to do
business with you.
If you asked your customers to rank the customer service elements above, in order of importance to
them, the results might also be interesting. For example, it is quite common to find companies
incurring significant costs to provide a speedy response to customers. Surveys often indicate that speed
is not the issue, but consistency of order cycle time is. Customers can plan knowing that you will
consistently deliver say 10 days after receipt of order. That is more important to them than some times
getting it in 24 hours and at other times 72 hours.
If you also asked your customers to rate your performance in relation to the customer service elements,
and also the performance of your leading competitor or competitors, you would be able to identify
those elements where you are strong (and weak) and your competitors‟ strengths (and weaknesses).
Then you can start to develop strategies which deliver the level of service your customers actually
want and exploit your strengths and your competitors‟ weaknesses.
In this way, your customer service strategy can become part of your marketing mix. You will be
developing a market driven customer service strategy.
Once you have done this, you can design the logistics system necessary to deliver the required level of
service. This is what we mean when we say customer service sets the specification for logistics system
design.
For example, if order fill rates are important to your customers, then you can plan inventory policies to
satisfy this requirement.
If a fast response time to orders is critical, then you can plan your inventory levels, warehouse
locations, modes of transport etc to deliver the required level of service.
2. Optimised Logistics Costs and Investment.
Having developed the specification for the logistics system, the second universal logistics success
factor is optimising logistics costs and investment.
An analysis of the typical profit and loss statement for a company will show logistics related costs
accounting for 20 - 25% of the cost of sales when you take into account transport, warehousing, stock
holding, systems, materials and people. In the typical balance sheet logistics will probably account for
Website:
Phone: www.lifetime-reliability.com +61 (0) 402 731 563
35 - 40% of the assets when you include inventory, investment in warehousing, transport and handling
equipment, and production capacity.
With these sorts of figures, optimising logistics costs and investment is a major opportunity for
improving the bottom line. Add to this the potential impact on competitive advantage of the
development of a market-driven customer service strategy, then logistics is a must for management
attention.
Deciding on the number, location and size of distribution centres and warehouses - Deciding the
location and mission of manufacturing facilities i.e. what manufacturing locations should make what
products and service what markets. Developing a cost effective logistics operating strategy e.g.
inventory deployment, intra company and customer transport, size and number of vehicles, Cost
savings in freight, warehousing, inventory levels, materials handling, order processing etc.
3. Logistics Management Information Systems.
Supply chain management or logistics is about managing the flow of the right materials through an
organisation and the flow of information to facilitate the flow of the right materials. The sort of
decisions referred to above cannot be made without having the appropriate information.
Designing and implementing information systems to support the logistics network is critical. These
systems will include order-processing, warehouse management, inventory and materials management,
procurement as well as various logistics planning tools.
4. Manage Logistics Organisation Structure.
The traditional approach to managing a company was to take each functional area in isolation. So, if
you were the production manager you managed your function to achieve your objective which was
probably achieving the lowest unit cost of production. You did this by producing long runs of the same
product. This invariably meant you built up stocks of each product with resulting inventory carrying
costs and loss of customer service.
If you were the transport manager you would optimise your function by achieving the lowest transport
cost. This might mean using the cheapest mode of transport and inevitably this would be at the cost of
service levels.
The procurement manager would buy the cheapest which would usually mean buying large quantities
which would impact investment in inventory and the potential risk of damage or obsolete materials.
Etc.
The principle of supply chain management is that the flow of materials of materials needs to be
managed as a whole. This means that you can make the right trade-offs and avoid the problems
described above.
To achieve this you need to have an organisation structure to facilitate it. This involves having all
logistics related functions under the same management control.
Website:
Phone: www.lifetime-reliability.com +61 (0) 402 731 563
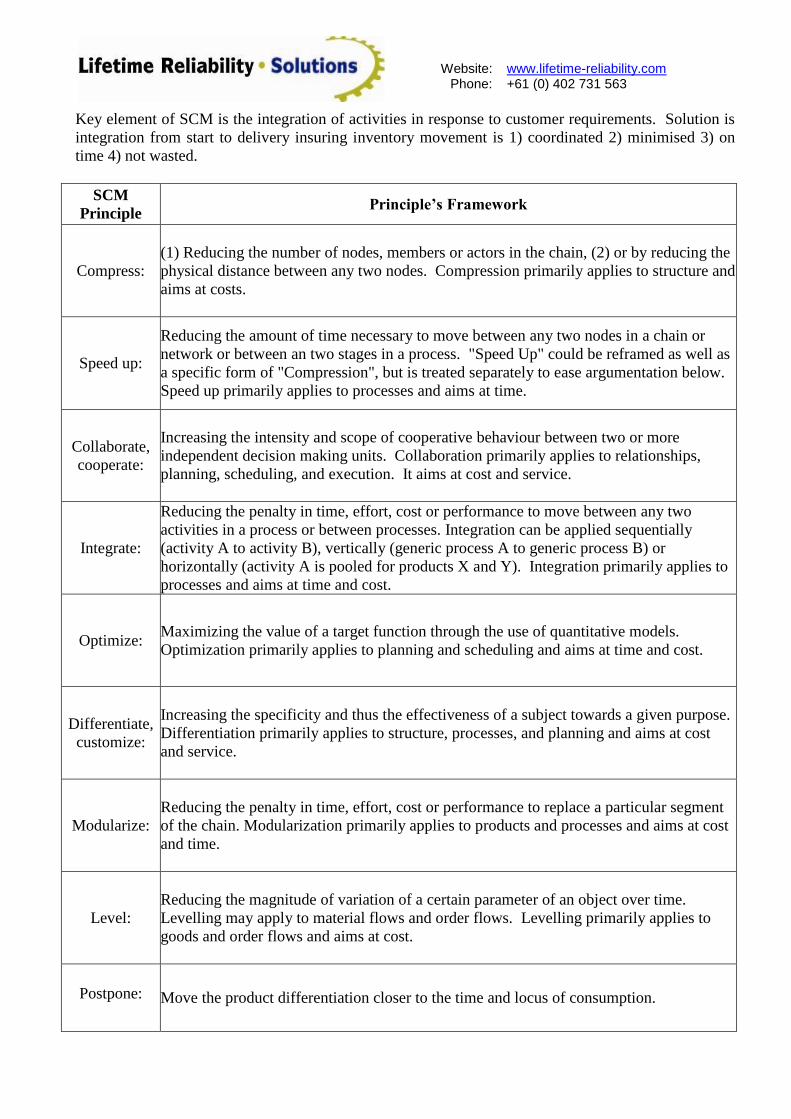
Key element of SCM is the integration of activities in response to customer requirements. Solution is
integration from start to delivery insuring inventory movement is 1) coordinated 2) minimised 3) on
time 4) not wasted.
SCM
Principle Principle’s Framework
Compress:
(1) Reducing the number of nodes, members or actors in the chain, (2) or by reducing the
physical distance between any two nodes. Compression primarily applies to structure and
aims at costs.
Speed up:
Reducing the amount of time necessary to move between any two nodes in a chain or
network or between an two stages in a process. "Speed Up" could be reframed as well as
a specific form of "Compression", but is treated separately to ease argumentation below.
Speed up primarily applies to processes and aims at time.
Collaborate,
cooperate:
Increasing the intensity and scope of cooperative behaviour between two or more
independent decision making units. Collaboration primarily applies to relationships,
planning, scheduling, and execution. It aims at cost and service.
Integrate:
Reducing the penalty in time, effort, cost or performance to move between any two
activities in a process or between processes. Integration can be applied sequentially
(activity A to activity B), vertically (generic process A to generic process B) or
horizontally (activity A is pooled for products X and Y). Integration primarily applies to
processes and aims at time and cost.
Optimize: Maximizing the value of a target function through the use of quantitative models.
Optimization primarily applies to planning and scheduling and aims at time and cost.
Differentiate,
customize:
Increasing the specificity and thus the effectiveness of a subject towards a given purpose.
Differentiation primarily applies to structure, processes, and planning and aims at cost
and service.
Modularize:
Reducing the penalty in time, effort, cost or performance to replace a particular segment
of the chain. Modularization primarily applies to products and processes and aims at cost
and time.
Level:
Reducing the magnitude of variation of a certain parameter of an object over time.
Levelling may apply to material flows and order flows. Levelling primarily applies to
goods and order flows and aims at cost.
Postpone: Move the product differentiation closer to the time and locus of consumption.
Website:
Phone: www.lifetime-reliability.com +61 (0) 402 731 563
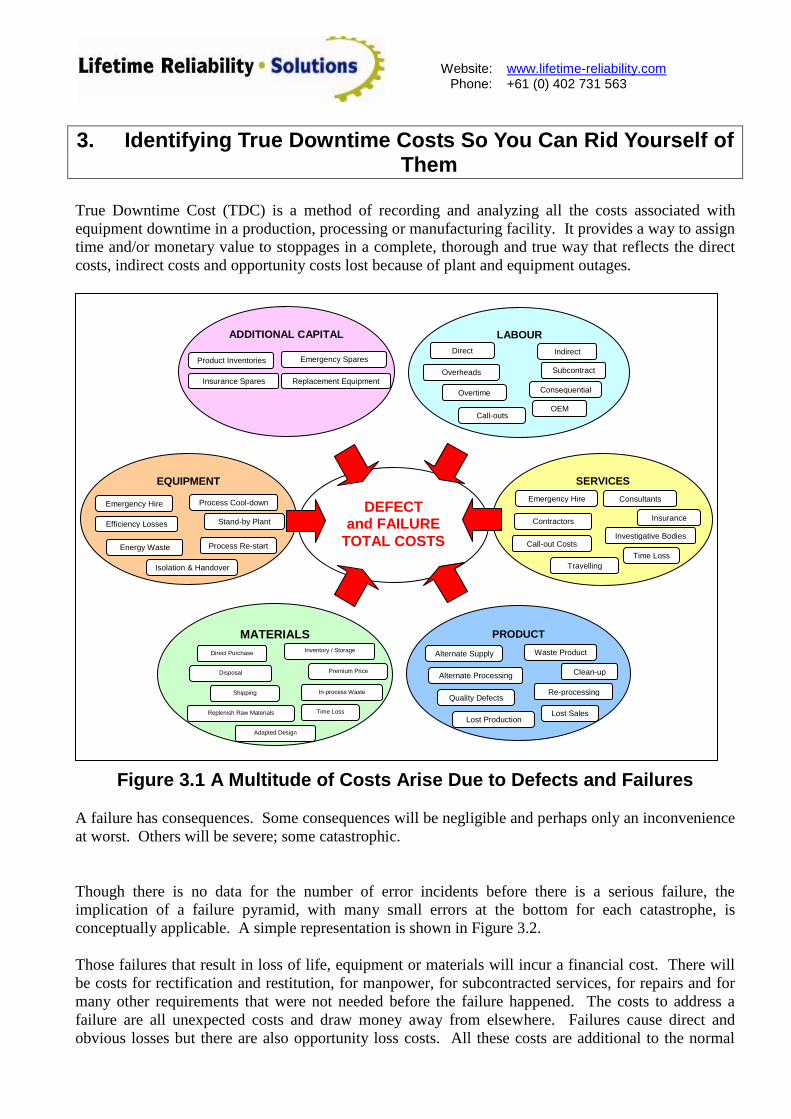
3. Identifying True Downtime Costs So You Can Rid Yourself of Them
True Downtime Cost (TDC) is a method of recording and analyzing all the costs associated with
equipment downtime in a production, processing or manufacturing facility. It provides a way to assign
time and/or monetary value to stoppages in a complete, thorough and true way that reflects the direct
costs, indirect costs and opportunity costs lost because of plant and equipment outages.
Figure 3.1 A Multitude of Costs Arise Due to Defects and Failures
A failure has consequences. Some consequences will be negligible and perhaps only an inconvenience
at worst. Others will be severe; some catastrophic.
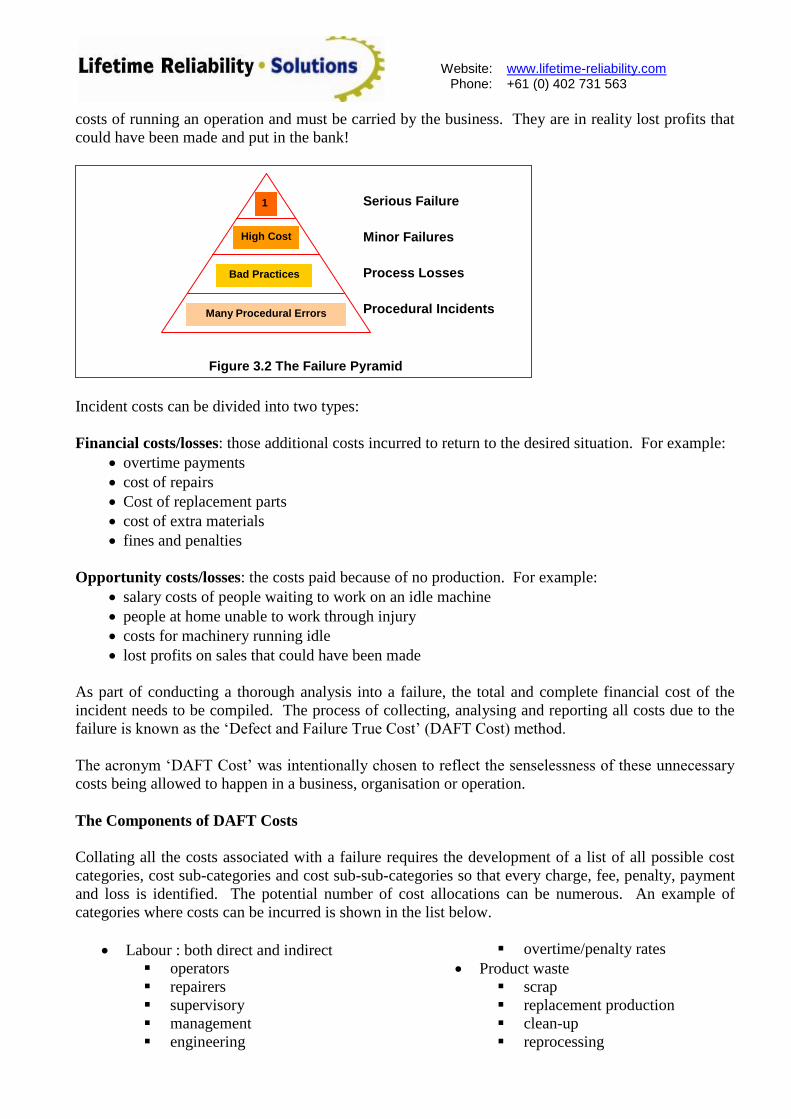
Though there is no data for the number of error incidents before there is a serious failure, the
implication of a failure pyramid, with many small errors at the bottom for each catastrophe, is
conceptually applicable. A simple representation is shown in Figure 3.2.
Those failures that result in loss of life, equipment or materials will incur a financial cost. There will
be costs for rectification and restitution, for manpower, for subcontracted services, for repairs and for
many other requirements that were not needed before the failure happened. The costs to address a
failure are all unexpected costs and draw money away from elsewhere. Failures cause direct and
obvious losses but there are also opportunity loss costs. All these costs are additional to the normal
EQUIPMENT
Process Re-start
Stand-by Plant Efficiency Losses
Process Cool-down Emergency Hire
Energy Waste
Isolation & Handover
SERVICES
Call-out Costs
Travelling
Time Loss
Investigative Bodies
Insurance Contractors
Consultants Emergency Hire
DEFECT and FAILURE
TOTAL COSTS
ADDITIONAL CAPITAL
Replacement Equipment Insurance Spares
Emergency Spares Product Inventories
LABOUR
Overtime
Call-outs OEM
Consequential
Subcontract Overheads
Indirect Direct
MATERIALS
Shipping
Adapted Design Time Loss In-process Waste
Premium Price Disposal
Inventory / Storage Direct Purchase
Replenish Raw Materials
PRODUCT
Quality Defects
Lost Production Lost Sales
Re-processing
Clean-up Alternate Processing
Waste Product Alternate Supply
Website:
Phone: www.lifetime-reliability.com +61 (0) 402 731 563
costs of running an operation and must be carried by the business. They are in reality lost profits that
could have been made and put in the bank!
Incident costs can be divided into two types:
Financial costs/losses: those additional costs incurred to return to the desired situation. For example:
overtime payments
cost of repairs
Cost of replacement parts
cost of extra materials
fines and penalties
Opportunity costs/losses: the costs paid because of no production. For example:
salary costs of people waiting to work on an idle machine
people at home unable to work through injury
costs for machinery running idle
lost profits on sales that could have been made
As part of conducting a thorough analysis into a failure, the total and complete financial cost of the
incident needs to be compiled. The process of collecting, analysing and reporting all costs due to the
failure is known as the „Defect and Failure True Cost‟ (DAFT Cost) method.
The acronym „DAFT Cost‟ was intentionally chosen to reflect the senselessness of these unnecessary
costs being allowed to happen in a business, organisation or operation.
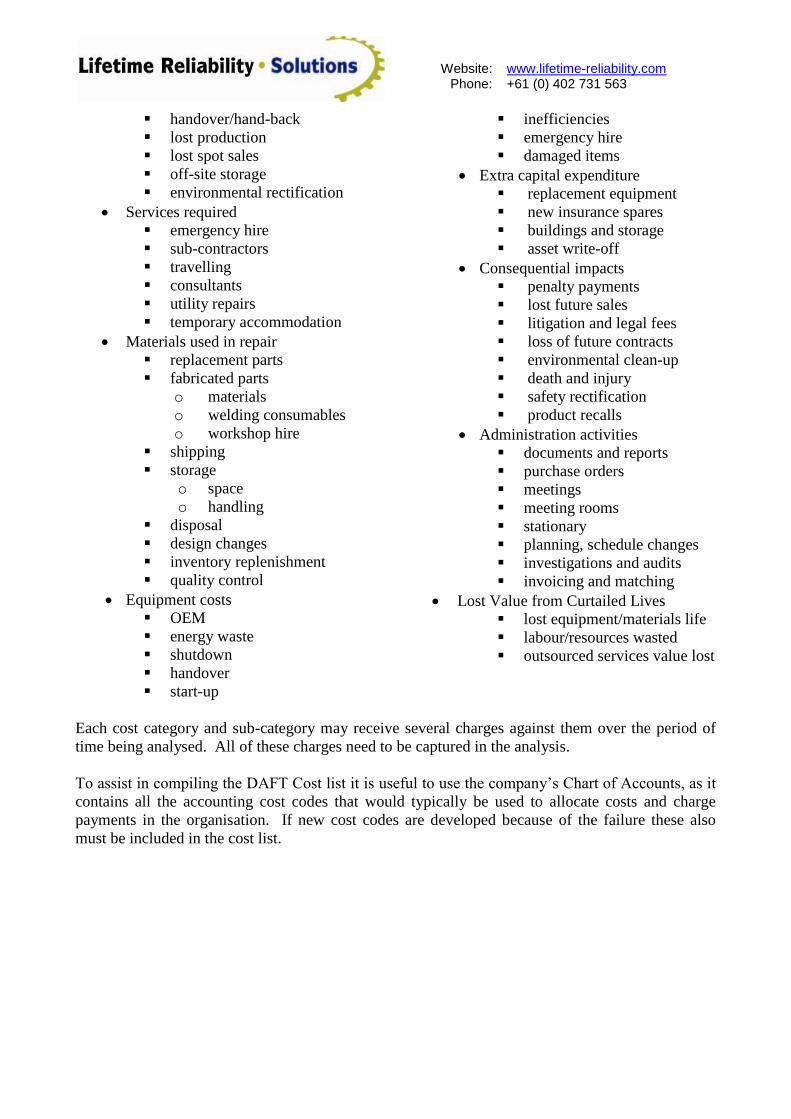
The Components of DAFT Costs
Collating all the costs associated with a failure requires the development of a list of all possible cost
categories, cost sub-categories and cost sub-sub-categories so that every charge, fee, penalty, payment
and loss is identified. The potential number of cost allocations can be numerous. An example of
categories where costs can be incurred is shown in the list below.
Labour : both direct and indirect
operators
repairers
supervisory
management
engineering
overtime/penalty rates
Product waste
scrap
replacement production
clean-up
reprocessing
1
High Cost
Bad Practices
Many Procedural Errors
Figure 3.2 The Failure Pyramid
Process Losses
Minor Failures
Serious Failure
Procedural Incidents
Website:
Phone: www.lifetime-reliability.com +61 (0) 402 731 563
handover/hand-back
lost production
lost spot sales
off-site storage
environmental rectification
Services required
emergency hire
sub-contractors
travelling
consultants
utility repairs
temporary accommodation
Materials used in repair
replacement parts
fabricated parts
o materials
o welding consumables
o workshop hire
shipping
storage
o space
o handling
disposal
design changes
inventory replenishment
quality control
Equipment costs
OEM
energy waste
shutdown
handover
start-up
inefficiencies
emergency hire
damaged items
Extra capital expenditure
replacement equipment
new insurance spares
buildings and storage
asset write-off
Consequential impacts
penalty payments
lost future sales
litigation and legal fees
loss of future contracts
environmental clean-up
death and injury
safety rectification
product recalls
Administration activities
documents and reports
purchase orders
meetings
meeting rooms
stationary
planning, schedule changes
investigations and audits
invoicing and matching
Lost Value from Curtailed Lives
lost equipment/materials life
labour/resources wasted
outsourced services value lost
Each cost category and sub-category may receive several charges against them over the period of
time being analysed. All of these charges need to be captured in the analysis.
To assist in compiling the DAFT Cost list it is useful to use the company‟s Chart of Accounts, as it
contains all the accounting cost codes that would typically be used to allocate costs and charge
payments in the organisation. If new cost codes are developed because of the failure these also
must be included in the cost list.
Website:
Phone: www.lifetime-reliability.com +61 (0) 402 731 563
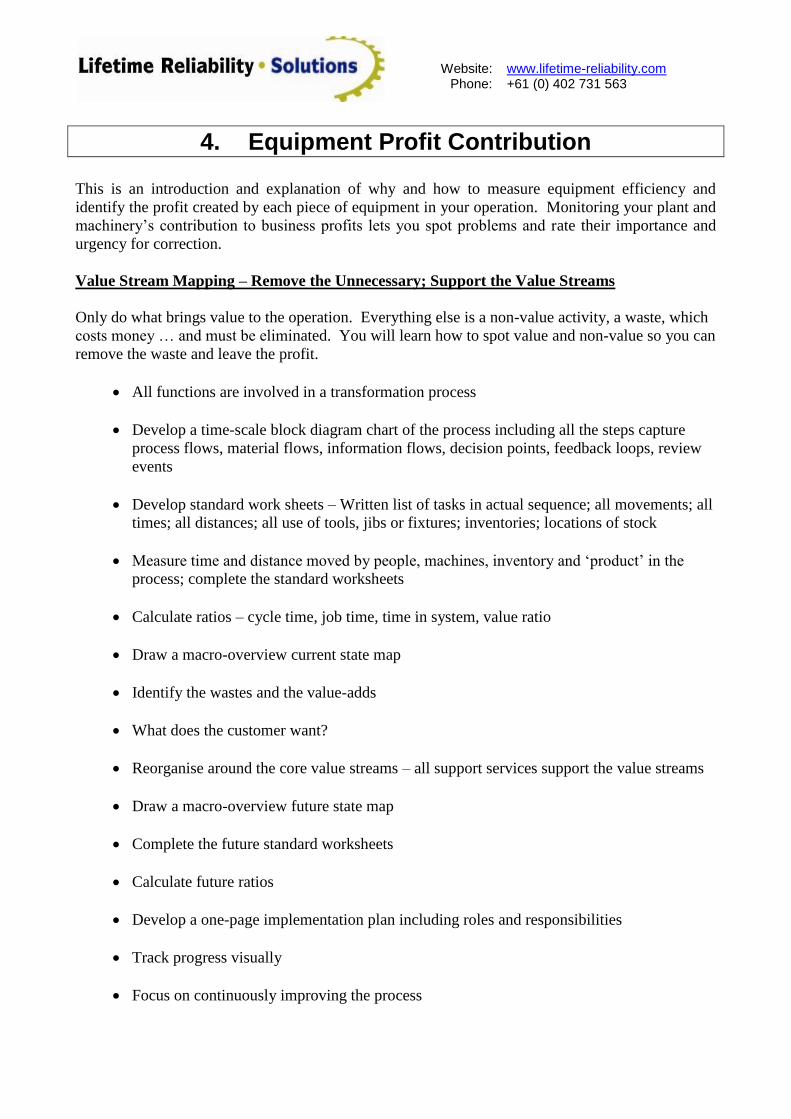
4. Equipment Profit Contribution
This is an introduction and explanation of why and how to measure equipment efficiency and
identify the profit created by each piece of equipment in your operation. Monitoring your plant and
machinery‟s contribution to business profits lets you spot problems and rate their importance and
urgency for correction.
Value Stream Mapping – Remove the Unnecessary; Support the Value Streams
Only do what brings value to the operation. Everything else is a non-value activity, a waste, which
costs money … and must be eliminated. You will learn how to spot value and non-value so you can
remove the waste and leave the profit.
All functions are involved in a transformation process
Develop a time-scale block diagram chart of the process including all the steps capture
process flows, material flows, information flows, decision points, feedback loops, review
events
Develop standard work sheets – Written list of tasks in actual sequence; all movements; all
times; all distances; all use of tools, jibs or fixtures; inventories; locations of stock
Measure time and distance moved by people, machines, inventory and „product‟ in the
process; complete the standard worksheets
Calculate ratios – cycle time, job time, time in system, value ratio
Draw a macro-overview current state map
Identify the wastes and the value-adds
What does the customer want?
Reorganise around the core value streams – all support services support the value streams
Draw a macro-overview future state map
Complete the future standard worksheets
Calculate future ratios
Develop a one-page implementation plan including roles and responsibilities
Track progress visually
Focus on continuously improving the process
Website:
Phone: www.lifetime-reliability.com +61 (0) 402 731 563
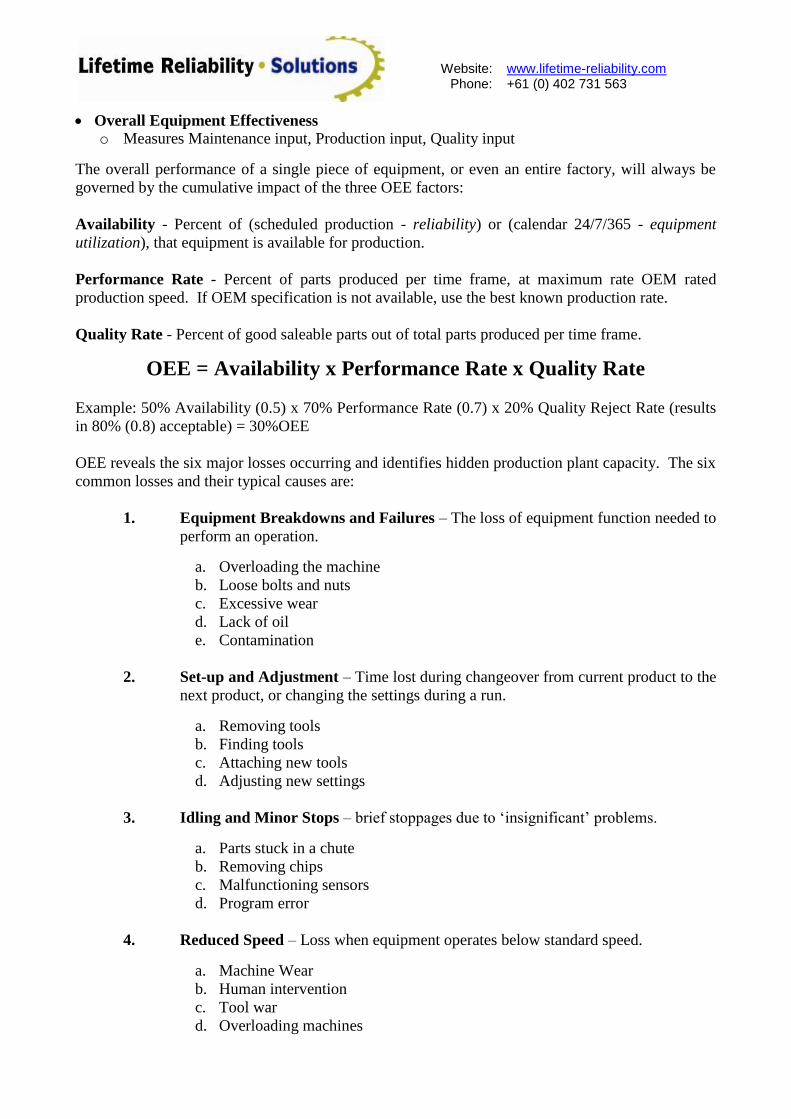
Overall Equipment Effectiveness
o Measures Maintenance input, Production input, Quality input
The overall performance of a single piece of equipment, or even an entire factory, will always be
governed by the cumulative impact of the three OEE factors:
Availability - Percent of (scheduled production - reliability) or (calendar 24/7/365 - equipment
utilization), that equipment is available for production.
Performance Rate - Percent of parts produced per time frame, at maximum rate OEM rated
production speed. If OEM specification is not available, use the best known production rate.
Quality Rate - Percent of good saleable parts out of total parts produced per time frame.
OEE = Availability x Performance Rate x Quality Rate
Example: 50% Availability (0.5) x 70% Performance Rate (0.7) x 20% Quality Reject Rate (results
in 80% (0.8) acceptable) = 30%OEE
OEE reveals the six major losses occurring and identifies hidden production plant capacity. The six
common losses and their typical causes are:
1. Equipment Breakdowns and Failures – The loss of equipment function needed to
perform an operation.
a. Overloading the machine
b. Loose bolts and nuts
c. Excessive wear
d. Lack of oil
e. Contamination
2. Set-up and Adjustment – Time lost during changeover from current product to the
next product, or changing the settings during a run.
a. Removing tools
b. Finding tools
c. Attaching new tools
d. Adjusting new settings
3. Idling and Minor Stops – brief stoppages due to „insignificant‟ problems.
a. Parts stuck in a chute
b. Removing chips
c. Malfunctioning sensors
d. Program error
4. Reduced Speed – Loss when equipment operates below standard speed.
a. Machine Wear
b. Human intervention
c. Tool war
d. Overloading machines
Website:
Phone: www.lifetime-reliability.com +61 (0) 402 731 563
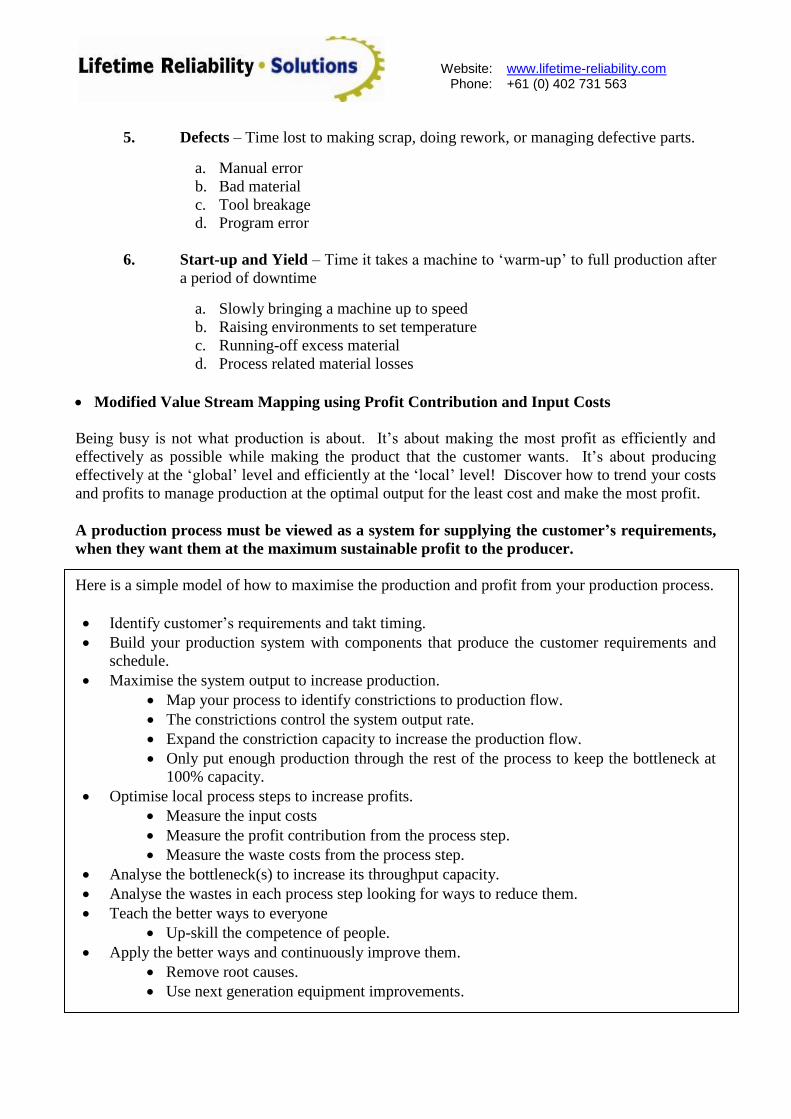
5. Defects – Time lost to making scrap, doing rework, or managing defective parts.
a. Manual error
b. Bad material
c. Tool breakage
d. Program error
6. Start-up and Yield – Time it takes a machine to „warm-up‟ to full production after
a period of downtime
a. Slowly bringing a machine up to speed
b. Raising environments to set temperature
c. Running-off excess material
d. Process related material losses
Modified Value Stream Mapping using Profit Contribution and Input Costs
Being busy is not what production is about. It‟s about making the most profit as efficiently and
effectively as possible while making the product that the customer wants. It‟s about producing
effectively at the „global‟ level and efficiently at the „local‟ level! Discover how to trend your costs
and profits to manage production at the optimal output for the least cost and make the most profit.
A production process must be viewed as a system for supplying the customer’s requirements,
when they want them at the maximum sustainable profit to the producer.
Here is a simple model of how to maximise the production and profit from your production process.
Identify customer‟s requirements and takt timing.
Build your production system with components that produce the customer requirements and
schedule.
Maximise the system output to increase production.
Map your process to identify constrictions to production flow.
The constrictions control the system output rate.
Expand the constriction capacity to increase the production flow.
Only put enough production through the rest of the process to keep the bottleneck at
100% capacity.
Optimise local process steps to increase profits.
Measure the input costs
Measure the profit contribution from the process step.
Measure the waste costs from the process step.
Analyse the bottleneck(s) to increase its throughput capacity.
Analyse the wastes in each process step looking for ways to reduce them.
Teach the better ways to everyone
Up-skill the competence of people.
Apply the better ways and continuously improve them.
Remove root causes.
Use next generation equipment improvements.
Website:
Phone: www.lifetime-reliability.com +61 (0) 402 731 563
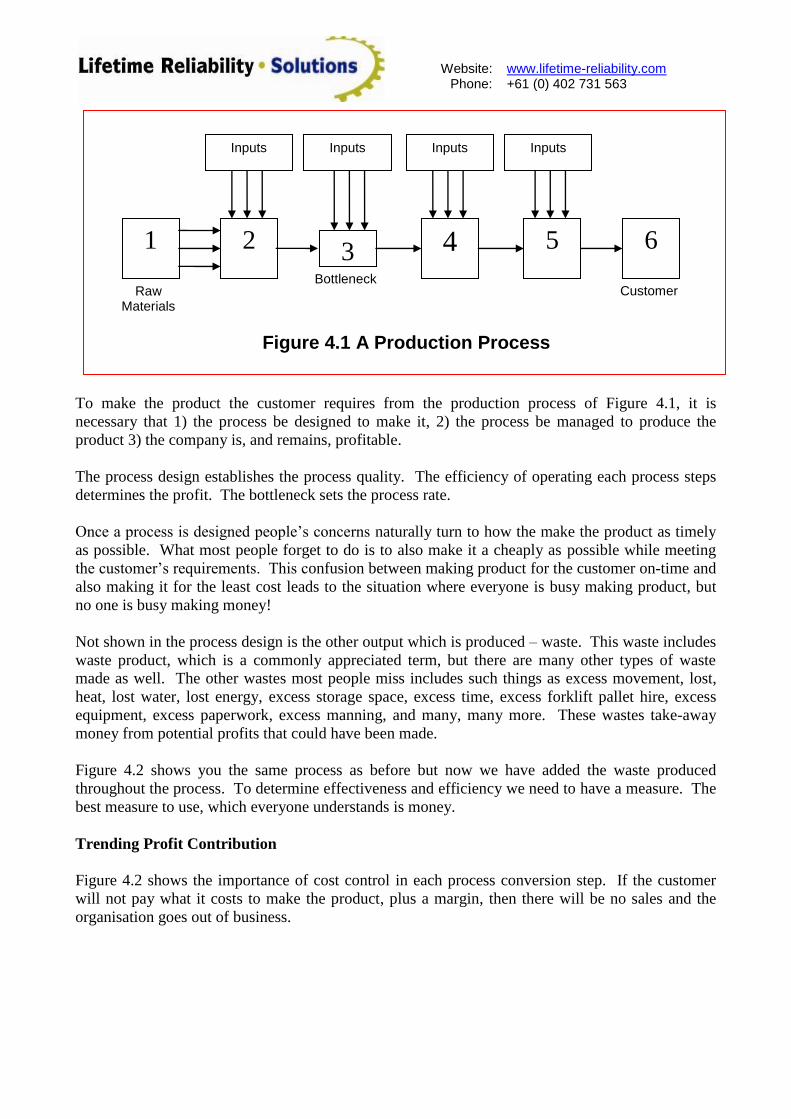
To make the product the customer requires from the production process of Figure 4.1, it is
necessary that 1) the process be designed to make it, 2) the process be managed to produce the
product 3) the company is, and remains, profitable.
The process design establishes the process quality. The efficiency of operating each process steps
determines the profit. The bottleneck sets the process rate.
Once a process is designed people‟s concerns naturally turn to how the make the product as timely
as possible. What most people forget to do is to also make it a cheaply as possible while meeting
the customer‟s requirements. This confusion between making product for the customer on-time and
also making it for the least cost leads to the situation where everyone is busy making product, but
no one is busy making money!
Not shown in the process design is the other output which is produced – waste. This waste includes
waste product, which is a commonly appreciated term, but there are many other types of waste
made as well. The other wastes most people miss includes such things as excess movement, lost,
heat, lost water, lost energy, excess storage space, excess time, excess forklift pallet hire, excess
equipment, excess paperwork, excess manning, and many, many more. These wastes take-away
money from potential profits that could have been made.
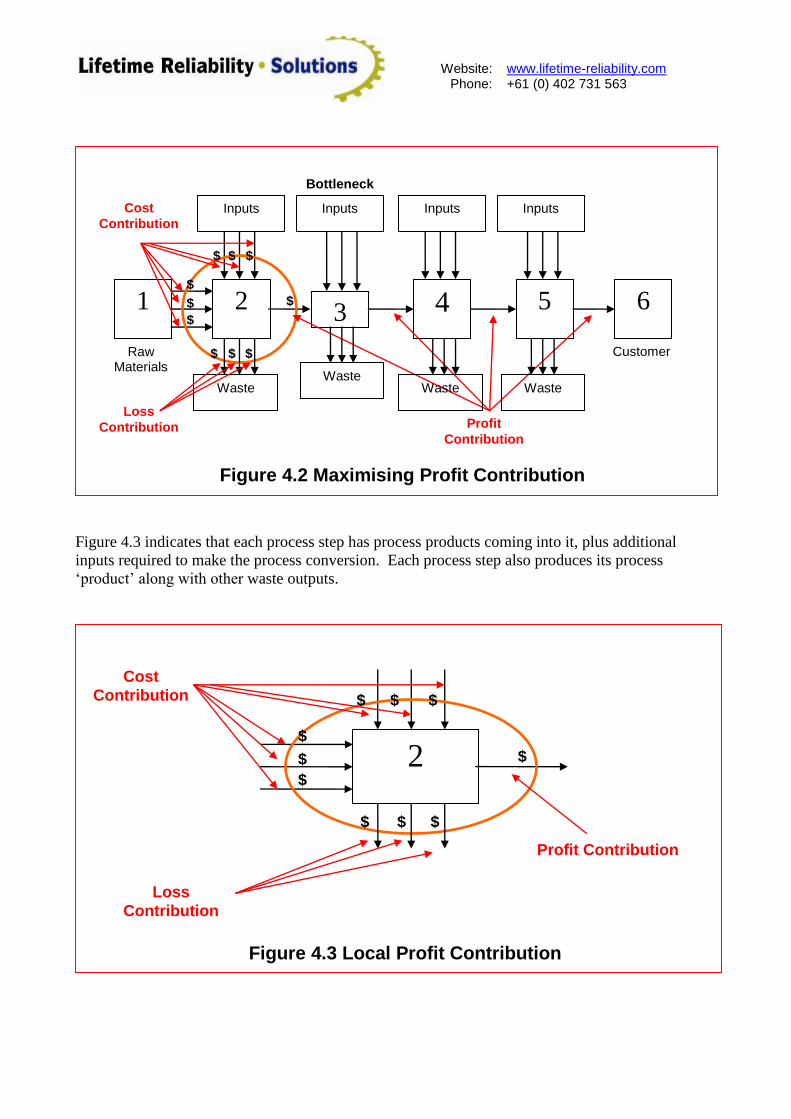
Figure 4.2 shows you the same process as before but now we have added the waste produced
throughout the process. To determine effectiveness and efficiency we need to have a measure. The
best measure to use, which everyone understands is money.
Trending Profit Contribution
Figure 4.2 shows the importance of cost control in each process conversion step. If the customer
will not pay what it costs to make the product, plus a margin, then there will be no sales and the
organisation goes out of business.
2 3 4 5 6 1
Inputs Inputs Inputs Inputs
Figure 4.1 A Production Process
Raw Materials
Customer Bottleneck
Website:
Phone: www.lifetime-reliability.com +61 (0) 402 731 563
Figure 4.3 indicates that each process step has process products coming into it, plus additional
inputs required to make the process conversion. Each process step also produces its process
„product‟ along with other waste outputs.
2 $
$ $ $
$
$
$
Profit Contribution
Cost
Contribution
Loss
Contribution
$ $ $
2 3 4 5 6 1
Inputs Inputs Inputs Inputs
Figure 4.2 Maximising Profit Contribution
Raw Materials
Customer
$
$ $ $
$
$
$
Profit
Contribution
Cost
Contribution
Bottleneck
Waste Waste
Waste Waste
Loss
Contribution
$ $ $
Figure 4.3 Local Profit Contribution
Website:
Phone: www.lifetime-reliability.com +61 (0) 402 731 563
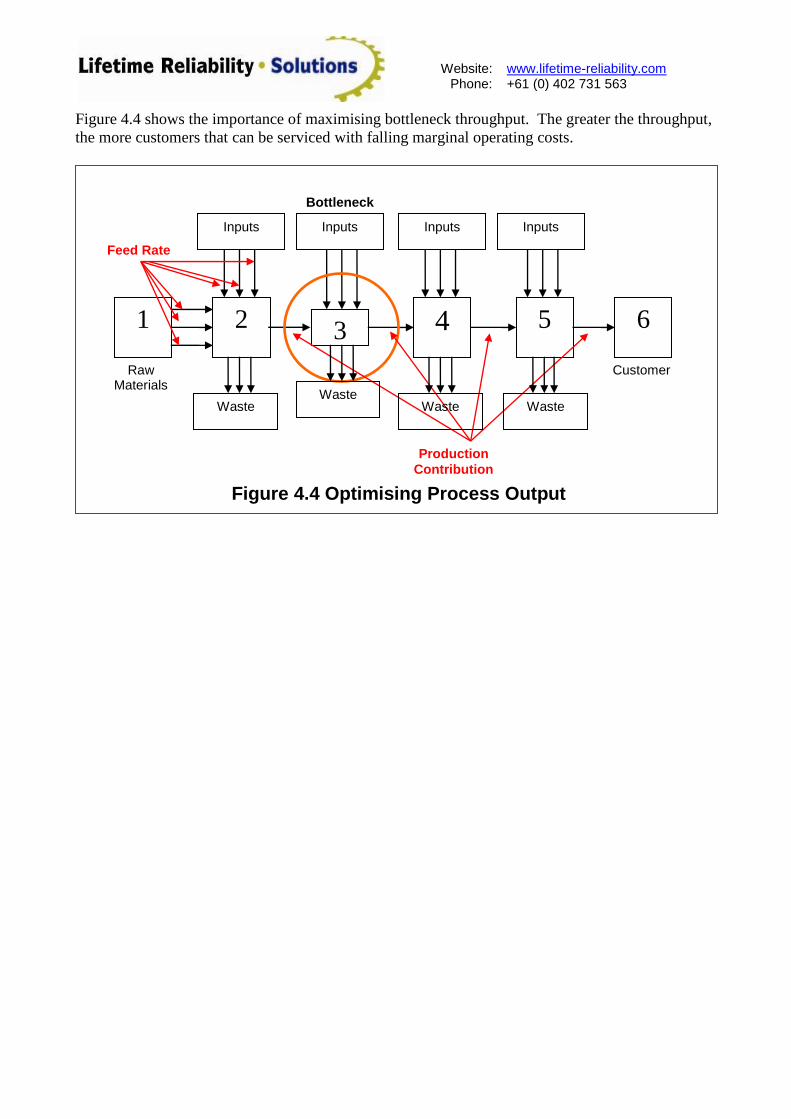
Figure 4.4 shows the importance of maximising bottleneck throughput. The greater the throughput,
the more customers that can be serviced with falling marginal operating costs.
2 3 4 5 6 1
Inputs Inputs Inputs Inputs
Figure 4.4 Optimising Process Output
Raw Materials
Customer
Bottleneck
Production
Contribution
Feed Rate
Waste Waste
Waste Waste
Website:
Phone: www.lifetime-reliability.com +61 (0) 402 731 563
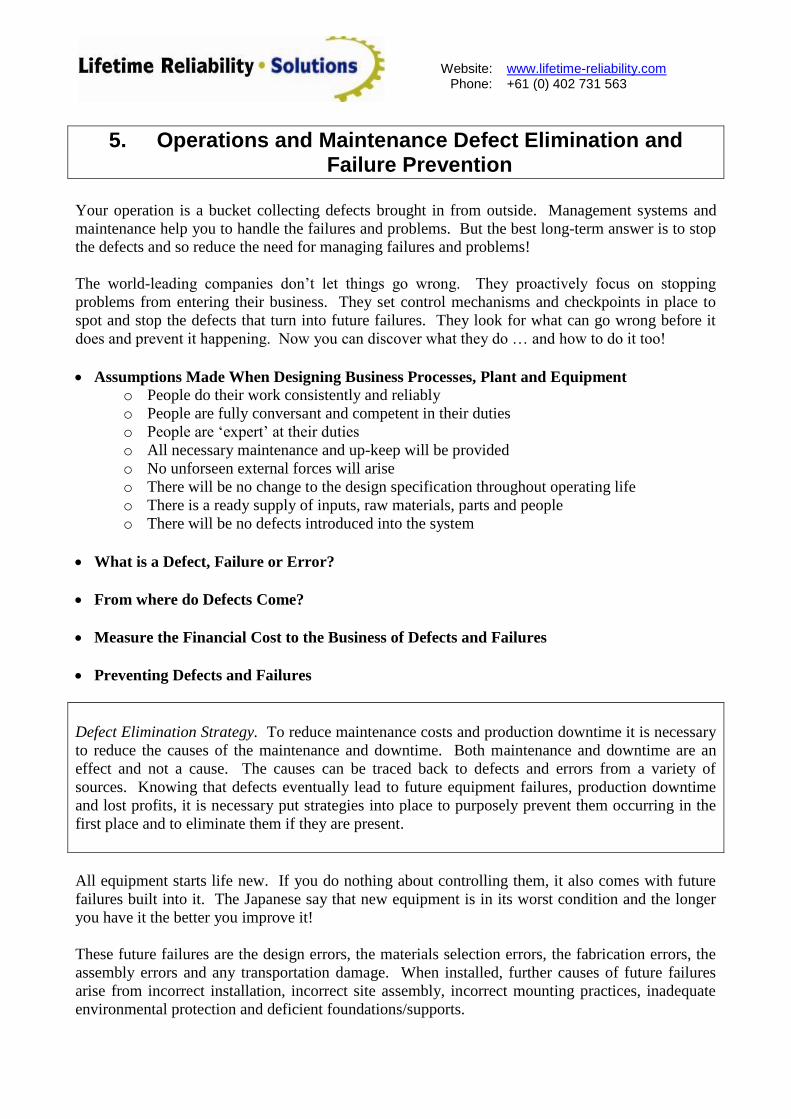
5. Operations and Maintenance Defect Elimination and Failure Prevention
Your operation is a bucket collecting defects brought in from outside. Management systems and
maintenance help you to handle the failures and problems. But the best long-term answer is to stop
the defects and so reduce the need for managing failures and problems!
The world-leading companies don‟t let things go wrong. They proactively focus on stopping
problems from entering their business. They set control mechanisms and checkpoints in place to
spot and stop the defects that turn into future failures. They look for what can go wrong before it
does and prevent it happening. Now you can discover what they do … and how to do it too!
Assumptions Made When Designing Business Processes, Plant and Equipment
o People do their work consistently and reliably
o People are fully conversant and competent in their duties
o People are „expert‟ at their duties
o All necessary maintenance and up-keep will be provided
o No unforseen external forces will arise
o There will be no change to the design specification throughout operating life
o There is a ready supply of inputs, raw materials, parts and people
o There will be no defects introduced into the system
What is a Defect, Failure or Error?
From where do Defects Come?
Measure the Financial Cost to the Business of Defects and Failures
Preventing Defects and Failures
Defect Elimination Strategy. To reduce maintenance costs and production downtime it is necessary
to reduce the causes of the maintenance and downtime. Both maintenance and downtime are an
effect and not a cause. The causes can be traced back to defects and errors from a variety of
sources. Knowing that defects eventually lead to future equipment failures, production downtime
and lost profits, it is necessary put strategies into place to purposely prevent them occurring in the
first place and to eliminate them if they are present.
All equipment starts life new. If you do nothing about controlling them, it also comes with future
failures built into it. The Japanese say that new equipment is in its worst condition and the longer
you have it the better you improve it!
These future failures are the design errors, the materials selection errors, the fabrication errors, the
assembly errors and any transportation damage. When installed, further causes of future failures
arise from incorrect installation, incorrect site assembly, incorrect mounting practices, inadequate
environmental protection and deficient foundations/supports.
Website:
Phone: www.lifetime-reliability.com +61 (0) 402 731 563
Some of these errors, along with commissioning errors and operating errors, cause failures early in
the equipment‟s operating life and explain early-life or „infant mortality‟ failures. The errors that
do not appear early in equipment infant-life will eventually surface and cause failures sometime
later during its operating life.
The preferred terminology is to call the errors „defects‟, because that is what you see as a
consequence of the mistake.
Defect Elimination
Starting from new, a part properly built and installed, without any errors, will operate at a particular
level of performance. If looked after properly it should, ideally, deliver its design requirements all
its operating life.
As its operating life progresses any of those previously hidden manufacturer‟s and installer‟s errors
noted above starting to make their effects shown. For some reason the equipment starts to fail.
Failure causes can be introduced at anytime. They can appear during operation from management
decision errors, operating errors, repair errors, abuse and even acts of Mother Nature.
If you want superbly reliable equipment you must prevent the introduction of defects and
errors at all stages of equipment life and also act to remove the defects and errors already
present in it. By getting rid of the defects that generate failure modes you will not reduce your
future maintenance requirements.
An average item of equipment has several dozen direct and consequential failure modes.
The best maintenance strategy to adopt is to not allow failure modes into the equipment from the
start. Such strategies require that you put in place management controls and quality standards that
must be followed to detect, control and stop the introduction of errors and defects into the
equipment.
For example a wise strategy at the design stage is to look for every failure mode possible and
remove it while on the drawing board. You can take each part of the equipment and list its possible
defects and errors and then introduced strategies and plans to address every one of those failure
paths.
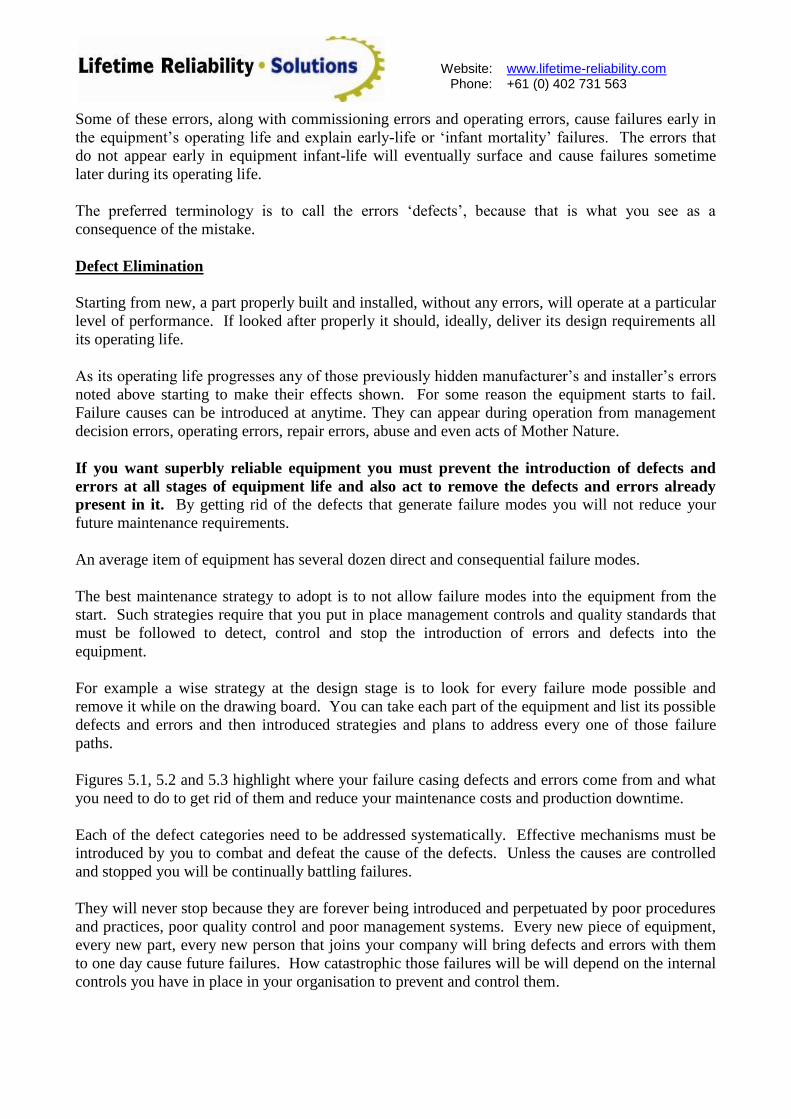
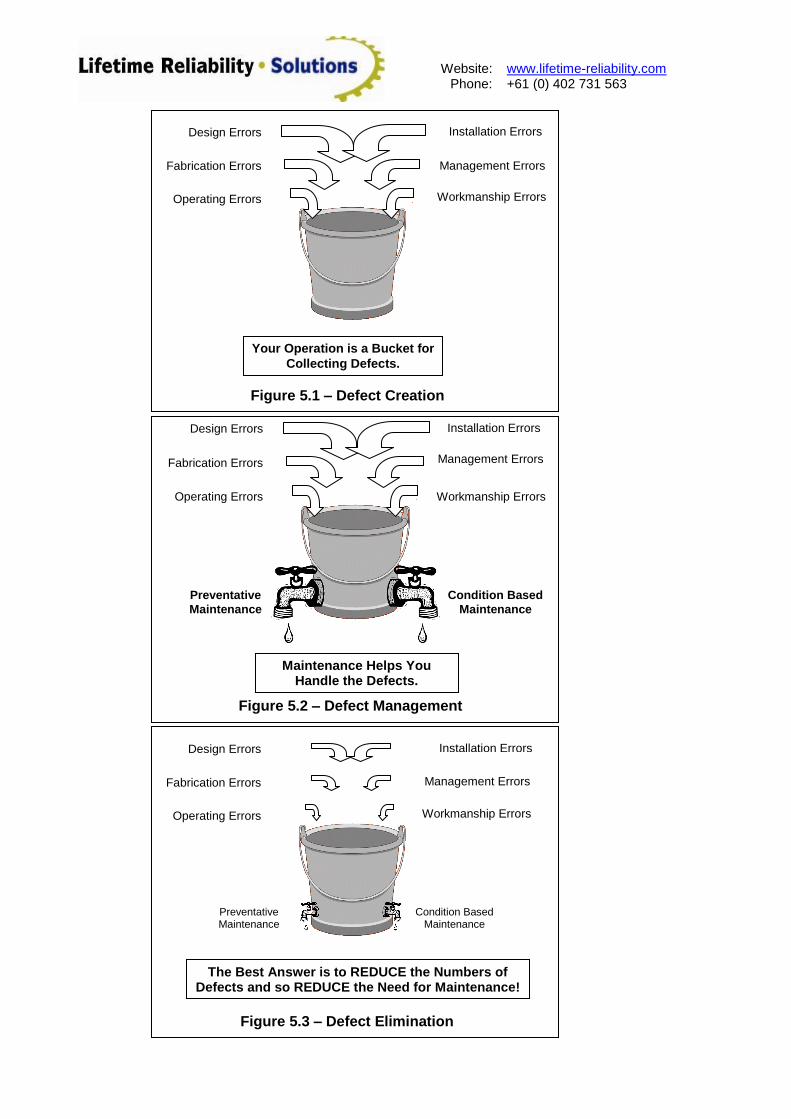
Figures 5.1, 5.2 and 5.3 highlight where your failure casing defects and errors come from and what
you need to do to get rid of them and reduce your maintenance costs and production downtime.
Each of the defect categories need to be addressed systematically. Effective mechanisms must be
introduced by you to combat and defeat the cause of the defects. Unless the causes are controlled
and stopped you will be continually battling failures.
They will never stop because they are forever being introduced and perpetuated by poor procedures
and practices, poor quality control and poor management systems. Every new piece of equipment,
every new part, every new person that joins your company will bring defects and errors with them
to one day cause future failures. How catastrophic those failures will be will depend on the internal
controls you have in place in your organisation to prevent and control them.
Website:
Phone: www.lifetime-reliability.com +61 (0) 402 731 563
Design Errors
Fabrication Errors
Operating Errors
Management Errors
Workmanship Errors
Installation Errors
Figure 5.3 – Defect Elimination
The Best Answer is to REDUCE the Numbers of Defects and so REDUCE the Need for Maintenance!
Preventative Maintenance
Condition Based Maintenance
Design Errors
Fabrication Errors
Operating Errors
Management Errors
Workmanship Errors
Installation Errors
Figure 5.2 – Defect Management
Maintenance Helps You Handle the Defects.
Preventative
Maintenance
Condition Based
Maintenance
Design Errors
Fabrication Errors
Operating Errors
Management Errors
Workmanship Errors
Installation Errors
Figure 5.1 – Defect Creation
Your Operation is a Bucket for
Collecting Defects.
Website:
Phone: www.lifetime-reliability.com +61 (0) 402 731 563
A Simple Defect Elimination Process
An easy, simple and powerful model to guide you in removing equipment defects from your
operation is:
1) Select one failure and identify where defects and errors were first introduced through the use of
root cause failure analysis.
2) Use resources skilled at eliminating the root cause and action a plan to engineer-out the causes
forever. (I implore you not to use work procedures to control engineering failures. If you do
that you will soon run out of people in the company to make responsible for controlling the
causes you will find. They will also consider it an impost on their job and sub-consciously
lower its importance so they do nothing about it and the failure will repeat. Use work
procedures to direct people‟s attention, not to compensate for equipment defects.)
3) Introduce clear, written quality production and engineering standards into the appropriate levels
and locations in the organisation that contain checks and tests to prevent the defects from again
entering into your company.
4) Train and re-train your people to meet the new standards.
5) Measure their performance against the new standards.
6) Repeat the above until the defects are so few that your operation is the world-class leader in
your industry.
It is necessary to use a quality system because a quality system is self-improving, self-correcting
and self-developing. With a quality system properly applied, your company will continuously
improve because continuous improvement is built into the way you do business. Without a working
quality system you require individuals to remember to do the right things every time. This means
you are now counting on good luck for things to go right!
You can remove defects and stop failures by taking a personal stand and start introducing the right
quality management practices into your operation. Start with your own projects. Only by adopting
better systems and methods, and causing the introduction of better practices and standards at every
stage of the production, engineering and maintenance process, will you ever reduce the equipment
failures in your operation.
If you want to master equipment maintenance and have outstandingly reliable production, stop the
introduction of defects and errors into your operation! If you want to seriously reduce maintenance
costs then reduce the number of ways your equipment can randomly fail.
Website:
Phone: www.lifetime-reliability.com +61 (0) 402 731 563
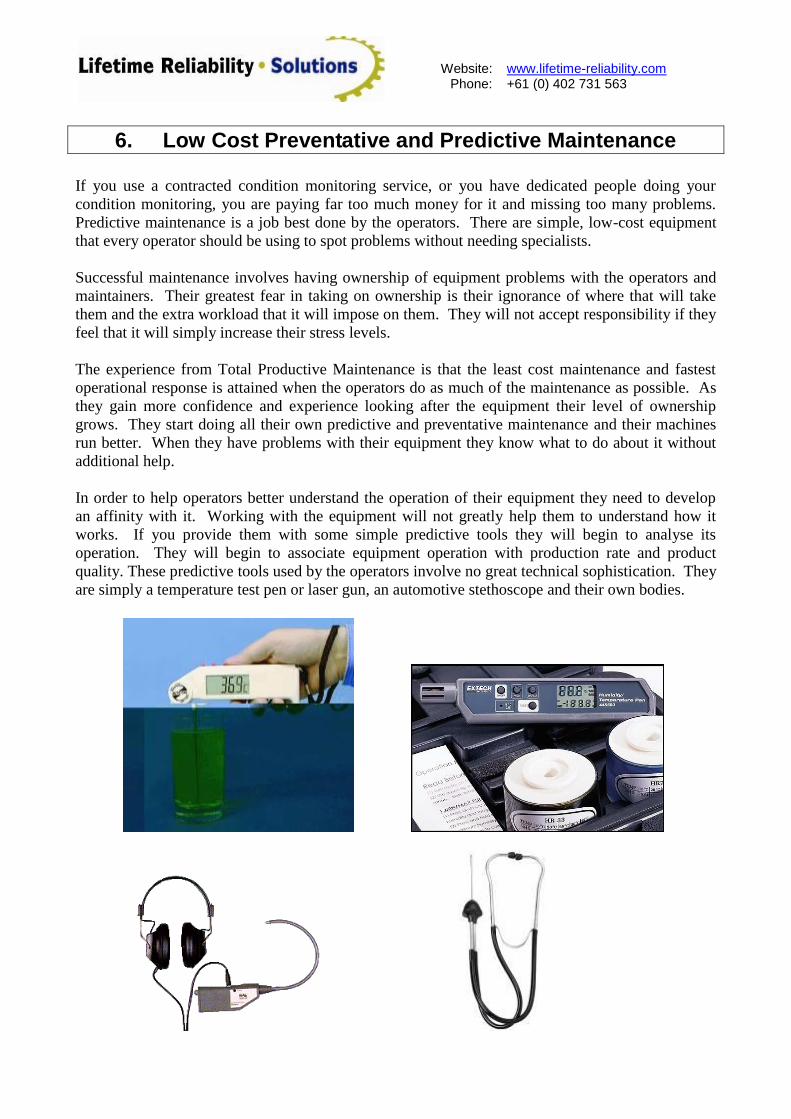
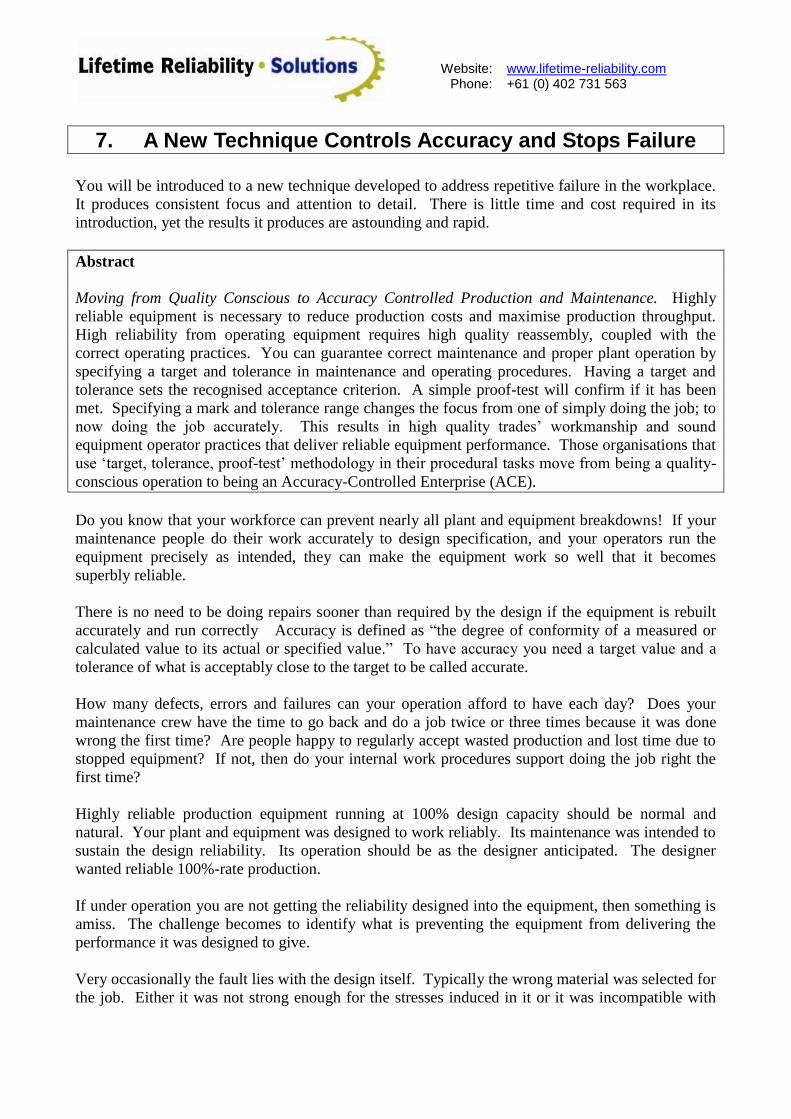
6. Low Cost Preventative and Predictive Maintenance
If you use a contracted condition monitoring service, or you have dedicated people doing your
condition monitoring, you are paying far too much money for it and missing too many problems.
Predictive maintenance is a job best done by the operators. There are simple, low-cost equipment
that every operator should be using to spot problems without needing specialists.
Successful maintenance involves having ownership of equipment problems with the operators and
maintainers. Their greatest fear in taking on ownership is their ignorance of where that will take
them and the extra workload that it will impose on them. They will not accept responsibility if they
feel that it will simply increase their stress levels.
The experience from Total Productive Maintenance is that the least cost maintenance and fastest
operational response is attained when the operators do as much of the maintenance as possible. As
they gain more confidence and experience looking after the equipment their level of ownership
grows. They start doing all their own predictive and preventative maintenance and their machines
run better. When they have problems with their equipment they know what to do about it without
additional help.
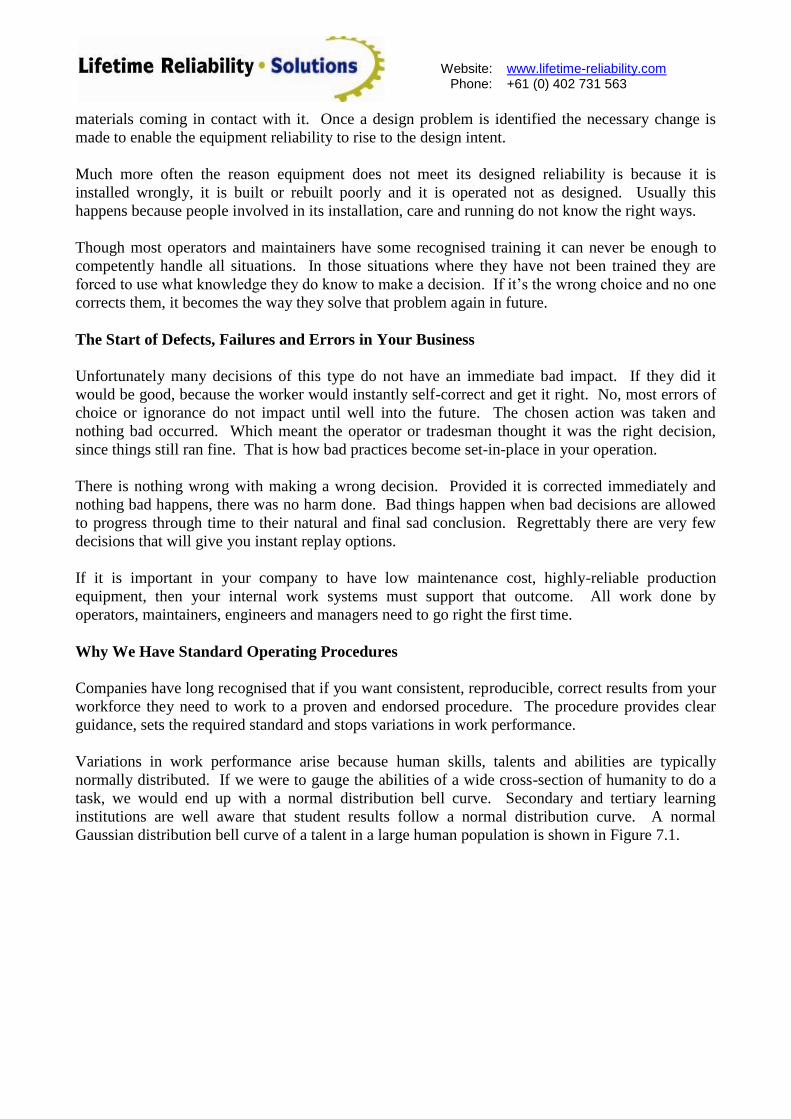
In order to help operators better understand the operation of their equipment they need to develop
an affinity with it. Working with the equipment will not greatly help them to understand how it
works. If you provide them with some simple predictive tools they will begin to analyse its
operation. They will begin to associate equipment operation with production rate and product
quality. These predictive tools used by the operators involve no great technical sophistication. They
are simply a temperature test pen or laser gun, an automotive stethoscope and their own bodies.
Website:
Phone: www.lifetime-reliability.com +61 (0) 402 731 563
7. A New Technique Controls Accuracy and Stops Failure
You will be introduced to a new technique developed to address repetitive failure in the workplace.
It produces consistent focus and attention to detail. There is little time and cost required in its
introduction, yet the results it produces are astounding and rapid.
Abstract
Moving from Quality Conscious to Accuracy Controlled Production and Maintenance. Highly
reliable equipment is necessary to reduce production costs and maximise production throughput.
High reliability from operating equipment requires high quality reassembly, coupled with the
correct operating practices. You can guarantee correct maintenance and proper plant operation by
specifying a target and tolerance in maintenance and operating procedures. Having a target and
tolerance sets the recognised acceptance criterion. A simple proof-test will confirm if it has been
met. Specifying a mark and tolerance range changes the focus from one of simply doing the job; to
now doing the job accurately. This results in high quality trades‟ workmanship and sound
equipment operator practices that deliver reliable equipment performance. Those organisations that
use „target, tolerance, proof-test‟ methodology in their procedural tasks move from being a quality-
conscious operation to being an Accuracy-Controlled Enterprise (ACE).
Do you know that your workforce can prevent nearly all plant and equipment breakdowns! If your
maintenance people do their work accurately to design specification, and your operators run the
equipment precisely as intended, they can make the equipment work so well that it becomes
superbly reliable.
There is no need to be doing repairs sooner than required by the design if the equipment is rebuilt
accurately and run correctly Accuracy is defined as “the degree of conformity of a measured or
calculated value to its actual or specified value.” To have accuracy you need a target value and a
tolerance of what is acceptably close to the target to be called accurate.
How many defects, errors and failures can your operation afford to have each day? Does your
maintenance crew have the time to go back and do a job twice or three times because it was done
wrong the first time? Are people happy to regularly accept wasted production and lost time due to
stopped equipment? If not, then do your internal work procedures support doing the job right the
first time?
Highly reliable production equipment running at 100% design capacity should be normal and
natural. Your plant and equipment was designed to work reliably. Its maintenance was intended to
sustain the design reliability. Its operation should be as the designer anticipated. The designer
wanted reliable 100%-rate production.
If under operation you are not getting the reliability designed into the equipment, then something is
amiss. The challenge becomes to identify what is preventing the equipment from delivering the
performance it was designed to give.
Very occasionally the fault lies with the design itself. Typically the wrong material was selected for
the job. Either it was not strong enough for the stresses induced in it or it was incompatible with
Website:
Phone: www.lifetime-reliability.com +61 (0) 402 731 563
materials coming in contact with it. Once a design problem is identified the necessary change is
made to enable the equipment reliability to rise to the design intent.
Much more often the reason equipment does not meet its designed reliability is because it is
installed wrongly, it is built or rebuilt poorly and it is operated not as designed. Usually this
happens because people involved in its installation, care and running do not know the right ways.
Though most operators and maintainers have some recognised training it can never be enough to
competently handle all situations. In those situations where they have not been trained they are
forced to use what knowledge they do know to make a decision. If it‟s the wrong choice and no one
corrects them, it becomes the way they solve that problem again in future.
The Start of Defects, Failures and Errors in Your Business
Unfortunately many decisions of this type do not have an immediate bad impact. If they did it
would be good, because the worker would instantly self-correct and get it right. No, most errors of
choice or ignorance do not impact until well into the future. The chosen action was taken and
nothing bad occurred. Which meant the operator or tradesman thought it was the right decision,
since things still ran fine. That is how bad practices become set-in-place in your operation.
There is nothing wrong with making a wrong decision. Provided it is corrected immediately and
nothing bad happens, there was no harm done. Bad things happen when bad decisions are allowed
to progress through time to their natural and final sad conclusion. Regrettably there are very few
decisions that will give you instant replay options.
If it is important in your company to have low maintenance cost, highly-reliable production
equipment, then your internal work systems must support that outcome. All work done by
operators, maintainers, engineers and managers need to go right the first time.
Why We Have Standard Operating Procedures
Companies have long recognised that if you want consistent, reproducible, correct results from your
workforce they need to work to a proven and endorsed procedure. The procedure provides clear
guidance, sets the required standard and stops variations in work performance.
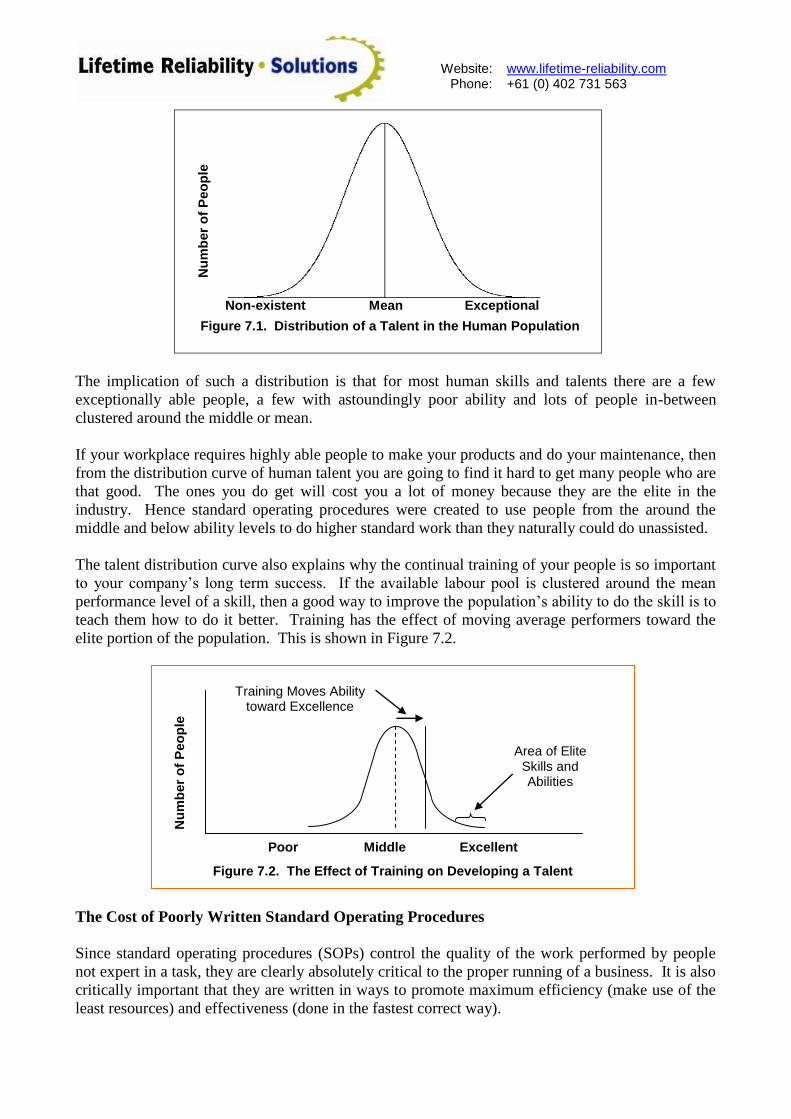
Variations in work performance arise because human skills, talents and abilities are typically
normally distributed. If we were to gauge the abilities of a wide cross-section of humanity to do a
task, we would end up with a normal distribution bell curve. Secondary and tertiary learning
institutions are well aware that student results follow a normal distribution curve. A normal
Gaussian distribution bell curve of a talent in a large human population is shown in Figure 7.1.
Website:
Phone: www.lifetime-reliability.com +61 (0) 402 731 563
The implication of such a distribution is that for most human skills and talents there are a few
exceptionally able people, a few with astoundingly poor ability and lots of people in-between
clustered around the middle or mean.
If your workplace requires highly able people to make your products and do your maintenance, then
from the distribution curve of human talent you are going to find it hard to get many people who are
that good. The ones you do get will cost you a lot of money because they are the elite in the
industry. Hence standard operating procedures were created to use people from the around the
middle and below ability levels to do higher standard work than they naturally could do unassisted.
The talent distribution curve also explains why the continual training of your people is so important
to your company‟s long term success. If the available labour pool is clustered around the mean
performance level of a skill, then a good way to improve the population‟s ability to do the skill is to
teach them how to do it better. Training has the effect of moving average performers toward the
elite portion of the population. This is shown in Figure 7.2.
The Cost of Poorly Written Standard Operating Procedures
Since standard operating procedures (SOPs) control the quality of the work performed by people
not expert in a task, they are clearly absolutely critical to the proper running of a business. It is also
critically important that they are written in ways to promote maximum efficiency (make use of the
least resources) and effectiveness (done in the fastest correct way).
Training Moves Ability toward Excellence
Nu
mb
er
of
Peo
ple
Poor Middle Excellent
Area of Elite Skills and Abilities
Figure 7.2. The Effect of Training on Developing a Talent
Figure 7.1. Distribution of a Talent in the Human Population
Non-existent Mean Exceptional
Nu
mb
er
of
Peo
ple

Website:
Phone: www.lifetime-reliability.com +61 (0) 402 731 563
It has been my experience that very few companies use their SOPs to control outcomes. When they
are available they are not self-checking and do not promote good practice. They offer little
practical assistance to the user. Typically they are glanced over when operators and maintainers
start a new job and then thrown to the back of the shelf to never be seen again. That is a pity
because they are one of the most powerful learning tools ever developed. At least they could be if
their supervisors and managers knew what could be done with an SOP.
Of the companies that have SOPs, most were written by their resident expert in the job. They wrote
the procedure already knowing all the answers. So tasks were described with words and statements
that assumed prior knowledge. You will often see in SOPs statements such as - “Inspect lights,
check switch, check fuse, and test circuit”. And “Inspect steering wheel linkage”. Or in the case of
a machine operator - “Test the vehicle and report its condition”.
The problem with the use of procedures containing such descriptions is that you must first be an
expert to know whether there is anything wrong with what you are looking at. They require you to
hire trained and qualified people in order to do what is maybe a very simple job.
The Best SOPs Can Be Done By The Least Skilled People.
There is a better way to write SOPs that still maintain the work quality but do not need only
qualified people to do them. They can be written with more detail and guidance and include a
target to hit, a tolerance on accuracy and regular proof-tests of compliance so that job quality is
guaranteed.
Standard operating procedures are a quality and accuracy control device which has the power to
deliver a specific level of excellence every time they are used. Few companies understand the true
power of an SOP. Typically they are written because the company‟s quality system demands it.
People mistakenly write them as fast as they can, with the least details and content necessary.
In reality SOPs should be written to save organisations time, money, people and effort because they
can make plant and equipment outstandingly reliable so production can maximise productivity!
For a standard operating procedure to have positively powerful effects on a company and its people
there must be clear and precise measures, which if faithfully met, will produce the required quality
to deliver the designed equipment performance. Great production plant reliability and production
performance will naturally follow!
If we take the “Inspect steering wheel linkage” example from above and apply the „target, tolerance,
proof‟ method, a resulting description might be:
“With a sharp, pointed scribe mark a straight line directly in-line on both shafts of the linkage as
shown in the accompanying drawing/photo (A drawing or photo would be provided. If necessary
you also describe how to mark a straight scribe mark in-line on both shafts). Grab both sides of the
steering linkage and firmly twist in opposite directions. Observe the scribe marks as you twist. If
they go out of alignment more than the thickness of the scribe mark replace the linkage (a sketch
would be included showing when the movement is out of tolerance).” The procedure would then
continue to list and specify any other necessary tests and resulting repairs.
With such detail you no longer need a highly qualified person to do the inspection. Anyone with
mechanical aptitude can do a reliable inspection. This method of writing procedures is the same as
Website:
Phone: www.lifetime-reliability.com +61 (0) 402 731 563
used by writers of motor car manuals for novice car mechanics. Car manuals are full of procedures
containing highly detailed descriptions and plentiful descriptive images. With them in-hand novice
car mechanics can do a lot of their own maintenance with certainty of job quality.
The very same logic and method used to write car manuals also applies to industrial production and
maintenance procedures. If you put in your procedures all the information that is necessary to
rebuild an item of equipment, or to run a piece of plant accurately, you do not need people from the
exceptional end of the population to do the job well.
Train and Retrain Your People to Your Standard Operating Procedures
Having a procedure full of best content and excellent explanations for your workforce is not by
itself enough to guarantee accuracy. How can you be sure that your people comprehend what they
read? Many tradesmen and plant operators are not literate in English, nor do they understand the
true meaning of all the terms used in a procedure.
To be sure your people know what to do and can do it right, they need to be trained in the procedure
and be tested. Training is needed before they do the task alone, without supervision, and later they
need refresher and reinforcement training. The amount and extent of training varies depending on
the frequency a procedure is done, the skill level of the persons involved and their past practical
experience in successfully doing the work.
Procedures done annually or more often by the same people will not need retraining. Because
people forget, those procedures on longer cycles than annually will need refreshment training before
they are next done. Training and retraining often seems such an unnecessary impost on an
organisation. You will hear managers say “If the work is done by qualified people why do I need to
train them? They have already been trained.” The answer to that question is “How many mistakes
are you willing to accept?”
For example, if you have had flange leaks soon after a piece of equipment was rebuilt, it is a sign
that you may need to retrain you people in the correct bolting of flanges. Flanges do not leak if they
were done right. When a repair re-occurs too often, it is a signal that the SOP does not contain
targets, tolerances and proof-tests or that training is needed to teach people the procedure.
Taking Your Organisation to an Accuracy Controlled Enterprise
A classic example of what great value an accuracy-focused SOP can bring is in this story of a
forced draft fan bearing failure. The rear roller bearing on this fan never lasted more than about two
months after a repair. The downtime was an expensive and great inconvenience. To take it out of
the realm of a breakdown, the bearing was replaced every six weeks as planned maintenance.
The bearing was also put on vibration analysis condition monitoring observation. After several
replacements enough vibration data was collected to diagnose a pinched outer bearing race. The
rear bearing housing had been machined oval in shape when manufactured and it squeezed the new
bearing out-of-round every time it was bolted up.
You could say that vibration analysis was applied wonderfully well. But the truth is the repair
procedure failed badly. If there had been a task in the procedure to measure the bolted bearing
housing roundness and compare the dimensions to allowable target measurements, it would have
been instantly noticed as having an oval shaped hole at the first rebuild.
Website:
Phone: www.lifetime-reliability.com +61 (0) 402 731 563
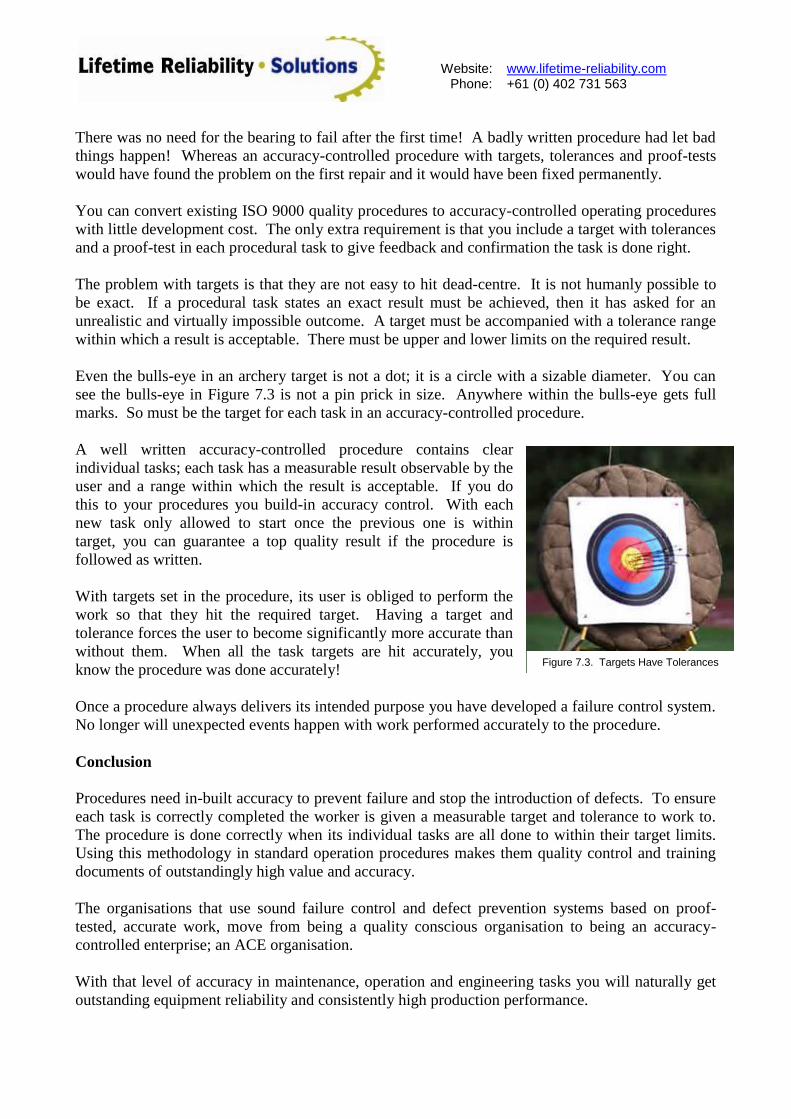
Figure 7.3. Targets Have Tolerances
There was no need for the bearing to fail after the first time! A badly written procedure had let bad
things happen! Whereas an accuracy-controlled procedure with targets, tolerances and proof-tests
would have found the problem on the first repair and it would have been fixed permanently.
You can convert existing ISO 9000 quality procedures to accuracy-controlled operating procedures
with little development cost. The only extra requirement is that you include a target with tolerances
and a proof-test in each procedural task to give feedback and confirmation the task is done right.
The problem with targets is that they are not easy to hit dead-centre. It is not humanly possible to
be exact. If a procedural task states an exact result must be achieved, then it has asked for an
unrealistic and virtually impossible outcome. A target must be accompanied with a tolerance range
within which a result is acceptable. There must be upper and lower limits on the required result.
Even the bulls-eye in an archery target is not a dot; it is a circle with a sizable diameter. You can
see the bulls-eye in Figure 7.3 is not a pin prick in size. Anywhere within the bulls-eye gets full
marks. So must be the target for each task in an accuracy-controlled procedure.
A well written accuracy-controlled procedure contains clear
individual tasks; each task has a measurable result observable by the
user and a range within which the result is acceptable. If you do
this to your procedures you build-in accuracy control. With each
new task only allowed to start once the previous one is within
target, you can guarantee a top quality result if the procedure is
followed as written.
With targets set in the procedure, its user is obliged to perform the
work so that they hit the required target. Having a target and
tolerance forces the user to become significantly more accurate than
without them. When all the task targets are hit accurately, you
know the procedure was done accurately!
Once a procedure always delivers its intended purpose you have developed a failure control system.
No longer will unexpected events happen with work performed accurately to the procedure.
Conclusion
Procedures need in-built accuracy to prevent failure and stop the introduction of defects. To ensure
each task is correctly completed the worker is given a measurable target and tolerance to work to.
The procedure is done correctly when its individual tasks are all done to within their target limits.
Using this methodology in standard operation procedures makes them quality control and training
documents of outstandingly high value and accuracy.
The organisations that use sound failure control and defect prevention systems based on proof-
tested, accurate work, move from being a quality conscious organisation to being an accuracy-
controlled enterprise; an ACE organisation.
With that level of accuracy in maintenance, operation and engineering tasks you will naturally get
outstanding equipment reliability and consistently high production performance.
Website:
Phone: www.lifetime-reliability.com +61 (0) 402 731 563
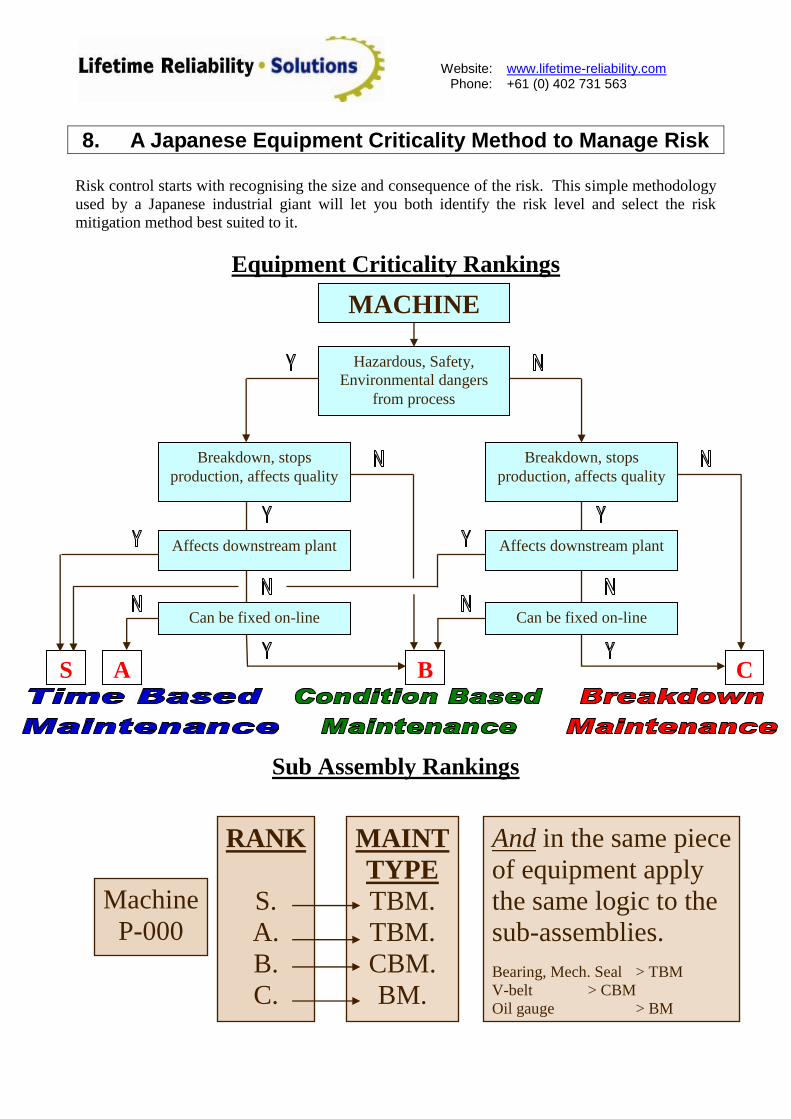
8. A Japanese Equipment Criticality Method to Manage Risk
Risk control starts with recognising the size and consequence of the risk. This simple methodology
used by a Japanese industrial giant will let you both identify the risk level and select the risk
mitigation method best suited to it.
Equipment Criticality Rankings
Sub Assembly Rankings
Machine
P-000
RANK
S.
A.
B.
C.
MAINT
TYPE
TBM.
TBM.
CBM.
BM.
And in the same piece
of equipment apply
the same logic to the
sub-assemblies.
Bearing, Mech. Seal > TBM
V-belt > CBM
Oil gauge > BM
MACHINE
Hazardous, Safety,
Environmental dangers
from process
Breakdown, stops
production, affects quality Breakdown, stops
production, affects quality
Affects downstream plant Affects downstream plant
Can be fixed on-line Can be fixed on-line
S A B C
Website:
Phone: www.lifetime-reliability.com +61 (0) 402 731 563
9. The Incredible Power of Visual Management
Human beings love a challenge. You can use visual management „tools‟ to turn work into a „game‟
that they will love to master. This little understood psychological „trick‟ is a powerful way to get
people to enjoy their work and become inspired to improve their performance!
A key condition of accuracy controlled procedures is to provide a means to physically confirm a test
measure is definitely within the target tolerance range. To pass the acceptance test the operator
must have sensory confirmation of the result. It is not sufficient that a procedure is accepted as
completed correctly simply because the tasks in the procedure have been followed from start to end.
One must be sure that what is written in a procedure produced the right result.
It is only when the result of the proof-tests confirm that all procedural tasks have been done right
that you can be sure the whole procedure has been completed correctly. The best and most
acceptable way to know a test is within its limits is for the person performing it to note the results
with one of their body‟s senses. This can be visually, through sound, by taste, using touch or with
smell.
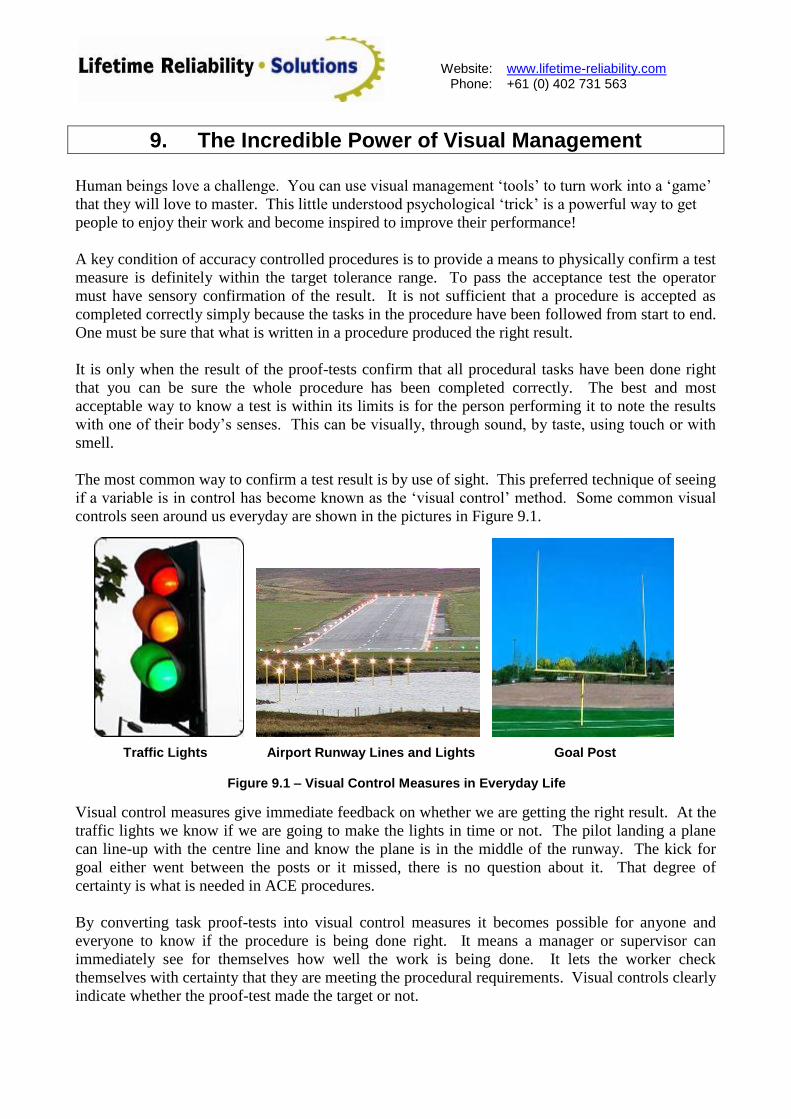
The most common way to confirm a test result is by use of sight. This preferred technique of seeing
if a variable is in control has become known as the „visual control‟ method. Some common visual
controls seen around us everyday are shown in the pictures in Figure 9.1.
Traffic Lights Airport Runway Lines and Lights Goal Post
Figure 9.1 – Visual Control Measures in Everyday Life
Visual control measures give immediate feedback on whether we are getting the right result. At the
traffic lights we know if we are going to make the lights in time or not. The pilot landing a plane
can line-up with the centre line and know the plane is in the middle of the runway. The kick for
goal either went between the posts or it missed, there is no question about it. That degree of
certainty is what is needed in ACE procedures.
By converting task proof-tests into visual control measures it becomes possible for anyone and
everyone to know if the procedure is being done right. It means a manager or supervisor can
immediately see for themselves how well the work is being done. It lets the worker check
themselves with certainty that they are meeting the procedural requirements. Visual controls clearly
indicate whether the proof-test made the target or not.
Website:
Phone: www.lifetime-reliability.com +61 (0) 402 731 563
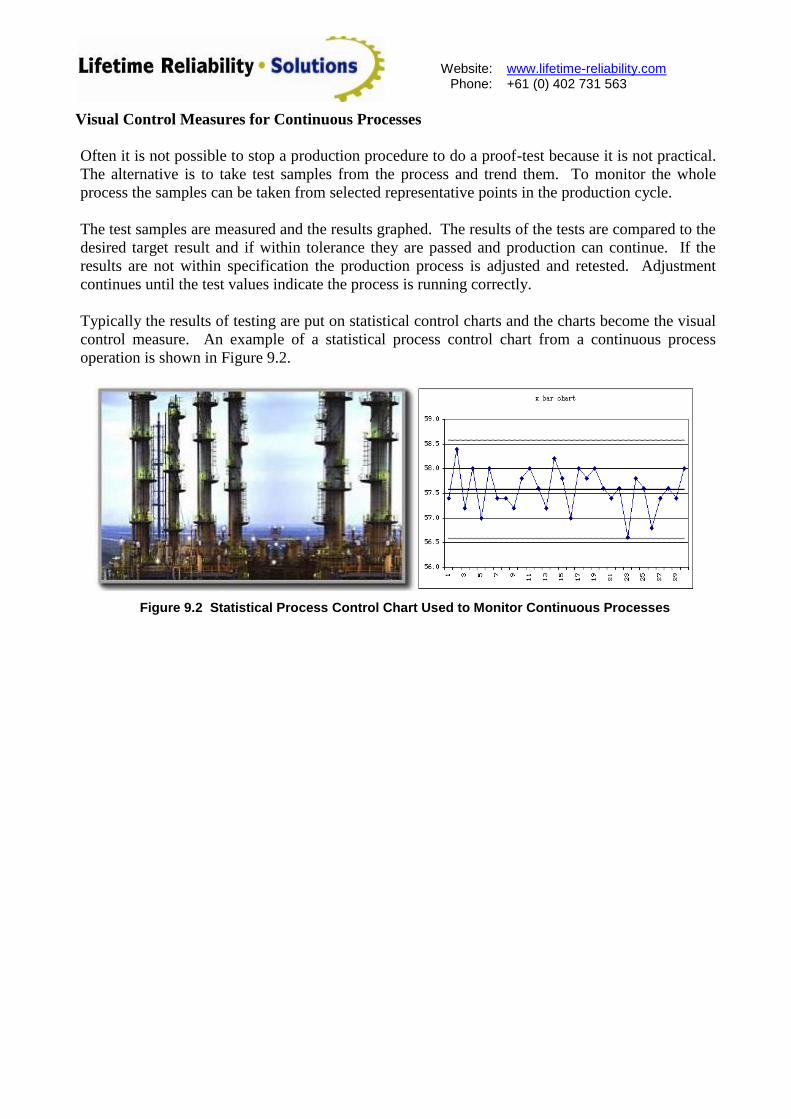
Visual Control Measures for Continuous Processes
Often it is not possible to stop a production procedure to do a proof-test because it is not practical.
The alternative is to take test samples from the process and trend them. To monitor the whole
process the samples can be taken from selected representative points in the production cycle.
The test samples are measured and the results graphed. The results of the tests are compared to the
desired target result and if within tolerance they are passed and production can continue. If the
results are not within specification the production process is adjusted and retested. Adjustment
continues until the test values indicate the process is running correctly.
Typically the results of testing are put on statistical control charts and the charts become the visual
control measure. An example of a statistical process control chart from a continuous process
operation is shown in Figure 9.2.
Figure 9.2 Statistical Process Control Chart Used to Monitor Continuous Processes
Website:
Phone: www.lifetime-reliability.com +61 (0) 402 731 563
10. 5 Ways to Miss-Out on World-Class Operating Performance
World-class operations performers do five things exceptionally well. If you want to be like them
you need only do the same! But not doing one of the five exceptionally well will stop you getting
there. Learn what the 5 key factors are and how the world-class operators do them.
The biggest and richest car company in the world has discovered many successful production
practices and methods. Learn what they are and how they can be used in your operation to make
quick and lasting improvements.
Continuous One-Piece Process Flow
„Pull‟ Systems to Avoid Inventory (JIT)
Level-Out the Workload to the Bottleneck
Get Quality Right the First Time (1)
Standardise to Maximise Simplicity (2)
Use Visual Controls
Use Tested and Proven Technology
Develop People and Teams To Support Your Culture (3)
Work With Your Suppliers and Partners To Improve Together
Go and See for Yourself to Gain Thorough Understanding (4)
Make Decisions Slowly, Considering All Options. Implement Rapidly
Become a Learning Organism Continuously Improving (5)
Website:
Phone: www.lifetime-reliability.com +61 (0) 402 731 563
11. Optimising Whole of Life Profitability
The profitability of a business is determined before a shovel of dirt has been turned! If the concept
and design is flawed nothing can fix it when it‟s operating. You need to have a profitable operation
before it starts! Now a new method to test and prove your plant and equipment investments will
make good profits, not just average profits, is yours to use!
Life Cycle Profit Optimisation – Design-in Reliability and Lower Costs
If maintenance is done poorly production costs rise fast. But maintenance done well delivers higher
profits. „Repairs and Maintenance‟ is classified as a cost by accountants, but in reality it is an
enabler for improving production and lifting profits. Learn how to use maintenance to drive profits!
Reliability is Where The Profit Is
o Reliability is long-term. It is the probability a product will function correctly when needed,
for the period required, in the specified environment. In manufactured products the
reliability comes from its design, materials, manufacture and use in service.
o Reliability is customer satisfaction driven.
o Reliability is measured at end of life – probability of functioning to design for a set period of
time.
o Reliability is observable - number of returns and service call-outs from customers
Reliability is Designed-in – Request It.
o Reliability is designed-in using failure reduction techniques such as Failure Mode and
Effects Analysis (FMEA), Design Options and Cost Total Optimisation Review (DOCTOR)
and as predicted based on test results and models.
o Forecast problems and unlikely ways to fail.
o Prototype and make the item fail; then design-out problems.
Life-Cycle Profitability is Culture Critical
o Master plan for reliability improvement and a written company policy.
o Company-wide buy-in – „common-mindset‟ throughout/across organisation.
o Make the improvement process visible – goals, targets, charts, deeds done.
‘Customer’ Communication
o User feedback‟s captured and root cause failure analysis applied.
o Competitor‟s products examined for weaknesses and strengths.
Equipment Failure Database And Analysis
o Detailed equipment and component failure database developed.
o Discover the actual root cause and identify clearly.
o Analyse database for specific changes to include in next generation of items.
Website:
Phone: www.lifetime-reliability.com +61 (0) 402 731 563
Product And Design Development
o Reliability is „designed in‟ with appropriate engineering decisions.
o Reliability level and matching project goals set with design team for each „project‟.
o Formal methodology of design, development and testing process developed and followed.
o Project management applied to control reliability requirement during development.
Supply System Alignment
o The supplier‟s components are the components your company will build its business on.
o The supplier‟s processes must deliver the required reliability.
o Open, honest communication focused on mutual improvement needed.
Production and Maintenance Systems
o Need the processes, equipment, tools and techniques to control variation.
o Production/Manufacturing is part of the design and development process so that
production/manufacturing limitations are recognised and appropriate choices made.
Design Options & Cost Total Optimisation of Risk (DOCTOR):
Analyses the operating costs of available solutions based on Net Present Value. The costs of the
consequences of future failures are used to proactively address issues at the decision and selection
stages of improvement projects. It is a Life-Cycle Profit (LCP) methodology of great value because
of its simplicity to understand and to use. Appropriate measures are put in place to track and
control the solution‟s performance.
Defect and Failure True Cost (DAFT Cost):
Identify the full and true costs of potential failures in real money. Typically the total true defect
cost is many times the obvious costs of rectification. When failures occur their costs reverberate
across the entire organisation. Production, Maintenance, Stores, Administration, Finance, Sales and
Despatch are all impacted. Those seemingly small failures snowball into substantial amounts of
money that could have been profits! DAFT Costing highlights to everyone the tremendous expense
and waste caused by failure and spurs change the way things are done so that defects, failures and
errors are reduced.
Examples of the Techniques
See the „Plant and Equipment Wellness‟ eBook free from the Lifetime Reliability Solutions website
Website:
Phone: www.lifetime-reliability.com +61 (0) 402 731 563
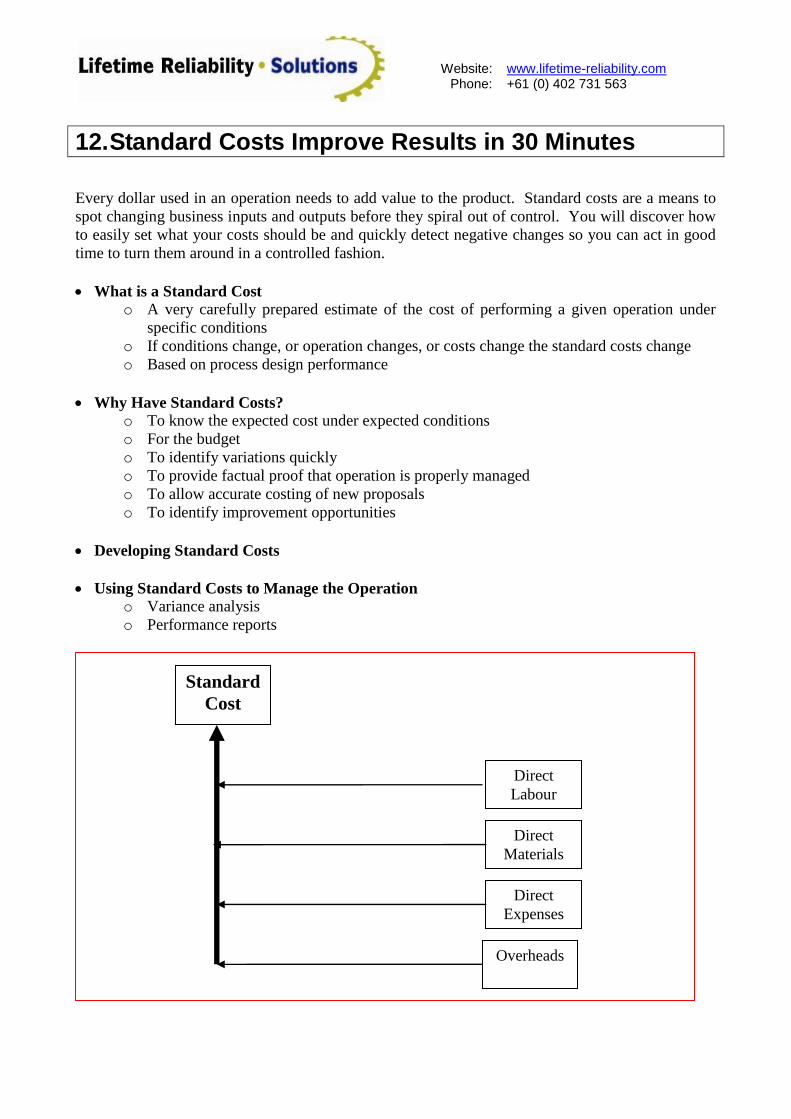
12. Standard Costs Improve Results in 30 Minutes
Every dollar used in an operation needs to add value to the product. Standard costs are a means to
spot changing business inputs and outputs before they spiral out of control. You will discover how
to easily set what your costs should be and quickly detect negative changes so you can act in good
time to turn them around in a controlled fashion.
What is a Standard Cost o A very carefully prepared estimate of the cost of performing a given operation under
specific conditions
o If conditions change, or operation changes, or costs change the standard costs change
o Based on process design performance
Why Have Standard Costs?
o To know the expected cost under expected conditions
o For the budget
o To identify variations quickly
o To provide factual proof that operation is properly managed
o To allow accurate costing of new proposals
o To identify improvement opportunities
Developing Standard Costs
Using Standard Costs to Manage the Operation
o Variance analysis
o Performance reports
Standard
Cost
Direct
Labour
Direct
Materials
Direct
Expenses
Overheads
Website:
Phone: www.lifetime-reliability.com +61 (0) 402 731 563
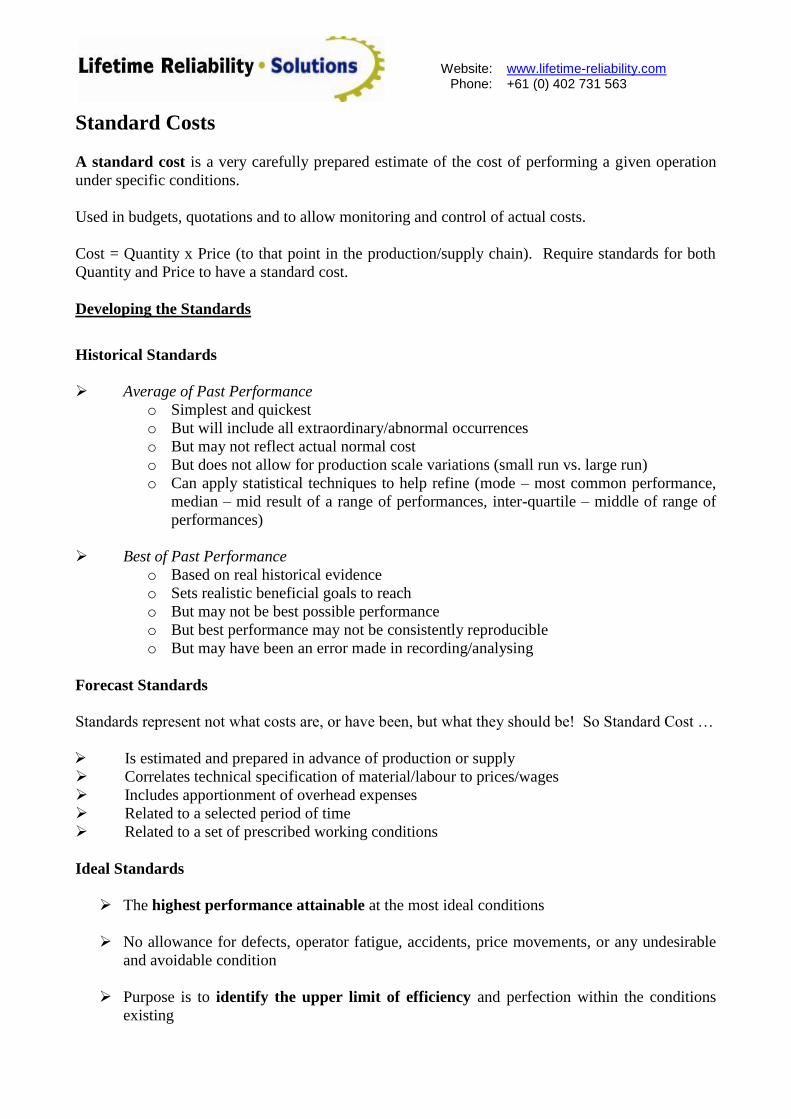
Standard Costs
A standard cost is a very carefully prepared estimate of the cost of performing a given operation
under specific conditions.
Used in budgets, quotations and to allow monitoring and control of actual costs.
Cost = Quantity x Price (to that point in the production/supply chain). Require standards for both
Quantity and Price to have a standard cost.
Developing the Standards
Historical Standards
Average of Past Performance
o Simplest and quickest
o But will include all extraordinary/abnormal occurrences
o But may not reflect actual normal cost
o But does not allow for production scale variations (small run vs. large run)
o Can apply statistical techniques to help refine (mode – most common performance,
median – mid result of a range of performances, inter-quartile – middle of range of
performances)
Best of Past Performance
o Based on real historical evidence
o Sets realistic beneficial goals to reach
o But may not be best possible performance
o But best performance may not be consistently reproducible
o But may have been an error made in recording/analysing
Forecast Standards
Standards represent not what costs are, or have been, but what they should be! So Standard Cost …
Is estimated and prepared in advance of production or supply
Correlates technical specification of material/labour to prices/wages
Includes apportionment of overhead expenses
Related to a selected period of time
Related to a set of prescribed working conditions
Ideal Standards
The highest performance attainable at the most ideal conditions
No allowance for defects, operator fatigue, accidents, price movements, or any undesirable
and avoidable condition
Purpose is to identify the upper limit of efficiency and perfection within the conditions
existing
Website:
Phone: www.lifetime-reliability.com +61 (0) 402 731 563
Unachievable and so can be demoralising to workforce if used.
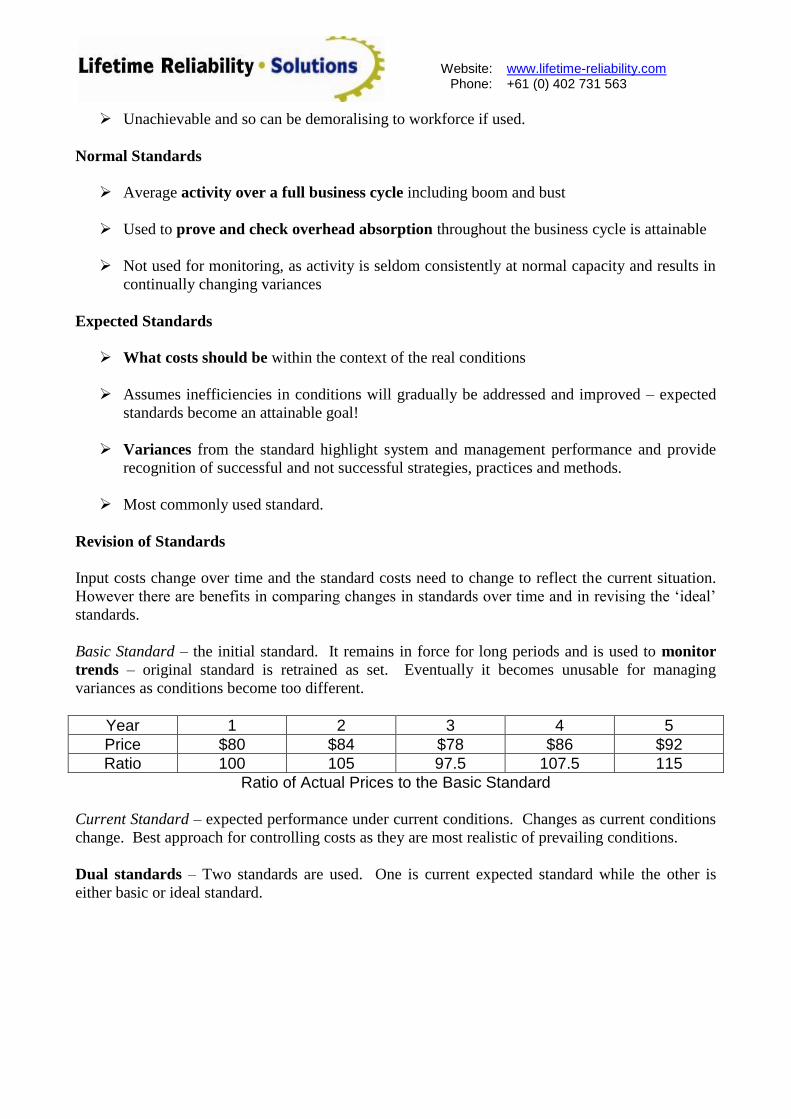
Normal Standards
Average activity over a full business cycle including boom and bust
Used to prove and check overhead absorption throughout the business cycle is attainable
Not used for monitoring, as activity is seldom consistently at normal capacity and results in
continually changing variances
Expected Standards
What costs should be within the context of the real conditions
Assumes inefficiencies in conditions will gradually be addressed and improved – expected
standards become an attainable goal!
Variances from the standard highlight system and management performance and provide
recognition of successful and not successful strategies, practices and methods.
Most commonly used standard.
Revision of Standards
Input costs change over time and the standard costs need to change to reflect the current situation.
However there are benefits in comparing changes in standards over time and in revising the „ideal‟
standards.
Basic Standard – the initial standard. It remains in force for long periods and is used to monitor
trends – original standard is retrained as set. Eventually it becomes unusable for managing
variances as conditions become too different.
Year 1 2 3 4 5
Price $80 $84 $78 $86 $92
Ratio 100 105 97.5 107.5 115
Ratio of Actual Prices to the Basic Standard
Current Standard – expected performance under current conditions. Changes as current conditions
change. Best approach for controlling costs as they are most realistic of prevailing conditions.
Dual standards – Two standards are used. One is current expected standard while the other is
either basic or ideal standard.
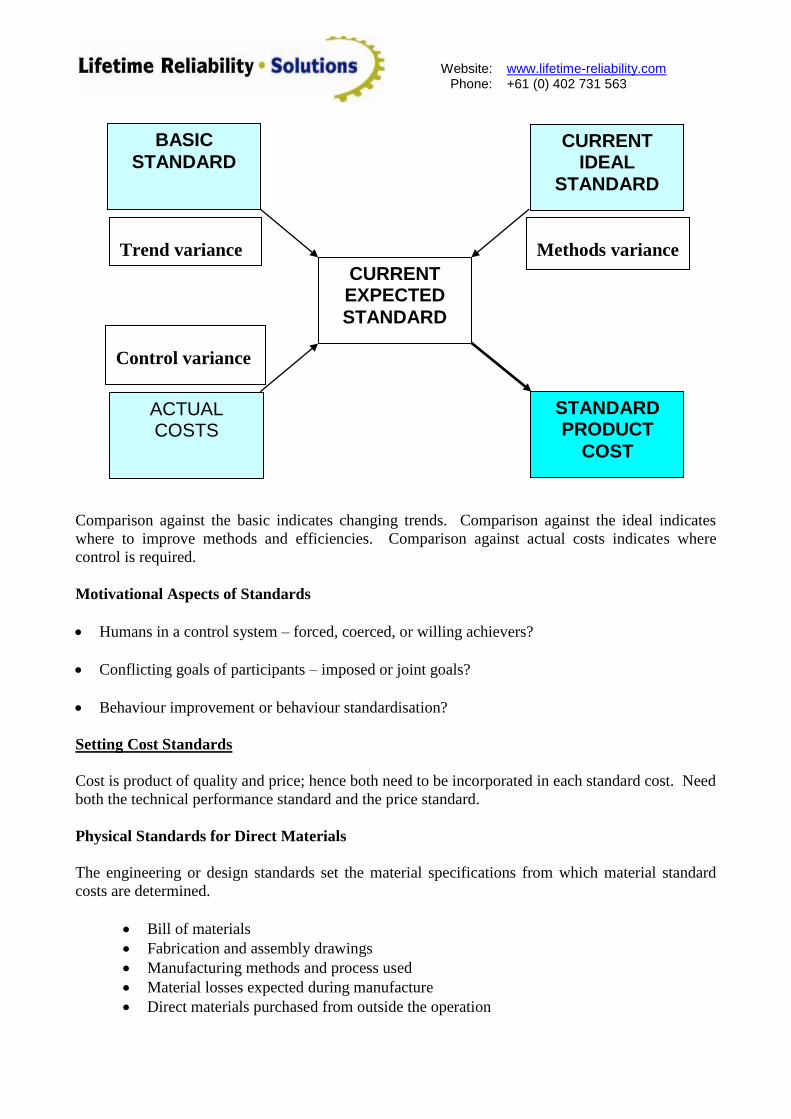
Website:
Phone: www.lifetime-reliability.com +61 (0) 402 731 563
Comparison against the basic indicates changing trends. Comparison against the ideal indicates
where to improve methods and efficiencies. Comparison against actual costs indicates where
control is required.
Motivational Aspects of Standards
Humans in a control system – forced, coerced, or willing achievers?
Conflicting goals of participants – imposed or joint goals?
Behaviour improvement or behaviour standardisation?
Setting Cost Standards
Cost is product of quality and price; hence both need to be incorporated in each standard cost. Need
both the technical performance standard and the price standard.
Physical Standards for Direct Materials
The engineering or design standards set the material specifications from which material standard
costs are determined.
Bill of materials
Fabrication and assembly drawings
Manufacturing methods and process used
Material losses expected during manufacture
Direct materials purchased from outside the operation
BASIC
STANDARD
CURRENT EXPECTED
STANDARD
STANDARD PRODUCT
COST
ACTUAL COSTS
CURRENT IDEAL
STANDARD
Trend variance Methods variance
Control variance
Website:
Phone: www.lifetime-reliability.com +61 (0) 402 731 563
Include benefits (trade discounts, cash discounts, refund on returns, full credit on returnable items)
and adverse effects (disposal, cartage, damage, handling) in standard costs where intended.
Provides chance to use „value analysis‟ to interrogate the function of materials‟ selection and
identify least expensive purchase to meet function.
Standard Operations for Direct Labour
Setting labour performance requires specifying how the operation is performed with the equipment
involved and the estimated time for each operation.
Operation Times are based on the standard hour – „ a hypothetical unit pre-established to represent
the amount of work that should be performed in one hour at standard performance‟. It represents
the average time for the average worker to perform a given task under standard conditions.
Time and method studies.
Average past performance
Test runs factoring in learning curve
Forecast estimates (particularly when tendering)
Standard Wage Rates
Setting standard wages depend on the type/grade of labour (trade, manual, technician, engineer, etc)
and the payment for that type of work including method of remuneration (wages, salary, incentives)
Hourly wages - Time rate usually reflects one grade of labour in any given cost centre for all
operations in that cost centre. Unless there is a clear need for a range of rates in the cost centre
(some tasks need higher skills).
Incentive plans – in piecework the standard rate is the price paid to operators and incurs no
variance. Under a bonus system the rate includes time wages and bonus earned under standard
conditions.
Teamwork – where process requires a team to accomplish it may be better to aggregate all wages
into a standard team hour.
Factory Overhead Standards
Overheads are the additional costs incurred in running a business, which a not directly related to
making the saleable product – manufacturing, engineering, administration, selling, distribution,
research.
Absorption rates are established for each cost centre to enable an equitable charge for overheads to
be made against each product.
Can be based in a time rate where overhead costs are allocated based on passage of time, e.g.
monthly, or use a pre-determined rate based on production volume or throughput.
Methods of absorption relate to where overhead cost is incurred –
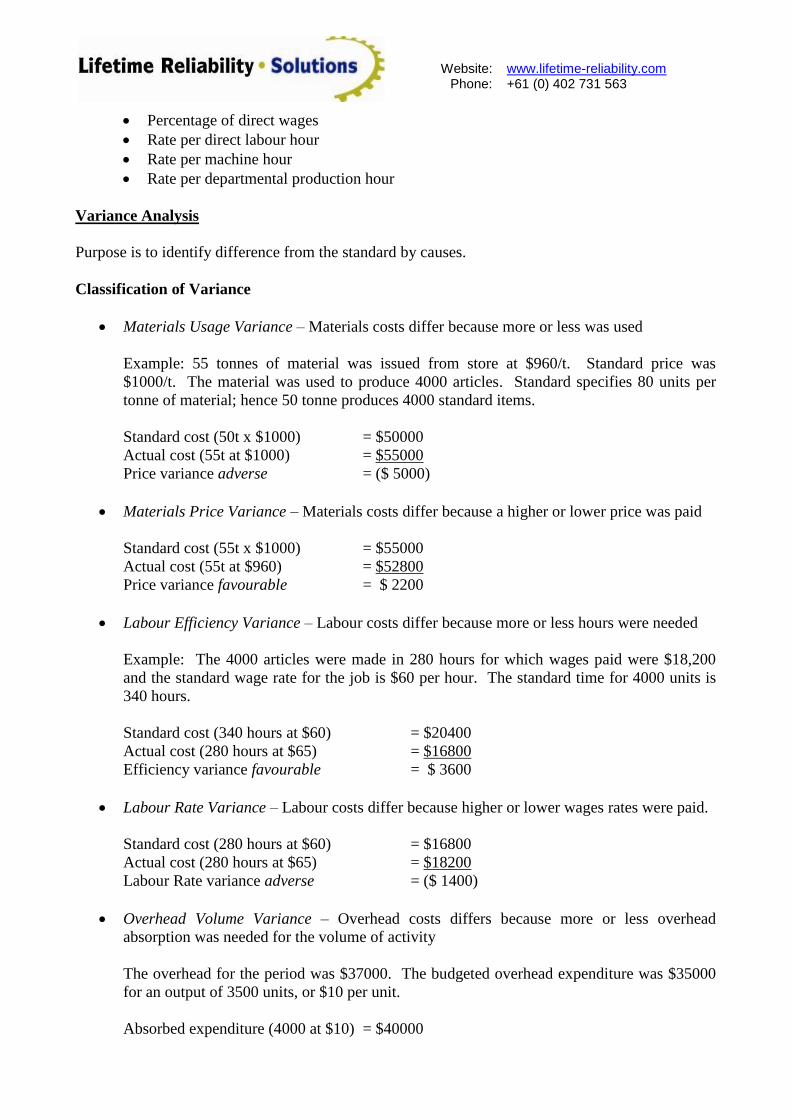
Website:
Phone: www.lifetime-reliability.com +61 (0) 402 731 563
Percentage of direct wages
Rate per direct labour hour
Rate per machine hour
Rate per departmental production hour
Variance Analysis
Purpose is to identify difference from the standard by causes.
Classification of Variance
Materials Usage Variance – Materials costs differ because more or less was used
Example: 55 tonnes of material was issued from store at $960/t. Standard price was
$1000/t. The material was used to produce 4000 articles. Standard specifies 80 units per
tonne of material; hence 50 tonne produces 4000 standard items.
Standard cost (50t x $1000) = $50000
Actual cost (55t at $1000) = $55000
Price variance adverse = ($ 5000)
Materials Price Variance – Materials costs differ because a higher or lower price was paid
Standard cost (55t x $1000) = $55000
Actual cost (55t at $960) = $52800
Price variance favourable = $ 2200
Labour Efficiency Variance – Labour costs differ because more or less hours were needed
Example: The 4000 articles were made in 280 hours for which wages paid were $18,200
and the standard wage rate for the job is $60 per hour. The standard time for 4000 units is
340 hours.
Standard cost (340 hours at $60) = $20400
Actual cost (280 hours at $65) = $16800
Efficiency variance favourable = $ 3600
Labour Rate Variance – Labour costs differ because higher or lower wages rates were paid.
Standard cost (280 hours at $60) = $16800
Actual cost (280 hours at $65) = $18200
Labour Rate variance adverse = ($ 1400)
Overhead Volume Variance – Overhead costs differs because more or less overhead
absorption was needed for the volume of activity
The overhead for the period was $37000. The budgeted overhead expenditure was $35000
for an output of 3500 units, or $10 per unit.
Absorbed expenditure (4000 at $10) = $40000
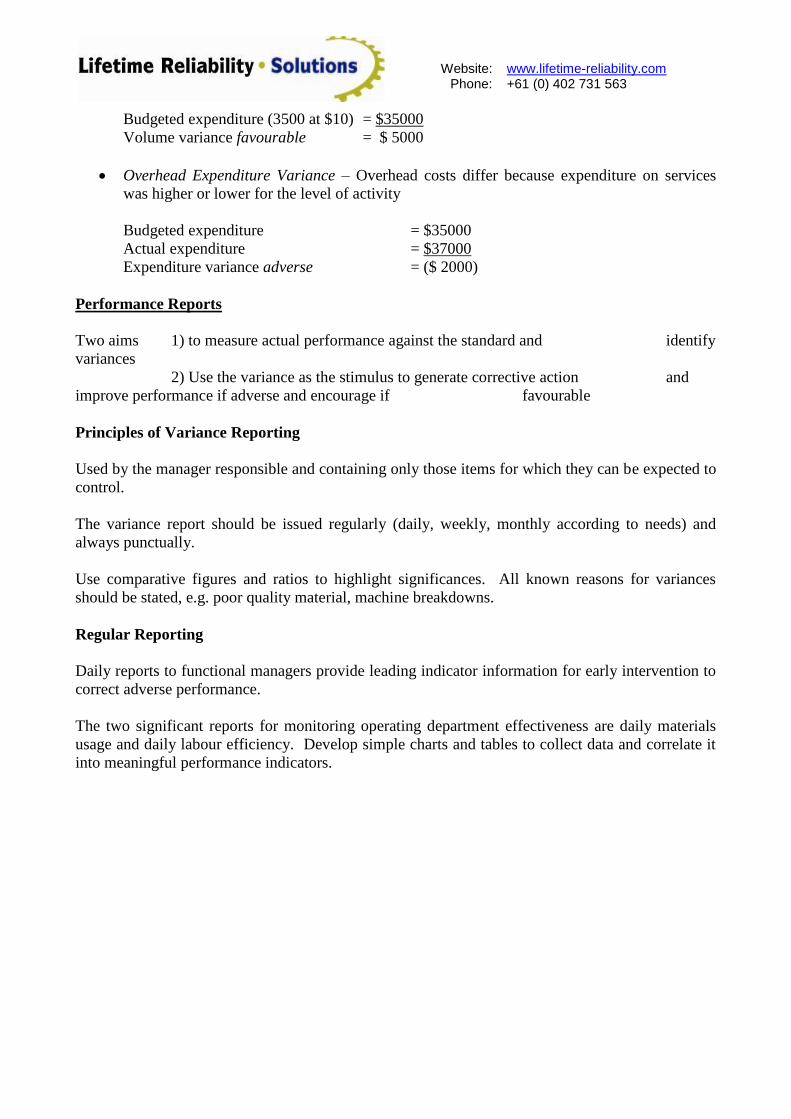
Website:
Phone: www.lifetime-reliability.com +61 (0) 402 731 563
Budgeted expenditure (3500 at $10) = $35000
Volume variance favourable = $ 5000
Overhead Expenditure Variance – Overhead costs differ because expenditure on services
was higher or lower for the level of activity
Budgeted expenditure = $35000
Actual expenditure = $37000
Expenditure variance adverse = ($ 2000)
Performance Reports
Two aims 1) to measure actual performance against the standard and identify
variances
2) Use the variance as the stimulus to generate corrective action and
improve performance if adverse and encourage if favourable
Principles of Variance Reporting
Used by the manager responsible and containing only those items for which they can be expected to
control.
The variance report should be issued regularly (daily, weekly, monthly according to needs) and
always punctually.
Use comparative figures and ratios to highlight significances. All known reasons for variances
should be stated, e.g. poor quality material, machine breakdowns.
Regular Reporting
Daily reports to functional managers provide leading indicator information for early intervention to
correct adverse performance.
The two significant reports for monitoring operating department effectiveness are daily materials
usage and daily labour efficiency. Develop simple charts and tables to collect data and correlate it
into meaningful performance indicators.
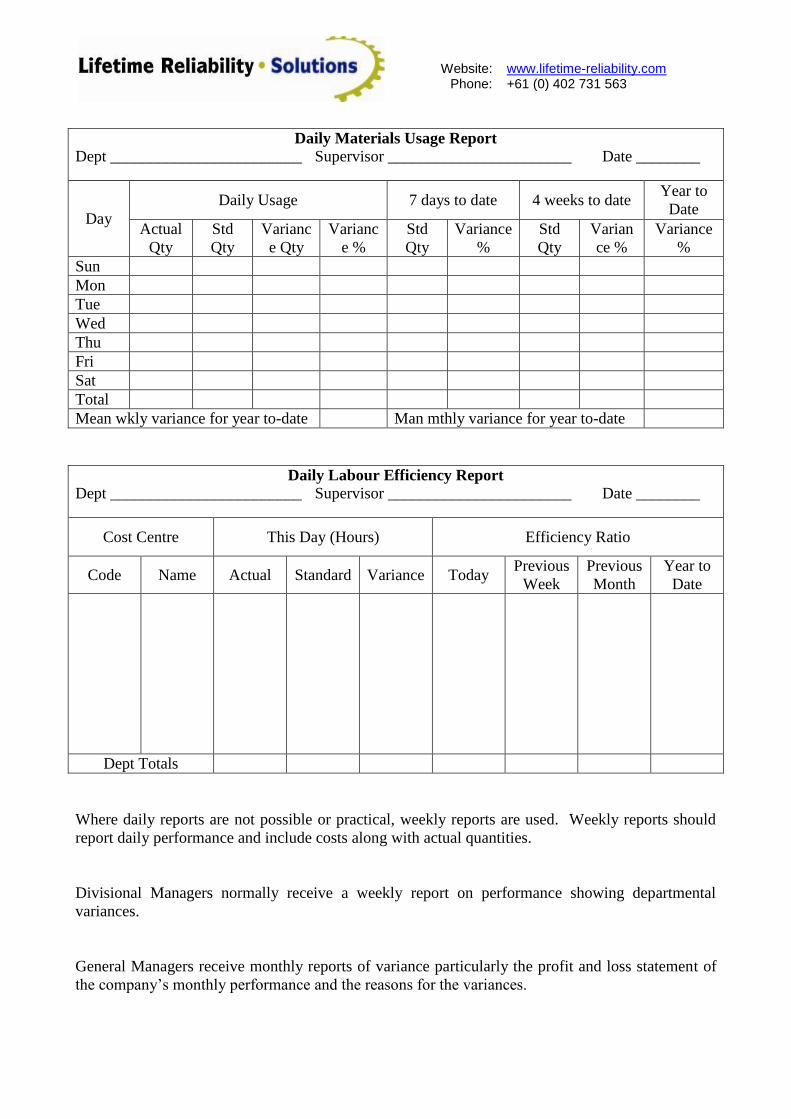
Website:
Phone: www.lifetime-reliability.com +61 (0) 402 731 563
Daily Materials Usage Report
Dept ________________________ Supervisor _______________________ Date ________
Day
Daily Usage 7 days to date 4 weeks to date Year to
Date
Actual
Qty
Std
Qty
Varianc
e Qty
Varianc
e %
Std
Qty
Variance
%
Std
Qty
Varian
ce %
Variance
%
Sun
Mon
Tue
Wed
Thu
Fri
Sat
Total
Mean wkly variance for year to-date Man mthly variance for year to-date
Daily Labour Efficiency Report
Dept ________________________ Supervisor _______________________ Date ________
Cost Centre This Day (Hours) Efficiency Ratio
Code Name Actual Standard Variance Today Previous
Week
Previous
Month
Year to
Date
Dept Totals
Where daily reports are not possible or practical, weekly reports are used. Weekly reports should
report daily performance and include costs along with actual quantities.
Divisional Managers normally receive a weekly report on performance showing departmental
variances.
General Managers receive monthly reports of variance particularly the profit and loss statement of
the company‟s monthly performance and the reasons for the variances.
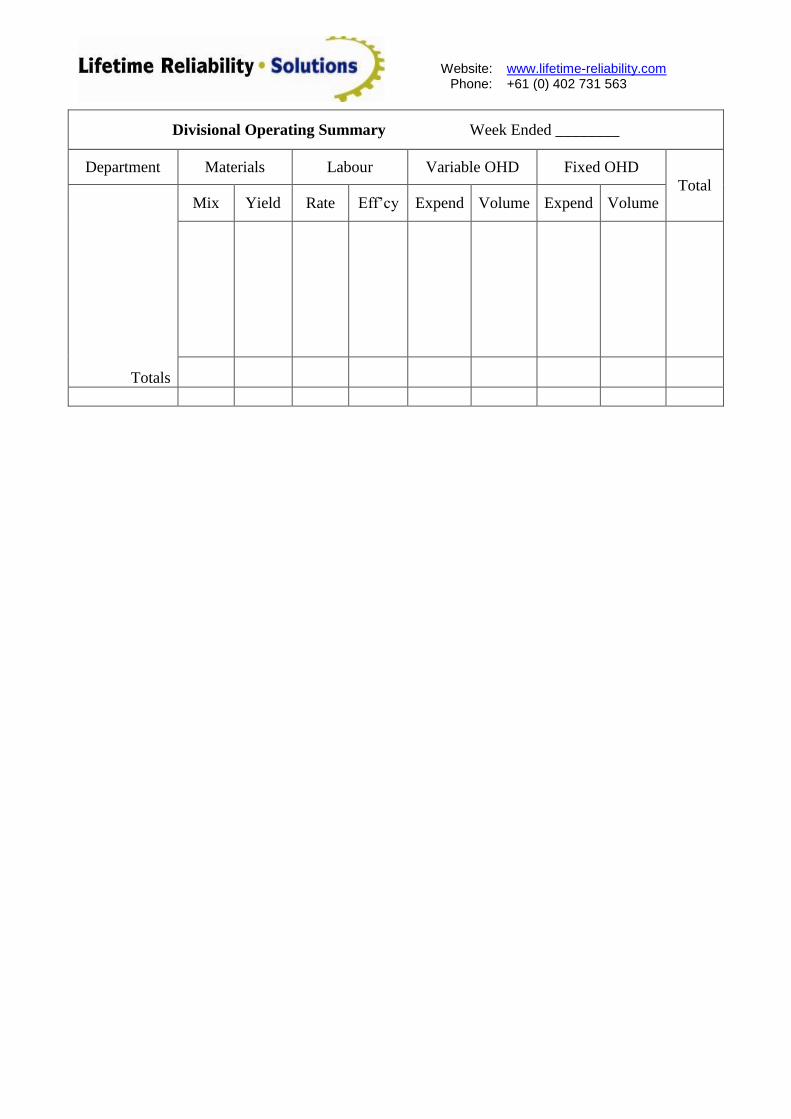
Website:
Phone: www.lifetime-reliability.com +61 (0) 402 731 563
Divisional Operating Summary Week Ended ________
Department Materials Labour Variable OHD Fixed OHD
Total
Totals
Mix Yield Rate Eff‟cy Expend Volume Expend Volume
Website:
Phone: www.lifetime-reliability.com +61 (0) 402 731 563
13. Workplace Failure and Defect Elimination
Here are two simple equations that are very important to your future. These two equations can
make you very successful in your career. The first equation shows how you make money in
business. The second equation shows you how you lose it!
Profit = Sales Revenue - Costs Eq. 13.1 $ = $ - $
Cost of Loss = Frequency x Cost of Eq. 13.2
Of Occurrence Occurrence $ = N x $
Equation 13.1 is what doing business is all about. If you want to be profitable you must make more
money from selling your product or service than it costs to make it. If in your market you cannot
raise your price, then you can only become more profitable by lowering your costs. Keeping your
costs down means you must do two things well:
1. get things right the first time so there are no wasted resources, effort or money.
2. keep improving and finding ways to lower your costs further.
In business we expect things to go right, just as we planned them to go. But continually we find
that they do not. This means that each time something goes wrong your costs automatically go up
because the job was not done right the first time and you now have to expend extra resources and
spend more money to fix it.
Equation 13.2 explains why when things go wrong your company loses money. A mistake, (often
called a failure) costs money to fix. It is money lost that can never return. How much money you
loose each year from failures depends on how big the failures are and how often they happen. How
often a failure happens is known as the „frequency of occurrence‟. The more often a failure occurs,
the more money lost. Even if a failure happens very occasionally, but when it does it is a
catastrophe, you will still lose a lot of money.
All failures must be addressed and the extra costs to fix them are paid for from profits. This
explains how failures and mistakes in a business cause it to become unprofitable.
Risk Based Maintenance
With equation 13.2 you can see that to reduce the losses from failures you must do one of two
things:
1. reduce the number of failures.
2. reduce the cost impact of the failures.
Identify what your failures are costing you so that you can get support from the people in your
company to fix them. Otherwise the cumulative cost of the losses could put you all out of business.
Website:
Phone: www.lifetime-reliability.com +61 (0) 402 731 563
Risk-based maintenance (RBM) revolves around minimising both the frequency of failure and the
cost consequences of failure. One of the best ways to minimise risk is to be accurate when you do
maintenance.
Precision Maintenance – An Accuracy Mind-Set
This is a phylosophy created by Ralph Buscurello from the USA-based Uptime International in the
late 1980‟s. Time and again it has saved companies fortunes in maintenance costs. Now it‟s fully
explained so you can use it too.
Accuracy is Critical
Shaft parallel alignment to under a hair‟s width.
Machine vibration to below standard – balance, transfer isolation
No soft-foot, no body distortion, no pinched parts on assembly
Master craftsmanship work quality
Proof test that quality and accuracy is achieved before doing the next task
Know the Machine Condition
Vibration
Oil
Wear
Stresses
Fatigue
High temperature
Identify and use measurable parameters
Assembly, Disassembly and Re-assembly is to Specification
Develop procedures and check sheets with target, tolerance, proof-test; keep assembly records
Tolerance standards
Check and prove all is correct prior assembly
Test run, check and observe under operating conditions – base level machine condition values
are where they should be
Creative Disassembly
Know what is right to expect – drawings, specifications, component materials
Measure and record wear; record operating life effects for comparison training and reference
Identify root cause of the issue


![Enterprise Asset Management [EAM]](https://img.pdfslide.net/doc/110x75/54471a5cafaf9f61178b48d0/enterprise-asset-management-eam.jpg)