Embed Size (px)
Citation preview
ENTERPRISE RISK MANAGEMENT, INSURER VALUE MAXIMISATION,AND MARKET FRICTIONS*
BY
SHAUN YOW AND MICHAEL SHERRIS
ABSTRACT
Enterprise risk management has become a major focus for insurers and rein-surers. Capitalization and pricing decisions are recognized as critical to firmvalue maximization. Market imperfections including frictional costs of capi-tal such as taxes, agency costs, and financial distress costs are an importantmotivation for enterprise risk management. Risk management reduces thevolatility of financial performance and can have a significant impact on firmvalue maximization by reducing the impact of frictional costs. Insurers operatein imperfect markets where demand elasticity of policyholders and preferencesfor financial quality of insurers are important determinants of capitalizationand pricing strategies. In this paper, we analyze the optimization of enterpriseor firm value in a model with market imperfections. A realistic model of aninsurer is developed and calibrated.
Frictional costs, imperfectly competitive demand elasticity, and preferencesfor financial quality are explicitly modelled and implications for enterprise riskmanagement are quantified.
1. INTRODUCTION
Risk management for an insurer has generally focussed on determining thelevel of capitalization using risk based or economic capital. Using economiccapital measures for financial decision making is becoming a standard forfinancial service firms including insurers. A 2005 survey by Pricewaterhouse-Coopers of 200 senior executives in financial service firms throughout Asia,Europe, and the U.S., with 7% of respondents from the insurance industry,found that 44% quantified risk with economic capital and 13% planned touse economic capital within 12 months. The survey revealed that economic
Astin Bulletin 38(1), 293-339. doi: 10.2143/AST.38.1.2030415 © 2008 by Astin Bulletin. All rights reserved.
* Acknowledgement: The authors acknowledge financial support from Australian Research CouncilDiscovery Grants DP0663090 and DP0556775 and support from the UNSW Actuarial Foundationof the Institute of Actuaries of Australia. Support from Georgia State University 2007 BowlesSymposium and the ERM Symposium is gratefully acknowledged. Yow acknowledges the financialsupport of Ernst and Young and the award of the Faculty of Business Honours Year Scholarship.
0587-07_Astin38/1_16 02-06-2008 13:49 Pagina 293
, available at https://www.cambridge.org/core/terms. https://doi.org/10.1017/S051503610001518XDownloaded from https://www.cambridge.org/core. IP address: 54.39.106.173, on 30 May 2020 at 06:30:26, subject to the Cambridge Core terms of use
capital is a critical component for the success of a financial service firm. As astrategic tool, economic capital impacted pricing policies in 20% of firms and10% of respondents discontinued unprofitable lines of business based on eco-nomic capital. The paper by Hitchcox et al. [15] discusses the cost of capitaland the impact of frictional costs for a model insurer with an objective ofassessing target capital and premium loadings for insurers. Swiss Re [31] alsoassess the cost of capital for insurers and analyze frictional costs, referred toas the insurance cost of capital.
In practice enterprise value maximization has a broader focus than eco-nomic capital and must consider the impact of liability pricing, capitalization,and asset-liability management decisions on capital costs, risk, and firm value.The famous Modigliani-Miller theorem (Modigliani and Miller [22]) statesthat in perfect markets a firm’s capital structure, which is an integral compo-nent of its risk management, is irrelevant to firm value. Risk management willnot impact firm value in perfect markets. In practice capital market imper-fections and informational asymmetries create frictional costs for the firm.These frictional costs provide the economic rationale for risk management and,as demonstrated in this paper, have a significant impact on a firm’s optimal cap-ital structure and pricing strategies.
The economic motivation for risk management is to maximize firm value.Part I of Culp [3], the Chapter by Hommel “Value Based Motives for RiskManagement” in Frenkel, Hommel, and Rudolf [10] as well as Chapter 3 ofStulz [29] provide excellent coverage of how risk management can be used toincrease firm value. McNeil et al. [20] also discuss three ways in which enter-prise risk management enhances insurer value by minimizing frictional costs.First, risk management reduces cash flow volatility and since firm profits allow-ing for taxes are convex, risk management increases expected after-tax profits.Second, reduced cash flow volatility also reduces the costs of financial distressby lowering the probability of insolvency and the expected costs of financialdistress. Finally, since external financing is more costly than internal financing,reduced cash flow volatility will reduce the expected requirement for, andexpected costs of, external financing. Agency costs are also an important fric-tional cost for an insurer. The management of an insurer are agents of theshareholders, making investment, underwriting, and risk management deci-sions to maximize shareholder value. Management will act in self interest andare costly to monitor. Insurers are complex and agency costs of capital, suchas sub-optimal risk management decisions and management perquisites, reducefirm value and are an important risk management issue.
Capital also impacts an insurer’s pricing strategy and the pricing strategyis an important source of risk and value. As Merton and Perold [21] note, foran insurer debtholders are also its primary customers. An insurer’s under-writing risk is not easily traded or hedged and insurers hold capital to ensurepolicyholder claims are met. Policyholders are concerned about financial qual-ity and the payment of claims. Empirical evidence in Phillips, Cummins, andAllen [25] shows that the demand for insurance is influenced by the financial
294 S. YOW AND M. SHERRIS
0587-07_Astin38/1_16 02-06-2008 13:49 Pagina 294
, available at https://www.cambridge.org/core/terms. https://doi.org/10.1017/S051503610001518XDownloaded from https://www.cambridge.org/core. IP address: 54.39.106.173, on 30 May 2020 at 06:30:26, subject to the Cambridge Core terms of use
quality of the insurer. Insurers operate in a regulated environment where riskbased capital is held to ensure a low risk of insolvency or financial distress. Forbanks and insurers, economic capital is central to enterprise risk managementbut understanding the interaction between capital and pricing is critical to thesuccessful financial operation of an insurer.
Panning [24] develops a firm value maximizing model for an insurer basedon value added which is defined as the present value of future after-tax profitsallowing for insurer default in excess of surplus. Zanjani [36] formally developsa firm value maximizing model where capital is costly to hold because of fric-tional costs and policyholders have inelastic demand and care about the finan-cial quality of the insurer. Zanjani [36] provides analytical results for insurercapitalization and pricing with examples based on a normal distribution ofrisks. In his conclusion on page 30, Zanjani [36] states:
Understanding the exact nature of capital costs and calibrating their influence onmarket behavior are important areas for future research.
In this paper we examine the impact of frictional costs and market imperfec-tions on enterprise risk management, capitalization, and pricing decisions ina multi-line insurer. Our aim is to demonstrate the importance of the differentmarket frictions and provide guidance on enterprise risk management strategies,optimal capitalization, and multi-line insurance pricing. Optimal strategies aredetermined by maximizing insurer enterprise value added (EVA) using a valuebased measure allowing for frictional costs of capital that is different to eco-nomic value added, the financial performance measure developed by SternStewart and Co., and similar to that of Panning [24]. The model assumptionsare based on those of Zanjani [36] and we include frictional costs, imperfectdemand, and then optimize EVA through capitalization and pricing strategies.We model price elasticity across different lines of business. We study in detailthe impact of market frictions for taxes, agency costs, and financial distress costsusing a calibrated model of an insurer representative of the Australian generalinsurance industry.
We find that the impact of frictional costs on an insurer’s optimal riskbased capital is more significant than would at first be expected and thisvaries significantly by the type of frictional cost. Higher tax and agency costsof capital result in reductions in optimal levels of capitalization and higher firm-wide insolvency risk since costs of capital reduce the returns to shareholders.Conversely, higher costs of financial distress create an incentive for insurersto increase the capitalization of the firm and improve financial quality inorder to write business at value-adding prices. We also find that under optimalstrategies shareholders bear most of the frictional costs of capital and thatthese are not in general passed on to policyholders through higher insuranceprices.
Enterprise risk management has an objective of enhancing the value of aninsurer through its risk management strategies. This paper demonstrates thatbecause of the importance of financial quality to pricing and the impact of
ENTERPRISE RISK MANAGEMENT AND MARKET FRICTIONS 295
0587-07_Astin38/1_16 02-06-2008 13:49 Pagina 295
, available at https://www.cambridge.org/core/terms. https://doi.org/10.1017/S051503610001518XDownloaded from https://www.cambridge.org/core. IP address: 54.39.106.173, on 30 May 2020 at 06:30:26, subject to the Cambridge Core terms of use
imperfect demand elasticity, risk based capital is a critical component of theoptimal strategy for an enterprise maximizing insurer. Understanding the linkbetween enterprise value, frictional costs, capital, and pricing strategies is alsofundamental to successful financial performance and optimal risk manage-ment for an insurer.
The remainder of this paper is organized as follows. Section 2 developsa single-period economic model of an insurer in imperfect markets. Section 3calibrates the model to Australian general insurance industry data and modelspolicyholder demand for insurance. Section 4 presents results and a discus-sion of findings. Section 5 concludes.
2. THE INSURER MODEL
Doherty and Garven [9] develop a single-period option pricing framework forinsurer pricing and capitalization including default risk and taxation. We developa framework for analyzing the optimal pricing and capitalization of an insurerin imperfect markets based on Zanjani [36]. The objective we use for firm valuemaximization is similar to that of Panning [24]. The model is a single-periodmodel of an insurer that writes N lines of business at time 0, with claims dueto be paid at time 1. While we focus on the single-period model, the model canbe extended to a multi-period model by assuming business is renewed at theend of each year and optimal capital and pricing decisions are made in the lightof evolving experience. Although Panning [24] assumes multi-period insurercash flows, the optimization is at a single initial point of time and does notinvolve dynamic decision making.
Three types of frictional costs are included: taxes, agency costs of capital,and costs of financial distress. Importantly, insurance product markets are notassumed to be perfectly competitive as is often assumed for financial assetmarkets. In practice, information asymmetries and switching costs for policy-holders result in a downward sloping demand curve as a function of price perunit of risk. We model the price elasticity of demand by line. Policyholdersare also assumed to care about enterprise wide insolvency risk, so that insurerswith higher capitalization and financial quality have higher market premiums.The insurer determines capital and pricing strategies that maximize EVA allow-ing for costs of capital and imperfect demand elasticity for its policies. Theresult is an optimal supply of insurance policies based on value maximizationin the presence of frictional costs allowing for demand by policyholders for eachline of business. Optimal capital and pricing strategies are determined in themodel.
Value maximization as a firm objective is consistent with modern corporatefinancial theory and the economic foundation of risk management. In perfectmarkets, the Fisher Separation Theorem (MacMinn [18]) implies that investorswith diverse risk preferences will invest capital into firms and delegate produc-tion decisions to management, whose objective is to maximize firm value
296 S. YOW AND M. SHERRIS
0587-07_Astin38/1_16 02-06-2008 13:49 Pagina 296
, available at https://www.cambridge.org/core/terms. https://doi.org/10.1017/S051503610001518XDownloaded from https://www.cambridge.org/core. IP address: 54.39.106.173, on 30 May 2020 at 06:30:26, subject to the Cambridge Core terms of use
regardless of investor risk preferences. Smith [28] demonstrates that FisherSeparation also holds in the case of incomplete markets when investor pref-erences, as given by their utility, satisfy conditions of additivity and constantrelative risk aversion. Without frictions, value maximizing firms should act asif they were risk neutral. Frictional costs create convexity in the after-tax profitsof the firm. Frictional costs are the costs of holding capital in the firm and areregarded as the insurance costs of capital (Swiss Re [31]). They impact finan-cial decision making by creating incentives to reduce risk and volatility in orderto maximize firm value. Explicitly modelling frictional costs allows thequantification of the costs and benefits of holding too much capital as well asthe costs and benefits of holding too little capital.
The main contributor to value added in an insurer is the profit margin byline of business. Determining optimal pricing strategies that maximize profitmargins by line, taking into account frictional costs and imperfect policyholderdemand, has important implications for optimal capitalization and hence forenterprise risk management. The optimization approach does not require theallocation of capital or frictional costs of capital to line of business for pricingsince optimal prices are determined directly taking into account policyholderdemand and preferences for financial quality.
The model is a single-period model where the insurer determines an opti-mal capital and pricing strategy that will maximize EVA. EVA is the increasein value of the insurer equity from writing the insurance business over andabove the initial capital subscribed allowing for frictional costs of capital.The model is calibrated to representative insurer data and implications forenterprise risk management are assessed. The model includes market imper-fections and allows for capital and pricing strategy interactions. The modelexplicitly allows for optimal insurer supply, based on its value maximization,and policyholder demand is determined from the by-line price elasticities.The model is solved numerically because of the interdependencies in the bal-ance sheet and the optimization determines the risk based capital and valuemaximizing profit loadings by line.
2.1. Insurer Balance Sheet and Model Assumptions
D’Arcy and Gorvett [8] develop a hypothetical but representative insurer in orderto examine the impact of varying assumptions on underwriting profit margins.We take a similar approach to construct a representative insurer, however, ourobjective is to determine optimal capitalization and insurer profit marginsallowing for varying frictional costs and, importantly, including policyholderdemand elasticity and a preference for financial quality in the model. We fol-low Doherty and Garven [9] and Sherris [26] in the construction of the bal-ance sheet, ignoring frictional costs. We then develop a market value basedbalance sheet incorporating frictional costs of capital. The balance sheet of theinsurer is determined using economic valuation of cashflows.
ENTERPRISE RISK MANAGEMENT AND MARKET FRICTIONS 297
0587-07_Astin38/1_16 02-06-2008 13:49 Pagina 297
, available at https://www.cambridge.org/core/terms. https://doi.org/10.1017/S051503610001518XDownloaded from https://www.cambridge.org/core. IP address: 54.39.106.173, on 30 May 2020 at 06:30:26, subject to the Cambridge Core terms of use
Initial cash capital subscribed at time 0 is denoted by R0. Premium revenueat time 0 for sales from the N lines of business is
P p q, ,i ii
N
0 0 01
==
!
where pi,0 is the premium for a policy in the ith line and qi,0 is the quantity soldin the ith line. We assume policies in each line of business are homogeneouswith respect to the loss distribution. The production cost for policies sold isassumed to be a function of quantities sold across all lines
c0 = c (q1,0, …, qN,0).
These include expenses for underwriting, administration, marketing, and bro-ker commissions. The cash value of the assets at time 0 is then given by
V0 = R0 + P0 – c0.
In order to determine the actuarial value of the liabilities it is necessary tovalue the time 1 payoffs. The time 1 random loss payoff for a policy in the ithline is denoted by Li,1 and the total random losses at time 1 is denoted by L1
with
,L L q, ,i ii
N
1 1 01
==
!
The value of total liabilities at time 0 are valued using a market based risk neutral valuation assumption. We assume that there exists a risk-neutral Qprobability measure that values all cash flows in the model. This is consistentwith financial pricing theory under the assumption of arbitrage free markets(Cochrane [2]). Our model is incomplete because of frictional costs. Becausewe require the valuation model to be arbitrage free, a risk-neutral Q probabilitymeasure exists, but this measure may not be unique. We have
,L e qm , ,r
i ii
N
0 1 01
=-
=
!
where
mi,1 = EQ [Li,1],
is the (risk-adjusted or market consistent) expected value of the insurance lossper policy for the ith line of business and r is the continuous compounding riskfree rate of interest.
298 S. YOW AND M. SHERRIS
0587-07_Astin38/1_16 02-06-2008 13:49 Pagina 298
, available at https://www.cambridge.org/core/terms. https://doi.org/10.1017/S051503610001518XDownloaded from https://www.cambridge.org/core. IP address: 54.39.106.173, on 30 May 2020 at 06:30:26, subject to the Cambridge Core terms of use
Assets accumulate according to a random return of rV so that the assetpayoffs at time 1 are determined by the random return on the asset portfolio.We have
V1 = V0 erV.
Given the cash initially invested from capital and premiums the initial value isrelated to the time 1 payoff under fair pricing in asset markets by,
V0 = e – rEQ [V1].
Although all the values are based on market values and are consistently val-ued using risk neutral valuation, there is an important balance sheet compo-nent still to be included. The model must allow for limited liability since ifthere are insufficient assets to meet liabilities then the policyholders will havetheir claims reduced by the shortfall. This is the risk of insolvency and impor-tantly reflects the financial quality of the insurer.
To allow for the risk of insolvency, at time 1 policyholders with claimspayable are assumed to receive claim amounts contingent on the value of theassets of the insurer’s balance sheet. Each line has full payment on all its poli-cies in the event that asset exceed liabilities so that
L L q, ,i ii
N
1 1 01
==
! if A1 $ L1
otherwise they are entitled to the assets
V1 if V1 < L1.
Payoffs to shareholders will also depend on the balance sheet at time 1 reflectingtheir limited liability. If assets are insufficient to meet liabilities then share-holders do not have to subscribe more capital at time 1 to meet the shortfall.Shareholder payoffs are then
V1 – L1 if V1 $ L1
and
0 if V1 < L1.
In the event of insolvency, the shortfall of assets over liabilities that the poli-cyholders have to bear in reduced claim payments is
D1 = max [L1 – V1,0]
ENTERPRISE RISK MANAGEMENT AND MARKET FRICTIONS 299
0587-07_Astin38/1_16 02-06-2008 13:49 Pagina 299
, available at https://www.cambridge.org/core/terms. https://doi.org/10.1017/S051503610001518XDownloaded from https://www.cambridge.org/core. IP address: 54.39.106.173, on 30 May 2020 at 06:30:26, subject to the Cambridge Core terms of use
and we define
D0 = e– rEQ [D1]
where D0 is the insolvency or default put option value. The default ratio, d0,is defined as the default risk per dollar of liabilities where D0 = L0d0. Thedefault ratio can be valued as a put option on the asset-liability ratio
d0 = e– rEQ [d1]
where
d1 = max[1 – L1, 0]
and the asset-liability ratio is
L1 = LV
1
1 .
If we denote the policyholder claims payoff allowing for insolvency at time 1 by
H1 = min [L1,V1] = L1 – D1
then at time 0 this insolvency adjusted value is given by
H0 = e– rEQ [L1 – D1] = L0 – D0
= L0 (1 – d0). (1)
For shareholders, if we denote the payoff to the equity at time 1 by E1 then
E1 = max [V1 – L1, 0] = V1 – L1 + D1.
and at time 0 equity value, denoted by E0, is
E0 = e– rEQ [V1 – L1 + D1]= V0 – L0 + D0. (2)
The effect of explicitly taking limited liability into account, as shown in Equa-tion (1), is that the market value of policyholder claims is reduced by the valueof the default put option. The economic value of liabilities is given by H0. Forshareholders, the default put results in an increase in the value of payoffs, asshown by Equation (2).
300 S. YOW AND M. SHERRIS
0587-07_Astin38/1_16 02-06-2008 13:49 Pagina 300
, available at https://www.cambridge.org/core/terms. https://doi.org/10.1017/S051503610001518XDownloaded from https://www.cambridge.org/core. IP address: 54.39.106.173, on 30 May 2020 at 06:30:26, subject to the Cambridge Core terms of use
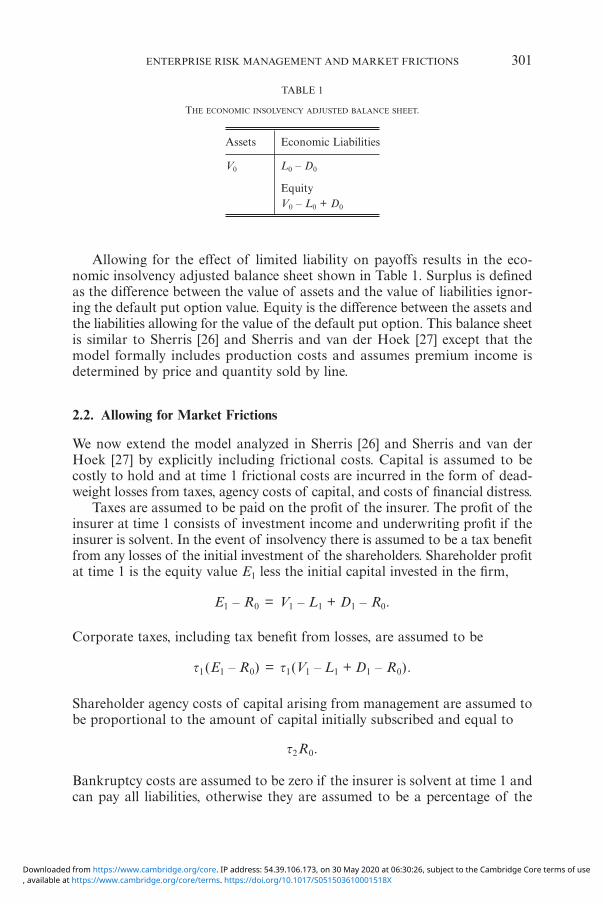
Allowing for the effect of limited liability on payoffs results in the eco-nomic insolvency adjusted balance sheet shown in Table 1. Surplus is definedas the difference between the value of assets and the value of liabilities ignor-ing the default put option value. Equity is the difference between the assets andthe liabilities allowing for the value of the default put option. This balance sheetis similar to Sherris [26] and Sherris and van der Hoek [27] except that themodel formally includes production costs and assumes premium income isdetermined by price and quantity sold by line.
2.2. Allowing for Market Frictions
We now extend the model analyzed in Sherris [26] and Sherris and van derHoek [27] by explicitly including frictional costs. Capital is assumed to becostly to hold and at time 1 frictional costs are incurred in the form of dead-weight losses from taxes, agency costs of capital, and costs of financial distress.
Taxes are assumed to be paid on the profit of the insurer. The profit of theinsurer at time 1 consists of investment income and underwriting profit if theinsurer is solvent. In the event of insolvency there is assumed to be a tax benefitfrom any losses of the initial investment of the shareholders. Shareholder profitat time 1 is the equity value E1 less the initial capital invested in the firm,
E1 – R0 = V1 – L1 + D1 – R0.
Corporate taxes, including tax benefit from losses, are assumed to be
t1 (E1 – R0) = t1(V1 – L1 + D1 – R0).
Shareholder agency costs of capital arising from management are assumed tobe proportional to the amount of capital initially subscribed and equal to
t2R0.
Bankruptcy costs are assumed to be zero if the insurer is solvent at time 1 andcan pay all liabilities, otherwise they are assumed to be a percentage of the
ENTERPRISE RISK MANAGEMENT AND MARKET FRICTIONS 301
TABLE 1
THE ECONOMIC INSOLVENCY ADJUSTED BALANCE SHEET.
Assets Economic Liabilities
V0 L0 – D0
EquityV0 – L0 + D0
0587-07_Astin38/1_16 02-06-2008 13:49 Pagina 301
, available at https://www.cambridge.org/core/terms. https://doi.org/10.1017/S051503610001518XDownloaded from https://www.cambridge.org/core. IP address: 54.39.106.173, on 30 May 2020 at 06:30:26, subject to the Cambridge Core terms of use
shortfall of assets over liabilities reflecting the size of the insolvency. Thusassumed bankruptcy costs are
0 if V1 $ L1
or
f (L1 – V1) if V1 < L1.
Altman [1] and Warner [34] report bankruptcy costs as percentages of firmvalue and shareholder value respectively. We assume bankruptcy costs will behigher the larger the shortfall of assets to liabilities. The time 1 payoffs to pol-icyholders allowing for bankruptcy costs is then
H1 if V1 $ L1
and
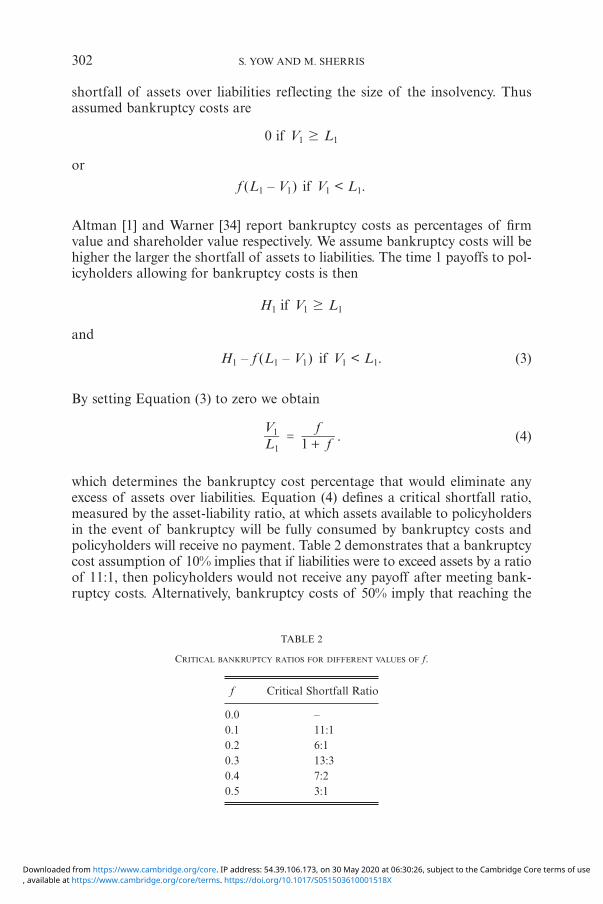
H1 – f (L1 – V1) if V1 < L1. (3)
By setting Equation (3) to zero we obtain
1 .L ff
11=
+
V(4)
which determines the bankruptcy cost percentage that would eliminate anyexcess of assets over liabilities. Equation (4) defines a critical shortfall ratio,measured by the asset-liability ratio, at which assets available to policyholdersin the event of bankruptcy will be fully consumed by bankruptcy costs andpolicyholders will receive no payment. Table 2 demonstrates that a bankruptcycost assumption of 10% implies that if liabilities were to exceed assets by a ratioof 11:1, then policyholders would not receive any payoff after meeting bank-ruptcy costs. Alternatively, bankruptcy costs of 50% imply that reaching the
302 S. YOW AND M. SHERRIS
TABLE 2
CRITICAL BANKRUPTCY RATIOS FOR DIFFERENT VALUES OF f.
f Critical Shortfall Ratio
0.0 –0.1 11:10.2 6:10.3 13:30.4 7:20.5 3:1
0587-07_Astin38/1_16 02-06-2008 13:49 Pagina 302
, available at https://www.cambridge.org/core/terms. https://doi.org/10.1017/S051503610001518XDownloaded from https://www.cambridge.org/core. IP address: 54.39.106.173, on 30 May 2020 at 06:30:26, subject to the Cambridge Core terms of use
critical ratio is much more likely as liabilities only have to exceed assets by aratio of 3:1 before firm assets are fully consumed by bankruptcy costs.
By the definition of bankruptcy costs their value at time 0 is determinedby the default put option value and equal to
fD0.
The value of policyholder claims at time 0 allowing for bankruptcy costsbecomes
H0 = L0 – (1 + f ) D0. (5)
Bankruptcy costs reduce the value of policyholder claims but do not explic-itly affect shareholder payoffs.
For shareholders, allowing for corporate tax and agency costs, the time 1payoff is
E1 = (V1 – L1 + D1) (1 – t1) + (t1 – t2)R 0.
and at time 0 the shareholder equity value is
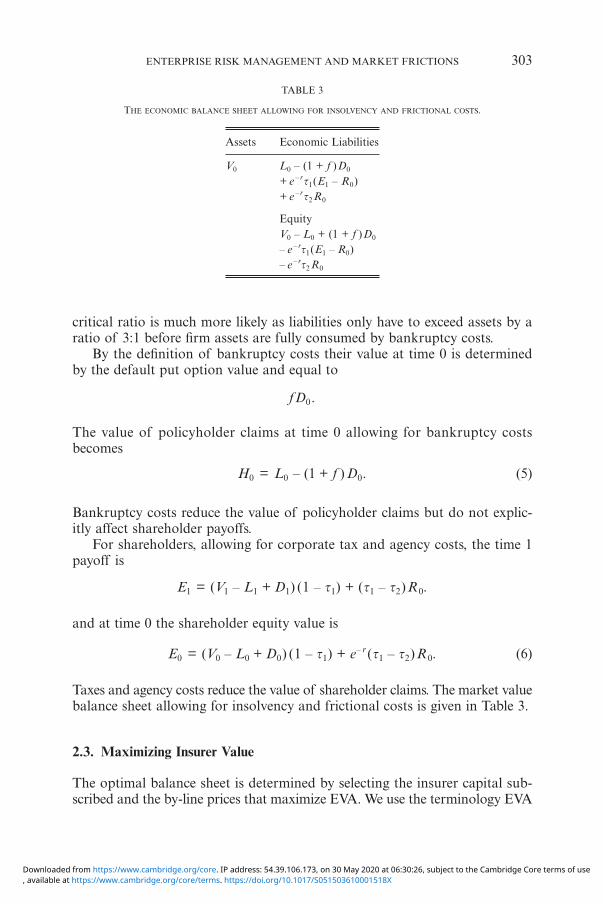
E0 = (V0 – L0 + D0) (1 – t1) + e– r(t1 – t2)R 0. (6)
Taxes and agency costs reduce the value of shareholder claims. The market valuebalance sheet allowing for insolvency and frictional costs is given in Table 3.
2.3. Maximizing Insurer Value
The optimal balance sheet is determined by selecting the insurer capital sub-scribed and the by-line prices that maximize EVA. We use the terminology EVA
ENTERPRISE RISK MANAGEMENT AND MARKET FRICTIONS 303
TABLE 3
THE ECONOMIC BALANCE SHEET ALLOWING FOR INSOLVENCY AND FRICTIONAL COSTS.
Assets Economic Liabilities
V0 L0 – (1 + f )D0
+ e– rt1(E1 – R0)+ e– rt2R0
EquityV0 – L0 + (1 + f )D0
– e– rt1(E1 – R0)– e– rt2R0
0587-07_Astin38/1_16 02-06-2008 13:49 Pagina 303
, available at https://www.cambridge.org/core/terms. https://doi.org/10.1017/S051503610001518XDownloaded from https://www.cambridge.org/core. IP address: 54.39.106.173, on 30 May 2020 at 06:30:26, subject to the Cambridge Core terms of use
to differentiate the model used here from many other value maximizationapproaches. The objective is not to maximize insurer shareholder value butto maximize the firm value added from writing insurance business over andabove the value of the equity subscribed. Value is added by writing insurancebusiness at profit loads above the risk adjusted expected value of claims andcosts, allowing for insolvency, reflecting policyholder demand elasticities andpreferences for financial quality. Frictional costs of capital reduce value andholding too much capital increases these costs. However, holding too low alevel of capital impacts market demand and there is a trade-off because offrictional costs. This trade-off produces an optimal level of capitalization andan optimal pricing strategy.
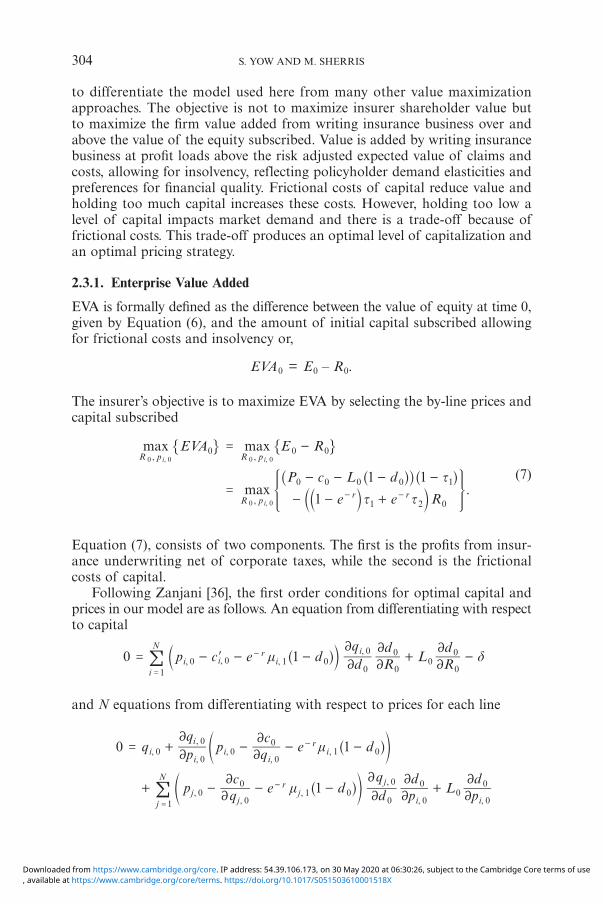
2.3.1. Enterprise Value Added
EVA is formally defined as the difference between the value of equity at time 0,given by Equation (6), and the amount of initial capital subscribed allowingfor frictional costs and insolvency or,
EVA0 = E0 – R0.
The insurer’s objective is to maximize EVA by selecting the by-line prices andcapital subscribed
p p
p.
max max
max
A E R
P c L d
e e R
t
t t
1 1
1
, ,
,
R R
Rr r
0 0 0
0 0 0 0 1
1 2 0
, ,
,
i i
i
0 0 0 0
0 0
= -
=- - - -
- - +- -
EV
^_ ^
ab
hi h
k l
" "
*
, ,
4
(7)
Equation (7), consists of two components. The first is the profits from insur-ance underwriting net of corporate taxes, while the second is the frictionalcosts of capital.
Following Zanjani [36], the first order conditions for optimal capital andprices in our model are as follows. An equation from differentiating with respectto capital
,i 0p c e d dq
Rd
L Rd
m d0 1, ,,
i ii
i
N
0 1 00
0
0
0
10
0
0
2
2
22
22
= - - - + -=
r-�! ^b hl
and N equations from differentiating with respect to prices for each line
mi
jj
jj
iq pq
p qc
e d
ce d d p
dL p
d
0 1
1
,,
,,
,,
,,
,,
, ,
ii
ii
j
N
i i
00
00
0
01 0
00
01 0
1 0
0
0
00
0
0
2
2
22
22
2
2
22
22
= + - - -
+ - - - +=
r
r
-
- mq
p q!
^e
^e
ho
ho
304 S. YOW AND M. SHERRIS
0587-07_Astin38/1_16 02-06-2008 13:50 Pagina 304
, available at https://www.cambridge.org/core/terms. https://doi.org/10.1017/S051503610001518XDownloaded from https://www.cambridge.org/core. IP address: 54.39.106.173, on 30 May 2020 at 06:30:26, subject to the Cambridge Core terms of use
where
.e e
d t
t t
1
1
1
1 2=
-
- +r r- -a k
These equations must be solved simultaneously and cannot be solved analyt-ically. It is also necessary to include in the optimization constraints to ensurethat the balance sheet values for the put option and the value of the liabilitiesare equal to the risk adjusted value of the time 1 payoffs. These constraintsmake the first order conditions more complex and the optimization must besolved numerically.
3. DATA AND MODEL INSURER
We construct a model insurer representative of a diversified multi-line insurerwriting business in the Australian general insurance industry. Although thedata is representative of an Australian insurer, the general model is represen-tative of insurers in many countries. The implications for risk based capital andpricing apply to property-casualty or general insurance companies morebroadly. Since we allow for a range of frictional costs, the study provides abroad understanding of the impact of these costs on optimal strategies. Themodel is similar to previous studies of the industry, for example Sutherland-Wong and Sherris [30] and Tang and Valdez [32] in Australia and also D’Arcyand Gorvett [8]. Although the aim has been to construct a realistic modelinsurer, many simplifying assumptions are made. The model has been cali-brated to industry data and published studies. This is the first public studythat we are aware of that assesses the relative impact of different types of fric-tional costs on enterprise value, pricing strategies, and the importance of eachfor risk based capital and risk management. We also formally incorporate andquantify price elasticities in insurer decision making and the impact on profitmargins and capitalization.
3.1. Data
The data used to calibrate the model insurer were derived from the followingsources.
– Australian Prudential Regulation Authority (APRA), Half Yearly GeneralInsurance Bulletin, December 1998 to December 2001.
– Tillinghast-Towers Perrin, Research and Data Analysis Relevant to the Devel-opment of Standards and Guidelines on Liability Valuation for GeneralInsurance, November 2001.
– Reserve Bank of Australia (RBA), S&P/ASX 200 Accumulation Index,January 1979 to September 2006.
ENTERPRISE RISK MANAGEMENT AND MARKET FRICTIONS 305
0587-07_Astin38/1_16 02-06-2008 13:50 Pagina 305
, available at https://www.cambridge.org/core/terms. https://doi.org/10.1017/S051503610001518XDownloaded from https://www.cambridge.org/core. IP address: 54.39.106.173, on 30 May 2020 at 06:30:26, subject to the Cambridge Core terms of use
– ABN AMRO, Government and Semi-Government Bonds Total ReturnIndex, January 1990 to September 2006.
3.1.1. The Model Insurer
The Business Mix. In order to construct a well diversified portfolio of a typ-ical insurer, the five largest individual lines by net premium revenue wereincluded in the insurer portfolio. The lines included in the business mix are asfollows.
– Domestic motor – Household – Fire & ISR– Public and product liability – CTP
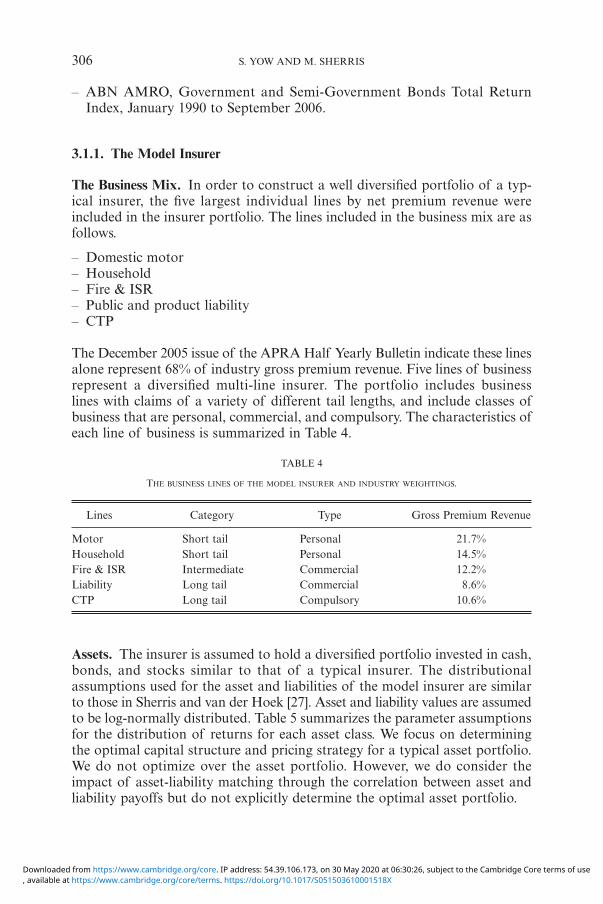
The December 2005 issue of the APRA Half Yearly Bulletin indicate these linesalone represent 68% of industry gross premium revenue. Five lines of businessrepresent a diversified multi-line insurer. The portfolio includes businesslines with claims of a variety of different tail lengths, and include classes ofbusiness that are personal, commercial, and compulsory. The characteristics ofeach line of business is summarized in Table 4.
306 S. YOW AND M. SHERRIS
TABLE 4
THE BUSINESS LINES OF THE MODEL INSURER AND INDUSTRY WEIGHTINGS.
Lines Category Type Gross Premium Revenue
Motor Short tail Personal 21.7%Household Short tail Personal 14.5%Fire & ISR Intermediate Commercial 12.2%Liability Long tail Commercial 8.6%CTP Long tail Compulsory 10.6%
Assets. The insurer is assumed to hold a diversified portfolio invested in cash,bonds, and stocks similar to that of a typical insurer. The distributionalassumptions used for the asset and liabilities of the model insurer are similarto those in Sherris and van der Hoek [27]. Asset and liability values are assumedto be log-normally distributed. Table 5 summarizes the parameter assumptionsfor the distribution of returns for each asset class. We focus on determiningthe optimal capital structure and pricing strategy for a typical asset portfolio.We do not optimize over the asset portfolio. However, we do consider theimpact of asset-liability matching through the correlation between asset andliability payoffs but do not explicitly determine the optimal asset portfolio.
0587-07_Astin38/1_16 02-06-2008 13:50 Pagina 306
, available at https://www.cambridge.org/core/terms. https://doi.org/10.1017/S051503610001518XDownloaded from https://www.cambridge.org/core. IP address: 54.39.106.173, on 30 May 2020 at 06:30:26, subject to the Cambridge Core terms of use
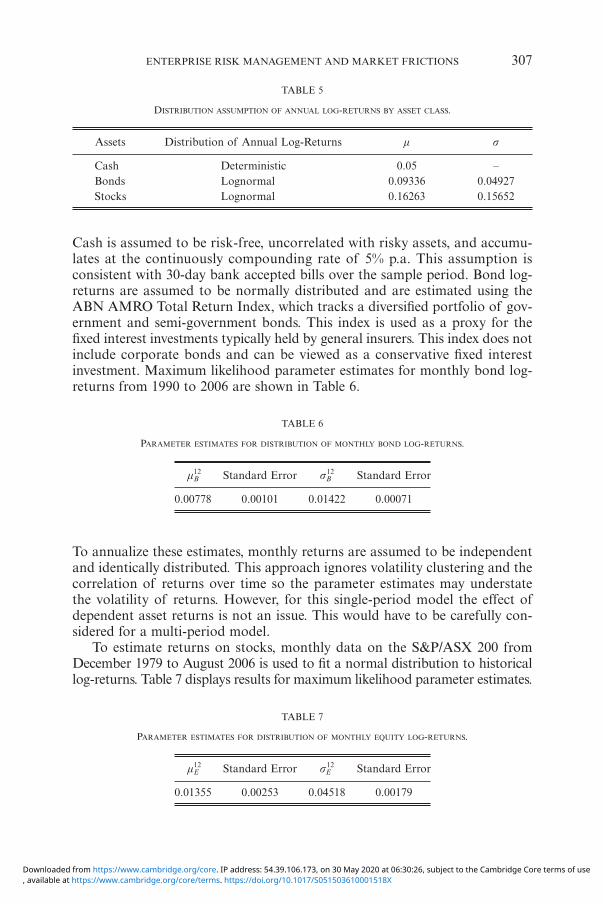
Cash is assumed to be risk-free, uncorrelated with risky assets, and accumu-lates at the continuously compounding rate of 5% p.a. This assumption isconsistent with 30-day bank accepted bills over the sample period. Bond log-returns are assumed to be normally distributed and are estimated using theABN AMRO Total Return Index, which tracks a diversified portfolio of gov-ernment and semi-government bonds. This index is used as a proxy for thefixed interest investments typically held by general insurers. This index does notinclude corporate bonds and can be viewed as a conservative fixed interestinvestment. Maximum likelihood parameter estimates for monthly bond log-returns from 1990 to 2006 are shown in Table 6.
ENTERPRISE RISK MANAGEMENT AND MARKET FRICTIONS 307
TABLE 5
DISTRIBUTION ASSUMPTION OF ANNUAL LOG-RETURNS BY ASSET CLASS.
Assets Distribution of Annual Log-Returns m s
Cash Deterministic 0.05 –Bonds Lognormal 0.09336 0.04927Stocks Lognormal 0.16263 0.15652
TABLE 6
PARAMETER ESTIMATES FOR DISTRIBUTION OF MONTHLY BOND LOG-RETURNS.
m12B Standard Error sB
12 Standard Error
0.00778 0.00101 0.01422 0.00071
TABLE 7
PARAMETER ESTIMATES FOR DISTRIBUTION OF MONTHLY EQUITY LOG-RETURNS.
m12E Standard Error sE
12 Standard Error
0.01355 0.00253 0.04518 0.00179
To annualize these estimates, monthly returns are assumed to be independentand identically distributed. This approach ignores volatility clustering and thecorrelation of returns over time so the parameter estimates may understatethe volatility of returns. However, for this single-period model the effect ofdependent asset returns is not an issue. This would have to be carefully con-sidered for a multi-period model.
To estimate returns on stocks, monthly data on the S&P/ASX 200 fromDecember 1979 to August 2006 is used to fit a normal distribution to historicallog-returns. Table 7 displays results for maximum likelihood parameter estimates.
0587-07_Astin38/1_16 02-06-2008 13:50 Pagina 307
, available at https://www.cambridge.org/core/terms. https://doi.org/10.1017/S051503610001518XDownloaded from https://www.cambridge.org/core. IP address: 54.39.106.173, on 30 May 2020 at 06:30:26, subject to the Cambridge Core terms of use
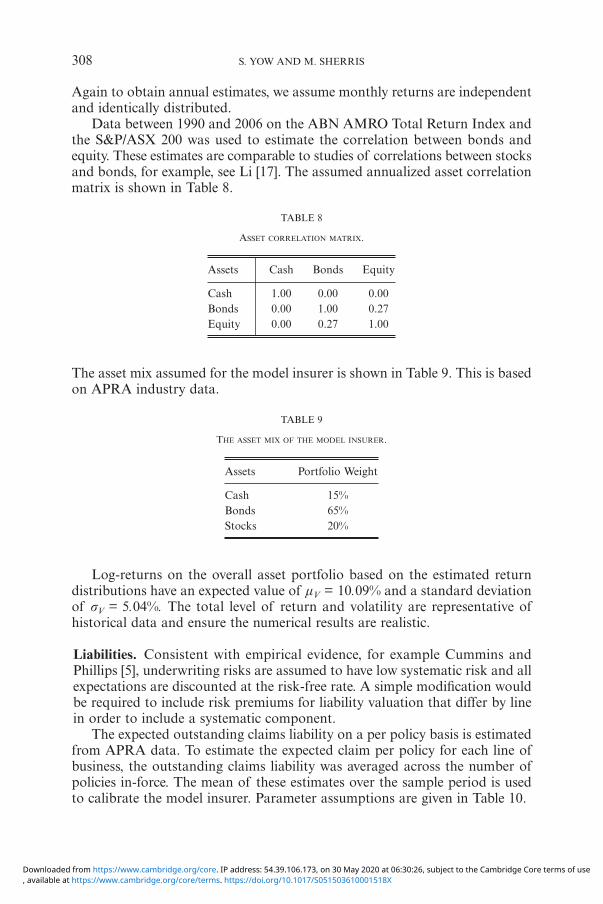
Again to obtain annual estimates, we assume monthly returns are independentand identically distributed.
Data between 1990 and 2006 on the ABN AMRO Total Return Index andthe S&P/ASX 200 was used to estimate the correlation between bonds andequity. These estimates are comparable to studies of correlations between stocksand bonds, for example, see Li [17]. The assumed annualized asset correlationmatrix is shown in Table 8.
308 S. YOW AND M. SHERRIS
TABLE 8
ASSET CORRELATION MATRIX.
Assets Cash Bonds Equity
Cash 1.00 0.00 0.00Bonds 0.00 1.00 0.27Equity 0.00 0.27 1.00
The asset mix assumed for the model insurer is shown in Table 9. This is basedon APRA industry data.
TABLE 9
THE ASSET MIX OF THE MODEL INSURER.
Assets Portfolio Weight
Cash 15%Bonds 65%Stocks 20%
Log-returns on the overall asset portfolio based on the estimated returndistributions have an expected value of mV = 10.09% and a standard deviationof sV = 5.04%. The total level of return and volatility are representative ofhistorical data and ensure the numerical results are realistic.
Liabilities. Consistent with empirical evidence, for example Cummins andPhillips [5], underwriting risks are assumed to have low systematic risk and allexpectations are discounted at the risk-free rate. A simple modification wouldbe required to include risk premiums for liability valuation that differ by linein order to include a systematic component.
The expected outstanding claims liability on a per policy basis is estimatedfrom APRA data. To estimate the expected claim per policy for each line ofbusiness, the outstanding claims liability was averaged across the number ofpolicies in-force. The mean of these estimates over the sample period is usedto calibrate the model insurer. Parameter assumptions are given in Table 10.
0587-07_Astin38/1_16 02-06-2008 13:50 Pagina 308
, available at https://www.cambridge.org/core/terms. https://doi.org/10.1017/S051503610001518XDownloaded from https://www.cambridge.org/core. IP address: 54.39.106.173, on 30 May 2020 at 06:30:26, subject to the Cambridge Core terms of use
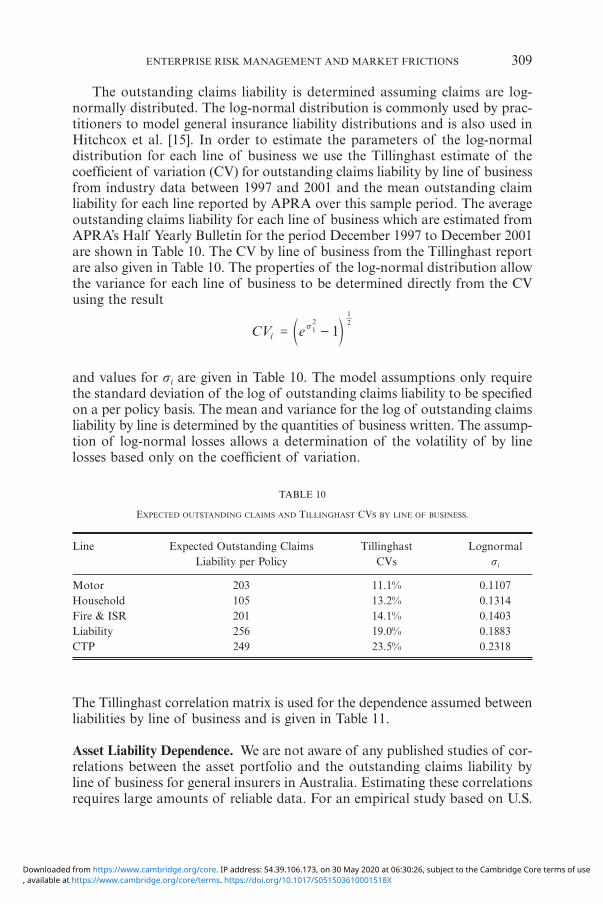
The outstanding claims liability is determined assuming claims are log-normally distributed. The log-normal distribution is commonly used by prac-titioners to model general insurance liability distributions and is also used inHitchcox et al. [15]. In order to estimate the parameters of the log-normaldistribution for each line of business we use the Tillinghast estimate of thecoefficient of variation (CV) for outstanding claims liability by line of businessfrom industry data between 1997 and 2001 and the mean outstanding claimliability for each line reported by APRA over this sample period. The averageoutstanding claims liability for each line of business which are estimated fromAPRA’s Half Yearly Bulletin for the period December 1997 to December 2001are shown in Table 10. The CV by line of business from the Tillinghast reportare also given in Table 10. The properties of the log-normal distribution allowthe variance for each line of business to be determined directly from the CVusing the result
iCV e 1s 2 21
= -1c m
and values for si are given in Table 10. The model assumptions only requirethe standard deviation of the log of outstanding claims liability to be specifiedon a per policy basis. The mean and variance for the log of outstanding claimsliability by line is determined by the quantities of business written. The assump-tion of log-normal losses allows a determination of the volatility of by linelosses based only on the coefficient of variation.
ENTERPRISE RISK MANAGEMENT AND MARKET FRICTIONS 309
TABLE 10
EXPECTED OUTSTANDING CLAIMS AND TILLINGHAST CVS BY LINE OF BUSINESS.
Line Expected Outstanding Claims Tillinghast LognormalLiability per Policy CVs si
Motor 203 11.1% 0.1107Household 105 13.2% 0.1314Fire & ISR 201 14.1% 0.1403Liability 256 19.0% 0.1883CTP 249 23.5% 0.2318
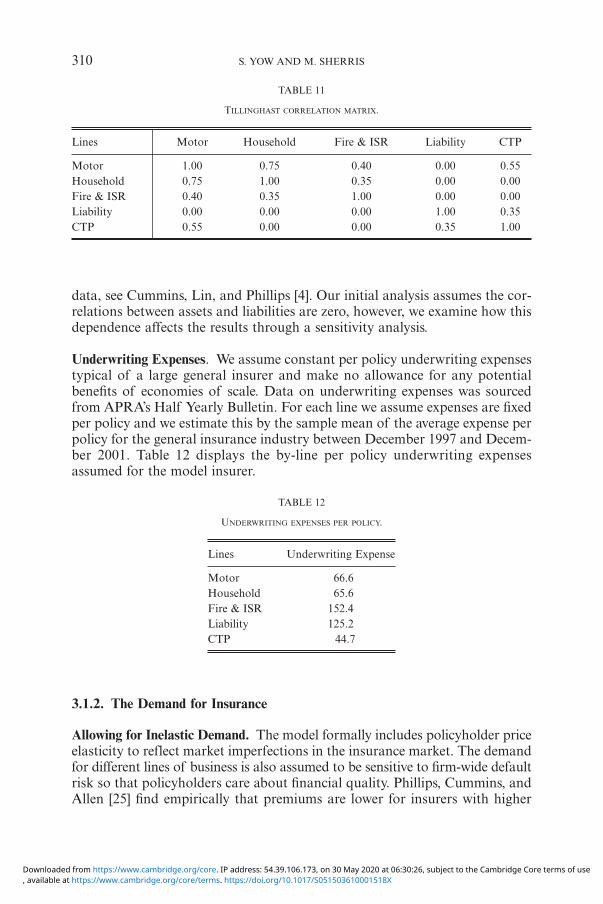
The Tillinghast correlation matrix is used for the dependence assumed betweenliabilities by line of business and is given in Table 11.
Asset Liability Dependence. We are not aware of any published studies of cor-relations between the asset portfolio and the outstanding claims liability byline of business for general insurers in Australia. Estimating these correlationsrequires large amounts of reliable data. For an empirical study based on U.S.
0587-07_Astin38/1_16 02-06-2008 13:50 Pagina 309
, available at https://www.cambridge.org/core/terms. https://doi.org/10.1017/S051503610001518XDownloaded from https://www.cambridge.org/core. IP address: 54.39.106.173, on 30 May 2020 at 06:30:26, subject to the Cambridge Core terms of use
data, see Cummins, Lin, and Phillips [4]. Our initial analysis assumes the cor-relations between assets and liabilities are zero, however, we examine how thisdependence affects the results through a sensitivity analysis.
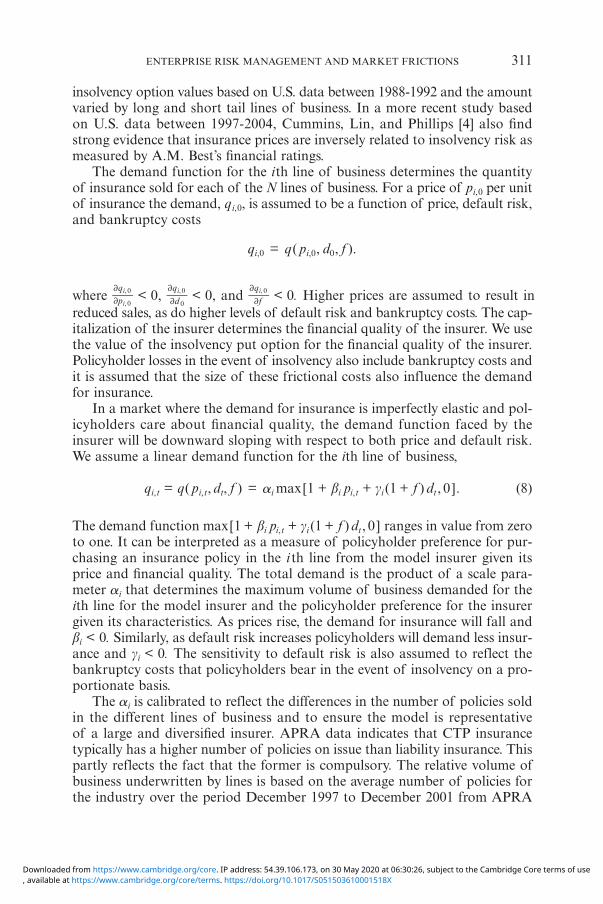
Underwriting Expenses. We assume constant per policy underwriting expensestypical of a large general insurer and make no allowance for any potentialbenefits of economies of scale. Data on underwriting expenses was sourcedfrom APRA’s Half Yearly Bulletin. For each line we assume expenses are fixedper policy and we estimate this by the sample mean of the average expense perpolicy for the general insurance industry between December 1997 and Decem-ber 2001. Table 12 displays the by-line per policy underwriting expensesassumed for the model insurer.
310 S. YOW AND M. SHERRIS
TABLE 11
TILLINGHAST CORRELATION MATRIX.
Lines Motor Household Fire & ISR Liability CTP
Motor 1.00 0.75 0.40 0.00 0.55Household 0.75 1.00 0.35 0.00 0.00Fire & ISR 0.40 0.35 1.00 0.00 0.00Liability 0.00 0.00 0.00 1.00 0.35CTP 0.55 0.00 0.00 0.35 1.00
TABLE 12
UNDERWRITING EXPENSES PER POLICY.
Lines Underwriting Expense
Motor 66.6Household 65.6Fire & ISR 152.4Liability 125.2CTP 44.7
3.1.2. The Demand for Insurance
Allowing for Inelastic Demand. The model formally includes policyholder priceelasticity to reflect market imperfections in the insurance market. The demandfor different lines of business is also assumed to be sensitive to firm-wide defaultrisk so that policyholders care about financial quality. Phillips, Cummins, andAllen [25] find empirically that premiums are lower for insurers with higher
0587-07_Astin38/1_16 02-06-2008 13:50 Pagina 310
, available at https://www.cambridge.org/core/terms. https://doi.org/10.1017/S051503610001518XDownloaded from https://www.cambridge.org/core. IP address: 54.39.106.173, on 30 May 2020 at 06:30:26, subject to the Cambridge Core terms of use
insolvency option values based on U.S. data between 1988-1992 and the amountvaried by long and short tail lines of business. In a more recent study basedon U.S. data between 1997-2004, Cummins, Lin, and Phillips [4] also findstrong evidence that insurance prices are inversely related to insolvency risk asmeasured by A.M. Best’s financial ratings.
The demand function for the ith line of business determines the quantityof insurance sold for each of the N lines of business. For a price of pi,0 per unitof insurance the demand, qi,0, is assumed to be a function of price, default risk,and bankruptcy costs
qi,0 = q( pi,0, d0, f ).
where 0
0
pq
,
,
i
i
2
2< 0, 0
d
q ,i
02
2< 0, and 0
f
q ,i
2
2< 0. Higher prices are assumed to result in
reduced sales, as do higher levels of default risk and bankruptcy costs. The cap-italization of the insurer determines the financial quality of the insurer. We usethe value of the insolvency put option for the financial quality of the insurer.Policyholder losses in the event of insolvency also include bankruptcy costs andit is assumed that the size of these frictional costs also influence the demandfor insurance.
In a market where the demand for insurance is imperfectly elastic and pol-icyholders care about financial quality, the demand function faced by theinsurer will be downward sloping with respect to both price and default risk.We assume a linear demand function for the ith line of business,
qi,t = q( pi,t, dt, f ) = ai max[1 + bi pi,t + gi(1 + f ) dt, 0 ]. (8)
The demand function max[1 + bi pi,t + gi(1 + f ) dt, 0] ranges in value from zeroto one. It can be interpreted as a measure of policyholder preference for pur-chasing an insurance policy in the i th line from the model insurer given itsprice and financial quality. The total demand is the product of a scale para-meter ai that determines the maximum volume of business demanded for theith line for the model insurer and the policyholder preference for the insurergiven its characteristics. As prices rise, the demand for insurance will fall andbi < 0. Similarly, as default risk increases policyholders will demand less insur-ance and gi < 0. The sensitivity to default risk is also assumed to reflect thebankruptcy costs that policyholders bear in the event of insolvency on a pro-portionate basis.
The ai is calibrated to reflect the differences in the number of policies soldin the different lines of business and to ensure the model is representativeof a large and diversified insurer. APRA data indicates that CTP insurancetypically has a higher number of policies on issue than liability insurance. Thispartly reflects the fact that the former is compulsory. The relative volume ofbusiness underwritten by lines is based on the average number of policies forthe industry over the period December 1997 to December 2001 from APRA
ENTERPRISE RISK MANAGEMENT AND MARKET FRICTIONS 311
0587-07_Astin38/1_16 02-06-2008 13:50 Pagina 311
, available at https://www.cambridge.org/core/terms. https://doi.org/10.1017/S051503610001518XDownloaded from https://www.cambridge.org/core. IP address: 54.39.106.173, on 30 May 2020 at 06:30:26, subject to the Cambridge Core terms of use
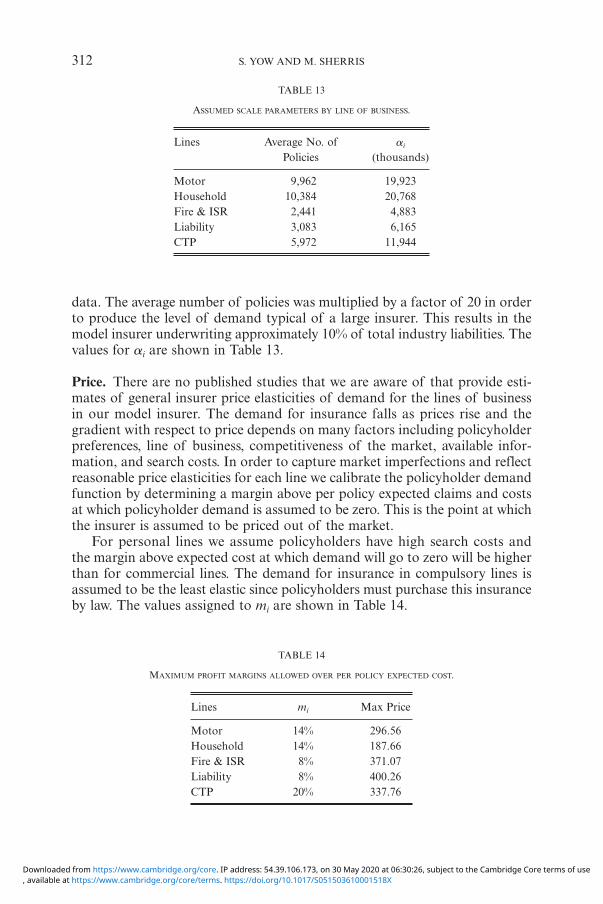
data. The average number of policies was multiplied by a factor of 20 in orderto produce the level of demand typical of a large insurer. This results in themodel insurer underwriting approximately 10% of total industry liabilities. Thevalues for ai are shown in Table 13.
Price. There are no published studies that we are aware of that provide esti-mates of general insurer price elasticities of demand for the lines of businessin our model insurer. The demand for insurance falls as prices rise and thegradient with respect to price depends on many factors including policyholderpreferences, line of business, competitiveness of the market, available infor-mation, and search costs. In order to capture market imperfections and reflectreasonable price elasticities for each line we calibrate the policyholder demandfunction by determining a margin above per policy expected claims and costsat which policyholder demand is assumed to be zero. This is the point at whichthe insurer is assumed to be priced out of the market.
For personal lines we assume policyholders have high search costs andthe margin above expected cost at which demand will go to zero will be higherthan for commercial lines. The demand for insurance in compulsory lines isassumed to be the least elastic since policyholders must purchase this insuranceby law. The values assigned to mi are shown in Table 14.
312 S. YOW AND M. SHERRIS
TABLE 13
ASSUMED SCALE PARAMETERS BY LINE OF BUSINESS.
Lines Average No. of ai
Policies (thousands)
Motor 9,962 19,923Household 10,384 20,768Fire & ISR 2,441 4,883Liability 3,083 6,165CTP 5,972 11,944
TABLE 14
MAXIMUM PROFIT MARGINS ALLOWED OVER PER POLICY EXPECTED COST.
Lines mi Max Price
Motor 14% 296.56Household 14% 187.66Fire & ISR 8% 371.07Liability 8% 400.26CTP 20% 337.76
0587-07_Astin38/1_16 02-06-2008 13:50 Pagina 312
, available at https://www.cambridge.org/core/terms. https://doi.org/10.1017/S051503610001518XDownloaded from https://www.cambridge.org/core. IP address: 54.39.106.173, on 30 May 2020 at 06:30:26, subject to the Cambridge Core terms of use
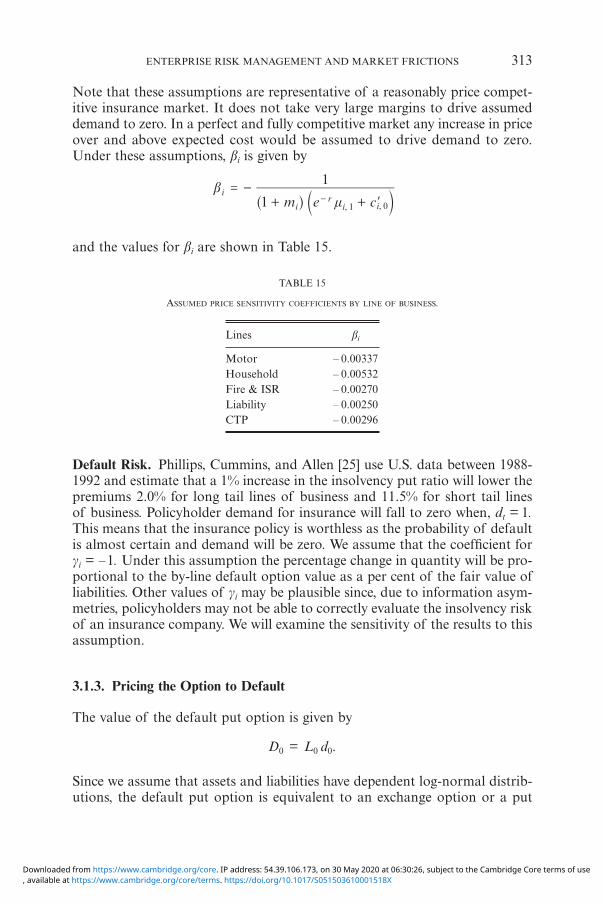
Note that these assumptions are representative of a reasonably price compet-itive insurance market. It does not take very large margins to drive assumeddemand to zero. In a perfect and fully competitive market any increase in priceover and above expected cost would be assumed to drive demand to zero.Under these assumptions, bi is given by
,i 0m e cb
m1
1
,
i
i i 1
= -+ +r- �^ bh l
and the values for bi are shown in Table 15.
ENTERPRISE RISK MANAGEMENT AND MARKET FRICTIONS 313
TABLE 15
ASSUMED PRICE SENSITIVITY COEFFICIENTS BY LINE OF BUSINESS.
Lines bi
Motor – 0.00337Household – 0.00532Fire & ISR – 0.00270Liability – 0.00250CTP – 0.00296
Default Risk. Phillips, Cummins, and Allen [25] use U.S. data between 1988-1992 and estimate that a 1% increase in the insolvency put ratio will lower thepremiums 2.0% for long tail lines of business and 11.5% for short tail linesof business. Policyholder demand for insurance will fall to zero when, dt = 1.This means that the insurance policy is worthless as the probability of defaultis almost certain and demand will be zero. We assume that the coefficient forgi = –1. Under this assumption the percentage change in quantity will be pro-portional to the by-line default option value as a per cent of the fair value ofliabilities. Other values of gi may be plausible since, due to information asym-metries, policyholders may not be able to correctly evaluate the insolvency riskof an insurance company. We will examine the sensitivity of the results to thisassumption.
3.1.3. Pricing the Option to Default
The value of the default put option is given by
D0 = L0 d0.
Since we assume that assets and liabilities have dependent log-normal distrib-utions, the default put option is equivalent to an exchange option or a put
0587-07_Astin38/1_16 02-06-2008 13:50 Pagina 313
, available at https://www.cambridge.org/core/terms. https://doi.org/10.1017/S051503610001518XDownloaded from https://www.cambridge.org/core. IP address: 54.39.106.173, on 30 May 2020 at 06:30:26, subject to the Cambridge Core terms of use
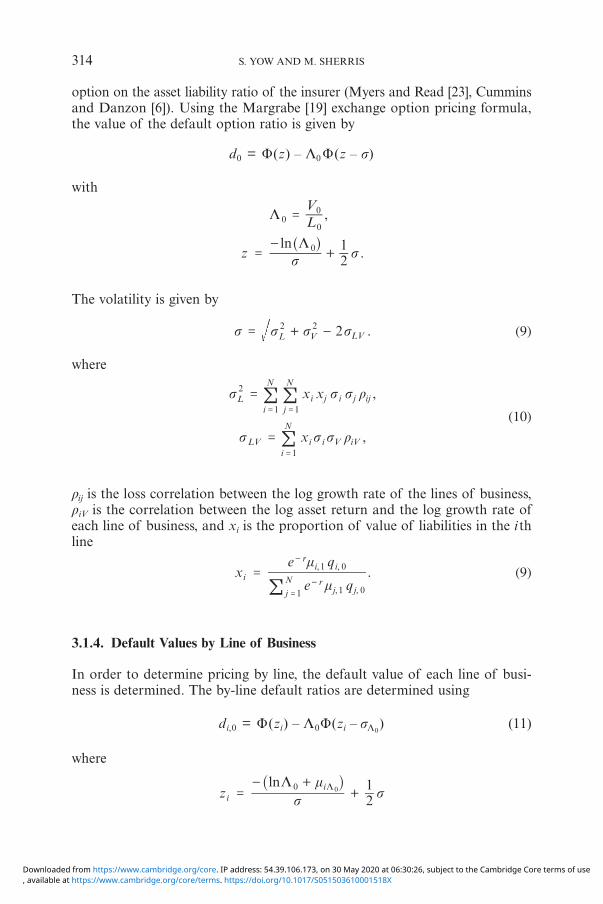
option on the asset liability ratio of the insurer (Myers and Read [23], Cumminsand Danzon [6]). Using the Margrabe [19] exchange option pricing formula,the value of the default option ratio is given by
d0 = F(z) – L0 F(z – s)
with
,
.ln
L
z s s
L
L21
00
0
0
=
=-
+
V
^ h
The volatility is given by
L V .s s s 2 LV2 2
= + - s (9)
where
jL j r
r
,
,
x
x
s s
s s s
i i ijj
N
i
N
LV i i V iVi
N
2
11
1
=
=
==
=
x s!!
!(10)
rij is the loss correlation between the log growth rate of the lines of business,riV is the correlation between the log asset return and the log growth rate ofeach line of business, and xi is the proportion of value of liabilities in the i thline
.xe
e qm
, ,
, ,i
j jj
i i
1 01
1 0=
=
N r
r
-
-
qm!(9)
3.1.4. Default Values by Line of Business
In order to determine pricing by line, the default value of each line of busi-ness is determined. The by-line default ratios are determined using
di,0 = F(zi) – L0F(zi – sL0) (11)
where
milnz s s
L21
iL0 0=
- ++
_ i
314 S. YOW AND M. SHERRIS
0587-07_Astin38/1_16 02-06-2008 13:50 Pagina 314
, available at https://www.cambridge.org/core/terms. https://doi.org/10.1017/S051503610001518XDownloaded from https://www.cambridge.org/core. IP address: 54.39.106.173, on 30 May 2020 at 06:30:26, subject to the Cambridge Core terms of use
and
miL0= sL
2 – sL sV rLV + si sV riV – si sL riL.
These results are derived in Sherris and van der Hoek [27]. Note that s and sL
are defined by Equations (9) and (10) respectively. This approach ensures thatthe allocation of the firm-wide default put option to line of business reflectsthe payoffs to policyholders and is used to determine the fair value of liabili-ties by line for the model insurer.
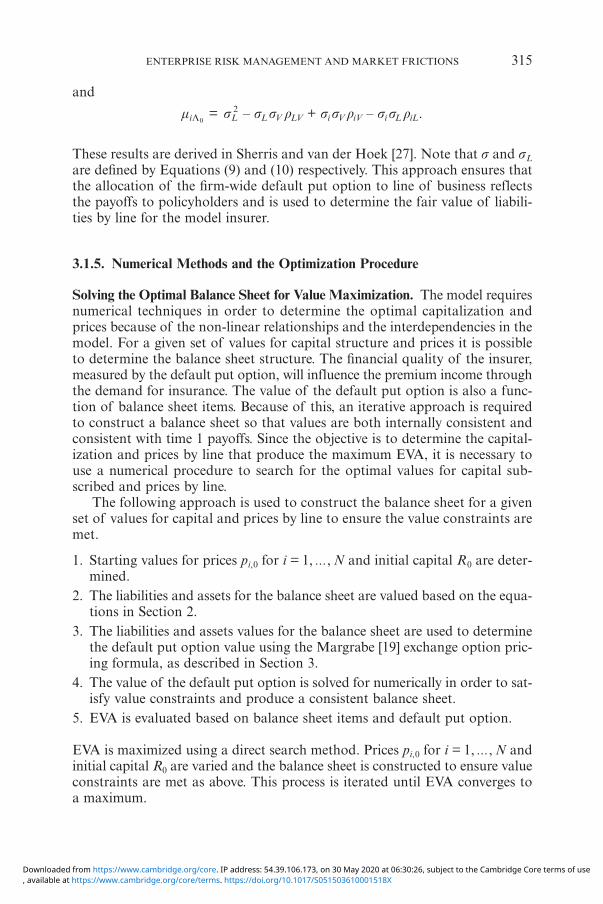
3.1.5. Numerical Methods and the Optimization Procedure
Solving the Optimal Balance Sheet for Value Maximization. The model requiresnumerical techniques in order to determine the optimal capitalization andprices because of the non-linear relationships and the interdependencies in themodel. For a given set of values for capital structure and prices it is possibleto determine the balance sheet structure. The financial quality of the insurer,measured by the default put option, will influence the premium income throughthe demand for insurance. The value of the default put option is also a func-tion of balance sheet items. Because of this, an iterative approach is requiredto construct a balance sheet so that values are both internally consistent andconsistent with time 1 payoffs. Since the objective is to determine the capital-ization and prices by line that produce the maximum EVA, it is necessary touse a numerical procedure to search for the optimal values for capital sub-scribed and prices by line.
The following approach is used to construct the balance sheet for a givenset of values for capital and prices by line to ensure the value constraints aremet.
1. Starting values for prices pi,0 for i = 1, ..., N and initial capital R0 are deter-mined.
2. The liabilities and assets for the balance sheet are valued based on the equa-tions in Section 2.
3. The liabilities and assets values for the balance sheet are used to determinethe default put option value using the Margrabe [19] exchange option pric-ing formula, as described in Section 3.
4. The value of the default put option is solved for numerically in order to sat-isfy value constraints and produce a consistent balance sheet.
5. EVA is evaluated based on balance sheet items and default put option.
EVA is maximized using a direct search method. Prices pi,0 for i = 1, ..., N andinitial capital R0 are varied and the balance sheet is constructed to ensure valueconstraints are met as above. This process is iterated until EVA converges toa maximum.
ENTERPRISE RISK MANAGEMENT AND MARKET FRICTIONS 315
0587-07_Astin38/1_16 02-06-2008 13:50 Pagina 315
, available at https://www.cambridge.org/core/terms. https://doi.org/10.1017/S051503610001518XDownloaded from https://www.cambridge.org/core. IP address: 54.39.106.173, on 30 May 2020 at 06:30:26, subject to the Cambridge Core terms of use
Optimizing Insurer Value Using a Direct Search Method. To maximize EVA adirect search method was used. Direct search is a non-derivative based methodthat searches for a maximum around a set of starting coordinates. In particu-lar, a pattern search algorithm with non-linear constraints was used for theoptimization. For an initial point, the algorithm creates a set of points tosearch, called a mesh, by adding a scalar multiple of a pattern of vectors.In order to ensure the algorithm produced an optimal value, we repeated eachoptimization with a number of different starting values to ensure the objectivefunction converged to a global maximum. For further detailed information onthe method used see Torczon [33] and Lewis and Torczon [16].
4. RESULTS AND DISCUSSION
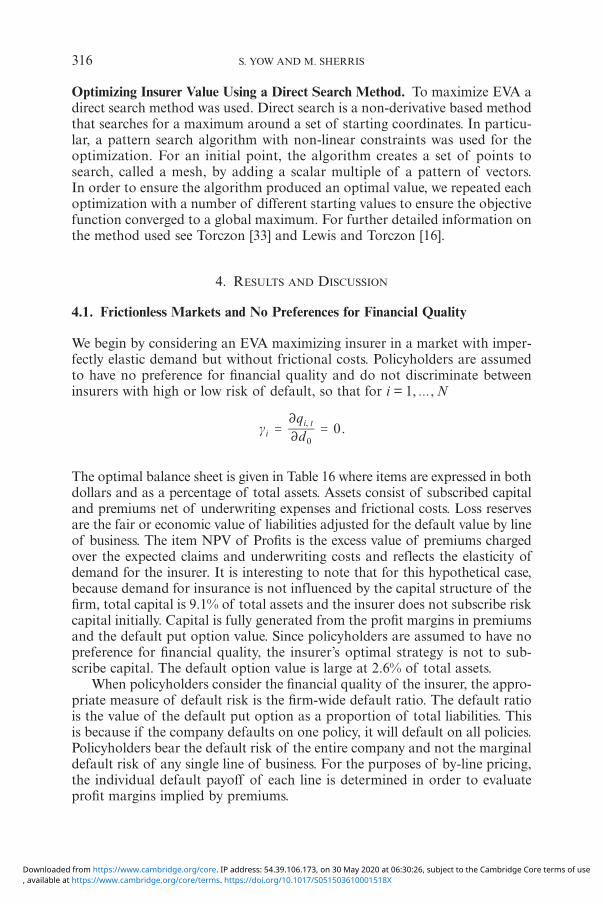
4.1. Frictionless Markets and No Preferences for Financial Quality
We begin by considering an EVA maximizing insurer in a market with imper-fectly elastic demand but without frictional costs. Policyholders are assumedto have no preference for financial quality and do not discriminate betweeninsurers with high or low risk of default, so that for i = 1, ..., N
.g 0,i
i t
02
2= =
qd
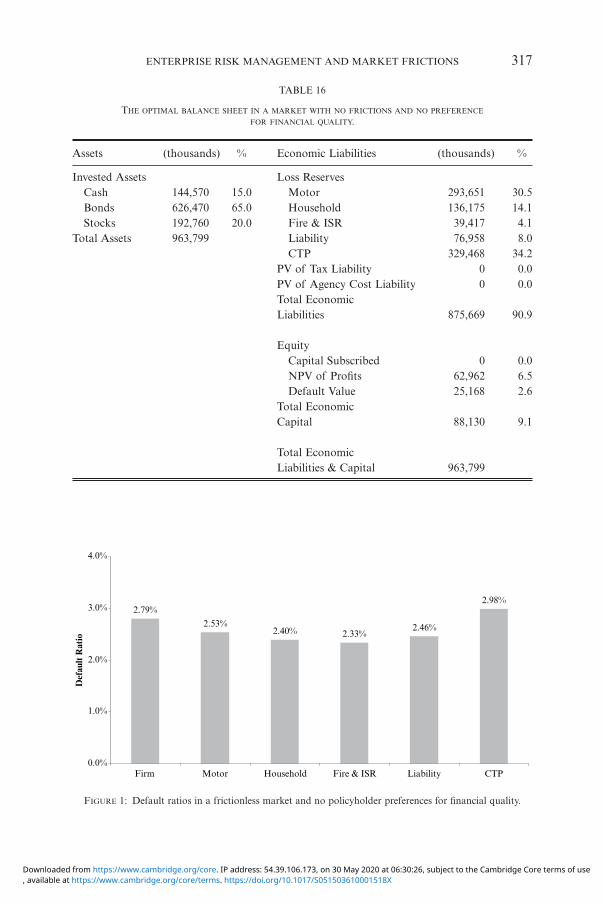
The optimal balance sheet is given in Table 16 where items are expressed in bothdollars and as a percentage of total assets. Assets consist of subscribed capitaland premiums net of underwriting expenses and frictional costs. Loss reservesare the fair or economic value of liabilities adjusted for the default value by lineof business. The item NPV of Profits is the excess value of premiums chargedover the expected claims and underwriting costs and reflects the elasticity ofdemand for the insurer. It is interesting to note that for this hypothetical case,because demand for insurance is not influenced by the capital structure of thefirm, total capital is 9.1% of total assets and the insurer does not subscribe riskcapital initially. Capital is fully generated from the profit margins in premiumsand the default put option value. Since policyholders are assumed to have nopreference for financial quality, the insurer’s optimal strategy is not to sub-scribe capital. The default option value is large at 2.6% of total assets.
When policyholders consider the financial quality of the insurer, the appro-priate measure of default risk is the firm-wide default ratio. The default ratiois the value of the default put option as a proportion of total liabilities. Thisis because if the company defaults on one policy, it will default on all policies.Policyholders bear the default risk of the entire company and not the marginaldefault risk of any single line of business. For the purposes of by-line pricing,the individual default payoff of each line is determined in order to evaluateprofit margins implied by premiums.
316 S. YOW AND M. SHERRIS
0587-07_Astin38/1_16 02-06-2008 13:50 Pagina 316
, available at https://www.cambridge.org/core/terms. https://doi.org/10.1017/S051503610001518XDownloaded from https://www.cambridge.org/core. IP address: 54.39.106.173, on 30 May 2020 at 06:30:26, subject to the Cambridge Core terms of use
ENTERPRISE RISK MANAGEMENT AND MARKET FRICTIONS 317
TABLE 16
THE OPTIMAL BALANCE SHEET IN A MARKET WITH NO FRICTIONS AND NO PREFERENCE
FOR FINANCIAL QUALITY.
Assets (thousands) % Economic Liabilities (thousands) %
Invested Assets Loss ReservesCash 144,570 15.0 Motor 293,651 30.5Bonds 626,470 65.0 Household 136,175 14.1Stocks 192,760 20.0 Fire & ISR 39,417 4.1
Total Assets 963,799 Liability 76,958 8.0CTP 329,468 34.2
PV of Tax Liability 0 0.0PV of Agency Cost Liability 0 0.0Total EconomicLiabilities 875,669 90.9
EquityCapital Subscribed 0 0.0NPV of Profits 62,962 6.5Default Value 25,168 2.6
Total EconomicCapital 88,130 9.1
Total EconomicLiabilities & Capital 963,799
FIGURE 1: Default ratios in a frictionless market and no policyholder preferences for financial quality.
2.79%
2.53%2.40% 2.33%
2.46%
2.98%
0.0%
1.0%
2.0%
3.0%
4.0%
Firm Motor Household Fire & ISR Liability CTP
Def
ault
Rat
io
0587-07_Astin38/1_16 02-06-2008 13:50 Pagina 317
, available at https://www.cambridge.org/core/terms. https://doi.org/10.1017/S051503610001518XDownloaded from https://www.cambridge.org/core. IP address: 54.39.106.173, on 30 May 2020 at 06:30:26, subject to the Cambridge Core terms of use
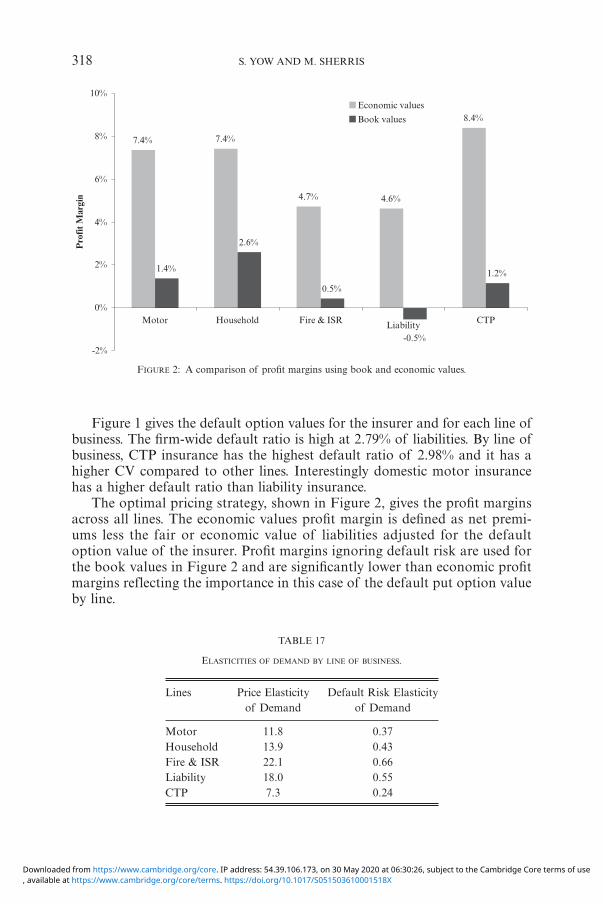
FIGURE 2: A comparison of profit margins using book and economic values.
Figure 1 gives the default option values for the insurer and for each line ofbusiness. The firm-wide default ratio is high at 2.79% of liabilities. By line ofbusiness, CTP insurance has the highest default ratio of 2.98% and it has ahigher CV compared to other lines. Interestingly domestic motor insurancehas a higher default ratio than liability insurance.
The optimal pricing strategy, shown in Figure 2, gives the profit marginsacross all lines. The economic values profit margin is defined as net premi-ums less the fair or economic value of liabilities adjusted for the defaultoption value of the insurer. Profit margins ignoring default risk are used forthe book values in Figure 2 and are significantly lower than economic profitmargins reflecting the importance in this case of the default put option valueby line.
318 S. YOW AND M. SHERRIS
7.4% 7.4%
4.7% 4.6%
8.4%
1.4%
2.6%
0.5%
-0.5%
1.2%
-2%
0%
2%
4%
6%
8%
10%
Motor Household Fire & ISR Liability CTP
Economic values
Book values
Pro
fit M
argi
n
TABLE 17
ELASTICITIES OF DEMAND BY LINE OF BUSINESS.
Lines Price Elasticity Default Risk Elasticityof Demand of Demand
Motor 11.8 0.37Household 13.9 0.43Fire & ISR 22.1 0.66Liability 18.0 0.55CTP 7.3 0.24
0587-07_Astin38/1_16 02-06-2008 13:50 Pagina 318
, available at https://www.cambridge.org/core/terms. https://doi.org/10.1017/S051503610001518XDownloaded from https://www.cambridge.org/core. IP address: 54.39.106.173, on 30 May 2020 at 06:30:26, subject to the Cambridge Core terms of use
The relative profit margins reflect the assumptions for the elasticities ofdemand for each line of business. The second column of Table 17 shows theprice elasticities of demand by line of business evaluated at the optimum. Priceelasticities are the percentage change in number of policies written for a 1%change in price. While the demand for insurance is price elastic across all linesof business, fire & ISR, and liability lines are particularly sensitive to pricechanges with elasticities of 22.1% and 18.0% respectively. This reflects theassumption that commercial lines are more price elastic than personal andcompulsory lines. The sensitivity of demand in motor and household lineshave lower elasticities of 11.0% and 13.9% respectively. The demand for CTPinsurance is the least elastic at 7.3%. These price elasticities indicate a relativelyhigh level of assumed competitiveness at the optimum in the model. Low elas-ticity lines, such as personal and compulsory, yield higher profit margins atthe optimum, as demand is less sensitive to increases in premiums.
Commercial lines display higher elasticities of demand with respect todefault risk when compared to personal and compulsory lines. The default riskelasticities of demand are the percentage change in the number of policies writ-ten for a 1% change in the firm-wide default ratio. Default risk elasticitiesevaluated at the optimum are shown in the third column of Table 17. Thesensitivity of policyholder demand to default risk is highest in commerciallines. A 1% increase in the insurer’s default ratio would see a reduction inpolicies of 0.66% and 0.55% in fire & ISR and liability lines respectively. Thedemand for CTP insurance is the most inelastic with respect to default riskwith an elasticity less than half that of commercial lines at 0.24%. Theseresults indicate that policyholder demand at the optimum, while elastic tochanges in price, is relatively inelastic to the default ratio. This is expected as,at the optimum, the value of the default put option is relatively low at 2.79%of liabilities.
The level of profit margins generated for this assumption are reasonablyconsistent with, although not the same as, the tariff margins mentioned byHill [14] and US empirical data in D’Arcy and Garven [7]. This indicates thatthe demand elasticities are reasonable assumptions for assessing the impact offrictional costs on profit margins. To make the model more realistic the elas-ticities could be calibrated to market or historical profit margins, however, thiswould assume that these market based profit margins were optimal. Since weare interested in the relative impact of these costs in the optimal strategy andthe relative differences by line it is important to incorporate a range of elas-ticities in the model assumptions. Market or historical margins will be alsoexpected to vary across insurers.
4.2. When Financial Quality Matters
In order to assess the impact of financial quality of the insurer we maintain theassumption of frictionless markets and consider the case where policyholders
ENTERPRISE RISK MANAGEMENT AND MARKET FRICTIONS 319
0587-07_Astin38/1_16 02-06-2008 13:50 Pagina 319
, available at https://www.cambridge.org/core/terms. https://doi.org/10.1017/S051503610001518XDownloaded from https://www.cambridge.org/core. IP address: 54.39.106.173, on 30 May 2020 at 06:30:26, subject to the Cambridge Core terms of use
are assumed to care about the financial quality of the insurer, that is, for i =1, ..., N we assume
.g 1,i
i t
02
2= = -
qd
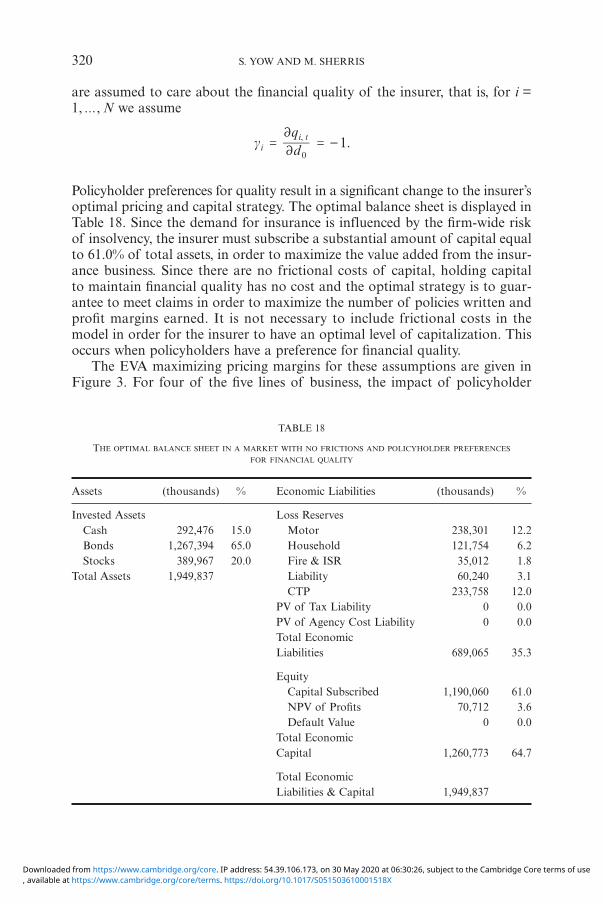
Policyholder preferences for quality result in a significant change to the insurer’soptimal pricing and capital strategy. The optimal balance sheet is displayed inTable 18. Since the demand for insurance is influenced by the firm-wide riskof insolvency, the insurer must subscribe a substantial amount of capital equalto 61.0% of total assets, in order to maximize the value added from the insur-ance business. Since there are no frictional costs of capital, holding capitalto maintain financial quality has no cost and the optimal strategy is to guar-antee to meet claims in order to maximize the number of policies written andprofit margins earned. It is not necessary to include frictional costs in themodel in order for the insurer to have an optimal level of capitalization. Thisoccurs when policyholders have a preference for financial quality.
The EVA maximizing pricing margins for these assumptions are given inFigure 3. For four of the five lines of business, the impact of policyholder
320 S. YOW AND M. SHERRIS
TABLE 18
THE OPTIMAL BALANCE SHEET IN A MARKET WITH NO FRICTIONS AND POLICYHOLDER PREFERENCES
FOR FINANCIAL QUALITY
Assets (thousands) % Economic Liabilities (thousands) %
Invested Assets Loss ReservesCash 292,476 15.0 Motor 238,301 12.2Bonds 1,267,394 65.0 Household 121,754 6.2Stocks 389,967 20.0 Fire & ISR 35,012 1.8
Total Assets 1,949,837 Liability 60,240 3.1CTP 233,758 12.0
PV of Tax Liability 0 0.0PV of Agency Cost Liability 0 0.0Total EconomicLiabilities 689,065 35.3
EquityCapital Subscribed 1,190,060 61.0NPV of Profits 70,712 3.6Default Value 0 0.0
Total EconomicCapital 1,260,773 64.7
Total EconomicLiabilities & Capital 1,949,837
0587-07_Astin38/1_16 02-06-2008 13:50 Pagina 320
, available at https://www.cambridge.org/core/terms. https://doi.org/10.1017/S051503610001518XDownloaded from https://www.cambridge.org/core. IP address: 54.39.106.173, on 30 May 2020 at 06:30:26, subject to the Cambridge Core terms of use
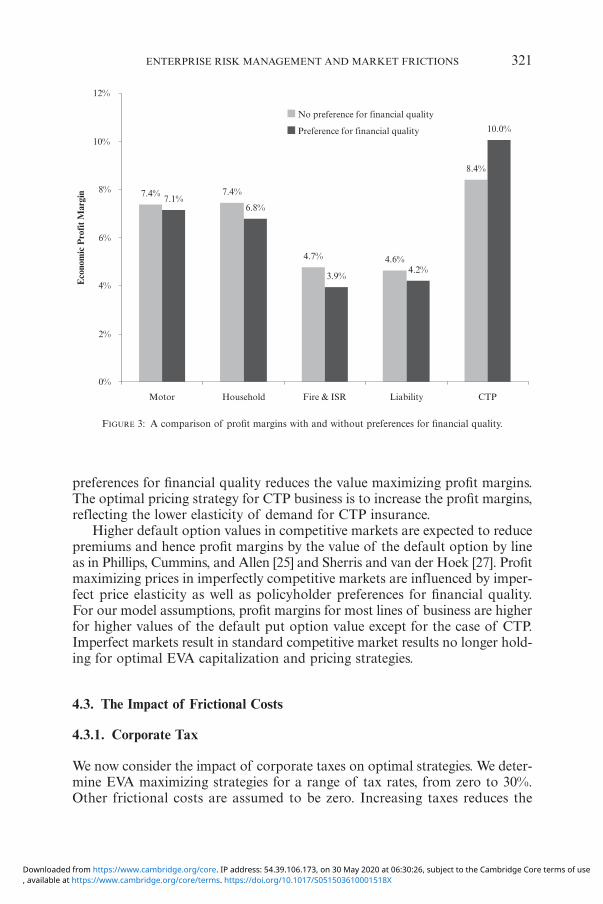
FIGURE 3: A comparison of profit margins with and without preferences for financial quality.
preferences for financial quality reduces the value maximizing profit margins.The optimal pricing strategy for CTP business is to increase the profit margins,reflecting the lower elasticity of demand for CTP insurance.
Higher default option values in competitive markets are expected to reducepremiums and hence profit margins by the value of the default option by lineas in Phillips, Cummins, and Allen [25] and Sherris and van der Hoek [27]. Profitmaximizing prices in imperfectly competitive markets are influenced by imper-fect price elasticity as well as policyholder preferences for financial quality.For our model assumptions, profit margins for most lines of business are higherfor higher values of the default put option value except for the case of CTP.Imperfect markets result in standard competitive market results no longer hold-ing for optimal EVA capitalization and pricing strategies.
4.3. The Impact of Frictional Costs
4.3.1. Corporate Tax
We now consider the impact of corporate taxes on optimal strategies. We deter-mine EVA maximizing strategies for a range of tax rates, from zero to 30%.Other frictional costs are assumed to be zero. Increasing taxes reduces the
ENTERPRISE RISK MANAGEMENT AND MARKET FRICTIONS 321
7.4% 7.4%
4.7% 4.6%
8.4%
10.0%
7.1%6.8%
3.9%4.2%
0%
2%
4%
6%
8%
10%
12%
Motor Household Fire & ISR Liability CTP
No preference for financial quality
Preference for financial quality
Eco
nom
ic P
rofi
t Mar
gin
0587-07_Astin38/1_16 02-06-2008 13:50 Pagina 321
, available at https://www.cambridge.org/core/terms. https://doi.org/10.1017/S051503610001518XDownloaded from https://www.cambridge.org/core. IP address: 54.39.106.173, on 30 May 2020 at 06:30:26, subject to the Cambridge Core terms of use
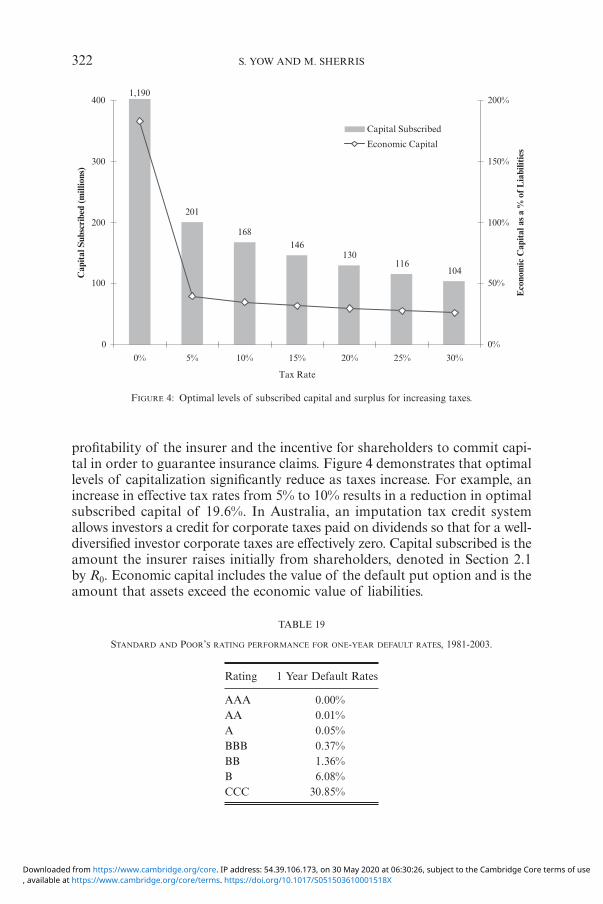
FIGURE 4: Optimal levels of subscribed capital and surplus for increasing taxes.
profitability of the insurer and the incentive for shareholders to commit capi-tal in order to guarantee insurance claims. Figure 4 demonstrates that optimallevels of capitalization significantly reduce as taxes increase. For example, anincrease in effective tax rates from 5% to 10% results in a reduction in optimalsubscribed capital of 19.6%. In Australia, an imputation tax credit systemallows investors a credit for corporate taxes paid on dividends so that for a well-diversified investor corporate taxes are effectively zero. Capital subscribed is theamount the insurer raises initially from shareholders, denoted in Section 2.1by R0. Economic capital includes the value of the default put option and is theamount that assets exceed the economic value of liabilities.
322 S. YOW AND M. SHERRIS
1,190
201
168146
130116
104
0
100
200
300
400
0% 5% 10% 15% 20% 25% 30%
Tax Rate
0%
50%
100%
150%
200%
Capital Subscribed
Economic Capital
Cap
ital
Sub
scri
bed
(mill
ions
)
Eco
nom
ic C
apit
al a
s a
% o
f Lia
bilit
ies
TABLE 19
STANDARD AND POOR’S RATING PERFORMANCE FOR ONE-YEAR DEFAULT RATES, 1981-2003.
Rating 1 Year Default Rates
AAA 0.00%AA 0.01%A 0.05%BBB 0.37%BB 1.36%B 6.08%CCC 30.85%
0587-07_Astin38/1_16 02-06-2008 13:50 Pagina 322
, available at https://www.cambridge.org/core/terms. https://doi.org/10.1017/S051503610001518XDownloaded from https://www.cambridge.org/core. IP address: 54.39.106.173, on 30 May 2020 at 06:30:26, subject to the Cambridge Core terms of use
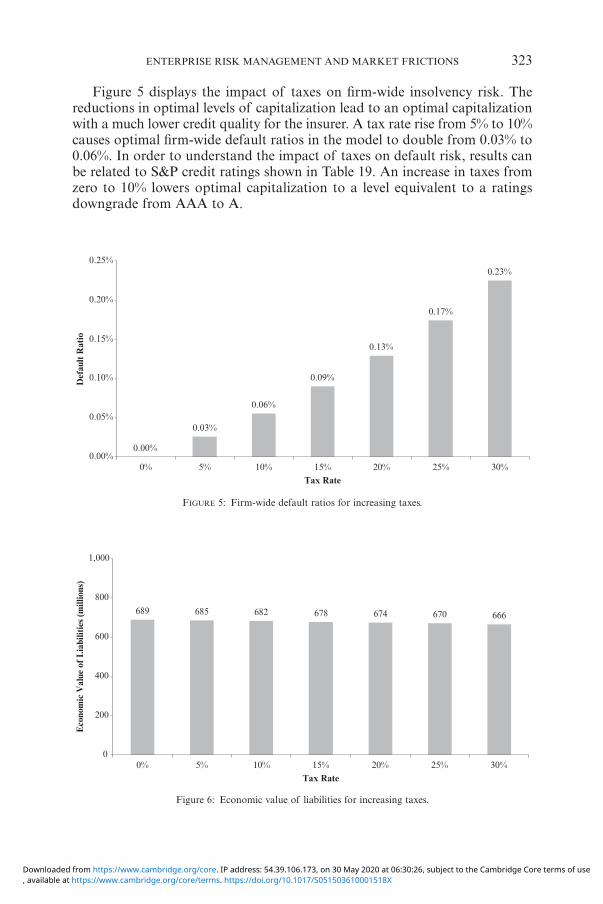
Figure 5 displays the impact of taxes on firm-wide insolvency risk. Thereductions in optimal levels of capitalization lead to an optimal capitalizationwith a much lower credit quality for the insurer. A tax rate rise from 5% to 10%causes optimal firm-wide default ratios in the model to double from 0.03% to0.06%. In order to understand the impact of taxes on default risk, results canbe related to S&P credit ratings shown in Table 19. An increase in taxes fromzero to 10% lowers optimal capitalization to a level equivalent to a ratingsdowngrade from AAA to A.
ENTERPRISE RISK MANAGEMENT AND MARKET FRICTIONS 323
FIGURE 5: Firm-wide default ratios for increasing taxes.
0.00%
0.03%
0.06%
0.09%
0.13%
0.17%
0.23%
0.00%
0.05%
0.10%
0.15%
0.20%
0.25%
0% 5% 10% 15% 20% 25% 30%Tax Rate
Def
ault
Rat
io
Figure 6: Economic value of liabilities for increasing taxes.
689 685 682 678 674 670 666
0
200
400
600
800
1,000
0% 5% 10% 15% 20% 25% 30%Tax Rate
Eco
nom
ic V
alue
of L
iabi
litie
s (m
illio
ns)
0587-07_Astin38/1_16 02-06-2008 13:50 Pagina 323
, available at https://www.cambridge.org/core/terms. https://doi.org/10.1017/S051503610001518XDownloaded from https://www.cambridge.org/core. IP address: 54.39.106.173, on 30 May 2020 at 06:30:26, subject to the Cambridge Core terms of use
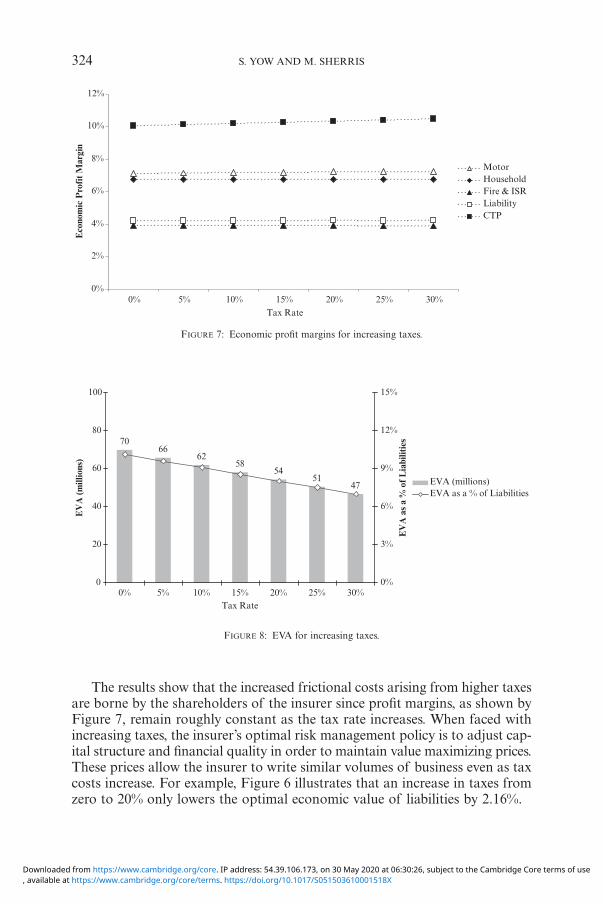
The results show that the increased frictional costs arising from higher taxesare borne by the shareholders of the insurer since profit margins, as shown byFigure 7, remain roughly constant as the tax rate increases. When faced withincreasing taxes, the insurer’s optimal risk management policy is to adjust cap-ital structure and financial quality in order to maintain value maximizing prices.These prices allow the insurer to write similar volumes of business even as taxcosts increase. For example, Figure 6 illustrates that an increase in taxes fromzero to 20% only lowers the optimal economic value of liabilities by 2.16%.
324 S. YOW AND M. SHERRIS
FIGURE 7: Economic profit margins for increasing taxes.
0%
2%
4%
6%
8%
10%
12%
0% 5% 10% 15% 20% 25% 30%Tax Rate
MotorHouseholdFire & ISRLiabilityCTP
Eco
nom
ic P
rofi
t Mar
gin
FIGURE 8: EVA for increasing taxes.
7066
6258
5451
47
0
20
40
60
80
100
0% 5% 10% 15% 20% 25% 30%Tax Rate
0%
3%
6%
9%
12%
15%
EVA (millions)EVA as a % of Liabilities
EV
A a
s a
% o
f Lia
bilit
ies
EV
A (m
illio
ns)
0587-07_Astin38/1_16 02-06-2008 13:50 Pagina 324
, available at https://www.cambridge.org/core/terms. https://doi.org/10.1017/S051503610001518XDownloaded from https://www.cambridge.org/core. IP address: 54.39.106.173, on 30 May 2020 at 06:30:26, subject to the Cambridge Core terms of use
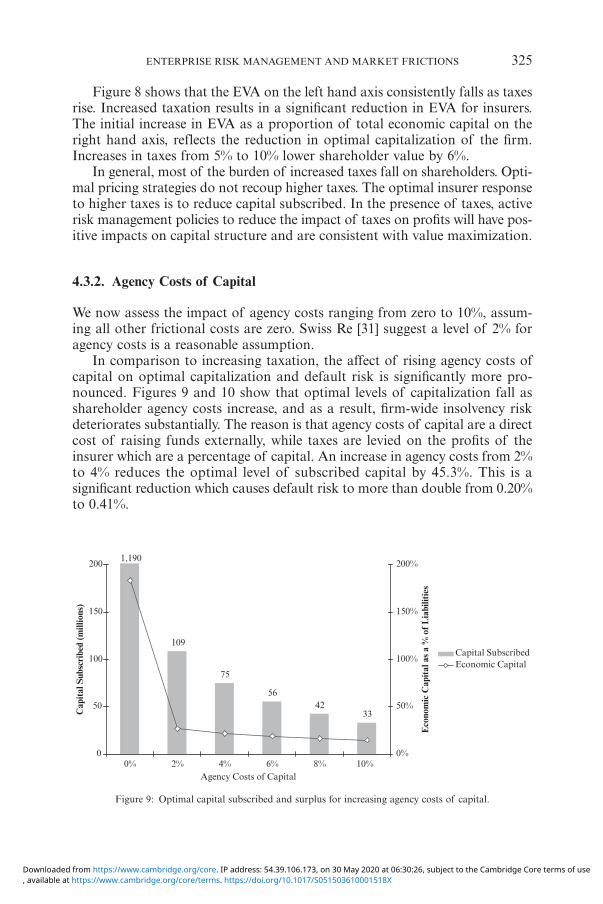
Figure 8 shows that the EVA on the left hand axis consistently falls as taxesrise. Increased taxation results in a significant reduction in EVA for insurers.The initial increase in EVA as a proportion of total economic capital on theright hand axis, reflects the reduction in optimal capitalization of the firm.Increases in taxes from 5% to 10% lower shareholder value by 6%.
In general, most of the burden of increased taxes fall on shareholders. Opti-mal pricing strategies do not recoup higher taxes. The optimal insurer responseto higher taxes is to reduce capital subscribed. In the presence of taxes, activerisk management policies to reduce the impact of taxes on profits will have pos-itive impacts on capital structure and are consistent with value maximization.
4.3.2. Agency Costs of Capital
We now assess the impact of agency costs ranging from zero to 10%, assum-ing all other frictional costs are zero. Swiss Re [31] suggest a level of 2% foragency costs is a reasonable assumption.
In comparison to increasing taxation, the affect of rising agency costs ofcapital on optimal capitalization and default risk is significantly more pro-nounced. Figures 9 and 10 show that optimal levels of capitalization fall asshareholder agency costs increase, and as a result, firm-wide insolvency riskdeteriorates substantially. The reason is that agency costs of capital are a directcost of raising funds externally, while taxes are levied on the profits of theinsurer which are a percentage of capital. An increase in agency costs from 2%to 4% reduces the optimal level of subscribed capital by 45.3%. This is asignificant reduction which causes default risk to more than double from 0.20%to 0.41%.
ENTERPRISE RISK MANAGEMENT AND MARKET FRICTIONS 325
Figure 9: Optimal capital subscribed and surplus for increasing agency costs of capital.
1,190
109
75
5642
33
0
50
100
150
200
0% 2% 4% 6% 8% 10%Agency Costs of Capital
0%
50%
100%
150%
200%
Capital Subscribed
Cap
ital
Sub
scri
bed
(mill
ions
)
Economic Capital
Eco
nom
ic C
apit
al a
s a
% o
f Lia
bilit
ies
0587-07_Astin38/1_16 02-06-2008 13:50 Pagina 325
, available at https://www.cambridge.org/core/terms. https://doi.org/10.1017/S051503610001518XDownloaded from https://www.cambridge.org/core. IP address: 54.39.106.173, on 30 May 2020 at 06:30:26, subject to the Cambridge Core terms of use
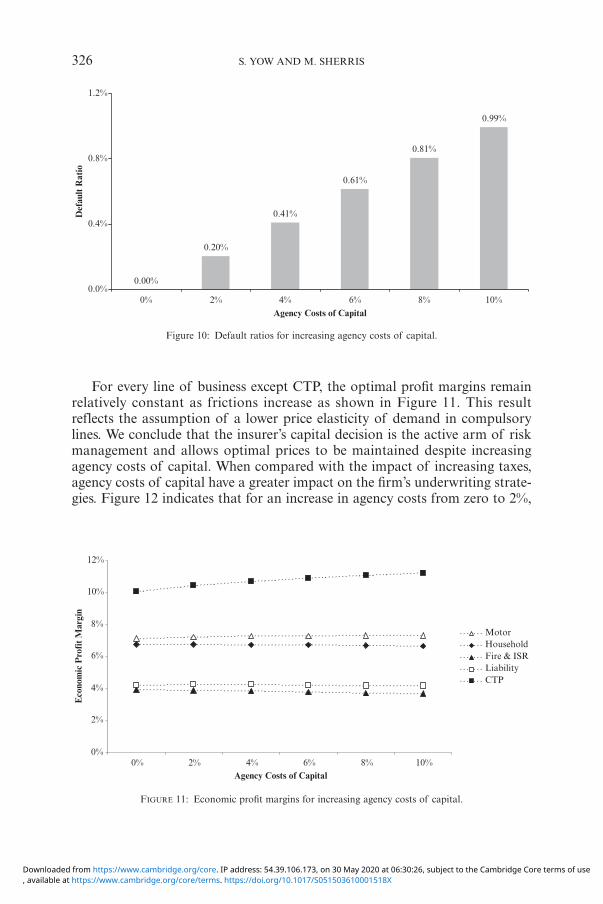
For every line of business except CTP, the optimal profit margins remainrelatively constant as frictions increase as shown in Figure 11. This resultreflects the assumption of a lower price elasticity of demand in compulsorylines. We conclude that the insurer’s capital decision is the active arm of riskmanagement and allows optimal prices to be maintained despite increasingagency costs of capital. When compared with the impact of increasing taxes,agency costs of capital have a greater impact on the firm’s underwriting strate-gies. Figure 12 indicates that for an increase in agency costs from zero to 2%,
326 S. YOW AND M. SHERRIS
Figure 10: Default ratios for increasing agency costs of capital.
0.00%
0.20%
0.41%
0.61%
0.81%
0.99%
0.0%
0.4%
0.8%
1.2%
0% 2% 4% 6% 8% 10%Agency Costs of Capital
Def
ault
Rat
io
FIGURE 11: Economic profit margins for increasing agency costs of capital.
0%
2%
4%
6%
8%
10%
12%
0% 2% 4% 6% 8% 10%Agency Costs of Capital
MotorHouseholdFire & ISRLiabilityCTP
Eco
nom
ic P
rofi
t Mar
gin
0587-07_Astin38/1_16 02-06-2008 13:50 Pagina 326
, available at https://www.cambridge.org/core/terms. https://doi.org/10.1017/S051503610001518XDownloaded from https://www.cambridge.org/core. IP address: 54.39.106.173, on 30 May 2020 at 06:30:26, subject to the Cambridge Core terms of use
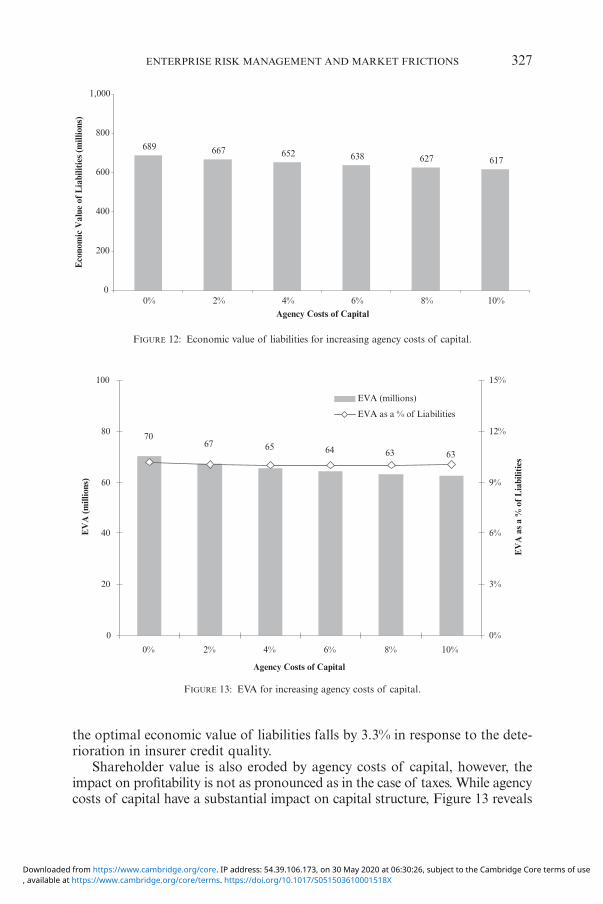
the optimal economic value of liabilities falls by 3.3% in response to the dete-rioration in insurer credit quality.
Shareholder value is also eroded by agency costs of capital, however, theimpact on profitability is not as pronounced as in the case of taxes. While agencycosts of capital have a substantial impact on capital structure, Figure 13 reveals
ENTERPRISE RISK MANAGEMENT AND MARKET FRICTIONS 327
FIGURE 12: Economic value of liabilities for increasing agency costs of capital.
689 667 652 638 627 617
0
200
400
600
800
1,000
0% 2% 4% 6% 8% 10%Agency Costs of Capital
Eco
nom
ic V
alue
of L
iabi
litie
s (m
illio
ns)
FIGURE 13: EVA for increasing agency costs of capital.
7067 65 64 63 63
0
20
40
60
80
100
0% 2% 4% 6% 8% 10%
Agency Costs of Capital
0%
3%
6%
9%
12%
15%
EVA (millions)
EVA as a % of Liabilities
EV
A a
s a
% o
f Lia
bilit
ies
EV
A (m
illio
ns)
0587-07_Astin38/1_16 02-06-2008 13:50 Pagina 327
, available at https://www.cambridge.org/core/terms. https://doi.org/10.1017/S051503610001518XDownloaded from https://www.cambridge.org/core. IP address: 54.39.106.173, on 30 May 2020 at 06:30:26, subject to the Cambridge Core terms of use
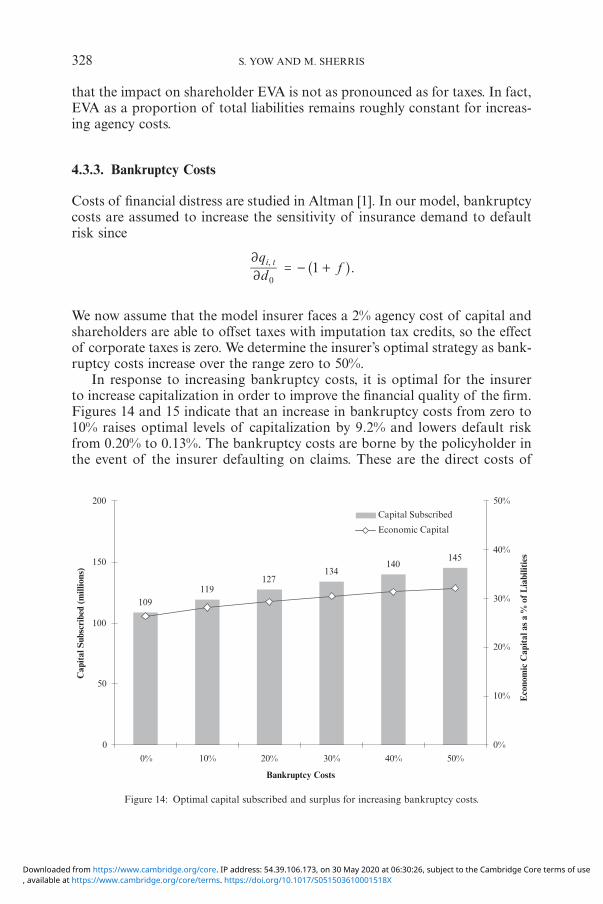
Figure 14: Optimal capital subscribed and surplus for increasing bankruptcy costs.
that the impact on shareholder EVA is not as pronounced as for taxes. In fact,EVA as a proportion of total liabilities remains roughly constant for increas-ing agency costs.
4.3.3. Bankruptcy Costs
Costs of financial distress are studied in Altman [1]. In our model, bankruptcycosts are assumed to increase the sensitivity of insurance demand to defaultrisk since
.f1,i t
02
2= - +
qd ^ h
We now assume that the model insurer faces a 2% agency cost of capital andshareholders are able to offset taxes with imputation tax credits, so the effectof corporate taxes is zero. We determine the insurer’s optimal strategy as bank-ruptcy costs increase over the range zero to 50%.
In response to increasing bankruptcy costs, it is optimal for the insurerto increase capitalization in order to improve the financial quality of the firm.Figures 14 and 15 indicate that an increase in bankruptcy costs from zero to10% raises optimal levels of capitalization by 9.2% and lowers default riskfrom 0.20% to 0.13%. The bankruptcy costs are borne by the policyholder inthe event of the insurer defaulting on claims. These are the direct costs of
328 S. YOW AND M. SHERRIS
109119
127134
140145
0
50
100
150
200
0% 10% 20% 30% 40% 50%
Bankruptcy Costs
0%
10%
20%
30%
40%
50%
Capital Subscribed
Economic Capital
Cap
ital
Sub
scri
bed
(mill
ions
)
Eco
nom
ic C
apit
al a
s a
% o
f Lia
bilit
ies
0587-07_Astin38/1_16 02-06-2008 13:51 Pagina 328
, available at https://www.cambridge.org/core/terms. https://doi.org/10.1017/S051503610001518XDownloaded from https://www.cambridge.org/core. IP address: 54.39.106.173, on 30 May 2020 at 06:30:26, subject to the Cambridge Core terms of use
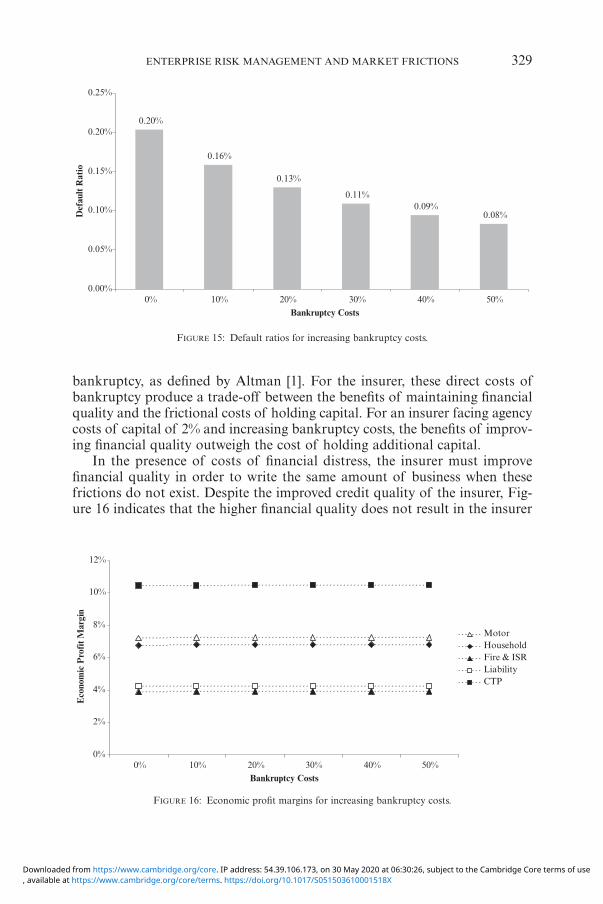
FIGURE 15: Default ratios for increasing bankruptcy costs.
FIGURE 16: Economic profit margins for increasing bankruptcy costs.
bankruptcy, as defined by Altman [1]. For the insurer, these direct costs ofbankruptcy produce a trade-off between the benefits of maintaining financialquality and the frictional costs of holding capital. For an insurer facing agencycosts of capital of 2% and increasing bankruptcy costs, the benefits of improv-ing financial quality outweigh the cost of holding additional capital.
In the presence of costs of financial distress, the insurer must improve financial quality in order to write the same amount of business when thesefrictions do not exist. Despite the improved credit quality of the insurer, Fig-ure 16 indicates that the higher financial quality does not result in the insurer
ENTERPRISE RISK MANAGEMENT AND MARKET FRICTIONS 329
0.20%
0.16%
0.13%
0.11%0.09%
0.08%
0.00%
0.05%
0.10%
0.15%
0.20%
0.25%
0% 10% 20% 30% 40% 50%Bankruptcy Costs
Def
ault
Rat
io
0%
2%
4%
6%
8%
10%
12%
0% 10% 20% 30% 40% 50%Bankruptcy Costs
MotorHouseholdFire & ISRLiabilityCTP
Eco
nom
ic P
rofi
t Mar
gin
0587-07_Astin38/1_16 02-06-2008 13:51 Pagina 329
, available at https://www.cambridge.org/core/terms. https://doi.org/10.1017/S051503610001518XDownloaded from https://www.cambridge.org/core. IP address: 54.39.106.173, on 30 May 2020 at 06:30:26, subject to the Cambridge Core terms of use
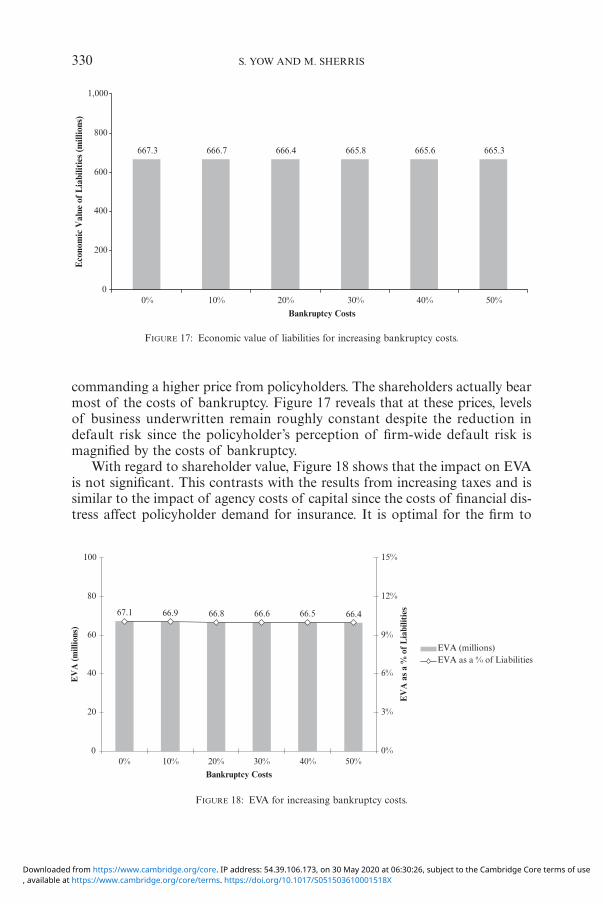
FIGURE 17: Economic value of liabilities for increasing bankruptcy costs.
FIGURE 18: EVA for increasing bankruptcy costs.
commanding a higher price from policyholders. The shareholders actually bearmost of the costs of bankruptcy. Figure 17 reveals that at these prices, levelsof business underwritten remain roughly constant despite the reduction indefault risk since the policyholder’s perception of firm-wide default risk ismagnified by the costs of bankruptcy.
With regard to shareholder value, Figure 18 shows that the impact on EVAis not significant. This contrasts with the results from increasing taxes and issimilar to the impact of agency costs of capital since the costs of financial dis-tress affect policyholder demand for insurance. It is optimal for the firm to
330 S. YOW AND M. SHERRIS
667.3 666.7 666.4 665.8 665.6 665.3
0
200
400
600
800
1,000
0% 10% 20% 30% 40% 50%
Bankruptcy Costs
Eco
nom
ic V
alue
of L
iabi
litie
s (m
illio
ns)
67.1 66.9 66.8 66.6 66.5 66.4
0
20
40
60
80
100
0% 10% 20% 30% 40% 50%
Bankruptcy Costs
0%
3%
6%
9%
12%
15%
EVA (millions)
EV
A (m
illio
ns)
EVA as a % of Liabilities
EV
A a
s a
% o
f Lia
bilit
ies
0587-07_Astin38/1_16 02-06-2008 13:51 Pagina 330
, available at https://www.cambridge.org/core/terms. https://doi.org/10.1017/S051503610001518XDownloaded from https://www.cambridge.org/core. IP address: 54.39.106.173, on 30 May 2020 at 06:30:26, subject to the Cambridge Core terms of use
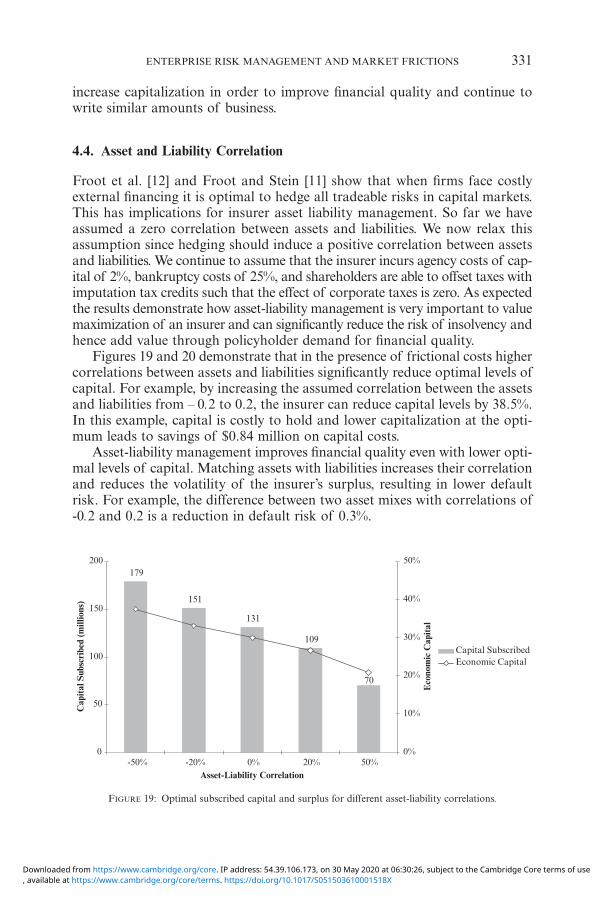
increase capitalization in order to improve financial quality and continue towrite similar amounts of business.
4.4. Asset and Liability Correlation
Froot et al. [12] and Froot and Stein [11] show that when firms face costlyexternal financing it is optimal to hedge all tradeable risks in capital markets.This has implications for insurer asset liability management. So far we haveassumed a zero correlation between assets and liabilities. We now relax thisassumption since hedging should induce a positive correlation between assetsand liabilities. We continue to assume that the insurer incurs agency costs of cap-ital of 2%, bankruptcy costs of 25%, and shareholders are able to offset taxes withimputation tax credits such that the effect of corporate taxes is zero. As expectedthe results demonstrate how asset-liability management is very important to valuemaximization of an insurer and can significantly reduce the risk of insolvency andhence add value through policyholder demand for financial quality.
Figures 19 and 20 demonstrate that in the presence of frictional costs highercorrelations between assets and liabilities significantly reduce optimal levels ofcapital. For example, by increasing the assumed correlation between the assetsand liabilities from – 0.2 to 0.2, the insurer can reduce capital levels by 38.5%.In this example, capital is costly to hold and lower capitalization at the opti-mum leads to savings of $0.84 million on capital costs.
Asset-liability management improves financial quality even with lower opti-mal levels of capital. Matching assets with liabilities increases their correlationand reduces the volatility of the insurer’s surplus, resulting in lower defaultrisk. For example, the difference between two asset mixes with correlations of-0.2 and 0.2 is a reduction in default risk of 0.3%.
ENTERPRISE RISK MANAGEMENT AND MARKET FRICTIONS 331
FIGURE 19: Optimal subscribed capital and surplus for different asset-liability correlations.
179
151
131
109
70
0
50
100
150
200
-50% -20% 0% 20% 50%Asset-Liability Correlation
0%
10%
20%
30%
40%
50%
Capital SubscribedEconomic Capital
Eco
nom
ic C
apit
al
Cap
ital
Sub
scri
bed
(mill
ions
)
0587-07_Astin38/1_16 02-06-2008 13:51 Pagina 331
, available at https://www.cambridge.org/core/terms. https://doi.org/10.1017/S051503610001518XDownloaded from https://www.cambridge.org/core. IP address: 54.39.106.173, on 30 May 2020 at 06:30:26, subject to the Cambridge Core terms of use
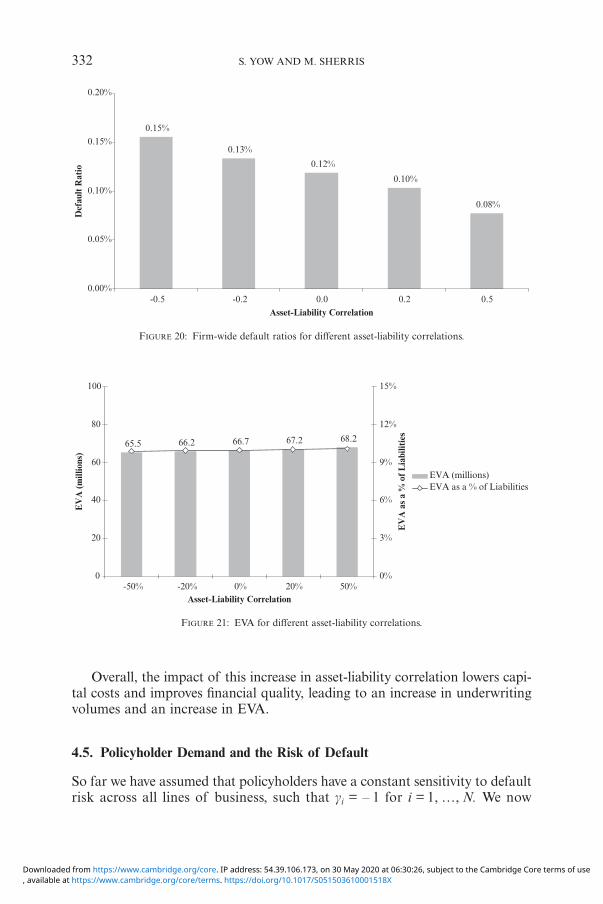
Overall, the impact of this increase in asset-liability correlation lowers capi-tal costs and improves financial quality, leading to an increase in underwritingvolumes and an increase in EVA.
4.5. Policyholder Demand and the Risk of Default
So far we have assumed that policyholders have a constant sensitivity to defaultrisk across all lines of business, such that gi = – 1 for i = 1, …, N. We now
332 S. YOW AND M. SHERRIS
FIGURE 20: Firm-wide default ratios for different asset-liability correlations.
0.15%
0.13%
0.12%
0.10%
0.08%
0.00%
0.05%
0.10%
0.15%
0.20%
-0.5 -0.2 0.0 0.2 0.5Asset-Liability Correlation
Def
ault
Rat
io
FIGURE 21: EVA for different asset-liability correlations.
65.5 66.2 66.7 67.2 68.2
0
20
40
60
80
100
-50% -20% 0% 20% 50%Asset-Liability Correlation
0%
3%
6%
9%
12%
15%
EVA (millions)
EV
A (m
illio
ns)
EVA as a % of Liabilities
EV
A a
s a
% o
f Lia
bilit
ies
0587-07_Astin38/1_16 02-06-2008 13:51 Pagina 332
, available at https://www.cambridge.org/core/terms. https://doi.org/10.1017/S051503610001518XDownloaded from https://www.cambridge.org/core. IP address: 54.39.106.173, on 30 May 2020 at 06:30:26, subject to the Cambridge Core terms of use
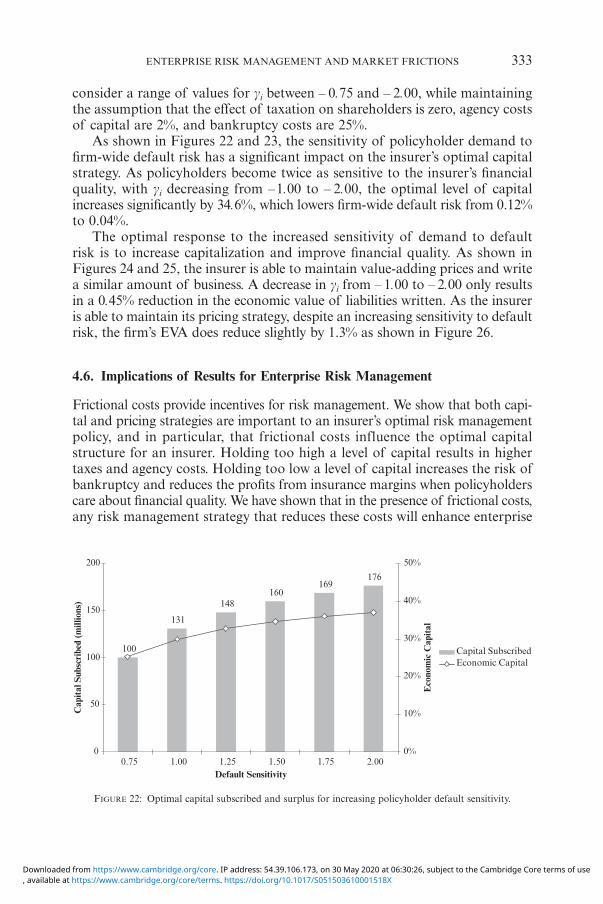
consider a range of values for gi between – 0.75 and – 2.00, while maintainingthe assumption that the effect of taxation on shareholders is zero, agency costsof capital are 2%, and bankruptcy costs are 25%.
As shown in Figures 22 and 23, the sensitivity of policyholder demand tofirm-wide default risk has a significant impact on the insurer’s optimal capitalstrategy. As policyholders become twice as sensitive to the insurer’s financialquality, with gi decreasing from –1.00 to – 2.00, the optimal level of capitalincreases significantly by 34.6%, which lowers firm-wide default risk from 0.12%to 0.04%.
The optimal response to the increased sensitivity of demand to defaultrisk is to increase capitalization and improve financial quality. As shown inFigures 24 and 25, the insurer is able to maintain value-adding prices and writea similar amount of business. A decrease in gi from – 1.00 to – 2.00 only resultsin a 0.45% reduction in the economic value of liabilities written. As the insureris able to maintain its pricing strategy, despite an increasing sensitivity to defaultrisk, the firm’s EVA does reduce slightly by 1.3% as shown in Figure 26.
4.6. Implications of Results for Enterprise Risk Management
Frictional costs provide incentives for risk management. We show that both capi-tal and pricing strategies are important to an insurer’s optimal risk managementpolicy, and in particular, that frictional costs influence the optimal capitalstructure for an insurer. Holding too high a level of capital results in highertaxes and agency costs. Holding too low a level of capital increases the risk ofbankruptcy and reduces the profits from insurance margins when policyholderscare about financial quality. We have shown that in the presence of frictional costs,any risk management strategy that reduces these costs will enhance enterprise
ENTERPRISE RISK MANAGEMENT AND MARKET FRICTIONS 333
FIGURE 22: Optimal capital subscribed and surplus for increasing policyholder default sensitivity.
100
131
148160
169176
0
50
100
150
200
0.75 1.00 1.25 1.50 1.75 2.00Default Sensitivity
0%
10%
20%
30%
40%
50%
Capital SubscribedEconomic Capital
Eco
nom
ic C
apit
al
Cap
ital
Sub
scri
bed
(mill
ions
)
0587-07_Astin38/1_16 02-06-2008 13:51 Pagina 333
, available at https://www.cambridge.org/core/terms. https://doi.org/10.1017/S051503610001518XDownloaded from https://www.cambridge.org/core. IP address: 54.39.106.173, on 30 May 2020 at 06:30:26, subject to the Cambridge Core terms of use
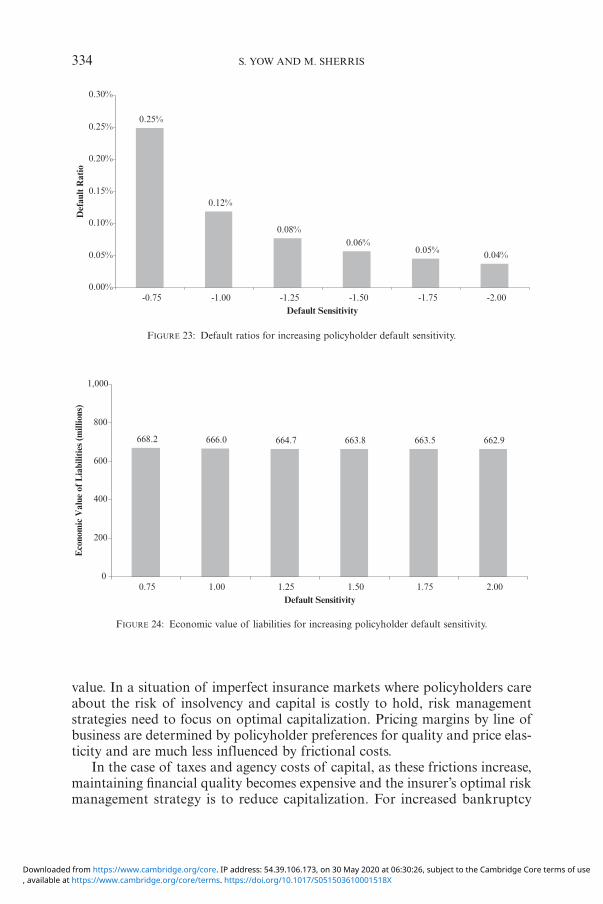
value. In a situation of imperfect insurance markets where policyholders careabout the risk of insolvency and capital is costly to hold, risk managementstrategies need to focus on optimal capitalization. Pricing margins by line ofbusiness are determined by policyholder preferences for quality and price elas-ticity and are much less influenced by frictional costs.
In the case of taxes and agency costs of capital, as these frictions increase,maintaining financial quality becomes expensive and the insurer’s optimal riskmanagement strategy is to reduce capitalization. For increased bankruptcy
334 S. YOW AND M. SHERRIS
FIGURE 23: Default ratios for increasing policyholder default sensitivity.
0.25%
0.12%
0.08%0.06%
0.05% 0.04%
0.00%
0.05%
0.10%
0.15%
0.20%
0.25%
0.30%
-0.75 -1.00 -1.25 -1.50 -1.75 -2.00Default Sensitivity
Def
ault
Rat
io
FIGURE 24: Economic value of liabilities for increasing policyholder default sensitivity.
668.2 666.0 664.7 663.8 663.5 662.9
0
200
400
600
800
1,000
0.75 1.00 1.25 1.50 1.75 2.00Default Sensitivity
Eco
nom
ic V
alue
of L
iabi
litie
s (m
illio
ns)
0587-07_Astin38/1_16 02-06-2008 13:51 Pagina 334
, available at https://www.cambridge.org/core/terms. https://doi.org/10.1017/S051503610001518XDownloaded from https://www.cambridge.org/core. IP address: 54.39.106.173, on 30 May 2020 at 06:30:26, subject to the Cambridge Core terms of use
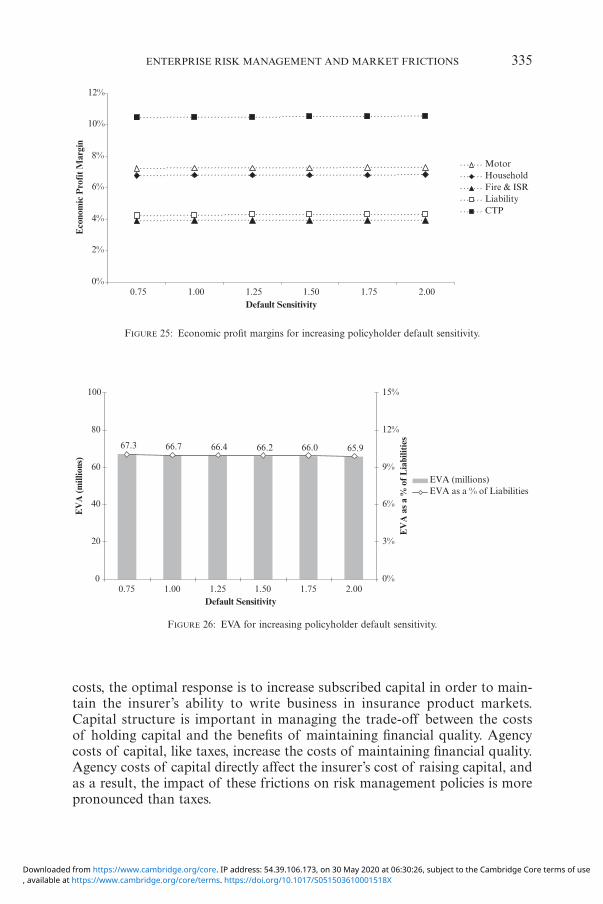
costs, the optimal response is to increase subscribed capital in order to main-tain the insurer’s ability to write business in insurance product markets.Capital structure is important in managing the trade-off between the costsof holding capital and the benefits of maintaining financial quality. Agencycosts of capital, like taxes, increase the costs of maintaining financial quality.Agency costs of capital directly affect the insurer’s cost of raising capital, andas a result, the impact of these frictions on risk management policies is morepronounced than taxes.
ENTERPRISE RISK MANAGEMENT AND MARKET FRICTIONS 335
FIGURE 25: Economic profit margins for increasing policyholder default sensitivity.
0%
2%
4%
6%
8%
10%
12%
0.75 1.00 1.25 1.50 1.75 2.00Default Sensitivity
MotorHouseholdFire & ISRLiabilityCTP
Eco
nom
ic P
rofi
t Mar
gin
FIGURE 26: EVA for increasing policyholder default sensitivity.
67.3 66.7 66.4 66.2 66.0 65.9
0
20
40
60
80
100
0.75 1.00 1.25 1.50 1.75 2.00Default Sensitivity
0%
3%
6%
9%
12%
15%
EVA (millions)
EV
A (m
illio
ns)
EVA as a % of Liabilities
EV
A a
s a
% o
f Lia
bilit
ies
0587-07_Astin38/1_16 02-06-2008 13:51 Pagina 335
, available at https://www.cambridge.org/core/terms. https://doi.org/10.1017/S051503610001518XDownloaded from https://www.cambridge.org/core. IP address: 54.39.106.173, on 30 May 2020 at 06:30:26, subject to the Cambridge Core terms of use
Bankruptcy costs result in the insurer raising additional capital in order toimprove the financial quality of the firm, in order to maintain value maximizingprices and write optimal levels of business. The optimal response of capitalstrategies to agency costs and bankruptcy costs attenuate the loss in enterprisevalue, with EVA remaining at an approximately constant percentage of liabilitiesfor increases in these frictional costs.
Matching assets and liabilities is an important part of effective risk man-agement. We show, for our model assumptions, that small increases in theasset-liability correlation significantly reduce the insurer’s optimal capitaliza-tion and improve financial quality. By increasing the correlation between assetsand liabilities, the insurer can lower costs from holding capital and increaseenterprise value.
For our model assumptions, shareholders bear the costs of capital in amarket where policyholder demand for insurance is inelastic. We show thatthe optimal response of pricing strategies to increasing frictional costs is gen-erally to leave economic profit margins at approximately constant value max-imizing levels. For the insurer, capital management is then the active arm ofrisk management and, at the optimum, must be designed to reduce the frictionalcosts borne by the insurer. The price elasticity of policyholder demand willmake it sub-optimal to pass these frictional costs to policyholders throughhigher insurance premium profit margins. Doing this will reduce shareholdervalue by reducing the value of profit margins from reduced business volumes.
For our model assumptions, profit margins are not significantly lower forinsurers with lower financial quality in imperfect product markets. Insurerswith a higher risk of default will have lower capitalization and will write lowervolumes of business if they charge the same prices as insurers with lowerdefault risk.
5. CONCLUSIONS
There is an increasing awareness of the role of economic capital, not only asa risk management tool, but also in its capacity to measure value and influ-ence financial decision-making. Most of the recent focus has been on riskbased capital requirements with limited study of enterprise value maximizingcapital strategies. For insurers in particular, the presence of high frictionalcosts creates a trade-off between the costs of holding capital and the benefitsof maintaining financial quality. We examine this trade-off and provide guid-ance for the determination of economic capital allowing for imperfect markets.
This paper developed a single-period economic model of a multi-line insurerin an imperfect market with frictional costs of capital, imperfectly elasticdemand for insurance, and policyholder preferences for financial quality.
The model was calibrated to be representative of a large diversified generalinsurer and the impact of frictional costs on risk management and capital wasquantified.
336 S. YOW AND M. SHERRIS
0587-07_Astin38/1_16 02-06-2008 13:51 Pagina 336
, available at https://www.cambridge.org/core/terms. https://doi.org/10.1017/S051503610001518XDownloaded from https://www.cambridge.org/core. IP address: 54.39.106.173, on 30 May 2020 at 06:30:26, subject to the Cambridge Core terms of use
We find for our model assumptions that frictional costs do provide a strongrationale for risk management, as quantified by optimal capital, and consis-tent with enterprise value maximization. Holding optimal levels of capitalwill reduce frictional costs from writing insurance business and allows profitmaximizing sales of policies with policyholder preferences for financial quality.Frictional costs are not required in order for the insurer to have an optimal cap-italization. Policyholder preferences for financial quality alone also result in anoptimal insurer capitalization.
A range of assumptions concerning frictional costs were examined to assessthe impact on the results. Assumptions used were as realistic as possible, how-ever, there is a lack of information about price elasticity by line of business andprofits margins in the general insurance industry. Assumptions for policyholderdemand were used that produced price margins that were generally in line withhistorical data and that were consistent with a relatively competitive market.Further research on price elasticity would benefit studies of the optimal cap-ital structure of insurers.
We find that optimal price margins are not highly sensitive to frictionalcosts of capital. In imperfect insurance markets we find that pricing marginsare mainly determined by price elasticities and policyholder preferences forfinancial quality. We also demonstrate that the value of the default optionvalue is an important measure of the capital adequacy and solvency of aninsurer and impacts on the capitalization of the insurer. However, this defaultoption value by line does not fully reflect in the profit margins of insurancepremiums since the enterprise value maximizing pricing margins are relativelyinsensitive to this value. We also find that pricing margins are not significantlyimpacted by higher levels of frictional costs since shareholders actually bearmost of these costs. We have considered both capital, which reflects the impactof frictional costs, and value added which reflects insurance pricing margins.
Risk based capital and economic capital models only focus on the capitaldecision. Enterprise risk management must focus more broadly than economiccapital if it is to add value to the financial management of an insurer. We haveaimed to provide a basis for broadening the focus of enterprise risk manage-ment by demonstrating the benefits of considering enterprise value addingcapital and pricing strategies in a consistent model framework. We have alsoformally incorporated optimal decision making into a model with market fric-tions and imperfect demand elasticity. In a companion paper we study capitalallocation and pricing using the EVA approach that is presented and analyzedin this paper.
REFERENCES
[1] ALTMAN, E.I. (1984) ‘A Further Empirical Investigation of the Bankruptcy Cost Question.’Journal of Finance 39, 1067-1089.
[2] COCHRANE, J.H. (2005) Asset Pricing. Princeton University Press.[3] CULP, C.L. (2001) The Risk Management Process. John Wiley and Sons, New York.
ENTERPRISE RISK MANAGEMENT AND MARKET FRICTIONS 337
0587-07_Astin38/1_16 02-06-2008 13:51 Pagina 337
, available at https://www.cambridge.org/core/terms. https://doi.org/10.1017/S051503610001518XDownloaded from https://www.cambridge.org/core. IP address: 54.39.106.173, on 30 May 2020 at 06:30:26, subject to the Cambridge Core terms of use
[4] CUMMINS, J.D., LIN, Y., and PHILLIPS, R.D. (2006) ‘Capital Allocation and the Pricing ofFinancially Intermediated Risks: An Empirical Investigation.’ Wharton Financial Institu-tions Center 06-13.
[5] CUMMINS, J.D. and PHILLIPS, R.D. (2005) ‘Estimating the Cost of Equity Capital for Prop-erty-Liability Insurers.’ Journal of Risk and Insurance, 72(3), 441-478.
[6] CUMMINS, J.D. and DANZON, P.M. (1997) ‘Price, Financial Quality, and Capital Flows inInsurance Markets.’ Journal of Financial Intermediation 6, 3-38.
[7] D’ARCY, S.P. and GARVEN, J.R. (1990) ‘Property-Liability Insurance Pricing Models: AnEmpirical Evaluation.’ Journal of Risk and Insurance 57, 391-430.
[8] D’ARCY, S.P. and GORVETT, R.W. (1998) ‘A Comparison of Property/Casualty InsuranceFinancial Pricing Models.’ Proceedings of the Casualty Actuarial Society, LXXXV; Part 1,162, 1-88.
[9] DOHERTY, N.A. and GARVEN, J.R. (1986) ‘Price Regulation in Property-Liability Insurance:A Contingent-Claims Approach.’ Journal of Finance 41, 1031-1050.
[10] FRENKEL, M., HOMMEL, U. and RUDOLF, M. (eds.) (2005) Risk Management: Challenge andOpportunity. Springer, Berlin-Heidelberg.
[11] FROOT, K.A. and STEIN, J.C. (1998) ‘Risk Management, Capital Budgeting, and CapitalStructure Policy for Financial Institutions: An Integrated Approach.’ Journal of FinancialEconomics 47, 55-82.
[12] FROOT, K.A., SCHARFSTEIN, D.S. and STEIN, J.C. (1993) ‘Risk Management: CoordinatingCorporate Investment and Financing Policies.’ Journal of Finance 48, 1629-1658.
[13] HANCOCK, J., HUBER, P. and KOCH, P. (2001) ‘The Economics of Insurance: How InsurersCreate Value for Shareholders.’ Swiss Re Technical Publishing 2nd Edition.
[14] HILL, R. (1979) ‘Profit Regulation in Property-Liability Insurance.’ Bell Journal of Eco-nomics 10, 172-191.
[15] HITCHCOX, A.N., HINDER, I.A., KAUFMAN, A.M., MAYNARD, T.J., SMITH, A.D. andWHITE, M.G. (2006) ‘Assessment of Target Capital for General Insurance Firms.’ Paperpresented to the Institute of Actuaries 27 November 2006.
[16] LEWIS, R.M. and TORCZON, V. (2000) ‘Pattern Search Methods for Linearly ConstrainedMinimization.’ SIAM Journal on Optimization 10, 917-941.
[17] LI, L. (2002) ‘Macroeconomic Factors and the Correlation of Stock and Bond Returns.’ YaleInternational Center for Finance Working Paper.
[18] MACMINN, R.D. (2005) The Fisher Model and Financial Markets. World Scientific.[19] MARGRABE, W. (1978) ‘The Value of an Option to Exchange One Asset for Another.’ Jour-
nal of Finance 33, 177-186.[20] MCNEIL, A.J., FREY, R. and EMBRECHTS, P. (2005) Quantitative Risk Management. Prince-
ton University Press, United Kingdom.[21] MERTON, R.C. and PEROLD, A.F. (1993) ‘Theory of Risk Capital in Financial Firms.’ Jour-
nal of Applied Corporate Finance 6, 16-32.[22] MODIGLIANI, F. and MILLER, M.H. (1958) ‘The Cost of Capital, Corporation Finance, and
the Theory of Investment.’ American Economic Review 48, 261-297.[23] MYERS, S.C. and READ, J.A. (2001) ‘Capital Allocation for Insurance Companies.’ Journal
of Risk and Insurance 3, 187-221.[24] PANNING, W.H. (2006) ‘Managing the Invisible: Measuring Risk, Managing Capital, Max-
imizing Value.’ Willis Re Working Paper.[25] PHILLIPS, R.D., CUMMINS, J.D. and ALLEN, F. (1998) ‘Financial Pricing of Insurance in the
Multiple Line Insurance Company.’ Journal of Risk and Insurance 65, 597-636.[26] SHERRIS, M. (2006) ‘Solvency, Capital Allocation and Fair Rate of Return in Insurance.’
Journal of Risk and Insurance 73, 71-96.[27] SHERRIS, M. and VAN DER HOEK, J. (2006) ‘Capital Allocation in Insurance: Economic Cap-
ital and the Allocation of the Default Option Value.’ North American Actuarial Journal 10,39-61.
[28] SMITH, J.E. (1996) ‘Fisher Separation and Project Valuation in Partially Complete Mar-kets.’ Duke University Working Paper.
[29] STULZ, R.M. (2003) Risk Management and Derivatives. South-Western, Ohio.[30] SUTHERLAND-WONG, C. and SHERRIS, M. (2005) ‘Risk-Based Regulatory Capital for Gen-
eral Insurers: A Case Study.’ Journal of Actuarial Practice 12, 5-46.
338 S. YOW AND M. SHERRIS
0587-07_Astin38/1_16 02-06-2008 13:51 Pagina 338
, available at https://www.cambridge.org/core/terms. https://doi.org/10.1017/S051503610001518XDownloaded from https://www.cambridge.org/core. IP address: 54.39.106.173, on 30 May 2020 at 06:30:26, subject to the Cambridge Core terms of use
[31] SWISS RE (2005) ‘Insurers’ cost of capital and economic value creation: principles and prac-tical implications.’ Swiss Re Technical Publishing Sigma No. 3.
[32] TANG, A. and VALDEZ, E.A. (2004) ‘Economic Capital and the Aggregation of Risks UsingCopulas.’ UNSW Working Paper.
[33] TORCZON, V. (1997) ‘On the Convergence of Pattern Search Algorithms.’ SIAM Journal onOptimization 7, 1-25.
[34] WARNER, J.B. (1977) ‘Bankruptcy Costs: Some Evidence.’ Journal of Finance 32, 337-348.[35] Yow, S. and SHERRIS, M. (2007) ‘Enterprise Risk Management, Insurer Pricing, and Capi-
tal Allocation.’ UNSW Actuarial Studies Working Paper and Paper presented to the BowlesSymposium and ERM Symposium, Chicago, March.
[36] ZANJANI, G. (2002) ‘Pricing and Capital Allocation in Catastrophe Insurance.’ Journal ofFinancial Economics 65, 283-305.
SHAUN YOW
The Boston Consulting GroupLevel 28, Chifley Tower, 2 Chifley SquareSydney, NSW, Australia, 2000E-Mail: [email protected]
MICHAEL SHERRIS
School of Actuarial Studies, Faculty of BusinessUniversity of New South WalesSydney, NSW, Australia, 2052E-Mail: [email protected]
ENTERPRISE RISK MANAGEMENT AND MARKET FRICTIONS 339
0587-07_Astin38/1_16 02-06-2008 13:51 Pagina 339
, available at https://www.cambridge.org/core/terms. https://doi.org/10.1017/S051503610001518XDownloaded from https://www.cambridge.org/core. IP address: 54.39.106.173, on 30 May 2020 at 06:30:26, subject to the Cambridge Core terms of use