Embed Size (px)
Citation preview
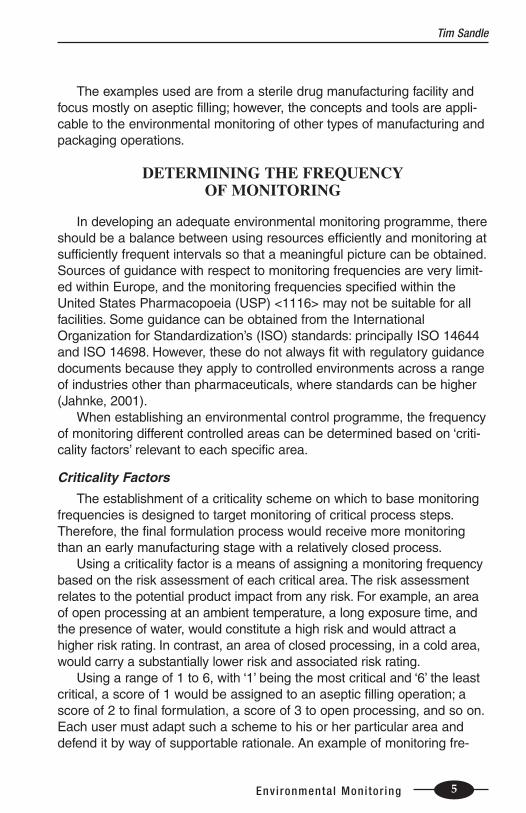
INTRODUCTION
Environmental Monitoring describes the microbiological testing under-taken in order to detect changing trends of microbial counts and micro-flora growth within cleanroom or controlled environments. The resultsobtained provide information about the physical construction of the room,the performance of the Heating, Ventilation, and Air-Conditioning (HVAC)system, personnel cleanliness, gowning practices, the equipment, andcleaning operations.
Over the past decade, environmental monitoring has become moresophisticated in moving from random sampling, using an imaginary gridover the room and testing in each grid, to the current focus on risk assess-ment and the use of risk assessment tools to determine the most appro-priate methods for environmental monitoring.
This paper explores current trends in the application of risk assessmentto the practice of environmental monitoring by examining the following keyareas:
• Determining the Frequency of Monitoring: Using the concept ofrisk assessment to decide how often to monitor different types ofcleanrooms
• Risk Assessment Tools: Applying risk assessment tools to estab-lish methods for environmental monitoring
• Numerical Approaches: Considering a numerical approach toassess risk data using a case study of an aseptic filling operation
4 Institute of Validation Technology
Environmental Monitoring
Risk AssessmentBy Tim Sandle
The examples used are from a sterile drug manufacturing facility andfocus mostly on aseptic filling; however, the concepts and tools are appli-cable to the environmental monitoring of other types of manufacturing andpackaging operations.
DETERMINING THE FREQUENCY OF MONITORING
In developing an adequate environmental monitoring programme, thereshould be a balance between using resources efficiently and monitoring atsufficiently frequent intervals so that a meaningful picture can be obtained.Sources of guidance with respect to monitoring frequencies are very limit-ed within Europe, and the monitoring frequencies specified within theUnited States Pharmacopoeia (USP) <1116> may not be suitable for allfacilities. Some guidance can be obtained from the InternationalOrganization for Standardization’s (ISO) standards: principally ISO 14644and ISO 14698. However, these do not always fit with regulatory guidancedocuments because they apply to controlled environments across a rangeof industries other than pharmaceuticals, where standards can be higher(Jahnke, 2001).
When establishing an environmental control programme, the frequencyof monitoring different controlled areas can be determined based on ‘criti-cality factors’ relevant to each specific area.
Criticality Factors
The establishment of a criticality scheme on which to base monitoringfrequencies is designed to target monitoring of critical process steps.Therefore, the final formulation process would receive more monitoringthan an early manufacturing stage with a relatively closed process.
Using a criticality factor is a means of assigning a monitoring frequencybased on the risk assessment of each critical area. The risk assessmentrelates to the potential product impact from any risk. For example, an areaof open processing at an ambient temperature, a long exposure time, andthe presence of water, would constitute a high risk and would attract ahigher risk rating. In contrast, an area of closed processing, in a cold area,would carry a substantially lower risk and associated risk rating.
Using a range of 1 to 6, with ‘1’ being the most critical and ‘6’ the leastcritical, a score of 1 would be assigned to an aseptic filling operation; ascore of 2 to final formulation, a score of 3 to open processing, and so on.Each user must adapt such a scheme to his or her particular area anddefend it by way of supportable rationale. An example of monitoring fre-
Tim Sandle
5Environmental Moni tor ing
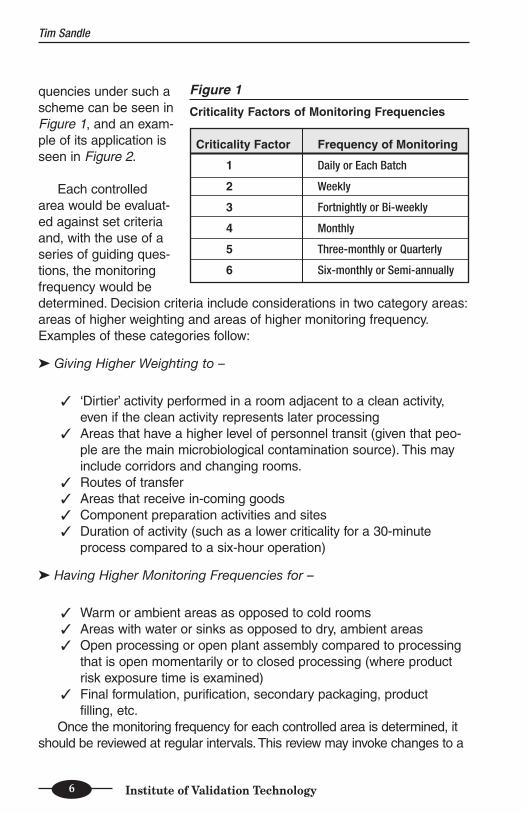
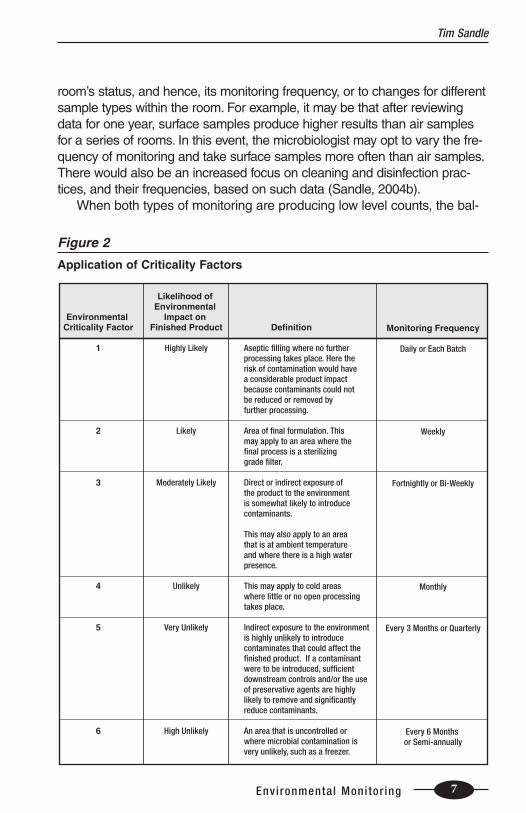
quencies under such ascheme can be seen inFigure 1, and an exam-ple of its application isseen in Figure 2.
Each controlledarea would be evaluat-ed against set criteriaand, with the use of aseries of guiding ques-tions, the monitoringfrequency would bedetermined. Decision criteria include considerations in two category areas:areas of higher weighting and areas of higher monitoring frequency.Examples of these categories follow:
➤ Giving Higher Weighting to –
✓ ‘Dirtier’ activity performed in a room adjacent to a clean activity,even if the clean activity represents later processing
✓ Areas that have a higher level of personnel transit (given that peo-ple are the main microbiological contamination source). This mayinclude corridors and changing rooms.
✓ Routes of transfer✓ Areas that receive in-coming goods✓ Component preparation activities and sites✓ Duration of activity (such as a lower criticality for a 30-minute
process compared to a six-hour operation)
➤ Having Higher Monitoring Frequencies for –
✓ Warm or ambient areas as opposed to cold rooms✓ Areas with water or sinks as opposed to dry, ambient areas✓ Open processing or open plant assembly compared to processing
that is open momentarily or to closed processing (where productrisk exposure time is examined)
✓ Final formulation, purification, secondary packaging, product filling, etc.
Once the monitoring frequency for each controlled area is determined, itshould be reviewed at regular intervals. This review may invoke changes to a
Tim Sandle
6 Institute of Validation Technology
Figure 1
Criticality Factors of Monitoring Frequencies
Criticality Factor Frequency of Monitoring
1 Daily or Each Batch
2 Weekly
3 Fortnightly or Bi-weekly
4 Monthly
5 Three-monthly or Quarterly
6 Six-monthly or Semi-annually
room’s status, and hence, its monitoring frequency, or to changes for differentsample types within the room. For example, it may be that after reviewingdata for one year, surface samples produce higher results than air samplesfor a series of rooms. In this event, the microbiologist may opt to vary the fre-quency of monitoring and take surface samples more often than air samples.There would also be an increased focus on cleaning and disinfection prac-tices, and their frequencies, based on such data (Sandle, 2004b).
When both types of monitoring are producing low level counts, the bal-
Tim Sandle
7Environmental Moni tor ing
Environmental Criticality Factor
1
2
3
4
5
6
Likelihood of Environmental
Impact on Finished Product
Highly Likely
Likely
Moderately Likely
Unlikely
Very Unlikely
High Unlikely
Definition
Aseptic filling where no further processing takes place. Here the risk of contamination would have a considerable product impact because contaminants could not be reduced or removed by further processing.
Area of final formulation. This may apply to an area where the final process is a sterilizing grade filter.
Direct or indirect exposure of the product to the environment is somewhat likely to introduce contaminants.
This may also apply to an area that is at ambient temperature and where there is a high water presence.
This may apply to cold areas where little or no open processing takes place.
Indirect exposure to the environment is highly unlikely to introduce contaminates that could affect the finished product. If a contaminant were to be introduced, sufficient downstream controls and/or the use of preservative agents are highly likely to remove and significantly reduce contaminants.
An area that is uncontrolled or where microbial contamination is very unlikely, such as a freezer.
Monitoring Frequency
Daily or Each Batch
Weekly
Fortnightly or Bi-Weekly
Monthly
Every 3 Months or Quarterly
Every 6 Months or Semi-annually
Figure 2
Application of Criticality Factors
ance of risk would be toward air samples. This is because air samples aredirect indicators of the quality of the process and assign a level of control tothe process, whereas surface samples are indicators of cleaning and disin-fection. If the results of surface samples are generally satisfactory, as indi-cated by trend analysis, then either the number of samples or the frequen-cy at which they are taken can be reduced. If subsequent data showed anincrease in counts, the monitoring frequency could easily be restored.Indeed, all types of monitoring frequencies may increase as part of aninvestigation, as appropriate. Therefore, the criticality factor approach notonly sets the requirement for a room, it can also be used to vary the sam-ple types within a room (Ljungqvist and Reinmuller, 1996).
RISK ASSESSMENT TOOLS
Once the status for each room has been selected, a risk assessmentprocedure is required to determine locations for environmental monitoring.Such risk-based approaches are recommended in ISO 14698 and regulato-ry authorities are increasingly asking drug manufacturers about this subject.
Risk-based approaches include Failure Mode and Effects Analysis(FMEA), Fault Tree Analysis (FTA), and Hazard Analysis and CriticalControl Points (HACCP), all of which employ a scoring approach. (Otherapproaches include: Failure Mode, Effects, and Criticality Analysis(FMECA); Hazard Operability Analysis (HAZOP); QuantitativeMicrobiological Risk Assessment (QMRA); Modular Process Risk Model(MPRM); System Risk Analysis (SRA); Method for Limitation of Risks; andRisk Profiling.)
At present, no definitive method exists, and the various approaches dif-fer in their process and in the degree of complexity involved. However, thetwo most commonly used methods appear to be HACCP, which originatedin the food industry, and FMEA, which was developed for the engineeringindustry (Whyte and Eaton, 2004a).
These various analytical tools are similar in that they involve:
• Constructing diagrams of work flows• Pin-pointing areas of greatest risk• Examining potential sources of contamination• Deciding on the most appropriate sample methods• Helping to establish alert and action levels• Taking into account changes to the work process and seasonal
activities
Tim Sandle
8 Institute of Validation Technology
These risk assessment approaches are not only concerned withselecting environmental monitoring locations. They integrate the environ-mental monitoring system with a complete review of operations within thecleanroom to ensure those facilities, operations, and practices are alsosatisfactory. The approaches recognise a risk, rate the level of the risk,and then set out a plan to minimise, control, and monitor the risk. Themonitoring of the risk will help to determine the frequency, locations for,and level of environmental monitoring (for example, refer to an article bySandle [2003a], for a more detailed example).
This paper explores an example from three different techniques:
• A simple conceptualisation of risk using a table• HACCP• FMEA
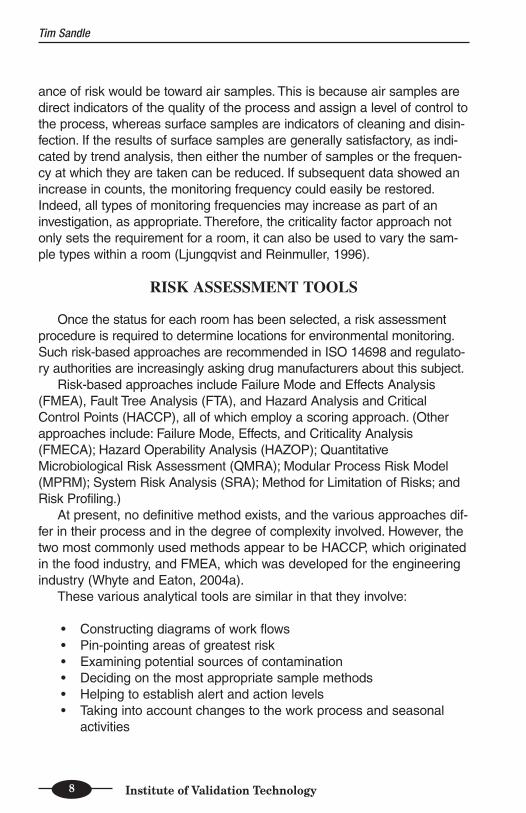
Tabular Approach
An example using a simple table for analyzing risk in environmentalmonitoring situations appears in Figure 3.
Tim Sandle
9Environmental Moni tor ing
Area or Equipment: Sterility Testing Isolator
Risk: Contamination due to build-up of microbial counts in the isolator environment
Failure or Situation: Failure to adequately clean after use
Effect
• When isolators are not cleaned regularly, there is a possibility of micro-organisms remaining in the environment.
Minimising the Risk (Mitigations to Reduce Risk)
• Cleaning surfaces using water to remove dirt or spillages prior to the application of a suitable disinfectant.
• The disinfectant used must have a wide spectrum of efficacy, but not be aggressive to the isolator material.
• The isolator should be designed so that it is easy to clean.
Monitoring
• An environmental monitoring programme (using settle plates, air samples, contact plates, swabs, or finger plates) will show the areas of greatest risk. This data should be examined for trends.
• For out-of-limits environmental monitoring results, appropriate Corrective and Preventive Actions (CAPA) should be put in place.
Figure 3
Tabular Approach to Risk Assessment
HACCP
➤ The seven principles behind constructing an HACCP analysis consist of:
1. Identifying hazards or contamination risks and assessing theirseverity
2. Determining Critical Control Points (CCPs)3. Establishing critical limits4. Establishing a system to monitor and control CCPs5. Establishing corrective action when a CCP is not under control6. Establishing procedures for verification to confirm that the
HACCP system is working effectively7. Establishing documentation and reporting systems for all proce-
dures
Each of these seven key points is a vital step in developing the riskassessment.
➤ The seven points include:
1. Construct a risk diagram, or diagrams, to identify sources of contami-nation. Diagrams should show sources and routes of contamination.
Examples include:✓ Areas adjacent to Cleanroom or Isolator (e.g.: airlocks, chang-
ing rooms)✓ Air supply and Room air✓ Surfaces✓ People✓ Machines and Equipment
2. Assess the importance of these sources and determine whetheror not they are hazards that should be controlled.
Examples include:✓ Amounts of contamination on, or in, the source that is avail-
able for transfer✓ Ease by which the contamination is dispersed or transferred✓ Proximity of the source to the critical point where the product
is exposed✓ Ease with which the contamination can pass through the
control method
Tim Sandle
10 Institute of Validation Technology
The use of a scoring method can greatly help in assessing the relative importance of these contamination sources.
3. Identify the methods that can be used to control these hazards.
For example:✓ Air Supply: High Efficiency Particulate Air (HEPA) filters✓ Dirty Areas adjacent to Cleanroom or
Isolator: differential pressures, airflow movement✓ Room Air: air change rates, use of barriers✓ Surfaces: sterilisation, effectiveness of cleaning and
disinfection procedures✓ People: cleanroom clothing and gloves, room ventilation,
training✓ Machines and Equipment: sterilisation, effectiveness of
cleaning, exhaust systems
4. Determine valid sampling methods to monitor either the hazardsor their control methods or both.
For example:✓ HEPA filter integrity tests✓ Air supply velocity, air change rates✓ Room pressure differentials✓ Particle counts✓ Air samplers, settle plates, contact plates, etc.
5. Establish a monitoring schedule with ‘alert’ and ‘action’ levels and the corrective measures to be taken when these levels are exceeded.
For example:✓ The greater the hazard, the greater the amount of monitoring
required✓ Trend analysis for alert and action levels, in or out of control
Tim Sandle
11Environmental Moni tor ing
6. Verify that the contamination control system is working effectivelyby reviewing key targets like product rejection rate, samplingresults, control methods, and so on. These may require modifica-tion over time.For example:✓ System for data review✓ Examine filling trials✓ Audits✓ Reassess - hazards, effectiveness of control systems, frequency
of monitoring, appropriateness of alert and action levels
7. Establish and maintain documentation.
For example:✓ Describe the steps being taken✓ Describe the monitoring procedures✓ Describe the reporting and review procedures
Before implementing HACCP, it is important to train all staff involved inthe process and to use a multi-disciplinary team. For example, the teammay be comprised of personnel from Production, Engineering, QualityControl (QC), Quality Assurance (QA), Validation, and so on.
FMEA
FMEA schemes vary in their approach, scoring, and categorisation. Allmethods share a numerical approach. The example presented here,based on a sterility testing isolator, assigns a score (from 1 to 5) to eachof the following categories:
➤ Severity➤ Occurrence➤ Detection
Where:✓ Severity is the consequence of a failure✓ Occurrence is the likelihood of the failure happening based on
past experience✓ Detection is based on the monitoring systems in place and on
how likely a failure can be detected
Tim Sandle
12 Institute of Validation Technology
By asking a series of questions, each main part of the cleanroom orisolator system can be grouped or classified into key parts.
Such questions include:✓ What is the function of the equipment? What are its perform-
ance requirements? ✓ How can it fail to fulfil these functions? ✓ What can cause each failure? ✓ What happens when each failure occurs? ✓ How much does each failure matter? What are its conse-
quences? ✓ What can be done to predict or prevent each failure? ✓ What should be done if a suitable proactive task cannot be
found?
The scoring is 1 (very good) to 5 (very bad). Therefore, a likelihood ofhigh severity would be rated 5; high occurrence rated 5; but a good detec-tion system would be rated 1.
Using these criteria, a final FMEA score is produced from:Severity score
x Occurrence score
x Detection score
Decisions on further action will depend upon the score produced.There is no published guidance on what the score that dictates some formof action should be. However, 27 is the suggested score for the cut-offvalue at which action is required. This is based on 27 being the scorederived when the mid-score is applied to all three categories (i.e., thenumerical value '3' for severity 3 x occurrence 3 x detection 3) and thesupposition that if the mid-rating (or a higher number) is scored for allthree categories, then at a minimum, the system should be examined ingreater detail.
Tim Sandle
13Environmental Moni tor ing
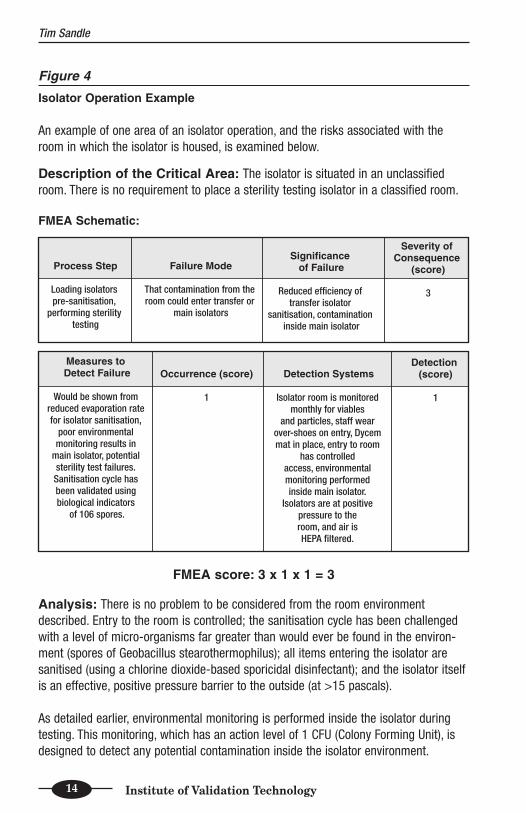
Figure 4
Isolator Operation Example
An example of one area of an isolator operation, and the risks associated with theroom in which the isolator is housed, is examined below.
Description of the Critical Area: The isolator is situated in an unclassifiedroom. There is no requirement to place a sterility testing isolator in a classified room.
FMEA Schematic:
FMEA score: 3 x 1 x 1 = 3
Analysis: There is no problem to be considered from the room environmentdescribed. Entry to the room is controlled; the sanitisation cycle has been challengedwith a level of micro-organisms far greater than would ever be found in the environ-ment (spores of Geobacillus stearothermophilus); all items entering the isolator aresanitised (using a chlorine dioxide-based sporicidal disinfectant); and the isolator itselfis an effective, positive pressure barrier to the outside (at >15 pascals).
As detailed earlier, environmental monitoring is performed inside the isolator duringtesting. This monitoring, which has an action level of 1 CFU (Colony Forming Unit), isdesigned to detect any potential contamination inside the isolator environment.
Tim Sandle
14 Institute of Validation Technology
Process Step
Loading isolators pre-sanitisation,
performing sterility testing
Failure Mode
That contamination from the room could enter transfer or
main isolators
Significance of Failure
Reduced efficiency of transfer isolator
sanitisation, contamination inside main isolator
Severity of Consequence
(score)
3
Measures to Detect Failure
Would be shown from reduced evaporation rate for isolator sanitisation,
poor environmental monitoring results in
main isolator, potential sterility test failures. Sanitisation cycle has been validated using biological indicators
of 106 spores.
Occurrence (score)
1
Detection Systems
Isolator room is monitored monthly for viables
and particles, staff wear over-shoes on entry, Dycem mat in place, entry to room
has controlled access, environmental monitoring performed inside main isolator.
Isolators are at positive pressure to the room, and air is HEPA filtered.
Detection (score)
1
NUMERICAL APPROACHES
A third component of the risk assessment approach is to evaluate arisk once an activity has taken place. Then, by using a largely numerically-driven set of tools, repeatability and reproducibility can be ensured.Examples of individual out-of-limits results and data-sets relating to anoperation are examined below using examples from an aseptic fillingprocess. Following this, an example of an overall assessment of differentprocesses over time is explored. Numerical approaches are useful inapplying a level of consistency between one decision and another.
Individual Assessments
The section below details some methods that can be used to quantifythe risk of contamination in pharmaceutical cleanrooms. The models out-lined are based on the work performed by Whyte and Eaton (2003a and b).
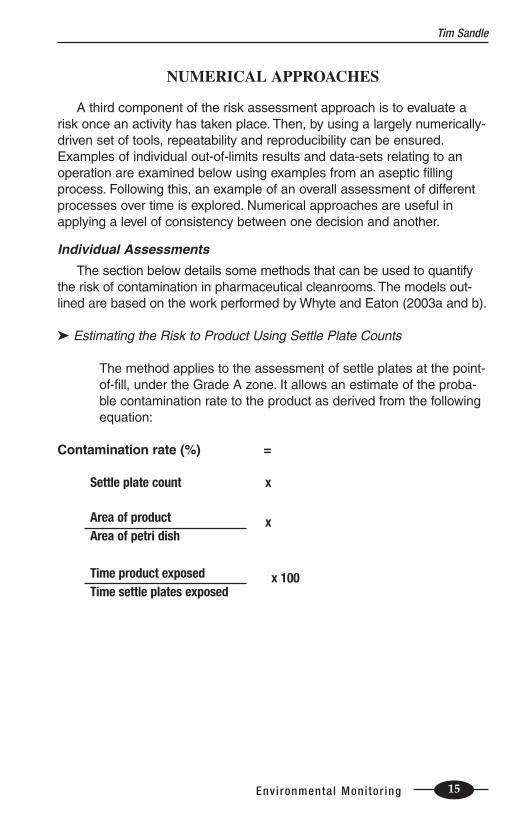
➤ Estimating the Risk to Product Using Settle Plate Counts
The method applies to the assessment of settle plates at the point-of-fill, under the Grade A zone. It allows an estimate of the proba-ble contamination rate to the product as derived from the followingequation:
Contamination rate (%) =
Settle plate count x
Area of product xArea of petri dish
Time product exposed x 100Time settle plates exposed
Tim Sandle
15Environmental Moni tor ing
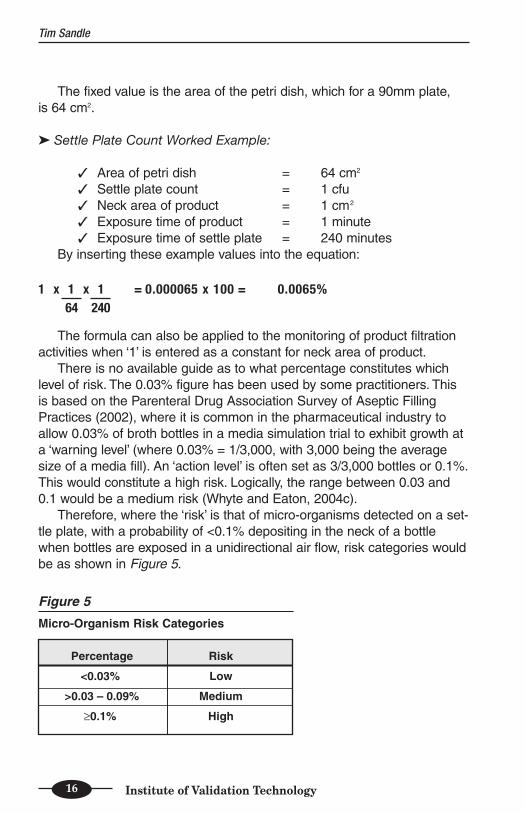
The fixed value is the area of the petri dish, which for a 90mm plate, is 64 cm2.
➤ Settle Plate Count Worked Example:
✓ Area of petri dish = 64 cm2
✓ Settle plate count = 1 cfu✓ Neck area of product = 1 cm2
✓ Exposure time of product = 1 minute✓ Exposure time of settle plate = 240 minutes
By inserting these example values into the equation:
1 x 1 x 1 = 0.000065 x 100 = 0.0065%64 240
The formula can also be applied to the monitoring of product filtrationactivities when ‘1’ is entered as a constant for neck area of product.
There is no available guide as to what percentage constitutes whichlevel of risk. The 0.03% figure has been used by some practitioners. Thisis based on the Parenteral Drug Association Survey of Aseptic FillingPractices (2002), where it is common in the pharmaceutical industry toallow 0.03% of broth bottles in a media simulation trial to exhibit growth ata ‘warning level’ (where 0.03% = 1/3,000, with 3,000 being the averagesize of a media fill). An ‘action level’ is often set as 3/3,000 bottles or 0.1%.This would constitute a high risk. Logically, the range between 0.03 and0.1 would be a medium risk (Whyte and Eaton, 2004c).
Therefore, where the ‘risk’ is that of micro-organisms detected on a set-tle plate, with a probability of <0.1% depositing in the neck of a bottlewhen bottles are exposed in a unidirectional air flow, risk categories wouldbe as shown in Figure 5.
Tim Sandle
16 Institute of Validation Technology
Figure 5
Micro-Organism Risk Categories
Percentage Risk
<0.03% Low
>0.03 – 0.09% Medium
≥0.1% High
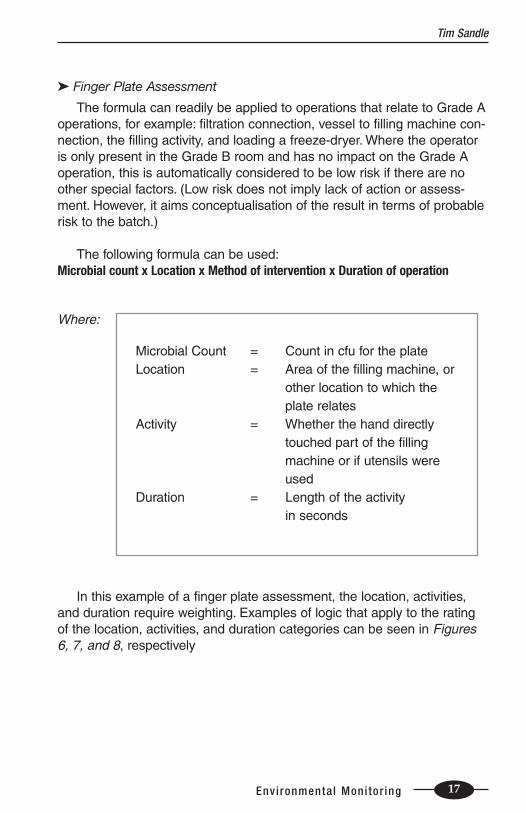
➤ Finger Plate Assessment
The formula can readily be applied to operations that relate to Grade Aoperations, for example: filtration connection, vessel to filling machine con-nection, the filling activity, and loading a freeze-dryer. Where the operatoris only present in the Grade B room and has no impact on the Grade Aoperation, this is automatically considered to be low risk if there are noother special factors. (Low risk does not imply lack of action or assess-ment. However, it aims conceptualisation of the result in terms of probablerisk to the batch.)
The following formula can be used:Microbial count x Location x Method of intervention x Duration of operation
Where:
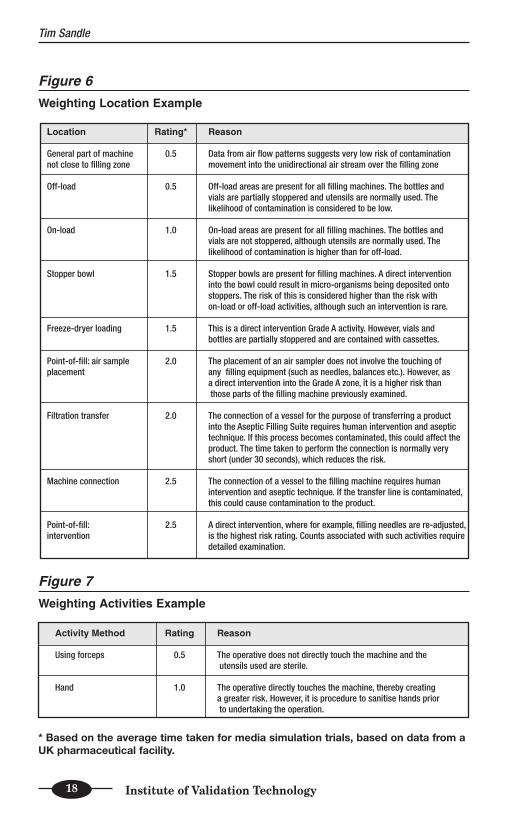
In this example of a finger plate assessment, the location, activities,and duration require weighting. Examples of logic that apply to the ratingof the location, activities, and duration categories can be seen in Figures6, 7, and 8, respectively
Tim Sandle
17Environmental Moni tor ing
Microbial Count = Count in cfu for the plateLocation = Area of the filling machine, or
other location to which the plate relates
Activity = Whether the hand directlytouched part of the fillingmachine or if utensils wereused
Duration = Length of the activity in seconds
Tim Sandle
18 Institute of Validation Technology
Figure 6
Weighting Location Example
Location
General part of machine not close to filling zone
Off-load
On-load
Stopper bowl
Freeze-dryer loading
Point-of-fill: air sample placement
Filtration transfer
Machine connection
Point-of-fill: intervention
Rating*
0.5
0.5
1.0
1.5
1.5
2.0
2.0
2.5
2.5
Reason
Data from air flow patterns suggests very low risk of contamination movement into the unidirectional air stream over the filling zone
Off-load areas are present for all filling machines. The bottles and vials are partially stoppered and utensils are normally used. The likelihood of contamination is considered to be low.
On-load areas are present for all filling machines. The bottles and vials are not stoppered, although utensils are normally used. The likelihood of contamination is higher than for off-load.
Stopper bowls are present for filling machines. A direct intervention into the bowl could result in micro-organisms being deposited onto stoppers. The risk of this is considered higher than the risk with on-load or off-load activities, although such an intervention is rare.
This is a direct intervention Grade A activity. However, vials and bottles are partially stoppered and are contained with cassettes.
The placement of an air sampler does not involve the touching of any filling equipment (such as needles, balances etc.). However, as a direct intervention into the Grade A zone, it is a higher risk than those parts of the filling machine previously examined.
The connection of a vessel for the purpose of transferring a product into the Aseptic Filling Suite requires human intervention and aseptic technique. If this process becomes contaminated, this could affect the product. The time taken to perform the connection is normally very short (under 30 seconds), which reduces the risk.
The connection of a vessel to the filling machine requires human intervention and aseptic technique. If the transfer line is contaminated, this could cause contamination to the product.
A direct intervention, where for example, filling needles are re-adjusted, is the highest risk rating. Counts associated with such activities require detailed examination.
Figure 7
Weighting Activities Example
Activity Method
Using forceps
Hand
Rating
0.5
1.0
Reason
The operative does not directly touch the machine and the utensils used are sterile.
The operative directly touches the machine, thereby creating a greater risk. However, it is procedure to sanitise hands prior to undertaking the operation.
* Based on the average time taken for media simulation trials, based on data from aUK pharmaceutical facility.
➤ Finger Plate Assessment Worked Example
A finger plate with a count of 1 cfu for an activity at point-of-fill, usingforceps, that lasts for one minute.
Microbial count x Location x Method of intervention x Duration of operation1 x 2.5 x 0.5 x 1 = 1.25
The score produced would be ratedaccording to standard risk assessment categories:
These risk ratings are based, in part, onthe worked example. Based on historical dataover the past six-months, the highest recordexample of a Grade A intervention finger plate is a count of 2 cfu: usingforceps to retrieve a fallen vial and lasting for more than 120 seconds. Thiswould have given a score of 7.5, which falls within the medium risk cate-gory. The user should develop a scheme that fits his or her facility (Whyteand Eaton, 2004b).
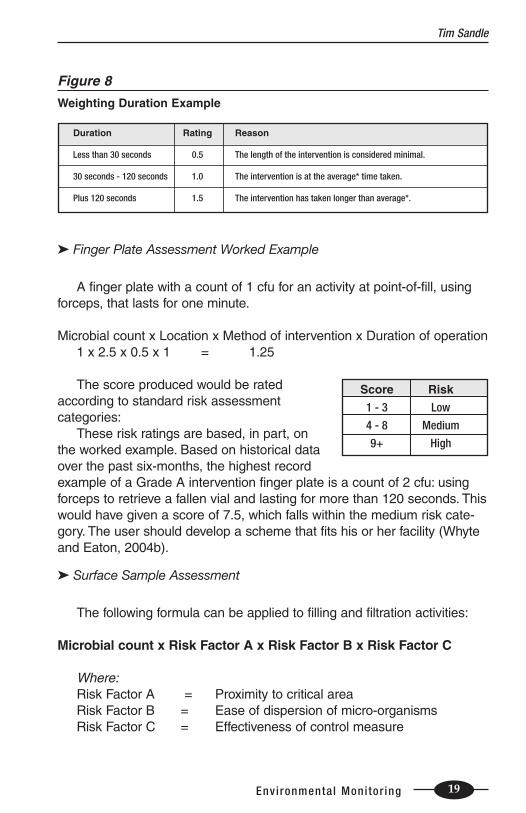
➤ Surface Sample Assessment
The following formula can be applied to filling and filtration activities:
Microbial count x Risk Factor A x Risk Factor B x Risk Factor C
Where:Risk Factor A = Proximity to critical areaRisk Factor B = Ease of dispersion of micro-organismsRisk Factor C = Effectiveness of control measure
Tim Sandle
19Environmental Moni tor ing
Score
1 - 3
4 - 8
9+
Risk
Low
Medium
High
Figure 8
Weighting Duration Example
Duration
Less than 30 seconds
30 seconds - 120 seconds
Plus 120 seconds
Rating
0.5
1.0
1.5
Reason
The length of the intervention is considered minimal.
The intervention is at the average* time taken.
The intervention has taken longer than average*.
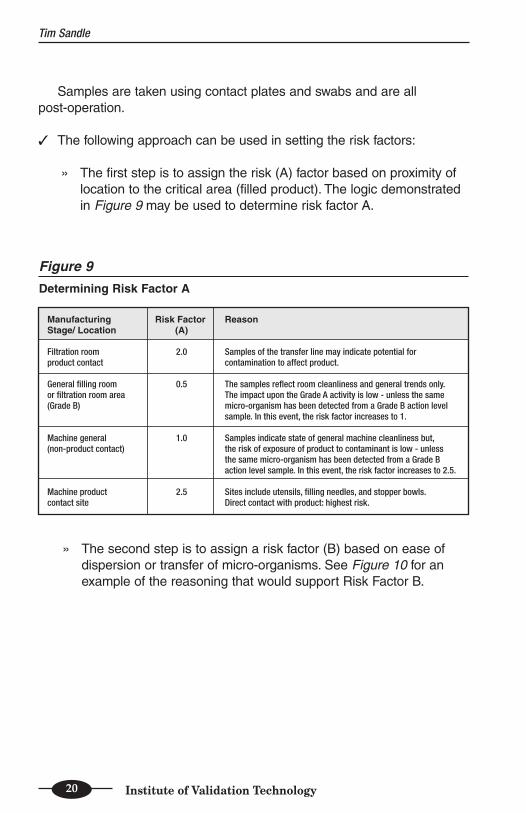
Samples are taken using contact plates and swabs and are all post-operation.
✓ The following approach can be used in setting the risk factors:
» The first step is to assign the risk (A) factor based on proximity oflocation to the critical area (filled product). The logic demonstratedin Figure 9 may be used to determine risk factor A.
Tim Sandle
20 Institute of Validation Technology
Manufacturing Stage/ Location
Filtration room product contact
General filling room or filtration room area (Grade B)
Machine general (non-product contact)
Machine product contact site
Risk Factor (A)
2.0
0.5
1.0
2.5
Reason
Samples of the transfer line may indicate potential for contamination to affect product.
The samples reflect room cleanliness and general trends only. The impact upon the Grade A activity is low - unless the same micro-organism has been detected from a Grade B action level sample. In this event, the risk factor increases to 1.
Samples indicate state of general machine cleanliness but, the risk of exposure of product to contaminant is low - unless the same micro-organism has been detected from a Grade B action level sample. In this event, the risk factor increases to 2.5.
Sites include utensils, filling needles, and stopper bowls. Direct contact with product: highest risk.
Figure 9
Determining Risk Factor A
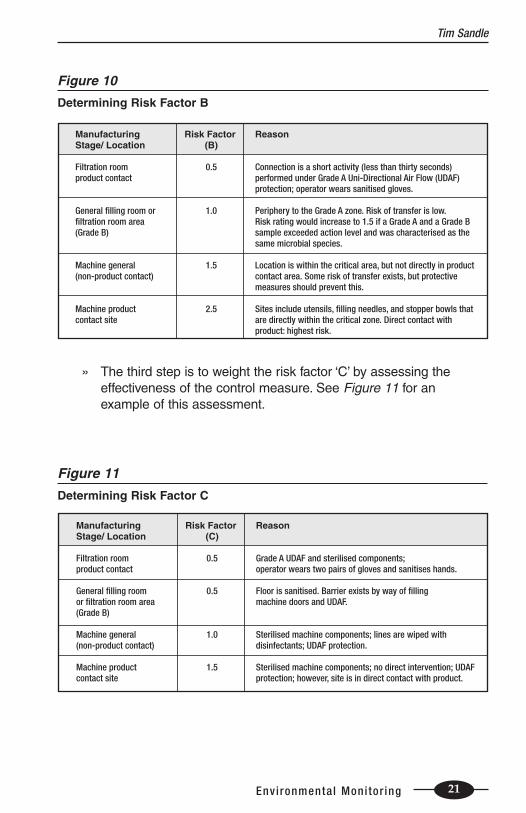
» The second step is to assign a risk factor (B) based on ease ofdispersion or transfer of micro-organisms. See Figure 10 for anexample of the reasoning that would support Risk Factor B.
Tim Sandle
21Environmental Moni tor ing
Figure 10
Determining Risk Factor B
Manufacturing Stage/ Location
Filtration room product contact
General filling room or filtration room area (Grade B)
Machine general (non-product contact)
Machine product contact site
Risk Factor (B)
0.5
1.0
1.5
2.5
Reason
Connection is a short activity (less than thirty seconds) performed under Grade A Uni-Directional Air Flow (UDAF) protection; operator wears sanitised gloves.
Periphery to the Grade A zone. Risk of transfer is low. Risk rating would increase to 1.5 if a Grade A and a Grade B sample exceeded action level and was characterised as the same microbial species.
Location is within the critical area, but not directly in product contact area. Some risk of transfer exists, but protective measures should prevent this.
Sites include utensils, filling needles, and stopper bowls that are directly within the critical zone. Direct contact with product: highest risk.
» The third step is to weight the risk factor ‘C’ by assessing the effectiveness of the control measure. See Figure 11 for an example of this assessment.
Figure 11
Determining Risk Factor C
Manufacturing Stage/ Location
Filtration room product contact
General filling room or filtration room area (Grade B)
Machine general (non-product contact)
Machine product contact site
Risk Factor (C)
0.5
0.5
1.0
1.5
Reason
Grade A UDAF and sterilised components; operator wears two pairs of gloves and sanitises hands.
Floor is sanitised. Barrier exists by way of filling machine doors and UDAF.
Sterilised machine components; lines are wiped with disinfectants; UDAF protection.
Sterilised machine components; no direct intervention; UDAF protection; however, site is in direct contact with product.
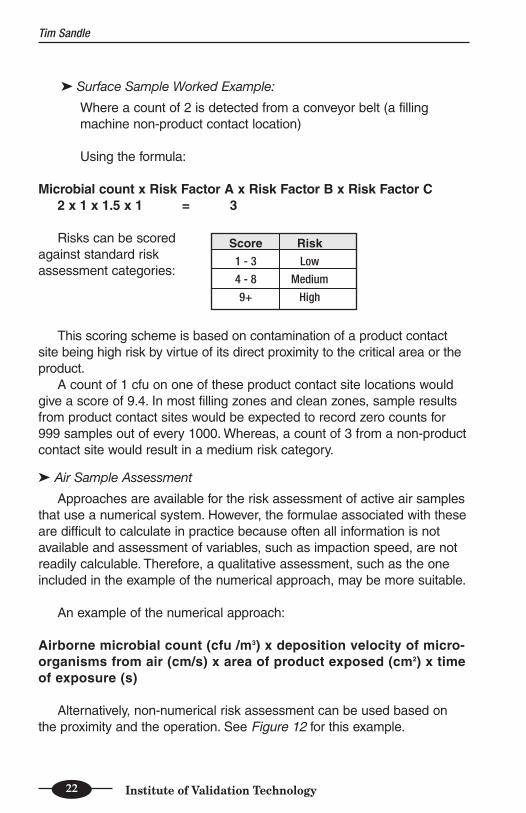
➤ Surface Sample Worked Example:
Where a count of 2 is detected from a conveyor belt (a fillingmachine non-product contact location)
Using the formula:
Microbial count x Risk Factor A x Risk Factor B x Risk Factor C2 x 1 x 1.5 x 1 = 3
Risks can be scoredagainst standard riskassessment categories:
This scoring scheme is based on contamination of a product contactsite being high risk by virtue of its direct proximity to the critical area or theproduct.
A count of 1 cfu on one of these product contact site locations wouldgive a score of 9.4. In most filling zones and clean zones, sample resultsfrom product contact sites would be expected to record zero counts for999 samples out of every 1000. Whereas, a count of 3 from a non-productcontact site would result in a medium risk category.
➤ Air Sample Assessment
Approaches are available for the risk assessment of active air samplesthat use a numerical system. However, the formulae associated with theseare difficult to calculate in practice because often all information is notavailable and assessment of variables, such as impaction speed, are notreadily calculable. Therefore, a qualitative assessment, such as the oneincluded in the example of the numerical approach, may be more suitable.
An example of the numerical approach:
Airborne microbial count (cfu /m3) x deposition velocity of micro-organisms from air (cm/s) x area of product exposed (cm2) x timeof exposure (s)
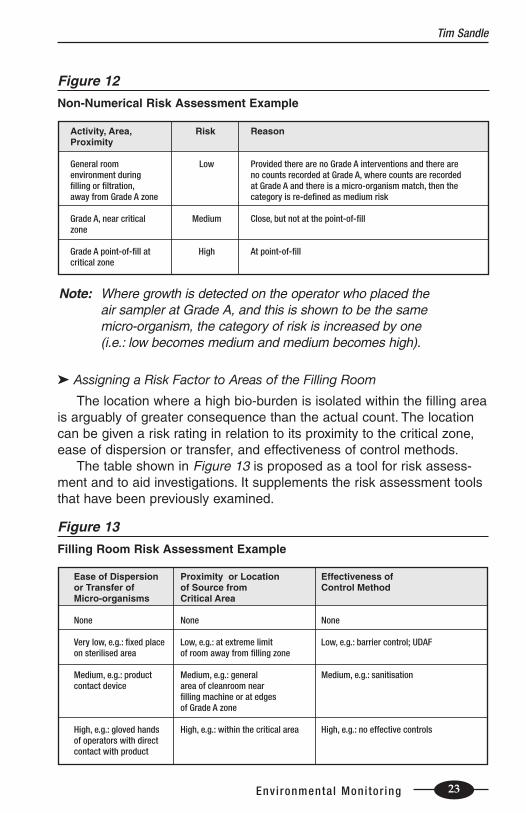
Alternatively, non-numerical risk assessment can be used based onthe proximity and the operation. See Figure 12 for this example.
Tim Sandle
22 Institute of Validation Technology
Score
1 - 3
4 - 8
9+
Risk
Low
Medium
High
➤ Assigning a Risk Factor to Areas of the Filling Room
The location where a high bio-burden is isolated within the filling areais arguably of greater consequence than the actual count. The locationcan be given a risk rating in relation to its proximity to the critical zone,ease of dispersion or transfer, and effectiveness of control methods.
The table shown in Figure 13 is proposed as a tool for risk assess-ment and to aid investigations. It supplements the risk assessment toolsthat have been previously examined.
Tim Sandle
23Environmental Moni tor ing
Figure 12
Non-Numerical Risk Assessment Example
Activity, Area, Proximity
General room environment during filling or filtration, away from Grade A zone
Grade A, near critical zone
Grade A point-of-fill at critical zone
Risk
Low
Medium
High
Reason
Provided there are no Grade A interventions and there are no counts recorded at Grade A, where counts are recorded at Grade A and there is a micro-organism match, then the category is re-defined as medium risk
Close, but not at the point-of-fill
At point-of-fill
Note: Where growth is detected on the operator who placed the air sampler at Grade A, and this is shown to be the samemicro-organism, the category of risk is increased by one (i.e.: low becomes medium and medium becomes high).
Figure 13
Filling Room Risk Assessment Example
Ease of Dispersion or Transfer of Micro-organisms
None
Very low, e.g.: fixed place on sterilised area
Medium, e.g.: product contact device
High, e.g.: gloved hands of operators with direct contact with product
Proximity or Location of Source from Critical Area
None
Low, e.g.: at extreme limit of room away from filling zone
Medium, e.g.: general area of cleanroom near filling machine or at edges of Grade A zone
High, e.g.: within the critical area
Effectiveness of Control Method
None
Low, e.g.: barrier control; UDAF
Medium, e.g.: sanitisation
High, e.g.: no effective controls
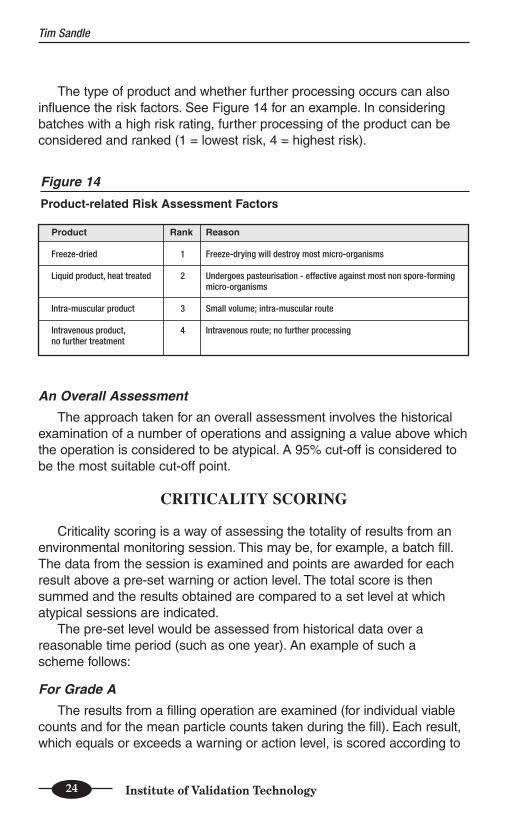
The type of product and whether further processing occurs can alsoinfluence the risk factors. See Figure 14 for an example. In consideringbatches with a high risk rating, further processing of the product can beconsidered and ranked (1 = lowest risk, 4 = highest risk).
An Overall Assessment
The approach taken for an overall assessment involves the historicalexamination of a number of operations and assigning a value above whichthe operation is considered to be atypical. A 95% cut-off is considered tobe the most suitable cut-off point.
CRITICALITY SCORING
Criticality scoring is a way of assessing the totality of results from anenvironmental monitoring session. This may be, for example, a batch fill.The data from the session is examined and points are awarded for eachresult above a pre-set warning or action level. The total score is thensummed and the results obtained are compared to a set level at whichatypical sessions are indicated.
The pre-set level would be assessed from historical data over a reasonable time period (such as one year). An example of such a scheme follows:
For Grade A
The results from a filling operation are examined (for individual viablecounts and for the mean particle counts taken during the fill). Each result,which equals or exceeds a warning or action level, is scored according to
Tim Sandle
24 Institute of Validation Technology
Figure 14
Product-related Risk Assessment Factors
Product
Freeze-dried
Liquid product, heat treated
Intra-muscular product
Intravenous product, no further treatment
Rank
1
2
3
4
Reason
Freeze-drying will destroy most micro-organisms
Undergoes pasteurisation - effective against most non spore-forming micro-organisms
Small volume; intra-muscular route
Intravenous route; no further processing
the criteria in Figure 15 and Figure 16. Using the criteria presented inFigures 15 and 16 produces the Grade A score.
For Grade B
The results from a filling operation are examined (for the individualviable counts and the mean particle counts taken during the fill). Eachresult that equals or exceeds a warning level is scored according to thecriteria in Figure 17 and Figure 18.
Tim Sandle
25Environmental Moni tor ing
Figure 15
Viable Counts Criteria for Grade A
Sample
Active Air Sample
Settle Plate
Contact Plate
Swab
Finger Plate
Warning Level
5 points
5 points
5 points
5 points
5 points
Action Level
10 points
10 points
10 points
10 points
10 points
Count (cfu)
Figure 16
Particle Count Criteria for Grade A
Particle Size
0.5 µm
5.0 µm
Mean Counts from fill at Warning Level
5 points
5 points
Mean Counts from fill at Action Level
10 points
10 points
Count (cfu)
Figure 17
Viable Counts Criteria for Grade B
Sample
Active Air Sample
Settle Plate
Contact Plate
Swab
Finger Plate
1 cfu
1 point
1 point
1 point
1 point
1 point
Count
2-3 cfu
2 points
2 points
2 points
2 points
2 points
4-5 cfu
3 points
3 points
3 points
3 points
3 points
Warning Level
3 points
3 points
3 points
3 points
3 points
Action Level
5 points
5 points
5 points
5 points
5 points
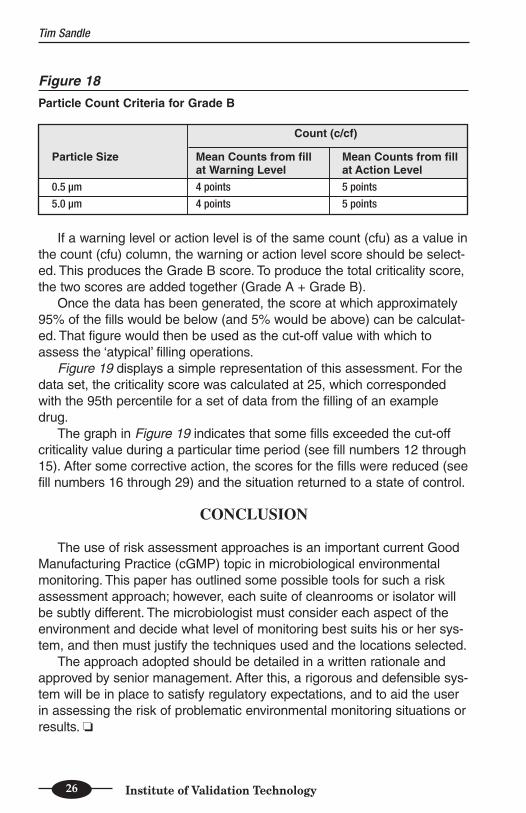
If a warning level or action level is of the same count (cfu) as a value inthe count (cfu) column, the warning or action level score should be select-ed. This produces the Grade B score. To produce the total criticality score,the two scores are added together (Grade A + Grade B).
Once the data has been generated, the score at which approximately95% of the fills would be below (and 5% would be above) can be calculat-ed. That figure would then be used as the cut-off value with which toassess the ‘atypical’ filling operations.
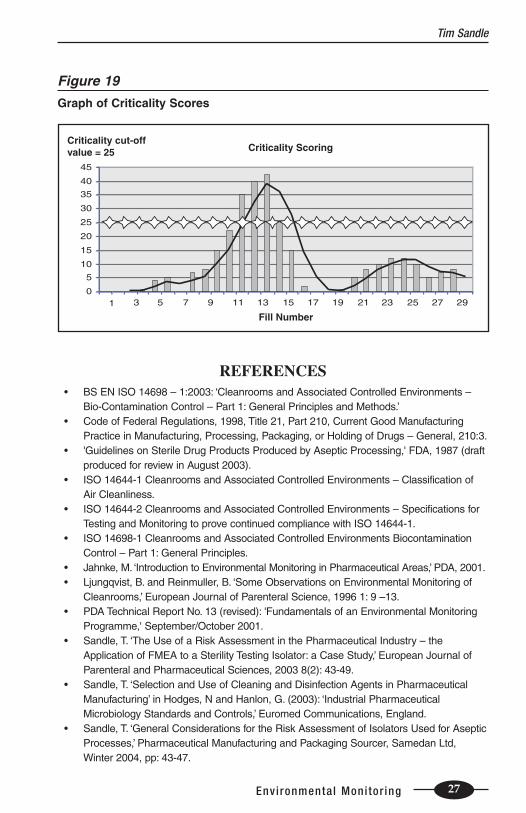
Figure 19 displays a simple representation of this assessment. For thedata set, the criticality score was calculated at 25, which correspondedwith the 95th percentile for a set of data from the filling of an exampledrug.
The graph in Figure 19 indicates that some fills exceeded the cut-offcriticality value during a particular time period (see fill numbers 12 through15). After some corrective action, the scores for the fills were reduced (seefill numbers 16 through 29) and the situation returned to a state of control.
CONCLUSION
The use of risk assessment approaches is an important current GoodManufacturing Practice (cGMP) topic in microbiological environmentalmonitoring. This paper has outlined some possible tools for such a riskassessment approach; however, each suite of cleanrooms or isolator willbe subtly different. The microbiologist must consider each aspect of theenvironment and decide what level of monitoring best suits his or her sys-tem, and then must justify the techniques used and the locations selected.
The approach adopted should be detailed in a written rationale andapproved by senior management. After this, a rigorous and defensible sys-tem will be in place to satisfy regulatory expectations, and to aid the userin assessing the risk of problematic environmental monitoring situations orresults. ❏
Tim Sandle
26 Institute of Validation Technology
Figure 18
Particle Count Criteria for Grade B
Particle Size
0.5 µm
5.0 µm
Mean Counts from fill at Warning Level
4 points
4 points
Mean Counts from fill at Action Level
5 points
5 points
Count (c/cf)
REFERENCES • BS EN ISO 14698 – 1:2003: ‘Cleanrooms and Associated Controlled Environments –
Bio-Contamination Control – Part 1: General Principles and Methods.’• Code of Federal Regulations, 1998, Title 21, Part 210, Current Good Manufacturing
Practice in Manufacturing, Processing, Packaging, or Holding of Drugs – General, 210:3.• 'Guidelines on Sterile Drug Products Produced by Aseptic Processing,' FDA, 1987 (draft
produced for review in August 2003).• ISO 14644-1 Cleanrooms and Associated Controlled Environments – Classification of
Air Cleanliness.• ISO 14644-2 Cleanrooms and Associated Controlled Environments – Specifications for
Testing and Monitoring to prove continued compliance with ISO 14644-1.• ISO 14698-1 Cleanrooms and Associated Controlled Environments Biocontamination
Control – Part 1: General Principles.• Jahnke, M. ‘Introduction to Environmental Monitoring in Pharmaceutical Areas,’ PDA, 2001.• Ljungqvist, B. and Reinmuller, B. ‘Some Observations on Environmental Monitoring of
Cleanrooms,’ European Journal of Parenteral Science, 1996 1: 9 –13.• PDA Technical Report No. 13 (revised): 'Fundamentals of an Environmental Monitoring
Programme,' September/October 2001.• Sandle, T. ‘The Use of a Risk Assessment in the Pharmaceutical Industry – the
Application of FMEA to a Sterility Testing Isolator: a Case Study,’ European Journal ofParenteral and Pharmaceutical Sciences, 2003 8(2): 43-49.
• Sandle, T. ‘Selection and Use of Cleaning and Disinfection Agents in PharmaceuticalManufacturing’ in Hodges, N and Hanlon, G. (2003): ‘Industrial PharmaceuticalMicrobiology Standards and Controls,’ Euromed Communications, England.
• Sandle, T. ‘General Considerations for the Risk Assessment of Isolators Used for AsepticProcesses,’ Pharmaceutical Manufacturing and Packaging Sourcer, Samedan Ltd,Winter 2004, pp: 43-47.
Tim Sandle
27Environmental Moni tor ing
Figure 19
Graph of Criticality Scores
0
5
10
15
20
25
30
35
40
45
Criticality ScoringCriticality cut-offvalue = 25
Fill Number
3 5 7 9 11 13 15 17 19 21 23 25 27 291
• USPNF#25 <1116>• Whyte, W. ‘Cleanroom Technology: Fundamentals of Design, Testing and Operation,
2001.’• Whyte, W. and Eaton, T. ‘Microbiological Contamination Models for Use in Risk
Assessment during Pharmaceutical Production,’ European Journal of Parenteral andPharmaceutical Sciences, 2004 Vol. 9, No.1, pp: 11-15.
• Whyte, W. and Eaton, T. ‘Microbiological Risk Assessment in PharmaceuticalCleanrooms,’ European Journal of Parenteral and Pharmaceutical Sciences, 2004, Vol. 9,No.1, pp: 16-23.
• Whyte, W. and Eaton, T. ‘Assessing Microbial Risk to Patients from AsepticallyManufactured Pharmaceuticals,’ European Journal of Parenteral and PharmaceuticalSciences, 2004, Vol. 9, No.3, pp: 71-79.
Tim Sandle
28 Institute of Validation Technology
Article Acronym Listing
CAPA Corrective and Preventive ActionCCPCritical Control PointCFUColony Forming UnitcGMP Current Good Manufacturing
PracticeFMEA Failure Mode and Effects AnalysisFMECA Failure Mode, Effects, and Criticality AnalysisFTA Fault Tree AnalysisHACCP Hazard Analysis and Critical
Control PointHAZOP Hazard Operability AnalysisHEPA High Efficiency Particulate AirHVAC Heating, Ventilation, and
Air-ConditioningISO International Organization for
StandardizationMPRM Modular Process Risk ModelQA Quality AssuranceQC Quality ControlQMRA Quantitative Microbiological Risk AssessmentSRA System Risk AnalysisUDAF Uni-Directional Air FlowUSP United States Pharmacopoeia
SUGGESTED READING• Anon. (1998), The Gold Sheet, Vol. 32, No.10, October 1998.• De Abreu, C., Pinto, T. and Oliveira, D. ‘Environmental Monitoring: A Correlation Study
between Viable and Nonviable Particles in Cleanrooms,’ Journal of PharmaceuticalScience and Technology, Vol. 58, No.1, January-February 2004, pp: 45-53.
• Kaye, S. ‘Efficiency of Biotest RCS as a Sampler of Airborne Bacteria,’ Journal ofParenteral Science and Technology, Vol. 42, No.5, September-October 1986, pp: 147-152.
• Meir, R. and Zingre, H. ‘Qualification of Air Sampler Systems: MAS-100,’ Swiss Pharma,22 (2000), pp: 15 – 21.
• Ohresser, S., Griveau, S. and Schann, C. ‘Validation of Microbial Recovery fromHydrogen Peroxide-Sterilised Air,’ Journal of Pharmaceutical Science and Technology,Vol. 58, No. 2, March-April 2004, pp: 75-80.
• PhRMA Environmental Monitoring Work Group ‘Microbiological Monitoring ofEnvironmental Conditions for Nonsterile Pharmaceutical Manufacturing,’ Pharm.Technol., March 1997, pp: 58-74.
• Reich, et al. ‘Developing a Viable Microbiological Environmental Monitoring Program forNonsterile Pharmaceutical Operations.’ Pharm. Technol., March 2003, pp: 92-100.
• 'Rules and Guidance for Pharmaceutical Manufacturers and Distributors' ('EU GMPGuide'), MHRA, 2002.
• Sandle, T. ‘Environmental Monitoring in a Sterility Testing Isolator,’ PharMIG News No. 1,March 2000.
• Sandle, T. ‘Microbiological Culture Media: Designing a Testing Scheme,’ PharMIG NewsNo. 2, August 2000.
ABOUT THE AUTHORTim Sandle is the company Microbiologist at Bio Products Laboratory (BPL).BPL is the manufacturing unit of the UK National Health Service - Blood andTransplant.
Prior to his current role, Tim has worked on a number of different microbiologicalprojects within the Pharmaceutical Industry, including: developments in the test-ing of endotoxins and pyrogens for protein-based products, establishing theenvironmental monitoring regime for a network of over two-hundred cleanrooms,and validating a sterility testing isolator system.
Tim has written more than forty articles relating to microbiology and pharmaceu-tical operations, including: LAL testing, operation of isolators, cleanrooms, and environmental monitoring. Tim may be contacted by email athis BPL address, [email protected] or at his home address of:[email protected]
Tim Sandle
29Environmental Moni tor ing
Originally published in the January 2006 issue of the Journal of GXP Compliance