Embed Size (px)
Citation preview
Enzyme characterisation and kinetic modelling of the pentose
phosphate pathway in yeast
Hanan L. Messiha 1,2
Edward Kent 1,3
Naglis Malys 1,4
Kathleen M. Carroll 1,2
Pedro Mendes 1,5,6,∗
Kieran Smallbone 1,5
1Manchester Centre for Integrative Systems Biology2School of Chemistry
3Doctoral Training Centre in Integrative Systems Biology4School of Chemical Engineering
5School of Computer ScienceUniversity of Manchester, M13 9PL, UK.
6Center for Quantitative Medicine and Department of Cell Biology,University of Connecticut Health Center, Farmington, CT 06030, USA.
Abstract
We present the quantification and kinetic characterisation of the enzymes of the pentosephosphate pathway in Saccharomyces cerevisiae. The data are combined into a mathematicalmodel that describes the dynamics of this system and allows for predicting changes in metabo-lite concentrations and fluxes in response to perturbations. We use the model to study theresponse of yeast to a glucose pulse. We then combine the model with an existing glycolysisone to study the effect of oxidative stress on carbohydrate metabolism. The combination ofthese two models was made possible by the standardized enzyme kinetic experiments carriedout in both studies. This work demonstrates the feasibility of constructing larger networkmodels by merging smaller pathway models.
∗To whom correspondence should be addressed at [email protected]
1PeerJ PrePrints | https://peerj.com/preprints/146v1/ | v1 received: 9 Dec 2013, published: 9 Dec 2013, doi: 10.7287/peerj.preprints.146v1
PrePrin
ts
Introduction
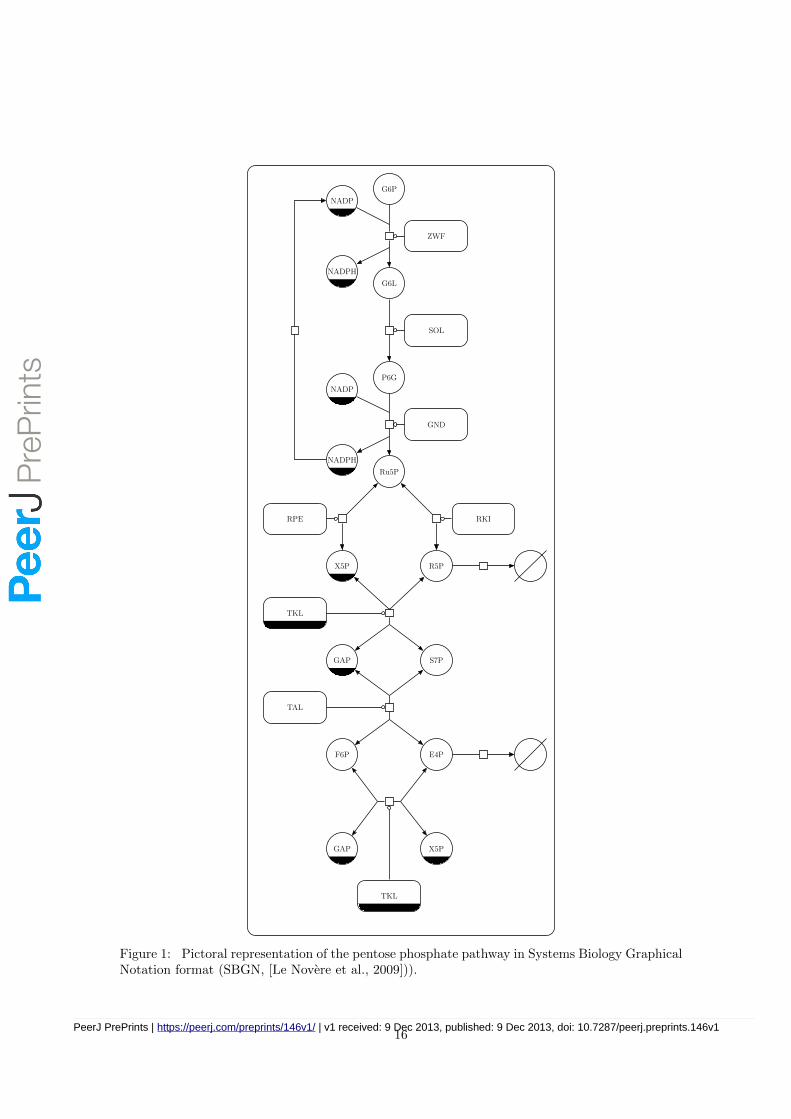
The pentose phosphate pathway (PPP) is a central and widely conserved metabolic pathway of car-bohydrate metabolism which, in eukaryotic cells, is located in the cytoplasm (see Figure 1). Thispathway serves two major functions: production of precursors for biosynthesis of macromoleculesand production of reducing equivalents in the form of NADPH. Accordingly, these two roles are re-flected in the two major phases of the PPP: in the ‘oxidative phase’, glucose 6-phosphate (G6P) isconverted into ribulose 5-phosphate (Ru5P) through the sequential action of glucose-6-phosphatedehydrogenase and 6-phosphogluconate dehydrogenase, with lactonase enhancing the already sig-nificant non-enzymic hydrolysis of the 6-phosphogluconolactone (G6L) product of the latter. The‘non-oxidative phase’ carries out the isomerisation of Ru5P to ribose 5-phosphate (R5P), theepimerisation of Ru5P to xylulose 5-phosphate (X5P) and, through the actions of transketolaseand transaldolase, a series of carbon skeleton transfers that can interconvert pentose phosphate intothe glycolytic intermediates fructose 6-phosphate (F6P) and glyceraldehyde 3-phosphate (GAP)and erythrose 4-phosphate (E4P). The oxidative branch is considered to be largely irreversibleunder normal cellular conditions, whilst the non-oxidative branch is reversible [Saggerson, 2009].The PPP is not a simple linear pathway (see Figure 1) since several carbon atoms are recycledback into glycolysis. Furthermore, the enzyme transketolase catalyses two different reactions inthe pathway, resulting in the two substrates of these reactions being competitive inhibitors of eachother.
The PPP has three main products: reduced equivalents in the form of NADPH, produced inthe oxidative phase, needed in biosynthetic pathways and for maintenance of the oxidative levelof cells; R5P, for the biosynthesis of all nucleic acids; and E4P, for biosynthesis of the threearomatic amino acids. Different physiological states require operation of this biochemical networkin different modes: in actively growing cells, such as during culture growth in reactors, the pathwaymust produce a sufficient amount of all three products, since all are required in the constructionof new cells. Under stress conditions growth slows down and the only product in considerabledemand is NADPH.
Oxidative stress causes damage to all living organisms. They have developed a number of defenceand repair mechanisms that are conserved from unicellular to multicellular organisms. Cells typ-ically respond with post-translational modification of a number of proteins, affecting both theirlocalisation and functionality [Godon et al., 1998, Ishii et al., 2007]. In particular, oxidative stressin yeast leads to repression of glycolysis and induction of the PPP; this is crucial for maintainingthe NADPH/NADP+ ratio, which provides the redox power for antioxidant systems [Ralser et al.,2007].
Since the seminal work of [Glock & McLean, 1953], the pentose phosphate pathway has beensubjected to a number of quantitative studies, including in yeast [Bruinenberg et al., 1983]. Math-ematical models of the pathway have been created in yeast [Vaseghi et al., 1999, Ralser et al.,2007], trypanosome [Kerkhoven et al., 2013], rat [Haut et al., 1974, Sabate et al., 1995] and hu-man [Joshi & Palsson, 1989, Mulquiney & Kuchel, 1999]. However, such studies have neglected,or over-simplified, the non-oxidative branch of the pathway. Here we kinetically quantify andcharacterise various enzymes in the pathway, combine these properties into a mathematical modelthat describes the dynamic behaviour of this system, and compare the model’s predictions toexperimental observations of transient metabolite concentrations following a glucose pulse. We goon to examine the response of a combined glycolysis-PPP model to oxidative stress, and comparethis to measured metabolite levels.
2PeerJ PrePrints | https://peerj.com/preprints/146v1/ | v1 received: 9 Dec 2013, published: 9 Dec 2013, doi: 10.7287/peerj.preprints.146v1
PrePrin
ts
Materials and Methods
Kinetics
To determine the kinetic parameters of individual enzymatic reactions of the pentose phosphatepathway, isoenzymes were purified as described previously [Malys et al., 2011]. Spectrophotometricassays were then performed for most of the isoenzymes, following a similar strategy to [Smallboneet al., 2013]. Enzymes were assayed spectrophotometrically through detection of NADPH orNADH, by using coupling reactions where needed, with the exception of ribulose-5-phosphate-3-epimerase (RPE1) and ribose-5-phosphate ketol isomerase (RKI1) which where assayed usingcircular dichroism (CD, [Kochetov et al., 1978]). Assays were coupled with enzyme(s) in whichNAD(P) or NAD(P)H is a product or substrate so that its formation or consumption could befollowed spectrophotometrically at 340 nm using an extinction coefficient of 6.62 /mM/cm, unlessthe reaction of a particular enzyme consumes or produces NADH or NADPH, in which case nocoupling enzymes were needed.
Absorbance measurements were carried out with a BMG Labtech NOVOstar plate reader (Offen-burg, Germany) in 384-well format plates in a 60 l reaction volume. All assays were performed ina standardised reaction buffer (100 mM MES, pH 6.5, 100 mM KCl, and 5 mM free magnesiumin the form of MgCl2) at 30 ◦C and were automated so that all reagents in the reaction buffer(including any coupling enzymes) are in 45 µl, the enzyme (to be assayed) in 5 µl and the substratein 10 µl volumes as described in [Messiha et al., 2011]. For each individual enzyme, the forwardand the reverse reactions were assayed whenever possible.
Assays for each individual enzyme were either developed or modified from previously publishedmethodology to be compatible with the conditions of the assay reactions (e.g. pH compatibilityor unavailability of commercial substrates). The assay conditions used for each enzyme were asfollows:
6-phosphogluconate dehydrogenase GND1 and GND2 were assayed in the reaction bufferin the forward reaction by direct measurement of the production of NADPH as in [He et al., 2007].The kinetic parameters for each isoenzyme were determined by varying the concentration of eachsubstrate (6-phosphogluconate and NADP) at fixed saturated concentration of the other.
6-phosphogluconolactonase SOL3 and SOL4 were assayed in the reaction buffer exactly ac-cording to [Schofield & Sols, 1976].
Transaldolase TAL1 and NQM1 were assayed in the reaction buffer in the forward and reversedirections according to [Tsolas & Joris, 1964, Wood, 1972]. Since sedoheptulose 7-phosphate wasnot available commercially, its barium salt was synthesised by Chemos GmbH and converted tothe sodium salt just prior to assay according to [Charmantray et al., 2009].
Transketolase TKL1 and TKL2 were assayed for both of their participatory reactions in thereaction buffer in the forward and reverse directions according to [Datta & Racker, 1961, Kochetov,1982]. The kinetic parameters were determined by varying the concentration of each substrate ata fixed saturated concentration of the other for the forward and reverse reactions.
Glucose-6-phosphate dehydrogenase ZWF1 was assayed in the reaction buffer in the forwardreaction by direct measurement of the production of NADPH according to [Gould & Goheer, 1976].
3PeerJ PrePrints | https://peerj.com/preprints/146v1/ | v1 received: 9 Dec 2013, published: 9 Dec 2013, doi: 10.7287/peerj.preprints.146v1
PrePrin
ts
Ribose-5-phosphate ketol-isomerase RKI1 was assayed for the forward and reverse reactionby circular dichroism (CD) measurements. The assay was developed based on the fact thatribulose-5-phosphate has a maximum absorbance at 278 nm, with a measured coefficient of -2.88m◦/mM/mm, and ribose-5-phosphate has an absorbance at 278 nm with a measured coefficientof -0.131 m◦/mM/mm. The data were collected in 400 µl in a 1 mm path length cuvette. In bothdirections, the CD angle θ can be used to calculate reactant concentrations, from which we cancalculate the rate of reaction.
D-ribulose-5-phosphate 3-epimerase RPE1 was assayed for the forward and reverse reactionby CD measurements. The assay was developed and modified from [Karmali et al., 1983]. Xylulose-5-phosphate has an absorbance at 278 nm with a measured coefficient of 0.846 m◦/mM/mm. Thesignal of CD θ can again be followed to infer the rate of reaction in both directions.
All measurements are based on at least duplicate determination of the reaction rates at eachsubstrate concentration. For each isoenzyme, the initial rates at various substrate concentrationswere determined and the data obtained were analysed by the KineticsWizard [Swainston et al.,2010] and COPASI [Hoops et al., 2006] and fitted to Michaelis-Menten kinetics. Data were obtainedfor all PPP isoenzymes, with the exception of SOL3 and SOL4 which showed no activity (seeTable 1). Any missing kinetic parameters were taken from previous models [Vaseghi et al., 1999,Ralser et al., 2007], or given initial estimates using typical values (kcat = 10 s−1, Km = 0.1 mM,[Bar-Even et al., 2011, Smallbone & Mendes, 2013]).
Proteomics
We attempted to measure the absolute quantities of all isoenzymes in this pathway through theQConCAT technology [Benyon et al., 2005]. Total cell protein was extracted from turbidostatyeast cultures as described earlier [Carroll et al., 2011]. Data analyses were performed using thePrideWizard software [Swainston et al., 2011] (see Table 2). Concentrations were then calculatedfrom copy number using a typical cytoplasmic volume of 5 fL [Smallbone et al., 2013].
Only four of the isoenzymes (Gnd1, Sol3, Tal1 and Tkl1) were detected using this approach.In the case of Gnd1/Gnd2 and Tal1/Nqm1, only the most abundant isoenzyme was detected ineach case, and it is likely that the expression level the less abundant isoenzyme was not neces-sarily zero but at least it was below the detection limit. The remaining three enzymes (Rki1,Rpe1 and Zwf1) were detected at higher levels in a previous study ([Ghaemmaghami et al., 2003],detailed in Table 2). Moreover, these are soluble cytoplasmic proteins, so we can assume theywere likely present in the extracted protein preparations (rather than sequestered to membranes,and subsequently lost as insoluble material). There are two possible explanations for the fail-ure to detect these proteins: poor or incomplete proteolysis (trypsin miscleavage) or unexpectedpost-translational modifications, either naturally occuring or inadvertently introduced during theexperimental protocol.
We note that copy numbers of PPP enzymes measured here were twenty-fold higher, on average,than in a previous study [Ghaemmaghami et al., 2003]. Thus using the data from Ghaemmaghamiet al. directly to fill in for the missing measurements is not appropriate here. Rather, in caseswhere one of two isoenzymes was not quantified (Gnd2, Nqm1), the same ratio was maintainedas as in [Ghaemmaghami et al., 2003] (i.e. we use the same proportions of the two isoenzymes).For the remaining three undetected enzymes (Rki1, Rpe1, Zwf1) the value reported in that studywas multiplied by twenty to provide an initial estimate.
4PeerJ PrePrints | https://peerj.com/preprints/146v1/ | v1 received: 9 Dec 2013, published: 9 Dec 2013, doi: 10.7287/peerj.preprints.146v1
PrePrin
ts
Model construction
From a modelling perspective, the enzyme kinetic constants and protein concentrations representthe parameters of the system, while the metabolite concentrations (Table 3) represent the variables.Combining the protein concentration data with those for the enzyme kinetic parameters, togetherwith the measured steady state metabolite levels, allows a mathematical model to be produced forthis system (Table 4) in ordinary differential equation format. This model considers, in the firstinstance, the PPP in isolation. Thus we consider three boundary metabolites to be fixed: F6P,G6P and GAP.
To consider oxidative stress, however, we expanded the model to combine it with our recentlypublished model of glycolysis (that includes trehalose and glycerol metabolism) [Smallbone et al.,2013], where the enzymatic parameters were determined in the same condiditions as describedhere. This combined glycolysis:PPP model contains 34 reactions, and allows calculation of theconcentration of 32 metabolites (variables). Importantly, it allows us to compare the joint responseof both pathways to environmental perturbations.
Simulations and analyses were performed in the software COPASI [Hoops et al., 2006]. The modelsdescribed here are available in SBML format [Hucka et al., 2003] from the BioModels database [Liet al., 2010] with identifiers:
• PPP in isolation: MODEL1311290000
• combined glycolysis:PPP: MODEL1311290001
[Note: until publication, the models are instead available fromhttp://www.ebi.ac.uk/biomodels/reviews/MODEL1311290000-1/]
5PeerJ PrePrints | https://peerj.com/preprints/146v1/ | v1 received: 9 Dec 2013, published: 9 Dec 2013, doi: 10.7287/peerj.preprints.146v1
PrePrin
ts
Results
Glucose pulse
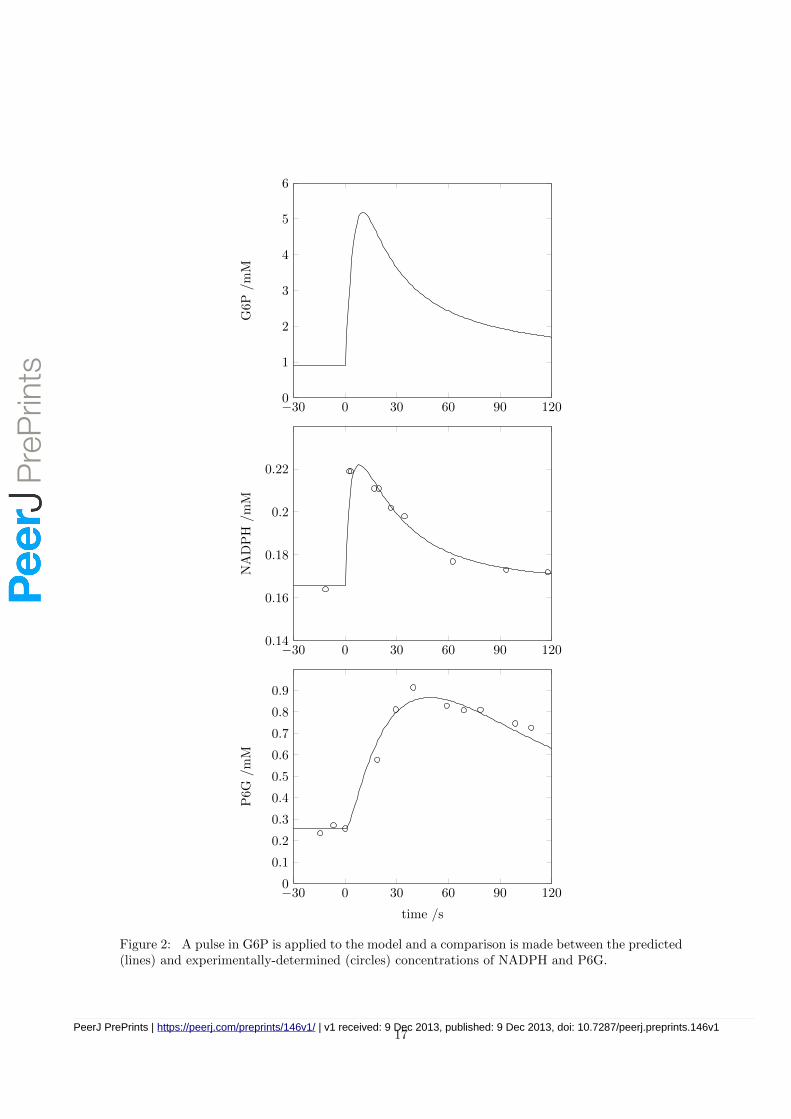
We used data published earlier for a perturbation in the G6P concentration following a glucosepulse [Vaseghi et al., 1999] with the following format
G6P = 0.9 +44.1 t
48.0 + t + 0.45 t2
and compared our model’s predictions to the experimental observations in [Vaseghi et al., 1999]with respect to NADPH and P6G concentrations (see Figure 2).
Whilst the present model contains many parameters that we measured under standardised condi-tions, a few parameters were not possible to determine experimentally and were therefore obtainedfrom the literature. The relative contribution of each of these parameters to the quality of fit todata may be ranked using sensitivity analysis. If we were unable to closely match the data usingonly the literature value of the most important parameter, we tried using two parameters, andcontinued adding parameters until a satisfactory match was obtained. Only five parameters hadto be obtained from the literature in this way (see Table 5) to provide the good match seen inFigure 2. Of these five, three were initial guesses, one (ZWF:Kg6l) was measured under otherconditions, and only one ([Gnd1]) had been measured by us (see above), but nonetheless fitted tothe data.
Oxidative stress
One of the proteins that responds to oxidative stress is the glycolytic enzyme glyceraldehyde-3-phosphate dehydrogenase (TDH). In response to high oxidant levels this enzyme is inactivatedand accumulates in the nucleus of the cell in several organisms and cell types [Chuang et al.,2005, Shenton & Grant, 2003]. Thus, we simulate in silico oxidative stress through reduction ofTDH activity in the combined glycolysis:PPP model to 25% of its wild-type value, following theapproach of [Ralser et al., 2007]. Cells also respond to the presence of oxidative agents throughslower growth, which we translate in our model as reducing the requirement for E4P and R5P (thebiomass precursors); we thus reduce the rate of consumption of these by two orders of magnitudefrom their reference values. The defence against the oxidant agent requires reductive power whichis ultimately supplied by NADPH (e.g. through glutathione); we thus also increase the rate ofNADPH consumption by two orders of magnitude. We may then compare predicted changes inmetabolite concentrations to those measured in response to H2O2 treatment [Ralser et al., 2007],a typical oxidative stress agent [Godon et al., 1998].
The results of these simulations are presented in Table 6. They show that seven of the eightqualitative changes in metabolite concentrations are correctly predicted by the model. A differencebetween the experimental data and the predictions was only observed for the metabolite glycerol3-phosphate (G3P), where the simulation predicts a small increase, but experimentally we observea small decrease.
As the qualitative predictions reasonably matched the experimental data set, we moved on tocalculate the influence of oxidative stress on carbon flux. We found that the ratio of fluxes intoglycolysis (via PGI) and into PPP (via ZWF) was 18:1 under reference conditions, but this valuereduced to 9:1 under the oxidative stress conditions, corroborating the hypothesis that oxidativestress leads to a redirection of the carbohydrate flux [Ralser et al., 2007]. The ratios are consistentwith experimental measurement showing that, in aerobic growth conditions on glucose minimalmedium, PPP activity accounts for some 10% of the total consumption of glucose [Blank et al.,2005].
6PeerJ PrePrints | https://peerj.com/preprints/146v1/ | v1 received: 9 Dec 2013, published: 9 Dec 2013, doi: 10.7287/peerj.preprints.146v1
PrePrin
ts
Control analysis
Metabolic control analysis (MCA) is a biochemical formalism, defining how variables, such asfluxes and concentrations, depend on network parameters. It stems from the work of [Kacser &Burns, 1973] and, independently, [Heinrich & Rapoport, 1974]. In Table 7 (a), we present thescaled flux control coefficients for the (fitted) PPP model. These are measures of how a relativechange in enzyme activity leads to a change in steady state flux through the system. For example,from the third row of the table, we predict that a 1% increase in GND levels would lead to a0.153% decrease in RPE flux.
The table shows us that flux into the pathway (via ZWF) is entirely controlled by ZWF, SOL,GND and NADPH oxidase (the latter representing all processes that oxidise NADPH). Returningto Figure 1, we see that these correspond to the first three steps of the pathway plus NADPHrecycling – the oxidative phase. The table also shows the overall control of each step of thepathway, taken in COPASI [Hoops et al., 2006] to be the norm of the control coefficients. We seethat little control is exerted by the RPE and TKL (R5P:S7P) steps. The three sinks have highoverall control, and as such we would expect fluxes through the pathway to be highly dependenton growth rate and stress levels.
In the oxidative stress simulation the control distribution changes, as presented in Table 7 (b).The main observation from these data is that the control of the pathway input flux is now muchlower by the NADPH oxidase — this is somewhat expected since the rate of this step increased100× and thus became less limiting. Less intuitive is the reduction of overall control of the networkby RKI (the reaction that produces ribose 5-phosphate). However this result implies that underoxidative stress the PPP is essentially insensitive to the “pull” from ribose use for nucleic acidsynthesis, which agrees with the observation that growth is arrested under these conditions.
7PeerJ PrePrints | https://peerj.com/preprints/146v1/ | v1 received: 9 Dec 2013, published: 9 Dec 2013, doi: 10.7287/peerj.preprints.146v1
PrePrin
ts
Discussion
The pentose phosphate pathway, depicted in Figure 1, is a central pathway in yeast and in mostorganisms and serves two main functions: maintanance of the NADPH:NADP+ ratio, and pro-duction of several precursors for biosynthesis of macromolecules. These two roles of the pathwayare mirrored in its structure and it consists of two semi-independent parts; the oxidative branchreduces NADP+, whilst the non-oxidative branch creates R5P, a precursor for nucleic acid biosyn-thesis, or E4P, a precursor for aromatic amino acids and some vitamins. The PPP is intimatelyconnected with glycolysis as it diverts some of its flux away from energy production. Furthermore,the two pathways have three metabolites in common: G6P, F6P and GAP.
In order to describe a biological system such as PPP quantitatively, the kinetic properties ofall its components need to be established in conditions close to the physiological [van Eunen etal., 2010, Messiha et al., 2011]. Where possible, they should represent a system in steady state,where all measurements, even if carried out at different times, are performed under identicalconditions. Following the methodology previously applied to glycolysis [Smallbone et al., 2013],robust and standardised enzyme kinetics and quantitative proteomics measurements were appliedto the enzymes of the pentose phosphate pathway in the S. cerevisiae strain YDL227C. Theresulting data are integrated in a kinetic model of the pathway. This is in contrast to previousstudies [Vaseghi et al., 1999, Ralser et al., 2007], where kinetic parameters were taken from varioussources the literature:
“The kinetic constants were determined using enzymes from five different species (hu-man, cow, rabbit, yeast, E. coli) in different laboratories over a period of more thanthree decades.” [Ralser et al., 2007]
We use our standardised model to study the response of the pentose phosphate pathway to aglucose pulse, finding a good agreement between measured and predicted NADPH and P6G profiles(Figure 2). We go on to use model to study the combined response of glycolysis and PPP tooxidative stress, and find that a considerable amount of flux is rerouted through the PPP.
Our modelling approach also reveals a discrepancy between the observed change in G3P levelsfollowing stress cannot be predicted by current understanding of glycolysis and PPP; followingthe “cycle of knowledge” [Kell, 2006], it is of interest to direct future focus towards glycerolmetabolism in order to improve the accuracy of this model.
It is important to highlight that we were not able here to quantify the concentration of all enzymesin the pathway, thus having to rely on crude estimates. It is quite possible that the pysiologicalconditions under which the cells were measured by [Ghaemmaghami et al., 2003] were very differentthan those used here, which could result in innacurate estimates for the concentration of severalenzymes. However the fact that we have measured kcat parameters for those enzymes will alloweasy correction of the model if accurate enzyme concentrations are determined later. Indeed,these data will allow to account for changes in enzyme concentrations resulting from a longerterm response of the cells, through protein degradation or increased protein synthesis rate due tochanges at the level of transcription and translation.
The combined PPP and glycolysis model demonstrates the value of standardised enzyme kineticmeasurements – models thus parameterised can be combined to expand their scope, eventuallyforming large-scale models of metabolism [Snoep, 2005, Snoep et al., 2006, Smallbone & Mendes,2013]. Indeed the combined glycolysis:PPP model could be expanded to consider enzyme con-centrations as variables (through accounting for their synthesis and degradation, reflecting geneexpression and signalling) which would improve its utility in predicting a broader array of condi-tions. Such an expansion of models to cover wider areas of metabolism and cellular biochemistrywill lead to digital organisms, as shown in a recent proof of principle for the simple bacteriumMycoplasma genitalium [Karr et al., 2012].
8PeerJ PrePrints | https://peerj.com/preprints/146v1/ | v1 received: 9 Dec 2013, published: 9 Dec 2013, doi: 10.7287/peerj.preprints.146v1
PrePrin
ts
The “bottom-up” strategy used here is to combine compatible kinetic models (PPP and glycolysis)exapnding them towards a larger metabolic model. An alternative (“top-down”) strategy is tostart with a large structural yeast network [Herrgard et al., 2008, Dobson et al., 2010, Heavneret al., 2012, Heavner et al., 2013, Aung et al., 2013], then add estimated kinetic parameters and,through successive rounds of improvement, incorporate measured parameters [Smallbone et al.,2010, Smallbone & Mendes, 2013, Stanford et al., 2013], in an automated manner where possible[Li et al., 2010, Buchel et al., 2013]. Can these two strategies be combined into a more robust andscalable approach?
In summary, we present here a model of the yeast pentose phosphate pathway that we believe isthe most realistic so far, including experimentally determined kinetic parameters for its enzymesand (some) physiological enzyme concentrations. A more complex model resulting from the com-bination of this PPP model with a previous glycolytic model [Smallbone et al., 2013] was possibledue to the standardized way in which the kinetic parameters were measured. This opens up theprospect of expanding models to eventually cover the entire metabolism of a cell in a way thatmakes them compatible with a further improvement, by including the effects of changes in geneexpression.
9PeerJ PrePrints | https://peerj.com/preprints/146v1/ | v1 received: 9 Dec 2013, published: 9 Dec 2013, doi: 10.7287/peerj.preprints.146v1
PrePrin
ts
Acknowledgements
We thank Neil Swainston for his help with the KineticsWizard and PrideWizard software. PMthanks Ana M Martins for early discussions about the PPP.
10PeerJ PrePrints | https://peerj.com/preprints/146v1/ | v1 received: 9 Dec 2013, published: 9 Dec 2013, doi: 10.7287/peerj.preprints.146v1
PrePrin
ts
References
[Aung et al., 2013] Aung HW, Henry SA, Walker LP. 2013. Revising the representation of fattyacid, glycerolipid, and glycerophospholipid metabolism in the consensus model of yeastmetabolism. Ind Biotech 9:215–228. doi:10.1089/ind.2013.0013
[Bar-Even et al., 2011] Bar-Even A, Noor E, Savir Y, Liebermeister W, Davidi D, Tawfik DS,Milo R. 2011. The moderately efficient enzyme: evolutionary and physicochemical trendsshaping enzyme parameters. Biochemistry 50:4402–4410. doi:10.1021/bi2002289
[Benyon et al., 2005] Beynon RJ, Doherty MK, Pratt JM, Gaskell SJ. 2005. Multiplexed abso-lute quantification in proteomics using artificial QCAT proteins of concatenated signaturepeptides. Nature Methods 2:587–589. doi:10.1038/nmeth774
[Blank et al., 2005] Blank LM, Kuepfer L, Sauer U. 2005. Large-scale 13C-flux analysis revealsmechanistic principles of metabolic network robustness to null mutations in yeast. GenomeBiology 6:R49. doi:10.1186/gb-2005-6-6-r49
[Bruinenberg et al., 1983] Bruinenberg PM, Van Dijken JP, Scheffers WA. 1983. A theoreticalanalysis of NADPH production and consumption in yeasts. Journal of General Microbiology129:953–964. doi:10.1099/00221287-129-4-953
[Buchel et al., 2013] Buchel F, Rodriguez N, Swainston N, Wrzodek C, Czauderna T, Keller R,Mittag F, Schubert M, Glont M, Golebiewski M, van Iersel M, Keating S, Rall M, Wybrow M,Hermjakob H, Hucka M, Kell DB, Mller W, Mendes P, Zell A, Chaouiya C, Saez-RodriguezJ, Schreiber F, Laibe C, Drger A, Le Novere N. 2013. Path2Models: large-scale generationof computational models from biochemical pathway maps. BMC Systems Biology 7:116.doi:10.1186/1752-0509-7-116
[Carroll et al., 2011] Carroll KM, Simpson DM, Eyers CE, Knight CG, Brownridge P, DunnWB, Winder CL, Lanthaler K, Pir P, Malys N, Kell DB, Oliver SG, Gaskell SJ, BeynonRJ. 2011. Absolute quantification of the glycolytic pathway in yeast: deployment ofa complete QconCAT approach. Molecular and Cellular Proteomics 10:M111.007633.doi:10.1074/mcp.M111.007633
[Charmantray et al., 2009] Charmantray F, Helaine V, Legereta B, Hecquet L. 2009. Prepar-ative scale enzymatic synthesis of D-sedoheptulose-7-phosphate from β-hydroxypyruvateand D-ribose-5-phosphate. Journal of Molecular Catalysis B: Enzymatic 57:6-9.doi:10.1016/j.molcatb.2008.06.005
[Chuang et al., 2005] Chuang DM, Hough C, Senatorov VV. 2005. Glyceraldehyde-3-phosphatedehydrogenase, apoptosis, and neurodegenerative diseases. Annual Review of Pharmacologyand Toxicology 45:269–290. doi:10.1146/annurev.pharmtox.45.120403.095902
[Datta & Racker, 1961] Datta AG, Racker E. 1961. Mechanism of action of transketolase. I. Crys-talization and properties of yeast enzyme. Journal of Biological Chemistry 236:617–623.
[Dobson et al., 2010] Dobson PD, Smallbone K, Jameson D, Simeonidis E, Lanthaler K, Pir P,Lu C, Swainston N, Dunn WB, Fisher P, Hull D, Brown M, Oshota O, Stanford NJ, Kell DB,King RD, Oliver SG, Stevens RD, Mendes P. 2010. Further developments towards a genome-scale metabolic model of yeast. BMC Systems Biology 4:145. doi:10.1186/1752-0509-4-145
[Ghaemmaghami et al., 2003] Ghaemmaghami S, Huh WK, Bower K, Howson RW, Belle A, De-phoure N, O’Shea EK, Weissman JS. 2003. Dynamic rerouting of the carbohydrate flux iskey to counteracting oxidative stress. Nature 425:737–41. doi:10.1038/nature02046
[Glock & McLean, 1953] Glock GE, McLean, P. 1953. Further studies on the properties andassay of glucose 6-phosphate dehydrogenase and 6-phosphogluconate dehydrogenase of ratliver. Biochemical Journal 55:400–408.
11PeerJ PrePrints | https://peerj.com/preprints/146v1/ | v1 received: 9 Dec 2013, published: 9 Dec 2013, doi: 10.7287/peerj.preprints.146v1
PrePrin
ts
[Godon et al., 1998] Godon C, Lagniel G, Lee J, Buhler JM, Kieffer S, Perrot M, Boucherie H,Toledano MB, Labarre J. 1998. The H2O2 stimulon in Saccharomyces cerevisiae. Journal ofBiological Chemistry 273:22480–22489. doi:10.1074/jbc.273.35.22480
[Gould & Goheer, 1976] Gould BJ, Goheer MA. 1976. Kinetic mechanism from steady-state kinet-ics of the reaction catalysed by baker’s-yeast glucose 6-phosphate dehydrogenase in solutionand covalently attached to sepharose. Biochemical Journal 157:389–393.
[Heavner et al., 2012] Heavner BD, Smallbone K, Barker B, Mendes P, Walker LP. 2012. Yeast5 – an expanded reconstruction of the Saccharomyces cerevisiae metabolic network. BMCSystems Biology 6:55. doi:10.1186/1752-0509-6-55
[Heavner et al., 2013] Heavner BD, Smallbone K, Price ND, Walker LP. 2013. Version 6 of theconsensus yeast metabolic network refines biochemical coverage and improves model perfor-mance. Database 2013:bat059. doi:10.1093/database/bat059
[Herrgard et al., 2008] Herrgard MJ, Swainston N, Dobson P, Dunn WB, Arga KY, Arvas M,Bluthgen N, Borger S, Costenoble R, Heinemann M, Hucka M, Le Novere N, Li P, Lieber-meister W, Mo M, Oliveira AP, Petranovic D, Pettifer S, Simeonidis E, Smallbone K, Spasic I,Weichart D, Brent R, Broomhead DS, Westerhoff HV, Kırdar B, Penttila M, Klipp E, Pals-son BØ, Sauer U, Oliver SG, Mendes P, Nielsen J, Kell DB. 2008. A consensus yeast metabolicnetwork obtained from a community approach to systems biology. Nature Biotechnology26:1155–1160. doi:10.1038/nbt1492
[Haut et al., 1974] Haut MJ, London JW, Garfinkel D. 1974. Simulation of the pentose cycle inlactating rat mammary gland. Biochemical Journal 138:511–524.
[He et al., 2007] He W, Wang Y, Liu W, Zhou CZ. 2007. Crystal structure of Saccha-romyces cerevisiae 6-phosphogluconate dehydrogenase Gnd1. BMC Structural Biology 7:38.doi:10.1186/1472-6807-7-38
[Hoops et al., 2006] Hoops S, Sahle S, Gauges R, Lee C, Pahle J, Simus N, Singhal M, Xu L,Mendes P, Kummer U. 2006. COPASI: a COmplex PAthway SImulator. Bioinformatics22:3067–3074. doi:10.1093/bioinformatics/btl485
[Hucka et al., 2003] Hucka M, Finney A, Sauro HM, Bolouri H, Doyle JC, Kitano H, Arkin AP,Bornstein BJ, Bray D, Cornish-Bowden A, Cuellar AA, Dronov S, Gilles ED, Ginkel M, Gor V,Goryanin II, Hedley WJ, Hodgman TC, Hofmeyr JH, Hunter PJ, Juty NS, Kasberger JL,Kremling A, Kummer U, Le Novere N, Loew LM, Lucio D, Mendes P, Minch E, Mjolsness ED,Nakayama Y, Nelson MR, Nielsen PF, Sakurada T, Schaff JC, Shapiro BE, Shimizu TS,Spence HD, Stelling J, Takahashi K, Tomita M, Wagner J, Wang J, SBML Forum. 2003.The systems biology markup language (SBML): a medium for representation and exchange ofbiochemical network models. Bioinformatics 19:524–531. doi:10.1093/bioinformatics/btg015
[Ishii et al., 2007] Ishii N, Nakahigashi K, Baba T, Robert M, Soga T, Kanai A, Hirasawa T,Naba M, Hirai K, Hoque A, Ho PY, Kakazu Y, Sugawara K, Igarashi S, Harada S, Ma-suda T, Sugiyama N, Togashi T, Hasegawa M, Takai Y, Yugi K, Arakawa K, Iwata N,Toya Y, Nakayama Y, Nishioka T, Shimizu K, Mori H, Tomita M. 2007. Multiple high-throughput analyses monitor the response of E. coli to perturbations. Science 316:593–597.doi:10.1126/science.1132067
[Joshi & Palsson, 1989] Joshi A, Palsson BØ. 1989. Metabolic dynamics in the human redcell. Part I–A comprehensive kinetic model. Journal of Theoretical Biology 141:515–528.doi:10.1016/S0022-5193(89)80233-4
[Kacser & Burns, 1973] Kacser H, Burns JA. 1973. The control of flux. Symposia of the Societyfor Experimental Biology 27:65–104.
12PeerJ PrePrints | https://peerj.com/preprints/146v1/ | v1 received: 9 Dec 2013, published: 9 Dec 2013, doi: 10.7287/peerj.preprints.146v1
PrePrin
ts
[Heinrich & Rapoport, 1974] Heinrich R, Rapoport TA. 1974 A linear steady-state treatment ofenzymatic chains. General properties, control and effector strength. European Journal ofBiochemistry 42:89–95. doi:10.1111/j.1432-1033.1974.tb03318.x
[Karmali et al., 1983] Karmali A, Drake AF, Spencer N. 1983. Purification, properties and assay ofD-ribulose 5-phosphate 3-epimerase from human erythrocytes. Biochemical Journal 211:617–623.
[Karr et al., 2012] Karr JR, Sanghvi JC, Macklin DN, Gutschow MV, Jacobs JM, Bolival B Jr,Assad-Garcia N, Glass JI, Covert MW. 2012. A whole-cell computational model predictsphenotype from genotype. Cell 150(2):389–401. doi:10.1016/j.cell.2012.05.044
[Kell, 2006] Kell DB. 2006. Metabolomics, modelling and machine learning in systems biology:towards an understanding of the languages of cells. The 2005 Theodor Bucher lecture. FEBSJ 273:873–894. doi:10.1128/JB.185.9.2692-2699.2003
[Kerkhoven et al., 2013] Kerkhoven EJ, Achcar F, Alibu VP, Burchmore RJ, Gilbert IH, Trybi loM, Driessen NN, Gilbert D, Breitling R, Bakker BM, Barrett MP. Handling Uncertainty inDynamic Models: The Pentose Phosphate Pathway in Trypanosoma brucei. PLoS Computa-tional Biology In press. doi:10.1371/journal.pcbi.1003371
[Kochetov, 1982] Kochetov GA. 1982. Transketolase from yeast, rat liver and pig liver. Methodsin Enzymology 90:209–223.
[Kochetov et al., 1978] Kochetov GA, Usmanov RA, Mevkh AT. 1978. A new method of deter-mination of transketolase activity by asymmetric synthesis reaction. Analytical Biochemistry88:296–301. doi:10.1016/0003-2697(78)90422-0
[Le Novere et al., 2009] Le Novere N N, Hucka M, Mi H, Moodie S, Schreiber F, Sorokin A,Demir E, Wegner K, Aladjem MI, Wimalaratne SM, Bergman FT, Gauges R, Ghazal P,Kawaji H, Li L, Matsuoka Y, Villeger A, Boyd SE, Calzone L, Courtot M, Dogrusoz U,Freeman TC, Funahashi A, Ghosh S, Jouraku A, Kim S, Kolpakov F, Luna A, Sahle S,Schmidt E, Watterson S, Wu G, Goryanin I, Kell DB, Sander C, Sauro H, Snoep JL, KohnK, Kitano H. 2009. The Systems Biology Graphical Notation. Nature Biotechnology 27:735–741. doi:10.1038/nbt.1558
[Li et al., 2010] Li C, Donizelli M, Rodriguez N, Dharuri H, Endler L, Chelliah V, Li L, He E,Henry A, Stefan MI, Snoep JL, Hucka M, Le Novere N, Laibe C. 2010. BioModels Database:An enhanced, curated and annotated resource for published quantitative kinetic models. BMCSystems Biology 4:92. doi:10.1186/1752-0509-4-92
[Li et al., 2010] Li P, Dada JO, Jameson D, Spasic I, Swainston N, Carroll K, Dunn W, KhanF, Malys N, Messiha HL, Simeonidis E, Weichart D, Winder C, Wishart J, Broomhead DS,Goble CA, Gaskell SJ, Kell DB, Westerhoff HV, Mendes P, Paton NW. 2010. Systematicintegration of experimental data and models in systems biology. BMC Bioinformatics 11:582.doi:10.1186/1471-2105-11-5822
[Malys et al., 2011] Malys N, Wishart JA, Oliver SG, McCarthy JEG. 2011. Protein productionin Saccharomyces cerevisiae for systems biology studies. Methods in Enzymology 500:197–222.doi:10.1016/B978-0-12-385118-5.00011-6
[Messiha et al., 2011] Messiha HL, Malys N, Carroll K. 2011. Towards full quantitative descriptionof yeast metabolism: a systematic approach for estimating the kinetic parameters of isoen-zymes under in vivo like conditions. Methods in Enzymology 500:215–231. doi:10.1016/B978-0-12-385118-5.00012-8
[Mulquiney & Kuchel, 1999] Mulquiney PJ, Kuchel PW. 1999. Model of 2,3-bisphosphoglyceratemetabolism in the human erythrocyte based on detailed enzyme kinetic equations: equationsand parameter refinement. Biochemical Journal 342:581–596.
13PeerJ PrePrints | https://peerj.com/preprints/146v1/ | v1 received: 9 Dec 2013, published: 9 Dec 2013, doi: 10.7287/peerj.preprints.146v1
PrePrin
ts
[Ralser et al., 2007] Ralser M, Wamelink MM, Kowald A, Gerisch B, Heeren G, Struys EA, KlippE, Jakobs C, Breitenbach M, Lehrach H, Krobitsch S. 2007. Dynamic rerouting of the carbohy-drate flux is key to counteracting oxidative stress. Journal of Biology 6:10. doi:10.1186/jbiol61
[Sabate et al., 1995] Sabate L, Franco R, Canela EI, Centelles JJ, Cascante M. 1995. A modelof the pentose phosphate pathway in rat liver cells. Molecular and Cellular Biochemistry142:9–17. doi:10.1007/BF00928908
[Saggerson, 2009] Saggerson D. 2009. Getting to grips with the pentose phosphate pathway in1953. Biochemical Journal. doi:10.1042/BJ20081961
[Schofield & Sols, 1976] Schofield PJ, Sols A. 1976. Rat liver 6-phosphogluconolactonase: alow Km enzyme. Biochemical and Biophysical Research Communications 71:1313–1318.doi:10.1016/0006-291X(76)90798-1
[Sha et al., 2013] Sha W, Martins AM, Laubenbacher R, Mendes P, Shulaev V. 2013. The genome-wide early temporal response of Saccharomyces cerevisiae to oxidative stress induced bycumene hydroperoxide. PLoS ONE 8:e74939. doi:10.1371/journal.pone.0074939
[Shenton & Grant, 2003] Shenton D, Grant CM. 2003. Protein S-thiolation targets glycolysisand protein synthesis in response to oxidative stress in the yeast Saccharomyces cerevisiae.Biochemical Journal 1:513–519. doi:10.1042/BJ20030414
[Smallbone et al., 2010] Smallbone K, Simeonidis E, Swainston N, Mendes P. 2010. To-wards a genome-scale kinetic model of cellular metabolism. BMC Systems Biology 4:6.doi:10.1186/1752-0509-4-6
[Smallbone et al., 2013] Smallbone K, Messiha HL, Carroll KM, Winder CL, Malys N, Dunn WB,Murabito E, Swainston N, Dada JO, Khan F, Pir P, Simeonidis E, Spasic I, Wishart J,Weichart D, Hayes NW, Jameson D, Broomhead DS, Oliver SG, Gaskell SJ, McCarthy JE,Paton NW, Westerhoff HV, Kell DB, Mendes P. 2013. A model of yeast glycolysis basedon a consistent kinetic characterisation of all its enzymes. FEBS Letters 587:2832–2841.doi:10.1016/j.febslet.2013.06.043
[Smallbone & Mendes, 2013] Smallbone K, Mendes P. 2013. Large-Scale Metabolic Mod-els: From Reconstruction to Differential Equations. Industrial Biotechnology 9:179–184.doi:10.1089/ind.2013.0003
[Snoep, 2005] Snoep JL. 2005. The Silicon Cell initiative: working towards a detailed ki-netic description at the cellular level. Current Opinion in Biotechnology 16:336–343.doi:10.1016/j.copbio.2005.05.003
[Snoep et al., 2006] Snoep JL, Bruggeman F, Olivier BG, Westerhoff HV. 2006. To-wards building the silicon cell: a modular approach. Biosystems 83:207–216.doi:10.1016/j.biosystems.2005.07.006
[Stanford et al., 2013] Stanford NJ, Lubitz T, Smallbone K, Klipp E, Mendes P, LiebermeisterW. 2013. Systematic construction of kinetic models from genome-scale metabolic networks.PLoS ONE 8:e79195. doi:10.1371/journal.pone.0079195
[Swainston et al., 2010] Swainston N, Golebiewski M, Messiha HL, Malys N, Kania R, Kengne S,Krebs O, Mir S, Sauer-Danzwith H, Smallbone K, Weidemann A, Wittig U, Kell DB, MendesP, Muller W, Paton NW, Rojas I. 2010. Enzyme kinetics informatics: from instrument tobrowser. FEBS Journal 277:3769–3779. doi:10.1111/j.1742-4658.2010.07778.x
[Swainston et al., 2011] Swainston N, Jameson D, Carroll K. 2011. A QconCAT informaticspipeline for the analysis, visualization and sharing of absolute quantitative proteomics data.Proteomics 11:329–333. doi:10.1002/pmic.201000454
14PeerJ PrePrints | https://peerj.com/preprints/146v1/ | v1 received: 9 Dec 2013, published: 9 Dec 2013, doi: 10.7287/peerj.preprints.146v1
PrePrin
ts
[Tsolas & Joris, 1964] Tsolas O and Joris L. 1964. Transaldolase In: Boyer PD, ed. The Enzymes7. New York: Academic Press, 259-280.
[van Eunen et al., 2010] , van Eunen K, Bouwman J, Daran-Lapujade P, Postmus J, Canelas AB,Mensonides FI, Orij R, Tuzun I, van den Brink J, Smits GJ, van Gulik WM, Brul S, HeijnenJJ, de Winde JH, Teixeira de Mattos MJ, Kettner C, Nielsen J, Westerhoff HV, Bakker BM.2010. Measuring enzyme activities under standardized in vivo-like conditions for systemsbiology. FEBS Journal 277:749–760. doi:10.1111/j.1742-4658.2009.07524.x
[Vaseghi et al., 1999] Vaseghi S, Baumeister A, Rizzi M, Reuss M. 1999. In vivo dynamics of thepentose phosphate pathway in Saccharomyces cerevisiae. Metabolic Engineering 1:128–140.doi:10.1006/mben.1998.0110
[Wood, 1972] Wood T. 1972. The forward and reverse reactions of transaldolase. FEBS Letters,52:153-155. doi:10.1016/0014-5793(72)80474-5
15PeerJ PrePrints | https://peerj.com/preprints/146v1/ | v1 received: 9 Dec 2013, published: 9 Dec 2013, doi: 10.7287/peerj.preprints.146v1
PrePrin
ts
G6P
G6L
ZWF
NADP
NADPH
P6G
SOL
Ru5P
GND
NADP
NADPH
RPE
X5P
RKI
R5P
GAP S7P
TKL
F6P E4P
TAL
GAP X5P
TKL
Figure 1: Pictoral representation of the pentose phosphate pathway in Systems Biology GraphicalNotation format (SBGN, [Le Novere et al., 2009])).
16PeerJ PrePrints | https://peerj.com/preprints/146v1/ | v1 received: 9 Dec 2013, published: 9 Dec 2013, doi: 10.7287/peerj.preprints.146v1
PrePrin
ts
−30 0 30 60 90 1200
1
2
3
4
5
6
G6P
/m
M
−30 0 30 60 90 1200.14
0.16
0.18
0.2
0.22
NA
DP
H/m
M
−30 0 30 60 90 1200
0.1
0.2
0.3
0.4
0.5
0.6
0.7
0.8
0.9
time /s
P6G
/mM
Figure 2: A pulse in G6P is applied to the model and a comparison is made between the predicted(lines) and experimentally-determined (circles) concentrations of NADPH and P6G.
17PeerJ PrePrints | https://peerj.com/preprints/146v1/ | v1 received: 9 Dec 2013, published: 9 Dec 2013, doi: 10.7287/peerj.preprints.146v1
PrePrin
ts
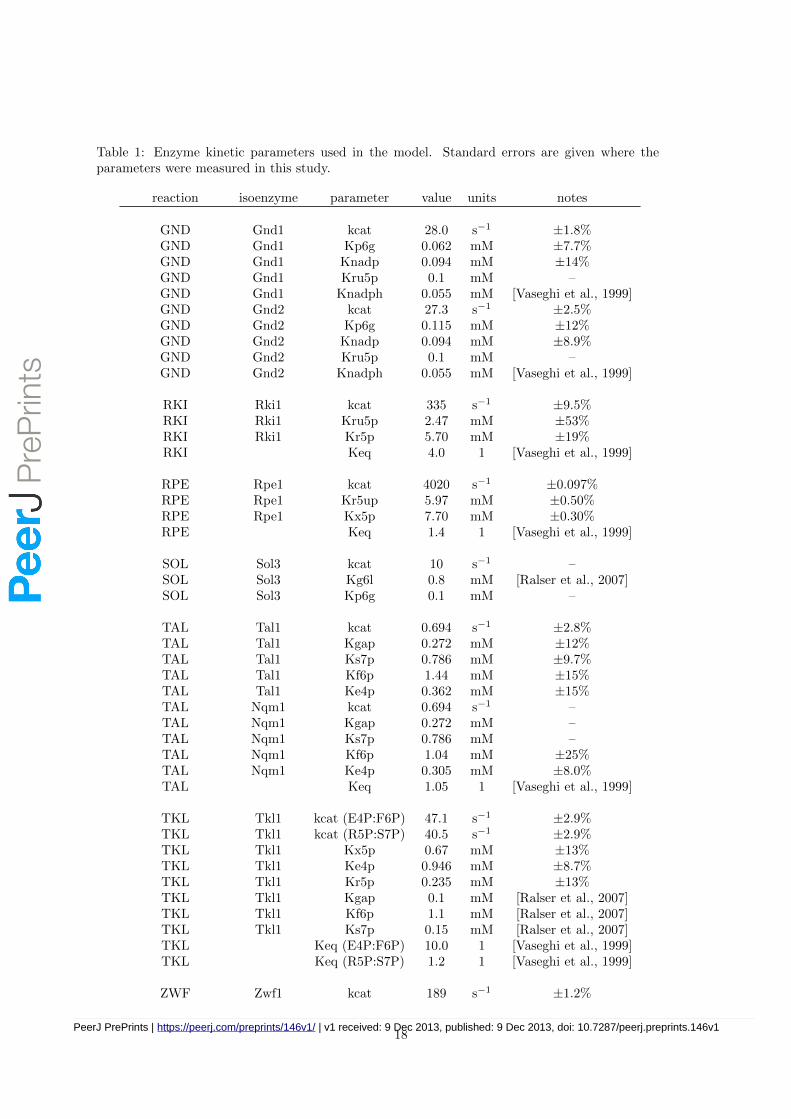
Table 1: Enzyme kinetic parameters used in the model. Standard errors are given where theparameters were measured in this study.
reaction isoenzyme parameter value units notes
GND Gnd1 kcat 28.0 s−1 ±1.8%GND Gnd1 Kp6g 0.062 mM ±7.7%GND Gnd1 Knadp 0.094 mM ±14%GND Gnd1 Kru5p 0.1 mM –GND Gnd1 Knadph 0.055 mM [Vaseghi et al., 1999]GND Gnd2 kcat 27.3 s−1 ±2.5%GND Gnd2 Kp6g 0.115 mM ±12%GND Gnd2 Knadp 0.094 mM ±8.9%GND Gnd2 Kru5p 0.1 mM –GND Gnd2 Knadph 0.055 mM [Vaseghi et al., 1999]
RKI Rki1 kcat 335 s−1 ±9.5%RKI Rki1 Kru5p 2.47 mM ±53%RKI Rki1 Kr5p 5.70 mM ±19%RKI Keq 4.0 1 [Vaseghi et al., 1999]
RPE Rpe1 kcat 4020 s−1 ±0.097%RPE Rpe1 Kr5up 5.97 mM ±0.50%RPE Rpe1 Kx5p 7.70 mM ±0.30%RPE Keq 1.4 1 [Vaseghi et al., 1999]
SOL Sol3 kcat 10 s−1 –SOL Sol3 Kg6l 0.8 mM [Ralser et al., 2007]SOL Sol3 Kp6g 0.1 mM –
TAL Tal1 kcat 0.694 s−1 ±2.8%TAL Tal1 Kgap 0.272 mM ±12%TAL Tal1 Ks7p 0.786 mM ±9.7%TAL Tal1 Kf6p 1.44 mM ±15%TAL Tal1 Ke4p 0.362 mM ±15%TAL Nqm1 kcat 0.694 s−1 –TAL Nqm1 Kgap 0.272 mM –TAL Nqm1 Ks7p 0.786 mM –TAL Nqm1 Kf6p 1.04 mM ±25%TAL Nqm1 Ke4p 0.305 mM ±8.0%TAL Keq 1.05 1 [Vaseghi et al., 1999]
TKL Tkl1 kcat (E4P:F6P) 47.1 s−1 ±2.9%TKL Tkl1 kcat (R5P:S7P) 40.5 s−1 ±2.9%TKL Tkl1 Kx5p 0.67 mM ±13%TKL Tkl1 Ke4p 0.946 mM ±8.7%TKL Tkl1 Kr5p 0.235 mM ±13%TKL Tkl1 Kgap 0.1 mM [Ralser et al., 2007]TKL Tkl1 Kf6p 1.1 mM [Ralser et al., 2007]TKL Tkl1 Ks7p 0.15 mM [Ralser et al., 2007]TKL Keq (E4P:F6P) 10.0 1 [Vaseghi et al., 1999]TKL Keq (R5P:S7P) 1.2 1 [Vaseghi et al., 1999]
ZWF Zwf1 kcat 189 s−1 ±1.2%
18PeerJ PrePrints | https://peerj.com/preprints/146v1/ | v1 received: 9 Dec 2013, published: 9 Dec 2013, doi: 10.7287/peerj.preprints.146v1
PrePrin
ts
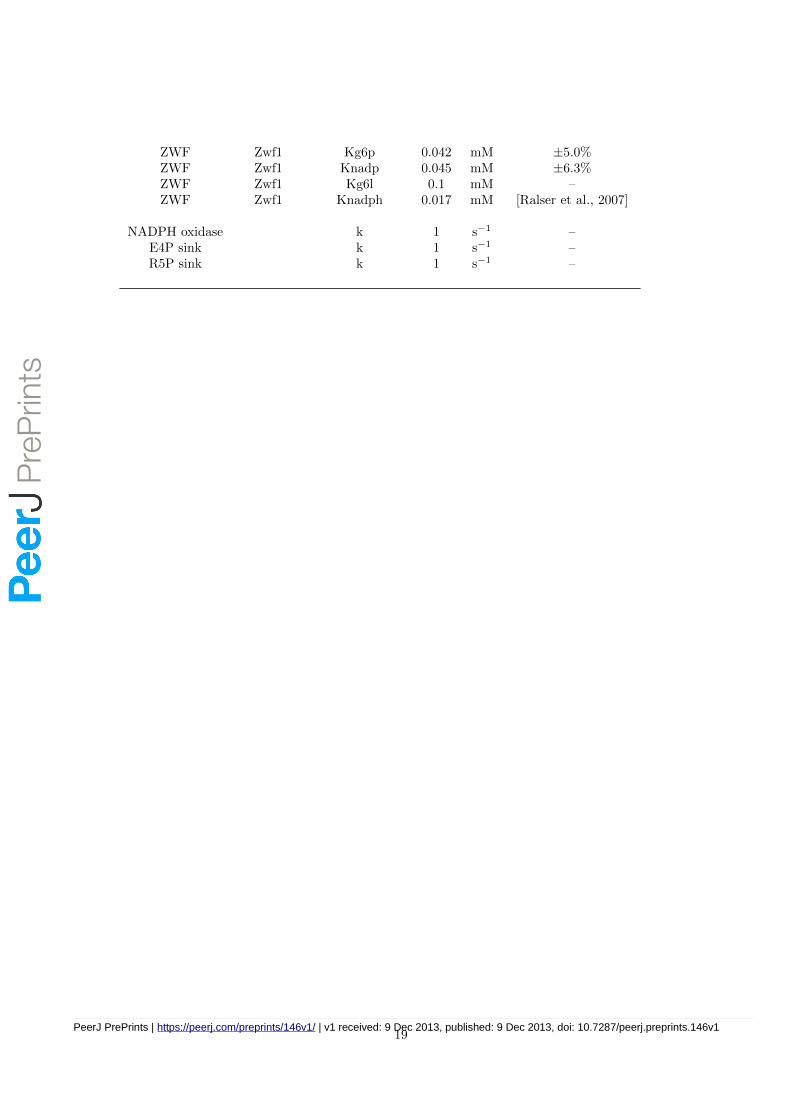
ZWF Zwf1 Kg6p 0.042 mM ±5.0%ZWF Zwf1 Knadp 0.045 mM ±6.3%ZWF Zwf1 Kg6l 0.1 mM –ZWF Zwf1 Knadph 0.017 mM [Ralser et al., 2007]
NADPH oxidase k 1 s−1 –E4P sink k 1 s−1 –R5P sink k 1 s−1 –
19PeerJ PrePrints | https://peerj.com/preprints/146v1/ | v1 received: 9 Dec 2013, published: 9 Dec 2013, doi: 10.7287/peerj.preprints.146v1
PrePrin
ts
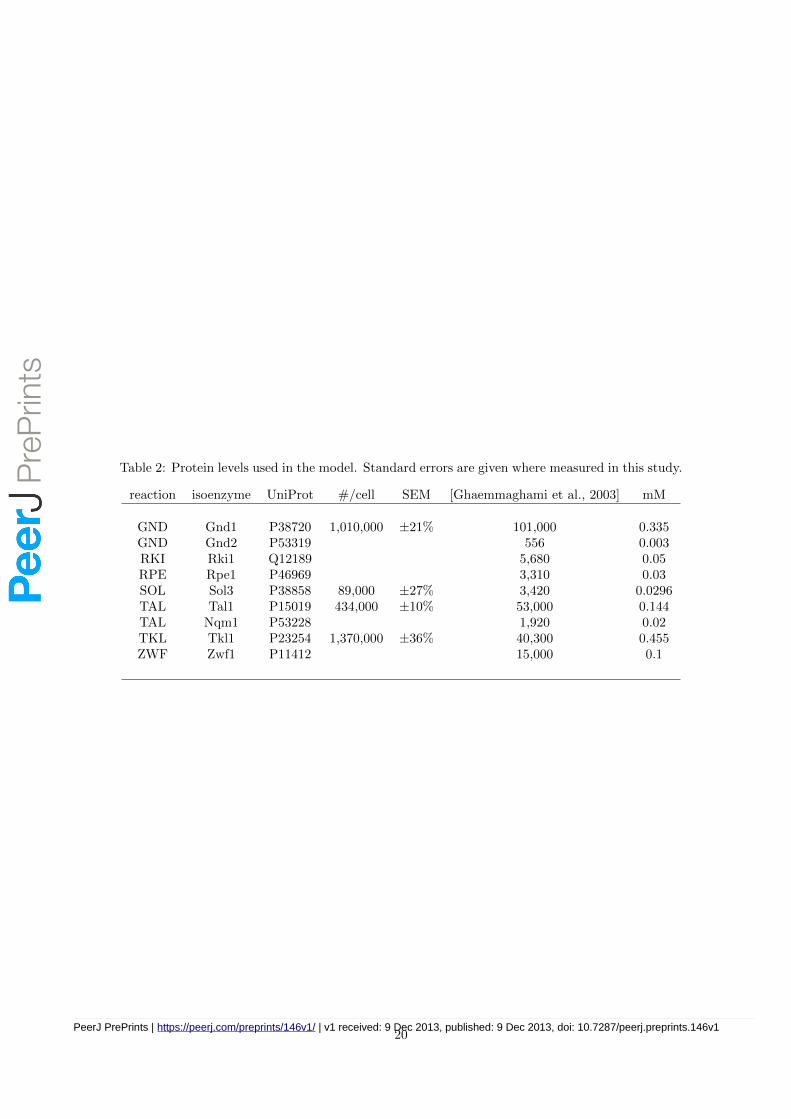
Table 2: Protein levels used in the model. Standard errors are given where measured in this study.
reaction isoenzyme UniProt #/cell SEM [Ghaemmaghami et al., 2003] mM
GND Gnd1 P38720 1,010,000 ±21% 101,000 0.335GND Gnd2 P53319 556 0.003RKI Rki1 Q12189 5,680 0.05RPE Rpe1 P46969 3,310 0.03SOL Sol3 P38858 89,000 ±27% 3,420 0.0296TAL Tal1 P15019 434,000 ±10% 53,000 0.144TAL Nqm1 P53228 1,920 0.02TKL Tkl1 P23254 1,370,000 ±36% 40,300 0.455ZWF Zwf1 P11412 15,000 0.1
20PeerJ PrePrints | https://peerj.com/preprints/146v1/ | v1 received: 9 Dec 2013, published: 9 Dec 2013, doi: 10.7287/peerj.preprints.146v1
PrePrin
ts
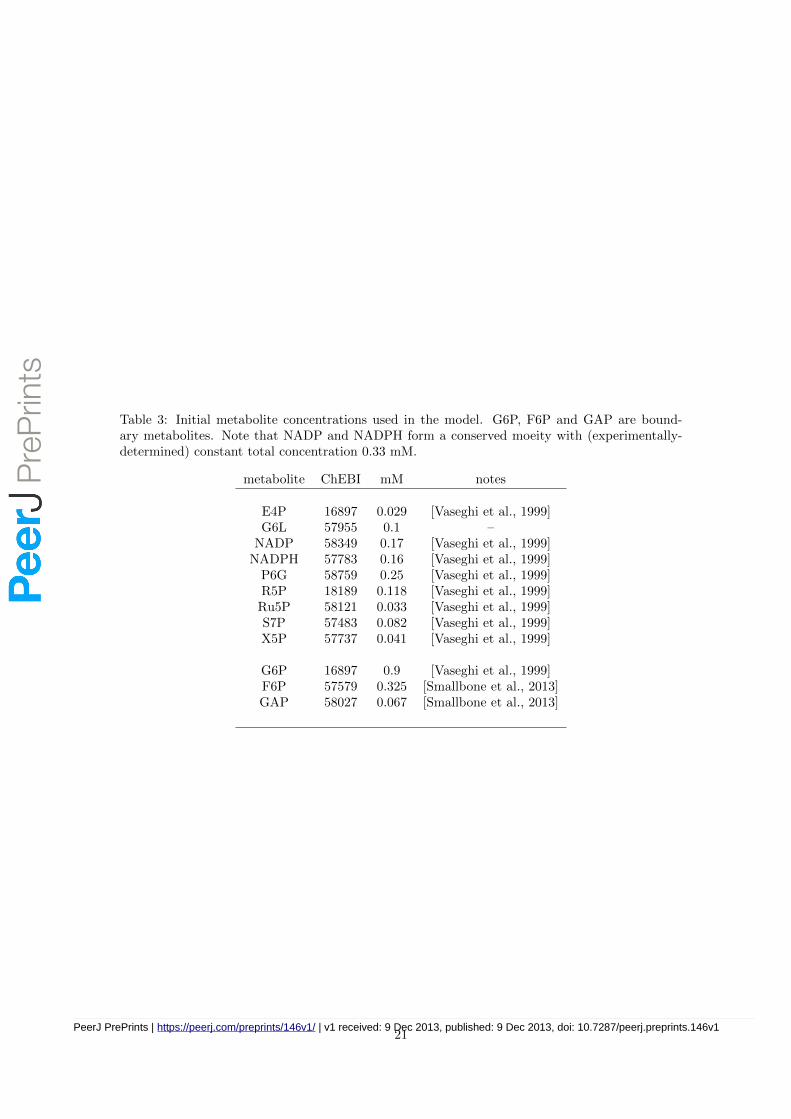
Table 3: Initial metabolite concentrations used in the model. G6P, F6P and GAP are bound-ary metabolites. Note that NADP and NADPH form a conserved moeity with (experimentally-determined) constant total concentration 0.33 mM.
metabolite ChEBI mM notes
E4P 16897 0.029 [Vaseghi et al., 1999]G6L 57955 0.1 –
NADP 58349 0.17 [Vaseghi et al., 1999]NADPH 57783 0.16 [Vaseghi et al., 1999]
P6G 58759 0.25 [Vaseghi et al., 1999]R5P 18189 0.118 [Vaseghi et al., 1999]Ru5P 58121 0.033 [Vaseghi et al., 1999]S7P 57483 0.082 [Vaseghi et al., 1999]X5P 57737 0.041 [Vaseghi et al., 1999]
G6P 16897 0.9 [Vaseghi et al., 1999]F6P 57579 0.325 [Smallbone et al., 2013]GAP 58027 0.067 [Smallbone et al., 2013]
21PeerJ PrePrints | https://peerj.com/preprints/146v1/ | v1 received: 9 Dec 2013, published: 9 Dec 2013, doi: 10.7287/peerj.preprints.146v1
PrePrin
ts
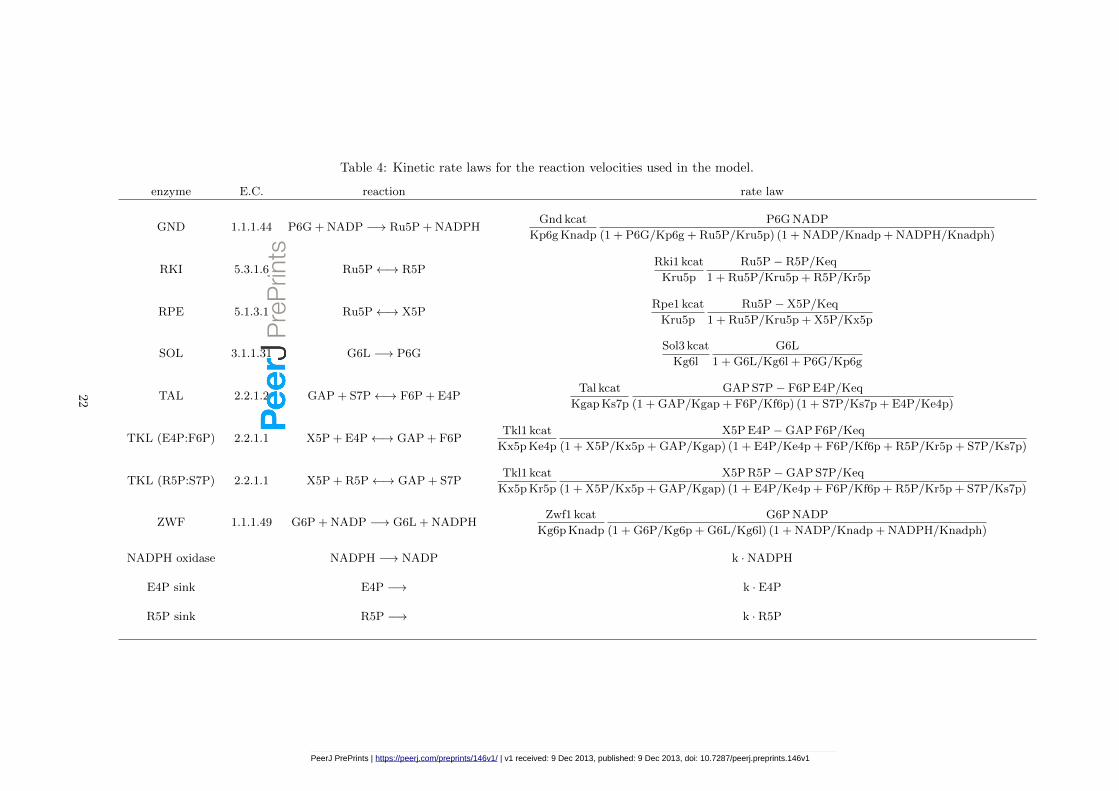
Table 4: Kinetic rate laws for the reaction velocities used in the model.
enzyme E.C. reaction rate law
GND 1.1.1.44 P6G + NADP −→ Ru5P + NADPHGnd kcat
Kp6g Knadp
P6G NADP
(1 + P6G/Kp6g + Ru5P/Kru5p) (1 + NADP/Knadp + NADPH/Knadph)
RKI 5.3.1.6 Ru5P←→ R5PRki1 kcat
Kru5p
Ru5P− R5P/Keq
1 + Ru5P/Kru5p + R5P/Kr5p
RPE 5.1.3.1 Ru5P←→ X5PRpe1 kcat
Kru5p
Ru5P−X5P/Keq
1 + Ru5P/Kru5p + X5P/Kx5p
SOL 3.1.1.31 G6L −→ P6GSol3 kcat
Kg6l
G6L
1 + G6L/Kg6l + P6G/Kp6g
TAL 2.2.1.2 GAP + S7P←→ F6P + E4PTal kcat
Kgap Ks7p
GAP S7P− F6P E4P/Keq
(1 + GAP/Kgap + F6P/Kf6p) (1 + S7P/Ks7p + E4P/Ke4p)
TKL (E4P:F6P) 2.2.1.1 X5P + E4P←→ GAP + F6PTkl1 kcat
Kx5p Ke4p
X5P E4P−GAP F6P/Keq
(1 + X5P/Kx5p + GAP/Kgap) (1 + E4P/Ke4p + F6P/Kf6p + R5P/Kr5p + S7P/Ks7p)
TKL (R5P:S7P) 2.2.1.1 X5P + R5P←→ GAP + S7PTkl1 kcat
Kx5p Kr5p
X5P R5P−GAP S7P/Keq
(1 + X5P/Kx5p + GAP/Kgap) (1 + E4P/Ke4p + F6P/Kf6p + R5P/Kr5p + S7P/Ks7p)
ZWF 1.1.1.49 G6P + NADP −→ G6L + NADPHZwf1 kcat
Kg6p Knadp
G6P NADP
(1 + G6P/Kg6p + G6L/Kg6l) (1 + NADP/Knadp + NADPH/Knadph)
NADPH oxidase NADPH −→ NADP k ·NADPH
E4P sink E4P −→ k · E4P
R5P sink R5P −→ k · R5P
22
PeerJ PrePrints | https://peerj.com/preprints/146v1/ | v1 received: 9 Dec 2013, published: 9 Dec 2013, doi: 10.7287/peerj.preprints.146v1
PrePrin
ts
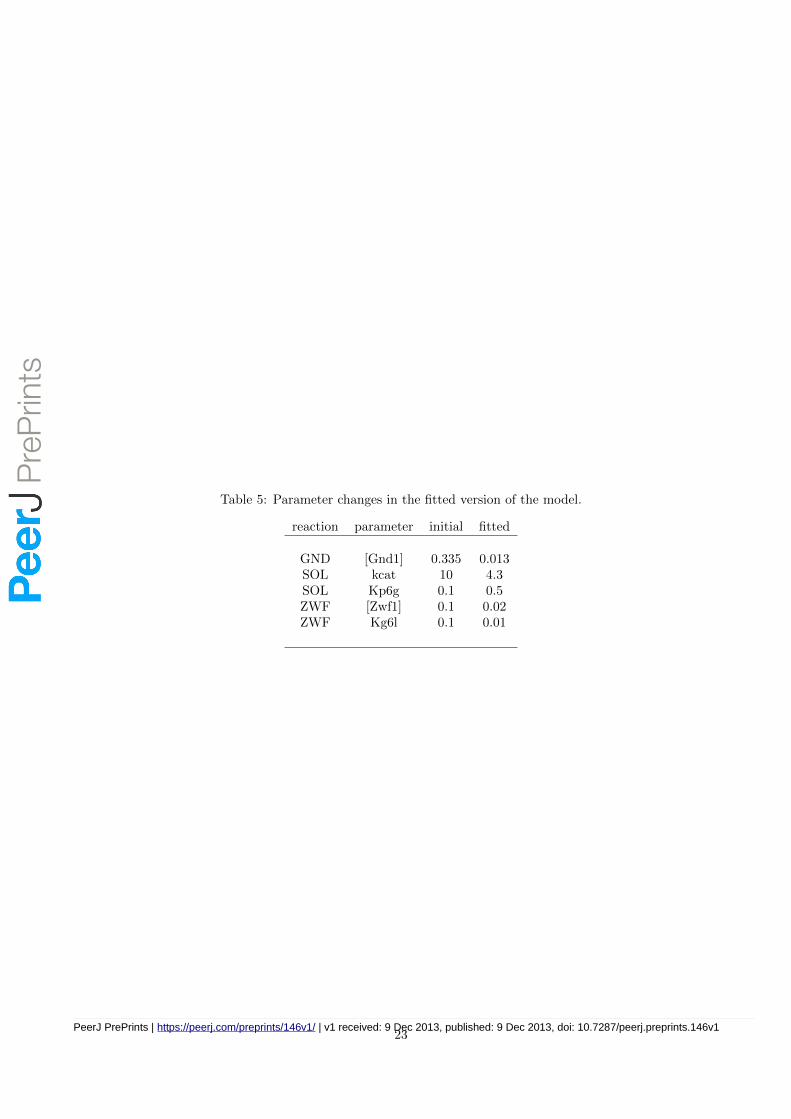
Table 5: Parameter changes in the fitted version of the model.
reaction parameter initial fitted
GND [Gnd1] 0.335 0.013SOL kcat 10 4.3SOL Kp6g 0.1 0.5ZWF [Zwf1] 0.1 0.02ZWF Kg6l 0.1 0.01
23PeerJ PrePrints | https://peerj.com/preprints/146v1/ | v1 received: 9 Dec 2013, published: 9 Dec 2013, doi: 10.7287/peerj.preprints.146v1
PrePrin
ts
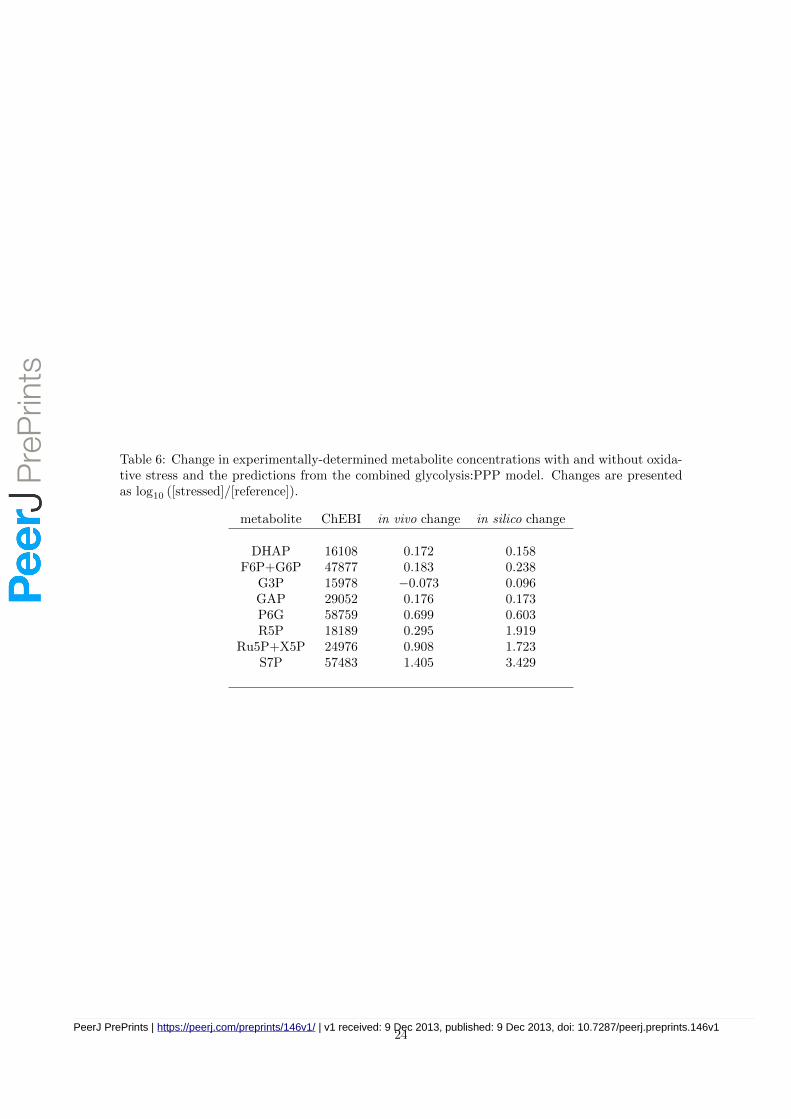
Table 6: Change in experimentally-determined metabolite concentrations with and without oxida-tive stress and the predictions from the combined glycolysis:PPP model. Changes are presentedas log10 ([stressed]/[reference]).
metabolite ChEBI in vivo change in silico change
DHAP 16108 0.172 0.158F6P+G6P 47877 0.183 0.238
G3P 15978 −0.073 0.096GAP 29052 0.176 0.173P6G 58759 0.699 0.603R5P 18189 0.295 1.919
Ru5P+X5P 24976 0.908 1.723S7P 57483 1.405 3.429
24PeerJ PrePrints | https://peerj.com/preprints/146v1/ | v1 received: 9 Dec 2013, published: 9 Dec 2013, doi: 10.7287/peerj.preprints.146v1
PrePrin
ts
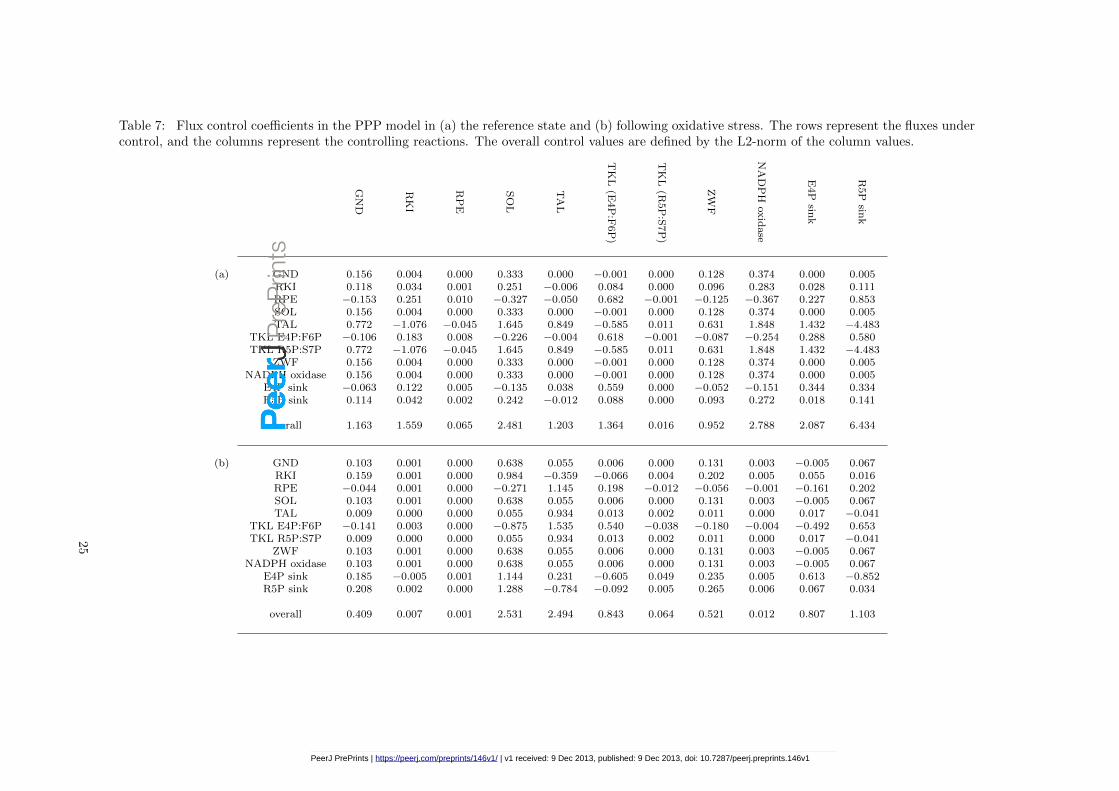
Table 7: Flux control coefficients in the PPP model in (a) the reference state and (b) following oxidative stress. The rows represent the fluxes undercontrol, and the columns represent the controlling reactions. The overall control values are defined by the L2-norm of the column values.
GND
RKI
RPE
SOL
TAL
TKL
(E4P:F6P)
TKL
(R5P:S7P)
ZW
F
NADPH
oxidase
E4P
sink
R5P
sink
(a) GND 0.156 0.004 0.000 0.333 0.000 −0.001 0.000 0.128 0.374 0.000 0.005RKI 0.118 0.034 0.001 0.251 −0.006 0.084 0.000 0.096 0.283 0.028 0.111RPE −0.153 0.251 0.010 −0.327 −0.050 0.682 −0.001 −0.125 −0.367 0.227 0.853SOL 0.156 0.004 0.000 0.333 0.000 −0.001 0.000 0.128 0.374 0.000 0.005TAL 0.772 −1.076 −0.045 1.645 0.849 −0.585 0.011 0.631 1.848 1.432 −4.483
TKL E4P:F6P −0.106 0.183 0.008 −0.226 −0.004 0.618 −0.001 −0.087 −0.254 0.288 0.580TKL R5P:S7P 0.772 −1.076 −0.045 1.645 0.849 −0.585 0.011 0.631 1.848 1.432 −4.483
ZWF 0.156 0.004 0.000 0.333 0.000 −0.001 0.000 0.128 0.374 0.000 0.005NADPH oxidase 0.156 0.004 0.000 0.333 0.000 −0.001 0.000 0.128 0.374 0.000 0.005
E4P sink −0.063 0.122 0.005 −0.135 0.038 0.559 0.000 −0.052 −0.151 0.344 0.334R5P sink 0.114 0.042 0.002 0.242 −0.012 0.088 0.000 0.093 0.272 0.018 0.141
overall 1.163 1.559 0.065 2.481 1.203 1.364 0.016 0.952 2.788 2.087 6.434
(b) GND 0.103 0.001 0.000 0.638 0.055 0.006 0.000 0.131 0.003 −0.005 0.067RKI 0.159 0.001 0.000 0.984 −0.359 −0.066 0.004 0.202 0.005 0.055 0.016RPE −0.044 0.001 0.000 −0.271 1.145 0.198 −0.012 −0.056 −0.001 −0.161 0.202SOL 0.103 0.001 0.000 0.638 0.055 0.006 0.000 0.131 0.003 −0.005 0.067TAL 0.009 0.000 0.000 0.055 0.934 0.013 0.002 0.011 0.000 0.017 −0.041
TKL E4P:F6P −0.141 0.003 0.000 −0.875 1.535 0.540 −0.038 −0.180 −0.004 −0.492 0.653TKL R5P:S7P 0.009 0.000 0.000 0.055 0.934 0.013 0.002 0.011 0.000 0.017 −0.041
ZWF 0.103 0.001 0.000 0.638 0.055 0.006 0.000 0.131 0.003 −0.005 0.067NADPH oxidase 0.103 0.001 0.000 0.638 0.055 0.006 0.000 0.131 0.003 −0.005 0.067
E4P sink 0.185 −0.005 0.001 1.144 0.231 −0.605 0.049 0.235 0.005 0.613 −0.852R5P sink 0.208 0.002 0.000 1.288 −0.784 −0.092 0.005 0.265 0.006 0.067 0.034
overall 0.409 0.007 0.001 2.531 2.494 0.843 0.064 0.521 0.012 0.807 1.103
25
PeerJ PrePrints | https://peerj.com/preprints/146v1/ | v1 received: 9 Dec 2013, published: 9 Dec 2013, doi: 10.7287/peerj.preprints.146v1
PrePrin
ts