Embed Size (px)
Citation preview
TOPIC GUIDE:Agricultural Productivity
Peter Hazell
May 2014

About Evidence on Demand and Professional DevelopmentEvidence on Demand supports the professional development of Climate, Environment,Infrastructure and Livelihoods Advisers at DFID. Technical Competency Frameworks for theadvisory groups guide the support provided. Evidence on Demand also supports cross-cutting ordevelopment competencies which cover areas of technical knowledge and skills needed byadvisers to effectively deploy their core technical skills and knowledge in development policy andoperations.
The Evidence on Demand team is led by a HTSPE Limited and IMC Worldwide Limited JointVenture. Both firms are established development consultancies with considerable experience inmanaging resource centres. The Joint Venture is backed by a core consortium of specialistorganisations. The consortium provides technical support for developing quality assured resources,answering helpdesk enquiries and supporting consultancy services. Please go to the Evidence onDemand website (www.evidenceondemand.info) for further details.
DisclaimerThis Topic Guide has been produced by Evidence on Demand with the assistance of the UKDepartment for International Development (DFID) contracted through the Climate, Environment,Infrastructure and Livelihoods Professional Evidence and Applied Knowledge Services (CEIL PEAKS)programme, jointly managed by HTSPE Limited and IMC Worldwide Limited.
The views expressed in the Topic Guide are entirely those of the authors and do not necessarilyrepresent DFID’s own views or policies, or those of Evidence on Demand. Comments anddiscussion on items related to content and opinion should be addressed to the author, [email protected].
Your feedback helps us ensure the quality and usefulness of all knowledge products. Please [email protected] and let us know whether or not you have found this materialuseful; in what ways it has helped build your knowledge base and informed your work; or how it couldbe improved.
DOI: http://dx.doi.org/10.12774/eod_tg.may2014.hazell
First published May 2014© CROWN COPYRIGHT
i
ContentsAbout Topic Guides....................................................................................................iii
Tips for using Topic Guides........................................................................................iv
Acknowledgements .................................................................................................... v
About the Author ........................................................................................................ v
SECTION 1 ................................................................................................................ 1
Introduction ................................................................................................................ 1
Paper outline .............................................................................................................. 2
SECTION 2 ................................................................................................................ 3
Key concepts for measuring agricultural productivity ................................................. 3
SECTION 3 ................................................................................................................ 5
What is the record on productivity growth? ................................................................ 5
SECTION 4 ................................................................................................................ 7
What drives growth in agricultural productivity growth?.............................................. 7
Sources of new technologies ..................................................................................... 7
Evidence on productivity impacts ............................................................................... 8
Difficulties and robust findings.................................................................................... 9
Adoption of new technologies .................................................................................. 10
Adoption at the community level .............................................................................. 10
Adoption at the farm level......................................................................................... 12
Policies to promote technology adoption.................................................................. 14
SECTION 5 .............................................................................................................. 19
Productivity growth and poverty ............................................................................... 19
Impact pathways ...................................................................................................... 19
Micro-level evidence from within regions of adoption............................................... 20
Indirect impacts and aggregate impacts................................................................... 20
Future challenges..................................................................................................... 22
SECTION 6 .............................................................................................................. 24
Productivity growth and sustainability....................................................................... 24
SECTION 7 .............................................................................................................. 29
Productivity growth in conflict areas ......................................................................... 29
SECTION 8 .............................................................................................................. 31
Summary and future priorities .................................................................................. 31
Summary.................................................................................................................. 31
Future Priorities........................................................................................................ 32
ii
Recommended reading ............................................................................................ 34
References............................................................................................................... 36
List of Boxes
Box 1 Development of English wheat yields.......................................................................... 7Box 2 Common determinants of technology adoption by farmers........................................ 13Box 3 India’s Green Revolution Agenda (Hazell, 2009)....................................................... 14Box 4 Some innovative approaches to addressing adoption constraints for small farms(Hazell, 2010) ..................................................................................................................... 16Box 5 The experience with targeted fertiliser subsidies in Malawi (Chirwa & Dorward, 2013)........................................................................................................................................... 18Box 6 System of rice intensification (SRI) (Hazell, 2008)..................................................... 25Box 7 Integrated pest management (IPM)........................................................................... 26Box 8 Conservation agriculture (World Bank, 2007; Hobbs et al, 2007) .............................. 27
List of Tables
Table 1 Productivity indicators for world agriculture, 1961-2007: average annual growth rateby period (%) (Fuglie, 2010).................................................................................................. 5Table 2 Productivity returns in agriculture from various items of public rural spending,benefit/cost ratios, for India and China (Fan & Rao, 2008) .................................................. 10Table 3 Poverty impacts of agricultural research in India, state-level analysis, 1970-93 (Fanet al, 1999).......................................................................................................................... 21

iii
About Topic Guides
Welcome to the Evidence on Demand series of Topic Guides. The guides are beingproduced for Climate, Environment, Infrastructure and Livelihoods Advisers in the UKDepartment for International Development (DFID). There will be up to 30 Topic Guidesproduced 2013-2014.
The purpose of the Topic Guides is to provide resources to support professionaldevelopment. Each Topic Guide is written by an expert in the field. Topic Guides:
Provide an overview of a topic; Present the issues and arguments relating to a topic; Are illustrated with examples and case studies; Stimulate thinking and questioning; Provide links to current best ‘reads’ in an annotated reading list; Provide signposts to detailed evidence and further information; Provide a glossary of terms for a topic.
Topic Guides are intended to get you started on a subject with which you are not familiar. Ifyou already know about a topic then you may still find it useful to take a look. Authors andeditors of the guides have put together the best of current thinking and the main issues ofdebate.
Topic Guides are, above all, designed to be useful to development professionals. You maywant to get up to speed on a particular topic in preparation for taking up a new position, oryou may want to learn about a topic that has cropped up in your work. Whether you are aDFID Climate, Environment, Infrastructure or Livelihoods Adviser, an adviser in anotherprofessional group, a member of a development agency or non-governmental organisation,a student, or a researcher we hope that you will find Topic Guides useful.

iv
Tips for using Topic Guides
I am going to be under the spotlight. How can a Topic Guide help?
The Topic Guides, and key texts referred to in the guides, cover the latest thinking onsubject areas. If you think that a specific issue might be raised when you are under thespotlight, you can scan a Topic Guide dealing with that issue to get up to speed.
I have just joined as an adviser. Where should I start?
Topic Guides are peer reviewed and formally approved by DFID. They are a good startingpoint for getting an overview of topics that concern DFID. You can opt to be alerted to newTopic Guides posted on the Evidence on Demand website through Facebook, Twitter orLinkedIn. New publications of interest to advisers will also be announced in Evidence onDemand quarterly ebulletins.
I don’t have much time. How long should I set aside for reading a Topic Guide?
The main text of a Topic Guide takes around three hours to read. To get a goodunderstanding of the topic allow up to three hours to get to grips with the main points. Allowadditional time to follow links and read some of the resources.
I need to keep up my professional development. How can Topic Guides helpwith this?
Topic Guides, while providing an overview and making key resources easy to access, arealso meant to be stretching and stimulating. The annotated reading lists point to material thatyou can draw on to get a more in-depth understanding of issues. The Topic Guides can alsobe useful as aides-mémoires because they highlight the key issues in a subject area. Theguides also include a glossary of key words and phrases.
I would like to read items in the reading list. Where can I access them?
Most resources mentioned in the Topic Guides are readily available in the public domain.Where subscriptions to journals or permissions to access to specialist libraries are requiredthese are highlighted.
I have a comment on a guide. How can I provide feedback?
Evidence on Demand is keen to hear your thoughts and impressions on the Topic Guides.Your feedback is very welcome and will be used to improve new and future editions of TopicGuides. There are a number of ways you can provide feedback:
Use the Have Your Say section on the Evidence on Demand website(www.evidenceondemand.info). Here you can email our team with your thoughts on aguide. You can also submit documents that you think may enhance a Topic Guide. Ifyou find Topic Guides useful for your professional development, please share yourexperiences here.
Send an email to the Evidence on Demand Editor [email protected] with your recommendations for other TopicGuides.
v
Acknowledgements
The Topic Guide was coordinated by Yolande Wright (DFID) and Ruth Sparrey (Evidence onDemand) with additional inputs from Alan Tollervey, Ben Cattermoul and Douglas Gollin,Professor of Development Economics, Oxford Department of International Development,University of Oxford.
About the Author
Peter Hazell is an agricultural economist who has devoted more than 40 years of his careerto research and advisory work on policy issues related to agricultural development. From1972 to 2005 he held various research and management positions at the World Bank andthe International Food Policy Research Institute (IFPRI) in Washington, D.C. After returningto the UK he became a Visiting Professor at Imperial College London and a ProfessorialResearch Associate at the School of Oriental and African Studies (SOAS), University ofLondon. Peter currently lives in Santa Barbara, California.
1
SECTION 1Introduction
As the recent world food crisis has demonstrated, meeting the food needs of a growing worldpopulation, projected to reach over 9 billion people by 2050, is going to be a challenge. Thechallenge is especially daunting for many African and South Asian countries that face thehighest population growth rates and which already have some of the severest per capitaland constraints.
There are two ways to increase agricultural production. One is to use more inputs, like land,labour, water and fertiliser. The other is to adopt improved technologies and managementpractices that raise the productivity of the inputs that are used. For example, improved cropvarieties can improve the yield response to fertilisers, improved water management practicescan provide greater output per drop of water, and machines can increase the amount of workthat a labourer can complete in a day. People have relied on the first source of growth – useof more inputs – for most of history, and this is still possible in some land-abundant countriesin Africa and Latin America. However, most countries are already using all their availableland and water, and they use other inputs to the point where additional application is notwidely profitable. To meet the growing demand for food, substantial increases in theproductivity of the inputs that are already used in agriculture will be required.
Raising productivity is also important for farmers. For commercial farmers this enables themto compete better in the market on cost and quality, and to increase their incomes. Forsubsistence-orientated farmers, this is how they can grow more food for their ownconsumption from their limited bundle of resources. Raising agricultural productivity alsomakes important contributions to a country’s development. It enables a greater supply offood and other raw materials to be produced at lower unit costs, frees up labour for use inother production sectors, and saves on food imports. A dynamic farm sector also providesstrong demand linkages to the non-farm sector, including agro-industry.
Not all ways of increasing agricultural productivity are equally good. Given the huge diversityof farming conditions that exists, improved technologies and farming practices must beselected and adapted to local conditions. Even then, they may lead to very different social,economic and environmental outcomes, even for comparable levels of increase inagricultural production. Not only must agricultural production be increased, but thecontemporary development agenda calls for this to be done in ways that are environmentallysustainable, that contribute to reducing poverty, food insecurity and malnutrition, that createproductive employment, that empower women, and that lead to more climate resilient farmand rural economies. All this is to be achieved whilst obtaining rates of return to publicinvestments in agriculture that are competitive with investments in other sectors.
The means by which improved technologies and farming practices are developed anddisseminated also vary, some being more readily provided by private sector firms (e.g. seedand engineering firms), whereas others depend more on the public sector (e.g. access totechnology and markets via rural roads). Public policy also plays an important role in guidingtechnology discovery and adoption processes (e.g. through public funding and laws aboutintellectual property rights), and helps determine whether farmers will find it attractive toadopt technologies and farming practices that are win-win in terms of their desired social,economic and environmental outcomes. Public interventions are especially important forraising the productivity of poor farmers and women farmers.

2
Paper outline
This Topic Guide provides an overview of the ways in which agricultural productivity hasbeen successfully raised in developing countries, and of the social, economic andenvironmental consequences. It draws on the available evidence base, and highlights areaswhere important knowledge gaps still remain.
The Topic Guide begins in Section 2 by defining key concepts and measurementapproaches related to agricultural productivity, then in Section 3 provides a global review ofpast patterns of production growth and the contributions of productivity growth. Section 4explores the sources of productivity growth, including the role of agricultural research indeveloping new technologies and management practices, and the social and economicconstraints that may prevent their widespread adoption. Section 5 reviews the evidence onhow improved technologies impact on the poor, both within the areas where the technologiesare adopted and through spillover benefits or costs that may affect wider populations.Section 6 examines the impact of new technologies and farming practices on theenvironment, while section 7 addresses the specific problem of restoring prior levels ofagricultural productivity in conflict areas. Throughout, special attention is given to theimplications for women and poor farmers, and the types of policies that can facilitate betterproductivity, economic, social and environmental outcomes. Section 8 provides someconcluding comments.
3
SECTION 2Key concepts for measuring agricultural
productivity
The most commonly used measures of agricultural productivity are partial measures thatcapture the returns to individual inputs. For example, yield (output/land area), is a measureof the average productivity of land. Average labour productivity (output/number workers) is agood proxy for per capita agricultural income and, at low levels, also correlates negativelywith poverty.
Although useful, partial measures of productivity are not reliable measures of economicefficiency because they do not take account of the use of other inputs or their costs. Forexample, land productivity can be increased by applying more labour, and this may lead tolower labour productivity. In areas with surplus land, labour productivity can be increased byfarming more land, but land productivity may remain stagnant or even fall if the expansion isonto more marginal land. Moreover, both land and labour productivity are affected by the useof other farm inputs like fertilisers and tractors, which have their own economic costs.
A better measure of economic efficiency is total factor productivity (TFP), sometimesreferred to as multifactor productivity. This is calculated as the ratio of total output to totalinput, and measures the average productivity of all the inputs used. All inputs need to beincluded, otherwise the measure of TFP obtained will be biased upwards by the returns tomissing inputs.
Measuring partial measures of productivity for the same crop or livestock is relatively easy,given there is a single output and a single input which can be measured in quantity or valueterms. However, when the outputs of different crops and livestock have to be aggregatedthese then need to be added in value terms, which requires the selection of suitable priceindices. The challenge is even greater when measuring TFP, since not only the value ofoutputs but also that of all the inputs has to be valued and added. The methods used inthese calculations, especially the choice of indices, have an important bearing on the results,and have been discussed at length in the economics literature (Alston et al, 1998, provide acomprehensive discussion).
Increases in agricultural productivity, especially TFP, not only increase the returns to existinginputs, but also prevent diminishing returns from setting in when additional inputs are used toincrease production. Diminishing returns imply that the cost of producing a unit of output(e.g. a kilogram of rice) increases, making agricultural products, including food, moreexpensive to produce.
Increases in factor productivity can arise in two ways. One is from improved technologiesthat shift the production function upwards (i.e. give more output for the same level of inputs).New crop varieties, for example, may give higher yields than older varieties, even when inputuse is held constant. The other way to raise productivity arises when farmers are not fullyexploiting the potential of their current technologies. For example, their managementpractices may be sub-optimal, and adoption of improved practices might lead to greateroutput even with the same or lower levels of input use. This source of productivity gain iscalled an ‘efficiency’ gain in the literature. One example of this potential efficiency gain is the
4
observed difference between the yields of ‘best’ farmers versus the average farmeroperating under similar conditions.
Some technology shifts are biased towards increasing the productivity of some inputs morethan others, e.g. improved seeds improve the productivity of land more than that of labour,while mechanisation improves the productivity of labour more than that of land. Some shiftsare more neutral and increase the productivity of several inputs at the same time, e.g.irrigation. According to the ‘induced innovation’ theory, these input biases are important indetermining the types of technologies that are appropriate for different economic situations.For example, land-scarce countries with abundant labour will tend to adopt technologies thatare biased towards raising land productivity, while countries with plenty of land relative tolabour will tend to adopt technologies biased towards raising labour productivity. Thesepatterns have been amply demonstrated through studies of agricultural productivity growthover time for different types of countries – the classic study is Hayami and Ruttan (1971;1985). Similar patterns are found in the more recent ‘directed technology change’ literature(Acemoglu, 2002). Highly similar arguments hold for individual farms.

5
SECTION 3What is the record on productivity growth?
At the global level, agricultural production has grown much faster than the population inrecent decades, leading to a steady increase in per capita agricultural output (includingfood). In a dramatic break with historical patterns, expansion of the total cropped area inmost parts of the world has played a remarkably small role in increasing agriculturalproduction since the Second World War, to the point that growth in the global extent ofcropland has virtually stagnated since the 1960s (Hazell & Wood, 2008).
As a result of this unprecedented growth in land productivity, the world now produces morethan enough food to feed the entire population to minimum UN standards if it weredistributed more equitably. Even more remarkably, this surplus has been achieved despitethe diversion of considerable land, labour and other rural resources to the production ofhigher-value foods (meat, milk, fruits, vegetables, etc.) to meet the changing food demandsof growing, more urbanised, and more affluent populations. This includes the additionalcereals and oil crops needed as feed grains in intensive livestock systems and inlandaquaculture, and for biofuels production.
This favourable global perspective masks some important regional variation. While mostparts of the developing world have successfully and continuously increased their agriculturaloutput per capita since the 1960s, sub-Saharan Africa has experienced stagnant, evendeclining per capita output (ibid).
What is less certain is how much of this global increase in land productivity can be attributedto productivity growth, and how much can be attributed to greater use of inputs other thanland. Also, within productivity growth, how much can be attributed to technologies that haveshifted the production frontier, and how much to efficiency gains from improved managementpractices? These issues have been probed at some length in the literature using variousmeasures of productivity.
A good example is a study by Fuglie (2010) who analysed the growth in the productivity ofworld agriculture over the period 1961-2007. He defined total inputs to include land andstructures, labour, livestock and feed, machinery and energy, and chemicals and seeds.Table 1 shows the key results.
Period Output Inputs TFP Outputper
worker
Outputper
hectare
Grainyield perhectare
1961-1969 2.81 2.31 0.49 0.96 2.39 2.841970-1989 2.18 1.40 0.77 1.22 1.97 2.311990-2007 2.04 0.59 1.45 1.40 1.90 1.351961-2007 2.23 1.24 0.99 1.25 2.01 2.02
Table 1 Productivity indicators for world agriculture, 1961-2007: average annual growth rate byperiod (%) (Fuglie, 2010)
Output grew by 2.23% per annum on average over the entire 1961-2007 period, and thiswas achieved through a 1.24% per annum growth in total inputs and a 0.99% per annumgrowth in TFP, i.e. productivity growth accounted for 45% of the total growth in output, while

6
the increased use of inputs including land accounted for 55%. Looking at sub-periods, outputgrowth slowed progressively from 2.81% per annum during 1961-69, to 2.18% per annumduring 1970-89, then to 2.04% per annum during 1990-2007. This slowdown was driven by asharp and consistent drop in the growth of total inputs used in agriculture; the slowdownwould have been even greater had there not also been a progressive growth in TFP. During1990-2007, TFP growth accounted for 71% of the growth in output, compared to 17% during1961-69. This clearly illustrates the increasing dependence of the global food supply ongains in agricultural productivity.
The partial measures of productivity reported in Table 1 show that labour productivityimproved over the entire period, whereas land productivity fell. The technical changesunderlying the growth in TFP were seemingly biased towards labour rather than land.
These kinds of results are not always robust, and by comparing results from alternativeestimates with the same data sets (Rezek et al, 2011; Headey et al, 2010), one finds thatresults are sensitive to the length of the time series used, the sample of countries included,and the technique used in calculating and decomposing TFP growth. More robust resultstend to hold for aggregates of countries rather than individual countries, and for long ratherthan short time periods.
7
SECTION 4What drives growth in agricultural productivity
growth?
The primary driver of productivity growth is new technologies and better ways of doingthings, so understanding the sources and diffusion of new technologies and knowledge isfundamental. However, new technologies and knowledge only make a difference when theyare adopted by farmers and rural communities; therefore, understanding the conditionsunder which adoption occurs is also crucial.
Sources of new technologies
There are multiple sources of new technologies and knowledge. Indigenous knowledge andfarmer experimentation have historically been an important source of technological change,and accounted for slow but steady increases in productivity over generations. However, themore dramatic breakthroughs that were needed to keep pace with rapidly growing andurbanising populations have come from the application of modern science by agriculturalresearch organisations. The development of English wheat yields is typical of what hashappened in many agricultural systems around the world (see Box 1). This has led to aconstant stream of new technologies that has enabled sustained and unprecedented rates ofgrowth in agricultural productivity over the past 75 years.
Box 1 Development of English wheat yields
Between 1300 and 1700, English wheat yields increased by 50% as a result of farmerinnovations, but were still only about 0.5 t/ha in 1700 (Grigg, 1984). They began toaccelerate a little thereafter, driven by such developments as: Jethro Tull’s seed drill which,by planting the crop in straight rows, permitted inter-row tillage; the Rotherham mould boardplough, which permitted complete inversion of the soil and better weed control; theincorporation of legumes and livestock into improved rotations; the first development ofartificial fertilisers in the 1840s (Deane, 1965).
By the 1850s, average wheat yields had risen to 1.1 t/ha, and to 2 t/ha by 1909-1913, aperiod which saw the more widespread adoption of artificial fertilisers. They remainedrelatively static until the late 1930s, after which they increased exponentially, fuelled bymodern plant breeding, improved agronomy, and the development of improved inorganicfertilisers and modern pesticides. By the 1980s, average wheat yields had reached nearly 6t/ha. Thus in the space of 40 years, wheat yields increased by 3.1 t/ha, or by more than theincrease achieved in the whole of the preceding six and one-half centuries. Today Englishwheat yields average 7.7 t/ha.
The private sector has long been involved in developing modern inputs such as machines,fertilisers, pesticides, and hybrid seeds that can be sold to farmers on a repeat basis.However, many of the technologies and improved husbandry practices needed fromagricultural research cannot be privatised in this way, and hence have had to be developedby public sector institutions. Recent developments in intellectual property rights andbiosciences have enabled the private sector to increase the range of proprietary products itcan produce, and hence increase its role in agricultural research. It now accounts for about

8
20% of global research and development (R&D) spending, but is mainly concentrated in theOECD countries, Brazil, China, and India (ASTI, 2012).
In 2008, developing countries spent US$15.6 billion (in inflation-adjusted, purchasing powerparity (PPP) dollars) on public agricultural research, compared to US$16.1 billion indeveloped countries. Three developing countries (Brazil, China and India) accounted for halfof the total developing country public spending, while sub-Saharan Africa accounted for ameagre 5% (ibid). Another US$500 million was spent on international agricultural researchconducted by the international research centres of the Consultative Group on InternationalAgricultural Research (CGIAR).
Evidence on productivity impacts
Public investments in research of these magnitudes have led to a host of studies todetermine whether the investments are worthwhile from a productivity perspective.
Difficulties arise in measuring productivity impacts because of selectivity biases that makedirect comparison of adopters with non-adopters suspect, of partial adoption that requiresplot-level rather than household-level data, of weather variability that requires time-seriesdata, and of more generally simply collecting reliable quantitative data on yields at the plot orfarm level.
In many cases there are problems defining what the technology ‘treatment’ (in evaluationparlance) actually comprises. Unlike single-dimensioned treatments in, say, drug-evaluationtrials, farmers typically face multi-dimensioned choices about combining differentcomponents of a technology package (e.g. seeds, fertiliser, and planting dates anddensities) and may (or are even encouraged to) adapt the package to their own farm-levelconditions. Lack of a standard package then makes evaluations much more difficult. A goodexample is the adoption of key components of the System of Rice Intensification (SRI)described in (see Box 6). Moreover, some technologies are not expected to raise yieldsevery year, but only reduce pest or drought damage in bad years; this can be difficult toobserve on any planned basis.
New methods such as randomised trials and econometric ways of pairing adopting and non-adopting farms are helping to bring greater rigour to research, especially in controlling forselectivity biases. However, they are expensive and difficult to scale up, and do not solvemany of the problems listed above. A substantial body of secondary or circumstantialevidence should not be ignored, such as available results from on-research stations and on-farm trials, and from direct elicitation from farmers about perceived yield differences under arange of weather conditions.
These problems notwithstanding, evidence from the Green Revolution era is prettyconclusive on linking R&D to increases in land productivity. Even though the increased useof irrigation and fertiliser was important in explaining yield growth, the release of high-yielding crop varieties that responded well to favourable growing environments led to muchlarger total impacts on yields. In a definitive study, Evenson and Gollin (2003) provide acomprehensive analysis of the global evidence on the impact of crop-genetic improvementover the period 1965-1998 for all the major food staple crops. They also break downCGIAR’s contributions and find very large impacts, especially for rice, wheat and maize.
In another study covering much the same period, Alston et al (2000) undertook a widelycited meta-analysis of 1,852 published project evaluations reporting rates of return toresearch investments. They found that the average annual rate of return was 65%, but thatthere was considerable variation across studies with a range of -100% to 910%. The
9
average rate of return was higher for developed (98%) than developing countries (60%). Itwas also higher for Asia (78%) than for sub-Saharan Africa (50%), and for Latin America andthe Caribbean (53%). In a recent update of this study, Rao, Hurley and Pardey (2012)expand the set of evaluations to 2,186, published between 1958-2011. The average annualrate of return was found to be 74.3%, with a median value of 43% and a range of -47.5% toan incredible 5,645% per year.
There are questions about whether these estimates are biased upwards because onlyevaluations from more successful projects might have been undertaken and published.Moreover, there are problems in the way internal rates of return are calculated for R&Dprojects that have long gestation periods; when these problems are corrected, the estimatedrates of return can be substantially less, though still attractive (ibid).
Other more recent evidence from CGIAR impact studies is assessed by Renkow andByerlee (2010). While the impacts are not as dramatic in scale as those in earlier periods,there are several rigorous studies showing favourable impacts on productivity.
Difficulties and robust findings
One difficulty of relying on project-level studies is that only successfully completed studiesare likely to be assessed. Research is inherently a risky venture, many research investmentsmay have failed or not been completed, and the cost of these investments really ought to beincluded. One way this is done is through studies that evaluate the impact of entire researchportfolios, such as the total public spending on agricultural research by a nationalgovernment. These studies invariably use time-series data and econometric methods toestimate changes in TFP in agriculture and to measure the contributions to change ofvarious driving factors, including spending on agricultural R&D. Analysts must contend with anumber of statistical problems (e.g. interdependencies between explanatory and dependentvariables, high correlations between variables over time, missing explanatory variables, andpossible lag structures). In addition, the ability to make appropriate adjustments to avoidmisleading results is constrained by the scope and quality of the available data set. Despitethese limitations, a few robust findings seem to stand out from across studies.
The first finding is that aggregate research spending does seem to yield consistently highreturns. Evenson et al (1999) identified 10 ex post studies of the returns to aggregateresearch programmes in South Asia. Despite some differences in methods of analysis andtime periods covered, all the studies show internal rates of return to research ranging from36% to 143%, much higher than any reasonable discount rate. In a much-cited but possiblyless reliable study (because it has limited time-series observations), Thirtle et al (2003)estimate the rate of return to total R&D spending in 44 countries and calculate weightedaverages by continent. They obtain a rate of return of 22% for Africa (north and sub-SaharanAfrica), 31% for Asia, but -6% for Latin America. The negative return for Latin America isattributable to Brazil, which dominates the weighted average and has a -6% return.1
In a similar type of study, Fan and colleagues at the International Food Policy ResearchInstitute (IFPRI) obtained benefit/cost ratios for different items of public rural spending,including agricultural R&D, in India and China (Fan & Rao, 2008). Agricultural R&D spendinghas large benefit/cost ratios in both countries, and dominates all other forms of publicspending in rural areas (see Table 2).
1The authors attribute the negative result for Latin America to the fact that large countries likeBrazil have reached a stage in their economic development where yield-increasinginnovations are no longer such a driving force in their development process, and thatshedding labour to other sectors is more important for productivity growth.

10
Expenditure variable India1970-93
China1970-97
R&D 13.45 6.75Irrigation 1.36 1.45Roads 5.31 1.69Education 1.39 2.17Power 0.26 0.82Soil & water 0.96 NIRural development 1.09 NIHealth 0.84 NIRural telephone NI 1.63Note: NI means not included
Table 2 Productivity returns in agriculture from various items of public rural spending,benefit/cost ratios, for India and China (Fan & Rao, 2008)
Another consistent finding from studies is the long lead times that arise between thelaunching of new agricultural research projects and their eventual impacts in farmers’ fields.These lead times can be as long as 10-20 years for some types of crop and livestockimprovement research (Alston et al, 2000), but can be much shorter for applied research onimproved farming practices. Investments in agricultural research may have powerfulproductivity impacts, but many are not quick fixes and need to be planned well ahead.Spending on them also needs to be sustained over their full life cycles.
Adoption of new technologies
What drives the uptake of new technologies and knowledge? Some technologies can beadopted by individual farmers (e.g. new seeds), but some need to be taken up in a collectiveway by groups of farmers or even whole communities (e.g. surface irrigation and watersheddevelopment, and the improvement of communal forests and grazing areas).
Adoption at the community level
Population pressure on a fixed land base has proven an important driver of technologyadoption at community and regional levels. There are two contrasting schools of thoughtabout this relationship. Malthus, writing in 18th century England, observed that populationgrowth led to expansion of the cropped area into ever more marginal lands, resulting indeclining labour productivity and per capita output. He postulated that this process ofimpoverishment would continue until per capita output declined to subsistence levels, belowwhich population growth was unsustainable. Malthus assumed that there would be littletechnological change in farming, hence little increase in productivity.
In a contrasting and more optimistic view, Boserup (1965) argues that, as populationpressure grows and labour becomes less costly relative to land, a process of ‘inducedinnovation’ occurs whereby communities invest in agricultural intensification and in improvingtheir natural resources. For example, in many Asian societies, growing population pressurehas led to labour-intensive investments in the terracing and levelling of cropland, to theconstruction of elaborate irrigation systems, and to the use of composting and manures.
The induced innovation theory predicts increases in agricultural output and land productivity,enabling growing populations to feed themselves. However, it does not necessarily predictthat output per worker (or average labour productivity) will also increase. This will depend onthe speed and type of the induced technological change. If average output per workercontinues to decline, the induced innovation model can also lead to the same state of
11
impoverishment predicted by Malthus – it will just take longer to get there. Geertz (1963)documented such a process in Java and coined the term ‘agricultural involution’. Moreover, iftechnological change can raise labour productivity even as more workers are absorbed intothe system, then per capita incomes will rise on average, and a process of sustainableeconomic development may be launched.
The empirical evidence on these issues is mixed. A much-cited study of Machakos district inthe Kenyan highlands with the provocative title More People, Less Erosion (Tiffen et al,1994) provided a striking example of induced innovation and raised hopes within thedevelopment community about the prospects for many degraded and impoverished regions.However, there are reasons to believe that Machakos owes much of its success to afavourable location with easy access to markets and non-farm jobs in Nairobi.
Community surveys conducted by IFPRI researchers in poor hillside areas in Ethiopia,Uganda, and Honduras found weak or negative relationships between population densityand agricultural productivity (Pender et al, 2001; 2006). According to this research, the keyto successful community pathways out of poverty lies with improved access tomarkets, especially for higher-value products, and access to new technologies thatcan increase land and labour productivity faster than population growth. Goldman andSmith (1995) also conclude that market access is far more important than population growthin driving patterns of intensification, based on studies in Nigeria and India.
Communities vary widely in their ability to organise and sustain effective collective action –whether it be managing community-owned resources or adopting community-leveltechnologies. This has led to a body of research trying to understand the determinants of thisvariation. Over a lifetime of research, Nobel Laureate Elinor Ostrom has shown that successis conditioned on a range of physical, social, and institutional factors. On the other hand,attempts by governments to manage collective action themselves by nationalising forestsand rangelands, and through top-down watershed development programmes (e.g. India),have met with limited success. The more recent trend has been towards greaterdevolution of the management (if not the ownership) of common properties to localcommunities, and the empowerment of local institutions to manage them.
There has been a veritable explosion in the formation of community-based organisations inrecent years, driven largely by environmental- and development-orientated non-governmental organisations (NGOs) that have become active at the grassroots level.Community organisations have also been promoted by some donors, such as theInternational Fund for Agricultural Development (IFAD) and the World Bank, as a way offunnelling investment resources directly to local communities which can invest in micro-projects of their own choice (Binswanger-Mkhizi et al, 2010).
The primary evidence base for drawing conclusions about the effectiveness of communityorganisations is comparative studies. These are mostly qualitative studies and, while theyprovide a lot of depth about what is happening within communities, they lack rigour inmaking comparisons across communities. At best, one finds studies, such as the IFPRIstudy based on a survey of a large number of communities in Ethiopia, Uganda, andHonduras (Pender et al, 2001; 2006), that use regression analysis to explain the differencebetween villages; however, they are limited by difficulties in capturing relevant explanatoryvariables. The ideal study would be based on in-depth studies of large numbers ofcommunities over time, but such data sets rarely exist.
Nevertheless, several useful insights have emerged. One is that community organisationsare more likely to succeed when all the key stakeholders are involved. In some cases,involving only one group of farmers within the community may be necessary – as, forexample, in contouring part of the landscape. In other cases, a whole village may need to be
12
involved, as in watershed development projects. Sometimes it will be necessary to embraceseveral villages, for example in the management of open rangelands which may be sharedby a number of local communities or even distant tribes.
Another finding is that, to avoid the capture of benefits by community elites and to be able toresolve local disputes, broad representation is needed in the governance of communityorganisations (Uphoff, 2001). This is particularly important if poor and women farmers are tobe empowered within such organisations (Meinzen-Dick et al, 2011).
The start up and early development of local organisations can be particularly fraughtbecause of a lack of leadership and technical and administrative skills in the community.There is some evidence that technical training and leadership support from outside agencieslike NGOs can be crucial in the early stages of organisational development; however, thisneeds to be undertaken with an exit strategy in mind.
Adoption at the farm level
There is typically a lot of diversity in farm-level adoption decisions. Typically there are leadfarmers who take the plunge, and then others follow when they have observed a favourableoutcome. There are also many constraints to adoption, particularly in the short term, andwhich impact differently on individual farmers.
Adoption rates for a region typically follow an ‘S’ shaped growth curve over time, starting offslowly with a few innovators, then accelerating as more and more farmers join in, and thenslowing again as only those who are unlikely to adopt remain. The speed of adoption and thefinal rate of adoption achieved (sometimes called the ceiling rate of adoption) depend to alarge degree on the agro-climatic suitability of the technology and its level of profitability. Thehigh-yielding rice varieties of the Green Revolution spread very quickly across Asia, from 0%of the rice area in 1965 to 40% by 1980, and about 80% by 2000. The adoption of the high-yielding wheat varieties was even faster, reaching about 90% of the wheat area by 2000(Gollin et al, 2005). On the other hand, the adoption of improved crop varieties has beenmuch slower and less complete in Africa (Evenson & Gollin, 2003), as has the adoption ofmany improved natural resource-management practices around the world.
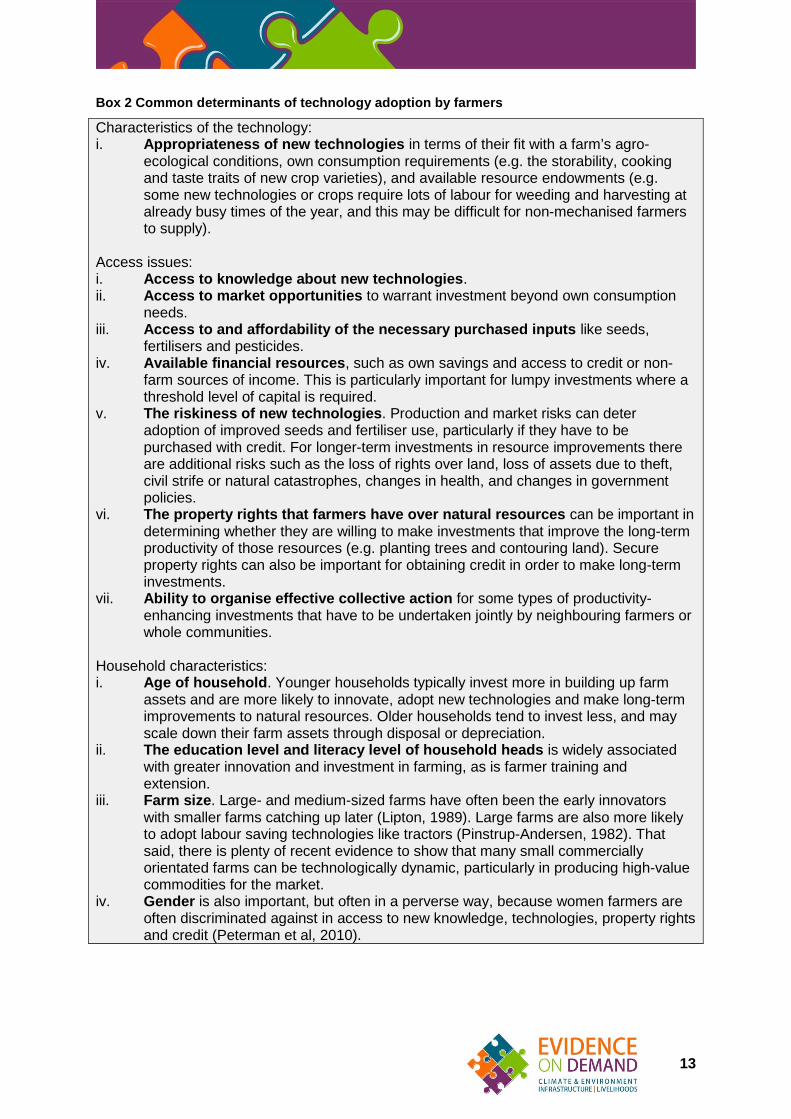
Given the importance of adoption to the success of agricultural R&D, a huge number ofstudies have been carried out on the determinants of technology adoption among farmingpopulations (for reviews see Adato & Meinzen-Dick, 2007; Doss, 2006; Feder et al, 1985;Jack, 2013; Lipton, 1989). Drawing on a large body of empirical studies, these haveidentified a number of frequently occurring factors that correlate with adoption rates (theseare listed in Box 2).
13
Box 2 Common determinants of technology adoption by farmers
Characteristics of the technology:i. Appropriateness of new technologies in terms of their fit with a farm’s agro-
ecological conditions, own consumption requirements (e.g. the storability, cookingand taste traits of new crop varieties), and available resource endowments (e.g.some new technologies or crops require lots of labour for weeding and harvesting atalready busy times of the year, and this may be difficult for non-mechanised farmersto supply).
Access issues:i. Access to knowledge about new technologies.ii. Access to market opportunities to warrant investment beyond own consumption
needs.iii. Access to and affordability of the necessary purchased inputs like seeds,
fertilisers and pesticides.iv. Available financial resources, such as own savings and access to credit or non-
farm sources of income. This is particularly important for lumpy investments where athreshold level of capital is required.
v. The riskiness of new technologies. Production and market risks can deteradoption of improved seeds and fertiliser use, particularly if they have to bepurchased with credit. For longer-term investments in resource improvements thereare additional risks such as the loss of rights over land, loss of assets due to theft,civil strife or natural catastrophes, changes in health, and changes in governmentpolicies.
vi. The property rights that farmers have over natural resources can be important indetermining whether they are willing to make investments that improve the long-termproductivity of those resources (e.g. planting trees and contouring land). Secureproperty rights can also be important for obtaining credit in order to make long-terminvestments.
vii. Ability to organise effective collective action for some types of productivity-enhancing investments that have to be undertaken jointly by neighbouring farmers orwhole communities.
Household characteristics:i. Age of household. Younger households typically invest more in building up farm
assets and are more likely to innovate, adopt new technologies and make long-termimprovements to natural resources. Older households tend to invest less, and mayscale down their farm assets through disposal or depreciation.
ii. The education level and literacy level of household heads is widely associatedwith greater innovation and investment in farming, as is farmer training andextension.
iii. Farm size. Large- and medium-sized farms have often been the early innovatorswith smaller farms catching up later (Lipton, 1989). Large farms are also more likelyto adopt labour saving technologies like tractors (Pinstrup-Andersen, 1982). Thatsaid, there is plenty of recent evidence to show that many small commerciallyorientated farms can be technologically dynamic, particularly in producing high-valuecommodities for the market.
iv. Gender is also important, but often in a perverse way, because women farmers areoften discriminated against in access to new knowledge, technologies, property rightsand credit (Peterman et al, 2010).
14
Many of these factors are particularly constraining for women and poor farmers. They areoften the least likely to have access to information about new technologies, modern inputs,credit, secure land rights, and mechanisation. Based on a review of 24 empirical studies(mostly from Africa), Peterman et al (ibid) conclude that, given equal access, there is nosignificant difference between adoption rates of modern technologies and inputs for men andwomen farmers. Hence, for productivity as well as equity reasons, there is a strong case forimproving women’s access to the key requisites for technology adoption (Quisumbing,1995). Udry et al (1995) estimate that for Sub-Saharan Africa (SSA), agricultural productioncould increase by between 10% and 20% if women had equal access, a very significant‘gender dividend’.
Policies to promote technology adoption
Many constraints to technology adoption reflect underlying market failures that lead to sub-optimal levels of technology uptake and productivity growth from an aggregate economicperspective (Jack, 2013). Market failures also make it harder for many poor farmers andwomen farmers to adopt, constraining the potential of agricultural R&D investments tocontribute to social and environmental goals (such as reducing poverty and landdegradation, and achieving gender equity). For these reasons, most countries have longintervened to promote the development and adoption of productivity-enhancing technologiesin agriculture.
During the Green Revolution era, many governments used a top-down approach thatincluded public provision of agricultural research and extension, shoring up farm creditsystems, subsidising and distributing key inputs (especially fertiliser, power, and water), andintervening in markets to ensure farmers received adequate prices each year to make newtechnologies profitable. Box 3 describes the Indian experience in promoting the GreenRevolution.
Research by Dorward and colleagues at the School of Oriental and African Studies hasshown that these kinds of interventions can be quite effective at early stages of agrariandevelopment. In these stages, value chains are still poorly developed, and the demand forkey inputs like improved seeds and fertilisers is still too low and spatially thin for privatedelivery systems to work adequately (Dorward et al, 2005; 2009). However, as value chainsdevelop, these kinds of interventions can quickly become costly and inefficient, and need tobe phased out once they have served their initial purposes.
Box 3 India’s Green Revolution Agenda (Hazell, 2009)
Immediately after independence in 1947, the Indian government made agriculturaldevelopment its top priority. Realising that India would have to develop the physical andscientific infrastructure necessary to support modern agriculture, Prime Minister JawaharlalNehru and his government poured resources into the effort, allocating 31% of the country’sbudget to agriculture and irrigation. Massive irrigation projects, power plants, stateagricultural universities, national agricultural research systems, and fertiliser plants sprangup across India. These steps were accompanied by land reform designed to create a moreequitable distribution of land.
In the mid-1960s, drought and population growth made India more dependent on US foodaid, despite its own agricultural potential. Following a study by the Ford Foundation in theearly 1960s, the Indian government set up the Intensive Agricultural District Programme toinvest heavily in agricultural extension and distribution of subsidised inputs. The governmentalso established the Food Corporation of India, which bought excess production at aguaranteed price in order to provide stability to farmers. The government also took an active
15
role in coordinating interventions from donors and development partners, who financedagricultural extension as well as research and development. All of this came on top of India’sconsiderable existing infrastructure, including roads and irrigation systems – the Indiangovernment coordinated interventions all along the market chain to enable the entireagricultural system to function.
As a result, most rural small-scale farmers could profitably obtain and use inputs such ashigh-yield seeds, fertilisers, irrigation, and credit. Despite heavy government involvement inthe production, dissemination, and adoption of these inputs, the private sector also played akey role. The dual private and public marketing system actually helped improve the efficientdistribution of inputs to farmers. The success of India’s Green Revolution arose from thecombination of subsidised inputs, public investments in infrastructure (roads, power, andirrigation), research and extension, and, later, marketing policy interventions that assuredfarmers’ access to market outlets at stable prices.
Many countries cut back or phased out these interventions after the mid-1980s as part ofmarket liberalisation programmes. This has led to a greater role for private sector and NGOplayers and the emergence of more innovative and diverse types of policy interventions.Some of the more successful approaches are summarised in

16
Box 4.
While there has been much promising innovation and many demonstrated successes, a keyquestion remains: will these new approaches be sufficient to solve the adoption problem forlarge numbers of small farms, especially poor and women farmers, or will new technologiesbe mainly accessible to larger commercial farms and to those small farms who cansuccessfully organise to access modern value chains? This is clearly an ongoing agendaand pilot innovations need to be backed up by rigorous evaluations showing their impact onkey target groups. There is also much to be learned about how and where to scale upsuccessful pilots when they arise. Scaling up requires going beyond measuring success andpaying attention to the causal factors underlying success. It also requires an ability to identifyand even map other places where the same conditions for success might exist. At presentthere is little guidance on the kinds of data and analysis that would be required to enablesuch inferences.
For reaching women farmers, Quisumbing and Pandolfelli (2010) provide a useful review ofthe evidence base on best practices. They also point out the need to recognise that not allwomen are the same, and that large variations in their age, marital status, educationlevel and size of holding require more specific targeting than just differentiatingbetween men and women farmers.
Women often face a general pattern of discrimination that affects their access to many, if notall, the key ingredients needed for technology adoption, including land, technology,knowledge, inputs, credit and markets. Finding ways to empower women that overcome thisoverall pattern of discrimination would level the playing field and be far more effective thanaddressing each constraint on its own. However, as Peterman et al (2010) observe, this isnot just a legal, political or economic issue: it requires changing gender relations, views andsocial institutions in many settings. Agricultural projects and programmes can contribute tothis end by recognising the range of barriers that women and girls face in accessingprogramme benefits, taking action where possible, and avoiding the risk of entrenchingdiscrimination and exclusion.
17
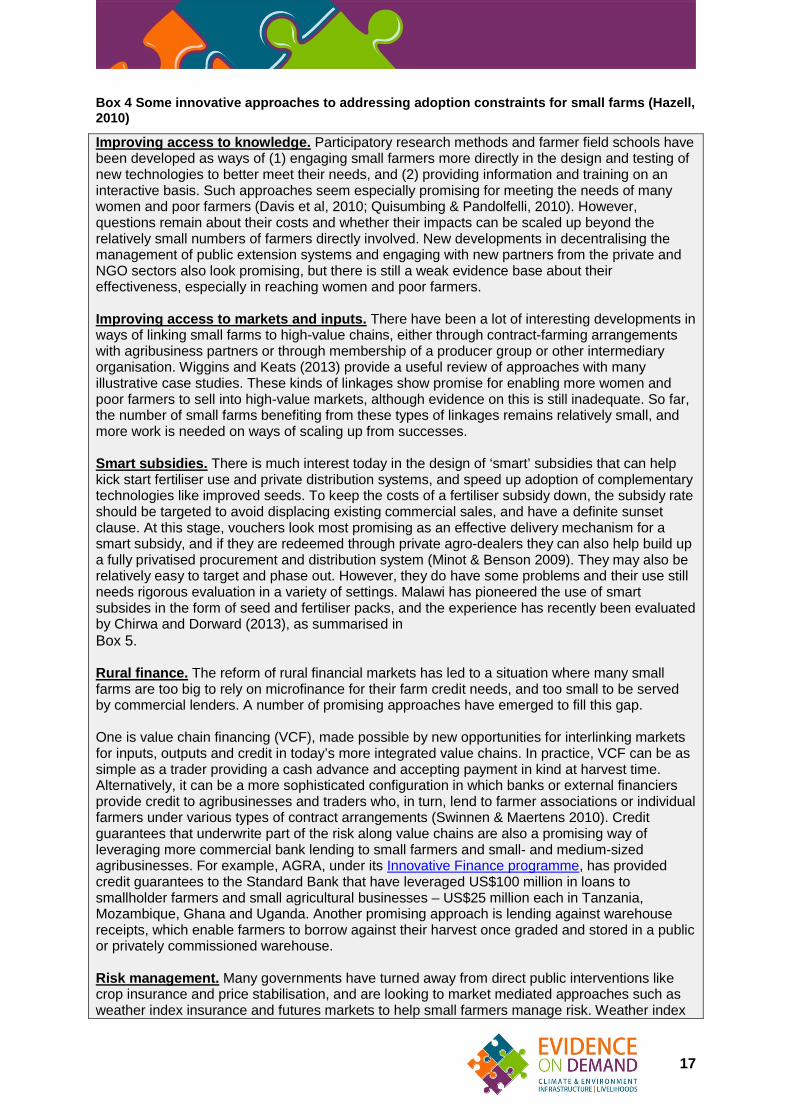
Box 4 Some innovative approaches to addressing adoption constraints for small farms (Hazell,2010)
Improving access to knowledge. Participatory research methods and farmer field schools havebeen developed as ways of (1) engaging small farmers more directly in the design and testing ofnew technologies to better meet their needs, and (2) providing information and training on aninteractive basis. Such approaches seem especially promising for meeting the needs of manywomen and poor farmers (Davis et al, 2010; Quisumbing & Pandolfelli, 2010). However,questions remain about their costs and whether their impacts can be scaled up beyond therelatively small numbers of farmers directly involved. New developments in decentralising themanagement of public extension systems and engaging with new partners from the private andNGO sectors also look promising, but there is still a weak evidence base about theireffectiveness, especially in reaching women and poor farmers.
Improving access to markets and inputs. There have been a lot of interesting developments inways of linking small farms to high-value chains, either through contract-farming arrangementswith agribusiness partners or through membership of a producer group or other intermediaryorganisation. Wiggins and Keats (2013) provide a useful review of approaches with manyillustrative case studies. These kinds of linkages show promise for enabling more women andpoor farmers to sell into high-value markets, although evidence on this is still inadequate. So far,the number of small farms benefiting from these types of linkages remains relatively small, andmore work is needed on ways of scaling up from successes.
Smart subsidies. There is much interest today in the design of ‘smart’ subsidies that can helpkick start fertiliser use and private distribution systems, and speed up adoption of complementarytechnologies like improved seeds. To keep the costs of a fertiliser subsidy down, the subsidy rateshould be targeted to avoid displacing existing commercial sales, and have a definite sunsetclause. At this stage, vouchers look most promising as an effective delivery mechanism for asmart subsidy, and if they are redeemed through private agro-dealers they can also help build upa fully privatised procurement and distribution system (Minot & Benson 2009). They may also berelatively easy to target and phase out. However, they do have some problems and their use stillneeds rigorous evaluation in a variety of settings. Malawi has pioneered the use of smartsubsides in the form of seed and fertiliser packs, and the experience has recently been evaluatedby Chirwa and Dorward (2013), as summarised inBox 5.
Rural finance. The reform of rural financial markets has led to a situation where many smallfarms are too big to rely on microfinance for their farm credit needs, and too small to be servedby commercial lenders. A number of promising approaches have emerged to fill this gap.
One is value chain financing (VCF), made possible by new opportunities for interlinking marketsfor inputs, outputs and credit in today’s more integrated value chains. In practice, VCF can be assimple as a trader providing a cash advance and accepting payment in kind at harvest time.Alternatively, it can be a more sophisticated configuration in which banks or external financiersprovide credit to agribusinesses and traders who, in turn, lend to farmer associations or individualfarmers under various types of contract arrangements (Swinnen & Maertens 2010). Creditguarantees that underwrite part of the risk along value chains are also a promising way ofleveraging more commercial bank lending to small farmers and small- and medium-sizedagribusinesses. For example, AGRA, under its Innovative Finance programme, has providedcredit guarantees to the Standard Bank that have leveraged US$100 million in loans tosmallholder farmers and small agricultural businesses – US$25 million each in Tanzania,Mozambique, Ghana and Uganda. Another promising approach is lending against warehousereceipts, which enable farmers to borrow against their harvest once graded and stored in a publicor privately commissioned warehouse.
Risk management. Many governments have turned away from direct public interventions likecrop insurance and price stabilisation, and are looking to market mediated approaches such asweather index insurance and futures markets to help small farmers manage risk. Weather index

18
insurance shows promise, but common problems have arisen in pilot programmes, such as lowfarmer demand due to high basis risk and perceived low benefits, and the difficulty and cost ofsetting up an effective delivery network.
A recent review of some 40 pilot programmes concluded that these problems are more easilyovercome if the insurance is linked to credit and a technology package that offers the farmer areal value-adding proposition that goes beyond simple risk management (International Fund forAgricultural Development and World Food Programme, 2010). Apart from a few export crops,relevant futures markets do not exist for most developing country farmers. Most small farmersneed intermediaries to access the futures markets that do exist on their behalf (Hazell, 2011;Larson et al, 2004). The few opportunities that arise involve traditional export crops. Given thelimited reach of index insurance and futures markets, most small farmers must rely onthemselves and their communities to manage risk, and on public relief programmes whencatastrophic losses arise.
Land rights.2 Many small farms and women farmers do not have secure access to their land;this is an impediment to investing in some types of technology, especially those with longgestation periods. Formal land titling seems to be a more effective approach in Asia than Africa,partly because land rights are already secure at the community level within many of Africa’scustomary land tenure systems (Deininger, 2014; Feder & Nishio, 1999). While there arecircumstances where land titling is justified in sub-Saharan Africa, more cost effective andpolitically feasible alternatives often exist. Improvements to land rental and sales markets can behelpful, such as reforming rental laws and streamlining procedures for registering and enforcingcontracts and resolving disputes.
Where customary land rights still prevail, it may be better to strengthen and build on existingsystems rather than replace them. In fact, land titling might undermine customary systems,creating conflicting rights that adversely affect the rights of women and secondary land users(Bruce & Migot-Adholla, 1994; Deininger & Feder, 2009). One approach is to reinforce localinstitutions by titling land at the community level. A number of African governments have initiatedland policy and legislative reforms based on these principles: Mozambique, Namibia, Niger,Tanzania, Uganda, and South Africa (Deininger, 2014).
One of the most difficult challenges is securing land rights for women. For example, in much ofsub-Saharan Africa, there is no concept of co-ownership of property by husband and wife undercustomary law, so formalising customary arrangements without first changing women’sinheritance and ownership rights can lead to catastrophic outcomes for women (Joireman, 2007).Although many African countries now give attention to gender equality in national legislation,implementation remains constrained by deeply rooted cultural norms, compounded by women’slack of access to legal institutions, especially in rural areas. Creating law regarding co-ownershipwithout effective enforcement of that law will not improve the current situation (ibid; Meinzen-Dick& Mwangi 2008). Additionally, the education of legal and traditional authorities and men andwomen is needed in areas where customary law might conflict with new statutes.
In all areas of land policy there is growing evidence to show that transparent and easy access toland records, such as is now possible through digitisation and the internet, can facilitate moresecure rights for small farmers, improve the efficiency of land markets, and enhance the value ofland for collateral purposes.
2See also the Topic Guide on Land published by Evidence on Demand in March 2014:http://dx.doi.org/10.12774/eod_tg.mar2014.lockehenley
19
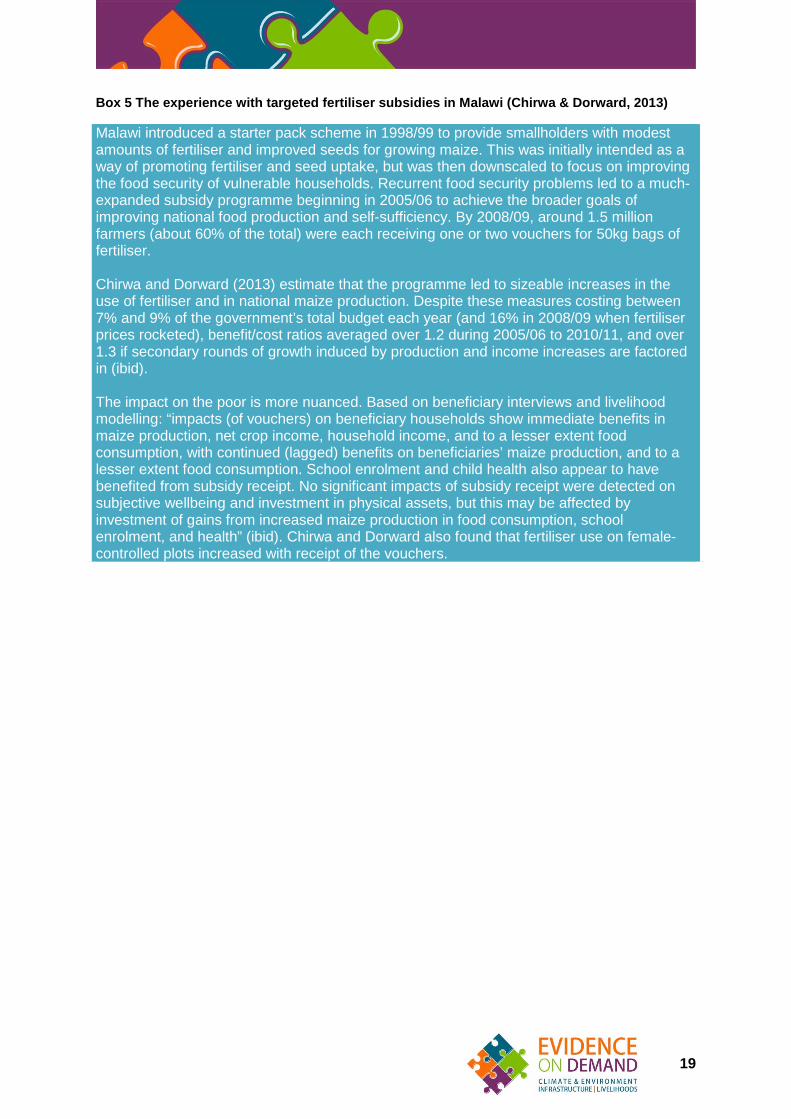
Box 5 The experience with targeted fertiliser subsidies in Malawi (Chirwa & Dorward, 2013)
Malawi introduced a starter pack scheme in 1998/99 to provide smallholders with modestamounts of fertiliser and improved seeds for growing maize. This was initially intended as away of promoting fertiliser and seed uptake, but was then downscaled to focus on improvingthe food security of vulnerable households. Recurrent food security problems led to a much-expanded subsidy programme beginning in 2005/06 to achieve the broader goals ofimproving national food production and self-sufficiency. By 2008/09, around 1.5 millionfarmers (about 60% of the total) were each receiving one or two vouchers for 50kg bags offertiliser.
Chirwa and Dorward (2013) estimate that the programme led to sizeable increases in theuse of fertiliser and in national maize production. Despite these measures costing between7% and 9% of the government’s total budget each year (and 16% in 2008/09 when fertiliserprices rocketed), benefit/cost ratios averaged over 1.2 during 2005/06 to 2010/11, and over1.3 if secondary rounds of growth induced by production and income increases are factoredin (ibid).
The impact on the poor is more nuanced. Based on beneficiary interviews and livelihoodmodelling: “impacts (of vouchers) on beneficiary households show immediate benefits inmaize production, net crop income, household income, and to a lesser extent foodconsumption, with continued (lagged) benefits on beneficiaries’ maize production, and to alesser extent food consumption. School enrolment and child health also appear to havebenefited from subsidy receipt. No significant impacts of subsidy receipt were detected onsubjective wellbeing and investment in physical assets, but this may be affected byinvestment of gains from increased maize production in food consumption, schoolenrolment, and health” (ibid). Chirwa and Dorward also found that fertiliser use on female-controlled plots increased with receipt of the vouchers.

20
SECTION 5Productivity growth and poverty
Low agricultural productivity is a primary cause of poverty for many rural households, soagricultural productivity growth ought to be a powerful way of reducing poverty. However, thelinks between agricultural productivity growth and poverty outcomes are complex and havebeen the subject of considerable controversy in the literature.
Impact pathways
There are a number of pathways through which improved technologies could potentiallybenefit the poor (Hazell & Haddad, 2001). Within adopting regions, poor farmers could gaindirectly through increased own-farm production, providing more food and nutrients for theirown consumption and increasing the output they can sell for cash income. Small farm andlandless labourer households could gain additional employment opportunities and higherwages within adopting regions, both in agriculture and the local non-farm economy.Productivity growth could also empower the poor by increasing their access to decision-making processes, enhancing their capacity for collective action, and reducing theirvulnerability to economic shocks via asset accumulation.
Poor people outside adopting regions might also gain indirectly from new technologies.Growth in adopting regions could create employment opportunities for migrant workers fromother less dynamic regions. It could also stimulate growth in the rural and urban non-farmeconomy with benefits for a wide range of rural and urban poor people. By reducingproduction costs per unit of output (e.g. per kilogram of rice), productivity growth could leadto lower food prices (and hence greater purchasing power) which could provide an immensebenefit for poor people.
However, technology uptake could also work against the poor. Some technologies are moresuited to larger farms, or require inputs that may only be affordable for or accessible to largefarms. Some technologies (e.g. mechanisation and herbicides) could displace labour,leading to lower earnings for agricultural workers. By increasing the returns to land,technology may lead to higher land rents and reduced access to rental land for the poor.Rising farm incomes might also lead to changes in consumption patterns that favourindustrial and imported goods at the expense of locally produced artisan products that areproduced by the poor (e.g. plastic shoes from China can displace the local cobbler). Byfavouring some regions over others, technology could harm poor farmers in non-adoptingregions by lowering their product prices, but without the offsetting cost reductions associatedwith the technology.
Given that many of the rural poor are simultaneously farmers, paid agricultural workers, netbuyers of food, and earners of income from non-farm sources, the impacts of technologicalchange on their poverty status can be difficult to assess, with households experiencing gainsin some dimensions and losses in others. For example, a poor farm household might gainfrom increased own-farm production and higher wage earnings, but lose from lower farmgate prices and higher land rents. Measuring net benefits to the poor requires a fullhousehold livelihood analysis of all direct and indirect impacts, as well as consideration ofthe impacts on poor households that are not engaged in agriculture and/or who live outsideadopting regions, including the urban poor.

21
Much of the controversy that exists in the literature about how new technologies andproductivity growth have an impact on the poor has arisen because too many studies haveonly taken a partial view of the problem. For example, many studies have only assessed thedirect and often short-term impacts on adopting farm households. There has also beenconfusion over the scale at which poverty impacts are measured. Since there can bewinners and losers both at the household and regional level and between rural and urbanpeople, then results can be very different depending on whether poverty reduction ismeasured within adopting regions or for a country as a whole, and whether it is assessedseparately for rural and urban people.
Micro-level evidence from within regions of adoption
The initial experience with the Green Revolution in Asia and in Latin America and theCaribbean (LAC) stimulated a huge number of studies on how technological change affectssmall farmers and landless workers within adopting regions. A number of village andhousehold studies conducted soon after the release of Green Revolution technologies raisedconcerns that large farms were the main beneficiaries of the technologies and that smallfarmers were either unaffected or made worse off – Griffin (1972) and Frankel (1976) wereinfluential critics at the time. Later evidence showed that, while small farmers did lag behindlarge farmers in adopting the new technologies, many of them eventually did catch up withina few years. In a comprehensive review of the literature some 10 years later, Lipton (1989)found that many small-farm adopters benefited from increased production, greateremployment opportunities, and higher wages in the agricultural and non-farm sectors.
Much of the literature in the 1970s and 1980s was focused on changes in inequality andincome distribution rather than absolute poverty, the latter emerging as a more importantgoal in the 1990s with the crystallisation of the Millennium Development Goals (MDGs) (infact, hardly any countries even reported poverty data before the 1990s). In an early exampleof meta-analysis, Freebairn (1995) reviewed 307 published studies on the Green Revolutionto evaluate impacts on income inequality. He found that 40% of the studies reported thatincome became more concentrated within adopting regions, 12% reported that it remainedunchanged or improved, and 48% offered no conclusion. He also found there were morefavourable outcomes in the literature on Asia than elsewhere, and that within the Asianstudies, Asian authors gave more favourable conclusions than non-Asian authors. Whetherthis reflected differences in the ideological biases of researchers in approaching data sets, orthe choice of case studies, is not known.
Other lessons drawn from this rich literature include a better understanding of the conditionsunder which agricultural research is on balance pro-poor within adopting regions. Theseconditions can be quite specific to the local socio-economic context, especially thedistribution of land, small farmers’ access to knowledge, key inputs and markets, and theempowerment of women farmers. National policies also matter, as can be inferred from theearlier discussion on public interventions for overcoming constraints to technology adoption,especially by poor and women farmers.
Indirect impacts and aggregate impacts
Complementing these many micro studies, a number of analysts have used cross-countryand/or time-series data to estimate more aggregate relationships between agriculturalgrowth and poverty reduction. These relationships capture many of the indirect as well asthe direct impacts of agricultural productivity growth on the poor. As discussed in Section 4,aggregate studies of returns to agricultural R&D must contend with a number of potential
22
statistical problems, and the ability to make appropriate adjustments to avoid misleadingresults is constrained by the scope and quality of the available data set.
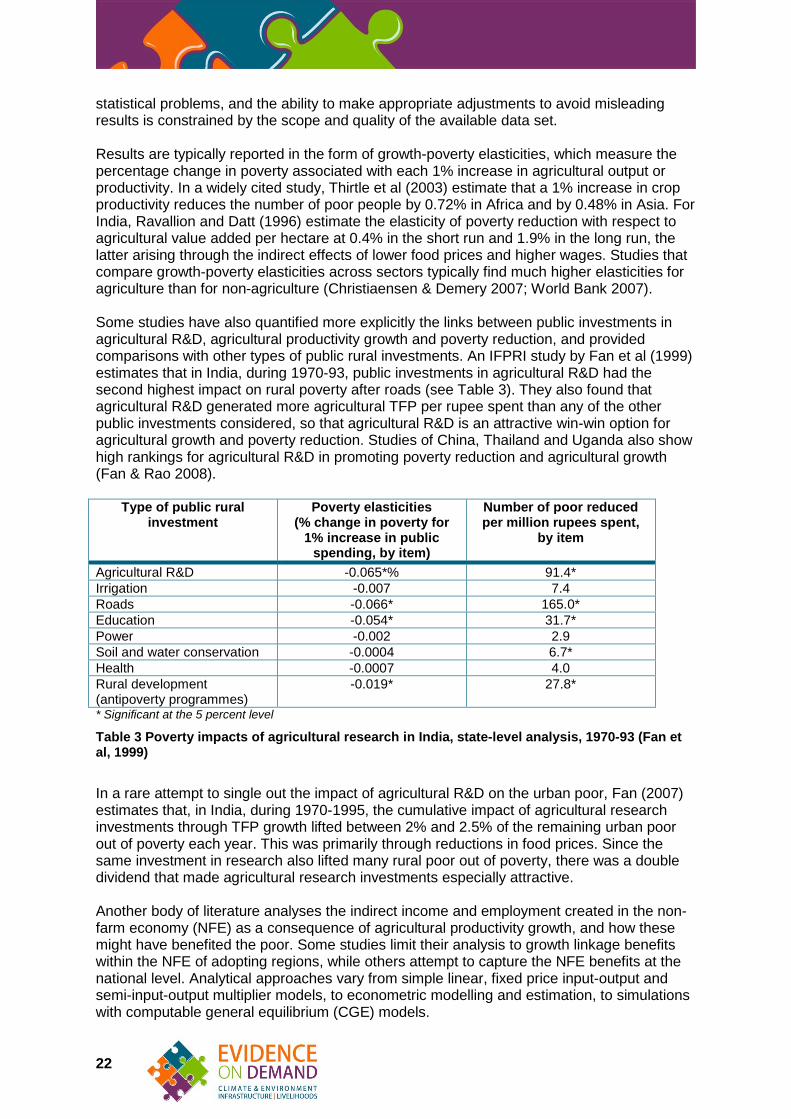
Results are typically reported in the form of growth-poverty elasticities, which measure thepercentage change in poverty associated with each 1% increase in agricultural output orproductivity. In a widely cited study, Thirtle et al (2003) estimate that a 1% increase in cropproductivity reduces the number of poor people by 0.72% in Africa and by 0.48% in Asia. ForIndia, Ravallion and Datt (1996) estimate the elasticity of poverty reduction with respect toagricultural value added per hectare at 0.4% in the short run and 1.9% in the long run, thelatter arising through the indirect effects of lower food prices and higher wages. Studies thatcompare growth-poverty elasticities across sectors typically find much higher elasticities foragriculture than for non-agriculture (Christiaensen & Demery 2007; World Bank 2007).
Some studies have also quantified more explicitly the links between public investments inagricultural R&D, agricultural productivity growth and poverty reduction, and providedcomparisons with other types of public rural investments. An IFPRI study by Fan et al (1999)estimates that in India, during 1970-93, public investments in agricultural R&D had thesecond highest impact on rural poverty after roads (see Table 3). They also found thatagricultural R&D generated more agricultural TFP per rupee spent than any of the otherpublic investments considered, so that agricultural R&D is an attractive win-win option foragricultural growth and poverty reduction. Studies of China, Thailand and Uganda also showhigh rankings for agricultural R&D in promoting poverty reduction and agricultural growth(Fan & Rao 2008).
Type of public ruralinvestment
Poverty elasticities(% change in poverty for
1% increase in publicspending, by item)
Number of poor reducedper million rupees spent,
by item
Agricultural R&D -0.065*% 91.4*Irrigation -0.007 7.4Roads -0.066* 165.0*Education -0.054* 31.7*Power -0.002 2.9Soil and water conservation -0.0004 6.7*Health -0.0007 4.0Rural development(antipoverty programmes)
-0.019* 27.8*
* Significant at the 5 percent level
Table 3 Poverty impacts of agricultural research in India, state-level analysis, 1970-93 (Fan etal, 1999)
In a rare attempt to single out the impact of agricultural R&D on the urban poor, Fan (2007)estimates that, in India, during 1970-1995, the cumulative impact of agricultural researchinvestments through TFP growth lifted between 2% and 2.5% of the remaining urban poorout of poverty each year. This was primarily through reductions in food prices. Since thesame investment in research also lifted many rural poor out of poverty, there was a doubledividend that made agricultural research investments especially attractive.
Another body of literature analyses the indirect income and employment created in the non-farm economy (NFE) as a consequence of agricultural productivity growth, and how thesemight have benefited the poor. Some studies limit their analysis to growth linkage benefitswithin the NFE of adopting regions, while others attempt to capture the NFE benefits at thenational level. Analytical approaches vary from simple linear, fixed price input-output andsemi-input-output multiplier models, to econometric modelling and estimation, to simulationswith computable general equilibrium (CGE) models.
23
Haggblade et al (2007) compare multiplier estimates (in Table 7.3) from a variety ofempirical studies using different methods. They report multipliers that measure the totalincome created in a regional or national economy for an additional £1 originating inagriculture – a multiplier of 1.5 therefore means that another £1 income generated inagriculture leads to a £0.5 gain in NFE income, and a total income gain of £1.5 to theeconomy. Most estimates of regional multipliers fall in the 1.3-2.0 range, while nationalmultipliers fall in the 1.5-3.0 range. The multipliers are typically lower when estimated withprice endogenous or econometric models than with different variants of input-output models.They are also typically higher for Asia than for Africa and Latin America, one reason beingthat Asia’s more input-intensive farming systems have stronger linkages to NFE.
Another important result from this body of literature is that much of the indirect incomegrowth induced in the rural NFE arises within the services and informal manufacturingsectors, and these are typically labour-intensive activities that are important to women andpoor people. Consequently, the multipliers can lead to substantial benefits for the poor(Haggblade et al, 2007; Hazell & Haggblade, 1993).
Future challenges
In summary, agricultural productivity growth has had mixed direct impacts on the poor withinadopting regions, with outcomes being sensitive to local socio-economic conditions andnational policies. On the other hand, indirect impacts on the wider population of rural andurban poor through lower food prices, higher wages, and growth linkages to NFE seem tohave been powerful and more consistently positive. They are often powerful enough to morethan offset any negative direct impacts within adopting regions (as evidenced by the sizeablepoverty elasticity estimates reported above).
Experience also suggests that policies matter, and it may be asking too much to expect thatagricultural R&D on its own can make all the poor better off; complementary policies to helpspread the benefits may be needed. Box 3, for example, describes how India pursued a setof policies that helped ensure small farms were not left out of the Green Revolution, andwhich contributed to more favourable outcomes for the poor within adopting regions thanwould otherwise have been the case.
Some of the lessons from this vast literature on productivity growth and poverty may have tobe qualified today because circumstances have changed since the Green Revolution era.Prominent among these changes are that globalisation and market liberalisation policies andrapid urbanisation have transformed the economic context for agricultural growth in mostcountries, and made food prices less contingent on national production. Small farms havealso become smaller (in India, for example, they are now less than half the size of smallfarms during the Green Revolution), and small farm households are much more diversifiedinto off-farm sources of income (Masters et al, 2013). Also, the majority of the rural poor nowlive in less-favoured regions that missed out on the Green Revolution, and where thepotential to raise agricultural productivity can be more challenging (Ghani, 2010; Hazell &Wood, 2008; World Bank, 2007). Within this changed context, many poor rural householdswith limited access to land might gain more from migration and non-farm opportunities thanfrom productivity gains or wage earnings in farming, and the urban poor might benefit morefrom agricultural trade policies than from increases in national food production (Dercon &Collier, 2013).
These changes do not rule out an important future role for agricultural productivity growth tobenefit the poor, but they do suggest that investments like agricultural R&D may need to betargeted differently than in the past. For example, a recent foresight study sponsored by the
24
Independent Science and Partnership Council (ISPC) of CGIAR concludes that agriculturalR&D investments for small farms need to be differentiated according to the regional contextin which farmers live and the market orientation of the farmers (Masters et al, 2013).
In particular, Masters et al (ibid) distinguish between favoured areas that have goodagricultural production potential and/or good market access, and less-favoured regions withpoor agricultural production potential and/or poor market access. Favoured regions providemany more business opportunities for small farms, particularly in today’s world of rapidurbanisation and globalisation of agricultural value chains. The opportunities for shifting intohigher-value agriculture for urban and export markets can be particularly attractive as, forexample, in some of the rural hinterlands around large cities in India, China, and Mexico.This is also true of the opportunities for producing fresh horticultural products for export inKenya and Central America. In less-favoured regions, market opportunities for most smallfarms are much more constrained, and crop yields can be expected to be lower. Theseregions tend to be much less competitive, more risky, and orientated to production of staplefoods, largely for local consumption.
Within these two types of regions, it is also recommended that a distinction is made betweenmarket-orientated farmers who are more likely to succeed on a commercial basis, andtransition or subsistence-orientated farmers who are either at various stages of transition outof farming or who farm primarily to meet own subsistence needs. The kinds of technologiesand assistance appropriate for these two groups can be quite different, with implications forthe kinds of R&D they need and whether the private or public sector is best positioned toprovide it.
Further research is needed to develop and test the relevance of smallholder typologies fortargeted R&D and other forms of small farm assistance, including developing practical waysof identifying the different groups of farms on the ground. There has been a lot of recentwork using GIS and spatial analysis methods to identify target areas for rural developmentpurposes. Most of this work focuses on mapping different regions in terms of their agro-ecology, market access, and rural population density (see, for example, Omamo et al, 2006);however, there has been limited work so far on disaggregating further, according todifferences in farmer endowments, market orientation, and gender.
25
SECTION 6Productivity growth and sustainability
There are serious concerns today that many of the more successful pathways to agriculturalproductivity growth are not sustainable from an environmental perspective. Given thegrowing human demands on farming systems, attempts to achieve environmentallysustainable solutions at current or lower levels of productivity will not be enough, and thereal need is for further productivity growth but on a sustainable basis. This is often referredto as ‘sustainable intensification’.
There are serious questions about the long-term sustainability of many past patterns ofagricultural productivity growth. In intensive (often irrigated) farming systems there arecontinuing problems with surface water and aquifer depletion, water logging and salt build-upin irrigated lands, pesticide poisoning, chemical (especially nitrate) pollution of waterways,biodiversity loss, and greenhouse gas emissions. In extensive farming systems, oftenlocated in low-potential and unirrigated areas, the main problems are expansion of theagricultural area into remaining forest, habitat and biodiversity loss, soil erosion, soil fertilitydepletion, degradation of watersheds, and decreasing carbon sequestration capacity (Hazell& Wood, 2008). The resilience of many farming systems is also being challenged by climatechange.
A priority for irrigated farming must be to improve water-use efficiency while substantiallyreducing total water use, water pollution, land degradation, and the unsustainable mining ofgroundwater. Many suitable technologies and natural resource management (NRM)practices have been developed. These include improved fertiliser management (involvingbetter choices about fertiliser types and application rates and timings to better match thechanging nutrient needs of plants over their growing season). Other examples are thesystem of rice intensification or SRI (see Box 6), greater use of ecological principles in pestmanagement – as in integrated pest management (IPM) (see Box 7) – and improved watermanagement practices (World Bank, 2007).
A priority in many extensive farming systems is to increase land and labour productivitythrough more intensive farming approaches that can reduce human pressure on the naturalresource base. One promising technology that has already had far-ranging impacts in manyhillside and agro-pastoral areas is agroforestry (Place et al, 2002). Another technology,conservation farming, has been successfully adapted to a wide range of conditions in LatinAmerica, Asia and Africa (see Box 8). In the Sahelian countries, simple and low-costbunding techniques and tree planting retain soil nutrients and reduce erosion, leading tohigher and more stable yields and incomes (Haggblade et al, 2010; Reij et al, 2009). Small-scale watershed development projects have been shown to increase farm incomes andreduce soil erosion in some of the lower rainfall areas of Ethiopia and India (Pender et al,2006; Kerr et al, 2002; Joshi et al, 2005). Small-scale, farmer-controlled irrigationdevelopments that use simple and low-cost technologies like river diversion, lifting with small(hand or rope) pumps from shallow groundwater or rivers, or seasonal flooding, enjoylocalised successes in Africa, especially when used to grow high-value horticulture crops(World Bank, 2007).
26
Box 6 System of rice intensification (SRI) (Hazell, 2008)
SRI was developed in the early 1980s by Henri de Laulanie, a French missionary priest inMadagascar, as an alternative approach to the standard Green Revolution rice technologiesfor small-scale farmers. It has since been widely promoted by a number of NGOs and theInternational Institute for Food, Agriculture and Development (IIFAD) at Cornell University.
The main components of SRI are as follows: transplanting of young seedlings (8-15-day-oldinstead of 3-4-week-old plants) on small hills at much lower plant densities than usual; watermanagement that keeps the soil moist rather than flooded; frequent weeding; use of largeamounts of organic compost for fertiliser.
The claimed benefits include high yields, even with traditional rice varieties; significantsavings in seed; little or no artificial fertiliser required; natural pest and disease control,eliminating the need for pesticides; reduced water use; a flexible management system thatallows farmers to experiment and adapt the approach to their particular growing conditions.The approach is claimed to be environmentally sustainable and of particular relevance forpoorer farmers who cannot afford modern inputs (Uphoff, 2003).
SRI has generated enormous controversy, largely because of claims of very high yields,sometimes exceeding the best experiment station yields for modern rice technologies,sometimes even without the use of fertiliser or modern varieties. These high yields defycurrent understanding of the physiology of rice plant growth (Sheehy et al, 2005).Proponents argue that there are strong synergies between the different managementcomponents of SRI that lead to strong root growth and higher yields, although thesesynergies are not well understood (Mishra et al, 2006).
Few of the yield claims have been verified under controlled experimental conditions. Trialsundertaken at IRRI found no significant yield differences between SRI and conventional GRpractices (Namara et al, 2003). McDonald et al (2006) analysed 40 sets of field trial resultsreported in the literature (five from Madagascar and 35 from 11 Asian countries) whichcompared SRI with ‘best management practices’ appropriate to each site. Apart from the fiveMadagascar studies, which consistently showed higher yields with SRI, SRI led to anaverage yield loss of 11% in the other 35 studies, with a range of -61% to 22%.
Yield gains appear to be better in farm-adoption studies. Farmers in Ratnapura andKurunegala Districts in Sri Lanka obtained 44% higher yields on average with SRI than withmodern rice farming methods (Namara et al, 2003), and the average yield gain was 32% forfarmers in Purila District of West Bengal (Sinha & Talati, 2007). However, in both studiesSRI farmers showed considerable variation in the management methods they used, makingit rather unclear as to what was being compared in the name of SRI. For example, many SRIfarmers used inorganic fertiliser as well as compost, many grew modern as well astraditional rice varieties, and their weeding and water management practices variedconsiderably.
SRI has yet to be widely adopted in any one country, although it can be found on a smallscale in many countries, including many parts of South Asia. Some of the reasons for pooruptake include the difficulties of controlling water with sufficient precision in many surfaceirrigation systems, the need for large amounts of compost, and the high labour demands fortransplanting, hand weeding, and generating and distributing compost. This is confirmed byavailable adoption studies. In Sri Lanka, adoption is positively related to family size(availability of labour) and ownership of animals (availability of manure), and is morecommon among rainfed than irrigated rice farmers (Namara et al, 2003). Moser and Barrett(2003) obtained similar results in an adoption study in Madagascar. Moser and Barrett (ibid),Namara et al (2003) and Sinha and Talati (2007) all found that adopters only practice SRI on
27
small parts of their rice area despite higher returns to both land and labour, and they alsofound high rates of disadoption. This again suggests important constraints, possibly labouror suitability of available irrigation systems, as well as disappointing returns.
Controversy about SRI continues, and the best conclusion may be that there are somefeatures of the approach, such as improved planting densities and water-managementpractices, can be usefully incorporated into modern rice growing practices without giving upthe advantages of using improved varieties and fertilisers.
Box 7 Integrated pest management (IPM)
Pest problems emerged as an important problem during the early Green Revolution erabecause many of the high-yielding varieties first released had poor resistance to someimportant insect pests and diseases. The problem was compounded by a shift to highercropping intensities, monocropping, high fertiliser use (which creates dense, lush canopies inwhich pests can thrive), and the planting of large adjacent areas to similar varieties with acommon susceptibility. Control was initially based on prophylactic chemical applications,driven by the calendar rather than incidence of pest attack. This approach disrupted thenatural pest-predator balance, and led to a resurgence of pest populations that requiredeven more pesticide applications to control. Problems were compounded by the build-up ofpest resistance to the commonly used pesticides. As pesticide use increased so didenvironmental and health problems. One study (Rola & Pingali, 1993) found that the healthcosts of pesticide use in rice reached the point where they more than offset the economicbenefits from pest control.
As problems with the use of pesticides began to emerge, researchers gave greater attentionto the development of crop varieties that have good resistance to important pests, andbiological and ecological pest-control methods. This led to the development of integratedpest management (IPM), an approach that integrates pest-resistant varieties, agronomic andbiological means of control, and the judicious and selective use of pesticides only when pestattacks occur. IPM was promoted widely across Asia beginning in the 1980s, backed bypolicy changes that made pesticides more expensive (e.g. removing subsidies or imposingimport tariffs), as in Indonesia, Bangladesh and The Philippines. Although IPM was initiallydeveloped for rice, IPM approaches have since been developed for many other crops.
Studies show that the main advantages of IPM for farmers arise from reduced labour andpesticide costs rather than higher yields, and from reduced health problems (e.g. Susmita etal, 2007). However, the scale of adoption has been disappointing. An important constraint isthat IPM is a knowledge-based technology that needs to be adapted to specific locations andsituations, and this poses serious challenges in regions with large numbers of small farms.Farmer Field Schools (FFS) have proven an effective approach for promoting IPM, but arecostly and only train a few farmers at a time. There is little evidence to show that knowledgespreads spontaneously from trained to untrained farmers.
28
Box 8 Conservation agriculture (World Bank, 2007; Hobbs et al, 2007)
Conservation agriculture (CA) is a system of crop farming that was developed in response tothe Dust Bowl of the 1930s in the US Great Plains that resulted from excessive tillage.Conservation agriculture is based on three principles, designed to enhance biodiversityabove and below ground: a) minimum or no mechanical soil disturbance throughout theentire crop rotation, b) permanent organic soil cover through cropping and mulching, and c)diversified crop rotations in the case of annual crops or plant associations in the case ofperennial crops.
The claimed benefits of CA include reduced wind and water erosion, better weed control,conservation of soil moisture, and improved soil organic matter and fertility. CA also saveson mechanisation costs and greenhouse gas emissions, and sequesters more carbon in thesoil. Weed control can be a problem, and it was only after the development of selectiveherbicides that the practice began to spread across North and South America and, to alesser degree, in Europe. Farmers in Iowa (USA), for example, growing maize on their deep,highly organic long-grass prairie soil, do not till their land, but do apply herbicides to controlthe weeds. In 2004/05, worldwide adoption of CA was about 95 million hectares (or about6.7% of the total cropped area).
CA principles are now being applied in many parts of Africa, by national agricultural researchsystems (NARS) and by NGOs. In these circumstances, weeding is still a challenge but isbeing tackled relatively successfully by hand weeding, without the use of herbicides. Ingeneral, yields under CA are significantly higher than under conventional farming in largepart due to improved soil and water conservation.
While it is relatively easy to demonstrate the yield and income impacts of these kinds oftechnologies and NRM practices, assessing their longer-term environmental impacts is morechallenging, and there are few impact studies that have succeeded (Renkow & Byerlee,2010). This is partly because of difficulties in measuring environmental changes over thetime spans and levels of scale (e.g. from plot to landscape to watershed) required, and alsobecause of difficulties in assigning economic values to changes even when they can bemeasured (Freeman et al, 2005). The few impact studies that exist either report changes inselected physical indicators or rely on farmers’ perceptions of change in resource orenvironmental condition (e.g. Kerr et al, 2002), or rely on model simulations.
Despite the development of and successful demonstration of many better technologies andNRM practices for reducing environmental problems in agriculture, their uptake and spreadremains grossly inadequate. Like other technologies, most of the adoption constraints listedin
29
Box 2 apply, but some factors are especially important (Shiferaw et al, 2009). One is thehigh knowledge and labour requirements of many improved NRM practices (Tripp, 2006).Another is the need for collective action for NRM practices that need to be implemented atthe landscape level (e.g. soil erosion control and watershed development) or by groups ofadjacent farmers (e.g. IPM and improved water management practices) (Meinzen-Dick et al,2002). In some cases, subsidies on water, fertilisers and pesticides act to encourage farmersto use excessive amounts of these inputs, thereby working against responsibleenvironmental management.
Another widespread problem is the offsite (or externality) nature of many environmentalproblems, meaning that the farmers who cause an environmental problem do not bear thefull consequences of the damage. With water pollution, for example, it is the people who livedownstream of the offending farmers who suffer the consequences. Again, farmers whomine groundwater have an impact on all users in a watershed. In these kinds of cases, thestandard policy approach is to regulate and penalise the farmers causing the problem, butthis requires more effective public institutions and enforcement systems than exist in mostdeveloping countries. Sometimes solutions can be found in local organisations that bring keystakeholders together (e.g. river basin management authorities provide a forum for linkingupstream and downstream users).
Not all externalities are costs. Some externalities lead to benefits, such as the provision ofimportant environmental services like watershed and habitat protection, and carbonsequestration. These can be of considerable benefit to societies at large, but the farmersand communities who provide these services are not rewarded for their efforts in the market.The result is that they engage in farming practices which, even if sustainable, do not providesufficient environmental services. In these cases there may be need for some form offinancial compensation (World Bank, 2007).
British and European farmers are compensated for providing environmental services on theirfarms, such as protecting headlands, hedges and wildlife. Unfortunately, few developingcountries can afford these kinds of payments and more promising solutions lie in theemergence of market based schemes for paying for environmental services (PES).Emerging carbon payment markets are a good example, and under some circumstances canbe used to pay farmers for sequestering carbon in their landscapes. The payment originatesfrom private industries that must stay within carbon caps either by reducing their ownemissions or by paying others to make compensating carbon offsets. So far there is limitedexperience in using PES in agriculture, but a lot of interesting pilot schemes are being tried(World Bank, 2007).3
3A Topic Guide on Ecosystems Services will be published by Evidence on Demand in June2014.

30
SECTION 7Productivity growth in conflict areas
Most conflicts in the developing world take place in rural areas, displacing large numbers ofcivilians, disrupting their agricultural livelihoods, and undermining agricultural productivityand food supplies. Rebuilding agriculture is an important strategy for post-conflictreconstruction. It not only offers an opportunity to improve food security and enhancelivelihoods, but agriculture is also well suited to absorb demobilised combatants.
An immediate need for restoring agricultural production in post-conflict situations is toprovide agricultural inputs and assets including seeds, tools, and livestock that have beenlost during the conflict. Most post-conflict programmes give high priority to providing theseinputs, but as Birner et al (2011) note: “Programmes that distribute such inputs are subject tosubstantial governance challenges, such as leakage of funds and procurement of sub-standard material. Moreover, unlike community infrastructure such as schools or boreholes,agricultural inputs are private goods, and the challenge of capture by better-off households isparticularly pronounced. In post-conflict situations, additional challenges arise due to thelimited capacity of both government and community-based institutions to implement suchprograms effectively”. Capture and sub-standard materials are not just a problem ofleakages, but can breed resentment that leads to renewed conflict.
In providing key agricultural inputs, development agencies and governments have tried avariety of approaches to overcoming governance problems, including the decentralisation ofprogramme implementation to local governments, the use of community-based procurementapproaches, and the use of vouchers for agricultural inputs. There is limited evaluationevidence on how well these various approaches work, and hardly any literature thatcompares their performance in resolving governance challenges. An exception is Birner et al(2011), who studied the agricultural input supply programmes implemented in post-conflictnorthern Uganda. Their study evaluates and compares the performance of two World Bank-funded government programmes: the National Agricultural Advisory Services programme(NAADS) and the Northern Uganda Social Action Fund (NUSAF); two programmes fundedby DANIDA; a Caritas programme; a programme of the International Committee of the RedCross; a programme run by the NGO Heifer International. Together, these programmesprovided contrasting experiences in the same region on four different implementationmechanisms: (1) public procurement of inputs either by government agencies or by NGOimplementing agencies; (2) procurement of inputs by community groups, with funds beingchannelled either through local government accounts or the groups’ own accounts; (3) inputvoucher programmes with a public works component, or without a public works component;(4) cash-for-work programmes with incentives for investment in agriculture.
Using a modified policy network analysis framework and stakeholder interviews, Birner et alfind that each approach has strengths and weaknesses in overcoming governanceproblems. For example, combating corruption among public officials using community-basedprocurement may come at the expense of elite capture in community groups. Additionally,using specialised organisations for delivering post-conflict programmes may work well in theshort run, but may affect the possibility of creating well-functioning institutions in the longrun. Moreover, many interesting approaches work well on a small scale when implementedby dedicated and committed project teams; however, scaling up such experiences is noteasy. Nevertheless, scaling up is necessary if agriculture is to be rebuilt and peace assuredat the regional level.
31
The performance of rural producer organisations (RPOs) in bridging the gap in serviceprovision in post-conflict situations is also analysed by Ragasa and Golan (2012). Theysurveyed a sample of RPOs in the Democratic Republic of the Congo (DRC) and found thatsuccess in terms of performing well and benefiting their members depended on an enablingenvironment, good governance, and security, all of which can be difficult to achieve in post-conflict situations, especially if they depend on a broader range of governance andinstitutional reforms that extend well beyond the agricultural sector (World Bank, 2011).
It is often argued that agriculture can make important contributions to avoiding conflicts. Forexample, poverty, inequality and weather shocks are all positively associated with conflict(ibid); therefore, investments in agricultural productivity growth that lead to inclusive andresilient patterns of rural growth should be helpful. This might be especially important inlagging regions that are heavily populated and in regions with large ethnic minorities.Although the logic seems impeccable, the empirical base to substantiate such claimsremains mixed (de Soysa & Petter Gleditsch, 1999).
32
SECTION 8Summary and future priorities
Summary
Since the 1960s, growth in global agricultural production has kept ahead of populationgrowth, contributing to a downward trend in world food prices when adjusted for inflation,and a supply of food that is adequate to feed the entire world population to minimum UNstandards were if more equitably distributed. The increased use of inputs, particularly water,fertilisers, and labour, explained about half the total increase in agricultural productionbetween 1960 and 2007, while the remaining half was due to increases in agriculturalproductivity (i.e. to gains in the efficiency with which inputs are used in farming). Strikingly,this increase in productivity since 1960 has enabled agricultural production to grow withouthaving to convert much additional land to farming, thus helping to retain large areas of landin forest and other environmentally valued uses. This favourable global perspective maskssome important regional variation. While most parts of the developing world havesuccessfully and continuously increased their agricultural output per capita since the 1960s,sub-Saharan Africa has experienced stagnant, even declining per capita output, and someregions have experienced more significant land conversion to agriculture.
Agricultural research has played a key role in raising agricultural productivity, both bycontributing new and improved technologies that give more output per unit of input, and byhelping farmers improve the efficiency of their management practices. The productivityreturns to agricultural research have generally been high, although controversy remainsabout just how high in terms of the economic returns to the investments made.
Many farmers have benefited from increased productivity, but only when they have beenable to adopt the improved technologies and management practices that became available.Adoption typically requires access to knowledge, key inputs and credit, and access to theseinputs depends on local availability and household characteristics. For example, youngerand more educated farmers tend more often to adopt, as do farms that are located nearroads or market centres that facilitate access to agro-dealers and markets. Women farmersand poor farmers typically face the most constraints in adopting better technologies, and aremost in need of supporting public policies. Recent years have seen a paradigm shift inpolicies for assisting farmers adopt new technologies, from a top-down public sector supplymodel to one in which the public sector works through a myriad of private sector and NGOplayers. It is still too soon to know if this new paradigm will be sufficient to successfully reachmany small farms, or poor and women farmers.
Agricultural productivity growth has been widely beneficial to the poor, especially where ithas helped keep food prices lower than they would otherwise have been, and where it hasgenerated additional income and employment opportunities in the farm and non-farmeconomy. However, the distribution of benefits within farming communities that haveadopted new technologies has led to mixed outcomes for the poor, and which areconditioned by initial socio-economic conditions such as farm size distribution and prevailingagricultural policies.
Although agricultural productivity growth has saved large areas of forest and other valuedland uses, it has also had negative impacts on the environment. Serious questions have
33
arisen about the sustainability of some of the more intensively farmed areas. Agriculturalresearch has contributed to the development of more sustainable and environmentallybenign farming practices for intensive farming systems, but their widespread adoptionremains disappointing. Some important reasons are their knowledge and labour intensity,and the distorted incentives that arise when governments subsidise the use of fertilisers andirrigation water, or where environmental costs arise off farm (i.e. they impact on people otherthan the ones causing the problem). It also needs to be recognised that many of theenvironmental problems associated with agriculture have little to do with intensive farming,but arise in areas that still depend on extensive farming practices and where populationgrowth is placing high stresses on the natural resource base. In these cases, productivitygrowth through agricultural intensification needs to be part of the solution, along with moresustainable management practices.
Too slow agricultural productivity growth has been linked to violence and conflicts in ruralareas, although the empirical evidence on this linkage is still less than compelling. What isclearer is that restoring agricultural productivity growth needs to be part of any strategy forpost-conflict recovery.
Future Priorities
Looking to the future, most countries have limited opportunities for further expanding theiragricultural area and irrigation capacity. Consequently, future agricultural growth will becomemore dependent on productivity growth rather than greater use of inputs and, as shown inTable 1, this is already reflected at the global level. There is no evidence to show that thereturns to agricultural R&D are declining over time, but if they are to be maintained, the besthope lies then in further advances in biosciences and information technology. Farmers inmany developed countries are already tapping into these sources of productivity growth, buttheir full impact has yet to be felt, especially in the developing world. Future research willalso need to emphasise the need for sustainable intensification, and for adapting to climatechange.
Agricultural productivity growth will also continue to be important for the poor. Poor peopleeverywhere benefit from less costly food supplies; however, unlike the past, marketliberalisation and globalisation have reduced the dependence of individual countries on theirown food production and hence weakened the link between own production and prices. Yet,this relationship still holds globally, and persists in many land-locked regions and countriesthat do not have ready access to world supplies.
Small farms and women farmers have played dominant roles in past patterns of agriculturalgrowth, and seem likely to continue to do so. Enhancing their on-farm productivity can still beimportant for enhancing their welfare and helping many escape poverty. However,agricultural research may need to be targeted differently in the future if it is to benefit thesegroups. Many small farms have become tiny and have diversified into off-farm sources ofincome, and now farm largely for their own consumption. Many of the poorest small farmsare also located in less-favoured regions where agricultural productivity remains low anddifficult to increase. At the same time, small farms wishing to expand into high valueagriculture as a way of raising their productivity face hurdles in linking to modern valuechains. In this changing context, the latest thinking is to differentiate farms on the basis oftheir regional context (e.g. favoured vs less-favoured regions in terms of agricultural potentialand access to markets) and to distinguish between market-orientated vs subsistence-orientated farmers. Pro-poor research can then be targeted at subsistence-orientated farmsand integrated alongside other complementary interventions that can assist them exit ordiversify further out of farming; productivity-orientated research for more commercially-orientated farming can be targeted at market-orientated farmers along with interventions to

34
help them link to modern market chains. In both cases, the regional context would help todefine the opportunities available and, hence, the detailed interventions to pursue.

35
Recommended reading
Sections 2 and 3: Productivity growth – definitions and trends
For a good nontechnical review of recent trends in world food production, including theimportant role of productivity growth, see Chapter 2 in IFPRI’s 2012 Annual Food PolicyReport, available at: http://www.ifpri.org/sites/default/files/publications/gfpr2012_ch02.pdf
Section 4: What drives productivity growth?
Bob Evenson and Doug Gollin (2003) provide the most comprehensive analysis of the globalevidence on the impact of crop-genetic improvement research over the period 1965-1998 forall the major food staple crops. They also break down CGIAR’s contributions and find verylarge impacts, especially for rice, wheat and maize. Unfortunately this is an expensivehardcover book.
Mitch Renkow and Derek Byerlee (2010) review recent impact assessment studies ofCGIAR research, including policy research, in terms of their contributions to productivity,poverty and environmental goals, available at:http://impact.cgiar.org/pdf/RenkowByerlee2010.pdf
In Slow Magic: Agricultural R&D a Century after Mendel, Phil Pardey and Nienke Beintema(2001) provide an excellent review of trends in agricultural R&D spending around the worldand the growing role of the private sector. They also review evidence on the impact of thatspending, available at: http://www.ifpri.org/sites/default/files/publications/fpr31.pdf. For a2012 update on R&D spending patterns, see:http://www.ifpri.org/sites/default/files/publications/astiglobalassessment.pdf
On ways of overcoming constraints to adoption, a recent (2013) and comprehensive reviewis provided at Feed the Future Learning Agenda Literature Review: Improved AgriculturalProductivity, USAID:http://agrilinks.org/sites/default/files/resource/files/Feed%20the%20Future_Learning%20Agenda%20Literature%20Review_Ag%20Productivity_2013.pdf
On gender issues, Agnes Quisumbing and colleagues at IFPRI have written severalcomprehensive and evidence based reviews of the extent of discrimination against women inaccessing key inputs for farming, and on approaches for overcoming the problem. Two keypapers are:
Peterman, A., Behrman, J. & Quisumbing, A. (2010) ‘A review of empirical evidenceon gender differences in nonland agricultural inputs, technology, and services indeveloping countries’, IFPRI Discussion Paper 975. Available at:http://www.ifpri.org/sites/default/files/publications/ifpridp00975.pdf
Quisumbing, A. & Pandolfelli, L. (2010) ‘Promising approaches to address the needsof poor female farmers: Resources, constraints, and interventions’, WorldDevelopment, 38(4), p581-592. Available at:http://www.ifpri.org/sites/default/files/publications/ifpridp00882.pdf
Another study from the same team looks specifically at how gender issues should beincorporated into agricultural R&D: Engendering Agricultural Research, Development, andExtension: http://www.ifpri.org/sites/default/files/publications/rr176.pdf

36
On linking small farms to markets, Wiggins and Keats (2013) provide a very useful review ofapproaches with many illustrative case studies in Leaping and Learning: LinkingSmallholders to Markets:https://workspace.imperial.ac.uk/africanagriculturaldevelopment/Public/LeapingandLearning_FINAL.pdf
Section 5: Productivity growth and poverty
Peter Hazell and Lawrence Haddad (2001) provide a conceptual and empirical review of theevidence on the impact of agricultural research on the poor and how it might be bettertargeted in Agricultural Research and Poverty Reduction:http://www.ifpri.org/sites/default/files/publications/2020dp34.pdf
Luc Christiaensen and Lionel Demery (2007) review the evidence on the macro linksbetween agricultural productivity growth and poverty, with a special emphasis on Africa inDown to Earth: Agriculture and Poverty Reduction in Africa:https://openknowledge.worldbank.org/bitstream/handle/10986/6624/387810AFR0Down101OFFICIAL0USE0ONLY1.pdf?sequence=1
Will Masters (2013) examines how agricultural R&D needs to be prioritised to address theproblems of small farms within the context of increasing urbanisation and declining farmsizes in Urbanization and Farm Size in Asia and Africa: Implications for Food Security andAgricultural Research: http://www.sciencecouncil.cgiar.org/sections/strategy-trends
Section 6: Productivity growth and sustainability
A good review of the environmental problems associated with agriculture and promisingways of addressing them is provided in Chapter 8 (Making agricultural systems moreenvironmentally sustainable) of the World Development Report 2008: Agriculture forDevelopment:https://openknowledge.worldbank.org/bitstream/handle/10986/5990/WDR%202008%20-%20English.pdf?sequence=3
The Montpellier Panel Report 2013, Sustainable Intensification: A New Paradigm for AfricanAgriculture, explores the general problem of defining and attaining sustainable intensificationin Africa:http://www3.imperial.ac.uk/africanagriculturaldevelopment/themontpellierpanel/themontpellierpanelreport2013
Section 7: Productivity growth and conflict areas
There is hardly any evidence-based research on the best ways to restore agriculturalproductivity in conflict areas. An exception is a study by Regina Birner, Marc Cohen andJohn Ilukor, who studied and compared the performance of several different types ofagricultural input supply programmes implemented in post-conflict northern Uganda inRebuilding Agricultural Livelihoods in Post-Conflict Situations: What are the GovernanceChallenges? The Case of Northern Uganda:http://www.ifpri.org/sites/default/files/publications/usspwp07.pdf

37
References
Acemoglu, D. (2002) ‘Directed technical change’, Review of Economic Studies 69, p781-810.
Adato, M. & Meinzen-Dick, R. (eds.) (2007) Agricultural Research, Livelihoods and Poverty:Studies of Economic and Social Impacts in Six Countries. Baltimore: Johns HopkinsUniversity Press.
Alston, J., Chan-Kang, C., Marra, M., Pardey, P., & Wyatt, T. (2000) A meta-analysis of ratesof return to agricultural R&D, ex pede herculem? Research Report 113. Washington, D.C.:IFPRI.
Alston, J., Norton, G. & Pardey, P. (1998) Science under Scarcity: Principles and Practicesfor Agricultural Research Evaluation and Priority Setting. Ithaca, N.Y.: Cornell UniversityPress.
ASTI. (2012) ASTI Global Assessment of Agricultural R&D Spending – Developing CountriesAccelerate Investment. Rome. Available at:http://www.asti.cgiar.org/pdf/ASTI_global_assessment.pdf
Binswanger-Mkhizi, H., de Regt, J. & Spector, S. (eds.) (2010) Local and Community DrivenDevelopment: Moving to Scale in Theory and Practice. Washington, D.C.: World Bank.
Birner, R., Cohen, M. & Ilukor, J. (2011) Rebuilding Agricultural Livelihoods in Post-ConflictSituations: What are the Governance Challenges? The Case of Northern Uganda. UgandaStrategy Support Program (USSP) Working Paper No. USSP 07. IFPRI. Available at:http://www.ifpri.org/sites/default/files/publications/usspwp07.pdf
Boserup, E. (1965) The Conditions of Agricultural Growth. New York: Aldine PublishingCompany.
Bruce, J. & Migot-Adholla, S. (eds). (1994) Searching for Land Tenure Security in Africa.Dubuque, Iowa: Kendall/Hunt Publishing Co.
Chirwa, E. & Dorward, A. (2013) Agricultural Input Subsidies and Malawi’s RecentExperience 2005-2010. Oxford, UK: Oxford University Press.
Christiaensen, L. & Demery, L. (20070 Down to Earth: Agriculture and Poverty Reduction inAfrica. Washington, D.C.: World Bank.
Davis, K., Nkonya, E., Kato, E., Mekonnen, D., Odendo, M., Miiro, R. & Nkuba, J. (2010)Impact of Farmer Field Schools on Agricultural Productivity and Poverty in East Africa.Discussion Paper 992. Washington, D.C.: IFPRI.
Deane, P. (1965) The First Industrial Revolution. Cambridge University Press.
Deininger, K. (2014) ‘Securing Land Rights for Smallholder Farmers’, in Hazell, P. &Rahman, A. (eds.) New Directions for Smallholder Agriculture. Oxford, UK: Oxford UniversityPress.
38
Deininger, K. & Feder, G. (2009) ‘Land registration, governance, and development: evidenceand implications’, World Bank Research Observer 24(2), p233-266.
Dercon, S. & Collier, P. (2013) African agriculture in 50 years: smallholders in a rapidlychanging world? Rome: FAO. Available at:ftp://ftp.fao.org/docrep/fao/012/ak542e/ak542e18.pdf
Dorward, A., Kydd, J., Morrison, J. & Poulton, C. (2005) ‘Institutions, markets and economiccoordination: linking development policy to theory and praxis’, Development and Change36(1), p1-25.
Dorward, A., Kydd, J., Poulton, C. & Bezemer, D. (2009) ‘Coordination risk and cost impactson economic development in poor rural areas’,.Journal of Development Studies, 45(7),p1093-1112.
Doss, C. (2006) ‘Analyzing technology adoption using microstudies: Limitations, challenges,and opportunities for improvement’, Agricultural Economics, 34, p207-219.
Evenson, R. & Gollin, D. (eds.) (2003) Crop Variety Improvement and its Effect onProductivity. Wallingford: CABI Publishing.
Evenson R., Pray, C. & Rosegrant, M. (1999) Agricultural Research and Productivity Growthin India. Research Report No.109. Washington, D.C.: International Food Policy ResearchInstitute.
Fan, S. (2007) ‘Agricultural research and urban poverty in China and India’, in Adato, M. &Meinzen-Dick, R. (eds.) Agricultural Research, Livelihoods, and Poverty: Studies ofEconomic and Social Impacts in Six Countries. Baltimore: Johns Hopkins University Press.
Fan, S., Hazell, P. & Thorat, S. (1999) Linkages Between Government Spending, Growthand Poverty in Rural India. Research Report 110. Washington, D.C.: IFPRI.
Fan, S. & Rao, N. (2008) ‘Public investment, growth and rural poverty’, in Fan, S. (ed.)Public Expenditures, Growth and Poverty: Lessons for Developing Countries. Baltimore:Johns Hopkins University Press.
Feder, G., Just, R. & Zilberman, D. (1985) ‘Adoption of agricultural innovations in developingcountries: A survey’, Economic Development and Cultural Change 33(2), p255-298.
Feder, G. & Nishio, A. (1999) ‘The benefits of land registration and titling: economic andsocial perspectives’, Land Use Policy 15(1), p25-43.
Frankel, F. (1976) India’s Green Revolution: Economic Gains and Political Costs. Princeton,N.J.: Princeton University Press.
Freebairn, D. (1995) ‘Did the Green Revolution concentrate incomes? A quantitative study ofresearch reports’, World Development 23(2), p265-279.
Freeman, H., Shiferaw, B. & Swinton, S. (eds.) (2005) Natural Resource Management inAgriculture: Methods for Assessing Economic and Environmental Impacts. Wallingford, UK:CAB International.
Fuglie, K. (2010) ‘Total factor productivity in the global agricultural economy: Evidence fromFAO data’, in Alston, J., Babcock, B. & Pardey, P. The Shifting Patterns of AgriculturalProduction and Productivity Worldwide. Ames, Iowa: The Midwest Agribusiness Trade
39
Research and Information Center, Iowa State University. Available at:http://www.card.iastate.edu/books/shifting_patterns/pdfs/chapter4.pdf
Geertz, C. (1963) Agricultural Involution: The Process of Ecological Change in Indonesia.Berkeley, CA: University of California Press.
Ghani, E. (ed.) (2010) The Poor Half Billion in South Asia: What is Holding Back LaggingRegions? New Delhi: Oxford University Press.
Goldman, A. & Smith, J. (1995) ‘Agricultural transformations in India and Northern Nigeria:exploring the nature of green revolutions’, World Development 23(2), p243-263.
Gollin, D., Morris, M. & Byerlee, D. (2005) ‘Technology adoption in intensive post-greenrevolution systems’, American Journal of Agricultural Economics 87(5), p1310-1316.
Griffin, K. (1972) The Green Revolution: An Economic Analysis. Geneva: United NationsResearch Institute for Social Development.
Grigg, D. (1984) ‘The agricultural revolution in Western Europe’, in Bayliss-Smith, T. &Wanmali, S. (eds.) Understanding Green Revolutions. Cambridge University Press, p1-15.
Haggblade, S., Hazell, P. & Dorosh, P. (2007) ‘Sectoral growth linkages between agricultureand the rural nonfarm economy’, in Haggblade, S., Hazell, P. & Reardon, T. (eds.)Transforming the Rural Nonfarm Economy. Baltimore: Johns Hopkins University Press,p141-182.
Haggblade, S., Tembo, G., Kabore, D. Reij, C., Ajayi, O., Franzel, S., Mafongoya, P. &Place, F. (2010) ‘Sustainable soil fertility management systems’, in Haggblade, S. & Hazell,P. (eds.) Successes in African Agriculture: Lessons for the Future. Baltimore: Johns HopkinsUniversity Press, p262-319.
Hayami, Y. & Ruttan, V. (1971) ‘Factor prices and technical change in agriculturaldevelopment: the United States and Japan, 1880-1960’, Journal of Political Economy 78,p1115-1141.
Hayami, Y. & Ruttan, V. (1985) Agricultural Development: An International Perspective (2nded). Baltimore: Johns Hopkins University Press.
Hazell, P. (2008) An Assessment of the Impact of Agricultural Research in South Asia sincethe Green Revolution. Rome: CGIAR Science Council Secretariat.
Hazell, P. (2009) ‘The Green Revolution’, in Spielman, D. & Pandya-Lorch, R. Millions Fed:Proven Successes in Agricultural Development. Washington, D.C.: IFPRI. Available athttp://www.ifpri.org/sites/default/files/publications/oc64ch03.pdf
Hazell, P. (2011) New developments in financial risk management tools for farmers. Sciencereview: SR 22. Foresight Project on Global Food and Farming Futures, London: GovernmentOffice for Science. Available at:http://webarchive.nationalarchives.gov.uk/20121212135622/http://www.bis.gov.uk/assets/foresight/docs/food-and-farming/science/11-567-sr22-new-developments-financial-risk-management-for-farmers.pdf
Hazell, P. (2013) Feed the Future Learning Agenda Literature Review: Improved AgriculturalProductivity. USAID. Available at:
40
http://agrilinks.org/sites/default/files/resource/files/Feed%20the%20Future_Learning%20Agenda%20Literature%20Review_Ag%20Productivity_2013.pdf
Hazell, P. & Haddad, L. (2001) Agricultural Research and Poverty Reduction. Food,Agriculture, and the Environment Discussion Paper 34. Washington, D.C.: International FoodPolicy Research Institute.
Hazell, P. & Haggblade, S. (1993) ‘Farm-nonfarm growth linkages and the welfare of thepoor’, in Lipton, M. & van der Gaag, J. (eds.) Including the Poor. Washington, D.C.: WorldBank, p190-204.
Hazell, P. & Wood, S. (2008) ‘Drivers of change in global agriculture’, PhilosophicalTransactions of the Royal Society B 363(1491), p495-515.
Headey, D., Alauddin, M. & Prasada Rao, D. (2010) ‘Explaining agricultural productivitygrowth: an international perspective’, Agricultural Economics 41(2010), p1-14.
Hobbs, P., Sayre, K. & Gupta, R. (2007) ‘The role of conservation agriculture in sustainableagriculture’, Philosophical Transactions of the Royal Society Series B 363 (1491), p543-556.Available at: http://www.ncbi.nlm.nih.gov/pmc/articles/PMC2610169/
International Fund for Agricultural Development and World Food Programme. (2010)Potential for Scale and Sustainability in Weather Index Insurance for Agriculture and RuralLivelihoods. Rome: International Fund for Agricultural Development. Available at:http://www.ifad.org/ruralfinance/pub/weather.pdf
Jack, B. (2013) Constraints on the Adoption of Agricultural Technologies in DevelopingCountries. Literature Review. Agricultural Technology Adoption Initiative, J-PAL (MIT) andCEGA (UC Berkeley).
Joireman, S. (2007) ‘The mystery of capital formation in Sub-Saharan Africa: Women,property rights and customary law’, World Development 36 (7), p1233-1246.
Joshi, P., Jha, A., Wani, S., Joshi, L. & Shiyani, R. (2005) Meta-Analysis to Assess Impact ofWatershed Program and People’s Participation. Comprehensive Assessment ResearchReport 8. Colombo, Sri Lanka: IWMI.
Kerr, J., Pangare, G. & Vasudha, L. (2002) Watershed Development Projects in India: AnEvaluation. Research Report 127. Washington, D.C.: International Food Policy ResearchInstitute.
Larson, D., Anderson, J. & Varangis, P. (2004) ‘Policies on managing risk in agriculturalmarkets’, World Bank Research Observer 19(2), p199-230.
Lipton, M. & Longhurst, R. (1989) New Seeds and Poor People. Baltimore: Johns HopkinsUniversity Press.
Locke, A. & Henley, G. (2014) Topic Guide: Land. UK: Evidence on Demand. Available at:http://www.evidenceondemand.info/topic-guide-land
Masters, W., Andersson Djurfeldt, A., DeHaan, C., Hazell, P., Jayne, T., Jirström, M. &Reardon, T. (2013) Urbanization and Farm Size in Asia and Africa: Implications for FoodSecurity and Agricultural Research. Synthesis paper from an ISPC Foresight Study on FarmSize and Urbanization. Available at: http://www.sciencecouncil.cgiar.org/sections/strategy-trends
41
McDonald, A., Hobbs, P. & Riha, S. (2006) ‘Does the system of rice intensificationoutperform conventional best management? A synopsis of the empirical record’, Field CropsResearch, 96, p31-36.
Meinzen-Dick, R., Knox, A., Place, F. & Swallow, B. (eds.) (2002) Innovation in NaturalResource Management; The Role of Property Rights and Collective Action in DevelopingCountries. Baltimore: Johns Hopkins University Press.
Meinzen-Dick, R. & Mwangi, E. (2008) ‘Cutting the web of interest: pitfalls of formalizingproperty rights’, Land Use Policy 26(1), p36-43.
Meinzen-Dick, R., Quisumbing, A., Behrman, J., Biermayr-Jenzano, P., Wilde, V.,Noordeloos, M., Ragasa, C. & Beintema, N. (2011) Engendering Agricultural Research,Development, and Extension. Research Monograph. Washington, D.C.: IFPRI.
Minot, N. & Benson, T. (2009) Fertilizer Subsidies in Africa: Are Vouchers the Answer? IssueBrief 60. Washington, D.C.: International Food Policy Research Institute.
Mishra , A., Whitten, M., Ketelaar, J. & Salokhe, V. (2006) ‘The system of rice intensification(SRI): a challenge for science, and an opportunity for farmer empowerment towardssustainable agriculture’, International Journal of Agricultural Sustainability 4(3), p193-212.
Moser, C. & Barrett, C. (2003) ‘The disappointing adoption dynamics of a yield-increasing,low external-input technology: the case of SRI in Madagascar’, Agricultural Systems 76,p1085-1100.
Namara, R. Weligamage, P. & Barker, R. (2003) Prospects for Adopting System of RiceIntensification in Sri Lanka: A Socioeconomic Assessment. Research Report 75. Colombo,Sri Lanka: IWMI.
Omamo, S., Diao, X., Wood, S., Chamberlin, J., You, L., Benin, S., Wood-Sichra, U. &Tatwangire, A. (2006) Strategic Priorities for Agricultural Development in Eastern andCentral Africa. Washington, D.C.: International Food Policy Research Institute.
Ostrom, E. (1994) Neither Market nor State: Governance of Common-Poor Resources in theTwenty-First Century. Washington, D.C.: IFPRI. Available at:http://www.ifpri.org/sites/default/files/publications/ls2.pdf
Pender, J., Place, F. Ehui, S. (eds.) (2006) Strategies for Sustainable Land Management inthe East African Highlands. Washington, D.C.: IFPRI.
Pender, J., Scherr, S. & Durón, G. (2001) ‘Pathways of development in the hillside areas ofHonduras: causes and implications for agricultural production, poverty and sustainableresource use’, in Lee, D. & Barrett, C. (eds.) Tradeoffs or Synergies? AgriculturalIntensification, Economic Development and the Environment. Wallingford, UK: CABInternational.
Peterman, A., Behrman, J. & Quisumbing, A. (2010) A Review of Empirical Evidence onGender Differences in Nonland Agricultural Inputs, Technology, and Services in DevelopingCountries. IFPRI Discussion Paper 00975. Washington, D.C.: IFPRI.
Pinstrup-Andersen, P. (1982) Agricultural Research and Technology in EconomicDevelopment. New York: Longman.

42
Place, F., Franzel, S., DeWolf, J., Rommeise, R., Kwesiga, F., Niang, A. & Jama, B. (2002)‘Agroforestry for soil-fertility replenishment: Evidence on adoption processes in Kenya andZambia’, in Barrett, C., Place, F. & Aboud, A. (eds.) Natural Resources Management inAfrican Agriculture. Wallingford, UK: CABI Publishing, p155-168.
Quisumbing, A. (1995) Gender Differences in Agricultural Productivity: A Survey of EmpiricalEvidence. FCND Discussion Paper No. 5. Washington, D.C.: IFPRI.
Quisumbing, A. & Pandolfelli, L. (2010) ‘Promising approaches to address the needs of poorfemale farmers: Resources, constraints, and interventions’, World Development 38(4), p581-592.
Ragasa, C. & Golan, J. (2012) The Role of Rural Producer Organizations for AgriculturalService Provision in Fragile States. IFPRI Discussion paper 01235. Washington, D.C.:IFPRI. Available at: http://www.ifpri.org/sites/default/files/publications/ifpridp01235.pdf
Rao, X., Hurley, M. & Pardey, P. (2012) Recalibrating the reported rates ofreturn to food and agricultural R&D. Staff Paper P12-8. Department of Applied Economics,University of Minnesota. Available at: http://ageconsearch.umn.edu/handle/135018
Ravallion, M. & Datt, G. (1996) ‘How important to India’s poor in the sectoral composition ofeconomic growth?’, World Bank Economic Review 10 (1), p1-26.
Reij, C., Tappan, G. & Smale, M. (2009) ‘Re-greening the Sahel: farmer-led innovation inBurkina Faso and Niger’, in Spielman, D. & Pandya-Lorch, R. (eds.) Millions Fed: ProvenSuccesses in Agricultural Development. Washington, D.C.: IFPRI, p53-58.
Renkow, M. & Byerlee, D. (2010) ‘The impacts of CGIAR research: A review of recentevidence’, Food Policy 35(2010), p391-402.
Rezek, J., Campbell, R. & Rogers, K. (2011) ‘Assessing total factor productivity growth inSub-Saharan African agriculture’, Journal of Agricultural Economics 62(2), p357-374.
Rola, A. & Pingali, P. (1993) Pesticide, Rice Productivity and Farmer’s Health: An EconomicAssessment. Washington, D.C./Los Banos, Philippines: World Resources Institute/IRRI.
Sheehy, J., Sinclair, T. & Cassman, K. (2005) ‘Curiosities, nonsense, non-science and SRI’,Field Crops Research 91, p355-356.
Shiferaw, B., Okello, J. & Reddy, R. (2009) ‘Adoption and adaptation of natural resourcemanagement innovations in smallholder agriculture: reflections on key lessons and bestpractice’, Environment, Development and Sustainability 11, p601-609.
Sinha, S. & Talati, J. (2007) ‘Productivity impacts of the system of rice intensification (SRI): acase study in West Bengal, India’, Agricultural Water Management 87, p55-60.
de Soysa, I. & Petter Gleditsch, N. (with Gibson, M. & Sollenberg, M) (1999) To CultivatePeace: Agriculture in a World of Conflict. Environmental Change & Security Project Report,Issue 5 (summer 1999) 15. Washington, D.C.: Wilson Center. Available at:http://www.wilsoncenter.org/sites/default/files/feature2.pdf
Susmita, D., Meisner, C. & Wheeler, D. (2007) ‘Is environmentally friendly agriculture lessprofitable for farmers? Evidence on Integrated Pest Management in Bangladesh’, Review ofAgricultural Economics 29(1), p103-118.
43
Swinnen, J. & Maertens, M. (2010) Finance through food and commodity value chains in aglobalized economy. KfW Financial Sector Development Symposium 2010, Finance forFood: Towards New Agricultural Rural Finance. Available at:https://lirias.kuleuven.be/bitstream/123456789/290158/1/Financial_Sector_Symposium_Berlin_2010_-_Session_2_-_Jo_Swinnen_-_Paper%5B1%5D.pdf
Thirtle, C., Lin, L. & Piesse, J. (2003) ‘The impact of research-led agricultural productivitygrowth on poverty reduction in Africa, Asia, and Latin America’, World Development 31 (12),p1959-1975.
Tiffen, M., Mortimore, M. & Gichuki, F. (1994) More People, Less Erosion: EnvironmentalRecovery in Kenya. Chichester, UK: Wiley.
Tripp, R. (2006) Self-Sufficient Agriculture: Labour and Knowledge in Small-Scale Farming.London: Earthscan.
Udry, C., Hoddinott, J., Alderman, H. & Haddad, L. (1995) ‘Gender differentials in farmproductivity: implications for household efficiency and agricultural policy’, Food Policy 20,p407-423.
Uphoff, N. (2001) ‘Balancing development and environmental goals through community-based natural resource management’, in Lee, D. & Barrett, C. (eds.) Tradeoffs or Synergies?Agricultural Intensification, Economic Development and the Environment. Wallingford, UK:CAB International, p433-450.
Uphoff, N. (2003) ‘Higher yields with fewer external inputs? The system of rice intensificationand potential contributions to agricultural sustainability’, International Journal of AgriculturalSustainability 1(1), p38-50.
Wiggins, S. & Keats, S. (2013) Leaping and Learning: Linking Smallholders to Markets.Agriculture for Impact. London: Imperial College. Available at:https://workspace.imperial.ac.uk/africanagriculturaldevelopment/Public/LeapingandLearning_FINAL.pdf
World Bank. (2007) World Development Report 2008: Agriculture for Development.Washington, D.C. Available at:http://siteresources.worldbank.org/INTWDRS/Resources/477365-1327599046334/WDR_00_book.pdf
World Bank. (2011) World Development Report 2011: Conflict, Security, and Development.Washington, D.C. Available at:http://siteresources.worldbank.org/INTWDRS/Resources/WDR2011_Full_Text.pdf