EOR in Fractured Carbonate Reservoirs – low salinity low temperature conditions
By
Aparna Raju Sagi, Maura C. Puerto, Clarence A. Miller, George J. Hirasaki
Rice University
Mehdi Salehi, Charles Thomas
TIORCO
April 26, 2011
Outline
• EOR strategy for fractured reservoirs
• Evaluation at room temperature (~25 °C)o Phase behavior studies – surfactant selectiono Viscosity measurementso Imbibition experimentso Adsorption experiments
• Evaluation at 30 °C and live oilo Phase behavior experimentso Imbibition experiements
• Conclusions
2

3
EOR strategy
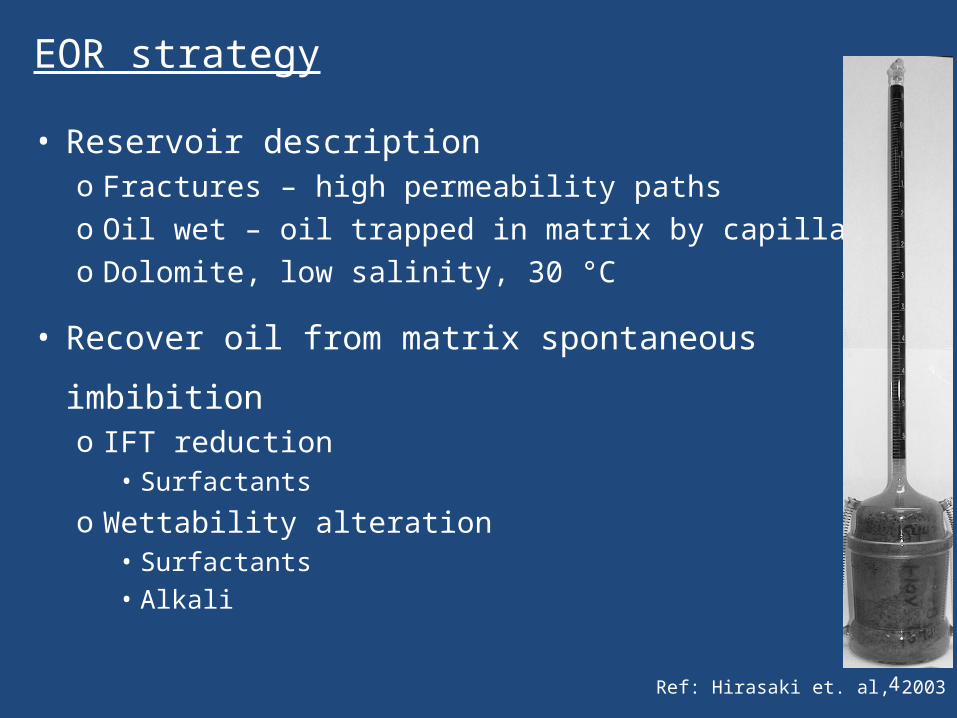
• Reservoir description o Fractures – high permeability pathso Oil wet – oil trapped in matrix by capillarityo Dolomite, low salinity, 30 °C
• Recover oil from matrix spontaneous imbibitiono IFT reduction
• Surfactants
o Wettability alteration• Surfactants
• Alkali
EOR strategy
4Ref: Hirasaki et. al, 2003
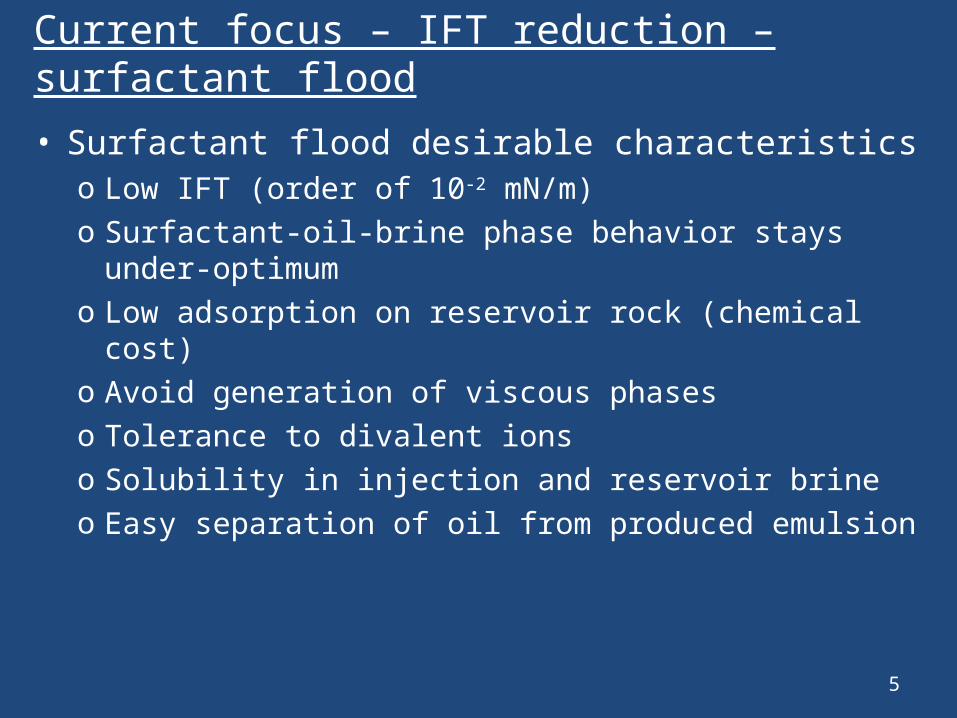
Current focus – IFT reduction – surfactant flood
• Surfactant flood desirable characteristicso Low IFT (order of 10-2 mN/m)o Surfactant-oil-brine phase behavior stays under-
optimumo Low adsorption on reservoir rock (chemical cost)o Avoid generation of viscous phases o Tolerance to divalent ionso Solubility in injection and reservoir brineo Easy separation of oil from produced emulsion
5

6
Phase behavior studies at ~ 25 °C
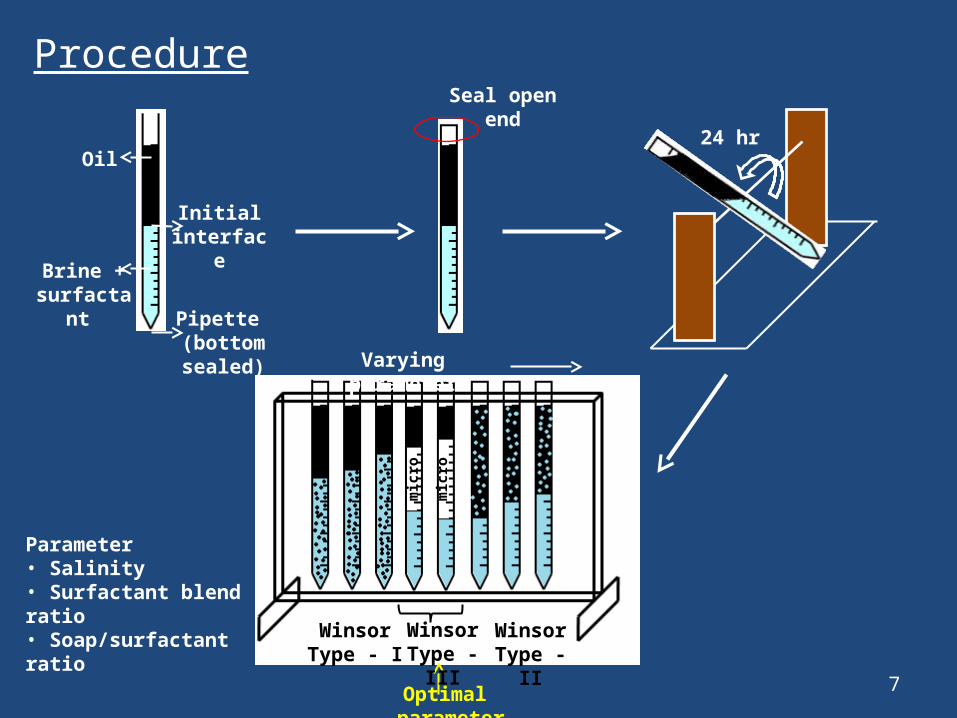
Parameter• Salinity• Surfactant blend ratio• Soap/surfactant ratio
Optimal parameter
Winsor Type - I
Winsor Type - II
Varying parameter
Winsor Type - III
mic
ro
mic
ro
Procedure
7
Pipette (bottom sealed)
Brine + surfactant
Oil
Initial interface
Seal open end
24 hr
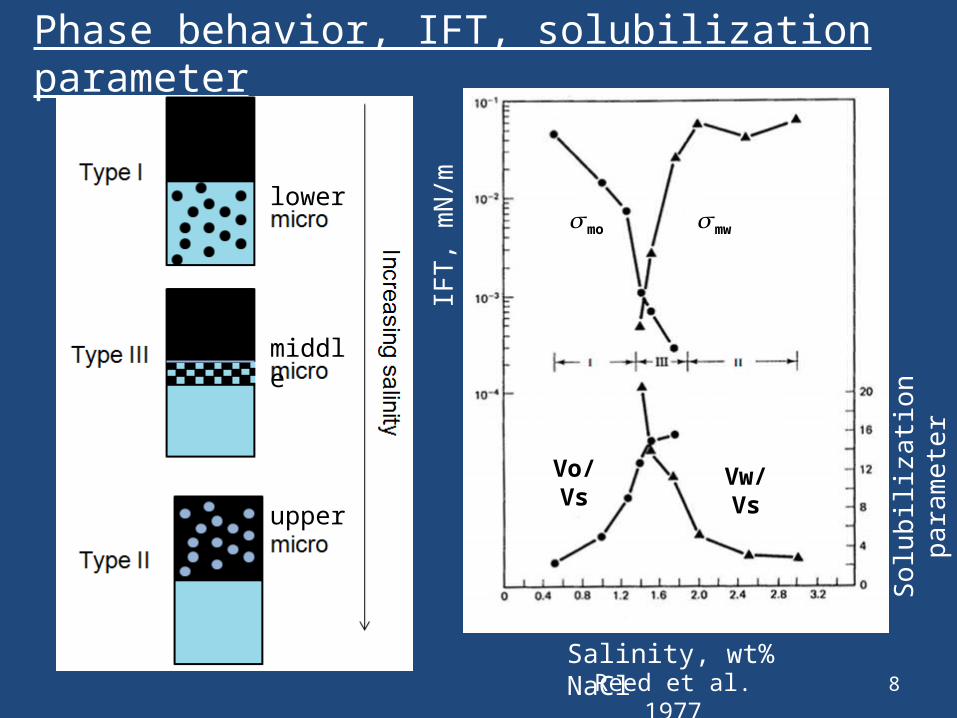
Phase behavior, IFT, solubilization parameter
8Reed et al. 1977Salinity, wt% NaCl
IFT
, mN
/m
So
lub
iliza
tion
pa
ram
ete
r
𝜎mo
𝜎mw
Vo/Vs Vw/Vs
middle
upper
lower
Phase behavior
• Purpose of phase behavior studieso Determine optimal salinity, Cø
• transition from Winsor Type I to Winsor Type II
o Calculate solubilization ratio, Vo/Vs and Vw/Vso Detect viscous emulsions (undesirable)
• Parameterso Salinity – 11,000 ppm (incl Ca, Mg)o Surfactant type, Blend ratio (2 surfactants)o Oil type – dead oil vs. live oilo Water oil ratio (WOR)o Surfactant concentration
9
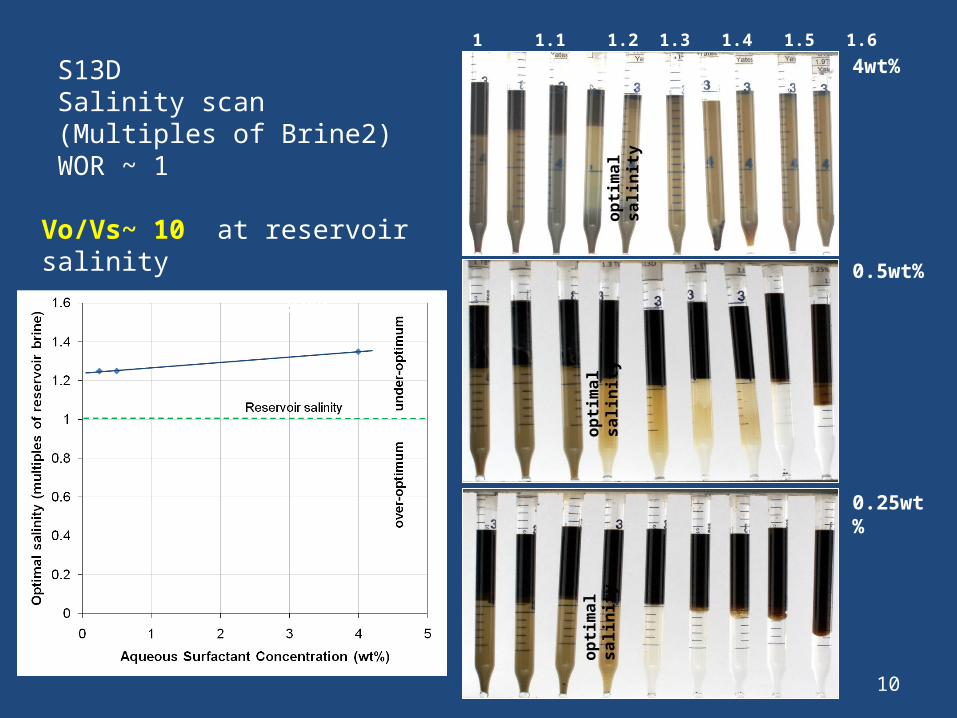
4wt%1 1.1 1.2 1.3 1.4 1.5 1.6 1.7 1.8 1.9 Brine2
S13D Salinity scan (Multiples of Brine2)WOR ~ 1
0.5wt%
0.25wt%
op
tim
al
sa
lin
ity
op
tim
al
sa
lin
ity
op
tim
al
sa
lin
ity
Vo/Vs~ 10 at reservoir salinity
10

11
Viscosity studiesat ~ 25 °C
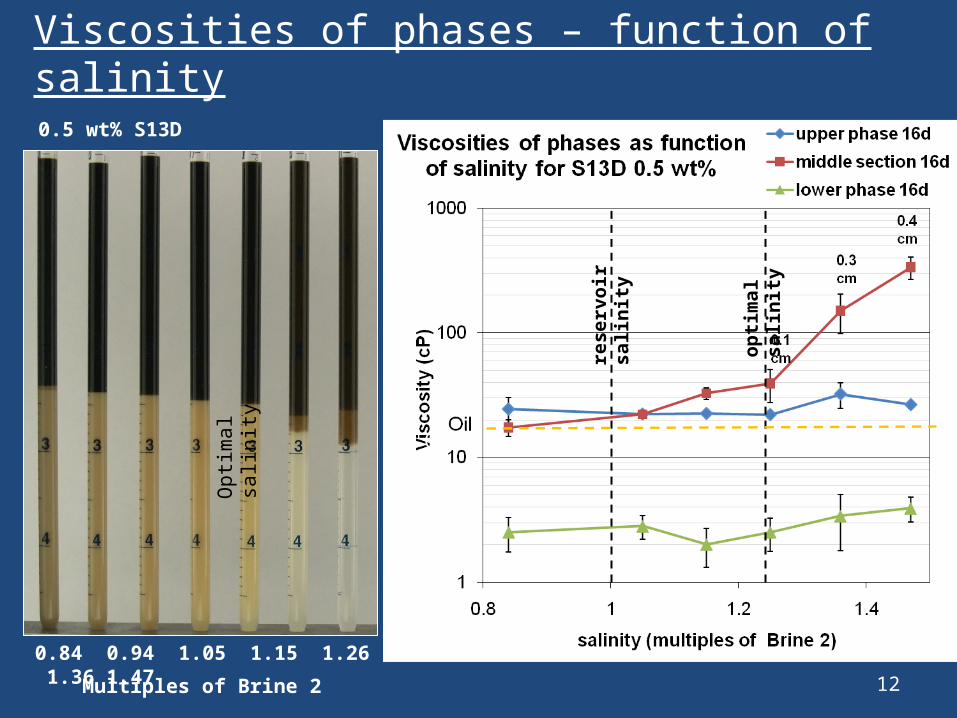
Viscosities of phases – function of salinity
12
0.84 0.94 1.05 1.15 1.26 1.36 1.47
Multiples of Brine 2
Op
tima
l sa
linity
rese
rvo
ir s
alin
ity
op
tim
al s
alin
ity
Oil
0.5 wt% S13D

13
Imbibition studiesat ~ 25 °C
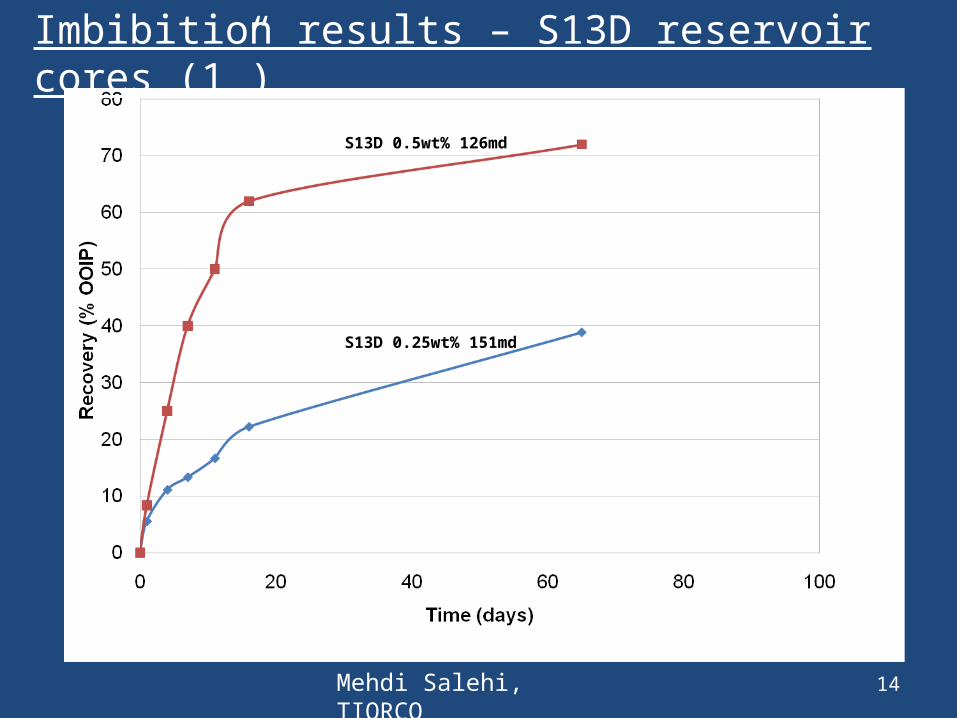
Imbibition results – S13D reservoir cores (1”)
14
S13D 0.5wt% 126md
S13D 0.25wt% 151md
Mehdi Salehi, TIORCO
S13D candidate for EORo under-optimum at reservoir salinityo stays under-optimum upon dilutiono Vo/Vs~10 (at 4wt% surfactant concentration)
indicative of low IFToNo high viscosity phases at reservoir salinityo ~ 70% recovery in imbibition tests
15
16
Adsorption studiesat ~ 25 °C
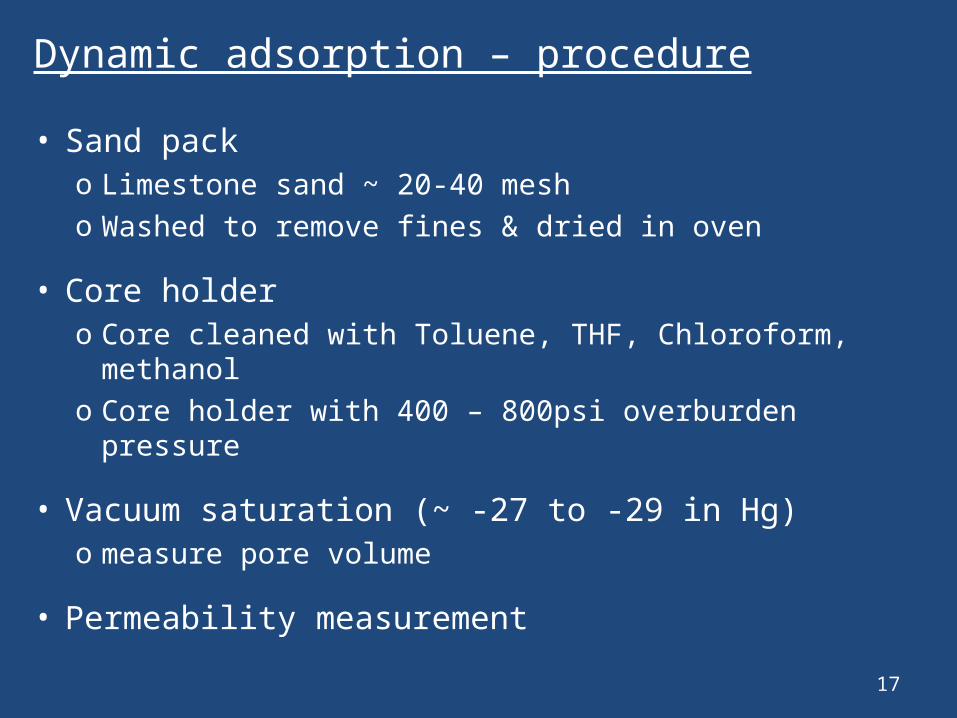
Dynamic adsorption – procedure
• Sand pack o Limestone sand ~ 20-40 mesh o Washed to remove fines & dried in oven
• Core holdero Core cleaned with Toluene, THF, Chloroform, methanolo Core holder with 400 – 800psi overburden pressure
• Vacuum saturation (~ -27 to -29 in Hg) o measure pore volume
• Permeability measurement
17
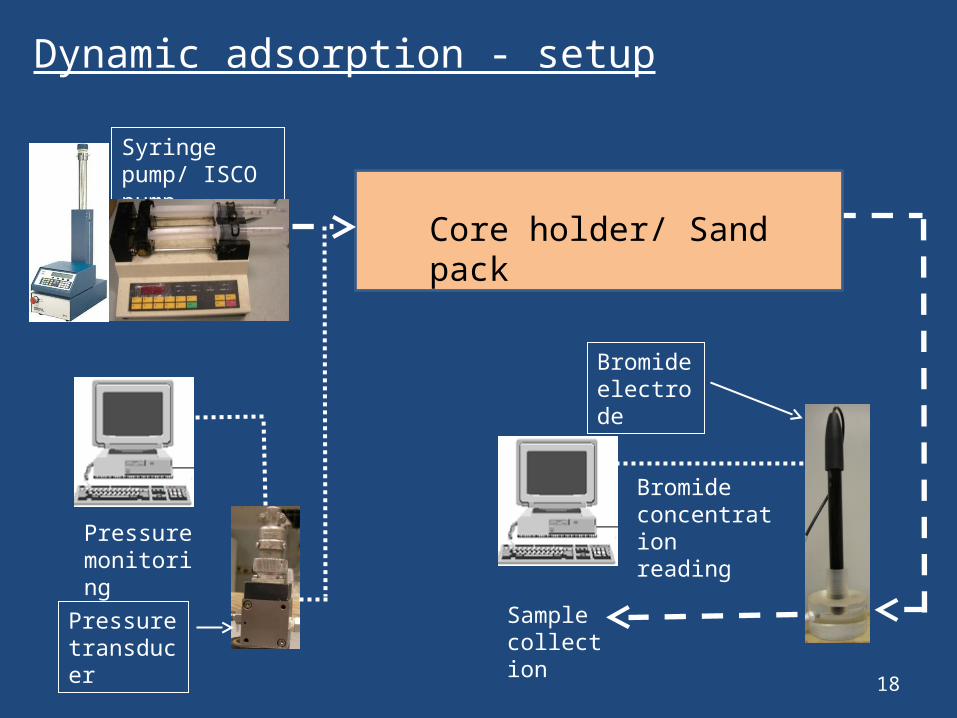
Dynamic adsorption - setup
18
Sample collection
Bromide concentration reading
Bromide electrode
Pressure transducer
Pressure monitoring
Core holder/ Sand pack
Syringe pump/ ISCO pump
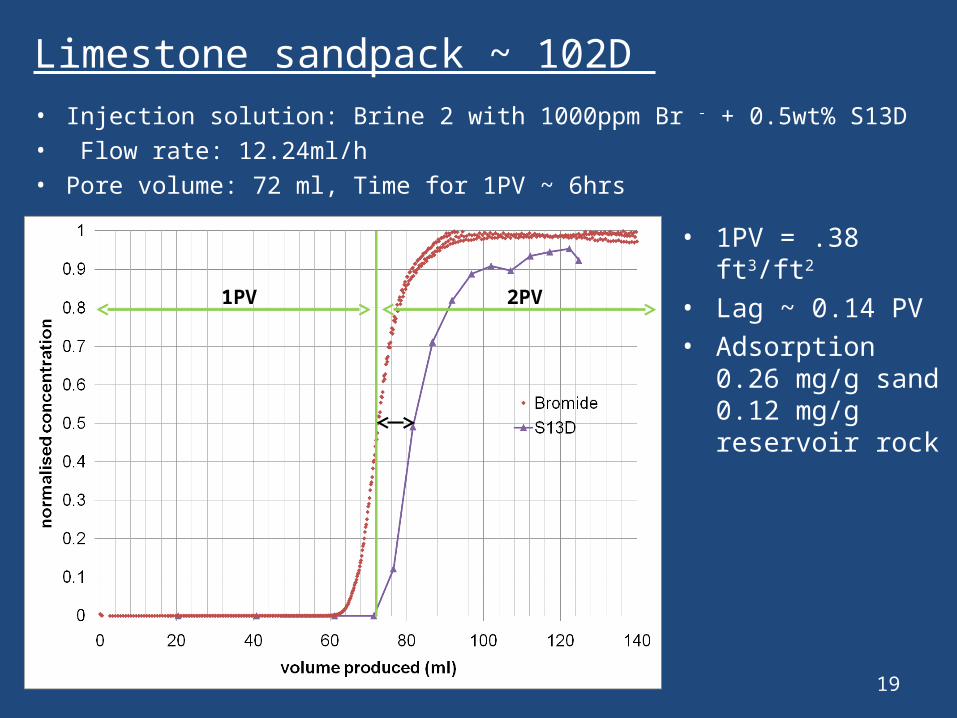
Limestone sandpack ~ 102D
• Injection solution: Brine 2 with 1000ppm Br - + 0.5wt% S13D• Flow rate: 12.24ml/h• Pore volume: 72 ml, Time for 1PV ~ 6hrs
19
• 1PV = .38 ft3/ft2
• Lag ~ 0.14 PV• Adsorption
0.26 mg/g sand0.12 mg/g reservoir rock
1PV 2PV
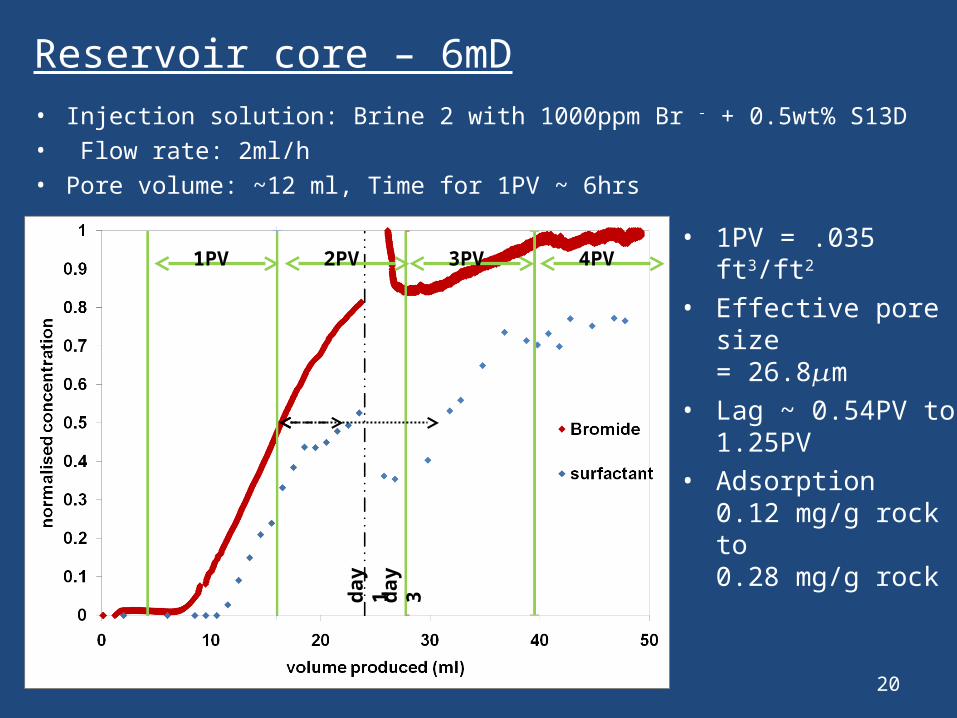
Reservoir core – 6mD
20
• Injection solution: Brine 2 with 1000ppm Br - + 0.5wt% S13D• Flow rate: 2ml/h• Pore volume: ~12 ml, Time for 1PV ~ 6hrs
• 1PV = .035 ft3/ft2
• Effective pore size = 26.8𝜇m
• Lag ~ 0.54PV to 1.25PV
• Adsorption0.12 mg/g rock to0.28 mg/g rock
3PV 4PV
da
y 1
da
y 3
2PV1PV
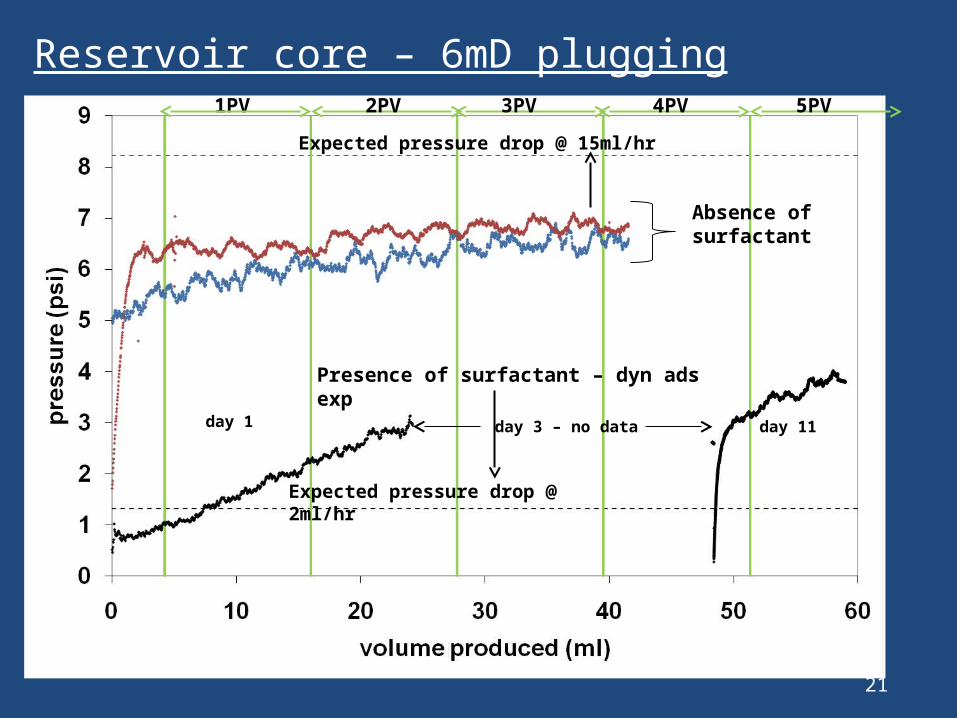
Reservoir core – 6mD plugging
21
Expected pressure drop @ 15ml/hr
Expected pressure drop @ 2ml/hr
Absence of surfactant
Presence of surfactant – dyn ads exp
day 1 day 11day 3 – no data
1PV 2PV 3PV 4PV 5PV
By Yu Bian
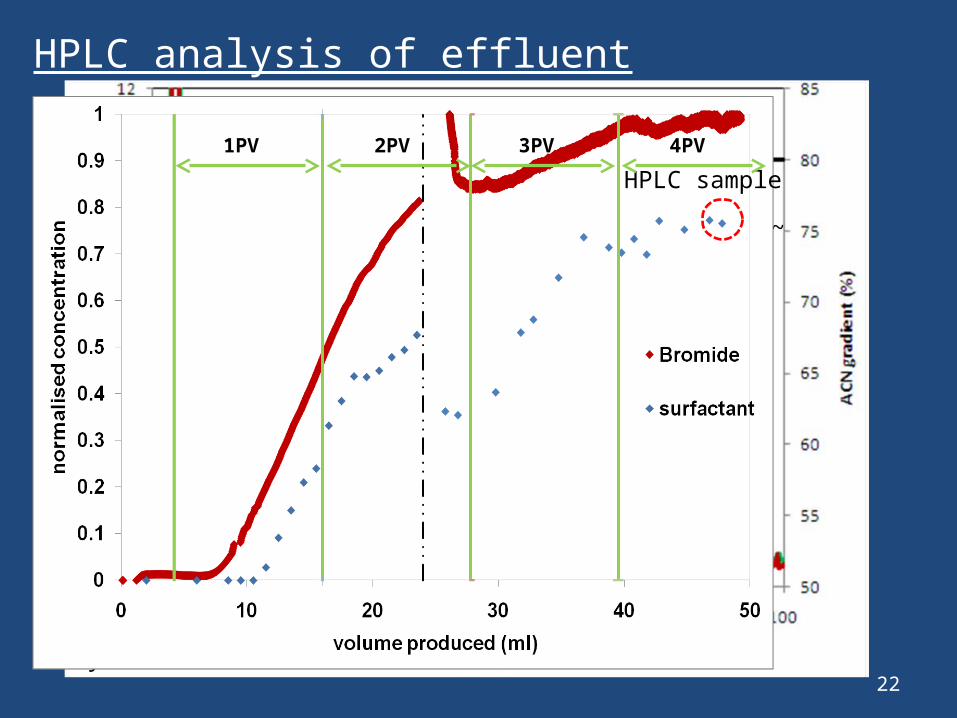
diff in area ~ 21 %
3PV 4PV
da
y 1
da
y 3
2PV1PV
HPLC sample
HPLC analysis of effluent
22
3PV 4PV2PV1PV
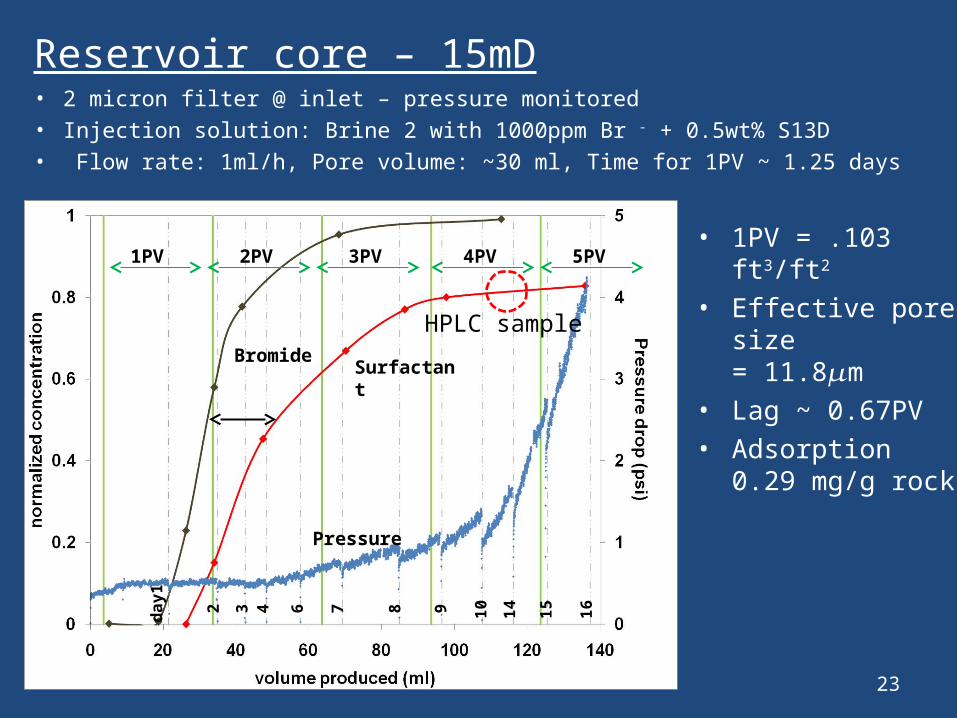
Reservoir core – 15mD
23
• 2 micron filter @ inlet – pressure monitored• Injection solution: Brine 2 with 1000ppm Br - + 0.5wt% S13D• Flow rate: 1ml/h, Pore volume: ~30 ml, Time for 1PV ~ 1.25 days
• 1PV = .103 ft3/ft2
• Effective pore size= 11.8𝜇m
• Lag ~ 0.67PV• Adsorption
0.29 mg/g rock
Surfactant
Pressure
Bromide
1PV 2PV 3PV 4PV 5PV
da
y1
2 3 4 6 7 8 9 10
14
15
16
HPLC sample
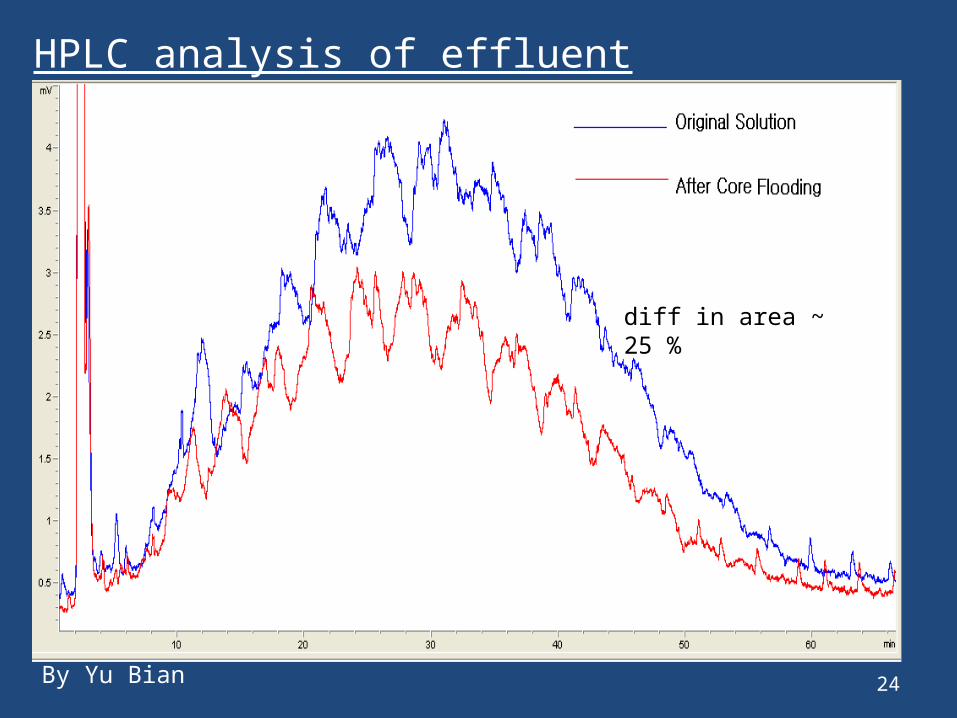
HPLC analysis of effluent
24
diff in area ~ 25 %
By Yu Bian
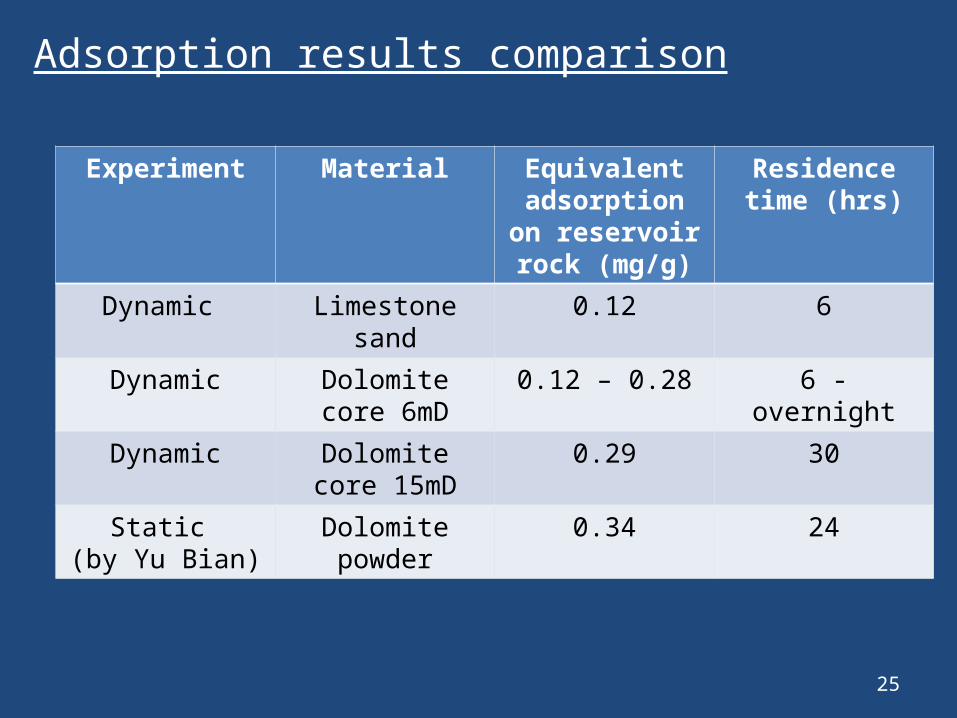
Adsorption results comparison
25
Experiment Material Equivalent adsorption on reservoir rock
(mg/g)
Residence time (hrs)
Dynamic Limestone sand 0.12 6
Dynamic Dolomite core 6mD
0.12 – 0.28 6 - overnight
Dynamic Dolomite core 15mD
0.29 30
Static (by Yu Bian)
Dolomite powder 0.34 24

26
Phase behavior studies at ~ 30 °C
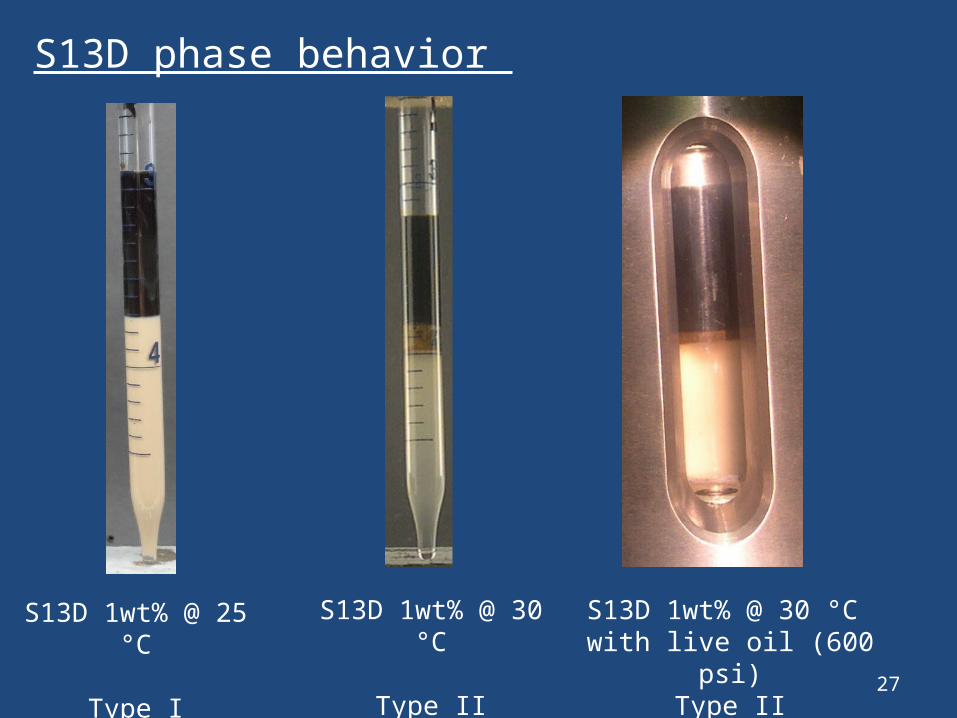
S13D phase behavior
27
S13D 1wt% @ 25 °C
Type I microemulsion
S13D 1wt% @ 30 °C
Type II microemulsion
S13D 1wt% @ 30 °C with live oil (600 psi)
Type II microemulsion
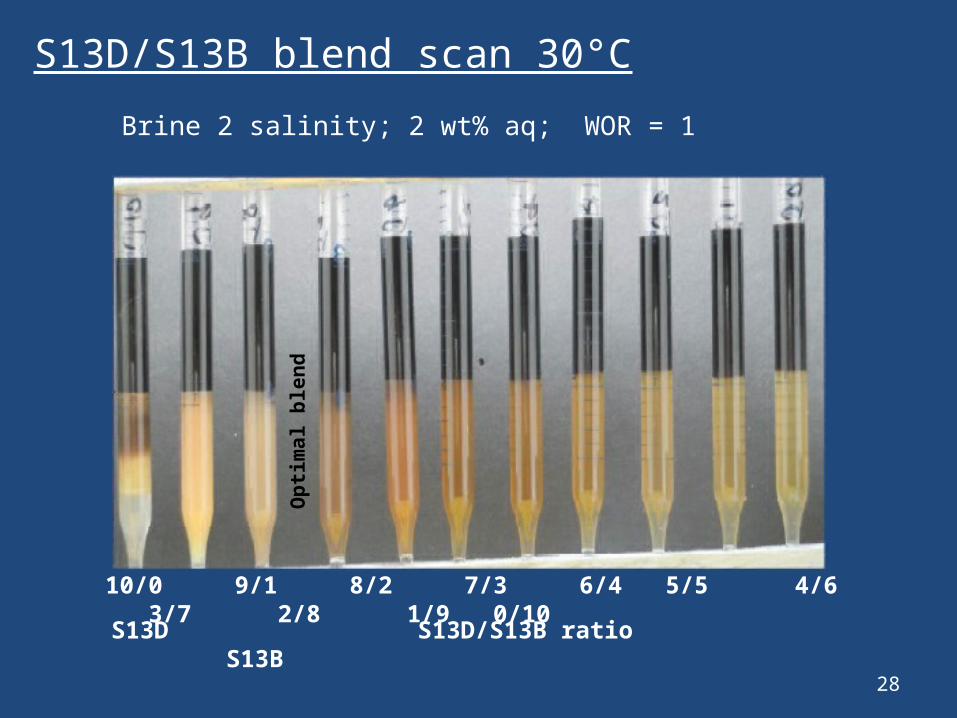
S13D/S13B blend scan 30°C
28
10/0 9/1 8/2 7/3 6/4 5/5 4/6 3/7 2/8 1/9 0/10
S13D S13D/S13B ratio S13B
Brine 2 salinity; 2 wt% aq; WOR = 1
Op
tim
al
ble
nd
29
5
4
3
2
1
0S13D 10 9 8 7 6 5 4 3 2 1 0S13B 0 1 2 3 4 5 6 7 8 9 10
5
4
3
2
1
0
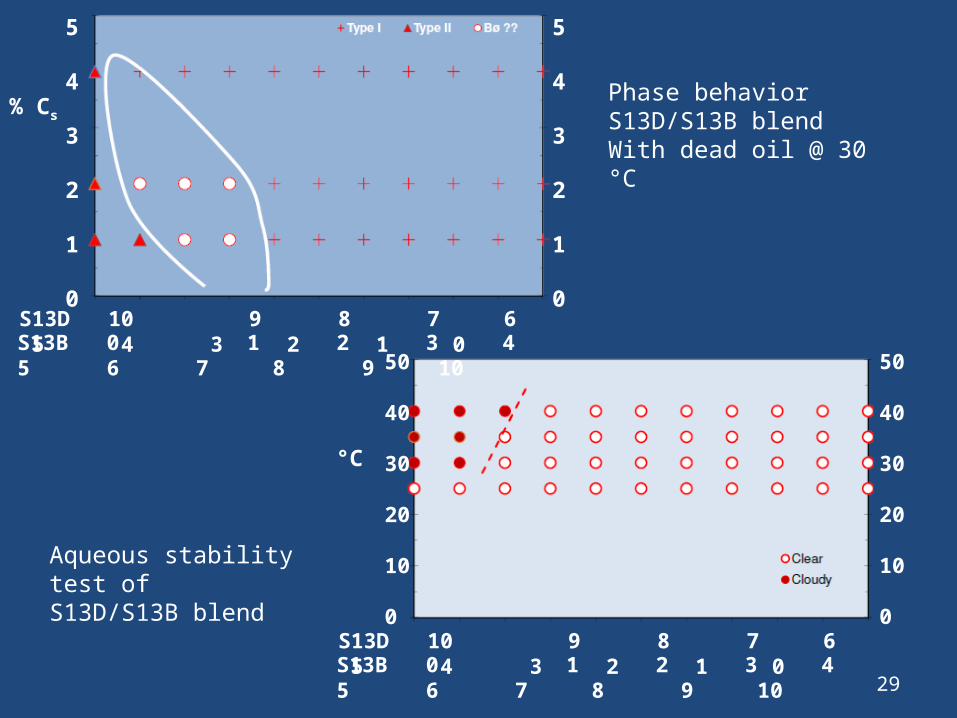
% Cs
°C
50
40
30
20
10
0S13D 10 9 8 7 6 5 4 3 2 1 0S13B 0 1 2 3 4 5 6 7 8 9 10
50
40
30
20
10
0
Phase behavior S13D/S13B blend With dead oil @ 30 °C
Aqueous stability test ofS13D/S13B blend
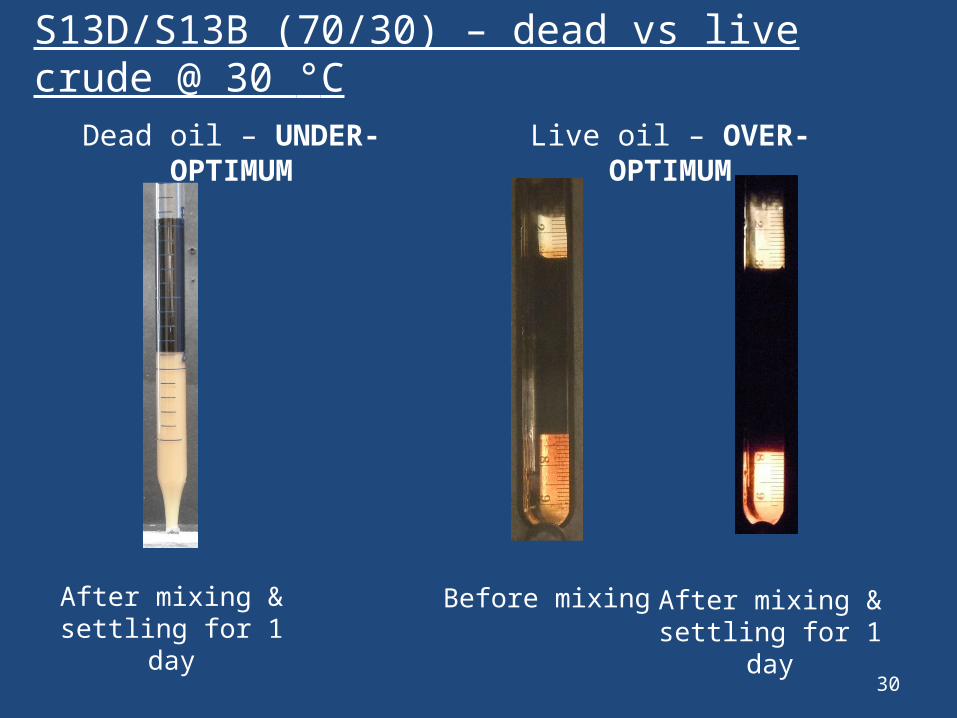
S13D/S13B (70/30) – dead vs live crude @ 30 °C
30
Dead oil – UNDER-OPTIMUM Live oil – OVER-OPTIMUM
After mixing & settling for 1 day
Before mixingAfter mixing & settling for 1 day

31
Imbibition studiesat ~ 30 °C
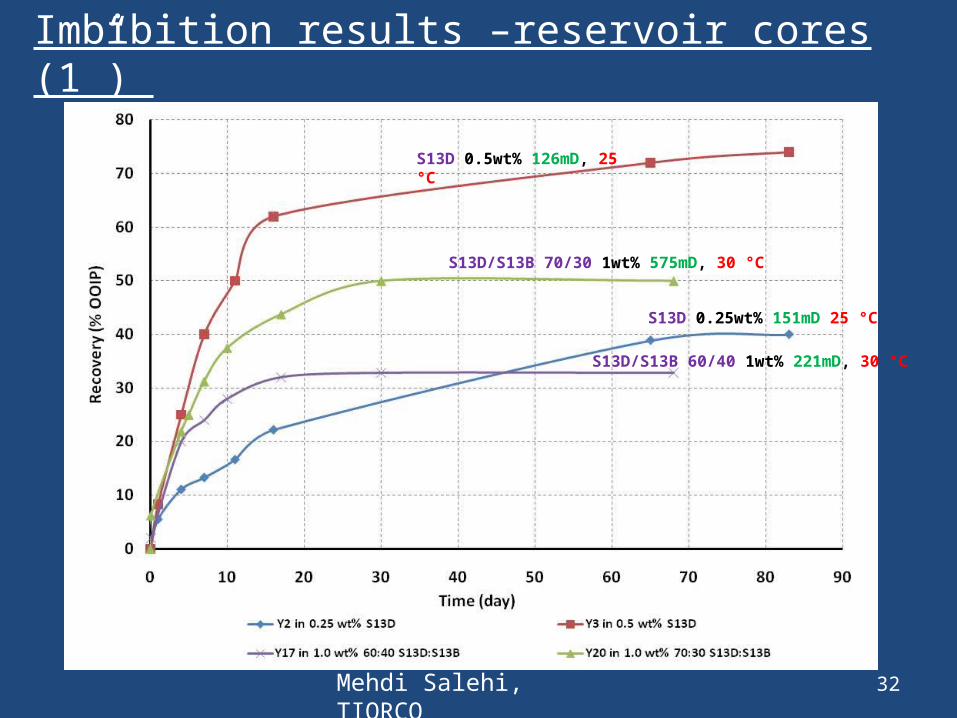
Imbibition results –reservoir cores (1”)
32
S13D 0.5wt% 126mD, 25 °C
S13D 0.25wt% 151mD 25 °C
Mehdi Salehi, TIORCO
S13D/S13B 70/30 1wt% 575mD, 30 °C
S13D/S13B 60/40 1wt% 221mD, 30 °C

33
Conclusions
Conclusions
• Dynamic adsorption experiments (absence of oil)o Effluent surfactant concentration plateaus at ~80%
injected concentrationo Higher PO components are deficient in the effluent
sample (in plateau region)o Increase in pressure drop with volume throughput
• Sensitivity of phase behavior to temperature and oil
(dead vs. live)
• S13D/S13B 70/30 @ 30 °C performance poor
compared to S13D @ 25 °C34

35
Questions
Recommended