Embed Size (px)
Citation preview
MEASURINGPROGRESSA Practical Guide from the Developers of the EnvironmentalPerformance Index (EPI)
Yale Center for Environmental Law & Policy

2
AuthorsAngel HsuDirector,Environmental PerformanceMeasurement ProjectYale Center for Environmental Law & Policy (YCELP)
Laura JohnsonResearch AssociateYale Center for Environmental Law & Policy (YCELP)
Ainsley LloydResearch AssociateYale Center for Environmental Law & Policy (YCELP)
ContributorsAlex de SherbininSenior Research AssociateCenter for International EarthScience Information Network(CIESIN), The Earth Institute,Columbia University
William DornbosDirectorEnvironment Northeast - Connecticut
Jay EmersonAssociate ProfessorDepartment of Statistics,Yale University
Daniel C. EstyHillhouse Professor ofEnvironmental Law & PolicyYale University
Nora HawkinsResearch AssociateYale Center for Environmental Law & Policy (YCELP)
Marc LevyDeputy DirectorCenter for International EarthScience Information Network(CIESIN), The Earth Institute,Columbia University
ReviewersAlex de SherbininSenior Research AssociateCenter for International EarthScience Information Network(CIESIN), The Earth Institute,Columbia University
Jay EmersonAssociate ProfessorDepartment of Statistics,Yale University
Josh GalperinAssociate DirectorYale Center for Environmental Law & Policy (YCELP)
Aaron ReubenResearch AssociateYale Center for Environmental Law & Policy (YCELP)
Fiona Schwab Senior AdvisorOffice of Strategic Affairs (AbuDhabi, United Arab Emirates)
Tanja SrebotnjakSenior FellowEcologic Institute
Susanne StahlProgram CoordinatorYale Center for Environmental Law & Policy (YCELP)
July, 2013Hsu, A., L.A. Johnson, and A. Lloyd. 2013. Measuring Progress: A Practical Guide From the Developers of
the Environmental Performance Index (EPI). New Haven: Yale Center for Environmental Law & Policy.
Acknowledgments

Table of Contents
Chapter 1: Introduction . . . . . . . . . . . . . . . . . . . . . . . . . . . . . . . . . . . . . . . . . . . . . . . . . . . . . . . . . . . . . . . . . . . . . . . . . . . . . . . . . 4
Why the EPI? . . . . . . . . . . . . . . . . . . . . . . . . . . . . . . . . . . . . . . . . . . . . . . . . . . . . . . . . . . . . . . . . . . . . . . . . . . . . . . . . . . . . . . . . . . . . . . . . . . . . . .5History and Evolution of the EPI . . . . . . . . . . . . . . . . . . . . . . . . . . . . . . . . . . . . . . . . . . . . . . . . . . . . . . . . . . . . . . . . . . . . . . . . . . . . . . . . . . .7Who Should Use This Guide . . . . . . . . . . . . . . . . . . . . . . . . . . . . . . . . . . . . . . . . . . . . . . . . . . . . . . . . . . . . . . . . . . . . . . . . . . . . . . . . . . . . . . .9Structure of this Guide . . . . . . . . . . . . . . . . . . . . . . . . . . . . . . . . . . . . . . . . . . . . . . . . . . . . . . . . . . . . . . . . . . . . . . . . . . . . . . . . . . . . . . . . . . . 10
Chapter 2: Establishing the Basis of an Index . . . . . . . . . . . . . . . . . . . . . . . . . . . . . . . . . . . . . . . . . . . . . . . . . . . . . . . . . . 12
Overall Goals of an Index . . . . . . . . . . . . . . . . . . . . . . . . . . . . . . . . . . . . . . . . . . . . . . . . . . . . . . . . . . . . . . . . . . . . . . . . . . . . . . . . . . . . . . . . 13Audience . . . . . . . . . . . . . . . . . . . . . . . . . . . . . . . . . . . . . . . . . . . . . . . . . . . . . . . . . . . . . . . . . . . . . . . . . . . . . . . . . . . . . . . . . . . . . . . . . . . . . . . . 17Principles . . . . . . . . . . . . . . . . . . . . . . . . . . . . . . . . . . . . . . . . . . . . . . . . . . . . . . . . . . . . . . . . . . . . . . . . . . . . . . . . . . . . . . . . . . . . . . . . . . . . . . . . 18
Chapter 3: Preparing the Process . . . . . . . . . . . . . . . . . . . . . . . . . . . . . . . . . . . . . . . . . . . . . . . . . . . . . . . . . . . . . . . . . . . . . . . 20
Management Team . . . . . . . . . . . . . . . . . . . . . . . . . . . . . . . . . . . . . . . . . . . . . . . . . . . . . . . . . . . . . . . . . . . . . . . . . . . . . . . . . . . . . . . . . . . . . . 21The Contribution of Experts . . . . . . . . . . . . . . . . . . . . . . . . . . . . . . . . . . . . . . . . . . . . . . . . . . . . . . . . . . . . . . . . . . . . . . . . . . . . . . . . . . . . . .22Evaluating Expert Input . . . . . . . . . . . . . . . . . . . . . . . . . . . . . . . . . . . . . . . . . . . . . . . . . . . . . . . . . . . . . . . . . . . . . . . . . . . . . . . . . . . . . . . . . . 24Process and Timeline . . . . . . . . . . . . . . . . . . . . . . . . . . . . . . . . . . . . . . . . . . . . . . . . . . . . . . . . . . . . . . . . . . . . . . . . . . . . . . . . . . . . . . . . . . . . 25
Chapter 4: Building an Indicator Framework . . . . . . . . . . . . . . . . . . . . . . . . . . . . . . . . . . . . . . . . . . . . . . . . . . . . . . . . . . . 30
Designing the Indicator Framework . . . . . . . . . . . . . . . . . . . . . . . . . . . . . . . . . . . . . . . . . . . . . . . . . . . . . . . . . . . . . . . . . . . . . . . . . . . . . 31Considerations for Indicator Selection . . . . . . . . . . . . . . . . . . . . . . . . . . . . . . . . . . . . . . . . . . . . . . . . . . . . . . . . . . . . . . . . . . . . . . . . . . . 37
Chapter 5: Evaluating Data Quality . . . . . . . . . . . . . . . . . . . . . . . . . . . . . . . . . . . . . . . . . . . . . . . . . . . . . . . . . . . . . . . . . . . . 42
Data Quality Criteria and Standards . . . . . . . . . . . . . . . . . . . . . . . . . . . . . . . . . . . . . . . . . . . . . . . . . . . . . . . . . . . . . . . . . . . . . . . . . . . . . . 43Data Sources and Collection . . . . . . . . . . . . . . . . . . . . . . . . . . . . . . . . . . . . . . . . . . . . . . . . . . . . . . . . . . . . . . . . . . . . . . . . . . . . . . . . . . . . . 46Formatting and Organizing Data . . . . . . . . . . . . . . . . . . . . . . . . . . . . . . . . . . . . . . . . . . . . . . . . . . . . . . . . . . . . . . . . . . . . . . . . . . . . . . . . 49Exploratory Data Analysis . . . . . . . . . . . . . . . . . . . . . . . . . . . . . . . . . . . . . . . . . . . . . . . . . . . . . . . . . . . . . . . . . . . . . . . . . . . . . . . . . . . . . . . . 49Data Quality Grading . . . . . . . . . . . . . . . . . . . . . . . . . . . . . . . . . . . . . . . . . . . . . . . . . . . . . . . . . . . . . . . . . . . . . . . . . . . . . . . . . . . . . . . . . . . . 51Time Series Data Analysis . . . . . . . . . . . . . . . . . . . . . . . . . . . . . . . . . . . . . . . . . . . . . . . . . . . . . . . . . . . . . . . . . . . . . . . . . . . . . . . . . . . . . . . . 51
Chapter 6: Constructing an Index . . . . . . . . . . . . . . . . . . . . . . . . . . . . . . . . . . . . . . . . . . . . . . . . . . . . . . . . . . . . . . . . . . . . . .54
Determining Targets . . . . . . . . . . . . . . . . . . . . . . . . . . . . . . . . . . . . . . . . . . . . . . . . . . . . . . . . . . . . . . . . . . . . . . . . . . . . . . . . . . . . . . . . . . . . . 55Indicator Calculation . . . . . . . . . . . . . . . . . . . . . . . . . . . . . . . . . . . . . . . . . . . . . . . . . . . . . . . . . . . . . . . . . . . . . . . . . . . . . . . . . . . . . . . . . . . . 59Weighting and Aggregation . . . . . . . . . . . . . . . . . . . . . . . . . . . . . . . . . . . . . . . . . . . . . . . . . . . . . . . . . . . . . . . . . . . . . . . . . . . . . . . . . . . . . 62Aggregation Methods . . . . . . . . . . . . . . . . . . . . . . . . . . . . . . . . . . . . . . . . . . . . . . . . . . . . . . . . . . . . . . . . . . . . . . . . . . . . . . . . . . . . . . . . . . . .66
Conclusion . . . . . . . . . . . . . . . . . . . . . . . . . . . . . . . . . . . . . . . . . . . . . . . . . . . . . . . . . . . . . . . . . . . . . . . . . . . . . . . . . . . . . . . . . . . . . 70
Glossary . . . . . . . . . . . . . . . . . . . . . . . . . . . . . . . . . . . . . . . . . . . . . . . . . . . . . . . . . . . . . . . . . . . . . . . . . . . . . . . . . . . . . . . . . . . . . . . . 72
List of Key Acronyms . . . . . . . . . . . . . . . . . . . . . . . . . . . . . . . . . . . . . . . . . . . . . . . . . . . . . . . . . . . . . . . . . . . . . . . . . . . . . . . . . . 73
Appendix 1. Additional Resources and Index Efforts . . . . . . . . . . . . . . . . . . . . . . . . . . . . . . . . . . . . . . . . . . . . . . . . . . 74
Appendix 2. Examples of Indicator Frameworks . . . . . . . . . . . . . . . . . . . . . . . . . . . . . . . . . . . . . . . . . . . . . . . . . . . . . . . 75
Appendix 3. Example of EPI Metadata . . . . . . . . . . . . . . . . . . . . . . . . . . . . . . . . . . . . . . . . . . . . . . . . . . . . . . . . . . . . . . . . . 78
Appendix 4. 2005 ESI Data Grading Rubric . . . . . . . . . . . . . . . . . . . . . . . . . . . . . . . . . . . . . . . . . . . . . . . . . . . . . . . . . . . . 79
3
Measuring Progress:A Practical Guide From the Developers of the Environmental Performance Index (EPI)

4
Measuring Progress: A Practical Guide From the Developers of the Environmental Performance Index (EPI)
Introduction11

IntroductionWe are currently in an age of information dilemmas. Although data and statistics are now more accessiblethan ever due to technological advances, we still suffer from knowledge gaps and informationasymmetries. While these gaps will always persist, the challenge lies in bridging scientific understandingwith needed data collection to effectively manage an issue at multiple scales–locally, regionally, andglobally. Particularly with respect to the environment, decisions have historically relied too heavily on“educated guesses but not hard facts,” allowing critics to dismiss the importance of pollution control andnatural resource management.1
Environmental indicators and performance indices are emerging as powerful tools for decisionmakers tonavigate the uncertain information landscape. They distill complex information, allowing decisionmakersand key audiences to efficiently spot critical areas of concern, support policy development and targetsetting, and measure impacts of policy responses.
Over the past two decades, there have been dramatic increases in the development and use of indicators ascost effective and efficient means to inform decisionmaking and management.2,3 Gross Domestic Product(GDP), created in 1934, has become a ubiquitous measure of economic progress. The HumanDevelopment Index (HDI) and Millennium Development Goals (MDGs), among many others, now serveas similar initiatives to GDP to help gauge progress toward social and economic development.
This manual serves as a guide to the process of developing an environmental performance index basedon the experience of the Yale Center for Environmental Law and Policy (YCELP) and the Center forInternational Earth Science Information Network (CIESIN) at Columbia University in developing theEnvironmental Sustainability Index (ESI) and its subsequent form, the Environmental Performance Index(EPI). Here we share our “lessons learned” in creating performance indices, particularly with respect toenvironmental issues.
We have learned many of these lessons through our own collaboration and analyses, as well as extensiveconsultation with subject-area experts, decisionmakers, journalists, and researchers. Although we admitthat the EPI is an ever-evolving process, we believe we have valuable insights to share. We also hope thatthis manual will start to cultivate a conversation about the methods and challenges of developing andmaintaining indicators and indices.
Why the EPI?The EPI ranks countries on performance indicators tracked across policy categories that include bothenvironmental public health and ecosystem vitality. These indicators, aimed at the national governmentscale, provide a gauge of a country’s performance toward policy goals.
Although the EPI is primarily applied at the country-level, its flexible framework and methodology canalso be adapted for a variety of purposes at different scales. Individual countries have approached theYCELP and CIESIN teams to develop sub-national environmental performance indices that rankprovinces or cities. Others have sought to apply the EPI toward a particular objective (e.g., measuring and
Chapter 1: Introduction
5
1 Esty, D.C. 2001. Toward Data-Driven Environmentalism: The Environmental Sustainability Index. The Environmental Law Reporter: News &Analysis. May 2001.
2 USGCRP (US Global Change Research Program). 2012a. Climate Change Impacts and Responses: Societal Indicators for the National ClimateAssessment. NCA Report Series, Volume 5c. Washington DC: US Government Printing Office.
3 USGCRP (US Global Change Research Program). 2012b. Ecosystem Responses to Climate Change: Selecting Indicators and IntegratingObservational Networks. NCA Report Series, Volume 5a. Washington DC: US Government Printing Office.

comparing economic competitiveness in relation to the environment). Since the ESI’s conception in2000, there has been a proliferation of index and indicator efforts, with particular attention paid to theenvironment and sustainability. One review noted over 500 sustainability-related indicator efforts inexistence in 2003. Of these efforts, 67 were global, 103 were national, 72 were state or provincial, and289 were local or metropolitan.4 These included the Dow Jones Sustainability Index, UNDP’s HumanDevelopment Index, the World Wildlife Fund’s Living Planet Index, and the World Economic Forum’sCompetitiveness Index, among others. Box 1.1 provides an overview of some of these indices and their aims.
The EPI stands out from other quantitative environmental efforts. It incorporates a comprehensive pictureof high-priority environmental issues, including resource consumption, depletion of environmental assets,pollution, species loss, and other important topics. Other mainstream environmental assessment efforts donot quite achieve this scope and are outside the purview of this manual. For instance, the EcologicalFootprint (EF), a well-known effort to quantify human environmental impacts, is based on an architecturethat includes natural resources related to consumption. The EF is aimed at addressing long-term environ-
mental impacts stemming from human demands, butomits non-consumption high-priority issues, such aspollution and waste management. While some greenaccounting methods, such as Green GDP, areinternationally accepted statistical standards, manyremain controversial in terms of consistency inmethodological calculation and results.5 In addition, someenvironmental accounting efforts are based onenvironmental assets that are commercially exploited andquantify impacts in economic terms, resulting in highlydebatable and often controversial results that limitwidespread policy adoption.
The strength of the EPI is in its expert consensus-basedframework that identifies critical environmental policyissues and calculates scientifically rigorous metrics on acommon and comparable scale. The framework is flexibleenough to include almost any issue deemed a highpriority. Because the metrics in the EPI rely on a
country’s performance relative to a defined policy target, it provides a basis for comparisons regardless ofthe data or issue at hand.
The EPI’s methodology and principles are based on developing performance indicators calculated as acountry’s distance to a defined target. These characteristics have made the EPI an oft-cited reference forpolicymakers, the media, and members of the research community.6 Our success has been due in no smallpart to the contributions of hundreds of experts who have convened to develop and vet our process, dataand methodology. Moreover, experience in refining the EPI over the past 13 years has provided themembers of YCELP and CIESIN with valuable expertise in the realm of environmental performancemeasurement and composite index development.
6
Measuring Progress: A Practical Guide From the Developers of the Environmental Performance Index (EPI)
The strength of the EPI is in itsexpert consensus-basedframework that identifies criticalenvironmental policy issues andcalculates scientifically rigorousmetrics on a common andcomparable scale. The frameworkis flexible enough to includealmost any issue deemed a highpriority. Because the metrics in theEPI rely on a country’sperformance relative to a definedpolicy target, it provides a basis forcomparisons regardless of thedata or issue at hand.
4 Parris, T.M. and R.W. Kates. 2003. Characterizing and Measuring Sustainable Development. Annual Review of Environmental Resources.28:559–86.
5 Li, L. 2007. China postpones release of report on ‘Green’ GDP accounting. Worldwatch Institute.www.caep.org.cn/english/ReadNewsEN.asp?NewsID=1069. Last accessed: January 28, 2013.
6 See www.epi.yale.edu/community/news for a full listing of news articles and reports that cite or reference the EPI.

History and Evolution of the EPIYCELP, in partnership with CIESIN and the World Economic Forum, has been developing global indices ofenvironmental sustainability and performance for more than a decade. When we first published the ESI (thepredecessor of the EPI) in 2000, governments around the world were struggling to mainstream sustainabilityinto their policy goals. The Millennium Declaration promulgated earlier that year by the United Nationssought to articulate a comprehensive vision for improving quality of life in developing countries. This visioninvolved long-term development goals that were grounded in quantitative metrics to be achieved by 2015.While the Declaration included environmental sustainability as a goal, it contained virtually no relevantquantitative metrics to support the goal. This stood out in sharp contrast to the other goals of the Declaration,such as poverty reduction, health care improvement, and education expansion, each of which could rely onwell-established metrics for policy setting. The ESI was, in part, a response to this data gap.
The ESI was a first attempt to rank countries on multiple components of environmental sustainability,including natural resource endowments, past and present pollution levels, environmental management
Chapter 1: Introduction
7
OECD Better Life Indexwww.oecdbetterlifeindex.org
Measures “well-being” across eleven categories, including housing, income and jobs for all thirty-four OECD countries.
Ocean Health Indexwww.oceanhealthindex.org
Evaluates the condition of marine ecosystems according to ten human goals, which represent the key ecological, social, and economic benefits that a healthy ocean provides.
Ecological Footprint www.footprintnetwork.org
A metric that represents the amount of biologically productive land and sea areanecessary to supply the resources a human population consumes, and to assimilateassociated waste.
Human Development Indexwww.hdr.undp.org/en/statistics/hdi
Measures human development in three basic dimensions: long and healthy life (health),access to knowledge (education), and a decent standard of living (income).
WEF’s Global Competitiveness Indexwww.weforum.org/issues/global-competitiveness/index.html
Gauges 144 economies according to a set of institutions, policies, and factors thatdetermine levels of productivity.
Box 1.1. Examples of Environmental Indices

efforts, contributions to the protection of the global commons, and a society’s capacity to improveenvironmental performance over time.
Because of its broad scope and unclear definition of sustainability, the original ESI proved to have limitedutility as a pragmatic tool for priority setting in policy. The large number of indicators made it difficult tomake targeted policy assessments and recommendations. To address this challenge, the Yale-Columbiaresearch team developed the 2006 pilot EPI as a departure from attempting to measure sustainability,and instead aimed to measure performance. The narrower scope of the EPI focuses more closely oncurrent policy action as opposed to historical trends and endowments, both of which comprised the ESI. It was our hope that the core set of metrics comprising the EPI would allow governments to be heldaccountable for sustainability impacts, as good environmental performance is a prerequisite for environ-mental sustainability. Through developing the EPI we found that policy drivers could be identified and
quantified as outcome-oriented indicators and offer a more relevantapproach than sustainability indicators, which were not gauged againstclearly defined targets.
Additionally, the EPI methodology was crafted in a way that wouldallow countries to compare their strengths and shortcomings againsttheir peer countries. The pared down EPI measured 16 indicators –rather than the unwieldy 76 of the ESI – across six identified policy categories sorted into two overarching environmental objectives:1) reducing environmental stresses on human health and 2) promotingecosystem vitality and sound natural resource management. These two
objectives were selected because the EPI was designed to be a useful tool for policymakers, and prioritieswith respect to the environment are often thought of along lines of people and ecosystems. The EPIcontinued to evolve through later releases, and the 2008 and 2010 reports included changes in data andmethodology based on expert feedback. The 2008 EPI specifically engaged a number of leading expertsas consultants on indicator development for policy categories. We increased the number of indicators to25 in the 2008 and 2010 EPIs, and we introduced imputations for missing data to increase the coverageof included countries. Another methodological change involved adjustments to the weights given tocertain policy categories, with the greatest weight attributed to the climate change category. The climatechange category weight was increased from one-tenth in the pilot EPI score to one-quarter of the 2008and 2010 EPI scores because of the prominence of climate change as a global issue and its overarchinginfluence over other ecosystem policy issues. In the 2010 EPI we modified our aggregationmethodology to include logarithmic transformation of certain indicators that effectually “spread out”data to highlight more subtle distinctions among leading countries.
By and large, the framework and approach to performance measurement remained relatively consistentfrom 2006 to 2010, with one major shortcoming: the inability to produce results that may be comparable
8
Measuring Progress: A Practical Guide From the Developers of the Environmental Performance Index (EPI)
The EPI methodologywas crafted in a waythat would allowcountries to comparetheir strengths andshortcomings againsttheir peer countries.
over time. Progressive versions of the EPI provided only a snapshot of environmental performance at agiven time because of alterations in data and methodology. To address this shortcoming we changed indicator criteria for the 2012 EPI, most notably requiring the availability of time series data for an indicator to be included. The new criteria focuses on a smaller set of core indicators that meet standardssuch as direct measurement (rather than modeled data), consistent time series, and institutional
commitments to maintain data streams into the future. Theapplication of these more stringent criteria enabled us to trackperformance over time and provide a foundation to continuetracking performance using a more consistent set of indicatorsinto the future.
These changes to the EPI’s methodology also allowed us todevelop the Pilot Trend Environmental Performance Index(Trend EPI). The Trend EPI ranks countries on the change intheir environmental performance over the last decade. As acomplement to the EPI, the Trend EPI shows which countriesare improving and which countries are declining over time, interms of performance. By using the Trend EPI, countries areable to better assess their environmental progress through timeand determine the efficacy of policies implemented to addressissues surrounding their performance.
Who Should use this Guide?This guide is based on the framework of the EPI and is meantfor those who are specifically seeking guidance on how todevelop environmental performance indicators or aggregated,composite indices. This guide is not intended for an audiencegenerally interested in understanding the use of indicators or as a widespread survey of indicator calculation methodologies.We also do not intend to duplicate any of the material found
in other detailed handbooks on statistical indicator construction, such as those from the OECD (seeAppendix 1 for a listing of other useful resources on indicator construction). Instead, the motivation for this manual is to reflect upon more than a decade’s worth of our experience in constructing and refining the EPI.
Chapter 1: Introduction
9
These changes to the EPI’smethodology also allowed usto develop the Pilot TrendEnvironmental PerformanceIndex (Trend EPI). The TrendEPI ranks countries on thechange in theirenvironmental performanceover the last decade. As acomplement to the EPI, theTrend EPI shows whichcountries are improving andwhich countries are decliningover time, in terms ofperformance. By using theTrend EPI, countries are ableto better assess their environ-mental progress throughtime and determine theefficacy of policiesimplemented to addressissues surrounding theirperformance.

Structure of this GuideThis manual is organized as follows:
Chapter 2: ‘Establishing the Basis of an Index’ discusses how to shape the foundation of an index, which includes identification of the goals, target audience, and guidingcriteria for an environmental performance index.
Chapter 3: ‘Preparing the Process’ describes how to create a working team to manage thedesign process for an index, as well as how to engage experts and other stakeholders.
Chapter 4: ‘Building an Indicator Framework’ provides step-by-step methods for definingan indicator framework, including what perspectives and criteria to consider.
Chapter 5: ‘Evaluating Data Quality’ includes strategies for obtaining high quality data tocreate a credible index.
Chapter 6: ‘Calculating an Index’ discusses the step-by-step details of index constructionfrom indicator calculation and weighting selection to final aggregation.
Throughout each of these chapters we provide insights from the development of the EPI, including detailson how we analyzed our own options and what criteria we used to design the EPI. Figure 1.1 provides ageneralized diagram of this process.
10
Measuring Progress: A Practical Guide From the Developers of the Environmental Performance Index (EPI)
Figure 1.1. An organizational roadmap describing the major steps of the EPI design process, as described in this manual.
Defining Objectives and Principles
1. Defining the overallobjective of an index.
2. Determining principles to guide the development of an index.
3. Specifying what audience to target for the index.
Preparing the Process
1. Establishing a management team.
2. Planning the process,including timelines,milestones, and deliverables.
3. Engaging experts andthe stakeholders inthe process.
Designing a Framework
1. Choosingmeasurable objec-tives.
2. Selecting core policy categories.
3. Determining thebest indicators.
EvaluatingData Quality
1. Defining data qualityand selection criteria.
2. Choosing andcollecting datasources.
3. Formatting andorganizing data.
4. Exploring DataQuality.
5. Grading Data Quality.
6. Utilizing time series.
Constructingan Index
1. Determining targets.
2. Calculating performance indicators.
3. Assigning weightings.
4. Aggregating an index.
CHAPTER 2 CHAPTER 3 CHAPTER 4 CHAPTER 5 CHAPTER 6

Chapter 1: Introduction
11
Box 1.2. Key Definitions We define “environmental performance”as measurable results of an entity’s management ofenvironmental issues.
We use “environmental indicator” to describe a quantitative variable measured or calculated from datathat is used to identify pressures on the environment, environmental conditions (states), or policyresponses, or trends thereof.
Combining the above two definitions, “environmental performance indicators” refer to applyingenvironmental stress, state, and policy response against clearly defined targets. The definitions of targetsand steps for setting targets are discussed in Chapter 6: Constructing an Index.
We use “index” as an aggregate of performance indicators, which generally implies conversion to commonunits (or a unitless scale) and weighted or unweighted aggregation (i.e., averaging, adding, or applyingother mathematical operations). A collection of indicators then specifies an architecture that identifies high-priority issues with all metrics calculated on a common scale.
Other keywords, denoted in bold, are defined in the Glossary at the end of this guide.

12
Measuring Progress: A Practical Guide From the Developers of the Environmental Performance Index (EPI)
E stablishing the Basis of an Index2 2
Topics covered in this chapter• Overall Goals and AimsDefining the purpose and message of an index.
• AudienceIdentifying the target audience for which an index is aimed.
• PrinciplesDetermining underlying principles that will underpin the foundation of an index.

IntroductionThis chapter seeks to lay a critical foundation for what an index is ultimately trying to measure, who it is intended to reach, and what underlying principles can guide the subsequent development of an index.In theory this process should be iterative, as illustrated in Figure 2.1, with the consideration of goals,audience, and principles informing the process of developing an index as it evolves.
Overall Goals of an IndexThe first challenge in developing an environmental performance index is to define its goal or purpose inconceptual terms. What is the index trying to achieve? The answer to this critical question will facilitatethe definition of an index’s overall aims, which provide an essential foundation for other components ofthe index, including the design of the indicator framework and data selection.
Chapter 2: Establishing the Basis of an Index
13
Figure 2.1. The relationships between an index’s goals, principles, and audienceand how each informs the process of developing an index.

The following are examples of common purposes and benefits for which environmental performanceindices are created:
uMeasurement• Measure or gauge something.
• Determine the effectiveness of an air pollution control policy.
• Track progress toward identified goals or targets.• How close a city is to achieving greenhouse gas reductions.
uCommunication • Communicate information to a specific audience.
• Policymakers, scientists, or the public.
• Translate complex information for social or policy learning. • Simplify complicated data to the lay public.
• Call attention to the most relevant or current policy-related issues.• High-priority topics related to vulnerable populations in a climate change adaptation index.
uComparison• Develop a common metric by which to compare progress or performance between entities.
• An index that normalizes pollutant concentrations to compare air quality between cities.
• Determine impact of policies or processes. • Compare performance before and after the implementation of a standard or regulation.
14
Measuring Progress: A Practical Guide From the Developers of the Environmental Performance Index (EPI)
Box 2.1. Developing an Index to Measure Gender Equality and the Environment: IUCN’s Environmental Gender Index
Several comprehensive international agreements, including all three of the Rio Conventions and the Conventionon the Elimination of all Forms of Discrimination Against Women (CEDAW), include mandates on gender and theenvironment. However, many governments are struggling to integrate a gender approach into environmentaldecisionmaking. To help overcome these challenges, the IUCN Global Gender Office recently initiated theEnvironmental Gender Index (EGI) as a new tool to help assess and measure gender equality and women’sempowerment in the context of global environmental agreements.
The EGI is geared toward becoming an important mechanism for policymakers and governments. The aim of thisindex, “to promote greater transparency and accountability, and to contribute to the full, effective, and sustainedimplementation of the Conventions,” establishes both communication and instrumental roles for the project inrelation to its objective. The communication role of the EGI stems from its ability to help connect components ofgender and the environment by providing information and data through indicators on governments’performance translating the gender and environment mandates into national policy and planning. The EGI willalso play an instrumental role in helping decisionmakers evaluate progress and make changes necessary formeeting the requirements of the mandates.
The development of the EGI exemplifies one of many ways an index can be initiated and how an index can havemany roles related to its objective. Additionally, this project demonstrates the need to identify a target audienceand users when establishing the foundation of any index framework, because indeed the EGI aims to presentinformation to its users as both a guide and a communication tool for important decisionmaking.

u Issue Framing• Combine complex or disparate data/information to communicate something new.
• For example, plans by the International Union for the Conservation of Nature (IUCN) to developan Environment and Gender Index (EGI) that combines information on performance related to bothgender and the environment to develop a new metric that is a measure of both (see Box 2.1).
uDecisionmaking and Management Tools• Provide a guide for allocating resources, taking actions, or making decisions.
• Manage environmental problems, create an action plan, or determine a generalpolicy/management direction.
• Devices for support or influence. • Build learning and cooperation toward a policy debate or management solution.
• Inform specific decisions or directions of management/policies.• Help develop goals, objectives, and tools for policy or management processes.
Our experience in developing both the ESI and the EPI has revealed the importance of a clearly definedoverarching goal for the design and communication of an index. As mentioned in Chapter 1, the ESIgrew out of an identified need to provide a metric for sustainability analogous to GDP. Key componentsof the ESI were derived from the long-term aim of developing a single measure to communicate 1) thestatus of a nation’s environmental systems; 2) the pressures on those systems; 3) human vulnerability toenvironmental change; 4) a country’s capacity to respond; and 5) contributions to global environmentalstewardship. These five objectives were identified as “components” to more narrowly focus the broadconcept of sustainability for which measurable variables could then be identified (see Chapter 4 for moredetails on defining measurable objectives).
When we transitioned from the ESI to the EPI, our goal changed. Rather than providing a relative meas-ure of sustainability for countries, as in the case of the ESI, we changed the focus of the EPI to measurecountry performance against absolute targets for which countries could take policy action. We also want-ed to highlight issues of environmental data availability, measurement, and quality using the best dataavailable globally but also identifying gaps in understanding. The latter goal has become more prominentin the latest iteration of the EPI, which avoids reliance on modeled estimates of environmental indicatorsand therefore includes fewer indicators than the 2010 EPI (see Chapter 5). Table 2.1 summarizes the
Chapter 2: Establishing the Basis of an Index
15
Table 2.1. The evolution of the ESI and EPI’s objectives and framework over time.
Category 2005 ESI 2006 EPI 2008 EPI 2010 EPI 2012 EPI & Pilot Trend EPI
Objective Gauges the long termenvironmental trajectoryof countries by focusingon “environmental sustainability.”
Assesses current environmental conditions. Assesses current environmentalperformance and makes comparisons of environmentalconditions over time.
Design Provides a relativemeasure of past, current,and likely future environ-mental, socio-economic,and institutional condi-tions relevant to environ-mental sustainability.
Provides an absolute measure of performanceby assessing countries on a proximity-to-target basis.
Provides measures ofperformance by assessingcountries on a proximity-to-target basis over the lastdecade to track changes inperformance over time.

differences in objectives between the ESI and EPI over the last decade, as well as the influence of thesechanges on the overall design of the indices.
In delineating the goal for an index, it is helpful to examine an index’s purpose in the context of scopeand scale. We define scope as the extent of the area or subject matter considered in an index (i.e., watersustainability versus environmental sustainability). We define scale as an index’s range (i.e., project-based, local scale versus national or global). For example, data may be easier to collect for an index thatis tightly focused and spans a small geographic area. It can also translate into a more narrow definitionand selection of indicators. An example of this type of index could be a company desiring consistentmetrics or Key Performance Indicators (KPIs) for its immediate operations within a region. On theother hand, defining scope and scale too narrowly may be limiting and thus unintentionally excludepotentially interested users. For example, an index focused on municipal waste in one particular citymay not be broad or inclusive enough to influence state or national decisionmakers who are interestedin regional waste concerns. Box 2.2 describes an example of Armenia’s efforts to include a sustainabilitycomponent in the Human Development Index (HDI) based on their goal of expanding its scope toinclude environmental concerns.
16
Measuring Progress: A Practical Guide From the Developers of the Environmental Performance Index (EPI)
Box 2.2. Adding a Sustainability Dimension to the Human Development Index
Armenia has been working since 1995 to transform the Human Development Index (HDI) into a SustainableHuman Development Index (SHDI). The HDI attempts to create a summary measure of human developmentacross three basic dimensions: health, education, and income. The HDI uses a single statistic to serve as aframe of reference for a country’s social and economic development. It sets a minimum and maximum foreach dimension, called “goalposts,” and then gauges where each country stands in relation to the goalposts,normalized as a value between 0 and 1.
Using these same principles, Armenia set out to incorporate an environmental sustainability dimension into the HDI. Environmental indicators in the SHDI are divided into two types: those relating to theenvironmental state of a territory, and those relating to the environmental evaluation of human activities.These two groupings of indicators are then further subdivided into 11 metrics that relate to specificmeasurable environmental issues.
The structure and indicators included in Armenia’s SHDI resemble the indicator framework of the YCELP-CIESINEPI, although taken together, the SHDI is more similar in breadth to the ESI. The SHDI and EPI represent twoindicator frameworks and indices that are designed to serve different objectives and are based on differentprinciples. While the SHDI’s aim is broad and encompasses as many aspects of sustainability and human devel-opment as possible, the EPI’s aim is more narrowly focused. A major principle of the SHDI is to be widelyinclusive, while the EPI is based on a sharp focus on performance-related indicators.
Both of these indices demonstrate the possibility of incorporating dissimilar objectives and underlyingprinciples into a similar framework, and how many different elements can be examined and utilized to tailoran index toward a specific scope or goal.

Audience Another key question to ask in the design of an environmental performance index is, “Who is the indexintended to reach and influence?” Defining a target audience will help sharpen the scale and scope of anindex, as well as facilitate the design of the indicator framework, indicators, and data selection. Setting aclear boundary for an index’s audience can help to act as a filter for what is pertinent in the selection ofdata and indicators (see Chapter 4 for more details on data selection).
Key questions that can help to define the target audience for an index include:
• Who is the index intended to reach or influence?
• Who will use the index, help disseminate the index, or share the information provided by the index?
• What are the goals of an index’s target audience?
• Should the index be geared toward a general audience or a specific sector of the population?
• Who may be interested in the results of the index, and who is the project relevant to?
An index can be designed to influence a variety of audiences, which can broadly include policymakers,the general public, and businesses. It can also include more specific sectors in these categories: forexample, environmental policymakers, or a subsection of the population interested in climate change. Inthe case of the World Wildlife Fund (WWF)'s Environmental Paper Company Index, the target audiencewas the pulp and paper industry, which WWF hoped to influence through increasing consumer awarenessusing the index. Another example is seafood sustainability indices such as Monterey Bay’s Seafood Watchrating or the Global Aquaculture Performance Index7, which is targeted toward influencing seafoodconsumers to make sustainable choices. Table 2.2 describes the objectives and target audiences for severalother index efforts.
Chapter 2: Establishing the Basis of an Index
17
Index Name Created By Goal Audience
Green City Index Siemens To measure the environmentalperformance of 120 cities around theworld.
City and national-levelgovernments.
Happy Planet Index (HPI) New EconomicsFoundation (NEF)
The goal of the HPI is to develop analternative measure of human well-being and progress.
MultidimensionalPoverty Index
United NationsDevelopmentProgramme (UNDP)
Records which aspects of poverty arefelt by different communities aroundthe world in an attempt to make theconcept of poverty more easily under-standable to policymakers.
Country-level policy-makers in governmentand NGOs seeking toalleviate poverty.
Can be used both byconsumers in makingpurchasing choices andby the paper companiesthemselves.
Drive the pulp and paper industry tobe more sustainable in its operations;to inform consumers of the ecologicalfootprint of some manufacturers.
World Wildlife Fund(WWF)
EnvironmentalPaper CompanyIndex
Country-level decision-makers and policymakers;the United Nations.
7 Volpe, J.P., M. Beck, V. Ethier, J. Gee, A. Wilson. 2010. Global Aquaculture Performance Index. University of Victoria, Victoria, British Columbia, Canada.
Table 2.2. Examples of index efforts and their identified objectives and target audiences.

Principles What criteria will guide the development of an index? In the planning phases of an index, it is oftenhelpful to identify guiding principles in conjunction with defining an index’s objectives and audience.These principles can also act as further filters to aid the developers in gauging what is relevant forinclusion in an index. Clear principles can also help to establish the basis of an index and provide support for the reasoning behind its processes, therefore increasing the transparency of an index for a target audience.
When considering which principles to adopt to guide the construction of an index, one can ask what tenets(e.g., transparency, accuracy, etc.) are important to the developers, users, and audience. Some principles toconsider for adoption include:
uComparabilityAn index may aim to achieve the greatest basis for comparison as possible, which may narrowthe consideration of common indicators and datasets.
uAccuracy Developers of an index should strive for accuracy—the degree to which the informationconveyed in an index correctly estimates or describes the properties it intends to measure—asa principle. An index is only as credible as the underlying data from which it is based.
18
Measuring Progress: A Practical Guide From the Developers of the Environmental Performance Index (EPI)
Box 2.3. When an Index’s Goal plays a Critical Role:The 2012 EPI’s Water Quantity Indicator
For the 2012 EPI, our team debated whether to include a less than ideal water indicator or to altogether omit awater policy category from the Ecosystem Vitality objective. None of the globally available water data met ourestablished criteria (see Box 4.1 for a full listing of the criteria used in the 2012 EPI). We were then faced with adecision to exclude the consideration of water resources from the Ecosystem Vitality objective, which wouldsend a strong signal as to the inadequacy of global water data, or to find a sub-par dataset that did not meetthe data selection criteria.
The EPI’s goals, target audience, and principles guided us to the decision to include a water indicator, even ifthe indicator did not meet all the criteria we initially set for inclusion. Because water is an integral part ofenvironmental sustainability and natural resources, we decided we could not release the EPI without theinclusion of a relevant indicator to measure water performance, despite no dataset fully meeting our evaluationcriteria. The only indicator we found to partially meet some of our criteria was a measure of the Change inWater Quantity, although this indicator lacked a historical time series and relied on modeled data using sparseunderlying observations. However, we extensively reviewed alternatives and determined that this datasetrepresented the “best available,” recognizing that the indicator is still only an approximation of overall waterresource management regarding ecosystems.

uFlexibility An index may want to adopt a principle of flexibility to allow for possible changes or updatesto the index in conjunction with advances in science, data availability, or thinking. Flexibilitycan also be manifested in the weighting and aggregation process. An index can allowflexibility by providing users an option to customize statistical weightings for a particularpurpose. The 2008 EPI provided this option in a web format.
uTransparency It is best practice to adopt a principle of transparency to ensure that data and indicatorselection, as well as calculation methodology, are credible for users and key audiences.
uCompleteness Developers may also want to adopt a principle of comprehensiveness to help guarantee theindex covers all relevant issues. Are there critical aspects of an issue that are missing from theframework? If so, can we justify their exclusion? Completeness may be a critical principle forusers or the intended audience of an index, as overlooking an indicator or aspect of an issuemay affect an index’s credibility. Box 2.3 describes the important trade-off between complete-ness and accuracy that we considered for the EPI when debating the inclusion of a waterresources policy category.
ConclusionThe main purpose of an environmental performance index is to communicate a goal to a keyaudience in a credible manner based on a transparent framework of indicators. Toward this aim,this chapter has outlined the importance of developing an index’s foundation—the overall goal,target audience, and principles that underpin an index. It is important to keep in mind thesefoundational elements when moving through subsequent chapters, as they will help index devel-opers make decisions regarding the inclusion of data, indicators, and methodologies.
Chapter 2: Establishing the Basis of an Index
19

20
Measuring Progress: A Practical Guide From the Developers of the Environmental Performance Index (EPI)
Preparing the Process33
Topics covered in this chapter:• Management TeamOrganizing a core team with specified roles to effectively manage the process of developing an index.
• Engaging ExpertsCollaborating with experts to share knowledge and receive input and feedback on the index construction process.
• Process and TimelineEstablishing a productive process and approximate timeline for creating an index.

Chapter 3: Preparing the Process
21
IntroductionThe organization and composition of a team developing an index can be highly varied – from a singleindividual to an inclusive multi-stakeholder process that involves multiple members. In the case of theEPI, we relied on the engagement of multiple institutions, stakeholders and experts. However, it isimportant to evaluate other factors that contribute to the overall structure and goals of an index, such asthe organization and establishment of a management team and the production process. Theseconsiderations are heavily dependent upon the type of index being built, its level of complexity, and thetype of data relied upon or pursued. Here, we demonstrate the experiences of the Yale and Columbia teamin developing the ESI and EPI as a model for understanding these important factors and guiding the estab-lishment of an effective process for the development of an index.
Management Team The management structure for developing an index is flexible and is largely determined by availablehuman and financial resources. While involving various actors is an essential part of an indexdevelopment process, it is the “core team” that manages the actual process of constructing an index.Because the EPI is a joint initiative between two academic institutions, our management process issomewhat more complex than when there is a single institution spearheading an effort. A more democraticmanagement process with multiple leading institutions could mean greater inclusivity but may alsorequire more time to gain consensus. The model provided in this section may be streamlined dependingon the scope of an index and the size and capacity of the creating organization(s). Environmentalperformance indices typically encompass a broad range of issues, and it is likely that a management teamwill need to draw from outside entities to be properly inclusive and thorough when developing the index.
Generally speaking, the core EPI team has consisted of one or two project “vision leaders,” a projectmanager, research staff, analytical staff and administrative support. A vision leader provides the overalldirection for an index and is usually an expert in the targeted field of the index. To effectively guide thedevelopment of an index, the vision leader must be knowledgeable of the context for which an index isbeing constructed. The EPI relies on the expertise and experience of vision leaders who are well-versed inthe language of policy and its drivers, as well as related environmental data and trends. The vision leaderalso plays a critical role in resolving disputes during the development an index. For example, if there areissues surrounding the inclusion of certain policy categories or indicators, the vision leader can make afinal decision. For the EPI, the vision leaders are not necessarily involved in the day-to-day research tasksbut instead serve a more advisory role in providing consultation and overall guidance. The role of a visionleader could easily take the form of an advisory or consultancy board of people, or instead be driven bystakeholder input.
Other members of the core team are often more involved in the day-to-day management of an index. Theproject manager serves as the single point person organizing the details of the project. The projectmanager helps define goals, assign and track tasks, establish timelines and provide feedback on work atall stages of the project. In addition, the project manager provides input for the content of the index andthe preparation of the report.
The research staff conducts preliminary research, identifies key experts for engagement (discussed later in this chapter), provides guidance on indicator selection and development, and assists in data collection,processing (including formatting as well as transformation of spatial datasets using GeographicInformation Systems (GIS), etc.) and interpretation. For the analytical and statistical aspects of construct-ing an index, core team members with quantitative skills or statistical capabilities provide the bulk of dataexploration and analysis, as well as indicator and index construction (see Chapter 6). Organizations that

lack these necessary skills may choose to hire an outside consultant to assist in the process of developingan index. However, it is valuable to have at least one team member with the quantitative skills necessary toassess or cross-check the validity of calculations and results. It is also essential to have administrative staffto support each phase of the project. Administrative support members help manage resource and staffrequirements, organize meetings and workshops, and take on vital tasks such as website administration,vendor liaising, and budget management. Figure 3.1 summarizes the key roles of each core team member.
The Contribution of Experts In addition to a core team, a wider network of experts can be convened at several key stages to providefeedback and guidance on methodology, indicator and data selection, and preliminary results.
The right experts for an index help facilitate stakeholder buy-in and adoption. Experts are often “thought leaders” whose knowledge is valued by the stakeholders of an index. Their
22
Measuring Progress: A Practical Guide From the Developers of the Environmental Performance Index (EPI)
Core Team
Vision LeaderProvides overall direction.
Project Manager
Analytical Staff Research Staff
AdministrativeSupport
Main point person in terms of coordinatingtasks and ensuring project stays on task.
Contributes to allresearch-related activities,
including identification of expert contributors,
preliminary background research, indicator
development, and review.
Evaluate data, performdata transformations, andcalculate indicators andfinal index. Cross-checkall statistical data workand provide secondary
analysis.
Handles day-to-day administration and support.
Figure 3.1. Summary of key roles for core team members who construct the EPI. The coreteam structure suggested here can be tailored and modified to fit the scope and scale ofan index. Often external consultants or university partners may assume the roles of a coreteam or specific members if an institution lacks the internal capacity to fulfill each role.

input helps ensure an index provides the most credible information and builds confidence amongstakeholders to promote widespread adoption and acceptance of the results. With this in mind, three types of experts can add to the robustness of an index:
1. Subject area experts check for the validity of data and determine what the data is used tomeasure. They understand the fundamental environmental issues that a given indicator orcategory is attempting to measure, have domain expertise (including knowledge of existingdatasets and monitoring systems), and can directly contribute to or assist in the selection ofappropriate data for the purpose of indicator construction.
2. Methodological experts contribute the latest knowledge and methods of indexconstruction. They can often provide valuable options and help guide the appropriateselection of methods.
3. Target audience experts provide a preliminary reaction from a target audience to ensurethe project is producing something relevant for its purposes. They are also knowledgeableon the needs of specific target audiences and can offer valuable suggestions for meetingthose needs.
Experts help shape the overall design of an index. From advising on equivalents of “policy categories” to helping vet datasets and selecting indicators thatprovide the best signal for what an index seeks to measure, experts can guide efforts for the best possibleresult. In the realm of data selection, experts are often aware of what data are commonly used and trusted,as well as data sources that may not be regarded as reliable but are in the public eye. When the time fordata analysis comes, experts can advise on almost everything – from defining the meaning of zeros andnegative numbers in particular datasets, to determining whether anomalies are true or mere coding errors.Later in the index development process, after the core team completes initial index calculation, expertscan serve as “beta testers” by reviewing the index before the results are released to the general public.Because anomalies and flaws in index construction frequently become evident only after an initialanalysis has been completed, experts play a crucial role in the beta testing stage by exposing shortcomingsand troubleshooting issues before others begin to use the index. From start to finish, experts bring a depthof learning to a team and complement the breadth of knowledge.
Experts can help identify the critical issues, key data and indicators within a field. Our experience with the EPI has shown that experts are aware of the nuances of their field in a way gener-alists are not. At an early stage in the development of the 2012 EPI, our core team circulated a list ofselection criteria, along with a list of potential indicators, to a range of subject area experts. We askedthese experts to rate the proposed indicators against each criterion and identify new potential indicatorsthat met those criteria. This feedback gave our team valuable leads early in the process. For example,when looking for fisheries data, experts from the Sea Around Us provided our team the most relevant, up-to-date datasets by which to construct the best indicators for fisheries sustainability. These expertsprovided guidance on one dataset, the Aquaculture Performance Index, which we found difficult toaggregate to a country-level metric and was excluded from further consideration. They also helped usevaluate the Marine Trophic Index and noted the need to interpret the data in conjunction with theextension of fisheries off of the coastal shelf; essentially making the data impractical for our purposes.The Sea Around Us Project experts contributed indicators for the Percentage of Stocks Overexploited andCollapsed by Exclusive Economic Zone (EEZ) and Trawling Catch per EEZ, and this collaborationenabled us to improve the fisheries indicators in the EPI so policymakers had a more accurate, relevantpicture of the status of their marine ecosystems.
Experts can contribute their own data and indicators to an index. Several experts directly contributed data for the EPI. The Sea Around Us Project processed their fisheriesdata, along with the time series, to provide country-by-country data consistent with the EPI methodology.
Chapter 3: Preparing the Process
23

This saved our team significant time and potential errors, because often raw data must be transformed(e.g., statistical transformations or unit conversions) to better provide transparent and applicable informa-tion. In other cases, experts may provide raw data that can be transformed by members of the core team.For example, an expert at the University of Maryland provided satellite-derived deforestation maps,which were then used by CIESIN to calculate the percentage of forest cover lost in a GIS. We then usedthis data for the 2012 EPI’s Forest Loss indicator. The Battelle Memorial Institute derived countries’satellite-based PM2.5 data for the Air Quality – Human Health effects policy category by normalizing thesatellite-derived fine particulate matter concentrations with population data to determine a country’saverage exposure. By convening these experts for input on the EPI, we were able to streamline the indexconstruction process and produce a much higher quality project with fewer resources.
Experts can help cross-check and validate data.It may be difficult to verify data with a relatively small core team, particularly when the scope of an indexis global like the EPI. Therefore, for the EPI we rely on subject-area experts who are more familiar with
the data used to help explain any anomalies or inconsistencies inthe data. Experts at the Sea Around Us Project informed us ofunderlying problems within several fisheries datasets that wemay not have otherwise understood. For example, the data forGreece included a suspicious spike in improved performance inthe year 2004 in the time series Trawling Catch per EEZ.Through consultation with the Sea Around Us Project experts,we discovered that there was a known reporting error for thisindicator in 2004. This led us to exclude the data point from thetime series and “smooth” Greece’s data by creating an average
value based on the previous and subsequent years’ data. Working with and building a network of expertsgave us the ability to cross-check and verify individual datasets, lending greater accuracy that would beotherwise difficult to achieve.
Experts can help provide added context and detail for a dataset. For the EPI’s renewable electricity generation indicator, we wanted to ensure we were not rewardingcountries that burned crop waste or animal dung. Although these resources are technically renewable,burning crop waste or animal dung produces air-pollution by-products. We consulted with experts at theInternational Energy Agency (IEA) who informed us that data for renewable energy consumption usual-ly include these biomass measurements. Upon request, the IEA experts were able to provide us two sep-arate datasets for renewable electricity generation: one including a biomass portion and one without.Although the difference between the two datasets turned out to be negligible, the transformation of thedata into two distinguishable datasets prevented any potential objections to the indicator by EPI users.As exemplified here, expert contextual input can help point the team toward the most salient data forreaching specific goals.
Evaluating Expert InputOften, expert involvement and input can have the effect of adding noise to the development of an index,particularly when expert opinions present conflicting results. It is the core team’s role to evaluate expertjudgments and decide when to accept an expert’s opinion. There are also more objective solutions fordeciding how to weigh expert opinion in the construction of an index. Chapter 5 describes how to gaugeexpert inputs for the quality of datasets as an example of a more quantitative assessment (see Appendix 4for the process of grading data quality for the 2005 ESI).
Regardless of how expert opinion is used, it is critical to properly attribute and credit experts’ contribu-tions to the index, both for ethical reasons and so experts will feel a sense of ownership and be willing to
24
Measuring Progress: A Practical Guide From the Developers of the Environmental Performance Index (EPI)
Working with and building anetwork of experts gave usthe ability to cross-check andverify individual datasets,lending greater accuracythat would otherwise bedifficult to achieve.

contribute to future editions. We have worked withexperts to co-author scientific publications based ontheir collaboration. The Joint Research Centre of theEuropean Commission has also partnered with theEPI to conduct independent sensitivity analyses tounderstand uncertainties in the EPI methodology. Insome cases, we have also provided honorariums tocompensate experts for their participation.
Process and TimelineThe construction of past EPIs generally required ayear to complete. However, the timeframe forconstructing an index can vary depending on thestarting point and existing foundations in place priorto processes for data collection, indicatorcalculation, and review. The first attempt at creatingan index may require more time. Chapter 2 presentsin detail the process of laying the foundations for anindex, as described in step one in the processoutlined below and summarized in Figure 3.2. It isalso critical to note that experts can be engaged inevery step of the process. However, it may beadvantageous to the core team to structure feedbackprocesses efficiently by aligning expert reviews atkey stages.
A generalized timeline for the EPI can be expressedas follows (detailed explanations for each step aredescribed in other chapters, as noted in each step):
1. Define Overall Goals, Audience, andPrinciples (Chapter 2)The first step in creating an index is laying itsfoundations. At this stage, preliminaryresearch and review of scholarly literature ishelpful in establishing a scientific basis for anindex. Here, the ‘why,’ ‘for whom,’ and ‘how’are defined.
This phase of the index development processcan require a substantial amount of time,depending on the core team’s timeframe toclearly define an index’s goals, audience,and principles. One strategy to make this
Chapter 3: Preparing the Process
25
Figure 3.2. A generalized timelinefor the construction of the EPI.
Measure ImpactsImpacts and use of the index are measured.
Release ReportThe index is released to target audiences.
Prepare Report and OutreachThe report and any communication
materials are prepared.
Hold Expert Review II:Feedback on ResultsExperts review the preliminaryresults of the index.
Incorporate Feedback andAnalyze Data (Core Team)
Expert input is incorporated,and the index is calculated.
Hold Expert Review I:Framework & IndicatorsExperts give their opinion on theindex’s foundations and framework.
Collect DataDevelopers collect
available data.
ConstructIndicator FrameworkThe backbone of an index is created.
Seek Preliminary ExpertFeedback on FoundationsAn expert review group is formed.
Define Overall Goals,Audience, and Principles
The foundations of an index are formed.

process more efficient is to narrowly focus an index on a specific issue, target a certain audience,and clearly elaborate principles by which to guide the process. A narrower scope will also help toensure the rest of the index process remains on track.
2. Seek Preliminary Expert Engagement (Chapter 3)It may be helpful to engage experts and stakeholders to provide guidance and feedback for Step 1 and,for later steps, help a team understand how the index fits into the larger landscape of stakeholderconcerns and research in the area. At this stage, the team should define the scope of expert engagementand identify experts based on areas of expertise.
Based on the overall goals, audience, and principles of the index, a list of the types of expertsneeded for the project can be defined. Types of experts who can be engaged in this stage of theindex development process are described in the above section, The Contribution of Experts.
Once the expert contributors have been identified, they can begin reviewing the overall goals,audience, and principles established in Step 1. Their feedback should include advice on thecurrent project scope and details, as well as how to reach the project’s goals. They can alsosuggest datasets potentially relevant to the project and the relative importance of issuesencompassed by the index (e.g. air pollution vis-à-vis forest cover). Furthermore, they can helpto identify other experts to engage in the process.
3. Establish Indicator Framework (Chapter 4)After defining an index’s objectives, goals, and audience, the core team should work to define theindicator framework that will determine the categories the index will measure, as well as possibleindicators to gauge performance in those categories.
As detailed in Chapter 4, establishing the structure of an index is an iterative process that mayrequire several rounds of revisions. Often an indicator framework starts from an “ideal”perspective, including the categories and indicators that a model framework would includediscounting any data limitations, but is then refined with stakeholder and expert input.Establishing the EPI indicator framework, which has been a relatively fixed process since 2006,has proven to be one of the more time-intensive stages; requiring slightly less time than thecollection of indicator data. Often, we required many weeks and multiple rounds of feedback toconfigure and finalize the final framework.
4. Collect Data (Chapter 5)This step can be the most time consuming part of the index construction process, depending on thesources for data collection.
Researching and gathering data for the purposes of index construction is an important step thatshould be conducted thoroughly and systematically. However, specific details as to how to goabout collecting appropriate data for the construction of an index is outside the scope of thismanual (users can refer to Appendix 1 for these resources). As further explained in Chapter 5, theunderlying methodology and sources for data should be carefully evaluated. The evaluation ofconsistency and trends in underlying methodology and data sources will often elucidate issues ofdata quality. It is important to consult with experts when collecting and analyzing data, and theircomments and suggestions are helpful throughout this process. Many datasets will fail to meetspecific criteria set by an index team and may be excluded from the project. However, it is best toretain any data collected because it may be helpful in assessing other data sets, detailing missinginformation between sources, and interpreting improvements in future iterations of the published
26
Measuring Progress: A Practical Guide From the Developers of the Environmental Performance Index (EPI)

data. It is also useful to communicate with the sources for data collection. Often, the publishersof data are looking for feedback to improve their products or may suggest more suitable sourcesor datasets for the purposes of an index.
5. (Optional) Conduct Expert Review on Framework and Indicators (Chapter 3)At this stage in the indicator construction process, the core team can choose to engage expert feedbackon an index’s framework and indicators. Experts can build on their preliminary thoughts on the founda-tions of the index to give a more in-depth evaluation of the framework and datasets with regards toestablished criteria. They can provide guidance on the inclusion or exclusion of data sources, theweighting of indicators, and indicator construction.
To prepare for this round of feedback, the core team provides experts with a description of theindex framework, information on selected datasets (including the background on each and thereason it was chosen), and a means of communicating feedback, whether electronically orverbally. The experts should be given ample time (i.e., several weeks) to carefully complete thisreview. Although experts may be encouraged to focus only on their area of expertise, theircomments on other areas may also be beneficial. Because many environmental subject areasoverlap, experts can provide valuable input and suggestions for inter-related topics.
Once this round of expert review has been completed, the core team aggregates feedback,solidifies the index framework and weightings, and selects the final datasets to be used.
6. Incorporate Feedback and Calculate the Index (Chapters 3, 5 and 6)At this stage, the core research team processes the data through the chosen methodology to producethe index. Anomalies and any questions for the final round of expert review are noted.
Research staff members prepare the selected datasets following the expert review, ensuring thatall datasets are in a compatible format for statistical analysis. This includes consistency innotation for missing values and units of measure (see Chapter 5). Next, the cleaned datasets areused to produce the overall index results (see Chapter 6).
Once the preliminary results have been prepared, the team should create a detailed presentationof these results for the next round of expert feedback. This presentation should note anomalies,missing data, and places where the team is seeking help in balancing trade-offs and making afinal decision.
7. Hold Expert Review for Feedback on Results (Chapter 3)For this expert review, the core team presents the results of preliminary analysis and invites questionsand comments on the outcome. This review reveals any conspicuous oversights and provides feedbackon the overall results and outcome of the index.
A final round of expert review should be held when the draft of an index is nearing completion.For this round of feedback, we always find it helpful to convene experts for a review workshop.Experts are given a draft of preliminary results prior to the workshop so they can comment andformulate initial feedback. It may be beneficial to divide experts into subject area teams before theworkshop so they can begin discussing key issues in preparation for meeting with their group.
At the workshop, experts participate in a presentation of the results and a roundtable discussionon the overall outcome. Next, subject area teams can meet to provide more in-depth feedback onresults. The results of these breakout groups are communicated to the core team and entire expertgroup to share lessons across subject areas and reach a consensus on tough questions.
Chapter 3: Preparing the Process
27

8. Report and Outreach PreparationAt this stage, the core team prepares the index report and any additional communication tools, such asa website, as well as a media and target audience outreach strategy.
The EPI report goes through several rounds of internal review and, once finalized, includesdetailed objectives, methods, indicator framework, data sources, and results of the index. Acomprehensive outreach strategy, including a website, should be considered far in advance ofdrafting the report and should help to maximize the reach of an index.
9. Report ReleaseFor the purposes of keeping a project on track, it may be helpful to time the release of an index with aconference or other event.
We have traditionally partnered with the World Economic Forum (WEF) to release the biennialEPI report at its Annual Meeting. Timing the launch of the report with the WEF meeting has provided a hard deadline for the release of the EPI. Additionally, this release strategy and venueprovide an international forum by which to disseminate the results.
10. Measuring ImpactsA last key step to developing an index is to measure its impacts. It is important to determine if theindex has reached the desired audiences and has exhibited the intended impacts.
Taking note of media mentions, website hits, and report downloads, as well as scheduling one-on-one interviews or focus group meetings with representatives of the target audience, canhelp to measure the impact of an index. This important last step should not be overlooked whendeveloping an index, because it can also help to provide valuable feedback for incorporation infuture editions of an index.
28
Measuring Progress: A Practical Guide From the Developers of the Environmental Performance Index (EPI)

ConclusionThe process and stakeholders involved in developing an index are just as important as indicatorselection, calculation methodology, and statistical aggregation (discussed in Chapters 4-6). However, itis important to keep in mind that the process and steps outlined in this chapter are by no means linearand are in fact more iterative. Therefore, while we intend for the discussion or explanation of thesemodes and processes to serve as recommendations, we recognize that our approach is not a “one-size-fits-all” method that will work for everyone. We simply have refined our collaborations over time andfeel that our experience may be of value to others when planning similar efforts. The timeframe forcreating an index is highly variable and depends on the experience and organization of the managingteam. The template provided in this chapter is only one example of the order and timing we have used to develop the ESI and EPI.
Chapter 3: Preparing the Process
29

30
Measuring Progress: A Practical Guide From the Developers of the Environmental Performance Index (EPI)
Building an Indicator Framework44
Topics Covered in this Chapter:• Designing the Indicator Framework
Measurable Objectives: Establishing an index’s goals that can be defined in measurable terms.Core Categories: Refining objectives to help group related indicators.Indicators: Defining and selecting indicators.
• Considerations for Indicator Selection

IntroductionThe indicator framework is the backbone of an index. It includes the major elements that define an index,such as the measurable objectives, policy categories, and indicators, as utilized in the EPI. A well-established indicator framework aids in the interpretation of a set of indicators and can provide aconceptual map for determining relationships between different issues. Additionally, the indicatorframework is essential for making the connection between certain observed trends in data and the actionsor policies that may have led to these developments.
While there are many different approaches to constructing an indicator framework (Appendix 2), thischapter will only focus on the EPI’s methods, which employ three tiers of weighting and aggregation toassign percentages for the purposes of statistical combination and produce a final, composite number.
Designing the Indicator Framework There is no single approach to constructing an indicator framework. The OECD has published extensiveand diverse literature on designing frameworks based on its vast experience in developing measures ofenvironmental performance and assessment (see Appendix 1). Many frameworks are built upon “causeand effect” logic that helps developers of environmental indices identify appropriate components and indicators to measure an index’s goal. A common causal framework is the Pressure-State-Response (PSR)model developed by the OECD in 1994.8 The PSR framework (Figure 4.1) is composed of:
• A pressure variable that describes human activities or aspects that exert pressures on the environ-ment. This variable represents the underlying cause or causes of a problem, whether this is an existingcause or one created from a new activity or investment. Examples of potential pressures includeincome growth, trade patterns and activities, energy use, and population growth.
• A state variable that describes some measurable characteristic of the environment that results fromthe pressure variable. Examples of state variables, or indicators, in the EPI include water quality orquantity, deforestation, and air pollution.
• A response variable that measures policy responses to environmental states and changes, such asactions or investments that are instituted to address a problem. Responses to environmental problemscan affect a state variable either directly or indirectly. Examples include water-pricing methods, theuse of alternative crops, and reforestation programs.
One of the criticisms of the PSR framework is that it oversimplifies complex relationships because there areoften numerous pressure, state and response variables. Adjustments have been made to the PSR model tocreate the Driving Force-State-Response (DSR) framework.9 The pressure variable is replaced with thedriving force variable, or the factor influencing a specific activity. The PSR model has also been amended toinclude impact indicators, making it a Pressure-State-Impact-Response (PSIR) framework. Adding bothDriving Forces and Pressure variables transforms the framework into Driving Force-Pressure-State-Impact-Response indicators (DPSIR).10,11 Figure 4.2 illustrates the relationships between these various frameworks in detail.12
Chapter 4: Building an Indicator Framework
31
8 Organisation for Economic Development and Cooperation (OECD). 2003. OECD Environmental Indicators: Development, Measurement, and Use.OECD. http://www.oecd.org/environment/environmentalindicatorsmodellingandoutlooks/24993546.pdf
9 United Nations Commission on Sustainable Development (UNCSD), 2001. Indicators of Sustainable Development: Framework and Methodologies.Background Paper Number 3. Available: http://www.un.org/esa/sustdev/csd/csd9_indi_bp3.pdf.
10 European Environmental Agency. 2003. The DPSIR framework used by the EEA.http://ia2dec.ew.eea.europa.eu/knowledge_base/Frameworks/doc101182/
11 Convention on Biological Diversity. 2003. Report of the expert meeting on indicators of biological diversity including indicators for rapid assess-ment of inland water ecosystems. Convention on Biological Diversity, 10–14 November 2003, Montreal.
12 Segnestam, L. 2002. Indicators of Environment and Sustainable Development: Theories and Practical Experience. Environmental EconomicsSeries, Paper No. 89. World Bank. http://siteresources.worldbank.org/INTEEI/936217-1115801208804/20486265/IndicatorsofEnvironmentandSustainableDevelopment2003.pdf.

It may also be useful to refer back to the scope and the scale of an index, defined in Chapter 2, to design asuitable indicator framework. As described by the World Bank, different analytical levels can requireseparate frameworks for analysis, including commonly used frameworks such as:12
• A project-based framework (also described as an Input-Output-Outcome-Impact framework) is oftenused to monitor the effectiveness of projects to improve the state of the environment. Input indicatorsmonitor the project-specific resources provided; Output indicators measure goods and services theproject provides; Outcome indicators measure the immediate, or short-term, results of project imple-mentation; and Impact indicators monitor the longer-term or more pervasive results of the project.
• The OECD’s PSR framework and subsequent variations as described above in Figure 4.2. Theseframeworks may be the most appropriate for national, regional, and international-level analyses.
• A theme-based framework, such as the use of indicators by the United Nations Commission onSustainable Development’s (UNCSD) for monitoring sustainable development starting in 1995.
We based the ESI and EPI on the OECD’s PSR and DPSIR frameworks, which are most appropriate tocompare environmental performance at the national and international levels. This is not to say that asimilar indicator framework cannot be adapted for smaller scales. There are three major components tothe EPI framework: 1) Measurable objectives; 2) Core Policy categories; and 3) Indicators. The followingparagraphs will describe a process of developing each component of an indicator framework based on ourexperience with the EPI.
32
Measuring Progress: A Practical Guide From the Developers of the Environmental Performance Index (EPI)
Figure 4.1. The OECD Pressure-State-Response model isolates various elements of the causal chain in environmentalissues (adapted from Segnestam, 2002).
12 Segnestam, L. 2002.
Pressure State ResponseInformation
Sectoral Responses
Pollution BurdenHuman Activities
• Agriculture• Industry• Transport• Energy• Others
Environment &Natural Resources
• Air• Water• Land• Living Resources• Other
Agents
• Administration• Households• Enterprises• International
Resources
Information
Environmental Responses

1. Measurable Objectives As discussed in Chapter 2, a well-conceived foundation of goals, target audiences, and guidingprinciples underpin a successful index. From this foundation, developers can begin to construct anindicator framework that measures the overall goals of the index. The first major component of theEPI indicator framework is the measurable objective. Measurable objectives relate to the overallgoals of an index and can be assessed with data. They comprise the top-level of aggregation in theEPI indicator framework. Often, the goal identified for the index (Chapter 2) will serve as themeasurable objective, depending on how narrowly it is defined. In the case of the ESI, for example,our goal was to develop a single metric to gauge environmental sustainability. However,sustainability itself was a broad concept that required definition. Therefore, we chose five narrowercomponents, or measurable objectives, by which to delineate our definition of sustainability.
Often it may be sufficient to have only one overall measurable objective for an index. Box 1.1 (page 7)provides several examples of these types of indices. For example, the Ocean Health Index (OHI) has
Chapter 4: Building an Indicator Framework
33
PSR Framework
DSR Framework PSIR Framework
DPSIR Framework
Replaced pressure variable
with drivingforce variable
Criticized for oversimplifying
complex relationships
Both models provided valuableelements– combined Driving
Forces and Pressure totransform into two
more robustframeworks
Amended toinclude impact
variable
Figure 4.2. An illustrationof the various iterations ofthe OECD’s Pressure-State-Response (PSR)model, which has led tothe development of otherframeworks.

one overarching goal—to provide an assessment of ocean health. This broad overarching goal isextended into 10 narrower components, or measurable objectives, for assessing ocean health. For otherindices, it may be preferable to have more than one objective if the corresponding data and variablesused are disparate. The Human Development Index (HDI) measures human well-being in three objec-tives: health, education, and income. In this case, the identification of three separate objectives allowsfor clear distinction of objectives within the HDI to make its contents more understandable.
For the EPI, we selected two environmental protection objectives: (1) Environmental Health -reducing environmental stresses on human health, and (2) Ecosystem Vitality - promoting ecosystemvitality and sound natural resource management. Following a careful review of existing policy goalsand literature, we chose these two broad policy objectives because they mirror the prioritiesexpressed by policymakers with respect to the environment and natural resource protection—mostnotably the environmental dimension of the United Nations Millennium Development Goals, as discussed in Chapter 1. Additionally, the scope of issues represented by Environmental Health andEcosystem Vitality are defined in measurable ways in terms of existing data, established policy goalsand targets, and relevance. Box 4.2 describes an example of how the EPI framework can be adaptedto incorporate additional objectives. In this case of our collaboration with the Chinese Academy forEnvironmental Planning (CAEP),the EPI framework was modified to incorporate a third objective inline with the policy priorities of the Chinese government.
2. Core Categories Core categories of an index are the types of categories that reflect facets of its measurableobjectives. These categories set clear policy lines to help distinguish an intermediary level betweenindicators and objectives. Core categories help to summarize the types of metrics used to supportmeasurable objectives and meet the overall goals of the index. While it may not be necessary toidentify core categories and add this level of additional weighting and aggregation between theobjectives and indicators, core categories may help to organize an indicator framework, particularlywhen an index includes many types of different indicators. For example, the Climate Change andEnergy policy category of the 2012 EPI includes several indicators to capture various aspects ofenvironmental performance on climate change (Figure 4.3).
Core categories also help to improve the overall comprehensiveness of an index and indicatorframework. For example, policymakers or the public may not understand that carbon dioxide (CO2)emissions are a measure of environmental performance. Through the introduction of an intermediarydefinition of “climate change and energy” as a policy category, greater clarity is provided, and atarget audience may be more apt to see the connection between climate change and energyemissions and environmental sustainability.
In conceptualizing an indicator framework, the identification of core policy categories may alsoassist in defining and selecting indicators. After developers take the first step of identifying measurable objectives, core categories can add further clarity to an index by distinguishing elementsor components of an objective. For the ESI, the notion of environmental sustainability wasinherently too broad to begin at the indicator level. Therefore, we identified five core components—environmental systems, reducing environmental stresses, reducing human vulnerability, social andinstitutional capacity, and global stewardship—as a means of outlining a clearer definition ofsustainability. Each of these categories was chosen because they extended from a broad base oftheory in the ecological and environmental policy sciences. After identifying these five components,variables for indicators were then selected. The selection of diverse indicators should relate to acomponent, but designers of an index may not want to select highly correlated indicators that have
34
Measuring Progress: A Practical Guide From the Developers of the Environmental Performance Index (EPI)
13 The OECD’s (2008) Handbook on Constructing Composite Indicators (http://www.oecd.org/std/clits/42495745.pdf) provides a useful discussionof this issue.

the effect of adding redundancy to the index.13 Diverse indicators can also help to provide a cohesivemeasure of the concept in question. The components not only aided in the categorization andsummarization of the 76 indicators used for the ESI, but alone are useful analytical tools to givedecisionmakers a sense of how they perform on an environmental issue, such as air quality.Therefore, the components proved to be useful even in isolation from the aggregate index.
The 2006 and 2008 EPIs include six core categories: environmental health, air quality, waterresources, biodiversity and habitat, productive natural resources, and sustainable energy. The 2010and 2012 EPIs include 10 core categories: environmental health, air quality (human health effects),water quality (human health effects), agriculture, biodiversity and habitat, forestry, air quality(ecosystem effects), water quantity, climate change and energy. Overall we chose these categoriesbecause they reflect facets of our measurable objectives and are core issues related to environmentalperformance. For example, we chose Water Resources as one of the six core categories for the 2006Pilot EPI because water is a critical element for environmental sustainability and is a major topic inthe international dialogue on sustainable development.
3. Indicators The third component of the indicator framework includes the indicators themselves—quantitative variables measured from observations (i.e., data) or calculated. There is no single way to determineappropriate indicators for an index, and the indicators included are inherently subjective for gauging a
Chapter 4: Building an Indicator Framework
35
Figure 4.3. The Climate Change and Energy policy category provides anintermediate grouping of climate- and energy-related indicators, and addsan additional level of aggregation.
Ecosystem Vitality
Climate Change & Energy
CO2 Emissions per Capita
CO2 Emissions per GDP
CO2 Emissions per KWH
Renewable Electricity Generation
Fisheries
Forests
Agriculture
Biodiversity & Habitat
Water Resources
AirMEASURABLE OBJECTIVE
CORE CATEGORIES
INDICATORS

particular environmental issue or goal. This being said, indicators are not designed to provide the fullpicture of a particular environmental issue. Instead, they are meant to help reveal trends and drawattention to particular issues (see Figure 4.4). Indicators can also characterize various states or condi-tions, track or predict changes, identify stresses, determine risks, and influence management decisions.
In deciding which indicators to select, the 5D’s can help developers determine what types of indicatorswill help an index convey its message.14 Indicators can be used to:
uDescribe issues• By reducing complexity in policy-relevant ways.
• By answering the question, What’s happening?
36
Measuring Progress: A Practical Guide From the Developers of the Environmental Performance Index (EPI)
Figure 4.4. A schematic that clarifies the relationship between data,indicators, index, and information. Indicators and indices are tools bywhich to communicate data in more targeted and effective ways.
14 de Sherbinin, A., A. Reuben, M. Levy, and L. Johnson. 2013. Indicators in Practice: How Environmental Indicators are Being Used in Policy andManagement Contexts. New Haven and New York: Yale and Columbia Universities.
Data
Indicators
Information
Index

uDiagnose problems• By depicting trends and enabling comparisons between diverse phenomena.
uDiscover patterns• By identifying leaders and laggards.
• By helping to identify best and worst practices.
• By targeting resources at stake.
uDeliberate about solutions• By helping societies and decisionmakers engage in dialogue about
what kind of future they want to have.
• By helping ground discussion in empirical reality.
• By setting goal posts whose desired positions can be debated.
uDrive action• By helping to navigate to a desired future.
• By holding decision-makers and managers accountable.
• By rewarding progress and punishing inaction.
The types of indicators we used for the EPI framework are performance-based indicators linked to quanti-tative objectives, such as targets or commitments (described in Chapter 6). Examples of these types ofperformance indicators include emissions per unit GDP to measure the environmental efficiency of theeconomy, per se, or change in water quantity to measure the intensity of the use of water resources.
Considerations for Indicator SelectionOver the last decade, we’ve discovered some helpful considerations to keep in mind when developing an index:
uLess may be more. Our experience with the EPI has demonstrated that being selective in terms of which indicators toinclude often facilitates the communication and understandability of an index. The inclusion of toomany indicators may dilute the signal provided by an overall category or goal of an index. It may alsobe difficult for the target audience to understand the message an index is attempting to convey.
uEstablish causal connections between indicators and index goals. In selecting appropriate indicators for a performance index, it is important that the user and target audience can see sufficient evidence for a causal link between the indicator and the issue it is trying tomeasure. For example, a measure of the rate of deforestation can provide an indication of forestprotection efforts, but if one is trying to determine an underlying cause of deforestation, informationabout the rate alone is insufficient.
u If a perfect indicator doesn’t exist, look for a proxy. Due to data limitations, it may not be possible to find an exact indicator to measure a particular issue.When direct measures are unavailable, proxies can often be considered as the next available substitute,which may be the case if, for example, a lack of resources prevents direct measurements from beingobtained. However, proxies should be carefully considered because they may potentially bemisleading. For example, for the EPI we included several measures of protected area coverage—forbiomes, highly threatened species and marine areas. These indicators may become confusing to someusers if they do not refer to our methodologies and explanation of these metrics. One advantage of an
Chapter 4: Building an Indicator Framework
37

indicator measuring the amount of space or territory under protection in a country is its ability to revealthe types of action being made on the ground, or policy response (i.e., the amount of space or territorycovered by protected areas as deemed by a policy decision). But a disadvantage of this indicator lies inits inability to provide information on the substance of an outcome. We cannot know from thisindicator, for example, how well a protected area is being managed or whether important species arebeing adequately protected.
uConsider relevant spatial and temporal scales.Given the lag time for certain environmental phenomena (i.e. reforestation efforts, which may takeseveral years to manifest measurable change), it is crucial to select indicators in an appropriate timeperiod to capture the change ostensibly being measured. For this reason, the trend analyses and changeindicators may be more useful in revealing performance rather than simple snapshots of data lackingtemporal context. Spatial scale is also an important consideration, one that has proven to becontroversial in the EPI. While the EPI provides performance scores at the national level, somecountries insist that they are being unfairly punished in performance terms when affected by the trans-boundary effects of pollution (i.e., air pollution that travels from one country to another). The EPI hasmade the decision to not take these trans-border impacts into consideration; however, it may bepossible to account for these effects using modeled data or on a smaller regional scale. YCELPconducted an analysis in 2010 examining the linkages between environmental performance and trade.15
uKeep in mind the target audience. As described in Chapter 2, it is important to keep the target audience and users of an index in mindwhen selecting appropriate indicators. For example, if the key audience of an index is the generalpublic, easily understood indicators based on readily available data may be needed, as opposed to anindex that may be used by businesses or an industry association that could entail technical indicatorsladen with scientific jargon or terms of art. In the latter case, more detailed indicators with specificdata may be required to provide final information.
uEstablishing a set of principles or criteria can help select indicators.A set of principles, such as those discussed in Chapter 2, can help to determine which indicators toinclude in an index. Box 4.1 describes six principles: relevance, performance orientation, establishedscientific methodology, data quality, time series availability, and completeness that we used for the2012 EPI and Pilot Trend EPI. We found these criteria helpful when evaluating hundreds of datasetsfor inclusion in the EPI.
uConduct a cost-benefit analysis to review resource and time constraints for data collection.It may be possible for developers to collect data, particularly if an index is project-based. It is impor-tant to consider the feasibility and the time requirements of data collection. If indicators are notdesigned in a pragmatic manner, they may become too costly and impractical to include in an index.A simple back of the envelope calculation or cost-benefit analysis can help determine whether it ispractical to obtain data necessary for a particular indicator. Some datasets are readily available and ina useful format that will save the core team valuable time. However, other datasets are less transparent(i.e., lack methodological description) or may require aggregation or further research and analysis tobe useful for an index. These implications should be reviewed to determine if the value of the datasetis necessary for use as an indicator and will provide substance to an index, or if the time required toprepare the dataset for use is beyond its worth. In the case of a global project such as the EPI, we rely
38
Measuring Progress: A Practical Guide From the Developers of the Environmental Performance Index (EPI)
15 Yale Center for Environmental Law and Policy. 2011. Exploring Trade and the Environment: An Empirical Examination of Trade Openness andNational Environmental Performance. New Haven, CT. Available:http://envirocenter.yale.edu/uploads/publications/Exploring%20Trade%20and%20the%20Environment%2005.24.11%20Web%20Download.pdf.

on international agencies and partners to aid in data collection, because our staff and resource limitations prevent us from collecting the raw data ourselves.
uQuality counts. The accuracy and quality of data used to construct indicators also matters, and processes to evaluatethese properties are thoroughly described in Chapter 5. For an index to be credible for target users,the underlying data used to construct the indicators must be carefully considered and evaluated. Box 5.4 describes an issue with some of the water quality indicators used in the 2010 EPI that werebased on inconsistent and incomplete data and ultimately called into question the reliability of theindicator itself.
ConclusionIt is important to build a robust framework by developing a tightly linked system of goals and targets thatblend together indicators used to define a set of core categories. A framework is not necessarily set instone—it can evolve alongside changes in policy priorities, data availability, or aims of an index. Thephilosophy held by the EPI is that a framework is a continuous work in progress. In the evolution fromthe ESI to the EPI, we have moved away from a broad scope of indicators related to environmentalsustainability to a more focused and smaller set of core indicators. These indicators meet our principlesand have associated environmental public health or ecosystem sustainability targets, all of which arenecessary elements for helping users decipher the EPI and fulfilling its overall objective.
Chapter 4: Building an Indicator Framework
39
Box 4.1. Principles used for Indicator Selection in the 2012 EPI and Pilot Trend EPI
The EPI team incorporated six principles to determine which indicators to include in the 2012 EPI and PilotTrend EPI. Indicators that did not meet these six criteria were not selected for the indicator framework.
Relevance: The indicator tracks the environmental issue in a manner that is applicable to countries undera wide range of circumstances.
Performance orientation: The indicator provides empirical data on ambient conditions or on-the-ground results for the issue of concern, or is a “best available data” proxy for such outcome measures.
Established scientific methodology: The indicator is based on peer reviewed scientific data or datafrom the United Nations or other institutions charged with data collection.
Data quality: The data represent the best measure available. All potential data sets are reviewed forquality and verifiability. Those that do not meet baseline quality standards are discarded.
Time series availability: The data have been consistently measured across time and there are ongoingefforts to continue consistent measurement in the future.
Completeness: The dataset needs to have adequate global and temporal coverage to be considered forinclusion as an indicator.

40
Measuring Progress: A Practical Guide From the Developers of the Environmental Performance Index (EPI)
Figure 1. The China EPI Framework.
Box 4.2. Identifying an Additional Objective for the China EPI
Population-weighted PM10 ConcentrationPopulation-weighted SO2 ConcentrationPopulation-weighted NO2 Concentration
Access to Tap Water (Urban) Access to Tap Water (Rural) Municipal Waste Intensity
Industrial Solid Waste IntensityMunicipal Solid Waste TreatedMunicipal Wastewater TreatedUrban Human Waste Disposal
Rural Human Waste DisposalHeavy Metals
Hazardous Waste Intensity
SO2 per Populated Land AreaNO2 per Populated Land Area
Water Scarcity IndexIntensity of COD Emissions
Marine Protected AreasTerrestrial Protected Areas
Water Quality of Offshore Marine AreasForest Growing Stock
Change in Forest Cover
Pesticide use IntensityChemical Fertilizer Use Intensity
Soil Erosion
CO2 per CapitaCO2 per Intensity
Economic Energy EfficiencyEfficient Use of Waste
Efficient Use of Water in Agriculture
Efficient Use of Water in IndustryNo. of EPB Employees on Gov’t Payroll
Investment in Env’t Protection, % of GDP
ChinaEnvironmental
PerformanceIndex
Environmental Health
Ecosystem Vitality
EconomicSustainability
Air (Human Health Effects)
Water (Human Health Effects)
Waste & Sanitation
Toxics
Air (Ecosystem Effects)
Water (Ecosystem Effects)
Biodiversity & Habitat
Forestry
Agriculture & Land Mgmt
Climate Change & Energy
Resource Efficiency
Environmental Governance
POLICY CATEGORIESOBJECTIVESEPI INDICATORS
16 Yale Center for Environmental Law and Policy (YCELP), the Center for International Earth Science Information Network (CIESIN), ChineseAcademy for Environmental Planning, and City University of Hong Kong. 2011. Towards a China Environmental Performance Index. New Haven,CT. Available: http://www.envirocenter.yale.edu/chinaepi.
The indicator framework for the China Environmental Performance Index feasibility study, “Towards a ChinaEnvironmental Performance Index16,” was the subject of intense deliberation amongst international and Chineseexperts. While the overall structure of the EPI framework, including the Environmental Health and Ecosystem Vitalityobjectives, remained intact, the inclusion of a third objective on Economic Sustainability was added. The EconomicSustainability objective objective includes indicators primarily focused on the environmental or resource efficiency ofeconomic activities. This is a major policy priority of the Chinese government and was the reason why experts andstakeholders felt these new indicators were critical to include in the final index.

Chapter 4: Building an Indicator Framework
41
Figure 2. The 2012 Environmental Performance Index Framework.
Child Mortality
Particulate Matter
Indoor Air Pollution
Access to Sanitation
Access to Drinking Water
SO2 per CapitaSO2 per $ GDP
Biome Protection
Change in Water QuantityCritical Habitat Protection
Marine Protected AreasAgricultural SubsidiesPesticide RegulationForest Growing Stock
Change in Forest CoverForest Loss
Coastal Shelf Fishing PressureFish Stocks Overexploited
CO2 per CapitaCO2 per $ GDPCO2 per KWH
Renewable Electricity
2012Environmental
PerformanceIndex
Environmental Health
Ecosystem Vitality
Environmental Health
Air (Effects on Human Health)
Water (Effects on Human Health)
Air (Ecosystem Effects)
Water Resources (Ecosystem Effects)
Biodiversity & Habitat
Agriculture
Forests
Fisheries
Climate Change & Energy
POLICY CATEGORIESOBJECTIVESEPI INDICATORS

42
Measuring Progress: A Practical Guide From the Developers of the Environmental Performance Index (EPI)
Evaluating Data Quality 55
Topics Covered in this Chapter:• Data quality criteria
Establishing standards for data evaluation.• Data sources and collection
Finding common sources of environmental data that can be used to develop credible indices.
• Formatting and organizing data Using techniques to organize data effectively.
• Exploratory data analysisEmploying statistical techniques to explore data and spot-check potential problems.
• Data quality gradingUtilizing expert opinion to evaluate the quality of datasets.
• Time series data analysisAssessing time series and trend data to evaluate the quality of data.
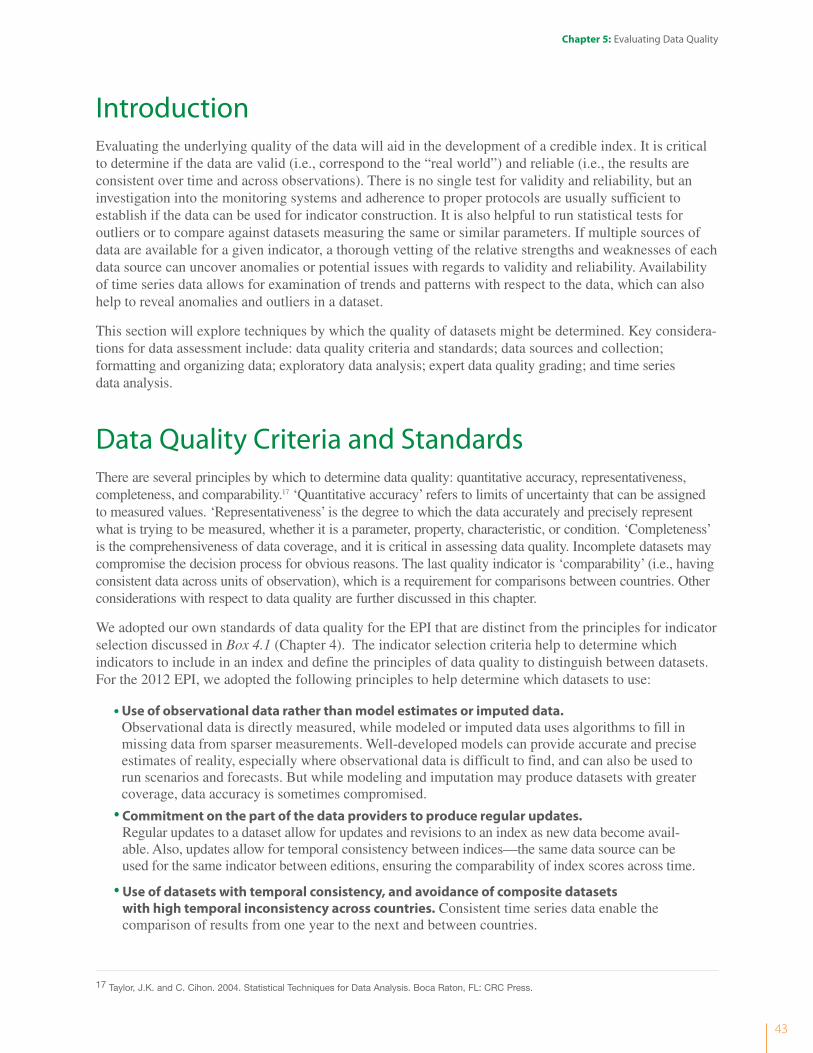
IntroductionEvaluating the underlying quality of the data will aid in the development of a credible index. It is criticalto determine if the data are valid (i.e., correspond to the “real world”) and reliable (i.e., the results areconsistent over time and across observations). There is no single test for validity and reliability, but aninvestigation into the monitoring systems and adherence to proper protocols are usually sufficient toestablish if the data can be used for indicator construction. It is also helpful to run statistical tests foroutliers or to compare against datasets measuring the same or similar parameters. If multiple sources ofdata are available for a given indicator, a thorough vetting of the relative strengths and weaknesses of eachdata source can uncover anomalies or potential issues with regards to validity and reliability. Availabilityof time series data allows for examination of trends and patterns with respect to the data, which can alsohelp to reveal anomalies and outliers in a dataset.
This section will explore techniques by which the quality of datasets might be determined. Key considera-tions for data assessment include: data quality criteria and standards; data sources and collection;formatting and organizing data; exploratory data analysis; expert data quality grading; and time series data analysis.
Data Quality Criteria and StandardsThere are several principles by which to determine data quality: quantitative accuracy, representativeness,completeness, and comparability.17 ‘Quantitative accuracy’ refers to limits of uncertainty that can be assignedto measured values. ‘Representativeness’ is the degree to which the data accurately and precisely representwhat is trying to be measured, whether it is a parameter, property, characteristic, or condition. ‘Completeness’is the comprehensiveness of data coverage, and it is critical in assessing data quality. Incomplete datasets maycompromise the decision process for obvious reasons. The last quality indicator is ‘comparability’ (i.e., havingconsistent data across units of observation), which is a requirement for comparisons between countries. Otherconsiderations with respect to data quality are further discussed in this chapter.
We adopted our own standards of data quality for the EPI that are distinct from the principles for indicatorselection discussed in Box 4.1 (Chapter 4). The indicator selection criteria help to determine whichindicators to include in an index and define the principles of data quality to distinguish between datasets.For the 2012 EPI, we adopted the following principles to help determine which datasets to use:
• Use of observational data rather than model estimates or imputed data. Observational data is directly measured, while modeled or imputed data uses algorithms to fill inmissing data from sparser measurements. Well-developed models can provide accurate and preciseestimates of reality, especially where observational data is difficult to find, and can also be used torun scenarios and forecasts. But while modeling and imputation may produce datasets with greatercoverage, data accuracy is sometimes compromised.
• Commitment on the part of the data providers to produce regular updates. Regular updates to a dataset allow for updates and revisions to an index as new data become avail-able. Also, updates allow for temporal consistency between indices—the same data source can beused for the same indicator between editions, ensuring the comparability of index scores across time.
• Use of datasets with temporal consistency, and avoidance of composite datasets with high temporal inconsistency across countries. Consistent time series data enable thecomparison of results from one year to the next and between countries.
Chapter 5: Evaluating Data Quality
43
17 Taylor, J.K. and C. Cihon. 2004. Statistical Techniques for Data Analysis. Boca Raton, FL: CRC Press.

Once a dataset passed these criteria, our team then reevaluated each dataset to determine itsappropriateness for the purposes of indicator construction (see Chapter 4 for more information onindicators).
While every attempt was made to find datasets meeting all criteria, in some cases data availability dictatedour final indicator selection. For example, to select the most performance-oriented data, our team put datasuitability criteria into a hierarchy of importance, then we applied this hierarchy to choose datasets. Thefirst tier of data included measures of direct environmental harm or quality, such as ambient pollution levelsto assess air quality. When direct measures were not available, proxy measures (the second tier) wereconsidered as best available substitutes, such as the use of agricultural subsidies18 to gauge agriculturalsustainability under the 2012 EPI’s agricultural policy category. Finally, if none of the above tiers of datawere available, evaluations of policy intent or motivation were used. An example of this type of indicator isthe Persistent Organic Pollutants (POPs) indicator in the 2012 EPI, which was also in the Agriculturepolicy category. This indicator measures whether countries allow, restrict, or ban one of the 12 “dirtydozen” POPs regulated under the Stockholm Convention.19 It is not a direct measure of pesticide levels orecosystem effects but does predict to a certain extent what POPs will likely be present in the environment(i.e., if a POP is not banned there is a greater likelihood that it will be present in the environment). Weconstructed the POP indicator through a point system to develop an objective measure of policy intent: twopoints were awarded for a banned substance, while only one point was award for restriction of a POP, and atwo-point penalty was applied for any POPs allowed.
Ultimately it is up to the designer of an index to determine what standards and criteria to use for dataquality. However, there is an inherent trade-off between employing strict standards of data quality andhaving data be widely available. An index could implement standards of quality so strict that no appro-priate data could meet them. Therefore, while data quality standards can assist with identifying poorquality data, they can also limit the availability of data. For example, it was not until the 2012 edition ofthe EPI that we incorporated time series data into the index and used a requirement for historical data to
44
Measuring Progress: A Practical Guide From the Developers of the Environmental Performance Index (EPI)
18 According to a report by the OECD (2004), public subsidies for agricultural protection and agrochemical inputs exacerbate environmental pres-sures through the intensification of chemical use, the expansion of land into sensitive areas, and overexploitation of resources.
19 See http://www.pops.int/documents/meetings/inc7/mastlist5/ml5.pdf, page 243 for more information on the specific types of pesticides regulatedunder the Stockholm Convention.
Figure 5.1. Hierarchy of information to create indices (adapted from Segnestam, 2002).In reality, primary data availability is the limiting factor in index development.
Primary Data
A. Theory B. Reality
Analyzed Data
Indicators
ag
gre
ga
tio
n
IndicesIndices
Indicators
Analyzed Data
PrimaryData

determine which sources to include. Choosing only time series data limited the number of available andappropriate datasets for the 2012 EPI. The time series criterion also eliminated some otherwise prefer-able datasets from consideration. For this reason, each data criterion should be carefully considered forits ability to produce to a better index, as well as the limitations it may impose on data selection.
In the end, although the process of data selection for use in an index should resemble the Theory trianglein Figure 5.1, with each level of data being selected from a larger pool of data on the lower levels, moreoften than not the reality is that primary data are often limited, as in the Reality triangle. While indexdesigners would like to have a broad base of primary data available by which to create indicators and ultimately indices, the process of data selection is usually dictated by the design of an index’s foundations(Chapter 2), and the data used is determined by whatever data are available. Figure 5.2 provides aflowchart decision matrix for evaluating a dataset for use in an index.
Chapter 5: Evaluating Data Quality
45
Figure 5.2. Flow chart decision matrix of evaluating a dataset for use in an index.
Is the dataset based on modeled or imputed valuesor observations?
YES
NO
YES
NO
YES
NO
YES
NO
YES
NO
Think about what is more important to the index—data coverage
or accuracy.
A time series may not be
necessary for a first effort.
Is the index a one-time effort, or are
there plans to continueupdating it?
See Chapter 2: Think carefully
about the aim of the index.
Think about how comparable the results
might be (if at all).Reconsider using
the data.
Consider for Indicator
Construction
Consider for Indicator
Construction
Consider for Indicator
Construction
Consider for Indicator
Construction
Consider for Indicator
Construction
Does the dataset havea time series?
Is there a commitment onthe part of the data providersto continue updating thedataset in the future?
Does the dataset reflect states, impacts, and pressuresin the DPSIR (drivers, pressures,states, impacts, and responses)frameworks?
Does the dataset havetemporal consistencybetween entities?

Data Sources and Collection The data used for the EPI come from a variety of sources including international organizations, researchinstitutions, government agencies, and academia. There are many sources of data that can be consideredfor inclusion in an index, such as those from:
• Official statistics that are measured and formally reported by governments to international organizations that may or may not be independently verified;
• Spatial data compiled by research or international organizations;
• Observations from monitoring stations;
• Modeled data;
• Field research and data collection programs through efforts of scientists and organizations (see Box 5.1 for examples).
46
Measuring Progress: A Practical Guide From the Developers of the Environmental Performance Index (EPI)
Box 5.1. Examples of Field Research & Data Collection Programs
Many data collection programs collect information from researchers, scientists and organizations for differentscaled initiatives. Data collected from scientists, members of academia and other organizations are frequentlyshared through data repositories, or these datasets are incorporated into larger assessments. Below are someexamples of how data may be gathered by different sources for sharing or program implementation.
Academia:Spatial data are often collected by researchers inacademia and shared with statewide programs.Universities help provide support by gathering largesources of data that may otherwise be out of reach witha state’s resources. The University of Connecticut collabo-rates with the Connecticut Department of Energy &Environmental Protection to provide maps andgeospatial data to the public on the CT EnvironmentalConditions Online Website, http://www.cteco.uconn.edu.Many of these datasets are provided by and maintainedby academic institutions.
Government:The U.S. government has several large-scale initiatives forcollecting national environmental data. The U.S.Geological Survey runs the Cooperative Water Program,which relies on approximately 1,500 state and localagencies to provide data and information on waterresources throughout the country,http://www.water.usgs.gov/coop/. The U.S. GeodicSurvey collects information for their National Spatial
Reference System (NSRS), which establishes referencestations at precisely determined locations (latitude,longitude, height, scale, gravity and orientation),http://www.ngs.noaa.gov. The U.S. Department ofAgriculture Natural Resources Conservation provides soildata and information produced by the NationalCooperative Soil Survey,http://www.websoilsurvey.nrcs.usda.gov/.
International Organizations:Some international programs depend upon membersof the scientific community and other groups to helpcollect data and information for global assessments. Thedata for the IUCN Red List of Threatened Species iscollected through assessments performed by membersof the IUCN SSC Specialists Groups, appointed Red ListAuthorities, or by participants of Global BiodiversityAssessment workshops, http://www.iucnredlist.org.They also welcome and review assessments by anyoneoutside of these member groups. Often, scientistsconducting population studies or assessments maycontribute their findings to this IUCN program.
Sources for More Information:U.S. Geological Survey: Cooperative Water Program http://www.water.usgs.gov/coop/U.S. Geodic Survey: Spatial information (latitude/longitude, etc.) http://www.ngs.noaa.gov/INFO/WhatWeDo.shtmlU.S. Department of Agriculture: National Cooperative Soil Survey http://www.websoilsurvey.nrcs.usda.gov/app/HomePage.htm

Sources of data to be used will depend on the size and scale of the issue an index is attempting tomeasure. The EPI provides a snapshot of environmental performance and only requires the most recentyear of data available. Due to the scale of the EPI, which includes over 100 countries, primary datacollection is not possible. For other indicator efforts more limited in scope, another option for datacollection is through survey or questionnaire techniques, or to allow for entities to self-report data. Withthe exception of Taiwan,20 the EPI does not allow countries to self-report data due to potential conflicts ofinterest and data verification concerns. Instead, for the EPI we often look to organizations, such as thoseintergovernmental organizations listed in Box 5.2, that serve as central agencies for global data collection.
For a high-quality, credible index that allows for self-reported data, we recommend a verification procedureto ensure that data are credible and comparable. Appendix 4 presents an example of this type of data qualityassessment from countries themselves as part of the 2005 ESI. As part of a country data review initiative,
Chapter 5: Evaluating Data Quality
47
Box 5.2. Intergovernmental Organizations (IGOs) that Collect Global Data
We rely on many international data custodians to collect datasets for building the EPI indicators. These datacustodians are typically intergovernmental organizations (IGOs) that have the ability to coordinate with countrieson a global scale to collect data on a range of issues. Below are several examples of international datacustodians, or organizations, many of which we rely on as resources for the EPI.
Food and Agricultural Organization (FAO)The Food and Agricultural Organization (FAO) of theUnited Nations collects, analyzes and disseminates datathat aids development, including data related toagriculture and agricultural policy. FAO’s effortssurround its mandate to achieve food security for all.FAO provides several global spatial databases(http://www.fao.org/corp/statistics) to provideinformation on topics related to agriculture, such asland-use, water management, production, trade,consumption, nutrition, fisheries, forestry, and importsand exports of wood and paper.
World Health Organization (WHO)The World Health Organization (WHO) providesleadership on global health matters and is part of theUnited Nations system. WHO’s agenda is focusedaround its aim to improve public health. To helpcountries achieve better public health, WHO offers theGlobal Health Observatory data repository(http://www.who.int/gho)—a collection of data andanalyses for monitoring global health. WHO offersnumerous datasets on world health statistics, includingthe occurrence of diseases, rates of mortality, and nutri-tional information, among many others.
International Energy Agency (IEA)The International Energy Agency (IEA) provides globalinformation related to its four focus areas: energysecurity, economic development, environmentalawareness, and worldwide engagement. IEA’s aim is tohelp ensure reliable, affordable and clean energy for itsmember countries and beyond. To help countriesachieve energy goals, the IEA provides statistics andonline data services (http://www.iea.org/stats), whichoffer country-level information on important energyrelated topics, such as emissions, energy statistics andbalances, types of energy sources, and renewables.
The World BankThe World Bank Group consists of several organizationsowned by the governments of member nations. TheWorld Bank provides support to developing countries,through policy advice, research and analysis andtechnical assistance. To ensure countries have access tothe best available tools and knowledge, the World Bankprovides an extensive database(http://www.data.worldbank.org), which provides infor-mation on a range of key topics, from agricultural and ruraldevelopment, climate change, education, environment,and poverty, to social and urban development.
20 For political reasons, Taiwan is unable to report its data to some United Nations-based or other international agencies that do not recognize it asan independent country.

Measuring Progress: A Practical Guide From the Developers of the Environmental Performance Index (EPI)
48
YCELP and CIESIN provided the 2005 data for each indicator to the environmental ministries and statisticaloffices of 152 countries. We asked the countries to review the collected data for accuracy and provide, whereapplicable, corrections or recent updates. YCELP and CIESIN also set up a website through which countriescould interact with the team as data were being reviewed and updated. A total of 62 countries responded tothe data review request, and of these, 25 countries sent updated and additional data. Fourteen countriesprovided feedback on methodological aspects of the ESI, and 39 countries sent references to reports andwebsites or informed us that they had no comments on the data sent. This review process ultimately led us todetermine that this type of ad-hoc data request was not the best way to obtain consistent country-level data;however, it was a useful exercise in understanding the limitations of this mode of data collection and thevalue of working with global institutions who serve as centralized data repositories.
When possible, collecting multiple sources of data that attempt to measure the same issue can help to iden-tify potentially problematic data quality issues. Collecting multiple sources of data can provide a basis ofcomparison between datasets, which can help in determining whether there is a relationship or consistency.If there is little consistency between two datasets, one can investigate why this might be the case andwhether one dataset is better suited than the other for measuring the issue of interest. For the 2012 EPI, weevaluated multiple sources of data for carbon dioxide emissions for the climate change policy category,including data from the International Energy Agency (IEA), the United Framework Convention on ClimateChange (UNFCCC), and the U.S. Energy Information Agency (U.S. EIA). We created scatterplots of thedatasets (one dataset as the x variable, a second dataset as the y variable; see Figure 5.3). If the datasets aresimilar, they should be highly correlated and reveal points close to the identity line of the plot—a 45-degreeangle from the origin would indicate high correlation between the two datasets. Any anomalous points inthe scatterplot could suggest problems with the accuracy or validity of a given dataset.
There is another critical rule of thumb when collecting data for the purposes of constructingenvironmental performance indices: do not throw out any collected data or make any prejudgments as towhether or not a dataset could be useful or pertinent! It is always better to have multiple sources of dataand extra data that may come in handy later. Having multiple sources of data also aids in transparency.Often, we are asked why we chose to use one dataset over another. Having additional datasets on handand detailed notes of our careful evaluation and explanations as to why we chose one over the other helpsto build transparency and credibility in the final product.
Figure 5.3. Scatterplot of two sources ofclimate data from the WRI and the IEArespectively. 21 The points fall roughlyalong the identity line —a 45 degreeangle from the origin—and show a strongcorrelation between the two datasets.
0 2 4 6 8
8
6
4
2
0
21 2007 carbon dioxide emissions data is from the International Energy Agency (IEA) on the x axis; 2007 carbon dioxide data is from the WorldResources Institute‚ Climate Analysis Indicators Tool (CAIT) on the y axis.

Formatting and Organizing DataConsistency is the most important principle to keep in mind when formatting and organizing data for thepurposes of analysis and indicator construction. To prevent major confusion in the future, data should berecorded as uniformly and consistently as possible, with the appropriate metadata included (i.e., source,author, date of collection, etc.; see Appendix 3 for an example of metadata from the EPI). Consistent codingof data is also important when there are multiple indicators or datasets used for each issue. Notation of theappropriate units of measure for the data is critical and should be described in detail in the metadata.
For the EPI, we always keep one set of the raw observations and data that come from an original source.This is important if any normalization, transformation, or inversion is applied to a dataset. The originalvalues are maintained in case data issues emerge later in the review. In our EPI metadata, we alwaysinclude notations with respect to any transformations or changes to the data used for an indicator.
Lastly, data should always be cross-checked. Allow for multiple, independent reviews of data to make sure there are no errors in data entry or formatting. Experts engaged in the development of an index (see Chapter 3) can also help to vet and verify data quality.
Exploratory Data AnalysisBefore attempting to draw any conclusions from more complex analyses, it is important to first examinethe data by conducting an exploratory data analysis. Examining the distribution of the data, whether it isnormally distributed or skewed left or right, is important for determining if statistical transformationsneed to be applied. For most datasets, a logarithmic transformation allows more effective differentiationamong performers that might be closely clustered together, and a transformation allows comparisons toreflect percentage changes rather than absolute levels of performance (see Chapter 6). Truncation to arange of desired values may be needed to exclude some unwanted values. For example, in the 2012 EPInegative values of the Agricultural Subsidies indicator are truncated to zero because these values actuallyrepresent agricultural taxation rather than subsidies, which is what the indicator is intended to measure. Incombination, this preliminary data analysis work leads to cleaned and transformed data.
When exploring the data, it is critical to ask whether changes in the data reflect real changes inperformance or actual changes in what the proposed index is attempting to measure. What are the sourcesof the change – could the data reflect mere changes in collection methodology or reporting, or do the datamost likely reflect on the ground changes? Often it is difficult to identify the signal through the noise of adataset to determine whether observed and measurable changes are due to actually implemented policies.Box 5.3 provides an example of a dataset that shows real change as a result of policy action. One way toevaluate such a change is to compare two similar entities. For example, in the case of the EPI, we cancompare the datasets of two countries that are similar with respect to GDP, geography, natural resourceendowment, or environmental challenges. If there are differences in an environmental indicator (e.g.,forest cover), one can then look at policies in both countries to determine whether the variation in forestcover is due to policy action or simply differences in natural endowments.
Regression analysis and statistical modeling have also been useful in evaluating data quality. Correlationanalysis allows for comparisons of datasets from different sources, thereby helping to spot anomalies orinconsistencies in the data. For example, to determine whether an air pollutant emissions dataset such assulfur dioxide is credible, one could run a correlation analysis of this dataset with energy or coal combus-tion data, because sulfur dioxide emissions are primarily the result of these processes. If the coal combus-tion data and sulfur dioxide emissions data do not match or show similar trends, there could be enoughbasis for questioning the validity of one of these datasets. Often the collection of “ancillary” datasets (i.e., a dataset that is not directly used in the index but can be helpful for comparison, such as the case ofcoal combustion for air quality data) can be used to develop simple linear regression models or conduct this
Chapter 5: Evaluating Data Quality
49

type of correlation analysis. Applying these statistical techniques can reveal patterns in environmental dataand whether the indicator or dataset in question provides the desired signal or measurable objective, particu-larly in circumstances where calculation methodologies or information on descriptive sources are lacking.
50
Measuring Progress: A Practical Guide From the Developers of the Environmental Performance Index (EPI)
Box 5.3. Detecting Measurable Changes inFisheries Sustainability in Namibia22
Often when evaluating a dataset for measurable changes resulting from government policies, it is difficult to distin-guish a signal from all of the noise. Working with experts at the Sea Around Us Project based in Vancouver, BritishColumbia, the EPI team developed indicators for Coastal Shelf Fishing Pressure (the intensity of fishing gear, like trawls,that operate on the shelf ) and Fish Stocks Overexploited and Collapsed (the fraction of fish stocks overexploited andcollapsed by exclusive economic zone (EEZ)). When trying to interpret the data for these indicators, Namibia is a clearexample of where policy interventions have directly led to improvements in fisheries sustainability. These results areeven more evident when taking a look at the full time series of data provided by the Sea Around Us Project, as demon-strated in the above two plots. In the early 1990s, fish stocks in Namibia were in dire straits, with around 80 percent ofstocks in a collapsed or overexploited state (red and orange areas in the upper plot). From about 2000, the situationimproves considerably. This improvement tracks the establishment of Namibia’s EEZ in 1990, which eliminated foreignfishing fleets (and can be seen in the lower plot in blue). Until Namibia established its EEZ in 1990, South African,Russian, Spanish, and Ukrainian vessels took the bulk of the catch (see figure, top). After 1990, Namibia restricted theaccess to its EEZ, and was able to enforce restrictions.
1950 1960 1970 1980 1990 2000 (n=64)
100
90
80
70
60
50
40
30
20
10
0
Cat
ch b
y st
ock
sta
tus
(%)
1950 1955 1960 1965 1970 1975 1980 1985 1990 1995 2000 2005
1,800
1,600
1,400
1,200
1,000
800
600
400
200
00
Cat
ch (t
on
nes
‘000
)
Rebuilding
Developing
Exploited
Overexploited
Collapsed
South Africa
Nambia
Russian Federation
Spain
Ukraine
Poland
Romania
Lituania
Bulgaria
Estonia
Georgia
Others
Sea Around Us Project 2011
22 Data source: Sea Around Us Project, 2011. Fish catches by country from 1950-2005 are shown in the above plot; and Species StockStatus from 1950 to 2005 is depicted in the lower plot.

Data Quality GradingThe Food and Agriculture Organization (FAO) has adopted data quality indicators in their system toassess the quality of their statistics. These indicators include: relevance and completeness, accuracy,timeliness, accessibility and clarity, comparability, and coherence.23 Our team also conducted a qualityassessment of variables used to construct the 2005 ESI. Relying on expert opinion to assess the variablesused to construct the ESI indicators, we used a graded quality assessment rubric (see Appendix 4) togauge relevancy (i.e., relativeness between a variable and the issue of interest), accuracy (i.e., reliability ofthe data source - whether the methodology used to calculate the variable is widely adopted and well estab-lished or other data was available to cross check the accuracy of the data), and spatial and temporalcoverage (e.g., most recent dataset, frequency of update, spatial coverage, and availability of a consistenttime series).24 Using these criteria, our team, along with outside experts, assessed data variables, giving“grades” of A (Excellent) to F (Unacceptable) and U (Unknown). The final grades were averaged and asingle rating given to the variables. As this process was “inescapably subjective” and limited to the knowledge of the working teams and experts, we found this method of judging the quality of data to beproblematic, particularly in areas where experts disagreed on the some of the assessment criteria.15 For theEPI we dropped this exercise, although internally we follow similar procedures.
Time Series Data AnalysisThe availability of time series data provides a greater ability for spotting anomalies and erroneous data toimprove the quality and credibility of indicators and the overall index. However, for most pilot efforts, theinitial use of time series data may not be necessary, depending on the particular aim of the index. Whilereceiving consistent feedback on the value of time series data as a way for countries to evaluate progressand performance over time, we piloted the use of time series data for a few selected indicators in the 2010EPI (Access to Sanitation, Access to Drinking Water, Industrial Greenhouse Gas Emissions, and CarbonDioxide Emissions per kWh of Electricity Generation).
For the 2012 EPI, the availability of time series data for almost all of the indicators allowed for more dataquality analysis through evaluations of trend data and anomalies. In the case of data for the Fisheriescategory, for example, we were able to use the time series data to spot erroneous data reporting for somecountries that were revealed as anomalies. Experts who provided the data were able to corroborate knownreporting issues with the data, which allowed us to remove anomalous data points. In other indicators, forexample the Forest Cover and Forest Growth indicators, the availability of time series data allowed us toidentify suspicious trends. For some countries, we noticed that data for the Forest Cover and ForestGrowth remained unchanged in a five- or 10-year period, causing us to question whether new data werebeing reported and updated, or if the same data were simply being reported year after year. Afterexamining these patterns, we reviewed the data’s original source and consulted with experts more familiarwith the forestry data to determine the origin of reporting issues. We noted these data quality andreporting issues in Section 4 of the 2012 EPI Report.
Time series data can also aid in evaluating whether a particular dataset actually measures or gaugeschanges in the issue an indicator or index is attempting to measure. With a single data point in time, it isdifficult to determine what that data point might be signaling. However, it is important to also keep time
Chapter 5: Evaluating Data Quality
51
23 Food and Agriculture Organization (FAO). 2005. Quality in Statistics: Integrating data quality indicators into the FAO statistical system.Luxembourg: Seventh Eurostat Meeting 23-24 May.http://faostat.fao.org/Portals/_Faostat/documents/data_quality/Integrating_Data_Quality_Indicators_fao_eurostat.pdf
24 Esty, D.C., M.A. Levy, T. Srebotnjak, and A. de Sherbinin. 2005. 2005 Environmental Sustainability Index: Benchmarking NationalEnvironmental Stewardship. New Haven: Yale Center for Environmental Law & Policy.

52
Measuring Progress: A Practical Guide From the Developers of the Environmental Performance Index (EPI)
Box 5.4. New Zealand and the 2010 EPI’s Water Quality IndexIn the 2010 EPI, we included Water Quality Index (WQI) as an indicator in the Water – Ecosystem Effects category.The WQI, which we created, was an attempt to measure countries’ water quality in the absence of completecountry coverage and data for key water pollutants and measures of water quality. The WQI included threeparameters for measuring nutrient levels (Dissolved Oxygen, Total Nitrogen, and Total Phosphorus) and twoparameters for measuring water chemistry (pH and Conductivity). We selected these parameters because theycover issues of global relevance (eutrophication, nutrient pollution, acidification, and salinization), and becausethey are the most consistently reported water quality standards. We collected the data from the United NationsGlobal Environmental Monitoring System (GEMS) Water Programme, which maintains the only global database ofwater quality for inland waters, and the European Environment Agency’s Waterbase, which has better Europeancoverage than GEMS.
Globally, the UNEP GEMS Water Program is the only international program that collects scientific information onwater quality parameters for surface and groundwater, although its future maintenance is uncertain. However,participation is voluntary and each country selects the stations reported to GEMS. As a result, some countriesonly supply data from one or more monitoring stations; others provide water quality data for almost all of theirmonitoring stations. Although the GEMS database is the most comprehensive database of water quality, werecognize substantial gaps remain in country, temporal, and parameter coverage, which is why we attempted tocreate a new measure of global water quality, the WQI.25
However, we determined that the data upon which we based imputations and the WQI were not consistent forcountries in terms of spatial coverage (i.e. which bodies of water should be included), temporal coverage (i.e. atwhat frequency), and scientific coverage (i.e., which parameters should be measured). In the case of NewZealand, the country’s Prime Minister took the WQI as a standalone measure to claim the country had the “world’ssecond best water quality,” behind Iceland.
There are many reasons why this was not a correct assertion. Data were available to compute indicator values for85 countries, but there were inconsistent time periods for available data. Seventy-four countries had recent data,and 11 countries had data from pre-1990 for which a regression model was used to impute post-1990 scores. Amultiple imputation model based on statistical relationships between countries with data and a number of covariates (variables that can predict WQI scores) was used to compute WQIs for an additional 110 countries that had more than 10 sq. km of surface water bodies. Countries with surface water less than 10 sq. km were averaged around.
There was also highly inconsistent station coverage across the countries. For GEMS, some stations are in areas withlower water quality, such as those downstream from pollution activities; others are pristine sites in undisturbedareas or at the headwaters of a water body. Thus some stations measure water that is not representative of overallwater quality for an area. One solution to this inconsistency would be to use data from only those stationsconsidered representative. However, based on expert judgment of GEMS personnel we decided not to attempt toidentify and filter out non-representative stations. Rather we retained all available data for all countries. We didhowever apply a station density adjustment factor to penalize countries with fewer reported stations.
Regardless of our attempts, the results were mixed and closer scrutiny revealed that imputed values, rather thanambient or direct measurements, could misrepresent on-the-ground conditions. Therefore, for the 2012 EPI weattempted to shift away from modeled or imputed datasets (with the exception of the Water Quantity indicator)and instead opted for data that adhered to stricter quality standards wherever possible.
25 Srebotnjak, T., G. Carr, A. de Sherbinin, and C. Rickwood. 2011. "A global Water Quality Index and hot-deck imputation of missing data"Ecological Indicators, available at http://dx.doi.org/10.1016/j.ecolind.2011.04.023.

scales in mind – a flat trend in a decade’s worth of data may not mean that the data are being inaccuratelyreported or there are issues of quality control. Some environmental changes are slow to manifestthemselves in measurable, quantifiable results. As in the case of changes in the global climate, forexample a longer time period may be necessary to evaluate a particular change.
ConclusionFor a pilot effort, it may not be necessary to employ very strict data quality standards, particularly if theissue an index is attempting to measure has sparsely available data. Data quality standards represent aprocess and an evolution. We always release the EPI with a disclaimer that it is a “work in progress” toreflect changes and improvements in data quality and availability over time. The most important rule ofthumb is to be transparent about the sources of data, the limitations of data, and any known issues withand information for the data. In this way, one can build a credible index that people can trust and theconsequences and limitations of the data used can be easily understood.
With this said, it is still critical to consider the quality of data being used to develop an index. Evaluatingdata quality is important. For the 2012 EPI, considerations of data quality also helped us determineweightings for the purposes of aggregation (see Chapter 6) for more information on weighting andaggregation). We gave less weight to indicators from datasets with lower quality. Some countries, suchas North Korea, were completely excluded based on the quality of the available data. Anomalous resultsfor North Korea on the Access to Water and Sanitation and Fish Stocks Over Exploited and Collapsed(FSOC) indicators raised questions of data quality, leading to our decision to exclude North Korea fromthe 2012 EPI.
Chapter 5: Evaluating Data Quality
53

54
Measuring Progress: A Practical Guide From the Developers of the Environmental Performance Index (EPI)
C onstructing an Index66
Topics covered in this chapter:• Determining targets
Determining high performance and low performance benchmarks.
• Calculating indicatorsCalculating performance indicators using a proximity-to-target methodology.
• Weighting and aggregating the index Selecting and assigning weightings to statistically aggregate the final index.

IntroductionAn index typically combines many indicators, as measured by selected datasets, over one or many levelsof aggregation to produce a single score or rank for each subject. There are many methods foraggregating indicators into indices (see Appendix 1), but here we describe the methods used to develop theEPI. In the case of the EPI, indicators are statistically combined or aggregated into policy categories andthen aggregated into policy objectives to produce a single score and a global rank for each country with sufficient data. The process for constructing an index involves, at the very least (but is not limited to), thefollowing steps:
• Determine TargetsBefore indicators can be calculated, high and low performance benchmarks need to be established.
• Calculate IndicatorsUsing a proximity-to-target methodology, raw datasets are transformed into performance indicators.
• Weight and AggregateWeightings are assigned at every level of aggregation, including indicators, policy categories, andobjectives according to the relative importance of each level.
In practice, the methodology of indices is far from mechanical. Expert judgment, interpretation of statis-tical results, and policy or management goals play important roles in setting the many constraints thatproduce an index. This chapter details both the quantitative and qualitative components for themethodology of index creation based on our experience with the EPI.
Throughout this chapter we use one consistent example (in addition to other examples) to illustrate themethodology described. For this example, consider a car buyer wishing to create a vehicle sustainabilityindex (hereafter called the “VSI”) to assist in selecting the most environmentally friendly vehicle basedon the combination of four characteristics: vehicle cost, fuel efficiency, passenger capacity and the miningfootprint of its manufacturing process. These data will be used to create four indicators: affordability,emissions, capacity and eco- impact.
Determining TargetsThe targets set for an index establish goals on the indicator level and allow for comparability betweenentities. Sometimes clear targets exist, either from biological thresholds, policy goals, or from establishedexpert judgment. Regardless, it is the job of the research team to determine targets that best represent thegoals of their index.
For the purposes of the EPI, we discovered that the most appropriate available targets for theenvironmental realm come from international or national policy goals, international organizations (e.g.,global organizations such as the World Health Organization, (WHO)), scientific criteria, or expertjudgment. The 2012 EPI targets were established using input from five sources:
• treaties or other internationally agreed-upon goals;• standards or recommendations set by international organizations;• leading national regulatory requirements;• expert judgment based on prevailing scientific consensus; and• ranges of values observed in the data over the duration of the time series.
Selecting appropriate targets is ultimately subjective and relies on the context of an index’s objectives.One example to consider is pollution. From an environmental perspective, zero levels of pollution may be
Chapter 6: Constructing an Index
55

a target value that represents the best possible state of the world. However, a target of zero is far fromrealistic, because it would mean the cessation of economic activity and a marked decline in livingstandards. When we chose the target for PM 2.5,26 we looked to reputable international and scientificorganizations to determine what the top performance benchmark should be. According to the WHO,annual average PM 2.5 concentrations of greater than 10 micrograms per cubic meter are known to beinjurious to human health.27 Thus we chose this 10 µg/m3 average exposure level as our target for PM 2.5.
In the EPI, achieving or exceeding a target is equivalent to a score of 100 on a 0-100 scale. Along withestablishing a high performance benchmark, it is also necessary to establish the low performancebenchmark, which is the low end of the indicator range (e.g., equivalent to 0 on a 0-100 scale). For theEPI, the worst-performing country usually establishes the low performance benchmark for a particularindicator, although Winsorization at the 95th percentile may also be used to establish this benchmark.For the 2012 EPI and the Pilot Trend EPI, we used the entire time series data (e.g., the lowestperformance over a 20 year time series) to set both the low and high performance benchmarks.
There are other considerations when establishing targets. One such consideration may include differentialtargets, which may be appropriate under certain circumstances (see Box 6.1). For example, differentialtargets may be used if differing levels of economic development make achievement more difficult for asubset of entities included in an index. To set differential targets, one should first determine a characteristicfor which differing performance is warranted. For example, data for economic development, such as percapita GDP, should be collected for all observations and then ranked along a continuum with cutoff points
56
Measuring Progress: A Practical Guide From the Developers of the Environmental Performance Index (EPI)
EXAMPLE: Targets for an imaginary Vehicle Sustainability Index (VSI)We need four targets for our VSI example, one for each characteristic we have chosen.
Cost: The best cost for a vehicle would be zero, since this represents the lowestprice we could pay. However, a new vehicle priced toward the bottom of this scalemight raise some red flags, so we will set our target at $10,000 for Cost.
Fuel efficiency: In terms of miles per gallon, higher fuel efficiency is better. TheWhite House has set a fuel economy target to reach 54.5 miles per gallon by 2025.This target falls into the category of “leading national regulatory requirement.”
Passenger capacity: A larger vehicle can transport more people per unit of fuel.However, any gains based on passenger capacity are not meaningful above the sizeof the average group that is traveling to the same location, say, the four people in anaverage family. A passenger bus may carry more people per unit of fuel, but for theaverage family, much of that space will often be unused. For this reason, a targetabove the size of the family would not make much sense. We will set this target atfour passengers.
Mining footprint: The “mining footprint” of a car’s manufacturing wouldrepresent the amount of resources required (in terms of area mined) in order toproduce the vehicle. This is measured in hectares, and a car scores better if this valueis lower. We will set this target at zero, the least impact possible.
26 Particulate Matter with a diameter of 2.5 microns or less27 World Health Organization (WHO). 2006. The World Health Report 2006: Working Together For Health. Geneva: World Health Organization.

Chapter 6: Constructing an Index
57
Box 6.1. The Ocean Health Index: Using Differential Targets to Judge Performance
In 2008 there was no definitive measure of the health of the world’s oceans. Four years later, using acombination of social, economic and environmental indicators, Ben Halpern, Karen McLeod, Steve Katona,Andrew Rosenberg, Catherine S. Longo and their team have created a multi-dimensional tool to produce justthat—the Ocean Health Index (OHI).
One of the unique features of the OHI is that it uses differential targets across countries. This means that thetarget for good performance is adjusted for each country based on its potential – no country would, forexample, be expected to raise the area covered by a given type of desirable ecosystem above thatecosystem’s original extent in the country. Through differential targets, the designers of the index measureenvironmental performance in terms of current status, but also relative to an established reference point. Forexample, the OHI uses maximum sustainable yield (MSY) to calculate scores for its Fisheries indicator. Thefishing landings of each country are judged relative to the country’s potential volume of sustainableextraction. Countries that receive the best scores are neither over- nor under-harvesting relative to this value,as it represents the management of the ecosystem for maximum social benefit as well as ecological health.Each indicator in the OHI incorporates a target like maximum sustainable yield that varies across countries.Some are established ecological targets like MSY, while others are historical benchmarks or are based onspatial and functional relationships.
How does the OHI’s approach compare to that of the EPI? The Pilot Trend EPI can be compared to the “differ-ential target” approach. In this analysis, each country receives not just an EPI rank and score, but another rankand score based on the trend in its performance for a given indicator over time. In this sense, each country isjudged relative to a historical benchmark to calculate its trend score. Both overall score and trend score arepresented side by side, such that status and trend can be considered together when forming an opinion onoverall performance.
Setting differential targets involves adding another layer of subjectivity to results, as researchers must makejudgment calls on how to vary targets across nations. However, it can also elucidate patterns of performanceand reward particular types of good performance that would otherwise remain hidden in the data.
Food Provision
A rtisanal Fishing Opportunity
Fisheries
Mariculture
L ivelihoods
E conomies
Iconic Species
L asting Special Places
H abitat
Species
Ocean HealthIndex
Natural Products
Carbon Storage
Coastal Protection
Tourism & Recreation
C oastal Livelihoods & Economies
Sense of Place
Clean Waters
Biodiversity
For EachIndicator:
Present R eference
Current Status
TrendPressure
R esilienceLikely Future

for GDP groupings. This might be based on natural breaks, percentiles, standard deviations, or some othermeasure. Next, a target for each group should be established, for example 100 percent critical habitatprotection for the 80th through 99th percentile, 80 percent critical habitat protection for the 60th through79th percentile, and so on. Based on these new targets, new scores can be calculated that reflect proximityto differential targets, although it must be noted that comparison across groups may now become difficult.
For the EPI, we have foregone differential targets for the reason that comparability then becomes difficultfor the entire set of included countries. In the 2012 EPI, we leveled the playing field without having toresort to differential targets by incorporating materiality thresholds (see Box 6.2).
58
Measuring Progress: A Practical Guide From the Developers of the Environmental Performance Index (EPI)
Box 6.2. Incorporating Materiality Thresholds in the 2012EPI to “Level the Playing Field” Among Countries
Recognizing that countries have varying natural resource endowments, physical characteristics, and geography,we applied a concept of “materiality” in the aggregation phase of the 2012 EPI and Pilot Trend EPI. If a countrymet the criteria for an indicator being “material” (i.e., relevant), we included the indicator in the EPI calculation. Forcountries that did not meet the materiality threshold, the indicator was “averaged around,” meaning the countrydoes not receive a score for that indicator and the weights of the other indicators in a particular category areincreased proportionally.
Critical Habitat Protection
Forests Forest Loss Must have a minimum 100 sq km of forested land.
Fisheries Coastal Shelf Fishing Pressure Coastal
Fishing Stocks Overexploitedand Collapsed
Climate Change Renewble Electricity Generation Must generate above 130 KWHof electricity annually.
Coastal
Forest Growing Stock Must have a minimum 100 sq km of forested land.
Change in Forest Cover Must have a minimum 100 sq km of forested land.
Must have sites designatedas “critical” by the Alliancefor Zero Extinction.
Biodiversity & Habitat Marine Protected Areas Coastal
Policy Category Indicator Materiality Filter

Indicator CalculationThe process of indicator construction includes several steps. In the first step, the raw datasets are cleanedand prepared for use; in particular, missing values and their nature (e.g., country not included in thesource data set, country included but value missing, or not applicable) are carefully noted. Second, rawdata values (e.g., total carbon emissions) need to be transformed to correct for abnormal distributions. Inaddition, some data should be transformed by dividing by population, GDP, area or some otherdenominator in order to make the data comparable across entities (i.e., normalizing the data).
Chapter 6: Constructing an Index
59
EXAMPLE: Indicator calculation for an imaginary VSIFor our VSI example, we need to make some transformations to our data. However,no normalizations based on units of observation (population, area, etc.) are necessaryin this example because all vehicles are already comparable for our purposes.
Cost: Since the best possible cost is zero, this dataset needs to be inverted so thatthe best values (low values) receive high value scores. In addition, most measures ofmoney are best viewed on a log scale, in which unit changes can be interpreted aspercentages rather than dollars. The difference between a car that costs $5,000 andone that costs $5,500 is about the same as the difference between a car that costs$50,000 and one that costs $55,000. A log scale presents these differences ($500 and$5,000) as the same, since they are the same in percentage terms.
Fuel efficiency: Fuel efficiency is better if it is higher. This dataset doesn’t need to beinverted. However, we might consider making transformations if, say the data looksmore like Series 1 than Series 2:
We want consistent units, and a transformation (in thisexample a square root) wouldproduce the consistency we’relooking for.
Passenger capacity: Since ourtarget value for capacity is four,we might consider truncatingthe data at four. This wouldproduce the same score forvehicles that can carry fourpassengers as for those thatcan carry five, since for ourpurposes the extra person adds no value.
Mining footprint: This data,like the cost data, also needs tobe inverted since lower valuesare better in our index.
Series1Series2
0 5 10 15 20
400
350
300
250
200
150
100
50
00
20
18
16
14
12
10
8
6
4
2
0
Figure 1. General plot of an imaginarydataset, with Series 2 representing asquare-root transformation of theoriginal data (Series 1).

The steps for indicator construction and calculation include the following:
1. Data preparationCommon normalizations include percent change (e.g., rates of deforestation over some time period),units per economic output (e.g., energy use per GDP), units per area (e.g., percent territory wherewater extraction exceeds a certain threshold), or units per population (e.g., CO2 emissions per capita).Note that the denominator in each case should be relevant for the environmental issue of interest. Insome cases, such as air pollution, it may also be useful to weight an indicator by the populationexposed. If ambient air pollution is higher in heavily populated urban areas where 75 percent of thepopulation lives, it makes sense for the ambient levels in urban areas to contribute 75 percent to thescore for that unit and in rural areas to contribute only 25 percent.
2. Data transformationIn the second step of indicator construction, the distribution of the data should be examined todetermine if further transformations are necessary. Because the transformed data for the EPI are oftenheavily skewed, we perform a logarithmic transformation on particular datasets (i.e. datasets that areskewed to the left or right).
Logarithmic transformation serves two purposes. First, and most importantly, if an indicator has asizeable number of countries very close to the target, a logarithmic scale more clearly differentiatesamong the best environmental performers. Using raw (untransformed) data ignores small differencesamong top-performing countries and only acknowledges more substantial differences between lead-ers and laggards. The use of the log transformation has the effect of spreading out performance,allowing the EPI to reflect important differences, not only between the leaders and laggards, but alsoamong the best performers. Secondly, logarithmic transformation improves the interpretation of dif-ferences between sub-national units at opposite ends of the scale. As an example, consider two com-parisons of particulate matter (PM 10): top-performers Venezuela and Grenada (having PM 10 valuesof 10.54 µg/m3 and 20.54 µg/m3, respectively), and low performers Libya and Kuwait (87.63 µg/m3
and 97.31 µg/m3, respectively). Both comparisons involve differences of 10 units on the raw scale(µg/m3), but they are substantively different. Venezuela is an order of magnitude better than Grenada,while Libya and Kuwait differ by a much smaller amount in terms of percentage on a log scale.Compared to the use of the raw measurement scale, the log scale downplays the differences betweenthe leaders and laggards, while more accurately reflecting the nature of differences at all ranges ofperformance. This data transformation can encourage continued improvements by the leaders, whereeven small improvements can be difficult to make, but provides relatively fewer rewards for the sameamount of improvement among the laggards.
In some cases, it is also necessary to invert data to make an appropriate fit into an index’s framework.This most commonly occurs with the EPI when good performance is on the opposite end of thespectrum from other data. For example, one hundred percent of critical habitat protected implies a highlevel of environmental performance (i.e., “good” performance), whereas one hundred percent offisheries overexploited or collapsed implies poor performance. In order to keep high scores on thesame end of the performance spectrum, the latter dataset could be inverted by taking the scores andsubtracting them from one.
60
Measuring Progress: A Practical Guide From the Developers of the Environmental Performance Index (EPI)

3. Data conversion to indicatorsAs a final step for indicator construction, the transformed and logged data are converted into indicators tocreate a common unit of analysis, permit comparability across indicators, and allow aggregation to acomposite index using a proximity-to-target methodology, as described below. Different indices usedifferent metrics, such as the ESI’s Z-score, the Ecological Footprint’s Hectares of biologicallyproductive land, and the Green GDP’s use of U.S. dollars. The proximity-to-target methodology measureseach entity’s performance on any given indicator based on its position within a range established by thelowest performing entity (equivalent to 0 on a 0-100 scale) and the target (equivalent to 100).
The generic formula for the proximity-to-target indicator calculation in the context of the global EPI isas follows:
For example, the score for the Access to Sanitation indicator (i.e., percent of population with access toadequate sanitation) is calculated as follows:
• The target is 100% access to sanitation.
• The worst performer might have 5% of its population with access to adequate sanitation.
• Another country’s access to sanitation might be 65%.
• The international range is 100 -5 = 95.
• For the country with 65% access to sanitation, its proximity-to-target score is calculated as follows: (95 - 35/95) x 100 = 63.1.
Chapter 6: Constructing an Index
61
Figure 6.1. Diagram illustrating the proximity-to-target methodology used to calculate performance indicators. Better and worse are relative terms only and refer to distance to the target.
International Range
Worse Performance Better Performance
Distance to Target
CountryPerformance Top
PerformanceBenchmark
PoorPerformance
Benchmark
0 50 100
International Range – Distance to Target
International RangeX 100

Weighting and AggregationIn the field of composite indices, the issues of weighting and aggregation are particularly sensitive andsubjective. There is no clear consensus among experts on how to best determine a methodological strategyfor combining diverse issues, such as those represented in the EPI. Furthermore, the process of assigningweightings is as much of a political process as it is a scientific process. We assign explicit weights to theindicators, policy categories, and objectives that comprise the EPI in order to create the aggregate EPIscore (see Figure 6.2).
Weights for the EPI were established after considering expert recommendations including perceivedquality of data, importance of the indicators and categories for policymaking, and the degree to which theindicators provide direct measurement of environmental performance.
62
Measuring Progress: A Practical Guide From the Developers of the Environmental Performance Index (EPI)
EXAMPLE: Converting data to indicators for the VSIIn order to proceed with our VSI calculations we need all of our data to be in a comparable form. Right now, Costranges from 4 to 5 (remember we are using a log scale), Fuel Efficiency ranges from, say, 10 to 50 miles per gallon,Passenger Capacity ranges from 2 to 4, and Mining Footprint from 1 hectare to 100 hectares.
We use the following generalized formula to arrive at our indicator scores:
Here are the conversion calculations for Car A with the following data:
Note that the range for Passenger Capacity is 3 (from 1 to 4) since a vehicle cannot fit fewer than one person,and we have set the upper limit at 4.
We have arrived at our VSI indicator scores for Car A: Cost = 40, Fuel Efficiency = 83, Passenger Capacity = 33and Mining Footprint = 20.
(Range - |Target Value - Actual Value|)
RangeX 100 = Indicator Score
Cost $40,000 Log 4.6 $10,000 4
FuelEfficiency 45mpg None 45 54.5 54.5
PassengerCapacity 2 Truncation 2 4 4
MiningFootprint 80-ha None 80 0 0
Indi
cato
r
Orig
inal
Dat
aVa
lue
Dat
aTr
ansf
orm
atio
n
Tran
sfor
med
Dat
a Va
lue
Orig
inal
Tar
get
Tran
sfor
med
Targ
et
Indi
cato
rCa
lcul
atio
n
( 1 – | 4 – 4.6 | )1 X 100 = 40
( 54.4 – | 54.5– 45 | )54.4 X 100 = 83
( 3 – | 4 – 2 | )3 X 100 = 33
( 100 – | 0 – 80 | )100 X 100 = 20

For the EPI, weightings are determined through an iterative process (see Figure 6.3). Generally speak-ing, weightings at every level of aggregation are first divided equally as a starting point. For the EPI,this means the two objectives (Environmental Health and Ecosystem Vitality) initially receive 50-50weights, each of the 10 policy categories receives 10 percent, and indicators receive weights dependingon the number of indicators within a policy category. Weightings can then be adjusted to reflect the relative importance of given issues and the relevance of indicators to category performance. For exam-ple, we decided, based on expert input, that CO2 per Capita and CO2 per GDP were more important forconsideration of climate change contributions than the indicator for the amount of renewable powergeneration. For this reason, the former two received greater weights relative to the other indicators intheir policy category.
Another important consideration when determining weightings is the underlying distribution of theindicator, policy category, and objective scores; or how much variation exists in the data. The impact ofunderlying score distributions becomes critical when chosen weightings result in composite indices that
Chapter 6: Constructing an Index
63
Figure 6.2. The Indicator Framework of the 2012 Environmental Performance Index. The percentagesindicate the weightings used for aggregation.
Child Mortality
Particulate Matter
Indoor Air Pollution
Access to Sanitation
Access to Drinking Water
SO2 per CapitaSO2 per $ GDP
Biome Protection
Change in Water QuantityCritical Habitat Protection
Marine Protected AreasAgricultural SubsidiesPesticide RegulationForest Growing Stock
Change in Forest CoverForest Loss
Coastal Shelf Fishing PressureFish Stocks Overexploited
CO2 per CapitaCO2 per $ GDPCO2 per KWH
Renewable Electricity
2012Environmental
PerformanceIndex
Environmental Health
Ecosystem Vitality
Environmental Health
Air (Effects on Human Health)
Water (Effects on Human Health)
Air (Ecosystem Effects)
Water Resources (Ecosystem Effects)
Biodiversity & Habitat
Agriculture
Forests
Fisheries
Climate Change& Energy
POLICY CATEGORIESOBJECTIVESEPI INDICATORS
The Indicator Framework of the 2012 Environmental Performance Index
15%30%
70%
17.5%
7.5%
15% 15%15%
15%3.75%
15%3.75%
15%3.75%
15%3.75%
4.38%
4.38%
8.75%
4.38%
8.75%
4.38%
3.89%
1.94%
1.94%
1.94%
1.94%
2.92%
2.92%
6.13%
6.13%
2.63%
2.63%
7.5%
8.75%
8.75%
17.5%
5.83%
5.83%
5.83%
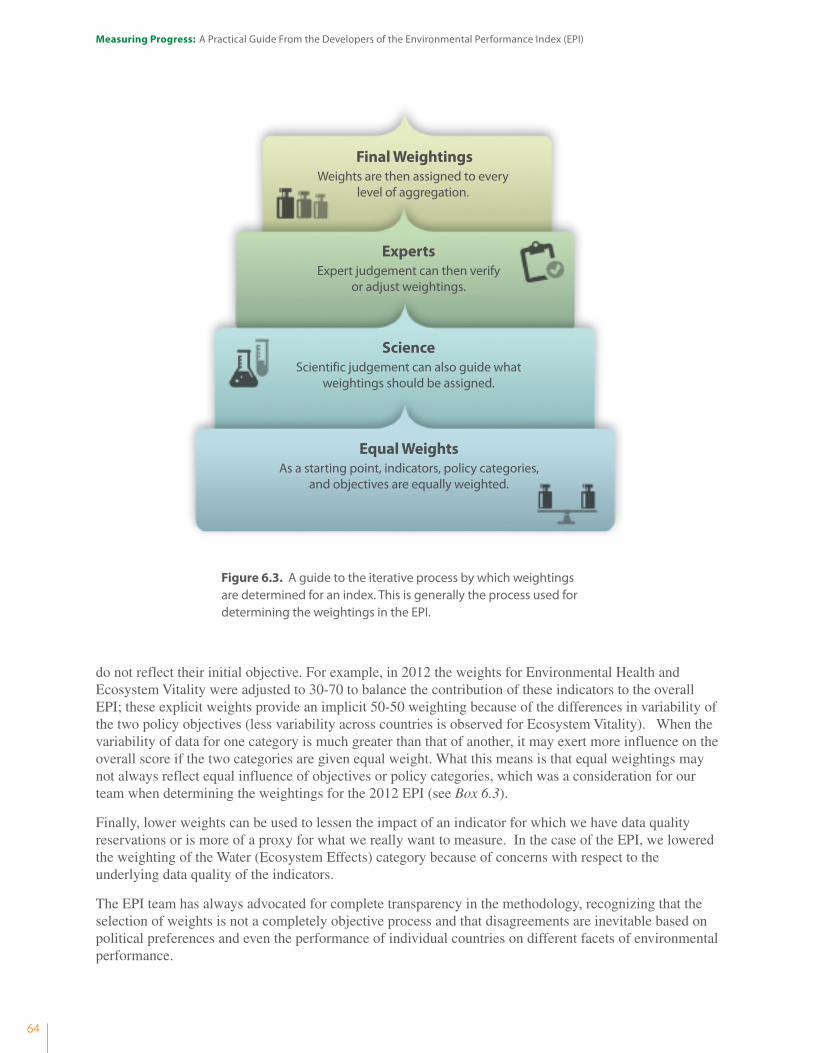
do not reflect their initial objective. For example, in 2012 the weights for Environmental Health andEcosystem Vitality were adjusted to 30-70 to balance the contribution of these indicators to the overallEPI; these explicit weights provide an implicit 50-50 weighting because of the differences in variability ofthe two policy objectives (less variability across countries is observed for Ecosystem Vitality). When thevariability of data for one category is much greater than that of another, it may exert more influence on theoverall score if the two categories are given equal weight. What this means is that equal weightings maynot always reflect equal influence of objectives or policy categories, which was a consideration for ourteam when determining the weightings for the 2012 EPI (see Box 6.3).
Finally, lower weights can be used to lessen the impact of an indicator for which we have data qualityreservations or is more of a proxy for what we really want to measure. In the case of the EPI, we loweredthe weighting of the Water (Ecosystem Effects) category because of concerns with respect to theunderlying data quality of the indicators.
The EPI team has always advocated for complete transparency in the methodology, recognizing that theselection of weights is not a completely objective process and that disagreements are inevitable based onpolitical preferences and even the performance of individual countries on different facets of environmentalperformance.
64
Measuring Progress: A Practical Guide From the Developers of the Environmental Performance Index (EPI)
Figure 6.3. A guide to the iterative process by which weightings are determined for an index. This is generally the process used for determining the weightings in the EPI.
Equal WeightsAs a starting point, indicators, policy categories,
and objectives are equally weighted.
ScienceScientific judgement can also guide what
weightings should be assigned.
ExpertsExpert judgement can then verify
or adjust weightings.
Final WeightingsWeights are then assigned to every
level of aggregation.

Chapter 6: Constructing an Index
65
Box 6.3. When are Equal Weights not Equal?Sensitivity analyses conducted on previous versions of the EPI revealed some unintended results of equally weightingthe Environmental Health and Ecosystem Vitality objectives. Despite mathematically equal weights, overall EPI scoreswere much more highly correlated with Environmental Health than Ecosystem Vitality, revealing the necessity oftaking into consideration the distribution of underlying variables when selecting appropriate weights.
For the 2012 EPI, a 50-50 weighting for both the Environmental Health and Ecosystem Vitality objectives meantthat the overall composite EPI scores were too heavily influenced by the Environmental Health objective. Thisunevenness is the result of differences in the variance in the scores for the Environmental Health and EcosystemVitality objectives (standard deviations of 27.2 and 12.0, respectively). In other words, the high and low scores onEnvironmental Health are spread farther apart than those of Ecosystem Vitality. When these more extreme scoresare averaged with the more moderate Ecosystem Vitality scores, the former tend to pull the overall score awayfrom the average, and thus produce most of the variation in overall EPI scores. For this reason, countries thatperform high in the Environmental Health objective are likely to perform better in the overall EPI, regardless ofscores in the Ecosystem Vitality objective.
To correct this statistical imbalance between the two objectives, the Environmental Health objective for the 2012EPI comprises 30 percent of the overall score while Ecosystem Vitality objective makes up the remaining 70percent. These relative contributions do not reflect the prioritization of nature indicators over those of environ-mental health, but rather provide a balance between the contributions of these policy objectives to the overallEPI. They also recognize that humans require healthy ecosystems just as much as they require clean air andpotable water. This change in weightings simply reflects a much-needed statistical correction to the aggregationmethod to produce EPI scores that are more balanced between the two objectives. Environmental Health (EH)and Ecosystem Vitality (EV) have been assigned statistical correlations of 0.57 and 0.64 with the overall EPI score,respectively. The plot below demonstrates the statistical balance achieved through these weights.
Other indices can incorporate this lesson by conducting correlation analyses that explore theimpact of individual components of the index. A robust index should also include sensitivityanalyses that adjust weights and other statistically influential components of the indexto uncover places where small changes may havea disproportionate impact on its outcome.Examples of sensitivity analyses are included witheach version of the EPI and ESI.
The matrix (left) shows the relationship betweenEnvironmental Health (EH) scores, EcosystemVitality (EV) scores and the overall EPI. The boxes tothe lower left show degree and direction of corre-lation: .57 for EH-EPI and a higher .67 for EV-EPI. Thescatterplots to the top right show the distributionof the data. Environmental Health plotted againstEPI has a wider distribution than Ecosystem Vitalityplotted against EPI. The relatively widely spacedEH scores tend to pull on EPI scores more thanmore tightly spaced EV scores, allowing EH toinfluence more of EPI variation even when the twoare equally weighted.
Figure 1. Relationship of the Ecosystem Health (EH) andEcosystem Vitality (EV) objective scores to the overall EPI Scores.
EH.057°
100 missing
100 missing 100 missing
.064° –.026° EV
EPI

Aggregation MethodsOnce indicator weights are established, the individual component scores must be aggregated into an overallscore. Most commonly, this is accomplished with a linear aggregation (i.e., adding up the weighted,normalized indicator scores). When weights are equal, this is similar to taking a simple average. However,the major drawback of the linear aggregation approach is that it treats unit changes across indicators andlevels of performance as preferentially independent, meaning that the scores do not reflect that a certainlevel of performance may be achieved in one indicator versus another, such that poor performance in onearea can be compensated for by equally (in absolute value) good performance in another area.
66
Measuring Progress: A Practical Guide From the Developers of the Environmental Performance Index (EPI)
EXAMPLE: Determining VSI weightsFor our VSI let us assume that we value all four indicators equally. We would then be inclined to settheir weights all to 25%. However, we should examine the ranges of scores for each indicator beforemaking a final decision:
For our three vehicles, the range of Cost scores is by far the largest, and is thus inconsistent with thedegree of variation we see in indicator scores in general. Furthermore, we see from the overall indexscore that the vehicles that scored highest and lowest were also those that scored highest andlowest in the Cost indicator. It appears that the variation in Cost is exerting a greater influence onoverall results than that of the other indicators, even though they received nominally equal weights.
To solve this problem, we could adjust the indicator weights according to the range of scores foreach indicator:
This would produce the new index:
In this example, the three vehicles are still ranked the same, Car B first, Car A second and Car C third.However, the differences between their overall scores now equally reflect the variation between theirindividual indicator scores, rather than giving more influence to Cost because of its greater range.
Fuel Passenger Mining OverallVehicle Cost Efficiency Capacity Footprint Index Score
Car A 40 83 33 20 44
Car B 100 80 66 30 69
Car C 10 75 33 22 35
Indicator range 90 8 33 10 34
Fuel Passenger Mining OverallVehicle Cost Efficiency Capacity Footprint Index
Adjusted weight .04 .46 .11 .39 100
Indicator range 90 8 33 10 34
Vehicle Overall Index Score
Car A 51.21
Car B 59.76
Car C 47.11

While on the surface this may not seem problematic, it can obscure situations where, for example, anentity performs very well on one or two indicators but relatively poorly on a host of others. With linearaggregation, an entity could score overall as well as, or better than, one that performs relatively wellacross all indicators, because their average performance is the same. The latter entity may be taking amore holistic approach to environmental governance, while the former may be simply benefitting from aunique case of good management for one or two indicators.
Geometric aggregation is designed to address this issue. In essence, this method punishes extremely lowscores more harshly per unit than better scores. Thus, in order to achieve high performance in the aboveexample, a country would have to perform adequately across all indicators and very well in some. Acountry thus has greater incentive to improve performance in lagging areas, as a one-unit change inperformance on a lower scoring indicator would produce a greater improvement in overall score than aone-unit improvement elsewhere. Unfortunately, geometric aggregation is difficult to communicate, andthus reduces the transparency of the index.
But the choice of aggregation methodology depends also on the scientific relationships betweenindicators, and not just on preferences for trade-offs. Two pollutants in the environment may have drasti-cally unequal effects at different levels, and an increase of just a few units may matter much more withone than with the other. Further, the effects may depend on the units and scales used to measure each (i.e.,ambient concentrations, quantities released, etc).28 For these reasons, there is no absolute basis forcomparison between indicators, and choosing an aggregation method should be informed by science butalso understood as inevitably a value judgment.
In order to balance these concerns, the EPI uses arithmetic means but addresses different scientificrelationships between indicators by using a proximity-to-target methodology, which defines the range ofperformance with reference to specific high- and low- performance benchmarks. This makes comparisonbetween performance on different indicators possible despite differences in measurement units.
Chapter 6: Constructing an Index
67
Box 6.4. A Work in Progress: Adjusting for a Changing Environment
We always provide a disclaimer that the EPI is a work in progress, to accommodate for updates to datasets, theinclusion of new data, and adjustments to the weightings used for aggregation. One of the benefits of choosingan index framework that encompasses a collection of issues with a transparent and simple-to-understandweighting system is that the index is easy to adjust as prevailing public and scientific opinion changes. As certainissues become more or less important to scientists and stakeholders, the index can be adjusted without startingfrom scratch.
For example, there was a marked change in public sentiment regarding climate change in the 2008 to 2012period. For the 2010 EPI, we increased the weighting of the climate change category to 25 percent of the overallscore to reflect the overarching importance of climate change to every other policy category in the ecosystemvitality objective. We then equalized the climate change category weighting to be in balance with the other policycategories in the 2012 EPI.
28 See Ebert, U. and H. Welsch (2004). Meaningful environmental indices: a social choice approach. Journal of Environmental Economics andManagement, 47(2): 270-283.

Whatever weightings and aggregation methodologies are eventually chosen, there will always be individuals who disagree with the final decision. There are several means of giving proper attention topublic concern over weightings. The following are examples of how one can address these types of issues,which we have used during our experiences with the EPI.
• Conduct a sensitivity analysis that explores how rankings and scores change if the weightingsof an index are adjusted.
• Provide tools that allow outsiders to weight their own index by adjusting indicator weightingand producing a tailored result based on those weights
• Supply a clear explanation as to why weights must be chosen to make aggregation possible,and explain how particular weights represent merely a best attempt at capturing a range ofopinions regarding the relative importance of each indicator.
68
Measuring Progress: A Practical Guide From the Developers of the Environmental Performance Index (EPI)
EXAMPLE: Aggregation for the VSITo simplify our aggregation calculations, let us assume that we retained the nominally equalweights of 25% for each indicator of our VSI.
Linear aggregation adds the individual indicator scores and divides by the total number ofindicators, producing the same scores as we discussed previously. Geometric aggregation, on theother hand, multiplies the indicator scores together, then takes the n root of the result, n being thetotal number of indicators.
Linear aggregation for Car A: Geometric aggregation for Car A:
(Note that these calculations would have to be adjusted if we were using unequal weights)
Fuel Passenger Mining OverallVehicle Cost Efficiency Capacity Footprint Index Score
Car A 40 83 33 20 44
Car B 100 80 66 30 69
Car C 10 75 33 22 35
Overall Score Overall ScoreVehicle (Linear Aggregation) (Geometric Aggregation)
Car A 44 40Car B 69 63
Car C 35 27
40 + 83 + 33 + 204
= 44 40 x 83 x 33 x20 = 39.58 = 40 (rounding)4√

Conclusion Although this chapter has described a fairly linear process for indicator calculation, weighting, and indexaggregation, in reality creating an index is more iterative and may involve multiple revisits to steps in theprocess. For example, it may be necessary to adjust targets (e.g., adjusting the top performing benchmarkto the 97th percentile rather than the 95th percentile) after initial indicator calculations, particularly if thedistribution of the indicator scores seems off (e.g., too many entities are at the top performingbenchmark). It may also be helpful to involve experts (Chapter 3) during stages in the calculation processto vet the quality and veracity of each indicator and the final index. Our teams work with outside partnerssuch as the Joint Research Centre of the European Commission, which conducts an independent statisticalsensitivity analysis of the EPI to test the robustness of the calculation methodology and any potentialsources of error or bias. In the end, it is essential to properly notate all steps taken in the process of calculating an index in order to transparently communicate how it was developed.
Chapter 6: Constructing an Index
69

70
Measuring Progress: A Practical Guide From the Developers of the Environmental Performance Index (EPI)
C onclusion77

Conclusion We hope that this guide, along with our more than a decade’s worth of experience, has provided a usefulmodel by which to develop an environmental performance index. While the process is variable, our bestadvice is summarized by the following:
• Set the goals, audience and principles of an index to lay the foundation for what issues theindex will address, for whom it is created, and what standards to which it will adhere.
• For academic rigor, an index’s management team should be complemented by a knowledgeable team of subject area, statistical, and thought-leader experts.
• Balance the best science with the needs of an index’s audience to develop a framework, tochoose which facets of the issue an index will address, and to reflect the relative importanceof those issues in a composite index.
• Indicators should represent the best in data quality balanced by data coverage.Understanding the underlying structure of the data guides adjustments made to the indexand produces more appropriate conclusions.
• Based on the knowledge gained through this process, transform data into a format thatallows for data to be consistently compared, and select an aggregation methodology to combine indicators in an overall coherent measure.
For more examples of environmental performance indices and how they are being applied in research,civil society, and government for management and policy purposes, we have been compiling case studiesthat can be found at our Indicators in Practice section of the EPI website (http://www.epi.yale.edu). Wehope that these examples can be useful for other organizations seeking to improve their environmentalperformance through the use of transparent, credible metrics.
In addition, we hope that with the help of this guide we can foster the growth of new data-driven toolsfor policymakers. In the future, it is our vision that better data will allow for environmental performanceindices to be more accurate and to reveal trends between policy action and environmental outcomes.
Conclusions
71

Aggregation
Audience
Core Categories
Core Team
Data
Distribution (data)
EnvironmentalPerformance
Experts
Framework
Goal
Index
Indicator
Metadata
Methodology
Metric
Normalize
Objective (Measurable)
Principles
“Proximity-to-target”
Proxy
Scale or Scope
Sensitivity Analysis
The method by which individual, indicator level scores are used to create a single overall Index score.
The stakeholders and other interested parties who use an index or to whom an index is directed. Definingan audience will help guide the development of goals and principles for an index.
A classification of components that reflects facets of its measurable objectives; a method of groupingtogether related indicators and including an additional level of aggregation. Example: the EPI’s indicatorsare grouped into categories such as Agriculture and Water.
The (often in-house) research group that will work on the project throughout its life.
Raw, quantitative resources that can be developed into information, and then knowledge.
A pattern of data across a range of values. A “normal” distribution has more data points closer to the mean,and fewer farther away.
Measurable results of an entity’s management of environmental quality.
The (often external) contacts that provide periodic input to guide the project.
The structure, model or design that connects data, indicators, goals, and principles via weighting andaggregation.
The outcome that the index hopes to achieve.
An aggregate of environmental performance indicators, which generally implies conversion to commonunits (or a unitless scale) and weighted or unweighted aggregation (i.e., averaging, adding, or applyingother mathematical operations).
A quantitative variable calculated or measured from an observation (i.e., data) that is used to identifypressures on the environment, environmental conditions (states), or policy responses, or trends thereof.
Information related to a dataset’s source, author, date of collection, etc. that is a necessary component forthe data collection process.
The agreed-upon process by which data collection, calculations, analysis and presentation will be conducted.
A numerical measurement representing data; expressed as an indicator when presented relative to a target.
To divide one dataset by another as a means of making units unequal and scale comparable; e.g., to arriveat per capita (per person) GDP, total GDP is normalized by population.
The scope of measurable issues related to and provided by the overall objective of an index.
The assumptions that connect methodology and goals; a set of guiding criteria.
A methodology that measures how close an entity comes to meeting a specified target or goal. Usually thetarget represents good performance, and ”proximity-to-target” methodology involves calculating a scorefor each entity that shows how well it has performed in relation to that goal.
A type of data that is used for an indicator as a substitute when a more direct measurement or metric is not available.
The theme of an index; or the level of index implementation.
A process by which constraints, such as weights, are adjusted, and then the impact on scores and ranks isobserved to determine how sensitive the index is to methodological choices.
6
2
4
3
6
6
1
3
2
2
1, 2
1, 4, 6
5
6
2
2, 6
4
2
6
4
2
6
72
Measuring Progress: A Practical Guide From the Developers of the Environmental Performance Index (EPI)
Term Definition Chapter
Glossary
(EnvironmentalPerformance)

Glossary / Key Acronyms
73
List of Key Acronyms
Smooth
Transformation(Log)
Target
Weighting
Winsorization
Creating an approximating function that attempts to capture important patterns in the data, while excluding or removing anomalous data or noise.
To perform the inverse of taking ten to the power of the number in question. This action transforms datathat is scaled by units (e.g., dollars, people, etc.) into data that is scaled by percentages, and often reducesabnormalities in the data's distribution.
The measure of “good” performance; the goal/aim/intention that best performers should seek to reach.
The fraction by which indicators are scaled to determine their relative contribution to overall score.
A statistical transformation of extreme (i.e., smallest and lowest, or “outliers”) values in data. A givenpercentage of these values are replaced with observations closest to them and a mean (i.e., Winsorizedmean) is calculated.
3
6
6
6
6
Term Definition Chapter
Glossary (continued)
CIESIN Center for International Earth Science Information Network
CPI Consumer Price Index
DPSIR Driving Force-Pressure-State-Impact-Response
EGI Environmental Gender Index
EPI Environmental Performance Index
ESI Environmental Sustainability Index
GDP Gross Domestic Product
HDI Human Development Index
IUCN International Union for the Conservation of Nature
KPIs Key Performance Indicators
MDGs Millennium Development Goals
OECD Organisation for Economic Co-operation and Development
OHI Ocean Health Index
PSR Pressure-State-Response indicator framework
UN United Nations
UNDP United Nations Development Program
UNFCCC United Nations Framework Convention on Climate Change
WEF World Economic Forum
WWF World Wildlife Fund
YCELP Yale Center for Environmental Law and Policy
Abbreviation Name

74
Measuring Progress: A Practical Guide From the Developers of the Environmental Performance Index (EPI)
OECD
OECD
OECD
OECD
UNDP
UNDP
WRI
Handbook on Constructing Composite Indicators: Methodology and User Guide
Composite Indicators: Science or Artifacts?
What is Sensitivity Analysis
Sensitive Issues in the Development of Composite Indicators for Policy-Making
Measuring Human Development: A Primer
Marketplace for Environmental Training and Online Resources
EarthTrends database
2008
2007
2005
2006
- - - -
- - - -
- - - -
Organization(s) Year Resource
Appendix 1. Additional Resources and Index Efforts
OECD
WWF
Reed, Fraser, Morse & Dougill
UNDP
Bell & Morse
Global Footprint Network
New Economics Foundation
New Economics Foundation
Tyndall Centre for Climate Change Research
NRCS
Ahlheim & Fror - HohenheimUniversity
UNDP
UN-Habitat
IISD
European Commission
POINT
South Pacific Applied GeoscienceCommission (SOPAC), UNEnvironment Programme (UNEP)
WWF
Pew Environment Group
NASDAQ
World Ports Climate Initiative
World Economic Forum
Hazards and VulnerabilityResearch Institute
Competitiveness Index
Ecological Footprint
Integrating Methods for Developing Sustainability Indicators to Facilitate Learning and Action
Human Development Index
The role of Sustainability Indicators within evidence-based policy for sustainable developingin the European Union
Ecological Footprint
Measuring our progress - the power of well being
The UN Happy Planet Index (HPI)
New indicators of vulnerability and adaptive capacity
Environmental Quality Index
Constructing a Preference-oriented Index of Environmental Quality - A welfare theoreticalgeneralization of the concept of environmental indices
A survey of composite indices measuring country performance
City Development Index
Indicators for Sustainable Development: Theory, Method, Applications
Sustainable Development Indicators
Policy Use and Influence of Indicators
Environmental Vulnerability Index
Environmental Paper Company Index
Global Aquaculture Performance Index
Sustainability Index
Environmental Ship Index (ESI)
Sustainability-Adjusted Global Competitiveness Index (GCI)
Social Vulnerability Index
- - - -
- - - -
2005
- - - -
2010
- - - -
2011
2009
2004
- - - -
2007
2008
- - - -
1999
- - - -
2008
- - - -
1999-2005
2010
2010
- - - -
- - - -
2012
Organization(s) Year Index

Appendix
75
Appendix 2. Examples of Indicator Frameworks
Human Well-being and Poverty Reduction
• Basic material for a good life• Health• Good Social Relations• Security• Freedom of choice and action
Indirect Drivers of Change• Demographic• Economic• Sociopolitical• Science & Technology• Cultural & Religious
Direct Drivers of Change• Changes in Land Use & Cover• Species Introduction or Removal• Technology Adaptation & Use• External Inputs• Harvest and Resource Consumption• Climate Change• Natural, Physical & Biological
Ecosystem Services• Provisioning (e.g., food, water, fiber & fuel)• Regulating (e.g., climate regulation, water & disease)• Cultural (e.g., spiritual, aesthetic, recreation & education)• Supporting (e.g., primary production & soil formation)
Life on Earth – Biodiversity
Millennium Ecosystem Assessment Framework

76
Measuring Progress: A Practical Guide From the Developers of the Environmental Performance Index (EPI)
Appendix 2. Examples of Indicator Frameworks (continued)
HumanDevelopment:• Demographics
• Economic processes(consumption, produc-tion, markets & trade)
• Scientific & techno-logical innovations
• Distribution patternprocesses (inter- andintro-generational)
• Cultural, social, politi-cal and institutional(including productionand service sectors)processes
Material, Human & Social Capital
HumanInterventions inthe Environment:• Land use
• Resource extraction
• External inputs (fertilizers, chemicals,irrigation)
• Emissions (pollutantsand waste)
• Modifications andmovement of organisms
Natural Processes:• Solar radiation• Volcanoes• Earthquakes
Natural Capital:Atmosphere, land,water & biodiversity
Change in Human Well-beingBroadly defined as human freedoms of choiceand actions to achieve, inter alia:
• Security• Basic material needs• Good health• Good social relations
which may result in human development orpoverty, inequity, and human vulnerability.
Demographic, social (institutional)& material factors determininghuman well-being
Responses to environmental challenges:Formal and informal adaptation to, and mitigation of,environmental change (including restoration) by alteringhuman activity and development patterns within andbetween the Drivers, Pressures and Impact boxesthrough inter alia: science and technology, policy, lawand institutions.
Environmental FactorsDetermining Human Well-being:• Ecological services such as provisioning
services (consumptive use), cultural services(non-consumptive use), regulating services& supporting services (indirect use)
• Non-ecosystem natural resources, i.e., hydro-carbons, minerals & renewable energy
• Stress, inter alia diseases, pests, radiation &hazards
EnvironmentalImpacts & Change:• Climate change &
depletion of thestratospheric ozonelayer
• Biodiversity change
• Pollution,degradation and/ordepletion of air, water,minerals and land(including desertifi-cation)
Responses
Human Society Environment Impacts
Drivers Pressures State & Trends
Global Environmental Outlook (GEO4)

Sustainable Region
Equity
Environment
Economy
ResourceE!
ciency & ConservationEnvironmenta
l Health
E!ci
ent T
ransp
ortatio
n & Land Use Economic Competitiveness &O
pportunityFuture Indicators
Futu
re In
dica
tors
Futu
re In
dica
tors
Future Indicators
Urban Greening
Ener
gy Use
: Ele
ctric
ity
Energy Use: Natural G
as
Housing A
�ordab
ility
Green Jobs & Establishments
Job Growth & Wages
Obesity & Overweight
Asthma
Air Q
uality
Urban Water Use
Ag Land ConversionVehicle Fuel Consum
ptionVehicle M
iles Traveled
Appendix
77
Appendix 2. Examples of Indicator Frameworks (continued)
California Forward's Regional Sustainability Network

78
Measuring Progress: A Practical Guide From the Developers of the Environmental Performance Index (EPI)
Appendix 3. Example of EPI Metadata
Indicator: Critical Habitat ProtectionObjective/Policy: Ecosystem Vitality - Biodiversity and HabitatCode: AZEDescription: Percentage of the total AZE site area that is within protected areas.
Rationale: The Alliance for Zero Extinction (AZE) has identified 587 sites that each represents the last refuge of one or more of the world’s most highly threatened 920 species. From theperspective of biodiversity conservation, protection of these sites is of the highest priority.
Source(s)Variable: AZE sites
Citation: Alliance for Zero ExtinctionYear of publication: 2011
Covered time: 2011URL: http://www.zeroextinction.org/
Date data obtained: 10/6/2011Data type: GIS polygon shape file obtained from the American Bird Conservancy.
Variable: World Database of Protected Areas (WDPA)
Citation: UNEP-World Conservation Monitoring CentreYear of publication: 2011
Covered time: 1990-2011URL: http://www.wdpa.org/
Date data obtained: 10/6/2011Data type: GIS polygon shape file
Indicator SummaryUnit of Measurement: Percentage
Indicator creation A time series version of the World Database of Protected Areas (WDPA) from 1990-2011method: was obtained from the World Conservation Monitoring Centre. For each country, the
percentage area of AZE site(s) that fell within protected areas was calculated.
Additional notes: The delineation of AZE sites may have uncertainties. Countries with no AZE sites wereaveraged around for EPI calculations, and are coded -7777.
Transformation needed nonefor aggregation:
Target: 100Low Performance
Benchmark: 0
Source: Expert opinion. The low performance benchmark is the minimum of the 2000-2010 dataset.

Com
pone
nt
Indi
cato
r Num
ber
Indi
cato
r
Varia
ble
Num
ber
Varia
ble
Varia
ble
Desc
riptio
n
Mat
ch b
etw
een
varia
ble
and
issu
e
Relia
bilit
y of
da
ta s
ourc
e
Varia
ble
met
hodo
logy
Cros
s-ch
eck
crite
ria
Mos
t rec
ent d
ata
set
Freq
uenc
y of
upd
ate
Spat
ial c
over
age
Cons
iste
nt ti
me
serie
s
Env
ironm
enta
l Sys
tem
s
Air Quality
Biodiversity
Land
Water Quality
Water Quantity
Reducing Air Pollution
Reducing Ecosystem
Stress
Reducing Population Pressure
Reducing Waste & Consumption
Pressures
Reducing Water
1
2
3
4
5
6
7
8
9
10
Red
ucin
g E
cosy
stem
Str
ess
1
2
3
4
5
6
7
8
9
10
11
12
13
14
15
16
17
18
19
20
21
22
23
24
25
26
27
28
29
NO2
SO2
TSP
INDOOR
ECORISK
PRTBRD
PRTMAM
PRTAMPH
NBI
ANTH10
ANTH40
WQ_DO
WQ_EC
WQ_PH
WQ_SS
WATAVL
GRDAVL
NOXKM
SO2KM
VOCKM
COALKM
CARSKM
FOREST
ACEXC
GR2050
TFR
EFPC
RECYCLE
HAZWST
BODWAT
NO2 Urban population weighted NO2concentrationUrban population weighted SO2concentration
Urban population weighted TSP concentration
Indoor air pollution from solid fuel use
Percentage of country’s territory inthreatened ecoregions
Threatened bird species as percentageof known breeding bird species in eachcountry
Threatened mammal species aspercentage of known mammal speciesin each country
Threatened amphibian species aspercentage of known amphibian speciesin each country
National Biodiversity Index
Percentage of total land area(including inland waters) having verylow anthropogenic impact
Percentage of total land area(including inland waters) having veryhigh anthropogenic impact
Dissolved oxygen concentration
Electrical conductivity
Phosphorus concentration
Suspended solids
Freshwater availability per capita
Internal groundwater availability per capita
Coal consumption per populated landareaAnthropogenic NOx emissions perpopulated land areaAnthropogenic SO2 emissions perpopulated land area
Anthropogenic VOC emissions perpopulated land area
Vehicles in use per populated land area
Annual average forest cover changerate from 1990 to 2000Acidification exceedance fromanthropogenic sulfur depositionPercentage change in projectedpopulation 2004-2050
Total Fertility Rate
Ecological Footprint per capita
Waste recycling rates
Generation of hazardous waste
Industrial organic water pollutant (BOD)
A A B C A- A- D B-
A A B B- A- A- D B-
A A B B- A- A- D C-
B B- C D+ A U B F
B B C D A A A F
B A- B+ B- A A- A A-
B A- B+ B- A A- A A-
B A- A- B- A B A B
A A- B B A U B D
A- B B- B- A- D A C-
A- B- B- B- A- D A C-
A B+ B- B A A D C+
A- B+ B- B A A D C+
A B+ B- B A A D C+
A B+ B- B A A D C+
A B A- B C A B A
A- B C- C A C B D
A A- B B+ B B- C C-
A A- A- B+ B B- C- C-
A A- B B+ B B- C C-
C A- A- A- A A A A
C+ A A A- A A A A-
A- A- B- B B B- B C-
A C B B D F A F
A B A A A A A A
A A- A A- A A A A
A B B- C- B A- B B
B A C B- B A- C D
B A- B A B A/B C C
A A A- A B A B- A-
Appendix
79
Appendix 4. ESI Data Grading Rubic

About YCELP and CIESIN
Yale Center for Environmental Law and Policy (YCELP)The Yale Center for Environmental Law & Policy (YCELP) was established in 1994 as a joint ini-tiative between the Yale School of Forestry & Environmental Studies and the Yale Law School.YCELP seeks to incorporate fresh thinking, ethical awareness and analytically rigorous decision-making tools into environmental law and policy by providing opportunities to faculty, staff andstudents to collaborate on projects and research activities surrounding these areas. In addition,the Center supports a wide-range of teaching, research, and outreach initiatives aimed at shap-ing academic thinking and policymaking. These efforts are also incorporated into the Center’sEnvironmental Protection Clinic and three program areas: Environmental PerformanceMeasurement, Environmental Law and Governance, and Innovation and Environment.
Center for International Earth Science Information Network (CIESIN) The Center for International Earth Science Information Network (CIESIN) was established in1989, and in 1998 became part of the Columbia University Earth Institute. CIESIN’s mission is toprovide access to and enhance the use of information worldwide, advancing understanding ofhuman interactions in the environment and serving the needs of science and public and pri-vate decisionmaking. Through the development of several interdisciplinary approaches anddata-driven tools, CIESIN supplies valuable information for improving the understandingbetween human and the environment. In addition, CIESIN supports the research and teachingmissions of Columbia University by offering expertise in information technology and data man-agement and contributing to education initiatives.