Embed Size (px)
Citation preview
Cancer Therapy: Preclinical
Epidermal Growth Factor Receptor Inhibition Augments the Expressionof MHC Class I and II Genes
Brian P. Pollack1,2,3,4, Bishu Sapkota1, and Todd V. Cartee1
AbstractPurpose: Diverse immune-related effects occur with the use of epidermal growth factor receptor
inhibitors (EGFRI). In addition to the cutaneous inflammation induced by EGFRIs, these agents have
been associated with the exacerbation of autoimmune skin disease and contact hypersensitivity, antiviral
effects, and fatal alveolar damage in the setting of lung transplantation. Because EGFR ligands can
modulate MHC class I (MHCI) and II (MHCII) molecule expression, we hypothesized that some of
the immune-related effects of EGFRIs are due to direct effects on the expression of MHCI and/or MHCII
molecules.
Experimental Design: Primary human keratinocytes and amalignant keratinocyte cell line (A431) were
treated with EGFRIs alone or prior to IFN-g , a potent inducer of MHCI and MHCII molecule expression.
CIITA, MHCI, and MHCII RNA expression was measured using quantitative real-time reverse transcriptase
PCR, and cell surface MHCI and MHCII protein expression was measured using flow cytometry. Skin
biopsies from patients were analyzed for MHCI and MHCII protein expression before and during therapy
with an EGFRI using immunohistochemistry.
Results: Both EGFR tyrosine kinase inhibitors and ligand-blocking antibodies (cetuximab) augmented
the induction of MHCI and MHCII molecules by IFN-g in primary and malignant human keratinocytes.
Unexpectedly, the increase in MHCI protein expression did not require the presence of IFN-g . Consistentwith these in vitro findings, skin biopsies from cancer patients exhibited increased epidermal MHCI protein
expression during therapy with an EGFRI as well as increases in MHCI and MHCII molecule RNA.
Conclusions: These studies suggest that EGFRIs may influence immune/inflammatory responses by
directly modulating MHC expression. Clin Cancer Res; 17(13); 4400–13. �2011 AACR.
Introduction
Aberrant expression or activity of the epidermal growthfactor receptor (EGFR) has been linked to a variety ofhuman cancers (1). The importance of the EGFR pathwayin human cancer is underscored by the development andclinical use of humanized antibodies and small moleculeEGFR tyrosine kinase inhibitors (TKI) that block EGFRactivation (2). EGFR inhibitors (EGFRI) were initiallydeveloped to block EGFR-dependent prosurvival andmito-genic signals within tumor cells. Regardless of their
mechanism, the use of EGFRIs in patients is associatedwith proinflammatory side effects suggesting that EGFRsignaling modulates the expression of relevant immunor-egulatory genes.
The side effects associated with EGFRIs with an apparentimmune-related mechanism include the development ofskin inflammation (3), exacerbation of autoimmune dis-ease (4), and the development of acute lung injury in thesetting of lung transplantation (5). The development ofskin inflammation can cause significant morbidity and canbe dose limiting thereby interfering with antineoplastictherapy. Despite this, the development of EGFRI-inducedskin inflammation is associated with prolonged survivaland suggests a relationship between EGFR-induced inflam-mation and antitumor effects (6, 7). Defining how theEGFR pathway impacts immune responses is thereforeimportant because it will foster new approaches to attenu-ate EGFRI side effects and may help identify novel applica-tions for their use.
In this report, we show a novel activity of EGFRIs thatmay help explain the proinflammatory side effects of thesemedications. We report that both EGFR TKIs and cetux-imab potentiate the induction of MHC class I (MHCI) andII (MHCII) molecules in response to IFN-g . The increase inMHC molecule expression is associated with an increase in
Authors' Affiliations: Departments of 1Dermatology and 2Pathology andLaboratory Medicine, 3Winship Cancer Institute, Emory University Schoolof Medicine, Atlanta; and 4Atlanta Veterans Affairs Medical Center, Dec-atur, Georgia
Note: Supplementary data for this article are available at Clinical CancerResearch Online (http://clincancerres.aacrjournals.org/).
Current address for T.V. Cartee: Procedural Dermatology Fellow, 2100 16th
Avenue South, Suite 202, Birmingham, AL 35205.
Corresponding Author: Brian P. Pollack, Emory University School ofMedicine, 101 Woodruff Circle, Suite 5001, Atlanta, GA 30322. Phone:404-727-5899; Fax: 404-712-8201; E-mail: [email protected]
doi: 10.1158/1078-0432.CCR-10-3283
�2011 American Association for Cancer Research.
ClinicalCancer
Research
Clin Cancer Res; 17(13) July 1, 20114400
Research. on June 10, 2018. © 2011 American Association for Cancerclincancerres.aacrjournals.org Downloaded from
Published OnlineFirst May 17, 2011; DOI: 10.1158/1078-0432.CCR-10-3283
the MHCII transactivator (CIITA), a transcriptional regu-lator of MHCI and MHCII molecules (8, 9). Importantly,even in the absence of inflammatory cytokines, EGFRIsaugment the constitutive expression of MHCI molecules.Consistent with our in vitro findings, skin biopsies takenfrom patients during EGFRI therapy revealed an increase inepidermalMHCI protein expression andMHCI andMHCIIRNA levels when compared with skin biopsies taken priorto EGFRI therapy. These findings underscore the impor-tance of EGFR signaling in regulating immune system genesand suggest that manipulation of EGFR signaling may offera new approach to modulate MHC-dependent immuneresponses.
Materials and Methods
CellsA431 epidermoid keratinocytes were kindly provided by
the laboratory of Dr. Jeremy M. Boss (Department ofMicrobiology and Immunology, Emory University). WiDRcells were purchased from the American Type CultureCollection. The melanoma cell line, A375, and the coloncarcinoma cell line, HCT116, were kindly provided by Dr.Jack Arbiser (Department of Dermatology, Emory Univer-sity). A431, A375, and HCT116 cells were grown inDulbecco’s minimal essential medium (DMEM) supple-mented with 10% FBS (HyClone, Inc.), penicillin (50U/mL), streptomycin (50 mg/mL), and L-glutamine(1 mmol/L; Life Technologies) and maintained at 37�Cand 5% CO2 atmosphere. The head and neck carcinomacell lines (886LN and SQCC/Y1) were kindly provided byDr. Dong Shin (Winship Cancer Institute) and were main-tained in DMEM:F12 (1:1) supplemented with L-glutamine
(1 mmol/L) and 10% FBS at 37�C and 5% CO2 atmo-sphere. Primary human keratinocytes (PHK) were pur-chased (LifeLine Technologies) and grown in completedefined media as recommended by the supplier and main-tained at 37�C and 5% CO2 atmosphere. PHKs were usedbetween passages 3 and 6.
Reagents and treatment of cellsHuman IFN-g (Peprotech) was resuspended in DMEM
(200 mg/mL) and stored at �80�C. For the treatment ofcells, each unit of IFN-g as indicated in the text represents50 pg/mL of IFN-g . PD168393 and AG1295 (EMD Bio-chemicals) were dissolved in dimethylsulfoxide (DMSO) toa concentration of 10 mmol/L and cells were treated at afinal concentration of 1 mmol/L by adding 1 mL of stockPD168393 to 10 mL of media. AG1478 (Cayman Chemi-cal) was dissolved in DMSO to a concentration of 1.58mmol/L and cells were treated at a final concentration of 1mmol/L by similarly adding stock AG1478 to 10 mL ofmedia. EGF (Promega) was resuspended in basal keratino-cyte media to 100 mg/mL and used at a final concentrationof 10 ng/mL. All of the above reagents were stored at�80�Cin aliquots until use. Therapeutic antibodies were preparedfor human infusion as recommended by the manufacturerand were donated by the Winship Cancer Institute ofEmory University as follows: bevacizumab (25 mg/mL;Genetech), cetuximab (2 mg/mL; ImClone), infliximab(10 mg/mL; Centocor Ortho Biotech), and trastuzumab(21 mg/mL; Genetech). Bevacizumab, infliximab, andtrastuzumab were diluted to 2 mg/mL in sterile PBS andstored at 4�C, as was cetuximab. All therapeutic antibodieswere used at a final concentration of 2 mg/mL for in vitrostudies.
RNA isolation, RT reactions, and real-time PCRRNA isolation and reverse transcription were carried out
as previously described (10, 11). Quantitative real-timePCR was carried out using a CFX96 thermal cycler andmeasuring SYBR green incorporation into double-strandedamplicons. Reactions were carried out in 25 mL volumescontaining forward and reverse primers at a final concen-tration of 100 nmol/L. Primer sequences for CIITA andglyceraldehyde-3-phosphate dehydrogenase (GAPDH)were: CIITA forward 50-CTGAAGGATGTGGAAGACCTGG-GAAAGC-30, CIITA reverse 50-GTCCCCGATCTTGTTCT-CACTC-30; and GAPDH forward 50-GAAGGTGAAGGTC-GGAGTCA-30, GAPDH reverse 50-GAAGATGGTAGATGG-GATTTCC-30.
Flow cytometryFollowing the treatments indicated in the text, cells were
trypsinized, washed in fluorescence-activated cell-sorting(FACS) buffer (2 mmol/L EDTA, 1% bovine serum albu-min in PBS), pelleted by centrifugation. Cell pellets werethen resuspended in 20 to 40 mL of anti-HLA-DR (cloneL203, catalogue FAB4869P, R&D Systems) or anti-HLA-A,HLA-B, and HLA-C antibodies conjugated to phycoerythrin(clone G46-2.6, catalogue 557349, Becton Dickinson) or
Translational Relevance
The development of cutaneous inflammation inresponse to epidermal growth factor receptor inhibitors(EGFRI) is associated with prolonged survival inpatients with advanced cancer. To gain insight intohow EGFRIs alter immune responses, we explored theimpact of EGFRIs on the expression of MHC class I(MHCI) and II (MHCII) molecules. We found thatEGFRIs augment the expression of MHCI and MHCIImolecules on normal and malignant human keratino-cytes. Consistent with these findings, skin biopsies frompatients on EGFRI therapy exhibited an increase inepidermal MHCI protein expression and increases inMHCI and MHCII molecule RNA. These findings mayhelp explain the diverse immune-related effects ofEGFRIs. By modulating the expression of MHC mole-cules, EGFRIs may disturb cutaneous immune home-ostasis and alter antitumor immune responses. EGFRIsmay be useful in clinical settings where augmentedMHC molecule expression is desirable, and conversely,may exacerbate MHC-dependent immune/inflamma-tory processes.
EGFR Inhibitors Augment MHC Genes
www.aacrjournals.org Clin Cancer Res; 17(13) July 1, 2011 4401
Research. on June 10, 2018. © 2011 American Association for Cancerclincancerres.aacrjournals.org Downloaded from
Published OnlineFirst May 17, 2011; DOI: 10.1158/1078-0432.CCR-10-3283
an isotype control antibody also conjugated to phycoery-thrin (catalogue 554680, Becton Dickinson). Cells wereincubated on ice for 30 minutes, washed 3 times, andresuspended in 0.5 mL of FACS buffer containing 0.5%paraformaldehyde. Surface HLA-DR or HLA-A, HLA-B, andHLA-C expression was measured using a FACScalibur (BDBiosciences) flow cytometer and MHC expression analyzedon ungated cells using FlowJo software (Tree Star).
Human subjectsThe use of human subjects was conducted according to
the Declaration of Helsinki principles and was approvedby the Emory University Institutional Review Board.Written informed consent was obtained from all patientsprior to enrollment in the study. Prior to initiation oftherapy with an EGFRI, skin biopsies (4 mm) were con-ducted on the trunk (chest or back) and medial upperextremity. Three to 4 weeks into therapy with eithercetuximab or erlotinib, subjects were biopsied on thetrunk (clinically inflamed skin if present and nonin-flamed skin if not) and noninflamed skin from the uppermedial arm.
ImmunohistochemistryImmunohistochemistry (IHC) was carried out at the
Winship Cancer Institute Pathology Core Laboratory aspreviously reported (10). All skin biopsy sections werestained for either MHCI or MHCII at the same time andunder the same conditions. The following antibodies wereused to examine MHC protein expression: MHCI (Abcam;clone EMR8-5, 1:800) and MHCII (Abcam; clone KUL/05,1:150). Epidermal MHCI staining intensity between biop-sies from the same patient and anatomic site (before vs.during EGFRI therapy) were graded as no increase (�) orincreased (þ) on EGFRI therapy by one of the authorstrained in dermatopathology (B.P.P.). Images were cap-tured on a Nikon Eclipse E400 microscope (Nikon) usingSPOT Flex 15.2 64 Mp Shifting Pixel Camera and SPOTsoftware (Diagnostic Instruments Inc.).
Quantification of MHC I IHCGlass slides containing skin biopsies stained with MHCI
antibodies as described in the text were scanned at 40�magnification using a Nanozoomer 2.0HT slide scanner(Hamamatsu) at the Emory Pathology Core Laboratory.Scanned images were analyzed using Aperio ImageScopePositive Pixel Count (version 9) software (Aperio). Thethreshold settings used were intensity weak positive (Iwp¼200), intensity positive (Ip ¼ 155), and intensity strongpositive (Isp ¼ 100). A representative region of the epi-dermis (�1 mm in length) from each slide was selected foranalysis using the pen tool. To generate a numerical scorefor MHCI staining for the selected epidermal regions, thepixel values for the number of weak positive, positive, andstrong positive were combined and divided by the totalnumber of pixels analyzed (positive þ negative). For sta-tistical analysis, scores before EGFRI therapy from each sitewere averaged and compared with the averages of those
from the same site during therapy using a paired Student’st test (InStat 3, GraphPad Software Inc.).
Statistical analysisAll statistics were conducted using InStat (GraphPad
Software Inc.). Either a paired Student’s t test or an ANOVAwas conducted as indicated in the text. Tests for Gaussian(normal) distribution were conducted using the Kolmo-gorov–Smirnov test.
Results
PD168393 augments the induction of CIITA andHLA-DR by IFN-g
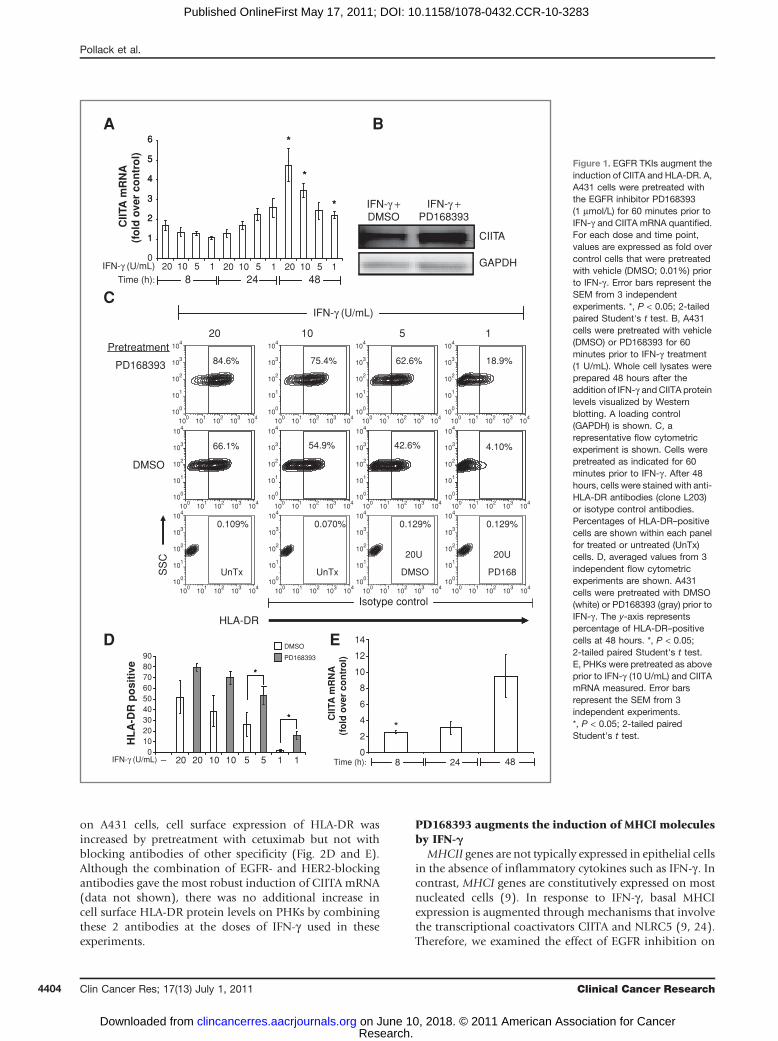
EGFR ligands such as TGF-a are known to be released inresponse to IFN-g through a protease-dependent mechan-ism and activate the EGFR (12, 13). These same ligands canattenuate the induction of MHCII genes by IFN-g (14). Onthe basis of this, we hypothesized that the transactivation ofthe EGFR following IFN-g exposure might establish anegative feedback loop and thereby limit MHCII moleculeexpression which is tightly regulated (15). CIITA plays acritical role in controlling the expression of MHCII mole-cules and is itself tightly regulated (15, 16). Therefore, wefirst examined the impact of EGFR inhibition on CIITAinduction. To this end, we pretreated A431 malignantkeratinocytes with the irreversible EGFRI PD168393 priorto treatment with IFN-g . A431 cells have been used exten-sively to define the mechanisms responsible for the induc-tion of CIITA and MHCII genes (17). PD168393irreversibly binds to the ATP-binding pocket of the EGFR(18) and was selected because it has been shown to alterimmune responses when applied topically to murine skin(13, 19). Following PD168393 pretreatment, A431 cellswere incubated with increasing concentrations of IFN-gand steady-state mRNA levels of CIITA were analyzed usingquantitative real-time reverse transcriptase PCR (RT-PCR)at 8, 24, and 48 hours following IFN-g treatment. Thesetime points were selected because the induction of CIITA byIFN-g involves the recruitment of transacting factors andchromatin-remodeling enzymes to the promoter of CIITAand peak steady-state CIITA mRNA levels have been shownto occur several hours after IFN-g treatment (17). The dosesof IFN-g used in these studies ranged from 1 to 20 units/mL. These doses were selected because they approximateserum levels of IFN-g in humans (20). In addition, wereasoned that at higher doses of IFN-g the expression ofCIITA, and thus its target genes, might bemaximal and thustoo high to detect any augmentation by EGFR inhibition.As shown in Figure 1A, pretreatment of A431 cells withPD168393 augmented CIITA mRNA levels above those ofcontrol cells that were pretreated with vehicle (DMSO)yet treated with the same concentration of IFN-g . Theeffect was most noticeable at the 24 and 48 hours timepoints with statistically significant differences at the 48-hour time point (Fig. 1A). CIITA protein levels were alsoelevated by pretreatment with PD168393 as shown inFigure 1B.
Pollack et al.
Clin Cancer Res; 17(13) July 1, 2011 Clinical Cancer Research4402
Research. on June 10, 2018. © 2011 American Association for Cancerclincancerres.aacrjournals.org Downloaded from
Published OnlineFirst May 17, 2011; DOI: 10.1158/1078-0432.CCR-10-3283
To determine whether the aforementioned changes inCIITA would impact MHCII cell surface protein expres-sion, A431 cells were treated as above, stained with anti-HLA-DR antibodies, and analyzed by flow cytometry.Pretreatment of A431 cells with PD168393 augmentedthe IFN-g–induced cell surface expression of HLA-DR(Fig. 1C and D). Although PD168393 augmented theexpression of HLA-DR at all concentrations tested, theeffect was most robust at lower concentrations of IFN-gwith statistically significant increases seen at 48 hoursusing 5 or 1 U/mL of IFN-g . Indeed, in contrast to lowerdoses of IFN-g , at higher doses of IFN-g (500 U/mL), wesaw only a minimal effect of PD168393 on cell surfaceHLA-DR expression (Supplementary Fig. S1). Thus, inA431 cells, PD168393 potentiates the induction of CIITAand HLA-DR by IFN-g . Analysis of other cancer cell linesrevealed a similar response in SQCCY1 carcinoma cellswhich are derived from an oral squamous cell carcinoma(SSC; Supplementary Fig. S2; ref. 21). In contrast, pre-treatment with PD168393 had no effect on the expressionof cell surface HLA-DR protein in other human cancercell lines tested including those derived from colon car-cinomas (WiDR and HCT116), a nodal metastasis of alaryngeal carcinoma (886LN), and a melanoma (A375;Supplementary Fig. S2).A431 cells are known to have amplification of the EGFR
gene and express levels of the EGFR above that seen inprimary and immortalized keratinocytes (22). In addition,there are known signaling differences between keratinocytecell lines and PHKs (23). Therefore, we repeated the abovestudies in PHKs using 10 U/mL of IFN-g . This dose wasselected because in our system, it leads to a partial induc-tion of cell surface HLA-DR in PHKs (data not shown) andtherefore could be used to detect any increased response inthe presence of EGFR inhibition. As observed in A431 cells,pretreatment with PD168393 augmented the induction ofCIITA mRNA in PHKs (Fig. 1E) to statistically significantlevels above control cells pretreated with vehicle (DMSO).Flow cytometric analysis of cell surface MHCII proteinexpression showed that PD168393 pretreatment also aug-mented the cell surface expression of HLA-DR in PHKs(Fig. 1F and G). As a control, we pretreated PHKs withanother (although reversible) EGFR inhibitor, AG1478,which also augmented levels of HLA-DR (Fig. 1F and G).In contrast, pretreatment with a platelet-derived growthfactor receptor (PDGFR) inhibitor, AG1295, failed to aug-ment levels of HLA-DR (Fig. 1F and G). These findingssuggest that EGFR activity following IFN-g exposure influ-ences the induction of CIITA and MHCII genes in malig-nant and normal human keratinocytes. The above resultssupport the notion that EGFR activation following IFN-gserves to attenuate the induction of CIITA. To test this, wetreated cells with IFN-g alone or combined with EGF. Wefound that in both A431 cells and PHKs, coadministrationof EGF with IFN-g attenuated the induction of CIITAmRNA by IFN-g (Supplementary Fig. S3). As reported byothers, the induction of cell surface HLA-DR protein wasalso attenuated (Supplementary Fig. S3; ref. 14).
The protease inhibitor marimastat augments theinduction of HLA-DR
EGFR ligands, such as TGF-a, can be shed from the cellsurface in response to inflammatory cytokines (such asIFN-g) through a protease-dependent mechanism (13).These same ligands can repress the induction of MHCIImolecules by IFN-g (14). Therefore, we reasoned thatinhibition of protease activity would block the release ofEGFR ligands following IFN-g exposure and lead to a morerobust induction of MHCII molecules. To test this hypoth-esis, we pretreated PHKs with the protease inhibitor mar-imastat prior to IFN-g treatment. As reported by others,treatment of keratinocytes with IFN-g resulted in a loss ofcell surface TGF-a protein (as measured by flow cytometry)and this effect was prevented by pretreatment with mar-imastat (Supplementary Fig. S4). Consistent with the afore-mentioned hypothesis, pretreatment with the proteaseinhibitor marimastat augmented the induction of HLA-DR by IFN-g in PHKs (Fig. 1H). The difference betweencontrol cells and those pretreated with marimastat wasstatistically significant and was not due to a direct effectof the protease inhibitor because marimastat alone had noeffect on HLA-DR levels.
Cetuximab augments the induction of CIITA andHLA-DR by IFN-g in human keratinocytes
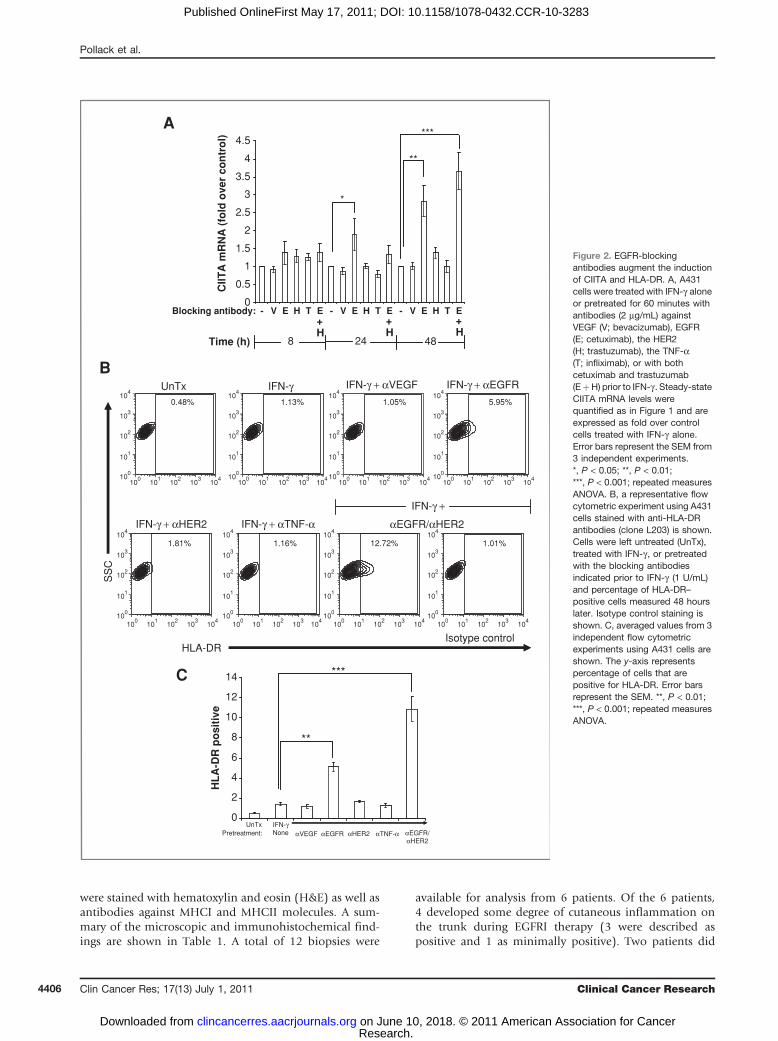
We next examined how the blockade of EGFR ligandbinding influenced the induction of CIITA and HLA-DR byIFN-g . A431 cells were pretreated with an EGFR-blockingantibody (cetuximab) prior to IFN-g exposure. As controls,we used other therapeutic humanized antibodies (whichlike cetuximab are IgG1k antibodies) that target vascularendothelial growth factor (VEGF; bevacizumab), humanepidermal growth factor receptor 2 (HER2; trastuzumab),and tumor necrosis factor-a (TNF-a; infliximab). Asobserved with PD168393, pretreatment with cetuximab,but not the control antibodies, augmented the induction ofCIITA mRNA by IFN-g in A431 cells to statistically signifi-cant levels compared with control cells (Fig. 2A). Becausethe EGFR is known to heterodimerize with other HERfamily members, and drugs targeting multiple HER familymembers are in development (2), we examined the effect ofcombining antibodies that block the EGFR with thosetargeting the related receptor tyrosine kinase HER2.Although blocking antibodies against HER2 had no effectwhen used alone, the addition of these antibodies tocetuximab slightly augmented the induction of CIITAmRNA at the 48-hour time point (Fig. 2A). We nextexamined cell surface MHCII protein expression using flowcytometry and found that pretreatment with cetuximabaugmented HLA-DR protein expression on the surface ofA431 cells (Fig. 2B and C) to levels that were statisticallysignificant. As we observed with CIITAmRNA, the additionof HER2-blocking antibodies augmented the effect of pre-treatment with the EGFR-blocking antibody cetuximab(Fig. 2B and C).
To test whether there is a similar response in primarycells, we repeated these experiments in PHKs. As observed
EGFR Inhibitors Augment MHC Genes
www.aacrjournals.org Clin Cancer Res; 17(13) July 1, 2011 4403
Research. on June 10, 2018. © 2011 American Association for Cancerclincancerres.aacrjournals.org Downloaded from
Published OnlineFirst May 17, 2011; DOI: 10.1158/1078-0432.CCR-10-3283
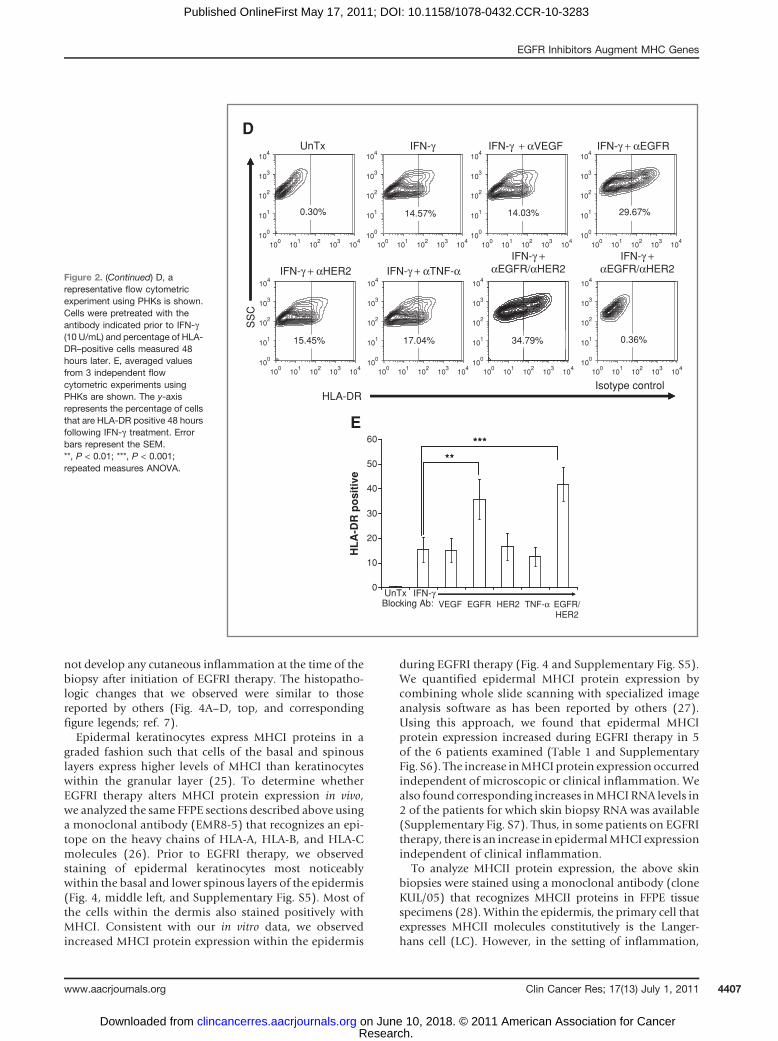
on A431 cells, cell surface expression of HLA-DR wasincreased by pretreatment with cetuximab but not withblocking antibodies of other specificity (Fig. 2D and E).Although the combination of EGFR- and HER2-blockingantibodies gave the most robust induction of CIITA mRNA(data not shown), there was no additional increase incell surface HLA-DR protein levels on PHKs by combiningthese 2 antibodies at the doses of IFN-g used in theseexperiments.
PD168393 augments the induction of MHCI moleculesby IFN-g
MHCII genes are not typically expressed in epithelial cellsin the absence of inflammatory cytokines such as IFN-g . Incontrast, MHCI genes are constitutively expressed on mostnucleated cells (9). In response to IFN-g , basal MHCIexpression is augmented through mechanisms that involvethe transcriptional coactivators CIITA and NLRC5 (9, 24).Therefore, we examined the effect of EGFR inhibition on
0
1
2
3
4
5
6
1 20 10 5Time (h):
*
*
*
1
2
3
4
5
6A
C
D E
BC
IITA
mR
NA
(fo
ld o
ver
con
tro
l)
10 120 10 5 1 20 5488 24
IFN-γ (U/mL)
*
*
*
CIITA
GAPDH
IFN-γ +DMSO
IFN-γ +PD168393
PD168393
*
*
IFN-γ (U/mL) – 20 20 10 10 5 5 1 1
*
*
0102030405060708090
HL
A-D
R p
osi
tive
DMSO
*
*
66.1% 54.9% 42.6%
75.4%84.6%
104
103
102
101
100
100
101
102
103
104
104
103
102
101
100
100
101
102
103
104
104
103
102
101
100
100
101
102
103
104
104
103
102
101
100
100
101
102
103
104
104
103
102
101
100
100
101
102
103
104
104
103
102
101
100
100
101
102
103
104
104
103
102
101
100
100
101
102
103
104
104
103
102
101
100
100
101
102
103
104
104
103
102
101
100
100
101
102
103
104
104
103
102
101
100
100
101
102
103
104
104
103
102
101
100
100
101
102
103
104
104
103
102
101
100
100
101
102
103
104
62.6% 18.9%
4.10%
0.070% 0.129% 0.129%0.109%
20 10 5 1
DMSO
PD168393
Pretreatment
UnTx
IFN-γ (U/mL)
UnTx
20U
DMSO
20U
PD168
HLA-DR
Isotype control
SS
C
14
8
10
12
2
4
6
CIIT
A m
RN
A(f
old
ove
r co
ntr
ol)
*
048248Time (h):
Figure 1. EGFR TKIs augment theinduction of CIITA and HLA-DR. A,A431 cells were pretreated withthe EGFR inhibitor PD168393(1 mmol/L) for 60 minutes prior toIFN-g and CIITA mRNA quantified.For each dose and time point,values are expressed as fold overcontrol cells that were pretreatedwith vehicle (DMSO; 0.01%) priorto IFN-g . Error bars represent theSEM from 3 independentexperiments. *, P < 0.05; 2-tailedpaired Student's t test. B, A431cells were pretreated with vehicle(DMSO) or PD168393 for 60minutes prior to IFN-g treatment(1 U/mL). Whole cell lysates wereprepared 48 hours after theaddition of IFN-g andCIITA proteinlevels visualized by Westernblotting. A loading control(GAPDH) is shown. C, arepresentative flow cytometricexperiment is shown. Cells werepretreated as indicated for 60minutes prior to IFN-g . After 48hours, cells were stained with anti-HLA-DR antibodies (clone L203)or isotype control antibodies.Percentages of HLA-DR–positivecells are shown within each panelfor treated or untreated (UnTx)cells. D, averaged values from 3independent flow cytometricexperiments are shown. A431cells were pretreated with DMSO(white) or PD168393 (gray) prior toIFN-g . The y-axis representspercentage of HLA-DR–positivecells at 48 hours. *, P < 0.05;2-tailed paired Student's t test.E, PHKs were pretreated as aboveprior to IFN-g (10 U/mL) and CIITAmRNA measured. Error barsrepresent the SEM from 3independent experiments.*, P < 0.05; 2-tailed pairedStudent's t test.
Pollack et al.
Clin Cancer Res; 17(13) July 1, 2011 Clinical Cancer Research4404
Research. on June 10, 2018. © 2011 American Association for Cancerclincancerres.aacrjournals.org Downloaded from
Published OnlineFirst May 17, 2011; DOI: 10.1158/1078-0432.CCR-10-3283
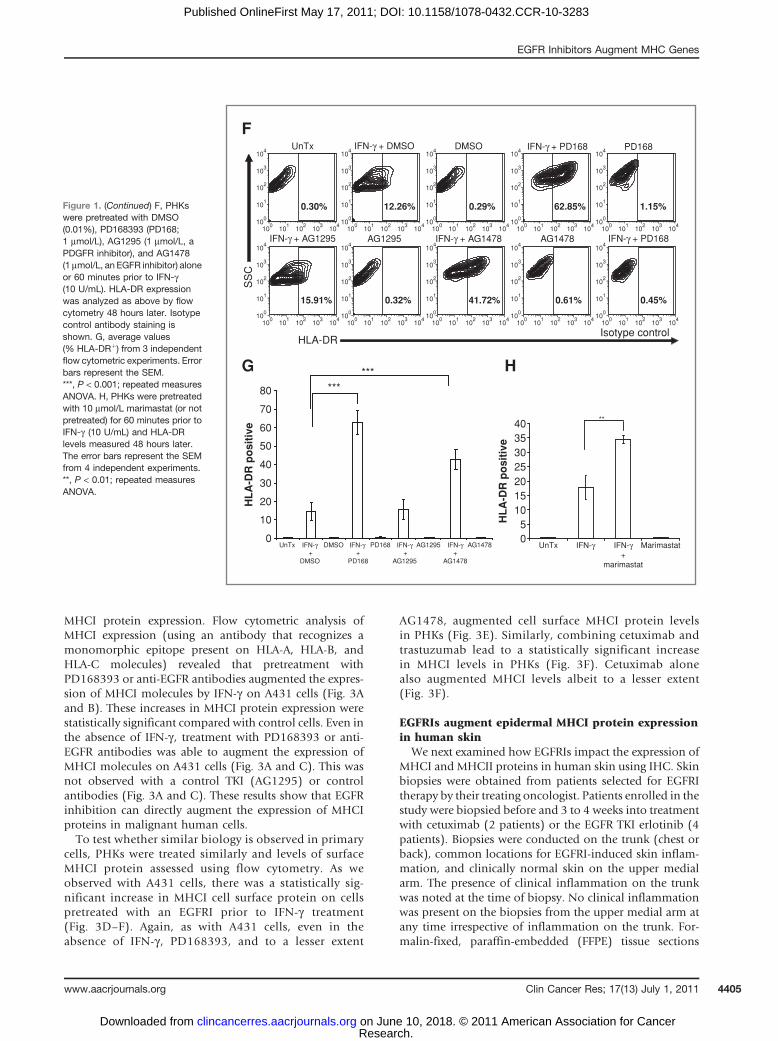
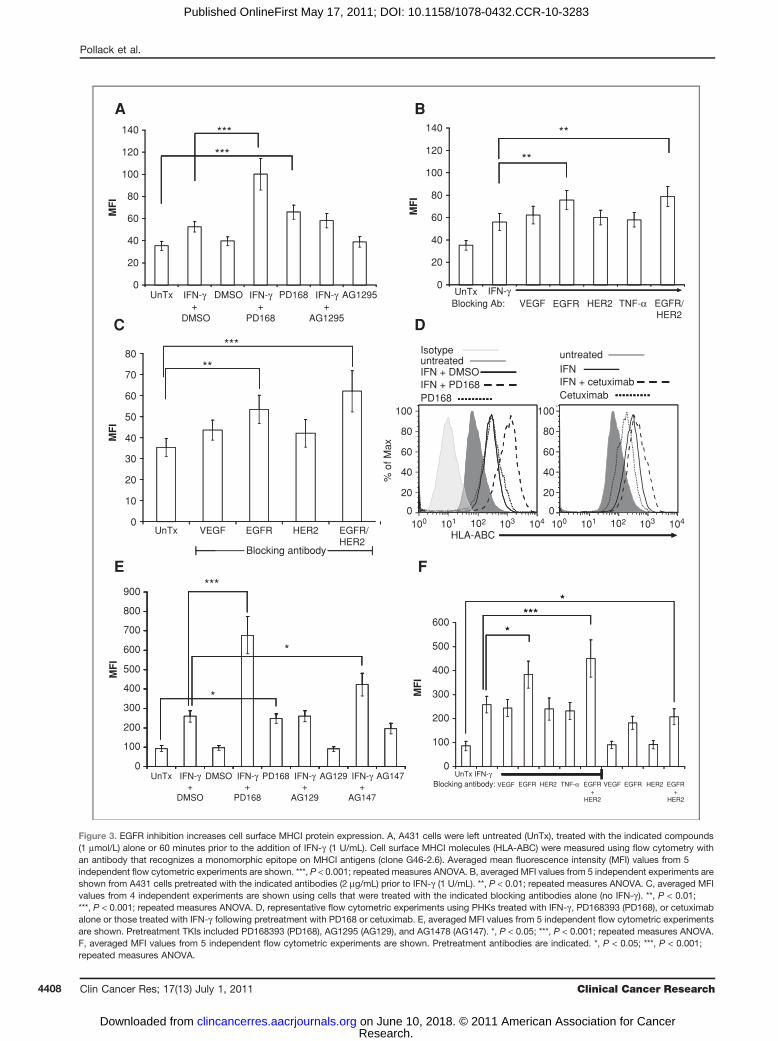
MHCI protein expression. Flow cytometric analysis ofMHCI expression (using an antibody that recognizes amonomorphic epitope present on HLA-A, HLA-B, andHLA-C molecules) revealed that pretreatment withPD168393 or anti-EGFR antibodies augmented the expres-sion of MHCI molecules by IFN-g on A431 cells (Fig. 3Aand B). These increases in MHCI protein expression werestatistically significant compared with control cells. Even inthe absence of IFN-g , treatment with PD168393 or anti-EGFR antibodies was able to augment the expression ofMHCI molecules on A431 cells (Fig. 3A and C). This wasnot observed with a control TKI (AG1295) or controlantibodies (Fig. 3A and C). These results show that EGFRinhibition can directly augment the expression of MHCIproteins in malignant human cells.To test whether similar biology is observed in primary
cells, PHKs were treated similarly and levels of surfaceMHCI protein assessed using flow cytometry. As weobserved with A431 cells, there was a statistically sig-nificant increase in MHCI cell surface protein on cellspretreated with an EGFRI prior to IFN-g treatment(Fig. 3D–F). Again, as with A431 cells, even in theabsence of IFN-g , PD168393, and to a lesser extent
AG1478, augmented cell surface MHCI protein levelsin PHKs (Fig. 3E). Similarly, combining cetuximab andtrastuzumab lead to a statistically significant increasein MHCI levels in PHKs (Fig. 3F). Cetuximab alonealso augmented MHCI levels albeit to a lesser extent(Fig. 3F).
EGFRIs augment epidermal MHCI protein expressionin human skin
We next examined how EGFRIs impact the expression ofMHCI and MHCII proteins in human skin using IHC. Skinbiopsies were obtained from patients selected for EGFRItherapy by their treating oncologist. Patients enrolled in thestudy were biopsied before and 3 to 4 weeks into treatmentwith cetuximab (2 patients) or the EGFR TKI erlotinib (4patients). Biopsies were conducted on the trunk (chest orback), common locations for EGFRI-induced skin inflam-mation, and clinically normal skin on the upper medialarm. The presence of clinical inflammation on the trunkwas noted at the time of biopsy. No clinical inflammationwas present on the biopsies from the upper medial arm atany time irrespective of inflammation on the trunk. For-malin-fixed, paraffin-embedded (FFPE) tissue sections
Figure 1. (Continued) F, PHKswere pretreated with DMSO(0.01%), PD168393 (PD168;1 mmol/L), AG1295 (1 mmol/L, aPDGFR inhibitor), and AG1478(1 mmol/L, an EGFR inhibitor) aloneor 60 minutes prior to IFN-g(10 U/mL). HLA-DR expressionwas analyzed as above by flowcytometry 48 hours later. Isotypecontrol antibody staining isshown. G, average values(% HLA-DRþ) from 3 independentflow cytometric experiments. Errorbars represent the SEM.***, P < 0.001; repeated measuresANOVA. H, PHKs were pretreatedwith 10 mmol/L marimastat (or notpretreated) for 60 minutes prior toIFN-g (10 U/mL) and HLA-DRlevels measured 48 hours later.The error bars represent the SEMfrom 4 independent experiments.**, P < 0.01; repeated measuresANOVA.
0.30% 12.26% 0.29% 62.85% 1.15%
15.91% 0.32% 41.72% 0.61% 0.45%
IFN-γ + DMSO DMSO IFN-γ + PD168
IFN-γ + AG1295 IFN-γ + AG1478 IFN-γ + PD168
HLA-DRIsotype control
SS
C
UnTx
F
G H
104
103
102
101
100
100
101
102
103
104
104
103
102
101
100
100
101
102
103
104
104
103
102
101
100
100
101
102
103
104
104
103
102
101
100
100
101
102
103
104
104
103
102
101
100
100
101
102
103
104
104
103
102
101
100
100
101
102
103
104
104
103
102
101
100
100
101
102
103
104
104
103
102
101
100
100
101
102
103
104
104
103
102
101
100
100
101
102
103
104
104
103
102
101
100
100
101
102
103
104
PD168
AG1295 AG1478
***
AG14780
10
20
30
40
50
60
70
80
HL
A-D
R p
osi
tive
***
IFN-γ+
AG1478
AG1295IFN-γ +
AG1295
PD168IFN-γ +
PD168
DMSOUnTx05
10152025303540
UnTx IFN-γ IFN-γ+
marimastat
Marimastat
HL
A-D
R p
osi
tive
**
IFN-γ +
DMSO
EGFR Inhibitors Augment MHC Genes
www.aacrjournals.org Clin Cancer Res; 17(13) July 1, 2011 4405
Research. on June 10, 2018. © 2011 American Association for Cancerclincancerres.aacrjournals.org Downloaded from
Published OnlineFirst May 17, 2011; DOI: 10.1158/1078-0432.CCR-10-3283
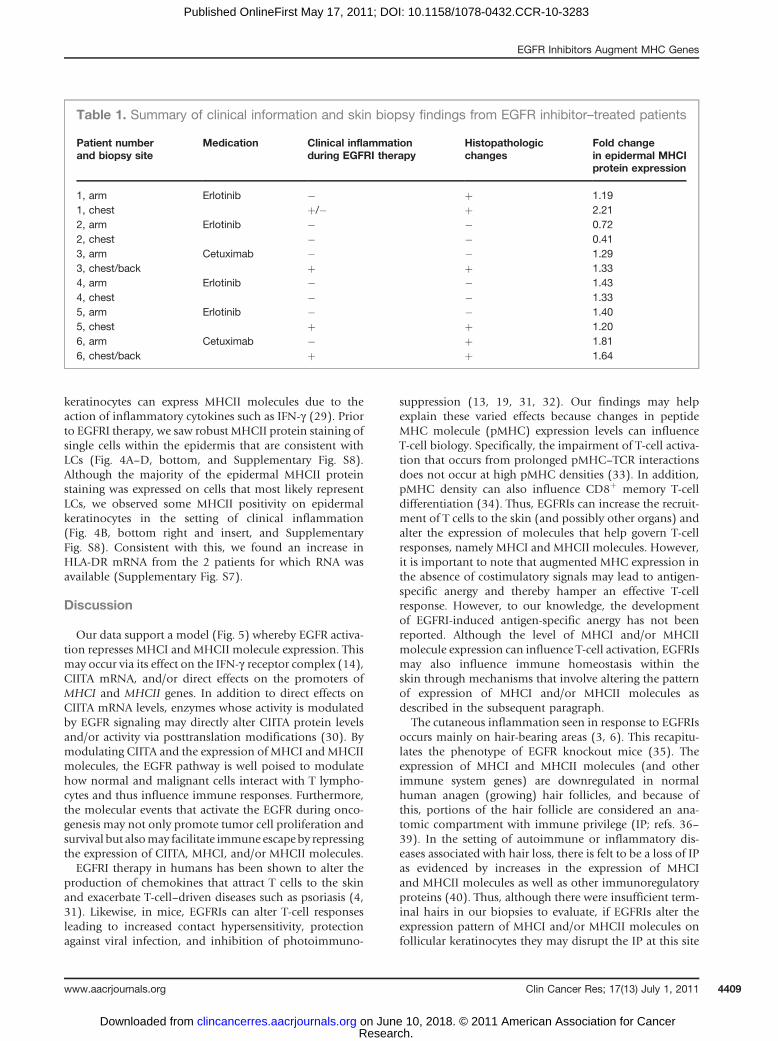
were stained with hematoxylin and eosin (H&E) as well asantibodies against MHCI and MHCII molecules. A sum-mary of the microscopic and immunohistochemical find-ings are shown in Table 1. A total of 12 biopsies were
available for analysis from 6 patients. Of the 6 patients,4 developed some degree of cutaneous inflammation onthe trunk during EGFRI therapy (3 were described aspositive and 1 as minimally positive). Two patients did
0
0.5
1
1.5
2
2.5
3
3.5
4
4.5
CIIT
A m
RN
A (
fold
ove
r co
ntr
ol)
Time (h) 8 24 48
**
***
*
Blocking antibody: V VVE E EH T H T H TE+H
E+H
E+H
- - -
0.48% 1.13% 1.05% 5.95%
1.81% 1.16% 12.72% 1.01%
UnTx IFN-γ IFN-γ + αVEGF IFN-γ + αEGFR
IFN-γ + αHER2 IFN-γ + αTNF-α
IFN-γ +
αEGFR/αHER2
Isotype controlHLA-DR
SS
C
104
103
102
101
100
100
101
102
103
104
104
103
102
101
100
100
101
102
103
104
104
103
102
101
100
100
101
102
103
104
104
103
102
101
100
100
101
102
103
104
104
103
102
101
100
100
101
102
103
104
104
103
102
101
100
100
101
102
103
104
104
103
102
101
100
100
101
102
103
104
104
103
102
101
100
100
101
102
103
104
A
B
C
0
2
4
6
8
10
12
14
UnTx IFN-γNone
HL
A-D
R p
osi
tive
αVEGF αEGFR αHER2 αTNF-α αEGFR/αHER2
Pretreatment:
**
***
Figure 2. EGFR-blockingantibodies augment the inductionof CIITA and HLA-DR. A, A431cells were treated with IFN-g aloneor pretreated for 60 minutes withantibodies (2 mg/mL) againstVEGF (V; bevacizumab), EGFR(E; cetuximab), the HER2(H; trastuzumab), the TNF-a(T; infliximab), or with bothcetuximab and trastuzumab(EþH) prior to IFN-g . Steady-stateCIITA mRNA levels werequantified as in Figure 1 and areexpressed as fold over controlcells treated with IFN-g alone.Error bars represent the SEM from3 independent experiments.*, P < 0.05; **, P < 0.01;***, P < 0.001; repeated measuresANOVA. B, a representative flowcytometric experiment using A431cells stained with anti-HLA-DRantibodies (clone L203) is shown.Cells were left untreated (UnTx),treated with IFN-g , or pretreatedwith the blocking antibodiesindicated prior to IFN-g (1 U/mL)and percentage of HLA-DR–positive cells measured 48 hourslater. Isotype control staining isshown. C, averaged values from 3independent flow cytometricexperiments using A431 cells areshown. The y-axis representspercentage of cells that arepositive for HLA-DR. Error barsrepresent the SEM. **, P < 0.01;***, P < 0.001; repeated measuresANOVA.
Pollack et al.
Clin Cancer Res; 17(13) July 1, 2011 Clinical Cancer Research4406
Research. on June 10, 2018. © 2011 American Association for Cancerclincancerres.aacrjournals.org Downloaded from
Published OnlineFirst May 17, 2011; DOI: 10.1158/1078-0432.CCR-10-3283
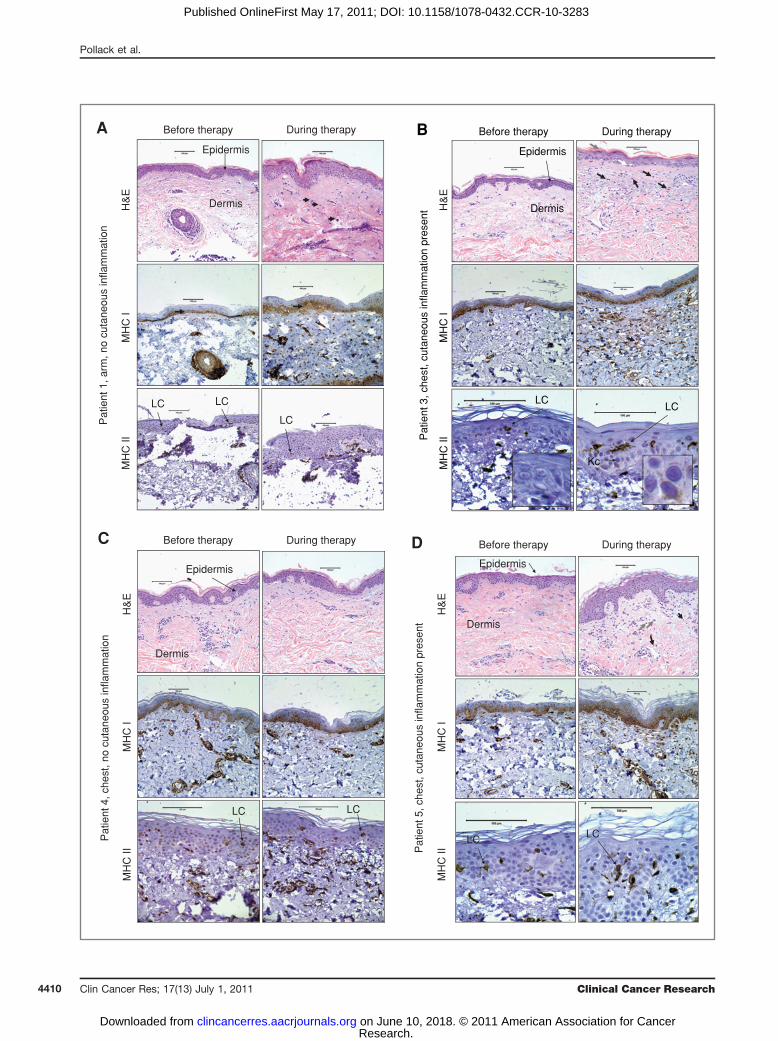
not develop any cutaneous inflammation at the time of thebiopsy after initiation of EGFRI therapy. The histopatho-logic changes that we observed were similar to thosereported by others (Fig. 4A–D, top, and correspondingfigure legends; ref. 7).Epidermal keratinocytes express MHCI proteins in a
graded fashion such that cells of the basal and spinouslayers express higher levels of MHCI than keratinocyteswithin the granular layer (25). To determine whetherEGFRI therapy alters MHCI protein expression in vivo,we analyzed the same FFPE sections described above usinga monoclonal antibody (EMR8-5) that recognizes an epi-tope on the heavy chains of HLA-A, HLA-B, and HLA-Cmolecules (26). Prior to EGFRI therapy, we observedstaining of epidermal keratinocytes most noticeablywithin the basal and lower spinous layers of the epidermis(Fig. 4, middle left, and Supplementary Fig. S5). Most ofthe cells within the dermis also stained positively withMHCI. Consistent with our in vitro data, we observedincreased MHCI protein expression within the epidermis
during EGFRI therapy (Fig. 4 and Supplementary Fig. S5).We quantified epidermal MHCI protein expression bycombining whole slide scanning with specialized imageanalysis software as has been reported by others (27).Using this approach, we found that epidermal MHCIprotein expression increased during EGFRI therapy in 5of the 6 patients examined (Table 1 and SupplementaryFig. S6). The increase inMHCI protein expression occurredindependent of microscopic or clinical inflammation. Wealso found corresponding increases inMHCI RNA levels in2 of the patients for which skin biopsy RNA was available(Supplementary Fig. S7). Thus, in some patients on EGFRItherapy, there is an increase in epidermalMHCI expressionindependent of clinical inflammation.
To analyze MHCII protein expression, the above skinbiopsies were stained using a monoclonal antibody (cloneKUL/05) that recognizes MHCII proteins in FFPE tissuespecimens (28). Within the epidermis, the primary cell thatexpresses MHCII molecules constitutively is the Langer-hans cell (LC). However, in the setting of inflammation,
Figure 2. (Continued) D, arepresentative flow cytometricexperiment using PHKs is shown.Cells were pretreated with theantibody indicated prior to IFN-g(10 U/mL) and percentage of HLA-DR–positive cells measured 48hours later. E, averaged valuesfrom 3 independent flowcytometric experiments usingPHKs are shown. The y-axisrepresents the percentage of cellsthat are HLA-DR positive 48 hoursfollowing IFN-g treatment. Errorbars represent the SEM.**, P < 0.01; ***, P < 0.001;repeated measures ANOVA.
0.30% 14.57% 14.03% 29.67%
15.45% 17.04% 34.79% 0.36%
0.30% 14.57% 14.03% 29.67%
UnTxD
IFN-γ IFN-γ + αVEGF IFN-γ + αEGFR
15.45% 17.04% 34.79% 0.36%
IFN-γ + αHER2 IFN-γ + αTNF-αIFN-γ +
αEGFR/αHER2IFN-γ +
αEGFR/αHER2
HLA-DRIsotype control
SS
C
104
103
102
101
100
100
101
102
103
104
104
103
102
101
100
100
101
102
103
104
104
103
102
101
100
100
101
102
103
104
104
103
102
101
100
100
101
102
103
104
104
103
102
101
100
100
101
102
103
104
104
103
102
101
100
100
101
102
103
104
104
103
102
101
100
100
101
102
103
104
104
103
102
101
100
100
101
102
103
104
E
*****
0
10
20
30
40
50
60
HL
A-D
R p
osi
tive
UnTx IFN-γVEGF EGFR HER2 TNF-α EGFR/
HER2Blocking Ab:
*****
EGFR Inhibitors Augment MHC Genes
www.aacrjournals.org Clin Cancer Res; 17(13) July 1, 2011 4407
Research. on June 10, 2018. © 2011 American Association for Cancerclincancerres.aacrjournals.org Downloaded from
Published OnlineFirst May 17, 2011; DOI: 10.1158/1078-0432.CCR-10-3283
0
20
40
60
80
100
120
140
A B
C D
E F
UnTx IFN-γ+
DMSO
DMSO IFN-γ+
PD168
PD168 IFN-γ+
AG1295
AG1295
MF
I
***
***
20
0
40
60
80
100
120
140
MF
I
UnTx IFN-γVEGFBlocking Ab: EGFR HER2 TNF-α EGFR/
HER2
**
**
0
10
20
30
40
50
60
70
80
MF
I
UnTx VEGF EGFR HER2 EGFR/HER2
**
***
Blocking antibody
100 101 102 103 104 100 101 102 103 1040
20
40
60
80
100
0
20
40
60
80
100
% o
f Max
Isotypeuntreated
IFN + PD168IFN + DMSO
PD168
untreated
IFN + cetuximabIFN
Cetuximab
HLA-ABC
UnTx IFN-γ+
DMSO
DMSO IFN-γ+
PD168
PD168 IFN-γ+
AG129
AG129 IFN-γ+
AG147
AG1470
100
200
300
400
500
600
700
800
900
MF
I
***
*
*
****
*
0
100
200
300
400
500
600
MF
I
UnTx IFN-γBlocking antibody: VEGF EGFR HER2 TNF-α EGFR
+HER2
VEGF EGFR HER2 EGFR+
HER2
****
*
Figure 3. EGFR inhibition increases cell surface MHCI protein expression. A, A431 cells were left untreated (UnTx), treated with the indicated compounds(1 mmol/L) alone or 60 minutes prior to the addition of IFN-g (1 U/mL). Cell surface MHCI molecules (HLA-ABC) were measured using flow cytometry withan antibody that recognizes a monomorphic epitope on MHCI antigens (clone G46-2.6). Averaged mean fluorescence intensity (MFI) values from 5independent flow cytometric experiments are shown. ***, P < 0.001; repeated measures ANOVA. B, averaged MFI values from 5 independent experiments areshown from A431 cells pretreated with the indicated antibodies (2 mg/mL) prior to IFN-g (1 U/mL). **, P < 0.01; repeated measures ANOVA. C, averaged MFIvalues from 4 independent experiments are shown using cells that were treated with the indicated blocking antibodies alone (no IFN-g ). **, P < 0.01;***, P < 0.001; repeated measures ANOVA. D, representative flow cytometric experiments using PHKs treated with IFN-g , PD168393 (PD168), or cetuximabalone or those treated with IFN-g following pretreatment with PD168 or cetuximab. E, averaged MFI values from 5 independent flow cytometric experimentsare shown. Pretreatment TKIs included PD168393 (PD168), AG1295 (AG129), and AG1478 (AG147). *, P < 0.05; ***, P < 0.001; repeated measures ANOVA.F, averaged MFI values from 5 independent flow cytometric experiments are shown. Pretreatment antibodies are indicated. *, P < 0.05; ***, P < 0.001;repeated measures ANOVA.
Pollack et al.
Clin Cancer Res; 17(13) July 1, 2011 Clinical Cancer Research4408
Research. on June 10, 2018. © 2011 American Association for Cancerclincancerres.aacrjournals.org Downloaded from
Published OnlineFirst May 17, 2011; DOI: 10.1158/1078-0432.CCR-10-3283
keratinocytes can express MHCII molecules due to theaction of inflammatory cytokines such as IFN-g (29). Priorto EGFRI therapy, we saw robust MHCII protein staining ofsingle cells within the epidermis that are consistent withLCs (Fig. 4A–D, bottom, and Supplementary Fig. S8).Although the majority of the epidermal MHCII proteinstaining was expressed on cells that most likely representLCs, we observed some MHCII positivity on epidermalkeratinocytes in the setting of clinical inflammation(Fig. 4B, bottom right and insert, and SupplementaryFig. S8). Consistent with this, we found an increase inHLA-DR mRNA from the 2 patients for which RNA wasavailable (Supplementary Fig. S7).
Discussion
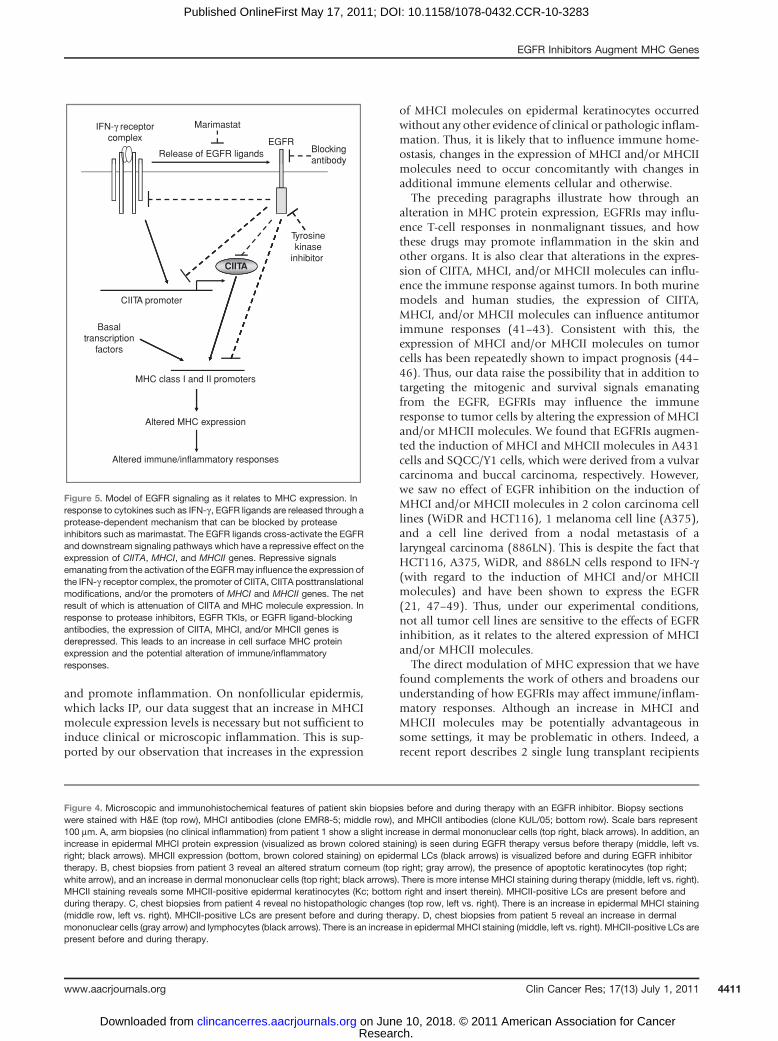
Our data support a model (Fig. 5) whereby EGFR activa-tion represses MHCI and MHCII molecule expression. Thismay occur via its effect on the IFN-g receptor complex (14),CIITA mRNA, and/or direct effects on the promoters ofMHCI and MHCII genes. In addition to direct effects onCIITA mRNA levels, enzymes whose activity is modulatedby EGFR signaling may directly alter CIITA protein levelsand/or activity via posttranslation modifications (30). Bymodulating CIITA and the expression of MHCI and MHCIImolecules, the EGFR pathway is well poised to modulatehow normal and malignant cells interact with T lympho-cytes and thus influence immune responses. Furthermore,the molecular events that activate the EGFR during onco-genesis may not only promote tumor cell proliferation andsurvival but alsomay facilitate immune escapeby repressingthe expression of CIITA, MHCI, and/or MHCII molecules.EGFRI therapy in humans has been shown to alter the
production of chemokines that attract T cells to the skinand exacerbate T-cell–driven diseases such as psoriasis (4,31). Likewise, in mice, EGFRIs can alter T-cell responsesleading to increased contact hypersensitivity, protectionagainst viral infection, and inhibition of photoimmuno-
suppression (13, 19, 31, 32). Our findings may helpexplain these varied effects because changes in peptideMHC molecule (pMHC) expression levels can influenceT-cell biology. Specifically, the impairment of T-cell activa-tion that occurs from prolonged pMHC–TCR interactionsdoes not occur at high pMHC densities (33). In addition,pMHC density can also influence CD8þ memory T-celldifferentiation (34). Thus, EGFRIs can increase the recruit-ment of T cells to the skin (and possibly other organs) andalter the expression of molecules that help govern T-cellresponses, namely MHCI and MHCII molecules. However,it is important to note that augmented MHC expression inthe absence of costimulatory signals may lead to antigen-specific anergy and thereby hamper an effective T-cellresponse. However, to our knowledge, the developmentof EGFRI-induced antigen-specific anergy has not beenreported. Although the level of MHCI and/or MHCIImolecule expression can influence T-cell activation, EGFRIsmay also influence immune homeostasis within theskin through mechanisms that involve altering the patternof expression of MHCI and/or MHCII molecules asdescribed in the subsequent paragraph.
The cutaneous inflammation seen in response to EGFRIsoccurs mainly on hair-bearing areas (3, 6). This recapitu-lates the phenotype of EGFR knockout mice (35). Theexpression of MHCI and MHCII molecules (and otherimmune system genes) are downregulated in normalhuman anagen (growing) hair follicles, and because ofthis, portions of the hair follicle are considered an ana-tomic compartment with immune privilege (IP; refs. 36–39). In the setting of autoimmune or inflammatory dis-eases associated with hair loss, there is felt to be a loss of IPas evidenced by increases in the expression of MHCIand MHCII molecules as well as other immunoregulatoryproteins (40). Thus, although there were insufficient term-inal hairs in our biopsies to evaluate, if EGFRIs alter theexpression pattern of MHCI and/or MHCII molecules onfollicular keratinocytes they may disrupt the IP at this site
Table 1. Summary of clinical information and skin biopsy findings from EGFR inhibitor–treated patients
Patient numberand biopsy site
Medication Clinical inflammationduring EGFRI therapy
Histopathologicchanges
Fold changein epidermal MHCIprotein expression
1, arm Erlotinib � þ 1.191, chest þ/� þ 2.212, arm Erlotinib � � 0.722, chest � � 0.413, arm Cetuximab � � 1.293, chest/back þ þ 1.334, arm Erlotinib � � 1.434, chest � � 1.335, arm Erlotinib � � 1.405, chest þ þ 1.206, arm Cetuximab � þ 1.816, chest/back þ þ 1.64
EGFR Inhibitors Augment MHC Genes
www.aacrjournals.org Clin Cancer Res; 17(13) July 1, 2011 4409
Research. on June 10, 2018. © 2011 American Association for Cancerclincancerres.aacrjournals.org Downloaded from
Published OnlineFirst May 17, 2011; DOI: 10.1158/1078-0432.CCR-10-3283
Before therapyA During therapyM
HC
IM
HC
IIH
&E
Epidermis
Dermis
LC LC
LCPat
ient
1, a
rm, n
o cu
tane
ous
infla
mm
atio
n
MH
C I
H&
EM
HC
II
Before therapyB During therapy
Epidermis
Dermis
LCLC
Pat
ient
3, c
hest
, cut
aneo
us in
flam
mat
ion
pres
ent
Kc
Pat
ient
4, c
hest
, no
cuta
neou
s in
flam
mat
ion
Epidermis
Dermis
MH
C I
H&
EM
HC
II
Before therapyC During therapy
LC LC
Before therapyD During therapy
MH
C I
MH
C II
H&
E
Pat
ient
5, c
hest
, cut
aneo
us in
flam
mat
ion
pres
ent
Epidermis
Dermis
LC LC
Pollack et al.
Clin Cancer Res; 17(13) July 1, 2011 Clinical Cancer Research4410
Research. on June 10, 2018. © 2011 American Association for Cancerclincancerres.aacrjournals.org Downloaded from
Published OnlineFirst May 17, 2011; DOI: 10.1158/1078-0432.CCR-10-3283
and promote inflammation. On nonfollicular epidermis,which lacks IP, our data suggest that an increase in MHCImolecule expression levels is necessary but not sufficient toinduce clinical or microscopic inflammation. This is sup-ported by our observation that increases in the expression
of MHCI molecules on epidermal keratinocytes occurredwithout any other evidence of clinical or pathologic inflam-mation. Thus, it is likely that to influence immune home-ostasis, changes in the expression of MHCI and/or MHCIImolecules need to occur concomitantly with changes inadditional immune elements cellular and otherwise.
The preceding paragraphs illustrate how through analteration in MHC protein expression, EGFRIs may influ-ence T-cell responses in nonmalignant tissues, and howthese drugs may promote inflammation in the skin andother organs. It is also clear that alterations in the expres-sion of CIITA, MHCI, and/or MHCII molecules can influ-ence the immune response against tumors. In both murinemodels and human studies, the expression of CIITA,MHCI, and/or MHCII molecules can influence antitumorimmune responses (41–43). Consistent with this, theexpression of MHCI and/or MHCII molecules on tumorcells has been repeatedly shown to impact prognosis (44–46). Thus, our data raise the possibility that in addition totargeting the mitogenic and survival signals emanatingfrom the EGFR, EGFRIs may influence the immuneresponse to tumor cells by altering the expression of MHCIand/or MHCII molecules. We found that EGFRIs augmen-ted the induction of MHCI and MHCII molecules in A431cells and SQCC/Y1 cells, which were derived from a vulvarcarcinoma and buccal carcinoma, respectively. However,we saw no effect of EGFR inhibition on the induction ofMHCI and/or MHCII molecules in 2 colon carcinoma celllines (WiDR and HCT116), 1 melanoma cell line (A375),and a cell line derived from a nodal metastasis of alaryngeal carcinoma (886LN). This is despite the fact thatHCT116, A375, WiDR, and 886LN cells respond to IFN-g(with regard to the induction of MHCI and/or MHCIImolecules) and have been shown to express the EGFR(21, 47–49). Thus, under our experimental conditions,not all tumor cell lines are sensitive to the effects of EGFRinhibition, as it relates to the altered expression of MHCIand/or MHCII molecules.
The direct modulation of MHC expression that we havefound complements the work of others and broadens ourunderstanding of how EGFRIs may affect immune/inflam-matory responses. Although an increase in MHCI andMHCII molecules may be potentially advantageous insome settings, it may be problematic in others. Indeed, arecent report describes 2 single lung transplant recipients
IFN-γ receptorcomplex EGFR
Release of EGFR ligands Blockingantibody
Marimastat
Tyrosinekinase
inhibitor
CIITA promoter
CIITA
Basaltranscription
factors
MHC class I and II promoters
Altered MHC expression
Altered immune/inflammatory responses
Figure 5. Model of EGFR signaling as it relates to MHC expression. Inresponse to cytokines such as IFN-g , EGFR ligands are released through aprotease-dependent mechanism that can be blocked by proteaseinhibitors such as marimastat. The EGFR ligands cross-activate the EGFRand downstream signaling pathways which have a repressive effect on theexpression of CIITA, MHCI, and MHCII genes. Repressive signalsemanating from the activation of the EGFRmay influence the expression ofthe IFN-g receptor complex, the promoter of CIITA, CIITA posttranslationalmodifications, and/or the promoters of MHCI and MHCII genes. The netresult of which is attenuation of CIITA and MHC molecule expression. Inresponse to protease inhibitors, EGFR TKIs, or EGFR ligand-blockingantibodies, the expression of CIITA, MHCI, and/or MHCII genes isderepressed. This leads to an increase in cell surface MHC proteinexpression and the potential alteration of immune/inflammatoryresponses.
Figure 4. Microscopic and immunohistochemical features of patient skin biopsies before and during therapy with an EGFR inhibitor. Biopsy sectionswere stained with H&E (top row), MHCI antibodies (clone EMR8-5; middle row), and MHCII antibodies (clone KUL/05; bottom row). Scale bars represent100 mm. A, arm biopsies (no clinical inflammation) from patient 1 show a slight increase in dermal mononuclear cells (top right, black arrows). In addition, anincrease in epidermal MHCI protein expression (visualized as brown colored staining) is seen during EGFR therapy versus before therapy (middle, left vs.right; black arrows). MHCII expression (bottom, brown colored staining) on epidermal LCs (black arrows) is visualized before and during EGFR inhibitortherapy. B, chest biopsies from patient 3 reveal an altered stratum corneum (top right; gray arrow), the presence of apoptotic keratinocytes (top right;white arrow), and an increase in dermal mononuclear cells (top right; black arrows). There is more intense MHCI staining during therapy (middle, left vs. right).MHCII staining reveals some MHCII-positive epidermal keratinocytes (Kc; bottom right and insert therein). MHCII-positive LCs are present before andduring therapy. C, chest biopsies from patient 4 reveal no histopathologic changes (top row, left vs. right). There is an increase in epidermal MHCI staining(middle row, left vs. right). MHCII-positive LCs are present before and during therapy. D, chest biopsies from patient 5 reveal an increase in dermalmononuclear cells (gray arrow) and lymphocytes (black arrows). There is an increase in epidermal MHCI staining (middle, left vs. right). MHCII-positive LCs arepresent before and during therapy.
EGFR Inhibitors Augment MHC Genes
www.aacrjournals.org Clin Cancer Res; 17(13) July 1, 2011 4411
Research. on June 10, 2018. © 2011 American Association for Cancerclincancerres.aacrjournals.org Downloaded from
Published OnlineFirst May 17, 2011; DOI: 10.1158/1078-0432.CCR-10-3283
who received cetuximab formetastatic cutaneous SSC. Bothpatients developed rapidly fatal diffuse alveolar damageresembling acute clinical rejection of the transplanted lung(5). Additional work is needed to define how EGFRIsmodulate MHC expression and how this in turn impactsimmune responses in vivo. This information will be helpfulto best define how to utilize medications that target theEGFR.
Disclosure of Potential Conflicts of Interest
No potential conflicts of interest were disclosed.
Acknowledgments
The authors thank Robert A. Swerlick, Kellie White, James C. Zimring,Jack L. Arbiser, Carlos S. Moreno, Daniel J. Brat, JeremyM. Boss, and Aron E.
Luckacher for their comments and scientific input; Justine Liepkalns, JaradWilson, Christopher Gilson, andDianne Alexis for their technical assistance;and Mike Bloomfield and the Winship Cancer Institute infusion center forproviding the therapeutic antibodies. They also thank Lee Cooper, CandaceChisolm, and Yuna Park for their assistance with whole slide scanning andthe quantification of immunohistochemical staining.
Grant Support
This work was supported by a Kennedy Seed grant from the WinshipCancer Institute (to B.P. Pollack), a research grant from the Melanoma andSkin Cancer Fund from the Winship Cancer Institute (to B.P. Pollack), and aDermatopathology Research grant from the Dermatology Foundation (to B.P.Pollack).
The costs of publication of this article were defrayed in part by thepayment of page charges. This article must therefore be hereby markedadvertisement in accordance with 18 U.S.C. Section 1734 solely to indicatethis fact.
Received December 10, 2010; revised April 29, 2011; accepted May 3,2011; published OnlineFirst May 17, 2011.
References1. Okamoto I. Epidermal growth factor receptor in relation to tumor
development: EGFR-targeted anticancer therapy. FEBS J 2010;277:309–15.
2. Vivanco I, Mellinghoff IK. Epidermal growth factor receptor inhibitorsin oncology. Curr Opin Oncol 2010;22:573–8.
3. Li T, Perez-Soler R. Skin toxicities associated with epidermal growthfactor receptor inhibitors. Target Oncol 2009;4:107–19.
4. Zorzou MP, Stratigos A, Efstathiou E, Bamias A. Exacerbation ofpsoriasis after treatment with an EGFR tyrosine kinase inhibitor. ActaDerm Venereol 2004;84:308–9.
5. Leard LE, Cho BK, Jones KD, Hays SR, Tope WD, Golden JA. Fataldiffuse alveolar damage in two lung transplant patients treated withcetuximab. J Heart Lung Transplant 2007;26:1340–4.
6. Perez-Soler R, Saltz L. Cutaneous adverse effects with HER1/EGFR-targeted agents: is there a silver lining? J Clin Oncol 2005;23:5235–46.
7. Guttman-Yassky E, Mita A, De Jonge M, Matthews L, McCarthy S,Iwata KK. Characterisation of the cutaneous pathology in non-smallcell lung cancer (NSCLC) patients treated with the EGFR tyrosinekinase inhibitor erlotinib. Eur J Cancer 2010;46:2010–9.
8. Steimle V, Otten LA, Zufferey M, Mach B. Complementation cloning ofan MHC class II transactivator mutated in hereditary MHC class IIdeficiency (or bare lymphocyte syndrome). Cell 1993;75:135–46.
9. Martin BK, Chin KC, Olsen JC, Skinner CA, Dey A, Ozato K, Ting JP.Induction of MHC class I expression by theMHC class II transactivatorCIITA. Immunity 1997;6:591–600.
10. Pollack BP, Sapkota B, Boss JM. Ultraviolet radiation-induced tran-scription is associated with gene-specific histone acetylation. Photo-chem Photobiol 2009;85:652–62.
11. Pollack BP, Sapkota B, Haun PL. Activating transcription factor 3(ATF3) expression is increased in erythema multiforme and is regu-lated by IFN-gamma in human keratinocytes. Exp Dermatol 2010;19:e310–3.
12. Burova E, Vassilenko K, Dorosh V, Gonchar I, Nikolsky N. Interferongamma-dependent transactivation of epidermal growth factor recep-tor. FEBS Lett 2007;581:1475–80.
13. Mascia F, Mariani V, Girolomoni G, Pastore S. Blockade of the EGFreceptor induces a deranged chemokine expression in keratinocytesleading to enhanced skin inflammation. Am J Pathol 2003;163:303–12.
14. Mitra RS, Nickoloff BJ. Epidermal growth factor and transforminggrowth factor-alpha decrease gamma interferon receptors and induc-tion of intercellular adhesion molecule (ICAM-1) on cultured kerati-nocytes. J Cell Physiol 1992;150:264–8.
15. Mach B. MHC class II regulation–lessons from a disease. N Engl JMed 1995;332:120–2.
16. Boss JM. Regulation of transcription of MHC class II genes. Curr OpinImmunol 1997;9:107–13.
17. Morris AC, Beresford GW, Mooney MR, Boss JM. Kinetics of agamma interferon response: expression and assembly of CIITApromoter IV and inhibition by methylation. Mol Cell Biol 2002;22:4781–91.
18. Fry DW, Bridges AJ, Denny WA, Doherty A, Greis KD, Hicks JL, et al.Specific, irreversible inactivation of the epidermal growth factor recep-tor and erbB2, by a new class of tyrosine kinase inhibitor. Proc NatlAcad Sci U S A 1998;95:12022–7.
19. Yao Y, Wolverton JE, Zhang Q, Marathe GK, Al-Hassani M, KongerRL. Ultraviolet B radiation generated platelet-activating factor recep-tor agonist formation involves EGF-R-mediated reactive oxygen spe-cies. J Immunol 2009;182:2842–8.
20. Ahmed K, Al-Matrouk KA, Martinez G, Oishi K, Rotimi VO, Nagatake T.Increased serum levels of interferon-gamma and interleukin-12 duringhuman brucellosis. Am J Trop Med Hyg 1999;61:425–7.
21. Zhang X, Zhang H, Tighiouart M, Lee JE, Shin HJ, Khuri FR. Syner-gistic inhibition of head and neck tumor growth by green tea (-)-epi-gallocatechin-3-gallate and EGFR tyrosine kinase inhibitor. Int JCancer 2008;123:1005–14.
22. Quadros MR, Peruzzi F, Kari C, Rodeck U. Complex regulation ofsignal transducers and activators of transcription 3 activationin normal and malignant keratinocytes. Cancer Res 2004;64:3934–9.
23. Lewis DA, Hengeltraub SF, Gao FC, Leivant MA, Spandau DF.Aberrant NF-kappaB activity in HaCaT cells alters their response toUVB signaling. J Invest Dermatol 2006;126:1885–92.
24. Meissner TB, Li A, Biswas A, Lee KH, Liu YJ, Bayir E. NLR familymember NLRC5 is a transcriptional regulator of MHC class I genes.Proc Natl Acad Sci U S A 2010;107:13794–9.
25. Gielen V, Schmitt D, Thivolet J. HLA class I antigen (heavy and lightchain) expression by Langerhans cells and keratinocytes of the normalhuman epidermis: ultrastructural quantitation using immunogoldlabelling procedure. Arch Dermatol Res 1988;280:131–6.
26. Tsukahara T, Kawaguchi S, Torigoe T, Asanuma H, Nakazawa E,Shimozawa K, et al. Prognostic significance of HLA class I expressionin osteosarcoma defined by anti-pan HLA class I monoclonal anti-body, EMR8–5. Cancer Sci 2006;97:1374–80.
27. Gorgun J, Portyanko A, Marakhouski Y, Cherstvoy E. Tissue trans-glutaminase expression in celiac mucosa: an immunohistochemicalstudy. Virchows Arch 2009;455:363–73.
28. Giacomini P, Tecce R, Nicotra MR, Cohen BB, Mazzilli MC, Natali PG.mAb KUL/05 identifies a denaturation-resistant determinant sharedby class II MHC products DR, DQ and DP. J Immunogenet1989;16:203–16.
Pollack et al.
Clin Cancer Res; 17(13) July 1, 2011 Clinical Cancer Research4412
Research. on June 10, 2018. © 2011 American Association for Cancerclincancerres.aacrjournals.org Downloaded from
Published OnlineFirst May 17, 2011; DOI: 10.1158/1078-0432.CCR-10-3283
29. Abrams JR, Kelley SL, Hayes E, Kikuchi T, Brown MJ, Kang S, et al.Blockade of T lymphocyte costimulation with cytotoxic T lymphocyte-associated antigen 4-immunoglobulin (CTLA4Ig) reverses the cellularpathologyof psoriatic plaques, including the activation of keratinocytes,dendritic cells, and endothelial cells. J Exp Med 2000;192:681–94.
30. Li G, Harton JA, Zhu X, Ting JP. Downregulation of CIITA function byprotein kinase a (PKA)-mediated phosphorylation: mechanism ofprostaglandin E, cyclic AMP, and PKA inhibition of class II majorhistocompatibility complex expression in monocytic lines. Mol CellBiol 2001;21:4626–35.
31. Pivarcsi A, Muller A, Hippe A, Rieker J, van Lierop A, Steinhoff M, et al.Tumor immune escape by the loss of homeostatic chemokine expres-sion. Proc Natl Acad Sci U S A 2007;104:19055–60.
32. Yang H, Kim SK, Kim M, Reche PA, Morehead TJ, Damon IK, et al.Antiviral chemotherapy facilitates control of poxvirus infectionsthrough inhibition of cellular signal transduction. J Clin Invest 2005;115:379–87.
33. Gonzalez PA, Carreno LJ, Coombs D, Mora JE, Palmieri E, GoldsteinB, et al. T cell receptor binding kinetics required for T cell activationdepend on the density of cognate ligand on the antigen-presentingcell. Proc Natl Acad Sci U S A 2005;102:4824–9.
34. Leignadier J, Labrecque N. Epitope density influences CD8þmemoryT cell differentiation. PLoS One 2010;5:e13740.
35. Roberts RB, Arteaga CL, Threadgill DW. Modeling the cancer patientwith genetically engineeredmice: prediction of toxicity frommolecule-targeted therapies. Cancer Cell 2004;5:115–20.
36. Billingham RE, Silvers WK. A biologist's reflections on dermatology.J Invest Dermatol 1971;57:227–40.
37. Paus R, Christoph T, Muller-Rover S. Immunology of the hair follicle: ashort journey into terra incognita. J Investig Dermatol Symp Proc1999;4:226–34.
38. Paus R, Ito N, TakigawaM, Ito T. The hair follicle and immune privilege.J Investig Dermatol Symp Proc 2003;8:188–94.
39. Paus R, Nickoloff BJ, Ito T. A ‘hairy’ privilege. Trends Immunol 2005;26:32–40.
40. Ito T, Ito N, Bettermann A, Tokura Y, Takigawa M, Paus R. Collapseand restoration of MHC class-I-dependent immune privilege:exploiting the human hair follicle as a model. Am J Pathol 2004;64:623–34.
41. Mortara L, Castellani P, Meazza R, Tosi G, De Lerma Barbaro A,Procopio FA, et al. CIITA-induced MHC class II expression in mam-mary adenocarcinoma leads to a Th1 polarization of the tumormicroenvironment, tumor rejection, and specific antitumor memory.Clin Cancer Res 2006;2:3435–43.
42. Lotem M, Machlenkin A, Hamburger T, Nissan A, Kadouri L, Franken-burg S, et al. Autologous melanoma vaccine induces antitumor andself-reactive immune responses that affect patient survival anddepend on MHC class II expression on vaccine cells. Clin CancerRes 2009;15:4968–77.
43. Burns WR, Zhao Y, Frankel TL, Hinrichs CS, Zheng Z, Xu H, et al. Ahigh molecular weight melanoma-associated antigen-specific chi-meric antigen receptor redirects lymphocytes to target human mel-anomas. Cancer Res 2010;70:3027–33.
44. Simpson JA, Al-Attar A, Watson NF, Scholefield JH, Ilyas M, DurrantLG. Intratumoral T cell infiltration, MHC class I and STAT1 as bio-markers of good prognosis in colorectal cancer. Gut 2010;59:926–33.
45. Walsh MD, Dent OF, Young JP, Wright CM, Barker MA, Leggett BA,et al. HLA-DR expression is associated with better prognosis insporadic Australian clinicopathological Stage C colorectal cancers.Int J Cancer 2009;125:1231–7.
46. Mizukami Y, Kono K, Maruyama T, Watanabe M, Kawaguchi Y,Kamimura K, et al. Downregulation of HLA Class I molecules in thetumour is associated with a poor prognosis in patients with oeso-phageal squamous cell carcinoma. Br J Cancer 2008;99:1462–7.
47. Xu H, Yu Y, Marciniak D, Rishi AK, Sarkar FH, Kucuk O, et al.Epidermal growth factor receptor (EGFR)-related protein inhibits mul-tiple members of the EGFR family in colon and breast cancer cells. MolCancer Ther 2005;4:435–42.
48. Mirmohammadsadegh A, Hassan M, Gustrau A, Doroudi R, Schmitt-ner N, Nambiar S, et al. Constitutive expression of epidermal growthfactor receptors on normal human melanocytes. J Invest Dermatol2005;125:392–4.
49. Koizumi F, Kanzawa F, Ueda Y, Koh Y, Tsukiyama S, Taguchi F, et al.Synergistic interaction between the EGFR tyrosine kinase inhibitorgefitinib ("Iressa") and the DNA topoisomerase I inhibitor CPT-11(irinotecan) in human colorectal cancer cells. Int J Cancer 2004;108:464–72.
EGFR Inhibitors Augment MHC Genes
www.aacrjournals.org Clin Cancer Res; 17(13) July 1, 2011 4413
Research. on June 10, 2018. © 2011 American Association for Cancerclincancerres.aacrjournals.org Downloaded from
Published OnlineFirst May 17, 2011; DOI: 10.1158/1078-0432.CCR-10-3283
2011;17:4400-4413. Published OnlineFirst May 17, 2011.Clin Cancer Res Brian P. Pollack, Bishu Sapkota and Todd V. Cartee Expression of MHC Class I and II GenesEpidermal Growth Factor Receptor Inhibition Augments the
Updated version
10.1158/1078-0432.CCR-10-3283doi:
Access the most recent version of this article at:
Material
Supplementary
http://clincancerres.aacrjournals.org/content/suppl/2011/05/17/1078-0432.CCR-10-3283.DC1Access the most recent supplemental material at:
Cited articles
http://clincancerres.aacrjournals.org/content/17/13/4400.full#ref-list-1
This article cites 49 articles, 15 of which you can access for free at:
Citing articles
http://clincancerres.aacrjournals.org/content/17/13/4400.full#related-urls
This article has been cited by 5 HighWire-hosted articles. Access the articles at:
E-mail alerts related to this article or journal.Sign up to receive free email-alerts
SubscriptionsReprints and
To order reprints of this article or to subscribe to the journal, contact the AACR Publications
Permissions
Rightslink site. (CCC)Click on "Request Permissions" which will take you to the Copyright Clearance Center's
.http://clincancerres.aacrjournals.org/content/17/13/4400To request permission to re-use all or part of this article, use this link
Research. on June 10, 2018. © 2011 American Association for Cancerclincancerres.aacrjournals.org Downloaded from
Published OnlineFirst May 17, 2011; DOI: 10.1158/1078-0432.CCR-10-3283