Embed Size (px)
Citation preview
Equilibrium Effects of Pharmaceutical Bundling: Evidence from India∗
Shengmao Cao† Chirantan Chatterjee‡
January 6, 2022
Click here for the latest version
Abstract
We study the equilibrium effects of competitive bundling on market outcomes and so-cial welfare in the context of the Indian pharmaceutical industry. Fixed-dose combinations(FDCs), which bundle two or more drugs in a single pill, account for over 50% of pharma-ceutical revenue in India. Using an equilibrium model of drug demand and supply, we showthat the price and welfare effects of FDCs are theoretically ambiguous. Empirically, we findthat FDCs on average sell at a 28% discount but increase standalone component prices by3%. New FDCs significantly increase sales of drug bundles. To quantify the welfare effectsof FDCs, we estimate the model in the market for Alzheimer’s drugs. We find that FDCsincrease consumer surplus by 21% and firm profits by 13% because of significant marketexpansion and cost savings. Counterfactual analysis shows that applying FDC regulationsfrom the US to India could deter FDC entry and forestall potential welfare benefits.
∗Cao would like to thank Liran Einav, Jose Ignacio Cuesta, and Matthew Gentzkow for their invaluable mentorship andadvice. We thank Luis Armona, Jie Bai, Panle Jia Barwick, Eran Bendavid, Yue Cao, Mark Duggan, Wesley Hartmann,Han Hong, Caroline Hoxby, Neale Mahoney, Paulo Somaini, Shoshana Vasserman, Melanie Wallskog, Jingyuan Wang,Heidi Williams, Jianwei Xing, Xuejie Yi, Chuan Yu, Ali Yurukoglu, and seminar participants at the Stanford IO workshopfor helpful comments. We also thank Varun Gupta and Anuj Saini from Tata 1mg for generous data sharing and helpfulconversations on the Indian pharmaceutical industry. Sujata Prabhu and Mayank Aggarwal provided generous datasupport. We gratefully acknowledge financial support from the Stanford Institute for Economic Policy Research (SIEPR),the SIEPR Program in Regulatory Policy Fellowship, the Leonard W. Ely and Shirley R. Ely Graduate Student Fellowship,and the ICICI Bank Chair 2018-2021 at IIM Ahmedabad. All errors are our own.
†Ph.D. Candidate, Department of Economics, Stanford University. Email: [email protected]‡Reader in Economics of Innovation, University of Sussex Business School. Email: [email protected]
1 Introduction
Competitive bundling is a phenomenon whereby competing multiproduct firms sell a package of prod-
ucts at a discount. Examples include TV–internet–phone bundles, connecting flights, home and auto
insurance, fast-food value meals, and so on. Theoretically, bundle discounts could make markets more
competitive, but bundling may also hurt some consumers through price discrimination or choice dis-
tortions. Despite the prevalence of competitive bundling, there is limited empirical evidence on its
equilibrium effects on market outcomes and social welfare.
In this paper, we study competitive bundling in the context of the Indian pharmaceutical indus-
try. Pharmaceutical companies implement competitive bundling with fixed-dose combinations (FDCs),
which combine two or more drugs in a single pill. In India, FDCs are de facto unregulated, and they
account for over 50% of total pharmaceutical revenue. The industry also resembles a typical product
market, where most consumers pay for goods out of pocket and patent protection is uncommon. We
thus have a rich and tractable setting from which to gain general insights into the economics of com-
petitive bundling. In addition, many countries such as the US require costly, large-scale clinical trials
to support new FDCs. Lessons from FDCs in India could also help inform policy discussions on FDC
regulations.1
Our analysis consists of three main parts. We begin with a model of drug demand and supply to
highlight key market forces that shape the equilibrium effects of FDCs. We then provide model-free
evidence on the effects of FDCs on drug prices and sales, leveraging rich variation from FDCs in a wide
range of therapeutic markets. Finally, we focus on the market for Alzheimer’s drugs and estimate the
model to characterize the welfare implications of FDCs and FDC regulations. Our results show that
FDCs could potentially benefit both consumers and firms because of procompetitive effects and cost
savings, though the welfare effects may be reversed under certain market conditions. Counterfactual
analysis suggests that uniformly strict FDC regulations may deter FDC entries and forestall potential
welfare benefits.
To develop intuition on the potential equilibrium effects of FDCs, we first consider a model of drug
demand and supply with two drugs and an FDC that bundles both. On the demand side, consumers
have five types of drug choices: the outside option, a product of either drug, a bundle of the two drugs
purchased separately, or an FDC product. Within each type, there are different drug bundles offered by
different firms. An FDC is equivalent to a two-drug bundle from the same firm, except that it has its
own price and that consumers may prefer the FDC for reasons such as convenience or mistaken beliefs
on product varieties. We allow heterogeneity in consumers’ drug preferences and firm preferences and
1Policy debates on regulating FDCs have focused mostly on their potential health impacts. In particular, manydiscussions focus on the trade-off between improved medication adherence and the risks to patients from unneeded FDCprescriptions and overtreatment (World Health Organization, 2005; Evans and Pollock, 2015; Vendoti, 2018). The potentialequilibrium effects of pharmaceutical bundling have rarely been considered, in part due to the lack of empirical evidence.
1
in the (dys)synergy from taking both drugs. Such preference heterogeneity determines the types of
consumers that FDCs attract. On the supply side, firms set prices to maximize profits under Nash–
Bertrand competition. The marginal cost of an FDC may be different from the sum of its components’
costs.
Our model provides intuition for key market features that determine the price and welfare effects
of FDCs. First, FDCs may sell at a premium due to FDC preferences or at a discount because of cost
savings or price discrimination. The price discrimination incentive diminishes when consumers tend
to buy both drugs from the same firm anyway. Second, FDCs have ambiguous effects on standalone
component prices. Competition from FDCs pushes component prices down, but firms that sell FDCs
tend to increase component prices to steer consumers towards their FDCs. Finally, the welfare effects of
FDC discounts depend on the net outcome of two countervailing forces: a market expansion effect and
a cannibalization effect. FDC discounts usually increase social surplus when they increase drug sales
but may reduce allocative efficiency when they divert consumer choices from other two-drug bundles.2
With this theoretical intuition in mind, we turn to our empirical setting to measure the effects of
FDCs on market outcomes and social welfare. Our primary data set covers monthly prices and sales of
all main drugs sold in India between April 2007 and December 2019.3 We also leverage three ancillary
data sets. The first contains information on coprescriptions, where we observe the monthly prescription
count of each drug and the coprescription count of each pair of drugs. The second contains transaction-
level data from one of the leading e-pharmacy platforms in India. The third is the Medicare Part D
Prescription Drug Event data from the US, which allow us to observe patterns of drug choices in a
setting in which most FDCs are absent.
We begin with a descriptive analysis of the effects of FDCs on drug prices and sales. First, we show
that FDCs on average sell at a 28% discount relative to the sum of their components’ prices. Using drug
coprescription rates in the US as a proxy for counterfactual coprescription rates in India in the absence
of FDCs, we show that the FDC discount is indeed smaller when consumers tend to buy the drug bundle
anyway.4 A 10% increase in the coprescription rate is associated with a 2.8% smaller discount among
two-molecule FDCs.
Second, we measure the effects of FDCs on the prices of their component molecules. Using an event
study framework, we find that entries of FDCs on average increased prices of their component molecules
by around 3% relative to prices of other molecules. Using cross-sectional variation in drug prices, we
2Part of the market expansion effect could also be driven by FDC preferences. The welfare effects of such marketexpansion depend on whether the FDC preferences capture convenience benefits or mistaken beliefs on product varieties.
3Manufacturers set drug prices at the national level, and we observe drug sales for 23 regions of India. Our mainempirical analysis is done at the national level.
4The coprescription rate is a number between 0 and 1 that measures consumers’ propensity to take two drugs together.A coprescription rate of 0 means no consumer is prescribed the two drugs together, while a coprescription rate of 1 meansall consumers who are prescribed a drug are also prescribed the other drug.
2
show that firms that sells FDCs of a molecule indeed set a 7% higher price for that molecule compared
to firms that do not sell the FDCs. Taken together, our results suggest that the price effects of FDCs
significantly benefit consumers who need the full bundle of drugs but on average harm consumers who
need just one component. Consistent with our theoretical intuition, the price effects depend on factors
such as drug coprescription rates and firms’ product portfolios.
Third, we measure the market expansion and cannibalization effects of 81 new two-molecule FDCs.
We find that the median new FDC increased the total coprescription rate of its components by 189%
and reduced the non-FDC coprescription rate by 25%.5 A strong market expansion effect and a modest
cannibalization effect imply potentially large welfare gains from many FDCs, though the welfare effects
still depend on whether the market expansion is driven by FDC discounts or potentially distortionary
FDC preferences.
Next, we focus on the market for Alzheimer’s drugs and estimate the model to quantify the welfare
effects of FDCs and FDC regulations. We choose this market because it is important for the well-being
of the elderly and because it offers a tractable setting with two main drugs and one FDC. We define
the national market in a quarter as one market and focus on donepezil and memantine, which account
for over 95% of Alzheimer’s drug sales in India. FDC products of the two drugs were first introduced
in 2008 and on average sell at a 25% discount. The efficacy of the FDC has been well established by
the medical literature (Tariot et al., 2004), and the FDC was approved in the US in 2015.
We combine aggregate moments with consumer-level data to identify key market features that
determine the equilibrium effects of FDCs. First, we estimate price elasticities by using a price control
policy that led to a sharp price reduction in a subset of drug products in 2016. Second, we use the
coprescription data to directly measure the fraction of consumers who buy both drugs before and after
FDC entry. Demand for FDCs that is not explained by the FDC discount reveals the size of consumer
FDC preferences. Finally, we use panel data on repeated drug purchases by individual consumers on
the e-pharmacy platform to identify the remaining time-invariant components of consumer preferences.
For example, the drug purchase histories of consumers who switch to a new FDC product provide
information on the types of consumers that FDCs attract. On the supply side, the residual FDC
discounts after firms’ strategic pricing incentives are accounted for reveal the cost savings from FDCs.
Our estimates shed light on several market features that are key to the welfare effects of FDCs.
First, the marginal costs of FDC products are on average 23% lower than the sum of their components’
costs. The cost savings are potentially due to streamlined production, storage, and distribution (World
Health Organization, 2005), and they explain around half of the FDC discount. Second, we find a strong
market expansion effect and a modest cannibalization effect: 33% of FDC consumers substitute from
5The total coprescription rate between two drugs measures the fraction of consumers who take them together, eitherseparately or as an FDC. The non-FDC coprescription rate measures the fraction of consumers who take the two drugsseparately.
3
the outside option, 49% from a single drug product, and only 18% from other two-drug bundles. This
result highlights that FDC discounts could play a pivotal role in helping patients afford the treatment
that they prefer when consumers are uninsured and drug prices are high relative to income. Finally,
consumers’ FDC preferences are on average negligible: the market expansion effect of FDCs can be
entirely explained by FDC discounts and additional product variety from firms that did not sell both
components before introducing the FDCs.
We use the model to quantify the welfare effects of FDCs for consumers and firms. We find that
FDCs increase consumer surplus by 21%. FDC discounts and additional product variety explain two-
thirds and one-third of the gains, respectively. On the firm side, FDCs increase producer surplus by 13%
because of significant market expansion and cost savings. These results, though specific to the market
for Alzheimer’s drugs, show that FDCs could potentially benefit both consumers and firms. We also
show that the welfare effects of FDCs may be reversed under different market conditions. For example,
FDCs may lead to overtreatment and reduce consumer surplus when there are strong, distortionary
FDC preferences. Firms may face a prisoner’s dilemma and lose profits when the cannibalization effects
of FDCs dominate the market expansion effects.
Finally, we simulate the effects of applying various FDC regulations from the US to India. In
the US, firms run clinical trials to support new FDCs and are granted patent protection for approved
FDCs. We find that giving an FDC patent to one firm would increase its FDC price by less than 2%.
Competition from component molecules is largely effective in disciplining the pricing of an FDC by a
monopolist. Such competition, however, also limits the expected profit gains from the FDC. For all
firms, the expected profit gains from the FDC over the length of patent protection fall short of the
estimated clinical trial costs for new drug approvals in the US (Moore et al., 2020). Our results suggest
that uniformly strict FDC regulations may deter entries of medically sound FDCs and forestall potential
welfare benefits.
Our paper relates to several distinct literatures. There is a large medical literature on the clinical
benefits and risks of FDCs. Many clinical studies show that FDCs significantly improve medication
adherence (see Bangalore et al. (2007) and Du et al. (2018) for detailed meta-analyses), which may lead
to better clinical outcomes and patient satisfaction (Thom et al., 2013; Verma et al., 2018). However,
several other studies document overuse of FDCs when a single drug is the recommended first-line
treatment (Gadzhanova et al., 2013; Evans and Pollock, 2015; Ahmad et al., 2016; Bortone et al., 2021).
Our study highlights that FDCs’ equilibrium effects on drug prices and sales, which have received little
focus in the medical literature or policy debates, could have significant welfare consequences.
Our study is grounded in the theory literature on competitive bundling. Most studies in this
literature focus on a stylized two-firm two-product case (Matutes and Regibeau, 1992; Anderson and
Leruth, 1993; Thanassoulis, 2007; Armstrong and Vickers, 2010; Hurkens et al., 2019). One exception
4
is Zhou (2021), which studies a setting similar to ours in oligopoly markets. We consider a richer
setting where we allow product complementarity, market expansion effects, and asymmetry in firms’
product menus and product qualities. Our paper also contributes to a small empirical literature on
bundling, including the works by Chu et al. (2011) on bundle-sized pricing by a theater company,
Crawford and Yurukoglu (2012) on bundling in multichannel television markets, and McManus et al.
(2018) on bundling and steering in the telecommunication industry. Our empirical setting has two novel
features. First, we observe competitive bundling in a large number of quasi-independent therapeutic
markets. Second, in some markets, we directly observe market outcomes before and after FDC entries.
These features allow us to document novel, model-free evidence on the equilibrium effects of competitive
bundling under various market conditions.
We also contribute to a small literature on the modeling of demand and supply when consumers
can choose a bundle of products. Examples of earlier studies include Gentzkow (2007) on print and
online newspapers, Berry and Haile (2014) on video and broadband services and Song et al. (2017) on
cancer drugs. We apply the framework in a setting of competitive bundling and develop an empirical
strategy to estimate the model without observing the market share of each individual product bundle.
In addition, identification in most earlier studies relies on variation in prices and choice sets between
different markets. Our identification strategy relies on micromoments of consumer choices. Our strategy
provides an alternative way to estimate the model when variation in choice sets across markets is
insufficient or likely endogenous.
Finally, our paper relates to a number of empirical studies on the Indian pharmaceutical industry.
Earlier studies have examined patent policy (Chaudhuri et al., 2006; Dutta, 2011; Duggan et al., 2016),
price controls (Mohapatra and Chatterjee, 2016; Dean, 2019), and drug quality (Bennett and Yin, 2019).
Interestingly, some of these studies have focused on single-molecule medicines. Our paper complements
them by focusing on FDCs. Since FDCs account for over half of pharmaceutical revenue in India, we
believe that understanding the role of FDCs is an important step forward for policy analysis in the
Indian pharmaceutical industry.
The rest of this paper is organized as follows. Section 2 describes the setting. In Section 3, we
develop a model of drug demand and supply to provide intuition for the potential equilibrium effects
of FDCs. Section 4 introduces the data for our empirical analysis. Section 5 documents model-free
evidence on the effects of FDCs on drug prices and sales. In Section 6, we estimate the model and
quantify the welfare effects of FDCs in the market for Alzheimer’s drugs. Section 7 concludes.
5
2 Background
2.1 Fixed-Dose Combinations (FDCs)
Medical treatment for many diseases involves more than a single drug. Some treatments combine
drugs that target the same disease with different action mechanisms, while others include a secondary
component to enhance the efficacy of the main drug. Compared to single-drug treatment, combination
therapy may improve treatment response, reduce risks of drug resistance, or lower the incidence of
adverse drug reactions (U.S. Food and Drug Administration, 2013). Combination therapy has become
the standard of care for many diseases, including human immunodeficiency virus (HIV), tuberculosis,
cardiovascular diseases, type 2 diabetes, and various types of cancer.
FDCs simplify combination therapy by combining multiple drugs into a single pill. A lower pill
burden leads to better medication adherence (Bangalore et al., 2007), which in turn improves clinical
outcomes and patient satisfaction (Thom et al., 2013; Verma et al., 2018). FDCs also simplify the
logistics of drug distribution and improve the reliability of drug supply (World Health Organization,
2005). Today, FDCs are commonly used for treatment of many diseases, especially chronic care. FDCs
constitute 52 out of 588 drugs in the 21st World Health Organization List of Essential Medicines (World
Health Organization, 2019).
There are, however, some concerns about unjustified uses of FDCs. Some combinations may have
adverse drug-drug interactions that compromise therapeutic efficacy. In addition, some FDCs may
include redundant component(s) that lead to overtreatment and encourage imprecise diagnosis. An
example is the frequent use in many countries of antibiotic FDCs when only one component is needed
(Bortone et al., 2021).
2.2 FDC Regulation
In light of the potential benefits and risks of FDCs, different countries have taken different approaches
to FDC regulation. Regulation is strict in most high-income countries but tends to be lax in low- and
middle-income countries.
For example, in India, our primary empirical setting of interest, firms have been de facto free to
introduce FDCs without much government oversight. In principle, to introduce a new FDC in India,
firms need approval from the Central Drugs Standard Control Organization (CDSCO). In practice,
enforcement of the regulation has been lax: out of over 6,000 FDCs sold in India in 2018, only 1,292
have been approved by the CDSCO (Vendoti, 2018). With growing public concerns over unjustified
uses of FDCs, the Indian government issued a ban on 344 FDCs in 2016 based on recommendations by
an expert committee. The scale of the ban was small: banned products accounted for around 2% of
FDC revenue in 2015.
6
In contrast, the standard for approving new FDCs is significantly higher in the US. To introduce
a new FDC in the US, the sponsor needs to provide evidence that the proposed FDC satisfies the
“combination rule” (21 CFR 300.50). This rule states that i) each component must make a contribution
to the claimed effects and that ii) the dosage of each component (amount, frequency, duration) is such
that the combination is safe and effective for the intended patient population. Achieving compliance
with the combination rule is a costly and time-consuming process. The sponsor needs to run laboratory
and clinical studies to assess drug-drug interactions, document side effects, and determine appropriate
doses of each component. In most applications, the sponsor also needs to implement at least one large-
scale clinical trial with a factorial design to demonstrate the therapeutic contribution of each component
molecule.6 For example, for an FDC that combines molecules A and B, a four-arm clinical trial is usually
required to show that the FDC is superior to each component alone and to the placebo (AB v. A v.
B v. placebo). Such clinical trials usually involve hundreds or thousands of human subjects and could
take years to complete.7
Patent protection is typically granted to the firm that successfully sponsors a new FDC.8 The
patent grants monopoly status for FDC production but does not prevent patients from buying the
components from other firms separately. As a result, compared to patents for new single-molecule
drugs, the monopoly power and expected profit gains from an FDC patent are significantly smaller.
These limited profit gains and high costs of clinical trials may dampen firms’ incentives to invest in new
FDCs. Indeed, these FDC regulations have been consequential: in 2015, FDCs accounted for 50% of
pharmaceutical revenue in India but only 17% among the elderly population in the US.9
2.3 The Indian Pharmaceutical Industry
Our primary empirical setting is the Indian pharmaceutical industry. The industry serves over 1.3 billion
people and is the third largest pharmaceutical sector in the world. India is also the largest exporter of
generic medicines globally, earning it the title “the pharmacy of the world”.
Affordability of essential medicines has been a longstanding policy concern in India. According to
the latest National Sample Survey on healthcare consumption, less than 20% of the population had
6Exemptions are made in cases when it is not feasible or ethical to expose patients to single-drug treatment (e.g.,for HIV drugs). In addition, for combinations whose safety and efficacy have been rigorously established in the scientificliterature, firms that sponsor the FDCs can cite existing results through the 505(b)(2) pathway and be exempted fromconducting their own trials.
7Among 119 FDCs approved in the US since 2000, 79% have gone through a pivotal clinical trial. According to theestimates by Moore et al. (2020), the median cost of a pivotal clinical trial for a new drug application is $19 million. Thecost of a clinical trial for an FDC is likely to be higher because it requires more arms of treatment.
8Around 80% of FDCs approved in the US are awarded patent protection, and the average patent length is 11.3 years.The award rate and patent length are both similar to those of patents for new single-molecule drugs.
9In Appendix Figure A.1, we compare FDC revenue shares between 28 different countries. Overall, FDCs are morecommonly used in low and middle-income countries than in high-income countries where FDC regulations are stricter.These cross-country differences persist after controlling for variation in disease burdens.
7
any form of health insurance as of 2018 (National Sample Survey Office, 2019). Pharmaceutical drugs
account for 51% of out-of-pocket health expenses, and about 7% of households fall below the poverty
line on account of health expenses (Singh et al., 2020).
In its efforts to reduce drug prices, the Indian government has fostered a highly competitive domestic
pharmaceutical industry. The Patents Act of 1970, which disallowed patent protection for pharmaceu-
tical products, fueled the growth of many indigenous pharmaceutical manufacturers and led to intense
competition in generics.10 Today, close to 1,000 firms compete in the Indian pharmaceutical industry,
and generic drugs account for over 85% of pharmaceutical revenue.11
The Indian government also maintains direct price controls on drugs that it considers essential for
public health. The Drug Price Control Order (DPCO) of 2013 sets price ceilings for all drugs included
in the National List of Essential Medicines (NLEM) of India.12 The price ceiling for a drug product is
based on the average price of all products of the same formulation in the prior year. Firms must adjust
prices below the ceiling and can only change prices annually to match inflation in subsequent years.
Today, price controls cover 376 drugs, which account for around 20% of total pharmaceutical revenue.
Most drugs under price control are single-molecule drugs, and only 6% are FDCs.
These market features all point to a potentially important role of FDCs in the Indian pharmaceutical
industry. A well-developed domestic pharmaceutical sector sets the ground for competitive bundling.
The potential price effects of FDCs can be pivotal in helping cash-constrained patients afford the
medicines that they need. On the other hand, firms may use FDCs as a tool to circumvent price
controls, which increases concerns over unjustified uses of FDCs (Bhaskarabhatla et al., 2021).
3 Theoretical Framework
We develop a model of drug demand and supply to provide intuition for the potential equilibrium effects
of FDCs. One main goal of the model is to highlight key market features that determine the price and
welfare effects of pharmaceutical bundling. These market features will be the focus of our empirical
analysis that follows the theoretical framework.
10India started recognizing drug patents in 2005, as stipulated by the Trade-Related Intellectual Property Rights(TRIPS) agreement. Duggan et al. (2016) shows that the impact of the policy change was limited because of the country’srobust domestic pharmaceutical manufacturing sector and compulsory licensing requirements.
11The total number of firms exceed 8,000 if we include all small local manufacturers that are not tracked by our data(Bennett and Yin, 2019).
12The NLEM may be updated from time to time, allowing the set of drugs under price control to change. DPCO 2013was first based on NLEM 2011 and currently applies to drugs listed in NLEM 2015.
8
3.1 Model
Demand Consider an oligopoly market with two drugs, A and B, and an FDC that bundles both.
These may be two drugs that target the same disease (e.g., different antiviral drugs for HIV) or treat
different diseases that occur together (e.g., cough and fever medicines). Each drug can be used alone,
and the two drugs can be used in combination. Patients can implement the combination treatment by
taking the two drugs separately or by using an FDC.
Define a drug product k as a drug j by a firm f , with j ∈ {A,B, FDC}. Each consumer chooses
a bundle of product(s) Br indexed by r. There are five types of drug choices: the empty bundle, one
drug A product, one drug B product, one bundle of the two drugs purchased separately, and one FDC
product. Within each type, there may be different drug bundles offered by different firms.
We define the utility of bundle r for consumer i as:
uir =∑k∈Br
vik + Γiιr −∑k∈Br
pk, (1)
The first component is total value of drug products in the bundle. The second component, where ιr takes
value 1 for two-drug bundles (including FDCs) and 0 otherwise, represents the (dys)synergy between
drugs A and B for consumer i. Γi > 0 indicates complementarity between the two drugs, while Γi < 0
means that the marginal benefit from a drug is lower when consumer i is taking the other drug.13 The
last component is the disutility from paying for the drug bundle.
For drug A or drug B, the value of product k to consumer i is:
vik = δk + νij(k) + νif(k), (2)
which consists of the average product value δk and consumer i’s idiosyncratic preferences for drug
j(k) and firm f(k). We allow vertical quality differences between different products of the same drug,
which reflects the lack of quality assurance in the generic drug markets in many developing countries
(Bate et al., 2011; Bennett and Yin, 2019). Consumer drug preferences, νiA and νiB, depend on each
consumer’s medical conditions. Consumer firm preferences, νif , could form for many reasons. For
example, consumers who value quality more would prefer firms that consistently offer higher-quality
drug products. Consumer preference heterogeneity gives rise to market power and determines the types
of consumers that FDCs would attract.
13For example, drug complementarity is significant when the drugs are perfect complements (e.g., HIV cocktails).Dyssynergy arises when two drugs treat the same disease with similar action mechanisms. For the same disease, patientswith more advanced conditions may need both drugs to achieve some threshold efficacy (Γi > 0), while patients with mildconditions may need only one drug (Γi < 0).
9
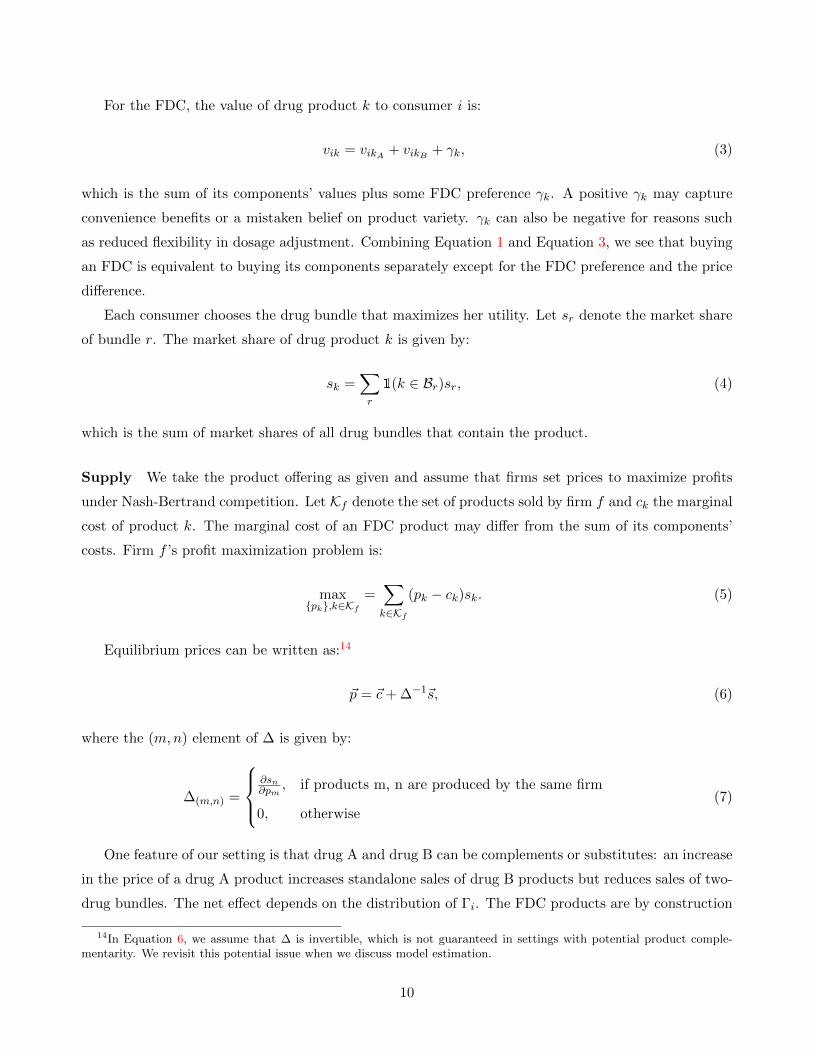
For the FDC, the value of drug product k to consumer i is:
vik = vikA + vikB + γk, (3)
which is the sum of its components’ values plus some FDC preference γk. A positive γk may capture
convenience benefits or a mistaken belief on product variety. γk can also be negative for reasons such
as reduced flexibility in dosage adjustment. Combining Equation 1 and Equation 3, we see that buying
an FDC is equivalent to buying its components separately except for the FDC preference and the price
difference.
Each consumer chooses the drug bundle that maximizes her utility. Let sr denote the market share
of bundle r. The market share of drug product k is given by:
sk =∑r
1(k ∈ Br)sr, (4)
which is the sum of market shares of all drug bundles that contain the product.
Supply We take the product offering as given and assume that firms set prices to maximize profits
under Nash-Bertrand competition. Let Kf denote the set of products sold by firm f and ck the marginal
cost of product k. The marginal cost of an FDC product may differ from the sum of its components’
costs. Firm f ’s profit maximization problem is:
max{pk},k∈Kf
=∑k∈Kf
(pk − ck)sk. (5)
Equilibrium prices can be written as:14
p = c+∆−1s, (6)
where the (m,n) element of ∆ is given by:
∆(m,n) =
∂sn∂pm
, if products m, n are produced by the same firm
0, otherwise(7)
One feature of our setting is that drug A and drug B can be complements or substitutes: an increase
in the price of a drug A product increases standalone sales of drug B products but reduces sales of two-
drug bundles. The net effect depends on the distribution of Γi. The FDC products are by construction
14In Equation 6, we assume that ∆ is invertible, which is not guaranteed in settings with potential product comple-mentarity. We revisit this potential issue when we discuss model estimation.
10
substitutes with drug A and drug B products because of the discrete choice framework.
Discussion Our model is related to the random-utility framework on competitive bundling in Zhou
(2021). Our main theoretical contribution is to incorporate several new features that allow us to more
flexibly characterize the equilibrium effects of competitive bundling. First, we relax the “full market
coverage” assumption that each consumer always chooses both products.15 Second, we incorporate
product complementarity.16 Finally, we allow bundle (FDC) preferences, cost savings from bundling,
and asymmetry in product menus and product qualities between firms. These market features have
important implications for the price and welfare effects of competitive bundling, which we discuss next.
3.2 Equilibrium Effects of FDCs on Prices and Welfare
3.2.1 FDC Pricing
Our model highlights three ways in which the price of an FDC may differ from the sum of its components’
prices. First, FDC preferences may lead to an FDC premium. Second, potential cost savings may lead
to an FDC discount. Third, firms may use FDC discounts to attract consumers to buy both drugs from
them. Zhou (2021) shows that absent bundle preferences or cost savings, firms offer bundle discounts
when consumers’ valuations of the two products are independent, negatively dependent, or limitedly
positively dependent.17 We focus on the size of the FDC discount and its determinants.
To develop intuition for firms’ strategic incentives to offer bundle discounts, we revisit the classic
problem of bundling by a monopolist. Appendix Figure A.2, which replicates Figure III in McAfee et
al. (1989), shows the trade-offs when a two-product monopolist introduces a bundle discount. The firm
gains additional sales to marginal consumers who respond to the discount but loses the discount for
every inframarginal consumer who would have bought its both products anyway. The incentive to offer
a bundle discount is thus weaker when there are more such inframarginal consumers. A similar intuition
applies to competitive bundling in oligopoly markets.
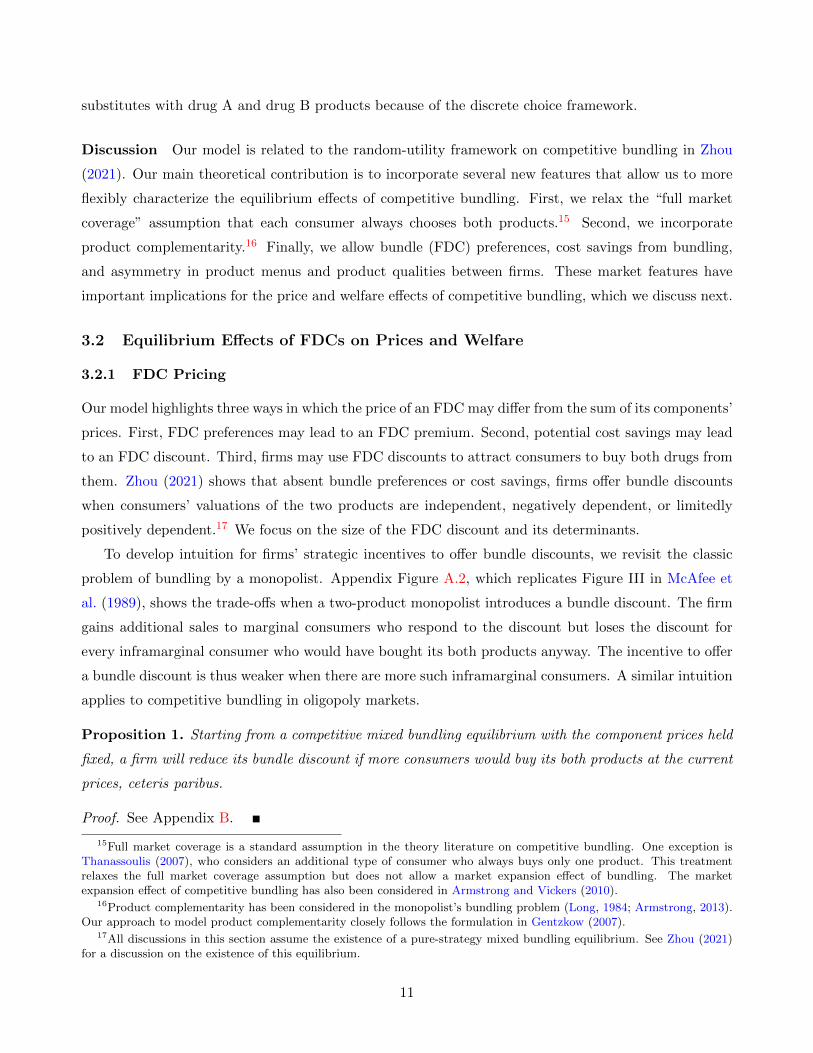
Proposition 1. Starting from a competitive mixed bundling equilibrium with the component prices held
fixed, a firm will reduce its bundle discount if more consumers would buy its both products at the current
prices, ceteris paribus.
Proof. See Appendix B.
15Full market coverage is a standard assumption in the theory literature on competitive bundling. One exception isThanassoulis (2007), who considers an additional type of consumer who always buys only one product. This treatmentrelaxes the full market coverage assumption but does not allow a market expansion effect of bundling. The marketexpansion effect of competitive bundling has also been considered in Armstrong and Vickers (2010).
16Product complementarity has been considered in the monopolist’s bundling problem (Long, 1984; Armstrong, 2013).Our approach to model product complementarity closely follows the formulation in Gentzkow (2007).
17All discussions in this section assume the existence of a pure-strategy mixed bundling equilibrium. See Zhou (2021)for a discussion on the existence of this equilibrium.
11
Intuitively, the price of a bundle increases (i.e. bundle discount decreases) when demand for the
bundle increases, ceteris paribus. Demand for a two-drug bundle increases when more consumers want
both drugs together (because of stronger drug complementarity or more positively correlated drug
preferences) and would buy from the same firm (because of stronger firm preferences). In Appendix B,
we use simulations to illustrate the effects of drug complementarity, drug preference correlation, and
firm preferences on the size of optimal FDC discounts in an oligopoly market.
3.2.2 Effects of FDCs on Component Prices
FDCs also influence the prices of their component molecules in equilibrium. Our model suggests that
this effect is ambiguous. Since FDCs and their components are substitutes, competition from FDCs
pushes component prices down, but firms that sell the FDC have an offsetting incentive to increase
component prices to steer consumers towards their FDC products. In addition, FDCs may lead to
market segmentation and change the price elasticity of consumers who consider standalone components.
The net impact of FDCs on standalone component prices thus depends on firms’ product portfolios and
consumer preference heterogeneity.
3.2.3 The Welfare Effects of FDCs
FDCs influence social welfare through their price effects, FDC preferences, and potential cost savings.
The welfare implication of the price effects depends on the net outcome of two countervailing forces: a
market expansion effect and a cannibalization effect.
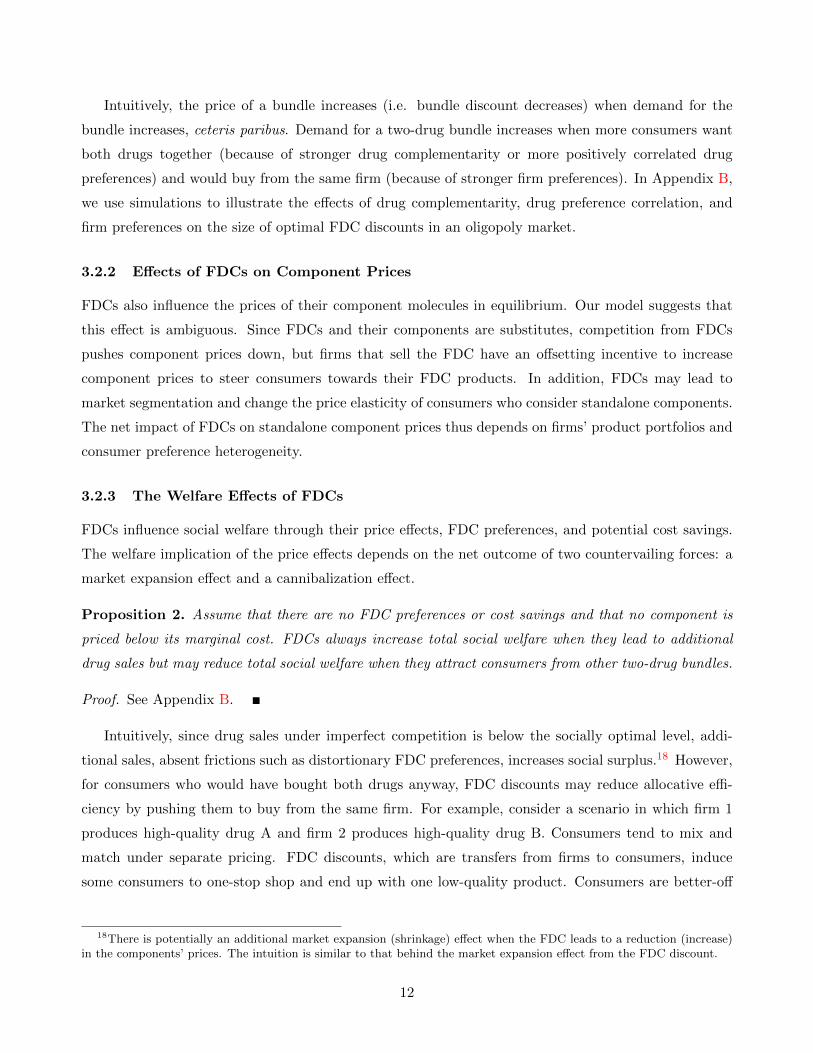
Proposition 2. Assume that there are no FDC preferences or cost savings and that no component is
priced below its marginal cost. FDCs always increase total social welfare when they lead to additional
drug sales but may reduce total social welfare when they attract consumers from other two-drug bundles.
Proof. See Appendix B.
Intuitively, since drug sales under imperfect competition is below the socially optimal level, addi-
tional sales, absent frictions such as distortionary FDC preferences, increases social surplus.18 However,
for consumers who would have bought both drugs anyway, FDC discounts may reduce allocative effi-
ciency by pushing them to buy from the same firm. For example, consider a scenario in which firm 1
produces high-quality drug A and firm 2 produces high-quality drug B. Consumers tend to mix and
match under separate pricing. FDC discounts, which are transfers from firms to consumers, induce
some consumers to one-stop shop and end up with one low-quality product. Consumers are better-off
18There is potentially an additional market expansion (shrinkage) effect when the FDC leads to a reduction (increase)in the components’ prices. The intuition is similar to that behind the market expansion effect from the FDC discount.
12
by revealed preference, but firms lose profits in a prisoner’s dilemma, and total social welfare decreases
due to reduced allocative efficiency.
The race between the market expansion and cannibalization effects depends on the types of con-
sumers whom the FDCs attract, which in turn depend on consumer preference heterogeneity. The scope
for market expansion is larger when fewer consumers buy both drugs under separate pricing and when
consumers are responsive to FDC discounts. Given the fraction of consumers who would buy both drugs
anyway, FDCs are more likely to cannibalize sales of other two-drug bundles when the variance in drug
complementarity is larger across consumers.
The welfare effects of FDCs are more nuanced when there are FDC preferences or cost savings.
FDC preferences add to the welfare gains from FDCs when they are driven by true benefits such as
convenience and improved medication adherence. Conversely, if there is a mistaken belief on product
variety, FDCs may lead to overtreatment, which reduces consumer welfare and potentially social welfare.
In characterizing the welfare effects of FDCs, it is therefore important to separate the roles of FDC
discounts and FDC preferences in driving demand for FDCs. Cost savings always increase social welfare.
To summarize, our model highlights key market features that determine the price and welfare effects
of FDCs. The price effects of FDCs depend on, among other things, consumer preferences for two-drug
bundles and firms’ product portfolios. The welfare effects of FDCs depend on FDC preferences, cost
savings, and substitution patterns as determined by consumer preference heterogeneity. These market
features will be the focus of our empirical analysis, which we turn to next.
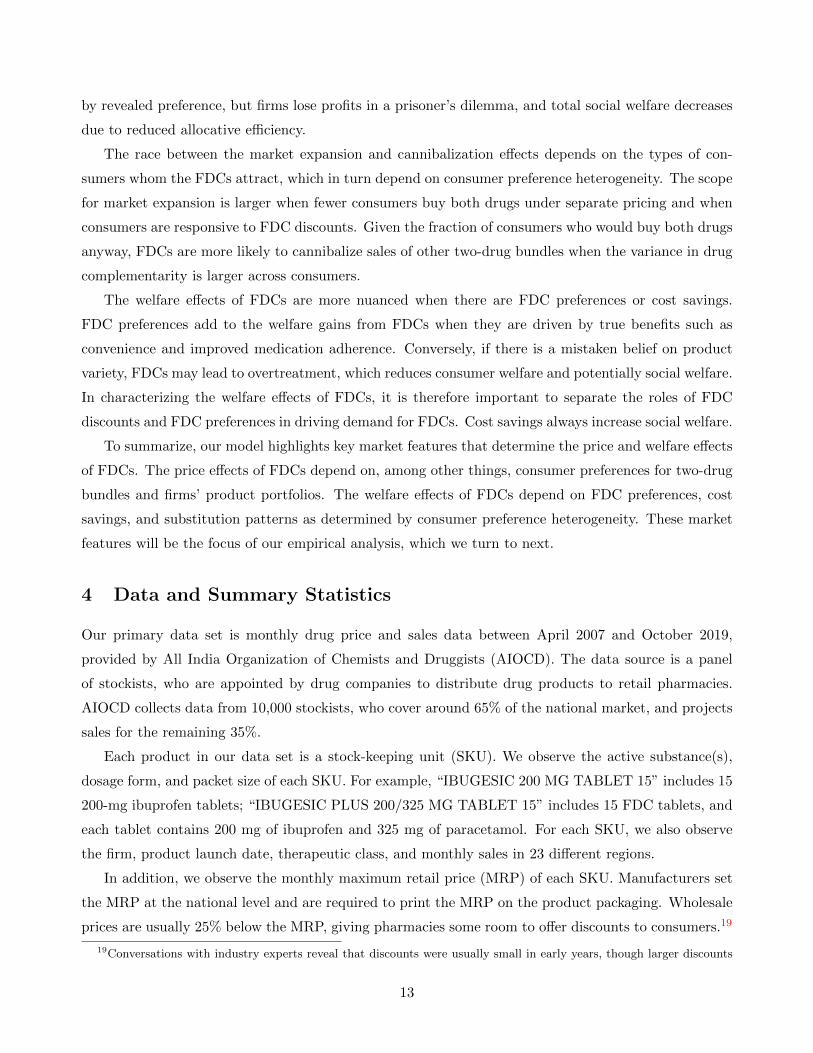
4 Data and Summary Statistics
Our primary data set is monthly drug price and sales data between April 2007 and October 2019,
provided by All India Organization of Chemists and Druggists (AIOCD). The data source is a panel
of stockists, who are appointed by drug companies to distribute drug products to retail pharmacies.
AIOCD collects data from 10,000 stockists, who cover around 65% of the national market, and projects
sales for the remaining 35%.
Each product in our data set is a stock-keeping unit (SKU). We observe the active substance(s),
dosage form, and packet size of each SKU. For example, “IBUGESIC 200 MG TABLET 15” includes 15
200-mg ibuprofen tablets; “IBUGESIC PLUS 200/325 MG TABLET 15” includes 15 FDC tablets, and
each tablet contains 200 mg of ibuprofen and 325 mg of paracetamol. For each SKU, we also observe
the firm, product launch date, therapeutic class, and monthly sales in 23 different regions.
In addition, we observe the monthly maximum retail price (MRP) of each SKU. Manufacturers set
the MRP at the national level and are required to print the MRP on the product packaging. Wholesale
prices are usually 25% below the MRP, giving pharmacies some room to offer discounts to consumers.19
19Conversations with industry experts reveal that discounts were usually small in early years, though larger discounts
13
We show using our e-pharmacy data (to be introduced soon) that the discount rates are similar between
FDCs and plain molecules and that there is no additional joint-purchase discount for non-FDC drug
bundles (see Appendix D.1 for details). As a result, we follow earlier studies on this industry and use the
MRP as a proxy for the prices that consumers pay (Chaudhuri et al., 2006; Mohapatra and Chatterjee,
2016).
We restrict the data sample in two ways. First, we focus on SKUs in tablet or capsule form, which
account for 61% of total pharmaceutical revenue. We choose this sample because the dosage strengths
of all such drugs are measured in milligrams, which makes it straightforward to link FDC products to
standalone component products of the same dosage strengths.20 Second, we exclude drugs for which we
do not observe all the active ingredients. These include products whose drug name is a broad category
(e.g. “other diuretics”, “Chinese medicines”) and all mineral supplements and vitamin products.21
SKUs dropped in this step account for 29% of revenue for FDCs and 4% of revenue for plain molecules.
We aggregate the data to the drug-dosage-firm level, which we define as a drug product.22 Our final
sample consists of 55,478 products of 1,626 drugs (818 plain molecules and 808 FDCs) from 971 different
firms.
A first look at the data confirms two facts. First, FDCs have proliferated in India since the early
2000s. Panel A of Figure 1 shows that the revenue share of FDCs in our sample grew from 30% in 2007
to 42% by the end of 2015. It continued to grow, albeit at a slower rate, after the ban on 344 FDCs in
2016. Panel B of Figure 1 shows a sharp increase in FDC entries in India around 2000. Around 35 new
FDCs were introduced every year between 2000 and 2015, outpacing the entries of new plain molecules.
Appendix Table A.1 shows the market shares of FDCs in 14 main therapeutic classes in 2019. FDCs
are commonly used in most therapeutic classes, especially the larger ones such as conditions related to
the alimentary tract and metabolism (e.g., diabetes), cardiovascular diseases, and antibiotics.
Second, we see that the Indian pharmaceutical industry is indeed highly competitive. Appendix
Table A.2 reports the breakdown of drugs by the number of firms selling them in January 2019 separately
for plain molecules and FDCs. Panel A shows that plain molecules are on average sold by 13 different
firms and that molecules sold by more than 5 firms account for 91% of drugs sales. Panel B shows a
similar pattern for FDCs: FDCs are on average sold by 12 different firms, and FDCs sold by more than
5 firms account for 86% of FDC sales. We also find significant price dispersion across different products
have become more common recently due to increased competition from e-pharmacies. Bennett and Yin (2019) shows thatMedplus, a large pharmacy chain known for offering lower drug prices, gave consumers a 10% discount off the MRP around2010. The median discount rate in our e-pharmacy data is 19% off the MRP.
20In contrast, drug in other forms (e.g., injection, syrup, cream) have different volumes and concentrations. LinkingFDCs with component molecules is sometimes difficult. In 2019, FDCs accounted for 52% of revenue for drugs in tabletand capsule form and 47% of revenue for drugs in other forms.
21Mineral supplements and vitamin products often contain a large number of additives, but our data record only oneor a few main active ingredients.
22A drug product is almost equilvalent to an SKU, except that firms occasionally offer different SKUs of the same drugat the same dosage strength.
14
of the same drug formulation. The lack of quality assurance gives rise to market power despite the large
number of firms.
We leverage three ancillary data sets that provide additional information on consumers’ drug choices.
The first is drug coprescription data from IQVIA, a leading healthcare research company. The data
are based on prescriptions written by a panel of 50,000 physicians between 2007 and 2017. The panel
of physicians covers a wide range of specialties, with the physicians selected to be representative of all
those in 170 major Indian cities. For each month, the data set records the total number of prescriptions
for each drug and the frequency at which each pair of drugs is prescribed together. The coprescription
data directly measure consumers’ propensity to buy two drug-bundles before and after FDC entries.
The second data set comes from Tata 1mg, a leading e-pharmacy platform in India. The platform
was started in 2013 and has been growing rapidly since then. We obtain data on all drug orders on the
platform for diabetes and Alzheimer’s drugs between October 2013 and July 2021. For each order, we
observe the SKUs purchased, the list price of each SKU, and the final price after coupons and discounts.
The e-pharmacy data allow us to observe repeated drug purchases by individual consumers over time
and reveal rich information on substitution patterns between different drug products.23
The third data set is the Medicare Part D Prescription Drug Event data from the Centers for
Medicare & Medicaid Services (CMS) in the US. We observe transaction-level data for all prescriptions
filled by 20% of Medicare Part D beneficiaries between 2006 and 2015. This data set allows us to
measure the coprescription rates of drugs in a setting in which most FDCs are absent. In the last part
of the paper, we also use this data set to assess the impacts of FDC regulations in the US.
5 Model-Free Analysis: Effects of FDCs on Drug Prices and Sales
In this section, we document model-free evidence on the effects of FDCs on drug prices and sales,
leveraging variation from FDCs in a wide range of therapeutic markets. Following the discussions under
our theoretical framework, we examine FDC pricing, the effects of FDCs on component prices, and the
market expansion and cannibalization effects of FDCs.
5.1 FDC Pricing
As discussed in Section 3.2, FDCs may sell at a premium due to FDC preferences, or a discount because
of cost savings or price discrimination. We compare FDC prices to the sum of their components’ prices
and examine how consumer preferences for two-drug bundles influence FDC pricing.
Our main analysis uses a cross-section of drug products from January 2013, prior to the implemen-
tation of the drug price control policy. The unit of analysis is an FDC formulation, or FDC by dosage
23We show in Appendix C that the coprescription data and e-pharmacy data are broadly consistent with our main datasample in terms of prescription and sales quantities.
15
strength (e.g., 400 mg ibuprofen + 500 mg paracetamol). For each FDC formulation, we first calculate
the average per-pill price of the FDC and of each component. We then calculate the “FDC price ratio”
by dividing the FDC price by the sum of the components’ prices.24 To remove outliers, we truncate the
sample at the 1st and 99th percentiles of the distribution of FDC price ratios. Our final sample consists
of 720 FDC formulations (of 359 FDCs) for which each component is also sold individually.
FDCs on average sell at a steep discount, as shown in Table 1. Column (1) shows an average discount
of 28%. Column (2) shows a significantly larger discount of over 40% for FDCs that have more than two
components. Column (3) shows that the discount is larger for more popular FDCs: the average discount
increases to 34% if weighted by sales quantity. One potential concern about the results is that FDC
discounts could be driven by a different mix of firms. In columns (4) and (5), we repeat the analysis at
the FDC-firm level and compare FDC prices to components prices set by the same firm. The average
FDC discount is 18% under this specification and 24% if weighted by sales. Panel A of Figure 2 shows
the distribution of the FDC price ratios. We see significant heterogeneity across different FDCs, and
around 8% of FDC formulations sell at a premium.25
Our theoretical framework predicts that a smaller FDC discount when consumers tend to buy both
drugs anyway. To test this prediction, we focus on 298 two-molecule FDCs that are not available in the
US and use drug coprescription rates in the US as a proxy for consumers’ propensity to buy both drugs
in India in the absence of FDCs.26 We define the coprescription rate between two drugs as the number
of coprescriptions divided by the smaller number of total prescriptions of the two. A coprescription
rate of 0 means no consumer is prescribed the two drugs together, while a coprescription rate of 1
means all consumers who are prescribed a drug are also prescribed the other drug. Panel B of Figure
2 shows that a 10% increase in the coprescription rate is associated with a 2.8% smaller FDC discount
(p-value = 0.02). Consistent with our theoretical intuition, firms do offer smaller FDC discounts when
consumers tend to buy both drugs anyway.
5.2 Effects of FDCs on Component Prices
Next, we examine the effects of FDCs on standalone component prices. We first leverage FDC entries
to estimate the average effects of FDCs on their components’ prices and then use cross-sectional price
24For example, the average price of a 400 mg ibuprofen + 500 mg paracetamol pill is 1 rupee. The average price is0.51 for a 400 mg ibuprofen pill and 0.58 for a 500 mg paracetamol pill. The FDC price ratio of this FDC formulation is
10.51+0.58
= 0.92.25We describe some additional results on FDC pricing in Appendix D.1. We show that patterns of FDC discounts are
robust to different sample selections and different ways of constructing FDC price ratios. We also show that firms thatalso sell standalone components offer smaller FDC discounts, which may explain the smaller average discount found in thefirm-level analysis.
26Appendix Figure A.3 shows a binned scatter plot of the coprescription rate in India against the coprescription rate inthe US for over 16,007 pairs of drugs that have not become FDCs in either country. The almost perfect linear relationshipimplies that the coprescription rate in the US is a reasonable proxy for the coprescription rate in India.
16
variation to gauge different pricing incentives by firms that do and do not sell the FDCs.
For the FDC entry analysis, we focus on the first half of our sample between April 2007 and June
2013, prior to the implementation of the price control policy. We define a period as a quarter t and
a product k as a molecule-dosage-firm (j-d-f) combination. We define the treated group as molecules
that are part of exactly one FDC, and we require the FDC to be introduced in the sample period. We
use molecules that are not part of any FDC as the control group. In addition, we restrict the sample to
products sold in every quarter. This gives us a balanced sample of 319 treated products (39 molecules)
and 1,485 control products (228 molecules).
We estimate the effects of FDC entries on standalone component prices with the following event
study framework:
log(pkt) =∑i =−1
βi1(t− dj(k) = i) + λk + λt + εkt, (8)
where dj(k) is the quarter when the FDC of molecule j was introduced. λk and λt refer to product and
quarter fixed effects, respectively. Standard errors are two-way clustered at the product and molecule-
by-quarter level.
Panel A of Figure 3 shows the results. Prior to FDC entry, the coefficients are small and not
significantly different from 0. Within a year after FDC entry, prices of the component molecules increase
by around 3.2% relative to prices of other molecules. The estimates are stable over time and borderline
significant at the 95% confidence level. These price increases may be driven by firms’ strategic price
adjustments to increase their FDC sales or by market segmentation if FDC discounts attract more
price-elastic consumers. On the other hand, the procompetitive effects of FDCs may be muted because
the markets for most component molecules are already quite competitive.27
A potential confounder of the results above is that the timing of FDC entry may be endogenous.
In particular, firms could introduce an FDC when they expect demand for the component molecule
to increase, which would bias our estimates upwards. To investigate this concern, we use Equation
8 to estimate the effects of FDC entry on component sales. Appendix Figure A.4 shows that sales
of component molecules drop after FDC entry, consistent with our causal interpretation of the price
effects.28
Next, we use cross-sectional price variation to measure the difference in component prices set by
firms that do and do not sell the FDCs. Here we leverage variation from a larger sample of drugs,
27The average number of firms that sells each treated molecule is 13. In Appendix D.2, we repeat the analysis using asmall subset of molecules sold by only one firm throughout the sample period. We find that FDC entries reduce componentprices in these more concentrated markets where the scope for procompetitive effects is larger.
28We discuss some additional robustness analysis in Appendix D.2. Our results are robust across a number of alternativespecifications incorporating, for example, weights for different products by sales quantity or controls for firm-specific timetrends, therapeutic-market-specific time trends, or the number of firms.
17
including older, more popular FDCs that may have larger price effects. We estimate the following
equation using all single-molecule drug products available in January 2013:
log(pk) = β01(sjf(k) > 0) + β1sjf(k) + λjd(k) + λf(k) + εk, (9)
where sjf(k) measures firm f ’s market share in all FDC products of molecule j by sales quantity. λjd(k)
and λf(k) stand for molecule-dosage fixed effects and firm fixed effects, respectively.29
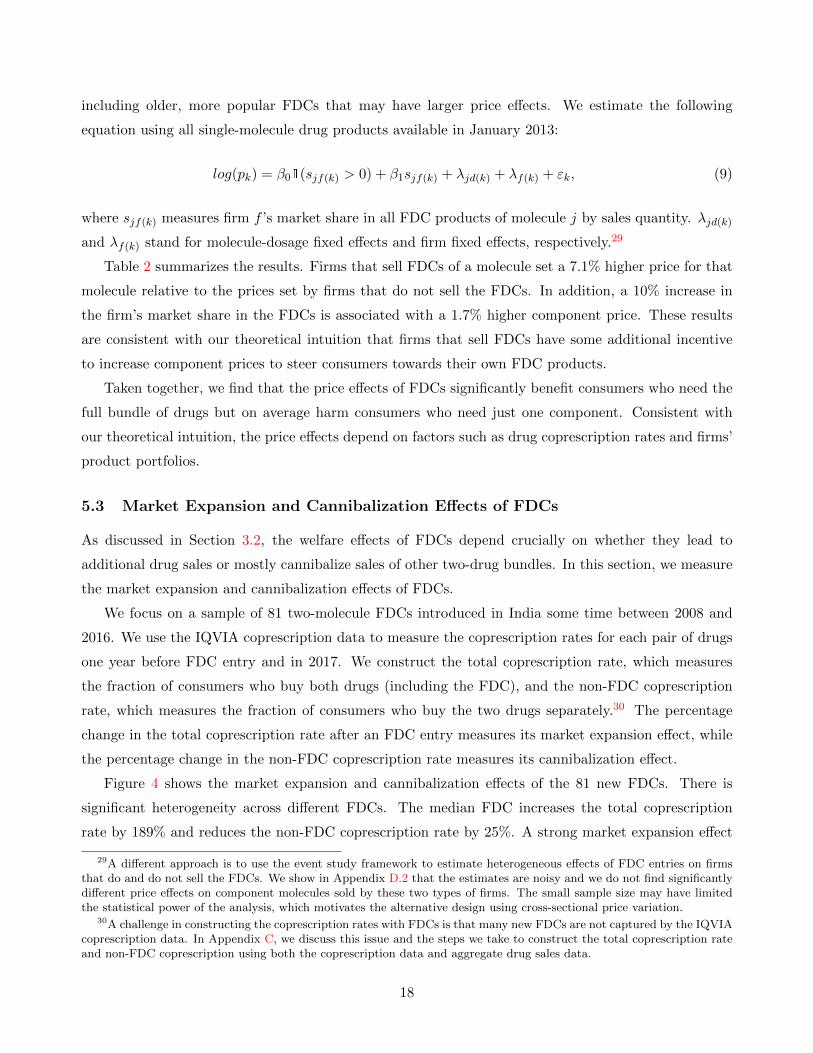
Table 2 summarizes the results. Firms that sell FDCs of a molecule set a 7.1% higher price for that
molecule relative to the prices set by firms that do not sell the FDCs. In addition, a 10% increase in
the firm’s market share in the FDCs is associated with a 1.7% higher component price. These results
are consistent with our theoretical intuition that firms that sell FDCs have some additional incentive
to increase component prices to steer consumers towards their own FDC products.
Taken together, we find that the price effects of FDCs significantly benefit consumers who need the
full bundle of drugs but on average harm consumers who need just one component. Consistent with
our theoretical intuition, the price effects depend on factors such as drug coprescription rates and firms’
product portfolios.
5.3 Market Expansion and Cannibalization Effects of FDCs
As discussed in Section 3.2, the welfare effects of FDCs depend crucially on whether they lead to
additional drug sales or mostly cannibalize sales of other two-drug bundles. In this section, we measure
the market expansion and cannibalization effects of FDCs.
We focus on a sample of 81 two-molecule FDCs introduced in India some time between 2008 and
2016. We use the IQVIA coprescription data to measure the coprescription rates for each pair of drugs
one year before FDC entry and in 2017. We construct the total coprescription rate, which measures
the fraction of consumers who buy both drugs (including the FDC), and the non-FDC coprescription
rate, which measures the fraction of consumers who buy the two drugs separately.30 The percentage
change in the total coprescription rate after an FDC entry measures its market expansion effect, while
the percentage change in the non-FDC coprescription rate measures its cannibalization effect.
Figure 4 shows the market expansion and cannibalization effects of the 81 new FDCs. There is
significant heterogeneity across different FDCs. The median FDC increases the total coprescription
rate by 189% and reduces the non-FDC coprescription rate by 25%. A strong market expansion effect
29A different approach is to use the event study framework to estimate heterogeneous effects of FDC entries on firmsthat do and do not sell the FDCs. We show in Appendix D.2 that the estimates are noisy and we do not find significantlydifferent price effects on component molecules sold by these two types of firms. The small sample size may have limitedthe statistical power of the analysis, which motivates the alternative design using cross-sectional price variation.
30A challenge in constructing the coprescription rates with FDCs is that many new FDCs are not captured by the IQVIAcoprescription data. In Appendix C, we discuss this issue and the steps we take to construct the total coprescription rateand non-FDC coprescription using both the coprescription data and aggregate drug sales data.
18
and a modest cannibalization effect imply that there could potentially be large welfare gains, but the
welfare effects still depend on whether the market expansion is driven by FDC discounts or potentially
distortionary FDC preferences. To assess the welfare effects of FDCs, we first need to estimate the
model and quantify a number of key market features, which we turn to in the next section.
6 Estimation and Welfare Analysis: the Case of Alzheimer’s Drugs
In this section, we estimate the model and quantify the welfare effects of FDCs in the market for
Alzheimer’s drugs. We choose this market for two reasons. First, Alzheimer’s is the seventh leading
cause of death globally (World Health Organization, 2020), and the market for Alzheimer’s drugs is
important for the well-being of the elderly population and their families. Second, this market offers
a tractable setting with two drugs and one FDC: donepezil, memantine and their FDC account for
over 95% of Alzheimer’s drugs sales. While it is straightforward to extend our model to describe
more complex market structures, this simple setting allows us to focus on the core economic forces in
competitive bundling in the most transparent way.
6.1 The Market for Alzheimer’s Drugs in India
Alzheimer’s disease is a brain disorder that slowly destroys memory and thinking skills and eventually
the ability to carry out the simplest tasks. According to the Dementia India Report 2010 by the
Alzheimer’s and Related Disorders Society of India (ARDSI), around 3.7 million people in India suffered
from dementia in 2010, with at least 50% of the cases caused by Alzheimer’s disease.
Two main drugs that treat Alzheimer’s disease are donepezil and memantine.31 Both drugs work by
regulating neurotransmitters of the brain, but each targets a different chemical. Medical studies have
shown that because of the different action mechanisms, combining the two drugs may further improve
patient outcomes, especially for patients with moderate or advanced disease conditions (Tariot et al.,
2004). An FDC of the two drugs was first introduced in India in June 2008 and approved in the US in
October 2015.
We define a market as the national market in a quarter and the market size as the total number
of people with Alzheimer’s disease in that quarter.32 According to the ARDSI report, the market size
was around 1.85 million in Q4 of 2010 and grew by around 0.9% per quarter. We define a drug product
at the drug-daily dosage-firm level and measure sales of each product in units of 90-day supply, which
31Currently, there is no cure for Alzheimer’s disease. The intended effect of most medications is to slow diseaseprogression and maintain mental function. In July 2021, the US FDA approved Aducanumab, the first approved disease-modifying therapy for Alzheimer’s disease. The approval was done through FDA’s Accelerated Approval Program, whichrequires an additional postmarketing study to confirm the anticipated clinical benefit.
32Though we do observe drug sales by region, we estimate the model at the national level because all pricing decisionsare made at the national level. In addition, most major drug products are introduced in all regions at the same time.
19
approximate the number of patients taking the product in each quarter.33
Appendix Figure A.5 shows the time trend in drug sales. Less than 3% of potential consumers
took the drugs at the beginning of the sample. The low treatment rate reflects limited awareness of
the disease among both patients and physicians (Ghandi, 2020). Drug costs have been another barrier
to treatment: in 2007, a single-drug treatment cost about 4,000 rupees a year, which amounted to
12% of per-capita income in India in that year. The total market share grew steadily over the sample
period, reaching around 7.5% in 2019. The FDC products experienced the fastest growth since their
introduction in 2008 and accounted for 24% of drug sales by the end of 2019.
Appendix Table A.3 shows the summary statistics of the drug products before and after donepezil
was included under price controls in Q2 of 2016. There are five main firms in the market.34 Throughout
the sample, four firms sell donepezil (Alkem, Cipla, Eisai, Intas), two firms sell memantine (Intas, Sun
Pharma), and one firm sells both drugs (Intas). The FDC products were first introduced by Sun Pharma
in Q2 of 2008 and were offered by all five firms by 2016. In Q4 of 2015, right before the price control
policy took effect, the FDC products on average sold at a 25% discount, similar to the average discount
rate of 28% across all therapeutic markets.
6.2 The Econometric Model
Our empirical specification closely follows the theoretical model outlined in Section 3.1. In this section,
we revisit the theoretical model and introduce some additional parametric assumptions.
Demand Patients with Alzheimer’s disease choose a treatment option to maximize utility under the
supervision of physicians and family members. We focus on two main drugs, donepezil (drug A) and
memantine (drug B), and the FDC that bundles both drugs. A product k is a drug-daily dosage-firm
(j-d-f) combination, with j ∈ {A,B, FDC}. Each consumer chooses one drug bundle Br indexed by
r. As before, there are five types of drug bundles: the empty bundle, one drug A product, one drug B
product, one bundle of the two drugs purchased separately, and one FDC product.
The indirect utility of bundle r to consumer i in market t is:
uirt =∑k∈Br
vikt + Γiιr −∑k∈Br
pkt + σεεirt. (10)
Equation 10 is identical to Equation 1 in our theoretical model except for two differences: product value
33Both donepezil and memantine are available in 5 mg and 10 mg tablets, and the FDC is available in “5/5 mg” and“5/10 mg” tablets. According to US FDA dosing and administration guidelines and purchase patterns in our e-pharmacydata, donepezil is usually taken once a day, while memantine and the FDC are usually taken twice a day. We thereforemeasure donepezil sales in units of 90 tablets and memantine and FDC sales in units of 180 tablets.
34We exclude from the sample products that on average account for less than 1% of sales in periods when they areoffered. Based on this sampling criterion, we exclude 11 firms whose products together account for 3.7% of total sales.
20
and price vary by market, and we introduce an additional shock σεεirt that represents the idiosyncratic
match value between consumer i and bundle r in market t.35 We assume that εirt follows the type
I extreme value distribution, with a scale parameter σε that measures how consumers trade off utils
against price. As before, Γi represents consumer-specific drug complementarity and is turned on when
bundle r contains both drugs A and B.
The value of drug product k of drug A or B to consumer i in market t is:
vikt = λk + λj(k)t + ξkt︸ ︷︷ ︸δkt
+νij(k) + νif(k). (11)
The average product value δkt consists of three components: the time-invariant product value λk, a
drug-level demand shock λj(k)t, and a product-level demand shock ξkt. As before, νij(k) and νif(k)
represent consumer i’s preferences for drug j and firm f . The value of an FDC product k to consumer
i in market t is:
vikt = vikAt + vikBt + γkt, (12)
which is the sum of the components’ values plus an FDC preference.36
Finally, we make the following parametric assumptions:
1.
νiA
νiB
∼ N (
0
0
,
σ2D ρσ2
D
ρσ2D σ2
D
)
2. νif ∼ N (0, σ2f ) for each firm
3. Γi ∼ N (Γ, σ2Γ)
Let F (νi) denote the distribution of consumer preferences parameterized by Θ, where νi = {σε, νiA, νiB,Γi, νif}.Integrating over idiosyncratic match value εirt and F (νi), we can write the market share of drug bundle
r in market t as:
35Idiosyncratic match values εirt rationalize the remaining variation in drug choices that is not explained by the restthe model. For example, our theoretical model implies that buying an FDC with a discount strictly dominates buying thecomponents separately from the same firm. εirt helps rationalize why some consumers continue to buy the componentsseparately despite the FDC discount, as we observe in our e-pharmacy data.
36For firms that sell the FDC but not some component(s), the component value vikAt(or vikBt) is undefined. A moregeneral formulation for the value of an FDC product is vikt = δFDC
kt + νiA + νiB +2νif(k), which is equivalent to Equation3 when firm f(k) sells both components.
21
srt(Θ, δt,pt) =
∫i
exp(∑
k∈Brvikt+Γiιr−
∑k∈Br
pktσε
)1 +
∑qexp
(∑k∈Bq
vikt+Γiιq−∑
k∈Bqpkt
σε
)dF (νi), (13)
where δt and pt are vectors of average product values and prices in market t.
Supply We focus on markets prior to the implementation of the price control policy. Following the
model of drug supply outlined in Section 3.1, we take the product offering as given and assume firms
set prices to maximize profits under Nash-Bertrand competition.
6.3 Identification and Estimation
We are interested in recovering consumer preference heterogeneity Θ = {σε, σD, ρ, Γ, σΓ, σf}, FDC
preferences γ, and potential cost savings from FDCs.37 There are two main challenges in estimating
this model with the standard aggregate drug sales data. First, with aggregate data, we would only
observe the total sales of each drug product, but not how often it is sold alone and how often together
with the other drug. Second, identifying substitution patterns with aggregate data would require
strong assumptions on the time trends of drug sales and exogenous variation in choice sets over time.
To address these challenges, we leverage a policy shock and novel coprescription and epharmacy data.
In this section, we describe the identifying variation for each parameter and the estimation procedure.
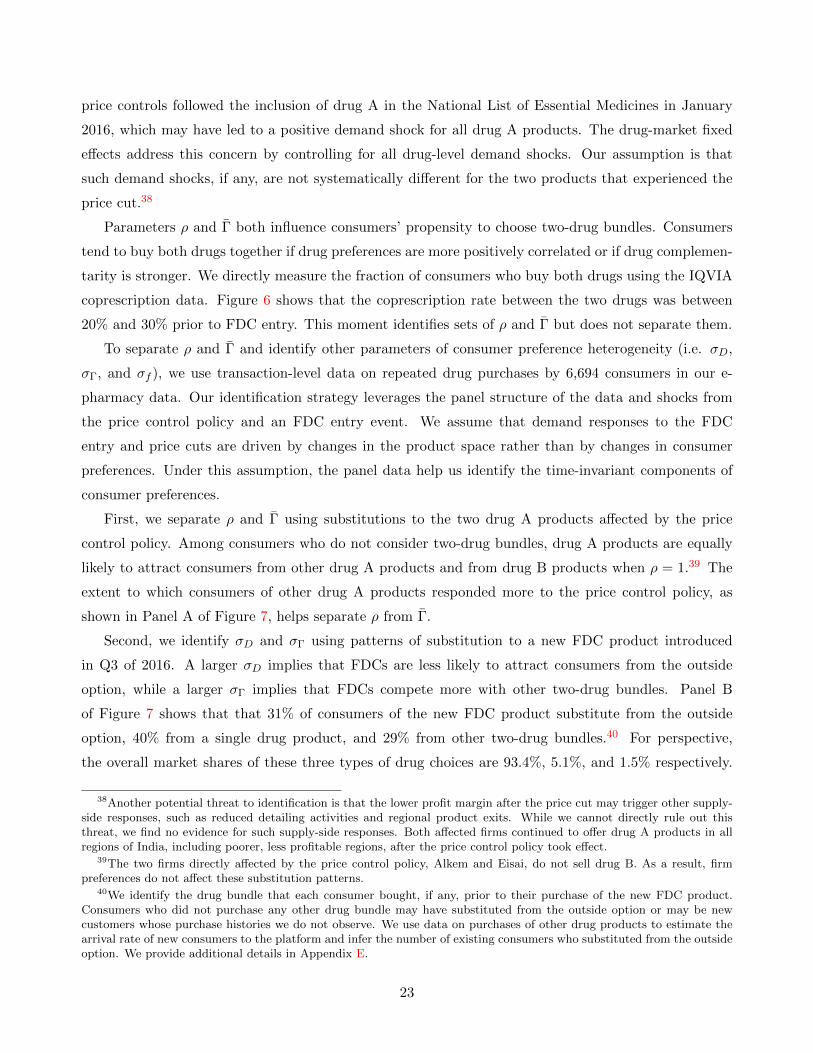
Identification The first parameter of interest is σε, which governs the price elasticity. Since prices are
likely positively correlated with unobserved demand shock ξkt, we need an instrument to consistently
estimate σε. Since we include drug-market fixed effects λjt in our utility specification, we need an
instrument that shifts prices of a subset of products of a specific drug. The price control policy, which
imposed a price ceiling on drug A in Q2 of 2016, provides such an instrument. Panel A of Figure 5
shows that two drug A products that were priced above the ceiling experienced an immediate price drop
of between 30% and 40% in Q2 of 2016, while the prices of the other two products were unaffected.
Panel B of Figure 5 shows sharp sales increases for the two affected products in response to the price
reductions. Our instrument Zkt takes value 1 for the two affected products starting in Q2 of 2016 and
0 otherwise.
The exclusion restriction of the instrument is that the price control policy does not affect drug sales
through any mechanism other than the price changes. One potential concern is that the imposition of
37We measure the average FDC preference in each market by using the difference between the sales-weighted averageproduct value of FDC products and the sum of the sales-weighted average product values of drug A and drug B products.We cannot measure γkt at the product-market level because most firms do not sell both drugs A and B.
22
price controls followed the inclusion of drug A in the National List of Essential Medicines in January
2016, which may have led to a positive demand shock for all drug A products. The drug-market fixed
effects address this concern by controlling for all drug-level demand shocks. Our assumption is that
such demand shocks, if any, are not systematically different for the two products that experienced the
price cut.38
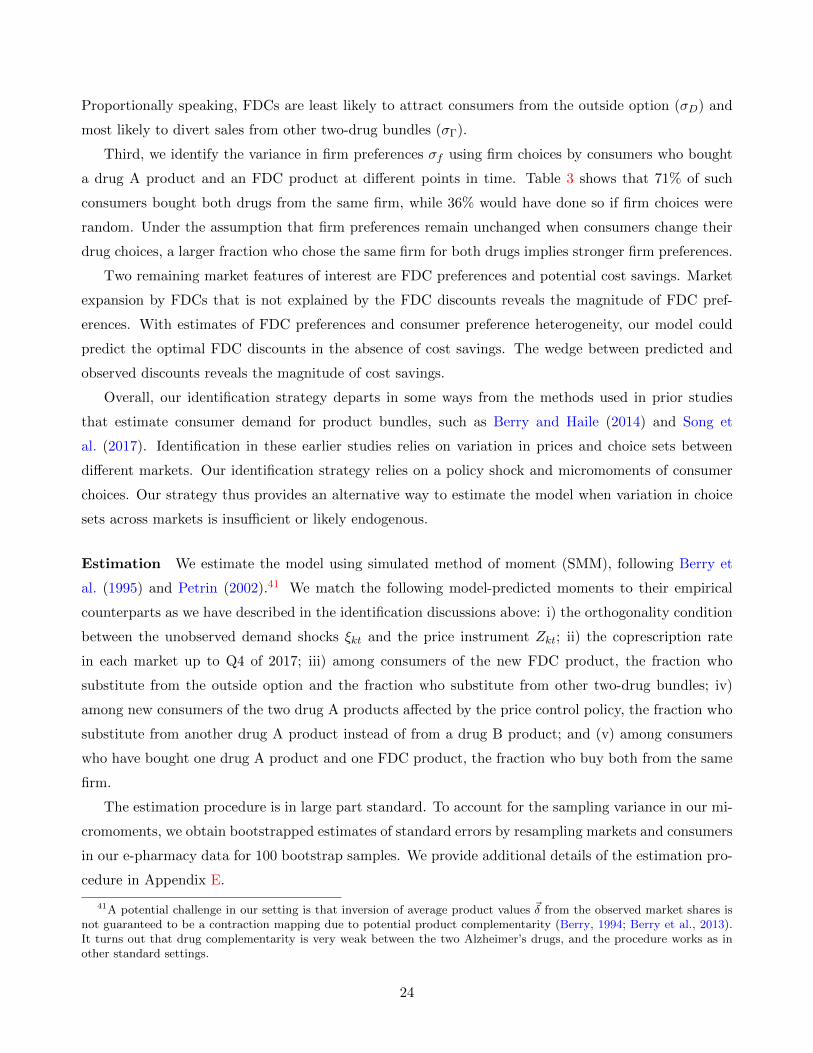
Parameters ρ and Γ both influence consumers’ propensity to choose two-drug bundles. Consumers
tend to buy both drugs together if drug preferences are more positively correlated or if drug complemen-
tarity is stronger. We directly measure the fraction of consumers who buy both drugs using the IQVIA
coprescription data. Figure 6 shows that the coprescription rate between the two drugs was between
20% and 30% prior to FDC entry. This moment identifies sets of ρ and Γ but does not separate them.
To separate ρ and Γ and identify other parameters of consumer preference heterogeneity (i.e. σD,
σΓ, and σf ), we use transaction-level data on repeated drug purchases by 6,694 consumers in our e-
pharmacy data. Our identification strategy leverages the panel structure of the data and shocks from
the price control policy and an FDC entry event. We assume that demand responses to the FDC
entry and price cuts are driven by changes in the product space rather than by changes in consumer
preferences. Under this assumption, the panel data help us identify the time-invariant components of
consumer preferences.
First, we separate ρ and Γ using substitutions to the two drug A products affected by the price
control policy. Among consumers who do not consider two-drug bundles, drug A products are equally
likely to attract consumers from other drug A products and from drug B products when ρ = 1.39 The
extent to which consumers of other drug A products responded more to the price control policy, as
shown in Panel A of Figure 7, helps separate ρ from Γ.
Second, we identify σD and σΓ using patterns of substitution to a new FDC product introduced
in Q3 of 2016. A larger σD implies that FDCs are less likely to attract consumers from the outside
option, while a larger σΓ implies that FDCs compete more with other two-drug bundles. Panel B
of Figure 7 shows that that 31% of consumers of the new FDC product substitute from the outside
option, 40% from a single drug product, and 29% from other two-drug bundles.40 For perspective,
the overall market shares of these three types of drug choices are 93.4%, 5.1%, and 1.5% respectively.
38Another potential threat to identification is that the lower profit margin after the price cut may trigger other supply-side responses, such as reduced detailing activities and regional product exits. While we cannot directly rule out thisthreat, we find no evidence for such supply-side responses. Both affected firms continued to offer drug A products in allregions of India, including poorer, less profitable regions, after the price control policy took effect.
39The two firms directly affected by the price control policy, Alkem and Eisai, do not sell drug B. As a result, firmpreferences do not affect these substitution patterns.
40We identify the drug bundle that each consumer bought, if any, prior to their purchase of the new FDC product.Consumers who did not purchase any other drug bundle may have substituted from the outside option or may be newcustomers whose purchase histories we do not observe. We use data on purchases of other drug products to estimate thearrival rate of new consumers to the platform and infer the number of existing consumers who substituted from the outsideoption. We provide additional details in Appendix E.
23
Proportionally speaking, FDCs are least likely to attract consumers from the outside option (σD) and
most likely to divert sales from other two-drug bundles (σΓ).
Third, we identify the variance in firm preferences σf using firm choices by consumers who bought
a drug A product and an FDC product at different points in time. Table 3 shows that 71% of such
consumers bought both drugs from the same firm, while 36% would have done so if firm choices were
random. Under the assumption that firm preferences remain unchanged when consumers change their
drug choices, a larger fraction who chose the same firm for both drugs implies stronger firm preferences.
Two remaining market features of interest are FDC preferences and potential cost savings. Market
expansion by FDCs that is not explained by the FDC discounts reveals the magnitude of FDC pref-
erences. With estimates of FDC preferences and consumer preference heterogeneity, our model could
predict the optimal FDC discounts in the absence of cost savings. The wedge between predicted and
observed discounts reveals the magnitude of cost savings.
Overall, our identification strategy departs in some ways from the methods used in prior studies
that estimate consumer demand for product bundles, such as Berry and Haile (2014) and Song et
al. (2017). Identification in these earlier studies relies on variation in prices and choice sets between
different markets. Our identification strategy relies on a policy shock and micromoments of consumer
choices. Our strategy thus provides an alternative way to estimate the model when variation in choice
sets across markets is insufficient or likely endogenous.
Estimation We estimate the model using simulated method of moment (SMM), following Berry et
al. (1995) and Petrin (2002).41 We match the following model-predicted moments to their empirical
counterparts as we have described in the identification discussions above: i) the orthogonality condition
between the unobserved demand shocks ξkt and the price instrument Zkt; ii) the coprescription rate
in each market up to Q4 of 2017; iii) among consumers of the new FDC product, the fraction who
substitute from the outside option and the fraction who substitute from other two-drug bundles; iv)
among new consumers of the two drug A products affected by the price control policy, the fraction who
substitute from another drug A product instead of from a drug B product; and (v) among consumers
who have bought one drug A product and one FDC product, the fraction who buy both from the same
firm.
The estimation procedure is in large part standard. To account for the sampling variance in our mi-
cromoments, we obtain bootstrapped estimates of standard errors by resampling markets and consumers
in our e-pharmacy data for 100 bootstrap samples. We provide additional details of the estimation pro-
cedure in Appendix E.
41A potential challenge in our setting is that inversion of average product values δ from the observed market shares isnot guaranteed to be a contraction mapping due to potential product complementarity (Berry, 1994; Berry et al., 2013).It turns out that drug complementarity is very weak between the two Alzheimer’s drugs, and the procedure works as inother standard settings.
24
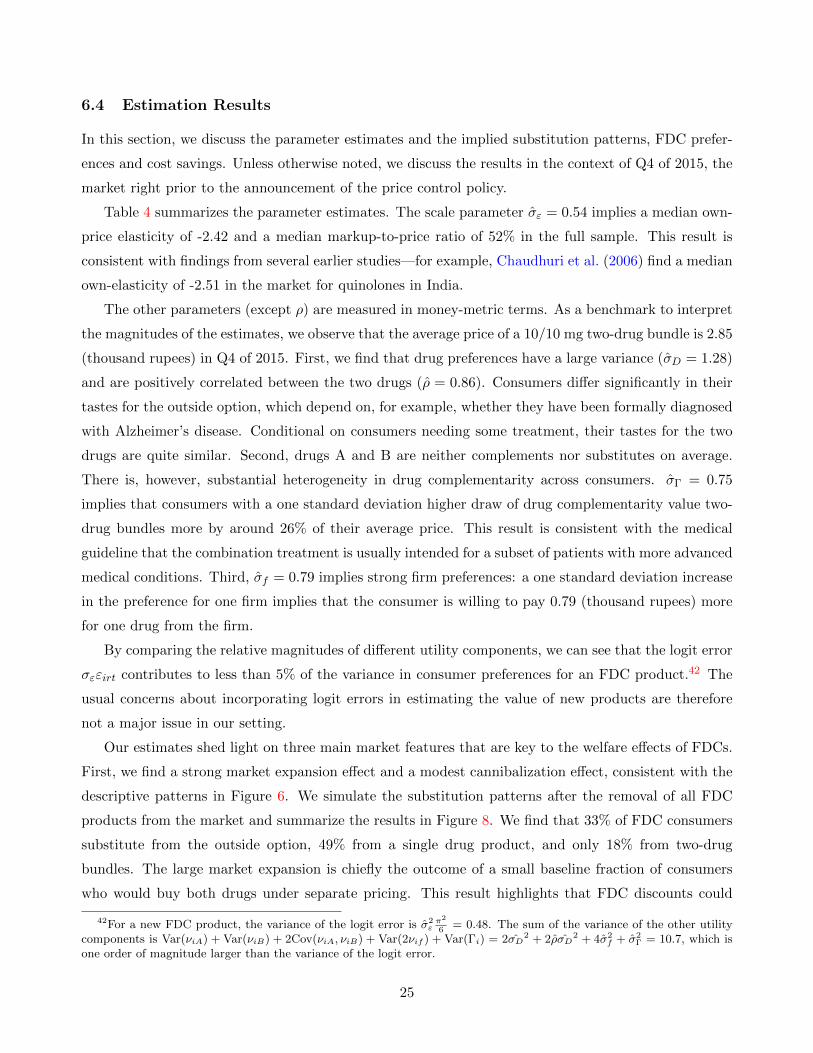
6.4 Estimation Results
In this section, we discuss the parameter estimates and the implied substitution patterns, FDC prefer-
ences and cost savings. Unless otherwise noted, we discuss the results in the context of Q4 of 2015, the
market right prior to the announcement of the price control policy.
Table 4 summarizes the parameter estimates. The scale parameter σε = 0.54 implies a median own-
price elasticity of -2.42 and a median markup-to-price ratio of 52% in the full sample. This result is
consistent with findings from several earlier studies—for example, Chaudhuri et al. (2006) find a median
own-elasticity of -2.51 in the market for quinolones in India.
The other parameters (except ρ) are measured in money-metric terms. As a benchmark to interpret
the magnitudes of the estimates, we observe that the average price of a 10/10 mg two-drug bundle is 2.85
(thousand rupees) in Q4 of 2015. First, we find that drug preferences have a large variance (σD = 1.28)
and are positively correlated between the two drugs (ρ = 0.86). Consumers differ significantly in their
tastes for the outside option, which depend on, for example, whether they have been formally diagnosed
with Alzheimer’s disease. Conditional on consumers needing some treatment, their tastes for the two
drugs are quite similar. Second, drugs A and B are neither complements nor substitutes on average.
There is, however, substantial heterogeneity in drug complementarity across consumers. σΓ = 0.75
implies that consumers with a one standard deviation higher draw of drug complementarity value two-
drug bundles more by around 26% of their average price. This result is consistent with the medical
guideline that the combination treatment is usually intended for a subset of patients with more advanced
medical conditions. Third, σf = 0.79 implies strong firm preferences: a one standard deviation increase
in the preference for one firm implies that the consumer is willing to pay 0.79 (thousand rupees) more
for one drug from the firm.
By comparing the relative magnitudes of different utility components, we can see that the logit error
σεεirt contributes to less than 5% of the variance in consumer preferences for an FDC product.42 The
usual concerns about incorporating logit errors in estimating the value of new products are therefore
not a major issue in our setting.
Our estimates shed light on three main market features that are key to the welfare effects of FDCs.
First, we find a strong market expansion effect and a modest cannibalization effect, consistent with the
descriptive patterns in Figure 6. We simulate the substitution patterns after the removal of all FDC
products from the market and summarize the results in Figure 8. We find that 33% of FDC consumers
substitute from the outside option, 49% from a single drug product, and only 18% from two-drug
bundles. The large market expansion is chiefly the outcome of a small baseline fraction of consumers
who would buy both drugs under separate pricing. This result highlights that FDC discounts could
42For a new FDC product, the variance of the logit error is σ2επ2
6= 0.48. The sum of the variance of the other utility
components is Var(νiA) + Var(νiB) + 2Cov(νiA, νiB) + Var(2νif ) + Var(Γi) = 2σD2 + 2ρσD
2 + 4σ2f + σ2
Γ = 10.7, which isone order of magnitude larger than the variance of the logit error.
25
play a pivotal role in helping patients afford the treatment they prefer when consumers are uninsured
and drug prices are high relative to income.
Second, consumers’ FDC preferences turn out to be negligible. The market expansion effect of FDCs
can be entirely explained by FDC discounts and additional product variety from firms that did not sell
both components before introducing the FDCs.
Finally, we find that FDCs lead to significant cost savings. The marginal costs of FDC products are
on average 23% lower than the sum of their components’ costs. By combining multiple drugs into one
pill, FDCs simplify the logistics of storage and distribution, which are major components of marginal
costs given the warm and humid climate in India (World Health Organization, 2005). Shutting down
cost savings would reduce FDC discounts by around half.
6.5 The Welfare Effects of FDCs and FDC Regulations
We use our model to assess the welfare effects of FDCs and potential FDC regulations. We quantify
welfare effects of FDCs in the market for Alzheimer’s drugs and discuss how the results would change
under different market conditions. Our goal is to highlight main policy trade-offs in healthcare regula-
tions on FDCs and in antitrust regulations on competitive bundling. Details on simulations of various
counterfactuals are provided in Appendix F.
6.5.1 The Welfare Effects of FDCs
We follow Train (2015) and allow a wedge between consumers’ “anticipated utility” and “actual utility”.
The former determines drug choices, while the latter determines consumer surplus. The wedge, if any,
captures misjudged FDC preferences. Formally, we define consumer surplus in market t as:
CSt =
∫iE(max
r(uirt))dF (νi)−
∑k
sktγkt, (14)
where uirt is consumer i’s anticipated utility from bundle r, and γkt is misjudged FDC preference for
FDC product k. If FDC preferences only capture true benefits such as convenience, we have γkt = 0
for all k. If FDC preferences only capture consumer mistakes, we have γkt = γkt, and FDCs could
reduce consumer surplus through choice distortions. The size of FDC preferences thus defines a region
of ambiguity in the welfare effects of FDCs that depends on the nature of FDC preferences. In the
market for Alzheimer’s drugs, this region of ambiguity vanishes because FDC preferences are negligible,
and we have the standard measure of consumer surplus based on revealed preferences.
FDCs also influence consumer welfare through FDC discounts, equilibrium effects on component
prices, and additional product varieties from firms that did not sell both components previously. Panel
A of Figure 9 shows these welfare effects in the market for Alzheimer’s drugs in Q4 of 2015. When we
26
remove all FDCs and allow firms to reset the components’ prices, consumer surplus is 46.3 rupees ($0.6)
per potential consumer. Under the current market equilibrium, the average consumer surplus is 55.9
rupees, a 21% increase relative to the no-FDC counterfactual. Additional product varieties increase
consumer surplus by 7%, and FDC discounts explain the remaining 14% increase. The effects of FDCs
on components’ prices are small and do not have an appreciable effect on consumer surplus.
On the firm side, we find that FDCs increase producer surplus by 13% because of significant market
expansion and cost savings. Panel B of Figure 9 shows large profit gains from consumers who substitute
from the outside option or a single drug product to an FDC, though substitutions from two-drug bundles
to FDCs reduce profits. Shutting down cost savings would reduce the profit gains to 8%. Overall, our
results show that competitive bundling could potentially benefit both consumers and firms.
It is also important to note that these results are specific to the market for Alzheimer’s drugs, and
the welfare effects of FDCs may be reversed under different market conditions. For example, if FDC
preferences play a large role in driving the demand for some FDCs, our model would imply a large
region of ambiguity in the effects of the FDCs on consumer surplus. In such cases, additional clinical
analysis is needed to examine the potential concern of overtreatment. In some other diseases like
active tuberculosis, consumers’ need for medications is less elastic and the scope for market expansion
is limited. In such cases, firms could face a prisoner’s dilemma: each firm has a unilateral incentive
to introduce an FDC discount, but in equilibrium all firms lose profits because of the cannibalization
effects of FDC discounts. Another main takeaway from our analysis is a framework to think about
how the welfare effects of competitive bundling depend on market features such as consumer preference
heterogeneity, bundle preferences, and cost savings.
6.5.2 Clinical Trial Requirement and FDC Patents
We end by evaluating the welfare implications of some real-world FDC regulations. As discussed in
Section 2.2, the US FDA usually requires large-scale clinical trials to support new FDCs and grants
patent protection to firms that sponsored approved FDCs. We simulate these regulations in the market
for Alzheimer’s drugs in India. We focus on two potential policy impacts: the price effects of FDC
patents and the implications of compliance costs for FDC entry.
We grant an FDC monopoly to each of the four firms in Q4 of 2015 and simulate the equilibrium
prices and profits. Table 5 shows that firms with monopoly power would increase the FDC price by less
than 2%43 The results suggest that competition from the component molecules is effective in disciplining
FDC pricing and that the monopoly power from FDC patents need not be a major concern. On the
other hand, this curtailed monopoly power may limit expected profit gains and dampen the incentive to
introduce FDCs. Assuming a patent length of 11 years, we find that the expected profit gain from the
43For simplicity, we take the simple average of the prices of the 10/10 mg and 10/20 mg products.
27
FDC is between 11.4 million and 530.2 million rupees, which falls below the estimated median clinical
trial cost for new drug approvals in the US.44 The clinical trial requirement may thus deter FDC entries
and forestall their potential welfare benefits.
The clinical trial requirement is certainly well intentioned and serves an important purpose of screen-
ing out potentially unjustified combinations. Our results on the potential equilibrium effects of FDCs
highlight another policy consideration that has so far been largely overlooked. In Appendix G, we use
the Medicare Prescription Drug Event data and FDA Orange Book data on new drug approvals to
directly assess the implications of FDC regulation in the US. We find that many commonly prescribed
combinations do not become FDCs in the US and that approved FDCs on average enter the US market
four years after they enter India. These results point to potential welfare gains from allowing an easier
approval process for combinations that doctors consider appropriate to prescribe together.
7 Conclusion
In this paper, we study the equilibrium effects of pharmaceutical bundling on market outcomes and
social welfare in India. Using an equilibrium model of drug demand and supply in oligopoly markets, we
show that the effects of FDCs on drug prices and social welfare are theoretically ambiguous. Firms offer
FDC discounts to attract one-stop shoppers but may strategically increase the components’ prices. FDC
discounts in general increase total social welfare when they increase drug sales but may reduce allocative
efficiency when they divert sales from other two-drug bundles. In addition, we characterize major
market features that determine these equilibrium effects, such as drug coprescription rates, consumer
firm preferences, heterogeneity in consumer drug preferences, and so on.
We confirm the theoretical intuition from the model using empirical evidence from a wide range of
therapeutic markets in India, where FDCs account for over 50% of pharmaceutical revenue. We find
that FDCs on average sell at a 28% discount but increase components’ prices by 3.2%. The price effects
depend on factors such as consumers’ preferences for two-drug bundles and firms’ product portfolios,
consistent with theoretical intuition from the model. We therefore consider our model a useful framework
to understand the price effects of competitive bundling in pharmaceutical markets or beyond.
Finally, we estimate the model in the market for Alzheimer’s drugs to quantify the welfare effects of
FDCs and FDC regulations. We find that FDCs in this market increase consumer surplus by 21% and
producer surplus by 13%. We also show that the cost of complying with FDC regulations, such as clinical
trial requirements, may deter FDC entries and forestall their welfare benefits. These results highlight a
potentially important but so far overlooked consideration in the design of FDC regulations. While our
44The average patent length for a new drug in the US after approval is 11.3 years and is similar for new molecules andFDCs. Moore et al. (2020) estimates that the median clinical trial cost for new drug approval in the US between 2015 and2017 was $48 million, or approximately 990 million rupees by purchasing power parity.
28
quantitative findings are specific to the market for Alzheimer’s drugs, our model can accommodate a
variety of settings, and the theoretical intuition on the different economic forces at play helps us think
about how the welfare effects of competitive bundling will differ in other settings with different market
conditions.
While this paper has characterized the major equilibrium effects of FDCs and their determinants,
there are still several unanswered, policy-relevant questions. First, we have largely abstracted from the
potential health effects of FDCs, in particular the public health externality from the overuse of, for
example, antibiotic FDCs. Our analysis is thus meant to complement other important medical research
on these potential health effects. Second, while we have estimated the model for a simple market with
two main drugs and one FDC, many therapeutic markets, such as the market for HIV treatment, may
have tens of different molecules and FDCs. Though it is conceptually straightforward to extend our
model to more complex settings and the economic forces at play are largely similar, the pricing strategy
space becomes much more complicated, and the model becomes less tractable (Armstrong and Vickers,
2010; Chu et al., 2011). We consider it a promising direction for future research to characterize the
equilibrium effects of FDCs in these more complex markets and see if there are any interesting economic
forces not present in the two-drug setting. Finally, measuring the long-run effects on product entries
and exits and market structure is also important in understanding the equilibrium effects of competitive
bundling.
29
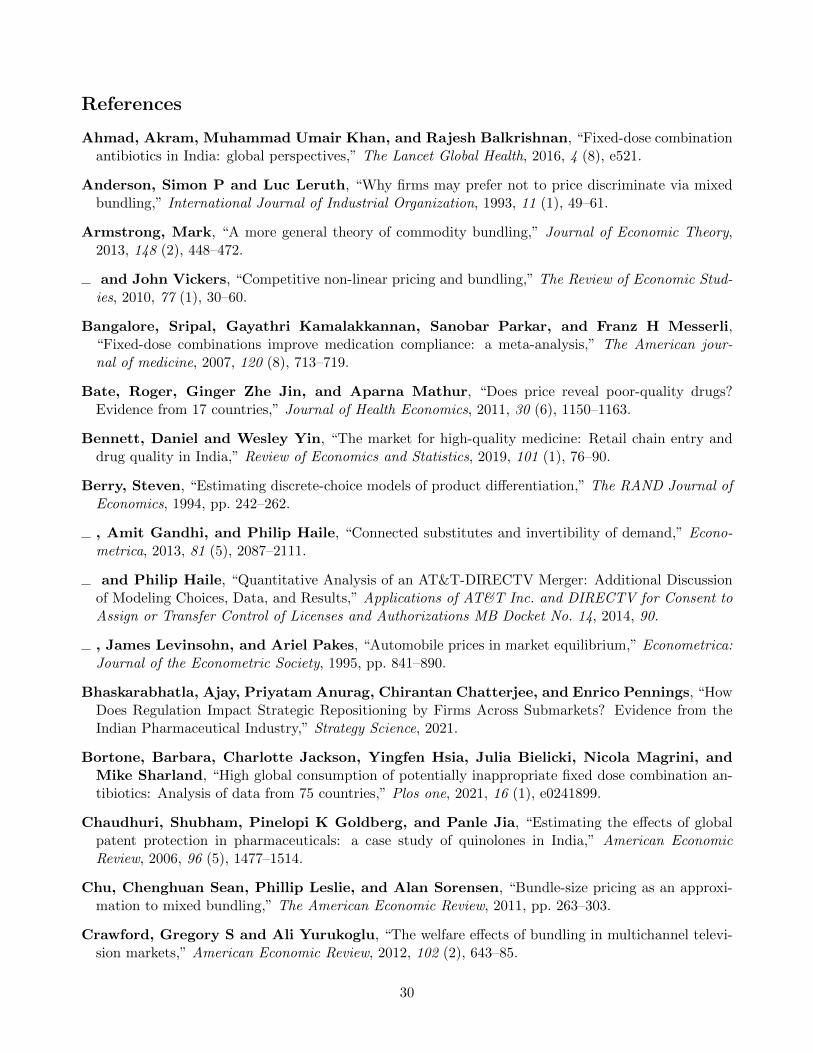
References
Ahmad, Akram, Muhammad Umair Khan, and Rajesh Balkrishnan, “Fixed-dose combinationantibiotics in India: global perspectives,” The Lancet Global Health, 2016, 4 (8), e521.
Anderson, Simon P and Luc Leruth, “Why firms may prefer not to price discriminate via mixedbundling,” International Journal of Industrial Organization, 1993, 11 (1), 49–61.
Armstrong, Mark, “A more general theory of commodity bundling,” Journal of Economic Theory,2013, 148 (2), 448–472.
and John Vickers, “Competitive non-linear pricing and bundling,” The Review of Economic Stud-ies, 2010, 77 (1), 30–60.
Bangalore, Sripal, Gayathri Kamalakkannan, Sanobar Parkar, and Franz H Messerli,“Fixed-dose combinations improve medication compliance: a meta-analysis,” The American jour-nal of medicine, 2007, 120 (8), 713–719.
Bate, Roger, Ginger Zhe Jin, and Aparna Mathur, “Does price reveal poor-quality drugs?Evidence from 17 countries,” Journal of Health Economics, 2011, 30 (6), 1150–1163.
Bennett, Daniel and Wesley Yin, “The market for high-quality medicine: Retail chain entry anddrug quality in India,” Review of Economics and Statistics, 2019, 101 (1), 76–90.
Berry, Steven, “Estimating discrete-choice models of product differentiation,” The RAND Journal ofEconomics, 1994, pp. 242–262.
, Amit Gandhi, and Philip Haile, “Connected substitutes and invertibility of demand,” Econo-metrica, 2013, 81 (5), 2087–2111.
and Philip Haile, “Quantitative Analysis of an AT&T-DIRECTV Merger: Additional Discussionof Modeling Choices, Data, and Results,” Applications of AT&T Inc. and DIRECTV for Consent toAssign or Transfer Control of Licenses and Authorizations MB Docket No. 14, 2014, 90.
, James Levinsohn, and Ariel Pakes, “Automobile prices in market equilibrium,” Econometrica:Journal of the Econometric Society, 1995, pp. 841–890.
Bhaskarabhatla, Ajay, Priyatam Anurag, Chirantan Chatterjee, and Enrico Pennings, “HowDoes Regulation Impact Strategic Repositioning by Firms Across Submarkets? Evidence from theIndian Pharmaceutical Industry,” Strategy Science, 2021.
Bortone, Barbara, Charlotte Jackson, Yingfen Hsia, Julia Bielicki, Nicola Magrini, andMike Sharland, “High global consumption of potentially inappropriate fixed dose combination an-tibiotics: Analysis of data from 75 countries,” Plos one, 2021, 16 (1), e0241899.
Chaudhuri, Shubham, Pinelopi K Goldberg, and Panle Jia, “Estimating the effects of globalpatent protection in pharmaceuticals: a case study of quinolones in India,” American EconomicReview, 2006, 96 (5), 1477–1514.
Chu, Chenghuan Sean, Phillip Leslie, and Alan Sorensen, “Bundle-size pricing as an approxi-mation to mixed bundling,” The American Economic Review, 2011, pp. 263–303.
Crawford, Gregory S and Ali Yurukoglu, “The welfare effects of bundling in multichannel televi-sion markets,” American Economic Review, 2012, 102 (2), 643–85.
30
Dean, Emma Boswell, “Who Benefits from Pharmaceutical Price Controls?: Evidence from India,”Technical Report, Center for Global Development 2019.
Du, Li-Ping, Zhong-Wei Cheng, Yu-Xuan Zhang, Ying Li, and Dan Mei, “The impact offixed-dose combination versus free-equivalent combination therapies on adherence for hypertension:a meta-analysis,” The Journal of Clinical Hypertension, 2018, 20 (5), 902–907.
Duggan, Mark, Craig Garthwaite, and Aparajita Goyal, “The market impacts of pharmaceuticalproduct patents in developing countries: Evidence from India,” American Economic Review, 2016,106 (1), 99–135.
Dutta, Antara, “From free entry to patent protection: Welfare implications for the Indian pharma-ceutical industry,” The Review of Economics and Statistics, 2011, 93 (1), 160–178.
Evans, Valerie and Allyson M Pollock, “The proliferation of irrational metformin fixed-dose com-binations in India,” The Lancet Diabetes & Endocrinology, 2015, 3 (2), 98–100.
Gadzhanova, Svetla, Jenni Ilomaki, and Elizabeth E Roughead, “Antihypertensive use beforeand after initiation of fixed-dose combination products in Australia: a retrospective study,” Interna-tional journal of clinical pharmacy, 2013, 35 (4), 613–620.
Gentzkow, Matthew, “Valuing new goods in a model with complementarity: Online newspapers,”American Economic Review, 2007, 97 (3), 713–744.
Ghandi, Divya, “Just a fraction of an estimated 5 million Indians with dementia and Alzheimer’s arediagnosed. Do we need a new policy to ensure their well-being?,” The Hindu, Nov 2020.
Hansen, Lars Peter, “Large sample properties of generalized method of moments estimators,” Econo-metrica: Journal of the econometric society, 1982, pp. 1029–1054.
Hurkens, Sjaak, Doh-Shin Jeon, and Domenico Menicucci, “Dominance and competitivebundling,” American Economic Journal: Microeconomics, 2019, 11 (3), 1–33.
Long, John B, “Comments on” Gaussian Demand and Commodity Bundling”,” The Journal of Busi-ness, 1984, 57 (1), S235–S246.
Matutes, Carmen and Pierre Regibeau, “Compatibility and bundling of complementary goods ina duopoly,” The Journal of Industrial Economics, 1992, pp. 37–54.
McAfee, R Preston, John McMillan, and Michael D Whinston, “Multiproduct monopoly,commodity bundling, and correlation of values,” The Quarterly Journal of Economics, 1989, 104 (2),371–383.
McManus, Brian, Aviv Nevo, Zachary Nolan, and Jonathan W Williams, “Steering incentivesand bundling practices in the telecommunications industry,” Available at SSRN 3267060, 2018.
Mohapatra, D and Chirantan Chatterjee, “Price Control and Access to Drugs: The Case of India’sMalaria Market,” Technical Report 2016.
Moore, Thomas J, James Heyward, Gerard Anderson, and G Caleb Alexander, “Variationin the estimated costs of pivotal clinical benefit trials supporting the US approval of new therapeuticagents, 2015–2017: a cross-sectional study,” BMJ open, 2020, 10 (6), e038863.
National Sample Survey Office, “Key Indicators of Social Consumption in India: Health,” 2019.
31
Petrin, Amil, “Quantifying the benefits of new products: The case of the minivan,” Journal of politicalEconomy, 2002, 110 (4), 705–729.
Singh, Prachi, Shamika Ravi, and David Dam, “Medicines in India: Accessibility, Affordabilityand Quality,” 2020.
Song, Minjae, Sean Nicholson, and Claudio Lucarelli, “Mergers with interfirm bundling: a caseof pharmaceutical cocktails,” The RAND Journal of Economics, 2017, 48 (3), 810–834.
Tariot, Pierre N, Martin R Farlow, George T Grossberg, Stephen M Graham, Scott Mc-Donald, Ivan Gergel, Memantine Study Group, Memantine Study Group et al., “Meman-tine treatment in patients with moderate to severe Alzheimer disease already receiving donepezil: arandomized controlled trial,” Jama, 2004, 291 (3), 317–324.
Thanassoulis, John, “Competitive mixed bundling and consumer surplus,” Journal of Economics &Management Strategy, 2007, 16 (2), 437–467.
Thom, Simon, Neil Poulter, Jane Field, Anushka Patel, Dorairaj Prabhakaran, Alice Stan-ton, Diederick E Grobbee, Michiel L Bots, K Srinath Reddy, Raghu Cidambi et al.,“Effects of a fixed-dose combination strategy on adherence and risk factors in patients with or at highrisk of CVD: the UMPIRE randomized clinical trial,” Jama, 2013, 310 (9), 918–929.
Train, Kenneth, “Welfare calculations in discrete choice models when anticipated and experiencedattributes differ: A guide with examples,” Journal of choice modelling, 2015, 16, 15–22.
U.S. Food and Drug Administration, “Guidance for industry: Codevelopment of Two or MoreNew Investigational Drugs for Use in Combination,” Food and Drug Administration Ceter for DrugEvaluation and Research (CDER), 2013.
Vendoti, Deepesh, “Decoding the ban on irrational fixed-dose combination drugs in India,” ObservarResearch Foundation Occasional Paper, 2018.
Verma, Amol A, Wayne Khuu, Mina Tadrous, Tara Gomes, and Muhammad M Mam-dani, “Fixed-dose combination antihypertensive medications, adherence, and clinical outcomes: apopulation-based retrospective cohort study,” PLoS medicine, 2018, 15 (6), e1002584.
World Health Organization, “Guidelines for registration of fixed-dose combination medicinal prod-ucts,” WHO Technical Report Series, 2005, 929, 94–142.
, “World Health Organization model list of essential medicines: 21st list 2019,” Technical Report,World Health Organization 2019.
, “Global Health Estimates 2020: Deaths by Cause, Age, Sex, by Country and by Region, 2000-2019,”Technical Report, World Health Organization 2020.
Zhou, Jidong, “Mixed bundling in oligopoly markets,” Journal of Economic Theory, 2021, p. 105257.
32
Figure 1: Time Trends in FDC Revenue Share and Drug Entries In India
Panel A: FDC Revenue Share over Time
.3.3
5.4
.45
FDC
Rev
enue
Sha
re in
Indi
a
2006m1 2008m1 2010m1 2012m1 2014m1 2016m1 2018m1 2020m1Year-Month
Panel B: Number of New Drugs over Time
010
2030
4050
Num
ber o
f New
Dru
gs
1960 1980 2000 2020Year
Plain Molecules FDC
Notes: This figure shows the time trend of the FDC revenue share and new drug entries in India
based on our main estimation sample. The FDC revenue share shown in Panel A is somewhat lower
than the FDC revenue share in the full sample because of our sampling criteria. In particular, we
exclude mineral supplements and vitamin products, most of which are FDCs.33
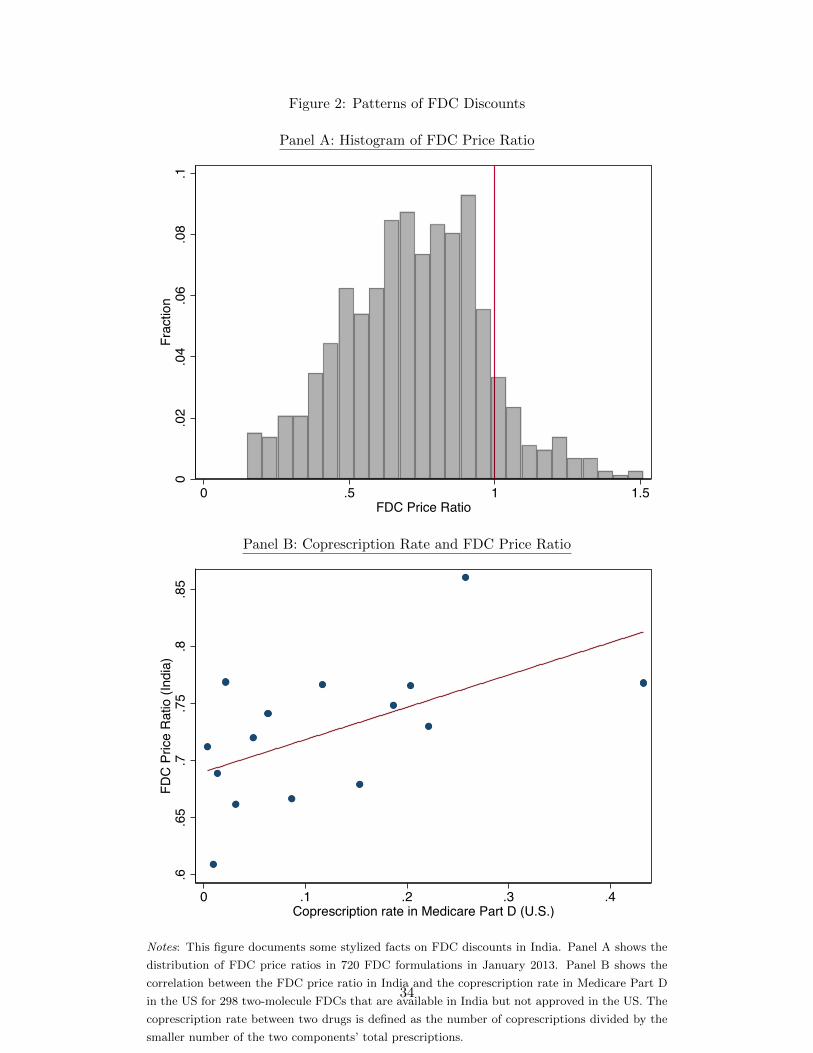
Figure 2: Patterns of FDC Discounts
Panel A: Histogram of FDC Price Ratio
0.0
2.0
4.0
6.0
8.1
Frac
tion
0 .5 1 1.5FDC Price Ratio
Panel B: Coprescription Rate and FDC Price Ratio
.6.6
5.7
.75
.8.8
5FD
C P
rice
Rat
io (I
ndia
)
0 .1 .2 .3 .4Coprescription rate in Medicare Part D (U.S.)
Notes: This figure documents some stylized facts on FDC discounts in India. Panel A shows the
distribution of FDC price ratios in 720 FDC formulations in January 2013. Panel B shows the
correlation between the FDC price ratio in India and the coprescription rate in Medicare Part D
in the US for 298 two-molecule FDCs that are available in India but not approved in the US. The
coprescription rate between two drugs is defined as the number of coprescriptions divided by the
smaller number of the two components’ total prescriptions.
34
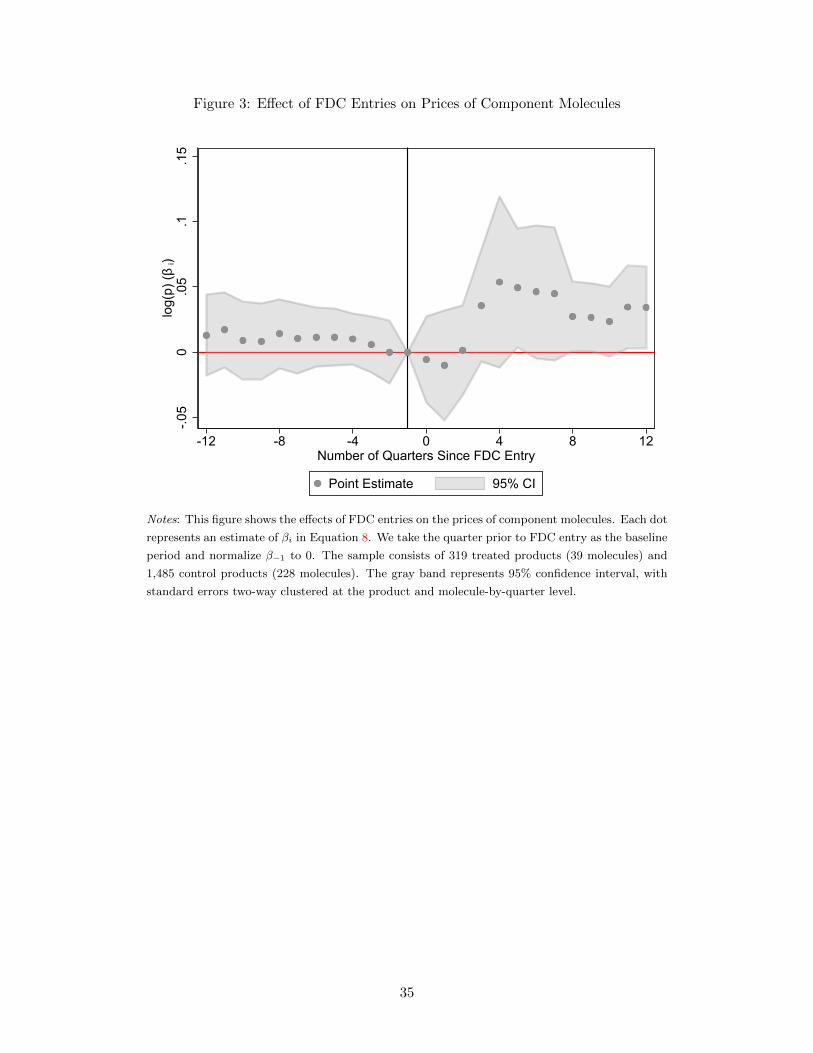
Figure 3: Effect of FDC Entries on Prices of Component Molecules
-.05
0.0
5.1
.15
log(
p) (β
i)
-12 -8 -4 0 4 8 12Number of Quarters Since FDC Entry
Point Estimate 95% CI
Notes: This figure shows the effects of FDC entries on the prices of component molecules. Each dot
represents an estimate of βi in Equation 8. We take the quarter prior to FDC entry as the baseline
period and normalize β−1 to 0. The sample consists of 319 treated products (39 molecules) and
1,485 control products (228 molecules). The gray band represents 95% confidence interval, with
standard errors two-way clustered at the product and molecule-by-quarter level.
35
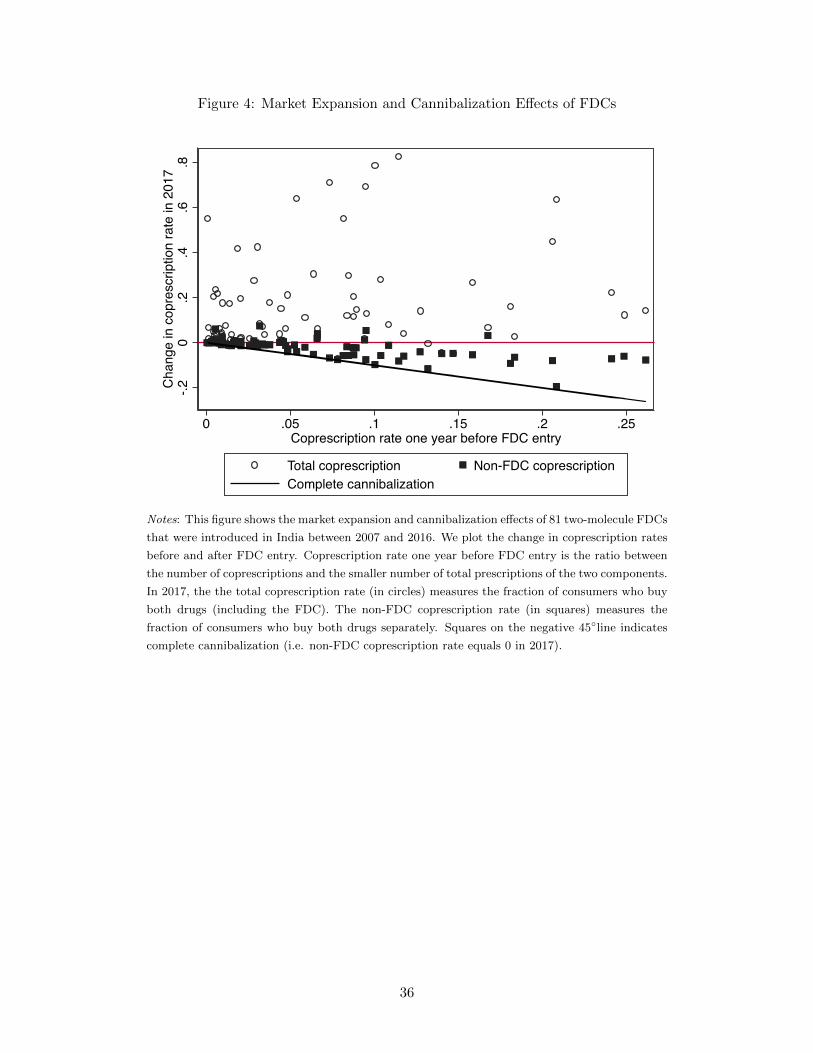
Figure 4: Market Expansion and Cannibalization Effects of FDCs
-.20
.2.4
.6.8
Cha
nge
in c
opre
scrip
tion
rate
in 2
017
0 .05 .1 .15 .2 .25Coprescription rate one year before FDC entry
Total coprescription Non-FDC coprescriptionComplete cannibalization
Notes: This figure shows the market expansion and cannibalization effects of 81 two-molecule FDCs
that were introduced in India between 2007 and 2016. We plot the change in coprescription rates
before and after FDC entry. Coprescription rate one year before FDC entry is the ratio between
the number of coprescriptions and the smaller number of total prescriptions of the two components.
In 2017, the the total coprescription rate (in circles) measures the fraction of consumers who buy
both drugs (including the FDC). The non-FDC coprescription rate (in squares) measures the
fraction of consumers who buy both drugs separately. Squares on the negative 45◦line indicates
complete cannibalization (i.e. non-FDC coprescription rate equals 0 in 2017).
36
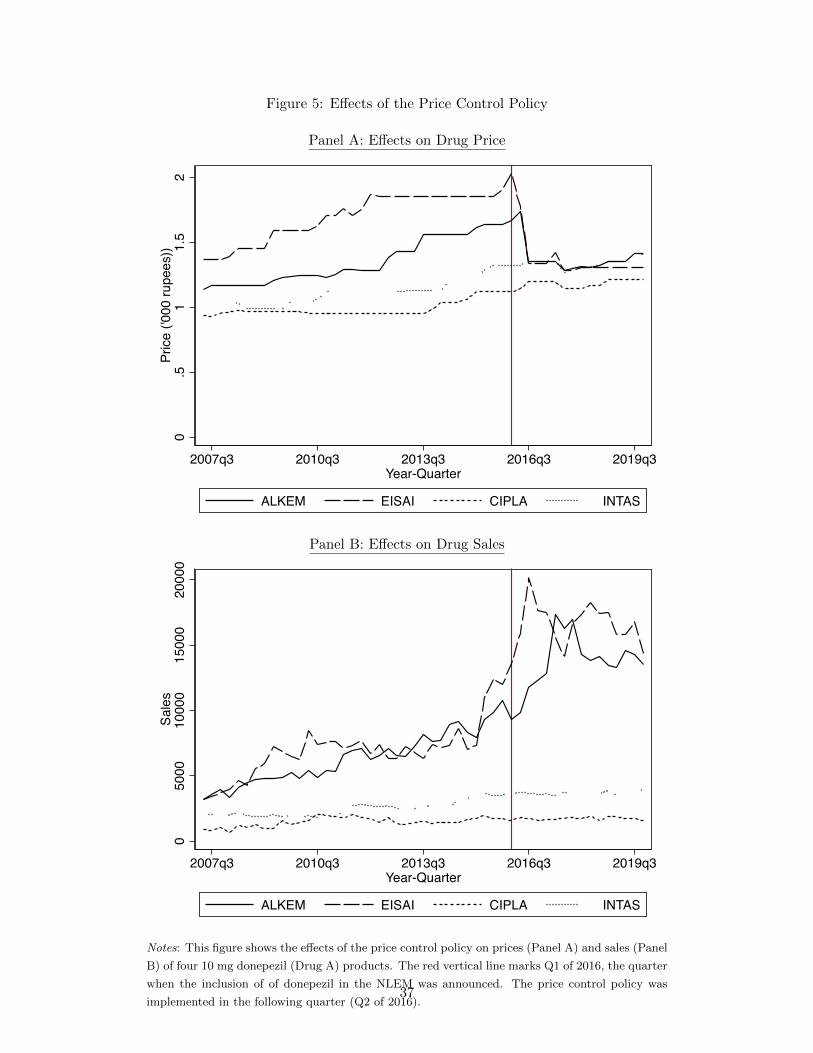
Figure 5: Effects of the Price Control Policy
Panel A: Effects on Drug Price
0.5
11.
52
Pric
e ('0
00 ru
pees
))
2007q3 2010q3 2013q3 2016q3 2019q3Year-Quarter
ALKEM EISAI CIPLA INTAS
Panel B: Effects on Drug Sales
05000
10000
15000
20000
Sales
2007q3 2010q3 2013q3 2016q3 2019q3Year-Quarter
ALKEM EISAI CIPLA INTAS
Notes: This figure shows the effects of the price control policy on prices (Panel A) and sales (Panel
B) of four 10 mg donepezil (Drug A) products. The red vertical line marks Q1 of 2016, the quarter
when the inclusion of of donepezil in the NLEM was announced. The price control policy was
implemented in the following quarter (Q2 of 2016).37
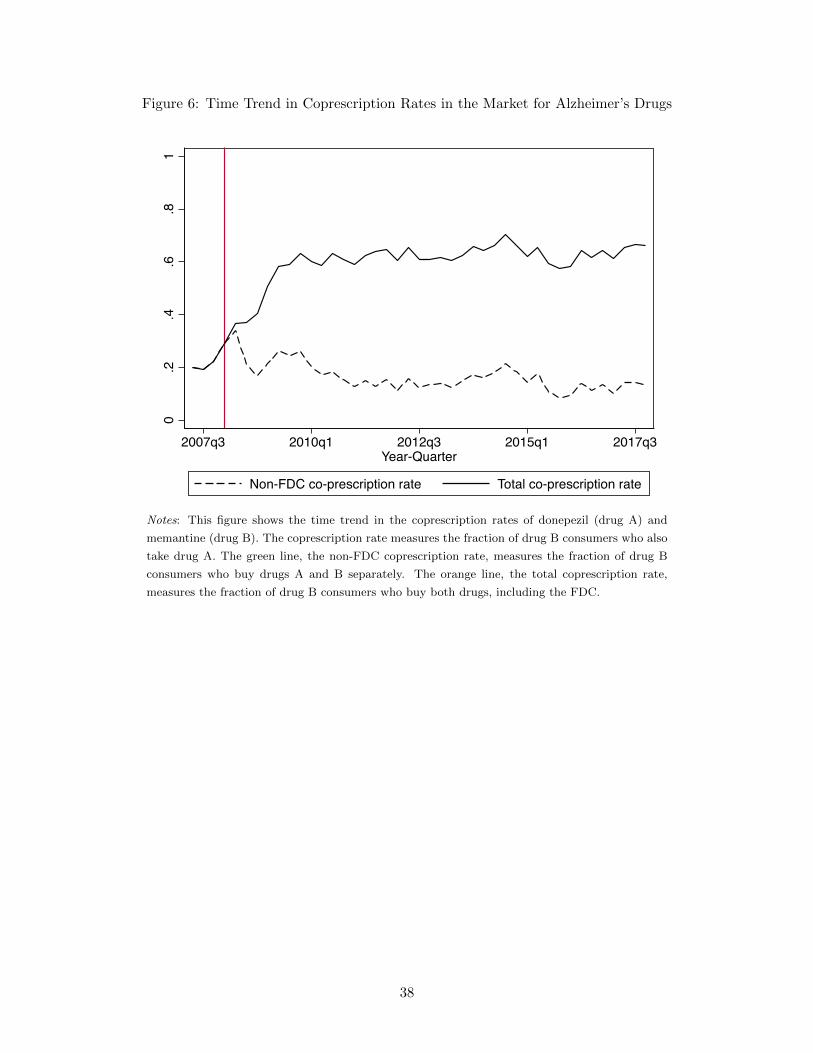
Figure 6: Time Trend in Coprescription Rates in the Market for Alzheimer’s Drugs
0.2
.4.6
.81
2007q3 2010q1 2012q3 2015q1 2017q3Year-Quarter
Non-FDC co-prescription rate Total co-prescription rate
Notes: This figure shows the time trend in the coprescription rates of donepezil (drug A) and
memantine (drug B). The coprescription rate measures the fraction of drug B consumers who also
take drug A. The green line, the non-FDC coprescription rate, measures the fraction of drug B
consumers who buy drugs A and B separately. The orange line, the total coprescription rate,
measures the fraction of drug B consumers who buy both drugs, including the FDC.
38
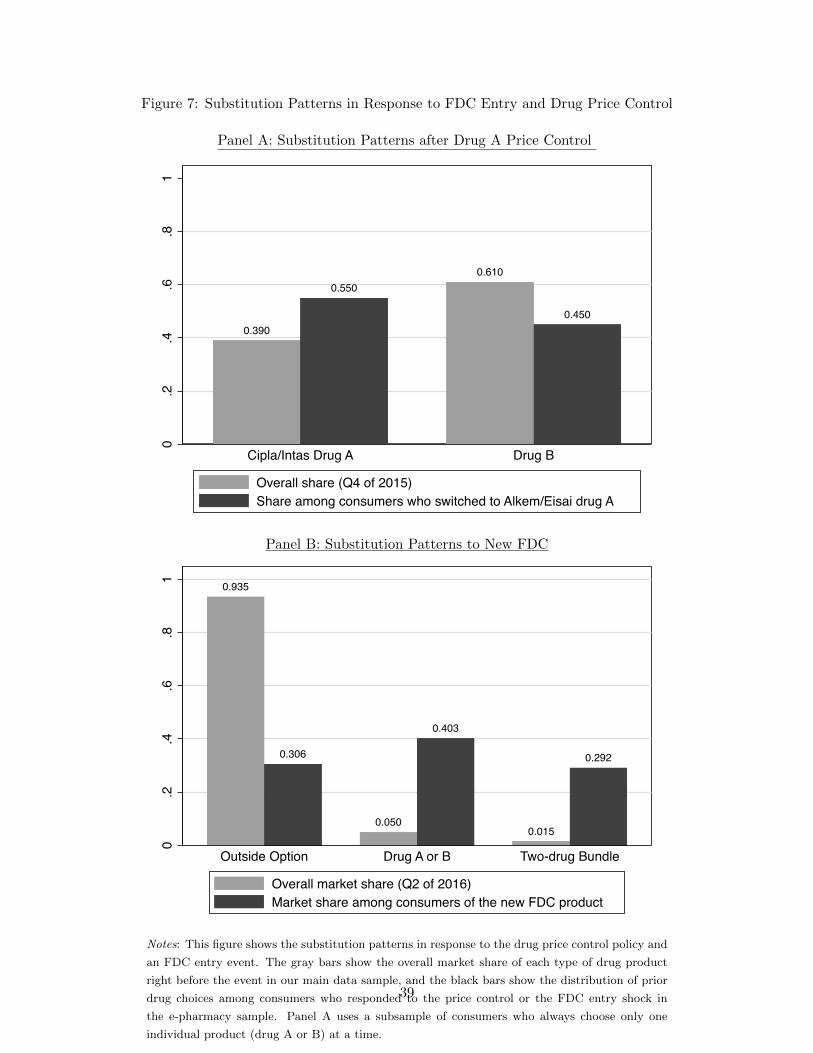
Figure 7: Substitution Patterns in Response to FDC Entry and Drug Price Control
Panel A: Substitution Patterns after Drug A Price Control
0.390
0.5500.610
0.450
0.2
.4.6
.81
Cipla/Intas Drug A Drug B
Overall share (Q4 of 2015)Share among consumers who switched to Alkem/Eisai drug A
Panel B: Substitution Patterns to New FDC
0.935
0.306
0.050
0.403
0.015
0.292
0.2
.4.6
.81
Outside Option Drug A or B Two-drug Bundle
Overall market share (Q2 of 2016)Market share among consumers of the new FDC product
Notes: This figure shows the substitution patterns in response to the drug price control policy and
an FDC entry event. The gray bars show the overall market share of each type of drug product
right before the event in our main data sample, and the black bars show the distribution of prior
drug choices among consumers who responded to the price control or the FDC entry shock in
the e-pharmacy sample. Panel A uses a subsample of consumers who always choose only one
individual product (drug A or B) at a time.
39
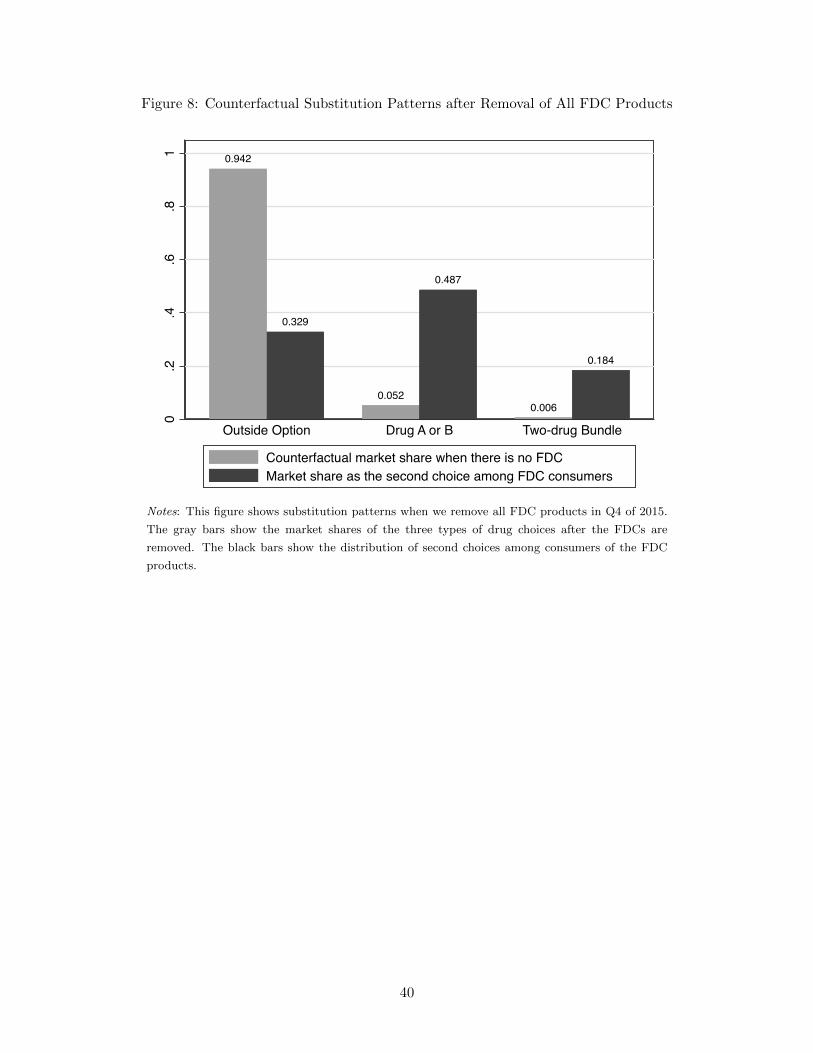
Figure 8: Counterfactual Substitution Patterns after Removal of All FDC Products
0.942
0.329
0.052
0.487
0.006
0.184
0.2
.4.6
.81
Outside Option Drug A or B Two-drug Bundle
Counterfactual market share when there is no FDCMarket share as the second choice among FDC consumers
Notes: This figure shows substitution patterns when we remove all FDC products in Q4 of 2015.
The gray bars show the market shares of the three types of drug choices after the FDCs are
removed. The black bars show the distribution of second choices among consumers of the FDC
products.
40
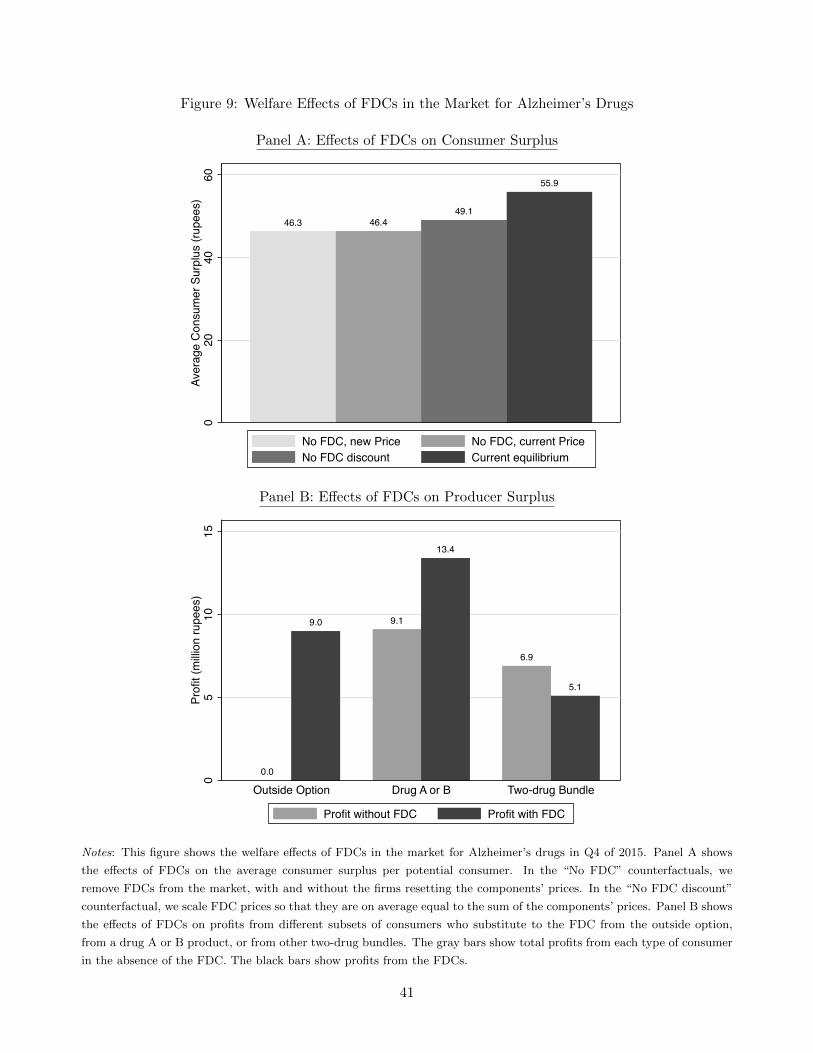
Figure 9: Welfare Effects of FDCs in the Market for Alzheimer’s Drugs
Panel A: Effects of FDCs on Consumer Surplus
46.3 46.449.1
55.9
020
4060
Aver
age
Con
sum
er S
urpl
us (r
upee
s)
No FDC, new Price No FDC, current PriceNo FDC discount Current equilibrium
Panel B: Effects of FDCs on Producer Surplus
0.0
9.0 9.1
13.4
6.9
5.1
05
1015
Profi
t (m
illion
rupe
es)
Outside Option Drug A or B Two-drug Bundle
Profit without FDC Profit with FDC
Notes: This figure shows the welfare effects of FDCs in the market for Alzheimer’s drugs in Q4 of 2015. Panel A shows
the effects of FDCs on the average consumer surplus per potential consumer. In the “No FDC” counterfactuals, we
remove FDCs from the market, with and without the firms resetting the components’ prices. In the “No FDC discount”
counterfactual, we scale FDC prices so that they are on average equal to the sum of the components’ prices. Panel B shows
the effects of FDCs on profits from different subsets of consumers who substitute to the FDC from the outside option,
from a drug A or B product, or from other two-drug bundles. The gray bars show total profits from each type of consumer
in the absence of the FDC. The black bars show profits from the FDCs.
41
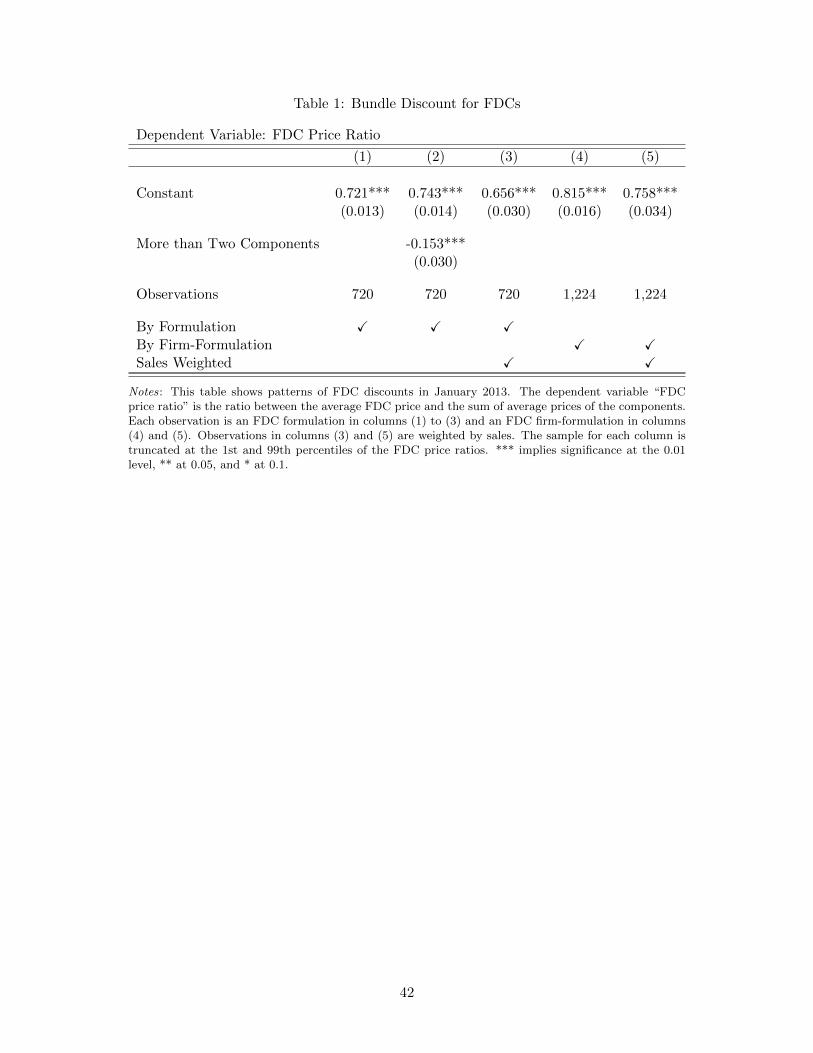
Table 1: Bundle Discount for FDCs
Dependent Variable: FDC Price Ratio
(1) (2) (3) (4) (5)
Constant 0.721*** 0.743*** 0.656*** 0.815*** 0.758***(0.013) (0.014) (0.030) (0.016) (0.034)
More than Two Components -0.153***(0.030)
Observations 720 720 720 1,224 1,224
By Formulation ✓ ✓ ✓By Firm-Formulation ✓ ✓Sales Weighted ✓ ✓
Notes: This table shows patterns of FDC discounts in January 2013. The dependent variable “FDCprice ratio” is the ratio between the average FDC price and the sum of average prices of the components.Each observation is an FDC formulation in columns (1) to (3) and an FDC firm-formulation in columns(4) and (5). Observations in columns (3) and (5) are weighted by sales. The sample for each column istruncated at the 1st and 99th percentiles of the FDC price ratios. *** implies significance at the 0.01level, ** at 0.05, and * at 0.1.
42
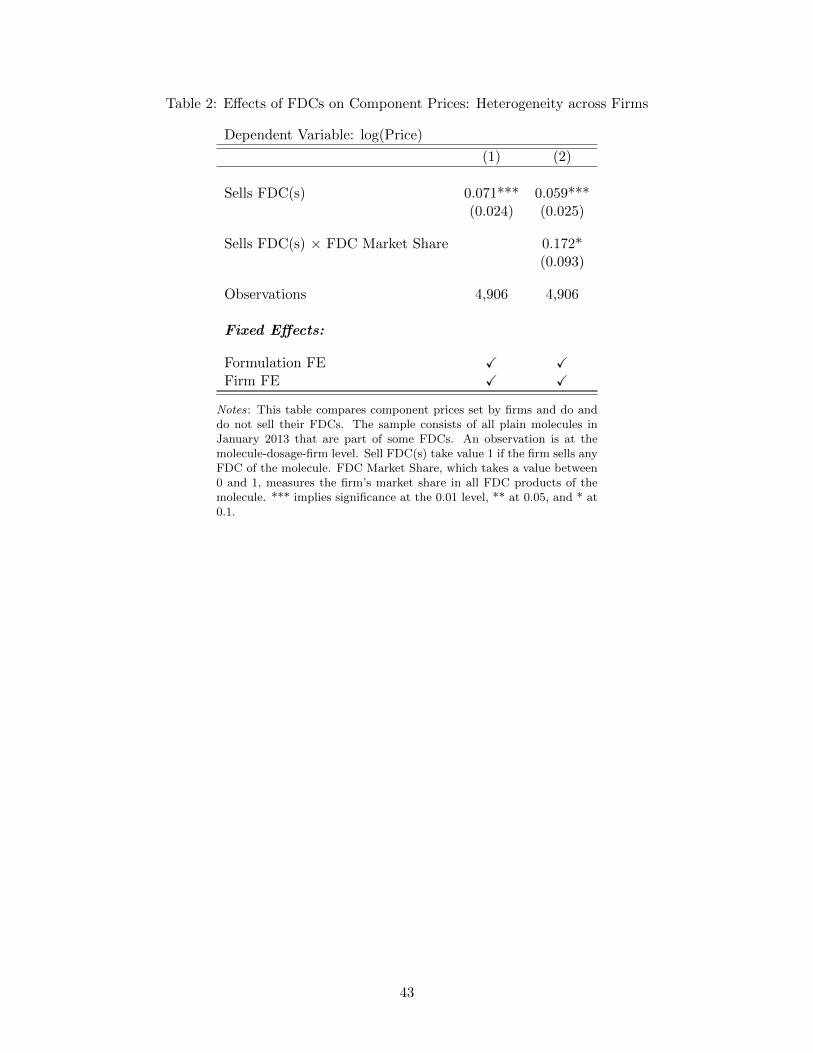
Table 2: Effects of FDCs on Component Prices: Heterogeneity across Firms
Dependent Variable: log(Price)
(1) (2)
Sells FDC(s) 0.071*** 0.059***(0.024) (0.025)
Sells FDC(s) × FDC Market Share 0.172*(0.093)
Observations 4,906 4,906
Fixed Effects:
Formulation FE ✓ ✓Firm FE ✓ ✓
Notes: This table compares component prices set by firms and do anddo not sell their FDCs. The sample consists of all plain molecules inJanuary 2013 that are part of some FDCs. An observation is at themolecule-dosage-firm level. Sell FDC(s) take value 1 if the firm sells anyFDC of the molecule. FDC Market Share, which takes a value between0 and 1, measures the firm’s market share in all FDC products of themolecule. *** implies significance at the 0.01 level, ** at 0.05, and * at0.1.
43
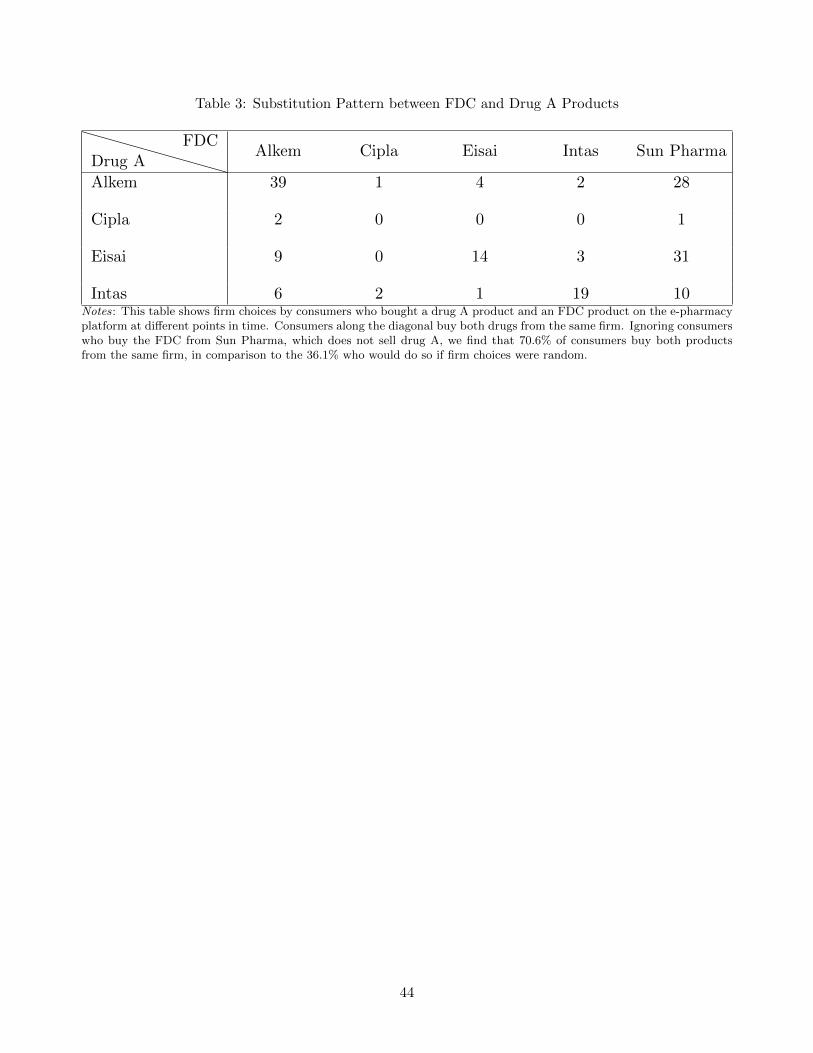
Table 3: Substitution Pattern between FDC and Drug A Products
Drug AFDC
Alkem Cipla Eisai Intas Sun Pharma
Alkem 39 1 4 2 28
Cipla 2 0 0 0 1
Eisai 9 0 14 3 31
Intas 6 2 1 19 10Notes: This table shows firm choices by consumers who bought a drug A product and an FDC product on the e-pharmacyplatform at different points in time. Consumers along the diagonal buy both drugs from the same firm. Ignoring consumerswho buy the FDC from Sun Pharma, which does not sell drug A, we find that 70.6% of consumers buy both productsfrom the same firm, in comparison to the 36.1% who would do so if firm choices were random.
44
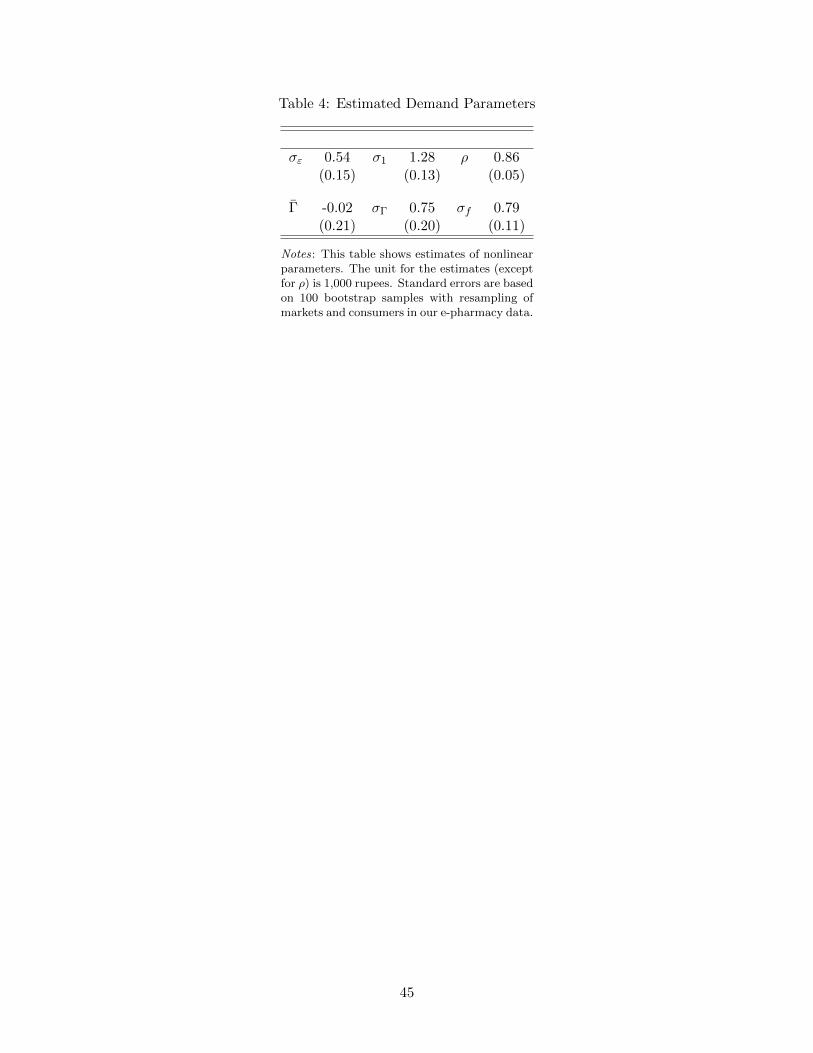
Table 4: Estimated Demand Parameters
σε 0.54 σ1 1.28 ρ 0.86(0.15) (0.13) (0.05)
Γ -0.02 σΓ 0.75 σf 0.79(0.21) (0.20) (0.11)
Notes: This table shows estimates of nonlinearparameters. The unit for the estimates (exceptfor ρ) is 1,000 rupees. Standard errors are basedon 100 bootstrap samples with resampling ofmarkets and consumers in our e-pharmacy data.
45
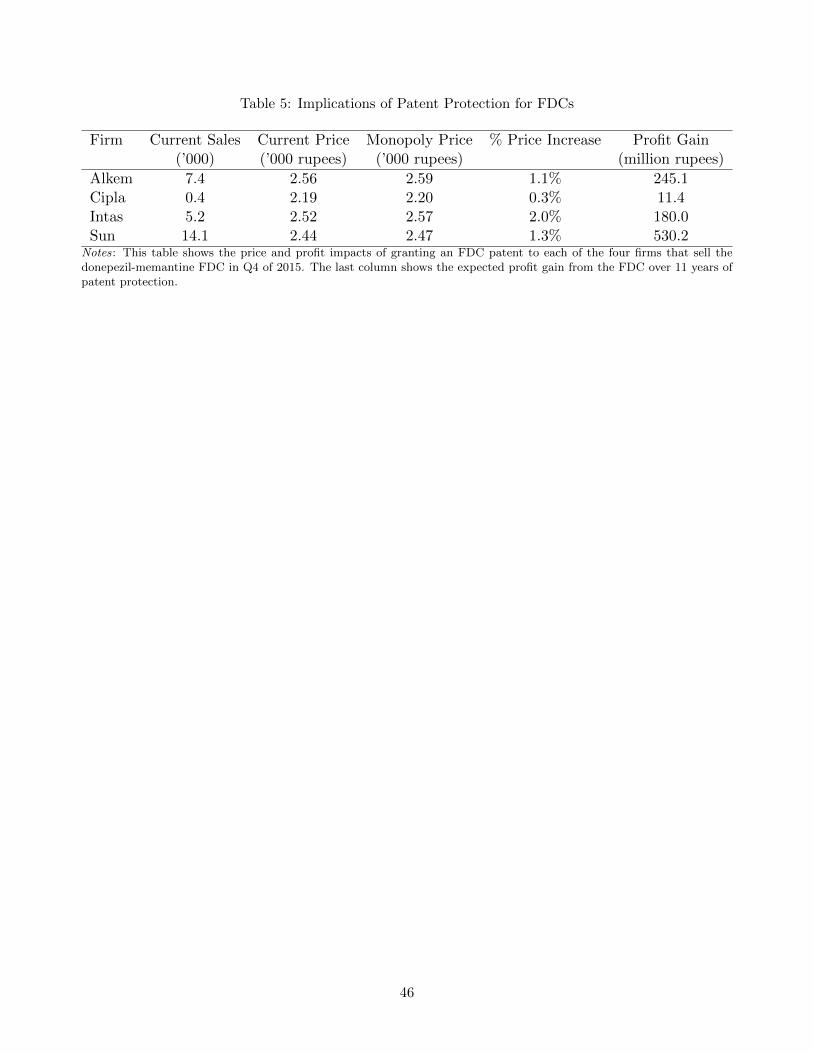
Table 5: Implications of Patent Protection for FDCs
Firm Current Sales Current Price Monopoly Price % Price Increase Profit Gain(’000) (’000 rupees) (’000 rupees) (million rupees)
Alkem 7.4 2.56 2.59 1.1% 245.1Cipla 0.4 2.19 2.20 0.3% 11.4Intas 5.2 2.52 2.57 2.0% 180.0Sun 14.1 2.44 2.47 1.3% 530.2
Notes: This table shows the price and profit impacts of granting an FDC patent to each of the four firms that sell thedonepezil-memantine FDC in Q4 of 2015. The last column shows the expected profit gain from the FDC over 11 years ofpatent protection.
46
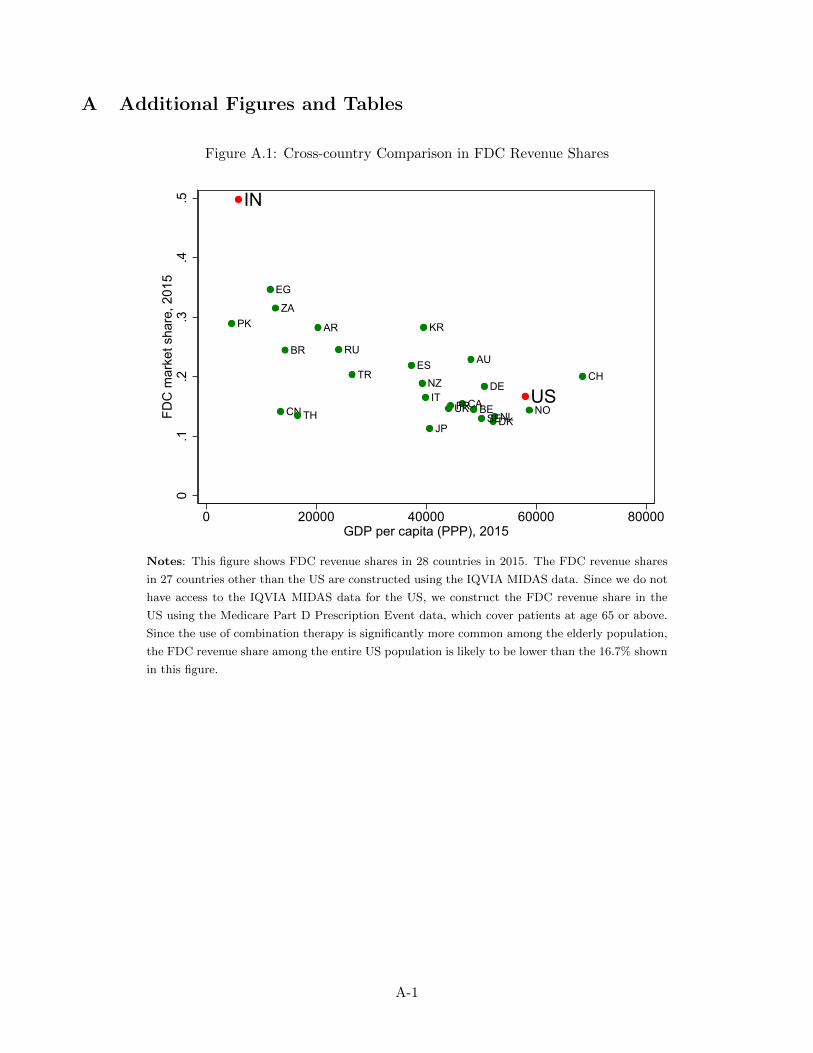
A Additional Figures and Tables
Figure A.1: Cross-country Comparison in FDC Revenue Shares
IN
US
AR
AU
BE
BR
CACN
DK
EG
FR
DEIT
JP
KR
NL
NZ
NO
PK
RU
ZA
ES
SE
CH
TH
TR
UK
0.1
.2.3
.4.5
FDC
mar
ket s
hare
, 201
5
0 20000 40000 60000 80000GDP per capita (PPP), 2015
Notes: This figure shows FDC revenue shares in 28 countries in 2015. The FDC revenue shares
in 27 countries other than the US are constructed using the IQVIA MIDAS data. Since we do not
have access to the IQVIA MIDAS data for the US, we construct the FDC revenue share in the
US using the Medicare Part D Prescription Event data, which cover patients at age 65 or above.
Since the use of combination therapy is significantly more common among the elderly population,
the FDC revenue share among the entire US population is likely to be lower than the 16.7% shown
in this figure.
A-1
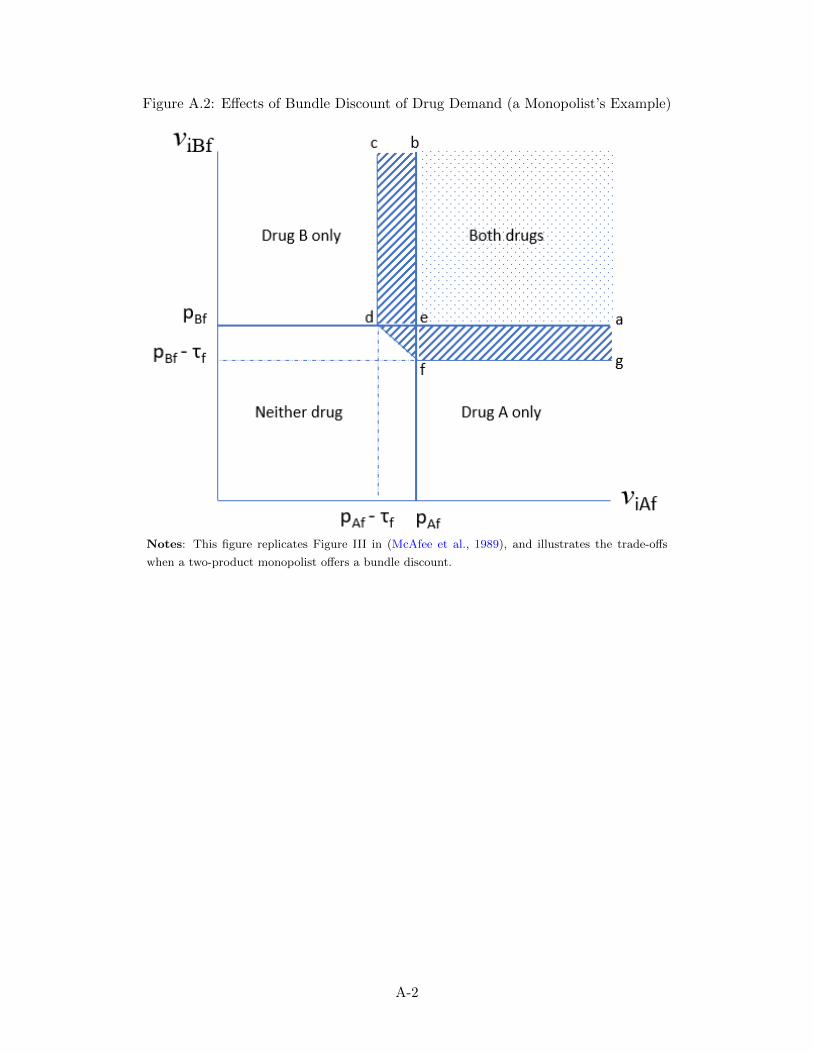
Figure A.2: Effects of Bundle Discount of Drug Demand (a Monopolist’s Example)
Notes: This figure replicates Figure III in (McAfee et al., 1989), and illustrates the trade-offs
when a two-product monopolist offers a bundle discount.
A-2
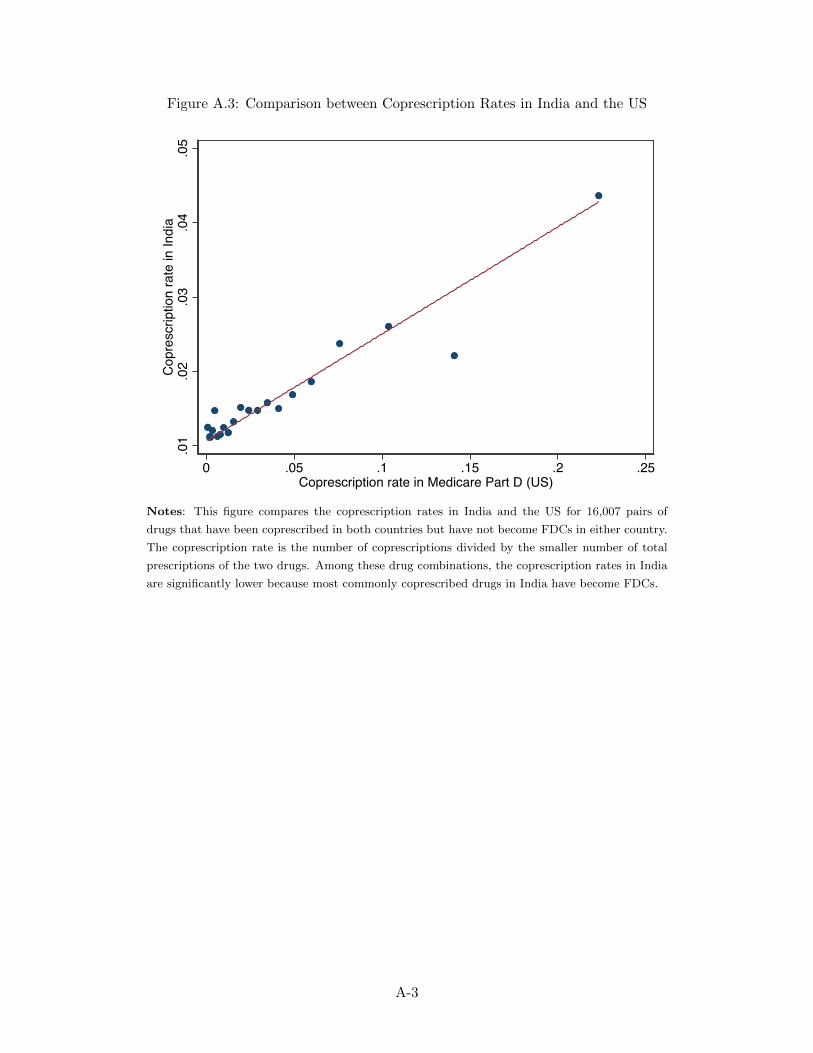
Figure A.3: Comparison between Coprescription Rates in India and the US
.01
.02
.03
.04
.05
Cop
resc
riptio
n ra
te in
Indi
a
0 .05 .1 .15 .2 .25Coprescription rate in Medicare Part D (US)
Notes: This figure compares the coprescription rates in India and the US for 16,007 pairs of
drugs that have been coprescribed in both countries but have not become FDCs in either country.
The coprescription rate is the number of coprescriptions divided by the smaller number of total
prescriptions of the two drugs. Among these drug combinations, the coprescription rates in India
are significantly lower because most commonly coprescribed drugs in India have become FDCs.
A-3
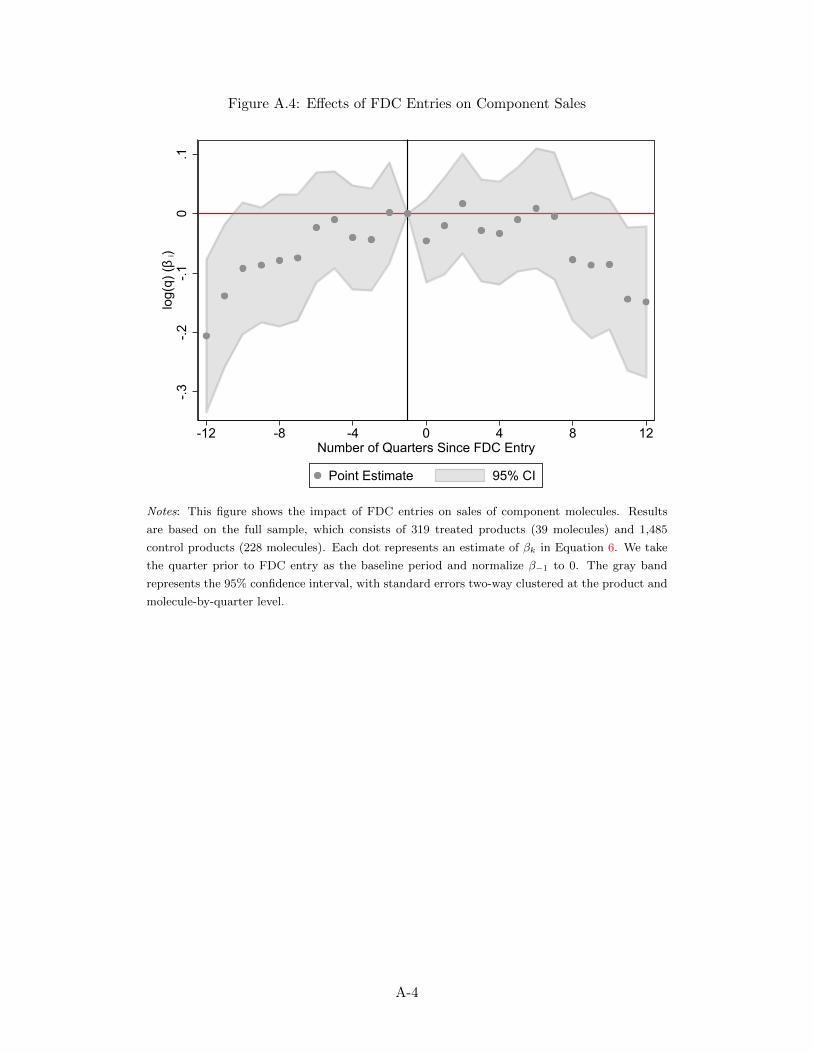
Figure A.4: Effects of FDC Entries on Component Sales
-.3-.2
-.10
.1lo
g(q)
(β i)
-12 -8 -4 0 4 8 12Number of Quarters Since FDC Entry
Point Estimate 95% CI
Notes: This figure shows the impact of FDC entries on sales of component molecules. Results
are based on the full sample, which consists of 319 treated products (39 molecules) and 1,485
control products (228 molecules). Each dot represents an estimate of βk in Equation 6. We take
the quarter prior to FDC entry as the baseline period and normalize β−1 to 0. The gray band
represents the 95% confidence interval, with standard errors two-way clustered at the product and
molecule-by-quarter level.
A-4
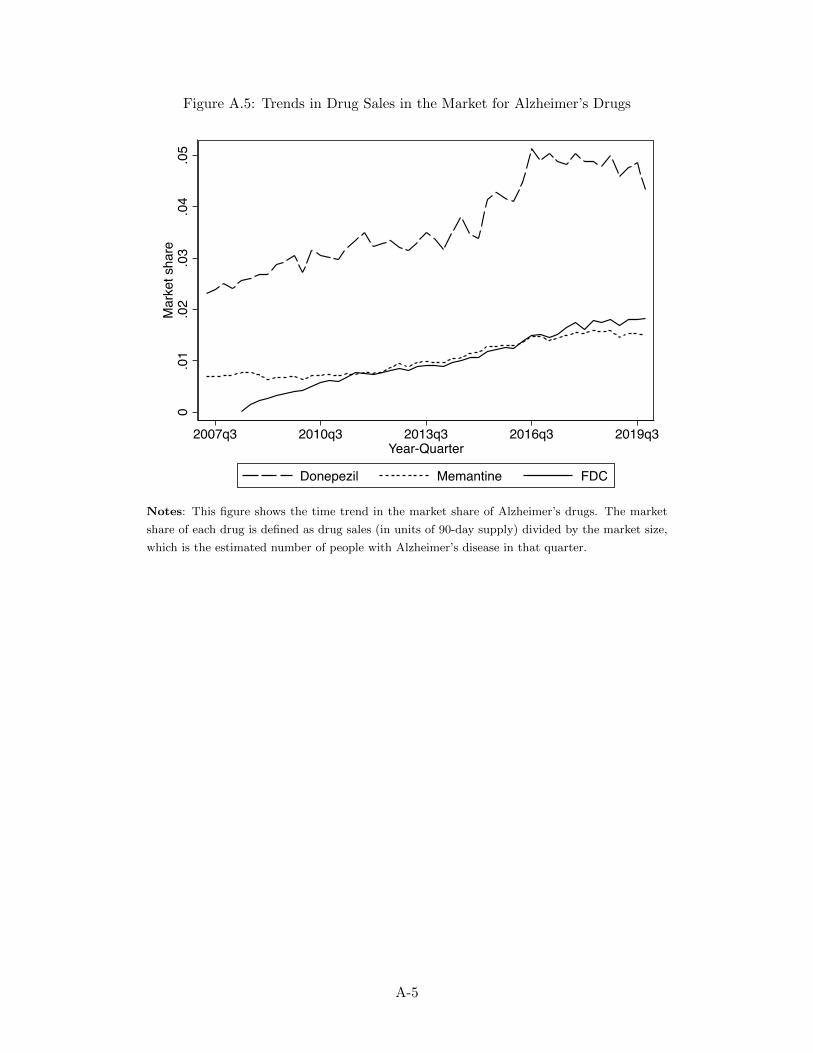
Figure A.5: Trends in Drug Sales in the Market for Alzheimer’s Drugs
0.0
1.0
2.0
3.0
4.0
5M
arke
t sha
re
2007q3 2010q3 2013q3 2016q3 2019q3Year-Quarter
Donepezil Memantine FDC
Notes: This figure shows the time trend in the market share of Alzheimer’s drugs. The market
share of each drug is defined as drug sales (in units of 90-day supply) divided by the market size,
which is the estimated number of people with Alzheimer’s disease in that quarter.
A-5
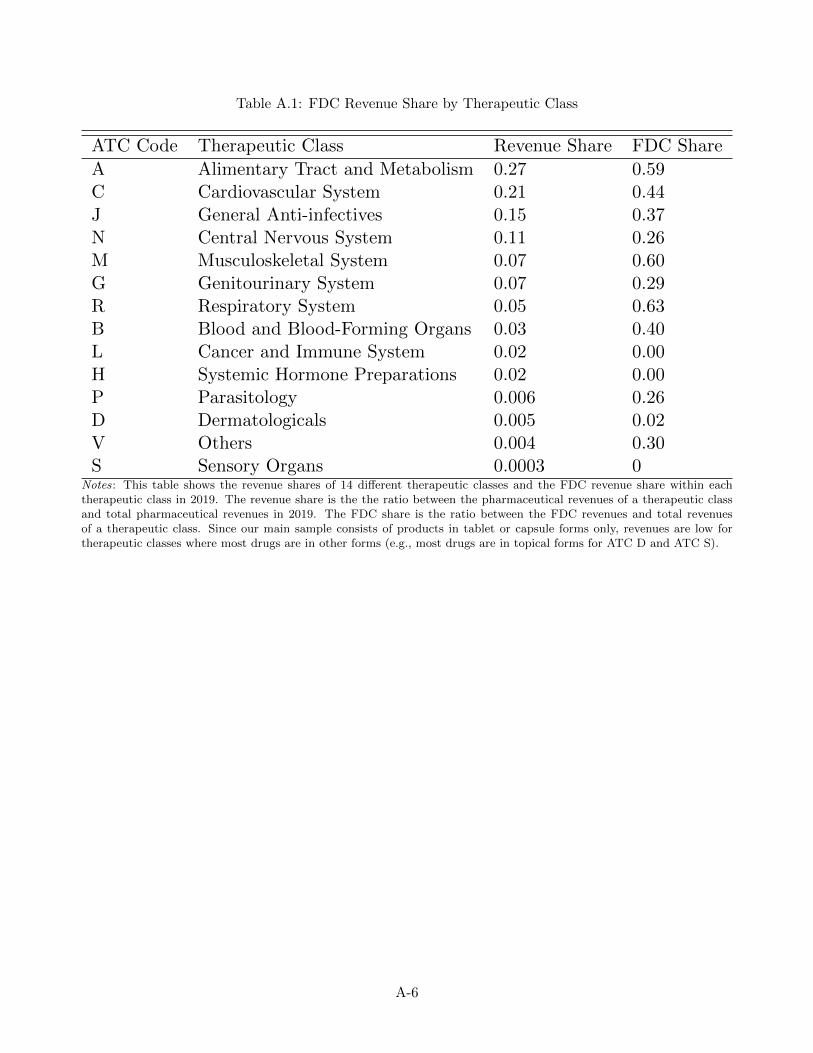
Table A.1: FDC Revenue Share by Therapeutic Class
ATC Code Therapeutic Class Revenue Share FDC Share
A Alimentary Tract and Metabolism 0.27 0.59C Cardiovascular System 0.21 0.44J General Anti-infectives 0.15 0.37N Central Nervous System 0.11 0.26M Musculoskeletal System 0.07 0.60G Genitourinary System 0.07 0.29R Respiratory System 0.05 0.63B Blood and Blood-Forming Organs 0.03 0.40L Cancer and Immune System 0.02 0.00H Systemic Hormone Preparations 0.02 0.00P Parasitology 0.006 0.26D Dermatologicals 0.005 0.02V Others 0.004 0.30S Sensory Organs 0.0003 0
Notes: This table shows the revenue shares of 14 different therapeutic classes and the FDC revenue share within eachtherapeutic class in 2019. The revenue share is the the ratio between the pharmaceutical revenues of a therapeutic classand total pharmaceutical revenues in 2019. The FDC share is the ratio between the FDC revenues and total revenuesof a therapeutic class. Since our main sample consists of products in tablet or capsule forms only, revenues are low fortherapeutic classes where most drugs are in other forms (e.g., most drugs are in topical forms for ATC D and ATC S).
A-6
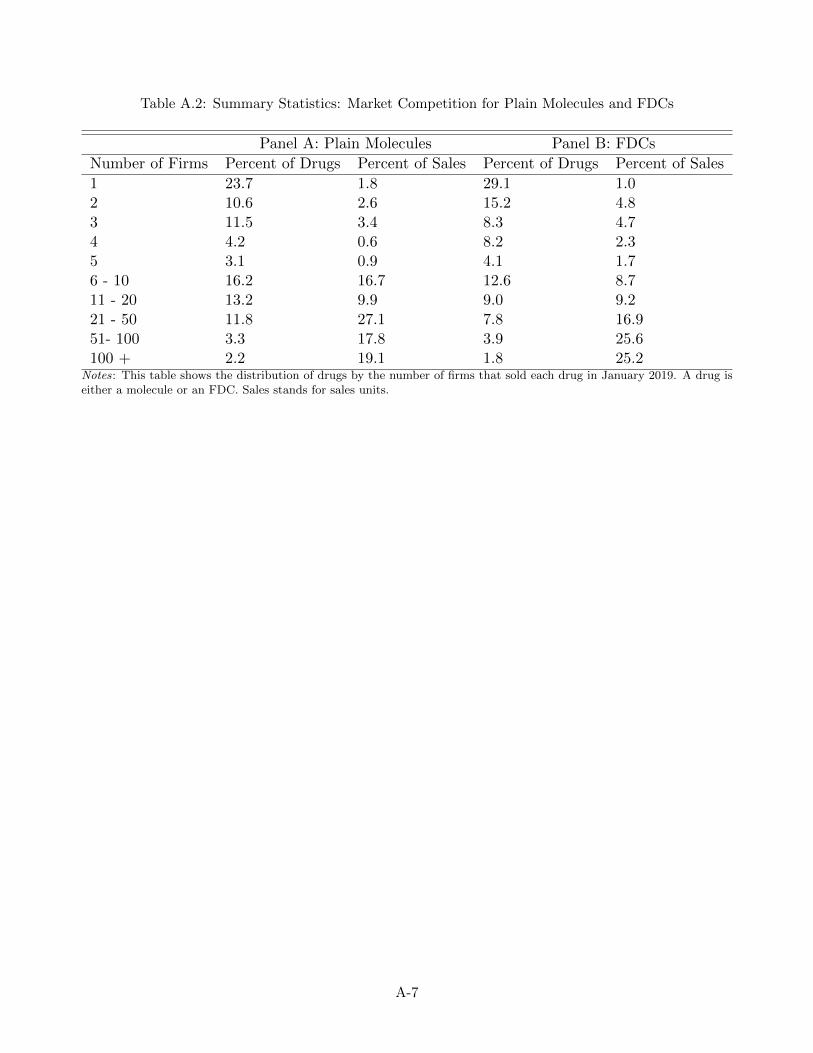
Table A.2: Summary Statistics: Market Competition for Plain Molecules and FDCs
Panel A: Plain Molecules Panel B: FDCs
Number of Firms Percent of Drugs Percent of Sales Percent of Drugs Percent of Sales
1 23.7 1.8 29.1 1.02 10.6 2.6 15.2 4.83 11.5 3.4 8.3 4.74 4.2 0.6 8.2 2.35 3.1 0.9 4.1 1.76 - 10 16.2 16.7 12.6 8.711 - 20 13.2 9.9 9.0 9.221 - 50 11.8 27.1 7.8 16.951- 100 3.3 17.8 3.9 25.6100 + 2.2 19.1 1.8 25.2
Notes: This table shows the distribution of drugs by the number of firms that sold each drug in January 2019. A drug iseither a molecule or an FDC. Sales stands for sales units.
A-7
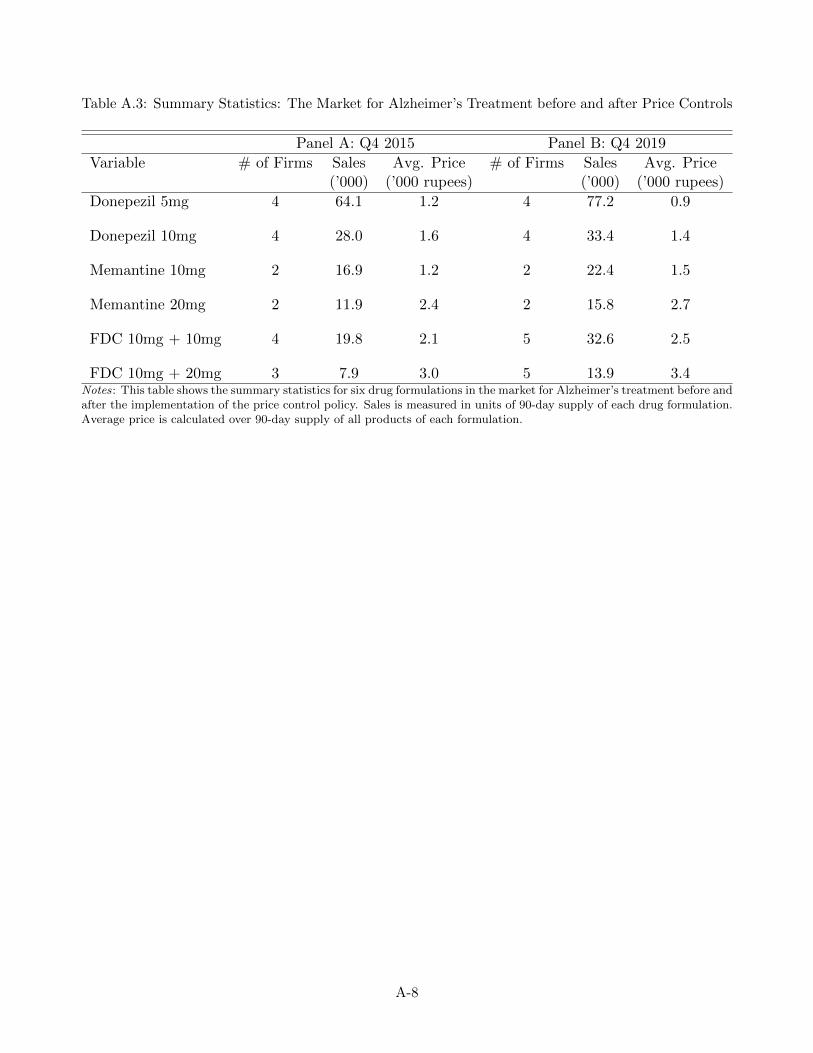
Table A.3: Summary Statistics: The Market for Alzheimer’s Treatment before and after Price Controls
Panel A: Q4 2015 Panel B: Q4 2019
Variable # of Firms Sales Avg. Price # of Firms Sales Avg. Price(’000) (’000 rupees) (’000) (’000 rupees)
Donepezil 5mg 4 64.1 1.2 4 77.2 0.9
Donepezil 10mg 4 28.0 1.6 4 33.4 1.4
Memantine 10mg 2 16.9 1.2 2 22.4 1.5
Memantine 20mg 2 11.9 2.4 2 15.8 2.7
FDC 10mg + 10mg 4 19.8 2.1 5 32.6 2.5
FDC 10mg + 20mg 3 7.9 3.0 5 13.9 3.4Notes: This table shows the summary statistics for six drug formulations in the market for Alzheimer’s treatment before andafter the implementation of the price control policy. Sales is measured in units of 90-day supply of each drug formulation.Average price is calculated over 90-day supply of all products of each formulation.
A-8
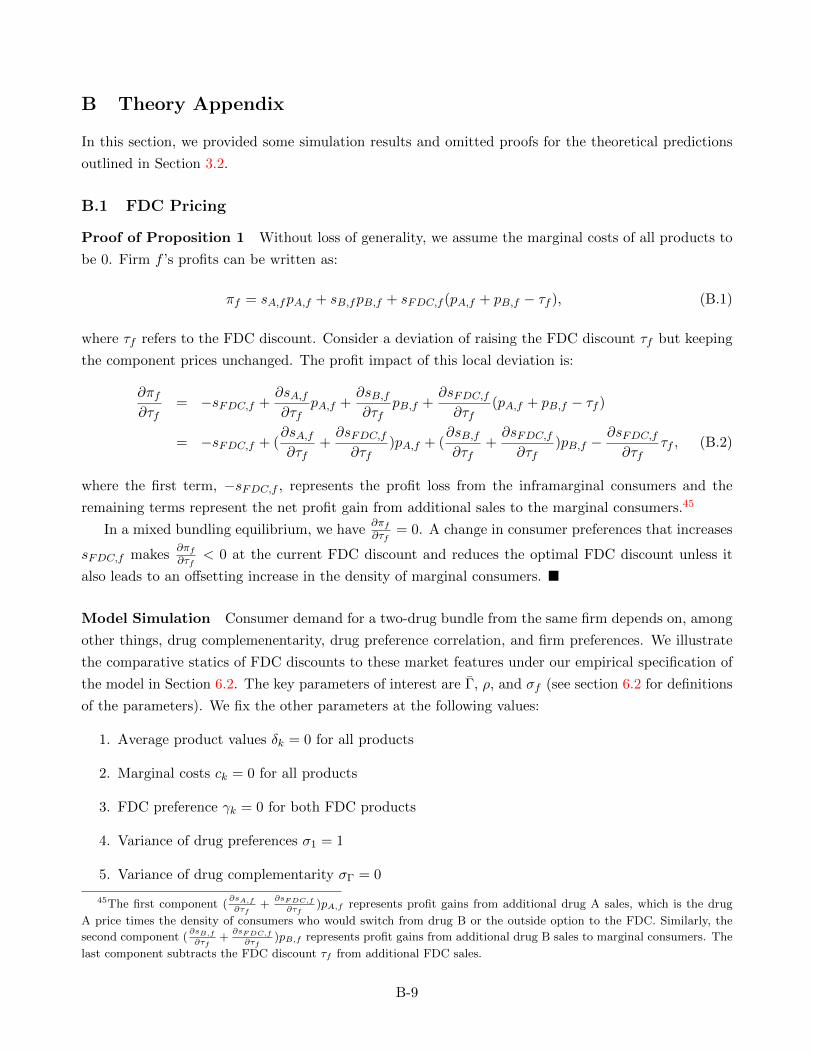
B Theory Appendix
In this section, we provided some simulation results and omitted proofs for the theoretical predictions
outlined in Section 3.2.
B.1 FDC Pricing
Proof of Proposition 1 Without loss of generality, we assume the marginal costs of all products to
be 0. Firm f ’s profits can be written as:
πf = sA,fpA,f + sB,fpB,f + sFDC,f (pA,f + pB,f − τf ), (B.1)
where τf refers to the FDC discount. Consider a deviation of raising the FDC discount τf but keeping
the component prices unchanged. The profit impact of this local deviation is:
∂πf∂τf
= −sFDC,f +∂sA,f
∂τfpA,f +
∂sB,f
∂τfpB,f +
∂sFDC,f
∂τf(pA,f + pB,f − τf )
= −sFDC,f + (∂sA,f
∂τf+
∂sFDC,f
∂τf)pA,f + (
∂sB,f
∂τf+
∂sFDC,f
∂τf)pB,f −
∂sFDC,f
∂τfτf , (B.2)
where the first term, −sFDC,f , represents the profit loss from the inframarginal consumers and the
remaining terms represent the net profit gain from additional sales to the marginal consumers.45
In a mixed bundling equilibrium, we have∂πf
∂τf= 0. A change in consumer preferences that increases
sFDC,f makes∂πf
∂τf< 0 at the current FDC discount and reduces the optimal FDC discount unless it
also leads to an offsetting increase in the density of marginal consumers. ■
Model Simulation Consumer demand for a two-drug bundle from the same firm depends on, among
other things, drug complemenentarity, drug preference correlation, and firm preferences. We illustrate
the comparative statics of FDC discounts to these market features under our empirical specification of
the model in Section 6.2. The key parameters of interest are Γ, ρ, and σf (see section 6.2 for definitions
of the parameters). We fix the other parameters at the following values:
1. Average product values δk = 0 for all products
2. Marginal costs ck = 0 for all products
3. FDC preference γk = 0 for both FDC products
4. Variance of drug preferences σ1 = 1
5. Variance of drug complementarity σΓ = 0
45The first component (∂sA,f
∂τf+
∂sFDC,f
∂τf)pA,f represents profit gains from additional drug A sales, which is the drug
A price times the density of consumers who would switch from drug B or the outside option to the FDC. Similarly, the
second component (∂sB,f
∂τf+
∂sFDC,f
∂τf)pB,f represents profit gains from additional drug B sales to marginal consumers. The
last component subtracts the FDC discount τf from additional FDC sales.
B-9
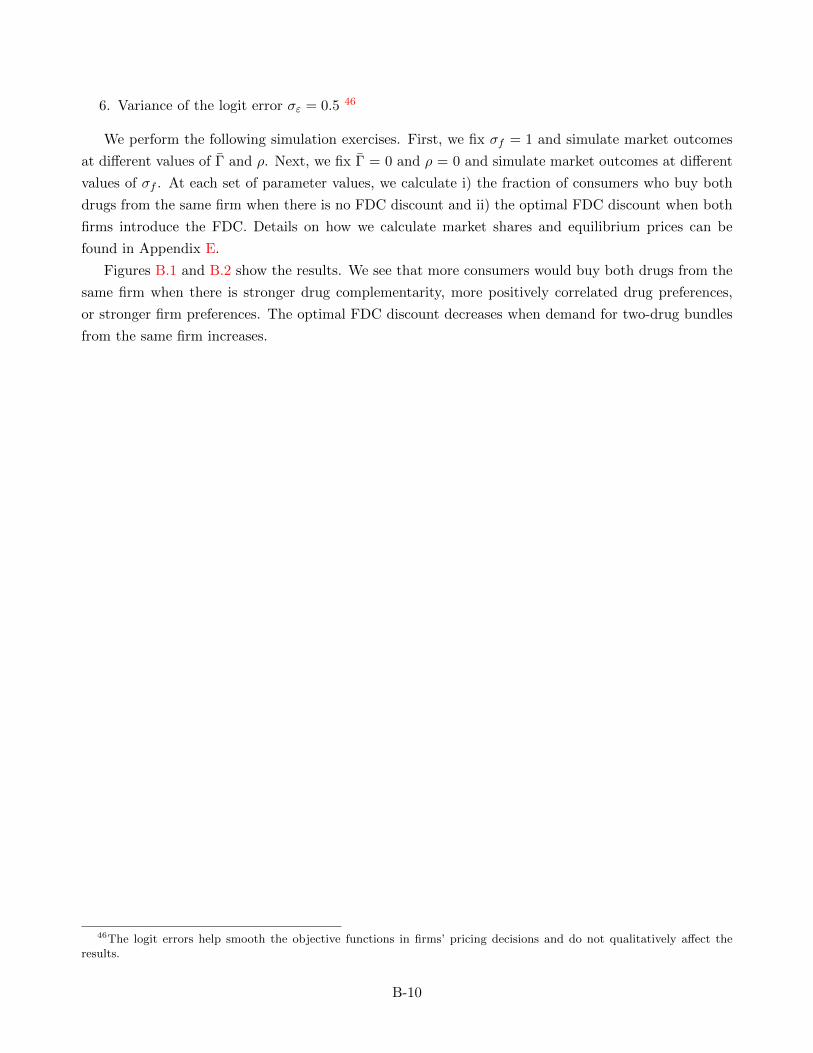
6. Variance of the logit error σε = 0.5 46
We perform the following simulation exercises. First, we fix σf = 1 and simulate market outcomes
at different values of Γ and ρ. Next, we fix Γ = 0 and ρ = 0 and simulate market outcomes at different
values of σf . At each set of parameter values, we calculate i) the fraction of consumers who buy both
drugs from the same firm when there is no FDC discount and ii) the optimal FDC discount when both
firms introduce the FDC. Details on how we calculate market shares and equilibrium prices can be
found in Appendix E.
Figures B.1 and B.2 show the results. We see that more consumers would buy both drugs from the
same firm when there is stronger drug complementarity, more positively correlated drug preferences,
or stronger firm preferences. The optimal FDC discount decreases when demand for two-drug bundles
from the same firm increases.
46The logit errors help smooth the objective functions in firms’ pricing decisions and do not qualitatively affect theresults.
B-10
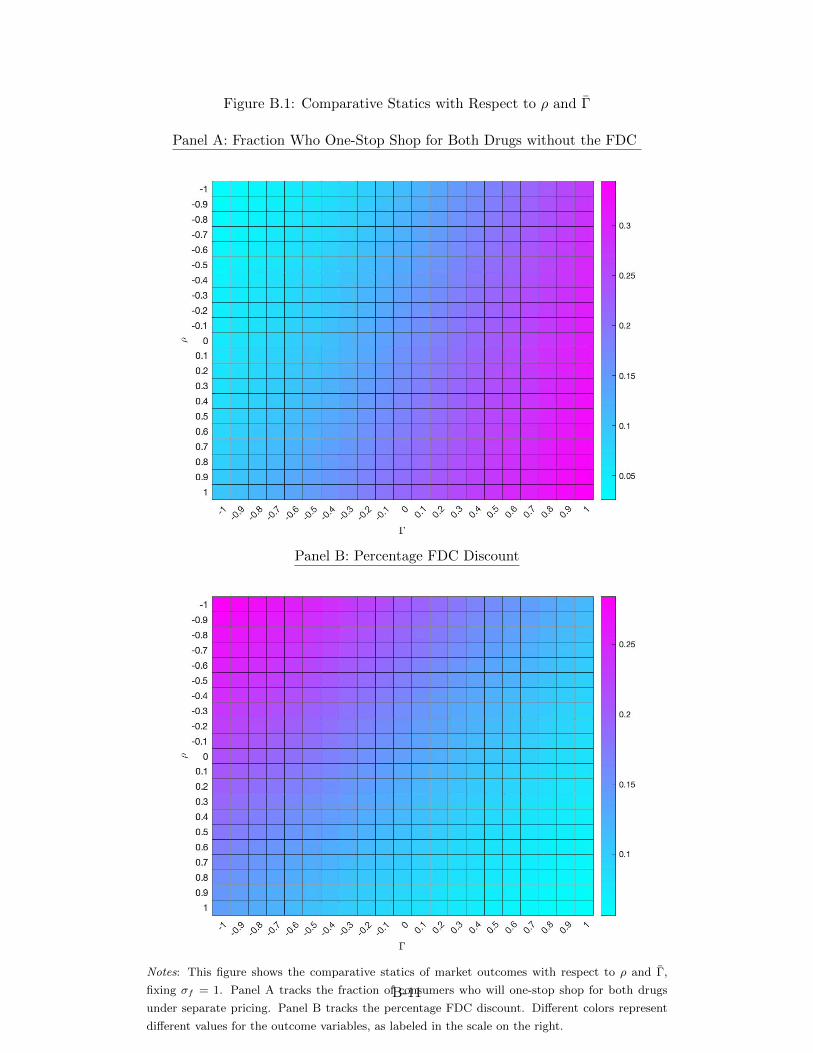
Figure B.1: Comparative Statics with Respect to ρ and Γ
Panel A: Fraction Who One-Stop Shop for Both Drugs without the FDC
Panel B: Percentage FDC Discount
Notes: This figure shows the comparative statics of market outcomes with respect to ρ and Γ,
fixing σf = 1. Panel A tracks the fraction of consumers who will one-stop shop for both drugs
under separate pricing. Panel B tracks the percentage FDC discount. Different colors represent
different values for the outcome variables, as labeled in the scale on the right.
B-11
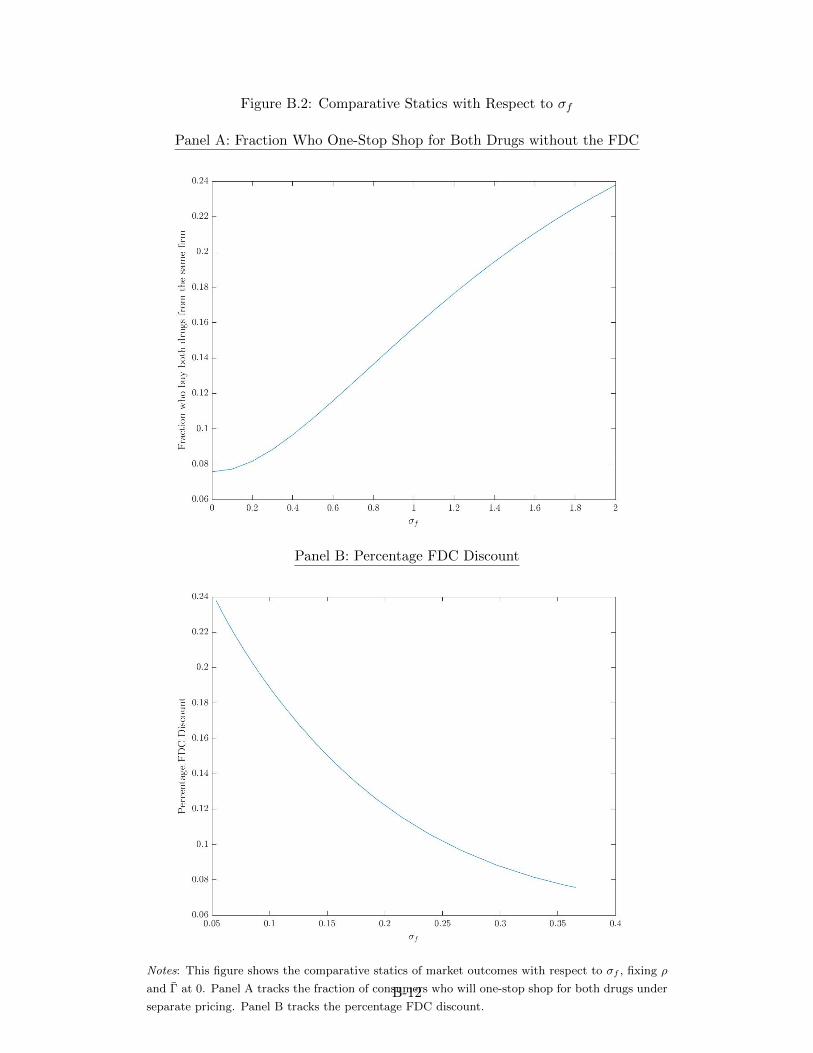
Figure B.2: Comparative Statics with Respect to σf
Panel A: Fraction Who One-Stop Shop for Both Drugs without the FDC
Panel B: Percentage FDC Discount
Notes: This figure shows the comparative statics of market outcomes with respect to σf , fixing ρ
and Γ at 0. Panel A tracks the fraction of consumers who will one-stop shop for both drugs under
separate pricing. Panel B tracks the percentage FDC discount.B-12
B.2 The Welfare Effects of FDCs
Proof of Proposition 2 When the FDC discount leads to additional sales, it increases total social
welfare if and only if the consumer values the additional product more than its marginal cost. Without
loss of generality, consider a case where a consumer substitutes from drug A to the FDC from the same
firm f . Let viBf denote the incremental value of the drug B product to consumer i, which includes its
product value and drug complementarity Γi. We have:
viBf ≥ pFDC,f − pA,f ≥ cB,f . (B.3)
The first inequality follows from revealed preference: consumer i’s incremental value from drug B is
weakly higher than the additional price she needs to pay for the bundle. The second inequality follows
from the assumption that no component is priced below its marginal cost. As a result, viBf ≥ cB,f , and
the additional drug B sales increase social welfare. By a similar intuition, social welfare increases when
consumers substitute from the outside option to an FDC product.
Among consumers who substitute from other two-drug bundles to FDCs, total welfare is determined
solely by the match quality between consumers and products. FDC discounts may lead to excessive
one-stop shopping and reduce social welfare.47 ■
47Without assuming symmetry between firms, consumer welfare may also increase when FDC discounts cause consumersto switch to one-stop shop at a firm that
B-13
C Data Appendix
In this section, we provide additional details on our data preparations, with a focus on several data
issues and the way that we address them.
C.1 Primary Drug Price and Sales Data
Inconsistency between Data Segments We receive the AIOCD drug price and sales data in three
separate segments: April 2007 to October 2013, January 2011 to December 2014, and January 2015 to
December 2019.48 There are several data discrepancies between different segments. First, SKU names
may change between segments. Second, we observe drug sales in 23 different regions in the first segment
but in 30 different regions in the other two segments.49 Finally, there are occasional large changes
in drug sales for some SKUs at the boundaries of the segments. Consultation with the data provider
reveals that AIOCD makes corrections to its projections after receiving feedback from pharmaceutical
companies but does not apply these corrections to the cached data on the earlier segments.
While we are not able to fix all the data issues for all the drug products, we take several precautions
to ensure that these issues do not interfere with our empirical analysis. First, we define a drug product
at the molecule-dosage-firm level. This allows us to link products over time even when we cannot match
the SKU names. Second, for most of our empirical analysis that involves panel data, we focus on one
data segment for consistency (e.g., we use the first segment for the FDC entry event study). Third, for
exercises where we need to track drug products over all 13 years (e.g., for the Alzheimer’s drug market
in the model estimation), we cross-reference with other data sources such as IQVIA coprescription data
and IQVIA MIDAS drug sales data and verify the data consistency.
Missing or Incorrect Dosage Information For a subset of SKUs, especially the FDC SKUs, the
dosage information may be missing or incorrect. We manually check the dosage information for each
individual SKU against data from several major e-pharmacy websites (e.g., Tata 1mg, MedPlus) and
fill in missing data or correct obvious data errors.50 For example, we make corrections for 1,273 out of
15,907 FDC SKUs, with 1,140 missing dosages and 133 mistakes, in the third data segment between
January 2015 and December 2019.
Linking Datasets We link our main data set with multiple ancillary data sets, including the National
Lists of Essential Medicines from 2011 and 2015 (i.e., the list of drugs under price control), the list of
FDCs covered by the 2016 FDC ban, the IQVIA coprescription data, the Tata 1mg e-pharmacy data,
the Medicare Part D Prescription Drug Event data, and the FDA Orange Book data on new drug
approvals. Drug names may differ across different data sets, and data linking is done with manually
prepared crosswalks.
48AIOCD revised its data reporting format in 2013 and did backdated correction through January 2011.49The 30 regions are finer cuts of the 23 regions based on the same underlying micro data. We can therefore aggregate
the data to the 23 regions in the second and third segments if needed.50The most common data error is that the dosages of two components in an FDC SKU are swapped.
C-14

C.2 Ancillary Data Sets
IQVIA Coprescription Data One major issue in the IQVIA coprescription data is that they report
the prescription information only for a subset of commonly prescribed drugs and combine less commonly
prescribed drugs into categories (e.g., other beta blockers, other antidiabetic combinations). For this
reason, we are able to match 782 out of 1,626 (48%) of the drugs in our main sample to the coprescription
data. The incomplete match creates some challenges in constructing the coprescription rates after FDC
entry because for many new FDCs, we do not observe the FDC prescriptions until many years after
they were introduced.
To address this issue, we use the aggregate drug sales data to complement the coprescription data
in constructing the coprescription rates. Consider a setting where drug B is less commonly prescribed
than drug A. We construct the coprescription rates between drugs A and B using the following steps:
1. In each quarter t, construct the baseline coprescription rate as the ratio between the coprescription
count and drug B prescription count
2. Multiply the baseline coprescription rate with drug B sales sB,t to recover the separate sales of
the two drugs sAB,t
3. The total coprescription rate issAB,t+sFDC,t
sB,t+sFDC,t
4. The non-FDC coprescription rate issAB,t
sB,t+sFDC,t
Tata 1mg E-Pharmacy Data Our e-pharmacy data include all purchases of diabetic and Alzheimer’s
drugs on Tata 1mg. These two therapeutic markets accounted for 13% of total pharmaceutical revenue
in India in 2019. The e-pharmacy data are sparse for earlier years, but sales on the platform grew
rapidly over time. In 2019, Tata 1mg accounted for about 0.5% of all drugs sales in India.
In Figure C.1, we show that our coprescription data and e-pharmacy data are broadly consistent
with our main data sample in terms of product-level sales.
Data on Drug Approvals in the US We review new drug applications (NDAs) for 127 new FDCs
approved by the US FDA since 2,000. For each FDC, we manually go through the medical review reports
on Drugs@FDA, the FDA database for new drug applications and approvals. We record information
on the number of clinical trials and the phase of each trial, the number of human subjects involved,
and the number of years between applications and approval. In addition, we collect information on
drug patents and market exclusivity from the Approved Drug Products with Therapeutic Equivalence
Evaluations (commonly known as the Orange Book), which is an annual publication by the US FDA
on drug approvals and patents.
C-15
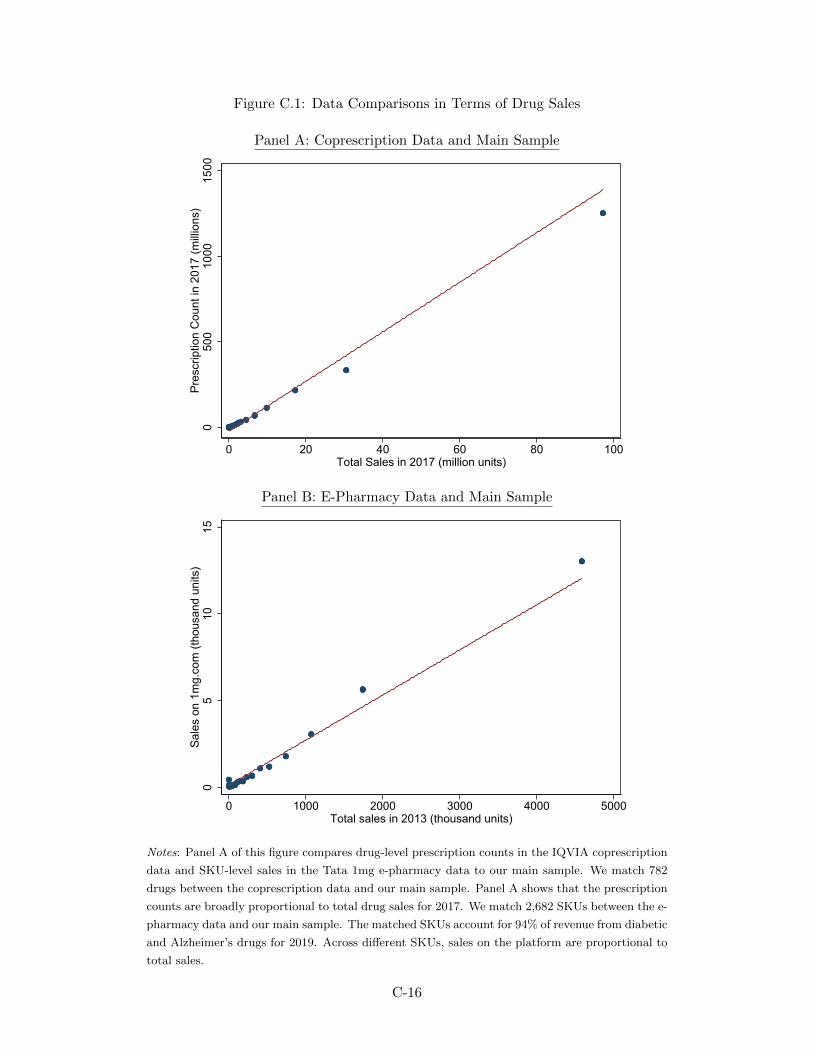
Figure C.1: Data Comparisons in Terms of Drug Sales
Panel A: Coprescription Data and Main Sample
050
010
0015
00Pr
escr
iptio
n C
ount
in 2
017
(milli
ons)
0 20 40 60 80 100Total Sales in 2017 (million units)
Panel B: E-Pharmacy Data and Main Sample
05
1015
Sale
s on
1m
g.co
m (t
hous
and
units
)
0 1000 2000 3000 4000 5000Total sales in 2013 (thousand units)
Notes: Panel A of this figure compares drug-level prescription counts in the IQVIA coprescription
data and SKU-level sales in the Tata 1mg e-pharmacy data to our main sample. We match 782
drugs between the coprescription data and our main sample. Panel A shows that the prescription
counts are broadly proportional to total drug sales for 2017. We match 2,682 SKUs between the e-
pharmacy data and our main sample. The matched SKUs account for 94% of revenue from diabetic
and Alzheimer’s drugs for 2019. Across different SKUs, sales on the platform are proportional to
total sales.
C-16
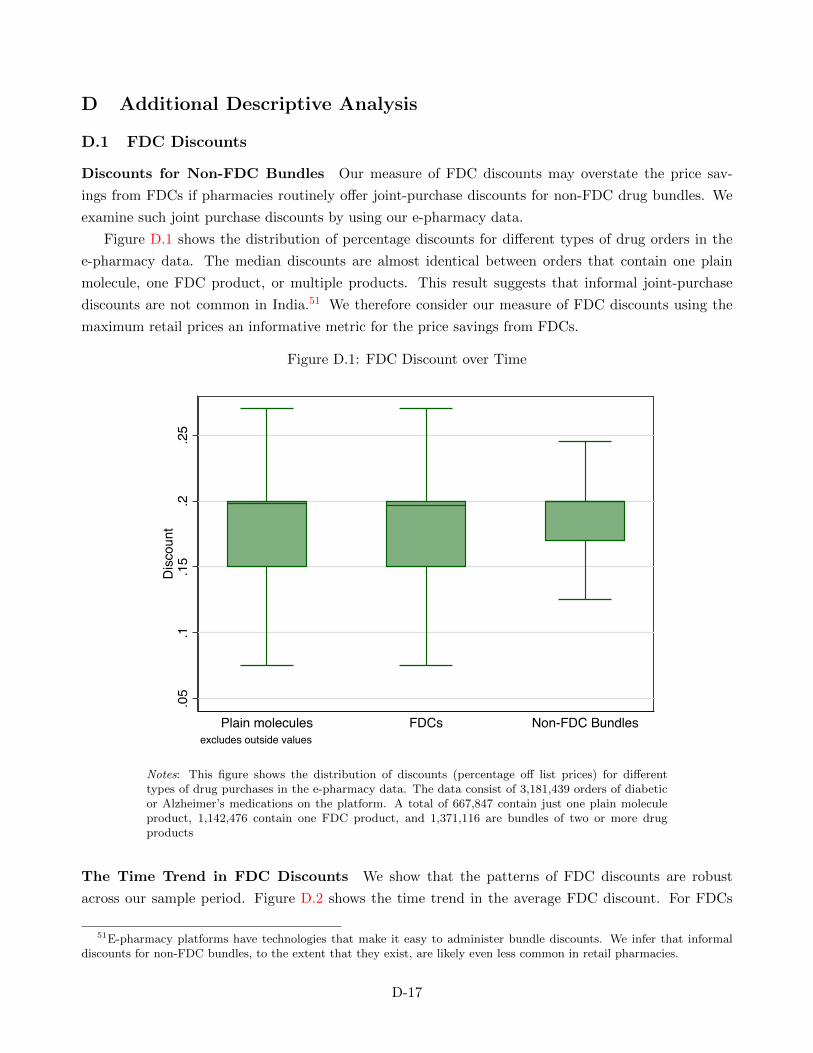
D Additional Descriptive Analysis
D.1 FDC Discounts
Discounts for Non-FDC Bundles Our measure of FDC discounts may overstate the price sav-
ings from FDCs if pharmacies routinely offer joint-purchase discounts for non-FDC drug bundles. We
examine such joint purchase discounts by using our e-pharmacy data.
Figure D.1 shows the distribution of percentage discounts for different types of drug orders in the
e-pharmacy data. The median discounts are almost identical between orders that contain one plain
molecule, one FDC product, or multiple products. This result suggests that informal joint-purchase
discounts are not common in India.51 We therefore consider our measure of FDC discounts using the
maximum retail prices an informative metric for the price savings from FDCs.
Figure D.1: FDC Discount over Time
.05
.1.1
5.2
.25
Dis
coun
t
Plain molecules FDCs Non-FDC Bundlesexcludes outside values
Notes: This figure shows the distribution of discounts (percentage off list prices) for differenttypes of drug purchases in the e-pharmacy data. The data consist of 3,181,439 orders of diabeticor Alzheimer’s medications on the platform. A total of 667,847 contain just one plain moleculeproduct, 1,142,476 contain one FDC product, and 1,371,116 are bundles of two or more drugproducts
The Time Trend in FDC Discounts We show that the patterns of FDC discounts are robust
across our sample period. Figure D.2 shows the time trend in the average FDC discount. For FDCs
51E-pharmacy platforms have technologies that make it easy to administer bundle discounts. We infer that informaldiscounts for non-FDC bundles, to the extent that they exist, are likely even less common in retail pharmacies.
D-17
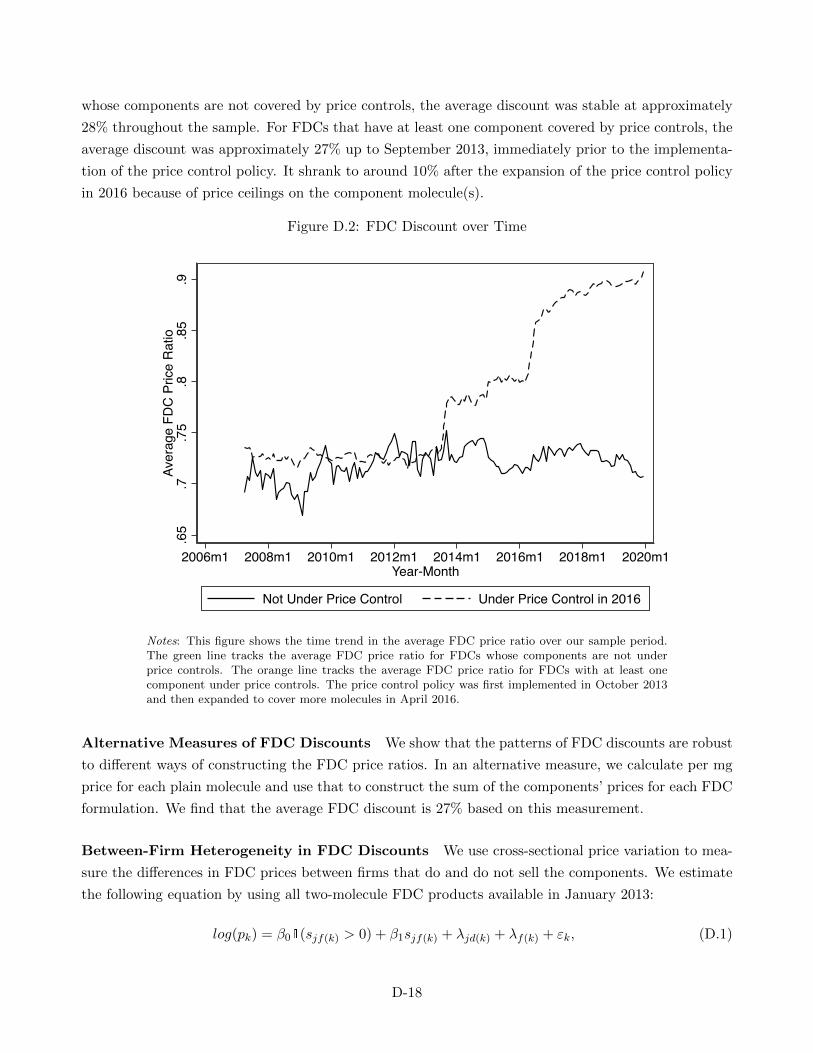
whose components are not covered by price controls, the average discount was stable at approximately
28% throughout the sample. For FDCs that have at least one component covered by price controls, the
average discount was approximately 27% up to September 2013, immediately prior to the implementa-
tion of the price control policy. It shrank to around 10% after the expansion of the price control policy
in 2016 because of price ceilings on the component molecule(s).
Figure D.2: FDC Discount over Time
.65
.7.7
5.8
.85
.9Av
erag
e FD
C P
rice
Rat
io
2006m1 2008m1 2010m1 2012m1 2014m1 2016m1 2018m1 2020m1Year-Month
Not Under Price Control Under Price Control in 2016
Notes: This figure shows the time trend in the average FDC price ratio over our sample period.The green line tracks the average FDC price ratio for FDCs whose components are not underprice controls. The orange line tracks the average FDC price ratio for FDCs with at least onecomponent under price controls. The price control policy was first implemented in October 2013and then expanded to cover more molecules in April 2016.
Alternative Measures of FDC Discounts We show that the patterns of FDC discounts are robust
to different ways of constructing the FDC price ratios. In an alternative measure, we calculate per mg
price for each plain molecule and use that to construct the sum of the components’ prices for each FDC
formulation. We find that the average FDC discount is 27% based on this measurement.
Between-Firm Heterogeneity in FDC Discounts We use cross-sectional price variation to mea-
sure the differences in FDC prices between firms that do and do not sell the components. We estimate
the following equation by using all two-molecule FDC products available in January 2013:
log(pk) = β01(sjf(k) > 0) + β1sjf(k) + λjd(k) + λf(k) + εk, (D.1)
D-18
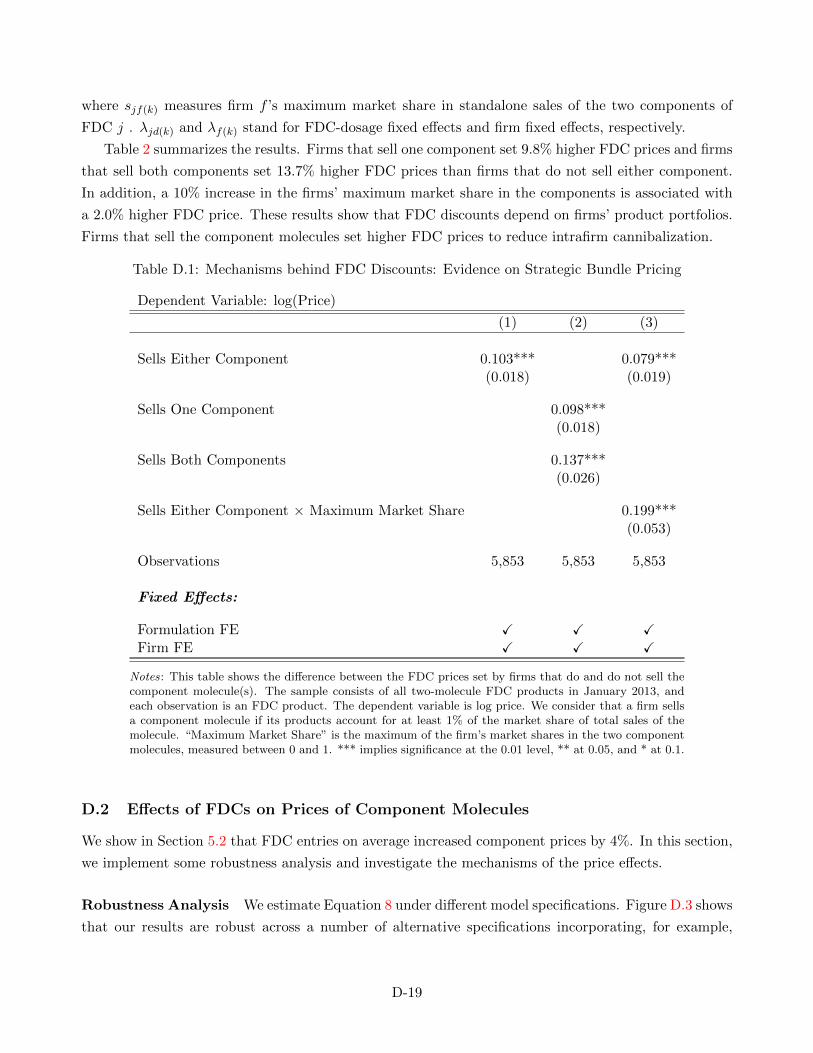
where sjf(k) measures firm f ’s maximum market share in standalone sales of the two components of
FDC j . λjd(k) and λf(k) stand for FDC-dosage fixed effects and firm fixed effects, respectively.
Table 2 summarizes the results. Firms that sell one component set 9.8% higher FDC prices and firms
that sell both components set 13.7% higher FDC prices than firms that do not sell either component.
In addition, a 10% increase in the firms’ maximum market share in the components is associated with
a 2.0% higher FDC price. These results show that FDC discounts depend on firms’ product portfolios.
Firms that sell the component molecules set higher FDC prices to reduce intrafirm cannibalization.
Table D.1: Mechanisms behind FDC Discounts: Evidence on Strategic Bundle Pricing
Dependent Variable: log(Price)
(1) (2) (3)
Sells Either Component 0.103*** 0.079***(0.018) (0.019)
Sells One Component 0.098***(0.018)
Sells Both Components 0.137***(0.026)
Sells Either Component × Maximum Market Share 0.199***(0.053)
Observations 5,853 5,853 5,853
Fixed Effects:
Formulation FE ✓ ✓ ✓Firm FE ✓ ✓ ✓
Notes: This table shows the difference between the FDC prices set by firms that do and do not sell thecomponent molecule(s). The sample consists of all two-molecule FDC products in January 2013, andeach observation is an FDC product. The dependent variable is log price. We consider that a firm sellsa component molecule if its products account for at least 1% of the market share of total sales of themolecule. “Maximum Market Share” is the maximum of the firm’s market shares in the two componentmolecules, measured between 0 and 1. *** implies significance at the 0.01 level, ** at 0.05, and * at 0.1.
D.2 Effects of FDCs on Prices of Component Molecules
We show in Section 5.2 that FDC entries on average increased component prices by 4%. In this section,
we implement some robustness analysis and investigate the mechanisms of the price effects.
Robustness Analysis We estimate Equation 8 under different model specifications. Figure D.3 shows
that our results are robust across a number of alternative specifications incorporating, for example,
D-19
weights for different products by sales quantity or controls for firm-specific time trends, therapeutic-
market-specific time trends, or the number of firms.
Mechanisms of the Price Effects We estimate heterogeneous effects of FDC entries on component
prices set by firms that do and do not sell the FDCs. Figure D.4 shows that there are no significant
differences in the price effects between the two types of firms. A possible explanation is that the overall
price increase is primarily driven by market segmentation: the FDC discount attracts the more price-
elastic consumers, and all firms increase the component prices to target the remaining less price-elastic
consumers. The small sample size may limit the statistical power to detect heterogeneous price responses
between firms that do and do not sell the FDCs.
Finally, we examine how the price effects of FDC entries depend on the pre-existing market structures
for the component molecules. We estimate Equation 8 for a subset of molecules sold by only one firm
throughout the sample period. This subsample consists of 4 treated molecules and 27 control molecules.
Figure D.5 shows that FDC entries reduced the prices of component molecules by up to 10%. This result
provides some suggestive evidence that the procompetitive effect of FDCs can be large in concentrated
markets, though it is muted in the full sample because the markets for most component molecules are
already highly competitive.
D-20
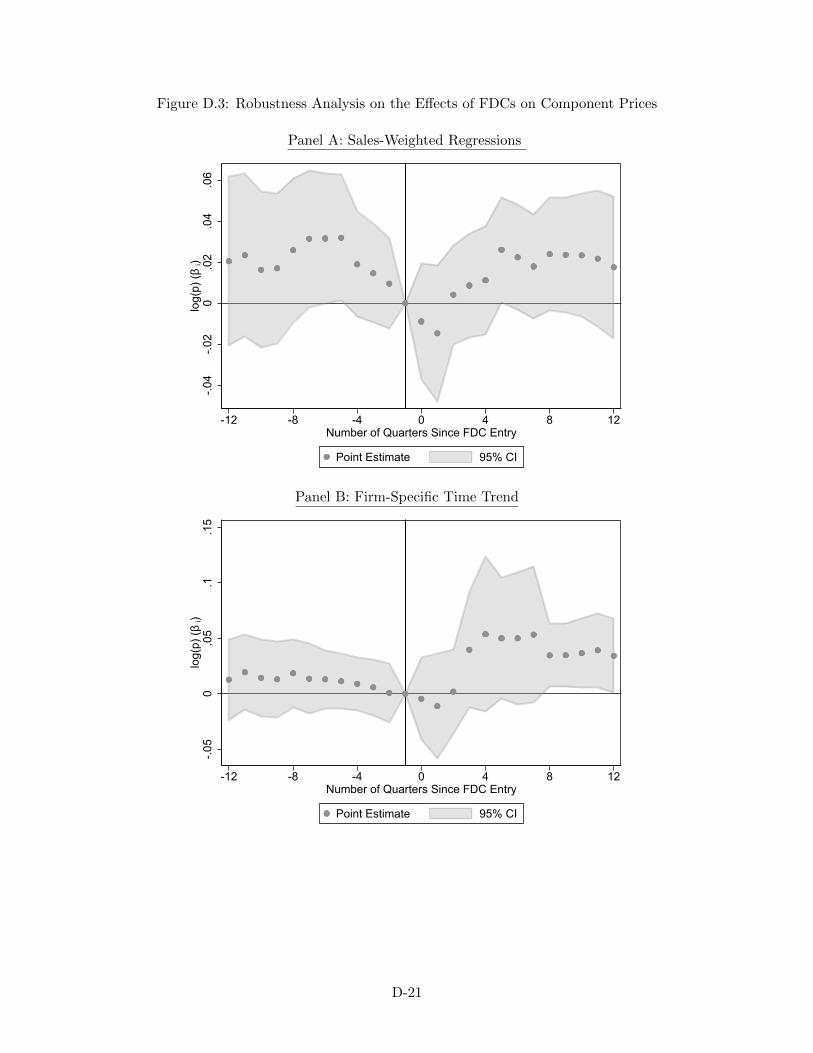
Figure D.3: Robustness Analysis on the Effects of FDCs on Component Prices
Panel A: Sales-Weighted Regressions
-.04
-.02
0.0
2.0
4.0
6lo
g(p)
(β i)
-12 -8 -4 0 4 8 12Number of Quarters Since FDC Entry
Point Estimate 95% CI
Panel B: Firm-Specific Time Trend
-.05
0.0
5.1
.15
log(
p) (β
i)
-12 -8 -4 0 4 8 12Number of Quarters Since FDC Entry
Point Estimate 95% CI
D-21
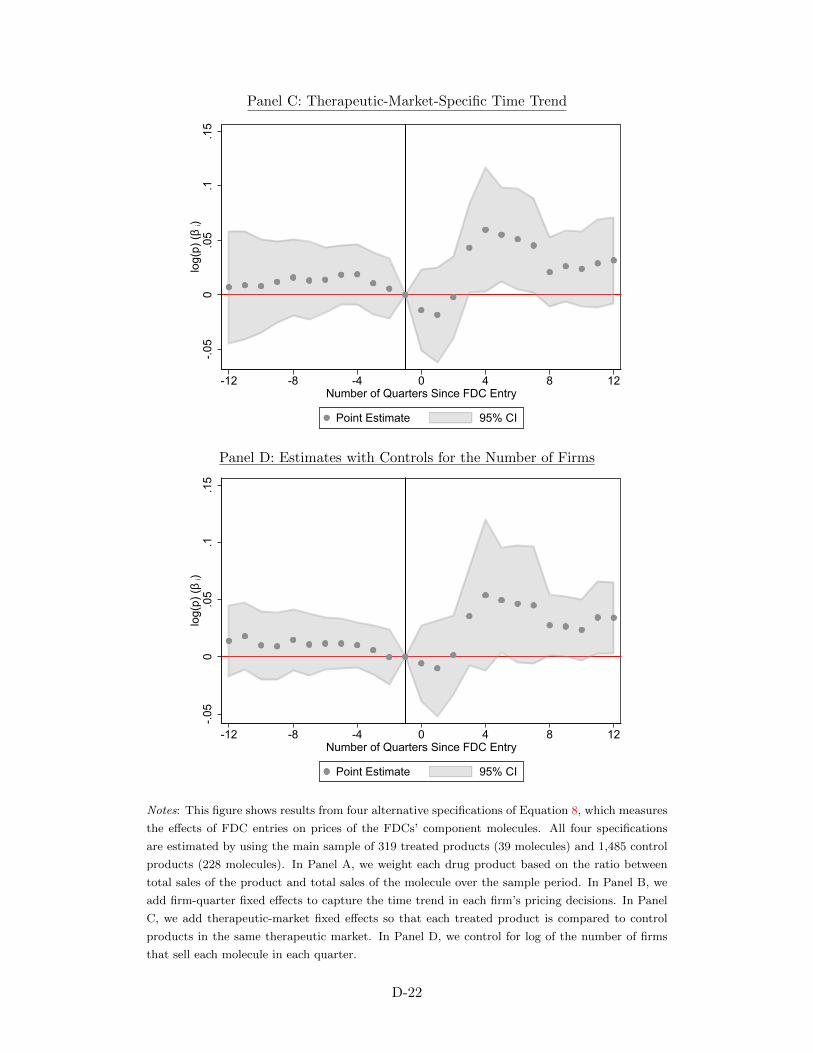
Panel C: Therapeutic-Market-Specific Time Trend
-.05
0.0
5.1
.15
log(
p) (β
i)
-12 -8 -4 0 4 8 12Number of Quarters Since FDC Entry
Point Estimate 95% CI
Panel D: Estimates with Controls for the Number of Firms
-.05
0.0
5.1
.15
log(
p) (β
i)
-12 -8 -4 0 4 8 12Number of Quarters Since FDC Entry
Point Estimate 95% CI
Notes: This figure shows results from four alternative specifications of Equation 8, which measures
the effects of FDC entries on prices of the FDCs’ component molecules. All four specifications
are estimated by using the main sample of 319 treated products (39 molecules) and 1,485 control
products (228 molecules). In Panel A, we weight each drug product based on the ratio between
total sales of the product and total sales of the molecule over the sample period. In Panel B, we
add firm-quarter fixed effects to capture the time trend in each firm’s pricing decisions. In Panel
C, we add therapeutic-market fixed effects so that each treated product is compared to control
products in the same therapeutic market. In Panel D, we control for log of the number of firms
that sell each molecule in each quarter.
D-22
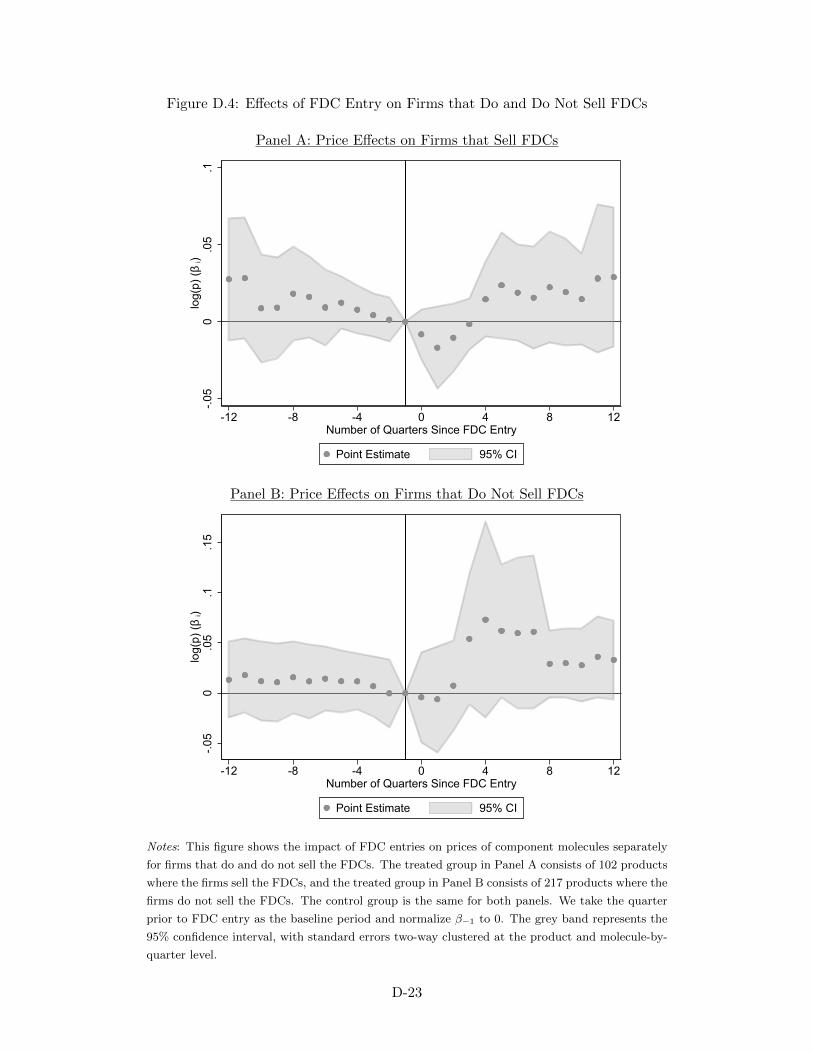
Figure D.4: Effects of FDC Entry on Firms that Do and Do Not Sell FDCs
Panel A: Price Effects on Firms that Sell FDCs
-.05
0.0
5.1
log(
p) (β
i)
-12 -8 -4 0 4 8 12Number of Quarters Since FDC Entry
Point Estimate 95% CI
Panel B: Price Effects on Firms that Do Not Sell FDCs
-.05
0.0
5.1
.15
log(
p) (β
i)
-12 -8 -4 0 4 8 12Number of Quarters Since FDC Entry
Point Estimate 95% CI
Notes: This figure shows the impact of FDC entries on prices of component molecules separately
for firms that do and do not sell the FDCs. The treated group in Panel A consists of 102 products
where the firms sell the FDCs, and the treated group in Panel B consists of 217 products where the
firms do not sell the FDCs. The control group is the same for both panels. We take the quarter
prior to FDC entry as the baseline period and normalize β−1 to 0. The grey band represents the
95% confidence interval, with standard errors two-way clustered at the product and molecule-by-
quarter level.
D-23
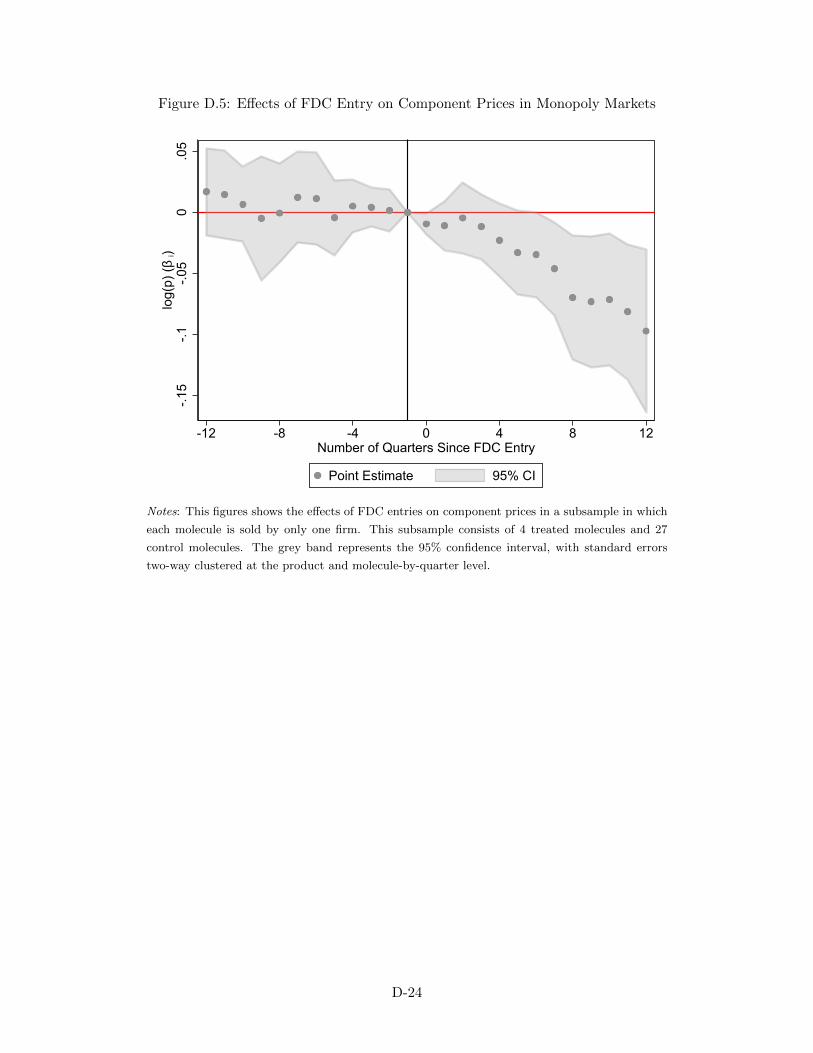
Figure D.5: Effects of FDC Entry on Component Prices in Monopoly Markets
-.15
-.1-.0
50
.05
log(
p) (β
i)
-12 -8 -4 0 4 8 12Number of Quarters Since FDC Entry
Point Estimate 95% CI
Notes: This figures shows the effects of FDC entries on component prices in a subsample in which
each molecule is sold by only one firm. This subsample consists of 4 treated molecules and 27
control molecules. The grey band represents the 95% confidence interval, with standard errors
two-way clustered at the product and molecule-by-quarter level.
D-24
E Model Estimation: Additional Details
We estimate the demand model by using the simulated method of moments (SMM). In this section,
we provide some additional details on the estimation procedure, with a focus on how we construct the
empirical moments and their model-predicted counterparts.
E.1 Price Instrument and Empirical Moments
Price Instruments As discussed in Section 6.3, our price instrument Z takes value 1 for the two drug
A products affected in the price control policy starting in Q2 of 2016 and 0 otherwise. Our estimates are
robust to different choices of price instruments, such as separate dummies for the two affected products
or the distance between the 2015 price and the price ceiling for the two affected products (with value 0
otherwise).
Coprescription Moments We measure the coprescription rate in each quarter by using the ratio
between the coprescription count and the drug B prescription count. Note that in markets after the
FDC entry, this measure, which does not include FDC sales, does not directly match either the total
coprescription rate or the non-FDC coprescription rate shown in Figure 6. However, since we match the
market shares of all drug B and FDC products in the estimation, targeting the baseline coprescription
rate also automatically targets the other coprescription measures.
E-Pharmacy Moments As we have discussed in Section 6.3, it is overall straightforward to construct
the moments that summarize the substitution patterns in the e-pharmacy data. As an example, we
discuss how we construct the moments related to substitutions to the new Eisai FDC, for which we
need an additional step to measure substitutions from the outside option.
We focus on a subset of 366 consumers who have bought the Eisai FDC and identify the drug bundle
that each consumer bought, if any, prior to purchasing the Eisai FDC. One empirical challenge is that
consumers who did not purchase any other drug bundle may have substituted from the outside option
or may be new consumers whose purchase history we do not observe. To estimate the number of new
arrivals, we use data on drug products that have been offered throughout the sample period and were
not directly affected by the price control policy. We measure the fraction of new consumers who show
up in the data for the first time in each month. We then multiply the new arrivals share with the
sales of the Eisai FDC in each month to estimate the number of new arrivals among the Eisai FDC
consumers. We drop these new arrivals and construct the moments based on substitution patterns
among the remaining consumers, as shown in Figure 7.
E.2 Predicted Moments
We describe the main steps that we take to construct the model-predicted moments. Recall that the
set of parameters of interest is Θ = {σε, σ1, ρ, Γ, σΓ, σf}. We simulate a sample of NC = 10, 000
consumers, with the preferences of each consumer νi = {νiA, νiB,Γi, νif} drawn from the distribution
E-25
described by Θ. Given a guess of Θ, we recover the vector of average product values δ so that the
model-predicted product market shares exactly match the observed product market shares, following
the standard contraction mapping procedure described in Berry (1994).
Orthogonality Condition Given a vector of δ, we recover the unobserved demand shocks as the
residuals from the following linear regression:
δkt = λk + λj(k)t + ξkt. (E.1)
The first moment condition is given by the orthogonality condition between the unobserved demand
shocks and the price instrument:
gξ(Θ) =1
N
∑kt
(ξkt × Zkt), (E.2)
where N is the total sample size.
Coprescription Moments Let srt(Θ) denote the market share of drug bundle r in market t implied
by Θ. The model-predicted coprescription rate in market t is:
f ct (Θ) =
∑rt srt(Θ)1(|Br| = 2)∑
rt srt(Θ)1(j(k) = B ∃ k ∈ Br), (E.3)
where the numerator is the total sales of non-FDC two-drug bundles and the denominator is the total
sales of all non-FDC bundles that contain drug B. Let f ct denote the corresponding empirical copre-
scription rate in market t. The set of coprescription moments can be written as a 43-by-1 vector gc(Θ),
whose tth element is equal to f ct (Θ)− f c
t .
E-Pharmacy Moments To construct the model-predicted e-pharmacy moments, we need to simulate
the substitution patterns when there is a product entry or exit or a large price change. For example,
when we remove drug bundle r1 from the market, the fraction of consumers who substitute to bundle
r2 is given by:
P(r1,r2)t(Θ) =
NC∑i=1
sir1t(Θ)× sir2t(Θ)
1−sir1t(Θ)
NC∑i=1
sir1t(Θ)
, (E.4)
where sirt(Θ) is the predicted probability of consumer i choosing bundle r in market t, which follows
the standard logit functional form as in the integrand in Equation 13. Intuitively, the fraction of
consumers who substitute from bundle r1 to r2 is the weighted average of each consumer’s probability
of choosing r2 when r1 is removed from the choice set, with the weights being the probability that the
E-26
consumer views r1 as the top choice. Following this approach, we can simulate substitution patterns
that correspond to each of the empirical e-pharmacy moments. We do so for each market and match
the average model-predicted moments over the relevant markets to the empirical moments.52 We refer
to this set of moments as ge(Θ), which is a 4-by-1 vector.
The final set of moments that we use in our estimation is:
g(Θ)= [gξ(Θ); gc(Θ); ge(Θ)], (E.5)
and we estimate parameters Θ = {σε, σ1, ρ, Γ, σΓ, σf} by using the two-step generalized method of
moments (Hansen, 1982). In the first step, we use the identity matrix as the weighting matrix to
derive a consistent set of estimates and the optimal weight matrix. In the second step, we re-estimate
the model with the optimal weight matrix. To account for the sampling variance in our empirical
moments, we obtain bootstrapped estimates of standard errors by resampling markets and consumers
in our e-pharmacy data for 100 bootstrap samples. We resample the markets before and after the
implementation of the price control policy separately to ensure that in each bootstrap sample we have
the policy variation to identify the price elasticities.
52The relevant market are all markets after the event time (e.g., Q2 of 2016 for the price control and Q3 of 2016 for theEisai FDC entry).
E-27
F Additional Details about the Counterfactual Analysis
Simulation Details In Section 6.5, we simulate counterfactual market outcomes when we remove
FDCs from the market. We use the following Monte Carlo procedure to simulate the counterfactual
scenario:
1. For each pseudoconsumer in market t, we simulate an Nt-by-1 vector of idiosyncratic match values,
which are i.i.d. draws from the type I extreme value distribution with scale parameter σε. Nt
stands for the number of bundles (including the outside option) in market t.
2. For each pseudoconsumer i, we calculate the utility uirt from each bundle and identify the most
preferred bundle y1i .
3. We remove all FDCs from the market (keeping the prices of other drugs fixed) and identify the
most preferred bundle for each pseudoconsumer y0i .
4. We identify the subset of consumers for whom y1i is an FDC product. We group these consumers
by whether y0i is the outside option, a drug A or B product, or another two-drug bundle.
5. For each consumer in step 4, we calculate the differences in the following metrics between y1i and
y0i .
(a) Bundle utility excluding prices
(b) Bundle utility including prices
(c) Profit
(d) Profit assuming no cost savings from FDCs
6. We aggregate the outcomes in step 5 across consumers in each group, divide by 10,000 (i.e., the
total number of pseudo consumers) and multiply by the market size to recover the market-level
effects.
7. Repeat steps 1-5 for 100 sets of draws and calculate the average market-level effects.
Using the steps above, we recover the substitution patterns after we remove FDCs from the market.
We also quantify changes in consumer surplus and firm profits within each type of substitution. The
results on firm profits are shown in Panel B of Figure 9.
FDC Preference and Consumer Surplus When consumer demand for FDCs is in part driven
by FDC preferences, the welfare effects of FDCs depend on the nature of those preferences. FDC
preferences turn out to be negligible in the market for Alzheimer’s drugs but may play a major role in
other therapeutic markets. We discuss a framework to bound consumer welfare in settings with FDC
preferences.
F-28
We follow Train (2015)’s framework to measure consumer surplus when consumers’ anticipated and
experienced attributes differ. Let γk denote the part of the FDC preference for FDC product k that is
driven by misinformation.53 We can write consumer surplus as:
CSt =
∫i(E(max
r(∑k∈Br
(vikt − pkt) + Γir)−∑k
sikγk))dF (νi)
=
∫iE(max
r(∑k∈Br
(vikt − pkt) + Γir))dF (νi)︸ ︷︷ ︸CSi
−∑k
skγk, (F.1)
which is consumer surplus under the revealed preference assumption minus the “illusory surplus” from
FDC preferences whenever FDCs are chosen. When FDC preferences are entirely driven by true benefits,
γk = 0 for all FDC products, and we have the standard consumer surplus measure in Equation ??.
Equation F.1 provides a simple way to bound consumer surplus in the presence of an FDC pref-
erence. It shows the economic intuition on why consumers are worse off when the FDC preference is
misperceived: γk may mislead consumers into choosing an FDC product when some other would be
preferred in the absence of γk.
53γk is by assumption 0 for all non-FDC bundles.
F-29
G Stylized Facts on the Effects of FDC Regulations in the U.S.
In this section, we document some stylized facts on the effects of FDC regulations in the US. We show
that these regulations may have deterred or delayed entries of many medically sound FDCs.
We first examine 182 two-molecule FDCs in India whose two components were sold in the US in
2015 but the FDC was not. Figure G.1 shows the coprescription rates of these combinations in the
US in 2015. Two patterns stand out. First, many such combinations are rarely coprescribed in the
US: the coprescription rate is below 1% for 13% of the sample. Panel A of Table G.1 shows that the
majority of these least commonly coprescribed combinations involve two antibiotics. There has been
robust evidence that antibiotic FDCs are overused in many countries, resulting in a public health crisis
of antimicrobial resistance (Ahmad et al., 2016). The results thus show that the combination rule
imposed by the US FDA has helped screen out unjustified FDCs. On the other hand, there are also
many commonly coprescribed combinations: the coprescription rate is above 20% for one quarter of the
sample. Panel B of Table G.1 shows that many of the commonly coprescribed combinations are used
in treating chronic diseases such as diabetes and cardiovascular diseases. FDC regulations may have
precluded FDC entries of these combinations that physicians have considered appropriate to prescribe
together.
In addition, FDC regulations have delayed FDC entries in the US. Using a sample of 29 FDCs
that have been approved in both India and the US, we show in Figure G.2 that on average the FDCs
were approved in the US four years after they were introduced in India. For perspective, we also show
in Figure G.2 that new plain molecules are on average introduced in US four years before they are
introduced in India. These facts show that the regulatory requirements delayed the entries of medically
sound FDCs and consequently their welfare benefits.
G-30
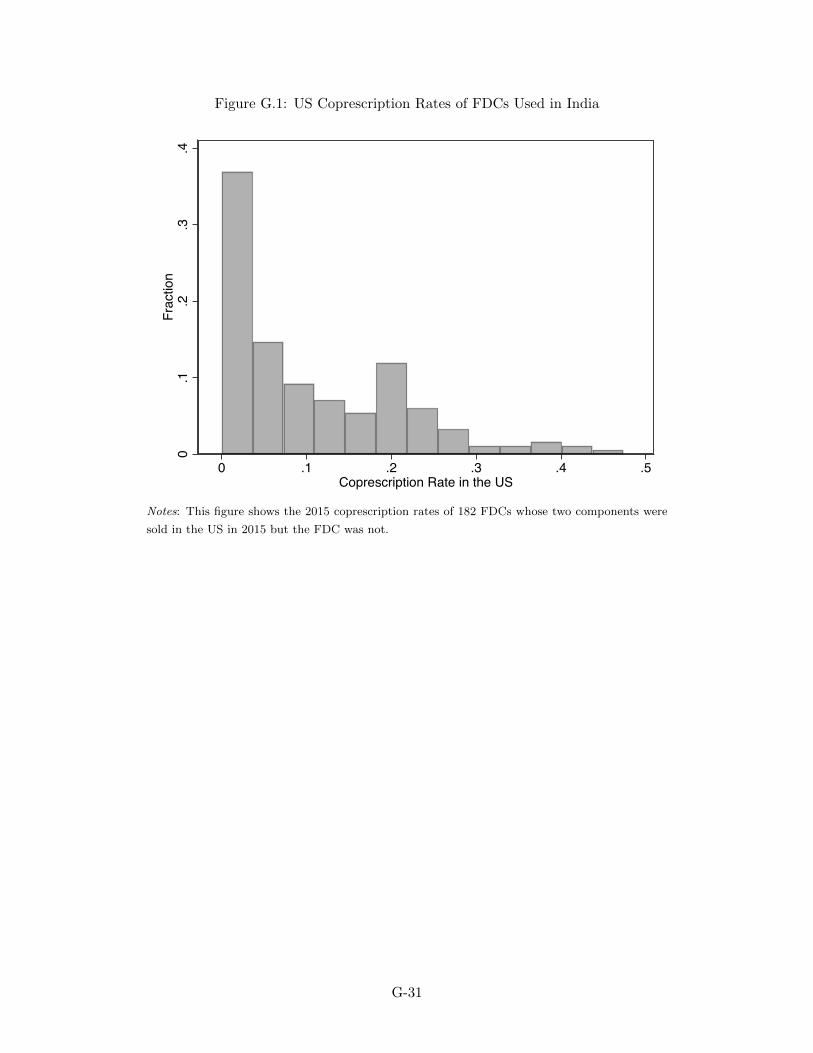
Figure G.1: US Coprescription Rates of FDCs Used in India
0.1
.2.3
.4Fr
actio
n
0 .1 .2 .3 .4 .5Coprescription Rate in the US
Notes: This figure shows the 2015 coprescription rates of 182 FDCs whose two components were
sold in the US in 2015 but the FDC was not.
G-31
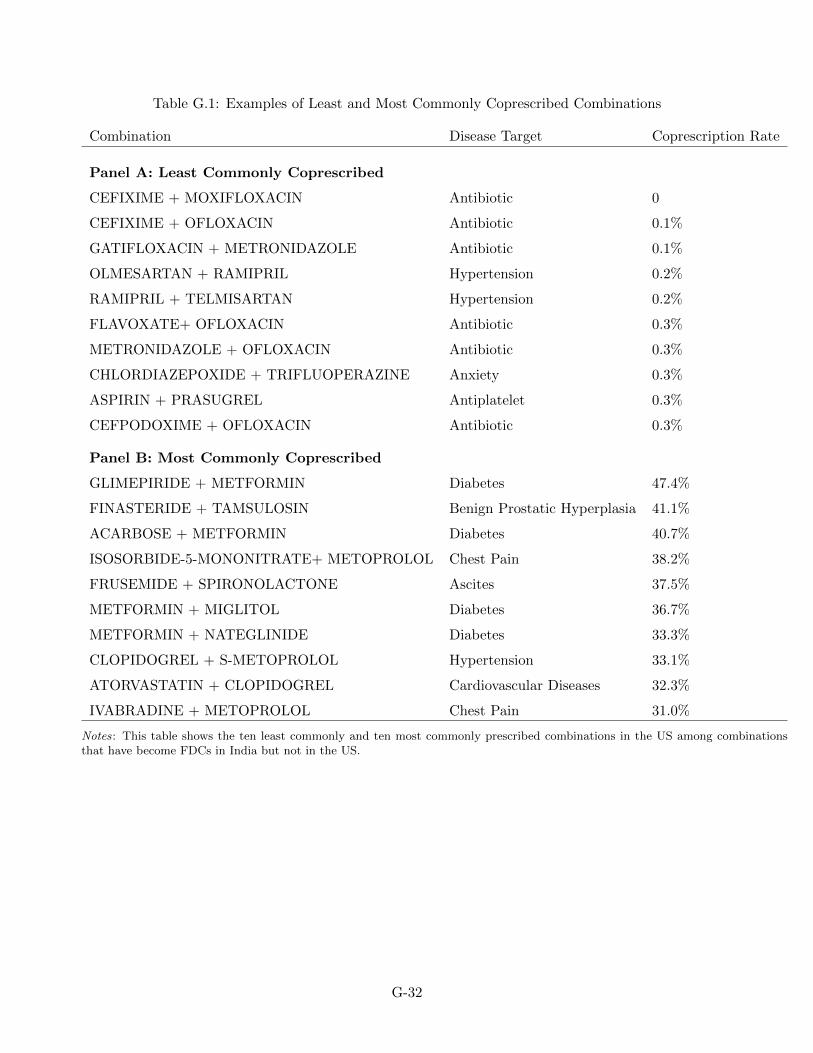
Table G.1: Examples of Least and Most Commonly Coprescribed Combinations
Combination Disease Target Coprescription Rate
Panel A: Least Commonly Coprescribed
CEFIXIME + MOXIFLOXACIN Antibiotic 0
CEFIXIME + OFLOXACIN Antibiotic 0.1%
GATIFLOXACIN + METRONIDAZOLE Antibiotic 0.1%
OLMESARTAN + RAMIPRIL Hypertension 0.2%
RAMIPRIL + TELMISARTAN Hypertension 0.2%
FLAVOXATE+ OFLOXACIN Antibiotic 0.3%
METRONIDAZOLE + OFLOXACIN Antibiotic 0.3%
CHLORDIAZEPOXIDE + TRIFLUOPERAZINE Anxiety 0.3%
ASPIRIN + PRASUGREL Antiplatelet 0.3%
CEFPODOXIME + OFLOXACIN Antibiotic 0.3%
Panel B: Most Commonly Coprescribed
GLIMEPIRIDE + METFORMIN Diabetes 47.4%
FINASTERIDE + TAMSULOSIN Benign Prostatic Hyperplasia 41.1%
ACARBOSE + METFORMIN Diabetes 40.7%
ISOSORBIDE-5-MONONITRATE+ METOPROLOL Chest Pain 38.2%
FRUSEMIDE + SPIRONOLACTONE Ascites 37.5%
METFORMIN + MIGLITOL Diabetes 36.7%
METFORMIN + NATEGLINIDE Diabetes 33.3%
CLOPIDOGREL + S-METOPROLOL Hypertension 33.1%
ATORVASTATIN + CLOPIDOGREL Cardiovascular Diseases 32.3%
IVABRADINE + METOPROLOL Chest Pain 31.0%
Notes: This table shows the ten least commonly and ten most commonly prescribed combinations in the US among combinationsthat have become FDCs in India but not in the US.
G-32
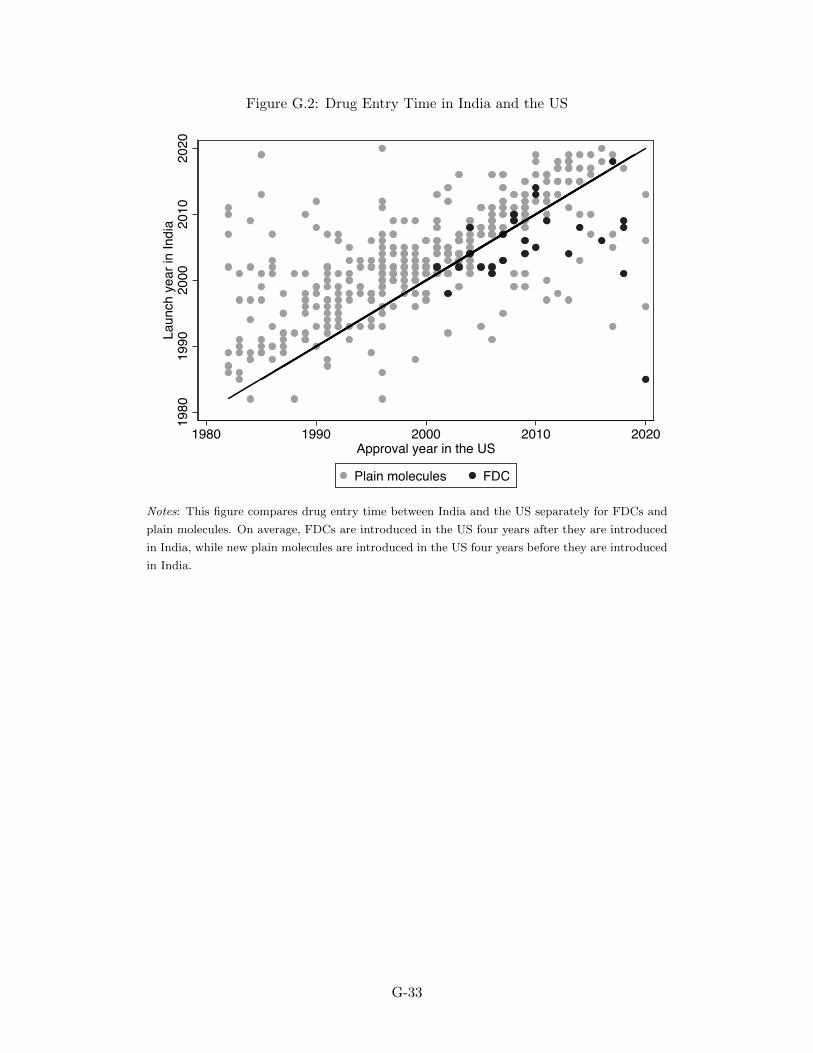
Figure G.2: Drug Entry Time in India and the US
1980
1990
2000
2010
2020
Laun
ch y
ear i
n In
dia
1980 1990 2000 2010 2020Approval year in the US
Plain molecules FDC
Notes: This figure compares drug entry time between India and the US separately for FDCs and
plain molecules. On average, FDCs are introduced in the US four years after they are introduced
in India, while new plain molecules are introduced in the US four years before they are introduced
in India.
G-33