Embed Size (px)
Citation preview
r 2008 Public Financial Publications, Inc.
Equity and Accountability: The Impact of StateAccountability Systems on School Finance
ROSS RUBENSTEIN, SONALI BALLAL, LEANNA STIEFEL, andAMY ELLEN SCHWARTZ
Using an 11-year panel data set containing information on revenues,expenditures, and demographics for every school district in the United States,we examine the effects of state-adopted school accountability systems on theadequacy and equity of school resources. We find little relationship betweenstate implementation of accountability systems and changes in school financeequity, though we do find evidence that states in which courts overturned theschool finance system during the decade exhibited significant equityimprovements. Additionally, while implementation of accountability per sedoes not appear linked to changes in resource adequacy, states that implementedstrong accountability systems did experience improvements.
INTRODUCTION
In the last decade, much of education policy has focused on concerns over the adequacy
of educational resources and accountability for student performance, joining more
Ross Rubenstein is Associate Professor of Public Administration in the Maxwell School at Syracuse
University, where he teaches courses in financial management, public budgeting, and education policy. He
is also a Senior Research Associate in the Center for Policy Research. He can be reached at rrubenst@
maxwell.syr.edu.
Sonali Ballal is a Public Administration Doctoral Candidate in the Maxwell School at Syracuse University.
She is also a Graduate Associate in the Center for Policy Research. Her research focuses on education
policy and public finance. She can be reached at [email protected].
Leanna Stiefel is Professor of Economics in the Wagner Graduate School and Associate Director for
Education Finance at the Institute for Education and Social Policy, New York University. Her current
research focuses on school-level expenditure reporting and financing schools within districts, academic
performance of immigrant students, and the implications of school organization for student performance.
She can be reached at [email protected].
Amy Ellen Schwartz is Professor of Public Policy, Education and Economics at New York University’s
Wagner and Steinhardt Schools where she directs the Institute for Education and Social Policy. She teaches
courses in public finance, applied economics, and education and urban policy and is the president-elect of
the American Education Finance Association. She can be reached at [email protected].
Rubenstein et al. / Equity and Accountability: Impact on School Finance 1
traditional school finance concerns about the equity of resource distributions. While
accountability reached the national stage with the passage of the 2001 No Child Left Behind
Act, during the 1990s addressing concerns about both adequacy and accountability rested in
the domain of state policy makers. The resulting variation in policies across states spurred a
steadily accumulating body of research examining the effects of accountability policies on
student performance,1 and a separate body of research examining the adequacy of school
financing.2 There has, however, been no research linking the two, nor examining their
relationship to equity in school finance. Yet these relationships are important; as a growing
number of states have made public, No Child Left Behind’s failure to provide the new
resources necessary for states to achieve Adequate Yearly Progress3 could combine with
increases in local resources to affect the overall equity of resource distributions within states.
Are there trade-offs between accountability and the adequacy or equity of school
finance? Is the implementation of an accountability system associated with more ade-
quate resources or, perhaps with less school finance equity? This study provides some
answers by examining trends in educational resource adequacy and resource equity,
using an 11-year panel data set containing information on revenues, expenditures, and
demographics for every school district in the United States. In particular, we look at the
effect of state-adopted accountability systems on measures of adequacy and equity of
resources, controlling for other likely determinants of changes in these measures. We find
little relationship between state implementation of accountability systems and changes in
school finance equity, though we do find evidence that states in which courts overturned
the school finance system during the decade exhibited significant improvements in
resource equity. Additionally, while implementation of accountability per se does not
appear linked to changes in adequacy, states that implemented strong accountability
systems did experience improvements in resource adequacy.
1. See, for example, M. Carnoy and S. Loeb, ‘‘Does External Accountability Affect Student Outcomes?
A Cross-State Analysis,’’ Education Evaluation and Policy Analysis 24, no. 4 (2003): 305–331; E. Hanushek
and M. Raymond, ‘‘Does School Accountability Lead to Improved Student Performance?,’’ Journal of
Policy Analysis and Management 24, no. 2 (2005): 297–327; H. Ladd, ‘‘The Dallas School Accountability
and Incentive Program: An Evaluation of Its Impacts on Student Outcomes,’’ Economics of Education
Review 18, no. 1 (1999): 1–16.
2. W. D. Duncombe and J. M. Yinger, ‘‘School Finance Reform: Aid Formulas and Equity Objec-
tives,’’ National Tax Journal 51, no. 2 (1998): 260–297; W. D. Duncombe and J. M. Yinger, ‘‘Performance
Standards and Educational Cost Indexes: You Can’t Have One without the Other,’’ in Equity and Adequacy
in Education Finance: Issues and Perspectives, eds. H. F. Ladd, R. Chalk, and J. S. Hansen (Washington,
DC: National Academy Press, 1999): 260–297; W. D. Duncombe and J. M. Yinger, ‘‘Financing Higher
Student Performance Standards: The Case of New York State,’’ Economics of Education Review 19, no. 4
(2000): 363–386; J. W. Guthrie and R. Rothstein, ‘‘Education Finance in the New Millennium,’’ in A New
Millennium and a Likely New Era of Education Finance, eds. S. Chaikind and W. J. Fowler, Jr. (Larchmont,
NY: Eye on Education, 2001): 99–119; R. Rubenstein, ‘‘Providing Adequate Educational Funding: A
State-by-State Analysis of Expenditure Needs,’’ Public Budgeting and Finance 22, no. 4 (2002): 73–98.
3. C. Hendrie, ‘‘NCLB Transfer Policy Seen as Flawed,’’ Education Week 24, no. 32 (2005): 1–3.
Public Budgeting & Finance / Fall 20082
The next section provides background on school finance adequacy and equity and
state accountability efforts. The following section describes the data used in the analyses,
the measures used to capture resource adequacy and equity, and the empirical methods.
In the next section, we discuss theoretical linkages between education accountability and
school finance and the contribution of the present study. In the penultimate section we
present results of our analyses. We conclude in the last section with a discussion of policy
implications and avenues for future research.
REVIEW OF THE LITERATURE
Resource Adequacy and Equity
Since the landmark Serrano versus Priest decision in California in 1971, virtually every
state in the United States has faced litigation challenging the constitutionality of its
system for funding public elementary and secondary education.4 While early cases used
education and equal protection clauses in state constitutions to argue that funding was
inequitably distributed across school districts, a ‘‘third wave’’ of litigation focused on the
adequacy of resources, particularly in property-poor districts.5 This shift is meaningful
conceptually because, while equity is concerned with fairness in the distribution of
funding, adequacy is concerned with the extent to which funding is sufficient to provide
students the opportunity to achieve specified learning outcomes.6
Equity-based litigation typically focuses on inequalities in the distribution of resources
across districts. While these inequalities are sometimes measured strictly as per-pupil
expenditures (horizontal equity), litigation more frequently considers differences in costs
of education across school districts and the higher levels of resources required in districts
serving large numbers of students from low-income families, students for whom English
is not their first language, and students with learning and physical disabilities (vertical
equity). Adequacy and vertical equity are not entirely distinct, however. Underwood,7
for example, writes that adequacy is a form of vertical equity and King, Swanson, and
Sweetland8 argue that adequacy is ‘‘the ideal state of vertical equity.’’
4. Y. Huang, A. Lukemeyer, and J. Yinger, ‘‘Appendix B: A Guide to State Operating Aid Programs
for Elementary and Secondary Education,’’ in Helping Children Left Behind: State Aid and the Pursuit of
Educational Equity, ed. John Yinger (Cambridge, MA: MIT Press, 2004): 317–330.
5. H. Ladd and J. S. Hansen, eds., Making Money Matter: Financing America’s Schools (Washington,
DC: National Academy Press, 1999); P. A. Minorini and S. D. Sugarman, ‘‘Educational Adequacy and the
Courts: The Promise and the Problems of Moving to a New Paradigm,’’ in Equity and Adequacy in
Education Finance: Issues and Perspectives, eds. H. F. Ladd, R. Chalk, and J. S. Hansen (Washington, DC:
National Academy Press, 1999): 175–208.
6. See Guthrie and Rothstein (2001) for more on this.
7. J. Underwood, ‘‘School Finance Adequacy as Vertical Equity,’’ University of Michigan Law Reform
28 (1995): 493–519.
8. R. A. King, A. D. Swanson, and S. R. Sweetland, ‘‘Designing Finance Structures to Satisfy Equity
and Adequacy Goals,’’ Education Policy Analysis Archives 13, no. 15 (2005): 1–26.
Rubenstein et al. / Equity and Accountability: Impact on School Finance 3
Much of the research on school finance equity has focused on the conceptual and
methodological underpinnings of equity9 or on empirical analyses of equity within in-
dividual states,10 comparisons across states11 or across schools within large districts.12
While the majority of research on equity has been descriptive, some has aimed at iden-
tifying causal relationships. As an example, Evans, Murray, and Schwab’s13 study of the
distribution of school resources between 1971 and 1992 found that within-state inequal-
ity was reduced by 19–34 percent because of the implementation of court-ordered finance
reforms. They also found that while state aid to districts increased in these states, local
funding was relatively unchanged.
Much of the research on adequacy has focused on methods to measure adequate fund-
ing,14 often examining individual states facing legal challenges (such as Ohio, New York, and
Texas). A more limited body of research has studied adequacy across states.15 We know of
no previous research, though, that has explored correlates of adequacy in school finance.State Accountability Research. While No Child Left Behind represented a dramatic in-
crease in the federal government’s role in setting education policy,16 individual states havebeen implementing accountability standards and assessment systems for well over a decade.‘‘Accountability’’ has become a buzzword in education circles in recent years, but the termmay refer to a wide array of policies and procedures. At their core, accountability policies
9. R. Berne and L. Stiefel, The Measurement of Equity in School Finance: Conceptual, Methodological,
and Empirical Dimensions (Baltimore, MD: Johns Hopkins University Press, 1984).
10. For example, W. D. Duncombe and J. Johnston, ‘‘The Impacts of School Finance Reform in
Kansas: Equity Is in the Eye of the Beholder,’’ in Helping Children Left Behind: State Aid and the Pursuit of
Educational Equity, ed. John Yinger (Cambridge, MA: MIT Press, 2004): 145–158; A. Flanagan and
S. Murray, ‘‘A Decade of Reform: The Impact of School Reform in Kentucky,’’ in Helping Children Left
Behind: State Aid and the Pursuit of Educational Equity, ed. John Yinger (Cambridge, MA: MIT Press,
2004): 195–214.
11. Berne and Stiefel (1984); M. Moser and R. Rubenstein, ‘‘The Equality of Public School District
Funding in the US: A National Status Report,’’ Public Administration Review 62, no. 1 (2002): 63–72.
12. L. Stiefel, R. Rubenstein, and R. Berne, ‘‘Intra-District Equity in Four Large Cities: Methods,
Data, and Results,’’ Journal of Education Finance 23, no. 4 (1998): 447–467; R. Rubenstein, A. E. Schwartz,
L. Stiefel, and H. Bel Hadj Amor, ‘‘From Districts to Schools: The Distribution of Resources across
Schools in Big City School Districts,’’ Economics of Education Review 26 (2007): 532–545.
13. W. N. Evans, S. E. Murray, and R. M. Schwab, ‘‘Schoolhouses, Courthouses, and Statehouses after
Serrano,’’ Journal of Policy Analysis and Management 16, no. 1 (1997): 10–31.
14. J. Chambers, ‘‘Geographic Variations in Public Schools’ Costs,’’ Working Paper No. 98–04 pre-
pared for the U.S. Department of Education, National Center for Education Statistics (Palo Alto, CA:
American Institutes for Research, 1998); Guthrie and Rothstein (2001); W. D. Duncombe and J. M.
Yinger, ‘‘Why Is It So Hard to Help Central City Schools?,’’ Journal of Policy Analysis and Management
16, no. 1 (1997): 85–113; A. Reschovsky and J. Imazeki, ‘‘Achieving Educational Adequacy through School
Finance Reform,’’ Journal of Education Finance 26, no. 4 (2000): 373–396.
15. Rubenstein (2002); R. S. Vesely and F. E. Crampton, ‘‘An Assessment of Vertical Equity in Four
States: Addressing Risk Factors in Education Funding Formulas,’’ Journal of Education Finance 30, no. 2
(2004): 111–122.
16. G. L. Sunderman and J. S. Kim, ‘‘The Expansion of Federal Power and the Politics of Implementing
the No Child Left Behind Act,’’ Teachers College Record 109, no. 5 (2004): 1057–1085.
Public Budgeting & Finance / Fall 20084
require states or school systems to define standards and goals for student performance, andto measure this performance.17 Student achievement is most commonly measured throughstandardized assessments of student performance in a variety of subject areas and atvarious grade levels, though standards may also include other outcomes such as graduationrates and school climate measures (e.g., violent incidents). Before No Child Left Behind,states varied widely in the details of their accountability systems, with some using a ‘‘low-stakes’’ system in which performance measures are simply publicly reported, while otherimplemented a ‘‘high-stakes’’ system of rewards for high or improving performance and/orsanctions for low performance or declining performance.18
A growing body of literature has examined various aspects of state accountability sys-tems, in particular their effects on student performance. For example, Carnoy and Loeb19
use a 0–5 index of accountability strength in 50 states and find a positive relationshipbetween stronger accountability systems and student performance. Their study also ex-plores characteristics of states that might lead to adoption of an accountability system,finding that states with larger populations, higher proportions of minority students, andlower-achieving white students are more likely to adopt stronger accountability systems.Hanushek and Raymond20 also use national data and include state fixed effects to examinethe impact of state accountability systems on student performance and test-taking exemp-tions. They find that introduction of state accountability regimes significantly increaseoverall performance on the National Assessment of Educational Progress (NAEP), butthat the gains are primarily among white and Hispanic, but not black, students. Lee andWong21 directly examine the effects of state accountability policies on both resources andperformance using data on expenditures, class size, and teacher qualifications, as wellNAEP mathematics test scores. They generally find no significant relationships betweenaccountability policies and the resource variables, and that accountability policies neitherreduce nor exacerbate achievement gaps between black and white students.
CONTRIBUTION OF THIS STUDY
This study builds on the previous work to examine the impact of state accountability
systems on school funding. Theory suggests several possible connections between re-
source adequacy or equity and accountability policies. First, accountability policies des-
ignate explicit state student performance standards, facilitating the measurement and
identification of resource (in)adequacy. In early adequacy litigation, states had rarely set
explicit performance targets and often argued that existing resource and performance
17. Ladd (1999).
18. Hanushek and Raymond (2005) categorize high-stakes systems as ‘‘consequential’’ and low stakes as
‘‘report card.’’
19. Carnoy and Loeb (2003).
20. Hanushek and Raymond (2005).
21. J. Lee and K. K. Wong, ‘‘The Impact of Accountability on Racial and Socioeconomic Equity:
Considering Both School Resources and Achievement Outcomes,’’ American Educational Research Journal
41, no. 4 (2004): 797–832.
Rubenstein et al. / Equity and Accountability: Impact on School Finance 5
levels were adequate to meet constitutional obligations.22 We might therefore hypoth-
esize that states with explicit performance targets for districts and schools would be more
likely to provide the requisite resources to ensure that all districts can meet these stan-
dards. Lee and Wong23 term this effect an ‘‘input driven’’ policy-outcome path in which
accountability policies affect the level of school resources, which in turn affect student
achievement. Additionally, they suggest an ‘‘equity-related’’ path in which accountability
policies induce states to take steps to reduce racial and socioeconomic resource inequal-
ities.24
Second, accountability systems often focus on the population of students scoring
below designated performance benchmarks. To the extent that accountability efforts
induce states to target additional resources to students with the lowest performance
levels, we might expect to find improvements in resource adequacy over the period.
Conversely, if accountability measures lead states to focus additional resources on dis-
tricts with students most likely to meet new standards, resource equity could worsen.
Third, the increased emphasis on measuring and reporting student performance could
result in a funding ‘‘arms race’’ as districts increase spending to achieve or maintain high
levels of performance. Because not all school districts will be equally capable of in-
creasing spending, we might expect accountability efforts to worsen equity as wealthier
districts compete to provide additional programs aimed at improving test scores, and by
providing a disincentive for teachers to work in high-need districts.25
Finally, accountability regimes may have indirect effects on school finance, by en-
hancing calls for fiscal accountability along with performance accountability,26 or by
increasing housing prices in districts reporting high test scores,27 potentially worsening
housing segregation and therefore school resource inequality.28
Given the unanswered questions in the literature, we address three primary research
issues: First, how did the equity and adequacy of education funding change during the
1990s? Second, what is the relationship between state accountability implementation and
educational resource adequacy and equity? Third, what other factors are related to
changes in resource adequacy and equity?
22. Ladd and Hansen (1999).
23. Lee and Wong (2004).
24. Note that while No Child Left Behind requires states to report student performance by subgroups,
states were not required to do so before the federal law.
25. William S. Koski and Rob Reich, ‘‘When ‘Adequate’ Isn’t: The Retreat from Equity in Educational
Law and Policy and Why It Matters’’ (Palo Alto, CA: Stanford University, unpublished manuscript, 2006);
C. T. Clotfelter, H. F. Ladd, J. L. Vigdor, and R. A. Diaz, ‘‘Do School Accountability Systems Make It
More Difficult for Low-Performing Schools to Attract and Retain High-Quality Teachers?,’’ Journal of
Policy Analysis and Management 23, no. 2 (2004): 251–271.
26. D. J. Hoff, ‘‘States to Get New Options on NCLB,’’ Education Week 24, no. 31 (2005): 1, 38.
27. D. N. Figlio, ‘‘School Funding and School Accountability,’’ in Helping Children Left Behind: State
Aid and the Pursuit of Educational Equity, ed. John Yinger (Cambridge, MA: MIT Press, 2004): 87–110.
28. Koski and Reich (2006)
Public Budgeting & Finance / Fall 20086
DATA AND MODELS
Data Sources
The primary data for our analyses come from the Unified Fiscal-Nonfiscal (UFNF) data
set, which combines 11 years (1989–1990 to 1999–2000) of fiscal and nonfiscal data from
the National Center for Education Statistics (NCES) Common Core of Data (CCD).
The fiscal data include information on per-pupil expenditures and revenues for every
school district by source and function. The nonfiscal data include information on student
characteristics such as race, special education eligibility, and free lunch eligibility. The
UFNF file is particularly useful for panel data analysis because it contains a ‘‘pseudo-
district’’ variable. For nonunified districts (i.e., elementary or secondary schools only),
NCES combines data from elementary districts with the secondary districts to which they
are linked to form a unified K–12 pseudo-district. To create comparable district- and
state-level observations, we exclude Hawaii and the District of Columbia (which each
have only a single school district), as well as districts reporting enrollments below 50
pupils or per-pupil expenditureso$500. The latter set of exclusions results in elimination
of between 155 districts (1990) and 427 districts (1998) per year. Most of the deleted
school districts were not open in that particular year.29
The analyses focus on the distribution of per-pupil expenditures for elementary and
secondary education. To adjust for differences in purchasing power over time we deflate
all expenditures using the Consumer Price Index for urban consumers (CPI-U) from the
Bureau of Labor Statistics for each school year.30 To adjust for differences in input prices
across districts that affect school district spending, we adjust each district’s expenditures
by a district-specific Comparable Wage Index (CWI). The CWI uses hedonic models to
estimate the cost of hiring teachers and purchasing other supplies, controlling for teacher
characteristics and factors, such as amenities and labor market conditions, outside the
control of school districts. A year-specific CWI is available only for 1997 and later years.
In the interest of simplicity and to facilitate interpretation, we use the 1997 CWI to adjust
for geographic differences for all years.31
Accounting for differential student needs is critical to the analysis of vertical equity
and resource adequacy. Vertical equity examines the inequality in resources across dis-
tricts, considering the extent to which higher per-pupil spending is found in districts
serving higher proportions of students with special needs.32 Similarly, adequacy requires
that resources be sufficient to meet the needs of each student, which may vary consid-
29. Note that due to district consolidations and closings, the data contain different numbers of school
districts each year. Our regression analyses aggregate data to the state level, resulting in a balanced panel of
48 states each year.
30. The base year is 1989–1990.
31. To the extent that differentials in the cost of education have changed unevenly across districts over
time, the index may over- or underestimate cost differences in some districts.
32. Berne and Stiefel (1984).
Rubenstein et al. / Equity and Accountability: Impact on School Finance 7
erably across districts.33 To account for these cost differences, we create weighted student
counts reflecting estimated differences in the cost of educating students with special
needs. Specifically, the UFNF includes data on students with an individualized education
plan (IEP) to indicate eligibility for special education services, and the percentage of
students eligible for free or reduced price lunch, indicating that the student is from a low-
income household.
The appropriate additional funding required to educate students with special needs
has been the subject of considerable controversy in litigation, policy, and academic
research.34 While 16 states use pupil weights in their formulas to distribute state aid to
districts, these weights are often derived on an ad hoc basis and are typically well below
the weights estimated through cost studies.35
Our data include no information on student test scores or other performance mea-
sures; therefore we cannot independently estimate student weights. Evidence on the
additional costs of educating students with special needs has accumulated from numer-
ous empirical studies, though, and we draw on these analyses for our adjustments.
Ideally, we would have a district-specific cost index estimating the relative costs facing
each district in the country, accounting for both geographic and student-need differ-
ences. No such comprehensive national index currently exists. Instead, we combine the
CWI created by Taylor and Fowler,36 with student-need weights estimated by Dun-
combe and Yinger.37 Duncombe and Yinger estimate a cost function for New York State
districts, using a weighted average of pass rates on elementary and secondary math and
reading tests as output measures and setting the performance target at New York State’s
average performance in 2000.38,39 We use a weight of 1.55 for students eligible for
free lunch and 1.88 for students receiving special education services, as estimated by
Duncombe and Yinger, to create cost-adjusted per-pupil expenditures for each district.40
33. Duncombe and Yinger (1997); W. D. Duncombe and J. M. Yinger, ‘‘How Much More Does a
Disadvantaged Student Cost?,’’ Economics of Education Review 24, no. 5 (2005): 513–532.
34. See, for example, J. M. Yinger, ed., Helping Children Left Behind: State Aid and the Pursuit of
Educational Equity (Cambridge, MA: MIT Press, 2004); Duncombe and Yinger (2005); Chambers (1998);
Guthrie and Rothstein (2001).
35. Yinger (2004).
36. L. L. Taylor and W. J. Fowler, Jr., A Comparable Wage Approach to Geographic Cost Adjustment
(NCES 2006–321) (Washington, DC: United States Department of Education, National Center for Ed-
ucation Statistics, 2006).
37. Duncombe and Yinger (2005).
38. See Duncombe, Lukemeyer, and Yinger (2003) and Duncombe and Yinger (2005) for more details
on construction of the cost index.
39. Average performance implies, of course, that many districts failed to meet the standard. The lower
performing districts were largely concentrated in the state’s urban areas.
40. Duncombe and Yinger’s estimate of special education costs identifies special education students as
students receiving services outside their classroom for more than 60 percent of the day. Our analyses
identify special education students as those having IEPs. To the extent that some students in our data have
lower costs than those identified by Duncombe and Yinger, our data may overestimate the costs associated
Public Budgeting & Finance / Fall 20088
Using the cost-adjusted district-level expenditure data, we calculate dispersion mea-
sures and an adequacy measure for each state in each year. To measure dispersion, we
focus on the Gini coefficient, with additional sensitivity checks using the coefficient of
variation (CV) and McLoone index. The Gini coefficient is the ratio of the area between
a 45 degree line reflecting a perfectly equal distribution and the area below a Lorenz
curve measuring the actual distribution. The Gini varies from 0 (perfect equality) to 100
(complete inequality). The CV is calculated by taking the square root of the variance of
per-pupil expenditures divided by the mean per-pupil expenditure.41 Like the Gini co-
efficient, lower values indicate greater resource equality across districts. The McLoone
index is defined as the ratio of the total amount spent on students below each state’s
median expenditure level relative to spending on these students if they received the
median funding level. The underlying assumption in the case of the McLoone index is
that perfect equity would be achieved if every student below the median received the
same per-pupil expenditure amount as the median student. The index ranges from a
value of 0–100 with higher values indicating greater equity.
To measure adequacy we use the Odden-Picus Adequacy Index (OPAI). The OPAI
measures how far a school finance system is from achieving an ‘‘adequate’’ level of
spending. It is constructed as the ratio of spending on students in districts below a given
adequacy benchmark divided by spending required to achieve the adequacy bench-
mark.42 To achieve an OPAI of 100 requires that all districts in the state spend at or
above the benchmark, taking into account differential costs across districts.
There is no generally accepted benchmark to define an ‘‘adequate’’ level of spending.
The benchmark we adopt for our analyses is the cost-adjusted national median of el-
ementary and secondary expenditures for each year. A review of various methods to
assess adequacy suggest that the estimates are often very close to the national spending
median and that raising spending to the median could result in innovative school reform
initiatives being adequately funded.43,44 Because there is no generally accepted bench-
mark, though, we also conduct sensitivity analysis at a variety of other spending levels.
(footnote Continued)
with special education. As described below, however, we also test the sensitivity of the results to other
weights.
41. Berne and Stiefel (1984).
42. A. R. Odden and L. O. Picus, School finance: A Policy Perspective, 2nd ed. (New York: McGraw-
Hill, 2000).
43. A. R. Odden and C. Busch, Financing Schools for High Performance: Strategies for Improving the
Use of Educational Resources (San Francisco: Jossey-Bass, 1998); A. R. Odden and W. Clune, ‘‘School
Finance Systems: Aging Structures in Need of Repair,’’ Educational Evaluation and Policy Analysis 20, no. 3
(1998); Rubenstein (2002); R. Rubenstein, ‘‘National Evidence on Racial Disparities in School Finance
Adequacy,’’ in Developments in School Finance, 2001–03, ed. William J. Fowler, Jr. (prepared for the
National Center for Education Statistics). (Washington, DC: National Center for Education Statistics,
2003).
44. All dispersion and adequacy measures are weighted by district enrollment, i.e., we use a student level
of analysis, as is the norm in the measurement of school finance equity and adequacy.
Rubenstein et al. / Equity and Accountability: Impact on School Finance 9
In most states, distribution of aid to school districts is through a foundation grant
program, guaranteeing every district a minimum spending ‘‘floor’’ provided they levy a
minimum property tax rate.45 Adjustments for cost of living and student needs may be
included to produce a higher foundation in districts facing higher costs. In theory, the
OPAI measures a concept similar to a foundation formulaFwhether the resources in all
districts are sufficient to provide a base level of educational services, accounting for
differences in educational costs across districts.
In the context of a national study with relatively aggregate measures of student and
district characteristics, it may not be possible to fully capture all costs that lead to higher
or lower district spending. The weights used in this study represent the best available
estimates of the effects of common cost factors affecting school district spending. Sim-
ilarly, the OPAI reflects an estimated benchmark for districts to achieve adequacy, ad-
justed for these cost factors. Achieving the cost-adjusted OPAI does not, however,
guarantee high performance for all students. Because our models are dependent on cost
estimates and expenditure benchmarks derived in previous literature, we test the sen-
sitivity of our results to numerous cost-factor estimates and adequacy benchmarks.
For each state in each year we include a dichotomous ‘‘accountability’’ variable,
indicating whether the state had an accountability system in that year. The information is
obtained from a survey conducted by the Center for Research on Education Outcomes
(CREDO) in 2001. This survey reports information on the year in which states imple-
mented their accountability systems. The variable takes a value of ‘‘0’’ for each year in
which a state had not implemented an accountability system and ‘‘1’’ for the year in
which a state implements the accountability system.
Model
At the heart of our empirical work is a model that relates the equity or adequacy of
spending in state s in time t to the introduction of an accountability system. The model
includes a vector of state demographic characteristics, other state policies, and state and
time fixed effects, to control for time invariant characteristics of the states and common
macroeconomic shifts affecting all states:
Yst ¼ f ðAst; Sst; Lst; ds; gtÞ ð1Þ
where s indexes states and t indexes years, Y is a measure of dispersion or adequacy, A is
a dichotomous variable where 15 accountability system implemented in state s in year t,
S the statewide student and other demographic characteristics, L the successful school
finance litigation in state s in year t, d the state fixed effects, and g the time fixed effects.
The goal of this model is to isolate the impact of accountability standards on the
equity and adequacy of spending within states. The fixed-effects design is used to min-
imize potential bias from omitted variables. The state fixed effects capture time-invariant
45. Yinger (2004).
Public Budgeting & Finance / Fall 200810
but unobserved characteristics of states that may affect adequacy and equity (e.g., a state
political culture that places a high value on equity), while the time fixed effects capture
changes over time that affect all states (e.g., changes in the national economy).
While the literature examining the demand for education is fairly well developed
(particularly at the district level), there is relatively little research examining the deter-
minants of state-level equity or adequacy. Murray, Evans, and Schwab46 estimate a
reduced-form model to explain within-state spending inequalities that includes state and
year effects along with measures of school finance reform and litigation. Alternative
specifications of their model include within-state dispersion in district demographic
variables such as median income, race, educational attainment, age, and enrollment.47
Stiefel and Berne48 include state-level measures of personal income and educational
attainment as determinants of equity. Moser and Rubenstein49 examine correlates of
funding inequality, including the number districts in each state, funding level and per-
centage of funding from the state.
Drawing on this work, we control for other observable state demographic charac-
teristics that could be linked to funding equity and adequacy. Three variablesFthe
percentage of students who are black, Hispanic, and eligible for free and reduced price
lunch (which serves as a proxy for poverty) are available in each year at the district level.
Thus, we include a measure of the statewide dispersion across districts of these char-
acteristics (coefficient of variation) on the theory that an unequal distribution of student
characteristics may be related to an unequal distribution of resources. Other demo-
graphic characteristics that could affect equity and adequacy (the percentage of housing
units that are owner-occupied, the percentage of households with income below the
national poverty line, the percentage of the population over 65 years old, state median
household income) and the size of the education system (elementary and secondary
enrollment) are available from the Census Bureau only at the state level for each year.50
While our primary interest is in the effects of accountability, the control variables may
also shed light on other correlates of equity and adequacy. Because court-imposed ed-
ucation finance reforms have previously been found to significantly reduce inequalities in
funding within states,51 we estimate an additional model that includes a dichotomous
variable representing court-ordered finance reform in each state in each year.
46. S. E. Murray, W. N. Evans, and R. M. Schwab, ‘‘Education-Finance Reform and the Distribution
of Education Resources,’’ The American Economic Review 88, no. 4 (1998): 789–812.
47. District demographic variables are available only from the decennial census, therefore their alter-
native models use only three years of data (1970, 1980, and 1990).
48. L. Stiefel and R. Berne, ‘‘The Equity Effects of State School Finance Reforms: A Methodological
Critique and New Evidence,’’ Policy Sciences 13, no. 1 (1981): 75–98.
49. Moser and Rubenstein (2002).
50. Thus dispersion of these measures across districts in each state cannot be calculated. As is con-
ventional, we include the latter two variables in logarithmic form.
51. Evans, Murray, and Schwab (1997); Murray, Evans, and Schwab (1998).
Rubenstein et al. / Equity and Accountability: Impact on School Finance 11
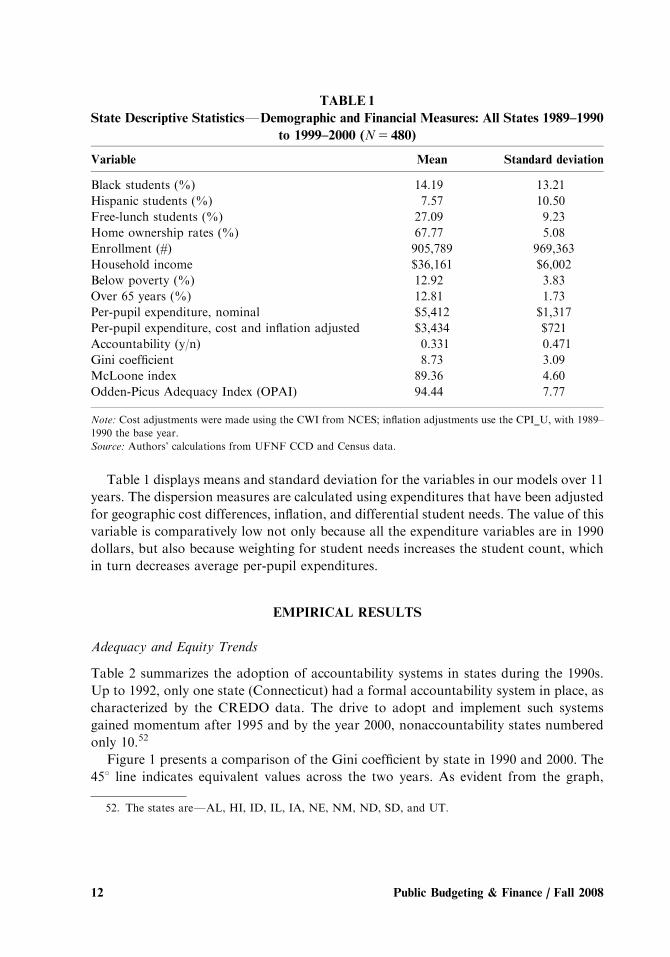
Table 1 displays means and standard deviation for the variables in our models over 11
years. The dispersion measures are calculated using expenditures that have been adjusted
for geographic cost differences, inflation, and differential student needs. The value of this
variable is comparatively low not only because all the expenditure variables are in 1990
dollars, but also because weighting for student needs increases the student count, which
in turn decreases average per-pupil expenditures.
EMPIRICAL RESULTS
Adequacy and Equity Trends
Table 2 summarizes the adoption of accountability systems in states during the 1990s.
Up to 1992, only one state (Connecticut) had a formal accountability system in place, as
characterized by the CREDO data. The drive to adopt and implement such systems
gained momentum after 1995 and by the year 2000, nonaccountability states numbered
only 10.52
Figure 1 presents a comparison of the Gini coefficient by state in 1990 and 2000. The
451 line indicates equivalent values across the two years. As evident from the graph,
TABLE 1
State Descriptive StatisticsFDemographic and Financial Measures: All States 1989–1990
to 1999–2000 (N5 480)
Variable Mean Standard deviation
Black students (%) 14.19 13.21
Hispanic students (%) 7.57 10.50
Free-lunch students (%) 27.09 9.23
Home ownership rates (%) 67.77 5.08
Enrollment (#) 905,789 969,363
Household income $36,161 $6,002
Below poverty (%) 12.92 3.83
Over 65 years (%) 12.81 1.73
Per-pupil expenditure, nominal $5,412 $1,317
Per-pupil expenditure, cost and inflation adjusted $3,434 $721
Accountability (y/n) 0.331 0.471
Gini coefficient 8.73 3.09
McLoone index 89.36 4.60
Odden-Picus Adequacy Index (OPAI) 94.44 7.77
Note: Cost adjustments were made using the CWI from NCES; inflation adjustments use the CPI_U, with 1989–
1990 the base year.
Source: Authors’ calculations from UFNF CCD and Census data.
52. The states areFAL, HI, ID, IL, IA, NE, NM, ND, SD, and UT.
Public Budgeting & Finance / Fall 200812
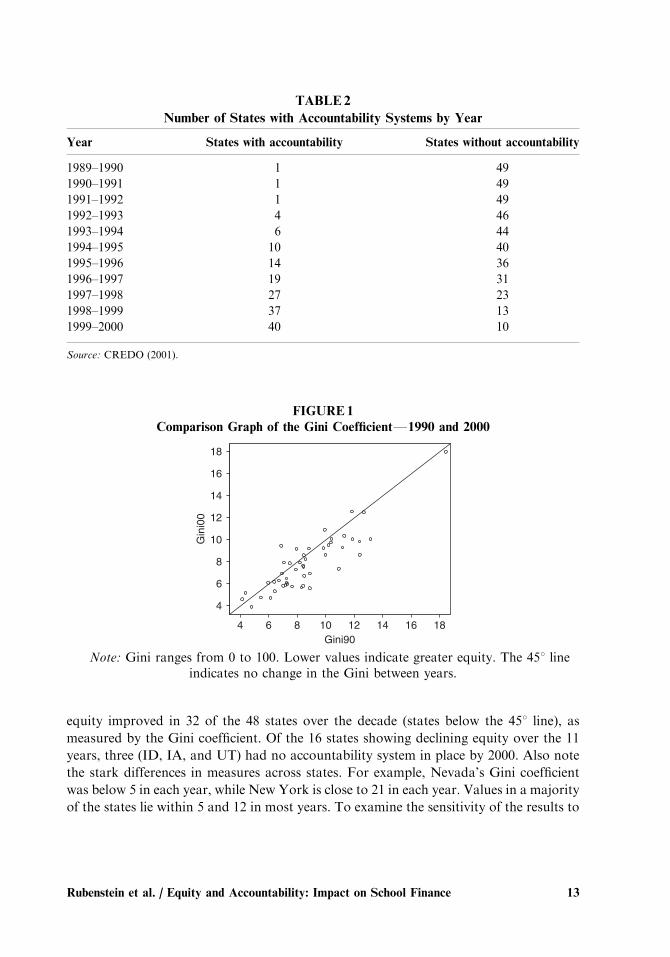
equity improved in 32 of the 48 states over the decade (states below the 451 line), as
measured by the Gini coefficient. Of the 16 states showing declining equity over the 11
years, three (ID, IA, and UT) had no accountability system in place by 2000. Also note
the stark differences in measures across states. For example, Nevada’s Gini coefficient
was below 5 in each year, while New York is close to 21 in each year. Values in a majority
of the states lie within 5 and 12 in most years. To examine the sensitivity of the results to
TABLE2
Number of States with Accountability Systems by Year
Year States with accountability States without accountability
1989–1990 1 49
1990–1991 1 49
1991–1992 1 49
1992–1993 4 46
1993–1994 6 44
1994–1995 10 40
1995–1996 14 36
1996–1997 19 31
1997–1998 27 23
1998–1999 37 13
1999–2000 40 10
Source: CREDO (2001).
1816141210864Gini90
18
16
14
12
10
8
6
4
Gini00
FIGURE1
Comparison Graph of the Gini CoefficientF1990 and 2000
Note: Gini ranges from 0 to 100. Lower values indicate greater equity. The 451 lineindicates no change in the Gini between years.
Rubenstein et al. / Equity and Accountability: Impact on School Finance 13
other measures of equity, we also calculate the coefficient of variation (CV) for each of
the states from 1990 to 2000.53 The trends for the coefficient of variation over 11 years
mirror in most cases the trends exhibited by the Gini coefficient with 37 of 48 states
exhibiting declining disparities.
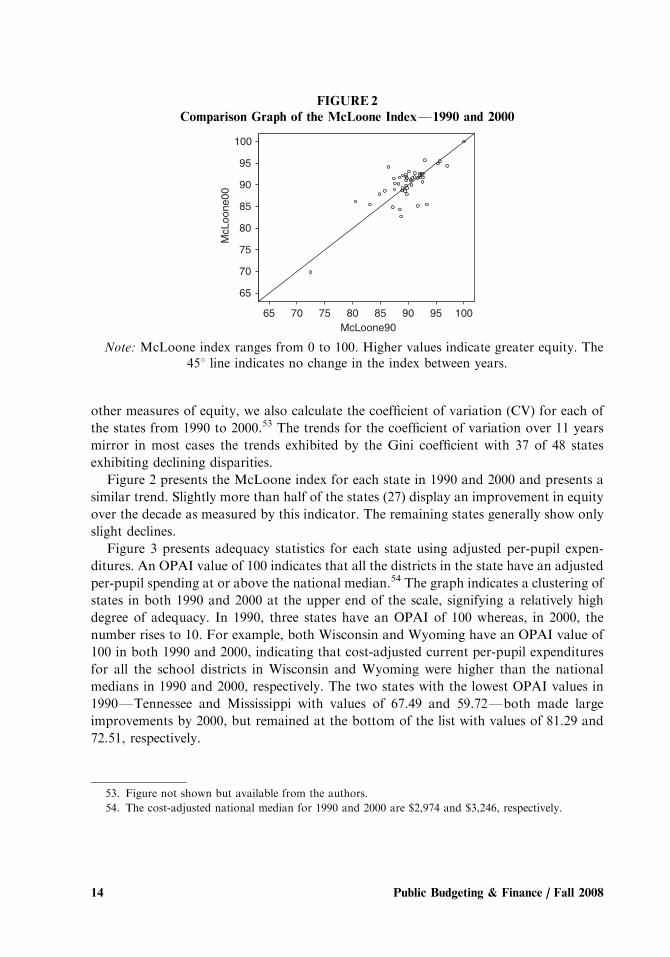
Figure 2 presents the McLoone index for each state in 1990 and 2000 and presents a
similar trend. Slightly more than half of the states (27) display an improvement in equity
over the decade as measured by this indicator. The remaining states generally show only
slight declines.
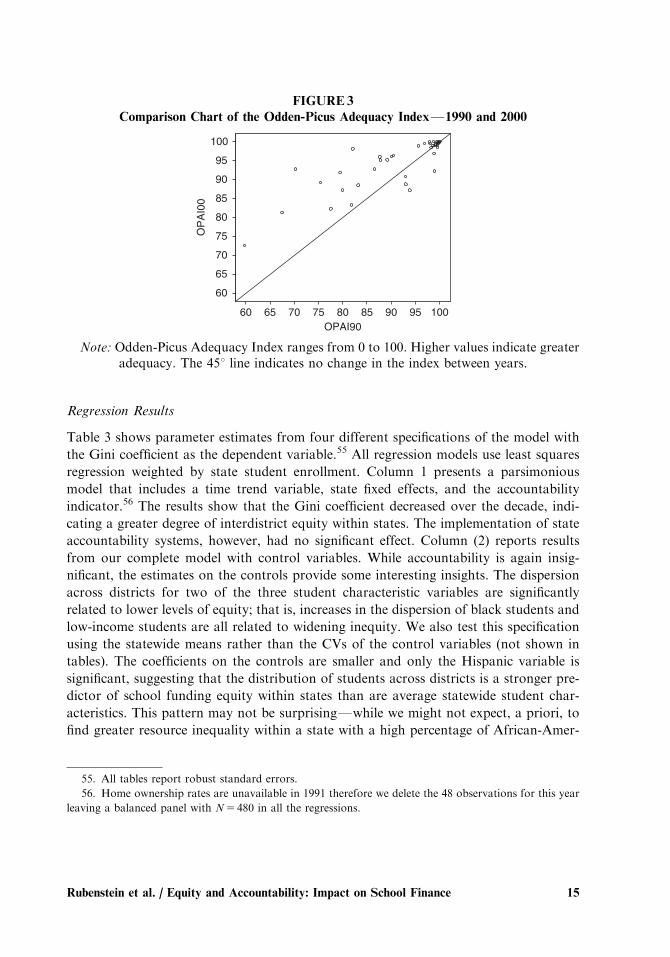
Figure 3 presents adequacy statistics for each state using adjusted per-pupil expen-
ditures. An OPAI value of 100 indicates that all the districts in the state have an adjusted
per-pupil spending at or above the national median.54 The graph indicates a clustering of
states in both 1990 and 2000 at the upper end of the scale, signifying a relatively high
degree of adequacy. In 1990, three states have an OPAI of 100 whereas, in 2000, the
number rises to 10. For example, both Wisconsin and Wyoming have an OPAI value of
100 in both 1990 and 2000, indicating that cost-adjusted current per-pupil expenditures
for all the school districts in Wisconsin and Wyoming were higher than the national
medians in 1990 and 2000, respectively. The two states with the lowest OPAI values in
1990FTennessee and Mississippi with values of 67.49 and 59.72Fboth made large
improvements by 2000, but remained at the bottom of the list with values of 81.29 and
72.51, respectively.
10095908580757065McLoone90
100
95
90
85
80
75
70
65
McL
oone
00
FIGURE 2
Comparison Graph of the McLoone IndexF1990 and 2000
Note: McLoone index ranges from 0 to 100. Higher values indicate greater equity. The451 line indicates no change in the index between years.
53. Figure not shown but available from the authors.
54. The cost-adjusted national median for 1990 and 2000 are $2,974 and $3,246, respectively.
Public Budgeting & Finance / Fall 200814
Regression Results
Table 3 shows parameter estimates from four different specifications of the model with
the Gini coefficient as the dependent variable.55 All regression models use least squares
regression weighted by state student enrollment. Column 1 presents a parsimonious
model that includes a time trend variable, state fixed effects, and the accountability
indicator.56 The results show that the Gini coefficient decreased over the decade, indi-
cating a greater degree of interdistrict equity within states. The implementation of state
accountability systems, however, had no significant effect. Column (2) reports results
from our complete model with control variables. While accountability is again insig-
nificant, the estimates on the controls provide some interesting insights. The dispersion
across districts for two of the three student characteristic variables are significantly
related to lower levels of equity; that is, increases in the dispersion of black students and
low-income students are all related to widening inequity. We also test this specification
using the statewide means rather than the CVs of the control variables (not shown in
tables). The coefficients on the controls are smaller and only the Hispanic variable is
significant, suggesting that the distribution of students across districts is a stronger pre-
dictor of school funding equity within states than are average statewide student char-
acteristics. This pattern may not be surprisingFwhile we might not expect, a priori, to
find greater resource inequality within a state with a high percentage of African-Amer-
1009590858075706560OPAI90
100
95
90
85
80
75
70
65
60
OPAI00
FIGURE3
Comparison Chart of the Odden-Picus Adequacy IndexF1990 and 2000
Note: Odden-Picus Adequacy Index ranges from 0 to 100. Higher values indicate greateradequacy. The 451 line indicates no change in the index between years.
55. All tables report robust standard errors.
56. Home ownership rates are unavailable in 1991 therefore we delete the 48 observations for this year
leaving a balanced panel with N5 480 in all the regressions.
Rubenstein et al. / Equity and Accountability: Impact on School Finance 15
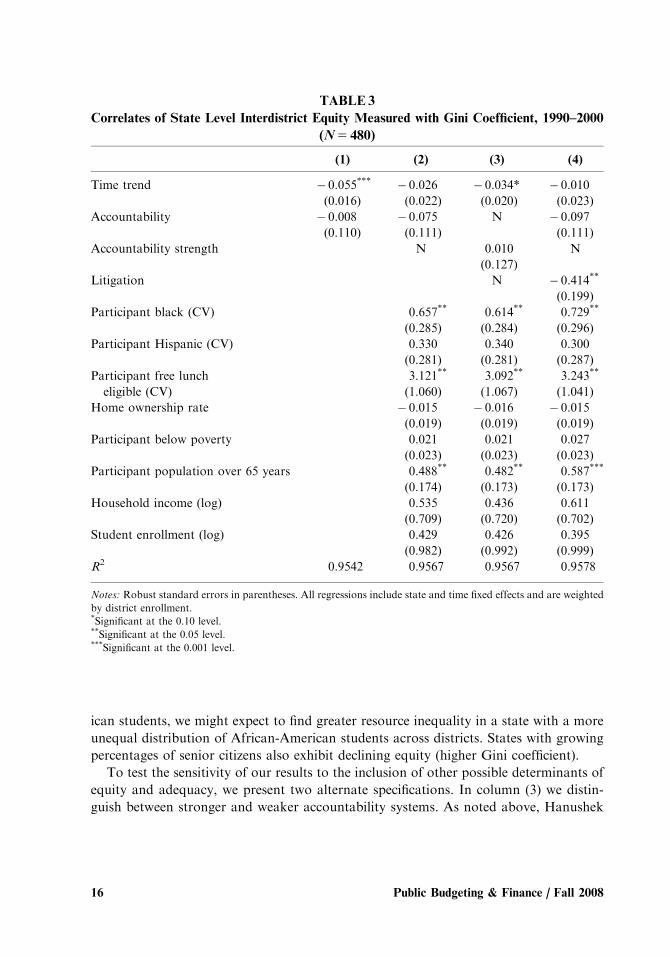
ican students, we might expect to find greater resource inequality in a state with a more
unequal distribution of African-American students across districts. States with growing
percentages of senior citizens also exhibit declining equity (higher Gini coefficient).
To test the sensitivity of our results to the inclusion of other possible determinants of
equity and adequacy, we present two alternate specifications. In column (3) we distin-
guish between stronger and weaker accountability systems. As noted above, Hanushek
TABLE 3
Correlates of State Level Interdistrict Equity Measured with Gini Coefficient, 1990–2000
(N5 480)
(1) (2) (3) (4)
Time trend � 0.055*** � 0.026 � 0.034* � 0.010
(0.016) (0.022) (0.020) (0.023)
Accountability � 0.008 � 0.075 N � 0.097
(0.110) (0.111) (0.111)
Accountability strength N 0.010 N
(0.127)
Litigation N � 0.414**
(0.199)
Participant black (CV) 0.657** 0.614** 0.729**
(0.285) (0.284) (0.296)
Participant Hispanic (CV) 0.330 0.340 0.300
(0.281) (0.281) (0.287)
Participant free lunch 3.121** 3.092** 3.243**
eligible (CV) (1.060) (1.067) (1.041)
Home ownership rate � 0.015 � 0.016 � 0.015
(0.019) (0.019) (0.019)
Participant below poverty 0.021 0.021 0.027
(0.023) (0.023) (0.023)
Participant population over 65 years 0.488** 0.482** 0.587***
(0.174) (0.173) (0.173)
Household income (log) 0.535 0.436 0.611
(0.709) (0.720) (0.702)
Student enrollment (log) 0.429 0.426 0.395
(0.982) (0.992) (0.999)
R2 0.9542 0.9567 0.9567 0.9578
Notes: Robust standard errors in parentheses. All regressions include state and time fixed effects and are weighted
by district enrollment.*Significant at the 0.10 level.**Significant at the 0.05 level.***Significant at the 0.001 level.
Public Budgeting & Finance / Fall 200816
and Raymond57 categorize accountability regimes into two types: consequential and
report card. We create a new variable named ‘‘strength’’ and code it ‘‘1’’ for conse-
quential accountability states and ‘‘0’’ for all others. The results for the regression with
the Gini coefficient as the dependent variable (column 3 in Table 5) are similar to those in
the first two model specifications. While the accountability coefficient becomes positive,
it remains insignificant. The same control variables remain significantly negatively
related to equity.
In column (4) we add a ‘‘litigation’’ variable to test the impact of court-ordered
finance reform.58 The litigation variable is coded ‘‘0’’ for a state with no litigation,
pending litigation, or a decision in favor of the state, and ‘‘1’’ for states in which the state
lost a challenge to its funding system in the highest state court. Similar to Evans, Murray,
and Schwab59 and Murray, Evans, and Schwab,60 we find that successful school finance
litigation is related to improved equity. The effect is relatively small, however, with a
coefficient of � .414, or approximately one-seventh of a standard deviation. This result
is noteworthy, though, because the previous work examined the years 1972–1992, while
this analysis examines 1990–2000, suggesting that litigation continued to be an effective
tool for addressing inequities across districts. As a further test for the robustness of our
results, we estimate these four models using the coefficient of variation rather than the
Gini coefficient as the dependent variable. The results, available from the authors, are
qualitatively similar to those using the Gini coefficient; all significant coefficients remain
significant with identical signs.
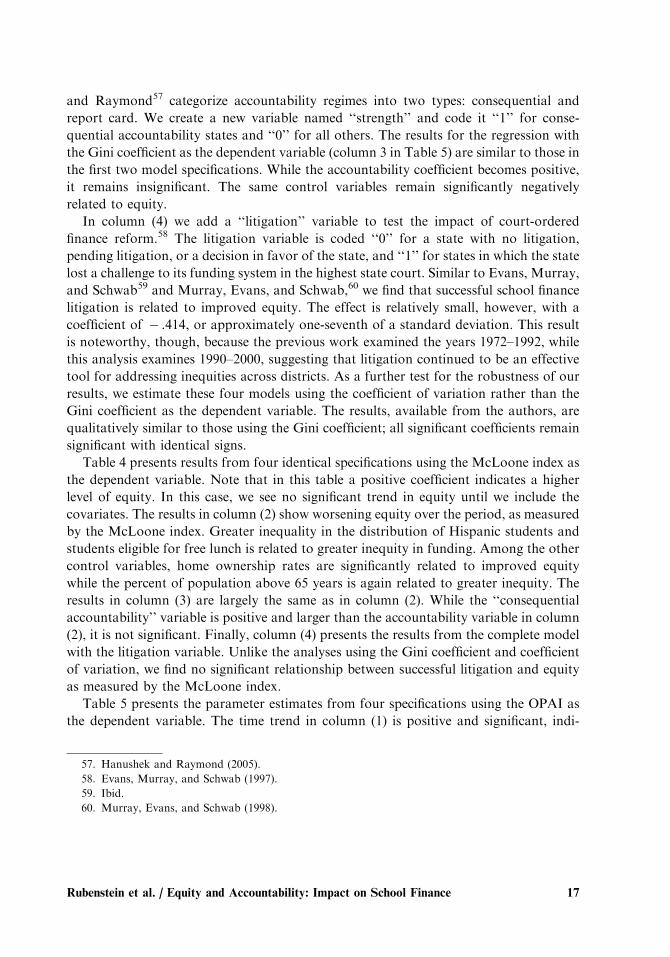
Table 4 presents results from four identical specifications using the McLoone index as
the dependent variable. Note that in this table a positive coefficient indicates a higher
level of equity. In this case, we see no significant trend in equity until we include the
covariates. The results in column (2) show worsening equity over the period, as measured
by the McLoone index. Greater inequality in the distribution of Hispanic students and
students eligible for free lunch is related to greater inequity in funding. Among the other
control variables, home ownership rates are significantly related to improved equity
while the percent of population above 65 years is again related to greater inequity. The
results in column (3) are largely the same as in column (2). While the ‘‘consequential
accountability’’ variable is positive and larger than the accountability variable in column
(2), it is not significant. Finally, column (4) presents the results from the complete model
with the litigation variable. Unlike the analyses using the Gini coefficient and coefficient
of variation, we find no significant relationship between successful litigation and equity
as measured by the McLoone index.
Table 5 presents the parameter estimates from four specifications using the OPAI as
the dependent variable. The time trend in column (1) is positive and significant, indi-
57. Hanushek and Raymond (2005).
58. Evans, Murray, and Schwab (1997).
59. Ibid.
60. Murray, Evans, and Schwab (1998).
Rubenstein et al. / Equity and Accountability: Impact on School Finance 17
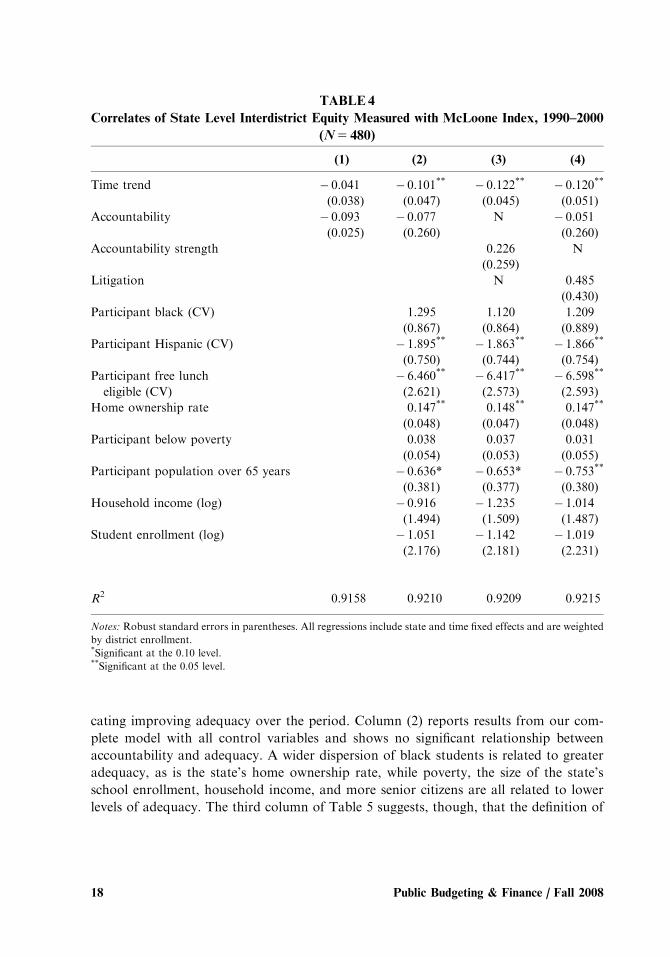
cating improving adequacy over the period. Column (2) reports results from our com-
plete model with all control variables and shows no significant relationship between
accountability and adequacy. A wider dispersion of black students is related to greater
adequacy, as is the state’s home ownership rate, while poverty, the size of the state’s
school enrollment, household income, and more senior citizens are all related to lower
levels of adequacy. The third column of Table 5 suggests, though, that the definition of
TABLE 4
Correlates of State Level Interdistrict Equity Measured with McLoone Index, 1990–2000
(N5 480)
(1) (2) (3) (4)
Time trend � 0.041 � 0.101** � 0.122** � 0.120**
(0.038) (0.047) (0.045) (0.051)
Accountability � 0.093 � 0.077 N � 0.051
(0.025) (0.260) (0.260)
Accountability strength 0.226 N
(0.259)
Litigation N 0.485
(0.430)
Participant black (CV) 1.295 1.120 1.209
(0.867) (0.864) (0.889)
Participant Hispanic (CV) � 1.895** � 1.863** � 1.866**
(0.750) (0.744) (0.754)
Participant free lunch � 6.460** � 6.417** � 6.598**
eligible (CV) (2.621) (2.573) (2.593)
Home ownership rate 0.147** 0.148** 0.147**
(0.048) (0.047) (0.048)
Participant below poverty 0.038 0.037 0.031
(0.054) (0.053) (0.055)
Participant population over 65 years � 0.636* � 0.653* � 0.753**
(0.381) (0.377) (0.380)
Household income (log) � 0.916 � 1.235 � 1.014
(1.494) (1.509) (1.487)
Student enrollment (log) � 1.051 � 1.142 � 1.019
(2.176) (2.181) (2.231)
R2 0.9158 0.9210 0.9209 0.9215
Notes: Robust standard errors in parentheses. All regressions include state and time fixed effects and are weighted
by district enrollment.*Significant at the 0.10 level.**Significant at the 0.05 level.
Public Budgeting & Finance / Fall 200818
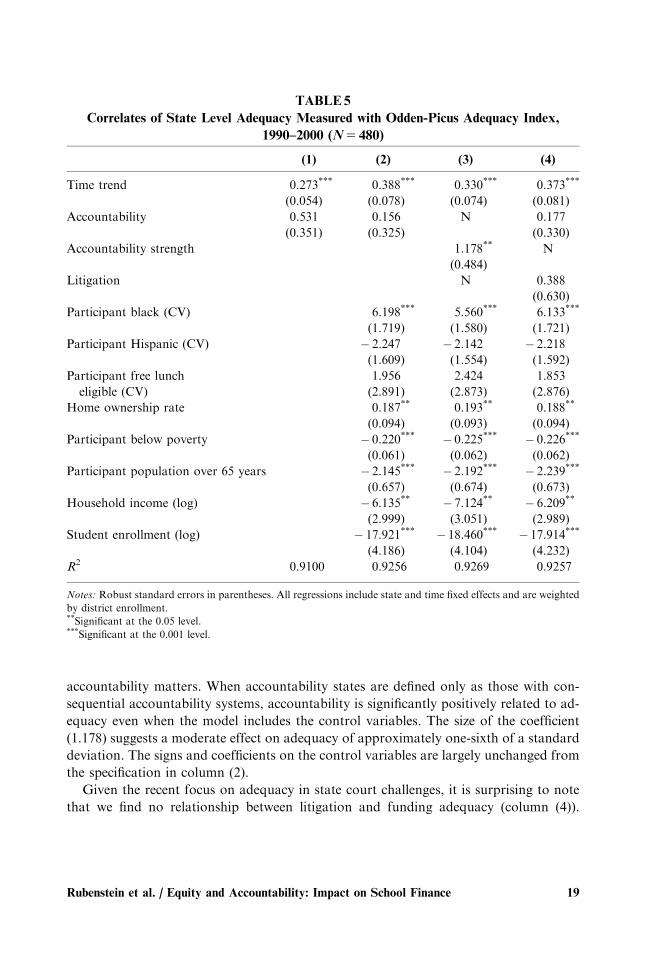
accountability matters. When accountability states are defined only as those with con-
sequential accountability systems, accountability is significantly positively related to ad-
equacy even when the model includes the control variables. The size of the coefficient
(1.178) suggests a moderate effect on adequacy of approximately one-sixth of a standard
deviation. The signs and coefficients on the control variables are largely unchanged from
the specification in column (2).
Given the recent focus on adequacy in state court challenges, it is surprising to note
that we find no relationship between litigation and funding adequacy (column (4)).
TABLE5
Correlates of State Level Adequacy Measured with Odden-Picus Adequacy Index,
1990–2000 (N5 480)
(1) (2) (3) (4)
Time trend 0.273*** 0.388*** 0.330*** 0.373***
(0.054) (0.078) (0.074) (0.081)
Accountability 0.531 0.156 N 0.177
(0.351) (0.325) (0.330)
Accountability strength 1.178** N
(0.484)
Litigation N 0.388
(0.630)
Participant black (CV) 6.198*** 5.560*** 6.133***
(1.719) (1.580) (1.721)
Participant Hispanic (CV) � 2.247 � 2.142 � 2.218
(1.609) (1.554) (1.592)
Participant free lunch 1.956 2.424 1.853
eligible (CV) (2.891) (2.873) (2.876)
Home ownership rate 0.187** 0.193** 0.188**
(0.094) (0.093) (0.094)
Participant below poverty � 0.220*** � 0.225*** � 0.226***
(0.061) (0.062) (0.062)
Participant population over 65 years � 2.145*** � 2.192*** � 2.239***
(0.657) (0.674) (0.673)
Household income (log) � 6.135** � 7.124** � 6.209**
(2.999) (3.051) (2.989)
Student enrollment (log) � 17.921*** � 18.460*** � 17.914***
(4.186) (4.104) (4.232)
R2 0.9100 0.9256 0.9269 0.9257
Notes: Robust standard errors in parentheses. All regressions include state and time fixed effects and are weighted
by district enrollment.**Significant at the 0.05 level.***Significant at the 0.001 level.
Rubenstein et al. / Equity and Accountability: Impact on School Finance 19
Inclusion of the litigation variable also has little effect on the size of the accountability
coefficient as compared with results without the litigation variable in column (2).61
We also test the sensitivity of the results to a variety of definitions of adequacy and
student weights.62 We estimate four additional sets of regression analyses for the OPAI
setting the adequacy level at the 25th percentile, the national mean and the 75th per-
centile of per pupil expenditures. The results from all the equations mirror the results
presented in Table 5, though the distribution of free lunch students is positive and
becomes significant when the adequacy level is set at the 75th percentile. To test the
sensitivity of these results to alternative student weights, we estimate additional models
for the Gini, McLoone, and the OPAI using adjustments of 1.2 for poverty and 2.3 for
special education, as suggested by Parrish, Hikido, and Fowler.63 We also estimate
additional models using the 1.2 poverty weight from Parrish, Hikido, and Fowler64 and
2.59 special education weights estimated by Reschovsky and Imazeki.65 The results from
the alternative weights largely mirror the results from our original analysis, with no
changes in the significance of any variables.
DISCUSSION
This paper provides an analysis of the possible relationship between important school
reform efforts of the 1990s and 2000s: school finance equity/adequacy and school ac-
countability systems. We find that vertical equity and adequacy in school finance systems
generally improved during the 1990s, particularly in the latter half of the decade. These
trends were not uniform across the country though, as many of the states with the lowest
OPAI values are in the South, even after adjusting for geographic cost differences. We do
not find relationships between school finance equity and the implementation of ac-
61. The state fixed effects capture all unobserved unchanging state policies that may affect equity and
adequacy. New policies enacted during the 1990s pose the threat of omitted variable bias if not included in
the model. To assess this possibility, we estimated alternative models with dichotomous variables for states
that enacted revenue limitations or expenditures limitations (TELs) during the 1990s (see D. R. Mullins and
B. Wallin, ‘‘Tax and Expenditure Limitations: Introduction and Overview,’’ Public Budgeting and Finance
24, no. 4 (2004): 2–15). The results from these alternative models are very similar to those presented in
Tables 3–5. The accountability variable and the demographic control variables do not change sign or
significance in any of the regressions that include the TEL variables. In most of these models, the size of the
coefficients is almost identical to those in Tables 3–5. While the inclusion of the TEL variable does not
account for all policy changes that have occurred during the period, these results suggest that they do not
pose the threat of omitted variable bias. The full results are available from the authors.
62. Results are not shown in the tables but are available from the authors.
63. T. B. Parrish, C. S. Hikido, and W. J. Fowler, Jr., Inequalities in Public School District Revenues
(Prepared for the National Center on Education Statistics), (Washington, DC: U.S. Department of
Education, National Center on Education Statistics, 1998).
64. Ibid.
65. Reschovsky and Imazeki (2000).
Public Budgeting & Finance / Fall 200820
countability policies. Instead, student demographics, particularly the dispersion of mi-
nority students and low-income students within states, appear to have a strong negative
impact on funding equity. Although accountability appears largely unrelated to equity,
we find evidence that successful litigation challenging state education-funding systems is
related to a more equitable distribution of funding, as measured by the Gini coefficient
and coefficient of variation.
We also find some evidence that the implementation of stronger accountability sys-
tems is related to improved resource adequacy. This pattern is similar to Hanushek and
Raymond’s66 finding that consequential accountability had a positive effect on achieve-
ment when compared with weaker accountability states.
Why might we find these patterns? A common complaint about the federal No Child
Left Behind Act is that it amounts to an unfunded mandate on school districts67 and
student performance is unlikely to improve substantially without improvements in the
adequacy of resources. Our results suggest that state accountability efforts may, in fact,
have coincided with efforts by states and school districts to improve the sufficiency of
resources, particularly for lower-spending districts in states with high-stakes systems.68 It
is possible that states, recognizing the need to improve resource sufficiency began
providing additional funding to low-spending districts following implementation of
accountability programs.
It is interesting, though, that changes in accountability did not worsen or improve
equity. It is possible that states and districts focused on providing a funding floor, rather
than on changing the distribution of resources across districts and that higher-spending
districts increased their spending as well. To the extent that additional resources were
needed to improve student performance, these results, combined with Hanushek and
Raymond’s findings of improved performance in consequential accountability states,
suggest that these states may have ‘‘put their money where their mouth is’’ by combining
higher expectations for student performance with higher funding and let equity take its
own course.
A more troubling pattern that emerges from this research is the effect of student
demographics on funding equity. Our estimates suggest a strong relationship between
unequal distributions of minority and poor students and more inequitable distributions
of resources within states. This pattern remains even after controlling for national trends
and time-invariant state characteristics. It suggests specific efforts, different from ac-
countability implementation, need to be initiated in order to counter these patterns in
inequity of resources.
66. Hanushek and Raymond (2005).
67. A. Reschovsky and J. Imazeki, ‘‘School Finance Reform in Texas: A Never Ending Story?,’’ in
Helping Children Left Behind: State Aid and the Pursuit of Educational Equity, ed. John Yinger (Cambridge,
MA: MIT Press, 2004): 251–282.
68. Recall that the OPAI focuses on districts below benchmark spending levels.
Rubenstein et al. / Equity and Accountability: Impact on School Finance 21
The evidence presented in this paper provides an opportunity to examine whether
major state education policy initiatives have worked at cross-purposes. The evidence
suggests that imposing more stringent accountability for results may be working to
provide adequate resources, but that these efforts appear to be providing little change in
resource equity. Other initiatives are apparently needed if further reductions in inequity
are a goal, but it is good news for many that accountability has not worsened equity.
With the federal government now requiring states to test students and hold schools
accountable, it remains to be seen whether such a federal mandate will have a similar
effect and spur other states to improve the adequacy of resources. To the extent that
finance and accountability policies are formulated in tandem, the possibilities of achiev-
ing broad-based opportunities to learn may be greatly enhanced.
NOTES
The authors wish to thank John Yinger, William Duncombe, Leonard Lopoo, David Figlio, Stuart
Bretschneider, seminar participants at the Maxwell School, Syracuse University, and session par-
ticipants at APPAM for generous comments on an earlier draft. All responsibility for errors and
omissions is ours.
Public Budgeting & Finance / Fall 200822