Embed Size (px)
Citation preview

Copyright © 2012. NCS Pearson, Inc. or its affiliate(s). All rights reserved. Page 1 Q-interactive is a trademark in the U.S. and/or other countries, of Pearson Education, Inc. or its affiliate(s).
Equivalence of Q-interactiveTM
-Administered Cognitive Tasks: WAIS-IV
®
Q-interactive Technical Report 1
Mark H. Daniel, PhD Senior Scientist for Research Innovation
June 2012
Copyright © 2012. NCS Pearson, Inc. or its affiliate(s). All rights reserved. Page 2 Q-interactive is a trademark in the U.S. and/or other countries, of Pearson Education, Inc. or its affiliate(s).
Introduction
Q-interactiveTM is a Pearson platform for computer-assisted, individually administered tests. The Q-interactive system is designed to make assessment more convenient and accurate, to give the clinician easier access to a larger number of tests, and eventually to support new types of tests that cannot be administered or scored without computer assistance.
To administer a test in Q-interactive, the examiner and examinee use wireless tablets that are
synched with each other so that the examiner can read administration instructions, time and capture
response information (including audio recording), and control the examinee’s tablet. The examinee
tablet displays visual stimuli and captures touch responses.
A goal for the initial test adaptations to the Q-interactive platform was to maintain raw-score
equivalence between standard (paper) and digital administration formats, so that raw scores would
be interchangeable. If equivalence could be demonstrated, then the existing norms, reliability, and
validity information could be applied to Q-interactive results. For this reason, physical manipulatives
(e.g., blocks in the Wechsler Block Design subtest) and printed response booklets (Wechsler
Processing Speed subtests) were used with the Q-interactive administration. Though these physical
components may eventually be replaced by interactive digital interfaces, the degree of adaptation
required would make raw-score equivalence unlikely.
The purpose of this study was to evaluate the equivalence of scores from Q-interactive and
standard administrations of the Wechsler Adult Intelligence Scale, Fourth Edition (WAIS–IV;
Wechsler, 2008). Digital (Q-interactive) administration may affect test scores for multiple
reasons, including:
examinee interaction with the tablet;
examiner interaction with the tablet, especially related to response capture and scoring; and
global effects of the digital assessment environment.
Copyright © 2012. NCS Pearson, Inc. or its affiliate(s). All rights reserved. Page 3 Q-interactive is a trademark in the U.S. and/or other countries, of Pearson Education, Inc. or its affiliate(s).
Most of the differences introduced in the first version of Q-interactive occurred in the examiner
interface. Administering a test on Q-interactive is different from the standard administration because
Q-interactive includes tools and procedures designed to simplify and support the examiner’s task. A
global effect was observed in an early study of an interface design, in which the examiners used a
keyboard to capture the examinees’ verbal responses. Examinees appeared to slow down their
responding so as not to get ahead of the examiner. This interface design was abandoned.
In this study, if a task was not found to be equivalent across the two formats (i.e., a digital effect),
the cause of the digital effect was investigated. In principle, if an effect is the result of examiners
being more accurate in administration or scoring, then Q-interactive provides an advance in
assessment technology and the lack of equivalence is not necessarily a problem. A reasonable
objective for a new technology may be to produce results that are equivalent to those from
examiners who use the standard paper format correctly; the digital format should not be expected
to replicate administration or scoring error. On the other hand, if it appears that a digital effect is
due to a reduction in accuracy on the part of either the examinee or the examiner, then the priority
would be to modify the Q-interactive system to remove this source of error. Only if that was not
possible would the effect be dealt with through norms adjustment. Collecting information through
video recording was important to evaluating administration and scoring accuracy during the
equivalence study.
Equivalence Study Designs
Several experimental designs were employed in the current study. Most of them used a randomly or
non-randomly equivalent-groups design in which each examinee took a test only once, in digital or
standard (paper) format, so that their experience was highly similar to what will occur in clinical
practice. This design requires larger samples than a retest or alternate-form design, but mitigates
the risk of practice effects. Some of the WAIS-IV subtests have practice effects when administered
in the final format. After an examinee has solved a problem once, solving it a second time is a
different process. (Few of the Q-interactive tests have alternate forms.) Taking a test a second time,
the cognitive processes employed may be substantially different, interfering with the effort to detect
a format effect. An equivalent-groups design that compares the performance of two groups, one
taking the test in the digital format and the other in the paper format, avoids these problems.
Copyright © 2012. NCS Pearson, Inc. or its affiliate(s). All rights reserved. Page 4 Q-interactive is a trademark in the U.S. and/or other countries, of Pearson Education, Inc. or its affiliate(s).
Randomly Equivalent Groups Design
The sample should resemble the general population in terms of sex, ethnicity, and education level.
The distribution of age should reflect the research questions (e.g., over-representing age levels at
which a particular risk of nonequivalence is suspected). Within each demographic cell (combination
of sex, ethnicity, and education), half of the examinees are randomly assigned to each format.
Immediately following test administration, all examinees take a set of covariate tests in paper format
that measure the same constructs as the digitally administered test (the focal test).
The results of each focal test or subtest are then analyzed separately, using multiple regression (or
ANCOVA). In the regression method, the predictors are age-adjusted normative scores on the
covariate tests, demographic variables, and a dummy-coded variable that represents administration
format. The dependent variable is the age-adjusted normative score on the focal test. The
unstandardized regression weight for format is a measure of the format effect, expressed in the
focal test’s normative-score metric.
The Q-interactive team has chosen to use an effect size of less than 0.2 as the standard for
equivalence. (This is slightly more than one-half of a scaled-score point on the Wechsler subtest
metric that has a mean of 10 and standard deviation of 3.) If the combination of demographics and
the covariate tests has a multiple correlation of 0.7 with the score on the test being analyzed (a
typical value for the WAIS–IV), then obtaining power of 0.8 to detect an effect size of 0.2 (with alpha
of .05) requires 200 examinees per format for a total of approximately 400.
The advantage of the randomly equivalent groups design is that the random assignment of
examinees to format tends to make the subsamples being compared equivalent on all
characteristics that might influence test performance, including those that are not measured (or
cannot be measured). This advantage comes at the price, however, of requiring a relatively
large sample.
Copyright © 2012. NCS Pearson, Inc. or its affiliate(s). All rights reserved. Page 5 Q-interactive is a trademark in the U.S. and/or other countries, of Pearson Education, Inc. or its affiliate(s).
Non-Randomly Equivalent Groups Design
This method leverages the large and carefully stratified norm sample that exists for each test and
reduces the required sample size. It can be used when the focal test contains two or more subtests
that measure the same ability construct, or when the norm sample examinees took external
covariate tests. When two subtests measure the same construct, they serve as the covariate tests.
In this design, the existing norm sample serves as the paper-administration sample and only the
digital-administration sample needs to be collected. The digital sample should have similar
demographic characteristics as the norm sample. The large size of the norm sample reduces the
size of the digital sample needed to reach a specified level of power. The statistical findings in the
norm sample are treated as population parameters, permitting the use of a one-sample test of
whether the statistical results in the digital sample differ from those parameters.
One method of analyzing the data from this design is to develop prediction equations for focal test
scores based on demographics and the covariate-test scores, using the norm-sample data. These
equations are applied to the digital-format sample, and the average difference between the
observed and predicted scores on the focal test is taken to be an estimate of the format effect. If the
multiple correlation of the covariate tests and demographic variables with scores on the focal test is
.75 (typical for the WAIS–IV), then a digital-format sample of approximately 100 cases provides
power of 0.8 to detect an effect size of 0.2 (at alpha of .05).
Other Designs
Occasionally, the nature of a test lends itself to a more efficient type of design in which examinees
serve as their own controls, such as retest and dual-capture. (The alternate-form design has not
been feasible because the WAIS-IV subtests do not have alternate forms.)
Retest Design
In the retest design, each examinee takes the test twice, and the administration sequence is
counterbalanced in the sample. This design is appropriate when the response processes are
thought to be unlikely to change substantially on retest, because the examinee does not learn
solutions to specific problems or strategies for solving novel problems. Examples of such tests are
measures of processing speed or short-term memory for non-meaningful stimuli.
Copyright © 2012. NCS Pearson, Inc. or its affiliate(s). All rights reserved. Page 6 Q-interactive is a trademark in the U.S. and/or other countries, of Pearson Education, Inc. or its affiliate(s).
When a retest design is possible, it is highly efficient because examinees serve as their own
controls. In this method, each examinee takes the test twice, once in each format, and the
administration sequence is counterbalanced so that half of the examinees take one format first and
half take the other first.
A retest equivalence study is analyzed by calculating for each examinee the difference between the
second-administration and first-administration scores. If there is no format effect, the average value
of these differences will be the same regardless of sequence. However, if there is a format effect,
the average difference scores in the two sequence groups will differ by twice the size of the effect,
because in one sequence group the effect will increase the average difference score and in the
other sequence group it will reduce it. Using demographically matched pairs of examinees in the
two sequence groups produces high statistical power with small sample sizes. Assuming a retest
correlation of 0.8, a sample of 30 cases (15 matched pairs) is needed to achieve power of 0.8 to
detect an effect size of 0.2 (alpha = .05).
Dual Capture Design
In the dual-capture design, each examinee takes the test only once, but the administration is video
recorded to capture the examinee’s responses and all audio. A number of examiners independently
watch each video to capture and score the responses, using the paper or the digital format.
This design is appropriate for subtests where the digital format does not affect examinee behavior,
either directly (by viewing or responding on the table) or indirectly (by the examiner’s feedback to
the examinee while the examinee is performing each item). Administrations are video recorded from
the examiner’s point of view, without showing the examiner capturing and scoring the responses. A
set of examiners scores each video recording, half use paper procedures and the other half uses
digital procedures. To the extent that the assumption that examinee behavior is not affected by the
digital format is correct, this is the equivalent of a retest design in which the examinee’s
performance is identical on each administration. Thus, the design focuses entirely on the effect of
the digital format on the examiner’s ability to capture and score that performance. Enough
examinees are needed to provide a range of types of performance, and each recording should be
scored by several examiners in each format.
Copyright © 2012. NCS Pearson, Inc. or its affiliate(s). All rights reserved. Page 7 Q-interactive is a trademark in the U.S. and/or other countries, of Pearson Education, Inc. or its affiliate(s).
Selection of Participants
The initial Q-interactive equivalence studies used samples of nonclinical examinees with
demographic characteristics similar to those of the general population. Examinees with clinical
conditions were excluded in order to focus the studies on estimating the presence and size of any
format effects. Because the effects of computer-assisted administration on individuals with
particular clinical conditions are difficult to predict, including an arbitrarily determined sample of
examinees with various disorders would have unknown effects on the results and could interfere
with the goal of seeing whether the digital format has an effect on examinee or examiner behavior.
Examiners participating in the format-equivalence studies were expected to be proficient in the
test’s standard administration procedures and received enough training and practice in the digital
administration procedures to be able to conduct the administration smoothly, without having to
devote a great deal of attention to the format. Experience suggests that becoming thoroughly
familiar with a new format takes a substantial amount of practice.
Studies of WAIS–IV Equivalence
To date, two WAIS–IV studies have been completed and a study of the WISC–IV is in process.
Study 1: WAIS–IV
Method
The non-randomly equivalent-groups method was used for the first WAIS–IV Q-interactive study,
conducted in August–September 2011.
Participants
The Q-interactive Study 1 sample consisted of individuals, ages 16 to 77, who were recruited by
Pearson’s Field Research staff or by a market research firm. Potential examinees were screened
for demographic characteristics and exclusionary factors, such as perceptual or motor disabilities or
severe clinical conditions. (A number of individuals with mild clinical conditions were recruited and
tested, but were excluded from the analyses.) The sampling plan called for an overrepresentation of
individuals at the upper age levels and those with no more than a high school education. These
groups were expected to be the most likely to be affected by the digital administration format.
Individuals who agreed to participate were randomly assigned to one of two substudies (Study 1a or
Study 1b). All examinees were paid for their participation.
Copyright © 2012. NCS Pearson, Inc. or its affiliate(s). All rights reserved. Page 8 Q-interactive is a trademark in the U.S. and/or other countries, of Pearson Education, Inc. or its affiliate(s).
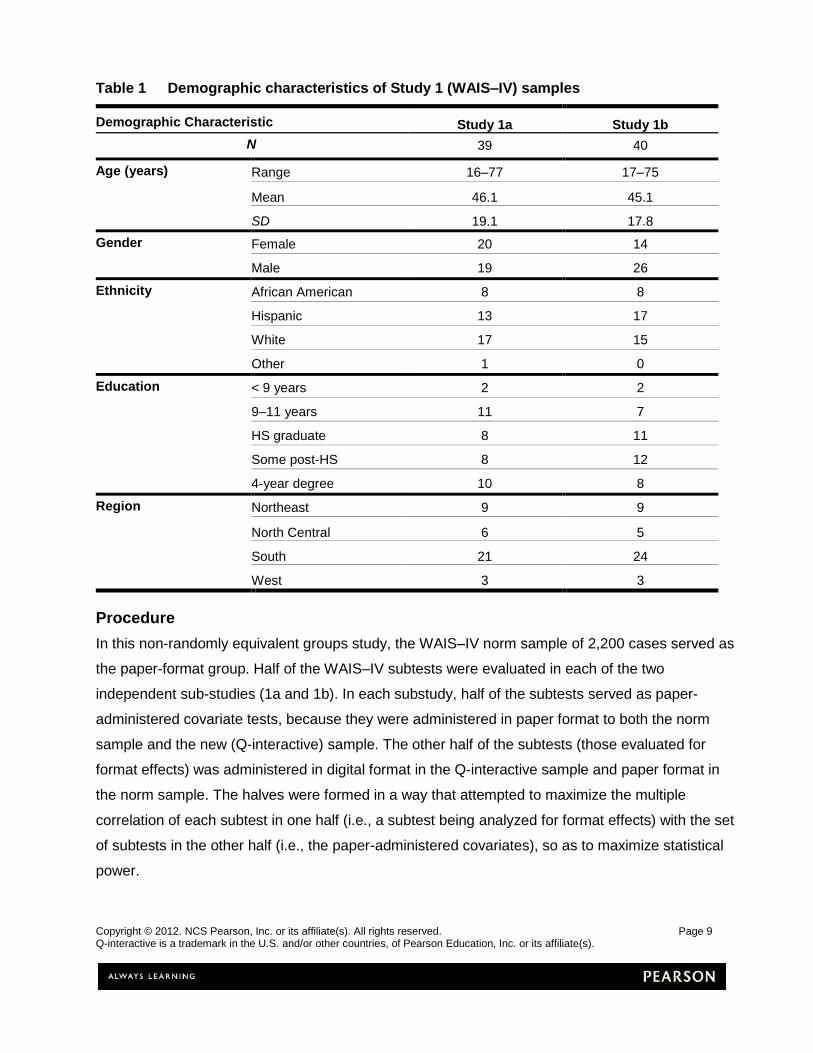
Table 1 reports the demographic characteristics of the two subsamples, which are similar except for
gender (with the Study 1b sample having a higher proportion of males). Because the substudies are
analyzed independently (that is, not compared with each other), this difference does not affect the
analyses.
Power analysis indicates that with 39 or 40 examinees taking each subtest digitally, and with a .75
multiple correlation of the covariate tests and demographic variables with scores on the focal test,
the nonrandomly equivalent groups design has a 0.46–0.47 probability of finding a statistically
significant effect (at alpha of .05) if the true effect size is 0.2.
Examiners were school and clinical psychologists qualified and experienced in administering
WAIS–IV or WISC–IV. They received two days of onsite training in administering WAIS–IV with Q-
interactive, and they conducted several practice administrations before the study began. Testing
took place at four sites: San Antonio, Chicago, San Francisco, and Newark, NY (near Rochester).
In San Antonio, testing was conducted in the Pearson office, and in the other sites the market
research firms that recruited the examinees provided testing rooms. All administrations were video
recorded (with the examinee’s consent) so that the accuracy of both digital and paper
administrations could be evaluated if any format effects were found. Examiners who were not
Pearson employees were paid for their participation.
Copyright © 2012. NCS Pearson, Inc. or its affiliate(s). All rights reserved. Page 9 Q-interactive is a trademark in the U.S. and/or other countries, of Pearson Education, Inc. or its affiliate(s).
Table 1 Demographic characteristics of Study 1 (WAIS–IV) samples
Demographic Characteristic Study 1a Study 1b
N 39 40
Age (years) Range 16–77 17–75
Mean 46.1 45.1
SD 19.1 17.8
Gender Female 20 14
Male 19 26
Ethnicity African American 8 8
Hispanic 13 17
White 17 15
Other 1 0
Education < 9 years 2 2
9–11 years 11 7
HS graduate 8 11
Some post-HS 8 12
4-year degree 10 8
Region Northeast 9 9
North Central 6 5
South 21 24
West 3 3
Procedure
In this non-randomly equivalent groups study, the WAIS–IV norm sample of 2,200 cases served as
the paper-format group. Half of the WAIS–IV subtests were evaluated in each of the two
independent sub-studies (1a and 1b). In each substudy, half of the subtests served as paper-
administered covariate tests, because they were administered in paper format to both the norm
sample and the new (Q-interactive) sample. The other half of the subtests (those evaluated for
format effects) was administered in digital format in the Q-interactive sample and paper format in
the norm sample. The halves were formed in a way that attempted to maximize the multiple
correlation of each subtest in one half (i.e., a subtest being analyzed for format effects) with the set
of subtests in the other half (i.e., the paper-administered covariates), so as to maximize statistical
power.
Copyright © 2012. NCS Pearson, Inc. or its affiliate(s). All rights reserved. Page 10 Q-interactive is a trademark in the U.S. and/or other countries, of Pearson Education, Inc. or its affiliate(s).
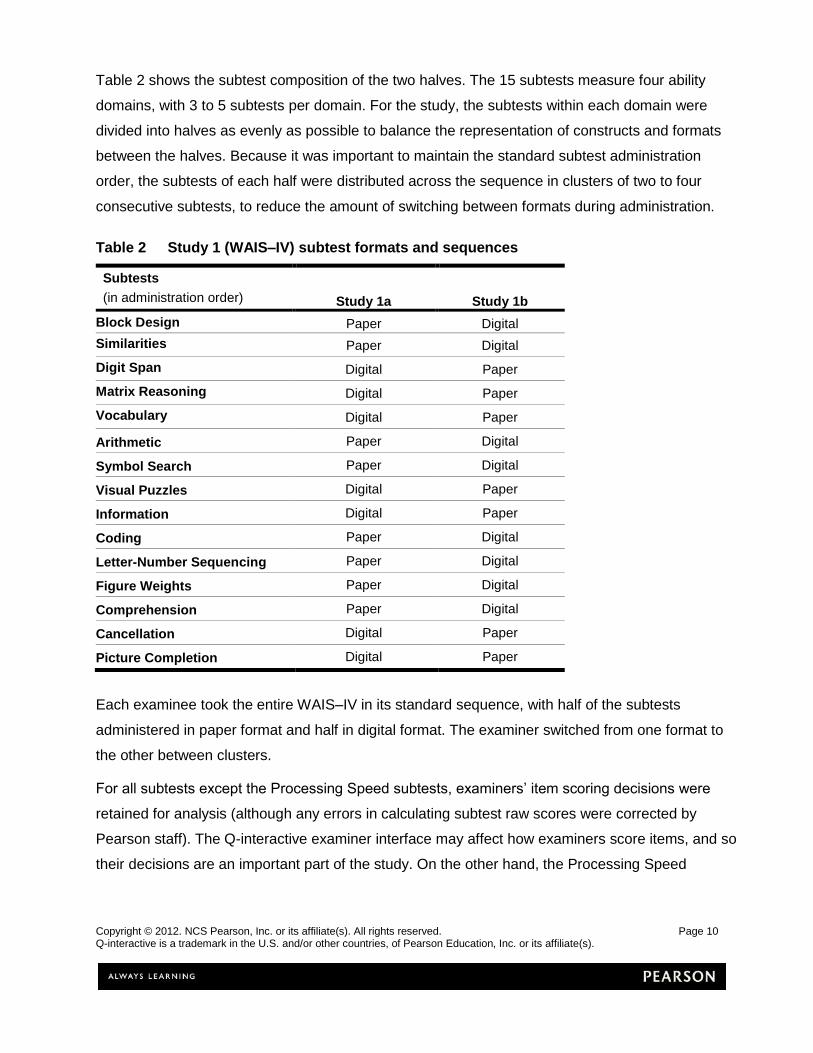
Table 2 shows the subtest composition of the two halves. The 15 subtests measure four ability
domains, with 3 to 5 subtests per domain. For the study, the subtests within each domain were
divided into halves as evenly as possible to balance the representation of constructs and formats
between the halves. Because it was important to maintain the standard subtest administration
order, the subtests of each half were distributed across the sequence in clusters of two to four
consecutive subtests, to reduce the amount of switching between formats during administration.
Table 2 Study 1 (WAIS–IV) subtest formats and sequences
Subtests
(in administration order) Study 1a Study 1b
Block Design Paper Digital
Similarities Paper Digital
Digit Span Digital Paper
Matrix Reasoning Digital Paper
Vocabulary Digital Paper
Arithmetic Paper Digital
Symbol Search Paper Digital
Visual Puzzles Digital Paper
Information Digital Paper
Coding Paper Digital
Letter-Number Sequencing Paper Digital
Figure Weights Paper Digital
Comprehension Paper Digital
Cancellation Digital Paper
Picture Completion Digital Paper
Each examinee took the entire WAIS–IV in its standard sequence, with half of the subtests
administered in paper format and half in digital format. The examiner switched from one format to
the other between clusters.
For all subtests except the Processing Speed subtests, examiners’ item scoring decisions were
retained for analysis (although any errors in calculating subtest raw scores were corrected by
Pearson staff). The Q-interactive examiner interface may affect how examiners score items, and so
their decisions are an important part of the study. On the other hand, the Processing Speed
Copyright © 2012. NCS Pearson, Inc. or its affiliate(s). All rights reserved. Page 11 Q-interactive is a trademark in the U.S. and/or other countries, of Pearson Education, Inc. or its affiliate(s).
subtests are scored post-administration in the identical manner for paper and digital formats,
so the response booklets for those subtests were rescored by Pearson staff to ensure that there
were no scoring errors.
The first step in analysis was to use the WAIS–IV norm sample to compute a multiple regression
equation for each subtest. The subtest scaled scores were predicted from the subtest scaled scores
in the other set and demographic variables (sex, ethnicity, and education). This equation was then
applied to each digitally administered subtest in the Q-interactive samples, to generate a predicted
score for each digital administration of a subtest. The residuals (differences between observed and
predicted scores) represent the digital effect plus error. The analysis of each subtest used a one-
sample t test of the null hypothesis that the average residual is zero.
Results
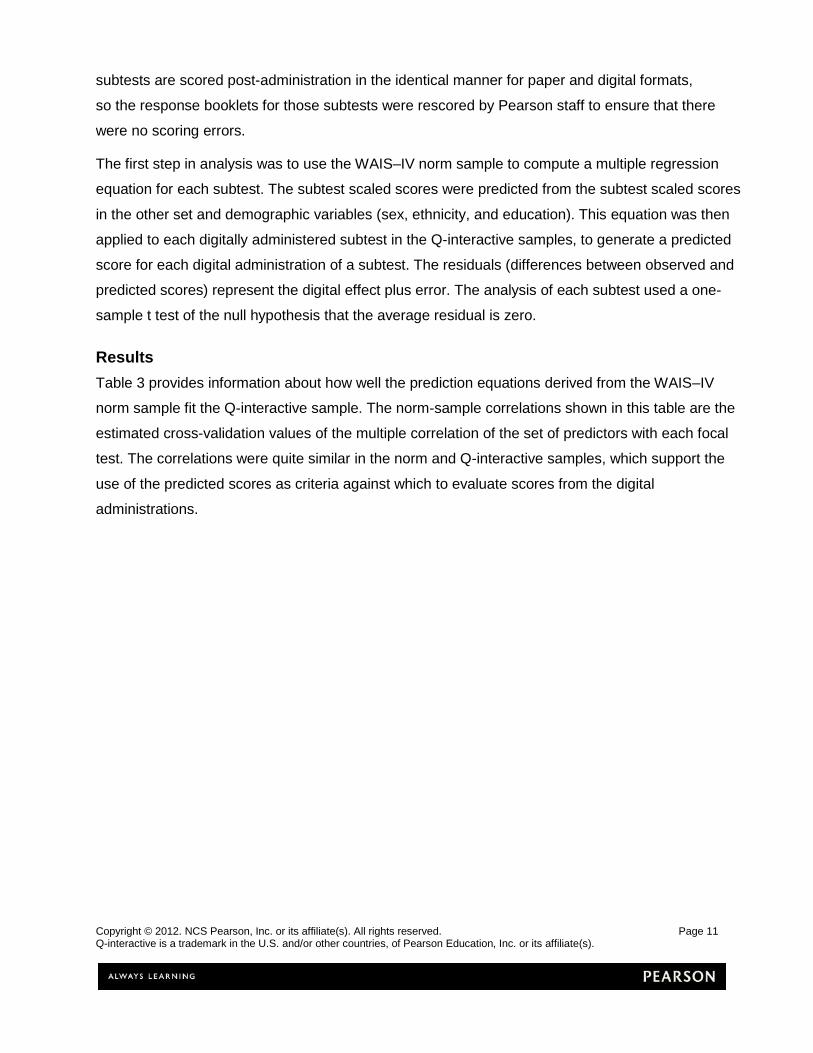
Table 3 provides information about how well the prediction equations derived from the WAIS–IV
norm sample fit the Q-interactive sample. The norm-sample correlations shown in this table are the
estimated cross-validation values of the multiple correlation of the set of predictors with each focal
test. The correlations were quite similar in the norm and Q-interactive samples, which support the
use of the predicted scores as criteria against which to evaluate scores from the digital
administrations.
Copyright © 2012. NCS Pearson, Inc. or its affiliate(s). All rights reserved. Page 12 Q-interactive is a trademark in the U.S. and/or other countries, of Pearson Education, Inc. or its affiliate(s).
Table 3 Study 1 (WAIS–IV), applicability of prediction equations to the Q-interactive samples
Subtest
Correlation of Predicted Score With Actual score
Q-interactive Sample Norm Sample
Arithmetic .83 .73
Block Design .68 .72
Cancellation .28 .51
Coding .68 .57
Comprehension .67 .77
Digit Span .81 .74
Figure Weights .78 .71
Information .77 .72
Letter-Number Sequencing .65 .71
Matrix Reasoning .82 .67
Picture Completion .57 .55
Similarities .82 .76
Symbol Search .52 .57
Visual Puzzles .77 .71
Vocabulary .84 .81
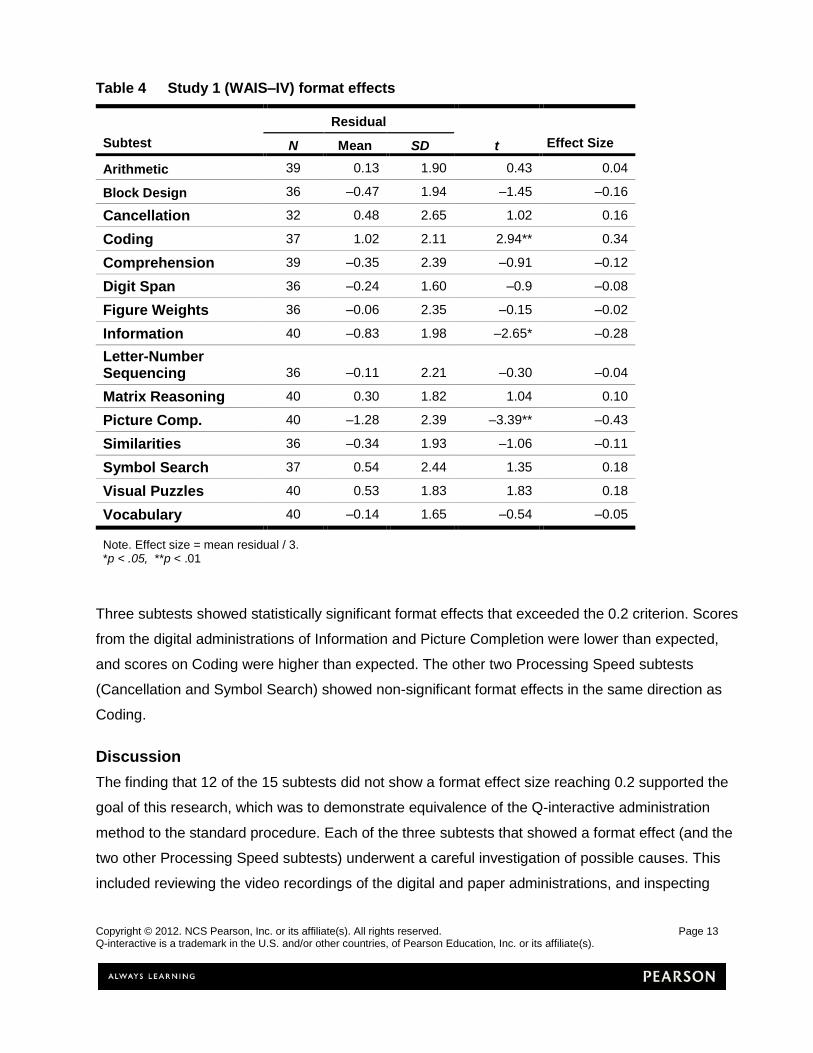
The results of Study 1 are presented in Table 4. Some digitally administered subtests had missing
or unusable scores for technical or scheduling reasons, and this is reflected in several sample sizes
smaller than 39 (Study 1a) or 40 (Study 1b). None of the missing data was caused by examinee
difficulty in using the digital format.
The average residual is the average difference between observed and predicted scaled scores on
the digitally administered subtest. A positive value means that scores from the digital format were
higher than predicted, and a negative value indicates lower than expected performance. The effect
size is the average residual divided by 3 (the standard deviation of scaled scores in the norm
sample).
Copyright © 2012. NCS Pearson, Inc. or its affiliate(s). All rights reserved. Page 13 Q-interactive is a trademark in the U.S. and/or other countries, of Pearson Education, Inc. or its affiliate(s).
Table 4 Study 1 (WAIS–IV) format effects
Subtest
Residual
t Effect Size N Mean SD
Arithmetic 39 0.13 1.90 0.43 0.04
Block Design 36 –0.47 1.94 –1.45 –0.16
Cancellation 32 0.48 2.65 1.02 0.16
Coding 37 1.02 2.11 2.94** 0.34
Comprehension 39 –0.35 2.39 –0.91 –0.12
Digit Span 36 –0.24 1.60 –0.9 –0.08
Figure Weights 36 –0.06 2.35 –0.15 –0.02
Information 40 –0.83 1.98 –2.65* –0.28
Letter-Number Sequencing 36 –0.11 2.21 –0.30 –0.04
Matrix Reasoning 40 0.30 1.82 1.04 0.10
Picture Comp. 40 –1.28 2.39 –3.39** –0.43
Similarities 36 –0.34 1.93 –1.06 –0.11
Symbol Search 37 0.54 2.44 1.35 0.18
Visual Puzzles 40 0.53 1.83 1.83 0.18
Vocabulary 40 –0.14 1.65 –0.54 –0.05
Note. Effect size = mean residual / 3. *p < .05, **p < .01
Three subtests showed statistically significant format effects that exceeded the 0.2 criterion. Scores
from the digital administrations of Information and Picture Completion were lower than expected,
and scores on Coding were higher than expected. The other two Processing Speed subtests
(Cancellation and Symbol Search) showed non-significant format effects in the same direction as
Coding.
Discussion
The finding that 12 of the 15 subtests did not show a format effect size reaching 0.2 supported the
goal of this research, which was to demonstrate equivalence of the Q-interactive administration
method to the standard procedure. Each of the three subtests that showed a format effect (and the
two other Processing Speed subtests) underwent a careful investigation of possible causes. This
included reviewing the video recordings of the digital and paper administrations, and inspecting
Copyright © 2012. NCS Pearson, Inc. or its affiliate(s). All rights reserved. Page 14 Q-interactive is a trademark in the U.S. and/or other countries, of Pearson Education, Inc. or its affiliate(s).
cases with unusually great variability in subtest scores to identify any invalid data that may have
affected the results.
Evaluation of Picture Completion suggested two possible causes of the digital effect. For some
items, the art displayed on the examinee tablet was slightly blurry. Although these effects were
subtle and did not affect perception of the important features of the illustrations, it is the nature of
the examinee’s task to search for defects, and so it is plausible that examinees would be distracted
by the blurry sections of the art and spend time inspecting those sections. Secondly, some
examiners found the organization of the response capture buttons on the examiner tablet to be
confusing. (Errors in capturing responses were not observed on the video recordings.)
By contrast, no explanations were apparent for the format effects on Information and Coding. On
both of these subtests, the examinee tablet is not used, and the examiner interface is very simple.
The video recordings of the digital and paper administrations of these subtests did not show any
examinee or examiner behaviors or examiner errors that would account for the results. A differential
item functioning analysis was conducted for Information to see if any particular items had become
more difficult since the WAIS–IV was normed about six years earlier, but the results were negative.
On Coding and the other Processing Speed subtests, the only difference between the formats is
that in the digital administration the tablet displays the instructions to the examiner (rather than the
printed manual) and controls the timing.
Study 2: WAIS–IV Follow-Up
Method
A second study of WAIS–IV was conducted in November 2011 to check the format effects found in
Study 1 for Picture Completion, Information, and Coding (as well as the Processing Speed
subtests). The Picture Completion digital art was replaced with clearer images, and the examiner
capture screen was redesigned and simplified, in the hope of removing the format effect for that
subtest. The other subtests were administered without change from Study 1. Because no
opportunities for improvement or correction were apparent for these subtests, this portion of the
study was designed to confirm or disconfirm the initial findings.
Participants
Examinees were recruited in the same way as in Study 1, except that individuals with clinical
conditions were not accepted. Also, demographic characteristics were controlled more tightly than
in Study 1 to obtain a closer match to the general population. Table 5 shows the distributions of sex,

Copyright © 2012. NCS Pearson, Inc. or its affiliate(s). All rights reserved. Page 15 Q-interactive is a trademark in the U.S. and/or other countries, of Pearson Education, Inc. or its affiliate(s).
ethnicity, education, and region in the Study 2 sample. The Processing Speed study sample of 30
cases consisted of 15 demographically matched pairs and was a subset of the larger Information
and Picture Completion study sample. Study 2 used the same testing sites and examiners as
Study 1.
Table 5 Demographic characteristics of the Study 2 (WAIS–IV) samples
Demographic Characteristic Processing Speed Study
Information & Picture Completion Study
N 30 99
Age (years) Range 16–67 16–82
Mean 37.5 40.8
SD 14.0 17.0
Gender Female 15 49
Male 15 50
Ethnicity African American 8 15
Hispanic 6 25
White 16 55
Other 0 4
Education < 9 years 0 1
9–11 years 0 4
HS graduate 6 21
Some post-HS 13 41
4-year degree 11 32
Region Northeast 0
North Central 16
South 83
West 0
Procedure
Study 2 was a combination of two study designs: the nonrandomly equivalent samples design was
repeated for Information and Picture Completion, and a retest design was used for Processing
Speed. Because the latter requires fewer cases than the former, it was conducted on the first 30
Copyright © 2012. NCS Pearson, Inc. or its affiliate(s). All rights reserved. Page 16 Q-interactive is a trademark in the U.S. and/or other countries, of Pearson Education, Inc. or its affiliate(s).
cases, and the remaining cases were used only for the analysis of Information and Picture
Completion. A retest design was considered appropriate for the Processing Speed subtests
because relatively little learning takes place from one administration to the next. The subtests use
tasks that are easy to perform, and assess the number of such tasks that the examinee does
correctly in a fixed amount of time. Remembering the symbol-digit associations on Coding would
boost the score on the second administration but was not thought to fundamentally change the
cognitive process required to perform the subtest.
The first 30 examinees each took the following sequence of subtests:
Coding, Cancellation, and Symbol Search in either paper or digital format
Block Design and Vocabulary in paper format (to serve as covariates)
Picture Completion and Information in digital format
Coding, Cancellation, and Symbol Search in the format not taken earlier
The remaining examinees followed this sequence, but did not take the Processing Speed subtests.
One examinee in each of the 15 demographically matched pairs in the Processing Speed portion of
the study took the paper format first and the digital format second, and the other examinee took the
reverse sequence. This permitted the use of a matched-pairs t test for the analysis.
The analysis of Picture Completion and Information used the same procedures as Study 1, in which
regression equations based on the WAIS–IV norm sample were used to predict scores on the
digital administrations of these subtests, and the residuals between actual and predicted scores
were interpreted as measures of the format effect.
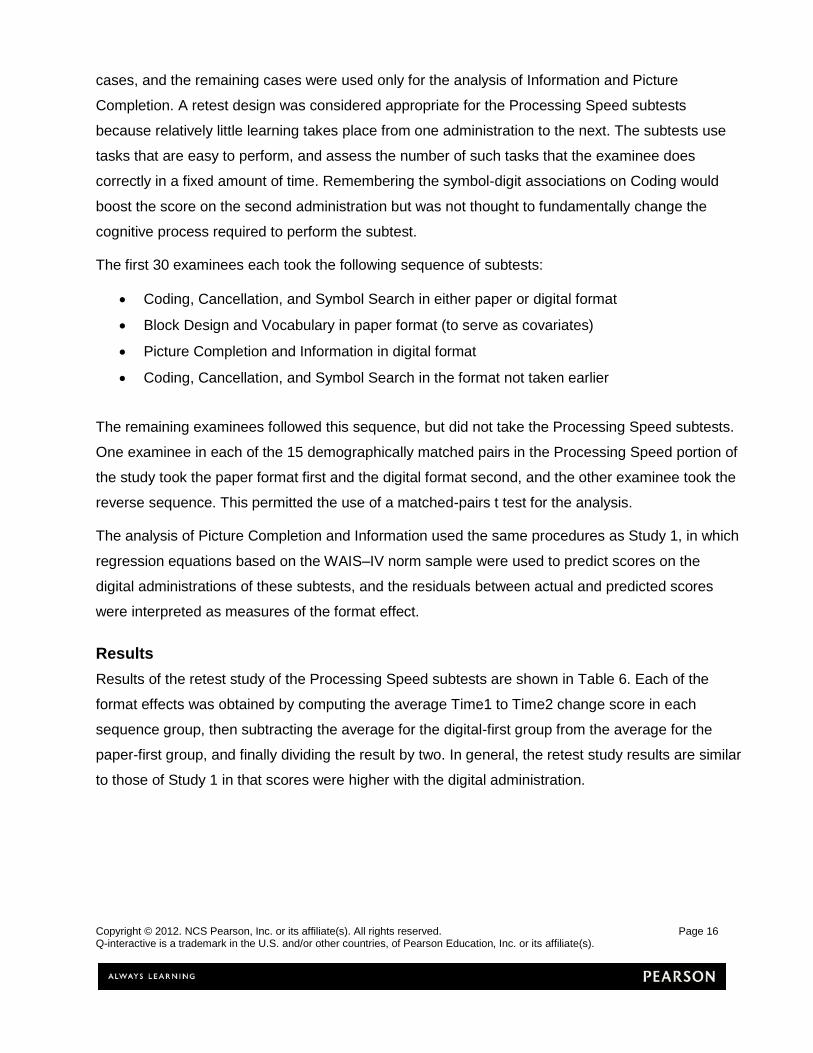
Results
Results of the retest study of the Processing Speed subtests are shown in Table 6. Each of the
format effects was obtained by computing the average Time1 to Time2 change score in each
sequence group, then subtracting the average for the digital-first group from the average for the
paper-first group, and finally dividing the result by two. In general, the retest study results are similar
to those of Study 1 in that scores were higher with the digital administration.
Copyright © 2012. NCS Pearson, Inc. or its affiliate(s). All rights reserved. Page 17 Q-interactive is a trademark in the U.S. and/or other countries, of Pearson Education, Inc. or its affiliate(s).
Table 6 Study 2 results for the WAIS–IV Processing Speed subtests (N = 15 matched pairs)
Subtest Format Effect
t Effect Size Mean SD
Cancellation 0.40 2.31 1.34 0.13
Coding 0.37 2.05 1.38 0.12
Symbol Search 0.80 3.31 1.87 0.27
Note. Positive format effect indicates higher scores on digital administration.
Effect size = format effect / 3
Shortly after Study 2 was completed, the Q-interactive software developers discovered that the way
in which the initiation of timing was programmed had introduced a delay of about 2 seconds.
Therefore, examinees had been getting approximately 2% more time to perform the Processing
Speed tasks. Reducing their raw scores by 2% brought the digital format effect sizes to:
Cancellation, 0.13; Coding, 0.07; and Symbol Search, 0.13. The software developers have
corrected the timing error in Q-interactive since then.
As shown in Table 7, the Study 2 result for Information was almost identical to that of Study 1
(effect sizes of –.29 and –.28, respectively). Because nothing about the administration of
Information was changed, this confirmed the initial finding. On the other hand, the format effect for
Picture Completion was quite a bit smaller than it had been in Study 1 (–.17 vs. –.43) and was
within the allowable range for equivalence, indicating that improving the quality of the illustrations
and/or reformatting the examiner capture screen had a positive effect.
Table 7 Study 2 results for the WAIS–IV Information and Picture Completion subtests
Subtest N
Residual
t Effect Size Mean SD
Information 99 –0.88 2.02 –4.33** –0.29
Picture Completion 99 –0.50 2.24 –2.22* –0.17
Note. Effect size = mean residual / 3 * p < .05 ** p < .01
Copyright © 2012. NCS Pearson, Inc. or its affiliate(s). All rights reserved. Page 18 Q-interactive is a trademark in the U.S. and/or other countries, of Pearson Education, Inc. or its affiliate(s).
Following Study 2, an additional analysis of Information shed light on the source of its digital format
effect. In Study 1, 40 examinees took Information in paper format (to serve as a covariate). Their
scores were analyzed using the same method as that applied to the digital administrations, using
other paper-administered subtests (Vocabulary, Matrix Reasoning, Visual Puzzles, and Digit Span)
as the covariates. The multiple correlation of these subtests with the paper Information score was
.74 in the WAIS–IV norm sample and .84 in the Q-interactive sample. The mean residual was –.51
(effect size –.17), indicating that even when Information is administered in paper format, its scores
tend to be lower than predicted. The reason for this effect is unknown; however, it explains more
than half of the format effect found in Studies 1 and 2. The remaining effect size of –.12 (–.29 minus
–.17) is relatively small and is similar to that for the other WAIS–IV Verbal Comprehension subtests.
Conclusion
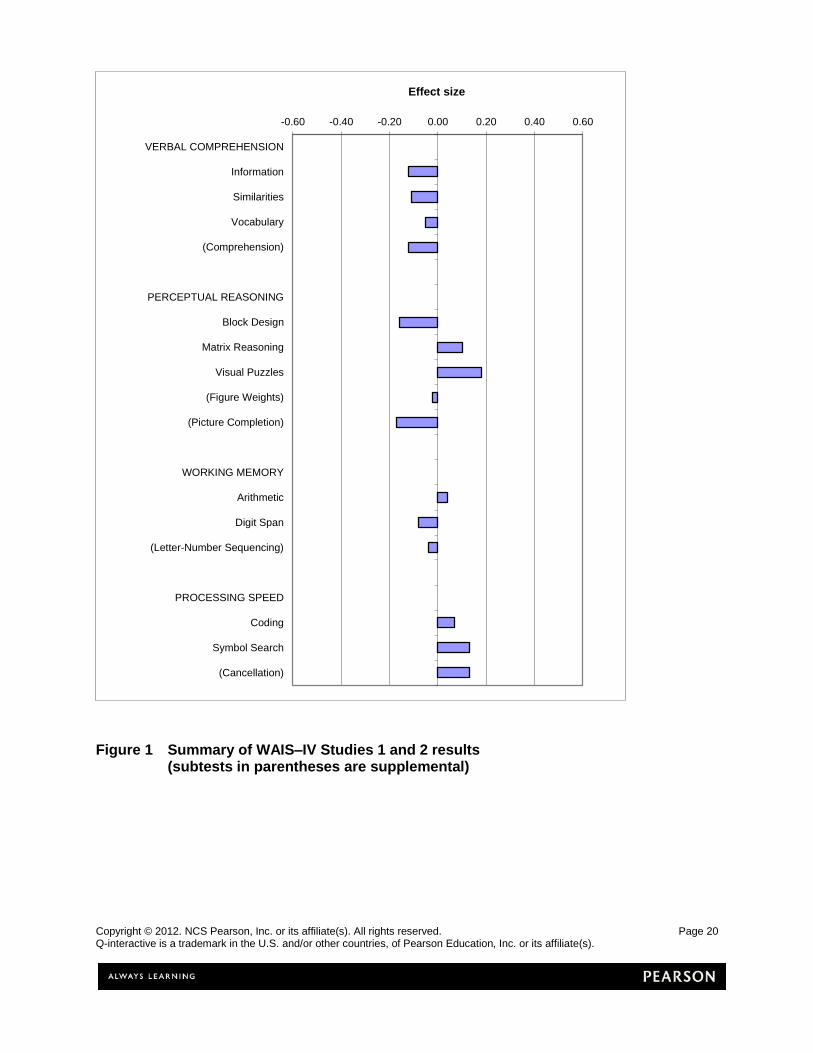
Figure 1 is a summary of the effect sizes from Studies 1 and 2. All subtests have effect sizes less
than 0.2, which was set initially as the criterion for equivalence. This supports the ability of clinicians
to interpret test scores obtained using the Q-interactive platform in the same way as results from
standard (paper-based) administration. It should be kept in mind that the studies have used
nonclinical samples and that the potential effects of using the digital interface with individuals with
particular clinical conditions are not yet known.
The Verbal Comprehension subtests tend to have very small format effects that are in a consistent
direction (slightly lower scores with digital administration). Similarly, the Processing Speed subtests
have very small positive format effects. These effects are non-significant and not clinically
meaningful, but their causes should continue to be sought. Identifying the causes will contribute to
our understanding of how digital interface design affects behavior.
These studies have provided useful information about procedures for studying the effects of
administration formats in general and digital formats in particular. The replication of findings for the
Information and Processing Speed subtests in independent samples and (for Processing Speed)
using a different experimental design supports the validity and dependability of these designs.
The value of having video recordings of administrations was demonstrated often during this
research. Without a way to determine how an examiner actually administered the test or how the
examinee’s performance should have been scored, it would have been much more difficult to judge
Copyright © 2012. NCS Pearson, Inc. or its affiliate(s). All rights reserved. Page 19 Q-interactive is a trademark in the U.S. and/or other countries, of Pearson Education, Inc. or its affiliate(s).
various hypotheses about the causes of any observed format effects. The recordings also help to
inform the developers about how examinees and examiners actually use the digital interfaces.
Another lesson was the importance examiners practicing administration several times. Although
examiners generally felt confident in their understanding of the Q-interactive procedures by the end
of the second day of training, they discovered that they needed to do more than just a few realistic
practice administrations to feel comfortable with the new system.
The experience with the Processing Speed subtests illustrated the risks associated with assuming
that a new type of digital interface will work as designed. This was the first experimentation with
tests scored on the basis of speed, and it revealed a technical flaw that may not have been
detected if the study had not been conducted.
Finally, these studies lay the groundwork for understanding the effects (or lack of effect) of features
of interface design on how examinees perform and how examiners capture and score responses.
As this body of knowledge grows, it should support generalization to other tests of the same type
and features.
Copyright © 2012. NCS Pearson, Inc. or its affiliate(s). All rights reserved. Page 20 Q-interactive is a trademark in the U.S. and/or other countries, of Pearson Education, Inc. or its affiliate(s).
Figure 1 Summary of WAIS–IV Studies 1 and 2 results (subtests in parentheses are supplemental)
-0.60 -0.40 -0.20 0.00 0.20 0.40 0.60
VERBAL COMPREHENSION
Information
Similarities
Vocabulary
(Comprehension)
PERCEPTUAL REASONING
Block Design
Matrix Reasoning
Visual Puzzles
(Figure Weights)
(Picture Completion)
WORKING MEMORY
Arithmetic
Digit Span
(Letter-Number Sequencing)
PROCESSING SPEED
Coding
Symbol Search
(Cancellation)
Effect size


![Examinee Handbook - ETS Global · PDF file[NEW 50575-98193] • TOEIC TFI Examinee Handbook • CS4 • Dr01 3/4/13 jw • Dr02 3/18/13 jw Examinee Handbook](https://img.pdfslide.net/doc/110x75/5aa6c4337f8b9ab8228b4fcd/examinee-handbook-ets-global-new-50575-98193-toeic-tfi-examinee-handbook.jpg)