Embed Size (px)
Citation preview
ESTABLISHMENT OF LITHO-STRUCTURAL CHARACTERISTICS OF SIWALIKS IN KANGRA SUB
BASIN TO UNDERSTAND THE CONTROL OF URANIUM MINERALISATION ALONG PANIALI – LOHARKAR –
GALOT TRACT, HAMIRPUR DIST, HIMACHAL PRADESH
by
ABHIJITH V.
ENGG1G201801011
Bhabha Atomic Research Centre, Mumbai
A thesis submitted to the
Board of Studies in Engineering Sciences
In partial fulfillment of requirements
for the Degree of
MASTER OF TECHNOLOGY
of
HOMI BHABHA NATIONAL INSTITUTE
February, 2021

DEDICATIONS
Dedicated to my family
ACKNOWLEDGEMENTS
First and foremost, I would like to express my gratitude towards Director, AMD for
the opportunity to carry out this project work as part of M.Tech degree. I thank Dr.
R.V.Singh, Regional Director South Central Region and my guide for his support and
encouragement for carrying out the work. I am grateful to Shri, P.K. Sharma, technical
advisor for his constant monitoring, suggestions and support during the course of the work.
This project work has been actualized because of their support and encouragement while
making sure that we get timely technical support.
I am very much grateful to Dr. Niranjan Kumar, for the technical and moral support
he has provided as a field partner and senior colleague. His suggestions have been of great
help in improving my work.
I am grateful to Dr. B.V.S.N. Raju, former RD, Northern Region, AMD, for the
guidance and encouragement he has provided. His gestures of appreciation imparted
confidence from the start of my project work.
Discussions and opinions from the side of The Director, AMD, Dr. D. K. Sinha, Shri.
B. Saravanan, AD (Op-II), Shri. A.K. Bhatt, former AD (Op-II), Dr. T.S. Sunil Kumar, AD
(R&D) have been very positive.
I am indebted to Smt. Sikta Patnaik and Shri. Somnath Bandyopadhyay for their
timely cooperation and help in carrying out petrographic studies. Their willingness to help
and provide microscope facility at any time is very much appreciated. Thanks are due to the
officers and staff of Physics laboratory, AMD, Northern Region, New Delhi, XRF
Laboratory, AMD, Central Region, Nagpur and Chemistry Laboratory, AMD, Jaipur.
I remember with respect the help extended by Shri. Keshav Ram, work assistant and
Shri. K.K. Sharma, driver in carrying out the field work, despite the difficult terrain and
conditions. Shri Jagannath and Amar Singh, technicians, also deserve a lot of gratitude for
the help and service provided by them.
I am grateful to Shri. Vikram Jeet, Shri Rohit Kumar, Sh. Sumit Thakur and Sh.
Karam Chand for their help in the field. I also thank the people of Nara, distt. Hamirpur,
Himachal Pradesh for their heartwarming gestures during my stay in the field, especially
during the COVID-19 lockdown period.
I thank my friend and colleague Shri. Subhajit Pandey for all his cooperation and

company during the limited stays in Delhi. I also thank Shri. Deepankar Sarma, for his
cooperation and support in carrying out my project work along with the field assignment. I
also thank Shri. Sushant Murmu, for providing moral support as a senior, during my difficult
times.
Last but not the least, I thank my parents, my brother for boosting my morale up and
for holding on together while I am away even during their difficult times. I also thank my
wife who came along with me in between the course of the project and took all the burden
of being the wife of a geologist.
i
CONTENTS Page
No.
Synopsis ii
List of figures iv
List of tables vi
List of Publications vii
Chapter 1. Introduction 1
Chapter 2. Literature Review 10
Chapter 3. Methodology 13
Chapter 4. Geology of the area 18
Chapter 5. Results and Interpretation
1. Radiometric studies
2. Petrography
3. XRF Analysis
4. Carbon and Sulphur Analysis
34
34
35
37
41
Chapter 6. Discussion 42
Chapter 7. Conclusion 49
Future scope of work 50
References 51
ii
SYNOPSIS
Lithostructural characterization of Siwaliks in Kangra subbasin has been carried out to
understand the controls of uranium mineralization in the Paniali-Loharkar-Galot tract of
Hamirpur dist., Himachal Pradesh. The Middle Eocene- Pliestocene aged Siwalik Group of
rocks, are represented in the study area by multi-storeyed stacks of sandstone, pebble beds and
mudstone lenses dominantly of the Middle and Upper Siwaliks as well as the Middle-Upper
Siwalik transition,. These are tectonically disturbed mainly by Jwalamukhi and Barasar thrusts
and their associated synclinal structures and later faults formed by thrust propagation in the
Himalayan Foreland Basin. Uranium mineralization occurs along the transition of Middle and
Upper Siwaliks in this area. An integration of remote sensing, field work, radiometric survey,
petrography and geochemical study using XRF analysis is employed to characterize the
lithology, to generate the lithostructural map of the area and to understand the controls of
uranium mineralization. Python programming was attempted to generate a 3D plot of field data.
Structural and geomorphological lineaments identified in remote sensing include thrusts, faults,
dipslopes, river escarpments etc., while geology is dominated by sandstone of sublithic to
feldspathic litharenite composition showing color variation from buff to brown in vertical
section. The sediment source ranges from granitic, volcanic, metamorphic and sedimentary
rocks as revealed by petrographic. Geochemical studies suggest change of the source tectonic
setting from passive to active continental margin upwards in the transition zone sediments,
which may be related to tectonic activity along Main Boundary Thrust at about 5 Ma. The
radioactive anomalies in the grey sandstone, associated with mud clasts, calcite- cemented
lenses and carbonaceous matter, assayed 0.01- 0.28% U3O8 (n=17) and are dominantly
associated with the carbonaceous matter and clay in the sandstone matrix, indicating adsorbed
nature. The Masanbal - Biru- Paniali tract to the western part of study area shows pronounced
variation in sandstone colour and radioactivity while a NW-SE trending reverse fault has
iii
uplifted the stratigraphically lower horizons in the east along Loharkar-Galot tract, represented
dominantly by grey sandstone which shows less colour variation but better continuity and order
of radioactivity. The decrease in intensity of oxidation and the increase in order of radioactivity
with depth as well as variations in sandstone and mud clast characteristics are also correlated.
The study suggests that the oxidation of sandstones and remobilization of Uranium followed
by the adsorption into clay and carbonaceous matter in the relatively reduced zone in grey
sandstone dominantly resulted in the mineralisation. Continued tectonic activity within the
Himalayan Foreland Basin is found to have disturbed the stratigraphy and thereby the
mineralisation on a later stage.
Keywords: Siwaliks, sandstone, uranium, oxidation, Kangra sub basin, Himalayan foreland
basin
iv
LIST OF FIGURES
Figure
No.
Description Page
No.
1.1 Schematic diagram of foreland basin with different depozones from Einsele
(2013) Modified after DeCelles and Giles (1996).
2
1.2 Stratigraphy of the Tertiary sediment sequence in Himalaya (Kothari et al.,
2017)
3
1.3 Geological map of Himalayas in the Kangra subbasin area showing
radioactive anomalies (Ghosh et al., 2017; Kothari, 2018)
7
3.1 Processing flow chart adapted for LISS III imagery processing 14
4.1 (a) Limonitic light brown sandstone with oxidation haloes around mud
clasts in Paniali (b) Light grey sandstones with basal pebbles near Biru (c)
Light grey sandstones with whitish appearancd near Sureri (d) Lithological
section along Paniali- Biru-Sureri area
22
4.2 Goethite banded sandstone (below) and limonitic banded sandstone above
near Biru in which low order activity of 1.5-3xbg was recorded
23
4.3 Calcitic cemented lens with mud clast in grey coarse grained sandstone with
radioactivity
24
4.4 Grey sandstones and pebble beds along stream section along Dadh Khad, 26
4.5 Lithological section along Dadh Khad stream section 26
4.6 (a) Reverse fault with fault plane dipping SW near Sukhar Khad (b) Fault
zone in mudstone. Camera facing in NW direction
26
4.7 Grey sandstones and pebble beds along stream section along Dadh
Khad,near Loharkar
27
4.8 Pebble beds with grey sandstone lenses along stream section,near Nalti 28
4.9 Secondary copper minerals associated with uranium mineralisation in
Romehra
28
4.10 Lineament map generated from LISS III Imagery superimposed on FCC
composite
29
4.11 Lineament map generated from Cartosat DEM superimposed on Shaded
Relief Map
29
4.12 Lineament map generated from Cartosat DEM superimposed on Slope
image derived from DEM
29
v
4.13 Lineaments in the study area identified during field work and ground verification. 32
4.14 Lower hemisphere equal area projections of synclinal structures associated
with (a) Barsar Thrust (b) Jwalamukhi Thrust
33
4.15 Geological Map of the study area, superimposed on the Digital Elevation
Model
33
5.1 Few selected photomicrographs (PPL) of nonradioactive samples from the
study area
35
5.2 (a) Calcite (sparry) in lithic arenites (b) Matrix with clay and carbonaceous
matter. Feldspar disintegration along grain boundary (c) Fe-oxide coating
of quartz grains revealed in reflected light (d) carbonaceous matter in the
matrix along with corresponding α-track.
36
5.3 (a) Matrix with clay and carbonaceous matter with corresponding α-track.
(b) and (c) Framboidal pyrite seen at higher magnification in oil immersion.
The outer rim shows evidence of oxidation.
37
5.4 Plot of log (Na2O / K2O ) vs log (SiO2 / Al2O3) after Pettijohn et al., (1987)
for geochemical classification of sadstones
38
5.5 TiO2 vs Al2O3 plot for discriminating the source rock characteristics 39
5.6 Na2O/ K2O vs SiO2 diagram of Roser and Korsch (1986). 39
5.7 (a) SiO2/ Al2O3 vs K2O/Na2O diagram of Maynard et al. (1982) PM Passive
Margin, ACM Active Continetal Margin (b) ternary plot of SiO2 / 20 – (
Na2O + K2O)- (TiO2 + Fe2O3 + MgO) (after Kroonenberg, 1994). A Oceanic
island arc, B continental island arc, C active continental margin, D passive
margin
40
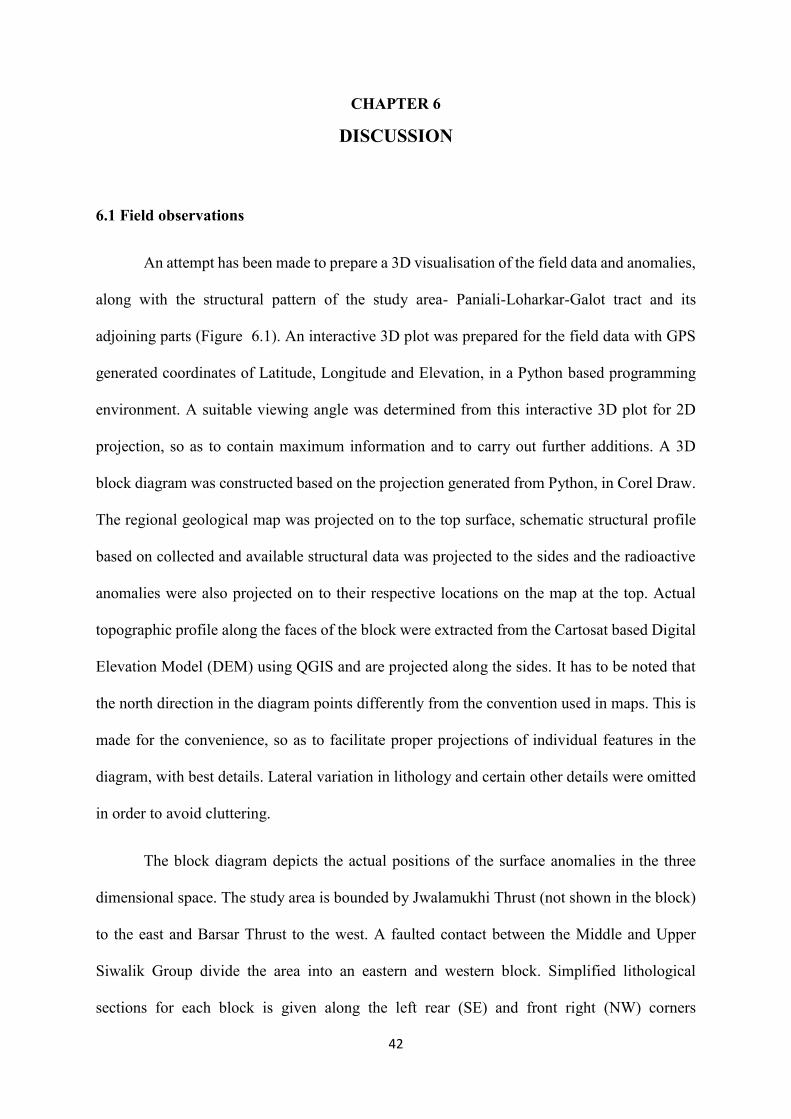
6.1 A representative 3D block diagram based on interactive plot generated from
GPS based field data along with geological and structural information. The
dots represent data points in the 3D space, with red dots corresponding to
surface anomalies. Orientation of the block with respect to north direction
was decided based on the suitable viewing angle generated from the
interactive plot.
44
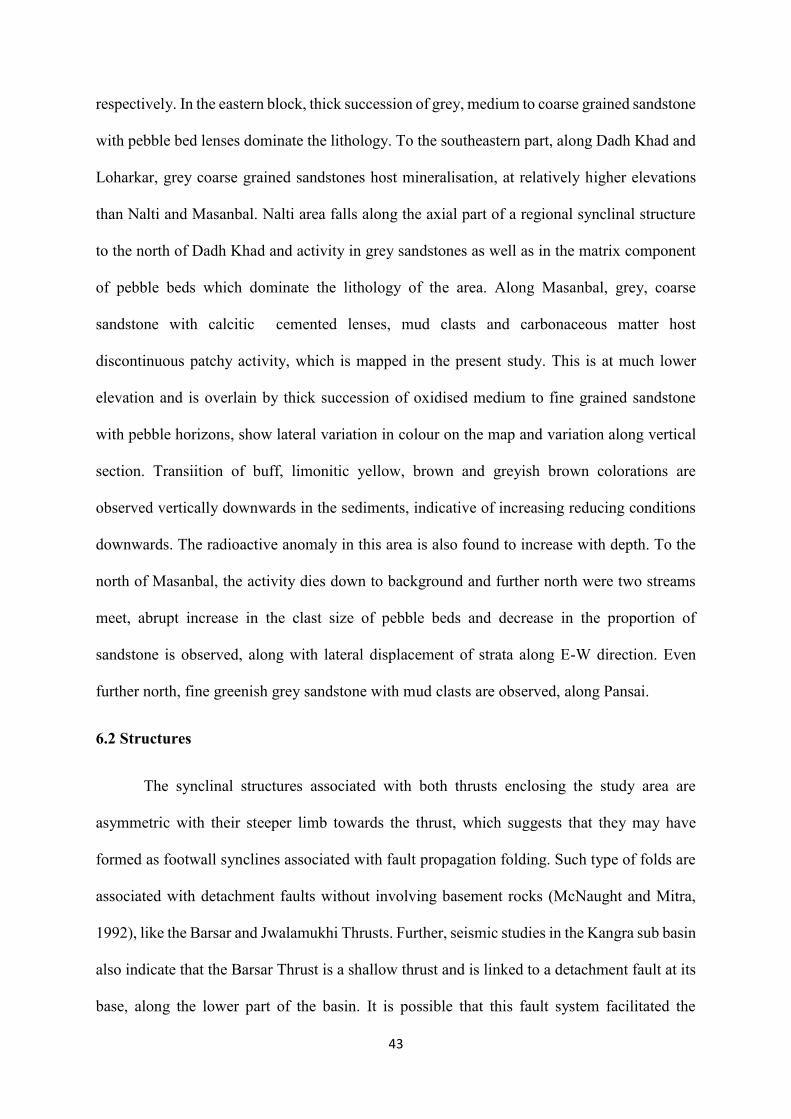
6.2 Representative diagram showing the variation in the redox condition of mud
clasts, sandstones and radioactivity with increasing depth.
45
vi
LIST OF TABLES
Table
No
Description Page
No.
5.1 Table showing the physical assay results of radioactive samples from
Masanbal and Nalti area, Dist. Hamirpur, H.P.
34
5.2 Table showing the results of carbon and sulphur analysis of samples from
Paniali- Loharkr-Galot tract, Dist. Hamirpur, H.P.
41
vii
LIST OF PUBLICAITONS
Sl.
No Paper Title
1. Integrated exploratory approach to the litho-structural characterization of Siwaliks in
Kangra sub basin- A case study from the uranium mineralized Paniali- Loharkar-
Galot tract, Hamirpur distt., H.P.*
Journal : Journal of The Geological Society of India#
*Publication being drafted and the title is subject to change # Prospective, may change based on acceptance
1
CHAPTER 1 INTRODUCTION
Studies in parts of the Siwalik basin are carried out currently for establishing the
possible litho-structural controls for the U mineralisation. Earlier exploratory works of the
department beginning in the year 1970s through to 1990s yielded significant uranium
mineralisation with the host rock mainly identified as sandstone and mudstone.
The Middle Eocene to Pliestocene (18.3 – 0.2 Ma) Siwalik basin is a multi-storeyed
molasse sedimentary sequence of fluviatile origin in the Himalayan Foreland Basin (HFB),
intersected by a network of thrusts, associated folds and cross faults (Dubey, 2014). The
lithostructural setup of Siwalik basin is favourable for sandstone hosted uranium
mineralisation, which is already identified in different parts of the basin, though not restricted
to sandstones. Primarily lithological controls of mineralisation have been proposed (Kaul et
al., 1993; Ghosh et al., 2017; Rahaman et al., 2017) and this study explores the role of structures
in controlling the mineralisation.
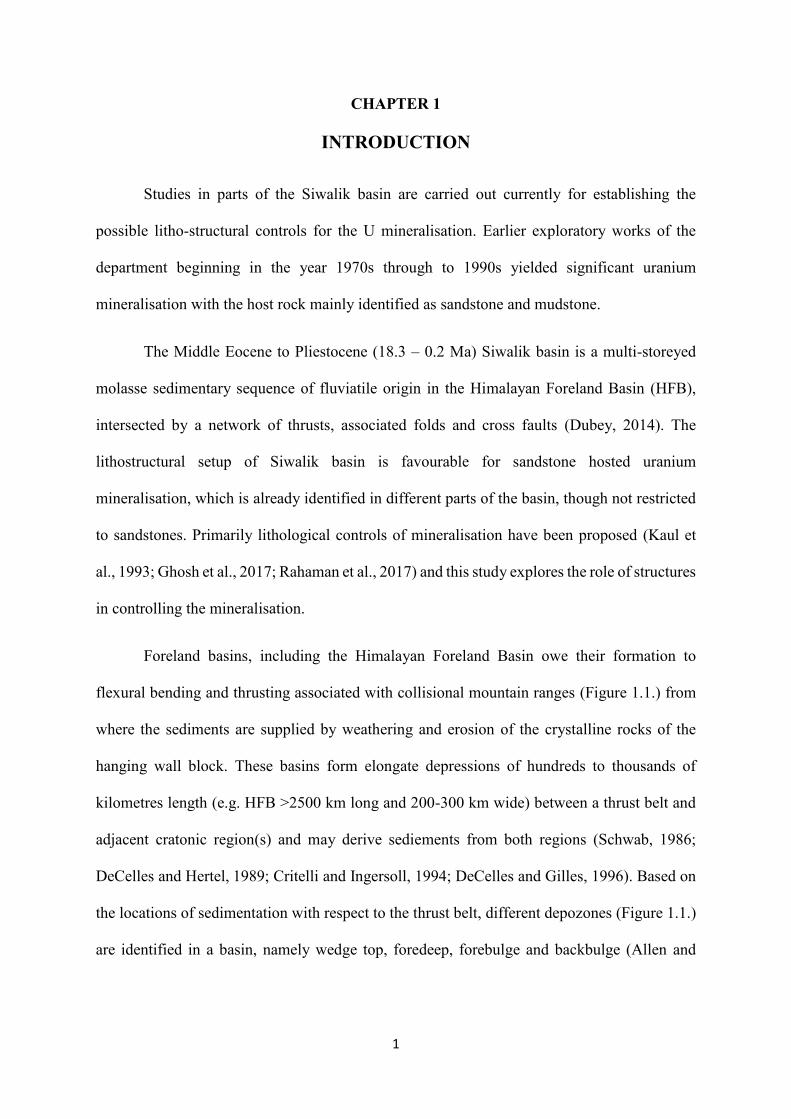
Foreland basins, including the Himalayan Foreland Basin owe their formation to
flexural bending and thrusting associated with collisional mountain ranges (Figure 1.1.) from
where the sediments are supplied by weathering and erosion of the crystalline rocks of the
hanging wall block. These basins form elongate depressions of hundreds to thousands of
kilometres length (e.g. HFB >2500 km long and 200-300 km wide) between a thrust belt and
adjacent cratonic region(s) and may derive sediements from both regions (Schwab, 1986;
DeCelles and Hertel, 1989; Critelli and Ingersoll, 1994; DeCelles and Gilles, 1996). Based on
the locations of sedimentation with respect to the thrust belt, different depozones (Figure 1.1.)
are identified in a basin, namely wedge top, foredeep, forebulge and backbulge (Allen and
2
Allen, 2013) and the sediment characteristics are controlled by the shift in the depozones due
to the subsidence of basin under topographic or sediment load. An initial flysch sedimentary
sequence gradually transitions into a molasse sequence (Miall, 2000). Siwalik basin formed
towards the later stage of thrusting along the Himalayan fold-thrust belt with sediment supply
from the weathering and erosion of Early Proterozoic to Cretaceous rocks of the Higher and
the Tethyan Himalayan tectonic units (Crawford, 1974; Valdiya,1970,1980; Valdiya et
al.,1984; Valdiya, 1989; Brown and Nazarchuk, 1993; Raiverman, 2002) along with the
Cenozoic sediments within the Sub-Himalayan tectonic unit (Raiverman, 2002).
The propagation of the main thrusting results in syn and post sedimentary deformation
in the foreland basins, which in turn results in the widening of the fold-thrust belt (Dahlstorm,
1970; Miall, 2000). Within basin faults develop and propagate from below the basin, cutting
through and uplifting the basin sediments (Miall, 2000). The continued faulting and folding
results in the formation of synclines, anticlines and faults at different scales within the basin
(Dubey, 2014). Syn-sedimentary deformation may also result in the formation of minor basins
and sub basins bounded by cross faults. The Kangra basin is a sub basin formed within the
Siwaliks.
Figure 1.1 Schematic diagram of foreland basin with different depozones after Einsele (2013)
3
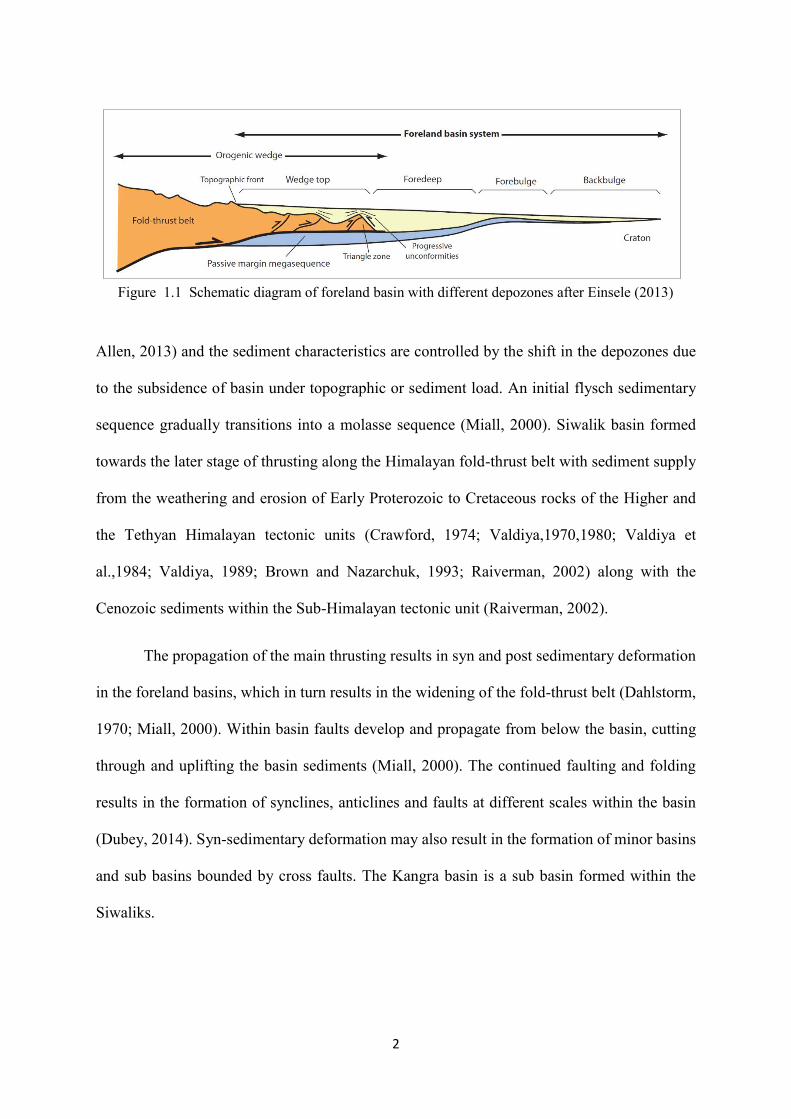
1.1 Geology of the Siwalik Group
The Siwalik sediments overlay the marine sediments of the Subathu and fluvial
sediments of Dharamshala Group in the HFB. The stratigraphic succession of the Siwaliks
(Kothari et al., 2017) is shown in Figure 1.2.
The Lower Siwaliks are divided into Kamlial and Chinji Formations of fluvial
sediments (Pilgrim, 1910). The Kamlial Formation consists of fine to medium grained, soft to
well indurated greyish sandstone, occasionally brownish sandstone and purple shale (Johnson
et al., 1985; Raiverman, 2002). Mammalian fossil assemblage suggest Middle Miocene age
Figure 1.2 Stratigraphy of the Tertiary sediment sequence in Himalaya (after Kothari et al., 2017).
4
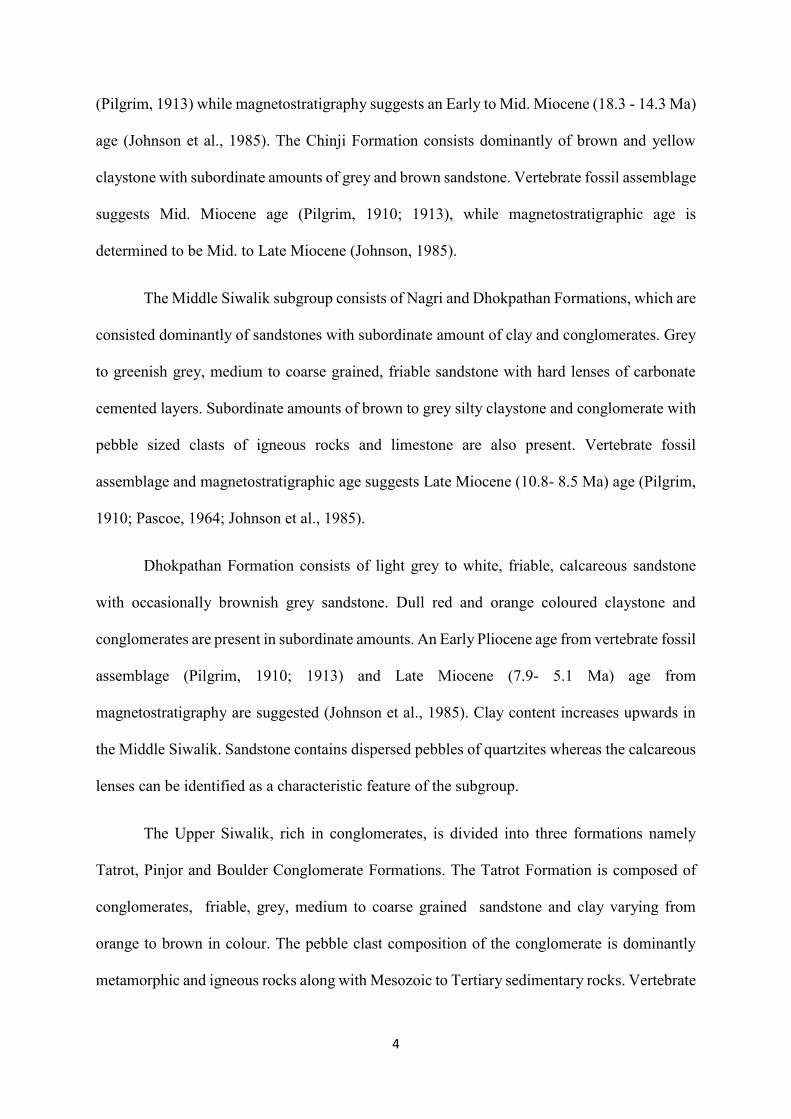
(Pilgrim, 1913) while magnetostratigraphy suggests an Early to Mid. Miocene (18.3 - 14.3 Ma)
age (Johnson et al., 1985). The Chinji Formation consists dominantly of brown and yellow
claystone with subordinate amounts of grey and brown sandstone. Vertebrate fossil assemblage
suggests Mid. Miocene age (Pilgrim, 1910; 1913), while magnetostratigraphic age is
determined to be Mid. to Late Miocene (Johnson, 1985).
The Middle Siwalik subgroup consists of Nagri and Dhokpathan Formations, which are
consisted dominantly of sandstones with subordinate amount of clay and conglomerates. Grey
to greenish grey, medium to coarse grained, friable sandstone with hard lenses of carbonate
cemented layers. Subordinate amounts of brown to grey silty claystone and conglomerate with
pebble sized clasts of igneous rocks and limestone are also present. Vertebrate fossil
assemblage and magnetostratigraphic age suggests Late Miocene (10.8- 8.5 Ma) age (Pilgrim,
1910; Pascoe, 1964; Johnson et al., 1985).
Dhokpathan Formation consists of light grey to white, friable, calcareous sandstone
with occasionally brownish grey sandstone. Dull red and orange coloured claystone and
conglomerates are present in subordinate amounts. An Early Pliocene age from vertebrate fossil
assemblage (Pilgrim, 1910; 1913) and Late Miocene (7.9- 5.1 Ma) age from
magnetostratigraphy are suggested (Johnson et al., 1985). Clay content increases upwards in
the Middle Siwalik. Sandstone contains dispersed pebbles of quartzites whereas the calcareous
lenses can be identified as a characteristic feature of the subgroup.
The Upper Siwalik, rich in conglomerates, is divided into three formations namely
Tatrot, Pinjor and Boulder Conglomerate Formations. The Tatrot Formation is composed of
conglomerates, friable, grey, medium to coarse grained sandstone and clay varying from
orange to brown in colour. The pebble clast composition of the conglomerate is dominantly
metamorphic and igneous rocks along with Mesozoic to Tertiary sedimentary rocks. Vertebrate
5
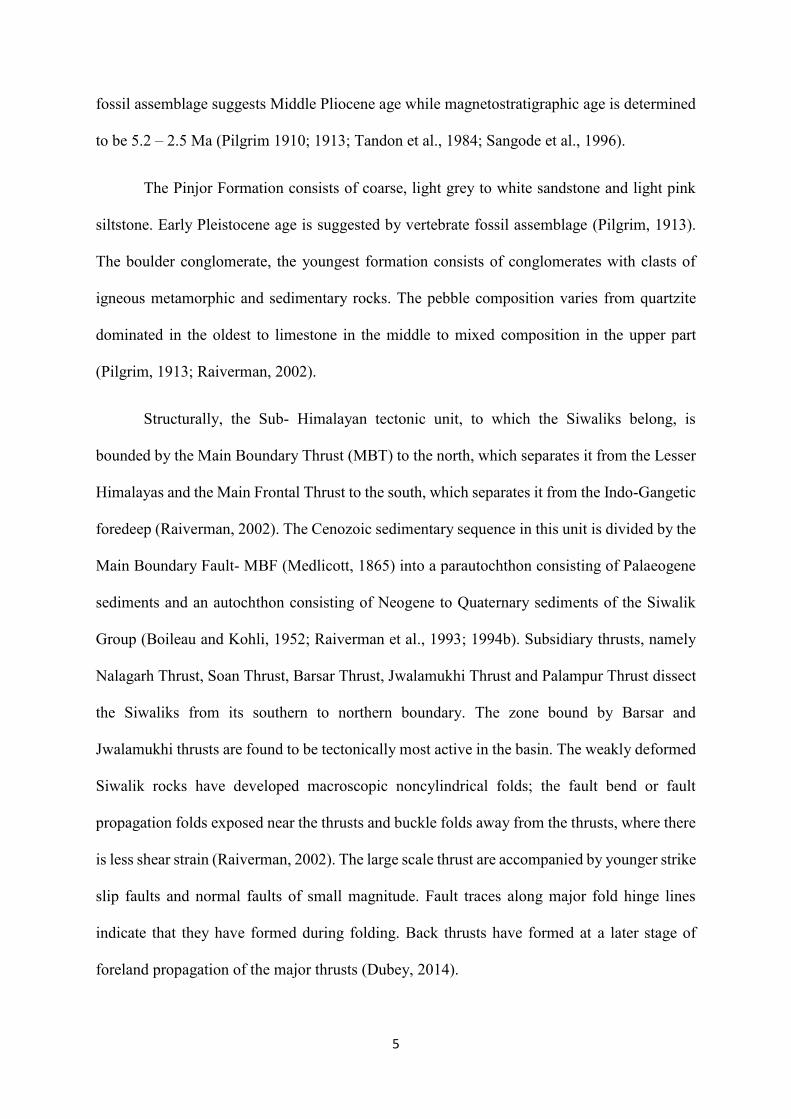
fossil assemblage suggests Middle Pliocene age while magnetostratigraphic age is determined
to be 5.2 – 2.5 Ma (Pilgrim 1910; 1913; Tandon et al., 1984; Sangode et al., 1996).
The Pinjor Formation consists of coarse, light grey to white sandstone and light pink
siltstone. Early Pleistocene age is suggested by vertebrate fossil assemblage (Pilgrim, 1913).
The boulder conglomerate, the youngest formation consists of conglomerates with clasts of
igneous metamorphic and sedimentary rocks. The pebble composition varies from quartzite
dominated in the oldest to limestone in the middle to mixed composition in the upper part
(Pilgrim, 1913; Raiverman, 2002).
Structurally, the Sub- Himalayan tectonic unit, to which the Siwaliks belong, is
bounded by the Main Boundary Thrust (MBT) to the north, which separates it from the Lesser
Himalayas and the Main Frontal Thrust to the south, which separates it from the Indo-Gangetic
foredeep (Raiverman, 2002). The Cenozoic sedimentary sequence in this unit is divided by the
Main Boundary Fault- MBF (Medlicott, 1865) into a parautochthon consisting of Palaeogene
sediments and an autochthon consisting of Neogene to Quaternary sediments of the Siwalik
Group (Boileau and Kohli, 1952; Raiverman et al., 1993; 1994b). Subsidiary thrusts, namely
Nalagarh Thrust, Soan Thrust, Barsar Thrust, Jwalamukhi Thrust and Palampur Thrust dissect
the Siwaliks from its southern to northern boundary. The zone bound by Barsar and
Jwalamukhi thrusts are found to be tectonically most active in the basin. The weakly deformed
Siwalik rocks have developed macroscopic noncylindrical folds; the fault bend or fault
propagation folds exposed near the thrusts and buckle folds away from the thrusts, where there
is less shear strain (Raiverman, 2002). The large scale thrust are accompanied by younger strike
slip faults and normal faults of small magnitude. Fault traces along major fold hinge lines
indicate that they have formed during folding. Back thrusts have formed at a later stage of
foreland propagation of the major thrusts (Dubey, 2014).
6
1.2 Mineral Potential of Foreland basins and Uranium mineralisation in the Siwaliks
The structural and sedimentary architecture of foreland basins make them potential
hosts of variety of mineral deposits and hydrocarbon resources. The vast network of thrusts,
faults and cross faults may aid in circulation of mineralised fluids across different parts of the
basin, by forming a plumbing system. The molasse sediment sequences provide sufficient
permeability for these fluids to invade and circulating meteoric water systems help set up redox
fronts whereas confinements of sedimentological and structural nature may facilitate
entrapment and preservation of the mineralisation. Oliver (1986) proposed that the fluids that
are expelled out of the basin sediments below the thrust sheets may effect the faulting, metal
transport, hydrocarbon migration or even metasomatism within the vicinity. As postulated by
Leach et al. (1984), Mississippi Valley-type lead-zinc deposits of the central United States were
deposited from hydrothermal fluids that were expelled from Ouachita foreland basin.
The multi-storeyed sedimentary sequence of sandstone, conglomerate and occasional
clay as well as calcitic cementations, make the Siwaliks suitable lithostructural locale for
hosting uranium mineralisation in the redox interfaces as well as in adsorbed form in the
carbonaceous matter, iron hydroxides and clay. The uranium mineralisation is associated with
the upper part of Lower Siwaliks as well as with the upper part of Middle Siwaliks- along the
transition of Middle to Upper Siwalik. The mineralised horizons occur at the redox interfaces
of oxidised and reduced sandstones, dominantly adsorbed in clay in the matrix, mud clasts and
organic matter, while also being associated with calcite cemented lenses at places. Uranium
mineralisation is also associated with the matrix component of pebble beds in the Middle
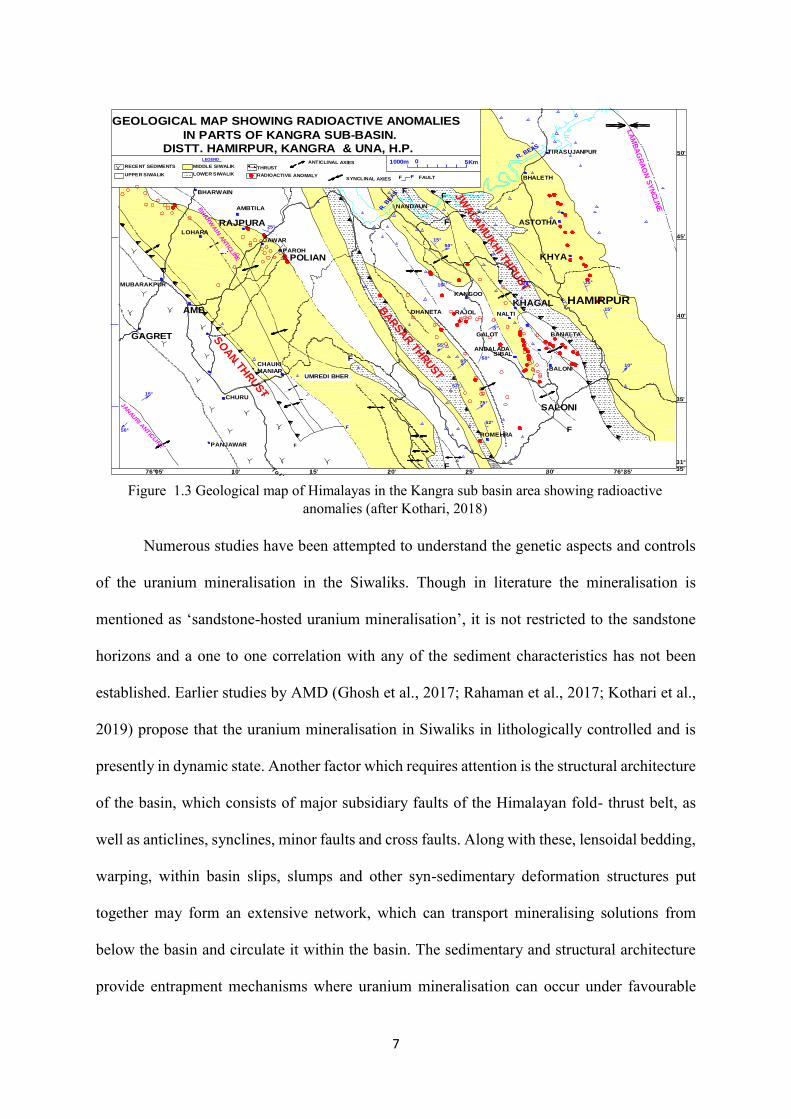
Siwalik as well as with the mudstones of Lower Siwaliks. Figure 1.3. shows the geological
map of the Kangra sub basin area with radioactive anomalies.
7
Numerous studies have been attempted to understand the genetic aspects and controls
of the uranium mineralisation in the Siwaliks. Though in literature the mineralisation is
mentioned as ‘sandstone-hosted uranium mineralisation’, it is not restricted to the sandstone
horizons and a one to one correlation with any of the sediment characteristics has not been
established. Earlier studies by AMD (Ghosh et al., 2017; Rahaman et al., 2017; Kothari et al.,
2019) propose that the uranium mineralisation in Siwaliks in lithologically controlled and is
presently in dynamic state. Another factor which requires attention is the structural architecture
of the basin, which consists of major subsidiary faults of the Himalayan fold- thrust belt, as
well as anticlines, synclines, minor faults and cross faults. Along with these, lensoidal bedding,
warping, within basin slips, slumps and other syn-sedimentary deformation structures put
together may form an extensive network, which can transport mineralising solutions from
below the basin and circulate it within the basin. The sedimentary and structural architecture
provide entrapment mechanisms where uranium mineralisation can occur under favourable
RECENT SEDIMENTS
UPPER SIWALIK
MIDDLE SIWALIK
LOWER SIWALIK
THRUST
LEGEND
PAROH
JAWAR
RAJPURA
AMBTILA
LOHARA
CHURU
CHAUKI
MANIARUMREDI BHER
PANJAWAR
AMB
GAGRET
MUBARAKPUR
BHARWAIN
TIRASUJANPUR
BHALETH
KHAGALNALTI
BALONI
ROMEHRA
35'
31°
35'
40'
45'
50'
35'30'25'20'15'10'05'76°'
R. B
EAS JW
ALA
MU
KH
I THR
UST
BAR
SA
R TH
RUST
SO
AN
THRUST
RAJOL
GALOT
ANDALADASIBAL
BANALTA
SALONI
ASTOTHA
KHYA
NANDAUN
DHANETA
POLIAN
RADIOACTIVE ANOMALY
1000m 0 5Km
JANAURI A
NTIC
LINE
LA
MB
AG
RA
ON
SY
NC
LIN
E
15°
50°
10°65°
55°
16°
50°
15°
15°
15°
52°
20°
5°
50°
57°
75°
25°
KANGOO
HAMIRPUR
GEOLOGICAL MAP SHOWING RADIOACTIVE ANOMALIES
IN PARTS OF KANGRA SUB-BASIN.
R. BEASDISTT. HAMIRPUR, KANGRA & UNA, H.P.
To Una
BH
AR
WA
IN A
NTIC
LINE
F
F
F
F
F
F76°
ANTICLINAL AXIES
SYNCLINAL AXIES F F FAULT
F
F
Figure 1.3 Geological map of Himalayas in the Kangra sub basin area showing radioactive anomalies (after Kothari, 2018)
8
physicochemical conditions (Moghal, 2001). During sedimentation and diagenesis, tectonic
activity (neotectonics) may help remobilise and concentrate uranium in a lithostructurally
controlled locales. Systematic studies in the uranium mineralised Siwaliks in the Kangra sub
basin would aid in examining the relationship between the structures and uranium
mineralisation. The regional structural pattern has to be delineated and studied alongside
lithological variations, uranium mineralisation and host rock characteristics.
The study area, Paniali – Loharkar- Galot tract falls in the Kangra sub basin and is
bounded by two thusts : Barsar thrust to the southwest and Jwalamukhi thrust to the northeast.
This tract, where Middle Siwalik sediments are dominantly exposed, along with Upper and
Lower Siwaliks, is a promising area with ongoing exploration activities of AMD for uranium
mineralisation since early 1970s. Geological, geophysical and geomorphometric studies
indicate that the Barsar and Jwalamukhi thrusts and the zone bounded by them comprise the
most active zone in the Kangra sub basin (Powers et al., 1998; Malik and Mohanty, 2007).
Barsar thrust is a backthrust with fault plane dipping towards SW. Associated with these thrusts
are two synclinal structures, Balaru syncline to the NE of Barsar thrust and another syncline to
the SW of Jwalamukhi thrust. Presence of cross faults have also been mentioned in earlier
studies.
Mineralisation in parts of this area and its surroundings is associated with grey and
brown sandstone, matrix part of conglomerates and in mudstones of Dad Khad, Loharkar, Nalti
and Romhera areas (Ghosh et al., 2017; Rahaman et al., 2017). With this preliminary
information, studies are planned to establish the lithostructural characteristics favouring
uranium mineralisation in this part of the basin.
9
1.4 Objectives
1. To identify, map and study the structural features in the Paniali- Loharkar- Galot tract
of the Kangra sub basin to understand the structural pattern of the area at a scale of
1:25,000.
2. To characterise the lithologies, host rocks for uranium mineralisation and the nature of
mineralisation.
3. To study the relationship between the distribution of uranium mineralisation and the
regional structural pattern.
4. To develop a model to understand the controlling factors of uranium mineralisation
with respect to structural aspects of the basin.
1.5 Deliverables
1. Lithostructural maps of the Paniali - Loharkar - Galot tract of the Kangra sub basin
delineating structural features over an area of 10 sq.km. at 1:25,000 scale.
2. Orientation data of structural features in the study area.
3. A proposal, regarding a suitable model for understanding the controlling factors of
uranium mineralisation with respect to structural aspects of the basin.
10
CHAPTER 2 LITERATURE REVIEW
The interdisciplinary study emphasising on all the processes that are involved in
remobilising the element(s) of interest from the source, its transportation and concentration
through segregation under conducive physico-chemical conditions and preservation through
geological history to form a mineable ore deposit, is the modern day mineral exploration
strategy. This is defined as mineral systems approach and was introduced by Wyborn et al.,
(1994).
The fundamental principles of sedimentary basin analysis, with the detailed description
of formation, sedimentation history and tectonics of foreland basins are discussed by Einsele
(2013), Allen and Allen (2013), Schwab (1986), DeCelles and Hertel (1989), Critelli and
Ingersoll (1994) and DeCelles and Gilles (1996). Miall (2001) gives a comprehensive
description of the Himalayan Foreland Basin.
Stratigraphic studies in the Siwalik were carried out by several authors including
Pilgrim (1910; 1913), Pascoe (1964), Johnson et al. (1985) and the fossil assemblage based
ages were determined by Pilgrim (1910; 1913) while Pascoe, (1964), Johnson et al., (1985)
determined the magnetostratigraphic ages of the individual subgroups within the Siwalik
Group. Geological Survey of India (GSI) and Oil and Natural Gas Corporation (ONGC) have
carried out extensive stratigraphic studies for the exploration of minerals and hydrocarbon.
Geological Quadrangle map, with regional geology and major structures of the area was
available from GSI web portal. A digitised district resource map as well as lineament map on
1:50,000 scale were accessed from the Bhuvan portal of National Remote Sensing Centre
(NRSC). Raiverman (2002) presents a detailed study of the stratigraphy, structure and the
evolution of the Himalayan Foreland Basin with energy sequence (enseq) concept. Mallik and
11
Mohanty (2007) studied the neotectonics of the terrain and delineated zones of neotectonics
activity through morphotectonic studies based on satellite remote sensing.
Relevant inhouse data pertaining to the uranium exploration in Siwaliks since early
1970s were referred for the present study.
Annual reports, maps and toposheets were collected from the regional library and
cartography section. Kaul et al. (1993) provides a comprehensive review of findings from the
exploration activities carried out between early 70s to early 90s, with lithological descriptions,
host rock characteristics, favourable physicochemical conditions, uranium mineralogy, and
maps of delineated mineralisation on a regional scale.
The present study is intended towards understanding the controls of mineralisation with
respect to the lithological and structural pattern, on a relatively detailed scale (1:25000). Similar
studies by Osterwald and Dean (1961) established structural control on uranium mineralisation
in the Cordillean foreland basin.
The literature and information collected from Bhuvan portal of National Remote
Sensing Centre (NRSC) included the digitised district resource map, lineament map on
1:50,000 scale.
Toposheet no. 53A/6 and 53A/10 pertaining to the area were collected from the
cartography section. As proposed by Krishna et al. (2015) the publicly available IRS
Resourcesat- 2 based LISS III imagery were found suitable for remote sensing studies of India.
The Cartosat-1 based Digital Elevation Model (DEM) are suitable for the rugged terrains of
Himalayan Region as referred by Baral et al. (2016).
The choice of Quantum GIS software (QGIS) were made for processing and
management of geospatial data, with respect to geological mapping as discussed by
Alshaghdari (2017) and Erharter and Palzer-Khomenko (2018). Kaul et al. (1993) suggested

12
that ground based radiometric surveys using in house developed instruments are most suitable
method for studying uranium anomalies in field.
13
CHAPTER 3 METHODOLOGY
3.1 Literature Survey
A vast quantity of available literature in the form of published papers, books and earlier
field season reports of Atomic Minerals Directorate for Exploration and Research (AMD) were
studied for understanding the geological background, nature of mineralisation and to prepare
basemaps from published maps. Literature related to remote sensing, processing of satellite
imagery and Digital Elevation Model (DEM), structural studies on foreland basins, along with
literature and online resources related to Quantum GIS (QGIS) were also studied for
formulating the methodology for carrying out the project work.
3.2 Preparation of basemap
An integrated basemap was prepared by digitising and georeferencing existing maps
which include : (i) Toposheets (no. 53A, 53A/6 and 53A/10) of the study area, collected from
the cartographic section at Northern Region Headquarters, AMD, New Delhi. (ii) Published
geological maps of Geological Survey of India (GSI) available in the online portal of GSI and
(iii) Digitally available maps from Bhuvan portal of National Remote Sensing Centre (NRSC)
(iv) Google Earth and ArcGIS Imagery
3.3 Remote sensing studies
Identification of structural features in a sedimentary terrain with loosely indurated or
friable sediments has to be aided by toposheet and remote sensing based geomorphological
studies. In this regard, Remote sensing studies were carried out for lineament identification,
studying topographic features and variations etc., so as to prepare thematic layers in the
database.
14
3.4 LISS III Imagery
IRS Resourcesat-2 LISS III imagery with 23.5 m spatial resolution and 10 bit
radiometric resolution were used in lineament extraction. These imagery containing
information in 4 spectral bands - Bands 2 to 4 in VNIR (0.52 - 0.86 μm) and Band 5 in SWIR
(1.55 - 1.70 μm) - are available in already georeferenced and orthorectified format from the
Bhuvan portal. Imagery pertaining to the local summer season were collected so as to have
minimum vegetation cover in the images.
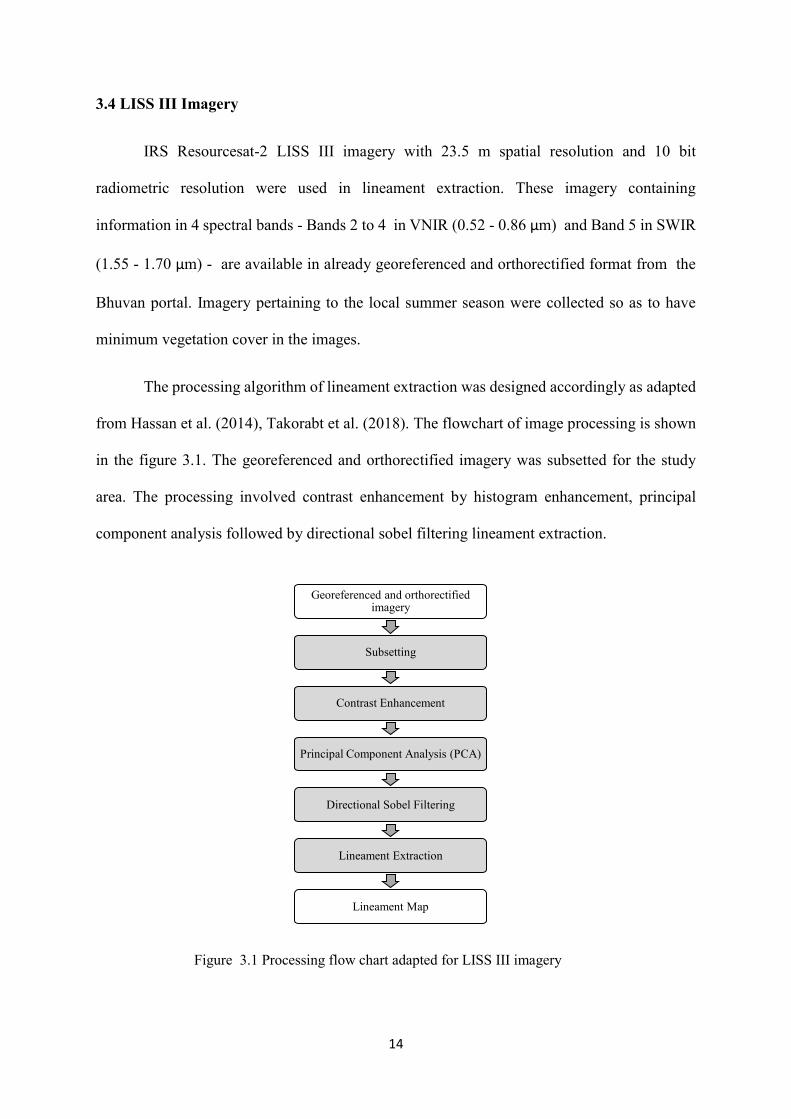
The processing algorithm of lineament extraction was designed accordingly as adapted
from Hassan et al. (2014), Takorabt et al. (2018). The flowchart of image processing is shown
in the figure 3.1. The georeferenced and orthorectified imagery was subsetted for the study
area. The processing involved contrast enhancement by histogram enhancement, principal
component analysis followed by directional sobel filtering lineament extraction.
Figure 3.1 Processing flow chart adapted for LISS III imagery
Georeferenced and orthorectified imagery
Subsetting
Contrast Enhancement
Principal Component Analysis (PCA)
Directional Sobel Filtering
Lineament Extraction
Lineament Map
15
3.4 Digital Elevation Model
The digital elevation model of the area was obtained from Cartosat-1 DEM derived
from stereo pair pan imagery and having a spatial resolution of 30m. Topographic contour
maps, shaded relief map and topographic profile were prepared using the DEM. The DEM was
also used for 3D visualisation of the terrain with overlays of different layers. The superiority
of Cartosat DEM over ASTER and SRTM based DEMs in rugged terrain is discussed by Baral
et al. (2016).
3.5 Other available maps
Maps of district resources, landuse, drainage and lineaments (1:50,000 scale) etc., were
incorporated from the Bhuvan portal of National Remote Sensing Centre (NRSC). Google earth
and ArcGIS imageries were also used to prepare road network map and identification of
lineaments.
3.6 Field work
Field work was carried out subsequently to remote sensing studies, for ground
verification and geological survey and detailed mapping. Toposheets, DEM and lineament
maps aided in planning the traverses. Lithological units at exposures were demarcated and
geological sections were prepared. Structural data pertaining to beddings, fractures, joints,
faults etc were collected and recorded systematically.
3.7 Radiometric survey
Radiation Survey Meter (RSM) was used to carry out radiometric survey on all
exposures, to measure the surface gamma ray activity (in ppm eU3O8 ) of the rocks. The
background values of radioactivity for each lithounit was determined and anomalous values
were identified for detailed mapping and sampling.
16
3.8 Map preparation
Lithostructural map of about 10 sq.km. area in the Paniali-Loharkar-Galot tract was
prepared, on a scale of 1:25000. Basemap was prepared by locating villages and towns using
digitized and georeferenced toposheet, by tracing road and stream networks from digitally
available georeferenced satellite imagery (Google earth, Open street map). Field data was
plotted on the map using GPS and toposheet based location data. Thematic layers were
prepared for lineaments extracted from LISS III imagery, lineaments extracted from DEM,
geological map, structural data and radioactive anomalies. All maps and imagery were
georeferenced to Geographic (Lat/Long) coordinate system, with WGS84 datum.
3.9 Sampling
Lithological grab sampling was carried out along the study area, where the exposures
are limited to stream and road cutting sections. Samples were numbered systematically and
sample slips were prepared, with field information as well as location data. Radioactive and
non radioactive samples were collected separately and were sent for petromineralogical and
gamma ray spectrometric studies to respective laboratories at NR headquarters, AMD, New
Delhi. The samples are sent to petrography lab to carry out studies related to clast composition,
texture, matrix, cement, radioactive phases, alterations if any and mineral paragenesis.
3.10 Software used
The free and open source QGIS (Quantum GIS) platform (QGIS 3.8.3 Zanzibar) was
used for the organisation, management and analysis of geospatial data involved in this study.
Within the project database, separate layers were prepared for lithological and lineament maps,
plotting of structural information and radioactive anomalies. Plenty of tools, plugins and
utilities available in QGIS were also used for collection and processing of data. This involved
digitization of publicly available geospatial data provided by Google, Bhuvan portal of NRSC,
17
ArcGIS Imagery, Openstreet map etc., organisation of georeferenced satellite imagery and
toposheets in raster format, preparation of digitized vector data of road and stream networks,
lithology and point data such as radioactive anomalies and structural data, collection of
orientation data of lineaments etc.
The lithological sections were prepared using AutoCAD software. The satellite imagery
processing was carried out using ERDAS Imagine and GRASS. Programming in Python
language was also carried out as part of an attempt to generate a 3D visualisation of the
geological and structural data.
18
CHAPTER 4 GEOLOGY OF THE AREA
The study area, Paniali-Loharkar-Galot tract falls in the Kangra sub basin of the Siwalik
basin and is bounded by Jwalamukhi thrust to the north and Barsar thrust to the south. The area
taken up for the survey and mapping (1:25000 scale ) include a 10 sq. km. block, with its
adjoining 20 sq.km. area enclosed between 31° 37′ 00″ and 31° 40′ 00″ latitudes and 76° 24′
25″ and 76° 30′ 00″ longitudes in toposheets no. 53A/6 and 53A/10.
Established stratigraphy of this area suggest that the rocks of Middle and Upper Siwalik
constitute the dominant lithology, bound by the two thrusts along east and west. Observations
made during the course of the present study are described in this chapter.
During the course of present studies lithological and structural data were recorded from
road and river sections exposing sandstone, pebble beds and mudstone of varying
characteristics. Attitude of beds tend to vary from horizontal to gentle to steep dips in opposite
directions, with a general NW-SE strike. Within basin slip faults, joints etc. were also recorded
at places. Radioactivity for individual units were recorded for determining the background
values of the units and to identify anomalies. Spotty and patchy anomalies were recorded in
different horizons, with widely ranging activities. Representative sampling was carried out for
petromineralogical and radioelemental studies for lithological characterisation of the rock
units. The following observations and recordings are made on 1:25000 scale.
4.1 Major lithounits
Sandstone, pebble beds and minor amounts of mud beds dominate the lithology of the
area. Besides this, variations in the sandstone colour has also been observed. The descriptions
of individual lithounits are given below.
19
4.1.1 Pebble beds
Pebble beds in the study area, limited to few exposures, occur as (i) the uppermost unit
and as (ii) intraformational lenses. In both types, clast composition consist of pink and white
quartzites, granitic gneisses and of indurated Fe-Mg rich mud clasts, which are dominantly of
cobble size, with occasional pebble and boulder sized clasts. Pebble beds forming the
uppermost units compose of matrix of reddish soil with clay, which suggests that they may be
part of recent alluvium or soil. The intraformational pebble bed lenses tend to be supported by
sandy matrix, with medium to coarse sized clasts. They form 6 - 7 m thick lenses with upto 40
m in the longer dimensions. The pebble beds are well exposed along the section near Masanbal,
where the matrix show variations from yellowish (limonitic) to buff colour whereas the clasts
of Fe-Mg rich indurated clay show corona structures interiorly and coating of bluish grey Fe
oxides exteriorly, giving a metallic lustre (specularite-like) to the clasts. These features are
indicative of oxidising environment. Significant radioactivity was not encountered in the
pebble beds within the present study area, whereas in the adjoining Nalti area to the east, within
the matrix component of pebble beds, significant radioactivity was recorded in earlier studies
carried out by AMD.
4.1.2 Buff sandstone
Buff coloured sandstone is dominantly found in the southern part of the study area, in
Paniali, Sureri and Balloh. These sandstone is medium to coarse grained, moderately sorted
and consists of quartz, altered feldspar, clasts of Fe-Mg minerals and mica. Pebbles of quartzite
and vein quartz are often found aligned along foresets of cross stratifications in this sandstone.
4.1.3 Limonitic Light Brown sandstone
In parts of Paniali, Sureri and Biru, limonitic light brown coloured sandstones are
observed. This is dominantly medium to fine grained and consists of quartz, altered feldspar,
20
mica and iron hydroxide, which may be imparting the colour to the rock. Limonitic bands are
observed in relatively less weathered surfaces exposed along recent road cuttings. Fe-Mg-Mn
rich mud clasts of dark black to brown colour are found at certain sections, surrounded by rusty
brown and black oxidation haloes of Fe and Mn. Radioactivity has also been recorded in these
clasts.
4.1.4 Brown Sandstone
At places, especially near Tagoh, Balloh and Biru, brown sandstones is exposed and
shows colour from orangish brown to reddish brown and are medium to fine grained with
occasional clay content. The colour of the rock may be due to the presence of iron oxides and
hydroxides (goethite gives orange colour). At certain places, banding is also observed.
4.1.5 Light Grey sandstone
In parts of Sureri, Manjrah and Biru and even westwards, light grey medium grained
sandstone are exposed and contain less amount of Fe-Mg rich clasts and often contain patches
of brown sandstone and limonitic sandstone with bandings. Mud clasts of dark grey to brown
are present but are not found associated with haloes.
4.1.6 Brownish Grey sandstone
In sections near Masanbal, towards the upper part of the sections, brownish grey
sandstones are exposed. These are medium to coarse grained and often contain lenses of grey
mud and pebbly horizons. Activity of upto 2.5 xbg has been reported in the mud lenses within
these units exposed near Biru.
4.1.7 Grey sandstone
The grey sandstone is the lowermost unit exposed in the study area, consisting of
medium to coarse grained ill sorted sandstone with hard compact lenses with calcite cement.
21
Alongside that grey coloured clay, organic matter are also associated with the sandstone. This
rock unit has dimensions – 2 km length along regional strike direction, 950 m width along dip
direction and about 2 - 7 m thickness- and hosts the radioactive zone delineated, with values
ranging from 50 ppm to 420 ppm as measured by radiation survey meter (RSM).
Grey sandstone is also exposed along the west and north of the area, from Pansai up to
Bal, along the Maan Khad. But in this part, it is slightly greenish, medium to fine grained, with
rare occurrence of calcitic cemented lenses, and tend to be more clayey. Clay lenses are also
greenish grey and laminations are observed at places. In these parts, significant radioactivity
was not encountered.
4.2 Area wise description of geology and radioactivity
4.2.1 Paniali
Exposures in Paniali area and its surroundings are restricted to road and stream sections,
often along steep slopes and beneath high vegetation cover. The lithology consists dominantly
of sandstone with exposures of conglomerate at places. Sandstone vary in color from grey to
buff to yellowish and brown and is medium to coarse grained, moderately to ill sorted, and
often pebbly. Compositionally these are arkosic-with feldspar often altered to clay minerals,
micaceous- at places with both muscovite and biotite and often contain calcitic cemented lenses
and mud clasts. Dark black minerals constitute about 5-20% of the mineralogy. The colour of
the sandstone is dominantly yellowish grey to brown and fine limonitic banding is observed at
places, suggestive of hydrous Fe oxides formed of near surface oxidation. Oxidation haloes
with concentric ferruginous ring structures developed around a central dark brown core of mud
is also observed within the sandstones in parts of Paniali.
To the south of Paniali, along Biru, Amroh and Sureri, light grey to limonitic light
brown and brown sandstones dominate the lithology. These occur as coarse to medium grained
22
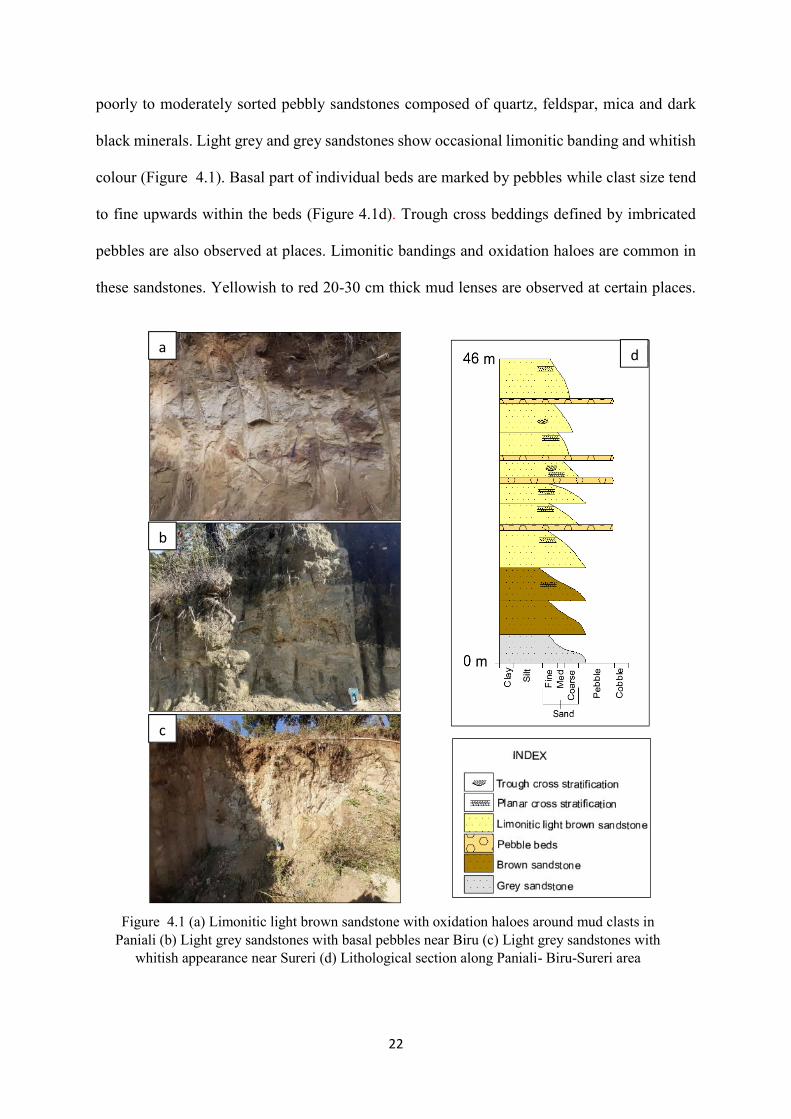
poorly to moderately sorted pebbly sandstones composed of quartz, feldspar, mica and dark
black minerals. Light grey and grey sandstones show occasional limonitic banding and whitish
colour (Figure 4.1). Basal part of individual beds are marked by pebbles while clast size tend
to fine upwards within the beds (Figure 4.1d). Trough cross beddings defined by imbricated
pebbles are also observed at places. Limonitic bandings and oxidation haloes are common in
these sandstones. Yellowish to red 20-30 cm thick mud lenses are observed at certain places.
Figure 4.1 (a) Limonitic light brown sandstone with oxidation haloes around mud clasts in Paniali (b) Light grey sandstones with basal pebbles near Biru (c) Light grey sandstones with
whitish appearance near Sureri (d) Lithological section along Paniali- Biru-Sureri area
a
b
c
d
23
Attitude of bedding plane measured in these sandstones is 145/18oW strike and dip
respectively.
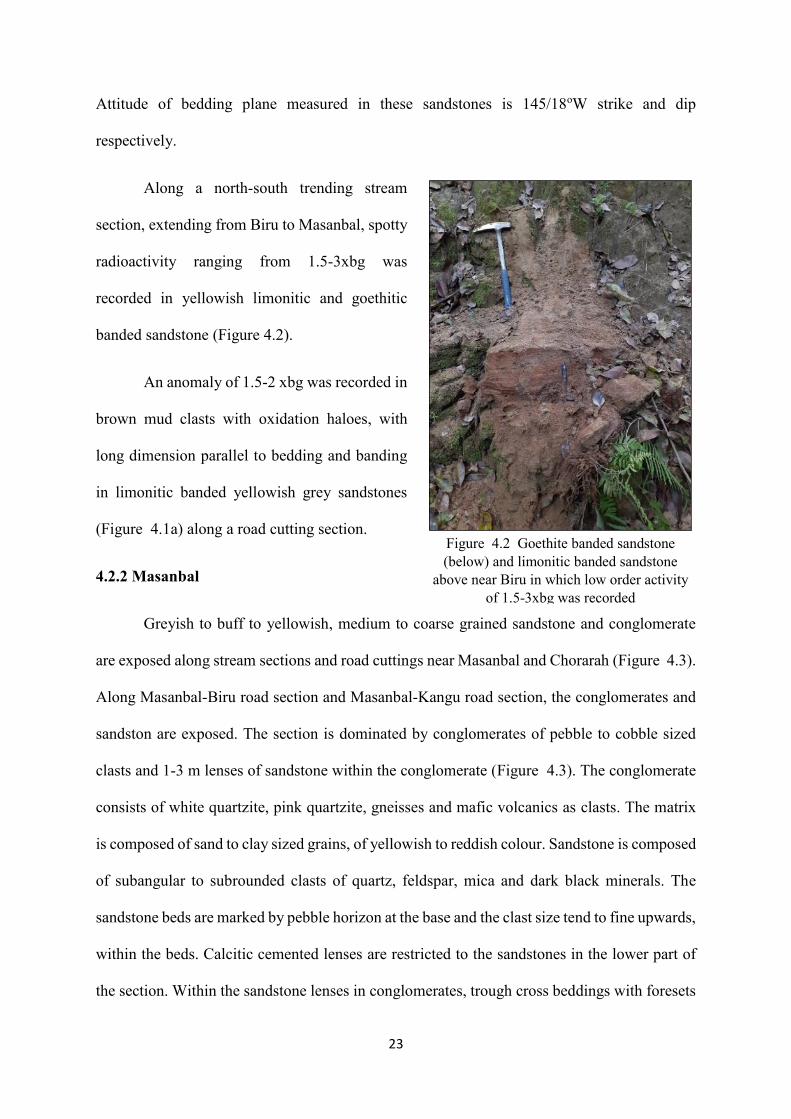
Along a north-south trending stream
section, extending from Biru to Masanbal, spotty
radioactivity ranging from 1.5-3xbg was
recorded in yellowish limonitic and goethitic
banded sandstone (Figure 4.2).
An anomaly of 1.5-2 xbg was recorded in
brown mud clasts with oxidation haloes, with
long dimension parallel to bedding and banding
in limonitic banded yellowish grey sandstones
(Figure 4.1a) along a road cutting section.
4.2.2 Masanbal
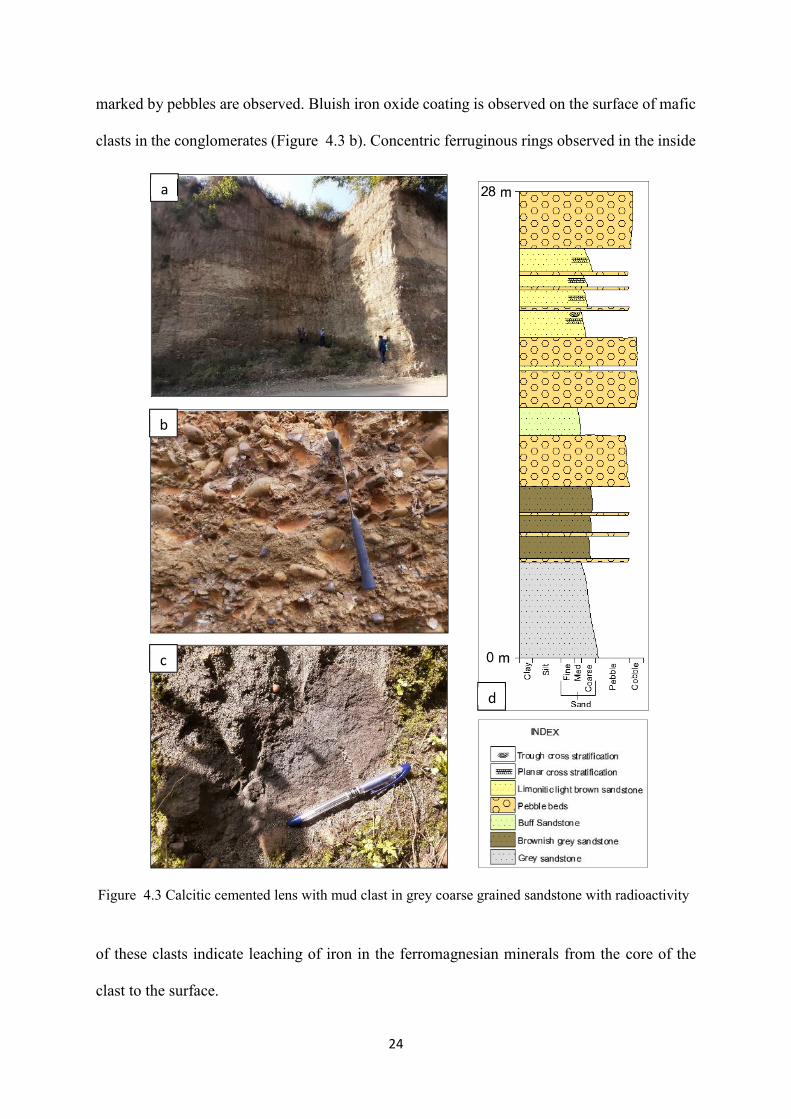
Greyish to buff to yellowish, medium to coarse grained sandstone and conglomerate
are exposed along stream sections and road cuttings near Masanbal and Chorarah (Figure 4.3).
Along Masanbal-Biru road section and Masanbal-Kangu road section, the conglomerates and
sandston are exposed. The section is dominated by conglomerates of pebble to cobble sized
clasts and 1-3 m lenses of sandstone within the conglomerate (Figure 4.3). The conglomerate
consists of white quartzite, pink quartzite, gneisses and mafic volcanics as clasts. The matrix
is composed of sand to clay sized grains, of yellowish to reddish colour. Sandstone is composed
of subangular to subrounded clasts of quartz, feldspar, mica and dark black minerals. The
sandstone beds are marked by pebble horizon at the base and the clast size tend to fine upwards,
within the beds. Calcitic cemented lenses are restricted to the sandstones in the lower part of
the section. Within the sandstone lenses in conglomerates, trough cross beddings with foresets
Figure 4.2 Goethite banded sandstone (below) and limonitic banded sandstone
above near Biru in which low order activity of 1.5-3xbg was recorded
24
marked by pebbles are observed. Bluish iron oxide coating is observed on the surface of mafic
clasts in the conglomerates (Figure 4.3 b). Concentric ferruginous rings observed in the inside
of these clasts indicate leaching of iron in the ferromagnesian minerals from the core of the
clast to the surface.
Figure 4.3 Calcitic cemented lens with mud clast in grey coarse grained sandstone with radioactivity
a
b
c
d
25
The conglomerates are present as 1-2m thick lenses within the sandstone and as separate
units of more than 7-8 m thickness as well. Wherever the conglomerates occur as thick separate
units, they form the uppermost lithounit. The conglomerates are matrix supported, poorly
sorted and consists of pebble to boulder sized clasts of white quartzite, pink quartzite, schists
and greenish grey fine grained mafic rock clast (dolerite?) as well. The average clast size is of
cobble size and the clasts generally show imbrications along flow direction. The matrix consists
of yellowish brown to reddish clay to gravel sized clasts. Lenses of 1-2 m thick sandstone of
yellowish to brown colour are present within these conglomerates.
Radioactivity of discontinuously patchy nature, encountered in the grey sandstone
along the N-S trending river section to from Masanbal to Paniali has been traced to about 500
m long, 60-90 m wide and 2-7 m thick band with 50 ppm- 420 ppm values measured with RSM
well above the background for the unit (15-20 ppm). The activity dies down to the north and to
the south to about 30-20 ppm and eventually decreases to background. The activity is
associated with calcitic cemented lenses, mud clasts, carbonaceous matter and Fe-Mn
encrustrations.
4.2.3 Galot – Loharkar - Nalti Tract
In the eastern part of the area, along Galot, Dadh Khad and Loharkar tract, southwest
of Jwalamukhi Thrust, sandstones and pebble beds of Middle Siwalik are mapped.
4.2.3.1 Galot
Stream sections of Dadh Khad, Kunnah Khad and Sukhar Khad, along Galot-Sibal and
Loharkar tract expose grey medium to coarse grained sandstone with conglomerate lenses
(Figure 4.4). The dominant lithology present is grey sandstone, with pebbly horizons and 7-9
meters thick pebble bed lenses. The grey sandstone is medium to coarse grained, friable, poorly
sorted and is composed of quartz, feldspar (often altered), mica, and dark, opaque minerals.
26
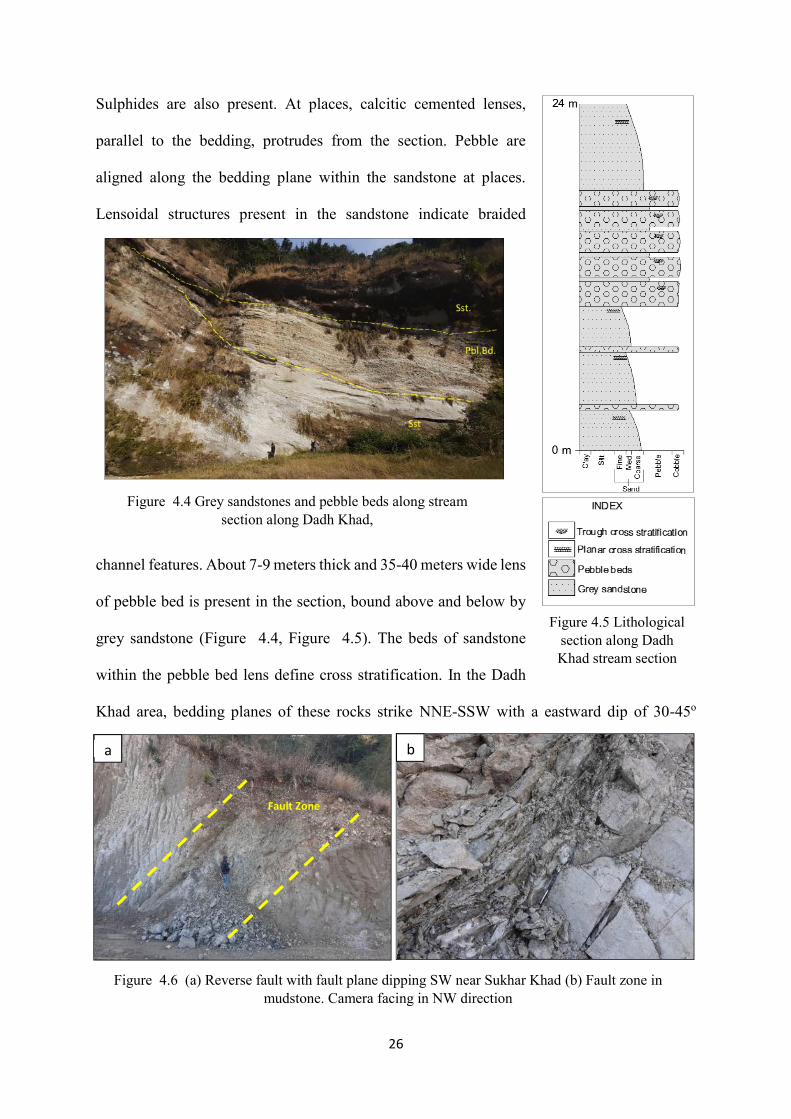
Sulphides are also present. At places, calcitic cemented lenses,
parallel to the bedding, protrudes from the section. Pebble are
aligned along the bedding plane within the sandstone at places.
Lensoidal structures present in the sandstone indicate braided
channel features. About 7-9 meters thick and 35-40 meters wide lens
of pebble bed is present in the section, bound above and below by
grey sandstone (Figure 4.4, Figure 4.5). The beds of sandstone
within the pebble bed lens define cross stratification. In the Dadh
Khad area, bedding planes of these rocks strike NNE-SSW with a eastward dip of 30-45o
Figure 4.4 Grey sandstones and pebble beds along stream section along Dadh Khad,
Figure 4.5 Lithological section along Dadh Khad stream section
Fault Zone
a b
Figure 4.6 (a) Reverse fault with fault plane dipping SW near Sukhar Khad (b) Fault zone in mudstone. Camera facing in NW direction
27
(Figure 4.4) and towards the eastern side, near Sukhar Khad, the beds have a nearly NW-SE
strike and a dip of above 50o southwestwards increasing upto 65o near a southwest dipping
reverse fault (Figure 4.6a) of same strike. To the east of this fault, along the Kunnah Khad
section, the beds become steeper with dips of about 80o southwestwards to almost subvertical
dips.
About 20 xbg activity was recorded in the grey sandstones ~200-400 ppm measured by
RSM in this area. The activity is also associated with calcitic cemented lenses, mud clasts,
carbonaceous matter.
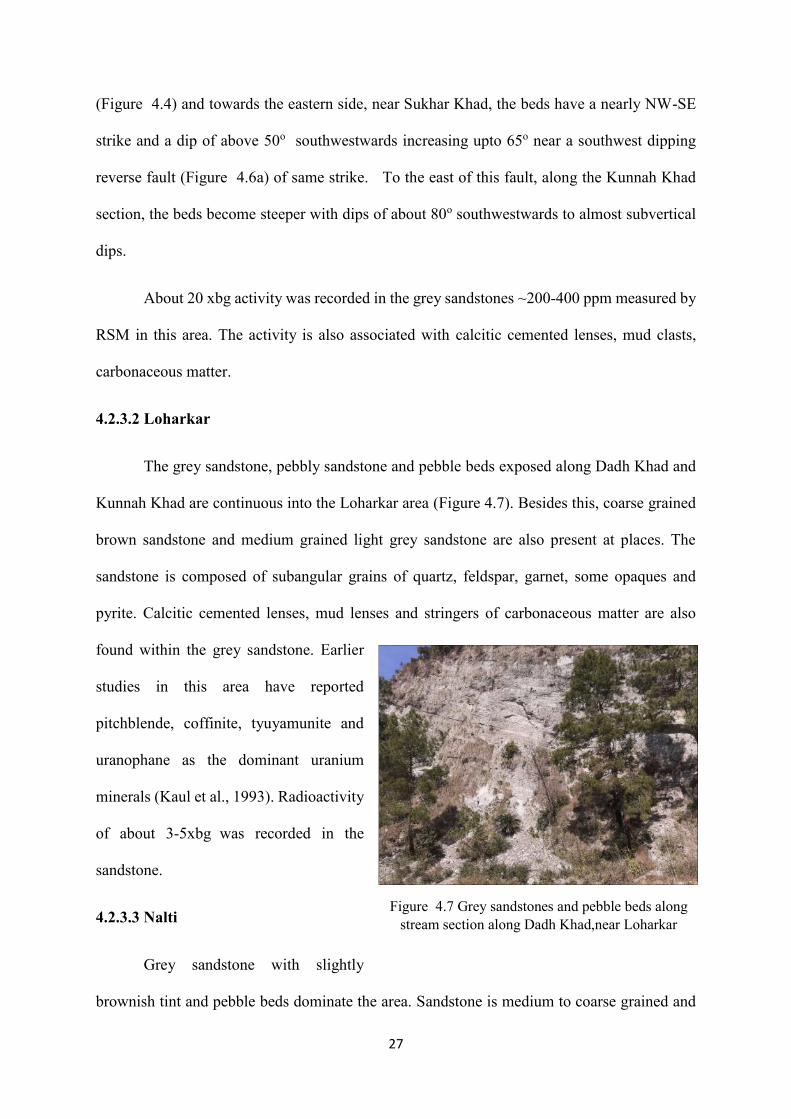
4.2.3.2 Loharkar
The grey sandstone, pebbly sandstone and pebble beds exposed along Dadh Khad and
Kunnah Khad are continuous into the Loharkar area (Figure 4.7). Besides this, coarse grained
brown sandstone and medium grained light grey sandstone are also present at places. The
sandstone is composed of subangular grains of quartz, feldspar, garnet, some opaques and
pyrite. Calcitic cemented lenses, mud lenses and stringers of carbonaceous matter are also
found within the grey sandstone. Earlier
studies in this area have reported
pitchblende, coffinite, tyuyamunite and
uranophane as the dominant uranium
minerals (Kaul et al., 1993). Radioactivity
of about 3-5xbg was recorded in the
sandstone.
4.2.3.3 Nalti
Grey sandstone with slightly
brownish tint and pebble beds dominate the area. Sandstone is medium to coarse grained and
Figure 4.7 Grey sandstones and pebble beds along stream section along Dadh Khad,near Loharkar
28
often pebbly, with pebbles arranged along foresets of cross stratifications, which are generally
planar or trough type. Pebble beds also
show cross stratifications and
imbrications. Beds strike NNW-SSE with
dips varying from 35o to 60o eastwards
(Figure 4.8).
Activity of about 6-10xbg was
recorded in Nalti and about 15-35xbg in
adjoining Har village. The activity is
associated with the grey sandstones and the matrix component of pebble beds. Activity of
480ppm was found associated with stringers of carbonaceous matter in Har.
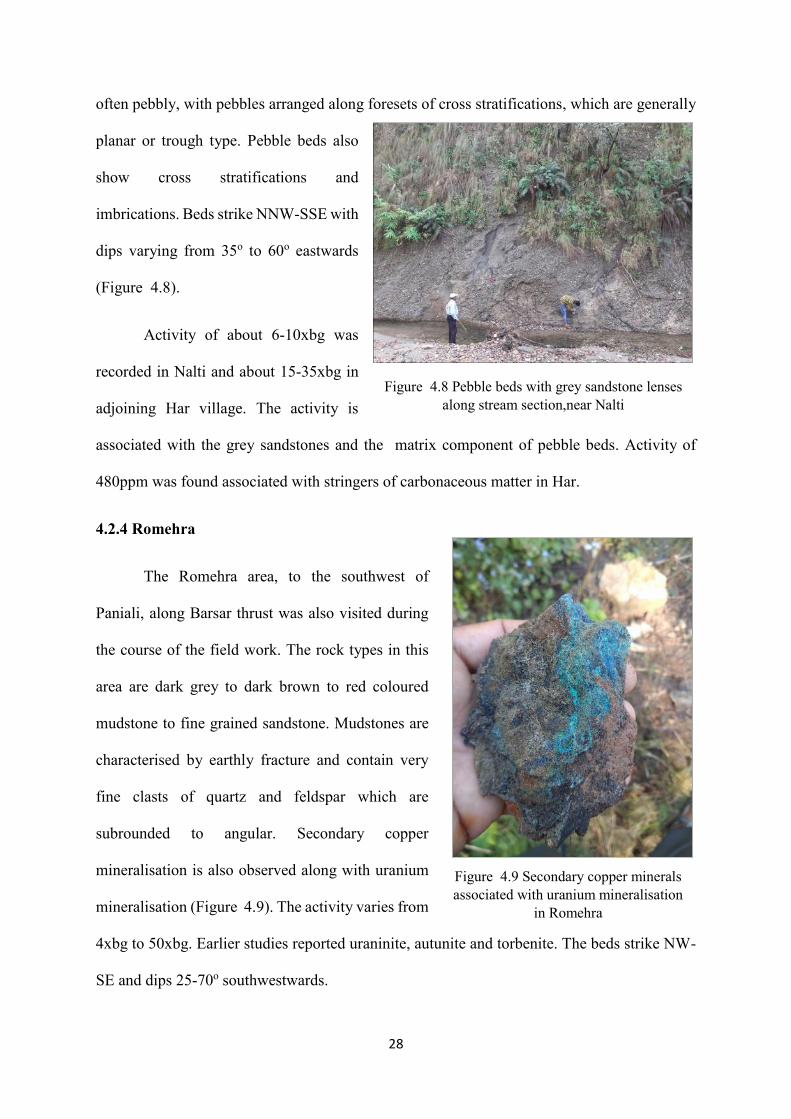
4.2.4 Romehra
The Romehra area, to the southwest of
Paniali, along Barsar thrust was also visited during
the course of the field work. The rock types in this
area are dark grey to dark brown to red coloured
mudstone to fine grained sandstone. Mudstones are
characterised by earthly fracture and contain very
fine clasts of quartz and feldspar which are
subrounded to angular. Secondary copper
mineralisation is also observed along with uranium
mineralisation (Figure 4.9). The activity varies from
4xbg to 50xbg. Earlier studies reported uraninite, autunite and torbenite. The beds strike NW-
SE and dips 25-70o southwestwards.
Figure 4.9 Secondary copper minerals associated with uranium mineralisation
in Romehra
Figure 4.8 Pebble beds with grey sandstone lenses along stream section,near Nalti
29
4.3 Structures
4.3.1 Remote sensing studies to identify structural features
The satellite imagery- IRS LISS III Imagery and Cartosat DEM were processed as per
the methodology adopted and used to extract lineaments. PCI Geomatica software was used
for the automatic detection of lineaments from the imagery. Manual identification of
lineaments were also carried out.
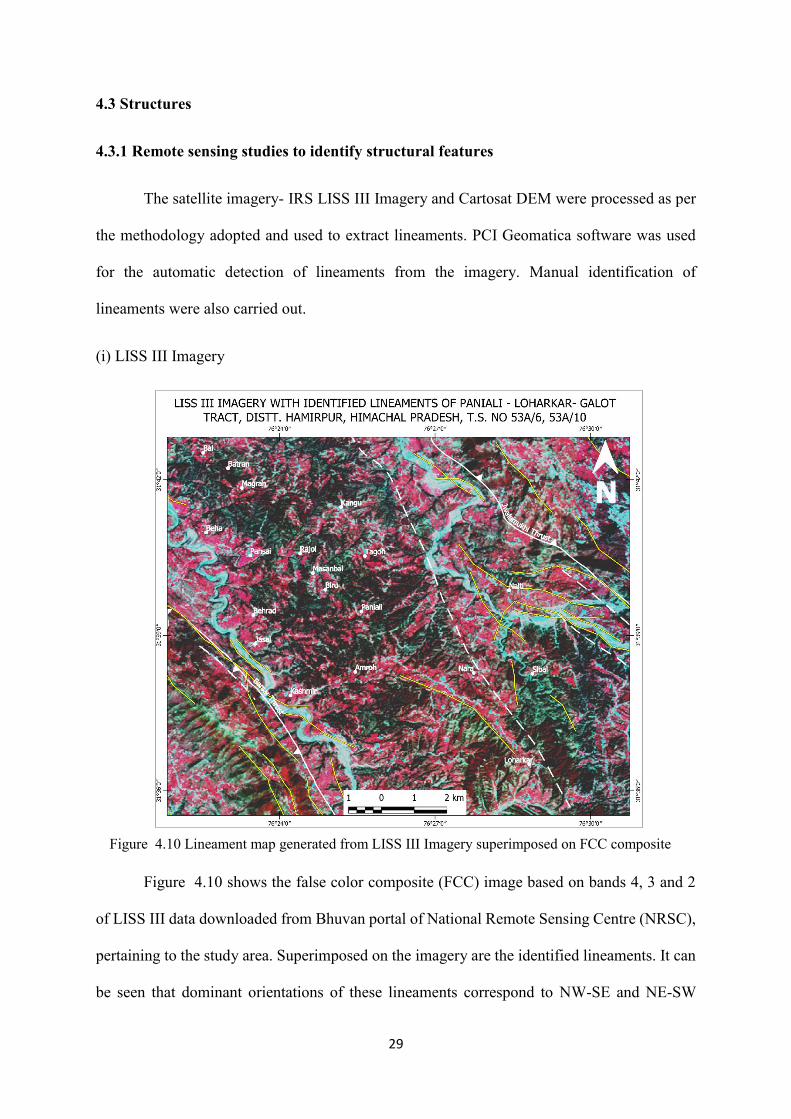
(i) LISS III Imagery
Figure 4.10 shows the false color composite (FCC) image based on bands 4, 3 and 2
of LISS III data downloaded from Bhuvan portal of National Remote Sensing Centre (NRSC),
pertaining to the study area. Superimposed on the imagery are the identified lineaments. It can
be seen that dominant orientations of these lineaments correspond to NW-SE and NE-SW
Figure 4.10 Lineament map generated from LISS III Imagery superimposed on FCC composite
30
directions. The NW-SE lineaments have more continuity and length and corresponds to major
lineaments in the area, including the Barsar thrust to the west, Jwalamukhi thrust to the east,
which are known and available in the published maps..
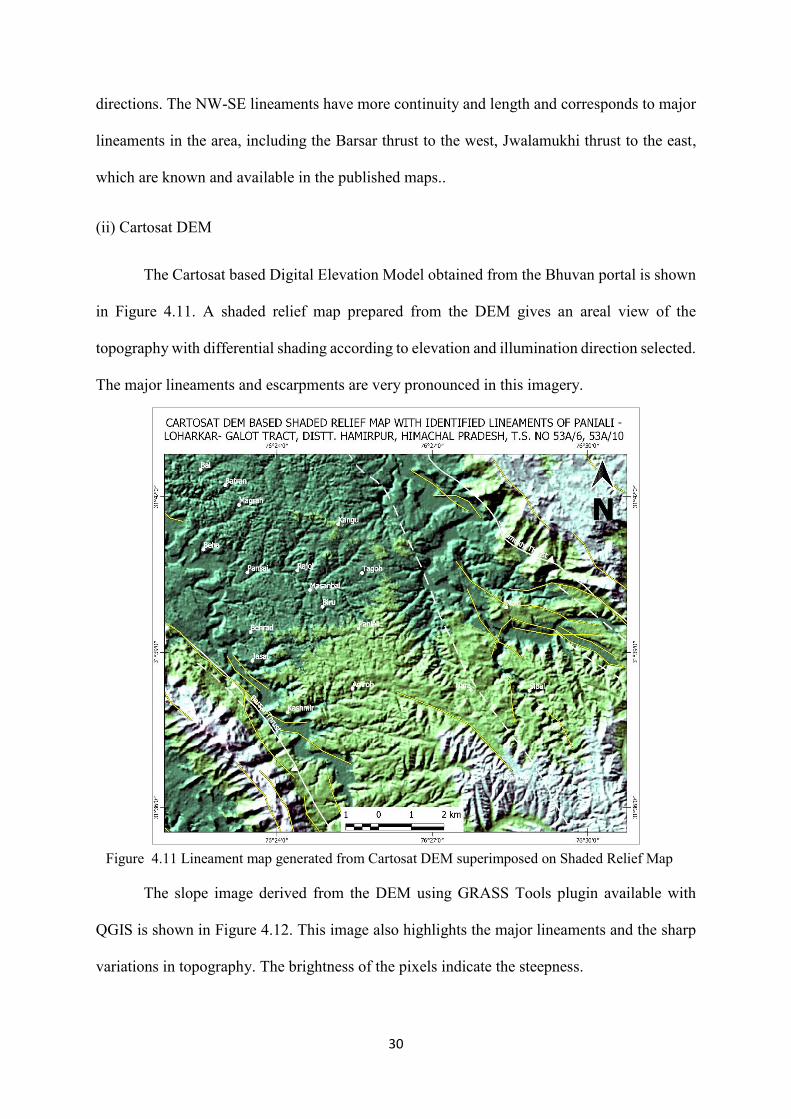
(ii) Cartosat DEM
The Cartosat based Digital Elevation Model obtained from the Bhuvan portal is shown
in Figure 4.11. A shaded relief map prepared from the DEM gives an areal view of the
topography with differential shading according to elevation and illumination direction selected.
The major lineaments and escarpments are very pronounced in this imagery.
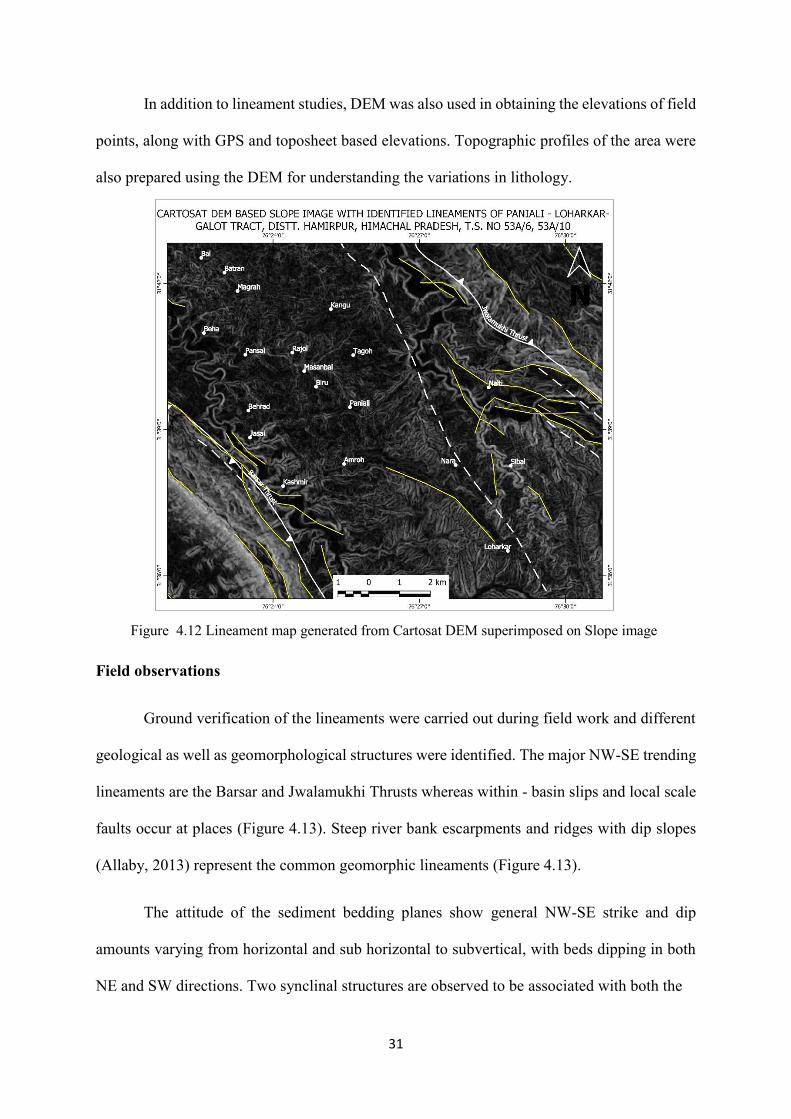
The slope image derived from the DEM using GRASS Tools plugin available with
QGIS is shown in Figure 4.12. This image also highlights the major lineaments and the sharp
variations in topography. The brightness of the pixels indicate the steepness.
Figure 4.11 Lineament map generated from Cartosat DEM superimposed on Shaded Relief Map
31
In addition to lineament studies, DEM was also used in obtaining the elevations of field
points, along with GPS and toposheet based elevations. Topographic profiles of the area were
also prepared using the DEM for understanding the variations in lithology.
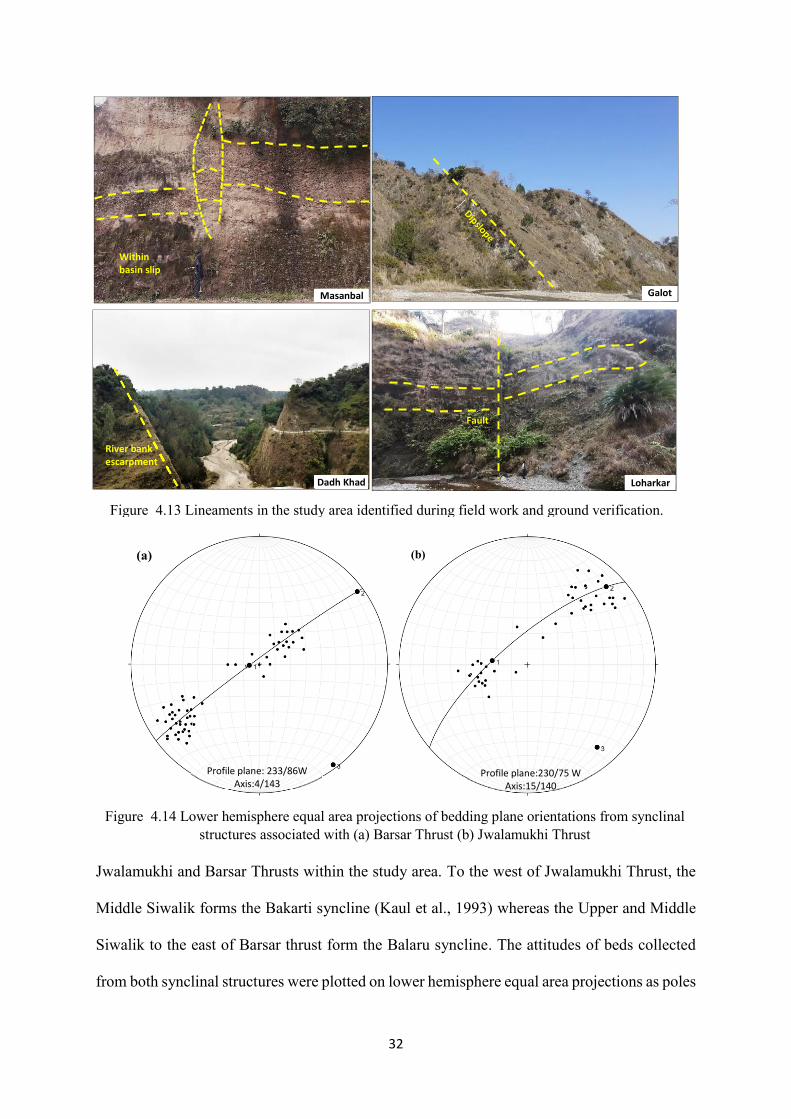
Field observations
Ground verification of the lineaments were carried out during field work and different
geological as well as geomorphological structures were identified. The major NW-SE trending
lineaments are the Barsar and Jwalamukhi Thrusts whereas within - basin slips and local scale
faults occur at places (Figure 4.13). Steep river bank escarpments and ridges with dip slopes
(Allaby, 2013) represent the common geomorphic lineaments (Figure 4.13).
The attitude of the sediment bedding planes show general NW-SE strike and dip
amounts varying from horizontal and sub horizontal to subvertical, with beds dipping in both
NE and SW directions. Two synclinal structures are observed to be associated with both the
Figure 4.12 Lineament map generated from Cartosat DEM superimposed on Slope image
32
Jwalamukhi and Barsar Thrusts within the study area. To the west of Jwalamukhi Thrust, the
Middle Siwalik forms the Bakarti syncline (Kaul et al., 1993) whereas the Upper and Middle
Siwalik to the east of Barsar thrust form the Balaru syncline. The attitudes of beds collected
from both synclinal structures were plotted on lower hemisphere equal area projections as poles
Profile plane: 233/86W Axis:4/143
Profile plane:230/75 W Axis:15/140
Figure 4.14 Lower hemisphere equal area projections of bedding plane orientations from synclinal structures associated with (a) Barsar Thrust (b) Jwalamukhi Thrust
(a) (b)
Galot
River bank
escarpment
Dadh Khad Loharkar
Fault
Masanbal
Figure 4.13 Lineaments in the study area identified during field work and ground verification.
Within basin slip
33
to the bedding planes (Figure 4.14). By fitting great circles to the clusters of poles, the profile
planes and fold axes were determined. Both folds have NW-SE trending fold axes, parallel to
the thrusts. Whereas the fold axis of the Balaru syncline is sub horizontal, the Bakarti syncline
has a gentle plunge of 15o southwestwards.
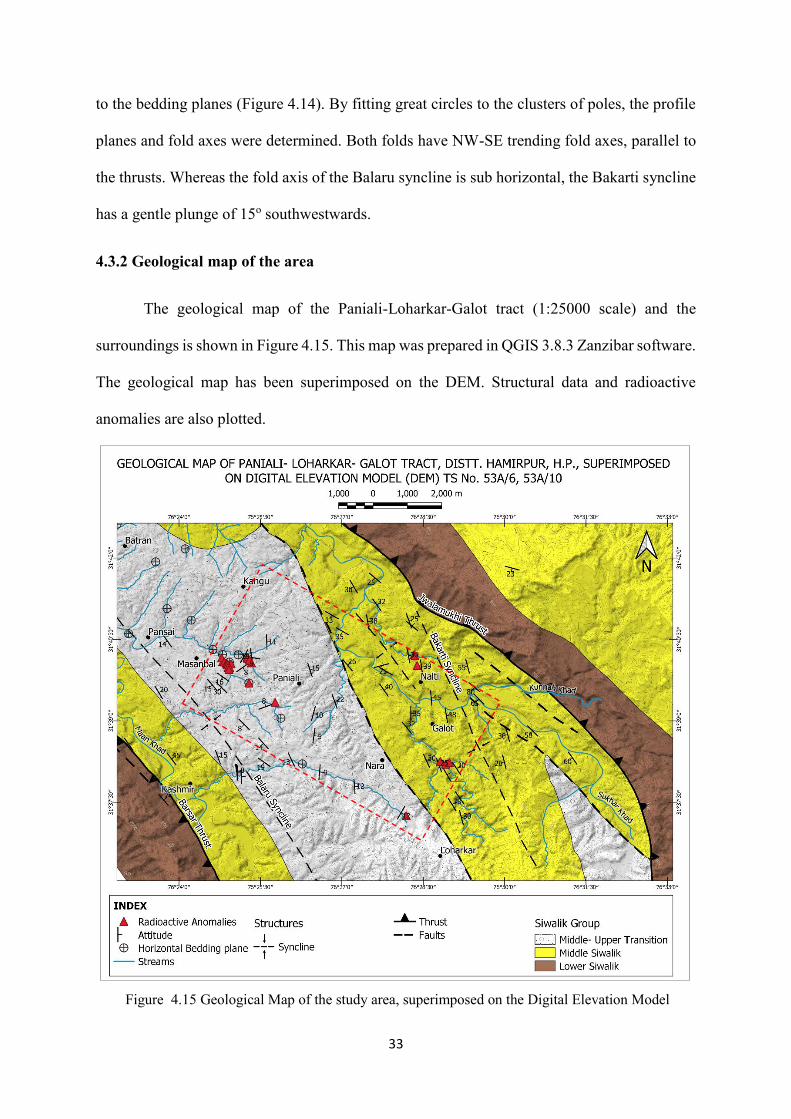
4.3.2 Geological map of the area
The geological map of the Paniali-Loharkar-Galot tract (1:25000 scale) and the
surroundings is shown in Figure 4.15. This map was prepared in QGIS 3.8.3 Zanzibar software.
The geological map has been superimposed on the DEM. Structural data and radioactive
anomalies are also plotted.
Figure 4.15 Geological Map of the study area, superimposed on the Digital Elevation Model
34
CHAPTER 5
RESULTS AND INTERPRETATION
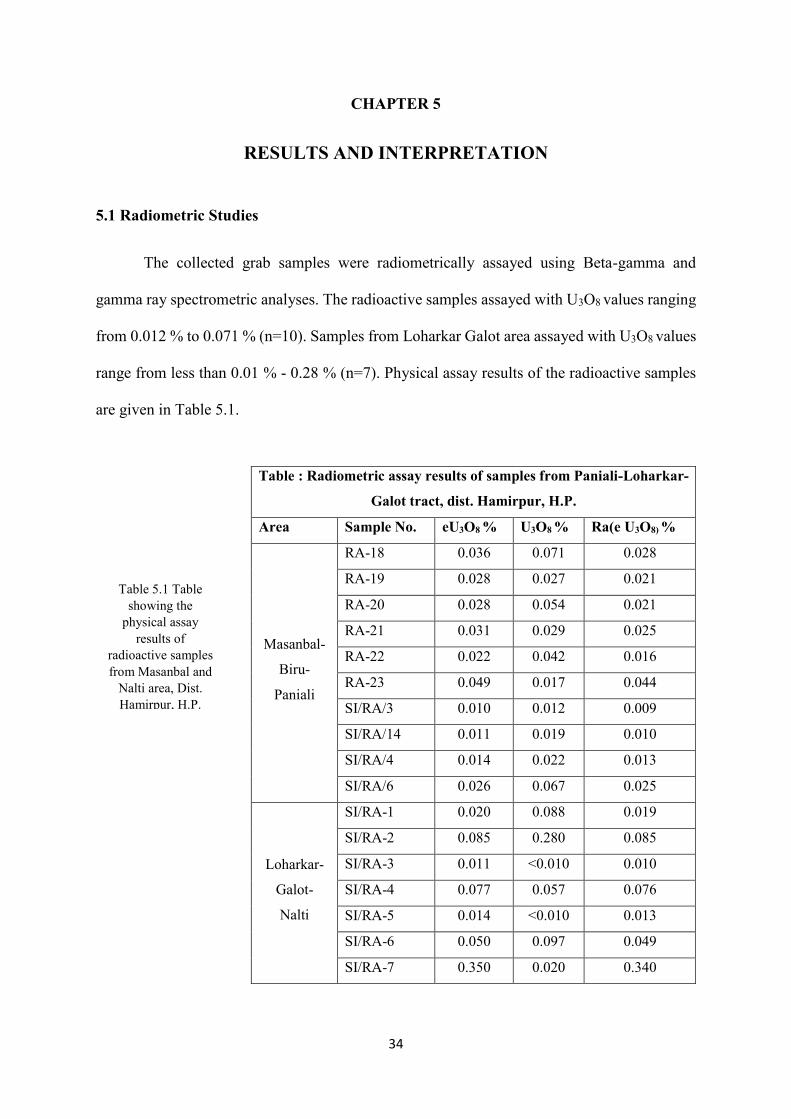
5.1 Radiometric Studies
The collected grab samples were radiometrically assayed using Beta-gamma and
gamma ray spectrometric analyses. The radioactive samples assayed with U3O8 values ranging
from 0.012 % to 0.071 % (n=10). Samples from Loharkar Galot area assayed with U3O8 values
range from less than 0.01 % - 0.28 % (n=7). Physical assay results of the radioactive samples
are given in Table 5.1.
Table : Radiometric assay results of samples from Paniali-Loharkar-
Galot tract, dist. Hamirpur, H.P.
Area Sample No. eU3O8 % U3O8 % Ra(e U3O8) %
Masanbal-
Biru-
Paniali
RA-18 0.036 0.071 0.028
RA-19 0.028 0.027 0.021
RA-20 0.028 0.054 0.021
RA-21 0.031 0.029 0.025
RA-22 0.022 0.042 0.016
RA-23 0.049 0.017 0.044
SI/RA/3 0.010 0.012 0.009
SI/RA/14 0.011 0.019 0.010
SI/RA/4 0.014 0.022 0.013
SI/RA/6 0.026 0.067 0.025
Loharkar-
Galot-
Nalti
SI/RA-1 0.020 0.088 0.019
SI/RA-2 0.085 0.280 0.085
SI/RA-3 0.011 <0.010 0.010
SI/RA-4 0.077 0.057 0.076
SI/RA-5 0.014 <0.010 0.013
SI/RA-6 0.050 0.097 0.049
SI/RA-7 0.350 0.020 0.340
Table 5.1 Table showing the
physical assay results of
radioactive samples from Masanbal and
Nalti area, Dist. Hamirpur, H.P.
35
5.2 Petrographic studies
Petrographic studies reveal
that the sandstones are clast
supported with upto 3 - 6 % of
matrix and upto 6 % cement,
which is dominantly calcitic with
occasional ferruginous cement.
The framework is composed of
subangular to subrounded clasts,
dominantly of quartz (40 – 60 %),
feldspar (10 – 25 %) - both
plagioclase (45%) and K-feldspar
(55 %), rock-fragments (14 –30 %)
and mica (3 – 4 %). The rock
fragments dominantly comprise of
sedimentary/metasedimentary
clasts (87 %) - shale.siltstone, sandstone, chert and mudstone, metamorphic clasts (12 %) -
metaquartzite, phyllite, schist and clasts of igneous rocks-mainly granitoids (18 %).Variations
are observed in grain size, shape and sorting across different units. Alteration of feldspar and
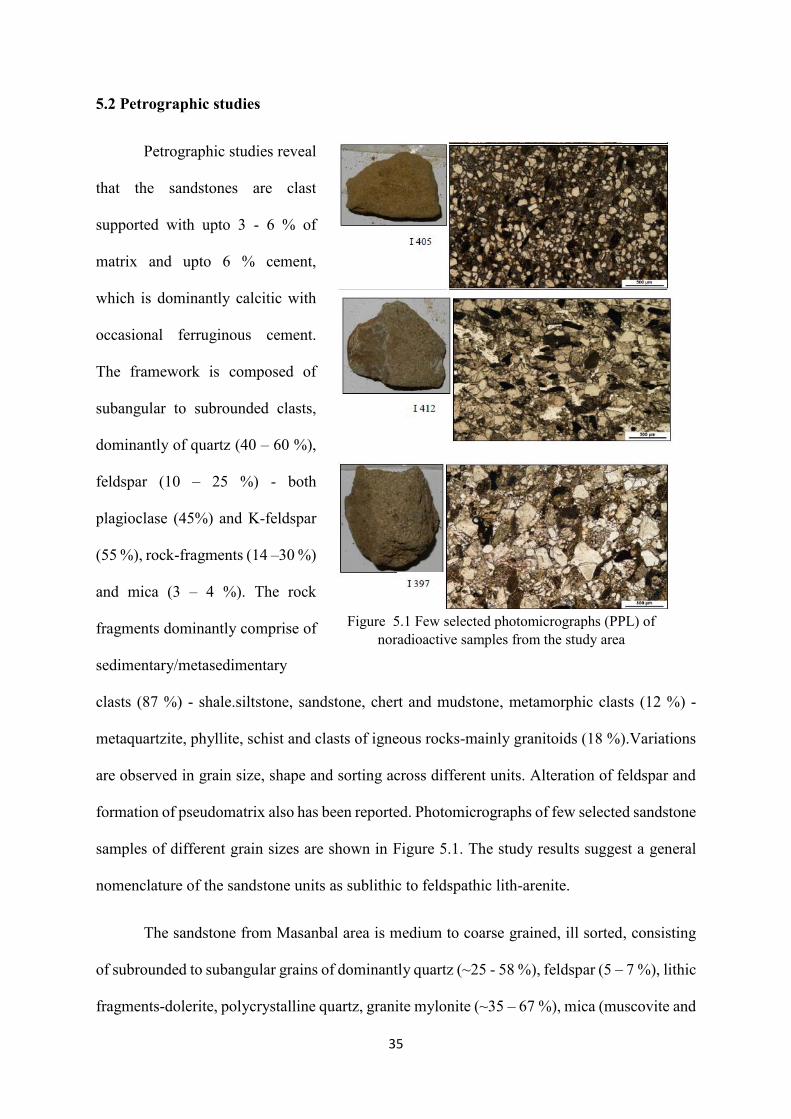
formation of pseudomatrix also has been reported. Photomicrographs of few selected sandstone
samples of different grain sizes are shown in Figure 5.1. The study results suggest a general
nomenclature of the sandstone units as sublithic to feldspathic lith-arenite.
The sandstone from Masanbal area is medium to coarse grained, ill sorted, consisting
of subrounded to subangular grains of dominantly quartz (~25 - 58 %), feldspar (5 – 7 %), lithic
fragments-dolerite, polycrystalline quartz, granite mylonite (~35 – 67 %), mica (muscovite and
Figure 5.1 Few selected photomicrographs (PPL) of noradioactive samples from the study area
36
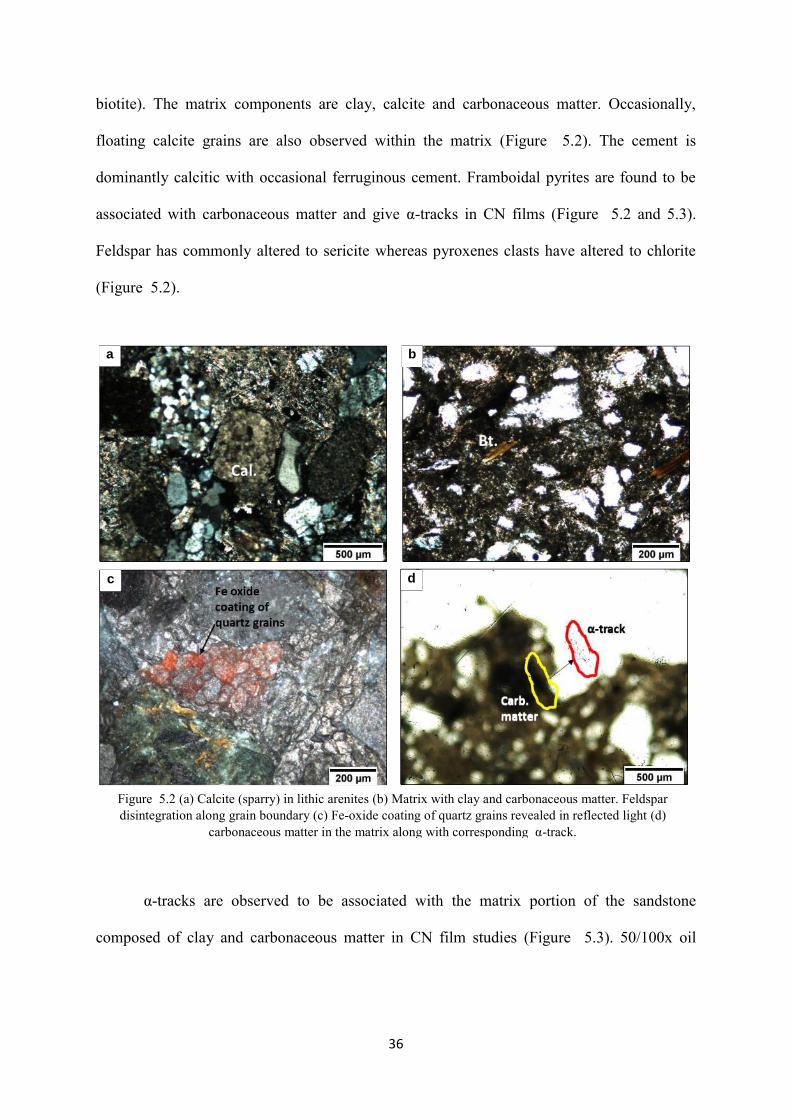
biotite). The matrix components are clay, calcite and carbonaceous matter. Occasionally,
floating calcite grains are also observed within the matrix (Figure 5.2). The cement is
dominantly calcitic with occasional ferruginous cement. Framboidal pyrites are found to be
associated with carbonaceous matter and give α-tracks in CN films (Figure 5.2 and 5.3).
Feldspar has commonly altered to sericite whereas pyroxenes clasts have altered to chlorite
(Figure 5.2).
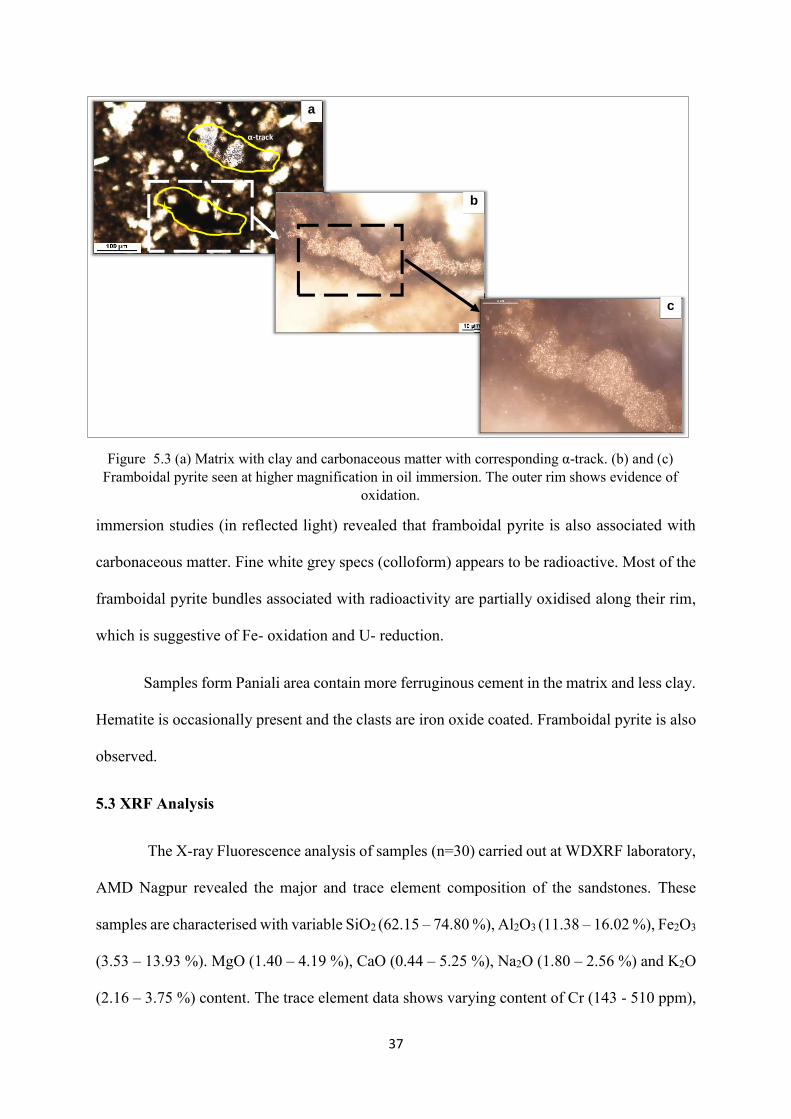
α-tracks are observed to be associated with the matrix portion of the sandstone
composed of clay and carbonaceous matter in CN film studies (Figure 5.3). 50/100x oil
Figure 5.2 (a) Calcite (sparry) in lithic arenites (b) Matrix with clay and carbonaceous matter. Feldspar disintegration along grain boundary (c) Fe-oxide coating of quartz grains revealed in reflected light (d)
carbonaceous matter in the matrix along with corresponding α-track.
b a
d c
37
immersion studies (in reflected light) revealed that framboidal pyrite is also associated with
carbonaceous matter. Fine white grey specs (colloform) appears to be radioactive. Most of the
framboidal pyrite bundles associated with radioactivity are partially oxidised along their rim,
which is suggestive of Fe- oxidation and U- reduction.
Samples form Paniali area contain more ferruginous cement in the matrix and less clay.
Hematite is occasionally present and the clasts are iron oxide coated. Framboidal pyrite is also
observed.
5.3 XRF Analysis
The X-ray Fluorescence analysis of samples (n=30) carried out at WDXRF laboratory,
AMD Nagpur revealed the major and trace element composition of the sandstones. These
samples are characterised with variable SiO2 (62.15 – 74.80 %), Al2O3 (11.38 – 16.02 %), Fe2O3
(3.53 – 13.93 %). MgO (1.40 – 4.19 %), CaO (0.44 – 5.25 %), Na2O (1.80 – 2.56 %) and K2O
(2.16 – 3.75 %) content. The trace element data shows varying content of Cr (143 - 510 ppm),
Figure 5.3 (a) Matrix with clay and carbonaceous matter with corresponding α-track. (b) and (c) Framboidal pyrite seen at higher magnification in oil immersion. The outer rim shows evidence of
oxidation.
α-track
b
a
c
38
Rb (80 - 174 ppm), Zr (64 - 148 ppm), Ba (520 - 890 ppm), Ce (102- 232 ppm), Th (13 - 42
ppm) and U (824 - 2549 ppm).
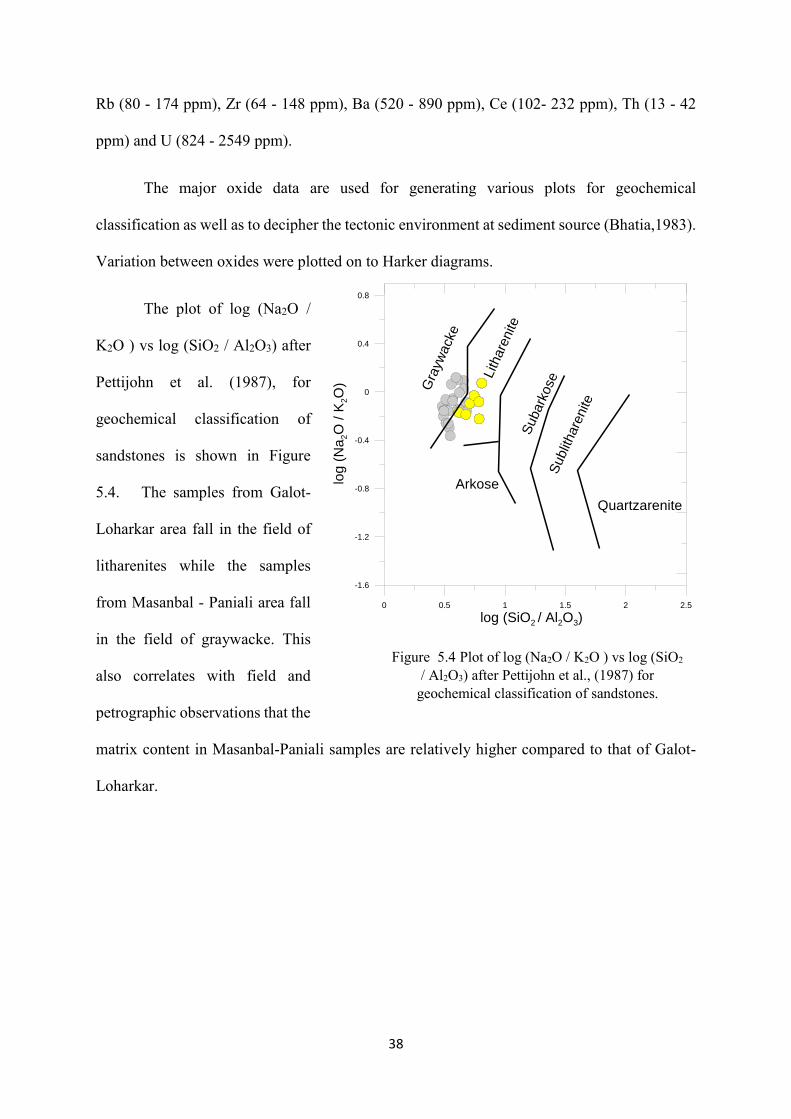
The major oxide data are used for generating various plots for geochemical
classification as well as to decipher the tectonic environment at sediment source (Bhatia,1983).
Variation between oxides were plotted on to Harker diagrams.
The plot of log (Na2O /
K2O ) vs log (SiO2 / Al2O3) after
Pettijohn et al. (1987), for
geochemical classification of
sandstones is shown in Figure
5.4. The samples from Galot-
Loharkar area fall in the field of
litharenites while the samples
from Masanbal - Paniali area fall
in the field of graywacke. This
also correlates with field and
petrographic observations that the
matrix content in Masanbal-Paniali samples are relatively higher compared to that of Galot-
Loharkar.
0 0.5 1 1.5 2 2.5
log (SiO2 / Al2O3)
-1.6
-1.2
-0.8
-0.4
0
0.4
0.8
log
(N
a2O
/ K
2O
) Gra
ywack
e
Lith
are
nite
Subark
ose
Sublit
hare
nite
Quartzarenite
Arkose
Figure 5.4 Plot of log (Na2O / K2O ) vs log (SiO2 / Al2O3) after Pettijohn et al., (1987) for
geochemical classification of sandstones.
39
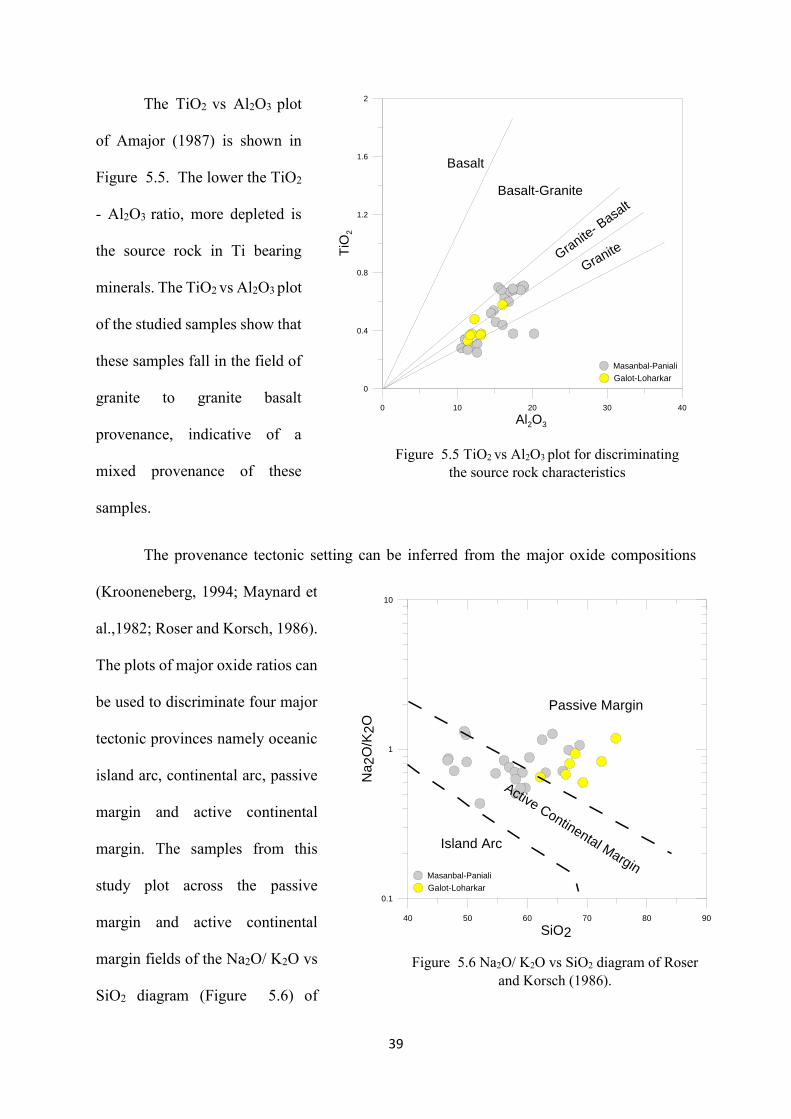
The TiO2 vs Al2O3 plot
of Amajor (1987) is shown in
Figure 5.5. The lower the TiO2
- Al2O3 ratio, more depleted is
the source rock in Ti bearing
minerals. The TiO2 vs Al2O3 plot
of the studied samples show that
these samples fall in the field of
granite to granite basalt
provenance, indicative of a
mixed provenance of these
samples.
The provenance tectonic setting can be inferred from the major oxide compositions
(Krooneneberg, 1994; Maynard et
al.,1982; Roser and Korsch, 1986).
The plots of major oxide ratios can
be used to discriminate four major
tectonic provinces namely oceanic
island arc, continental arc, passive
margin and active continental
margin. The samples from this
study plot across the passive
margin and active continental
margin fields of the Na2O/ K2O vs
SiO2 diagram (Figure 5.6) of
40 50 60 70 80 90
SiO2
0.1
1
10
Na
2O
/K2
O
Passive Margin
Active Continental Margin
Island Arc
Figure 5.6 Na2O/ K2O vs SiO2 diagram of Roser and Korsch (1986).
0 0.2 0.4 0.6 0.8 1
TiO2 + Fe2O3 + MgO
1
0.8
0.6
0.4
0.2
0
SiO2 / 20
1
0.8
0.6
0.4
0.2
0
K2O + Na2O
Masanbal-Paniali
A
B
C
D
Galot-Loharkar
A Oceanic island arcB Continental island arcC Active continental marginD Passive margin
0 10 20 30 40
Al2O3
0
0.4
0.8
1.2
1.6
2
TiO
2
Basalt
Basalt-Granite
Granite
- Basa
lt
Granite
Figure 5.5 TiO2 vs Al2O3 plot for discriminating the source rock characteristics
0 0.2 0.4 0.6 0.8 1
TiO2 + Fe2O3 + MgO
1
0.8
0.6
0.4
0.2
0
SiO2 / 20
1
0.8
0.6
0.4
0.2
0
K2O + Na2O
Masanbal-Paniali
A
B
C
D
Galot-Loharkar
A Oceanic island arcB Continental island arcC Active continental marginD Passive margin
40
Roser and Korsch (1986). The samples from Galot - Loharkar area dominantly fall in the
passive margin field while those from Masanbal - Paniali area fall dominantly in the active
continental margin field. Few samples of the latter set also fall in the passive margin field as
well as along the boundary of both the fields.
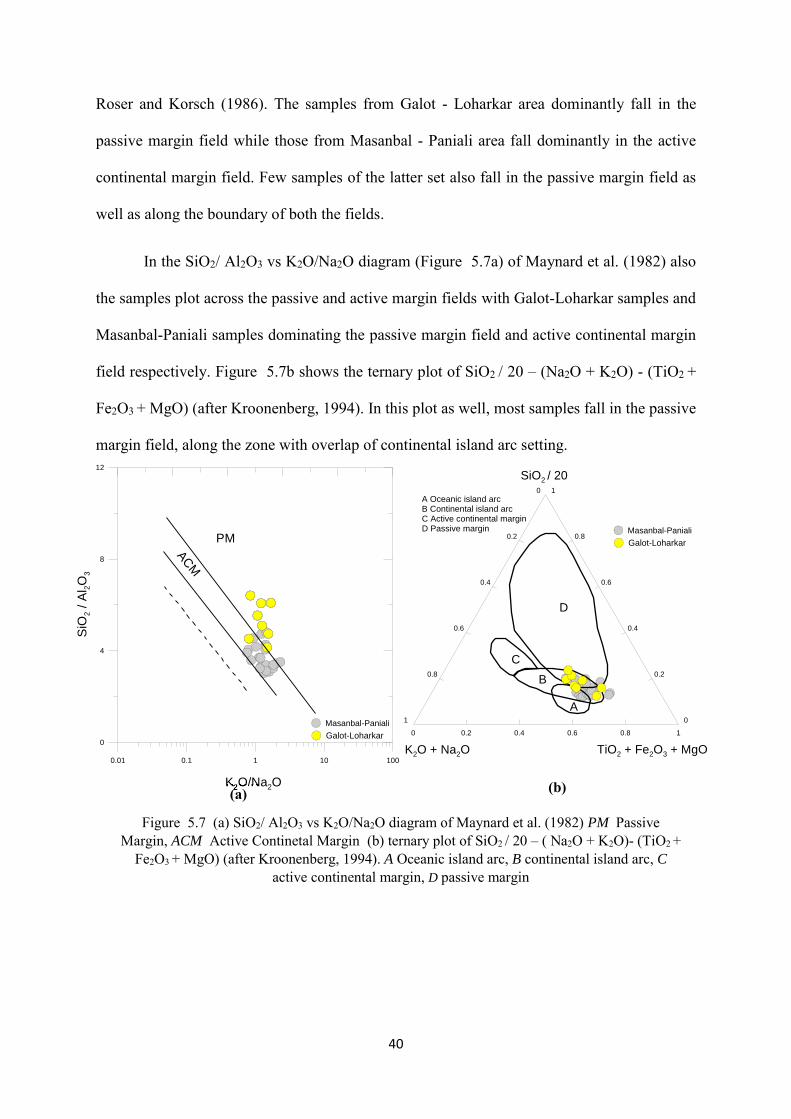
In the SiO2/ Al2O3 vs K2O/Na2O diagram (Figure 5.7a) of Maynard et al. (1982) also
the samples plot across the passive and active margin fields with Galot-Loharkar samples and
Masanbal-Paniali samples dominating the passive margin field and active continental margin
field respectively. Figure 5.7b shows the ternary plot of SiO2 / 20 – (Na2O + K2O) - (TiO2 +
Fe2O3 + MgO) (after Kroonenberg, 1994). In this plot as well, most samples fall in the passive
margin field, along the zone with overlap of continental island arc setting.
0 0.2 0.4 0.6 0.8 1
TiO2 + Fe2O3 + MgO
1
0.8
0.6
0.4
0.2
0
SiO2 / 20
1
0.8
0.6
0.4
0.2
0
K2O + Na2O
Masanbal-Paniali
A
B
C
D
Galot-Loharkar
A Oceanic island arcB Continental island arcC Active continental marginD Passive margin
0.01 0.1 1 10 100
K2O/Na2O
0
4
8
12
SiO
2 /
Al 2
O3
PM
AC
M
Figure 5.7 (a) SiO2/ Al2O3 vs K2O/Na2O diagram of Maynard et al. (1982) PM Passive Margin, ACM Active Continetal Margin (b) ternary plot of SiO2 / 20 – ( Na2O + K2O)- (TiO2 +
Fe2O3 + MgO) (after Kroonenberg, 1994). A Oceanic island arc, B continental island arc, C active continental margin, D passive margin
(b) K2O/N(a)
0 0.2 0.4 0.6 0.8 1
TiO2 + Fe2O3 + MgO
1
0.8
0.6
0.4
0.2
0
SiO2 / 20
1
0.8
0.6
0.4
0.2
0
K2O + Na2O
Masanbal-Paniali
A
B
C
D
Galot-Loharkar
A Oceanic island arcB Continental island arcC Active continental marginD Passive margin
41
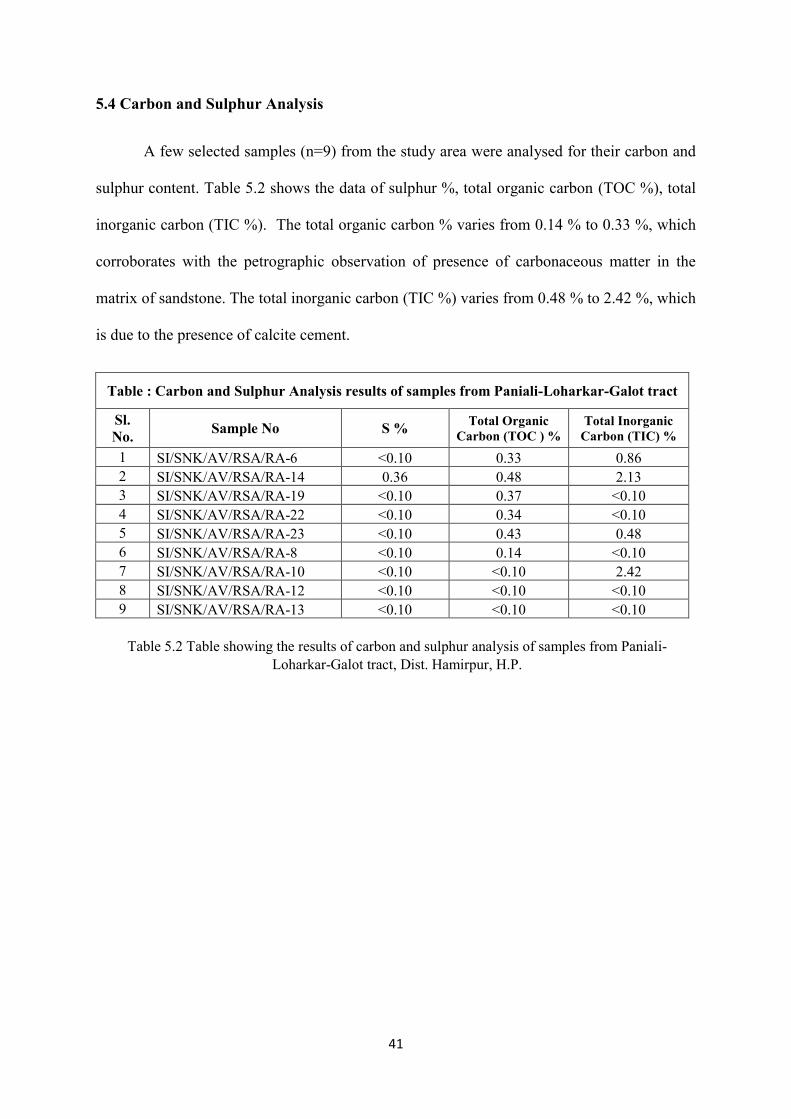
5.4 Carbon and Sulphur Analysis
A few selected samples (n=9) from the study area were analysed for their carbon and
sulphur content. Table 5.2 shows the data of sulphur %, total organic carbon (TOC %), total
inorganic carbon (TIC %). The total organic carbon % varies from 0.14 % to 0.33 %, which
corroborates with the petrographic observation of presence of carbonaceous matter in the
matrix of sandstone. The total inorganic carbon (TIC %) varies from 0.48 % to 2.42 %, which
is due to the presence of calcite cement.
Table : Carbon and Sulphur Analysis results of samples from Paniali-Loharkar-Galot tract
Sl. No. Sample No S % Total Organic
Carbon (TOC ) % Total Inorganic
Carbon (TIC) % 1 SI/SNK/AV/RSA/RA-6 <0.10 0.33 0.86 2 SI/SNK/AV/RSA/RA-14 0.36 0.48 2.13 3 SI/SNK/AV/RSA/RA-19 <0.10 0.37 <0.10 4 SI/SNK/AV/RSA/RA-22 <0.10 0.34 <0.10 5 SI/SNK/AV/RSA/RA-23 <0.10 0.43 0.48 6 SI/SNK/AV/RSA/RA-8 <0.10 0.14 <0.10 7 SI/SNK/AV/RSA/RA-10 <0.10 <0.10 2.42 8 SI/SNK/AV/RSA/RA-12 <0.10 <0.10 <0.10 9 SI/SNK/AV/RSA/RA-13 <0.10 <0.10 <0.10
Table 5.2 Table showing the results of carbon and sulphur analysis of samples from Paniali- Loharkar-Galot tract, Dist. Hamirpur, H.P.
42
CHAPTER 6
DISCUSSION
6.1 Field observations
An attempt has been made to prepare a 3D visualisation of the field data and anomalies,
along with the structural pattern of the study area- Paniali-Loharkar-Galot tract and its
adjoining parts (Figure 6.1). An interactive 3D plot was prepared for the field data with GPS
generated coordinates of Latitude, Longitude and Elevation, in a Python based programming
environment. A suitable viewing angle was determined from this interactive 3D plot for 2D
projection, so as to contain maximum information and to carry out further additions. A 3D
block diagram was constructed based on the projection generated from Python, in Corel Draw.
The regional geological map was projected on to the top surface, schematic structural profile
based on collected and available structural data was projected to the sides and the radioactive
anomalies were also projected on to their respective locations on the map at the top. Actual
topographic profile along the faces of the block were extracted from the Cartosat based Digital
Elevation Model (DEM) using QGIS and are projected along the sides. It has to be noted that
the north direction in the diagram points differently from the convention used in maps. This is
made for the convenience, so as to facilitate proper projections of individual features in the
diagram, with best details. Lateral variation in lithology and certain other details were omitted
in order to avoid cluttering.
The block diagram depicts the actual positions of the surface anomalies in the three
dimensional space. The study area is bounded by Jwalamukhi Thrust (not shown in the block)
to the east and Barsar Thrust to the west. A faulted contact between the Middle and Upper
Siwalik Group divide the area into an eastern and western block. Simplified lithological
sections for each block is given along the left rear (SE) and front right (NW) corners
43
respectively. In the eastern block, thick succession of grey, medium to coarse grained sandstone
with pebble bed lenses dominate the lithology. To the southeastern part, along Dadh Khad and
Loharkar, grey coarse grained sandstones host mineralisation, at relatively higher elevations
than Nalti and Masanbal. Nalti area falls along the axial part of a regional synclinal structure
to the north of Dadh Khad and activity in grey sandstones as well as in the matrix component
of pebble beds which dominate the lithology of the area. Along Masanbal, grey, coarse
sandstone with calcitic cemented lenses, mud clasts and carbonaceous matter host
discontinuous patchy activity, which is mapped in the present study. This is at much lower
elevation and is overlain by thick succession of oxidised medium to fine grained sandstone
with pebble horizons, show lateral variation in colour on the map and variation along vertical
section. Transiition of buff, limonitic yellow, brown and greyish brown colorations are
observed vertically downwards in the sediments, indicative of increasing reducing conditions
downwards. The radioactive anomaly in this area is also found to increase with depth. To the
north of Masanbal, the activity dies down to background and further north were two streams
meet, abrupt increase in the clast size of pebble beds and decrease in the proportion of
sandstone is observed, along with lateral displacement of strata along E-W direction. Even
further north, fine greenish grey sandstone with mud clasts are observed, along Pansai.
6.2 Structures
The synclinal structures associated with both thrusts enclosing the study area are
asymmetric with their steeper limb towards the thrust, which suggests that they may have
formed as footwall synclines associated with fault propagation folding. Such type of folds are
associated with detachment faults without involving basement rocks (McNaught and Mitra,
1992), like the Barsar and Jwalamukhi Thrusts. Further, seismic studies in the Kangra sub basin
also indicate that the Barsar Thrust is a shallow thrust and is linked to a detachment fault at its
base, along the lower part of the basin. It is possible that this fault system facilitated the
44
circulation of fluids between deeper part of the basin and the surface, which is substantiated by
the presence of copper mineralisation at Romhera, in the Lower Siwalik mudstones along
Barsar Thrust. Magnetotelluric studies have also suggested the presence of good conductors at
depth within the Siwalik sediments (Veeraswamy et al., 2010).
6.3 Oxidation of sediments and faulting
Oxidising fluids invading the sandstones from near surface conditions resulted in the
oxidation of Fe bearing minerals to oxides and hydroxides. Bandings of iron hydroxides and
oxidation haoles around mud clasts formed within these sediments. Later faulting along the
NW-SE trending fault plane, has uplifted the eastern block, exposing the relatively less
oxidised grey sandstones, which are exposed at elevations of about 900 m. In the western part
of the area, the oxidised sandstone with vertical colour variations consists of the top 100-150m
Figure 6.1 A representative 3D block diagram based on interactive plot generated from GPS based field data along with geological and structural information. The dots represent data points in the 3D
space, with red dots corresponding to surface anomalies. Orientation of the block with respect to north direction was decided based on the suitable viewing angle generated from the interactive plot.
45
of exposed stratigraphy, at elevations below 650m and the grey sandstone, with radioactivity
appears only at 500 – 540 m elevation. The presence of oxidation haloes and iron oxide coated
pebbles with corona structures indicate the prevalence of oxidation phenomena in these
sandstones. Similar sandstones are observed towards the hinge part of the Bakarti syncline as
well. It may be inferred that faulting is later to the oxidation of sediments. Cross faults of strike
slip nature cut across the regional strike of the faults and synclinal structures. Minor slip faults
have also developed in association with these faults at places.
6.4 Intensity of oxidation and radioactivity
It has been observed that while the colour of the rock changes from buff to brown to
grey with stratigraphic depth, the mud clasts in these sandstones, also change in nature. In the
top most units, mud clasts have well developed oxidation haloes whereas the core of the clasts
appear brownish. To the bottom, the haloes gradually reduce and disappear while the core
Increasing Increasing Increasing Increasing Increasing radioactivity radioactivity radioactivity radioactivity radioactivity radioactivity radioactivity radioactivity radioactivity with depth
Well Well Well developed developed developed developed developed developed developed developed developed oxidation oxidation oxidation oxidation oxidation haloe
No No oxidation oxidation oxidation oxidation oxidation haloe
Partially Partially Partially Partially developed developed developed developed developed developed developed oxidation oxidation oxidation oxidation oxidation oxidation oxidation haloe
Mud clast
Mid
dle
-Up
per
Si
wal
ik t
ran
siti
on
Mid
dle
Si
wal
ik
Spotty, low orderSpotty, low orderSpotty, low orderIn Fe
Spotty, low orderIn Fe-
Spotty, low orderSpotty, low orderSpotty, low orderSpotty, low orderSpotty, low orderSpotty, low orderIn Fe-hydroxide bands, mud In FeIn FeIn FeIn FeIn FeIn FeIn FeIn Fe-hydroxide bands, mud hydroxide bands, mud hydroxide bands, mud hydroxide bands, mud hydroxide bands, mud hydroxide bands, mud clasts
DiscontinousDiscontinous patchyDiscontinousDiscontinousDiscontinousDiscontinous patchypatchypatchypatchyCalcareous cemented Calcareous cemented Calcareous cemented Calcareous cemented Calcareous cemented Calcareous cemented Calcareous cemented Calcareous cemented Calcareous cemented Calcareous cemented Calcareous cemented Calcareous cemented Calcareous cemented lenses, mud clasts, lenses, mud clasts, lenses, mud clasts, lenses, mud clasts, lenses, mud clasts, lenses, mud clasts, lenses, mud clasts, lenses, mud clasts, lenses, mud clasts, lenses, mud clasts, lenses, mud clasts, carbonaceous matter
Better continuity and Better continuity and Better continuity and Better continuity and grade
Increasing Increasing Increasing Increasing oxidation
Figure 6.2 Representative diagram showing the variation in the redox condition of mud clasts, sandstones and radioactivity with increasing depth.
46
changes from brown to light grey to dark grey (Figure 6.2). This variation suggests changes in
redox conditions with depth. It is to be noted that the increase in radioactivity with depth also
can be correlated with this change. The activity occurs as spotty and of low order nature near
the surface in the buff sandstones and is associated with the mud clasts and iron oxide bands
whereas with depth, it becomes patchy with improved extend and occurs in mud clasts,
sandstone and with carbonaceous matter.
6.5 Petrography
The clast composition comprising quartz and feldspar clasts, lithic fragments of
sedimentary, metamorphic and igneous origin indicate sediments were derived from felsic
plutonic and metamorphic rocks, and reworked earlier sediments. A subordinate source of
volcanic suites is also recognised from the presence of volcanic clasts. Therefore, a mixing of
source rocks is suggested by the clast mineralogy.
Autoradiography study using CN films suggest that the radioactivity is associated with
carbonaceous matter as well as clay in the matrix component of the sandstone. This is
indicative of U being present mostly in adsorbed form. The presence of oxidation rims around
framboidal pyrite suggests that reduced U may be present at places were activity occur in the
vicinity of framboidal pyrites.
6.6 Geochemical characterisation
Geochemical data suggests that the sandstone samples from Galot -Loharkar area and
Masanbal-Paniali area show slightly distinct characteristics. The sediment source of these rocks
as indicated by the TiO2 vs Al2O3 plot of Amajor (1987) is dominantly granite- granite basalt,
suggestive of mixed source. The presence of lithic fragments of varying rock types observed
in petrographic study correlates well with this observation. The geochemical classification
diagram of discriminates samples from Galot-Loharkar area as litharenites and those from
47
Masanbal-Paniali area as graywackes. This may be attributed to the relatively higher amount
of clayey material present in the matrix of the Masanbal- Paniali sandstone samples. The source
tectonics as revealed from the major oxide plots suggest a transition from passive margin to
active continental margin tectonic regime. The Galot-Loharkar sandstones were sourced from
a passive margin tectonic setting while the Masanbal-Paniali sandstones range from passive to
active margin but dominantly show active continental margin signature. This observation is
well in accordance with the findings from similar works carried out in Siwalik by Kundu et al
(2016), Sinha et al. (2007) and Ranjan and Banerjee (2009).
The low total organic carbon content (TOC < 0.5%) and very low sulphur (< 0.10) in
the studied samples indicate insufficient precipitation of pyrite which is required to provide
reducing conditions for uranium mineralisation.
6.7 Geology, tectonic setting and mineralisation
The transition from Middle Siwalik to Upper Siwalik occurred in consequence with
onset of tectonic activity along the Main Boundary Thrust (MBT) around 5 Ma (Kumar et al.,
2013). The transition from distal to proximal sedimentation near the active thrust front resulted
in the variations observed in the sediment characteristics. The sandstones of Masanbal-Paniali
area stratigraphically overlay those of Galot -Loharkar area and are characterised by the
sediments in the transition zone between the Middle and Upper Siwalik represented by a
sandstone dominated lower part and pebble bed dominated upper part. Geochemical
classification and tectonic discrimination diagram also suggest that the geology of this zone
marks the transition from a passive margin to active continental margin tectonic setting of the
sediment source. The sediments were derived from multiple suites of rocks, as indicated by
petrographic and geochemical data. Decreasing intensity of oxidation and increasing intensity
of radioactivity are observed with stratigraphic depth in this zone. The adsorbed nature of
48
radioactivity observed in petrographic studies indicate that the uranium in remobilised form
was adsorbed by the carbonaceous matter and clay in the matrix of the sandstones. Given the
abundance of clay and disseminated carbonaceous matter in the Middle and Upper Siwalik
sequences, the restricted occurrence of radioactivity along the transition zone may have been
controlled by remobilisation of uranium associated with the tectonic activity along MBT.
49
CHAPTER 7
CONCLUSION
The present study integrating remote sensing, field mapping and laboratory studies has
delineated the lithostructural characteristics of the Middle Siwalik and Middle-Upper Siwalik
transition sediments in the Paniali-Loharkar-Galot tract of Kangra sub-basin. The structural
architecture, the transitional sedimentary sequence, changes in provenance tectonic setting,
variations in radioactivity and oxidation with depth are revealed.
The sedimentary sequence in the area gradually transitions from grey sandstone of Middle
Siwalik to overlying brown to buff sandstones and eventually into pebble beds of Upper
Siwalik. These sediments were sourced from multiple provenance, with tectonic setting
changing from passive margin to active continental margin. Uranium in the transition zone
sediments occurs mainly in adsorbed form with clay and organic matter in the matrix of grey
sandstone, while associated with oxidised framboidal pyrites at places. Organic carbon and
sulphur content in studied samples are in insufficient concentrations for forming typical
sandstone type uranium deposit. But the variation in the intensity of oxidation and radioactivity
with depth in this zone indicates horizons with better continuity and grade of mineralisation
may be concealed below. The transition of the sediment characteristics and inferred source
tectonic settings may be related to the reactivation of Main Boundary Thrust around 5 Ma.
Continued fault propagation in the Himalayan foreland basin resulted in thrusting, faulting and
folding which are manifested majorly as NW-SE trending lineaments including the Barsar
thrust, Jwalamukhi thrust, their associated synclines and NW-SE trending reverse fault. These
later events also have spatially displaced the sediments and the uranium mineralized horizons.
Hence, it is inferred that the uranium mineralisation in the study area is primarily having a
lithological control, while structure has displaced the mineralisation on a later stage.
50
Insights from the present study has created scope for further detailed studies, which
could not be incorporated in this thesis due to timeframe limitations. The presence of clay and
mud clasts, variations in their characteristics observed in field, association of uranium in
adsorbed form suggest that the clay mineralogy be studied in detail. This can involve separation
of clay from the sandstone and analysis using techniques like X-ray Diffraction (XRD) and
Scanning Electron Microscopy (SEM). This can be focused on identifying whether any
particular clay mineral is playing any role in the adsorption of uranium. Heavy mineral
separation and analysis can be adopted for more accurate provenance studies. A focused study
to understand the precipitation of calcite to form cemented lenses within the sandstone can also
be carried out. Whether this process has relation to invasion of fluids into the basin, uranium
mineralisation, and oxidation of sediments can also be studied. Detailed sedimentological
studies in a larger area around the present study area can be taken up for facies analysis. The
role of neotectonics in the area and its effect on uranium mineralisation also command a
detailed study.
51
REFERENCES
Allaby, M. (Ed.). (2013). A dictionary of geology and earth sciences. Oxford University Press, p.660.
Allen, P. A., and Allen, J. R. (2013). Basin analysis: Principles and application to petroleum play
assessment. John Wiley & Sons, p.619.
Alshaghdari, Mohsen. (2017). Geological mapping using open source QGIS.
10.13140/RG.2.2.11978.47045., p.22
Amajor LC (1987) Major and trace element geochemistry of Albian and Turonian shales from the
Southern Benue trough, Nigeria. J Afr. Earth Sci, v.6. pp.633–641.
Baral, S. S., Das, J., Saraf, A. K., Borgohain, S., and Singh, G. (2016). Comparison of Cartosat, ASTER
and SRTM DEMs of different terrains. Asian Journal of Geoinformatics, v.16(1).pp.1-7
Bhatia MR (1983) Plate tectonics and geochemical composition of sandstones. J Geol 91. pp.611–627.
Boileau, V. H., and Kohli, G. (1952). Final report on the geology of the Jawalamukhi area. Kangra
District, Punjab (1), unpublished report of the Geological Survey of India.
Brown, R. L., and Nazarchuk, J. H. (1993). Annapurna detachment fault in the Greater Himalaya of
central Nepal. Geological Society, London, Special Publications, v.74(1), pp. 461-473.
Crawford, A. R. (1974). The Indus suture line, the Himalaya, Tibet and Gondwanaland. Geological
Magazine, v.111(5), pp. 369-383.
Critelli, S., and Ingersoll, R. V. (1994). Sandstone petrology and provenance of the Siwalik Group
(northwestern Pakistan and western-southeastern Nepal). Journal of Sedimentary Research,
v.64(4a), pp.815-823.
Dahlstrom, C. D. (1970). Structural geology in the eastern margin of the Canadian Rocky Mountains.
Bulletin of Canadian Petroleum Geology, v.18(3), pp.332-406.
DeCelles, P. G., and Giles, K. A. (1996). Foreland basin systems. Basin research, v.8(2), pp.105-123.
Decelles, P. G., and Hertel, F. (1989). Petrology of fluvial sands from the Amazonian foreland basin,
Peru and Bolivia. Geological Society of America Bulletin, v.101(12), pp.1552-1562.
Dubey, A. K. (2014). Understanding an orogenic belt. Springer, Heidelberg, New York, Dordrecht,
London.p.401.
52
Dubey, A. K., Bhakuni, S. S., and Selokar, A. D. (2004). Structural evolution of the Kangra recess,
Himachal Himalaya: a model based on magnetic and petrofabric strains. Journal of Asian Earth
Sciences, v.24(2), pp.245-258.
Einsele, G. (2013). Sedimentary basins: evolution, facies, and sediment budget. Springer Science &
Business Media, p.792.
Erharter, G. H., and Palzer-Khomenko, M. (2018). DiGeo: Introduction and a new tutorial to geological
maps with QGIS 3. X. Austrian Journal of Earth Sciences, v.111(2), pp.223-224.
Ghosh, D., Sinha, K.K., Sharma, B.C. and Kothari, P.K. (2017). Annual report for field season 2016-
17. Unpublished Annual Report of Siwalik Investigations, NR, AMD, submitted to AMD,
Hyderabad.
Hassan, S. M., Mahmoud, A. A. A., and El-Mahdy, M. El kazzaz, YA (2014). Automated, manual
lineaments extraction and geospatial analysis using remote sensing techniques and GIS, Case
Study: Gabal Shabrawet area, South Ismailia, Egypt. Australian Journal of Basic and Applied
Sciences, v.8(10), pp.110-120.
Johnson, N. M., Stix, J., Tauxe, L., Cerveny, P. F., and Tahirkheli, R. A. (1985). Paleomagnetic
chronology, fluvial processes, and tectonic implications of the Siwalik deposits near Chinji
village, Pakistan. The Journal of Geology, v.93(1), pp.27-40.
Kaul, R., Umamaheshwar, K., Chandrasekaram, S., Deshmukh, R.D., Swarnkar, B.M., (1993). Uranium
mineralization in the Siwalik of North Western, Himalaya. India. J. Geol. Soc. India, v.41,
pp.243–258.
Kothari, P.K. (2018). Annual Report for field season 2017-18. Unpublished Annual Report of Siwalik
Investigations NR, AMD, submitted to AMD, Hyderabad.p.102.
Kothari, P.K., Sinha, K.K., Gupta, C. S., Ghosh, D., Rahaman, Md. M. and Sharma, B. C. (2017).
Annual report for field season 2016-17. Unpublished Annual Report of Siwalik Investigations,
NR, AMD, submitted to AMD, Hyderabad.p.71.
Kothari, P.K., Sinha, K.K., Gupta, C. S., Ghosh, D., Bhattacharya, S.. and Sharma, B. C. (2019).Brief
Annual report for field season 2018-19. Unpublished Brief Annual Report of Siwalik
Investigations, NR, AMD, submitted to AMD, Hyderabad.p.91.
53
Krishna, R. R., Kishan, D., and Sarup, J. (2015). Lineament extraction and lineament density assessment
of Omkareshwar, MP, India, using GIS Techniques. International Journal of Engineering and
Management Research (IJEMR), v.5(3), pp.717-720.
Kroonenberg SB (1994) Effects of provenance, sorting and weathering on the geochemistry of fluvial
sands from different tectonic and climatic environments. Proceedings of the 29th International
Geological Congress, Part A. Kyoto, Japan, pp.69–81.
Kumar, R., Ghosh, S. K., and Sangode, S. J. (2003). Mio-Pliocene sedimentation history in the
northwestern part of the Himalayan foreland basin, India. Current Science, pp.1006-1013.
Kundu, A., Matin, A., and Eriksson, P. G. (2016). Petrography and geochemistry of the Middle Siwalik
sandstones (tertiary) in understanding the provenance of sub-Himalayan sediments in the Lish
River Valley, West Bengal, India. Arabian Journal of Geosciences, v.9(2),162.p.18.
Leach, D. L., Viets, J. G., and Rowan, L. (1984). Appalachian-Ouachita orogeny and Mississippi
Valley-type lead-zinc deposits. Geological Society of America Abstracts with Programs (Vol.
16), p. 572.
Malik, J. N., and Mohanty, C. (2007). Active tectonic influence on the evolution of drainage and
landscape: geomorphic signatures from frontal and hinterland areas along the northwestern
Himalaya, India. Journal of Asian Earth Sciences, v.29(5-6), pp. 604-618.
Maynard JB, Valloni R, Yu HS (1982) Composition of modern deep sea sands from arc related basins.
Geol Soc Spec Publ, v.10. pp.551–561.
McNaught, M. A., & Mitra, G. (1993). A kinematic model for the origin of footwall synclines. Journal
of Structural Geology, v.15(6), pp.805-808.
Medlicott, H.B. (1865). On the geological structure and relations of the southern portion of the
Himalayan ranges between the rivers Ganges and Ravee. Mem. geol. Surv. India, v.3 (2), pp.1-
206.
Miall, A. D. (2000). Principles of sedimentary basin analysis. Springer, p.616
Moghal, M. Y. (2001). Current uranium activities in Pakistan (No. IAEA-TECDOC--1258). IAEA.
pp.101-115.
54
Oliver, J. (1986). Fluids expelled tectonically from orogenic belts: Their role in hydrocarbon migration
and other geologic phenomena. Geology, v.14(2), pp. 99-102.
Osterwald, F. W., and Dean, B. G. (1961). Relation of uranium deposits to tectonic pattern of the central
Cordilleran foreland (No. 1087). US Government Printing Office, pp.337-390.
Pascoe, E. H. (1964). A Manual of the Geology of India and Burma, vol. 3. Government of India Press,
Calcutta, pp.1345-2130.
Pilgrim, G. E. (1910). Preliminary note on a revised classification of the Tertiary freshwater deposits
of India. Records of the Geological Survey of India, v.40, pp.185-205.
Pilgrim, G. E. (1913). Correlation of the Siwalik with Mammal Horizon of Europe. Records of the
Geological Survey of India, v.24(2), pp.1-129.
Powers, P. M., Lillie, R. J., and Yeats, R. S. (1998). Structure and shortening of the Kangra and Dehra
Dun reentrants, sub-Himalaya, India. Geological Society of America Bulletin, v.110(8), pp.
1010-1027.
Rahaman, Md. M., Sharma, B. C. and Gupta, C. S. (2017). Annual report for field season 2016-17.
Unpublished Annual Report of Siwalik Investigations, NR, AMD, submitted to AMD,
Hyderabad.
Raiverman, V., Srivastava, A. K., and Prasad, D. N. (1993). On the foothill thrust of northwestern
Himalaya. Journal of Himalayan Geology, v.4(2), pp.237-256.
Raiverman, V., Srivastava, A. K., and Prasad, D. N. (1994). Structural style in northwestern Himalayan
foothills. Him. Geol. v.15. pp.263-280.
Raiverman, V. (2002). Foreland sedimentation in Himalayan tectonic regime. A relook at the orogenic
process. Bishen Singh Mahendra Pal Singh Publication, Dehradun. p.371.
Ranjan N, Banerjee DM (2009) Central Himalayan crystallines as the primary source for the sandstone-
shale suites of the Siwalik group: new geochemical evidence. Gondwana Res, v.16, pp.687–
696.
Roser BP, Korsch RJ (1986) Determination of tectonic setting of sandstone-mudstone suites using SiO2
content and K2O Na2O ratio. J Geol, v.9, pp.635–650.
55
Sangode, S. J. (1996). Magnetic polarity stratigraphy; the Siwalik sequence of Haripur area (HP), NW
Himalaya. J. Geol. Soc. India, v.47, pp.683-704.
Schwab, F.L. (1986) Sedimentary "signatures" offoreland basin assemblages: real or counterfeit? In:
Allen PA, Homewood P (eds) Foreland basins. Int. Assoc. Sedimentologists Spec Publ, v.8,
Blackwell, Oxford, pp. 395-410.
Sinha S, Islam R, Ghosh SK, Kumar R, Sangode J (2007) Geochemistry of Neogene Siwalik mudstones
along Punjab re-entrant, India: implications for source-area weathering, provenance and
tectonic setting. Curr Sci India, v.92, pp. 1103–1113.
Takorabt, M., Toubal, A. C., Haddoum, H., and Zerrouk, S. (2018). Determining the role of lineaments
in underground hydrodynamics using Landsat 7 ETM+ data, case of the Chott El Gharbi Basin
(western Algeria). Arabian Journal of Geosciences, v.11(4), pp.76.
Tandon, S. K., Kumar, R., Koyama, M., and Niitsuma, N. (1984). Magnetic polarity stratigraphy of the
Upper Siwalik subgroup, east of Chandigarh, Punjab sub-Himalaya, India. J. Geol. Soc. India,
v.25(1), pp.45-55.
Valdiya, K. S. (1977). Structural set-up of the Kumaun Lesser Himalaya. C, Jest (ed.), Himalaya :
Sciences de la Terre, Colloq. Int. C.N.R.S., v.268, pp. 449-462.
Valdiya, K. S. (1980). The two intracrustal boundary thrusts of the Himalaya. Tectonophysics, v.66(4),
pp.323-348.
Valdiya, K. S., Joshi, D. D., Sanwal, R., and Tandon, S. K. (1984). Geomorphologic development across
the active main boundary thrust, an example from the Nainital Hills in Kumaun Himalaya.
Journal of the Geological Society of India, v.25(12), pp.761-774.
Valdiya, K. S. (1989). Trans-Himadri intracrustal fault and basement upwarps. Tectonics of the Western
Himalaya, v.232, pp.153-168.
Veeraswamy, K., Sharana, B., Naidu, D., and Harinarayana, T. (2010). Electrical structure across lesser
and higher NW Himalaya, India. Chinese Journal of Geophysics, v.53(3), pp.576-584.
Wyborn, L. A. I., Heinrich, C. A., and Jaques, A. L. (1994). Australian Proterozoic mineral systems:
essential ingredients and mappable criteria. AusIMM Annual Conference (Vol. 1994), pp. 109-
115.