Embed Size (px)
Citation preview

Estimating Markovian Switching
Regression Models in
An application to model energy
price in Spain
S. Fontdecaba, M. P. Muñoz , J. A. Sànchez*
Department of Statistics and Operations Research
Universitat Politècnica de Catalunya - UPC
The R User Conference 2009July 8-10, Agrocampus-Ouest, Rennes, France

Markovian Switching Models. An application to model energy price in Spain
1 Introduction & Objectives 3 Data2 Methodology 4 Results 5 Conclusions
2
1. Introduction & Objectives
2. Methodology
3. Application to energy price
4. Results
5. Conclusions
Outline
1 Introduction & Objectives

Markovian Switching Models. An application to model energy price in Spain
1 Introduction & Objectives 3 Data2 Methodology 4 Results 5 Conclusions
3
1. Introduction
1 Introduction & Objectives
The model we consider is of the MARKOVIAN SWITCHING (MS) type, originally defined by Hamilton (1989).
•MSVAR library - Krolszing (1998) (not available free acces: OX)
•MSVARlib - Bellone (2005) (Less user friendly)
•MSRegression - Perlin (2007) (Libraries in Matlab)

Markovian Switching Models. An application to model energy price in Spain
1 Introduction & Objectives 3 Data2 Methodology 4 Results 5 Conclusions
4
1 Introduction & Objectives
1. Objectives1. Built a set of functions to explain time series
according to a Markovian Switching Regression model.
2. Resolution of the problems during the estimation of the Markovian Switching models.
3. Application of Markovian Switching models in energy price in Spain according to the demand, raw material prices and financial indicators.

Markovian Switching Models. An application to model energy price in Spain
1 Introduction & Objectives 3 Data2 Methodology 4 Results 5 Conclusions
2. Markovian Switching
SWITCHING
P(St=i | St-1=j, St-2=k,…,S1=k)=
P(St=i | St-1=j) -t=1 t=2
t=3
t=4
t=5t=6
t
SK(…)
S1 S2
S1S2
SK
(…) (…)
MARKOVIAN
2 Methodology

Markovian Switching Models. An application to model energy price in Spain
1 Introduction & Objectives 3 Data2 Methodology 4 Results 5 Conclusions
6
2. Markovian Switching
S1 S2
p12
p21Price=f1(X1, X2, X3, X4,…, Xk)
t
S1
S2
p11
p22
2 Methodology
Price=f2(X1, X2, X3, X4,…, Xk)

Markovian Switching Models. An application to model energy price in Spain
1 Introduction & Objectives 3 Data2 Methodology 4 Results 5 Conclusions
7
2. Markovian SwitchingS : Number of states
VARIABLES WITH SWITCHING EFFECT VARIABLES WITHOUT SWITCHING EFFECT
Parameters of the model to estimate:
Deviations of the states:
Coefficients of the regression with Switching effect :
Coefficients of the regression without Switching effect :
Transition probabilities:
2 Methodology

Markovian Switching Models. An application to model energy price in Spain
1 Introduction & Objectives 3 Data2 Methodology 4 Results 5 Conclusions
8
Dependent variable (Pt)
2 Methodology
Independent variables (X’s)
Number of states (S)
INPUT (user)
Switching Indicator
MODEL FITTING
Parameters Estimation (θ)
For each time instant…
- State Assignation- Probability assignment
in each state
OUTPUT
- Evolution of State assignation with probabilities
Num
eric
Gra
phic
LM� Perlin (2005)

Markovian Switching Models. An application to model energy price in Spain
1 Introduction & Objectives 3 Data2 Methodology 4 Results 5 Conclusions
9
2 Methodology
Model Likelihood:
∑∑=
Π
==ΘT
tS tttt
TTTT
SPXSyf
XyfXyL
1
:1:1:1:1
)|(),,,|(
),,|(),;(
σβ
σβ
Model parameters:
),,( Π=Θ σβ
The state S is a non-observable latent variable �Likelihood = marginal of the conjoint density for y and S

Markovian Switching Models. An application to model energy price in Spain
1 Introduction & Objectives 3 Data2 Methodology 4 Results 5 Conclusions
10
2 Methodology
In this case, the functional dependence between y and Xcorresponds to a linear model (OLS)
),(~,,| 2IXNXy σβσβ
),(~,,,|2)()( IXNXSy SS σβσβ
Conditioning on the state S means a different set of parameters for each state.
Other set-up can be considered:- Extending predictors �Autoregressive models- Modifying response distribution �Generalized LM- More complex functional dependence� Non-linear models

Markovian Switching Models. An application to model energy price in Spain
1 Introduction & Objectives 3 Data2 Methodology 4 Results 5 Conclusions
11
3. Application – Energy priceElectricity markets are characterized by:
� inelasticity of the demand� impossibility of storage� Seasonality character: fluctuations of demand due to
weather conditions and human habits
3 Data
In the last decade, the issue of modeling and forecasting prices had been the key question to:
� determine the causes of price behavior� Macroeconomic significance of the prices of raw
materials. Spain is an importer country

Markovian Switching Models. An application to model energy price in Spain
1 Introduction & Objectives 3 Data2 Methodology 4 Results 5 Conclusions
12
3. Application – Energy priceThe objective of the application is to identify the influence
on the energy price of:
� the demand� the price of the raw materials� financial information of the markets
during different states of its evolution.
Development of an R Code to estimate MSM
3 Data

Markovian Switching Models. An application to model energy price in Spain
1 Introduction & Objectives 3 Data2 Methodology 4 Results 5 Conclusions
3. DataData from January 1, 2002 to October 31, 2008 (daily data– working days: Monday to Friday)
ENERGY RAW MATERIALS FINANCIAL
• Average price ofenergy
(Cent/Kw.h)
• Daily demand ofenergy(GWh)
• Exchange Ratebetween Dolar -
Euro(USD-Euro)
• Ibex 35 Index
• Oil Price(€/barril)
• Gas Price(€/MW.h)
• Coal Price(€/T)
• Price of CO2
Allowances (€/T)
3 Data
13
� Bierbrauer, Truck and Weron (2006)� Amano and Norden (1998); Zachmann (2007)

Markovian Switching Models. An application to model energy price in Spain
1 Introduction & Objectives 3 Data2 Methodology 4 Results 5 Conclusions
3. Data
Anys
Cent
/kw
.h
2002 2003 2004 2005 2006 2007 2008 2009
24
68
10
Anys
GW
h
2002 2003 2004 2005 2006 2007 2008 2009
500
600
700
800
900
Anys
€/B
arril
2002 2003 2004 2005 2006 2007 2008 2009
2030
4050
6070
8090
Anys
€/M
Wh
2002 2003 2004 2005 2006 2007 2008 2009
020
4060
80
Anys
€/T
2002 2003 2004 2005 2006 2007 2008 2009
4060
8010
012
014
0
Anys
€/T
2002 2003 2004 2005 2006 2007 2008 2009
05
1015
2025
30
PRICE
DEMAND
IBEX
USD-€
GAS
OIL
COAL
CO2
Anys
2002 2003 2004 2005 2006 2007 2008 2009
0.7
0.8
0.9
1.0
1.1
Anys
2002 2003 2004 2005 2006 2007 2008 2009
6000
8000
1000
012
000
140
0016
000
¡¡ NO!!
0.79
0.78
-0.73
3 Data
>ts.plot(data)

Markovian Switching Models. An application to model energy price in Spain
1 Introduction & Objectives 3 Data2 Methodology 4 Results 5 Conclusions
15
4. Estimation ProcedureMAXIMUM LIKELIHOOD ESTIMATION OF THE PARAMETERS
1. How to determine starting values:Considering “No switching”
• Same model under both regimes• Probability of change equal to 0.5
� Estimate linear model (OLS) with all the observations
Number of parameters: 18 Convergence not assured!!
4 Results

Markovian Switching Models. An application to model energy price in Spain
1 Introduction & Objectives 3 Data2 Methodology 4 Results 5 Conclusions
4. Results
4 Results
β Estim. Std.Error
βConst. -9.046 0.54006***
βDemand -0.0090 0.0004***
βOil 0.0832 0.0037***
βGas 0.0420 0.0039***
βCoal -0.00819 0.00201
βUSD/E 6.059 0.3646***
βIbex35 -0.0001 0.00001***
σ=1.06R2=0.57

Markovian Switching Models. An application to model energy price in Spain
1 Introduction & Objectives 3 Data2 Methodology 4 Results 5 Conclusions
17
4. Estimation ProcedureMAXIMUM LIKELIHOOD ESTIMATION OF THE PARAMETERS
2. Non-linear optimization (Newton-Raphson)
Evaluation of the likelihood of the model
� Function optim to find MLE
4 Results
3. Expectation step for St
Calculate the Expectation of St under the current estimates of the parameters
� Assign each observation to one of the states
4. Maximization step for parametersConditioning on the values for St, obtain new estimates
� Estimate linear model (OLS) for each state
� go to step 2 until convergence
EMAlg.

Markovian Switching Models. An application to model energy price in Spain
1 Introduction & Objectives 3 Data2 Methodology 4 Results 5 Conclusions
4. Numerical Results
4 Results
State=1 ------- Coefficients: Estimate Std. Error t value Pr(>|t|) (Intercept) -9.575e+00 6.425e-01 -14.901 < 2e-16 *** Demanda 1.115e-02 5.601e-04 19.898 < 2e-16 *** Petroli 8.161e-02 4.924e-03 16.575 < 2e-16 *** Gas 2.192e-02 4.212e-03 5.204 2.44e-07 *** Carbo 1.406e-03 2.097e-03 0.670 0.503 EurDol 6.219e+00 4.189e-01 14.844 < 2e-16 *** Ibex35 -1.850e-04 2.337e-05 -7.918 7.30e-15 *** --- Signif. codes: 0 ‘***’ 0.001 ‘**’ 0.01 ‘*’ 0.05 ‘. ’ 0.1 ‘ ’ 1 Residual standard error: 0.8421 on 873 degrees of f reedom Multiple R -squared: 0.6648, Adjusted R-squared: 0.6625 Residuals: Min 1Q Median 3Q Max -1.90943 -0.35887 -0.01232 0.37846 1.53960 State=2 ------- Coefficients: Estimate Std. Error t value Pr(>|t|) (Intercept) -7.361e+00 3.751e-01 -19.623 < 2e-16 *** Demanda 5.301e-03 3.155e-04 16.799 < 2e-16 *** Petroli 5.371e-02 2.539e-03 21.151 < 2e-16 *** Gas 2.338e-02 3.148e-03 7.428 2.57e-13 *** Carbo 1.350e-02 1.613e-03 8.371 < 2e-16 *** EurDol 5.106e+00 2.566e-01 19.902 < 2e-16 *** Ibex35 -2.486e-05 9.812e-06 -2.534 0.0115 * --- Signif. codes: 0 ‘***’ 0.001 ‘**’ 0.01 ‘*’ 0.05 ‘. ’ 0.1 ‘ ’ 1 Residual standard error: 0.5229 on 897 degrees of f reedom Multiple R -squared: 0.8105, Adjusted R-squared: 0.8093
Transition Matrix -----------------
1 2 1 0.9715 0.0487 2 0.0284 0.9512
Likelihood: 1875.747 Pooled Residuals: Residual standard error: 0.69659 on 1770 degrees of freedom Multiple R -squared: 0.816691
Model under State 1
Model under State 2
Transition Matrix

Markovian Switching Models. An application to model energy price in Spain
1 Introduction & Objectives 3 Data2 Methodology 4 Results 5 Conclusions
4. Numerical Results
4 Results
β Estim. Std.Error
βConst. -9.575 0.6421***
βDemand 0.0115 0.0005***
βOil 0.08161 0.0049***
βGas 0.02192 0.0049***
βCoal 0.00014 0.0021
βUSD/E 6.219 0.418***
βIbex35 -0.0008 0.00001***
β Estim. Std.Error
βConst. -7.3610 0.37515***
βDemand 0.005301 0.0003***
βOil 0.05371 0.00253***
βGas 0.0238 0.0031***
βCoal -0.01352 0.00162***
βUSD/E 5.1062 0.256***
βIbex35 -0.00002 0.00009***
σ=0.842 R2=0.66 σ=0.52 R2=0.81
Markovian Switching Models. An application to model energy price in Spain
1 Introduction & Objectives 3 Data2 Methodology 4 Results 5 Conclusions
20
4. Graphical Results2
- E
stat
0 500 1000 1500
0.0
0.2
0.4
0.6
0.8
1.0
2002 2003 2004 2005 2006 2007 2008
dep
0 500 1000 1500
24
68
10 2002 2003 2004 2005 2006 2007 2008
4 Results

Markovian Switching Models. An application to model energy price in Spain
1 Introduction & Objectives 3 Data2 Methodology 4 Results 5 Conclusions
21
4. Graphical Results
mod
$e[,
1]
0 500 1000 1500
-4-2
02
46
4 Results
Markovian Switching Models. An application to model energy price in Spain
1 Introduction & Objectives 3 Data2 Methodology 4 Results 5 Conclusions
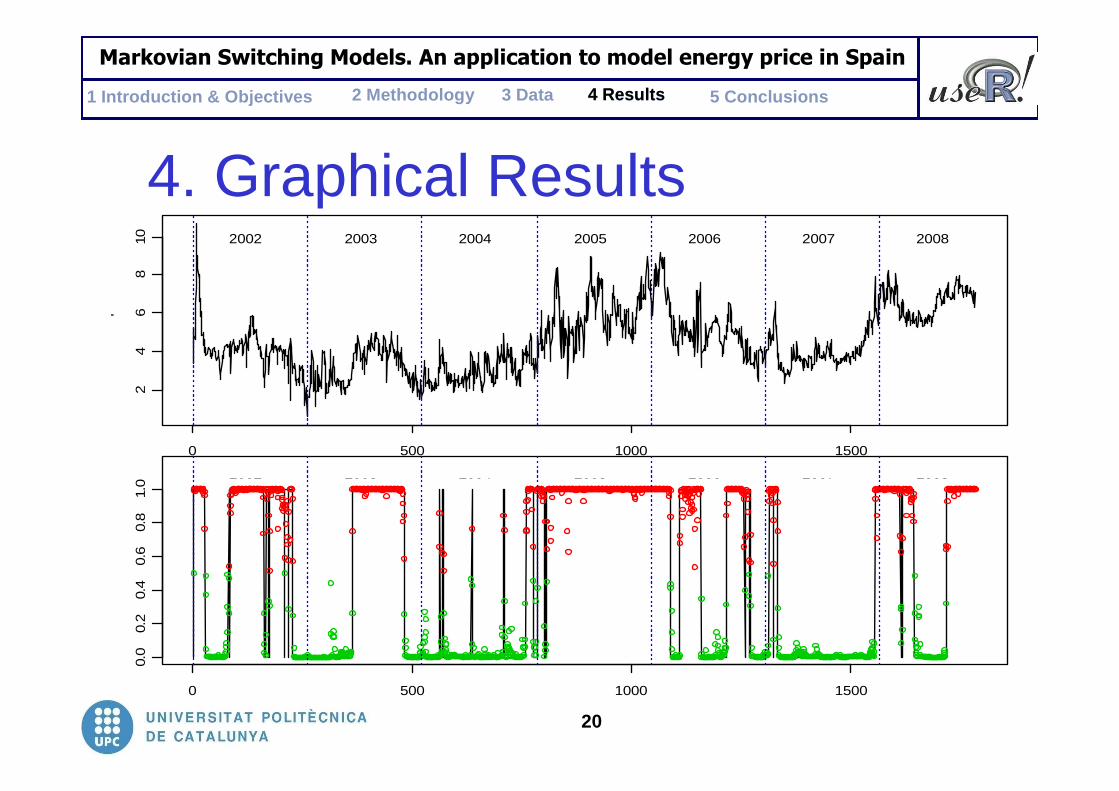
22
4. Results
2 -
Est
at
0 500 1000 1500
0.0
0.2
0.4
0.6
0.8
1.0
2002 2003 2004 2005 2006 2007 2008
EconomicRecession
Rising Oil Prices
Tsunami
Atypical Situation. Weather Cause
Gulf War. Iraq War.
“The Corralito”Yukos
4 Results

Markovian Switching Models. An application to model energy price in Spain
1 Introduction & Objectives 3 Data2 Methodology 4 Results 5 Conclusions
23
5. Conclusions
5 Conclusions & FR
1. Detection of a model that is not constant over the time
2. Implementation of a estimation methodology for Markovian Switching models (2 states) using
3. Relationship between states changes of price and USD-Euro and Ibex35
4. State changes in energy price caused by different movements in raw materials price ( oil and gas).

Markovian Switching Models. An application to model energy price in Spain
1 Introduction & Objectives 3 Data2 Methodology 4 Results 5 Conclusions
24
5. Future Lines
1. Reaction time on the market: Introduce some lags information of explanatory variables.
2. Autoregressive terms: Introduce previous prices as explanatory variables.
3. Orthogonal Model: Consider the components of PCA and FA as explanatory variables.
4. Flexibility of the model: Check the need of switching effect. Increase the number of states.
5 Conclusions & FR
Work on the routines to be a unique function that allows to the user:

Markovian Switching Models. An application to model energy price in Spain
1 Introduction & Objectives 3 Data2 Methodology 4 Results 5 Conclusions
25
ReferencesBierbrauer, M., Trück, S., Weron, R., 2003. “Modeling Electricity Prices
with Regime Switching Models”, Phisica A 336, 39-48.
Hamilton, J., 2005. “Regime Swtiching Models”, La Jolla CA 92093-0508.
Goldfeld, S., Quantd, R., 2005. “A Markov model for switching Regression”,Journal of Econometrics 135, 349-376.
Perlin, M., 2007. “Estimation, Simulation and Forecasting of a Markov Switching Regression”, (General case in Matlab).
Zachmann, G., 2006. “A Markov Switching model of the merit order to compare British and German Price formation”, Discussion paper. German Institute for Economics Research
5 Conclusions & FR

Markovian Switching Models. An application to model energy price in Spain
1 Introduction & Objectives 3 Data2 Methodology 4 Results 5 Conclusions
Thank youuse ’s!