Embed Size (px)
Citation preview
Estimating the Effects of Higher Coupon Face Values on the Timing of Redemptions, the Mix of Coupon Redeemers, and Purchase Quantity Aradhna Krishna Columbia University
Robert W. Shoemaker New York University
ABSTRACT
One of the key decisions a manager must make in designing a coupon promotion is to decide on the face value. In this study we examine the effects of higher face values on coupon redemption timing, category purchase timing, the mix of buyers who redeem the coupon, and purchase quantity. Data from a field experiment on coupon face values are used to test the hypotheses. A new method of measuring the effects of a coupon on category purchase timing is proposed. We find that coupons per se tend to advance category purchase timing, but higher face values do not increase the magnitude of this effect. Surprisingly, higher face values appear to increase redemption rates for both the prior nonbuyers and prior buyers of the brand in a similar way. However, higher face values have little effect on the package size purchased, the number of units purchased, or the total quantity (package size times units) purchased. 0 1992 John Wiley & Sons, Inc.
Psychology & Marketing Vol. 9(6): 453-467 (November/December 1992) 0 1992 John Wiley & Sons, Inc. CCC 0742-6046/92/060453-15
453
The distribution of coupons in the U.S. increased by 28% from 1984 to 1989, reaching a new level of 163.2 billion in 1989 (A. C. Nielsen Com- pany, 1989). One of the key issues faced by both managers and retailers in designing these coupon promotions is to decide on the face value. The decision is not simple, because these managers seek to achieve a wide variety of goals through the use of coupons. These goals include: increasing brand or store sales, attracting new users to the brand or store, gaining market share, countering the introduction of a compet- itive brand or store by building consumer inventory, supporting wider distribution of their brand in retail outlets, encouraging repeat pur- chase of a brand, or building store traffic (Bowman, 1980; Eldred, 1989; Klein, 1981; Neslin, Henderson, & Quelch, 1985).
It might be expected that each of these goals is better achieved by offering a higher face value coupon, and that the dilemma for the man- ufacturer or retailer arises because of the higher costs of the higher face value coupon. However, this assumption has not been fully tested. We wish to examine how higher coupon face values may or may not provide assistance to managers in achieving some of their goals.
The existing research on coupon face values has concentrated pri- marily on the effects of coupon face value on redemption rate or on incremental purchases. The studies by Riebstein and Traver (1982) and Ward and Davis (1978) show that higher coupon face values increase coupon redemption rates but not in proportion to the increase in face value. Bawa and Shoemaker (1989) and Irons, Little, and Klein (1983) show that incremental sales per household (that received the coupon) are slightly higher for increased face value. In addition, Neslin and Clarke (1987) showed that the likelihood of affecting trial is higher for higher face values.
In this study we examine the effects of coupon face value on the timing of redemption purchases, the timing of category purchases, the mix of coupon redeemers, and purchase quantity. These issues are im- portant for determining when a coupon promotion will affect consumer sales, whether it will cause consumers to temporarily stock up on the product class, and whether the higher face value coupons will primarily be redeemed by existing brand buyers or former nonbuyers of the brand.
In particular, this study addresses the following questions:
1. How does the time to redeem the coupon vary by the coupon face value?
2. Do differences in face value have any effect on category purchase timing?
3. Do higher face values help bring in a higher proportion of con- sumers with a lower prepurchase probability for the brand than lower face value coupons?
4. Do differences in the coupon face value affect the quantity pur- chased of the promoted brand?
454 KRISHNA AND SHOEMAKER
We first develop the hypotheses. Next we describe the data and meth- odology that were used to test the hypotheses. The data are from a field experiment on coupon face values, and appear to be highly suitable for estimating the effects of higher face values. Then we report the results and implications of the study.
HYPOTHESES DEVELOPMENT
We consider those types of coupons (for brand A) that can be redeemed for the purchase of any size of brand A and which do not require the purchase of multiple packages. These characteristics appear to hold for the majority of manufacturer-distributed coupons.
Predicted Effects of Higher Face Values on Redemption Timing Our examination of manufacturer coupons suggests that most manu- facturer coupons are distributed with (a) redemption dates that are several months long. Other coupons, such as many store coupons, are redeemable only (b) within a short time period or (c) in a specific week. The focus in this article is on case (a).
With long expiration dates specified on the coupon, some consumers may still want to use the coupon early for fear of forgetting i t or losing it. They might be more concerned about this if the coupon was for a higher face value.
This suggests that
HI: The number of product class shopping trips from the date of cou- pon delivery until the date of coupon redemption will be less for coupons with higher face values.
Predicted Effects of Higher Face Values on Category Purchase Timing Category purchase time refers to the time between successive purchases of the category or product class. With a redemption period of several months specified on the coupon, some consumers might hold the coupon until the category inventory was low and they were going to make a purchase of the category anyway. However, some other consumers might decide to redeem the coupon and buy the product class sooner, for fear of losing or forgetting the coupon. Thus, it is hypothesized that:
H2: In the aggregate, coupons cause consumers to purchase the prod- uct category sooner than they would without the coupon.
H,: The average decrease in time from coupon delivery to buying the product category (averaged over all coupon redeemers) is greater for a coupon with a higher face value.
COUPON FACE VALUE 455
In this article we measure category timing effects due to brand A coupons by considering the timing of purchases for any brand in the product class. The reader is referred to research on promotions and timing by Blattberg, Eppen, and Lieberman (19811, Shoemaker (19791, and Neslin et al. (1985) for related examples of this procedure.
The potential effects of higher face values on shopping trips until redemption and on category purchase timing may be related. However, these two measures relate to different aspects of coupon response. For example, a higher value coupon for brand A could cause some consumers to purchase the product class (any brand) a t their normal interval, but to switch brands (to brand A) sooner and redeem the brand A coupon on an earlier shopping trip than would occur with a lower face value coupon. In this case, HI would be supported but not H3. Conversely, it is also possible that delivery of a higher value coupon could serve as a stimulus or reminder to buy the product class sooner (H,) but not cause buyers to redeem the brand A coupon on an earlier shopping trip than would occur with a lower face value. Although this latter event is log- ically possible, it appears less likely to be observed.
Predicted Effects of Higher Face Values on the Mix of Redeemers
The empirical findings on coupon redemption rates (A. C. Nielsen Com- pany, 1979) indicate that redemption rates increase as the face value increases within certain ranges. An important question for managers is how this increase occurs. Is it a result of higher redemptions among those who had been using the promoted brand, or of higher redemptions among those who generally had not been buying the brand? (See Kuehn & Rohloff, 1967, pp. 70-73.)
Cunningham (1956) addressed this question and concluded that “. . . purchasing on deals tends to be concentrated among those with low brand loyalties.” [Neslin and Shoemaker (198911 studied a related ques- tion for price promotions (retail shelf price reduction) of regular and instant coffee. They found that a price promotion attracted a higher percentage of buyers who had a low probability of buying the brand when it was not on promotion.
By a similar line of reasoning, we expect the higher face value cou- pons to be more effective in attracting nonloyal buyers, that is, those with lower prepromotion purchase probabilities (PPP,). This suggests the following hypothesis:
H,: The average prepromotion purchase probability of those who re- deem a high value coupon will be lower than for those who redeem a low value coupon.
456 KRISHNA AND SHOEMAKER
That is, we would expect a high value coupon to attract a larger pro- portion of new triers or infrequent purchasers of brand A than would a low value coupon.
Predicted Effect of Coupons on Purchase Quantity We hypothesize that coupons will have no effect on purchase quantity. This premise is based upon the following reasoning. A change in pur- chase quantity may result from either a change in the number of units (i.e. number of packages) purchased, a change in the package size pur- chased, or both. These two aspects of purchase quantity are considered separately.
Package Size. One argument for expecting no change is that the con- sumer might remain loyal to a preferred package size (Guadagni & Little, 1983; Kuehn & Rohloff, 1967) and might use the coupon savings to reduce the required cash outlay on the shopping trip. That is, the consumer would pocket the savings. If a consumer reasoned this way, a larger coupon face value would have no effect on the package size purchased.
An alternative argument is that some households might like to buy a larger package size of brand A but are constrained from doing so by a budget constraint. A higher face value coupon would enable these households to purchase a larger package size.
A third argument is that some consumers might redeem the coupon for a smaller package size. This would result in a higher percentage price reduction than would occur if the coupon was redeemed on the consumer’s regular package size. The consumer could then buy several smaller packages with coupons over time. One might expect more of this behavior if coupons for this brand were frequently distributed.
Evidence on how consumers reason on this topic is limited. However, the existing empirical evidence on package-size loyalty suggests the following exploratory hypothesis:
H5: Coupon purchases of brand A are of the same package size as nonpromotion purchases of brand A made by the same household, irrespective of the face value of the coupon.
Number of Units. Because the consumer normally receives only one coupon for brand A at a time, the coupon can only be used to reduce the price for one unit of brand A. This is in contrast to the case of price promotions, where the price savings can be achieved on each unit pur- chased. Thus a coupon appears to provide little or no incentive to pur-
COUPON FACE VALUE 457
chase more units of brand A than would be purchased if brand A were purchased without a coupon.
H,: Individual households will tend to purchase the same number of units of brand A on a coupon redemption purchase as they do on a nondeal purchase of brand A, irrespective of the face value of the coupon.
DATA AND METHODOLOGY
Field Experiment
The hypotheses are tested using data previously collected in a field experiment for a frequently purchased product class.' The original ex- periment was designed to estimate the relative effectiveness of three coupon face values for a mature brand. These same data also appear to be highly suitable for testing the hypotheses in this study. A scanner panel of 5192 households was used for the experiment. Of the 5192 households, 4887 were purchasers of the product class in a 36-week period, which indicates that most households use this consumer product class. The average purchase cycle is less than three weeks.
Before the test coupons were mailed, three groups of panel households were selected and matched on total purchasing of the product class, and of the test brand. Following a pretest period of 24 weeks, a low, medium, or high valued coupon was mailed to the three groups, respectively.2
The data from this experiment appear to be particularly suitable for this study, because it is known that one brand A coupon was mailed to each household in the sample on the same day, and the date of the coupon delivery is known. This permits one to observe brand choices and purchase quantities by face value of the coupon, and to observe the time from coupon delivery to redemption. The coupon did not require purchase of multiple units of the brand or of a larger package size. The expiration date was more than six months after the delivery date.
The potential effects of promotions by other brands were evaluated by counting the number of promotional purchases (excluding redemp- tions for the direct-mail coupons in the test) made during each of the 36 weeks. The total number of purchases made with competitive pro- motions was relatively constant over the 36 weeks. In particular, no distinct changes in the level of competitive promotions occurred at the delivery time for the test coupons.
'The experiment was conducted by Information Resources, Inc. for a firm that requests anonymity. At the firm's request, the brand name and product class are not identified. The same data were used in a study by Bawa and Shoemaker (1987), and further details on the data are provided on pages 372-373.
2The coupon face values are in the ratio of 1.0, 1.4, and 2.0.
458 KRISHNA AND SHOEMAKER
FINDINGS
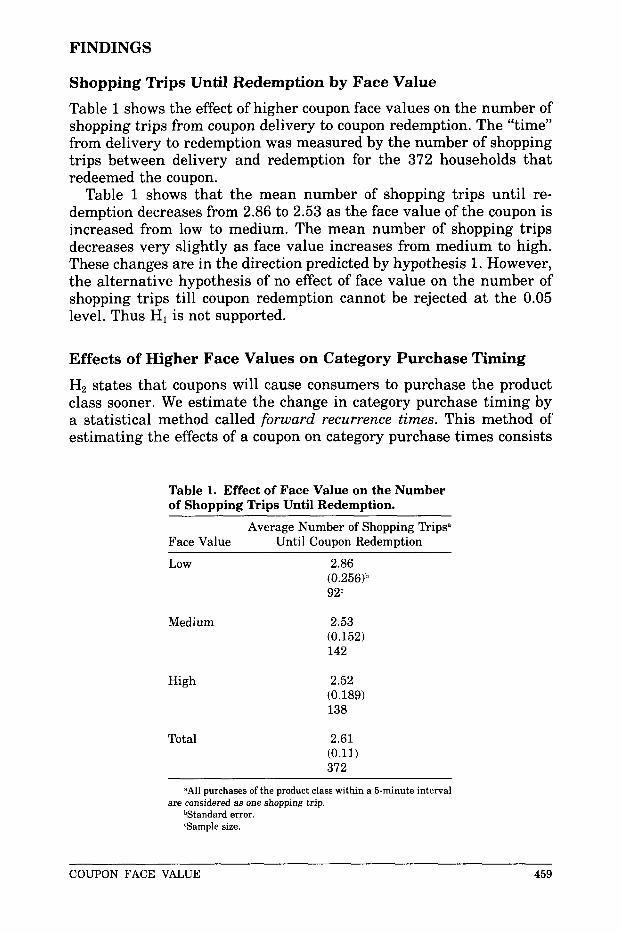
Shopping Trips Until Redemption by Face Value Table 1 shows the effect of higher coupon face values on the number of shopping trips from coupon delivery to coupon redemption. The “time” from delivery to redemption was measured by the number of shopping trips between delivery and redemption for the 372 households that redeemed the coupon.
Table 1 shows that the mean number of shopping trips until re- demption decreases from 2.86 to 2.53 as the face value of the coupon is increased from low to medium. The mean number of shopping trips decreases very slightly as face value increases from medium to high. These changes are in the direction predicted by hypothesis 1. However, the alternative hypothesis of no effect of face value on the number of shopping trips till coupon redemption cannot be rejected at the 0.05 level. Thus HI is not supported.
Effects of Higher Face Values on Category Purchase Timing H, states that coupons will cause consumers to purchase the product class sooner. We estimate the change in category purchase timing by a statistical method called forward recurrence times. This method of estimating the effects of a coupon on category purchase times consists
Table 1. Effect of Face Value on the Number of Shopping Trips Until Redemption.
Average Number of Shopping Trips” Face Value Until Coupon Redemption
Low 2.86 (0.256P 92‘
Medium
High
Total
2.53 (0.152) 142
2.52 (0.189) 138
2.61 (0.11) 372
“All purchases of the product class within a 5-minute interval
%tandard error. ‘Sample size.
are considered as one shopping trip.
COUPON FACE VALUE 459
of two steps. Step 1 is to pick an arbitrary point in time, such as April 3. Step 2 is to count the days to the first occurrence of a coupon or noncoupon purchase. Here, we are estimating parameters of event pro- cesses not from data on the time between events, but rather from data on time between a random point of interruption (which is independent of the occurrence of events) and the first subsequent event. This ap- proach has been given many names, such as mean residual lifetime and forward or backward recurrence times (Allison, 1985).
To measure the effect of “deals,” price promotions or coupons, on category purchase time, researchers have often compared the mean time between nondeal purchases to the mean time between a deal purchase and the prior or subsequent purchase (e.g., Blattberg et al., 1981; Neslin et al., 1985; Shoemaker, 1979). The reason for using forward recurrence times in this study is that a large proportion of coupons are not redeemed on the first category purchase after coupon delivery. In these cases the time between coupon redemption and the prior category purchase would not cover the time between coupon delivery and coupon redemption. Consequently, it may not indicate the effect of coupon delivery on cat- egory purchase timing.
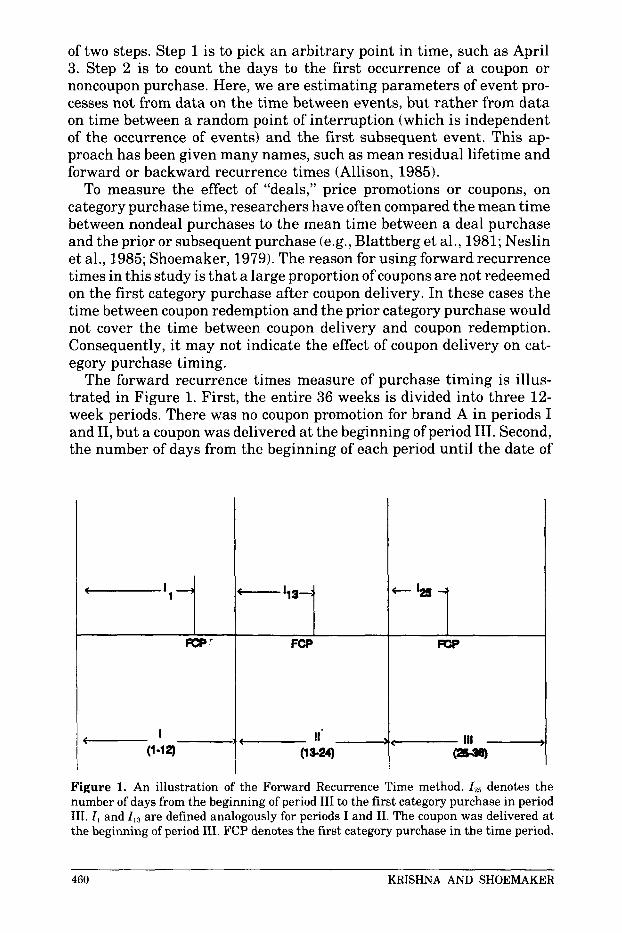
The forward recurrence times measure of purchase timing is illus- trated in Figure 1. First, the entire 36 weeks is divided into three 12- week periods. There was no coupon promotion for brand A in periods I and 11, but a coupon was delivered at the beginning of period 111. Second, the number of days from the beginning of each period until the date of
-‘1+
pcp’
, I - (1-12)
-‘13+ - 125 4 FCP mP
< II’ > <-, 111 (1 su) M
460 KRISHNA AND SHOEMAKER
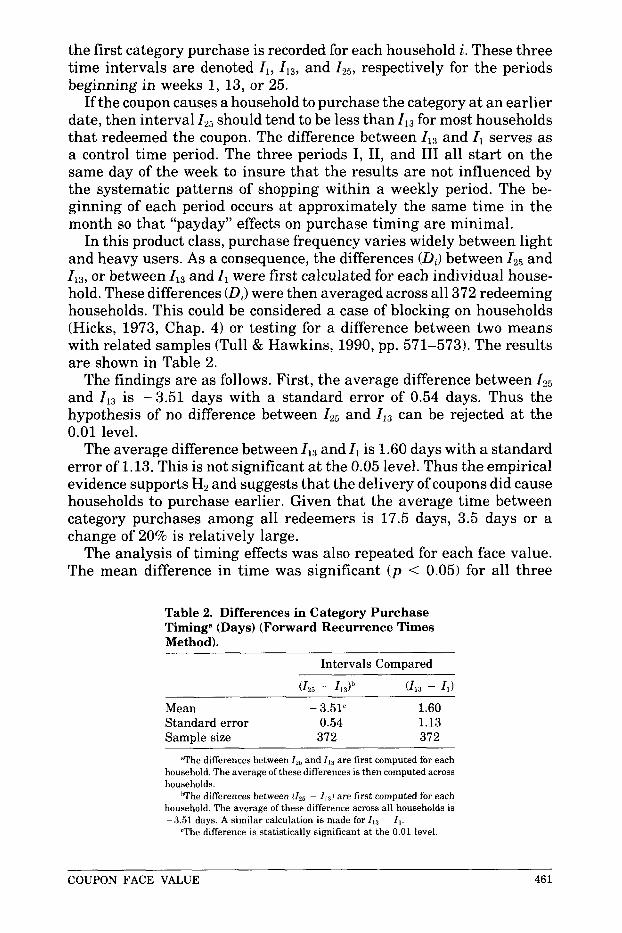
the first category purchase is recorded for each household i. These three time intervals are denoted 11, 1 1 3 , and 125, respectively for the periods beginning in weeks 1, 13, or 25.
If the coupon causes a household to purchase the category at an earlier date, then interval 1 2 5 should tend to be less than 1 1 3 for most households that redeemed the coupon. The difference between I I3 and I1 serves as a control time period. The three periods I, 11, and I11 all start on the same day of the week to insure that the results are not influenced by the systematic patterns of shopping within a weekly period. The be- ginning of each period occurs at approximately the same time in the month so that “payday” effects on purchase timing are minimal.
In this product class, purchase frequency varies widely between light and heavy users. As a consequence, the differences (D,) between I 2 5 and 113, or between I I3 and I, were first calculated for each individual house- hold. These differences (D,) were then averaged across all 372 redeeming households. This could be considered a case of blocking on households (Hicks, 1973, Chap. 4) or testing for a difference between two means with related samples (Tull & Hawkins, 1990, pp. 571-573). The results are shown in Table 2.
The findings are as follows. First, the average difference between 1 2 5
and 113 is -3.51 days with a standard error of 0.54 days. Thus the hypothesis of no difference between 125 and 113 can be rejected at the 0.01 level.
The average difference between I 1 3 and II is 1.60 days with a standard error of 1.13. This is not significant at the 0.05 level. Thus the empirical evidence supports H, and suggests that the delivery of coupons did cause households to purchase earlier. Given that the average time between category purchases among all redeemers is 17.5 days, 3.5 days or a change of 20% is relatively large.
The analysis of timing effects was also repeated for each face value. The mean difference in time was significant ( p < 0.05) for all three
Table 2. Differences in Category Purchase Timing* (Days) (Forward Recurrence Times Method).
Intervals Compared
Mean - 3.51‘ 1.60 Standard error 0.54 1.13 Sample size 372 372
’The differences between ZZ5 and 113 are first computed for each household. The average of these differences is then computed across households.
’The differences between (Izs - I,:,) are first computed for each household. The average of these difference across all households is -3.51 days. A similar calculation is made for II3 - II.
<The difference is statistically significant at the 0.01 level.
COUPON FACE VALUE 46 1
face values in the direction predicted (i.e., the time till the first purchase of the category decreased with the coupon). However, the differences were not larger for higher face values. Thus, H, is supported, and H, is not supported. These findings on H2 are related but not directly comparable to the findings of Neslin et al. (1985). In studying a closely related question, they observed that category interpurchase times with a coupon were not significantly smaller than interpurchase times with- out a coupon. The different findings may be due to differences in the product classes, sample sizes, experimental conditions, and methods of measurement.
Effect of Higher Face Values on the Mix of Coupon Redeemers H4 states that the average prepurchase probability will be lower for those who redeem a higher value coupon. This hypothesis is tested as follows. The prepurchase probability for each household (PPP,) is es- timated by the ratio of brand A purchases to product class purchases in the 24 weeks prior to delivery of the test coupons. This analysis is based on the 332 households who made at least five product class pur- chases in the first 24 weeks and redeemed the coupon. These households averaged more than 20 product class purchases during this 24 week period, which provides a relatively good basis for estimating PPP,.
The average value of PPP, is 0.118 for the low value coupon, 0.104 for the medium, and 0.108 for the high value coupon. The corresponding median values of PPP, are 0.059, 0.053, and 0.042. Thus there is a suggestion that a higher proportion of households with low values of PPP, are attracted by the higher face value. However, we could not reject the joint null hypothesis that all three means are equal. These observations may seem disappointing from the viewpoint of a manager who hoped to attract a much higher proportion of either new triers or infrequent brand A purchasers by offering higher face values.
In order to gain a better understanding of face value effects, each household was then classified as a prior buyer or nonbuyer of the pro- moted brand. Those who bought the brand at least once in the 24 weeks prior to the coupon delivery were classified as buyers. All others were classified as nonbuyers (see Table 3). Each household was also classified by the value of the coupon mailed to them.
Several factors are evident from Table 3. First, both buyers and non- buyers are sensitive to the face value. The number of redeemers among the nonbuyers was 31 for low value, 35 for medium, and 48 for the high value coupons. This is an increase of 17 units from 31 to 48. The cor- responding number of redemptions among the prior buyers were 55, 88, and 75, respectively, an increase of 20 units. Surprisingly, the higher face values appear to attract roughly the same number (17 or 20) of buyers and nonbuyers. The increase of 20 buyers from a base of 55 is roughly a 36% increase from the buyers versus a 55% increase for the
462 KRISHNA AND SHOEMAKER
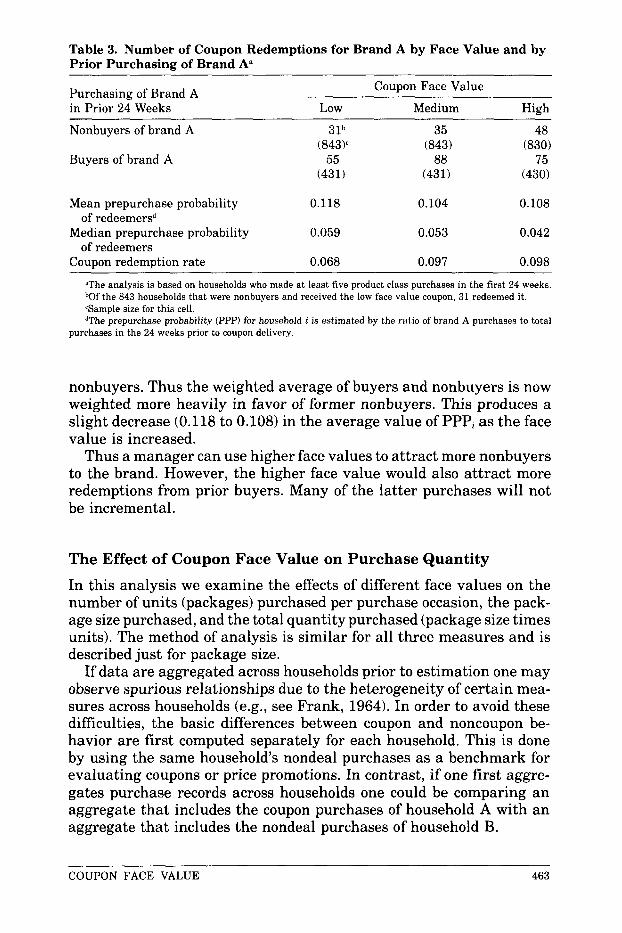
Table 3. Number of Coupon Redemptions for Brand A by Face Value and by Prior Purchasing of Brand Aa
~ ~
Coupon Face Value Purchasing of Brand A in Prior 24 Weeks Low Medium High
Nonbuyers of brand A 31b 35 48 (843Y (843) (830)
Buyers of brand A 55 88 75 (431) (431) (430)
Mean prepurchase probability 0.118 0.104 0.108 of redeemersd
of redeemers Median prepurchase probability 0.059 0.053 0.042
Coupon redemption rate 0.068 0.097 0.098
"The analysis is based on households who made a t least five product class purchases in the first 24 weeks. bOf the 843 households that were nonbuyers and received the low face value coupon, 31 redeemed it. 'Sample size for this cell. dThe prepurchase probability (PPP) for household i is estimated by the ratio of brand A purchases to total
purchases in the 24 weeks prior to coupon delivery.
nonbuyers. Thus the weighted average of buyers and nonbuyers is now weighted more heavily in favor of former nonbuyers. This produces a slight decrease (0.118 to 0.108) in the average value of PPPi as the face value is increased.
Thus a manager can use higher face values to attract more nonbuyers to the brand. However, the higher face value would also attract more redemptions from prior buyers. Many of the latter purchases will not be incremental.
The Effect of Coupon Face Value on Purchase Quantity In this analysis we examine the effects of different face values on the number of units (packages) purchased per purchase occasion, the pack- age size purchased, and the total quantity purchased (package size times units). The method of analysis is similar for all three measures and is described just for package size.
If data are aggregated across households prior to estimation one may observe spurious relationships due to the heterogeneity of certain mea- sures across households (e.g., see Frank, 1964). In order to avoid these difficulties, the basic differences between coupon and noncoupon be- havior are first computed separately for each household. This is done by using the same household's nondeal purchases as a benchmark for evaluating coupons or price promotions. In contrast, if one first aggre- gates purchase records across households one could be comparing an aggregate that includes the coupon purchases of household A with an aggregate that includes the nondeal purchases of household B.
COUPON FACE VALUE 463
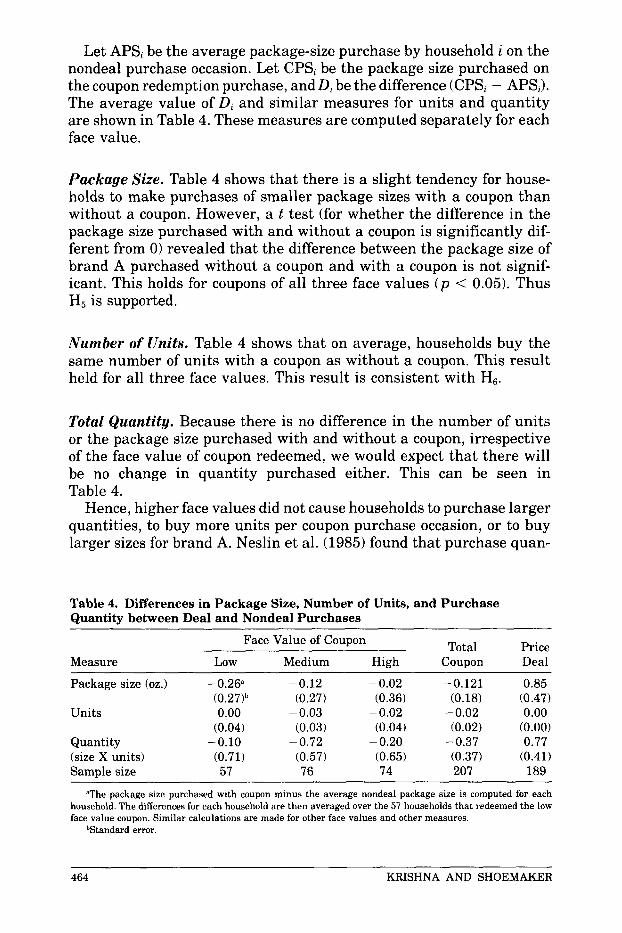
Let APS, be the average package-size purchase by household i on the nondeal purchase occasion. Let CPS, be the package size purchased on the coupon redemption purchase, andD, be the difference (CPS, - APS,). The average value of D, and similar measures for units and quantity are shown in Table 4. These measures are computed separately for each face value.
Package Size. Table 4 shows that there is a slight tendency for house- holds to make purchases of smaller package sizes with a coupon than without a coupon. However, a t test (for whether the difference in the package size purchased with and without a coupon is significantly dif- ferent from 0) revealed that the difference between the package size of brand A purchased without a coupon and with a coupon is not signif- icant. This holds for coupons of all three face values ( p < 0.05). Thus H, is supported.
Number of Units. Table 4 shows that on average, households buy the same number of units with a coupon as without a coupon. This result held for all three face values. This result is consistent with H6.
Total Quantity. Because there is no difference in the number of units or the package size purchased with and without a coupon, irrespective of the face value of coupon redeemed, we would expect that there will be no change in quantity purchased either. This can be seen in Table 4.
Hence, higher face values did not cause households to purchase larger quantities, to buy more units per coupon purchase occasion, or to buy larger sizes for brand A. Neslin et al. (1985) found that purchase quan-
Table 4. Differences in Package Size, Number of Units, and Purchase Quantity between Deal and Nondeal Purchases
Total Price Me as u r e Low Medium Hiah Coupon Deal
Face Value of Coupon
Package size (02.) - 0.26" - 0.12 - 0.02 - 0.121 0.85 (0.27)b (0.27) (0.36) (0.18) (0.47)
Units 0.00 -0.03 - 0.02 - 0.02 0.00 (0.04) (0.03) (0.04) (0.02) (0.00)
Quantity -0.10 - 0.72 - 0.20 - 0.37 0.77 (size X units) (0.71) (0.57) (0.65) (0.37) (0.41) Sample size 57 76 74 207 189
"The package size purchased with coupon minus the average nondeal package size is computed for each household. The differences for each household are then averaged over the 57 households that redeemed the low face value coupon. Similar calculations are made for other face values and other measures.
bStandard error.
464 KRISHNA AND SHOEMAKER
tities for coupon purchases were 17% higher than for nondeal purchases of bathroom tissue, and 7.9% larger for coffee (p. 156). Our findings on purchase quantity may appear to differ from theirs. However, they note in their study that some of their coupons could only be used for larger package sizes. This could account for the difference or the effects may vary between different product categories.
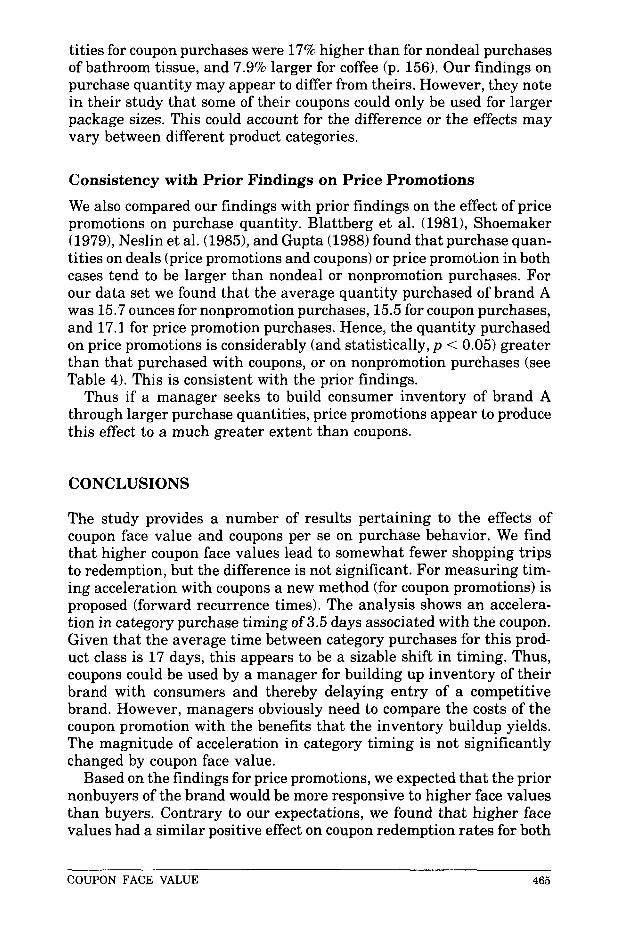
Consistency with Prior Findings on Price Promotions We also compared our findings with prior findings on the effect of price promotions on purchase quantity. Blattberg et al. (19811, Shoemaker (1979), Neslin et al. (1985), and Gupta (1988) found that purchase quan- tities on deals (price promotions and coupons) or price promotion in both cases tend to be larger than nondeal or nonpromotion purchases. For our data set we found that the average quantity purchased of brand A was 15.7 ounces for nonpromotion purchases, 15.5 for coupon purchases, and 17.1 for price promotion purchases. Hence, the quantity purchased on price promotions is considerably (and statistically, p < 0.05) greater than that purchased with coupons, or on nonpromotion purchases (see Table 4). This is consistent with the prior findings.
Thus if a manager seeks to build consumer inventory of brand A through larger purchase quantities, price promotions appear to produce this effect to a much greater extent than coupons.
CONCLUSIONS
The study provides a number of results pertaining to the effects of coupon face value and coupons per se on purchase behavior. We find that higher coupon face values lead to somewhat fewer shopping trips to redemption, but the difference is not significant. For measuring tim- ing acceleration with coupons a new method (for coupon promotions) is proposed (forward recurrence times). The analysis shows an accelera- tion in category purchase timing of 3.5 days associated with the coupon. Given that the average time between category purchases for this prod- uct class is 17 days, this appears to be a sizable shift in timing. Thus, coupons could be used by a manager for building up inventory of their brand with consumers and thereby delaying entry of a competitive brand. However, managers obviously need to compare the costs of the coupon promotion with the benefits that the inventory buildup yields. The magnitude of acceleration in category timing is not significantly changed by coupon face value.
Based on the findings for price promotions, we expected that the prior nonbuyers of the brand would be more responsive to higher face values than buyers. Contrary to our expectations, we found that higher face values had a similar positive effect on coupon redemption rates for both
COUPON FACE VALUE 465
buyers and nonbuyers of the brand. Consistent with expectations and findings on price deals (Neslin & Shoemaker, 19891, we find that the prior tendency to purchase the brand is higher for consumers who pur- chase the brand without a coupon versus those who purchase it with a coupon. However, the difference in prior purchase probability of those who buy on-deal and those who buy off-deal is much greater for price deals than for coupon promotions.
The good news for managers is that prior nonbuyers of the brand are sensitive to the face value and most of the sales of these buyers will be incremental. The less welcome finding is that the prior buyers also redeem at a higher level with higher face values and many of their redemption purchases will not be incremental. Thus, in total, much of the increase in coupon redemption due to higher face values will not produce a corresponding increase in incremental purchases for the brand.
As we expected, coupons in general, and higher face values in par- ticular, did not cause a significant increase in either the number of units (packages) purchased, or in the package size (measured in ounces) purchased per purchase occasion. Thus coupons appear to differ sharply from price promotions in this respect. Perhaps a coupon that could only be redeemed for the purchase of several packages or for larger sizes would cause consumers to build inventory.
We find that the effects of coupons are quite different from the effects of price promotions. Hence, one needs to analyze these effects sepa- rately.
This study shows the effects of increases in face value in a controlled experiment on one brand. Further research needs to be done to see if the results hold for other brands or for a wider range of face values. Clearly, much remains to be learned in these areas.
REFERENCES
A. C. Nielson Company. (1989). 1989 Nielson Annual Review ofRetail Grocery Trends. Northbrook, IL Author.
Allison, P. D. (1985). Survival analysis of backward recurrence times. Journal of the American Statistical Association, 80, 315-322.
Bawa, K., & Shoemaker, R. W. (1987). The effects of a direct mail coupon on brand choice behavior. Journal of Marketing Research, 24, 370-376.
Bawa, K., & Shoemaker, R. W. (1989). Analyzing incremental sales from a direct mail coupon promotion. Journal of Marketing, 53, 66-78.
Blattberg, R. C., Eppen, G. D., & Lieberman, J. (1981). “A theoretical and empirical evaluation of price deals for consumer nondurables. Journal of Marketing, 45, 116-129.
Bowman, R. (1980). Couponing and rebates: Profit of the dotted line. New York: Lebhar-Friedman Books.
466 KRISHNA AND SHOEMAKER
Cunningham, R. M. (1956). Brand loyalty-What, where, how much?. Harvard Business Review. 116-128.
Eldred, C. A. (1989). Coupon Facts, 1988. New York: Newspaper Advertising Bureau.
Frank, R. A. (1964). Brand choice as a probabilistic process. Journal of Busi- ness, 35, 43-56.
Guadagni, P. M., & Little, J. D. C. (1983). A Logit Model of Brand Choice Calibrated on Scanner Data. Marketing Science, 2, 203-238.
Gupta, S. (1988). Impact of sales promotion on when, what and how much to buy. Journal of Marketing Research, 25, 342-355.
Hicks, C. R. (1973). Fundamental concepts in the design of experiments (2nd ed.). New York: Holt, Rinehart, and Winston.
Irons, K., Little, J . D. C., & Klein, R. W. (1983, March). Determinants of Coupon Effectiveness. In Advances and Practices of Marketing Science, Proceedings of the 1983 ORSAITIMS Marketing Science Conference, USC (pp. 157-164).
Klein, R. L. (1981). Using supermarket scanner panels to measure the effec- tivenss of coupon promotions. In John W. Keon (Ed.), Proceedings: Third ORSAI TIMS Special Interest Conference on Market Measurement and Anal - ysis (pp. 118-124). Providence, RI: The Institute of Management Sciences.
Kuehn, A, A., & Rohloff, A. C. (1967). Consumer response to promotions. In Patrick J . Robinson (Ed.), Promotional decisions using mathematical models (pp. 45-148). Boston: Allyn and Bacon.
Neslin, S. A., & Clarke, D. G. (1987). Relating the brand use profile of coupon redeemers to brand and coupon characteristics. Journal of Advertising Re- search, 27, 23-32.
Neslin, S. A., Henderson, C., & Quelch, J. (1985). Consumer promotions and the acceleration of product purchases. Marketing Science, 4, 147-165.
Neslin, S. A., & Shoemaker, R. W. (19891, “An Alternative Explanation for Lower Repeat Rates after Promotion Purchases,” Journal of Marketing Re- search, 26 (May), 205-13.
Reibstein, D. J., & Traver, P. A. (1982). Factors affecting coupon redemption rates. Journal of Marketing, 46 (Fall), 102-13.
Shoemaker, R. W. (1979). An analysis of consumer reactions to product pro- motions. In Educators’ Conference Proceedings (pp. 244-248). Chicago: AMA.
Tull, D. S., & Hawkins, D. I. (1990). Marketing research (5th ed.). New York MacMillan.
Ward, R. W., & Davis, J . E. (1978). A pooled cross-section time series model of coupon promotions. American Journal of Agricultural Economics, 60,393- 401.
The authors gratefully acknowledge the assistance of Gerry Eskin and Kathie Eckert of IRI and appreciate the assistance of an anonymous firm in making these data available. We thank Professors Kapil Bawa, Imran Currim, and Sunil Gupta for their comments on an earlier draft.
Robert Shoemaker is with the Stern School of Business, New York University, 90 Trinity Place, New York, NY 10006.
COUPON FACE VALUE 467