Embed Size (px)
Citation preview
OCS Study MMS 2000-007
Estimation of Oil Spill Risk From Alaska North Slope, Trans-Alaska Pipeline, and Arctic Canada Oil Spill Data Sets
April 2000
Prepared by: Hart Crowser Inc.
2550 Denali Street, Suite 705 Anchorage, Alaska 99503
This study was funded by the U.S. Department of the Interior, Minerals Management Service (MMS) Alaska Outer Continental Shelf Region, Anchorage, Alaska, under Contract No. 01-99-
PO-16128, as part of the MMS Alaska Environmental Studies Program The opinions, findings, conclusions, or recommendations expressed in this report or product are those of the authors and do not necessarily reflect the views of the U.S. Department of the Interior, nor does mention of trade names or commercial products constitute endorsement or recommendation for use by the Federal Government.
U.S. Department of the Interior Minerals Management Service Alaska Outer Continental Shelf Region
2
Estimation of Oil Spill Risk From Alaska North Slope, Trans-Alaska Pipeline, and Arctic Canada Oil Spill
Data Sets
Jeffery L. Mach, Robert L. Sandefur, P.E., and Jean H. Lee OCS Study MMS 2000-007
i
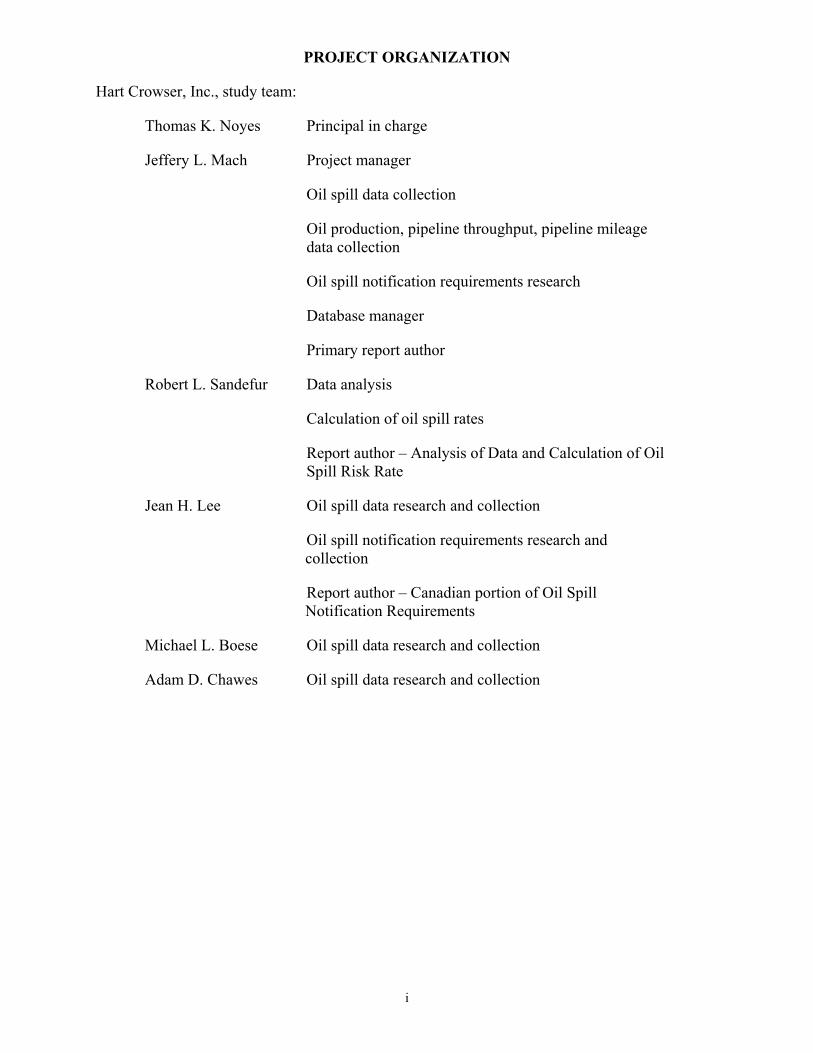
PROJECT ORGANIZATION
Hart Crowser, Inc., study team:
Thomas K. Noyes Principal in charge
Jeffery L. Mach Project manager
Oil spill data collection
Oil production, pipeline throughput, pipeline mileage data collection
Oil spill notification requirements research
Database manager
Primary report author
Robert L. Sandefur Data analysis
Calculation of oil spill rates
Report author – Analysis of Data and Calculation of Oil Spill Risk Rate
Jean H. Lee Oil spill data research and collection
Oil spill notification requirements research and collection
Report author – Canadian portion of Oil Spill Notification Requirements
Michael L. Boese Oil spill data research and collection
Adam D. Chawes Oil spill data research and collection
ii
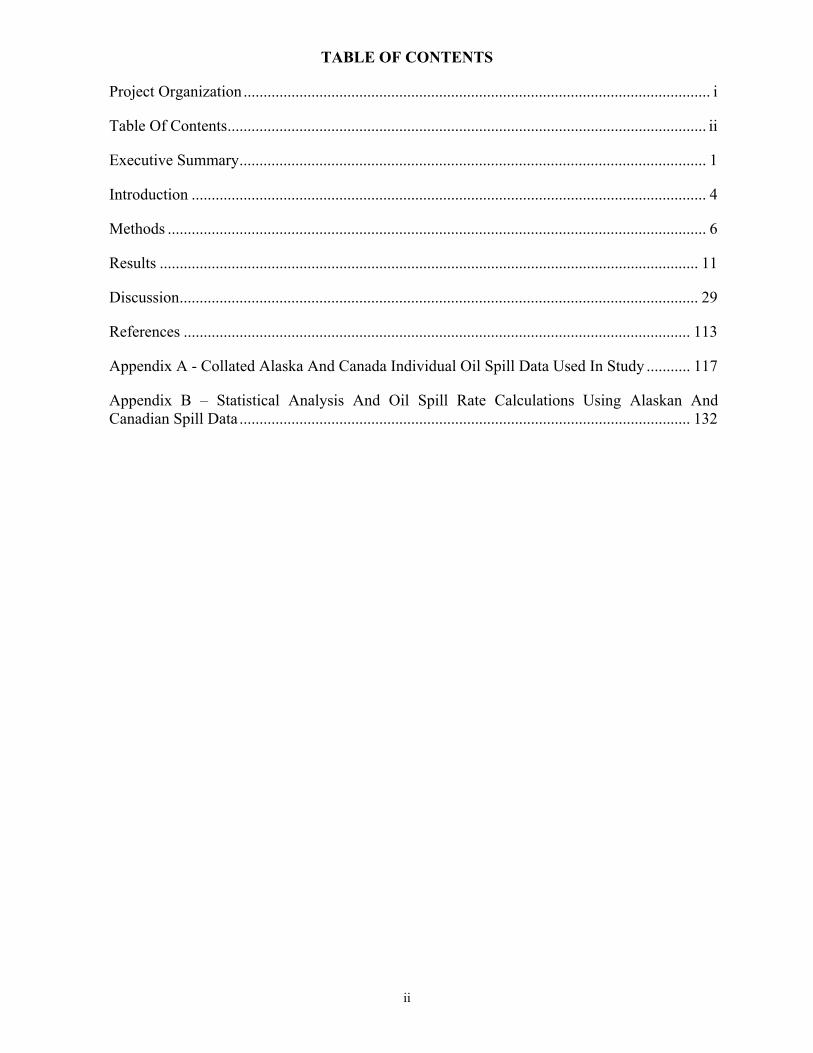
TABLE OF CONTENTS
Project Organization..................................................................................................................... i
Table Of Contents........................................................................................................................ ii
Executive Summary..................................................................................................................... 1
Introduction ................................................................................................................................. 4
Methods ....................................................................................................................................... 6
Results ....................................................................................................................................... 11
Discussion.................................................................................................................................. 29
References ............................................................................................................................... 113
Appendix A - Collated Alaska And Canada Individual Oil Spill Data Used In Study ........... 117
Appendix B – Statistical Analysis And Oil Spill Rate Calculations Using Alaskan And Canadian Spill Data ................................................................................................................. 132
1
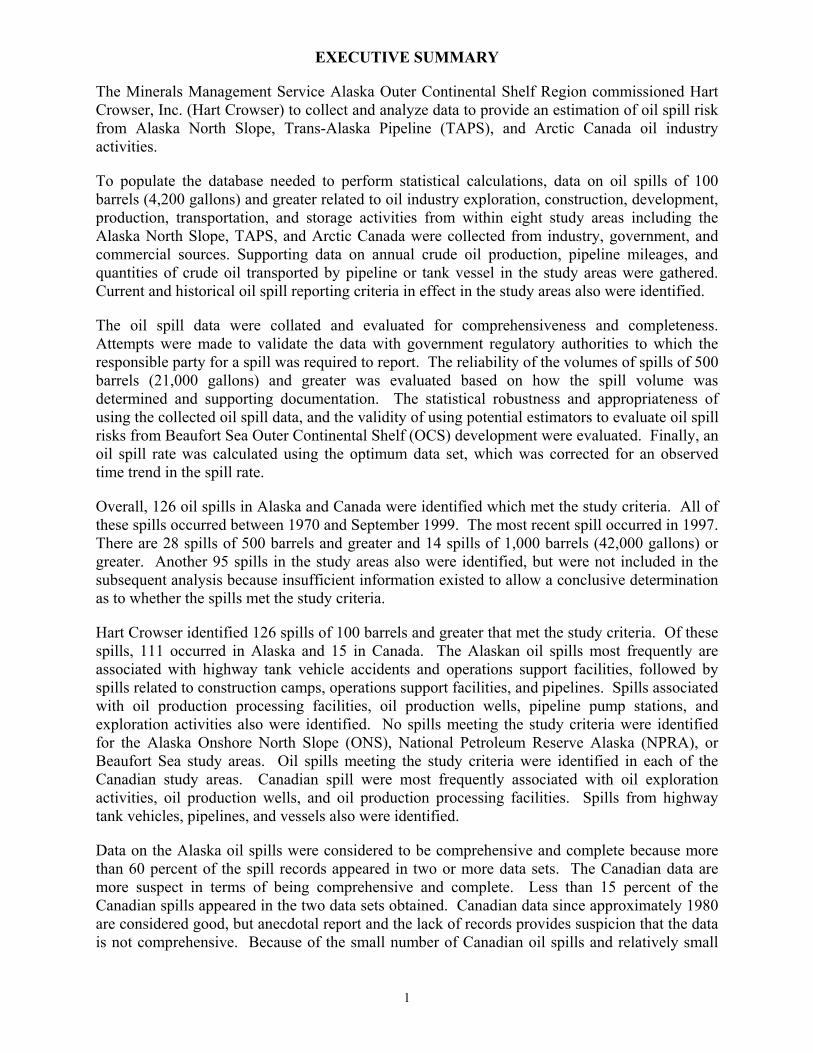
EXECUTIVE SUMMARY
The Minerals Management Service Alaska Outer Continental Shelf Region commissioned Hart Crowser, Inc. (Hart Crowser) to collect and analyze data to provide an estimation of oil spill risk from Alaska North Slope, Trans-Alaska Pipeline (TAPS), and Arctic Canada oil industry activities.
To populate the database needed to perform statistical calculations, data on oil spills of 100 barrels (4,200 gallons) and greater related to oil industry exploration, construction, development, production, transportation, and storage activities from within eight study areas including the Alaska North Slope, TAPS, and Arctic Canada were collected from industry, government, and commercial sources. Supporting data on annual crude oil production, pipeline mileages, and quantities of crude oil transported by pipeline or tank vessel in the study areas were gathered. Current and historical oil spill reporting criteria in effect in the study areas also were identified.
The oil spill data were collated and evaluated for comprehensiveness and completeness. Attempts were made to validate the data with government regulatory authorities to which the responsible party for a spill was required to report. The reliability of the volumes of spills of 500 barrels (21,000 gallons) and greater was evaluated based on how the spill volume was determined and supporting documentation. The statistical robustness and appropriateness of using the collected oil spill data, and the validity of using potential estimators to evaluate oil spill risks from Beaufort Sea Outer Continental Shelf (OCS) development were evaluated. Finally, an oil spill rate was calculated using the optimum data set, which was corrected for an observed time trend in the spill rate.
Overall, 126 oil spills in Alaska and Canada were identified which met the study criteria. All of these spills occurred between 1970 and September 1999. The most recent spill occurred in 1997. There are 28 spills of 500 barrels and greater and 14 spills of 1,000 barrels (42,000 gallons) or greater. Another 95 spills in the study areas also were identified, but were not included in the subsequent analysis because insufficient information existed to allow a conclusive determination as to whether the spills met the study criteria.
Hart Crowser identified 126 spills of 100 barrels and greater that met the study criteria. Of these spills, 111 occurred in Alaska and 15 in Canada. The Alaskan oil spills most frequently are associated with highway tank vehicle accidents and operations support facilities, followed by spills related to construction camps, operations support facilities, and pipelines. Spills associated with oil production processing facilities, oil production wells, pipeline pump stations, and exploration activities also were identified. No spills meeting the study criteria were identified for the Alaska Onshore North Slope (ONS), National Petroleum Reserve Alaska (NPRA), or Beaufort Sea study areas. Oil spills meeting the study criteria were identified in each of the Canadian study areas. Canadian spill were most frequently associated with oil exploration activities, oil production wells, and oil production processing facilities. Spills from highway tank vehicles, pipelines, and vessels also were identified.
Data on the Alaska oil spills were considered to be comprehensive and complete because more than 60 percent of the spill records appeared in two or more data sets. The Canadian data are more suspect in terms of being comprehensive and complete. Less than 15 percent of the Canadian spills appeared in the two data sets obtained. Canadian data since approximately 1980 are considered good, but anecdotal report and the lack of records provides suspicion that the data is not comprehensive. Because of the small number of Canadian oil spills and relatively small
2
amount of Canadian oil production, the Canadian data were not included in the subsequent statistical analysis. For both the Alaskan and Canadian oil spill data, the volumes assigned for the spills of 500 barrels and larger are reliable, but must be considered as general estimates in most cases. Documentation for these spills often does not describe how the spill volume was determined.
The Alaska oil spill data was sufficiently comprehensive and complete to conduct statistical analyses and estimate oil spill risk rates. A series of box and cumulative frequency plots of the Alaska spill data were constructed to analyze the data and determine trends. Exploratory data analysis on relevant independent variables indicated little statistical difference in terms of spills that occurred within the Alaska ONS, East of NPRA, and TAPS study areas. A general check on the fluctuation of the data set indicated spill occurrence to be quite random. There appeared to be little difference in the size of spills associated with the various facilities, with the exception of pipelines, which had larger spills. Analysis of variance by oil type showed that, in general crude oil spills tend to be larger than other types of oil spills.
A statistical analysis of individual spill volumes by study area, facility type, oil type, affected media, and spill cause combined did not indicate any particularly interesting correlation. Annualized groupings of spills, where total spill volumes by year were accumulated and plotted on a cumulative frequency plot, showed a mixture of several populations. Re-plotted on a logarithmic scale, a single lognormal population emerged. A count of the number of spills per year in the database is showed a possible Poisson distribution, but that hypothesis was not tested.
When spill size was plotted by year to see if regulatory or reporting requirements had a significant affect, it appeared that in the period from 1975 to 1979 there were a considerable number of large spills, and then the number of spills dropped to a more or less constant rate. The year of 1977 is significant because crude oil production on North Slope and operation of TAPS began in the middle of that year. However, the years of 1978 and 1979 visually fit with years of 1975 and 1977 better than breaking the data at 1977. The 1975 to 1979 period appears to have the most number of spills.
When Alaskan spill data were plotted on a yearly basis, it appears that prior to 1977, spill rates were considerably greater than in the subsequent years. When re-plotted on a logarithmic scale, it is apparent that prior to 1980 spill rates were considerably greater than after 1980.
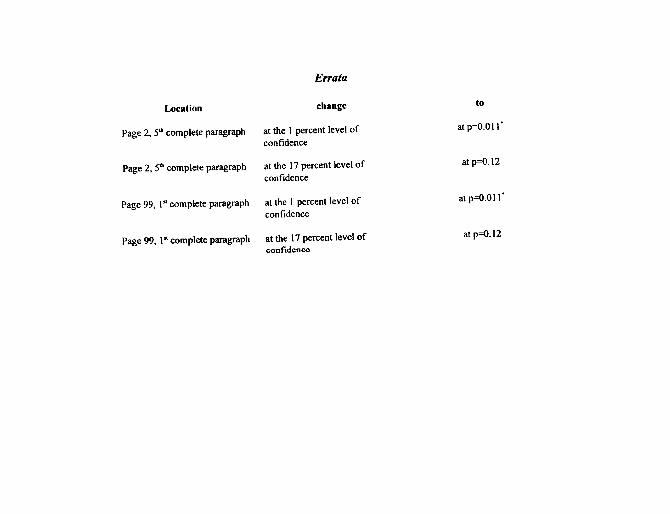
Hart Crowser calculated oil spill risk rates based on the number of spills and on volume. Hart Crowser calculated a rate based on volume because of the greater visual variability in the data. The statistical significance of this visual analysis showed a highly statistically significant correlation with spill rate and year if all of the Alaska spill data is included. If data earlier than 1980 is excluded, then there is still a correlation between spill rate and year that is significant at the 1 percent level of confidence. However, if data earlier than 1985 is excluded, then there is a correlation between spill rate and year, which is significant at the 17 percent level of confidence.
Hart Crowser concluded that spill rate is the best variable to use in predicting the volume of further oil spills and that a rate of approximately 52 gallons of oil spilled per million barrels of crude oil produced will be the average, if trends that started in 1980 continue. This rate is subject to considerable uncertainty in the mean (± 50% at the 95% level of confidence) and the value derived from the logarithmic distribution is 66 gallons of oil spilled per million barrels of crude oil produced as opposed to 52 gallons of oil spilled per million barrels of crude oil produced. These two values agree within the standard deviation of the means. The 95 percent
3
logarithmic confidence limits on spills for a given year are ± 465 percent at the 95 percent level of confidence. Hart Crowser is more inclined to believe the logarithmic values than the untransformed values, because the cumulative frequency of the data is more lognormal than normal. These very wide confidence limits and individual yearly values are consistent with the small number of data points available for this prediction.
Hart Crowser also calculated oil spill risk rates based on the number of spills of a given volume per million barrels of crude oil produced (spills/MMBbl), using data from 1978 through 1999. Hart Crowser found these rates to be:
• 0.0053 spills/MMBbl, ±24 percent, for spills of 100 barrels and greater; • 0.00093 spills/MMBbl, ±58 percent, for spills of 500 barrels and greater;
• 0.00039 spills/MMBbl, ±89 percent, for spills of 1,000 barrels and greater; and • 0.000078 spills/MMBbl, ±200 percent, for spills of 10,000 barrels and greater.
4
INTRODUCTION
In the development of environmental analyses for proposed Outer Continental Shelf (OCS) Beaufort Sea oil exploration and development off of Alaska’s North Slope, the U.S. Department of the Interior Minerals Management Service (MMS) OCS Region uses national OCS statistics to estimate the likelihood that large oil spills of 1,000 barrels (42,000 gallons) or larger will occur as a result of oil exploration, construction and development, production, and transportation activities. These national statistics primarily are from the Gulf of Mexico and do not include pipeline spills inshore of the OCS, in state waters, or on land. The MMS Alaska OCS Region desires to estimate oil spill frequency based on Alaska North Slope and Canadian Arctic, rather than Gulf of Mexico oil exploration, construction and development, production, and transportation experience.
The MMS contracted Hart Crowser to gather data and provide oil spill risk occurrence estimators for OCS Beaufort Sea oil exploration and development based on Alaska North Slope and Canadian Arctic statistics. More specifically, the scope of work directed Hart Crowser to:
• Identify, obtain relevant supporting information, and collate data for crude oil and diesel oil spills of 100 barrels and greater related to oil and gas exploration, construction, development, production, transportation, and storage from within the following study areas:
o U.S. Beaufort Sea; o Canadian Beaufort Sea; o National Petroleum Reserve Alaska (NPRA); o Alaska Onshore North Slope (ONS) East of NPRA; o Trans-Alaska Pipeline System, not including the Valdez Marine Terminal; o Onshore McKenzie River Delta; o Canadian High Arctic Islands; and o Norman Wells.
• Compare data sets from different sources for the same area to increase the
comprehensiveness and completeness of the data.
• Identify the oil spill reporting criteria in effect for oil spills in the study areas and validate the oil spill data with the regulatory authority to which the responsible party for the spill was required to report.
• Describe the overall comprehensiveness and completeness of the collected oil spill data.
• Evaluate the reliability of the volumes of spills of 500 barrels and greater, based on how the spill volume was determined and supporting documentation.
• Obtain and collate data on crude oil production, pipeline throughput, tanker shipments, and pipeline mileage by year for the Alaska and Canada study areas.
• Examine the appropriateness of using the collected oil spill data to evaluate oil spill risks from Beaufort Sea OCS development, partly in the context of prior MMS uses and statistical evaluations of oil spill rates for OCS use.
5
• Consider the statistical robustness and validity of potential oil spill risk estimators, including the:
o Effect of one or more spills on the estimators; o Size of the data set for spills of 100 barrels or more and 500 barrels or more; o Rationale for including or excluding intentional spills; o Effect of incomplete pipeline life cycles in the data set; o Correlation of pipeline mileage and/or oil production or throughput volumes with
spillage; o Differences in size of onshore and offshore oil spill data subsets; o Magnitude of the record (i.e., number and volumes of spills) used to calculate oil
spill risk estimators versus that used by Anderson and LaBelle (1994); and o Postulated differences, or lack thereof, in onshore and offshore oil spill risk
factors.
• Calculate onshore and offshore oil spill rates using the optimum data sets and including corrections for time trends in spill rates, if statistically appropriate.
• Prepare draft and final reports and technical summaries concerning the study, and appendices containing the oil spill and supporting data sets.
6
METHODS
Oil Spill Data Collection
Alaskan Oil Spill Data Hart Crowser gathered the Alaskan oil spill data used in this study using information contained in electronic spreadsheet and database files, and from written records. The data was obtained from federal and state agencies, major Alaskan oil industry companies, and one commercial source. Methods used to gather these data are described below.
The MMS Alaska OCS Office provided Hart Crowser with Alaska oil spill data gathered prior to the study by MMS from:
• BP Exploration (Alaska) Inc. (BP); • ARCO Alaska Inc. (ARCO); • Alyeska Pipeline Service Company (Alyeska); • U.S. Department of the Interior and Alaska Department of Natural Resources, Alaska
Joint Pipeline Office (JPO); • U.S. Department of the Interior Bureau of Land Management (BLM), Alaska Office of
Special Projects; • Alaska Department of Environmental Conservation (ADEC); and • The Oil Spill Intelligence Report (OSIR).
Hart Crowser contacted each of the data sources listed above, except OSIR, by telephone to obtain updated or additional oil spill data. Hart Crowser also contacted the U.S. Environmental Protection Agency (EPA), Alaska Operations Office by telephone and the National Response Center, Washington, D.C., in writing, to obtain available data on Alaskan oil spills meeting the study criteria.
Hart Crowser identified the location of potentially useful files from inquiries made to knowledgeable ADEC staff. Hart Crowser researchers traveled to ADEC’s Fairbanks and Valdez offices, and gathered oil spill data, supporting information, and documentation directly from the active and archived oil spill files in those offices. Hart Crowser also searched for Alaskan oil spill data on the Internet and in the collection of the Alaska State Library in Juneau, which contains documents from the ADEC’s former library.
Canadian Oil Spill Data Hart Crowser contacted the following organizations by telephone and inquired about the availability of oil spill data for the Canadian study areas:
• Department of Indian Affairs and Northern Development (DIAND; also known as Indian and Northern Affairs Canada); Toronto, Ontario offices;
• National Energy Board Canada (NEB); Edmonton, Alberta offices; • Environment Canada (EC), Prairie and Northern Region; Yellowknife, Northwest
Territories office; • Coast Guard Canada (CGC); Ottawa, Ontario office; and
7
• Government of the Northwest Territories (GNWT); Environmental Protection Service (EPS); Yellowknife, NWT office.
Oil spill records also were contained in the OSIR summary provided by MMS and reviews of the OSIR Oil Spills: International Summary and Review 1978-1981 and Oil Spills: International Summary and Review 1982-1985 were conducted to look for Canadian oil spills that met the study criteria. Hart Crowser also searched the Internet for documents that contained information on Canadian oil spills meeting the study criteria.
Oil Spill Data Evaluation and Collation Alaskan and Canadian oil spill records were initially transferred from existing electronic files, or were entered directly from written records, into Microsoft Excel spreadsheets. Each spreadsheet contained oil spill records from a specific source. Each spreadsheet was reviewed and those spill records that were judged to meet the study criteria were transferred into a Microsoft Access 97 database. This database contained all of the oil spill records subsequently used in the study. Spreadsheets and databases were maintained exclusively by the project data manager.
The spill records in the database containing all of the records were sorted to identify individual spills appearing in more than one data set. In cases where a spill record was found only in one of the data sets, the other relevant data sets Hart Crowser had obtained were cross checked to determine if they contained a similar spill record that had not been included in the database for some reason. Spill records were added to or deleted from the database of all spill records based on information found in the data sets, in written records, or interviews with knowledgeable individuals concerning specific spills.
Hart Crowser also assembled a database of oil spills that were excluded from the study because Hart Crowser could not determine whether these spills met the study criteria. Hart Crowser did not attempt to assemble a listing of all spill records reviewed and included in, or excluded from, the study.
Using the database of all oil spill records included in the study, Hart Crowser then assembled a collated database of the oil spills. Records from different data sets for an individual spill were compared with one another, and a single spill record for the collated database was created based on all of the records for the spill. Differences in individual spill records among the different data sets, including spill date, location description, spiller identity, oil type, and spill quantity were reconciled as much as possible by comparing the data in the different records and making inquiries about particular spills to the owners of the spill records or to individuals knowledgeable about the spill. Where differences between spill records for the same spill continued to exist, deference for use in the collated database was given to the data in the regulatory agency spill records. Where different spill dates were found among data sets, a single date was used in the collated database, typically the date used in the ADEC’s databases or that agency’s records. Where different oil spill quantities were reported in different data sets or where the spill quantity was reported as a range, a range was used in the collated database, using the range of spill quantities found among the data sets.
Oil Spill Data Comprehensiveness and Completeness
Hart Crowser felt that it would assemble the most comprehensive and complete data possible, within the time and resource limits of the study, by obtaining oil spill data from as many sources
8
as possible. To that end, Hart Crowser contacted organizations that were believed or known to have oil spill records relevant to the study. Included in the search for oil spill data relevant to the study were regulatory agencies that had or have legal requirements for oil spill reporting and cleanup; major oil exploration, production, and pipeline operating companies; and the OSIR, commercial publication specializing in oil spill information. Because Hart Crowser knew that ADEC’s oil and hazardous substance spill databases were incomplete, reviews of document files were conducted in an attempt to gather comprehensive and complete data for the study.
Hart Crowser analyzed the list of collated spills to determine how many spills appeared in two or more data sets. Whether a particular oil spill was found in more than one data set, whether the data for a particular spill was substantially the same between data sets, and whether data required for the study was found among the data sets was used as a guide in judging the comprehensiveness and completeness of the data. Hart Crowser also evaluated whether there was a correlation between the size of oil spills versus the occurrence of the spills in multiple databases for oil spills in the Alaskan and Canadian study areas, as a potential indicator of whether larger spills are more likely to be recorded.
Reliability of Oil Spill Volume Determinations
During reviews of the written oil spill records from Alaska and Canada Hart Crowser researchers searched for information in the records indicating how oil spill volume determinations had been made to allow Hart Crowser to gauge the reliability of the spill volumes contained in the records.
Oil Spill Notification Requirement Data Collection
United States and Alaska Notification Requirements Hart Crowser reviewed copies of current and historical federal and Alaska statutes and regulations in the Alaska Court System Law Library and the Alaska State Library at Juneau. The MMS provided Hart Crowser with additional information on oil spill notification requirements in Alaska.
Canadian Notification Requirements Hart Crowser reviewed copies of current statutes and regulations obtained from the Canada Department of Justice and the GNWT. Some historical statutes and regulations also were obtained and reviewed. Hart Crowser also interviewed representatives of the GNWT EPS and the NEB concerning current and historical oil spill notification requirements.
Crude Oil Production and Transportation Data Collection
Alaska Crude Oil Production, and Pipeline Mileage and Throughput Data The Alaska Department of Natural Resources (ADNR), Division of Oil and Gas was contacted to obtain annual crude oil production and pipeline throughput statistics. ADNR obtains production data monthly from the Alaska Oil and Gas Conservation Commission (AOGCC) and publishes annual summary statistics as part of its periodic publication, Historical and Projected Oil and Gas Consumption.
The JPO was contacted to obtain the mileages of “regulated pipelines” (i.e., those pipelines regulated by the U.S. Department of Transportation and by right-of-way leases issued by the State of Alaska or the BLM). Hart Crowser consulted the Trans-Alaska Pipeline Atlas, Prudhoe Bay to Valdez (Alyeska, 1993) to obtain the mileage of the TAPS.
9
Telephone inquiries were made to ARCO and BP staff members at the respective companies’ Anchorage headquarters and the individual oil production units concerning the mileages of the smaller field gathering lines (also called cross-country lines) in the individual production units. The field gathering lines, typically ranging in size from 8 to 30 inches in diameter, run from oil production pads to processing facilities and from processing facilities to sale oil pipelines or to Pump Station 1.
Throughputs for individual oil sales pipelines were calculated from the annual crude oil production quantities of the particular North Slope oil fields or operating units as reported in ADNR’s Historical and Projected Oil and Gas Consumption. Annual TAPS throughputs were obtained directly from Historical and Projected Oil and Gas Consumption.
Canadian Crude Oil Production, Pipeline Mileage and Throughput, and Tanker Transport Quantity Data Hart Crowser contacted the NEB to obtain crude oil production, pipeline mileage and throughput, and tanker transport quantity data for the Canadian Arctic study areas.
Alaska and Canadian crude oil production, pipeline mileage, and pipeline throughput or other transportation data were entered into a Microsoft Access database application and have been provided to MMS separately from this report.
Oil Spill Data Statistical Analysis and Estimation of Spill Risk
Statistical analysis began after collation of the oil spill data. The basic statistical approach used in the study consisted of visual review all of the data using cumulative frequency and box plots. Conclusions inferred from visual analysis of the data were verified by linear methods including linear regression and analysis of variance. In all statistical analyses, there is some type of balancing between a reasonable number of samples, which allow statistical inference to be made and relevant independent variables. Review of the oil spill data indicated that not all data fields had enough repeated entries to provide useful statistical results. Relevant variables selected were study area, spill date, facility type, oil type, spill cause, and affected media.
Units used in this study are those provided in the data. Oil production was expressed in millions of barrels per year, the volume of spills were expressed in U.S. gallons, volumetric spill rates were expressed in U.S. gallons per millions of barrels produced, and numerical spill rates were expressed as the number of spills at or above a specific size divided by millions of barrels of crude oil produced.
To increase the number of repeated entries in data fields, minor typographical inconsistencies in the facility type and oil type data fields were standardized. The data contained a number of explanations for the causes of spills. However, there was enough consistency to allow some of spill causes to be combined into a new variable, which was called spill cause common. The spill cause common variable contained facility piping leaks, facility tank leaks, facility explosions, pipeline leaks, tank vehicle accidents, and unspecified spill causes, along with one production well leak.
Visual review of the oil spill data from both Canadian and U.S. sources indicated that, in general, only maximum estimated spill volumes were available for the size of the oil spills. Maximum spill volume also is conservative. Consequently, the maximum spill size was used as the dependent variable for all analyses.
10
The statistical analysis of the oil spill data and the estimation of oil spill risk rates was conducted using Microsoft® Windows 2000® beta build 2128 using the MKS toolkit (which emulates a Unix Korn shell under Windows®) and the public domain statistics package “R”1, running on a Pentium II 300Mhz computer. After initial re-formatting of the data from Microsoft® Excel® spreadsheets, a single batch file was used to assure that results obtained in the study could be reproduced Between the initial analysis and the final analysis presented here, new versions of Windows 2000® (final release), the “R” statistics package and Microsoft® Excel® became available and were installed on the computer used to conduct the analysis. To verify that none of the software changes had an affect on the results, the initial data set was rerun and identical results obtained.
1 A description of this statistics package can be found on the Internet at http://www.ci.tuwien.ac.at/.
11
RESULTS
Oil Spill Data Collection
Alaskan Oil Spill Data Alaskan oil spill data obtained from the MMS consisted of:
• BP electronic database files of oil spills in the Prudhoe Bay Unit Western Operating Area (1989 through 1996), Duck Island (Endicott) Unit (1989 through 1996), and Milne Point (1994 through 1996);
• ARCO electronic spreadsheet files of oil spills for the Prudhoe Bay Unit Eastern Operating Area (1977 through 1996), Kuparuk River Unit (1977 through 1985 and 1986 through 1996), and Kuparuk River Unit exploration (1986 through 1996);
• Alyeska printed summary report of oil spills greater than 1000 barrels along the TAPS from 1977 to 1989;
• JPO electronic database of oil spills along the TAPS (1970 through 1994);
• BLM printed reports of oil spills along the TAPS during 1981 and 1982;
• ADEC electronic text and spreadsheet files of oil spills from the agency’s current oil and hazardous substances spill database (July 1995 to February 1997) and an earlier oil and hazardous substances spill database (1971 to July 1995);
• An unattributed printed summary of oil spills over 378.5 liters (100 gallons) on Alaska’s North Slope and along TAPS from 1970 to 19812; and
• An electronic spreadsheet summary of Alaskan and Canadian oil spills of 100 barrels or greater, from 1978 through 1997, as reported by the OSIR.
• An MMS report that no oil spills of 100 barrels or larger have occurred in the Alaska Beaufort Sea study area.
From inquiries to these same organizations, except to the OSIR, Hart Crowser obtained updated or additional oil spill data from:
• Alyeska; an electronic spreadsheet file containing all oil spills of 100 barrels and greater from the company’s oil spill database to September 1999; and
• ADEC; an electronic spreadsheet containing all oil spills in ADEC’s current oil and hazardous substance spill database to September 1999.
2 MMS reported that they obtained the summary from BLM. Hart Crowser believes this summary may be an ADEC work product, because a copy of it was found in the agency’s Fairbanks office files, and it is familiar to the report’s primary author who worked for ADEC in Fairbanks at the time it was prepared.
12
Additional oil spill data was not received in response to inquiries and requests made to ARCO, BP Exploration (Alaska), EPA, BLM, or the National Response Center.
A review of Oil Spills: International Summary and Review 1978-1981 and Oil Spills: International Summary and Review 1982-1985, which were produced by the publishers of the OSIR, yielded no additional oil data for the study.
No data concerning oil spills of 100 barrels and greater within the National Petroleum Reserve in Alaska (NPRA) were obtained from any sources. Inquiries to the BLM, the agency with surface management and protection responsibilities in NPRA since 1977, did not yield any oil spill data. Hart Crowser’s review of two publications that discussed oil exploration activities in NPRA also did not identify any oil spills that met the size threshold for inclusion in this study and analysis3.
Canadian Oil Spill Data Collection Hart Crowser’s inquiries seeking Canadian oil spill data either yielded no oil spill records or resulted in referrals to the GNWT EPS. From the GNWT EPS, Hart Crowser obtained a tabular summary of all oil spills of 100 barrels and larger that are included in the GNWT EPS oil spill database. The database has been maintained since 1985 and contains spill records back to 1971. Hart Crowser identified oil spills in the GNWT EPS database that met the study criteria and obtained the written records for those spills from the GNWT EPS.
Oil spill records also obtained oil spill data from the OSIR summary provided by MMS. This data was confirmed by Hart Crowser’s reviews of Oil Spills: International Summary and Review 1978-1981 and Oil Spills: International Summary and Review 1982-1985.
Reviews of EC’s Summary of Spill Events in Canada, 1974 – 1983 and Summary of Spill Events in Canada, 1984 – 1995 and DIAND’s Northern Oil and Gas Annual Reports for 1992 through 1998 yielded no data on specific spills for inclusion in the study.
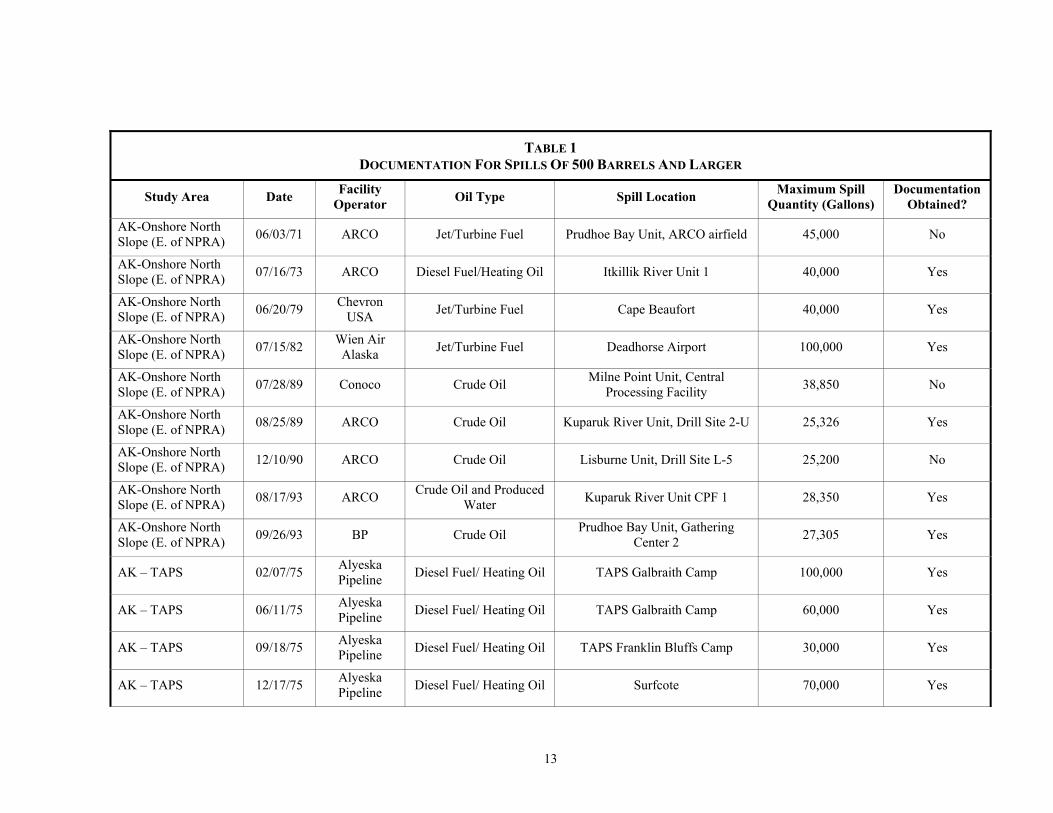
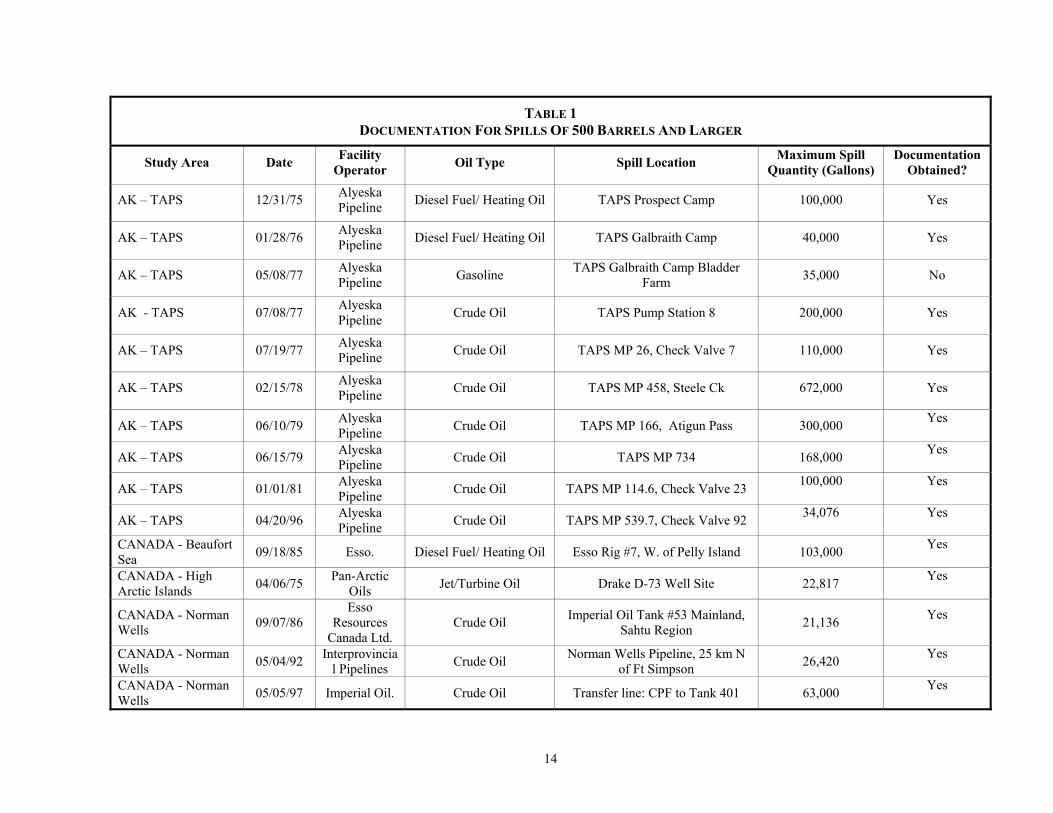
Documentation of Oil Spills of 500 Barrels and Larger Hart Crowser obtained some form of written supporting documentation from the ADEC and GNWT files for 24 of 28 oil spills identified that had a volume of 500 barrels or greater. Those spills are listed in Table 1.
Oil Spill Data Evaluation and Collation
Collation of the Alaskan and Canadian oil spill data sets resulted in the identification of 126 oil spills that met the study criteria for spill location, relation to oil industry activity, and were 100 barrels or greater. Of the 126 collated spills, 111 occurred in Alaska between 1970 and September 1999, and 15 in Canada between 1973 and September 1999. The most recent oil spills of 100 barrels or greater in both Alaska and Canada occurred in 1997. Also, of the 126 oil spills, 28 spills were 500 barrels and greater and 14 spills are 1,000 barrels or greater. Of the 28 oil spills that are 500 barrels or greater, 23 occurred in Alaska and 5 in Canada. The collated list of spills was provided to MMS as a Microsoft Access database application and, because of its size, is provided in Appendix A rather than as a table here.
3 Hanley et. al. 1981 and Gryc 1985.
13
TABLE 1 DOCUMENTATION FOR SPILLS OF 500 BARRELS AND LARGER
Study Area Date Facility Operator Oil Type Spill Location Maximum Spill
Quantity (Gallons) Documentation
Obtained?
AK-Onshore North Slope (E. of NPRA) 06/03/71 ARCO Jet/Turbine Fuel Prudhoe Bay Unit, ARCO airfield 45,000 No
AK-Onshore North Slope (E. of NPRA) 07/16/73 ARCO Diesel Fuel/Heating Oil Itkillik River Unit 1 40,000 Yes
AK-Onshore North Slope (E. of NPRA) 06/20/79 Chevron
USA Jet/Turbine Fuel Cape Beaufort 40,000 Yes
AK-Onshore North Slope (E. of NPRA) 07/15/82 Wien Air
Alaska Jet/Turbine Fuel Deadhorse Airport 100,000 Yes
AK-Onshore North Slope (E. of NPRA) 07/28/89 Conoco Crude Oil Milne Point Unit, Central
Processing Facility 38,850 No
AK-Onshore North Slope (E. of NPRA) 08/25/89 ARCO Crude Oil Kuparuk River Unit, Drill Site 2-U 25,326 Yes
AK-Onshore North Slope (E. of NPRA) 12/10/90 ARCO Crude Oil Lisburne Unit, Drill Site L-5 25,200 No
AK-Onshore North Slope (E. of NPRA) 08/17/93 ARCO Crude Oil and Produced
Water Kuparuk River Unit CPF 1 28,350 Yes
AK-Onshore North Slope (E. of NPRA) 09/26/93 BP Crude Oil Prudhoe Bay Unit, Gathering
Center 2 27,305 Yes
AK – TAPS 02/07/75 Alyeska Pipeline Diesel Fuel/ Heating Oil TAPS Galbraith Camp 100,000 Yes
AK – TAPS 06/11/75 Alyeska Pipeline Diesel Fuel/ Heating Oil TAPS Galbraith Camp 60,000 Yes
AK – TAPS 09/18/75 Alyeska Pipeline Diesel Fuel/ Heating Oil TAPS Franklin Bluffs Camp 30,000 Yes
AK – TAPS 12/17/75 Alyeska Pipeline Diesel Fuel/ Heating Oil Surfcote 70,000 Yes
14
TABLE 1 DOCUMENTATION FOR SPILLS OF 500 BARRELS AND LARGER
Study Area Date Facility Operator Oil Type Spill Location Maximum Spill
Quantity (Gallons) Documentation
Obtained?
AK – TAPS 12/31/75 Alyeska Pipeline Diesel Fuel/ Heating Oil TAPS Prospect Camp 100,000 Yes
AK – TAPS 01/28/76 Alyeska Pipeline Diesel Fuel/ Heating Oil TAPS Galbraith Camp 40,000 Yes
AK – TAPS 05/08/77 Alyeska Pipeline Gasoline TAPS Galbraith Camp Bladder
Farm 35,000 No
AK - TAPS 07/08/77 Alyeska Pipeline Crude Oil TAPS Pump Station 8 200,000 Yes
AK – TAPS 07/19/77 Alyeska Pipeline Crude Oil TAPS MP 26, Check Valve 7 110,000 Yes
AK – TAPS 02/15/78 Alyeska Pipeline Crude Oil TAPS MP 458, Steele Ck 672,000 Yes
AK – TAPS 06/10/79 Alyeska Pipeline Crude Oil TAPS MP 166, Atigun Pass 300,000 Yes
AK – TAPS 06/15/79 Alyeska Pipeline Crude Oil TAPS MP 734 168,000 Yes
AK – TAPS 01/01/81 Alyeska Pipeline Crude Oil TAPS MP 114.6, Check Valve 23 100,000 Yes
AK – TAPS 04/20/96 Alyeska Pipeline Crude Oil TAPS MP 539.7, Check Valve 92 34,076 Yes
CANADA - Beaufort Sea 09/18/85 Esso. Diesel Fuel/ Heating Oil Esso Rig #7, W. of Pelly Island 103,000 Yes
CANADA - High Arctic Islands 04/06/75 Pan-Arctic
Oils Jet/Turbine Oil Drake D-73 Well Site 22,817 Yes
CANADA - Norman Wells 09/07/86
Esso Resources
Canada Ltd. Crude Oil Imperial Oil Tank #53 Mainland,
Sahtu Region 21,136 Yes
CANADA - Norman Wells 05/04/92 Interprovincia
l Pipelines Crude Oil Norman Wells Pipeline, 25 km N of Ft Simpson 26,420 Yes
CANADA - Norman Wells 05/05/97 Imperial Oil. Crude Oil Transfer line: CPF to Tank 401 63,000 Yes
15
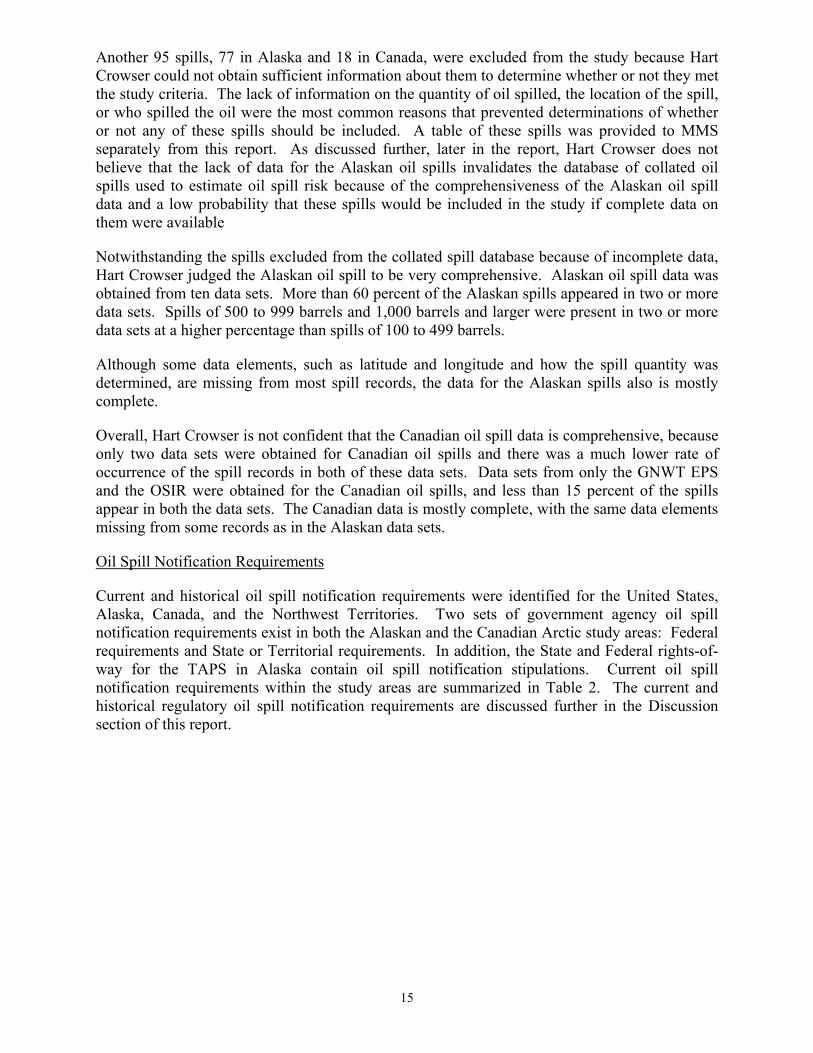
Another 95 spills, 77 in Alaska and 18 in Canada, were excluded from the study because Hart Crowser could not obtain sufficient information about them to determine whether or not they met the study criteria. The lack of information on the quantity of oil spilled, the location of the spill, or who spilled the oil were the most common reasons that prevented determinations of whether or not any of these spills should be included. A table of these spills was provided to MMS separately from this report. As discussed further, later in the report, Hart Crowser does not believe that the lack of data for the Alaskan oil spills invalidates the database of collated oil spills used to estimate oil spill risk because of the comprehensiveness of the Alaskan oil spill data and a low probability that these spills would be included in the study if complete data on them were available
Notwithstanding the spills excluded from the collated spill database because of incomplete data, Hart Crowser judged the Alaskan oil spill to be very comprehensive. Alaskan oil spill data was obtained from ten data sets. More than 60 percent of the Alaskan spills appeared in two or more data sets. Spills of 500 to 999 barrels and 1,000 barrels and larger were present in two or more data sets at a higher percentage than spills of 100 to 499 barrels.
Although some data elements, such as latitude and longitude and how the spill quantity was determined, are missing from most spill records, the data for the Alaskan spills also is mostly complete.
Overall, Hart Crowser is not confident that the Canadian oil spill data is comprehensive, because only two data sets were obtained for Canadian oil spills and there was a much lower rate of occurrence of the spill records in both of these data sets. Data sets from only the GNWT EPS and the OSIR were obtained for the Canadian oil spills, and less than 15 percent of the spills appear in both the data sets. The Canadian data is mostly complete, with the same data elements missing from some records as in the Alaskan data sets.
Oil Spill Notification Requirements
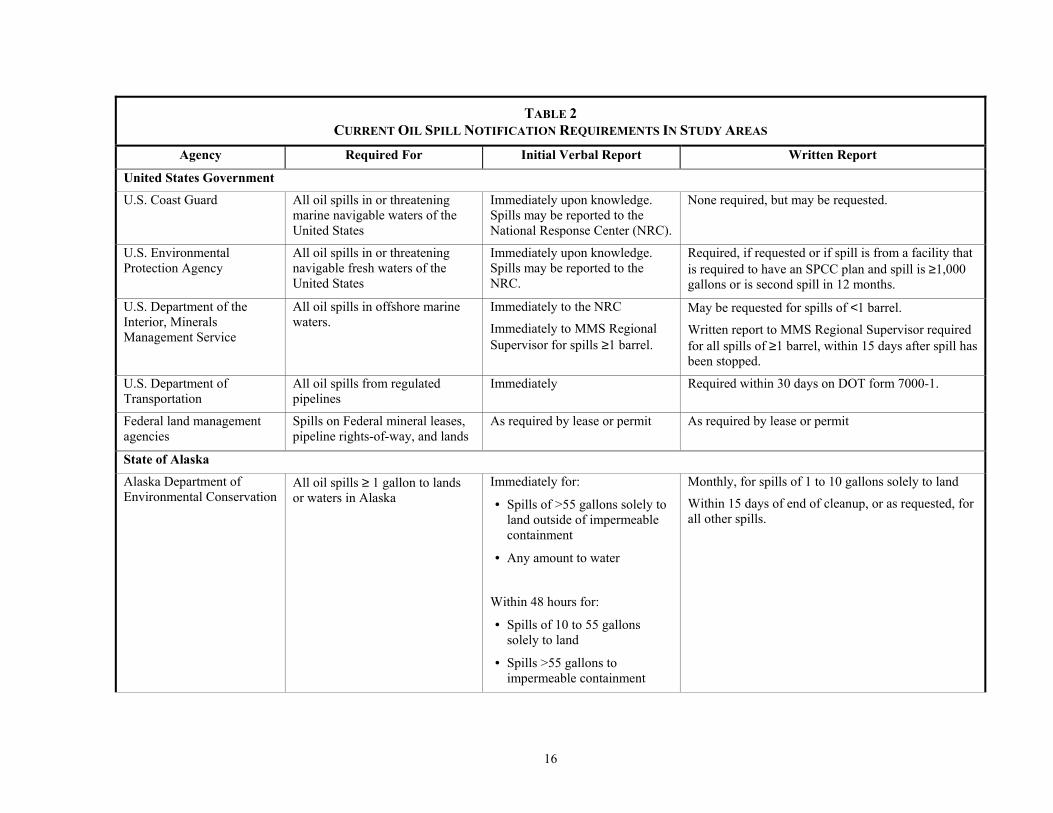
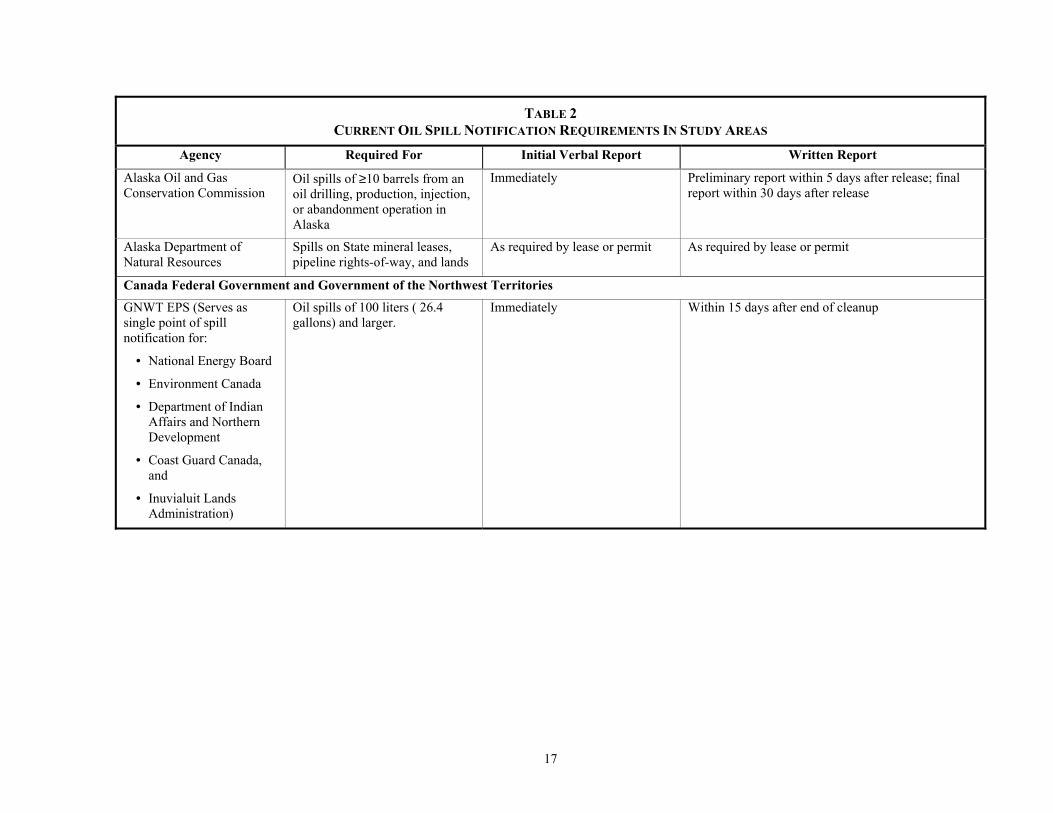
Current and historical oil spill notification requirements were identified for the United States, Alaska, Canada, and the Northwest Territories. Two sets of government agency oil spill notification requirements exist in both the Alaskan and the Canadian Arctic study areas: Federal requirements and State or Territorial requirements. In addition, the State and Federal rights-of-way for the TAPS in Alaska contain oil spill notification stipulations. Current oil spill notification requirements within the study areas are summarized in Table 2. The current and historical regulatory oil spill notification requirements are discussed further in the Discussion section of this report.
16
TABLE 2 CURRENT OIL SPILL NOTIFICATION REQUIREMENTS IN STUDY AREAS
Agency Required For Initial Verbal Report Written Report
United States Government
U.S. Coast Guard All oil spills in or threatening marine navigable waters of the United States
Immediately upon knowledge. Spills may be reported to the National Response Center (NRC).
None required, but may be requested.
U.S. Environmental Protection Agency
All oil spills in or threatening navigable fresh waters of the United States
Immediately upon knowledge. Spills may be reported to the NRC.
Required, if requested or if spill is from a facility that is required to have an SPCC plan and spill is ≥1,000 gallons or is second spill in 12 months.
U.S. Department of the Interior, Minerals Management Service
All oil spills in offshore marine waters.
Immediately to the NRC
Immediately to MMS Regional Supervisor for spills ≥1 barrel.
May be requested for spills of <1 barrel.
Written report to MMS Regional Supervisor required for all spills of ≥1 barrel, within 15 days after spill has been stopped.
U.S. Department of Transportation
All oil spills from regulated pipelines
Immediately Required within 30 days on DOT form 7000-1.
Federal land management agencies
Spills on Federal mineral leases, pipeline rights-of-way, and lands
As required by lease or permit As required by lease or permit
State of Alaska
Alaska Department of Environmental Conservation
All oil spills ≥ 1 gallon to lands or waters in Alaska
Immediately for:
• Spills of >55 gallons solely to land outside of impermeable containment
• Any amount to water
Within 48 hours for:
• Spills of 10 to 55 gallons solely to land
• Spills >55 gallons to impermeable containment
Monthly, for spills of 1 to 10 gallons solely to land
Within 15 days of end of cleanup, or as requested, for all other spills.
17
TABLE 2 CURRENT OIL SPILL NOTIFICATION REQUIREMENTS IN STUDY AREAS
Agency Required For Initial Verbal Report Written Report
Alaska Oil and Gas Conservation Commission
Oil spills of ≥10 barrels from an oil drilling, production, injection, or abandonment operation in Alaska
Immediately Preliminary report within 5 days after release; final report within 30 days after release
Alaska Department of Natural Resources
Spills on State mineral leases, pipeline rights-of-way, and lands
As required by lease or permit As required by lease or permit
Canada Federal Government and Government of the Northwest Territories
GNWT EPS (Serves as single point of spill notification for:
• National Energy Board
• Environment Canada
• Department of Indian Affairs and Northern Development
• Coast Guard Canada, and
• Inuvialuit Lands Administration)
Oil spills of 100 liters ( 26.4 gallons) and larger.
Immediately Within 15 days after end of cleanup
18
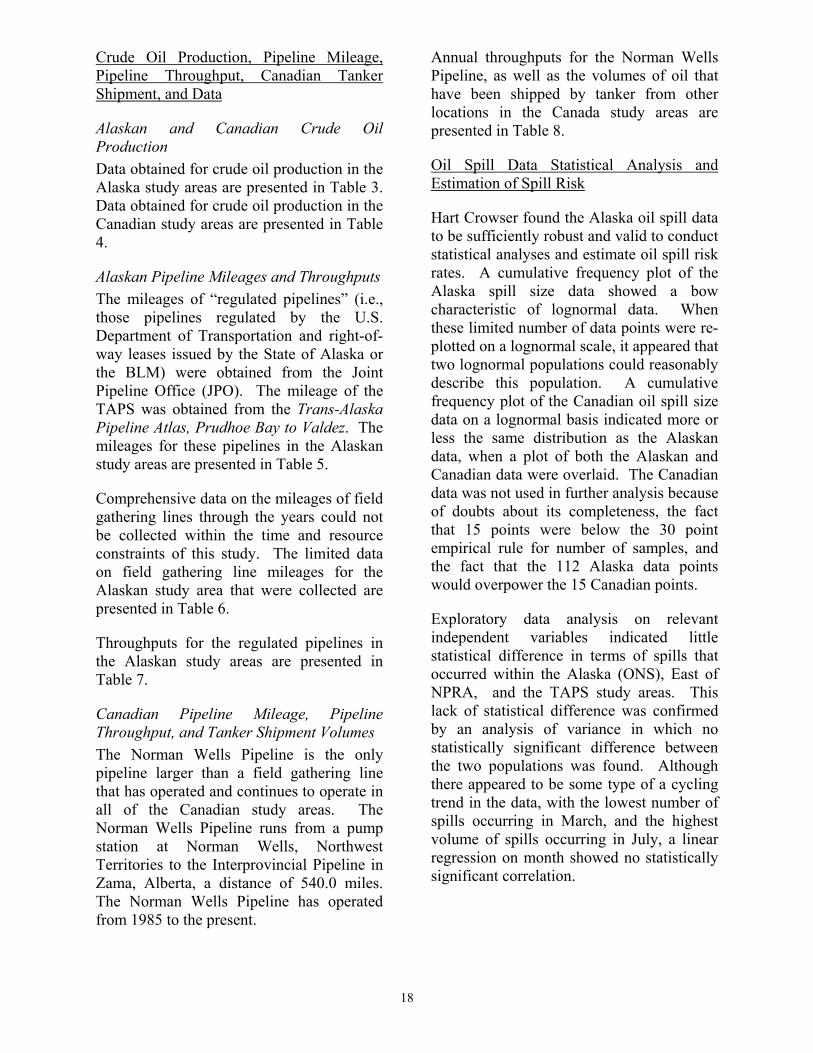
Crude Oil Production, Pipeline Mileage, Pipeline Throughput, Canadian Tanker Shipment, and Data
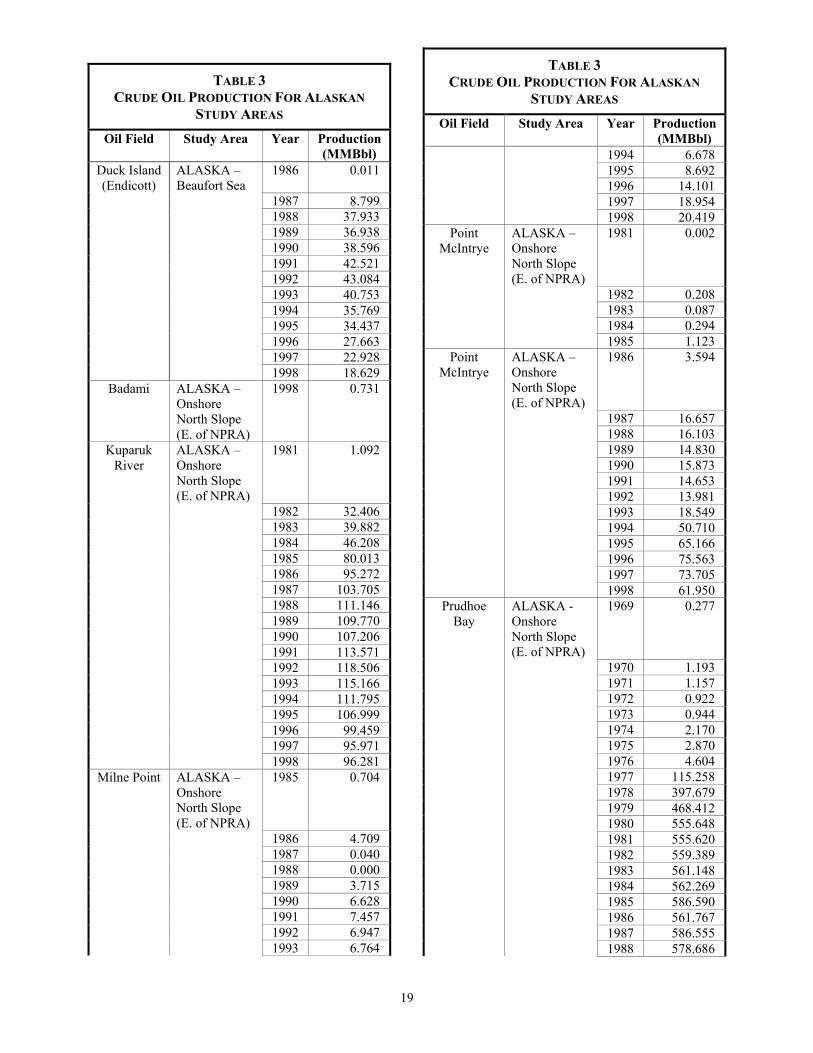
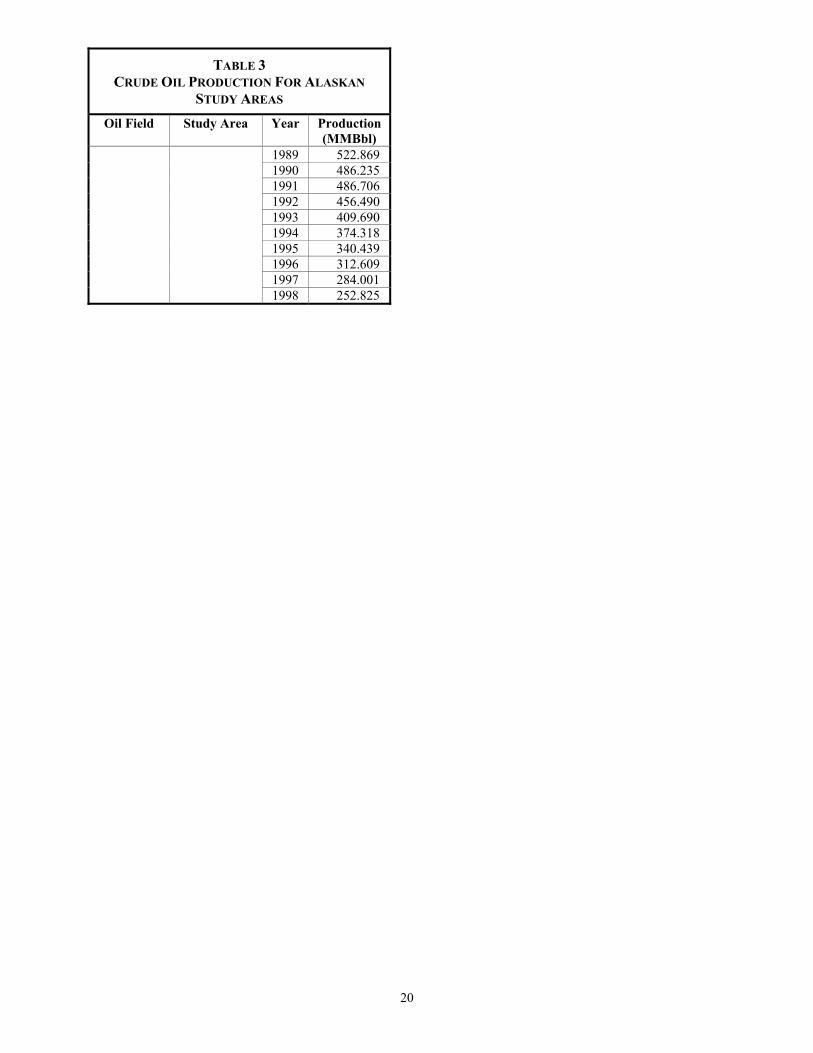
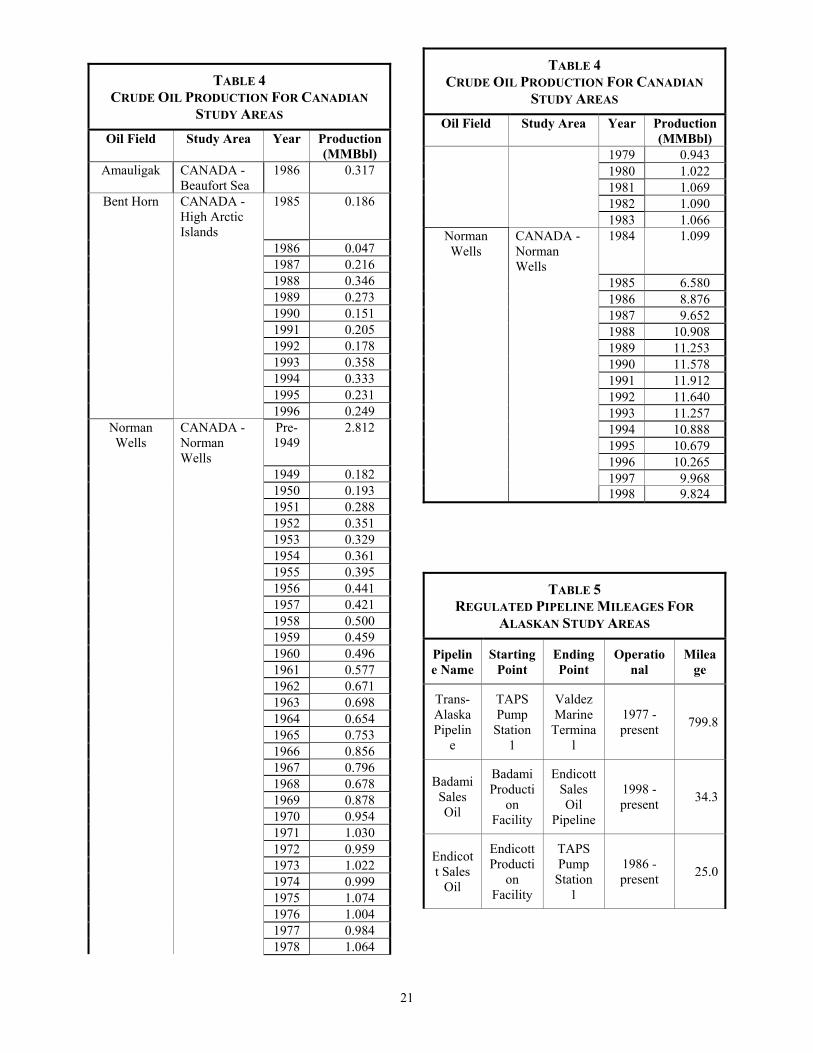
Alaskan and Canadian Crude Oil Production Data obtained for crude oil production in the Alaska study areas are presented in Table 3. Data obtained for crude oil production in the Canadian study areas are presented in Table 4.
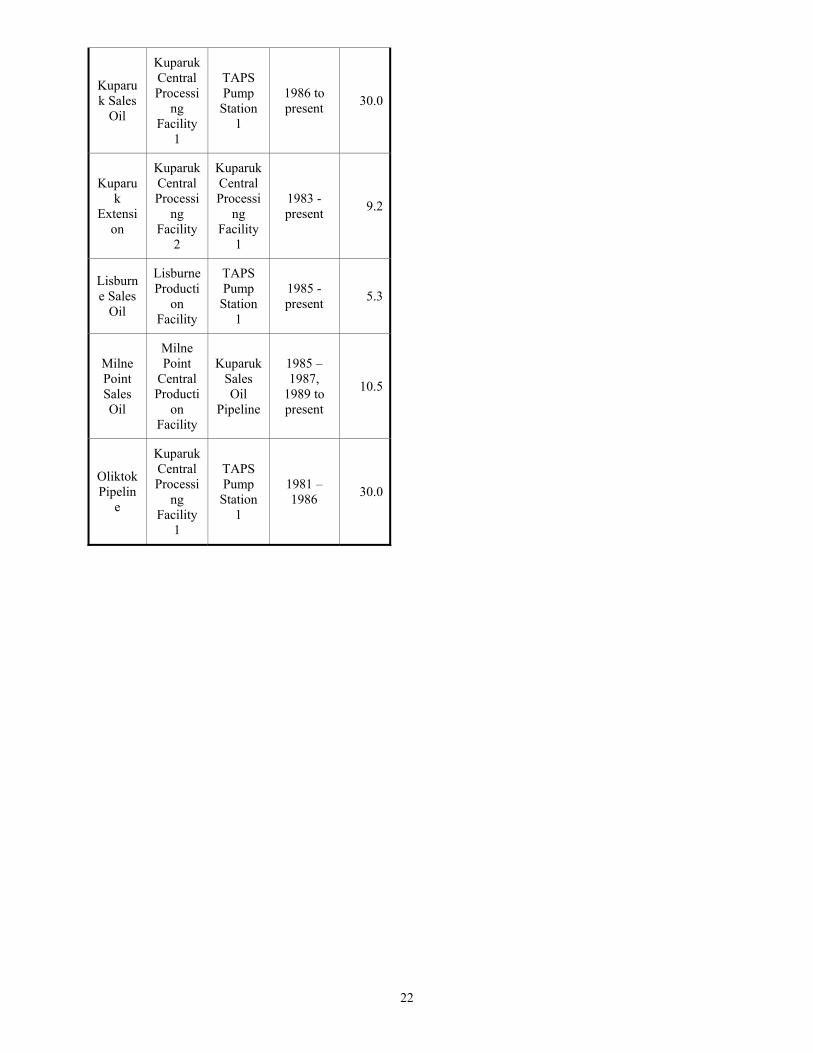
Alaskan Pipeline Mileages and Throughputs The mileages of “regulated pipelines” (i.e., those pipelines regulated by the U.S. Department of Transportation and right-of-way leases issued by the State of Alaska or the BLM) were obtained from the Joint Pipeline Office (JPO). The mileage of the TAPS was obtained from the Trans-Alaska Pipeline Atlas, Prudhoe Bay to Valdez. The mileages for these pipelines in the Alaskan study areas are presented in Table 5.
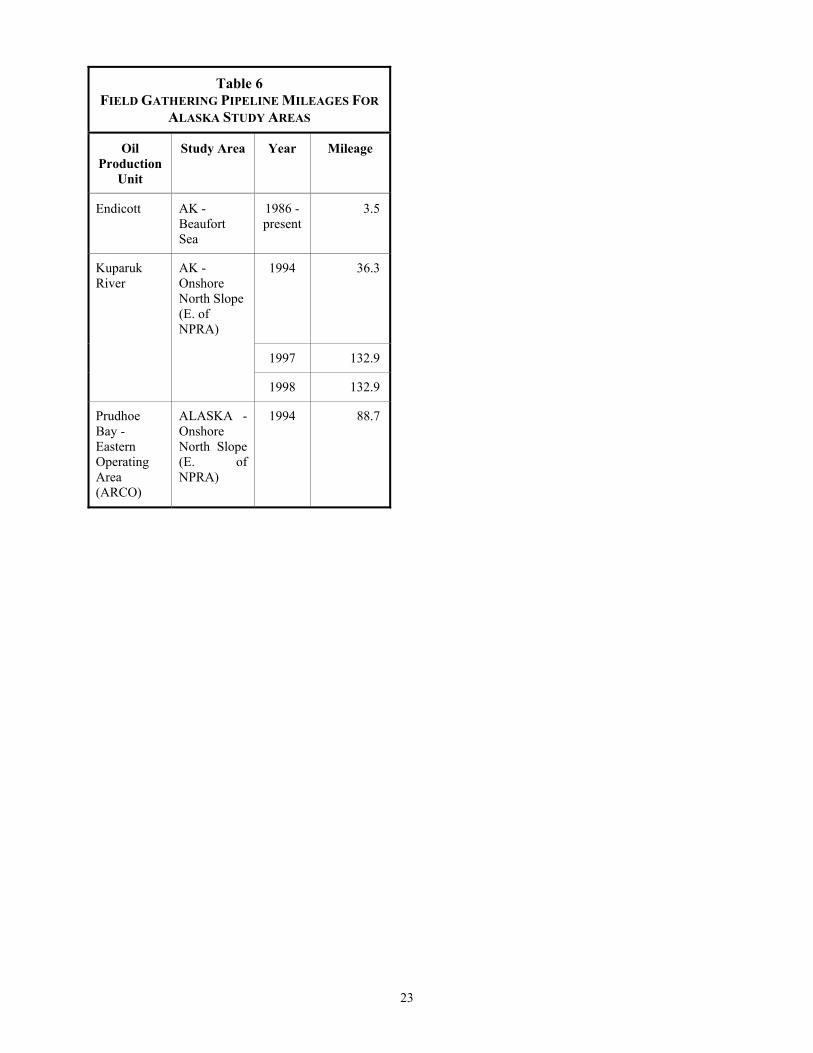
Comprehensive data on the mileages of field gathering lines through the years could not be collected within the time and resource constraints of this study. The limited data on field gathering line mileages for the Alaskan study area that were collected are presented in Table 6.
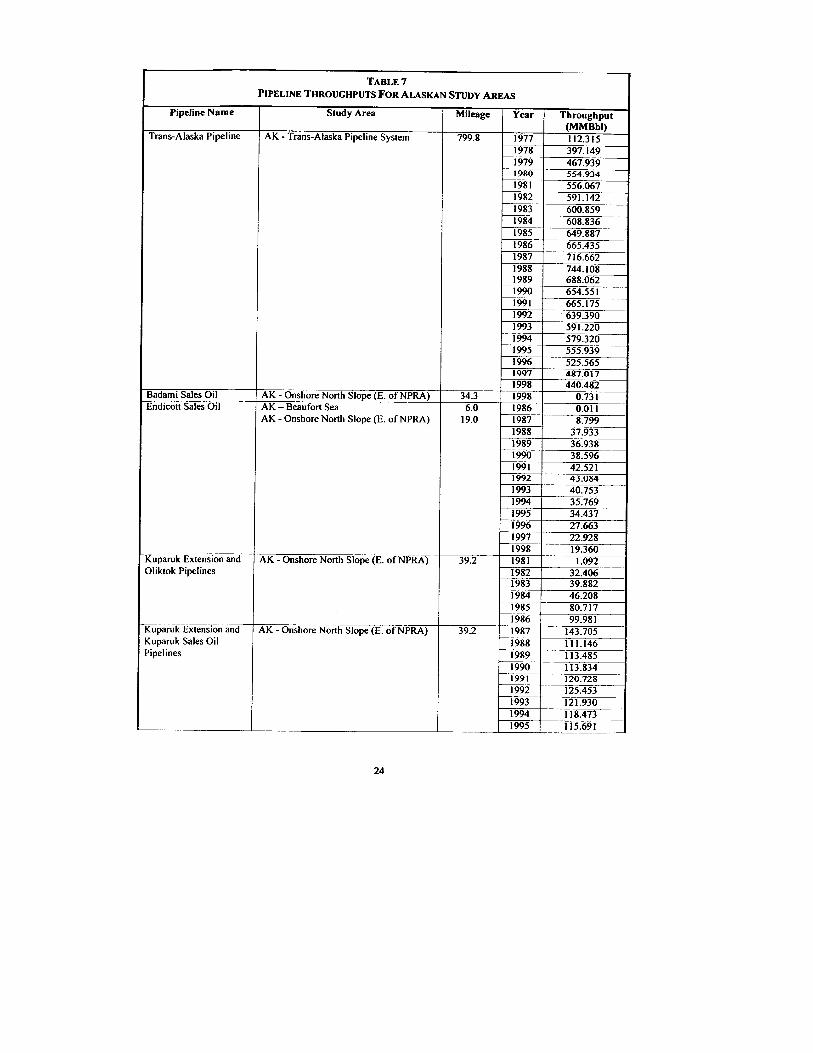
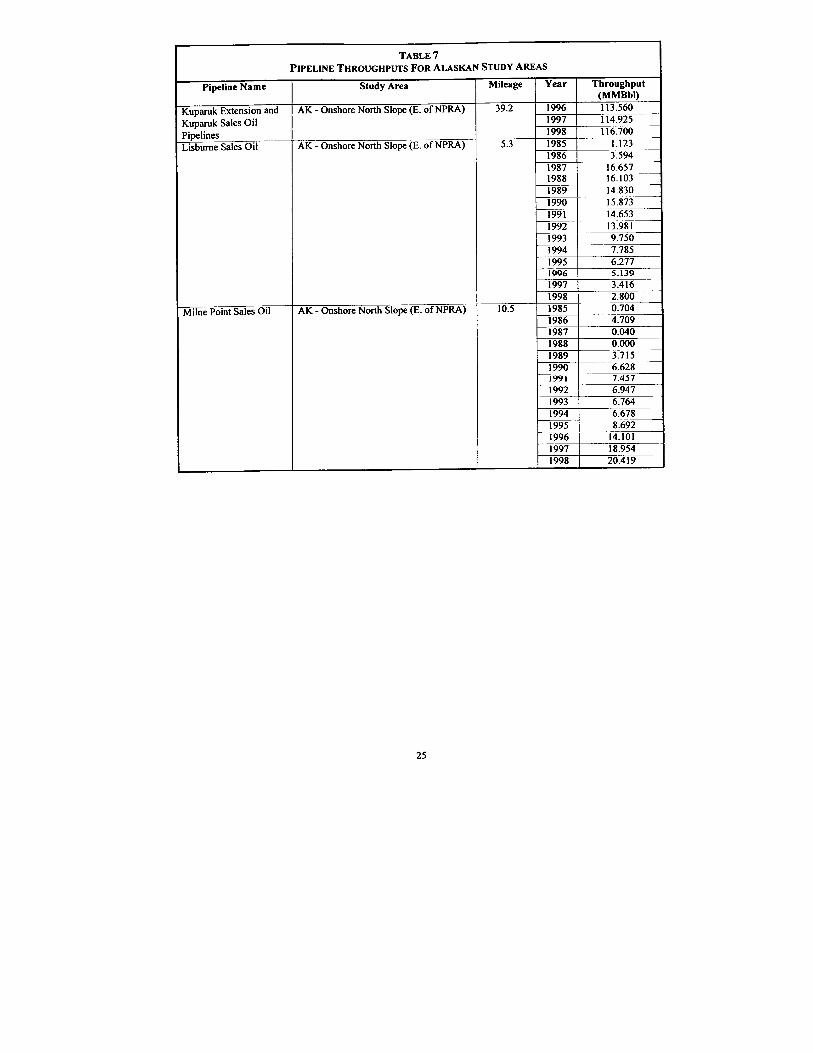
Throughputs for the regulated pipelines in the Alaskan study areas are presented in Table 7.
Canadian Pipeline Mileage, Pipeline Throughput, and Tanker Shipment Volumes The Norman Wells Pipeline is the only pipeline larger than a field gathering line that has operated and continues to operate in all of the Canadian study areas. The Norman Wells Pipeline runs from a pump station at Norman Wells, Northwest Territories to the Interprovincial Pipeline in Zama, Alberta, a distance of 540.0 miles. The Norman Wells Pipeline has operated from 1985 to the present.
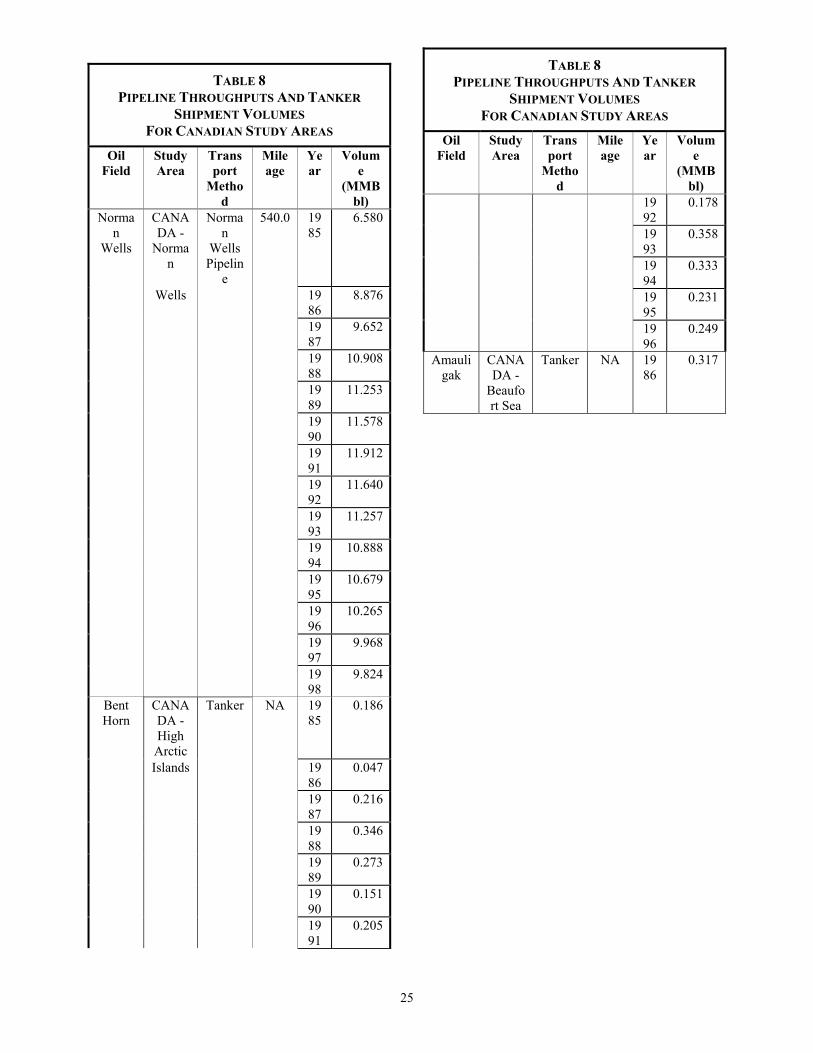
Annual throughputs for the Norman Wells Pipeline, as well as the volumes of oil that have been shipped by tanker from other locations in the Canada study areas are presented in Table 8.
Oil Spill Data Statistical Analysis and Estimation of Spill Risk
Hart Crowser found the Alaska oil spill data to be sufficiently robust and valid to conduct statistical analyses and estimate oil spill risk rates. A cumulative frequency plot of the Alaska spill size data showed a bow characteristic of lognormal data. When these limited number of data points were re-plotted on a lognormal scale, it appeared that two lognormal populations could reasonably describe this population. A cumulative frequency plot of the Canadian oil spill size data on a lognormal basis indicated more or less the same distribution as the Alaskan data, when a plot of both the Alaskan and Canadian data were overlaid. The Canadian data was not used in further analysis because of doubts about its completeness, the fact that 15 points were below the 30 point empirical rule for number of samples, and the fact that the 112 Alaska data points would overpower the 15 Canadian points.
Exploratory data analysis on relevant independent variables indicated little statistical difference in terms of spills that occurred within the Alaska (ONS), East of NPRA, and the TAPS study areas. This lack of statistical difference was confirmed by an analysis of variance in which no statistically significant difference between the two populations was found. Although there appeared to be some type of a cycling trend in the data, with the lowest number of spills occurring in March, and the highest volume of spills occurring in July, a linear regression on month showed no statistically significant correlation.
19
TABLE 3 CRUDE OIL PRODUCTION FOR ALASKAN
STUDY AREAS
Oil Field Study Area Year Production (MMBbl)
Duck Island (Endicott)
ALASKA – Beaufort Sea
1986 0.011
1987 8.799 1988 37.933 1989 36.938 1990 38.596 1991 42.521 1992 43.084 1993 40.753 1994 35.769 1995 34.437 1996 27.663 1997 22.928 1998 18.629
Badami ALASKA – Onshore North Slope (E. of NPRA)
1998 0.731
Kuparuk River
ALASKA – Onshore North Slope (E. of NPRA)
1981 1.092
1982 32.406 1983 39.882 1984 46.208 1985 80.013 1986 95.272 1987 103.705 1988 111.146 1989 109.770 1990 107.206 1991 113.571 1992 118.506 1993 115.166 1994 111.795 1995 106.999 1996 99.459 1997 95.971 1998 96.281
Milne Point ALASKA – Onshore North Slope (E. of NPRA)
1985 0.704
1986 4.709 1987 0.040 1988 0.000 1989 3.715 1990 6.628 1991 7.457 1992 6.947 1993 6.764
TABLE 3 CRUDE OIL PRODUCTION FOR ALASKAN
STUDY AREAS
Oil Field Study Area Year Production (MMBbl)
1994 6.678 1995 8.692 1996 14.101 1997 18.954 1998 20.419
Point McIntrye
ALASKA – Onshore North Slope (E. of NPRA)
1981 0.002
1982 0.208 1983 0.087 1984 0.294 1985 1.123
Point McIntrye
ALASKA – Onshore North Slope (E. of NPRA)
1986 3.594
1987 16.657 1988 16.103 1989 14.830 1990 15.873 1991 14.653 1992 13.981 1993 18.549 1994 50.710 1995 65.166 1996 75.563 1997 73.705 1998 61.950
Prudhoe Bay
ALASKA - Onshore North Slope (E. of NPRA)
1969 0.277
1970 1.193 1971 1.157 1972 0.922 1973 0.944 1974 2.170 1975 2.870 1976 4.604 1977 115.258 1978 397.679 1979 468.412 1980 555.648 1981 555.620 1982 559.389 1983 561.148 1984 562.269 1985 586.590 1986 561.767 1987 586.555 1988 578.686
20
TABLE 3 CRUDE OIL PRODUCTION FOR ALASKAN
STUDY AREAS
Oil Field Study Area Year Production (MMBbl)
1989 522.869 1990 486.235 1991 486.706 1992 456.490 1993 409.690 1994 374.318 1995 340.439 1996 312.609 1997 284.001 1998 252.825
21
TABLE 4 CRUDE OIL PRODUCTION FOR CANADIAN
STUDY AREAS
Oil Field Study Area Year Production (MMBbl)
Amauligak CANADA - Beaufort Sea
1986 0.317
Bent Horn CANADA - High Arctic Islands
1985 0.186
1986 0.047 1987 0.216 1988 0.346 1989 0.273 1990 0.151 1991 0.205 1992 0.178 1993 0.358 1994 0.333 1995 0.231 1996 0.249
Norman Wells
CANADA - Norman Wells
Pre-1949
2.812
1949 0.182 1950 0.193 1951 0.288 1952 0.351 1953 0.329 1954 0.361 1955 0.395 1956 0.441 1957 0.421 1958 0.500 1959 0.459 1960 0.496 1961 0.577 1962 0.671 1963 0.698 1964 0.654 1965 0.753 1966 0.856 1967 0.796 1968 0.678 1969 0.878 1970 0.954 1971 1.030 1972 0.959 1973 1.022 1974 0.999 1975 1.074 1976 1.004 1977 0.984 1978 1.064
TABLE 4 CRUDE OIL PRODUCTION FOR CANADIAN
STUDY AREAS
Oil Field Study Area Year Production (MMBbl)
1979 0.943 1980 1.022 1981 1.069 1982 1.090 1983 1.066
Norman Wells
CANADA - Norman Wells
1984 1.099
1985 6.580 1986 8.876 1987 9.652 1988 10.908 1989 11.253 1990 11.578 1991 11.912 1992 11.640 1993 11.257 1994 10.888 1995 10.679 1996 10.265 1997 9.968 1998 9.824
TABLE 5 REGULATED PIPELINE MILEAGES FOR
ALASKAN STUDY AREAS
Pipeline Name
Starting Point
Ending Point
Operational
Mileage
Trans-Alaska Pipelin
e
TAPS Pump
Station 1
Valdez Marine Termina
l
1977 - present 799.8
Badami Sales Oil
Badami Producti
on Facility
Endicott Sales Oil
Pipeline
1998 - present 34.3
Endicott Sales
Oil
Endicott Producti
on Facility
TAPS Pump
Station 1
1986 - present 25.0
22
Kuparuk Sales
Oil
Kuparuk Central Processi
ng Facility
1
TAPS Pump
Station 1
1986 to present 30.0
Kuparuk
Extension
Kuparuk Central Processi
ng Facility
2
Kuparuk Central Processi
ng Facility
1
1983 - present 9.2
Lisburne Sales
Oil
Lisburne Producti
on Facility
TAPS Pump
Station 1
1985 - present 5.3
Milne Point Sales Oil
Milne Point
Central Producti
on Facility
Kuparuk Sales Oil
Pipeline
1985 – 1987,
1989 to present
10.5
Oliktok Pipelin
e
Kuparuk Central Processi
ng Facility
1
TAPS Pump
Station 1
1981 – 1986 30.0
23
Table 6
FIELD GATHERING PIPELINE MILEAGES FOR ALASKA STUDY AREAS
Oil Production
Unit
Study Area Year Mileage
Endicott AK - Beaufort Sea
1986 - present
3.5
Kuparuk River
AK - Onshore North Slope (E. of NPRA)
1994 36.3
1997 132.9
1998 132.9
Prudhoe Bay - Eastern Operating Area (ARCO)
ALASKA - Onshore North Slope (E. of NPRA)
1994 88.7
25
TABLE 8 PIPELINE THROUGHPUTS AND TANKER
SHIPMENT VOLUMES FOR CANADIAN STUDY AREAS
Oil Field
Study Area
Transport
Method
Mileage
Year
Volume
(MMBbl)
Norman
Wells
CANADA -
Norman
Norman
Wells Pipelin
e
540.0 1985
6.580
Wells 1986
8.876
1987
9.652
1988
10.908
1989
11.253
1990
11.578
1991
11.912
1992
11.640
1993
11.257
1994
10.888
1995
10.679
1996
10.265
1997
9.968
1998
9.824
Bent Horn
CANADA - High Arctic
Tanker NA 1985
0.186
Islands 1986
0.047
1987
0.216
1988
0.346
1989
0.273
1990
0.151
1991
0.205
TABLE 8 PIPELINE THROUGHPUTS AND TANKER
SHIPMENT VOLUMES FOR CANADIAN STUDY AREAS
Oil Field
Study Area
Transport
Method
Mileage
Year
Volume
(MMBbl)
1992
0.178
1993
0.358
1994
0.333
1995
0.231
1996
0.249
Amauligak
CANADA -
Beaufort Sea
Tanker NA 1986
0.317
26
A general check on the fluctuation of the data set, as seen in a plot of the logarithm of thespill size versus the day of the month indicated spill occurrence to be quite random. There was little trend seen in the median of the data for a box plot of the logarithm of the spill size versus the year, with the exception of 1979, which was higher. However, an analysis of variance of this data showed no statistically significant difference between the years. There appeared to be little difference in the size of spills between the types of spills associated with the various facilities, with the exception of pipelines, which had larger spills. Analysis of variance by oil type showed that, in general crude oil spills tend to be larger than other types of oil spills.
Cumulative frequency plots by selected independent variables show that:
• Spills within the TAPS study area appears to be a fairly clear mixture of two lognormal populations;
• Spills within the ONS study area shows more bowing, indicating perhaps a single population;
• Spills from tank vehicles exhibit little apparent variability in a box plot, which is more or less consistent with the fact that a tank vehicle spill should be expected to have a firm upper limit;
• Spills from facility piping exhibit a bow, but no clear break in population;
• Spills from pipeline leaks indicate what may be a single lognormal population and, in general, appear to be the largest in quantity;
• Spills from facility tank leaks exhibit a single lognormal population;
• Spills from unspecified causes also exhibit a single lognormal population; and
• Spills from other causes had such a small number of data points that no definite conclusions could be drawn, but overlaying the figure for unspecified causes indicated that these two spill cause categories can probably reasonably be lumped together as a single population for statistical analysis.
Cumulative frequency plots of the logarithms of spill volume versus oil type showed that the data for spills involving:
• Diesel fuel data appears to be a mixture of two lognormal populations;
• Crude oil data appears to be a mixture of two lognormal populations;
• Gasoline data appears to show a single lognormal population with one possible outlier, which is consistent with a mixture of two lognormal populations; and
• Turbine and jet fuel data also shows what may be a mixture of two lognormal populations.
Cumulative frequency plots of the logarithms of spill volume versus the type of facility where a spill occurred showed that the data for spills from:
• Highways are very similar to the tank vehicle spills, which is entirely consistent with the assumption that most, if not all, highway spills are from tank vehicles;
• Support facilities was a bowed lognormal population;
• Production facilities appear to show a single lognormal population;
• Construction camps appear to show a mixture of two lognormal populations; and
27
• Pipelines could be interpreted as a single lognormal population.
Cumulative frequency plots of the log of spill volume versus the affected environmental media showed that spills:
• Affecting land is a mixture of two lognormal populations;
• Affecting land and water shows a mixture of two lognormal populations;
• Contained within a secondary containment area, appeared to be a single lognormal population; and
• Where the affected media was unspecified appears to be a single lognormal population.
There were no spills that affected water only.
A statistical analysis of individual spill volumes by study area, facility type, oil type, affected media and spill cause combined did not indicate any particularly interesting correlation. Annualized groupings of spills, where total spill volumes by year were accumulated and plotted on a cumulative frequency plot, showed a mixture of several populations. Re-plotted on a logarithmic scale, a single lognormal population emerged. A count of the number of spills per year in the database is showed a possible Poisson distribution, but that hypothesis was not tested.
When spill size was plotted by year to see if regulatory or reporting requirements had a significant affect, it appeared that in the period from 1975 to 1979 there were a considerable number of large spills, and then the number of spills dropped to a more or less constant rate. The year of 1977 is significant because crude oil production on North Slope and operation of TAPS began in the middle of that year. However, the years of 1978 and 1979 visually fit with
years of 1975 and 1977 better than breaking the data at 1977. The 1975 to 1979 period appears to have the most number of spills.
When Alaskan spill data were plotted on a yearly basis, it appears that prior to 1977, spill rates were considerably greater than in the subsequent years. When re-plotted on a logarithmic scale, it is apparent that prior to 1980 spill rates were considerably greater than after 1980.
Hart Crowser calculated oil spill risk rates based on the number of spills and on volume. Hart Crowser calculated a rate based on volume because of the greater visual variability in the data. The statistical significance of this visual analysis showed a highly statistically significant correlation with spill rate and year if all of the Alaska spill data is included. If data earlier than 1980 is excluded, then there is still a correlation between spill rate and year that is significant at the 1 percent level of confidence. However, if data earlier than 1985 is excluded, then there is a correlation between spill rate and year, which is significant at the 17 percent level of confidence.
Hart Crowser concluded that spill rate is the best variable to use in predicting the volume of further oil spills and that a rate of approximately 52 gallons of oil spilled per million barrels of crude oil produced will be the average, if trends that started in 1980 continue. This rate is subject to considerable uncertainty in the mean (± 50% at the 95% level of confidence) and the value derived from the logarithmic distribution is 66 gallons of oil spilled per million barrels of crude oil produced as opposed to 52 gallons of oil spilled per million barrels of crude oil produced. These two values agree within the standard deviation of the means. The 95 percent logarithmic confidence limits on spills for a given year are ± 465 percent at the 95 percent level of confidence. Hart Crowser is
28
more inclined to believe the logarithmic values than the untransformed values, because the cumulative frequency of the data is more lognormal than normal. These very wide confidence limits and individual yearly values are consistent with the small number of data points available for this prediction.
Hart Crowser also calculated oil spill risk rates based on the number of spills of a given volume per million barrels of crude oil produced (spills/MMBbl), using data from 1978 through 1999. Hart Crowser found these rates to be:
• 0.0053 spills/MMBbl, ±24 percent, for spills of 100 barrels and greater;
• 0.00093 spills/MMBbl, ±58 percent, for spills of 500 barrels and greater;
• 0.00039 spills/MMBbl, ±89 percent, for spills of 1,000 barrels and greater; and
• 0.000078 spills/MMBbl, ±200 percent, for spills of 10,000 barrels and greater.
29
DISCUSSION
Oil Spill Data Collection
Alaska Oil Spill Data Hart Crowser believed that ADEC would be the best potential source of oil spill records for Alaska because, since the Department was established in 1971, the agency has received reports, investigated, and overseen the cleanup of oil spills in Alaska. Hart Crowser received and reviewed copies of electronic spreadsheet files from ADEC and from the MMS that contained data on oil spills from a past (1986 – 1995) and a current (1995 – present) agency oil and hazardous substance spill database.
Through inquiries to ADEC staff, Hart Crowser researchers identified the location of relevant written oil spill files, and then traveled to ADEC’s Fairbanks and Valdez offices, to review those files. During the file reviews, Hart Crowser sought to identify oil spills that met the study criteria, record pertinent data from the spill records, and obtain documentation from the files for spills of 500 barrels or greater.
With respect to ADEC’s oil spill files and databases, Hart Crowser researchers observed that:
• Not all reported oil spills prior to July 1995 have been entered into ADEC’s current oil and hazardous substance spill database, which has been used since July 1995. In 1996, ADEC attempted to have all historical oil and hazardous substance spill information reviewed and entered into the database. However, the project was not conducted for several reasons, including the large number of historical records and the incomplete status of many historical records.
• Not all reported oil spills were entered into the older ADEC
Northern Regional Office oil and hazardous substance spill database, which was used from approximately 1986 to July 1995. Hart Crowser found several oil spill reports in the agency’s files that met the criteria for inclusion in this study, but which were not included in the agency’s database.
• Most initial and final oil spill reports and most other spill documentation do not describe how spill quantities were determined. In most cases, spill quantities appeared to be estimates. Some estimates are more accurate because the quantity of oil that may have been spilled is known (e.g., the capacity of a tank vehicle and the amount of oil that remained inside after an accident). Some spill estimates are calculated based on the size of the hole that allowed oil to escape, the pressure of the oil within the pipe or tank, the known or estimated duration of the leak, and the amount of oil recovered during spill cleanup. In other cases, spill sizes are rough estimates because the rate and duration of oil loss could not be accurately determined and the amount of oil recovered was not documented.
• Some oil spill reports contained incomplete information that did not allow them to be included in the study database. For oil spill records where the quantity of oil spilled, the location of the spill, or a connection to oil industry activities was not given or could not be determined, data on the spill was recorded, but the spill was not included in the study.
Canadian Oil Spill Data
30
Hart Crowser’s inquiries to Canadian government agencies for oil spill data resulted in referrals to the Government of the Northwest Territories, Environmental Protection Service (GNWT EPS) in Yellowknife, Northwest Territories. The GNWT EPS appears to be the sole repository of Canadian oil spill data for the areas of interest in this study. Hart Crowser was prepared to travel to Yellowknife and review the GNWT EPS oil spill files. However, GNWT EPS staff assured Hart Crowser that all requested oil spill documentation available in the agency’s files would be transmitted to Hart Crowser.
The GNWT EPS has maintained an oil and hazardous substance spill database since the early 1980s. Hart Crowser first obtained summary reports of oil spills of 100 barrels and larger from the agency's database, then obtained all written documentation from GNWT EPS for those oil spills that Hart Crowser determined either met or might meet the study criteria.
Hart Crowser also reviewed two summary reports of oil spills covering the years 1974 through 1995, published by Environment Canada, and seven Northern Oil and Gas Annual Reports from 1992 to 1998, published by the Department of Indian Affairs and Northern Development (DIAND, also known as Indian and Northern Affairs Canada) to look for additional data on oil spills associated with oil industry activities in the Canadian Arctic.
A summary of oil spills as reported by the OSIR, supplied by the MMS was reviewed for potential data on oil spills in the Canadian study areas. Data in this summary was found to correspond to information OSIR’s publications, Oil Spills: International Summary and Review 1978-1981 and Oil Spills: International Summary and Review 1982-1986.
Evaluation and Collation of Oil Spill Data
Different oil spill data sets (i.e., oil spill data obtained from different sources) were compared with one another to evaluate the overall comprehensiveness and completeness of the data and to develop a single collated list of oil spills. To develop the collated list of spills, the spill records from the different data sets were compared with one another and data for each spill was combined into a single record for each spill. Differences in data between spill records in the different data sets, including reported spill dates, locations, responsible parties, oil type, and spill quantity were reconciled. Where different oil spill quantities were reported in two or more different data sets, or the spill quantity was reported as a range, the spill quantity was reported as a range in the collated list of spills.
The database for the oil spill records included in the study includes data fields for:
• Record source (the organization where an oil spill record was obtained);
• Study area (designating which of the eight study areas a spill occurred within);
• Spill date; • Facility type (ten categories of
facility types were developed by Hart Crowser; one type was assigned to each spill report);
• Facility operator (company or organization that operates the facility where the spill occurred);
• Spiller (company or organization named as responsible for the spill);
• Spill name (if a spill is commonly referred to by a name);
• Oil type (six categories of oil types were developed by Hart Crowser;
31
one type was assigned to each spill report);
• Location (a brief description of where the spill occurred);
• Latitude and longitude; • Spill cause (a brief description of
what caused the spill); • Low and high spill quantity (in
gallons); • How the spill quantity was
determined; and • Affected environmental media.
The facility type categories attempt to designate the facility where the spill
occurred to allow analysis by this field. The facility type categories are:
• Construction camp; • Exploration support facility; • Exploration well site; • Highway; • Operations support facility; • Pipeline; • Pipeline pump station; • Production processing facility; • Production well site; and • Unspecified.
The oil type field categories assigned are:
• Crude oil; • Crude oil and produced water;
• Diesel/heating oil; • Gasoline; • Jet/turbine fuel; and • Unspecified.
Because of their similarities, diesel fuel and heating oil, and jet fuel and turbine fuel, were combined into single categories.
The affected media field records whether an individual oil spill affected land, water, or both. Spills contained in buildings, on gravel pads, or in impoundments such as secondary containment structures were included in the all-record and collated spill databases. These spills were designated as having affected “land” with a subsequent notation of how the spill was contained.
Data in the record source, study area, and facility type fields were assigned by Hart Crowser, based on information in the spill records, answers to inquiries, or personal knowledge. Data in fields such as facility operator, spiller, spill name, oil type, spill location descriptions, and the units of measure used in oil spill quantity were standardized as much as possible among the data sets to facilitate comparisons of individual spills between data sets.
The collated database includes the same data fields as the database for all spills, with the exception that the record source field was eliminated and multiple fields were added to indicate the sources of the records for each spill.
The Alaskan oil spills observed most frequently are associated with highway tank vehicle accidents related to TAPS and North Slope oil field construction and operations support, followed by spills related to construction camps, other operations support facilities, and pipelines. Spills associated with oil production processing facilities, oil production wells, pipeline pump stations, and exploration activities also were identified. The most frequent oil spills of 100 barrels and greater in the Canadian study areas were associated with oil exploration
32
activities, oil production wells, and oil production processing facilities. Highway tank vehicle and pipeline spills also were identified.
As mentioned in the results section of the report, 77 oil spills in Alaska and 18 in Canada were not included in the study because Hart Crowser could not obtain sufficient information about them to determine whether or not they met all of the study criteria. These excluded spills do not detract from the validity of the oil spill data used to estimate oil spill risk. Spills of 100 barrels and larger occur relatively infrequent, and because of this, they are more readily noticed and are better reported to government agencies either by the responsible party or other people who see them or clean them up. These spills also are more highly publicized in news stories. Evidence that oil spills of 100 barrels and larger are well reported can be seen in the high frequency that their spill records appear in more than one data set.
The spills on the excluded list tend to be those for which there no corroborating evidence in other data sets to help in determining whether to include an individual spill or not. All but one oil spill excluded from the study database appear only in one data set. Where Hart Crowser was able to obtain additional information about spills on the excluded list, the information Hart Crowser obtained has eliminated spills from further consideration, rather than added spills to the study database. No spills from the list of excluded spills have been added to the database. Further research could be conducted to completely determine whether any of the remaining spills on the excluded list should be included in the study. However, there appears to be a low probability that sufficient data on these other spills would be uncovered or that many additional oil spills would be added to the study database by that further research.
Oil Spill Data Comprehensiveness and Completeness
For the period from 1970 through September 1999, the Alaskan oil spill data appears to be comprehensive. However, Hart Crowser is not confident that the same can be said for the Canada data. It appears that the Alaskan spills are better documented than those in Canada. The Alaskan spill data was obtained from ten different government agency, industry, and commercial sources. The different sources largely corroborated each other on more than 60 percent of the spills and helped to provide complete data for most spills. Spills reported in only one data set appear to exist either because the spiller is a party who did not provide data for this study or because the spill was reported by one party but not another because of differences in the estimated spill quantity. The comprehensiveness and completeness of the Alaskan spill data prior to the early 1970s is the most suspect, because ADEC was not fully functional and agencies such as JPO did not exist. Data on older oil spills may exist in the archived files of extinct State or Federal environmental pollution agencies, such as the Alaska Department of Health and Welfare or the Federal Water Pollution Control Agency.
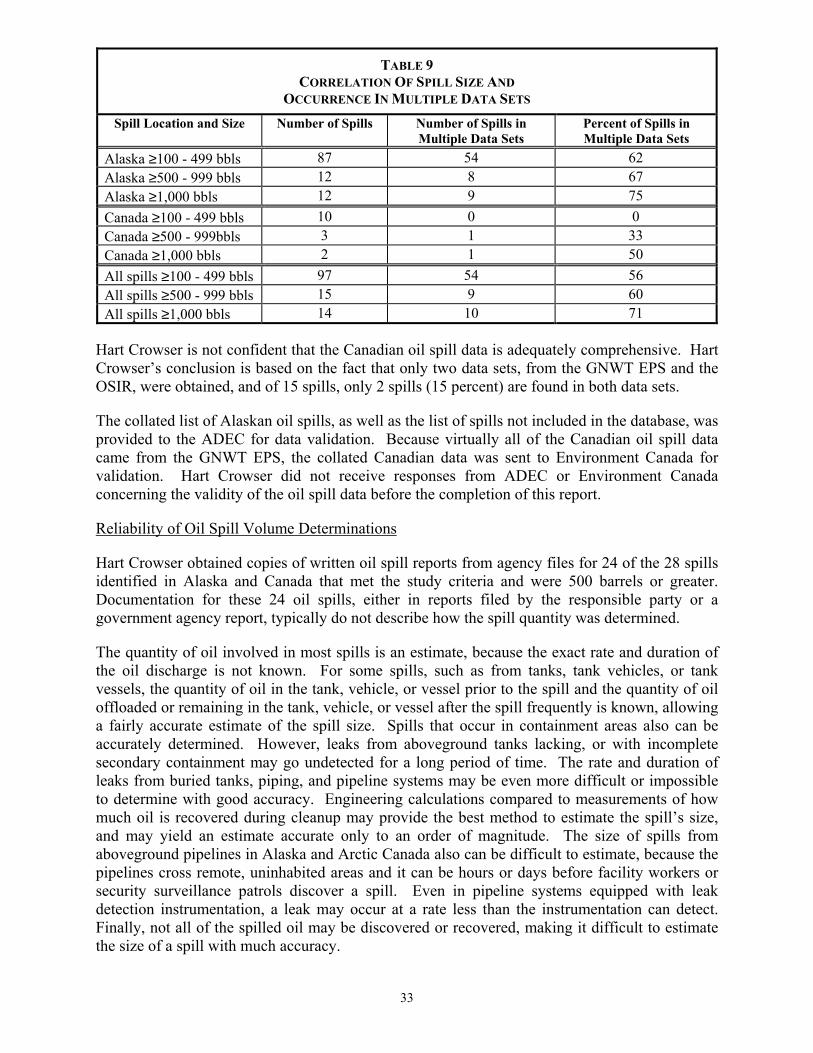
To see if there were differences between the size of a spill and its appearance in two or more data sets, the spills from the correlated spill database were compared against the various data sets to determine how many of the spills appeared in two or more data sets. Spills were divided into three basic size categories: 100 to 499 barrels, 500 to 999 barrels, and 1,000 barrels and larger. Table 9 presents the results of that evaluation. Overall, and individually, the Alaskan and Canadian data showed trends indicating that larger spills were more likely to occur in multiple data sets. The Canadian data showed greater differences between the 100 to 499 barrel and the other spill size categories, but with so few data points, Hart Crowser would not draw any conclusions from the Canadian data alone.
33
TABLE 9 CORRELATION OF SPILL SIZE AND
OCCURRENCE IN MULTIPLE DATA SETS Spill Location and Size Number of Spills Number of Spills in
Multiple Data Sets Percent of Spills in Multiple Data Sets
Alaska ≥100 - 499 bbls 87 54 62 Alaska ≥500 - 999 bbls 12 8 67 Alaska ≥1,000 bbls 12 9 75 Canada ≥100 - 499 bbls 10 0 0 Canada ≥500 - 999bbls 3 1 33 Canada ≥1,000 bbls 2 1 50 All spills ≥100 - 499 bbls 97 54 56 All spills ≥500 - 999 bbls 15 9 60 All spills ≥1,000 bbls 14 10 71
Hart Crowser is not confident that the Canadian oil spill data is adequately comprehensive. Hart Crowser’s conclusion is based on the fact that only two data sets, from the GNWT EPS and the OSIR, were obtained, and of 15 spills, only 2 spills (15 percent) are found in both data sets.
The collated list of Alaskan oil spills, as well as the list of spills not included in the database, was provided to the ADEC for data validation. Because virtually all of the Canadian oil spill data came from the GNWT EPS, the collated Canadian data was sent to Environment Canada for validation. Hart Crowser did not receive responses from ADEC or Environment Canada concerning the validity of the oil spill data before the completion of this report.
Reliability of Oil Spill Volume Determinations
Hart Crowser obtained copies of written oil spill reports from agency files for 24 of the 28 spills identified in Alaska and Canada that met the study criteria and were 500 barrels or greater. Documentation for these 24 oil spills, either in reports filed by the responsible party or a government agency report, typically do not describe how the spill quantity was determined.
The quantity of oil involved in most spills is an estimate, because the exact rate and duration of the oil discharge is not known. For some spills, such as from tanks, tank vehicles, or tank vessels, the quantity of oil in the tank, vehicle, or vessel prior to the spill and the quantity of oil offloaded or remaining in the tank, vehicle, or vessel after the spill frequently is known, allowing a fairly accurate estimate of the spill size. Spills that occur in containment areas also can be accurately determined. However, leaks from aboveground tanks lacking, or with incomplete secondary containment may go undetected for a long period of time. The rate and duration of leaks from buried tanks, piping, and pipeline systems may be even more difficult or impossible to determine with good accuracy. Engineering calculations compared to measurements of how much oil is recovered during cleanup may provide the best method to estimate the spill’s size, and may yield an estimate accurate only to an order of magnitude. The size of spills from aboveground pipelines in Alaska and Arctic Canada also can be difficult to estimate, because the pipelines cross remote, uninhabited areas and it can be hours or days before facility workers or security surveillance patrols discover a spill. Even in pipeline systems equipped with leak detection instrumentation, a leak may occur at a rate less than the instrumentation can detect. Finally, not all of the spilled oil may be discovered or recovered, making it difficult to estimate the size of a spill with much accuracy.
34
Of the 28 oil spills that are 500 barrels and greater, 8 involve pipeline leaks and 8 involve facility piping leaks. These types of spills are the most difficult to accurately estimate the size of because they may go undetected for long periods of time, the rate of spillage can be difficult to determine, and not all of the oil may be discovered or accounted for in cleanup. Two of the 28 spills involved facility explosions. The size of the spills associated with these explosions can be reasonably estimated because the time and rate of spillage can be calculated with some certainty. Another 7 of the 28 spills involve tank leaks, which also can be estimated with reasonable certainty because the quantity of oil involved in a spill can be accurately estimated from tank capacities, the tanks involved in these spills are located above ground, and, in most instances, the spills occurred within secondary containment areas. The final 3 of the 28 spills are from unspecified causes, and an assessment of the accuracy of the spill estimate cannot be made without further information.
Alaska Statutes, Title 46, Chapter 03, Section 758 (A.S. 46.03.758), enacted in 1977, authorizes state courts to assess civil penalties, based the quantity and toxicity of the oil, and the type of environment, against parties found that are found guilty of illegally discharging oil. This provision commonly is referred to as the “dollars per gallon” penalty. Depending on the toxicity of the oil and the type of environment involved, the basic penalties range from less than $1.00 to $10.00 per gallon. If gross negligence or intentional discharge is involved in the spill, or if the spiller fails to take reasonable steps to control, contain, and cleanup the spill, fines can be increased by a factor of five. ADEC adopted regulations in April 1978, found in Alaska Administrative Code, Title 18, Chapter 75, Article 6 (18 AAC 75.605 - 75.670), that establish a schedule to be used in calculating proposed fines under A.S. 46.03.758.
In addition to the civil fine provisions of A.S. 46.03.758, A.S. 46.030.759 establishes civil penalties for discharges of crude oil larger than 18,000 gallons. Under the crude oil penalty provisions, the court can assess a guilty party $8.00 per gallon for the first 420,000 gallons (1,000 barrels) spilled and $12.50 for every gallon over 420,000 gallons, regardless of the type of environment. Both statutory provisions allow a penalty to be reduced for every gallon of oil recovered and for mitigating circumstances. The provisions of A.S. 46.030.758 also allow the court to reduce a fine for an oil spill of less than 18,000 gallons to less than $500.
Because the dollar per gallon penalty provisions of A.S. 46.03.758 and 46.03 .759 apply only after a party has been found guilty of the illegal discharge of oil in a civil suit, a penalty can be reduced for specific reasons, and civil suits against oil spillers in Alaska are rare, ADEC does not routinely expend the effort to develop legally defensible estimates of the quantity of oil involved in each oil spill. In administrative enforcement actions that ADEC may take following an oil spill, such as a Compliance Order by Consent, any monetary restitution paid to the State as part of the Order may be based on the dollar per gallon penalty provisions and schedule, but are negotiated as part of settling a potential legal action.
No data concerning oil spills within the NPRA were obtained. Hart Crowser inquiries to BLM , the agency with surface management and protection responsibilities in NPRA since 1977, did not yield any oil spill data. Two publications that discussed oil exploration activities in NPRA did not identify any specific spills that met the size threshold for inclusion in this study and analysis4. Hanley5 wrote that when the Navy resumed oil exploration activities in NPRA in 1974, that there were chronic problems, which included minor fuel spills. He also states that
4 Hanley et. al. 1981 and Gryc 1985. 5 Hanley et. al. 1981, page 195.
35
while several fuel spills of 800 to 1,000 gallons in size occurred during the U.S. Department of the Interior’s exploration program beginning in 1977, spills of that size or larger had not occurred more recently (1979-1980)6. Gyrc7 wrote that there were a few minor fuel leaks and spills at drill sites and from mobile trains during the Department of the Interior’s exploratory activities from 1977 to 1982.
Current and Historical Oil Spill Notification Requirements
United States Federal Oil Spill Notification Requirements Federal oil spill notification requirements exist under the Federal Water Pollution Control Act (FWPCA), as amended by the Clean Water Act (CWA) amendments and the Oil Pollution Act of 1990 (OPA). Notification requirements also exist under the Comprehensive Environmental Response, Compensation, and Liability Act (CERCLA) as amended.
The FWPCA, enacted in 1948, prohibited the discharge of oil to the navigable waters. However, it was not until enactment of the CWA in 1972 that amendments were added which began to require notification of the U.S. Government for discharges of oil to the waters of the United States. Further amendments, which did not significantly change the notification requirements, were made in the CWA of 1977. Finally, OPA enacted in 1990 has further strengthened the FWPCA’s oil spill notification requirements and penalties.
Section 311(b)(6) of the CWA8 requires notification be made to the appropriate U.S. Government agency by the owner, operator, or person in charge of a vessel or an onshore or offshore facility that discharges oil into the navigable waters of the United States. EPA and the Coast Guard share oil spill notification and cleanup oversight or response responsibilities, based on whether the spill occurs in inland or marine waters. The Coast Guard has adopted oil discharge notification regulations that apply to vessels9. The EPA first adopted oil discharge notification regulations in September 1970. Prior to that time, there was no federal requirement to report oil spills promptly10. These regulations, found in 40 CFR 110, require that the owner, operator, or person in charge of a vessel or an onshore or offshore facility notify EPA when oil is discharged to the waters of the United States in a quantity that will be harmful11. The regulations define harmful quantity as the amount of oil that violates water quality standards or causes a film or sheen upon or discoloration of the surface of the water or adjoining shorelines or causes a sludge or emulsion to be deposited beneath the surface of the water or adjoining shorelines. It is known as the “sheen regulation.” EPA revised 40 CFR 110 in April 1987. These revisions modified the requirement that a spill be reported when the quantity of oil will be harmful, to when the quantity of oil may be harmful, and specified appropriate reporting requirements in terms of whether the discharge occurs in the territorial sea, the contiguous zone, or beyond 12 miles.
In 1997, the MMS also established oil spill notification requirements, under the authority of the CWA, for offshore oil for owners and operators of oil handling, storage, or transportation facilities that are located offshore of the coast line. The MMS requires the operator of an offshore facility to report to the NRC all oil spills from their facility, another offshore facility, 6 Hanley et. al. 1981, page 207. 7 Gyrc 1985, page C54. 8 33 USC 1321(b)(5) 9 33CFR 151.15 Reporting Requirements. 10 Federal Register, Volume 50, Page 9776 (50 FR 9776), March 11, 1985. 11 See 40 CFR 110.6.
36
and from unknown origins. An offshore facility operator also must report all spills known or thought to be 1 barrel or more in size from their facility also must be reported directly to the MMS, and a written follow-up report must be filed with MMS within 15 days after the spillage has stopped.
The CWA of 1972 established a criminal penalty for failure to notify the government of a discharge of oil. Upon conviction for a violation of the discharge notification requirement, the court could impose up to a $10,000 fine and, for a person, up to 1 year imprisonment12. These penalties were increased by OPA in 1990, making failure to report a discharge of oil a Class D felony, with a maximum penalty of a $250,000 fine and up to 5 years imprisonment for a person. OPA also added a maximum penalty of $250,000 fine and 15 years imprisonment, for a person convicted of multiple violations, and increased the maximum fine for an organization to $500,000.
Enactment of CERCLA in 1980 extended U.S. Government notification requirements to oil releases on land, provided that a discharge contains a hazardous substance identified by the Act above the established reportable quantity for the substance (e.g., the discharge of oil containing 10 pounds or more of benzene). The notification regulation adopted by EPA under CERCLA is found as part of the National Contingency Plan13. Discharge notifications to meet the requirements of either the FWPCA, for the Coast Guard or EPA, or CERCLA can be made through the NRC , a national clearinghouse, operated by the U.S. Coast Guard, for reporting all types of pollution incidents. The original penalty established in CERCLA for failure to report a discharge of a hazardous substance was a maximum fine of $10,000 and, for a person, up to 1 year imprisonment. In 1986, Congress increased the CERCLA’s penalties for failure to make the required notification, making the fine a maximum of $250,000 and increasing the imprisonment penalty to 3 years, with a maximum of 5 years for a second violation.
Alaska Oil Spill Notification Requirements Alaska’s current oil spill notification requirements, found in Title 18, Chapter 75, Section 300 (18 AAC 75.300), set out requirements for the reporting of both oil and hazardous substances spills based on the material, the quantity spilled, and whether the spill affects land or water. These notification requirements have been in effect, in much the same form, since April 1977. The underlying statutory authority for the regulation is found in Alaska Statutes Title 46, Chapter 03, Section 755 (AS46.03.755) Discharge Reporting, enacted by the Alaska Legislature in 1976.
Failure to report an oil spill as required by 18 AAC 75.300 and AS 46.03.755 is a Class A misdemeanor and, upon conviction, is punishable by:
• A $5,000 fine and up to 1 year imprisonment, if the defendant is a person; or
• A $200,000 fine or up to two times the pecuniary gain or loss that would be realized by the defendant as a result of the violation, if the defendant is an organization. From 1978 to 1990, the maximum fine for an organization was $100,000.
Prior to the adoption of 18 AAC 75.300 in 1977, Alaska’s oil spill notification requirement was found in older Alaska Department of Health and Welfare (ADHW) regulations which extended
12 33 USC 1321 (b)(5). 13 40 CFR 300.405 (b) Discovery or Notification.
37
back to at least 195914. The ADHW was the agency with primary responsibility for administering Alaska’s environmental laws prior to the Alaska Legislature’s creation of ADEC in 1971. The ADHW regulation required only the submittal of a written report for an oil spill within three days. No spill volume was specified in the notification requirement. The underlying statutory authority for the regulatory notification requirement appears to be general statutory prohibitions on environmental pollution15 and nuisances16. Penalties for failure to notify the state of an oil spill were a $100 to $500 fine and imprisonment of up to 30 days.
The Alaska Oil and Gas Conservation Commission (AOGCC) adopted regulations in 1980 that require the immediate notification of the AOGCC for uncontrolled accidental losses of oil that occur from oil drilling, production, injection, and abandonment activities. The existing regulations require notification for releases of greater than ten barrels. Prior to November 1999, the requirement called for the notification of any accidental loss. The penalties for failure to report an accidental loss to the AOGCC are the same as the penalties for failure to report a spill to the ADEC.
TAPS Right-of-Way Stipulations Both the State of Alaska and the federal right-of-way leases for the TAPS contain nearly identical notification requirements for oil spills from construction and operation of the pipeline. State of Alaska Stipulation 2.13.1 prohibits discharges of oil or other pollutants in violation of state law or regulations and requires the immediate reporting of any discharge to the Pipeline Coordinator and other state officials required by law to be given notice. State Stipulation 2.13.2 requires immediate notice of any spill or leakage from the pipeline, the Valdez Marine Terminal, and any storage or refueling facility and equipment to the Pipeline Coordinator and other state officials required by law to be given notice. An oral notification must be confirmed in writing as soon as possible.
Federal Stipulation 2.13.1 prohibits the discharge of oil into or upon the navigable waters of the United States, adjoining shorelines, or waters of the contiguous zone in violation of FWPCA as amended or the laws and regulations of the State of Alaska. The stipulation requires the immediate notification of discharges to the Department of the Interior Authorized Officer and other state and federal officials required by law to be notified. Federal Stipulation 2.13.2 requires immediate notice be given of any spill or leakage from the pipeline, the Valdez Marine Terminal, and any storage facility to the Authorized Officer and other state and federal officials required by law to be given notice. An oral notification must be confirmed in writing as soon as possible.
Other Federal and State Notification Requirements Federal and state land management agencies, including the BLM; Department of the Interior, Fish and Wildlife Service (USFWS); and the Alaska Department of Natural Resources also routinely require notification of spills that occur on lands under their administration. These notification requirements, similar to the TAPS right-of-way stipulations described above, typically are included as conditions of mineral leases, pipeline rights-of-way, and land use
14 7 AAC 01.02.04.501(h) 15 AS 46.03.710, and AS 46.05.170 prior to 1971. See 3Ch 120 SLA 1971. 16 AS 46.10.010 prior to 1971.
38
permits issued by the agencies. Because these types of notification requirements are not found in statutes or regulations, their current and historical requirements are not described in this report.
Canadian Notification Requirements
In Canada, statutes and regulations are first published in the Canada Gazettes and then consolidated every decade or so. Although consolidated statutes and regulations are cited, according to the Canada Department of Justice, consolidated statutes and regulations are not currently considered the official version. When consolidation occurs, the original year of enactment and early amendments are not necessarily carried forward. Information currently available from the regulatory agencies and the Canada Department of Justice was obtained, but further research into the full history of Canada’s oil spill notification requirements would require time-consuming research in the annual Canada Gazettes.
The latest consolidation of Canada’s statutes occurred in 1985 and is named the Revised Statutes of Canada (R.S.C.). The most recent consolidation of the regulations occurred in 1978 and is named the Consolidated Regulations of Canada (C.R.C.). Lowercase “c” is the abbreviation for chapter and lowercase “s” is the abbreviation for section in the regulations. Statutory Orders and Regulations (S.O.R.) refer to the regulations enacted between consolidations. Specific acts and accompanying regulations that contain oil spill notification requirements are discussed below.
Fisheries Act The Fisheries Act (R.S.C. 1985, c. F-14.81) is the primary federal means of managing water resources by protecting fish and fish habitat in Canadian waters. This Act originally was enacted no later than 1973. The current Fisheries Act sets penalties as high as $1 million in fines and three years in jail, depending on which offense is alleged, and whether the prosecution proceeds by way of a summary proceeding or by indictment.
Canada Oil and Gas Operations Act The Canada Oil and Gas Production and Conservation Act, which was amended by the Canada Petroleum Resources Act (which also repealed the Canada Oil and Gas Act), became the Canada Oil and Gas Operations Act (R.S.C. 1985, c. O-7). The Canada Oil and Gas Operations Act was enacted no later than 1979. According to definitions in this Act, “‘former regulations’ means the Canada Oil and Gas Land Regulations made pursuant to the Public Lands Grants Act and the Territorial Lands Act and includes orders made pursuant to those Regulations.”
Section 25 of the Oil and Gas Operations Act includes the duty to report spills:
“Where a spill occurs in any area to which this Act applies, any person who at the time of the spill is carrying on any work or activity related to the exploration for or development or production of oil or gas in the area of the spill shall, in the manner prescribed by the regulations, report the spill to the Chief Conservation Officer.”
Liability is assigned to persons involved, to the extent determined, according to the degree of fault or negligence proved against them.
Canada Oil and Gas Drilling and Production Regulations (C.R.C. 1978, c.1517) are part of the Territorial Lands Act and were adopted no later than 1978. These regulations govern oil and natural gas drilling and production procedures. If an accident occurs, such as a well flowing out of control, or any breaks or leaks in tanks or pipelines from which any serious loss of oil occurs,
39
the license owner/operator must report to the Oil Conservation Engineer immediately by telegraph, telephone or radio, with subsequent letter confirmation. Violations of the regulations can result in cancellations of licenses, permits, or leases. A “serious loss of oil” has not been defined in the regulations or in subsequent guidance issued by the NEB.
Canada Oil and Gas Drilling Regulations (SOR/79-82), adopted in 1979, are part of the Canada Oil and Gas Operations Act, and primarily address oil and natural gas drilling programs. If a significant event occurs, such as a spill, notification to the Chief Safety Officer or the Chief Conservation Officer is required. A “significant event” has not been defined in the regulations or in subsequent guidance. Failure to report a spill is considered an offense and the penalties for a violation are assumed to be as described in the Act.
Canada Oil and Gas Operations Regulations (SOR/83-149), adopted in 1983, also are part of the Canada Oil and Gas Operations Act and primarily govern operating license requirements. These regulations also require oil spills to be reported. Penalties are not included in this regulation, but are assumed to be as described in the Act.
The Canada Oil and Gas Production and Conservation Regulations (SOR/90-791), adopted in 1990 under the Canada Oil and Gas Operations Act, govern oil and natural gas production sites and the production of oil and natural gas. These regulations require the reporting of a “serious accident or event,” such as a spill, to the Chief Safety Officer or the Chief Conservation Officer. Failure to report is considered an offense; penalties are assumed to be as described in the Act. The phrase, a “serious accident or event” is not defined in the regulations or in subsequent guidance issued by the NEB.
Canada Oil and Gas Installation Regulations (SOR/96-118), adopted in 1996, under the Canada Oil and Gas Operations Act, also govern the operations of oil and natural gas installations. These regulations require the reporting, “of any situation or event involving any danger or accident to a person or property, including…explosion, loss of well control, hydrocarbon or toxic fluid spills, or significant damage to a pipeline, equipment or an installation.” Spill reports are to be given to the Chief Safety Officer. Failure to report is considered an offense; penalties are assumed to be as described in the Act. The phrase, “any situation or event involving any danger or accident” has not been further defined by the NEB.
Arctic Waters Pollution Prevention Act The Arctic Waters Pollution Prevention Act (R.S.C. 1985, c. A-12) was enacted either in 1970 or 1989. Two different information sources provided two different dates for its enactment. This federal statute requires that “a deposit of waste” in arctic waters above the 60th parallel to be reported forthwith to a pollution prevention officer. Failure to make a report can result in a fine up to $5,000 for a person or up to $100,000 for a ship. The Canada Shipping Act applies to waters below the 60th parallel.
Regulations pertaining to oil spills under the Arctic Waters Pollution Prevention Act include the Arctic Waters Pollution Prevention Regulations (C.R.C. 1978, c.354). The regulations expanded the reporting requirements to include “any undertaking on the mainland or islands of the Canadian arctic or in the arctic waters that, by reason of any accident or other occurrence, is in danger of causing any deposit of waste.” Deposits of industrial waste are allowed, “if the industrial waste is of a type and in a quantity and is deposited under conditions authorized by or under the Oil and Gas Production and Conservation Act, the Territorial Lands Act or the Public Lands Grants Act, whichever is applicable.” Current limits of liability are:
40
• For a pipeline operation, “an amount equal to the product of $500 and the volume, measured in barrels, of the section of the pipeline between the shut-off valves located on either side of the point in the pipeline from which the deposit of waste originates, divided by 7;”
• For an operation engaged in exploring for, developing or exploiting oil and gas, $40 million. This $40 million limit has four amendment citations for 1979, 1980, and 1981; and
• For ships (ship and cargo owners), an amount determined by multiplying 2,000 gold francs by the tonnage to a maximum of 210 million gold francs.
Canada Shipping Act The Canada Shipping Act (R.S.C. 1985, c. S-9.97) empowers the government to enact regulations that require reporting of discharges. The Act controls ship-borne pollution in all Canadian waters and fishing areas, except waters within certain zones under the Arctic Waters Pollution Prevention Act. Pollution from ships engaged in oil and gas exploration, production, or processing in areas under the Oil and Gas Production and Conservation Act also are exempted from the Canada Shipping Act.
Pollutant Discharge Reporting Regulations (SOR/95-351) were adopted in 1995 under the Canada Shipping Act. They replaced earlier regulations by the same name, adopted in 1992 (SOR/92-211). According to the 1995 version, immediate reporting is required when “the discharge is prohibited by the Act, the Arctic Waters Pollution Prevention Act or regulations made under these Acts.” The report must be made to a pollution prevention officer where the discharge of a pollutant occurs. In 1998, an amendment was made including reporting by “an operator of an oil handling facility.” Penalties are not described and are assumed to be similar to the Arctic Waters Pollution Prevention Act.
The Onshore Pipeline Regulations The Onshore Pipeline Regulations (SOR/89-303), adopted in 1989, as part of the National Energy Board Act, apply to onshore pipelines constructed, operated or abandoned after June 30, 1989. The regulations require the reporting of uncontained spillage of oil in excess of 1.5 cubic meters (approximately 397 gallons). Penalties are not discussed.
The Northwest Territories Waters Act The Northwest Territories Waters Act (R.S.C. 1992 c. 39), enacted in 1992, requires the reporting of unlawful deposits of waste. Currently, every person who is guilty of an offense, including not reporting an oil spill, and liable on summary conviction may be fined up to $100,000 dollars and/or be imprisoned for a term not exceeding 1 year. The associated regulations, the Northwest Territories Waters Regulations (SOR/93-303), were adopted in 1993 and govern applications for licenses to use water or deposit waste. Licenses are generally required for oil and gas exploration, production and transportation activities.
Inter-Agency Spill Reporting Working Agreement In addition, in 1992, a letter of agreement was set up concerning response to spills in the Northwest Territories between Indian and Northern Affairs Canada, Environment Canada, National Energy Board, Government of the Northwest Territories, Canadian Coast Guard (Transport Canada), and the Inuvialuit Lands Administration. The letter of agreement clarified
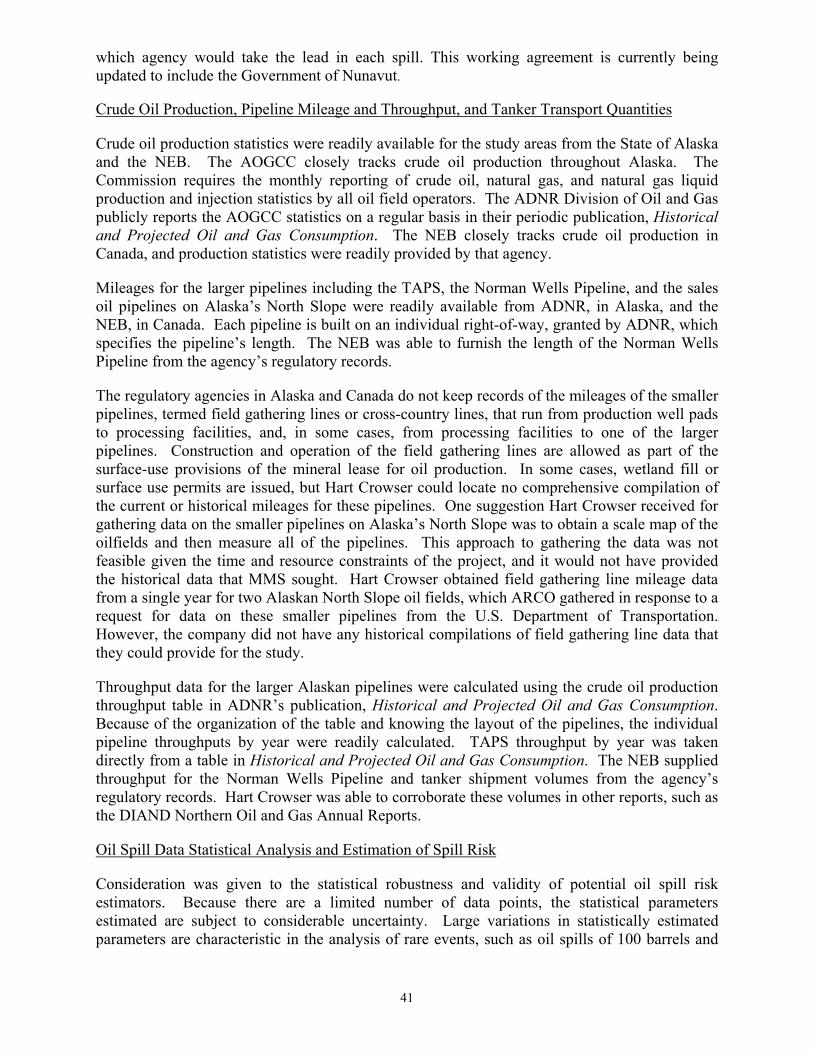
41
which agency would take the lead in each spill. This working agreement is currently being updated to include the Government of Nunavut. Crude Oil Production, Pipeline Mileage and Throughput, and Tanker Transport Quantities
Crude oil production statistics were readily available for the study areas from the State of Alaska and the NEB. The AOGCC closely tracks crude oil production throughout Alaska. The Commission requires the monthly reporting of crude oil, natural gas, and natural gas liquid production and injection statistics by all oil field operators. The ADNR Division of Oil and Gas publicly reports the AOGCC statistics on a regular basis in their periodic publication, Historical and Projected Oil and Gas Consumption. The NEB closely tracks crude oil production in Canada, and production statistics were readily provided by that agency.
Mileages for the larger pipelines including the TAPS, the Norman Wells Pipeline, and the sales oil pipelines on Alaska’s North Slope were readily available from ADNR, in Alaska, and the NEB, in Canada. Each pipeline is built on an individual right-of-way, granted by ADNR, which specifies the pipeline’s length. The NEB was able to furnish the length of the Norman Wells Pipeline from the agency’s regulatory records.
The regulatory agencies in Alaska and Canada do not keep records of the mileages of the smaller pipelines, termed field gathering lines or cross-country lines, that run from production well pads to processing facilities, and, in some cases, from processing facilities to one of the larger pipelines. Construction and operation of the field gathering lines are allowed as part of the surface-use provisions of the mineral lease for oil production. In some cases, wetland fill or surface use permits are issued, but Hart Crowser could locate no comprehensive compilation of the current or historical mileages for these pipelines. One suggestion Hart Crowser received for gathering data on the smaller pipelines on Alaska’s North Slope was to obtain a scale map of the oilfields and then measure all of the pipelines. This approach to gathering the data was not feasible given the time and resource constraints of the project, and it would not have provided the historical data that MMS sought. Hart Crowser obtained field gathering line mileage data from a single year for two Alaskan North Slope oil fields, which ARCO gathered in response to a request for data on these smaller pipelines from the U.S. Department of Transportation. However, the company did not have any historical compilations of field gathering line data that they could provide for the study.
Throughput data for the larger Alaskan pipelines were calculated using the crude oil production throughput table in ADNR’s publication, Historical and Projected Oil and Gas Consumption. Because of the organization of the table and knowing the layout of the pipelines, the individual pipeline throughputs by year were readily calculated. TAPS throughput by year was taken directly from a table in Historical and Projected Oil and Gas Consumption. The NEB supplied throughput for the Norman Wells Pipeline and tanker shipment volumes from the agency’s regulatory records. Hart Crowser was able to corroborate these volumes in other reports, such as the DIAND Northern Oil and Gas Annual Reports.
Oil Spill Data Statistical Analysis and Estimation of Spill Risk
Consideration was given to the statistical robustness and validity of potential oil spill risk estimators. Because there are a limited number of data points, the statistical parameters estimated are subject to considerable uncertainty. Large variations in statistically estimated parameters are characteristic in the analysis of rare events, such as oil spills of 100 barrels and
42
greater. In cases where a limited amount of data exists, the only way to decrease the uncertainty in these parameters is to gather additional data. In the case of this study, to decrease the uncertainty, additional data would need to be gathered over a longer time period of time. For this study, the number and study area distribution of oil spills of 100 barrels and greater and 500 barrels and greater are shown in Table 10. Because there are so few Canadian spills, all of the Canadian study areas have been combined in the table.
Table 10 Number And Distribution Of Oil Spills In Study Areas
Study Area Number of Spills 100 - 499 bbls
Number of Spills ≥500 bbls
Alaska - Onshore North Slope (E. of NPRA) 32 9 Alaska - TAPS 56 14 Canada - all study areas 10 5
The single oil spill that was caused intentionally, the February 1978 Steele Creek oil spill along the TAPS, was included in the statistical analysis and risk estimation. Intentional spills should be included in the estimation of potential oil spill risk because the sabotage of facilities is a real potential source of spills. A large percentage of TAPS and all pipelines on the Alaska North Slope are installed above ground, often in locations that provide relatively little protection against sabotage.
All of the pipelines included in the study are in the midst of their useful lives. The risk of an oil spill might be expected to increase with the age of the pipeline. However, the effect of incomplete lifecycles on the potential for oil spills from pipelines is difficult to gauge with any precision or accuracy because there are many other factors other than age that also affect the risk of a spill from any particular pipeline. Some of these other factors affecting oil spill risk include:
• The potential for corrosion or erosion of a particular pipeline, especially a field gathering line, which is related to the amount of sand and saltwater in the oil the pipeline carries and on the number of elbows in the pipeline;
• Engineering, construction, and monitoring of the condition of pipelines installed in ground susceptible to settling or other ground movement; and
• The type and amount of maintenance of the pipeline.
Hart Crowser evaluated whether the number or volume of oil spills should be correlated to oil production, pipeline mileage, pipeline throughput, or some other variable in calculating oil spill risk. Oil production was chosen for use in the risk estimates because oil production is well documented each year, it allows a simple calculation of spill rate, and it allows direct comparison with calculations of oil spill rates in other studies. Hart Crowser decided against using pipeline mileage because it was difficult to obtain pipeline mileage data for the smaller field gathering pipelines, and especially mileages over time. In addition, other factors that could affect the potential for a spill or the size of a spill from a pipeline are not accounted for using mileage alone. These factors include pipeline diameter, potential for corrosion or erosion, potential for damage by earth movement or other causes including sabotage, pipeline age, and pipeline maintenance. Hart Crowser also decided against the use of pipeline throughput as the variable because annual throughput data is not readily available for the smaller pipelines and, while
43
eliminating pipeline diameter as a spill risk factor, pipeline throughput does not take into account the other potential risk factors already mentioned in connection with pipeline mileage.
All of the spill data used in the analysis is from onshore oil spills. No offshore spills were identified in the Alaskan study areas and only two offshore spills were identified in the Canadian study areas. Almost certainly there are some differences in the risk factors between onshore and offshore oil spills. However, because so few offshore oil spills were identified as part of this study, there is not enough statistical data to determine any differences.
In comparison to Anderson and LaBelle (1994), this study gathered and used data on oil spills with a lower quantity threshold: 100 barrels and larger compared to 1,000 barrels and larger. This study also gathered and used data on different sources of oil spills than Anderson and LaBelle. The sources of spills included in the Anderson and LaBelle study and the number of spills identified for these sources were:
• Offshore oil drilling and production platforms located in the U.S. Outer Continental Shelf, 11 spills;
• Offshore pipelines located in the U.S. Outer Continental Shelf, 12 spills; • Tankers transporting crude oil in worldwide coastal and offshore waters, 213 spills; • Tankers transporting crude oil in U.S. coastal and offshore waters, 38 spills; • Tankers transporting Alaska North Slope crude oil, 10 spills; and • Barges transporting petroleum products in U.S. coastal, offshore, and inland waters, 153
spills. This study gathered and used data on oil spills related to oil and gas exploration, construction, development, production, storage, and transportation in specific Alaskan and Canadian study areas. The sources of spills included in this study and the number of spills identified among these spill types are:
• Construction Camps, 21 spills, all in Alaska; • Exploration Support Facilities, 3 spills, 2 of which were in Alaska; • Exploration Well Sites, 4 spills, 1 of which was in Alaska; • Highways; 37 spills, 36 of which were in Alaska; • Operations Support Facilities, 18 spills, all in Alaska; • Pipelines, 11 spills, 10 of which were in Alaska; • Pipeline Pump Stations, 5 spills, all in Alaska; • Production Processing Facilities, 13 spills, 10 of which were in Alaska; • Production Well Sites, 11 spills, 7 of which were in Alaska; • Unspecified Source, 1 spill in Alaska; and • Vessel Leak, 2 spills in Canada.
Hart Crowser first constructed a cumulative frequency plot of the data for the size of Alaskan spills, as shown in Figure 1. To facilitate easy plotting of the data analysis figures, abbreviations were used for different variables as shown in Table 11. Figure 1 shows a bow characteristic of lognormal data. Therefore, the data were re-plotted on a lognormal scale, as shown in Figure 2. For the limited number of data points, it appears that two lognormal populations could
44
reasonably describe this population. In Figure 2, two lines approximating the two lognormal populations are shown. The higher population is more linear than the lower. This is typical in lognormal data because of the greater proportional effect of rounding and data errors at low values. Lines showing the approximate theoretical distributions are shown only in Figure 2 to avoid biasing the reader.
A cumulative frequency plot of the Canadian oil spill size data also was constructed on a lognormal basis, as shown in Figure 3. Overlaying the Alaskan and Canadian plots indicated more or less the same distribution. The Canadian data was not used in further analysis because of doubts about its completeness, the fact that 15 points were below the 30 point empirical rule for number of samples, and the fact that the 112 Alaska data points would overpower the 15 Canadian points. The use of only Alaskan data also appears consistent with Anderson and LaBelle (1994), who state that “U.S. … rates will better reflect the magnitude of spill occurrence under U.S. regulatory and operational controls, and the individual spill and production records are readily available.” However, Hart Crowser also redid the analysis using the total oil spill data set (with Alaskan and Canadian crude oil production for rates). The results were statistically the same as for the Alaskan data alone. The rerun of all the combined Alaskan and Canadian data is included as Appendix B to the report.
Because the Alaskan data was more or less a mixture of two lognormal populations, exploratory data analysis on the relevant independent variables was conducted, as shown in Figures 4 through 10. These figures present box plots on a logarithmic basis for the dataset and show the median, quartile values, and outlying points. In Figure 4, it can be seen that there appears to be little statistical difference in terms of spills that occurred within the ONS and in the TAPS study areas. This lack of statistical difference between the ONS and TAPS study areas was confirmed by an analysis of variance in which no statistically significant difference between the two populations was found.
In Figure 5, which shows spill size versus month, some type of a cycling trend in the data may be interpreted, with the lowest number of spills occurring in March, and the highest volume of spills occurring in July. However, a linear regression on month showed no statistically significant correlation. A statistically significant correlation at the 99 percent level of confidence was confirmed by a logarithmic analysis of the data as presented in Table 12. As a general check on the fluctuation of the data set, logarithmic spill size versus the day of the month also was plotted, as shown in Figure 6. This particular dataset appears to be quite random. Once again, an analysis of variance, as seen in Table 13, showed no statistically significant difference between days.
Figure 7 is a box plot of the logarithm of the spill size versus the year. With the exception of 1979, there appears to be little trend in median of the data. An analysis of variance of this data showed no statistically significant difference in the years. Figure 8 shows the logarithm of spill size versus facility type. In general, there appears to be little difference between the types of spills associated with the various facilities with the exception of pipelines. An analysis of
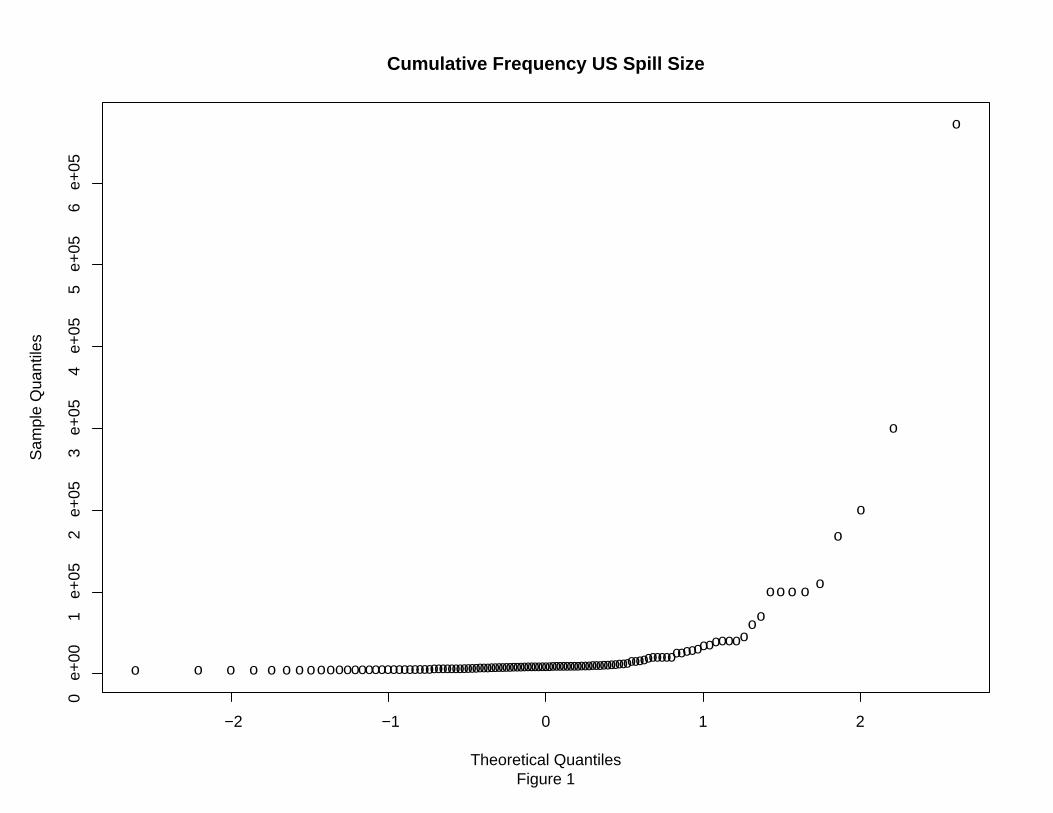
o
oo
o
o
o
o
ooo
o
oo oo o ooooo o ooo ooo
oo
oo
oo
oo o oo oo o
oo o ooo o
o
o oo
o
o ooo
o
o
o
o oo oo oo
oo o
o
o
o
oo o oo
o
o
o
o
oo o
o
oo ooo oo oo oo oo ooo o o oo oo
o
o
−2 −1 0 1 2
0 e
+00
1 e
+05
2 e
+05
3 e
+05
4 e
+05
5 e
+05
6 e
+05
Cumulative Frequency US Spill Size
Figure 1Theoretical Quantiles
Sam
ple
Qua
ntile
s
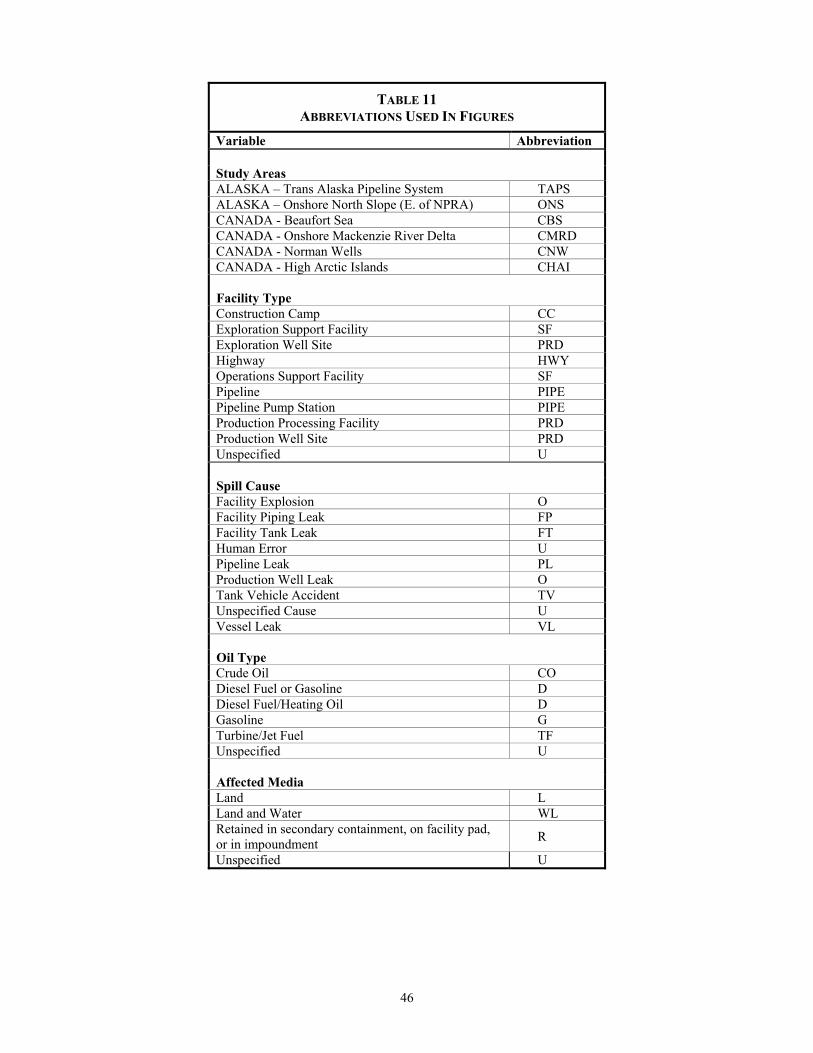
46
TABLE 11 ABBREVIATIONS USED IN FIGURES
Variable Abbreviation Study Areas ALASKA – Trans Alaska Pipeline System TAPS ALASKA – Onshore North Slope (E. of NPRA) ONS CANADA - Beaufort Sea CBS CANADA - Onshore Mackenzie River Delta CMRD CANADA - Norman Wells CNW CANADA - High Arctic Islands CHAI Facility Type Construction Camp CC Exploration Support Facility SF Exploration Well Site PRD Highway HWY Operations Support Facility SF Pipeline PIPE Pipeline Pump Station PIPE Production Processing Facility PRD Production Well Site PRD Unspecified U Spill Cause Facility Explosion O Facility Piping Leak FP Facility Tank Leak FT Human Error U Pipeline Leak PL Production Well Leak O Tank Vehicle Accident TV Unspecified Cause U Vessel Leak VL
Oil Type Crude Oil CO Diesel Fuel or Gasoline D Diesel Fuel/Heating Oil D Gasoline G Turbine/Jet Fuel TF Unspecified U
Affected Media Land L Land and Water WL Retained in secondary containment, on facility pad, or in impoundment R
Unspecified U
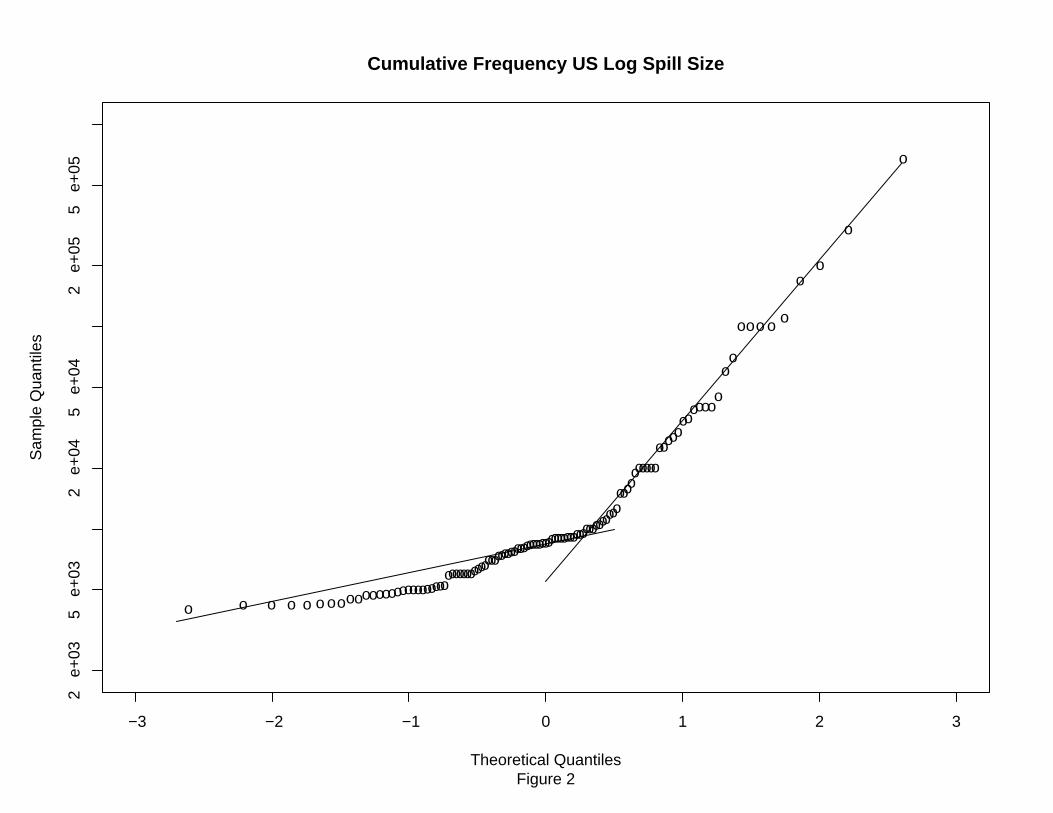
o
o
o
o
o
o
o
oo
o
o
o
o
oo
o o
o
ooo
o
oo
o
oo
o
o
o
o
o
o
o
o
o
o
o
oo
o
o
o
o
o
o
ooo
o
ooo
o
o
o
o
o
o
o
o
o
oo
oo
o
o
o
o
o
o
o
o
o
o o
oo
o
o
o
o
o
o
o
o
oo
oooo
oo
o
o
o
o
o
oo
oo
o o
oo
o
o
o
−3 −2 −1 0 1 2 3
2 e
+03
5 e
+03
2 e
+04
5 e
+04
2 e
+05
5 e
+05
Cumulative Frequency US Log Spill Size
Figure 2Theoretical Quantiles
Sam
ple
Qua
ntile
s
o
o
o
oo
oo
o
o
o o
o
o
o
−3 −2 −1 0 1 2 3
2 e
+03
5 e
+03
2 e
+04
5 e
+04
2 e
+05
5 e
+05
Cumulative Frequency Canada Log Spill Size
Figure 3Theoretical Quantiles
Sam
ple
Qua
ntile
s
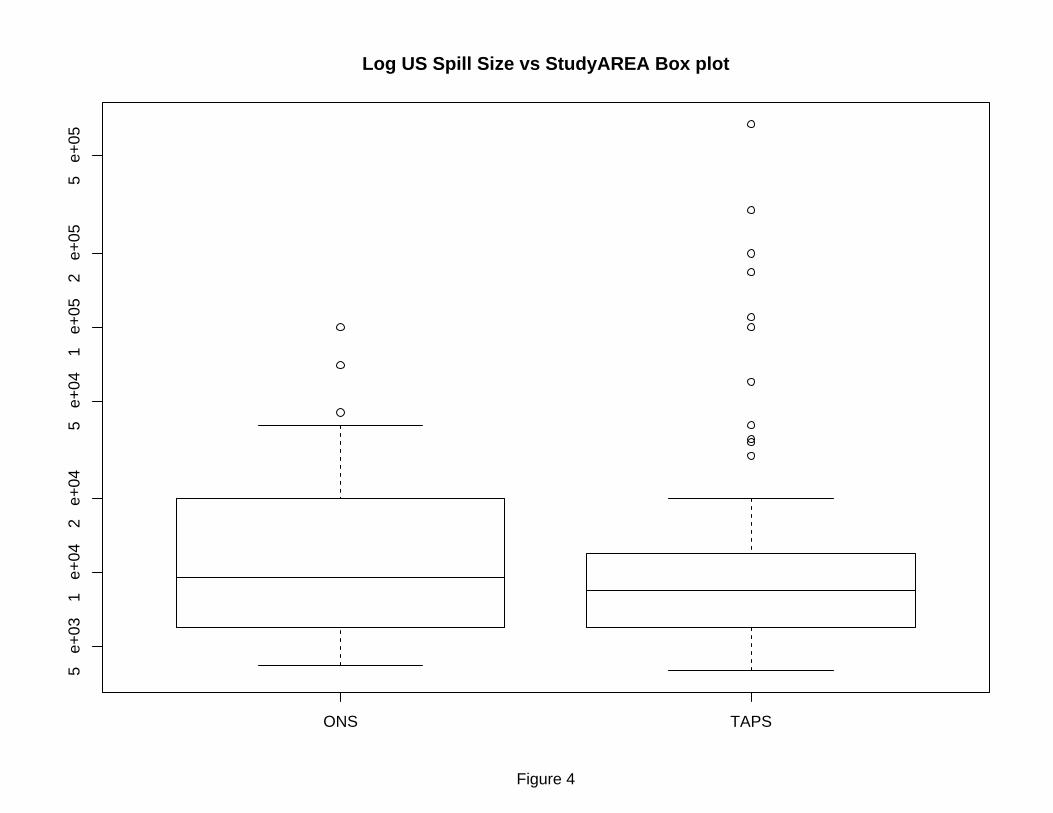
ONS TAPS
5 e
+03
1 e
+04
2 e
+04
5 e
+04
1 e
+05
2 e
+05
5 e
+05
Log US Spill Size vs StudyAREA Box plot
Figure 4
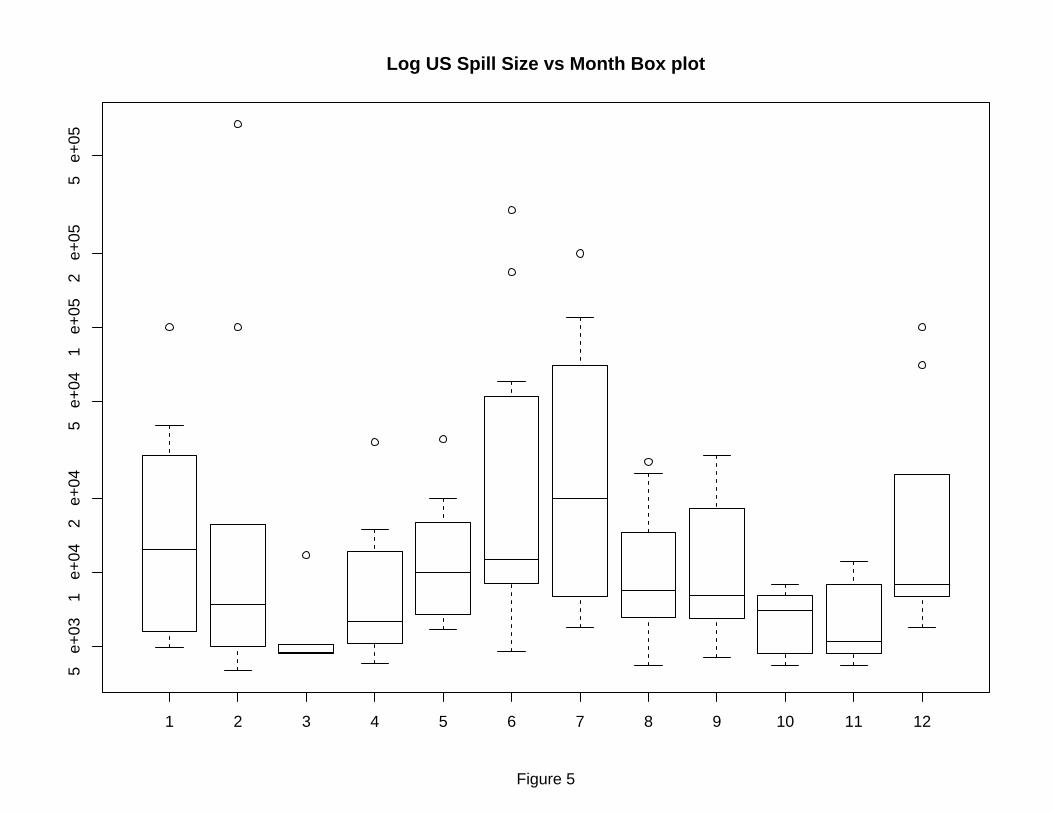
1 2 3 4 5 6 7 8 9 10 11 12
5 e
+03
1 e
+04
2 e
+04
5 e
+04
1 e
+05
2 e
+05
5 e
+05
Log US Spill Size vs Month Box plot
Figure 5
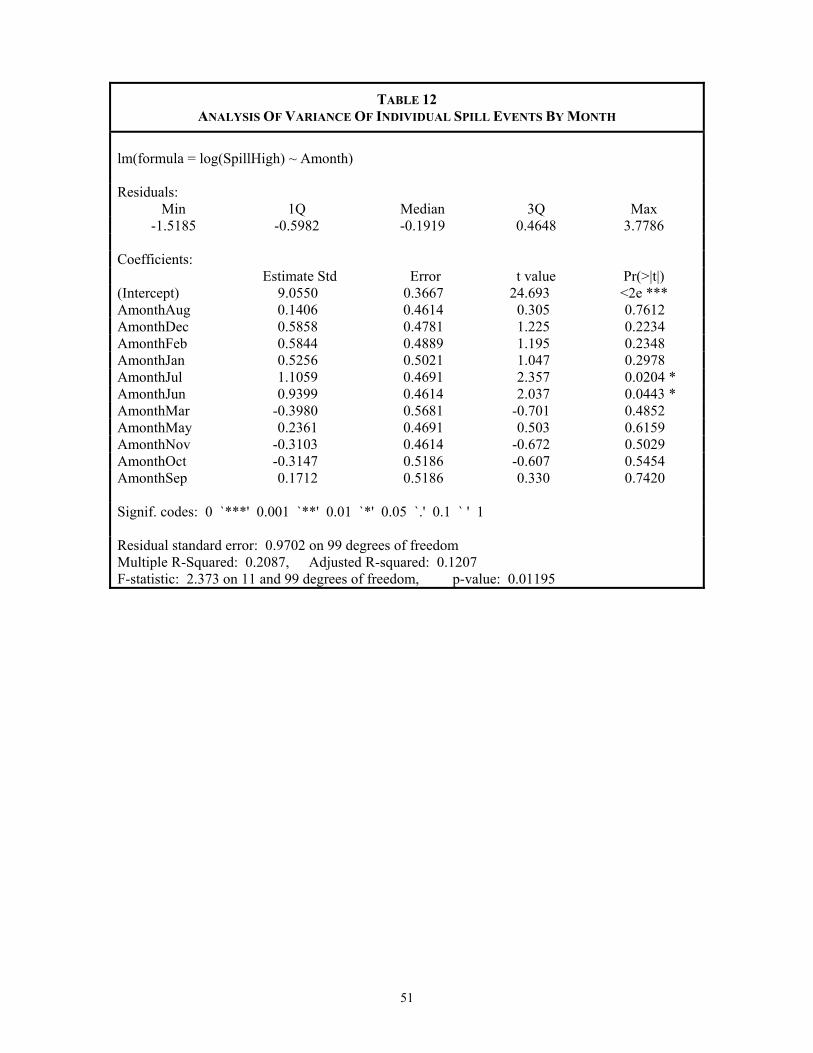
51
TABLE 12 ANALYSIS OF VARIANCE OF INDIVIDUAL SPILL EVENTS BY MONTH
lm(formula = log(SpillHigh) ~ Amonth) Residuals:
Min 1Q Median 3Q Max -1.5185 -0.5982 -0.1919 0.4648 3.7786
Coefficients: Estimate Std Error t value Pr(>|t|) (Intercept) 9.0550 0.3667 24.693 <2e *** AmonthAug 0.1406 0.4614 0.305 0.7612 AmonthDec 0.5858 0.4781 1.225 0.2234 AmonthFeb 0.5844 0.4889 1.195 0.2348 AmonthJan 0.5256 0.5021 1.047 0.2978 AmonthJul 1.1059 0.4691 2.357 0.0204 * AmonthJun 0.9399 0.4614 2.037 0.0443 * AmonthMar -0.3980 0.5681 -0.701 0.4852 AmonthMay 0.2361 0.4691 0.503 0.6159 AmonthNov -0.3103 0.4614 -0.672 0.5029 AmonthOct -0.3147 0.5186 -0.607 0.5454 AmonthSep 0.1712 0.5186 0.330 0.7420 Signif. codes: 0 `***' 0.001 `**' 0.01 `*' 0.05 `.' 0.1 ` ' 1 Residual standard error: 0.9702 on 99 degrees of freedom Multiple R-Squared: 0.2087, Adjusted R-squared: 0.1207 F-statistic: 2.373 on 11 and 99 degrees of freedom, p-value: 0.01195
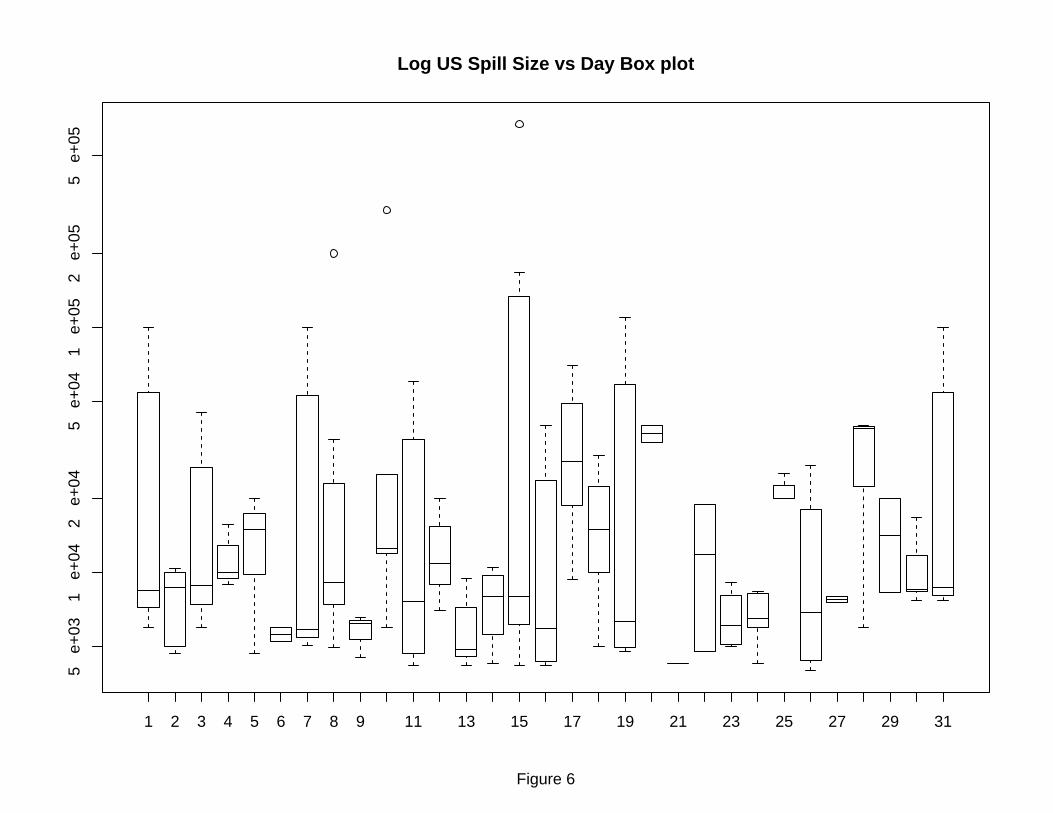
1 2 3 4 5 6 7 8 9 11 13 15 17 19 21 23 25 27 29 31
5 e
+03
1 e
+04
2 e
+04
5 e
+04
1 e
+05
2 e
+05
5 e
+05
Log US Spill Size vs Day Box plot
Figure 6
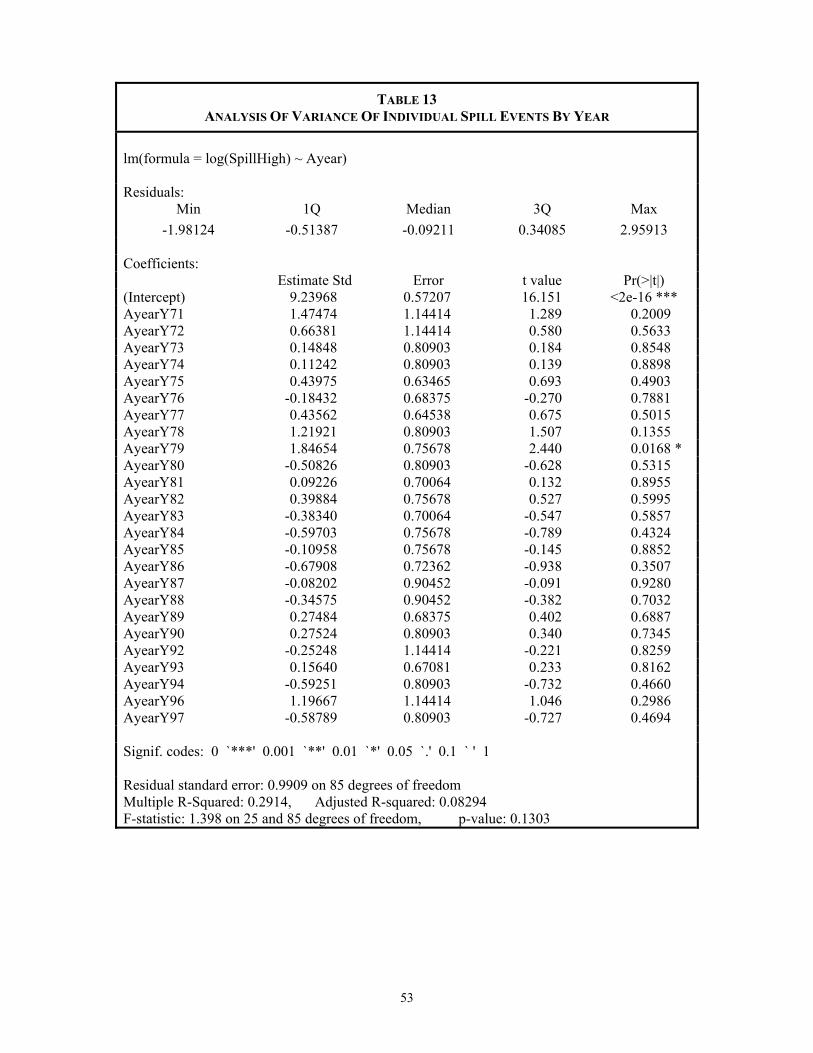
53
TABLE 13 ANALYSIS OF VARIANCE OF INDIVIDUAL SPILL EVENTS BY YEAR
lm(formula = log(SpillHigh) ~ Ayear) Residuals:
Min 1Q Median 3Q Max -1.98124 -0.51387 -0.09211 0.34085 2.95913
Coefficients: Estimate Std Error t value Pr(>|t|) (Intercept) 9.23968 0.57207 16.151 <2e-16 *** AyearY71 1.47474 1.14414 1.289 0.2009 AyearY72 0.66381 1.14414 0.580 0.5633 AyearY73 0.14848 0.80903 0.184 0.8548 AyearY74 0.11242 0.80903 0.139 0.8898 AyearY75 0.43975 0.63465 0.693 0.4903 AyearY76 -0.18432 0.68375 -0.270 0.7881 AyearY77 0.43562 0.64538 0.675 0.5015 AyearY78 1.21921 0.80903 1.507 0.1355 AyearY79 1.84654 0.75678 2.440 0.0168 * AyearY80 -0.50826 0.80903 -0.628 0.5315 AyearY81 0.09226 0.70064 0.132 0.8955 AyearY82 0.39884 0.75678 0.527 0.5995 AyearY83 -0.38340 0.70064 -0.547 0.5857 AyearY84 -0.59703 0.75678 -0.789 0.4324 AyearY85 -0.10958 0.75678 -0.145 0.8852 AyearY86 -0.67908 0.72362 -0.938 0.3507 AyearY87 -0.08202 0.90452 -0.091 0.9280 AyearY88 -0.34575 0.90452 -0.382 0.7032 AyearY89 0.27484 0.68375 0.402 0.6887 AyearY90 0.27524 0.80903 0.340 0.7345 AyearY92 -0.25248 1.14414 -0.221 0.8259 AyearY93 0.15640 0.67081 0.233 0.8162 AyearY94 -0.59251 0.80903 -0.732 0.4660 AyearY96 1.19667 1.14414 1.046 0.2986 AyearY97 -0.58789 0.80903 -0.727 0.4694 Signif. codes: 0 `***' 0.001 `**' 0.01 `*' 0.05 `.' 0.1 ` ' 1 Residual standard error: 0.9909 on 85 degrees of freedom Multiple R-Squared: 0.2914, Adjusted R-squared: 0.08294 F-statistic: 1.398 on 25 and 85 degrees of freedom, p-value: 0.1303
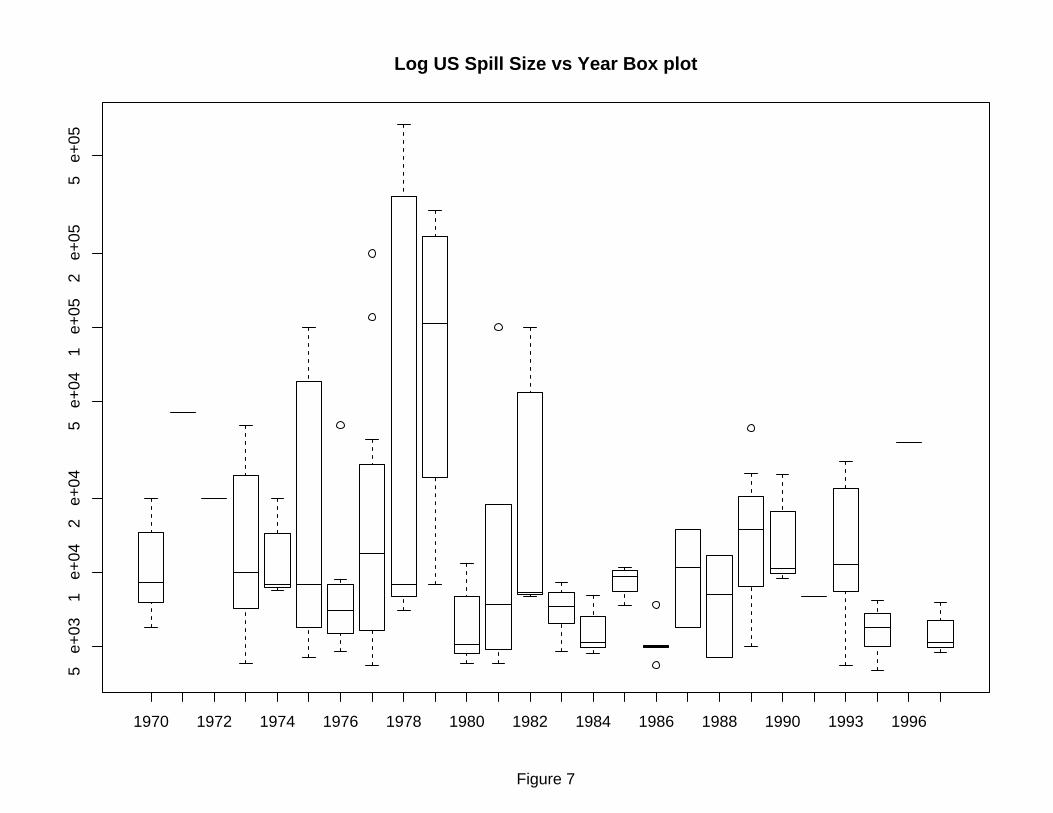
1970 1972 1974 1976 1978 1980 1982 1984 1986 1988 1990 1993 1996
5 e
+03
1 e
+04
2 e
+04
5 e
+04
1 e
+05
2 e
+05
5 e
+05
Log US Spill Size vs Year Box plot
Figure 7
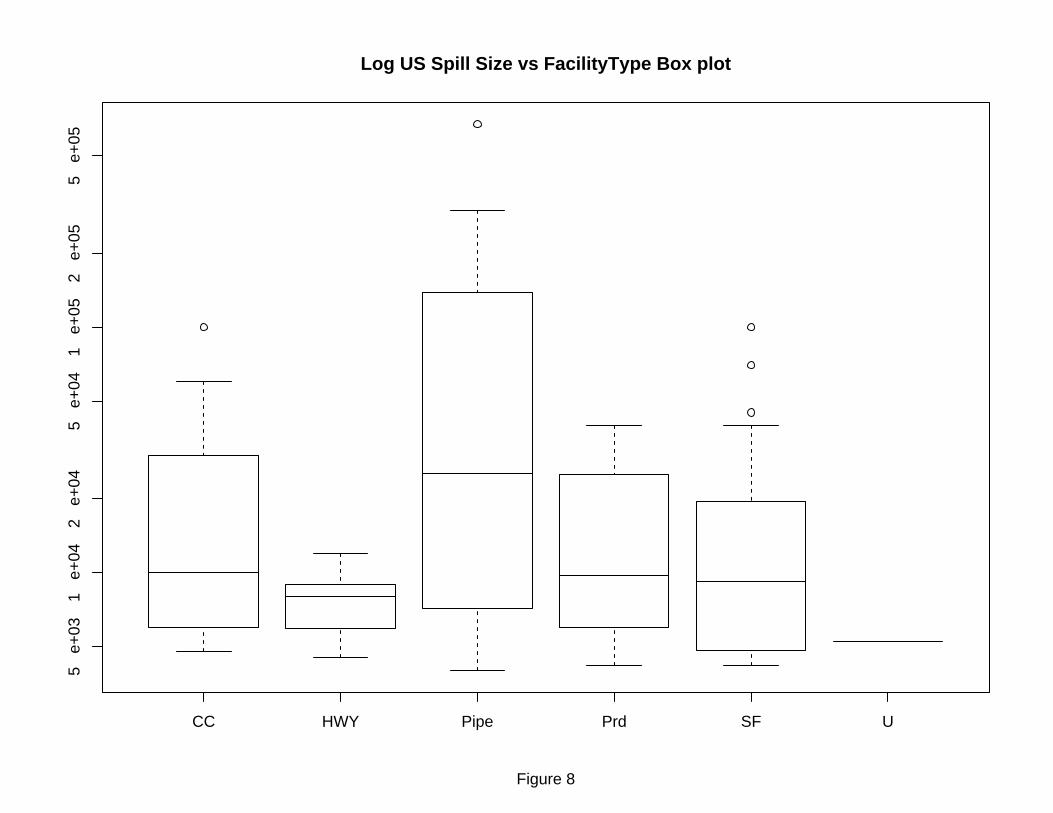
CC HWY Pipe Prd SF U
5 e
+03
1 e
+04
2 e
+04
5 e
+04
1 e
+05
2 e
+05
5 e
+05
Log US Spill Size vs FacilityType Box plot
Figure 8
56
variance of facility type showed that there was a statistically significant difference for pipelines. This analysis of variance is given in Table 14.
Figure 9 shows spill size versus oil type. An analysis of variance by oil type, presented in Table 15, showed that, in general it appears that crude oil spills tend to be larger than other types of oil spills.
Figure 10 is a box plot of the logarithm of the spill size versus affected media.
In performing a statistical analysis of the data, it is important to look at the cumulative frequency plots by selected independent variables. This is done in Figures 12 through 33. Figure 11 is a box plot of the logarithm of the spill size versus the spill cause. In general, those spills associated with pipelines appear to be largest. Figures 12 and 13 show cumulative frequency plots for the two different areas. The TAPS study area, Figure 12, appears to be a fairly clear mixture of two lognormal populations. The ONS study area shows less of a break, indicating perhaps a single population.
Figures 14 through 19 show cumulative frequency plots of the logarithm of the spill size versus the spill cause combined. In Figure 14, which is a plot of spills from tank vehicles, there is little apparent variability. This is more or less consistent with the fact that a tank vehicle spill should be expected to have a firm upper limit. Facility piping, as shown in Figure 15, shows a bow but no clear break in population. Pipeline leaks, Figure 16, show what may be a single lognormal population. Facility tank leaks, Figure 17, shows a single lognormal population. Unspecified spill causes, Figure 18, show a single lognormal population. Other spill causes, Figure 19, have such a small number of data points that no definite conclusions may be drawn. In general, overlaying all of the figures on one another indicates that they can probably reasonably be lumped together as a single population for statistical analysis.
Figures 20 through 23 show cumulative frequency plots of the logarithms of spill volume versus oil type. Figure 20, for diesel fuel, appears to be a mixture of two lognormal populations. Figure 21, for crude oil, again appears to be a mixture of two lognormal populations. Figure 22, for gasoline, shows a single lognormal population with one possible outlier. Again, this is consistent with a mixture of two lognormal populations. Figure 23, for turbine and jet fuel, again shows what may be a mixture of two lognormal populations. Figure 24 is two data points and is of little interest. However, Figure 24 overlies Figure 23 quite nicely.
Figures 25 through 29 show cumulative frequency plots of the logarithms of spill volume versus facility type. Figure 25, for highways, is very similar to the tank vehicle spills and is entirely consistent with the assumption that most highway spills are from tank vehicles. Figure 26, for support facilities, shows a bowed lognormal population. Figure 27, for production facilities, seems to show a single lognormal population. Figure 28, for construction camps, appears to show a mixture of two lognormal populations. Figure 29, for pipelines, may be interpreted as a single lognormal population.
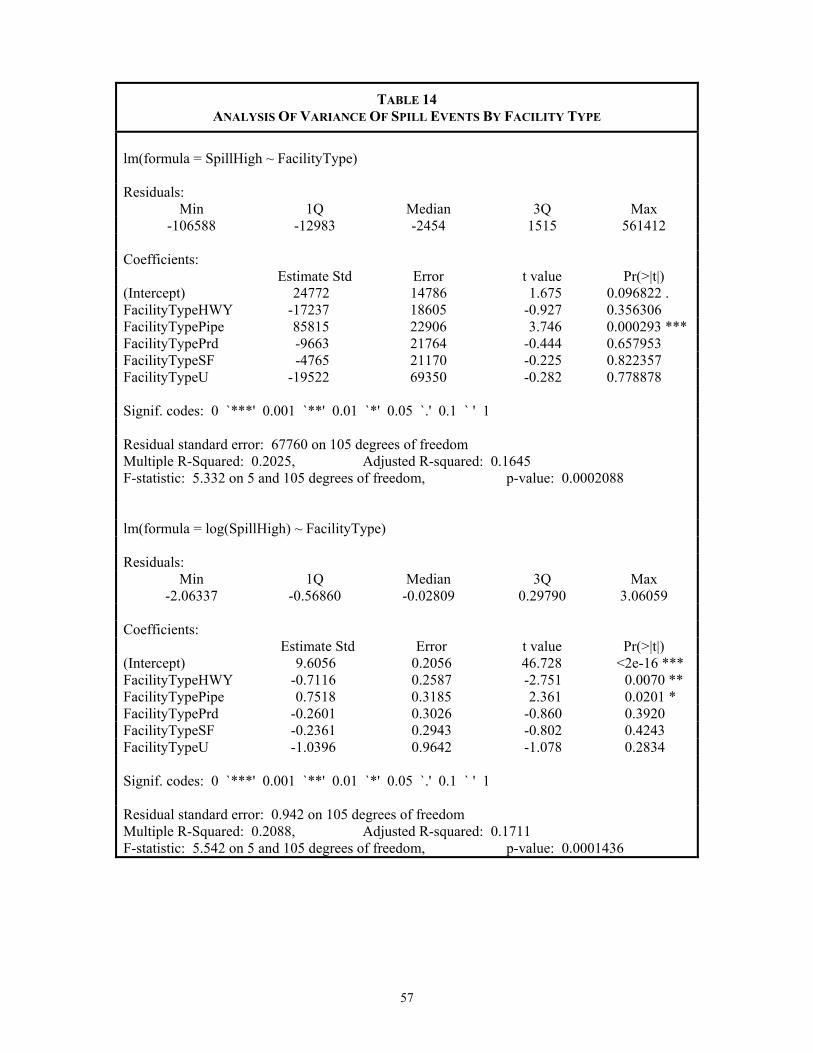
57
TABLE 14 ANALYSIS OF VARIANCE OF SPILL EVENTS BY FACILITY TYPE
lm(formula = SpillHigh ~ FacilityType) Residuals:
Min 1Q Median 3Q Max -106588 -12983 -2454 1515 561412
Coefficients: Estimate Std Error t value Pr(>|t|) (Intercept) 24772 14786 1.675 0.096822 . FacilityTypeHWY -17237 18605 -0.927 0.356306 FacilityTypePipe 85815 22906 3.746 0.000293 *** FacilityTypePrd -9663 21764 -0.444 0.657953 FacilityTypeSF -4765 21170 -0.225 0.822357 FacilityTypeU -19522 69350 -0.282 0.778878
Signif. codes: 0 `***' 0.001 `**' 0.01 `*' 0.05 `.' 0.1 ` ' 1
Residual standard error: 67760 on 105 degrees of freedom Multiple R-Squared: 0.2025, Adjusted R-squared: 0.1645 F-statistic: 5.332 on 5 and 105 degrees of freedom, p-value: 0.0002088
lm(formula = log(SpillHigh) ~ FacilityType)
Residuals: Min 1Q Median 3Q Max
-2.06337 -0.56860 -0.02809 0.29790 3.06059
Coefficients: Estimate Std Error t value Pr(>|t|) (Intercept) 9.6056 0.2056 46.728 <2e-16 *** FacilityTypeHWY -0.7116 0.2587 -2.751 0.0070 ** FacilityTypePipe 0.7518 0.3185 2.361 0.0201 * FacilityTypePrd -0.2601 0.3026 -0.860 0.3920 FacilityTypeSF -0.2361 0.2943 -0.802 0.4243 FacilityTypeU -1.0396 0.9642 -1.078 0.2834
Signif. codes: 0 `***' 0.001 `**' 0.01 `*' 0.05 `.' 0.1 ` ' 1
Residual standard error: 0.942 on 105 degrees of freedom Multiple R-Squared: 0.2088, Adjusted R-squared: 0.1711 F-statistic: 5.542 on 5 and 105 degrees of freedom, p-value: 0.0001436
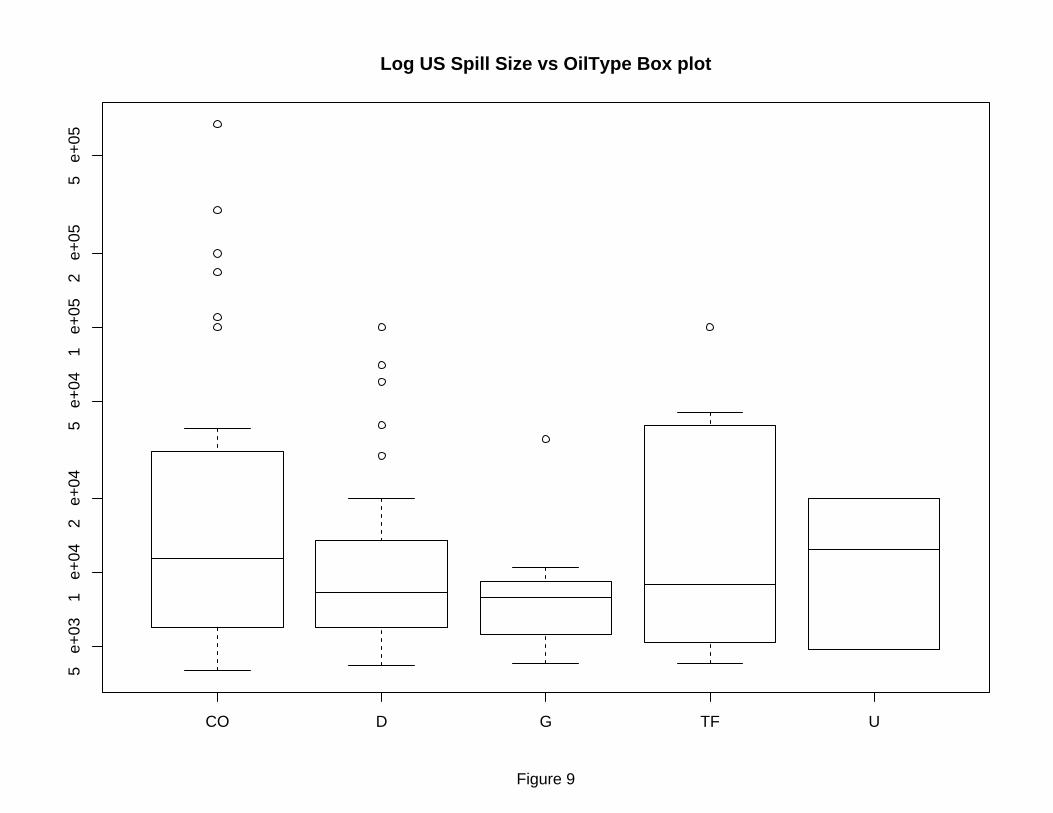
CO D G TF U
5 e
+03
1 e
+04
2 e
+04
5 e
+04
1 e
+05
2 e
+05
5 e
+05
Log US Spill Size vs OilType Box plot
Figure 9
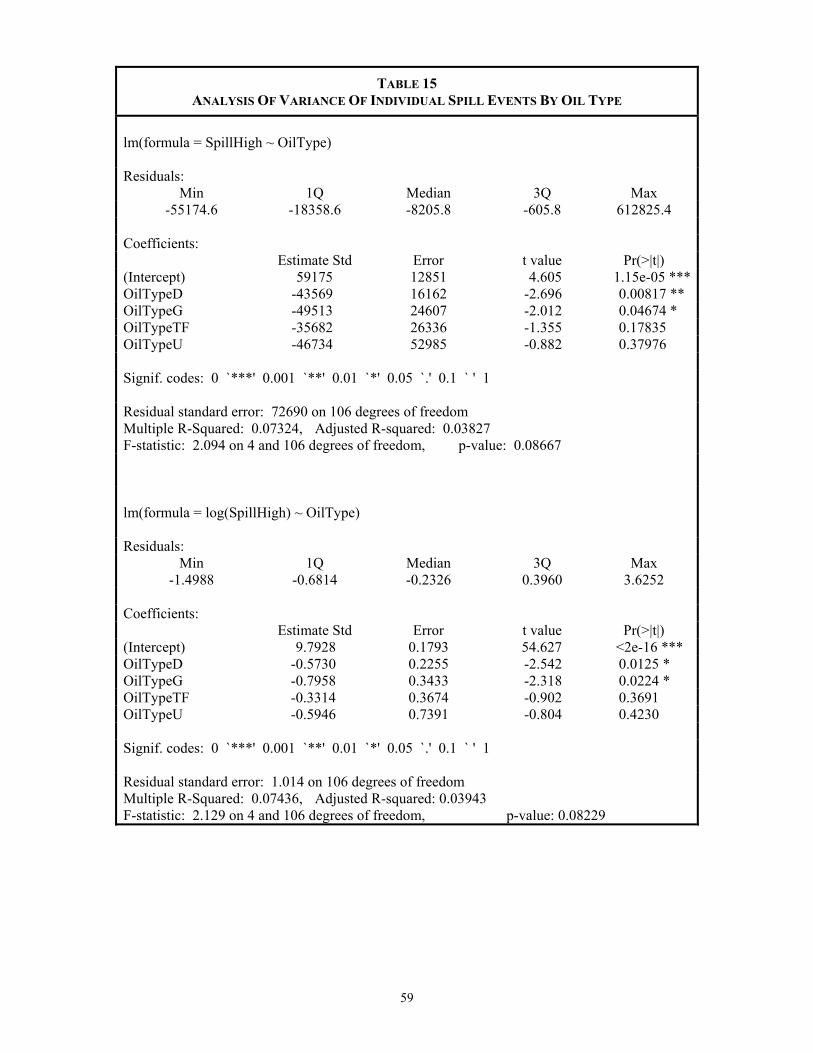
59
TABLE 15
ANALYSIS OF VARIANCE OF INDIVIDUAL SPILL EVENTS BY OIL TYPE lm(formula = SpillHigh ~ OilType) Residuals:
Min 1Q Median 3Q Max -55174.6 -18358.6 -8205.8 -605.8 612825.4
Coefficients: Estimate Std Error t value Pr(>|t|) (Intercept) 59175 12851 4.605 1.15e-05 ***OilTypeD -43569 16162 -2.696 0.00817 ** OilTypeG -49513 24607 -2.012 0.04674 * OilTypeTF -35682 26336 -1.355 0.17835 OilTypeU -46734 52985 -0.882 0.37976
Signif. codes: 0 `***' 0.001 `**' 0.01 `*' 0.05 `.' 0.1 ` ' 1
Residual standard error: 72690 on 106 degrees of freedom Multiple R-Squared: 0.07324, Adjusted R-squared: 0.03827 F-statistic: 2.094 on 4 and 106 degrees of freedom, p-value: 0.08667
lm(formula = log(SpillHigh) ~ OilType)
Residuals:
Min 1Q Median 3Q Max -1.4988 -0.6814 -0.2326 0.3960 3.6252
Coefficients: Estimate Std Error t value Pr(>|t|) (Intercept) 9.7928 0.1793 54.627 <2e-16 *** OilTypeD -0.5730 0.2255 -2.542 0.0125 * OilTypeG -0.7958 0.3433 -2.318 0.0224 * OilTypeTF -0.3314 0.3674 -0.902 0.3691 OilTypeU -0.5946 0.7391 -0.804 0.4230
Signif. codes: 0 `***' 0.001 `**' 0.01 `*' 0.05 `.' 0.1 ` ' 1 Residual standard error: 1.014 on 106 degrees of freedom Multiple R-Squared: 0.07436, Adjusted R-squared: 0.03943 F-statistic: 2.129 on 4 and 106 degrees of freedom, p-value: 0.08229
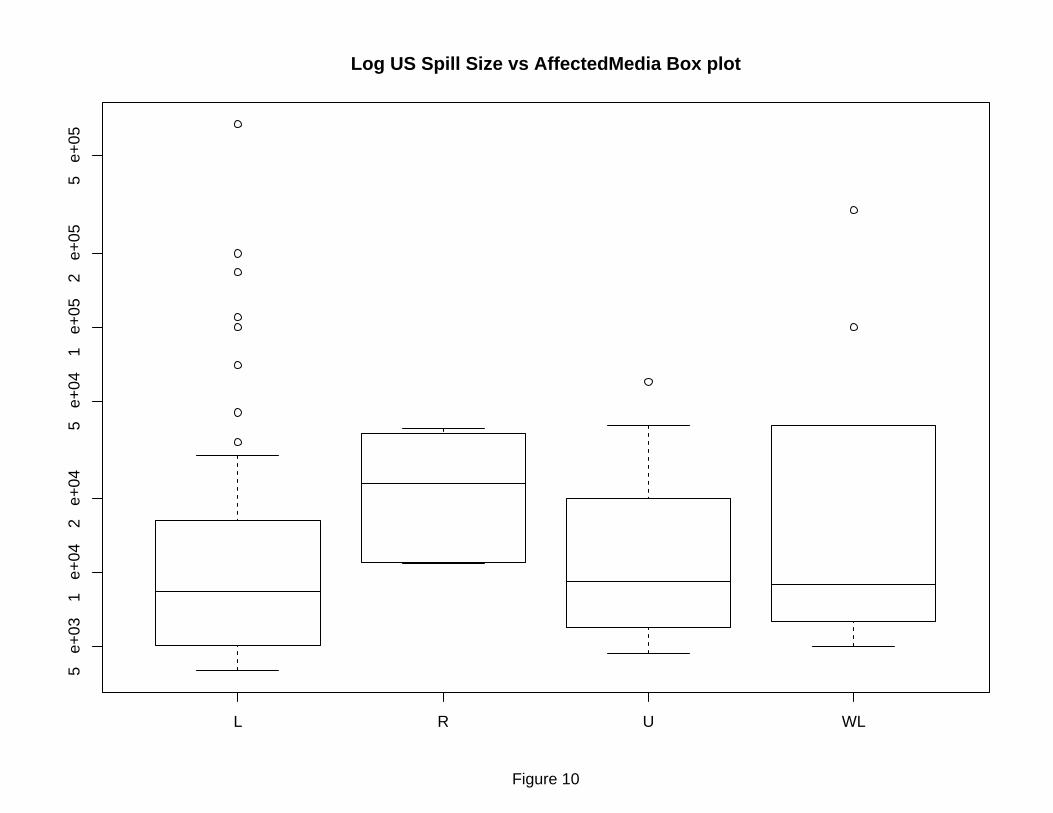
L R U WL
5 e
+03
1 e
+04
2 e
+04
5 e
+04
1 e
+05
2 e
+05
5 e
+05
Log US Spill Size vs AffectedMedia Box plot
Figure 10
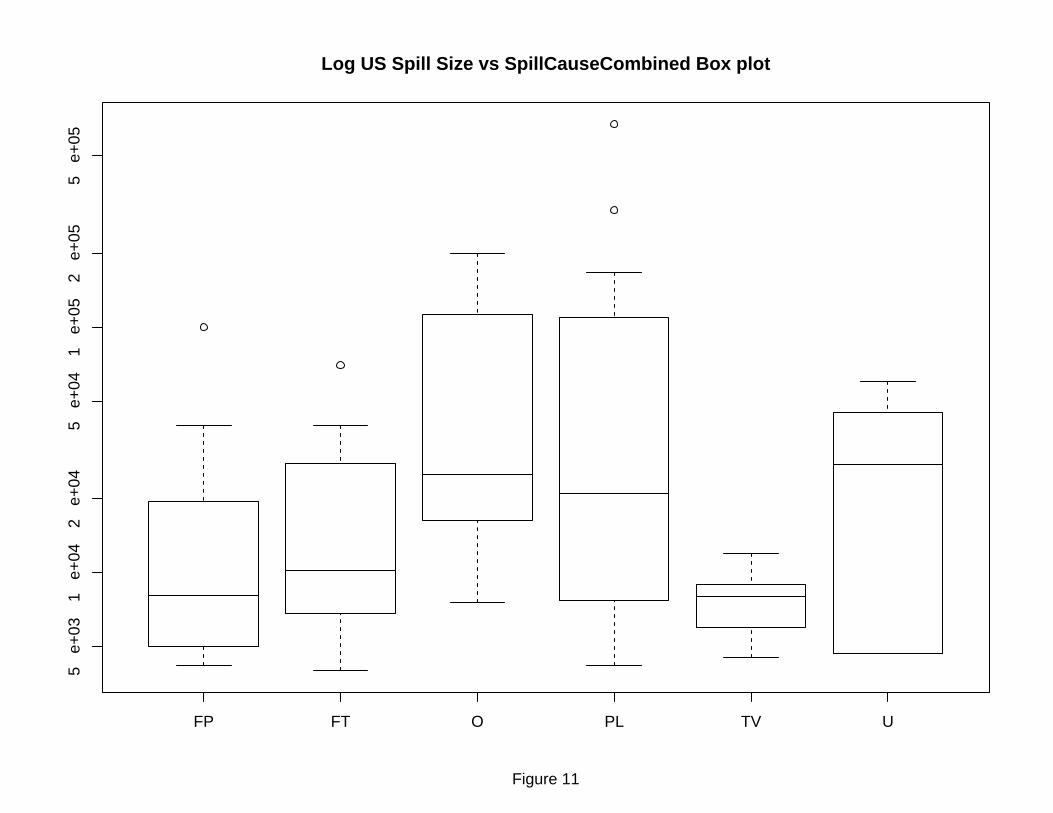
FP FT O PL TV U
5 e
+03
1 e
+04
2 e
+04
5 e
+04
1 e
+05
2 e
+05
5 e
+05
Log US Spill Size vs SpillCauseCombined Box plot
Figure 11
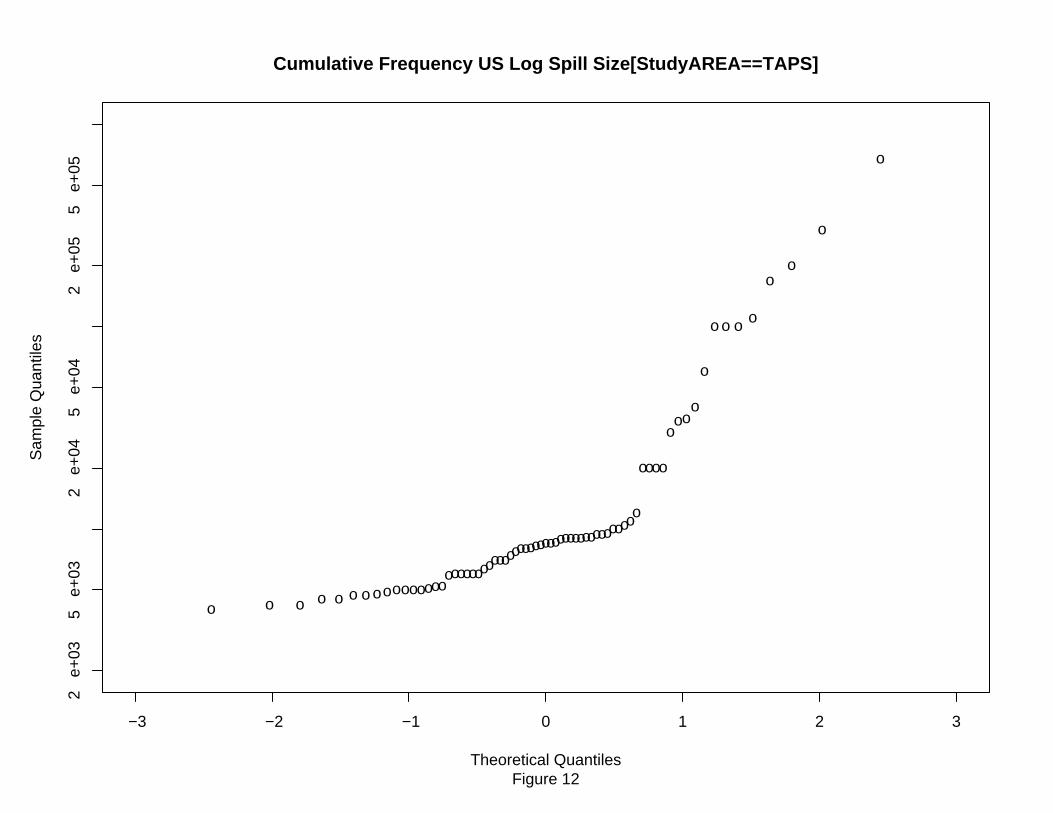
o
o
o
o
ooo
o
ooo
o
o
o
o
o
o
o
o
o
oo
oo
o
o
o
o
o
o
o
o
o
o o
oo
o
o
o
o
o
o
o
o
oo
oooo
oo
o
o
o
o
o
oo
oo
o o
oo
o
o
o
−3 −2 −1 0 1 2 3
2 e
+03
5 e
+03
2 e
+04
5 e
+04
2 e
+05
5 e
+05
Cumulative Frequency US Log Spill Size[StudyAREA==TAPS]
Figure 12Theoretical Quantiles
Sam
ple
Qua
ntile
s
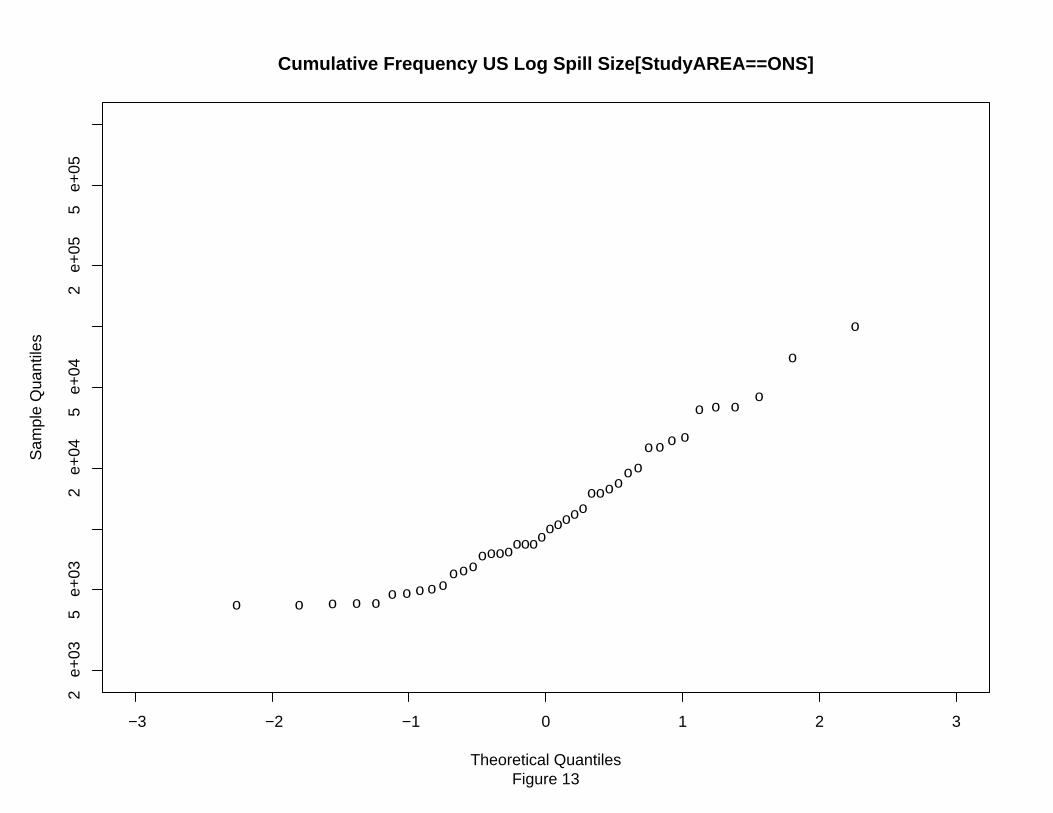
o
o
o
o
o
o
o
oo
o
o
o
o
oo
oo
o
ooo
o
oo
o
oo
o
o
o
o
o
o
o
o
o
o
o
oo
o
o
−3 −2 −1 0 1 2 3
2 e
+03
5 e
+03
2 e
+04
5 e
+04
2 e
+05
5 e
+05
Cumulative Frequency US Log Spill Size[StudyAREA==ONS]
Figure 13Theoretical Quantiles
Sam
ple
Qua
ntile
s
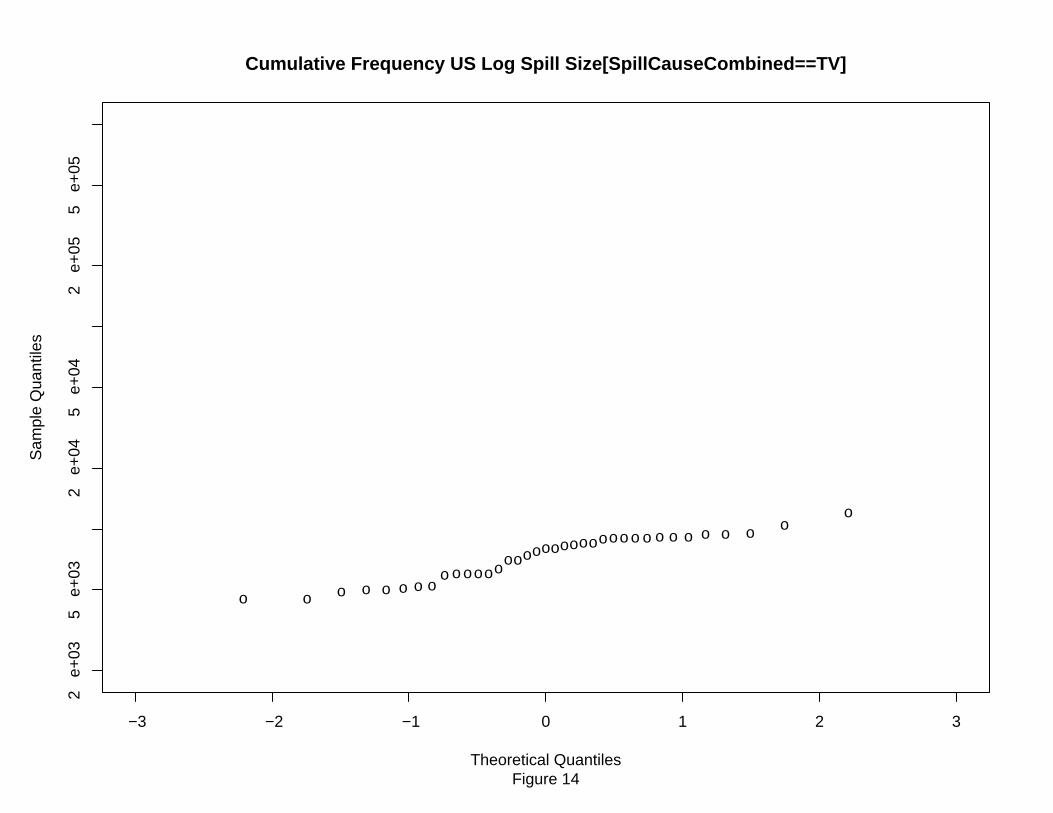
ooo
o oo
o
o
o
oo
oo
oo o
oo
o
oooo
oo
o
o
o
oo
oo
o o
oo
o
−3 −2 −1 0 1 2 3
2 e
+03
5 e
+03
2 e
+04
5 e
+04
2 e
+05
5 e
+05
Cumulative Frequency US Log Spill Size[SpillCauseCombined==TV]
Figure 14Theoretical Quantiles
Sam
ple
Qua
ntile
s
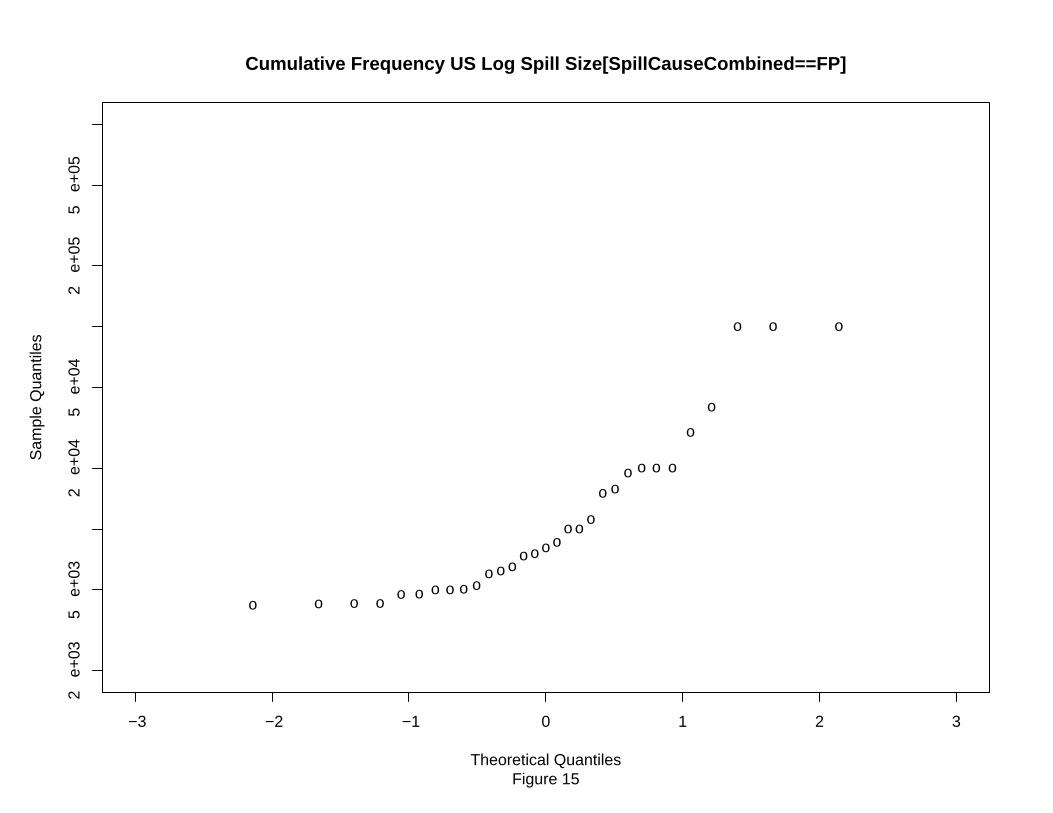
o
o oo
o
o
oo
o
o
oo
o
o
o
o
o
oo
o
o
o
o
o
o
o o o
o o
o
−3 −2 −1 0 1 2 3
2 e
+03
5 e
+03
2 e
+04
5 e
+04
2 e
+05
5 e
+05
Cumulative Frequency US Log Spill Size[SpillCauseCombined==FP]
Figure 15Theoretical Quantiles
Sam
ple
Qua
ntile
s
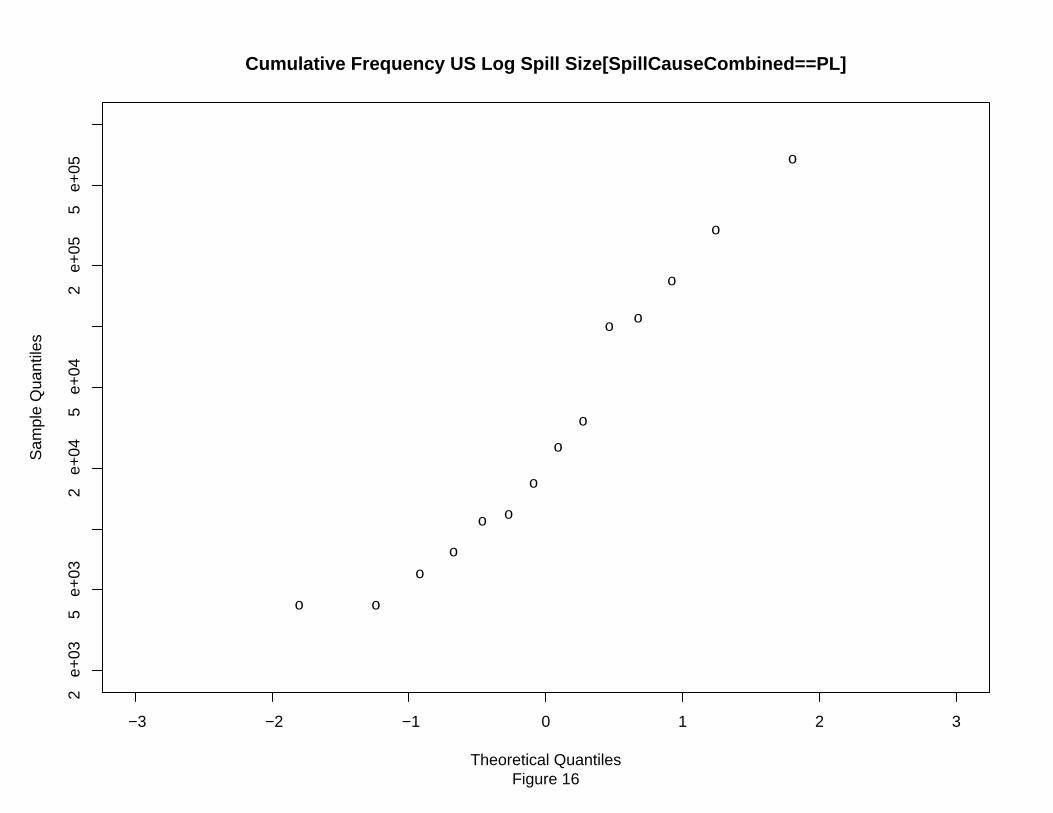
o
o
o
oo
o
o o
o
o
o
o
o
o
−3 −2 −1 0 1 2 3
2 e
+03
5 e
+03
2 e
+04
5 e
+04
2 e
+05
5 e
+05
Cumulative Frequency US Log Spill Size[SpillCauseCombined==PL]
Figure 16Theoretical Quantiles
Sam
ple
Qua
ntile
s
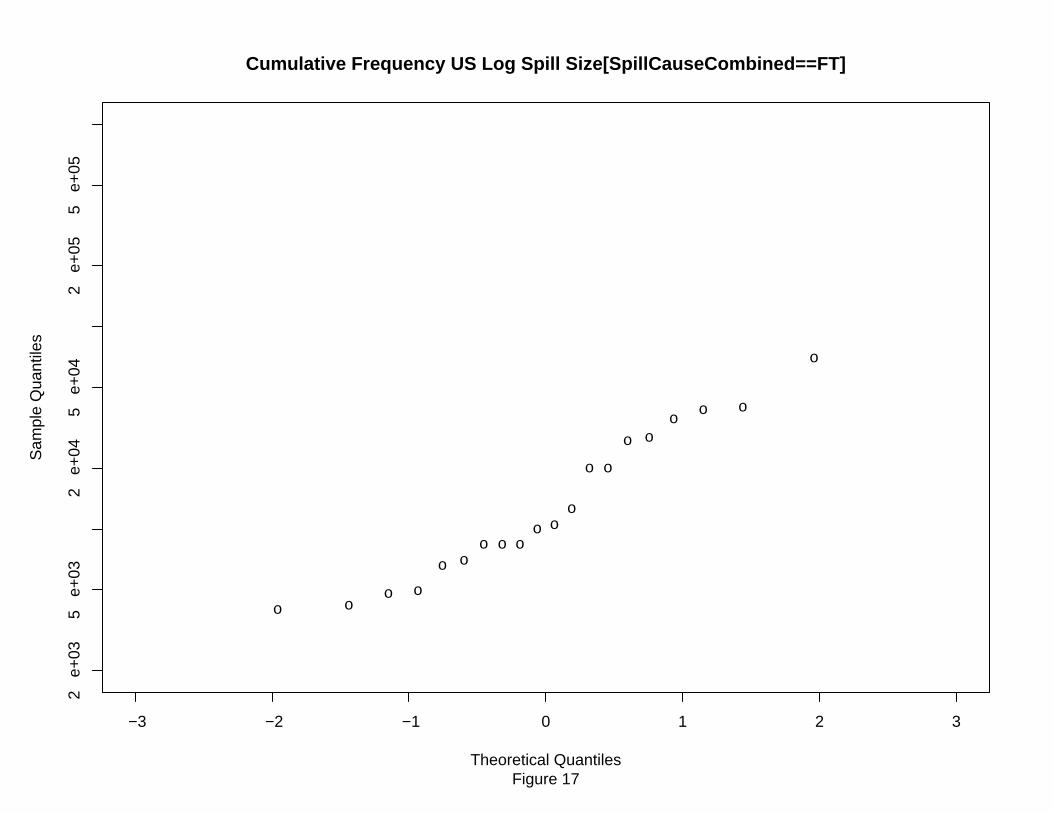
o
o
o
o
o
o
o
o
o
o
o
o
o
o
o
o
o
o o
o
−3 −2 −1 0 1 2 3
2 e
+03
5 e
+03
2 e
+04
5 e
+04
2 e
+05
5 e
+05
Cumulative Frequency US Log Spill Size[SpillCauseCombined==FT]
Figure 17Theoretical Quantiles
Sam
ple
Qua
ntile
s

oo
o
o
o
o
−3 −2 −1 0 1 2 3
2 e
+03
5 e
+03
2 e
+04
5 e
+04
2 e
+05
5 e
+05
Cumulative Frequency US Log Spill Size[SpillCauseCombined==U]
Figure 18Theoretical Quantiles
Sam
ple
Qua
ntile
s
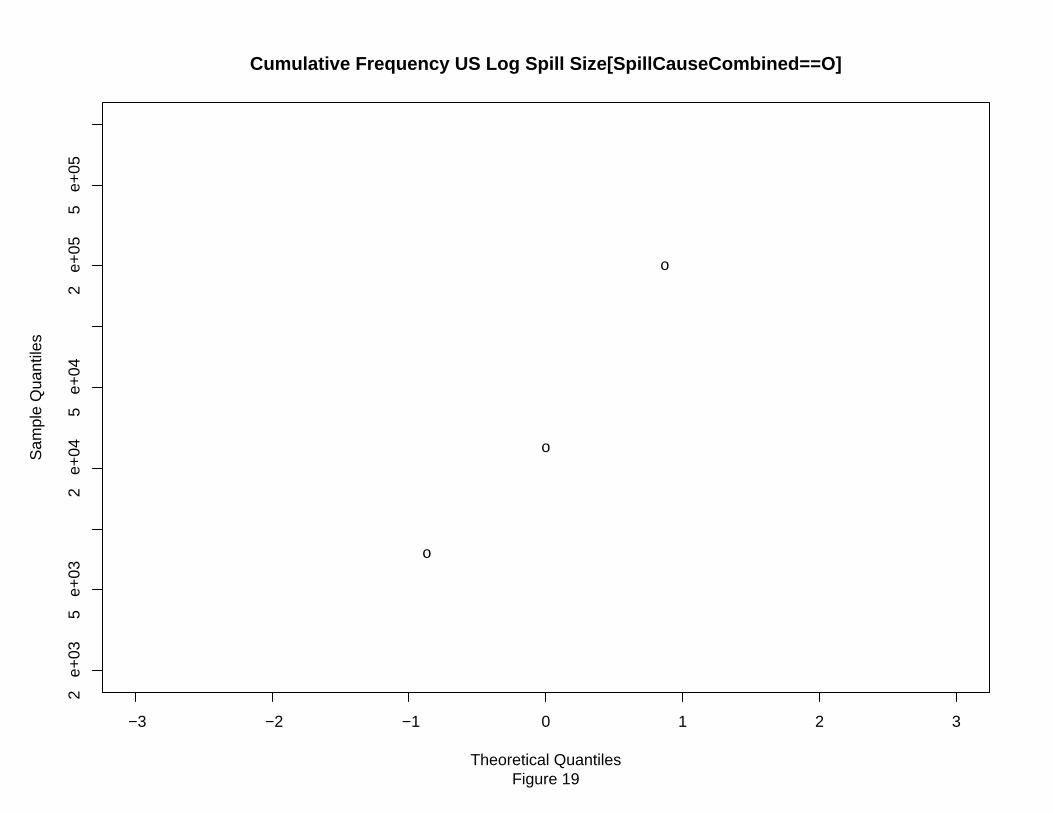
o
o
o
−3 −2 −1 0 1 2 3
2 e
+03
5 e
+03
2 e
+04
5 e
+04
2 e
+05
5 e
+05
Cumulative Frequency US Log Spill Size[SpillCauseCombined==O]
Figure 19Theoretical Quantiles
Sam
ple
Qua
ntile
s

o
o
o
o
o
o
o
oo
o
o
o
o
o
o
o
o
ooo
o
oo
o
o
o
o
o
o
o
o
o
oo
oo
o
o
o
ooo
oo
o
o
o
o
oo
o
o o
o
o
−3 −2 −1 0 1 2 3
2 e
+03
5 e
+03
2 e
+04
5 e
+04
2 e
+05
5 e
+05
Cumulative Frequency US Log Spill Size[OilType==D]
Figure 20Theoretical Quantiles
Sam
ple
Qua
ntile
s
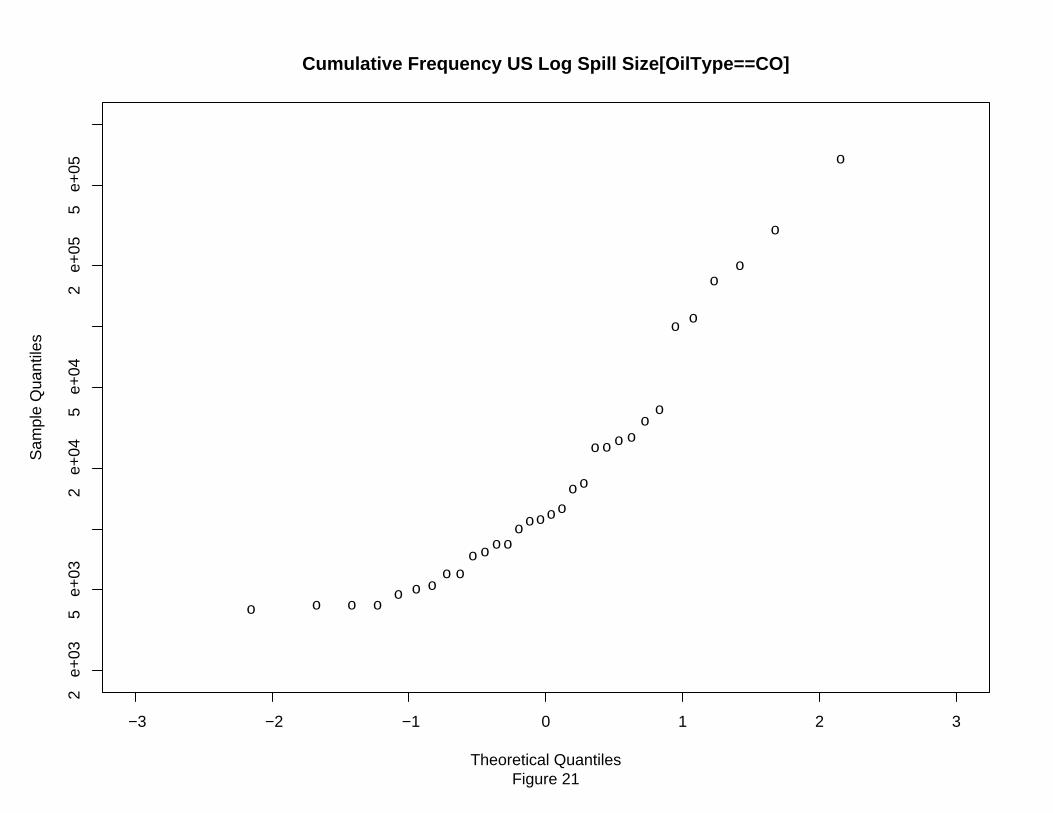
o
o
oo
o
o
o
o
o
o
o
o
o
o
o
o
o
oo
oo
o
o
o o
o
o
o
o
o
o
o
−3 −2 −1 0 1 2 3
2 e
+03
5 e
+03
2 e
+04
5 e
+04
2 e
+05
5 e
+05
Cumulative Frequency US Log Spill Size[OilType==CO]
Figure 21Theoretical Quantiles
Sam
ple
Qua
ntile
s
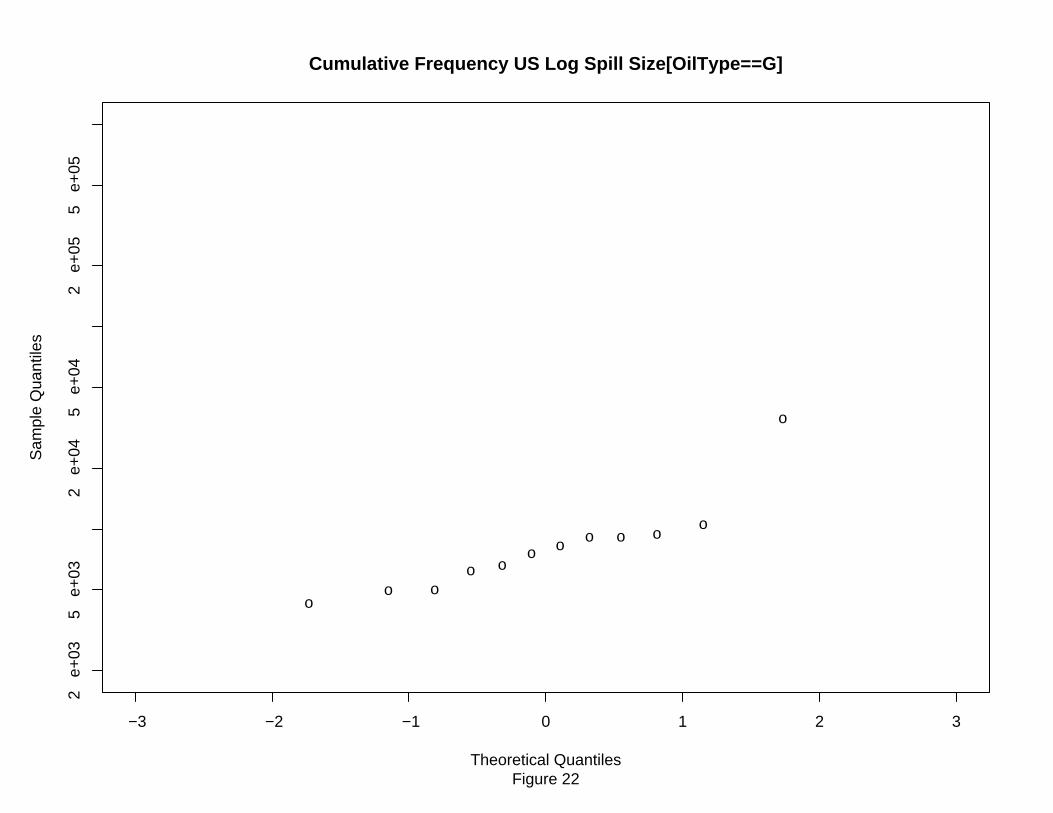
o
oo
o
o
o
oo o o
o
o
−3 −2 −1 0 1 2 3
2 e
+03
5 e
+03
2 e
+04
5 e
+04
2 e
+05
5 e
+05
Cumulative Frequency US Log Spill Size[OilType==G]
Figure 22Theoretical Quantiles
Sam
ple
Qua
ntile
s
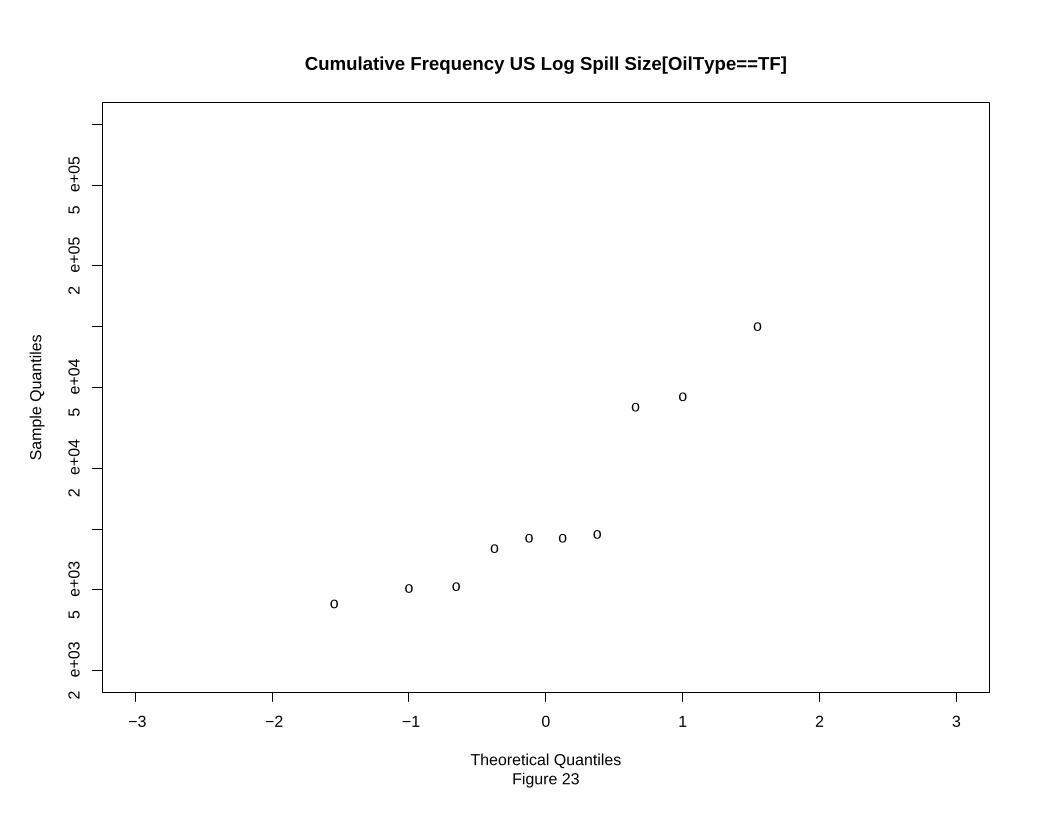
o
o
o
o
oo o
o
o
o
−3 −2 −1 0 1 2 3
2 e
+03
5 e
+03
2 e
+04
5 e
+04
2 e
+05
5 e
+05
Cumulative Frequency US Log Spill Size[OilType==TF]
Figure 23Theoretical Quantiles
Sam
ple
Qua
ntile
s
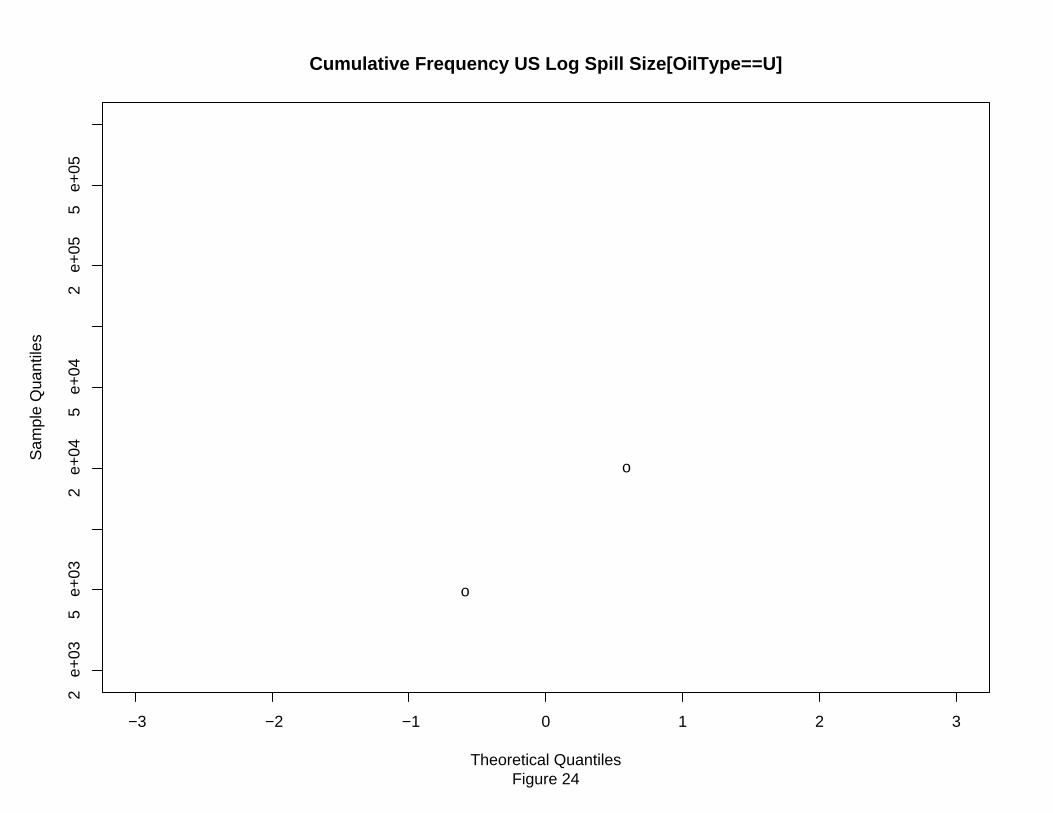
o
o
−3 −2 −1 0 1 2 3
2 e
+03
5 e
+03
2 e
+04
5 e
+04
2 e
+05
5 e
+05
Cumulative Frequency US Log Spill Size[OilType==U]
Figure 24Theoretical Quantiles
Sam
ple
Qua
ntile
s
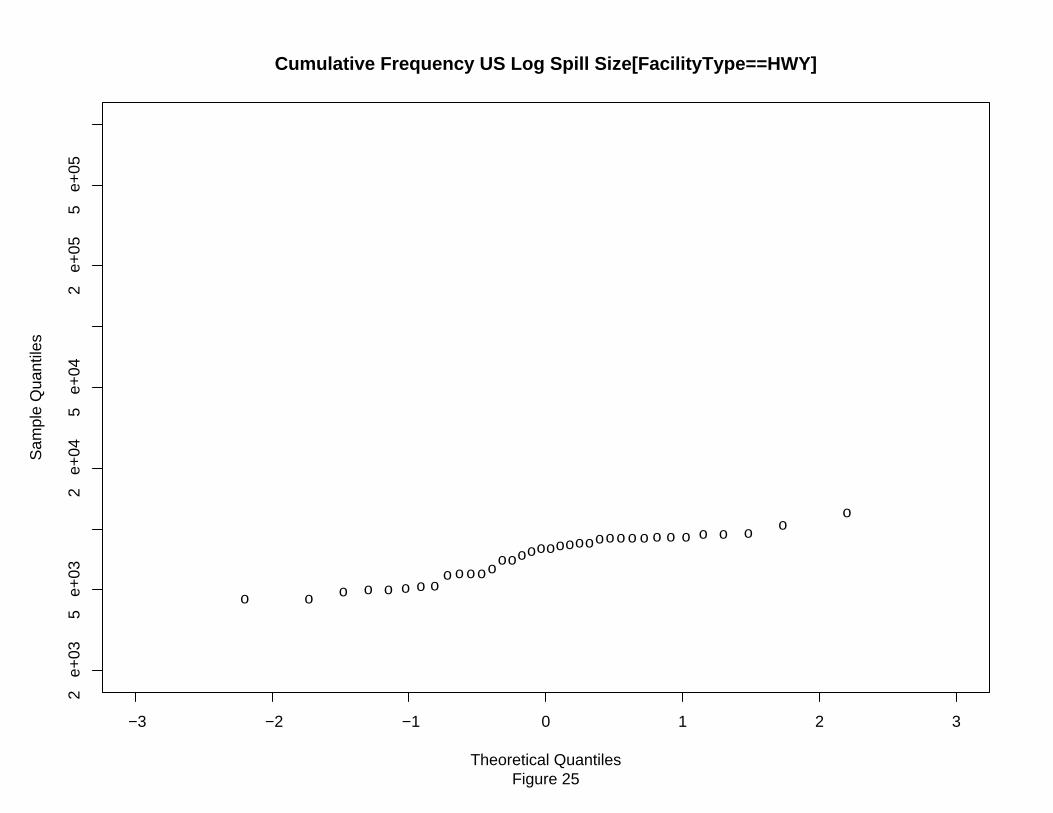
ooo
o o
o
o
o
oo
oo
oo o
oo
o
oooo
oo
o
o
o
oo
oo
o o
oo
o
−3 −2 −1 0 1 2 3
2 e
+03
5 e
+03
2 e
+04
5 e
+04
2 e
+05
5 e
+05
Cumulative Frequency US Log Spill Size[FacilityType==HWY]
Figure 25Theoretical Quantiles
Sam
ple
Qua
ntile
s
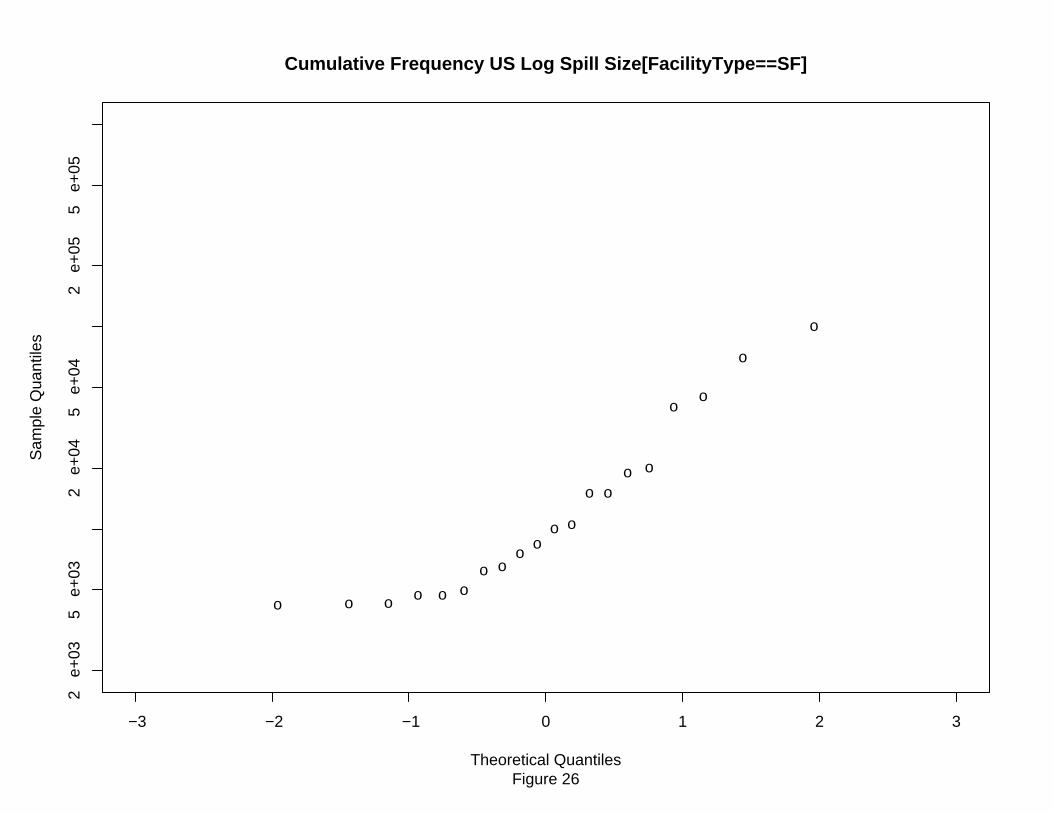
o
o
o
o
o
o
o
o
oo
o
o o
oo
o
o
o
o o
−3 −2 −1 0 1 2 3
2 e
+03
5 e
+03
2 e
+04
5 e
+04
2 e
+05
5 e
+05
Cumulative Frequency US Log Spill Size[FacilityType==SF]
Figure 26Theoretical Quantiles
Sam
ple
Qua
ntile
s
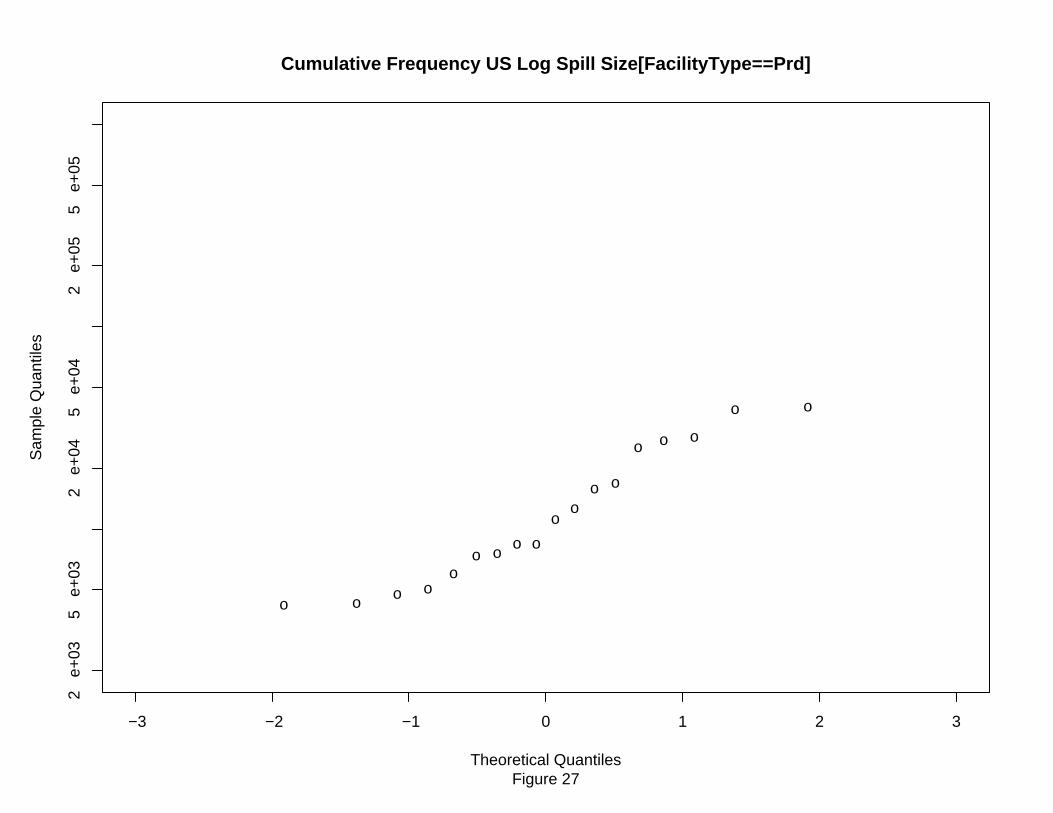
o
o
o
o
o
o
o
o
o
o
o
o
o
o
o
oo
o
−3 −2 −1 0 1 2 3
2 e
+03
5 e
+03
2 e
+04
5 e
+04
2 e
+05
5 e
+05
Cumulative Frequency US Log Spill Size[FacilityType==Prd]
Figure 27Theoretical Quantiles
Sam
ple
Qua
ntile
s
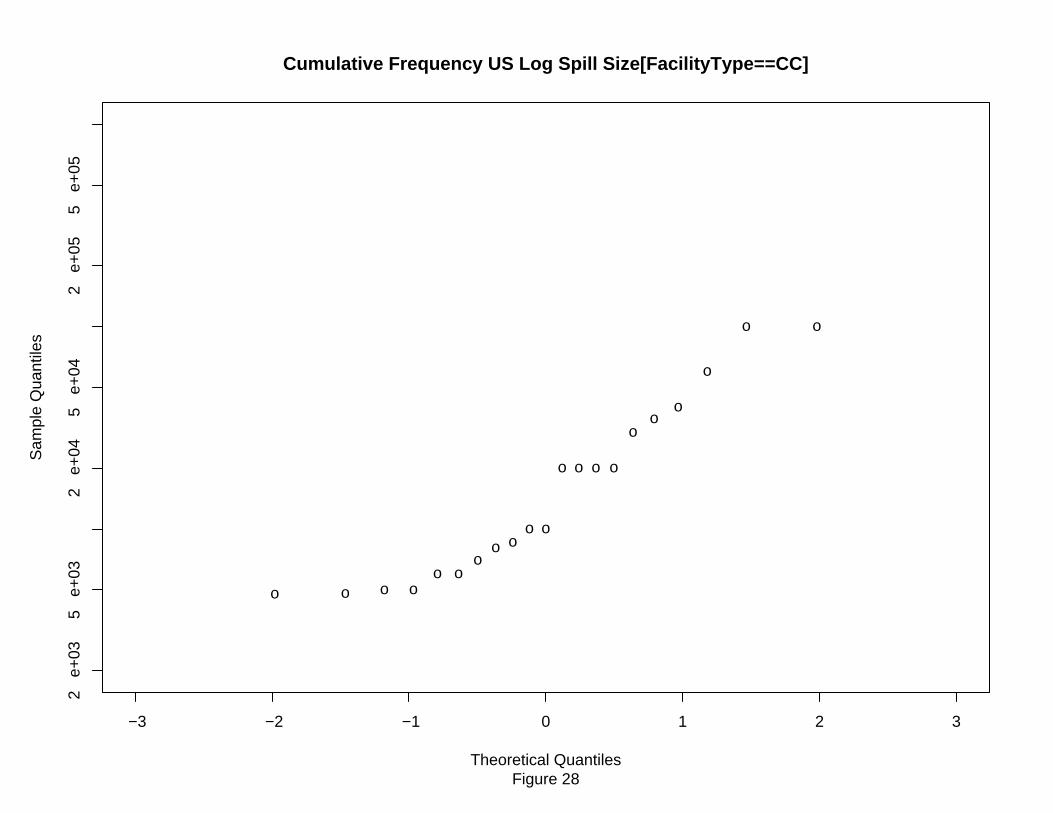
o
o
o
o
o
o
o
o
o
o
o
o
o
o o o
o
o o
oo
−3 −2 −1 0 1 2 3
2 e
+03
5 e
+03
2 e
+04
5 e
+04
2 e
+05
5 e
+05
Cumulative Frequency US Log Spill Size[FacilityType==CC]
Figure 28Theoretical Quantiles
Sam
ple
Qua
ntile
s
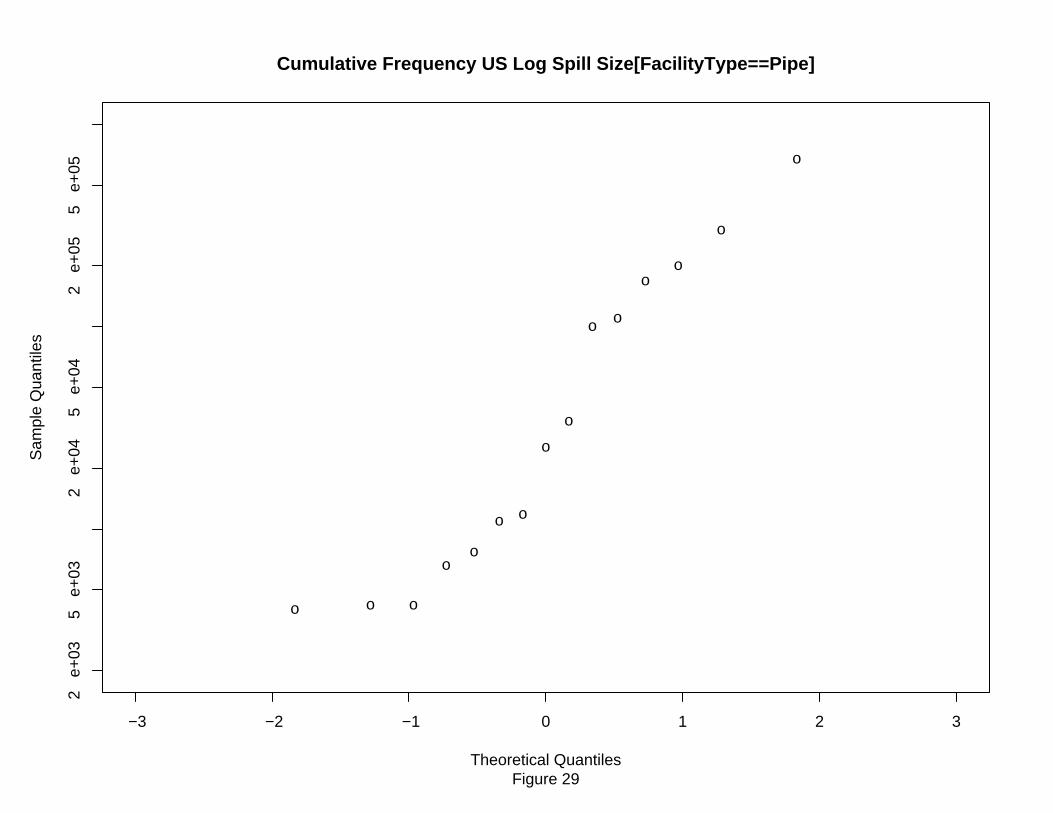
o
o
o
o
o
o
o o
o
o
o
o
o
o
o
−3 −2 −1 0 1 2 3
2 e
+03
5 e
+03
2 e
+04
5 e
+04
2 e
+05
5 e
+05
Cumulative Frequency US Log Spill Size[FacilityType==Pipe]
Figure 29Theoretical Quantiles
Sam
ple
Qua
ntile
s
80
Figures 30 through 33 show the logarithms of spill volume versus affected media. Figure 30, for land, shows a mixture of two lognormal populations, while Figure 31, for unspecified values, seems to be a single lognormal population. Figure 32, for land and water, shows a mixture of two lognormal populations. Figure 33, for those spills retained on a facility pad, in an impoundment, or within a secondary containment area, appears to be a single lognormal population.
It is of interest to note that it is possible to globally interpret all of the spills as composed of two lognormal populations, one of which is average and the other that is larger. Hart Crowser conducted a statistical analysis on individual spill volumes by study area, facility type, oil type, affected media and spill cause combined, and did not find any particularly interesting correlation. Hence, the next phase of the analysis looked at annualized groupings of spills. Total spill volumes by year were accumulated and plotted on a cumulative frequency plot, as shown in Figure 34. This shows a mixture of several populations.
If the data are re-plotted on a logarithmic scale, a single lognormal population emerges. This is shown in Figure 35. A count of the number of spills per year in the database is tabulated in Figure 36. This distribution is possibly Poisson; however, this hypothesis was not tested. A more interesting way of looking at the data to see if regulatory or reporting requirements have significantly affected spills is shown in Figure 37, where spill size is plotted by year. As can be seen by examining Figure 37, it appears that in the period from 1975 to 1979 there were a considerable number of large spills, and then after that, the number of spills dropped to a more or less constant rate. This same data is shown on a logarithmic scale in Figure 38. .Again, it appears that spills were relatively constant between 1969 and 1975, and from 1980 onward. It must be noted that 1977 is significant because crude oil production on North Slope and TAPS operation started in the middle of that year. However, the years of 1978 and 1979 fit with years of 1975 and 1977 visually better in Figure 38 than breaking the data at 1977. The number of spills as shown in Figure 39 again shows a larger number in the period from 1975 to 1980. On a count basis (Figure 39), there is some evidence that 1975,1976 and 1977 are a single high group. This corresponds well to the peak years of TAPS construction and development and construction of the North Slope oil fields. When the number of spills are grouped by 5-year periods (arbitrarily starting on years ending in 0 and 5 for calculation convenience), as shown in Figures 40 and 41, it appears that the 1975 to 1979 period was the highest. This same conclusion is confirmed by Figure 42, which shows a count of spills by 5-year groups. The 1975 to 1979 period appears to have the most number of spills.
Calculated Oil Spill Risk Rates Another way of investigating the data is on a rate basis. For a rate-basis type of investigation, some variable, which can be reasonably expected to correlate with the quantity being measured, is added to the dataset for analysis. In the case of the Alaskan oil spill data, total volume spilled divided by production was selected. As noted earlier, the units for this spill rate are U.S. gallons per million barrels produced. Because it was anticipated that a logarithmic analysis would give better results, 2,000 gallons was added to the total spill volume on each year for analysis. The rate data used are presented in Table 4, with assumptions of 450 million barrels of crude oil production for the Alaska - ONS study area and 9.924 million barrels of crude oil production for the Canada - Norman Wells study area for 1999. The value of 2,000 gallons is close to one-half of the minimum oil spill volume included in this analysis. A cumulative frequency plot of this variable is shown in Figure 43. This figure was not found to be particularly useful, so the data were re-plotted on a logarithmic basis as shown in Figure 44. Figure 44 shows what may be a
81
mixture of three lognormal populations. When these data are plotted on a yearly basis, as shown in Figure 45, it appears that prior to 1977, spill rates were considerably greater than in the subsequent years. Because of the low value of the spill rate after 1980, it is not possible to draw any conclusions
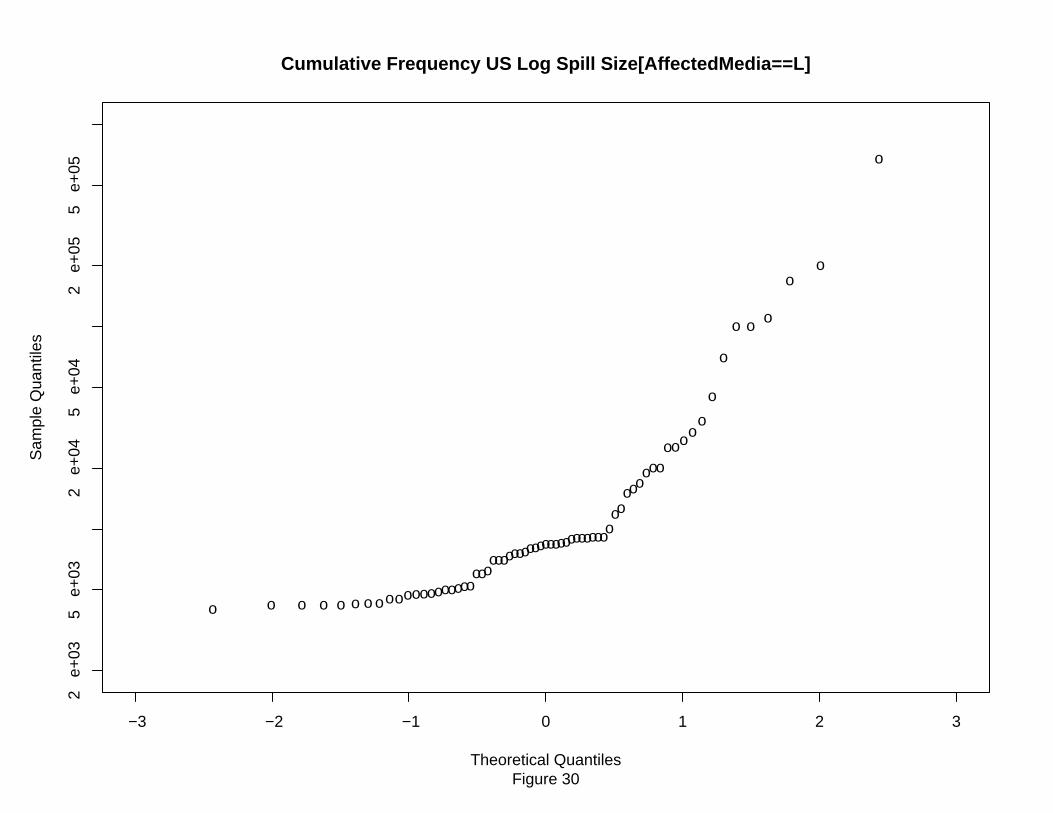
o
o
o
o
o
oo
o
o
o
o
oo
o
o
o
oo
o
oo
o
o
o
o
o
o
oo
o
o
o
o
o
o
o
o
o o
oo
o
o
o
o o
o
o
o
o
o
o
o
o
oooo
o
o
o
oo
o
o
o
o
−3 −2 −1 0 1 2 3
2 e
+03
5 e
+03
2 e
+04
5 e
+04
2 e
+05
5 e
+05
Cumulative Frequency US Log Spill Size[AffectedMedia==L]
Figure 30Theoretical Quantiles
Sam
ple
Qua
ntile
s
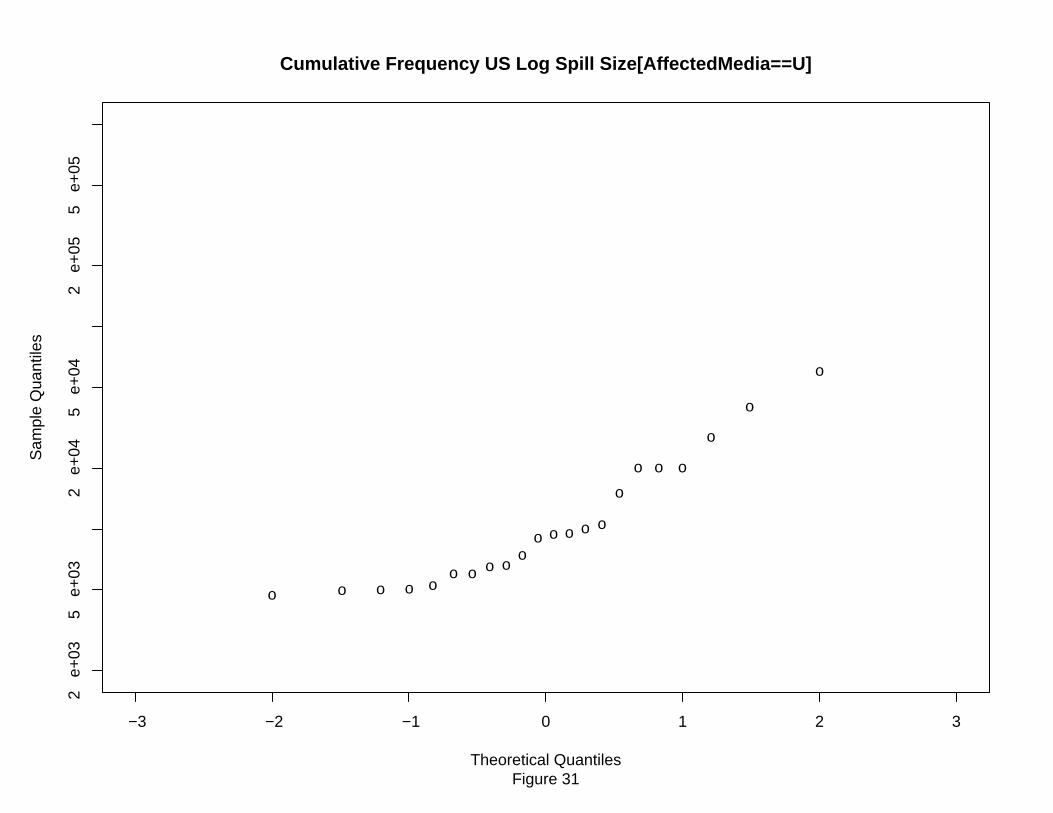
o
o
oo oo
o
o
o
oo
oo
o
o
o
o
o
o
oo
o
−3 −2 −1 0 1 2 3
2 e
+03
5 e
+03
2 e
+04
5 e
+04
2 e
+05
5 e
+05
Cumulative Frequency US Log Spill Size[AffectedMedia==U]
Figure 31Theoretical Quantiles
Sam
ple
Qua
ntile
s
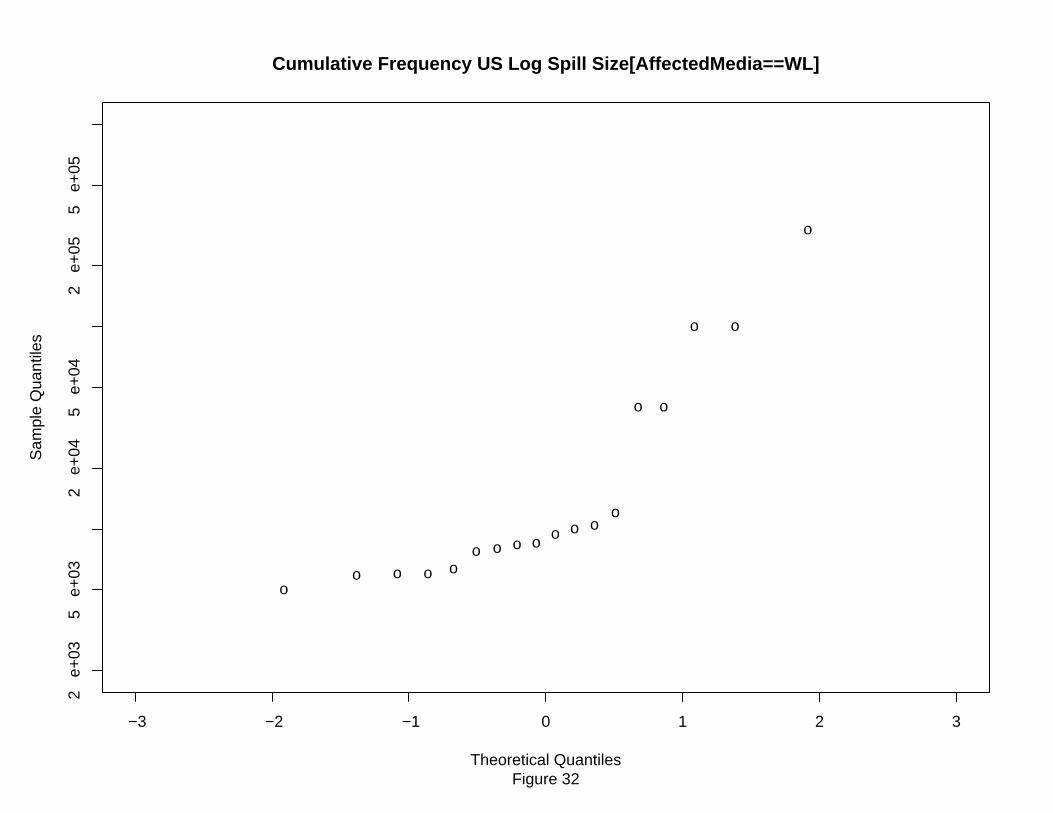
o
o
oo
o
o
o
o
o
oo
o
o
o
o
o
o
o
−3 −2 −1 0 1 2 3
2 e
+03
5 e
+03
2 e
+04
5 e
+04
2 e
+05
5 e
+05
Cumulative Frequency US Log Spill Size[AffectedMedia==WL]
Figure 32Theoretical Quantiles
Sam
ple
Qua
ntile
s
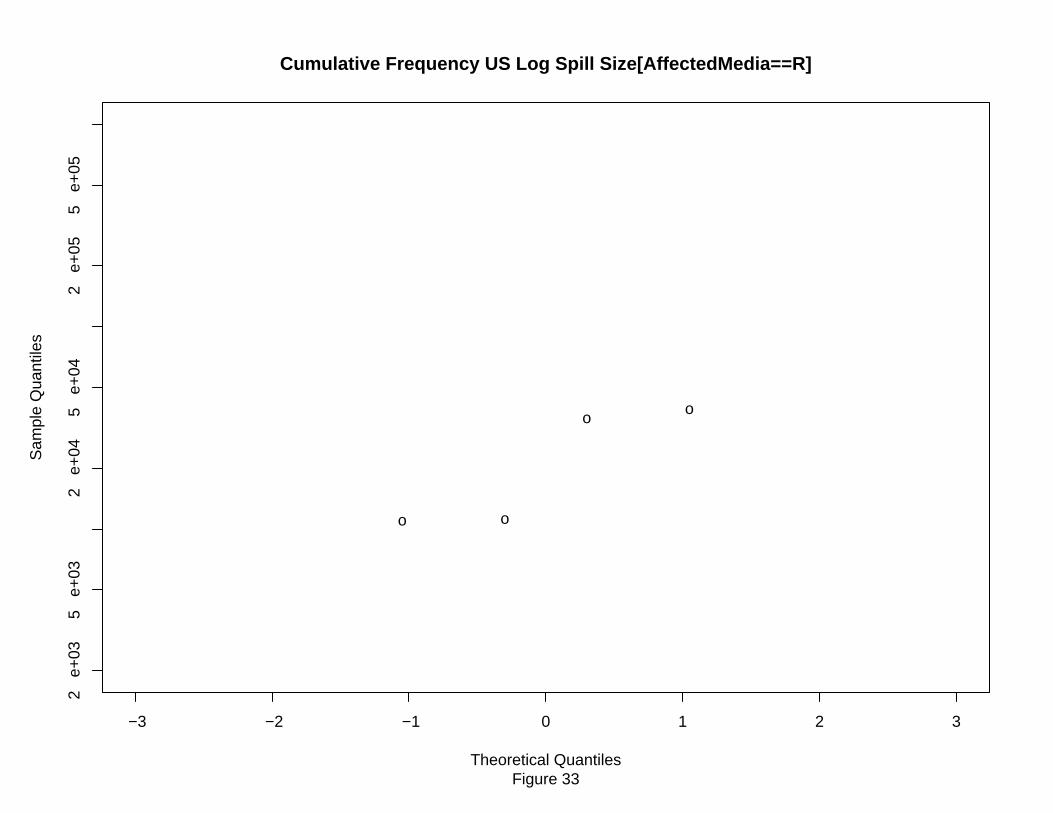
o
o
o
o
−3 −2 −1 0 1 2 3
2 e
+03
5 e
+03
2 e
+04
5 e
+04
2 e
+05
5 e
+05
Cumulative Frequency US Log Spill Size[AffectedMedia==R]
Figure 33Theoretical Quantiles
Sam
ple
Qua
ntile
s
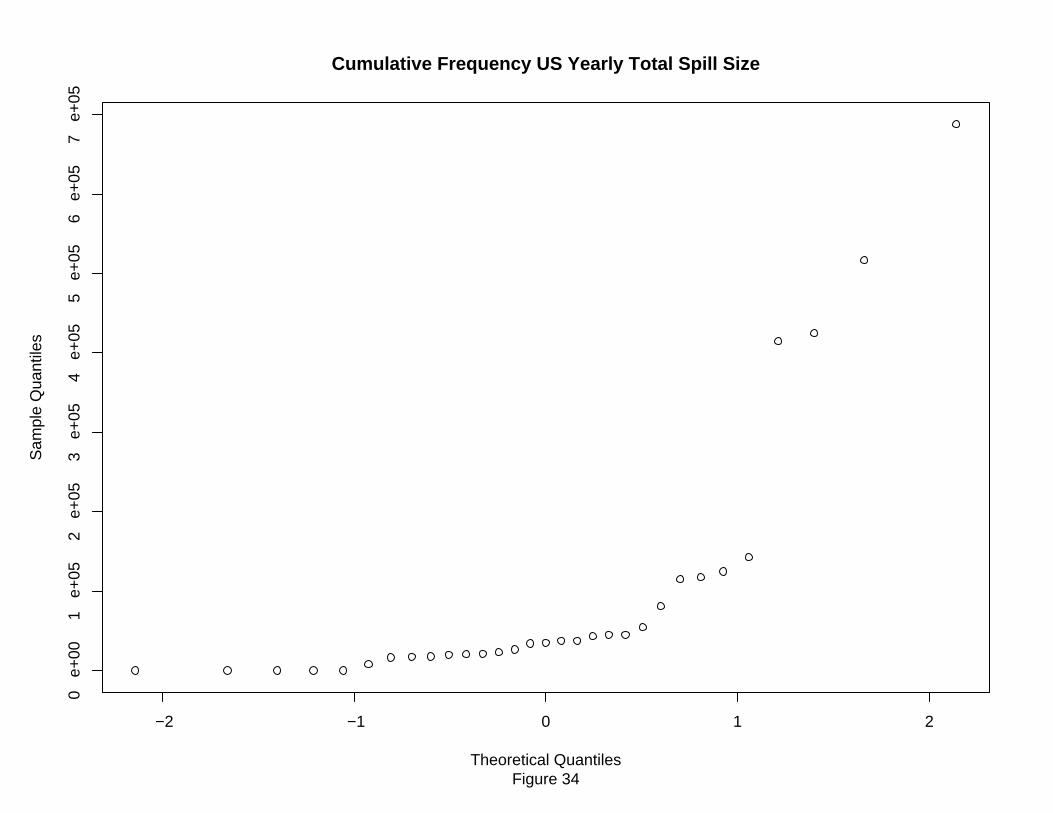
−2 −1 0 1 2
0 e
+00
1 e
+05
2 e
+05
3 e
+05
4 e
+05
5 e
+05
6 e
+05
7 e
+05
Cumulative Frequency US Yearly Total Spill Size
Figure 34Theoretical Quantiles
Sam
ple
Qua
ntile
s
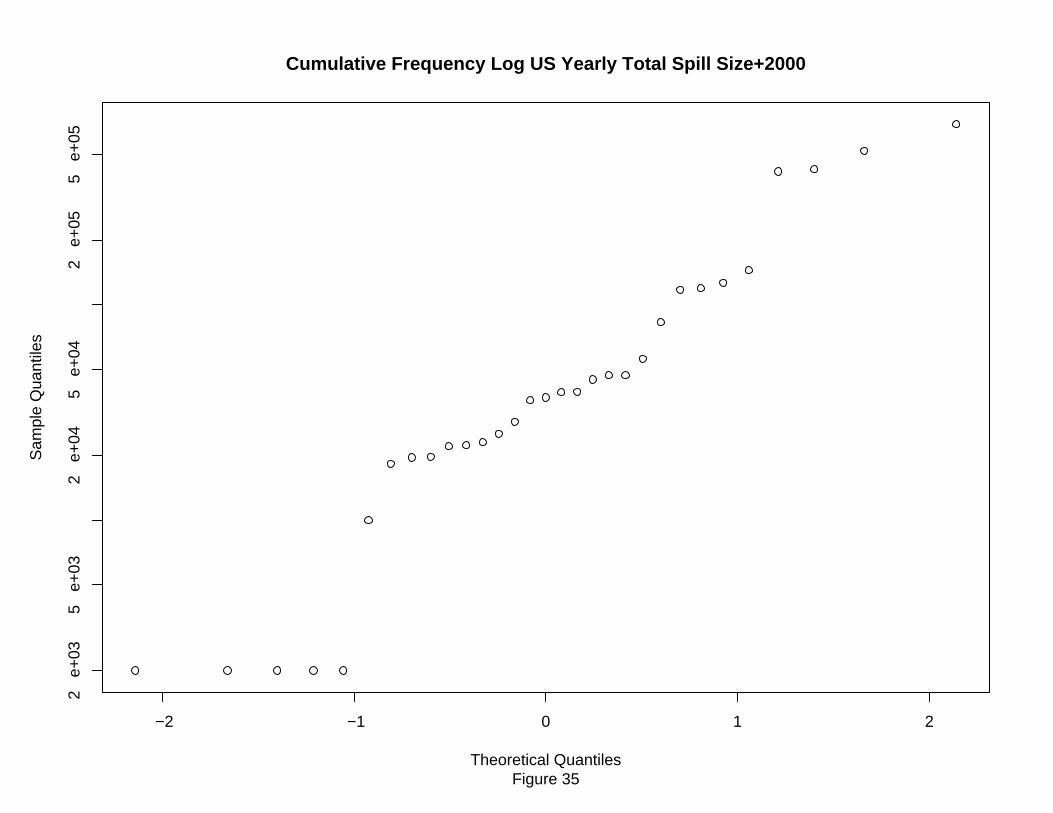
−2 −1 0 1 2
2 e
+03
5 e
+03
2 e
+04
5 e
+04
2 e
+05
5 e
+05
Cumulative Frequency Log US Yearly Total Spill Size+2000
Figure 35Theoretical Quantiles
Sam
ple
Qua
ntile
s
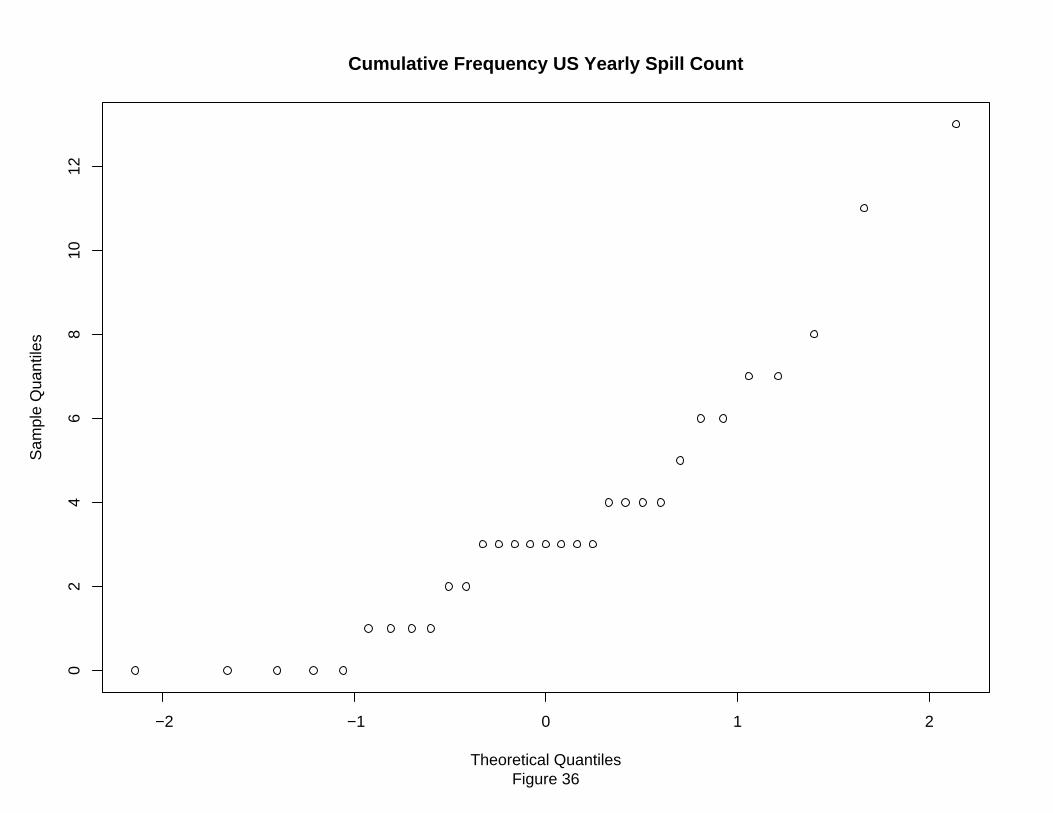
−2 −1 0 1 2
02
46
810
12Cumulative Frequency US Yearly Spill Count
Figure 36Theoretical Quantiles
Sam
ple
Qua
ntile
s
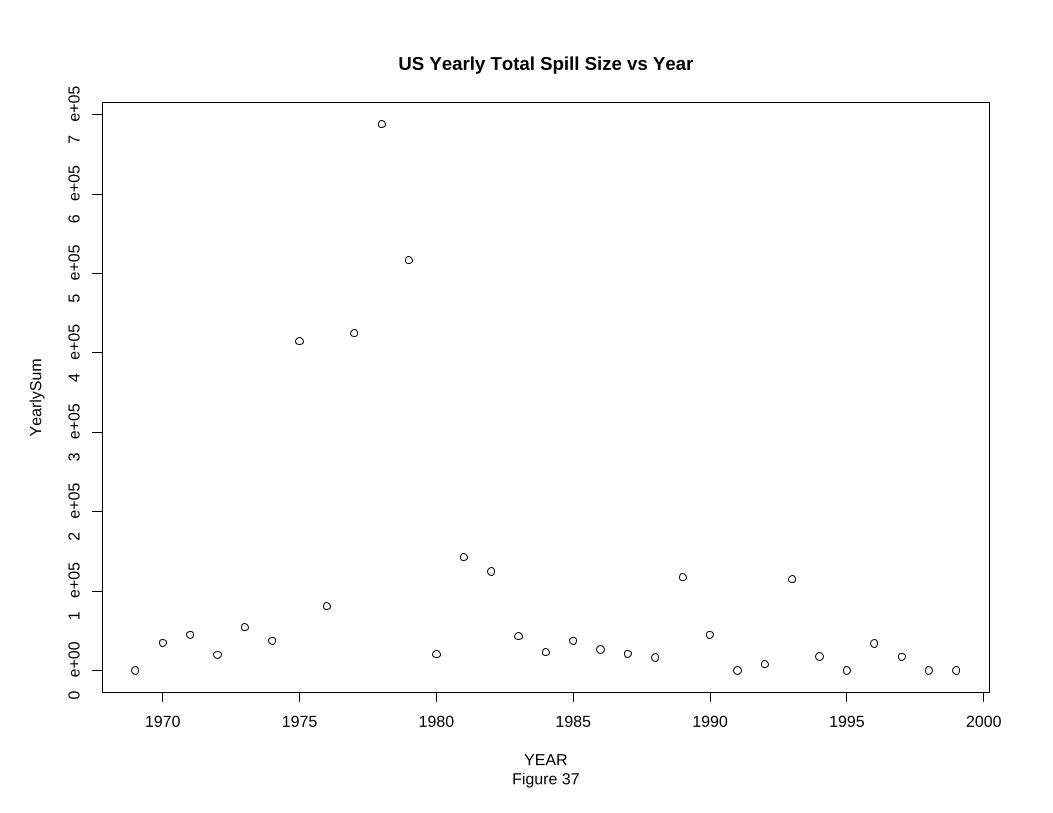
1970 1975 1980 1985 1990 1995 2000
0 e
+00
1 e
+05
2 e
+05
3 e
+05
4 e
+05
5 e
+05
6 e
+05
7 e
+05
US Yearly Total Spill Size vs Year
Figure 37YEAR
Yea
rlyS
um
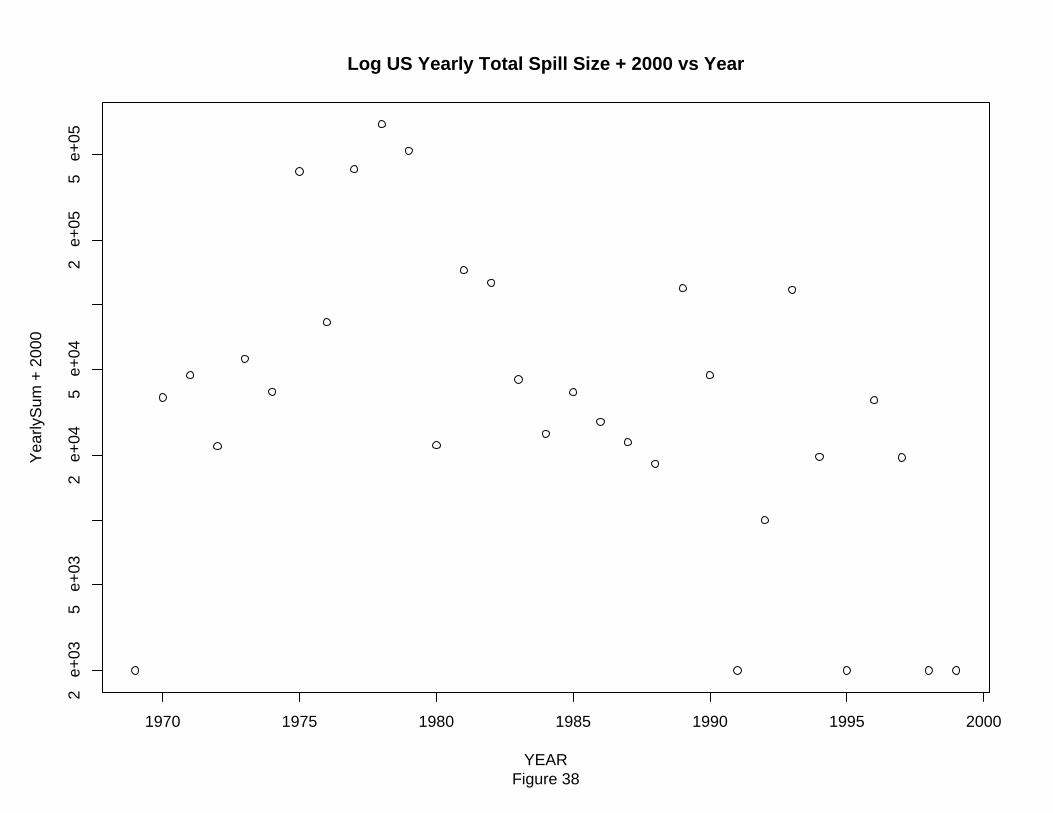
1970 1975 1980 1985 1990 1995 2000
2 e
+03
5 e
+03
2 e
+04
5 e
+04
2 e
+05
5 e
+05
Log US Yearly Total Spill Size + 2000 vs Year
Figure 38YEAR
Yea
rlyS
um +
200
0
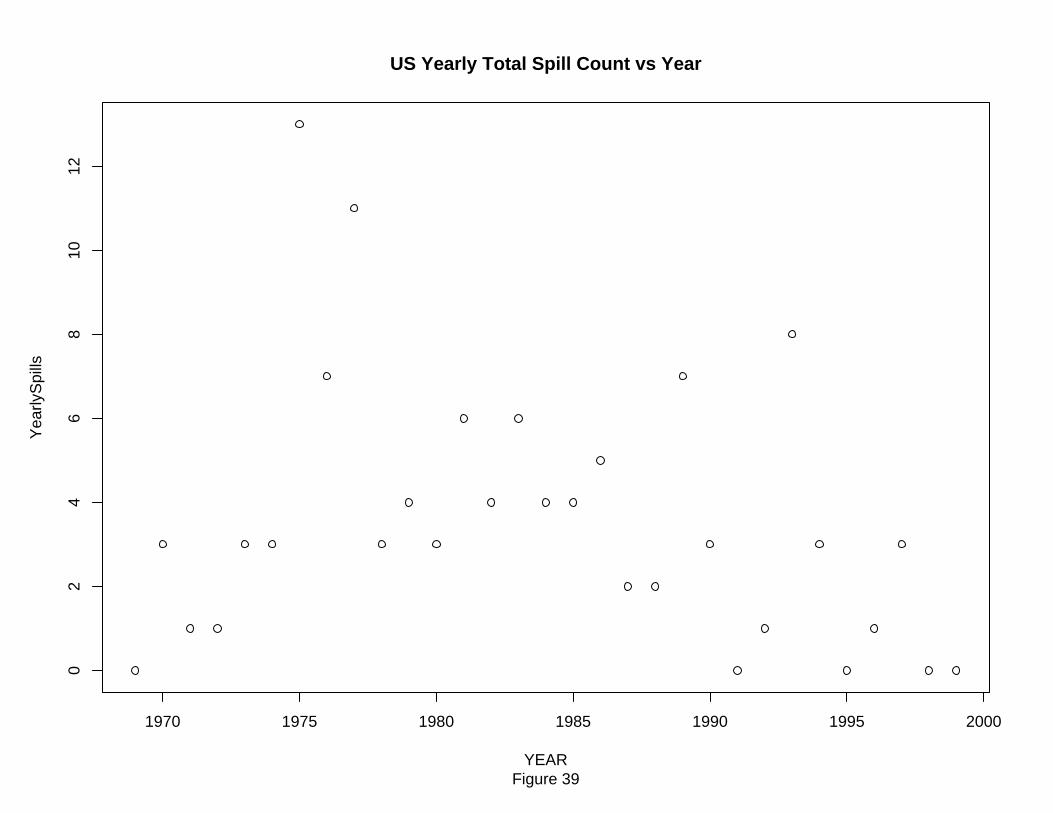
1970 1975 1980 1985 1990 1995 2000
02
46
810
12US Yearly Total Spill Count vs Year
Figure 39YEAR
Yea
rlyS
pills
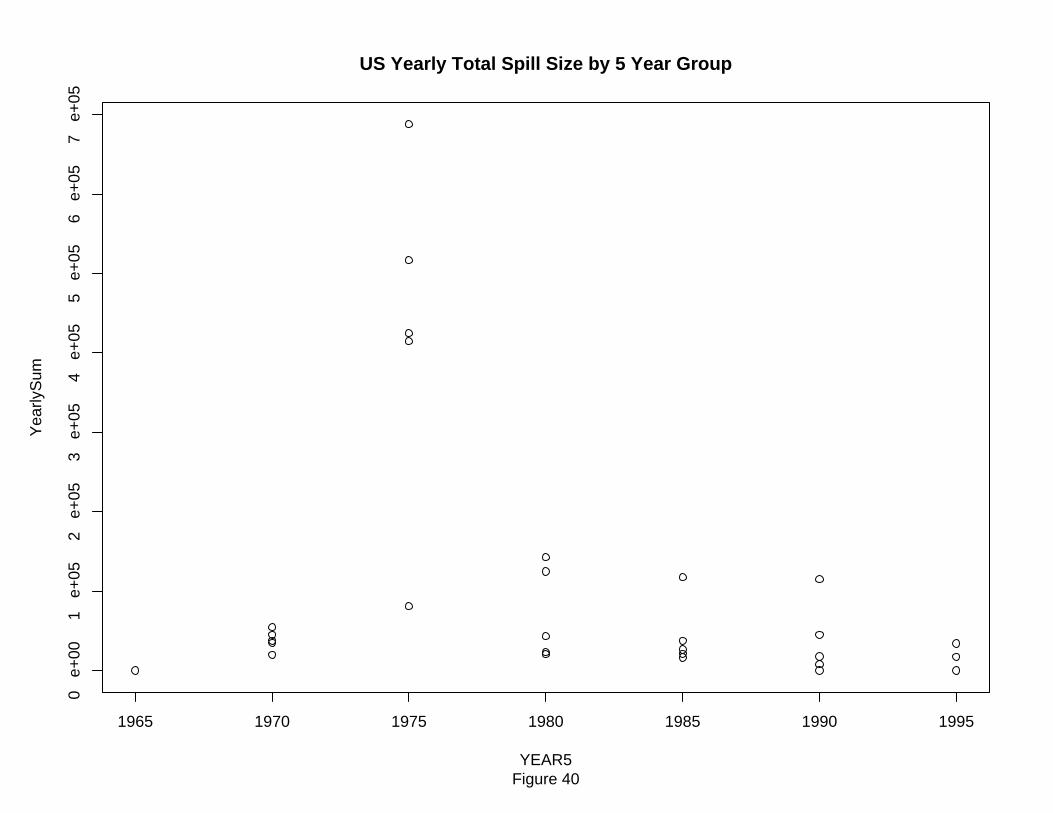
1965 1970 1975 1980 1985 1990 1995
0 e
+00
1 e
+05
2 e
+05
3 e
+05
4 e
+05
5 e
+05
6 e
+05
7 e
+05
US Yearly Total Spill Size by 5 Year Group
Figure 40YEAR5
Yea
rlyS
um
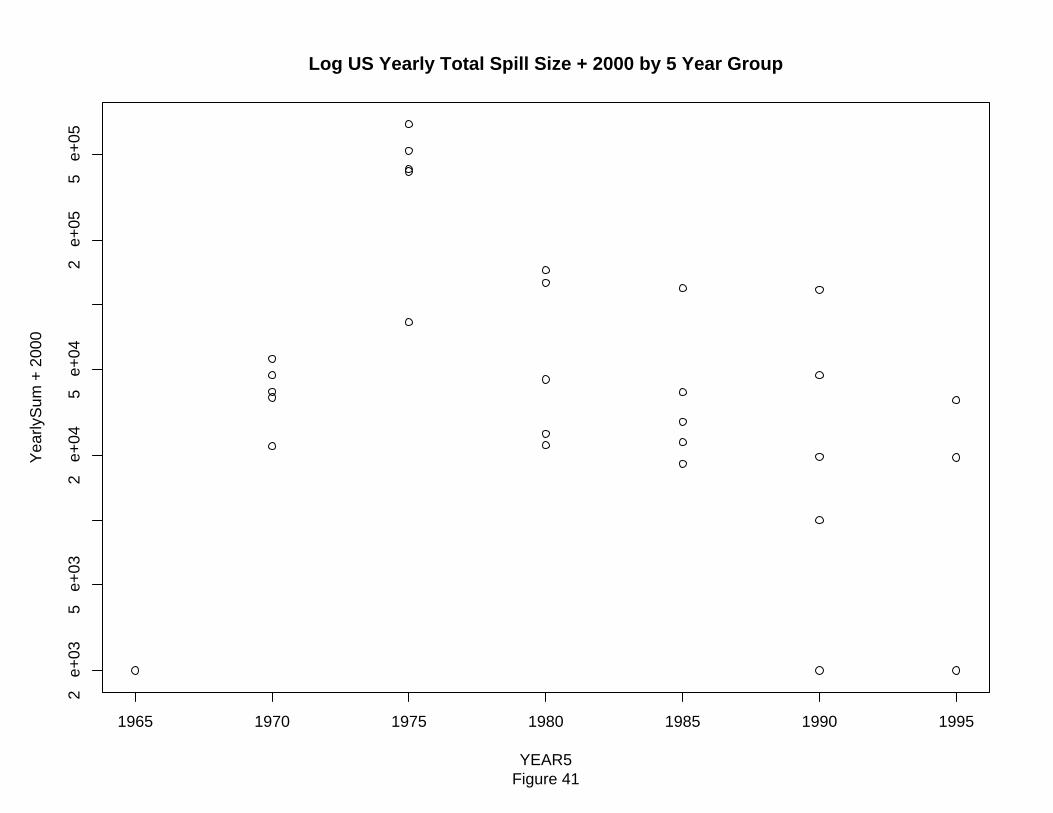
1965 1970 1975 1980 1985 1990 1995
2 e
+03
5 e
+03
2 e
+04
5 e
+04
2 e
+05
5 e
+05
Log US Yearly Total Spill Size + 2000 by 5 Year Group
Figure 41YEAR5
Yea
rlyS
um +
200
0
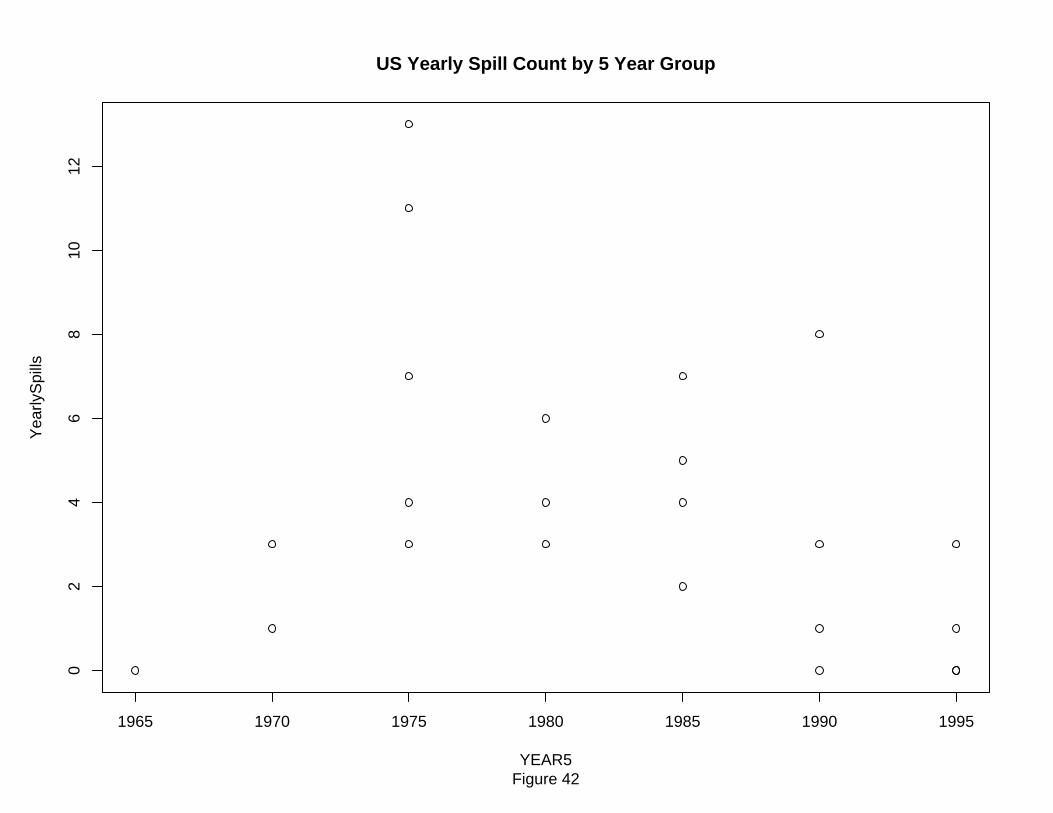
1965 1970 1975 1980 1985 1990 1995
02
46
810
12US Yearly Spill Count by 5 Year Group
Figure 42YEAR5
Yea
rlyS
pills
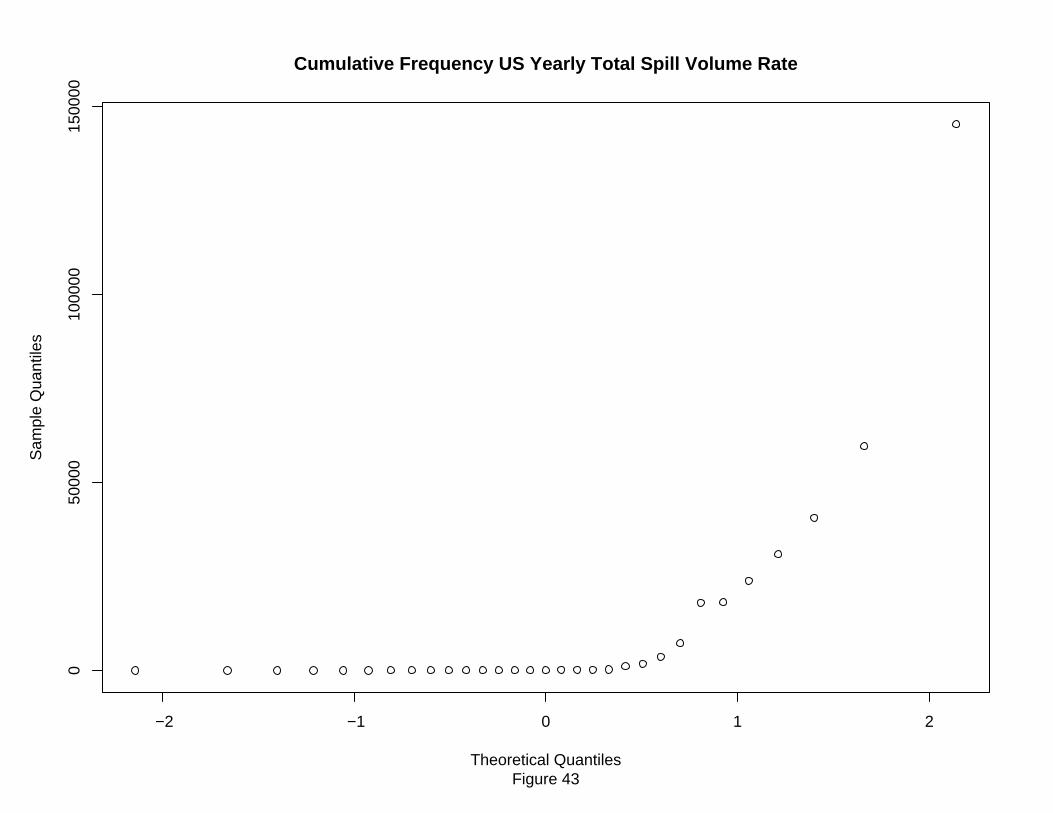
−2 −1 0 1 2
050
000
1000
0015
0000
Cumulative Frequency US Yearly Total Spill Volume Rate
Figure 43Theoretical Quantiles
Sam
ple
Qua
ntile
s
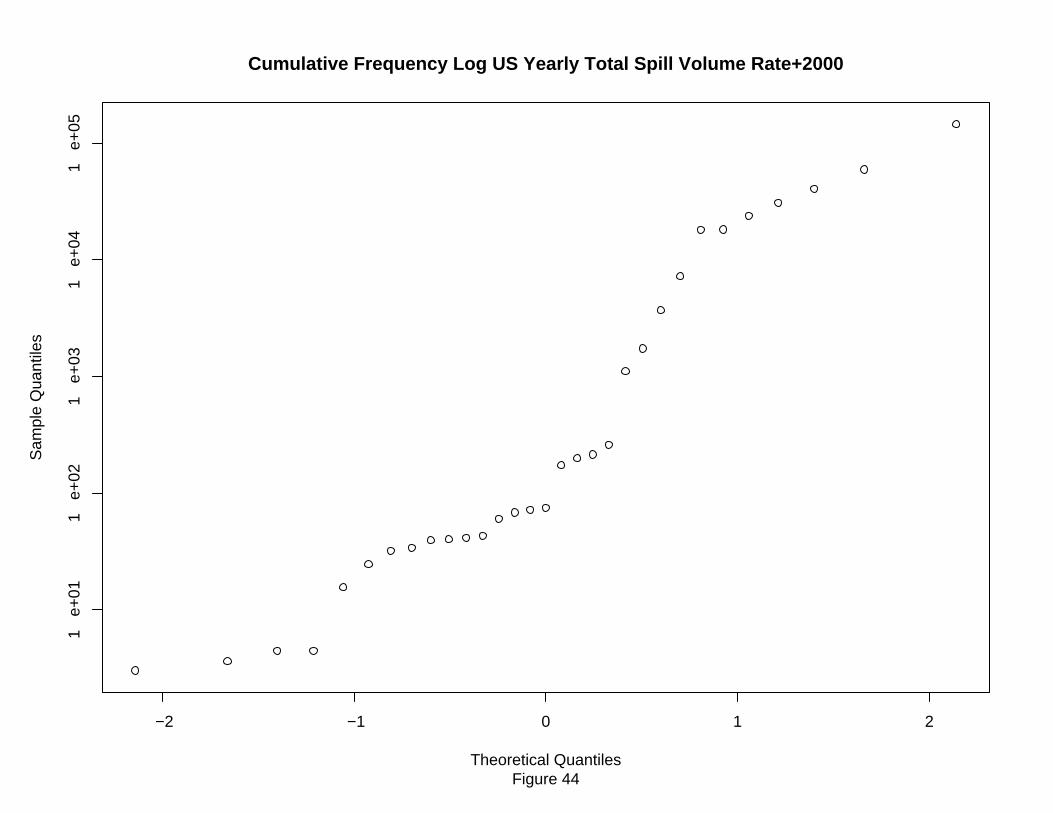
−2 −1 0 1 2
1 e
+01
1 e
+02
1 e
+03
1 e
+04
1 e
+05
Cumulative Frequency Log US Yearly Total Spill Volume Rate+2000
Figure 44Theoretical Quantiles
Sam
ple
Qua
ntile
s
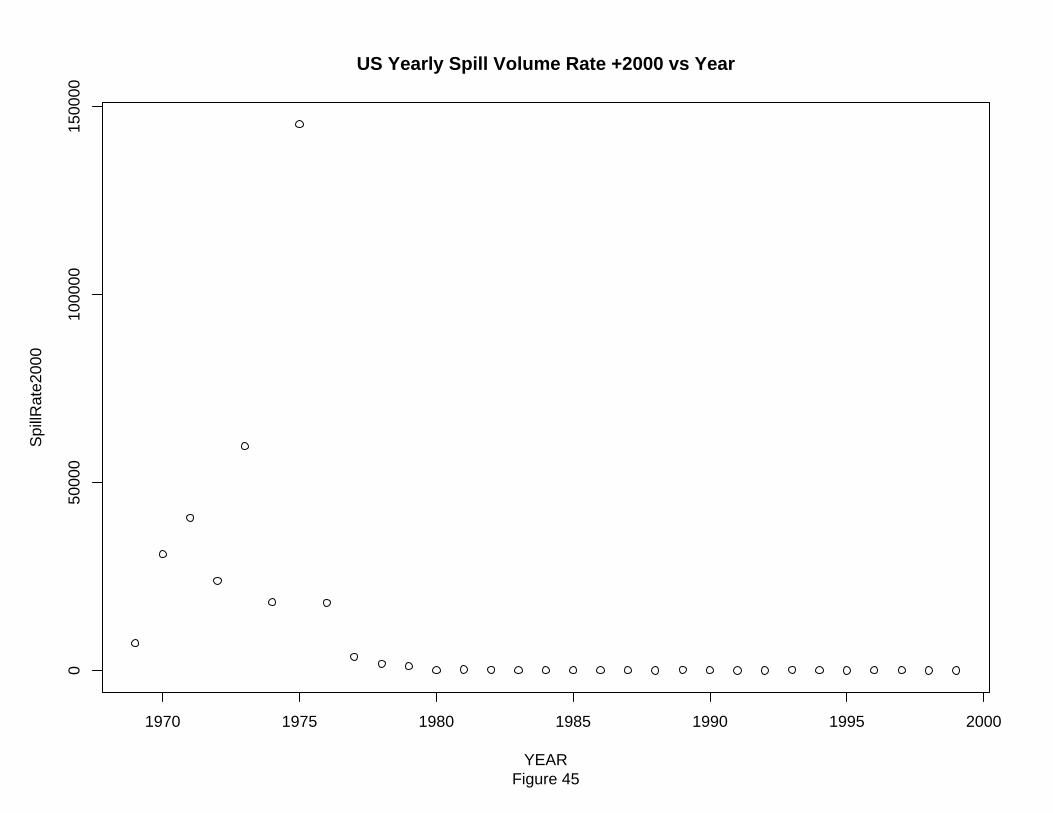
1970 1975 1980 1985 1990 1995 2000
050
000
1000
0015
0000
US Yearly Spill Volume Rate +2000 vs Year
Figure 45YEAR
Spi
llRat
e200
0
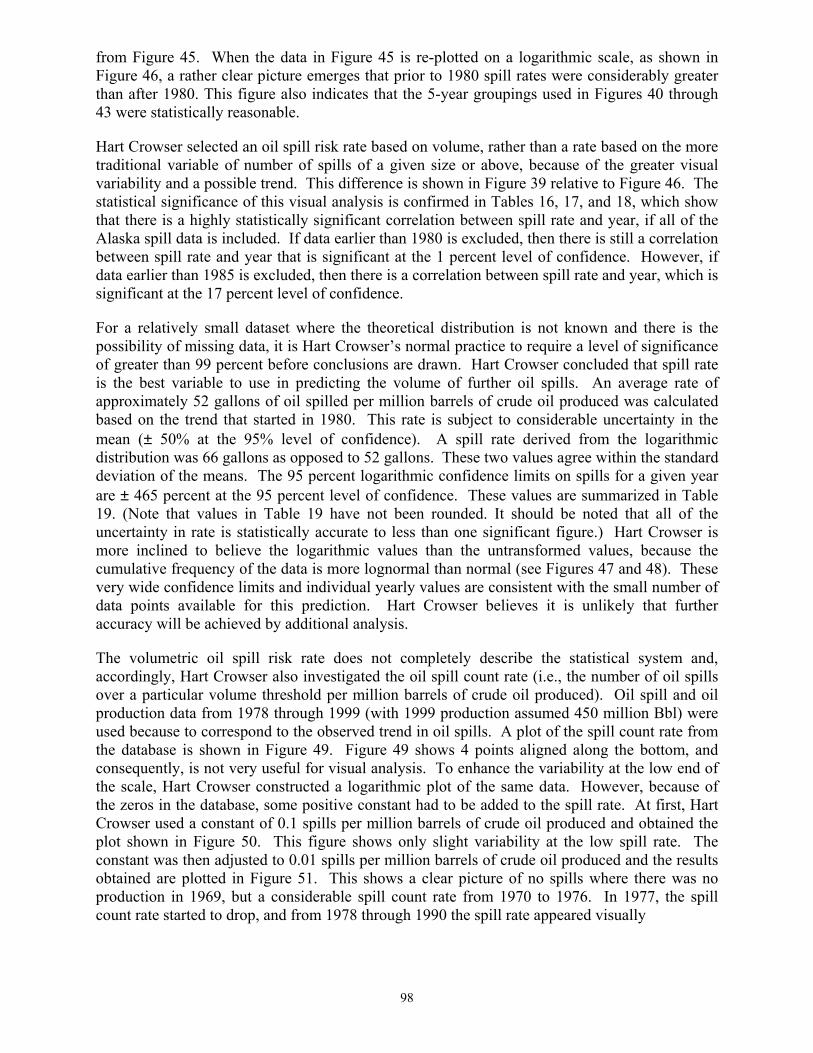
98
from Figure 45. When the data in Figure 45 is re-plotted on a logarithmic scale, as shown in Figure 46, a rather clear picture emerges that prior to 1980 spill rates were considerably greater than after 1980. This figure also indicates that the 5-year groupings used in Figures 40 through 43 were statistically reasonable.
Hart Crowser selected an oil spill risk rate based on volume, rather than a rate based on the more traditional variable of number of spills of a given size or above, because of the greater visual variability and a possible trend. This difference is shown in Figure 39 relative to Figure 46. The statistical significance of this visual analysis is confirmed in Tables 16, 17, and 18, which show that there is a highly statistically significant correlation between spill rate and year, if all of the Alaska spill data is included. If data earlier than 1980 is excluded, then there is still a correlation between spill rate and year that is significant at the 1 percent level of confidence. However, if data earlier than 1985 is excluded, then there is a correlation between spill rate and year, which is significant at the 17 percent level of confidence.
For a relatively small dataset where the theoretical distribution is not known and there is the possibility of missing data, it is Hart Crowser’s normal practice to require a level of significance of greater than 99 percent before conclusions are drawn. Hart Crowser concluded that spill rate is the best variable to use in predicting the volume of further oil spills. An average rate of approximately 52 gallons of oil spilled per million barrels of crude oil produced was calculated based on the trend that started in 1980. This rate is subject to considerable uncertainty in the mean (± 50% at the 95% level of confidence). A spill rate derived from the logarithmic distribution was 66 gallons as opposed to 52 gallons. These two values agree within the standard deviation of the means. The 95 percent logarithmic confidence limits on spills for a given year are ± 465 percent at the 95 percent level of confidence. These values are summarized in Table 19. (Note that values in Table 19 have not been rounded. It should be noted that all of the uncertainty in rate is statistically accurate to less than one significant figure.) Hart Crowser is more inclined to believe the logarithmic values than the untransformed values, because the cumulative frequency of the data is more lognormal than normal (see Figures 47 and 48). These very wide confidence limits and individual yearly values are consistent with the small number of data points available for this prediction. Hart Crowser believes it is unlikely that further accuracy will be achieved by additional analysis.
The volumetric oil spill risk rate does not completely describe the statistical system and, accordingly, Hart Crowser also investigated the oil spill count rate (i.e., the number of oil spills over a particular volume threshold per million barrels of crude oil produced). Oil spill and oil production data from 1978 through 1999 (with 1999 production assumed 450 million Bbl) were used because to correspond to the observed trend in oil spills. A plot of the spill count rate from the database is shown in Figure 49. Figure 49 shows 4 points aligned along the bottom, and consequently, is not very useful for visual analysis. To enhance the variability at the low end of the scale, Hart Crowser constructed a logarithmic plot of the same data. However, because of the zeros in the database, some positive constant had to be added to the spill rate. At first, Hart Crowser used a constant of 0.1 spills per million barrels of crude oil produced and obtained the plot shown in Figure 50. This figure shows only slight variability at the low spill rate. The constant was then adjusted to 0.01 spills per million barrels of crude oil produced and the results obtained are plotted in Figure 51. This shows a clear picture of no spills where there was no production in 1969, but a considerable spill count rate from 1970 to 1976. In 1977, the spill count rate started to drop, and from 1978 through 1990 the spill rate appeared visually
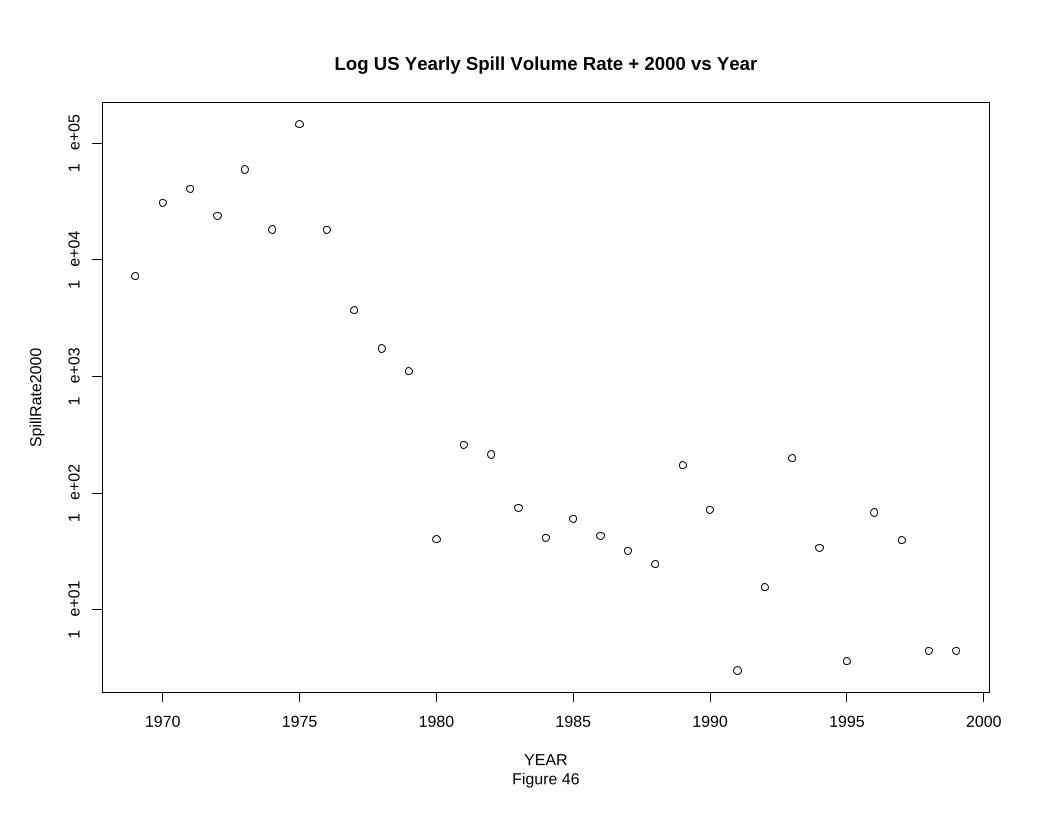
1970 1975 1980 1985 1990 1995 2000
1 e
+01
1 e
+02
1 e
+03
1 e
+04
1 e
+05
Log US Yearly Spill Volume Rate + 2000 vs Year
Figure 46YEAR
Spi
llRat
e200
0
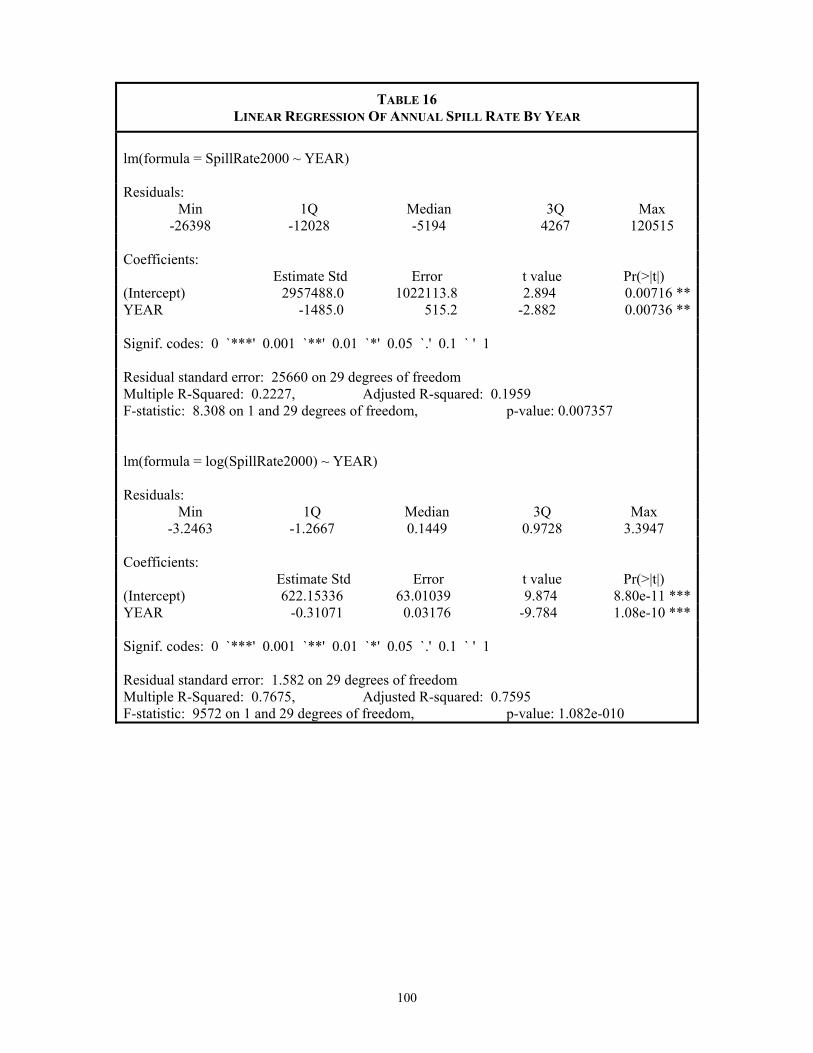
100
TABLE 16 LINEAR REGRESSION OF ANNUAL SPILL RATE BY YEAR
lm(formula = SpillRate2000 ~ YEAR) Residuals:
Min 1Q Median 3Q Max -26398 -12028 -5194 4267 120515
Coefficients: Estimate Std Error t value Pr(>|t|) (Intercept) 2957488.0 1022113.8 2.894 0.00716 **YEAR -1485.0 515.2 -2.882 0.00736 **
Signif. codes: 0 `***' 0.001 `**' 0.01 `*' 0.05 `.' 0.1 ` ' 1
Residual standard error: 25660 on 29 degrees of freedom Multiple R-Squared: 0.2227, Adjusted R-squared: 0.1959 F-statistic: 8.308 on 1 and 29 degrees of freedom, p-value: 0.007357
lm(formula = log(SpillRate2000) ~ YEAR)
Residuals: Min 1Q Median 3Q Max
-3.2463 -1.2667 0.1449 0.9728 3.3947
Coefficients: Estimate Std Error t value Pr(>|t|) (Intercept) 622.15336 63.01039 9.874 8.80e-11 ***YEAR -0.31071 0.03176 -9.784 1.08e-10 ***
Signif. codes: 0 `***' 0.001 `**' 0.01 `*' 0.05 `.' 0.1 ` ' 1
Residual standard error: 1.582 on 29 degrees of freedom Multiple R-Squared: 0.7675, Adjusted R-squared: 0.7595 F-statistic: 9572 on 1 and 29 degrees of freedom, p-value: 1.082e-010
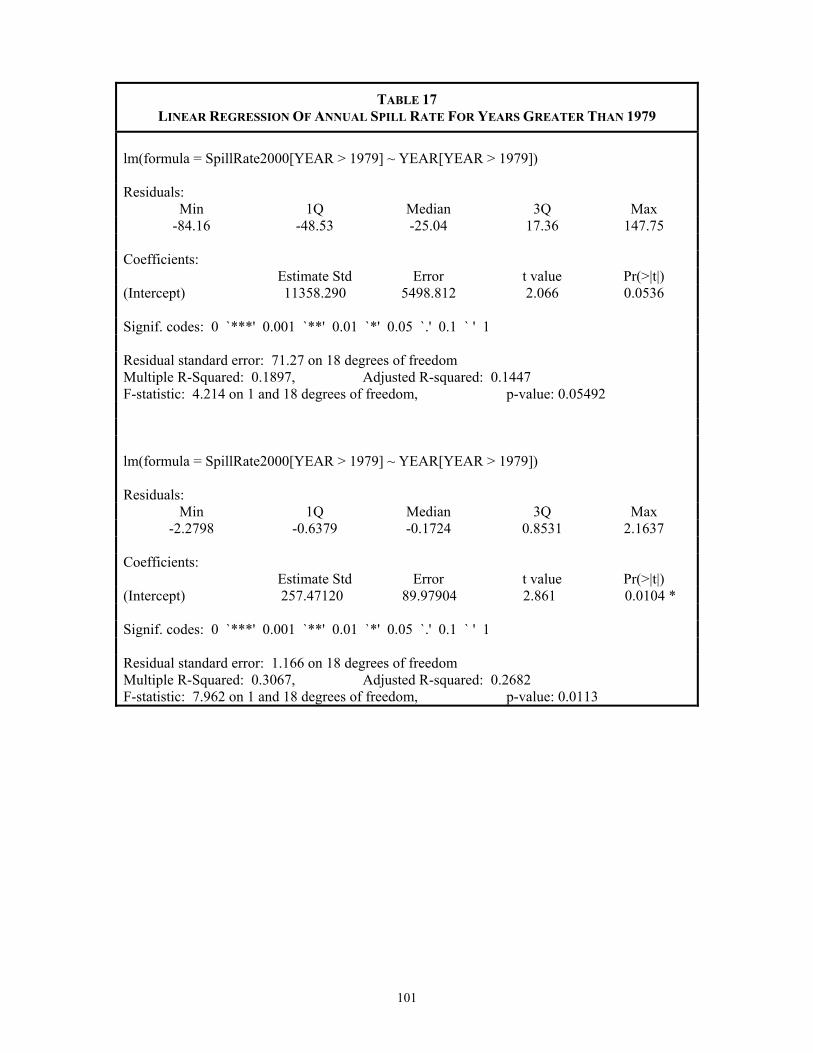
101
TABLE 17 LINEAR REGRESSION OF ANNUAL SPILL RATE FOR YEARS GREATER THAN 1979
lm(formula = SpillRate2000[YEAR > 1979] ~ YEAR[YEAR > 1979]) Residuals:
Min 1Q Median 3Q Max -84.16 -48.53 -25.04 17.36 147.75
Coefficients: Estimate Std Error t value Pr(>|t|) (Intercept) 11358.290 5498.812 2.066 0.0536 Signif. codes: 0 `***' 0.001 `**' 0.01 `*' 0.05 `.' 0.1 ` ' 1
Residual standard error: 71.27 on 18 degrees of freedom Multiple R-Squared: 0.1897, Adjusted R-squared: 0.1447 F-statistic: 4.214 on 1 and 18 degrees of freedom, p-value: 0.05492
lm(formula = SpillRate2000[YEAR > 1979] ~ YEAR[YEAR > 1979])
Residuals:
Min 1Q Median 3Q Max -2.2798 -0.6379 -0.1724 0.8531 2.1637
Coefficients: Estimate Std Error t value Pr(>|t|) (Intercept) 257.47120 89.97904 2.861 0.0104 *
Signif. codes: 0 `***' 0.001 `**' 0.01 `*' 0.05 `.' 0.1 ` ' 1
Residual standard error: 1.166 on 18 degrees of freedom Multiple R-Squared: 0.3067, Adjusted R-squared: 0.2682 F-statistic: 7.962 on 1 and 18 degrees of freedom, p-value: 0.0113
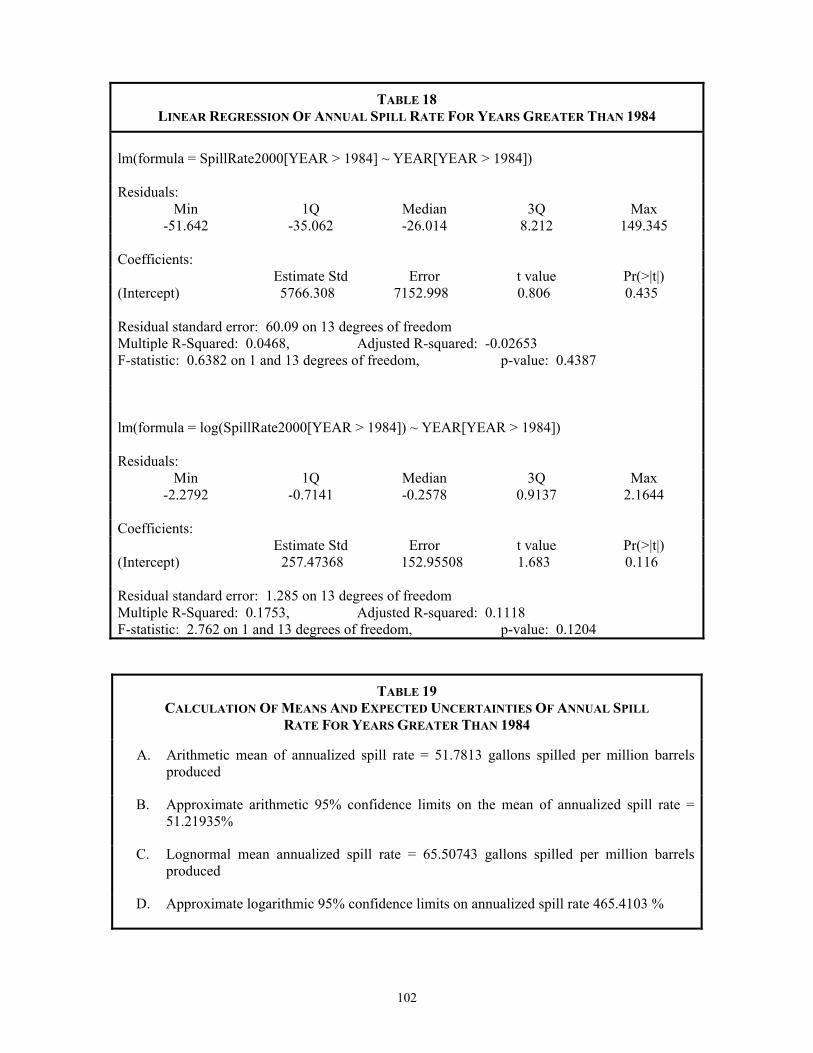
102
TABLE 18 LINEAR REGRESSION OF ANNUAL SPILL RATE FOR YEARS GREATER THAN 1984
lm(formula = SpillRate2000[YEAR > 1984] ~ YEAR[YEAR > 1984]) Residuals:
Min 1Q Median 3Q Max -51.642 -35.062 -26.014 8.212 149.345
Coefficients: Estimate Std Error t value Pr(>|t|) (Intercept) 5766.308 7152.998 0.806 0.435
Residual standard error: 60.09 on 13 degrees of freedom Multiple R-Squared: 0.0468, Adjusted R-squared: -0.02653 F-statistic: 0.6382 on 1 and 13 degrees of freedom, p-value: 0.4387
lm(formula = log(SpillRate2000[YEAR > 1984]) ~ YEAR[YEAR > 1984])
Residuals:
Min 1Q Median 3Q Max -2.2792 -0.7141 -0.2578 0.9137 2.1644
Coefficients: Estimate Std Error t value Pr(>|t|) (Intercept) 257.47368 152.95508 1.683 0.116
Residual standard error: 1.285 on 13 degrees of freedom Multiple R-Squared: 0.1753, Adjusted R-squared: 0.1118 F-statistic: 2.762 on 1 and 13 degrees of freedom, p-value: 0.1204
TABLE 19 CALCULATION OF MEANS AND EXPECTED UNCERTAINTIES OF ANNUAL SPILL
RATE FOR YEARS GREATER THAN 1984
A. Arithmetic mean of annualized spill rate = 51.7813 gallons spilled per million barrels produced
B. Approximate arithmetic 95% confidence limits on the mean of annualized spill rate = 51.21935%
C. Lognormal mean annualized spill rate = 65.50743 gallons spilled per million barrels produced
D. Approximate logarithmic 95% confidence limits on annualized spill rate 465.4103 %
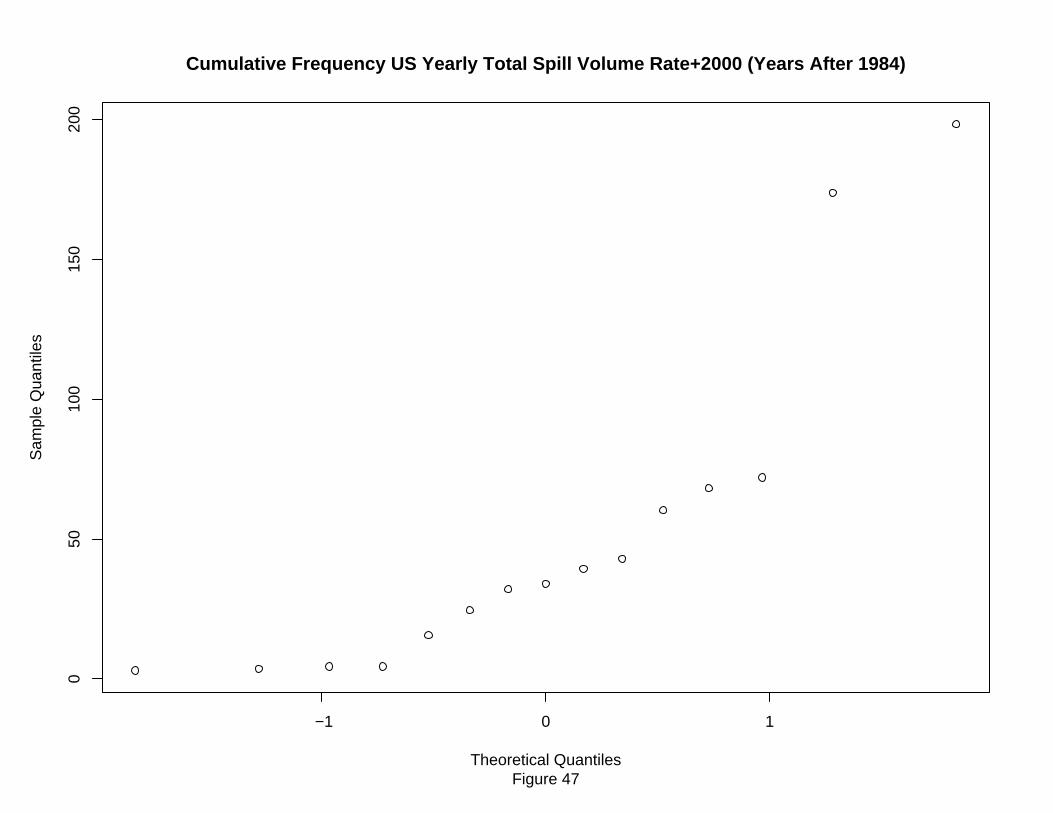
−1 0 1
050
100
150
200
Cumulative Frequency US Yearly Total Spill Volume Rate+2000 (Years After 1984)
Figure 47Theoretical Quantiles
Sam
ple
Qua
ntile
s
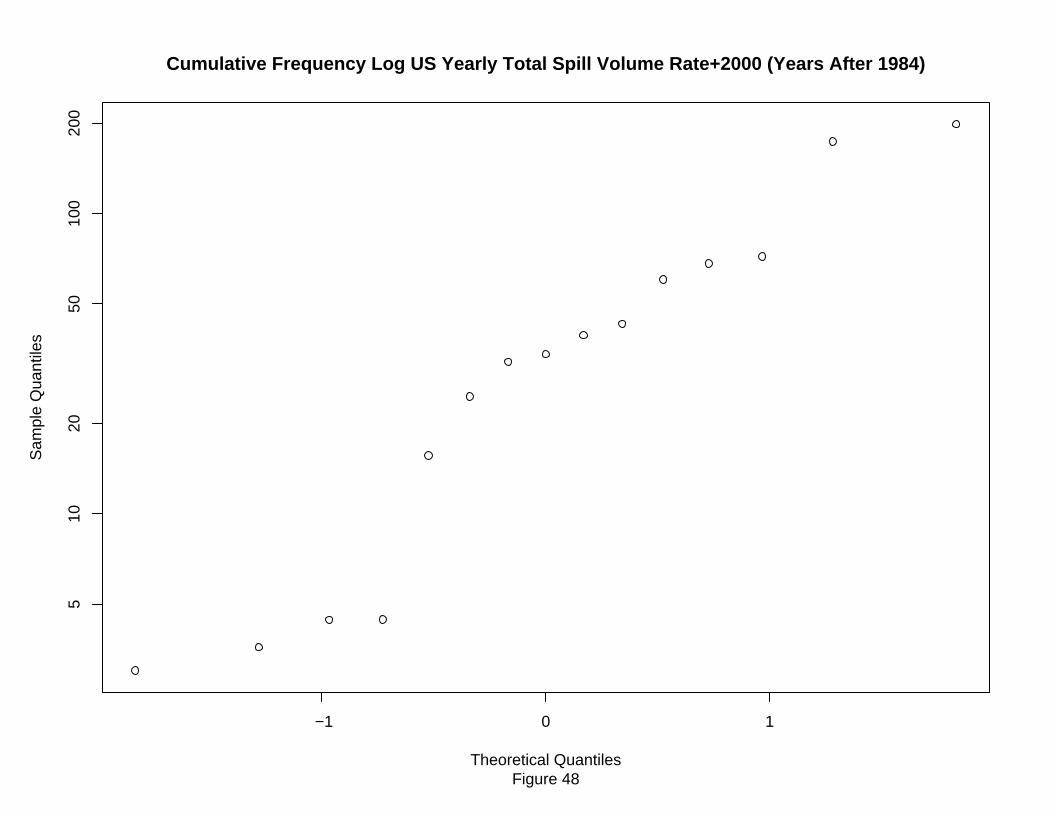
−1 0 1
510
2050
100
200
Cumulative Frequency Log US Yearly Total Spill Volume Rate+2000 (Years After 1984)
Figure 48Theoretical Quantiles
Sam
ple
Qua
ntile
s
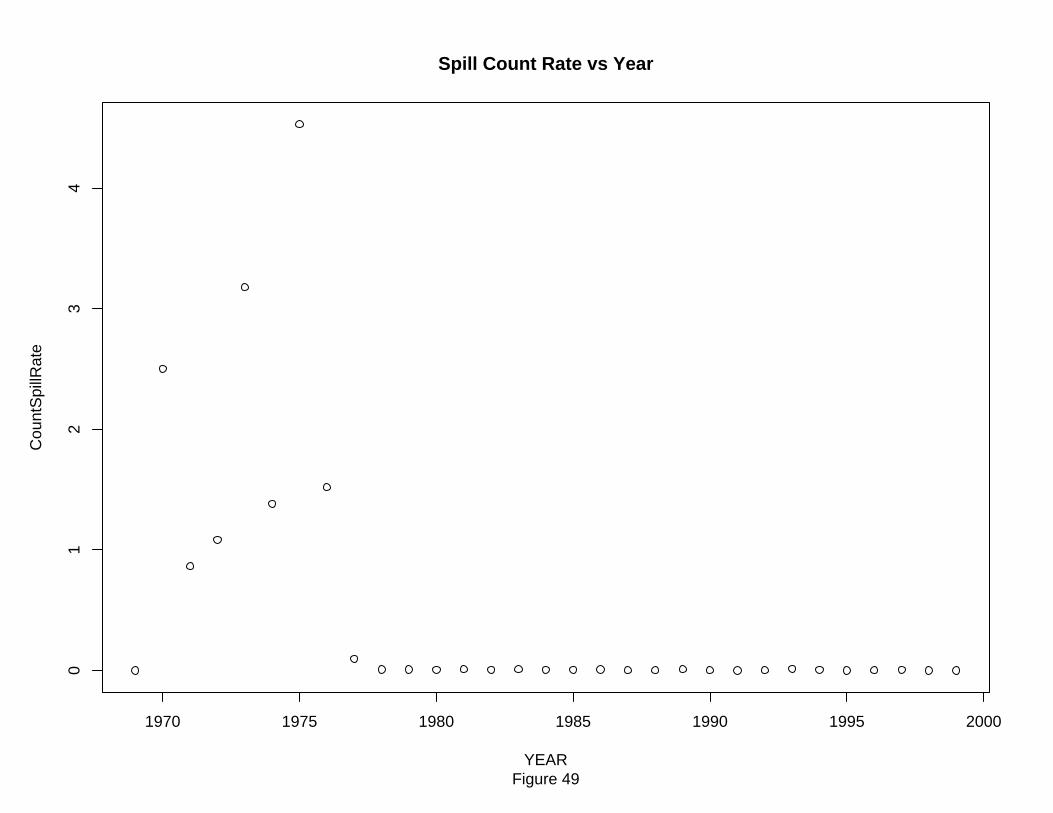
1970 1975 1980 1985 1990 1995 2000
01
23
4Spill Count Rate vs Year
Figure 49YEAR
Cou
ntS
pillR
ate
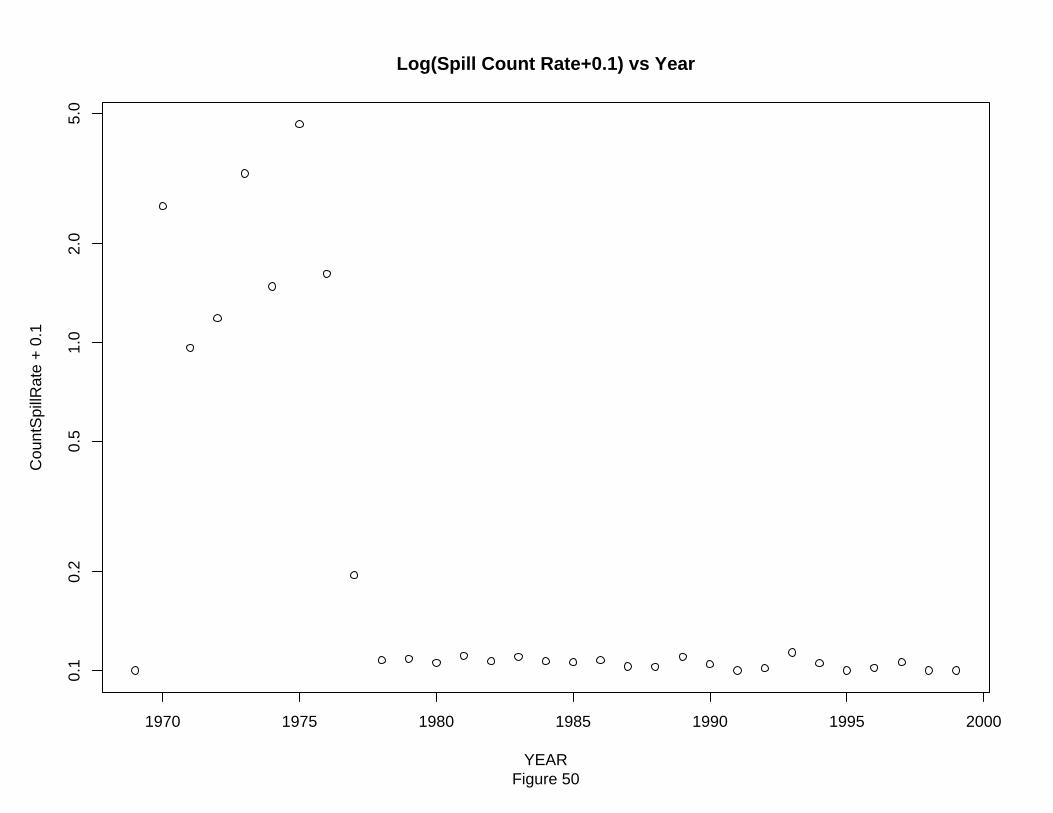
1970 1975 1980 1985 1990 1995 2000
0.1
0.2
0.5
1.0
2.0
5.0
Log(Spill Count Rate+0.1) vs Year
Figure 50YEAR
Cou
ntS
pillR
ate
+ 0
.1
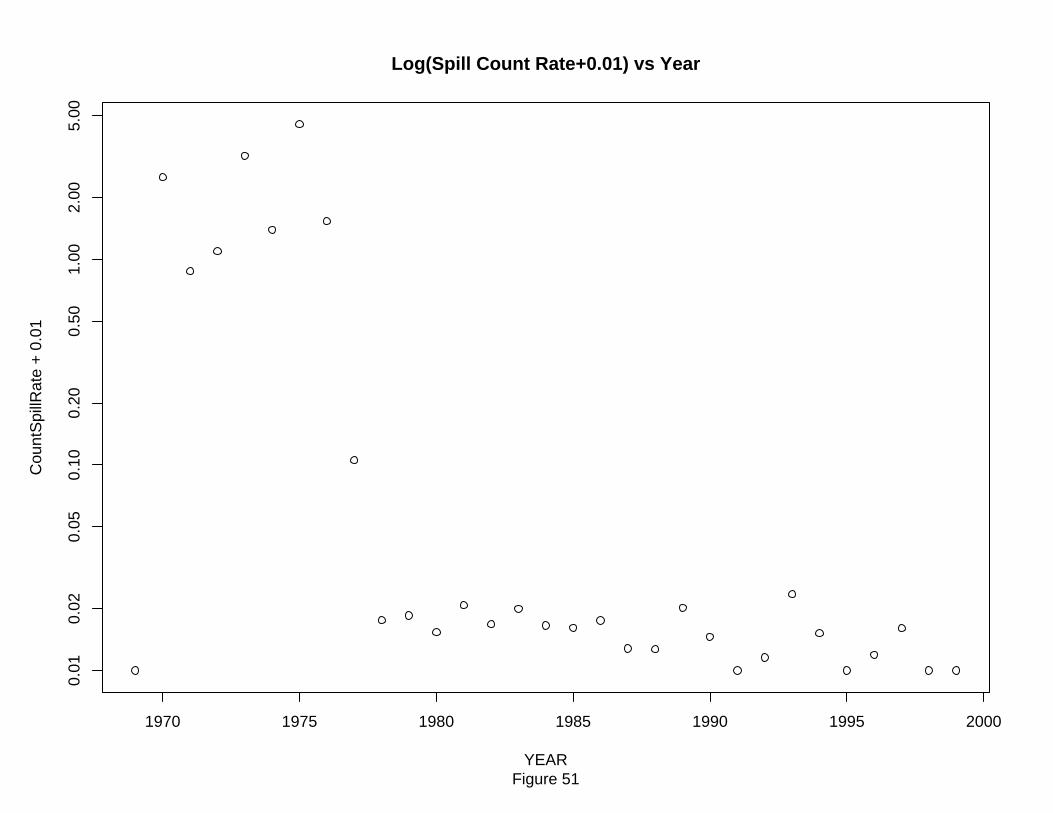
1970 1975 1980 1985 1990 1995 2000
0.01
0.02
0.05
0.10
0.20
0.50
1.00
2.00
5.00
Log(Spill Count Rate+0.01) vs Year
Figure 51YEAR
Cou
ntS
pillR
ate
+ 0
.01
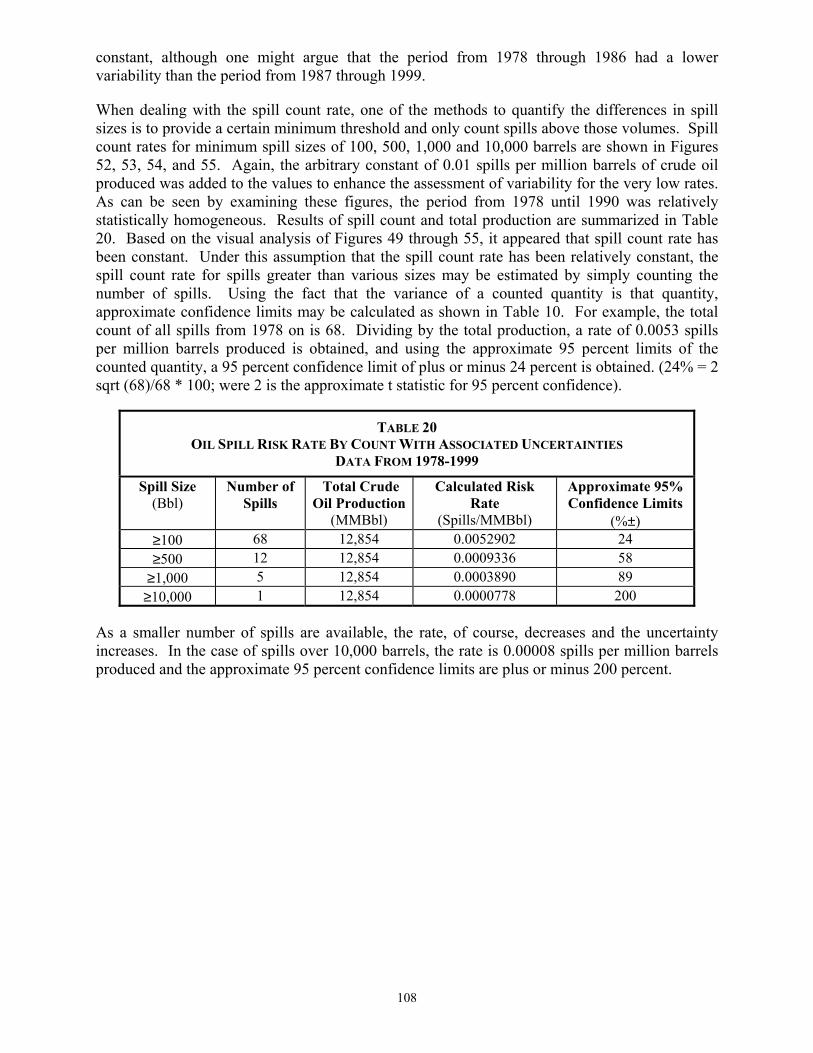
108
constant, although one might argue that the period from 1978 through 1986 had a lower variability than the period from 1987 through 1999.
When dealing with the spill count rate, one of the methods to quantify the differences in spill sizes is to provide a certain minimum threshold and only count spills above those volumes. Spill count rates for minimum spill sizes of 100, 500, 1,000 and 10,000 barrels are shown in Figures 52, 53, 54, and 55. Again, the arbitrary constant of 0.01 spills per million barrels of crude oil produced was added to the values to enhance the assessment of variability for the very low rates. As can be seen by examining these figures, the period from 1978 until 1990 was relatively statistically homogeneous. Results of spill count and total production are summarized in Table 20. Based on the visual analysis of Figures 49 through 55, it appeared that spill count rate has been constant. Under this assumption that the spill count rate has been relatively constant, the spill count rate for spills greater than various sizes may be estimated by simply counting the number of spills. Using the fact that the variance of a counted quantity is that quantity, approximate confidence limits may be calculated as shown in Table 10. For example, the total count of all spills from 1978 on is 68. Dividing by the total production, a rate of 0.0053 spills per million barrels produced is obtained, and using the approximate 95 percent limits of the counted quantity, a 95 percent confidence limit of plus or minus 24 percent is obtained. (24% = 2 sqrt (68)/68 * 100; were 2 is the approximate t statistic for 95 percent confidence).
TABLE 20 OIL SPILL RISK RATE BY COUNT WITH ASSOCIATED UNCERTAINTIES
DATA FROM 1978-1999 Spill Size
(Bbl) Number of
Spills Total Crude
Oil Production(MMBbl)
Calculated Risk Rate
(Spills/MMBbl)
Approximate 95% Confidence Limits
(%±) ≥100 68 12,854 0.0052902 24 ≥500 12 12,854 0.0009336 58
≥1,000 5 12,854 0.0003890 89 ≥10,000 1 12,854 0.0000778 200
As a smaller number of spills are available, the rate, of course, decreases and the uncertainty increases. In the case of spills over 10,000 barrels, the rate is 0.00008 spills per million barrels produced and the approximate 95 percent confidence limits are plus or minus 200 percent.
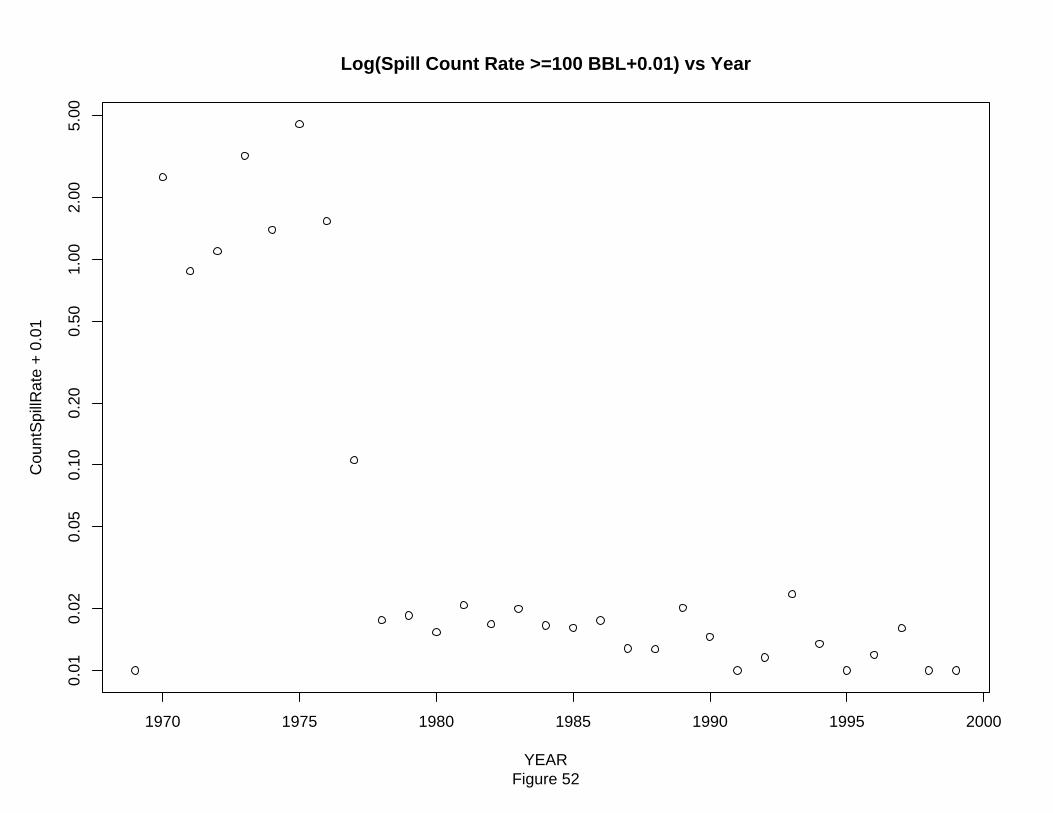
1970 1975 1980 1985 1990 1995 2000
0.01
0.02
0.05
0.10
0.20
0.50
1.00
2.00
5.00
Log(Spill Count Rate >=100 BBL+0.01) vs Year
Figure 52YEAR
Cou
ntS
pillR
ate
+ 0
.01
1970 1975 1980 1985 1990 1995 2000
0.01
0.02
0.05
0.10
0.20
0.50
1.00
2.00
Log(Spill Count Rate >=500 BBL+0.01) vs Year
Figure 53YEAR
Cou
ntS
pillR
ate
+ 0
.01
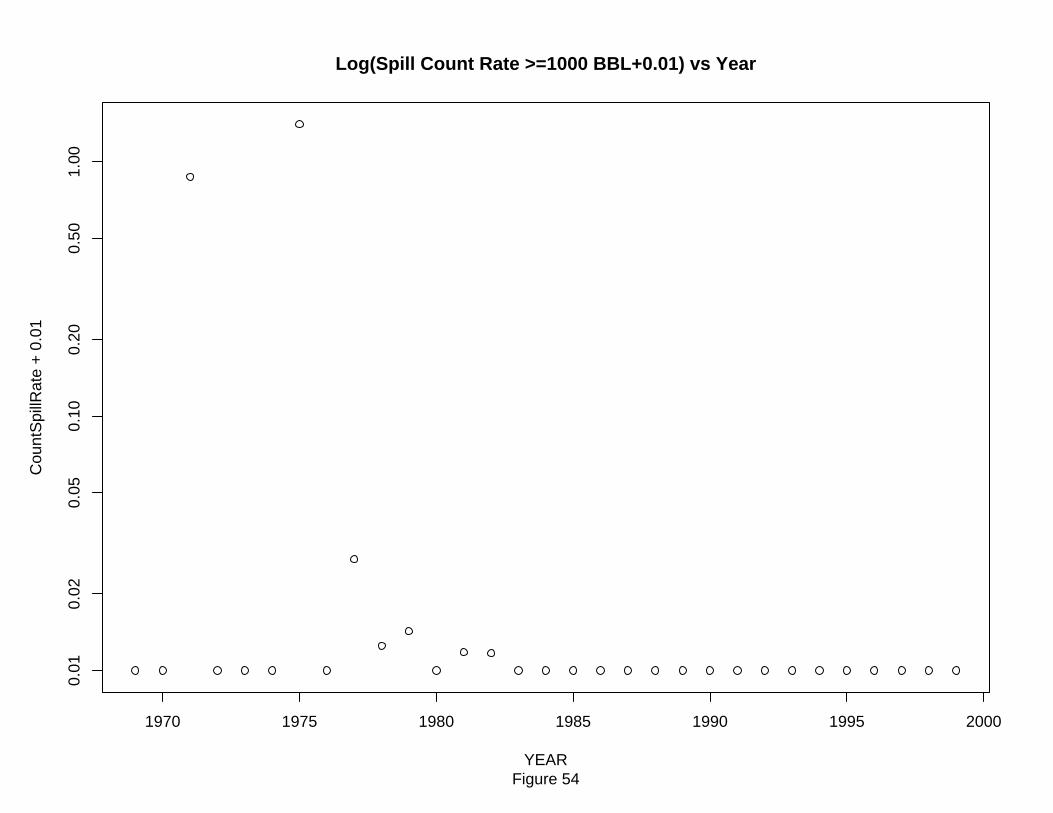
1970 1975 1980 1985 1990 1995 2000
0.01
0.02
0.05
0.10
0.20
0.50
1.00
Log(Spill Count Rate >=1000 BBL+0.01) vs Year
Figure 54YEAR
Cou
ntS
pillR
ate
+ 0
.01
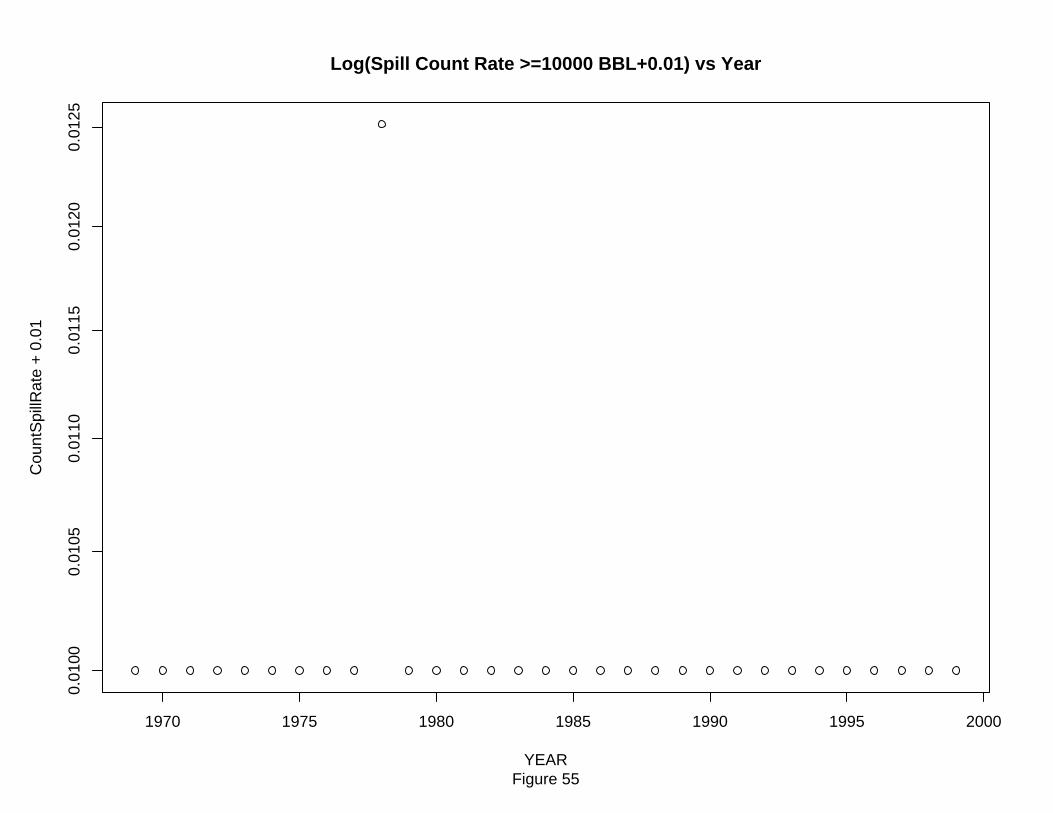
1970 1975 1980 1985 1990 1995 2000
0.01
000.
0105
0.01
100.
0115
0.01
200.
0125
Log(Spill Count Rate >=10000 BBL+0.01) vs Year
Figure 55YEAR
Cou
ntS
pillR
ate
+ 0
.01
113
REFERENCES
Alaska Administrative Code, undated, Superceded Regulations, 1962 to 1999: Assembled by Alaska Court System Law Library, Juneau, Alaska.
Alaska Administrative Code, 1971 - 1999, Title 18, Chapter 75, Oil and Hazardous Substances: State of Alaska, Office of the Lieutenant Governor.
Alaska Department of Environmental Conservation (ADEC) 1997a, Pre-July 1995 Northern Regional Office oil and hazardous substance spill database: Personal communication and electronic transmittal of database from Gail Volt (ADEC) to Caryn Smith (MMS), February 25, 1997.
______, 1997b, Post-July 1995 ADEC oil and hazardous substance spill database: Personal communication and electronic transmittal of database from Camille Stephens (ADEC) to Caryn Smith (MMS), April 23, 1997.
______, 1997c, Oil and hazardous substance spill database from the ADEC Fairbanks office as of April 29, 1997.
______, 1999a, Pre-July 1995 Northern Regional Office oil and hazardous substance spill database: Personal communication and electronic transmittal of database from Camille Stephens (ADEC) to Jeff Mach (HCI), September 22, 1999.
______, 1999b, Post-July 1995 ADEC oil and hazardous substance spill database: Personal communication and electronic transmittal of database from Camille Stephens (ADEC) to Jeff Mach (HCI), September 28, 1999.
Alaska Department of Natural Resources (ADNR), 1999a, Table 3 – Oil Production History updated to August 3, 1999: Personal communication and electronic transmittal of spreadsheet from Richard Beasley (ADNR) to Jeff Mach (HCI), September 15, 1999.
______, 1999b, Historical and Projected Oil and Gas Consumption, May 1999.
Alaska Statutes Title 46 Chapters 03, 04, 08, and 09, Current and superceded laws, 1959 to 1999: Alaska State Legislature, Juneau, Alaska.
Alyeska Pipeline Service Company and Bechtel Corporation, 1976, Federal and State Stipulations Governing the Trans-Alaska Pipeline System, 182 pages.
Alyeska Pipeline Service Company (Alyeska), 1993, Trans-Alaska Pipeline Atlas, Prudhoe Bay to Valdez, June 1993, 74 pages.
______, 1999a, Crude Oil Spill Data from 1977 to 1989, Undated, 1 page.
______, 1999b, North Slope Crude Spills, Pipeline Department From 1989 to May 4, 1999, Spreadsheet, 4 pages.
114
Anderson, C.M. and R.P. LaBelle, 1994, Comparative Occurrence Rates for Offshore Oil Spills, Spill Science and Technology Bulletin 1(2): 131-141.
ARCO Alaska Inc. (ARCO), 1997a, 1977-1985 Kuparuk River Unit Spill Data: Personal communication and electronic transmittal of spreadsheets from Kay La Bau (ARCO) to Caryn Smith (MMS), July 24, 1997.
______, 1997b, 1986-1996 Kuparuk River Unit Spill Data: Personal communication and electronic transmittal of spreadsheets from Kay La Bau (ARCO) to Caryn Smith (MMS), July 24, 1997.
______, 1997c, 1986-1996 Kuparuk Exploration Spill Data: Personal communication and electronic transmittal of spreadsheets from Kay La Bau (ARCO) to Caryn Smith (MMS), July 24, 1997.
______, 1997d, 1977-1996 Prudhoe Spill Data. Personal communication and electronic transmittal of spreadsheets from Kay La Bau (ARCO) to Caryn Smith (MMS), July 24, 1997.
______, 1999, Prudhoe Bay Eastern Operating Area and Kuparuk River Unit Field Gathering Line Mileage Data. Personal communication and electronic transmittal of spreadsheets from Mark Major (ARCO) to Jeff Mach (HCI), December 12, 1999.
BP Exploration (Alaska) (BP), 1997, Crude oil spill history: Personal communication and electronic transmittal of spreadsheet from Tess Dey (BP) to Karen Smith (MMS), July 22, 1997.
Braul, W, 1994, Module 2 - Overview of Federal Legislation and Policies: In http://www.vcn.bc.ca/wcel/otherpub/7021/7021_m2.html.
Cutter Information Corporation, 1989, Oil Spills: International Summary and Review 1978-1981: Cutter Information Corp., Arlington, MA., 133 pages.
Cutter Information Corporation, 1989, Oil Spills: International Summary and Review 1982-1985: Cutter Information Corp., Arlington, MA., 132 pages.
Directorate of Oil and Gas, Department of Indian Affairs and Northern Development, 1993, Northern Oil and Gas Annual Report 1992: Directorate of Oil and Gas, Department of Indian Affairs and Northern Development, Ottawa, Ontario, Canada, 40 pages.
________, 1994, Northern Oil and Gas Annual Report 1993: Directorate of Oil and Gas, Department of Indian Affairs and Northern Development, Ottawa, Ontario, Canada, 37 pages.
________, 1995, Northern Oil and Gas Annual Report 1994: Directorate of Oil and Gas, Department of Indian Affairs and Northern Development, Ottawa, Ontario, Canada, 31 pages.
________, 1996, Northern Oil and Gas Annual Report 1995: Directorate of Oil and Gas, Department of Indian Affairs and Northern Development, Ottawa, Ontario, Canada, 20 pages.
________, 1997, Northern Oil and Gas Annual Report 1996: Directorate of Oil and Gas, Department of Indian Affairs and Northern Development, Ottawa, Ontario, Canada, 22 pages.
115
________, 1998, Northern Oil and Gas Annual Report 1997: Directorate of Oil and Gas, Department of Indian Affairs and Northern Development, Ottawa, Ontario, Canada, 22 pages.
________, 1999, Northern Oil and Gas Annual Report 1998: Directorate of Oil and Gas, Department of Indian Affairs and Northern Development, Ottawa, Ontario, Canada, 24 pages.
Department of Justice Canada, 1999, Personal communication with Diana Haukman.
Environment Canada, 1987, Summary of Spill Events in Canada, 1974 – 1983: Environment Canada Publication EPS 5/SP/1, 52 pages.
________, 1996, Chapter 1 - CEPA Part VI and Ocean Dumping Regulations: In Environment Canada Compliance and Enforcement Report - Volume 1, http://www.ec.gc.ca/enforce/english/chapter1.htm.
_______, 1998. Summary of Spill Events in Canada, 1984 – 1995: Environment Canada Publication EPS 5/SP/3, 81 pages.
Federal Register, March 11, 1985, Environmental Protection Agency; Water Programs; Discharge of Oil; Proposed Rule: Volume 50, Page 9776 (50 FR 9776).
Government of the Northwest Territories, 1999, Personal communication with Harvey Gaukel, Hazardous Substance Specialist, Environmental Protection Service, Resources, Wildlife and Economic Development Department.
Gyrc, George, 1985, The National Petroleum Reserve in Alaska – Earth-Science Considerations: U.S. Geologic Survey Professional Paper 1240-C, 98 pages.
Hanley, Peter T., J.E. Hemming, and J.W. Morsell, 1981, Natural Resource Protection and Petroleum Development in Alaska: U.S. Department of the Interior, Fish and Wildlife Service Biological Services Program Publication FWS/OBS-80/22, August 1981, 323 pages.
Klotz, J., 1972, Are Ocean Polluters Subject to Universal Jurisdiction - Canada Breaks the Ice: In The International Lawyer, 6(4):706-18.
National Energy Board Canada, 1999a, Production data for Norman Wells, Bent Horn, and Amuligak oil fields: Personal Communication and electronic transmittal of spreadsheet from Terry Baker (NEB) to Jeff Mach (HCI), September 17, 1999.
_______, 1999b, Personal communication with Andrew Graw, Senior Environmental Officer.
Unattributed, 1981. Summary of Spills Over 100 Gallons: A Listing of Alaskan North Slope and TAPS Oil Spills from 1970 to 1981, designated as Attachment 2, 11 pages.
U.S. Department of the Interior Bureau of Land Management (BLM), 1982a, Year End Report on Alyeska Reported Spills: Memorandum from Ken Hunt, Environmental Protection Specialist, to Arlan Kohl, Project Manager TAPS, January 19, 1982, 13 pages.
______, 1982b, Spill Reports: Memorandum from EPS to PM-T, December 6, 1982, 13 pages.
116
______, 1983, Spill Reports: Memorandum from EPS to Chief, Branch of Pipeline Monitoring, 15 pages.
US Department of the Interior and Alaska Department of Natural Resources Joint Pipeline Office (JPO), 1997, Oil and hazardous substance spill database: Personal communication and electronic transmittal of database from Greg Doggett (JPO) to Caryn Smith (MMS), March 12, 1997.
______, 1999, Alaska North Slope Oil Pipeline Mileage Data: Personal communication from Tony Braden (JPO) to Jeff Mach (HCI), September 24, 1999.
______, 2000, Alaska North Slope Oil Pipeline Data: Personal communication from Tony Braden (JPO) to Jeff Mach (HCI), March 2, 2000.
US Department of the Interior, Minerals Management Service (MMS), 1999, Summary of Alaskan and Canadian oil spills of 100 barrels and greater as reported in the Oil Spill Intelligence Report: Personal communication and electronic transmittal of database from Richard Prentki (MMS) to Jeff Mach (HCI), December 6, 1999.
______, 2000, Alaska Beaufort Sea Oil Spill Data, Personal communication from Richard Prentki (MMS) to Jeff Mach (HCI), January 31, 2000.
University of British Columbia Law Library, 1999, Organization and History of Canadian Statutes and Regulations, Personal communication with reference librarian.
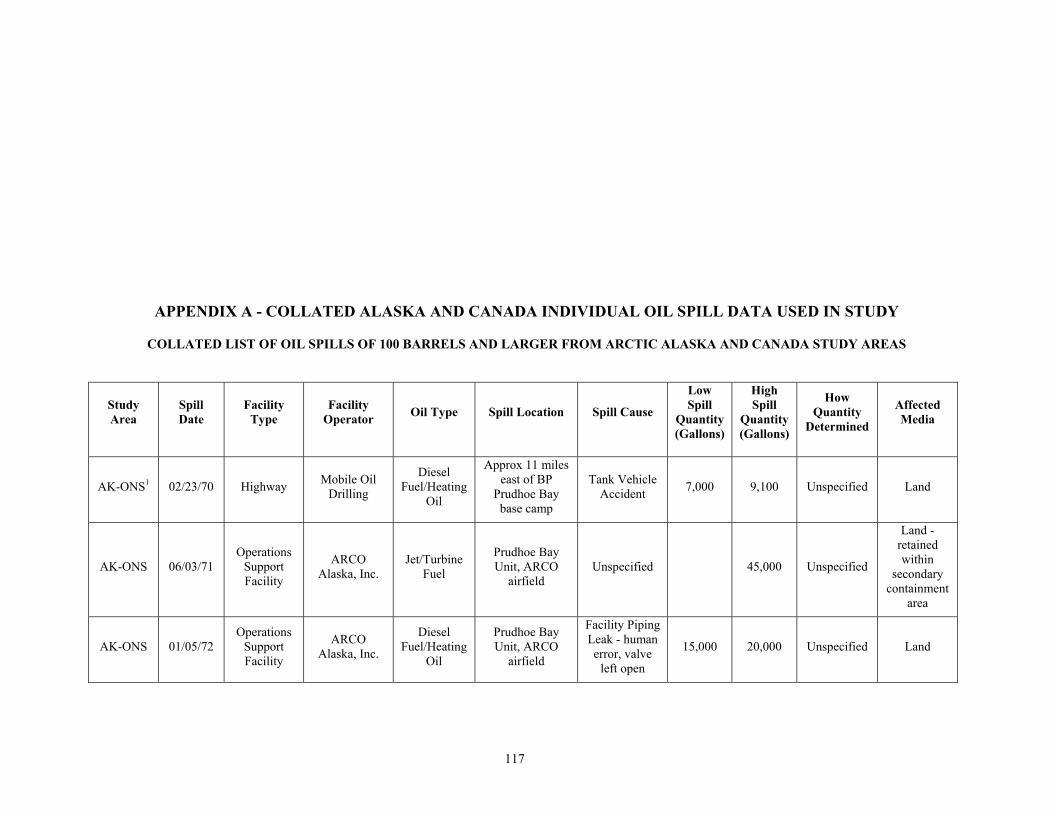
117
APPENDIX A - COLLATED ALASKA AND CANADA INDIVIDUAL OIL SPILL DATA USED IN STUDY
COLLATED LIST OF OIL SPILLS OF 100 BARRELS AND LARGER FROM ARCTIC ALASKA AND CANADA STUDY AREAS
Study Area
Spill Date
Facility Type
Facility Operator Oil Type Spill Location Spill Cause
Low Spill
Quantity (Gallons)
High Spill
Quantity (Gallons)
How Quantity
Determined
Affected Media
AK-ONS1 02/23/70 Highway Mobile Oil Drilling
Diesel Fuel/Heating
Oil
Approx 11 miles east of BP
Prudhoe Bay base camp
Tank Vehicle Accident 7,000 9,100 Unspecified Land
AK-ONS 06/03/71 Operations
Support Facility
ARCO Alaska, Inc.
Jet/Turbine Fuel
Prudhoe Bay Unit, ARCO
airfield Unspecified 45,000 Unspecified
Land - retained within
secondary containment
area
AK-ONS 01/05/72 Operations
Support Facility
ARCO Alaska, Inc.
Diesel Fuel/Heating
Oil
Prudhoe Bay Unit, ARCO
airfield
Facility Piping Leak - human error, valve
left open
15,000 20,000 Unspecified Land
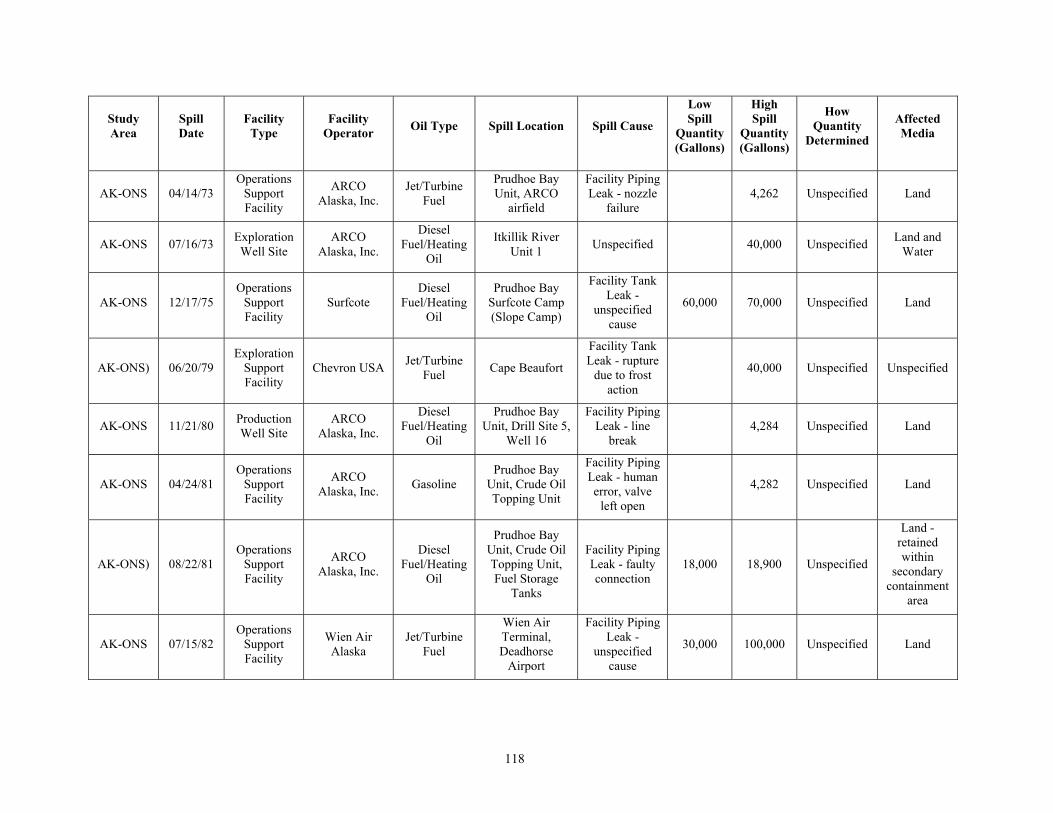
118
Study Area
Spill Date
Facility Type
Facility Operator Oil Type Spill Location Spill Cause
Low Spill
Quantity (Gallons)
High Spill
Quantity (Gallons)
How Quantity
Determined
Affected Media
AK-ONS 04/14/73 Operations
Support Facility
ARCO Alaska, Inc.
Jet/Turbine Fuel
Prudhoe Bay Unit, ARCO
airfield
Facility Piping Leak - nozzle
failure 4,262 Unspecified Land
AK-ONS 07/16/73 Exploration Well Site
ARCO Alaska, Inc.
Diesel Fuel/Heating
Oil
Itkillik River Unit 1 Unspecified 40,000 Unspecified Land and
Water
AK-ONS 12/17/75 Operations
Support Facility
Surfcote Diesel
Fuel/Heating Oil
Prudhoe Bay Surfcote Camp (Slope Camp)
Facility Tank Leak -
unspecified cause
60,000 70,000 Unspecified Land
AK-ONS) 06/20/79 Exploration
Support Facility
Chevron USA Jet/Turbine Fuel Cape Beaufort
Facility Tank Leak - rupture
due to frost action
40,000 Unspecified Unspecified
AK-ONS 11/21/80 Production Well Site
ARCO Alaska, Inc.
Diesel Fuel/Heating
Oil
Prudhoe Bay Unit, Drill Site 5,
Well 16
Facility Piping Leak - line
break 4,284 Unspecified Land
AK-ONS 04/24/81 Operations
Support Facility
ARCO Alaska, Inc. Gasoline
Prudhoe Bay Unit, Crude Oil Topping Unit
Facility Piping Leak - human error, valve
left open
4,282 Unspecified Land
AK-ONS) 08/22/81 Operations
Support Facility
ARCO Alaska, Inc.
Diesel Fuel/Heating
Oil
Prudhoe Bay Unit, Crude Oil Topping Unit, Fuel Storage
Tanks
Facility Piping Leak - faulty connection
18,000 18,900 Unspecified
Land - retained within
secondary containment
area
AK-ONS 07/15/82 Operations
Support Facility
Wien Air Alaska
Jet/Turbine Fuel
Wien Air Terminal, Deadhorse
Airport
Facility Piping Leak -
unspecified cause
30,000 100,000 Unspecified Land
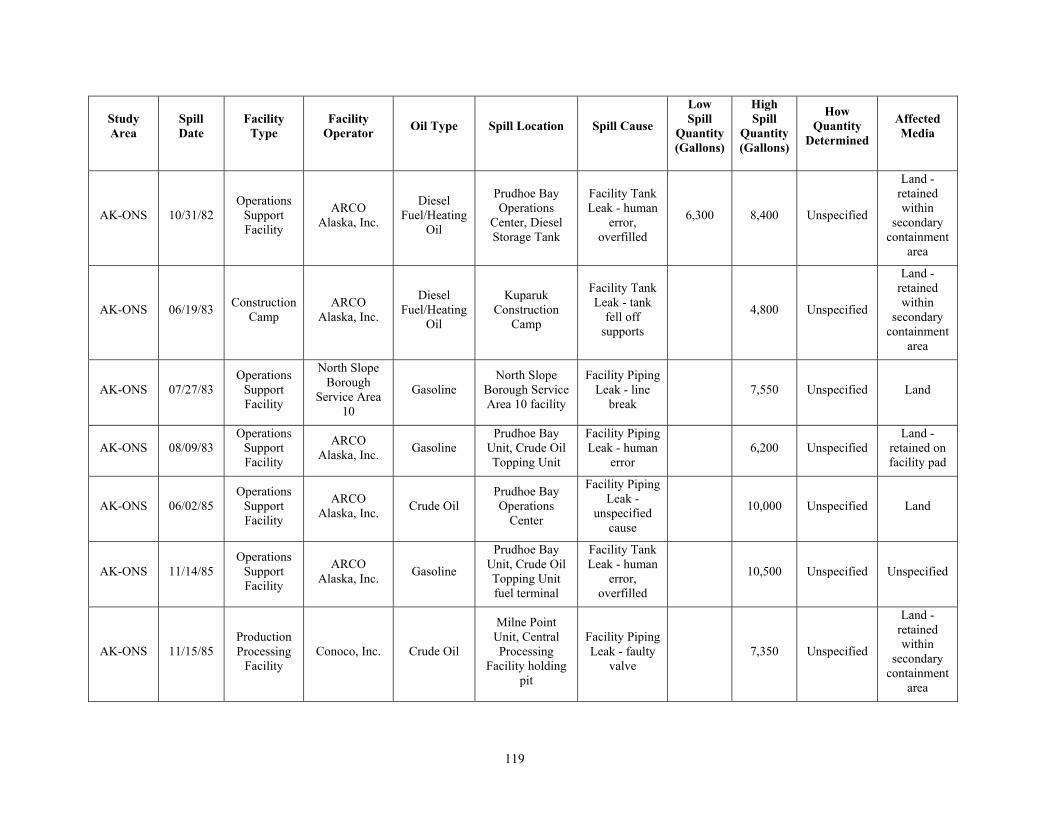
119
Study Area
Spill Date
Facility Type
Facility Operator Oil Type Spill Location Spill Cause
Low Spill
Quantity (Gallons)
High Spill
Quantity (Gallons)
How Quantity
Determined
Affected Media
AK-ONS 10/31/82 Operations
Support Facility
ARCO Alaska, Inc.
Diesel Fuel/Heating
Oil
Prudhoe Bay Operations
Center, Diesel Storage Tank
Facility Tank Leak - human
error, overfilled
6,300 8,400 Unspecified
Land - retained within
secondary containment
area
AK-ONS 06/19/83 Construction Camp
ARCO Alaska, Inc.
Diesel Fuel/Heating
Oil
Kuparuk Construction
Camp
Facility Tank Leak - tank
fell off supports
4,800 Unspecified
Land - retained within
secondary containment
area
AK-ONS 07/27/83 Operations
Support Facility
North Slope Borough
Service Area 10
Gasoline North Slope
Borough Service Area 10 facility
Facility Piping Leak - line
break 7,550 Unspecified Land
AK-ONS 08/09/83 Operations
Support Facility
ARCO Alaska, Inc. Gasoline
Prudhoe Bay Unit, Crude Oil Topping Unit
Facility Piping Leak - human
error 6,200 Unspecified
Land - retained on facility pad
AK-ONS 06/02/85 Operations
Support Facility
ARCO Alaska, Inc. Crude Oil
Prudhoe Bay Operations
Center
Facility Piping Leak -
unspecified cause
10,000 Unspecified Land
AK-ONS 11/14/85 Operations
Support Facility
ARCO Alaska, Inc. Gasoline
Prudhoe Bay Unit, Crude Oil Topping Unit fuel terminal
Facility Tank Leak - human
error, overfilled
10,500 Unspecified Unspecified
AK-ONS 11/15/85 Production Processing
Facility Conoco, Inc. Crude Oil
Milne Point Unit, Central Processing
Facility holding pit
Facility Piping Leak - faulty
valve 7,350 Unspecified
Land - retained within
secondary containment
area
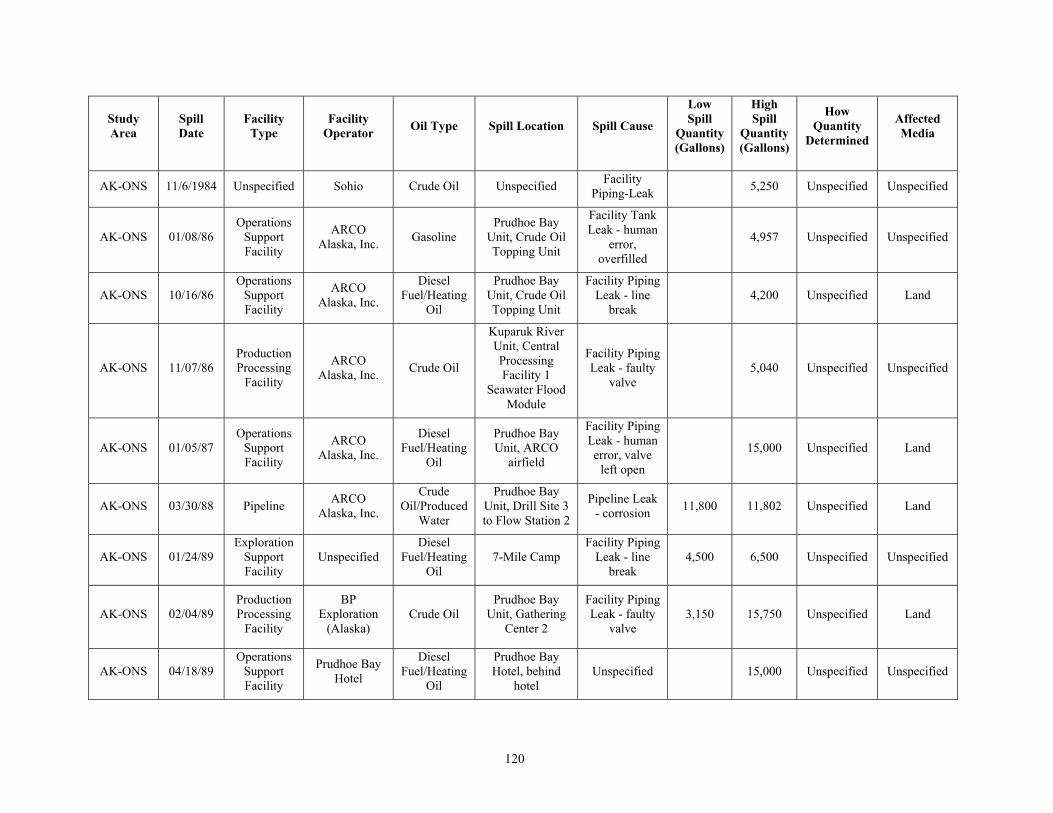
120
Study Area
Spill Date
Facility Type
Facility Operator Oil Type Spill Location Spill Cause
Low Spill
Quantity (Gallons)
High Spill
Quantity (Gallons)
How Quantity
Determined
Affected Media
AK-ONS 11/6/1984 Unspecified Sohio Crude Oil Unspecified Facility Piping-Leak 5,250 Unspecified Unspecified
AK-ONS 01/08/86 Operations
Support Facility
ARCO Alaska, Inc. Gasoline
Prudhoe Bay Unit, Crude Oil Topping Unit
Facility Tank Leak - human
error, overfilled
4,957 Unspecified Unspecified
AK-ONS 10/16/86 Operations
Support Facility
ARCO Alaska, Inc.
Diesel Fuel/Heating
Oil
Prudhoe Bay Unit, Crude Oil Topping Unit
Facility Piping Leak - line
break 4,200 Unspecified Land
AK-ONS 11/07/86 Production Processing
Facility
ARCO Alaska, Inc. Crude Oil
Kuparuk River Unit, Central Processing Facility 1
Seawater Flood Module
Facility Piping Leak - faulty
valve 5,040 Unspecified Unspecified
AK-ONS 01/05/87 Operations
Support Facility
ARCO Alaska, Inc.
Diesel Fuel/Heating
Oil
Prudhoe Bay Unit, ARCO
airfield
Facility Piping Leak - human error, valve
left open
15,000 Unspecified Land
AK-ONS 03/30/88 Pipeline ARCO Alaska, Inc.
Crude Oil/Produced
Water
Prudhoe Bay Unit, Drill Site 3 to Flow Station 2
Pipeline Leak - corrosion 11,800 11,802 Unspecified Land
AK-ONS 01/24/89 Exploration
Support Facility
Unspecified Diesel
Fuel/Heating Oil
7-Mile Camp Facility Piping
Leak - line break
4,500 6,500 Unspecified Unspecified
AK-ONS 02/04/89 Production Processing
Facility
BP Exploration
(Alaska) Crude Oil
Prudhoe Bay Unit, Gathering
Center 2
Facility Piping Leak - faulty
valve 3,150 15,750 Unspecified Land
AK-ONS 04/18/89 Operations
Support Facility
Prudhoe Bay Hotel
Diesel Fuel/Heating
Oil
Prudhoe Bay Hotel, behind
hotel Unspecified 15,000 Unspecified Unspecified
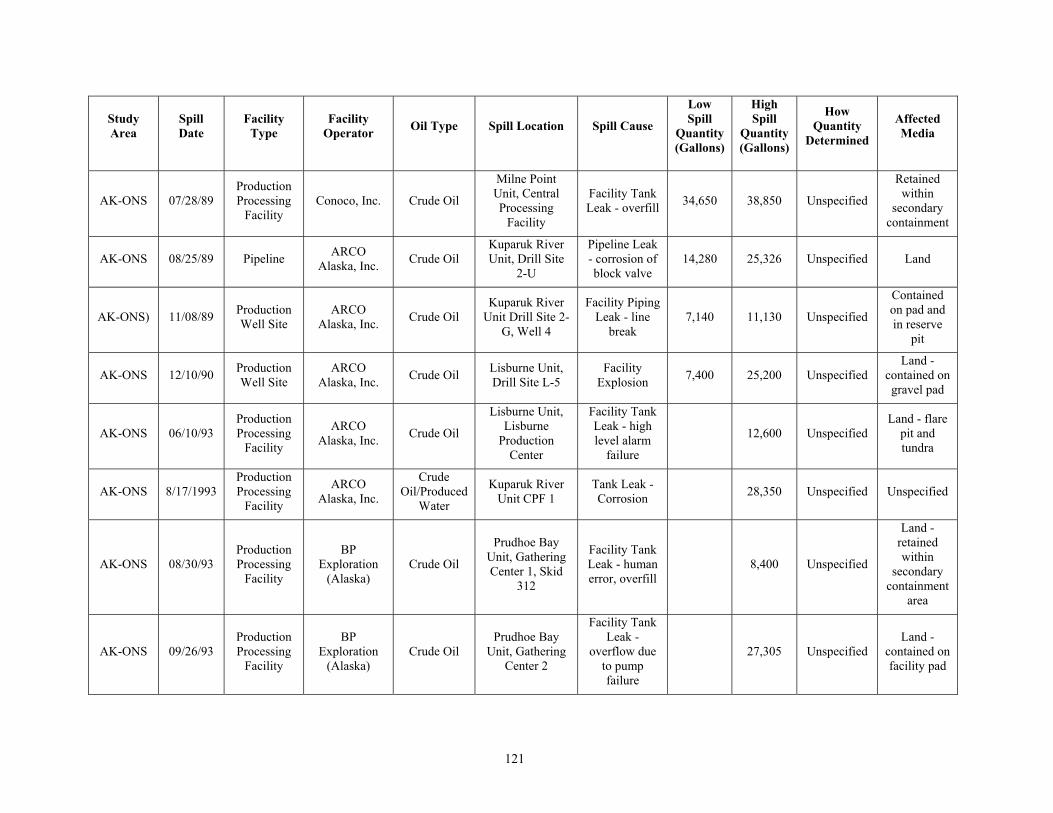
121
Study Area
Spill Date
Facility Type
Facility Operator Oil Type Spill Location Spill Cause
Low Spill
Quantity (Gallons)
High Spill
Quantity (Gallons)
How Quantity
Determined
Affected Media
AK-ONS 07/28/89 Production Processing
Facility Conoco, Inc. Crude Oil
Milne Point Unit, Central Processing
Facility
Facility Tank Leak - overfill 34,650 38,850 Unspecified
Retained within
secondary containment
AK-ONS 08/25/89 Pipeline ARCO Alaska, Inc. Crude Oil
Kuparuk River Unit, Drill Site
2-U
Pipeline Leak - corrosion of block valve
14,280 25,326 Unspecified Land
AK-ONS) 11/08/89 Production Well Site
ARCO Alaska, Inc. Crude Oil
Kuparuk River Unit Drill Site 2-
G, Well 4
Facility Piping Leak - line
break 7,140 11,130 Unspecified
Contained on pad and in reserve
pit
AK-ONS 12/10/90 Production Well Site
ARCO Alaska, Inc. Crude Oil Lisburne Unit,
Drill Site L-5 Facility
Explosion 7,400 25,200 Unspecified Land -
contained on gravel pad
AK-ONS 06/10/93 Production Processing
Facility
ARCO Alaska, Inc. Crude Oil
Lisburne Unit, Lisburne
Production Center
Facility Tank Leak - high level alarm
failure
12,600 Unspecified Land - flare
pit and tundra
AK-ONS 8/17/1993 Production Processing
Facility
ARCO Alaska, Inc.
Crude Oil/Produced
Water
Kuparuk River Unit CPF 1
Tank Leak - Corrosion 28,350 Unspecified Unspecified
AK-ONS 08/30/93 Production Processing
Facility
BP Exploration
(Alaska) Crude Oil
Prudhoe Bay Unit, Gathering Center 1, Skid
312
Facility Tank Leak - human error, overfill
8,400 Unspecified
Land - retained within
secondary containment
area
AK-ONS 09/26/93 Production Processing
Facility
BP Exploration
(Alaska) Crude Oil
Prudhoe Bay Unit, Gathering
Center 2
Facility Tank Leak -
overflow due to pump failure
27,305 Unspecified Land -
contained on facility pad
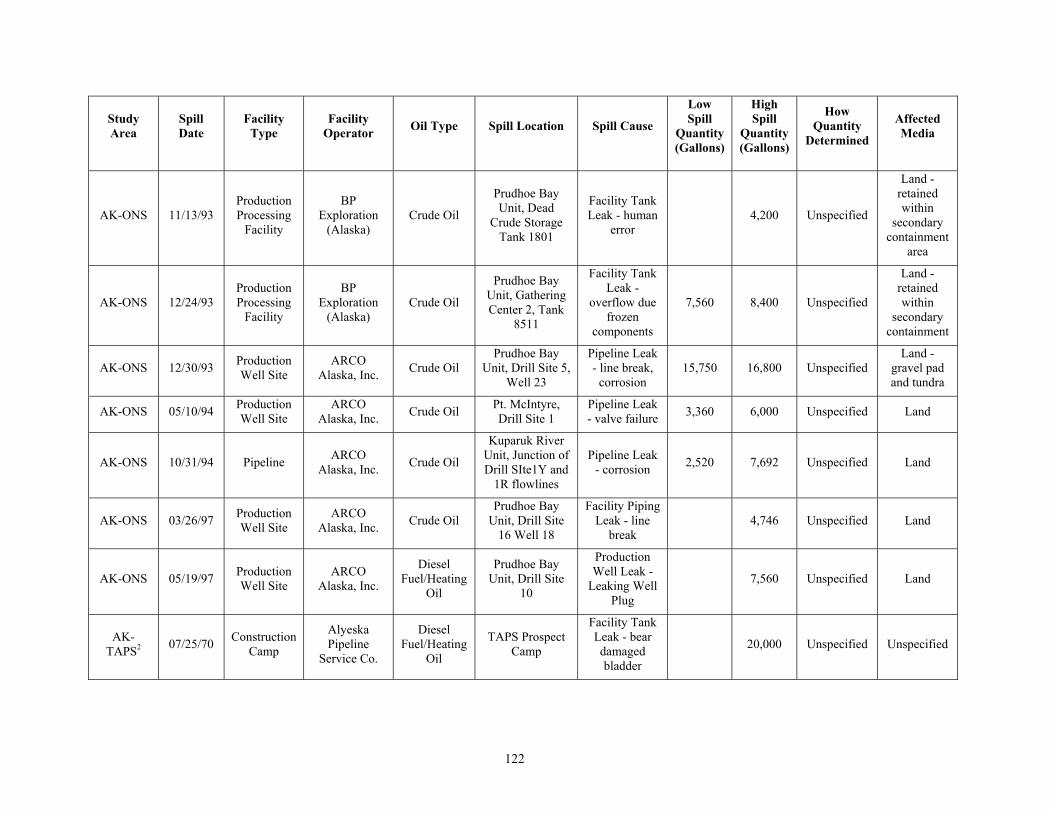
122
Study Area
Spill Date
Facility Type
Facility Operator Oil Type Spill Location Spill Cause
Low Spill
Quantity (Gallons)
High Spill
Quantity (Gallons)
How Quantity
Determined
Affected Media
AK-ONS 11/13/93 Production Processing
Facility
BP Exploration
(Alaska) Crude Oil
Prudhoe Bay Unit, Dead
Crude Storage Tank 1801
Facility Tank Leak - human
error 4,200 Unspecified
Land - retained within
secondary containment
area
AK-ONS 12/24/93 Production Processing
Facility
BP Exploration
(Alaska) Crude Oil
Prudhoe Bay Unit, Gathering Center 2, Tank
8511
Facility Tank Leak -
overflow due frozen
components
7,560 8,400 Unspecified
Land - retained within
secondary containment
AK-ONS 12/30/93 Production Well Site
ARCO Alaska, Inc. Crude Oil
Prudhoe Bay Unit, Drill Site 5,
Well 23
Pipeline Leak - line break,
corrosion 15,750 16,800 Unspecified
Land - gravel pad and tundra
AK-ONS 05/10/94 Production Well Site
ARCO Alaska, Inc. Crude Oil Pt. McIntyre,
Drill Site 1 Pipeline Leak - valve failure 3,360 6,000 Unspecified Land
AK-ONS 10/31/94 Pipeline ARCO Alaska, Inc. Crude Oil
Kuparuk River Unit, Junction of Drill SIte1Y and
1R flowlines
Pipeline Leak - corrosion 2,520 7,692 Unspecified Land
AK-ONS 03/26/97 Production Well Site
ARCO Alaska, Inc. Crude Oil
Prudhoe Bay Unit, Drill Site
16 Well 18
Facility Piping Leak - line
break 4,746 Unspecified Land
AK-ONS 05/19/97 Production Well Site
ARCO Alaska, Inc.
Diesel Fuel/Heating
Oil
Prudhoe Bay Unit, Drill Site
10
Production Well Leak -
Leaking Well Plug
7,560 Unspecified Land
AK-TAPS2 07/25/70 Construction
Camp
Alyeska Pipeline
Service Co.
Diesel Fuel/Heating
Oil
TAPS Prospect Camp
Facility Tank Leak - bear damaged bladder
20,000 Unspecified Unspecified
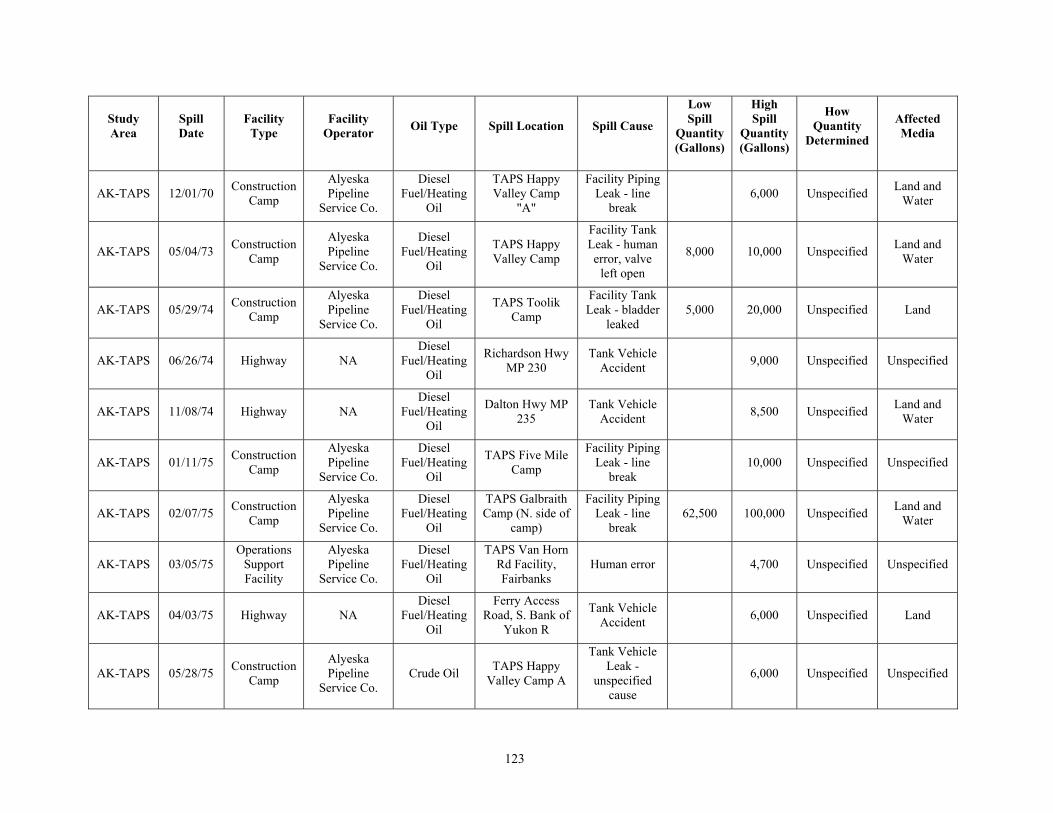
123
Study Area
Spill Date
Facility Type
Facility Operator Oil Type Spill Location Spill Cause
Low Spill
Quantity (Gallons)
High Spill
Quantity (Gallons)
How Quantity
Determined
Affected Media
AK-TAPS 12/01/70 Construction Camp
Alyeska Pipeline
Service Co.
Diesel Fuel/Heating
Oil
TAPS Happy Valley Camp
"A"
Facility Piping Leak - line
break 6,000 Unspecified Land and
Water
AK-TAPS 05/04/73 Construction Camp
Alyeska Pipeline
Service Co.
Diesel Fuel/Heating
Oil
TAPS Happy Valley Camp
Facility Tank Leak - human error, valve
left open
8,000 10,000 Unspecified Land and Water
AK-TAPS 05/29/74 Construction Camp
Alyeska Pipeline
Service Co.
Diesel Fuel/Heating
Oil
TAPS Toolik Camp
Facility Tank Leak - bladder
leaked 5,000 20,000 Unspecified Land
AK-TAPS 06/26/74 Highway NA Diesel
Fuel/Heating Oil
Richardson Hwy MP 230
Tank Vehicle Accident 9,000 Unspecified Unspecified
AK-TAPS 11/08/74 Highway NA Diesel
Fuel/Heating Oil
Dalton Hwy MP 235
Tank Vehicle Accident 8,500 Unspecified Land and
Water
AK-TAPS 01/11/75 Construction Camp
Alyeska Pipeline
Service Co.
Diesel Fuel/Heating
Oil
TAPS Five Mile Camp
Facility Piping Leak - line
break 10,000 Unspecified Unspecified
AK-TAPS 02/07/75 Construction Camp
Alyeska Pipeline
Service Co.
Diesel Fuel/Heating
Oil
TAPS Galbraith Camp (N. side of
camp)
Facility Piping Leak - line
break 62,500 100,000 Unspecified Land and
Water
AK-TAPS 03/05/75 Operations
Support Facility
Alyeska Pipeline
Service Co.
Diesel Fuel/Heating
Oil
TAPS Van Horn Rd Facility, Fairbanks
Human error 4,700 Unspecified Unspecified
AK-TAPS 04/03/75 Highway NA Diesel
Fuel/Heating Oil
Ferry Access Road, S. Bank of
Yukon R
Tank Vehicle Accident 6,000 Unspecified Land
AK-TAPS 05/28/75 Construction Camp
Alyeska Pipeline
Service Co. Crude Oil TAPS Happy
Valley Camp A
Tank Vehicle Leak -
unspecified cause
6,000 Unspecified Unspecified
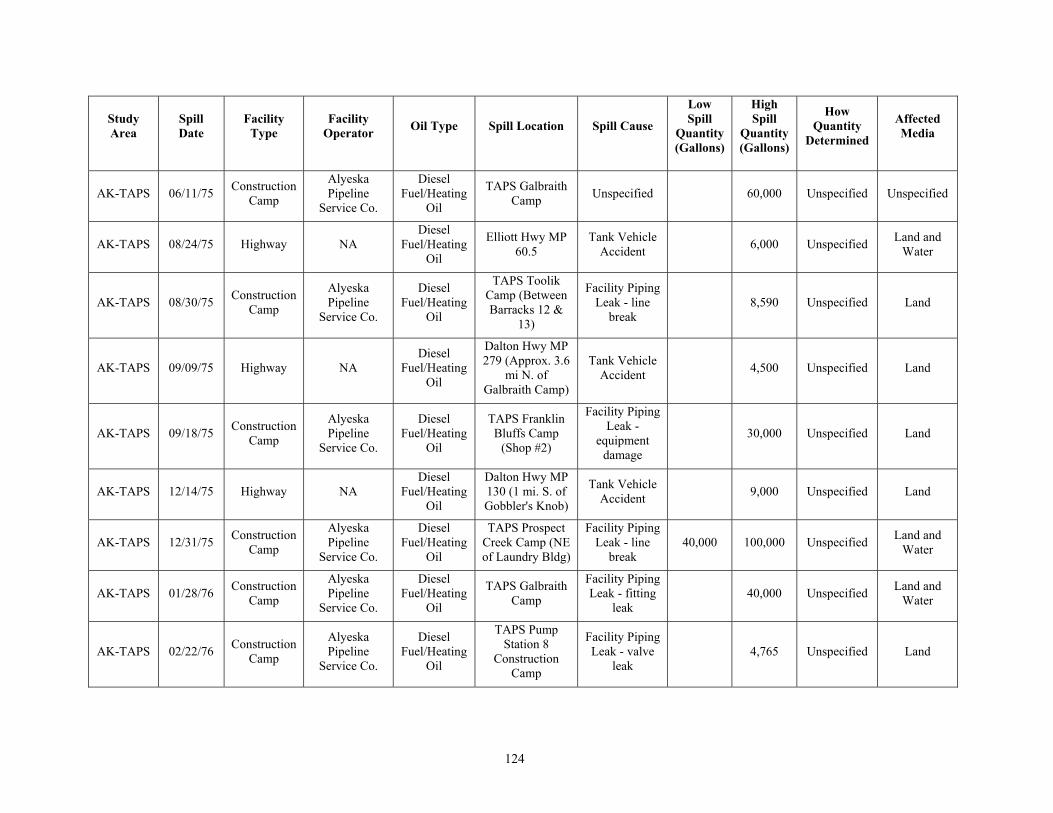
124
Study Area
Spill Date
Facility Type
Facility Operator Oil Type Spill Location Spill Cause
Low Spill
Quantity (Gallons)
High Spill
Quantity (Gallons)
How Quantity
Determined
Affected Media
AK-TAPS 06/11/75 Construction Camp
Alyeska Pipeline
Service Co.
Diesel Fuel/Heating
Oil
TAPS Galbraith Camp Unspecified 60,000 Unspecified Unspecified
AK-TAPS 08/24/75 Highway NA Diesel
Fuel/Heating Oil
Elliott Hwy MP 60.5
Tank Vehicle Accident 6,000 Unspecified Land and
Water
AK-TAPS 08/30/75 Construction Camp
Alyeska Pipeline
Service Co.
Diesel Fuel/Heating
Oil
TAPS Toolik Camp (Between Barracks 12 &
13)
Facility Piping Leak - line
break 8,590 Unspecified Land
AK-TAPS 09/09/75 Highway NA Diesel
Fuel/Heating Oil
Dalton Hwy MP 279 (Approx. 3.6
mi N. of Galbraith Camp)
Tank Vehicle Accident 4,500 Unspecified Land
AK-TAPS 09/18/75 Construction Camp
Alyeska Pipeline
Service Co.
Diesel Fuel/Heating
Oil
TAPS Franklin Bluffs Camp
(Shop #2)
Facility Piping Leak -
equipment damage
30,000 Unspecified Land
AK-TAPS 12/14/75 Highway NA Diesel
Fuel/Heating Oil
Dalton Hwy MP 130 (1 mi. S. of Gobbler's Knob)
Tank Vehicle Accident 9,000 Unspecified Land
AK-TAPS 12/31/75 Construction Camp
Alyeska Pipeline
Service Co.
Diesel Fuel/Heating
Oil
TAPS Prospect Creek Camp (NE of Laundry Bldg)
Facility Piping Leak - line
break 40,000 100,000 Unspecified Land and
Water
AK-TAPS 01/28/76 Construction Camp
Alyeska Pipeline
Service Co.
Diesel Fuel/Heating
Oil
TAPS Galbraith Camp
Facility Piping Leak - fitting
leak 40,000 Unspecified Land and
Water
AK-TAPS 02/22/76 Construction Camp
Alyeska Pipeline
Service Co.
Diesel Fuel/Heating
Oil
TAPS Pump Station 8
Construction Camp
Facility Piping Leak - valve
leak 4,765 Unspecified Land
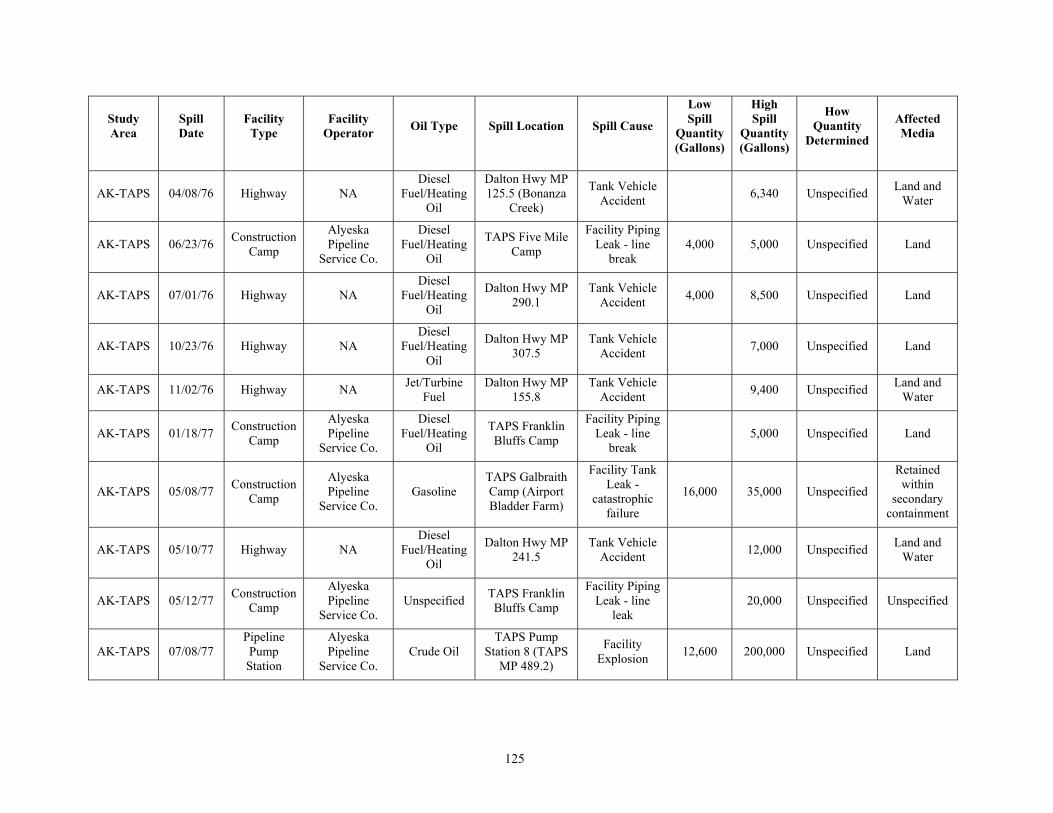
125
Study Area
Spill Date
Facility Type
Facility Operator Oil Type Spill Location Spill Cause
Low Spill
Quantity (Gallons)
High Spill
Quantity (Gallons)
How Quantity
Determined
Affected Media
AK-TAPS 04/08/76 Highway NA Diesel
Fuel/Heating Oil
Dalton Hwy MP 125.5 (Bonanza
Creek)
Tank Vehicle Accident 6,340 Unspecified Land and
Water
AK-TAPS 06/23/76 Construction Camp
Alyeska Pipeline
Service Co.
Diesel Fuel/Heating
Oil
TAPS Five Mile Camp
Facility Piping Leak - line
break 4,000 5,000 Unspecified Land
AK-TAPS 07/01/76 Highway NA Diesel
Fuel/Heating Oil
Dalton Hwy MP 290.1
Tank Vehicle Accident 4,000 8,500 Unspecified Land
AK-TAPS 10/23/76 Highway NA Diesel
Fuel/Heating Oil
Dalton Hwy MP 307.5
Tank Vehicle Accident 7,000 Unspecified Land
AK-TAPS 11/02/76 Highway NA Jet/Turbine Fuel
Dalton Hwy MP 155.8
Tank Vehicle Accident 9,400 Unspecified Land and
Water
AK-TAPS 01/18/77 Construction Camp
Alyeska Pipeline
Service Co.
Diesel Fuel/Heating
Oil
TAPS Franklin Bluffs Camp
Facility Piping Leak - line
break 5,000 Unspecified Land
AK-TAPS 05/08/77 Construction Camp
Alyeska Pipeline
Service Co. Gasoline
TAPS Galbraith Camp (Airport Bladder Farm)
Facility Tank Leak -
catastrophic failure
16,000 35,000 Unspecified
Retained within
secondary containment
AK-TAPS 05/10/77 Highway NA Diesel
Fuel/Heating Oil
Dalton Hwy MP 241.5
Tank Vehicle Accident 12,000 Unspecified Land and
Water
AK-TAPS 05/12/77 Construction Camp
Alyeska Pipeline
Service Co. Unspecified TAPS Franklin
Bluffs Camp
Facility Piping Leak - line
leak 20,000 Unspecified Unspecified
AK-TAPS 07/08/77 Pipeline Pump Station
Alyeska Pipeline
Service Co. Crude Oil
TAPS Pump Station 8 (TAPS
MP 489.2)
Facility Explosion 12,600 200,000 Unspecified Land
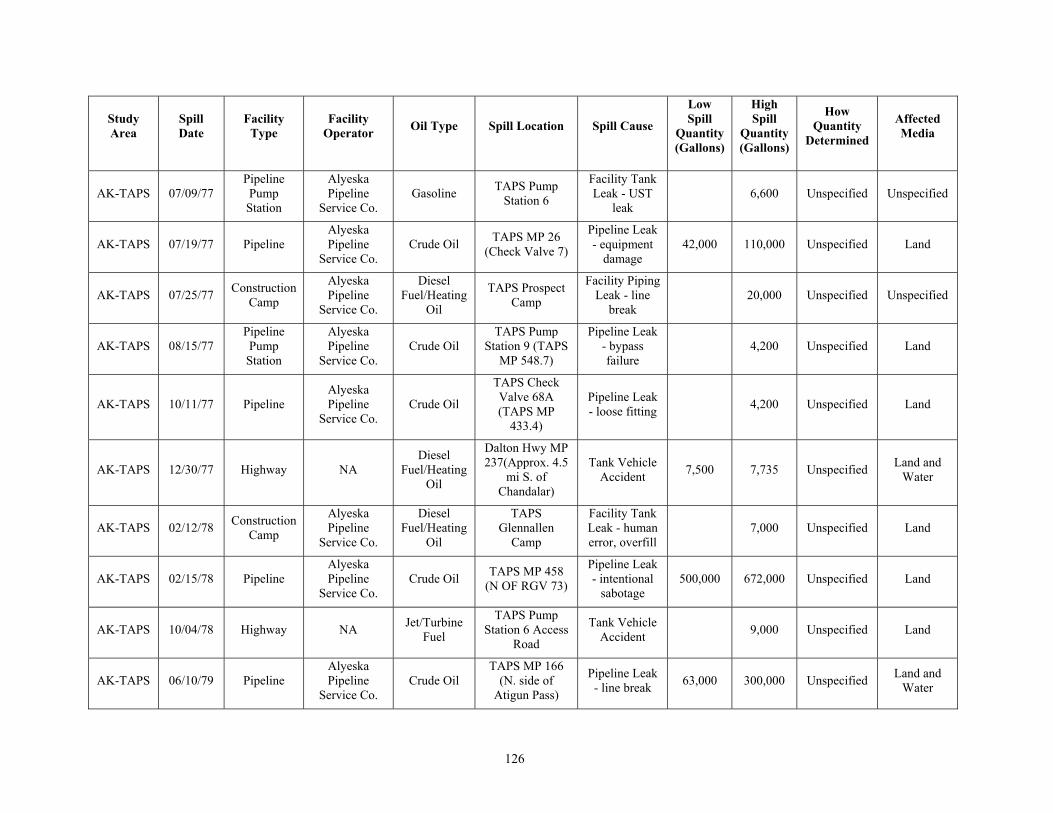
126
Study Area
Spill Date
Facility Type
Facility Operator Oil Type Spill Location Spill Cause
Low Spill
Quantity (Gallons)
High Spill
Quantity (Gallons)
How Quantity
Determined
Affected Media
AK-TAPS 07/09/77 Pipeline Pump Station
Alyeska Pipeline
Service Co. Gasoline TAPS Pump
Station 6
Facility Tank Leak - UST
leak 6,600 Unspecified Unspecified
AK-TAPS 07/19/77 Pipeline Alyeska Pipeline
Service Co. Crude Oil TAPS MP 26
(Check Valve 7)
Pipeline Leak - equipment
damage 42,000 110,000 Unspecified Land
AK-TAPS 07/25/77 Construction Camp
Alyeska Pipeline
Service Co.
Diesel Fuel/Heating
Oil
TAPS Prospect Camp
Facility Piping Leak - line
break 20,000 Unspecified Unspecified
AK-TAPS 08/15/77 Pipeline Pump Station
Alyeska Pipeline
Service Co. Crude Oil
TAPS Pump Station 9 (TAPS
MP 548.7)
Pipeline Leak - bypass failure
4,200 Unspecified Land
AK-TAPS 10/11/77 Pipeline Alyeska Pipeline
Service Co. Crude Oil
TAPS Check Valve 68A (TAPS MP
433.4)
Pipeline Leak - loose fitting 4,200 Unspecified Land
AK-TAPS 12/30/77 Highway NA Diesel
Fuel/Heating Oil
Dalton Hwy MP 237(Approx. 4.5
mi S. of Chandalar)
Tank Vehicle Accident 7,500 7,735 Unspecified Land and
Water
AK-TAPS 02/12/78 Construction Camp
Alyeska Pipeline
Service Co.
Diesel Fuel/Heating
Oil
TAPS Glennallen
Camp
Facility Tank Leak - human error, overfill
7,000 Unspecified Land
AK-TAPS 02/15/78 Pipeline Alyeska Pipeline
Service Co. Crude Oil TAPS MP 458
(N OF RGV 73)
Pipeline Leak - intentional
sabotage 500,000 672,000 Unspecified Land
AK-TAPS 10/04/78 Highway NA Jet/Turbine Fuel
TAPS Pump Station 6 Access
Road
Tank Vehicle Accident 9,000 Unspecified Land
AK-TAPS 06/10/79 Pipeline Alyeska Pipeline
Service Co. Crude Oil
TAPS MP 166 (N. side of
Atigun Pass)
Pipeline Leak - line break 63,000 300,000 Unspecified Land and
Water
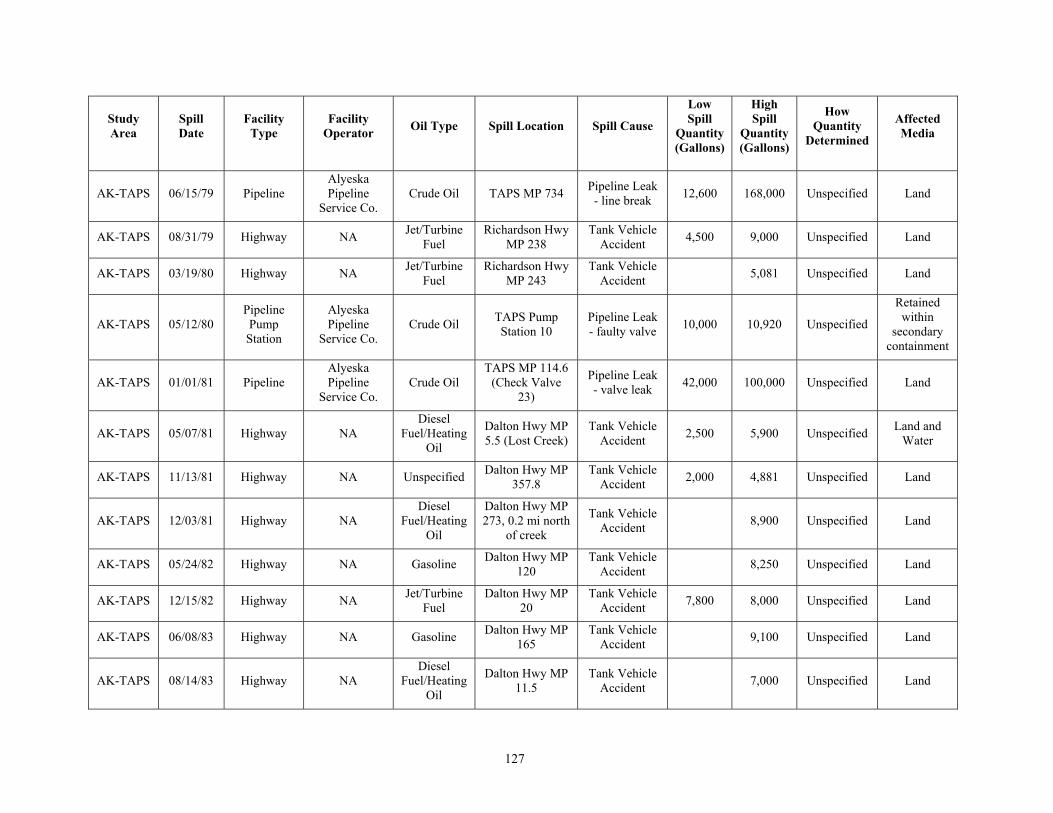
127
Study Area
Spill Date
Facility Type
Facility Operator Oil Type Spill Location Spill Cause
Low Spill
Quantity (Gallons)
High Spill
Quantity (Gallons)
How Quantity
Determined
Affected Media
AK-TAPS 06/15/79 Pipeline Alyeska Pipeline
Service Co. Crude Oil TAPS MP 734 Pipeline Leak
- line break 12,600 168,000 Unspecified Land
AK-TAPS 08/31/79 Highway NA Jet/Turbine Fuel
Richardson Hwy MP 238
Tank Vehicle Accident 4,500 9,000 Unspecified Land
AK-TAPS 03/19/80 Highway NA Jet/Turbine Fuel
Richardson Hwy MP 243
Tank Vehicle Accident 5,081 Unspecified Land
AK-TAPS 05/12/80 Pipeline Pump Station
Alyeska Pipeline
Service Co. Crude Oil TAPS Pump
Station 10 Pipeline Leak - faulty valve 10,000 10,920 Unspecified
Retained within
secondary containment
AK-TAPS 01/01/81 Pipeline Alyeska Pipeline
Service Co. Crude Oil
TAPS MP 114.6 (Check Valve
23)
Pipeline Leak - valve leak 42,000 100,000 Unspecified Land
AK-TAPS 05/07/81 Highway NA Diesel
Fuel/Heating Oil
Dalton Hwy MP 5.5 (Lost Creek)
Tank Vehicle Accident 2,500 5,900 Unspecified Land and
Water
AK-TAPS 11/13/81 Highway NA Unspecified Dalton Hwy MP 357.8
Tank Vehicle Accident 2,000 4,881 Unspecified Land
AK-TAPS 12/03/81 Highway NA Diesel
Fuel/Heating Oil
Dalton Hwy MP 273, 0.2 mi north
of creek
Tank Vehicle Accident 8,900 Unspecified Land
AK-TAPS 05/24/82 Highway NA Gasoline Dalton Hwy MP 120
Tank Vehicle Accident 8,250 Unspecified Land
AK-TAPS 12/15/82 Highway NA Jet/Turbine Fuel
Dalton Hwy MP 20
Tank Vehicle Accident 7,800 8,000 Unspecified Land
AK-TAPS 06/08/83 Highway NA Gasoline Dalton Hwy MP 165
Tank Vehicle Accident 9,100 Unspecified Land
AK-TAPS 08/14/83 Highway NA Diesel
Fuel/Heating Oil
Dalton Hwy MP 11.5
Tank Vehicle Accident 7,000 Unspecified Land
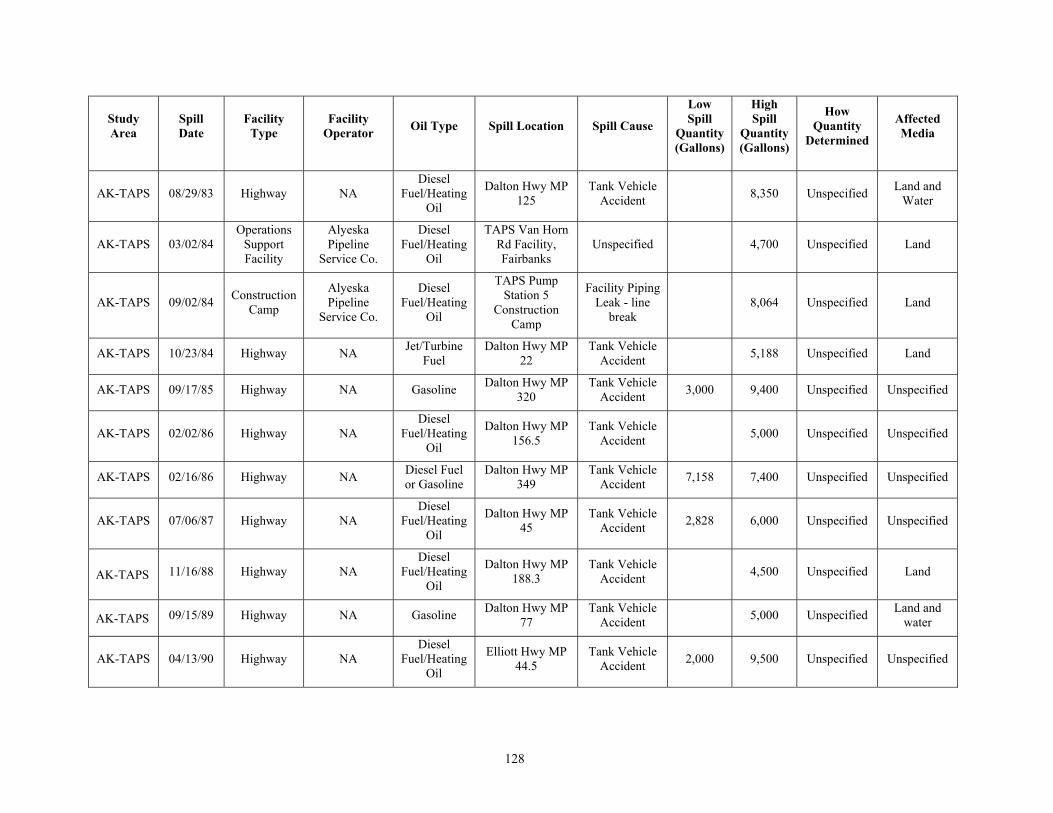
128
Study Area
Spill Date
Facility Type
Facility Operator Oil Type Spill Location Spill Cause
Low Spill
Quantity (Gallons)
High Spill
Quantity (Gallons)
How Quantity
Determined
Affected Media
AK-TAPS 08/29/83 Highway NA Diesel
Fuel/Heating Oil
Dalton Hwy MP 125
Tank Vehicle Accident 8,350 Unspecified Land and
Water
AK-TAPS 03/02/84 Operations
Support Facility
Alyeska Pipeline
Service Co.
Diesel Fuel/Heating
Oil
TAPS Van Horn Rd Facility, Fairbanks
Unspecified 4,700 Unspecified Land
AK-TAPS 09/02/84 Construction Camp
Alyeska Pipeline
Service Co.
Diesel Fuel/Heating
Oil
TAPS Pump Station 5
Construction Camp
Facility Piping Leak - line
break 8,064 Unspecified Land
AK-TAPS 10/23/84 Highway NA Jet/Turbine Fuel
Dalton Hwy MP 22
Tank Vehicle Accident 5,188 Unspecified Land
AK-TAPS 09/17/85 Highway NA Gasoline Dalton Hwy MP 320
Tank Vehicle Accident 3,000 9,400 Unspecified Unspecified
AK-TAPS 02/02/86 Highway NA Diesel
Fuel/Heating Oil
Dalton Hwy MP 156.5
Tank Vehicle Accident 5,000 Unspecified Unspecified
AK-TAPS 02/16/86 Highway NA Diesel Fuel or Gasoline
Dalton Hwy MP 349
Tank Vehicle Accident 7,158 7,400 Unspecified Unspecified
AK-TAPS 07/06/87 Highway NA Diesel
Fuel/Heating Oil
Dalton Hwy MP 45
Tank Vehicle Accident 2,828 6,000 Unspecified Unspecified
AK-TAPS 11/16/88 Highway NA Diesel
Fuel/Heating Oil
Dalton Hwy MP 188.3
Tank Vehicle Accident 4,500 Unspecified Land
AK-TAPS 09/15/89 Highway NA Gasoline Dalton Hwy MP 77
Tank Vehicle Accident 5,000 Unspecified Land and
water
AK-TAPS 04/13/90 Highway NA Diesel
Fuel/Heating Oil
Elliott Hwy MP 44.5
Tank Vehicle Accident 2,000 9,500 Unspecified Unspecified
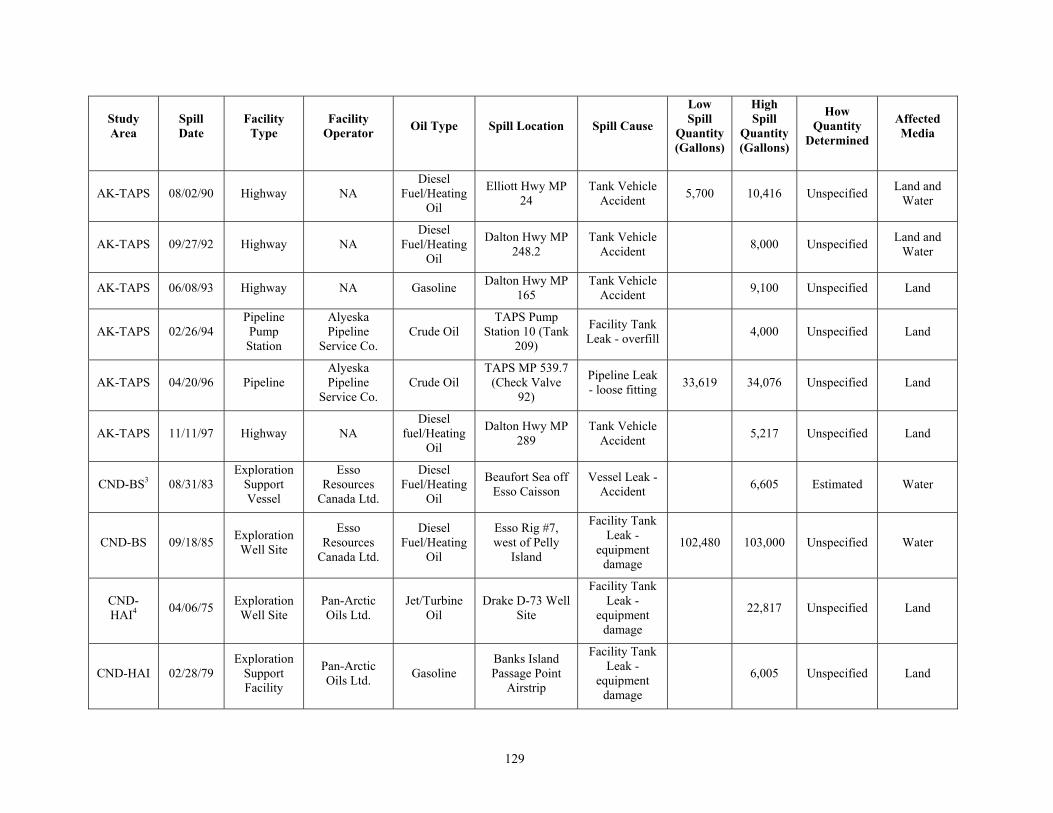
129
Study Area
Spill Date
Facility Type
Facility Operator Oil Type Spill Location Spill Cause
Low Spill
Quantity (Gallons)
High Spill
Quantity (Gallons)
How Quantity
Determined
Affected Media
AK-TAPS 08/02/90 Highway NA Diesel
Fuel/Heating Oil
Elliott Hwy MP 24
Tank Vehicle Accident 5,700 10,416 Unspecified Land and
Water
AK-TAPS 09/27/92 Highway NA Diesel
Fuel/Heating Oil
Dalton Hwy MP 248.2
Tank Vehicle Accident 8,000 Unspecified Land and
Water
AK-TAPS 06/08/93 Highway NA Gasoline Dalton Hwy MP 165
Tank Vehicle Accident 9,100 Unspecified Land
AK-TAPS 02/26/94 Pipeline Pump Station
Alyeska Pipeline
Service Co. Crude Oil
TAPS Pump Station 10 (Tank
209)
Facility Tank Leak - overfill 4,000 Unspecified Land
AK-TAPS 04/20/96 Pipeline Alyeska Pipeline
Service Co. Crude Oil
TAPS MP 539.7 (Check Valve
92)
Pipeline Leak - loose fitting 33,619 34,076 Unspecified Land
AK-TAPS 11/11/97 Highway NA Diesel
fuel/Heating Oil
Dalton Hwy MP 289
Tank Vehicle Accident 5,217 Unspecified Land
CND-BS3 08/31/83 Exploration
Support Vessel
Esso Resources
Canada Ltd.
Diesel Fuel/Heating
Oil
Beaufort Sea off Esso Caisson
Vessel Leak - Accident 6,605 Estimated Water
CND-BS 09/18/85 Exploration Well Site
Esso Resources
Canada Ltd.
Diesel Fuel/Heating
Oil
Esso Rig #7, west of Pelly
Island
Facility Tank Leak -
equipment damage
102,480 103,000 Unspecified Water
CND-HAI4 04/06/75 Exploration
Well Site Pan-Arctic Oils Ltd.
Jet/Turbine Oil
Drake D-73 Well Site
Facility Tank Leak -
equipment damage
22,817 Unspecified Land
CND-HAI 02/28/79 Exploration
Support Facility
Pan-Arctic Oils Ltd. Gasoline
Banks Island Passage Point
Airstrip
Facility Tank Leak -
equipment damage
6,005 Unspecified Land
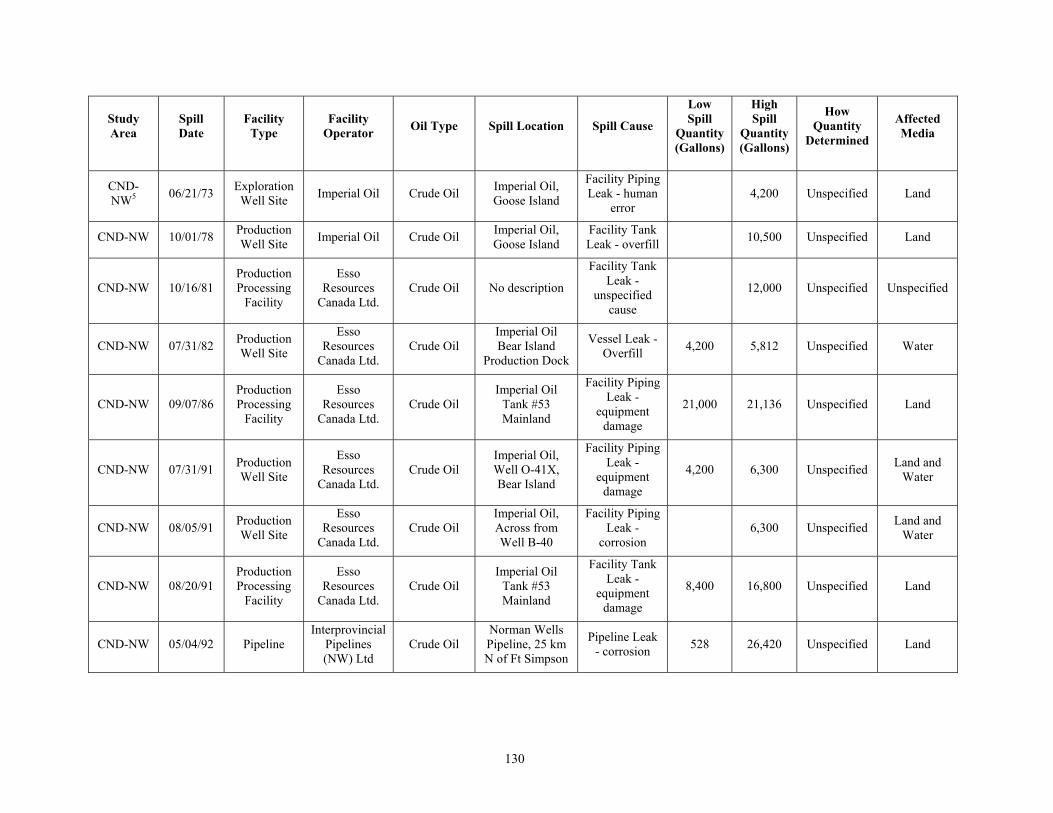
130
Study Area
Spill Date
Facility Type
Facility Operator Oil Type Spill Location Spill Cause
Low Spill
Quantity (Gallons)
High Spill
Quantity (Gallons)
How Quantity
Determined
Affected Media
CND-NW5 06/21/73 Exploration
Well Site Imperial Oil Crude Oil Imperial Oil, Goose Island
Facility Piping Leak - human
error 4,200 Unspecified Land
CND-NW 10/01/78 Production Well Site Imperial Oil Crude Oil Imperial Oil,
Goose Island Facility Tank Leak - overfill 10,500 Unspecified Land
CND-NW 10/16/81 Production Processing
Facility
Esso Resources
Canada Ltd. Crude Oil No description
Facility Tank Leak -
unspecified cause
12,000 Unspecified Unspecified
CND-NW 07/31/82 Production Well Site
Esso Resources
Canada Ltd. Crude Oil
Imperial Oil Bear Island
Production Dock
Vessel Leak - Overfill 4,200 5,812 Unspecified Water
CND-NW 09/07/86 Production Processing
Facility
Esso Resources
Canada Ltd. Crude Oil
Imperial Oil Tank #53 Mainland
Facility Piping Leak -
equipment damage
21,000 21,136 Unspecified Land
CND-NW 07/31/91 Production Well Site
Esso Resources
Canada Ltd. Crude Oil
Imperial Oil, Well O-41X, Bear Island
Facility Piping Leak -
equipment damage
4,200 6,300 Unspecified Land and Water
CND-NW 08/05/91 Production Well Site
Esso Resources
Canada Ltd. Crude Oil
Imperial Oil, Across from Well B-40
Facility Piping Leak -
corrosion 6,300 Unspecified Land and
Water
CND-NW 08/20/91 Production Processing
Facility
Esso Resources
Canada Ltd. Crude Oil
Imperial Oil Tank #53 Mainland
Facility Tank Leak -
equipment damage
8,400 16,800 Unspecified Land
CND-NW 05/04/92 Pipeline Interprovincial
Pipelines (NW) Ltd
Crude Oil Norman Wells Pipeline, 25 km N of Ft Simpson
Pipeline Leak - corrosion 528 26,420 Unspecified Land
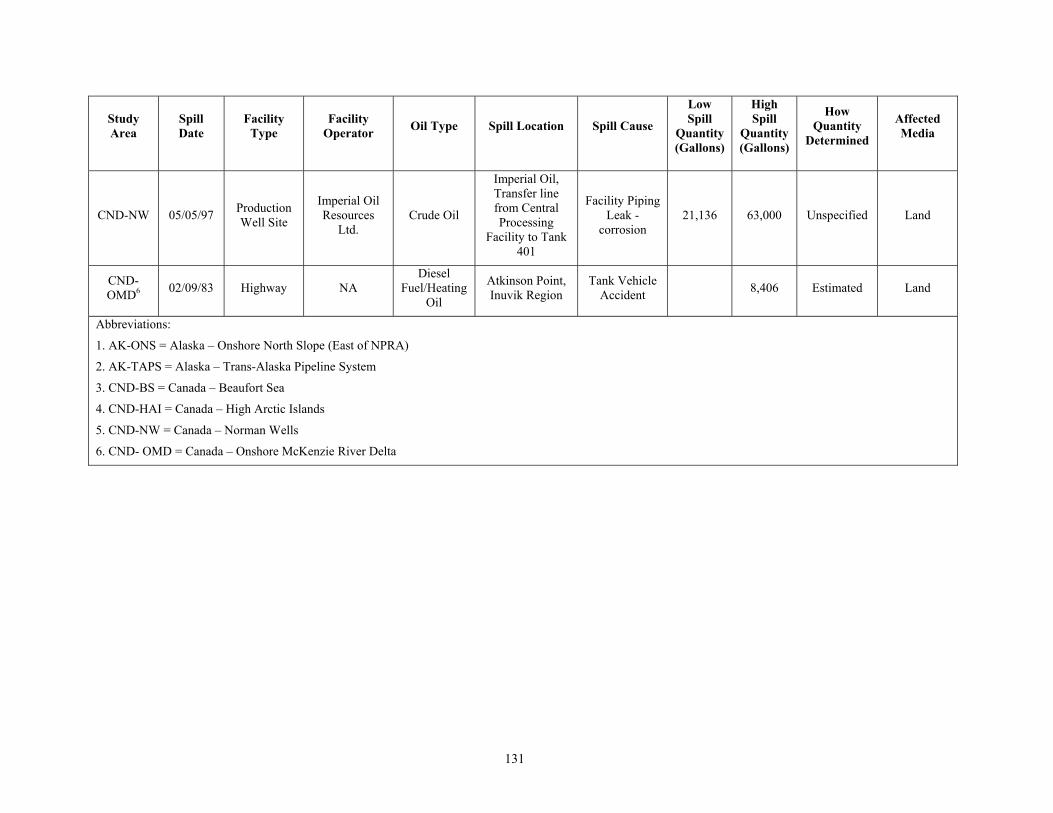
131
Study Area
Spill Date
Facility Type
Facility Operator Oil Type Spill Location Spill Cause
Low Spill
Quantity (Gallons)
High Spill
Quantity (Gallons)
How Quantity
Determined
Affected Media
CND-NW 05/05/97 Production Well Site
Imperial Oil Resources
Ltd. Crude Oil
Imperial Oil, Transfer line from Central Processing
Facility to Tank 401
Facility Piping Leak -
corrosion 21,136 63,000 Unspecified Land
CND-OMD6 02/09/83 Highway NA
Diesel Fuel/Heating
Oil
Atkinson Point, Inuvik Region
Tank Vehicle Accident 8,406 Estimated Land
Abbreviations:
1. AK-ONS = Alaska – Onshore North Slope (East of NPRA)
2. AK-TAPS = Alaska – Trans-Alaska Pipeline System
3. CND-BS = Canada – Beaufort Sea
4. CND-HAI = Canada – High Arctic Islands
5. CND-NW = Canada – Norman Wells
6. CND- OMD = Canada – Onshore McKenzie River Delta
132
APPENDIX B – STATISTICAL ANALYSIS AND OIL SPILL RATE CALCULATIONS USING ALASKAN AND CANADIAN SPILL DATA
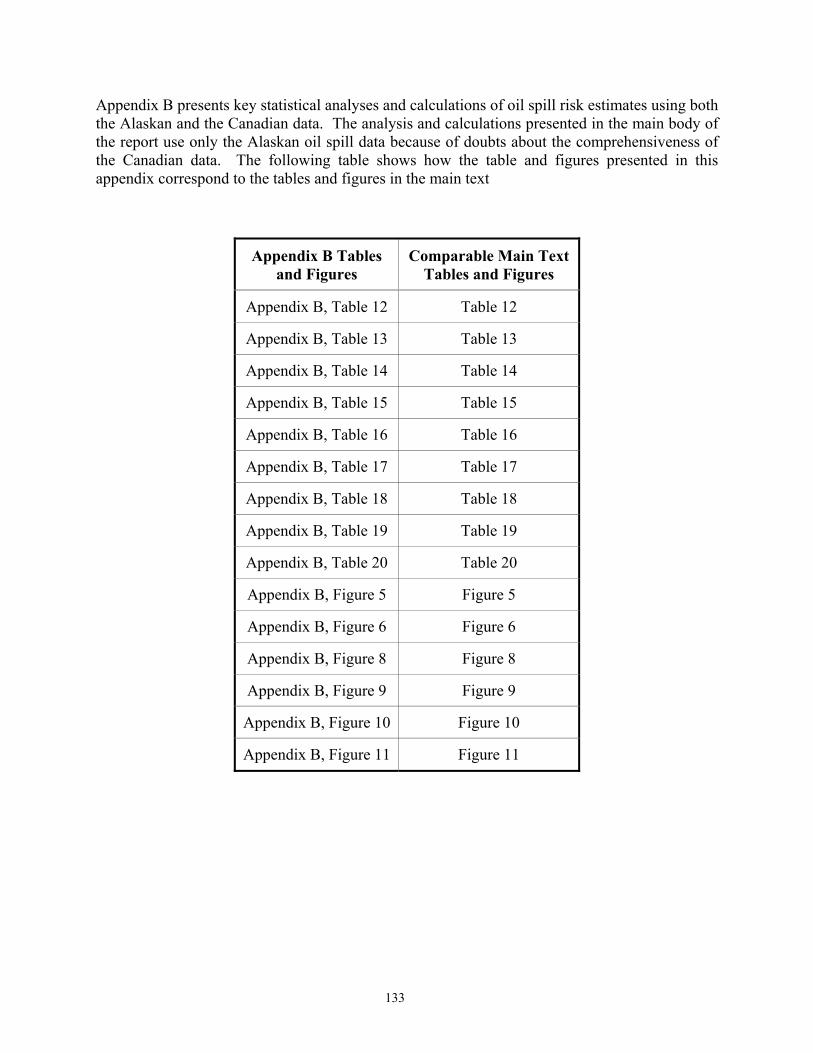
133
Appendix B presents key statistical analyses and calculations of oil spill risk estimates using both the Alaskan and the Canadian data. The analysis and calculations presented in the main body of the report use only the Alaskan oil spill data because of doubts about the comprehensiveness of the Canadian data. The following table shows how the table and figures presented in this appendix correspond to the tables and figures in the main text
Appendix B Tables and Figures
Comparable Main Text Tables and Figures
Appendix B, Table 12 Table 12
Appendix B, Table 13 Table 13
Appendix B, Table 14 Table 14
Appendix B, Table 15 Table 15
Appendix B, Table 16 Table 16
Appendix B, Table 17 Table 17
Appendix B, Table 18 Table 18
Appendix B, Table 19 Table 19
Appendix B, Table 20 Table 20
Appendix B, Figure 5 Figure 5
Appendix B, Figure 6 Figure 6
Appendix B, Figure 8 Figure 8
Appendix B, Figure 9 Figure 9
Appendix B, Figure 10 Figure 10
Appendix B, Figure 11 Figure 11
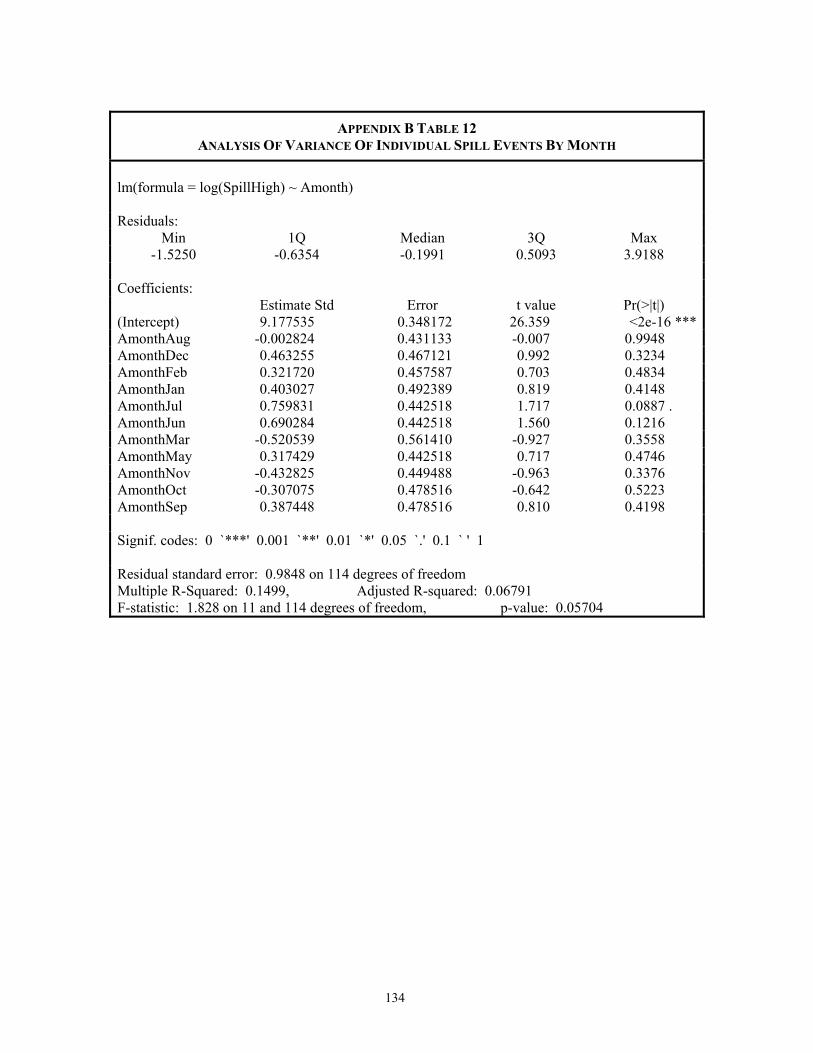
134
APPENDIX B TABLE 12 ANALYSIS OF VARIANCE OF INDIVIDUAL SPILL EVENTS BY MONTH
lm(formula = log(SpillHigh) ~ Amonth) Residuals:
Min 1Q Median 3Q Max -1.5250 -0.6354 -0.1991 0.5093 3.9188
Coefficients: Estimate Std Error t value Pr(>|t|) (Intercept) 9.177535 0.348172 26.359 <2e-16 ***AmonthAug -0.002824 0.431133 -0.007 0.9948 AmonthDec 0.463255 0.467121 0.992 0.3234 AmonthFeb 0.321720 0.457587 0.703 0.4834 AmonthJan 0.403027 0.492389 0.819 0.4148 AmonthJul 0.759831 0.442518 1.717 0.0887 . AmonthJun 0.690284 0.442518 1.560 0.1216 AmonthMar -0.520539 0.561410 -0.927 0.3558 AmonthMay 0.317429 0.442518 0.717 0.4746 AmonthNov -0.432825 0.449488 -0.963 0.3376 AmonthOct -0.307075 0.478516 -0.642 0.5223 AmonthSep 0.387448 0.478516 0.810 0.4198 Signif. codes: 0 `***' 0.001 `**' 0.01 `*' 0.05 `.' 0.1 ` ' 1 Residual standard error: 0.9848 on 114 degrees of freedom Multiple R-Squared: 0.1499, Adjusted R-squared: 0.06791 F-statistic: 1.828 on 11 and 114 degrees of freedom, p-value: 0.05704
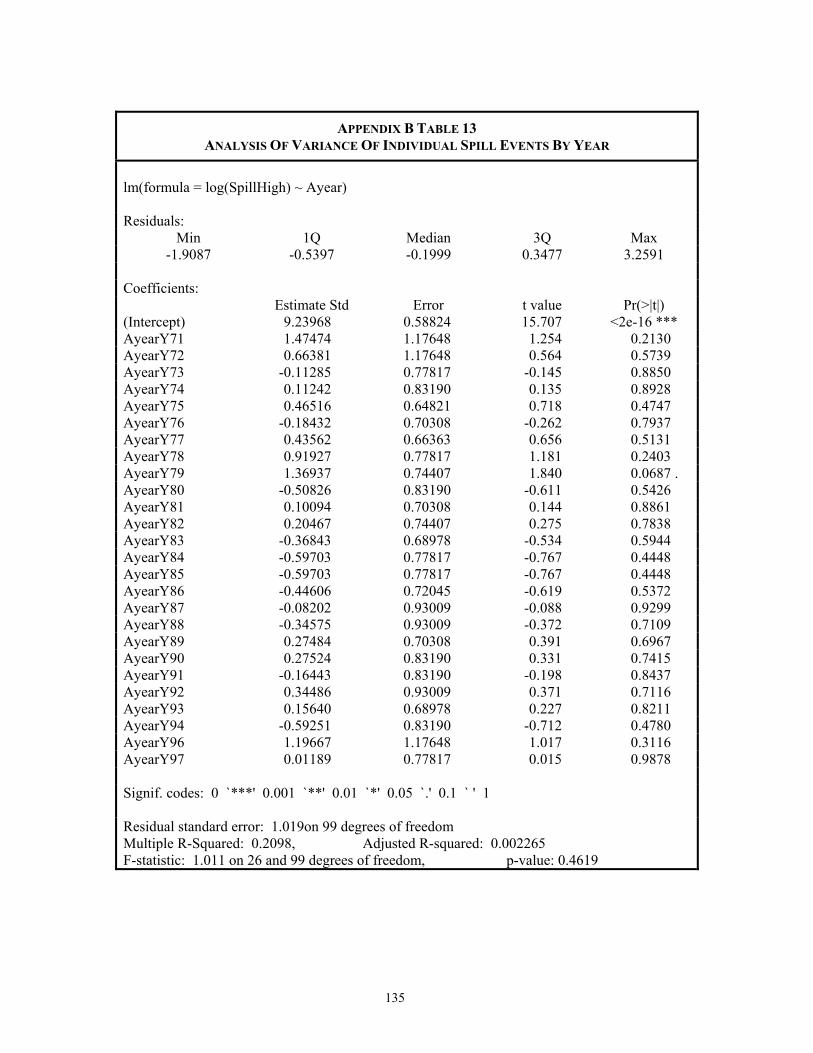
135
APPENDIX B TABLE 13 ANALYSIS OF VARIANCE OF INDIVIDUAL SPILL EVENTS BY YEAR
lm(formula = log(SpillHigh) ~ Ayear) Residuals:
Min 1Q Median 3Q Max -1.9087 -0.5397 -0.1999 0.3477 3.2591
Coefficients: Estimate Std Error t value Pr(>|t|) (Intercept) 9.23968 0.58824 15.707 <2e-16 *** AyearY71 1.47474 1.17648 1.254 0.2130 AyearY72 0.66381 1.17648 0.564 0.5739 AyearY73 -0.11285 0.77817 -0.145 0.8850 AyearY74 0.11242 0.83190 0.135 0.8928 AyearY75 0.46516 0.64821 0.718 0.4747 AyearY76 -0.18432 0.70308 -0.262 0.7937 AyearY77 0.43562 0.66363 0.656 0.5131 AyearY78 0.91927 0.77817 1.181 0.2403 AyearY79 1.36937 0.74407 1.840 0.0687 . AyearY80 -0.50826 0.83190 -0.611 0.5426 AyearY81 0.10094 0.70308 0.144 0.8861 AyearY82 0.20467 0.74407 0.275 0.7838 AyearY83 -0.36843 0.68978 -0.534 0.5944 AyearY84 -0.59703 0.77817 -0.767 0.4448 AyearY85 -0.59703 0.77817 -0.767 0.4448 AyearY86 -0.44606 0.72045 -0.619 0.5372 AyearY87 -0.08202 0.93009 -0.088 0.9299 AyearY88 -0.34575 0.93009 -0.372 0.7109 AyearY89 0.27484 0.70308 0.391 0.6967 AyearY90 0.27524 0.83190 0.331 0.7415 AyearY91 -0.16443 0.83190 -0.198 0.8437 AyearY92 0.34486 0.93009 0.371 0.7116 AyearY93 0.15640 0.68978 0.227 0.8211 AyearY94 -0.59251 0.83190 -0.712 0.4780 AyearY96 1.19667 1.17648 1.017 0.3116 AyearY97 0.01189 0.77817 0.015 0.9878 Signif. codes: 0 `***' 0.001 `**' 0.01 `*' 0.05 `.' 0.1 ` ' 1 Residual standard error: 1.019on 99 degrees of freedom Multiple R-Squared: 0.2098, Adjusted R-squared: 0.002265 F-statistic: 1.011 on 26 and 99 degrees of freedom, p-value: 0.4619
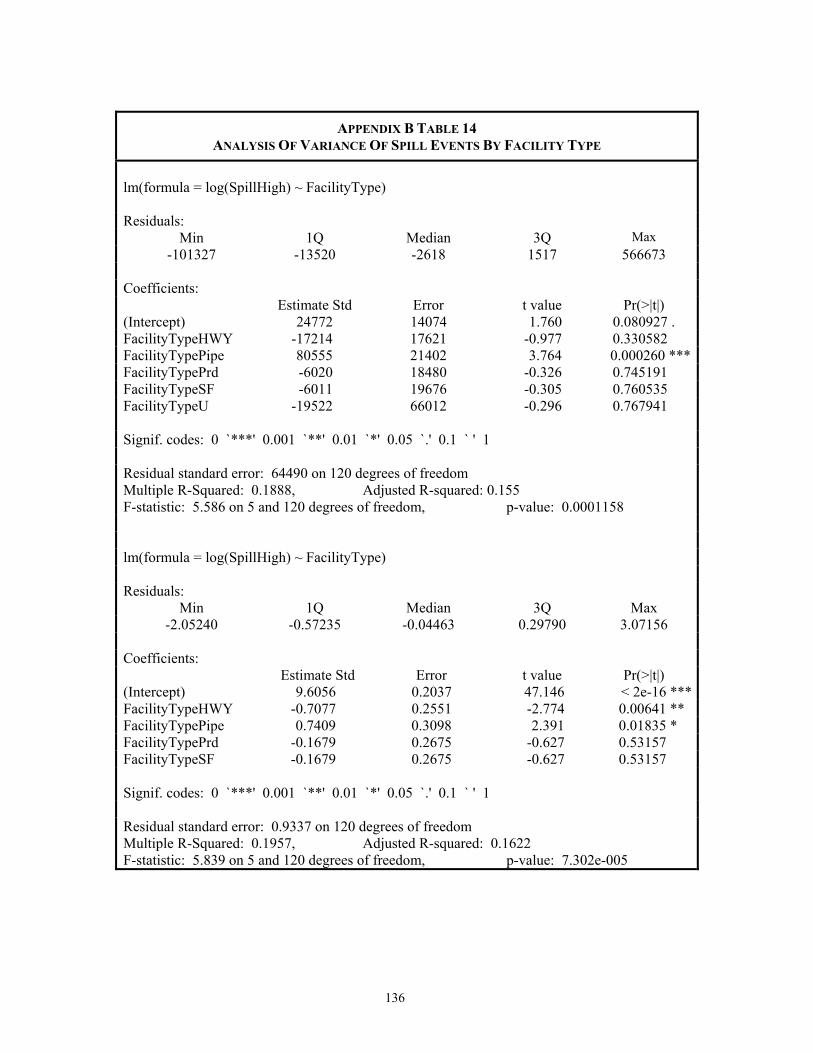
136
APPENDIX B TABLE 14 ANALYSIS OF VARIANCE OF SPILL EVENTS BY FACILITY TYPE
lm(formula = log(SpillHigh) ~ FacilityType) Residuals:
Min 1Q Median 3Q Max -101327 -13520 -2618 1517 566673
Coefficients: Estimate Std Error t value Pr(>|t|) (Intercept) 24772 14074 1.760 0.080927 . FacilityTypeHWY -17214 17621 -0.977 0.330582 FacilityTypePipe 80555 21402 3.764 0.000260 ***FacilityTypePrd -6020 18480 -0.326 0.745191 FacilityTypeSF -6011 19676 -0.305 0.760535 FacilityTypeU -19522 66012 -0.296 0.767941
Signif. codes: 0 `***' 0.001 `**' 0.01 `*' 0.05 `.' 0.1 ` ' 1
Residual standard error: 64490 on 120 degrees of freedom Multiple R-Squared: 0.1888, Adjusted R-squared: 0.155 F-statistic: 5.586 on 5 and 120 degrees of freedom, p-value: 0.0001158
lm(formula = log(SpillHigh) ~ FacilityType)
Residuals: Min 1Q Median 3Q Max
-2.05240 -0.57235 -0.04463 0.29790 3.07156
Coefficients: Estimate Std Error t value Pr(>|t|) (Intercept) 9.6056 0.2037 47.146 < 2e-16 ***FacilityTypeHWY -0.7077 0.2551 -2.774 0.00641 ** FacilityTypePipe 0.7409 0.3098 2.391 0.01835 * FacilityTypePrd -0.1679 0.2675 -0.627 0.53157 FacilityTypeSF -0.1679 0.2675 -0.627 0.53157
Signif. codes: 0 `***' 0.001 `**' 0.01 `*' 0.05 `.' 0.1 ` ' 1
Residual standard error: 0.9337 on 120 degrees of freedom Multiple R-Squared: 0.1957, Adjusted R-squared: 0.1622 F-statistic: 5.839 on 5 and 120 degrees of freedom, p-value: 7.302e-005
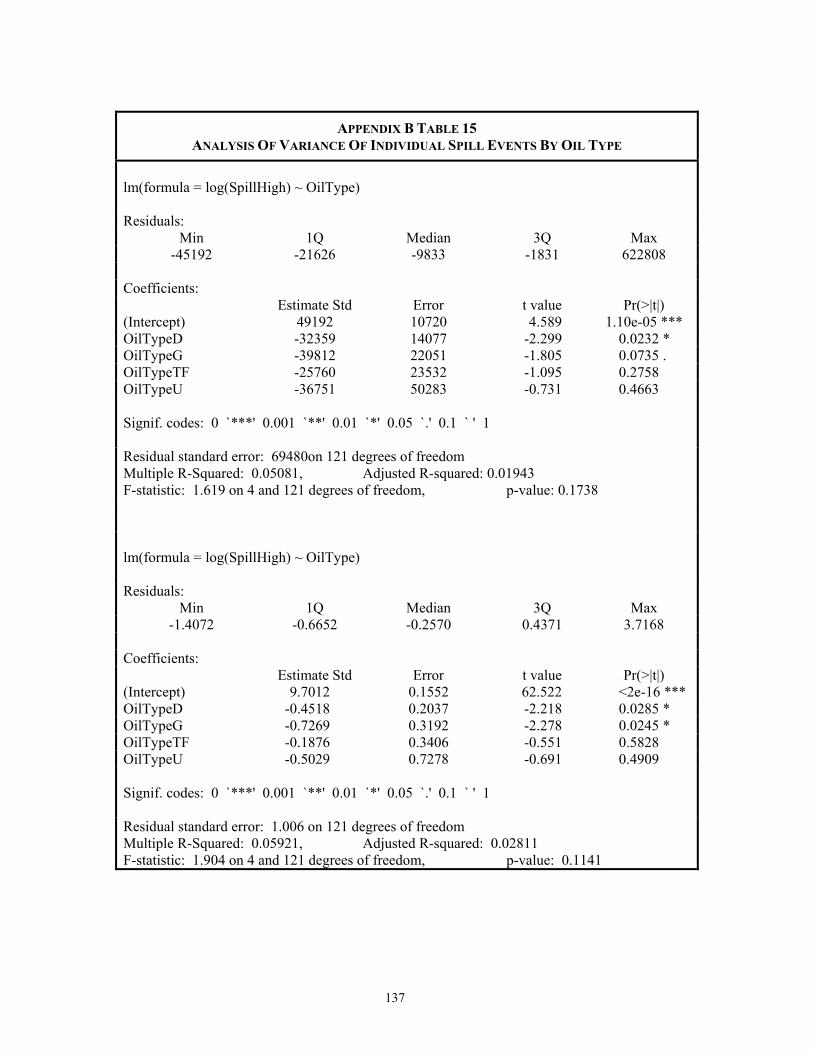
137
APPENDIX B TABLE 15 ANALYSIS OF VARIANCE OF INDIVIDUAL SPILL EVENTS BY OIL TYPE
lm(formula = log(SpillHigh) ~ OilType) Residuals:
Min 1Q Median 3Q Max -45192 -21626 -9833 -1831 622808
Coefficients: Estimate Std Error t value Pr(>|t|) (Intercept) 49192 10720 4.589 1.10e-05 *** OilTypeD -32359 14077 -2.299 0.0232 * OilTypeG -39812 22051 -1.805 0.0735 . OilTypeTF -25760 23532 -1.095 0.2758 OilTypeU -36751 50283 -0.731 0.4663
Signif. codes: 0 `***' 0.001 `**' 0.01 `*' 0.05 `.' 0.1 ` ' 1
Residual standard error: 69480on 121 degrees of freedom Multiple R-Squared: 0.05081, Adjusted R-squared: 0.01943 F-statistic: 1.619 on 4 and 121 degrees of freedom, p-value: 0.1738
lm(formula = log(SpillHigh) ~ OilType)
Residuals:
Min 1Q Median 3Q Max -1.4072 -0.6652 -0.2570 0.4371 3.7168
Coefficients: Estimate Std Error t value Pr(>|t|) (Intercept) 9.7012 0.1552 62.522 <2e-16 *** OilTypeD -0.4518 0.2037 -2.218 0.0285 * OilTypeG -0.7269 0.3192 -2.278 0.0245 * OilTypeTF -0.1876 0.3406 -0.551 0.5828 OilTypeU -0.5029 0.7278 -0.691 0.4909
Signif. codes: 0 `***' 0.001 `**' 0.01 `*' 0.05 `.' 0.1 ` ' 1 Residual standard error: 1.006 on 121 degrees of freedom Multiple R-Squared: 0.05921, Adjusted R-squared: 0.02811 F-statistic: 1.904 on 4 and 121 degrees of freedom, p-value: 0.1141
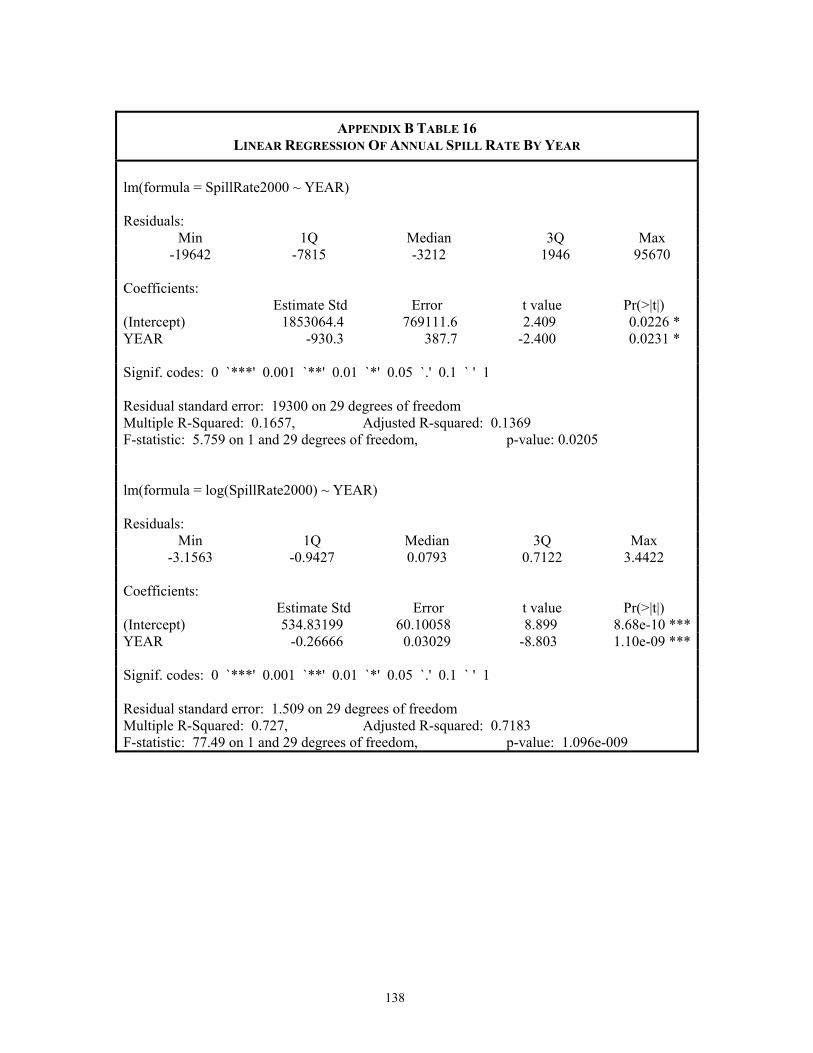
138
APPENDIX B TABLE 16 LINEAR REGRESSION OF ANNUAL SPILL RATE BY YEAR
lm(formula = SpillRate2000 ~ YEAR) Residuals:
Min 1Q Median 3Q Max -19642 -7815 -3212 1946 95670
Coefficients: Estimate Std Error t value Pr(>|t|) (Intercept) 1853064.4 769111.6 2.409 0.0226 * YEAR -930.3 387.7 -2.400 0.0231 *
Signif. codes: 0 `***' 0.001 `**' 0.01 `*' 0.05 `.' 0.1 ` ' 1
Residual standard error: 19300 on 29 degrees of freedom Multiple R-Squared: 0.1657, Adjusted R-squared: 0.1369 F-statistic: 5.759 on 1 and 29 degrees of freedom, p-value: 0.0205
lm(formula = log(SpillRate2000) ~ YEAR)
Residuals: Min 1Q Median 3Q Max
-3.1563 -0.9427 0.0793 0.7122 3.4422
Coefficients: Estimate Std Error t value Pr(>|t|) (Intercept) 534.83199 60.10058 8.899 8.68e-10 ***YEAR -0.26666 0.03029 -8.803 1.10e-09 ***
Signif. codes: 0 `***' 0.001 `**' 0.01 `*' 0.05 `.' 0.1 ` ' 1
Residual standard error: 1.509 on 29 degrees of freedom Multiple R-Squared: 0.727, Adjusted R-squared: 0.7183 F-statistic: 77.49 on 1 and 29 degrees of freedom, p-value: 1.096e-009
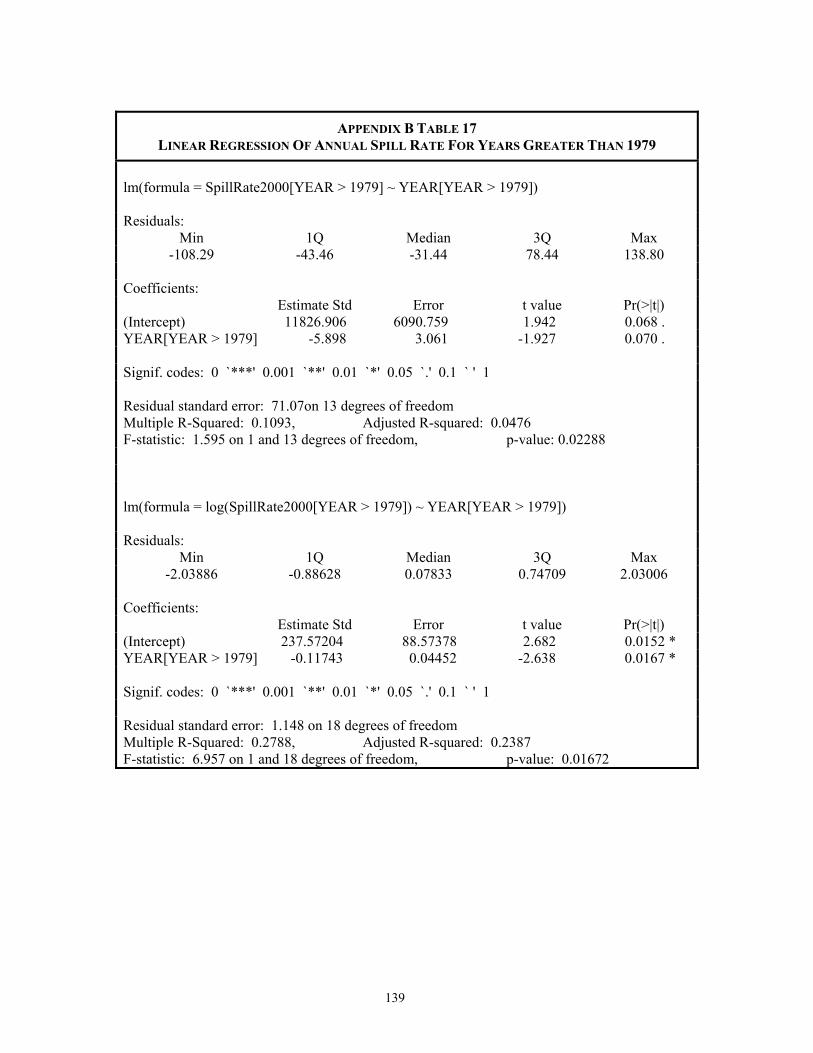
139
APPENDIX B TABLE 17 LINEAR REGRESSION OF ANNUAL SPILL RATE FOR YEARS GREATER THAN 1979
lm(formula = SpillRate2000[YEAR > 1979] ~ YEAR[YEAR > 1979]) Residuals:
Min 1Q Median 3Q Max -108.29 -43.46 -31.44 78.44 138.80
Coefficients: Estimate Std Error t value Pr(>|t|) (Intercept) 11826.906 6090.759 1.942 0.068 . YEAR[YEAR > 1979] -5.898 3.061 -1.927 0.070 . Signif. codes: 0 `***' 0.001 `**' 0.01 `*' 0.05 `.' 0.1 ` ' 1
Residual standard error: 71.07on 13 degrees of freedom Multiple R-Squared: 0.1093, Adjusted R-squared: 0.0476 F-statistic: 1.595 on 1 and 13 degrees of freedom, p-value: 0.02288
lm(formula = log(SpillRate2000[YEAR > 1979]) ~ YEAR[YEAR > 1979])
Residuals:
Min 1Q Median 3Q Max -2.03886 -0.88628 0.07833 0.74709 2.03006
Coefficients: Estimate Std Error t value Pr(>|t|) (Intercept) 237.57204 88.57378 2.682 0.0152 * YEAR[YEAR > 1979] -0.11743 0.04452 -2.638 0.0167 *
Signif. codes: 0 `***' 0.001 `**' 0.01 `*' 0.05 `.' 0.1 ` ' 1
Residual standard error: 1.148 on 18 degrees of freedom Multiple R-Squared: 0.2788, Adjusted R-squared: 0.2387 F-statistic: 6.957 on 1 and 18 degrees of freedom, p-value: 0.01672
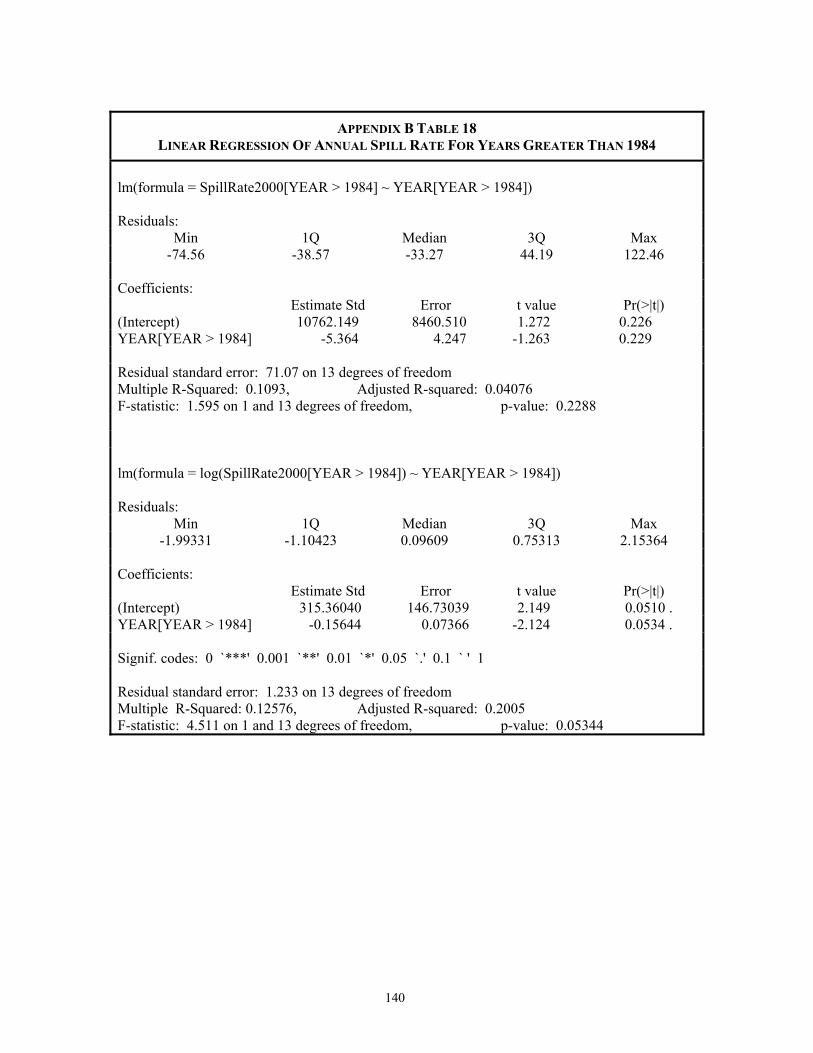
140
APPENDIX B TABLE 18 LINEAR REGRESSION OF ANNUAL SPILL RATE FOR YEARS GREATER THAN 1984
lm(formula = SpillRate2000[YEAR > 1984] ~ YEAR[YEAR > 1984]) Residuals:
Min 1Q Median 3Q Max -74.56 -38.57 -33.27 44.19 122.46
Coefficients: Estimate Std Error t value Pr(>|t|) (Intercept) 10762.149 8460.510 1.272 0.226 YEAR[YEAR > 1984] -5.364 4.247 -1.263 0.229
Residual standard error: 71.07 on 13 degrees of freedom Multiple R-Squared: 0.1093, Adjusted R-squared: 0.04076 F-statistic: 1.595 on 1 and 13 degrees of freedom, p-value: 0.2288
lm(formula = log(SpillRate2000[YEAR > 1984]) ~ YEAR[YEAR > 1984])
Residuals:
Min 1Q Median 3Q Max -1.99331 -1.10423 0.09609 0.75313 2.15364
Coefficients: Estimate Std Error t value Pr(>|t|) (Intercept) 315.36040 146.73039 2.149 0.0510 . YEAR[YEAR > 1984] -0.15644 0.07366 -2.124 0.0534 .
Signif. codes: 0 `***' 0.001 `**' 0.01 `*' 0.05 `.' 0.1 ` ' 1
Residual standard error: 1.233 on 13 degrees of freedom Multiple R-Squared: 0.12576, Adjusted R-squared: 0.2005 F-statistic: 4.511 on 1 and 13 degrees of freedom, p-value: 0.05344
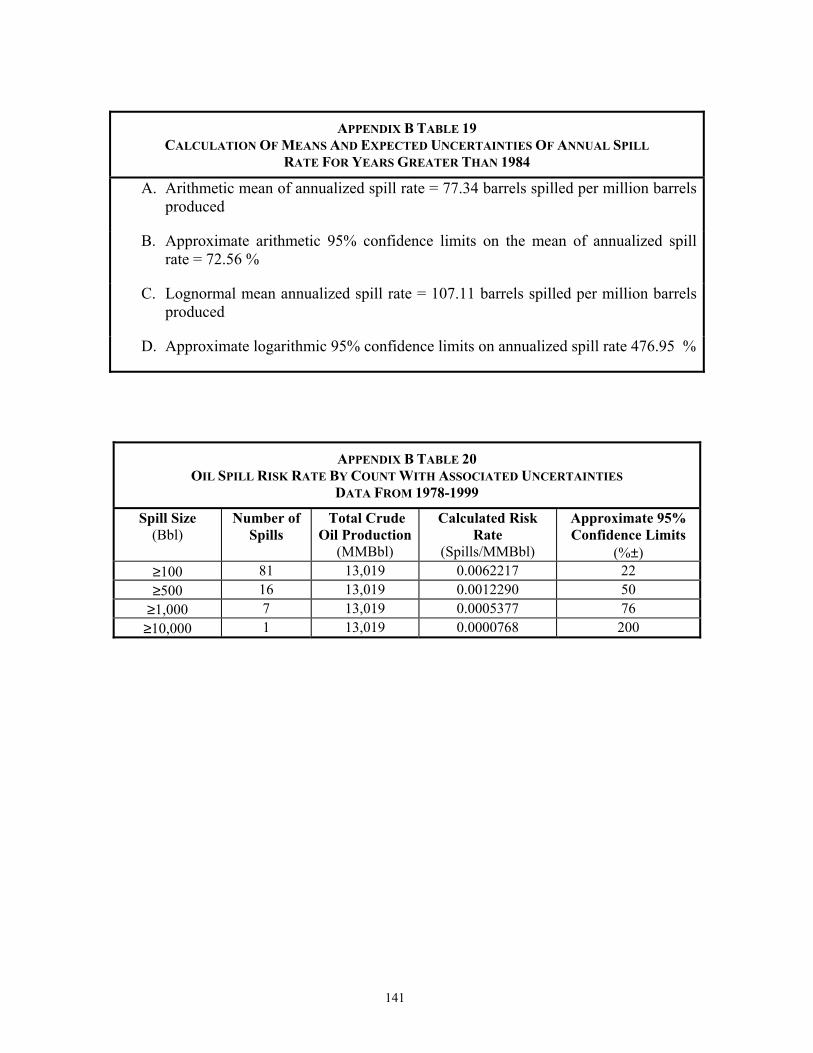
141
APPENDIX B TABLE 19 CALCULATION OF MEANS AND EXPECTED UNCERTAINTIES OF ANNUAL SPILL
RATE FOR YEARS GREATER THAN 1984
A. Arithmetic mean of annualized spill rate = 77.34 barrels spilled per million barrels produced
B. Approximate arithmetic 95% confidence limits on the mean of annualized spill rate = 72.56 %
C. Lognormal mean annualized spill rate = 107.11 barrels spilled per million barrels produced
D. Approximate logarithmic 95% confidence limits on annualized spill rate 476.95 %
APPENDIX B TABLE 20 OIL SPILL RISK RATE BY COUNT WITH ASSOCIATED UNCERTAINTIES
DATA FROM 1978-1999 Spill Size
(Bbl) Number of
Spills Total Crude
Oil Production(MMBbl)
Calculated Risk Rate
(Spills/MMBbl)
Approximate 95% Confidence Limits
(%±) ≥100 81 13,019 0.0062217 22 ≥500 16 13,019 0.0012290 50
≥1,000 7 13,019 0.0005377 76 ≥10,000 1 13,019 0.0000768 200
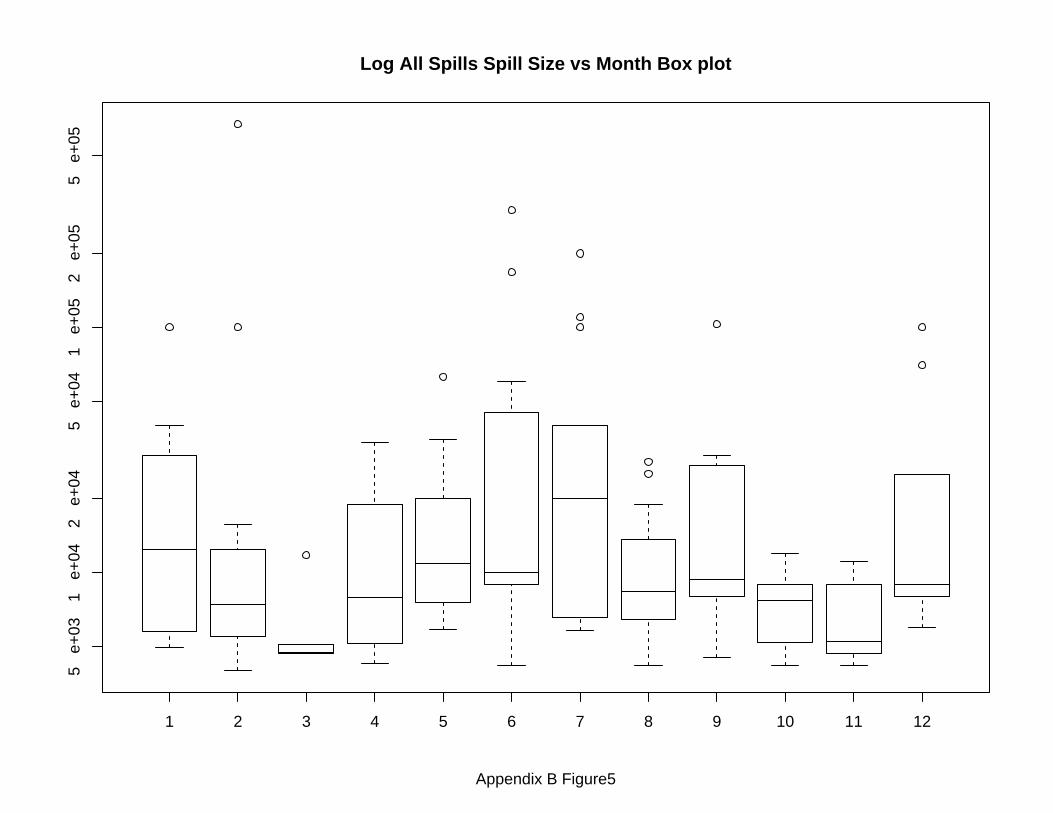
1 2 3 4 5 6 7 8 9 10 11 12
5 e
+03
1 e
+04
2 e
+04
5 e
+04
1 e
+05
2 e
+05
5 e
+05
Log All Spills Spill Size vs Month Box plot
Appendix B Figure5
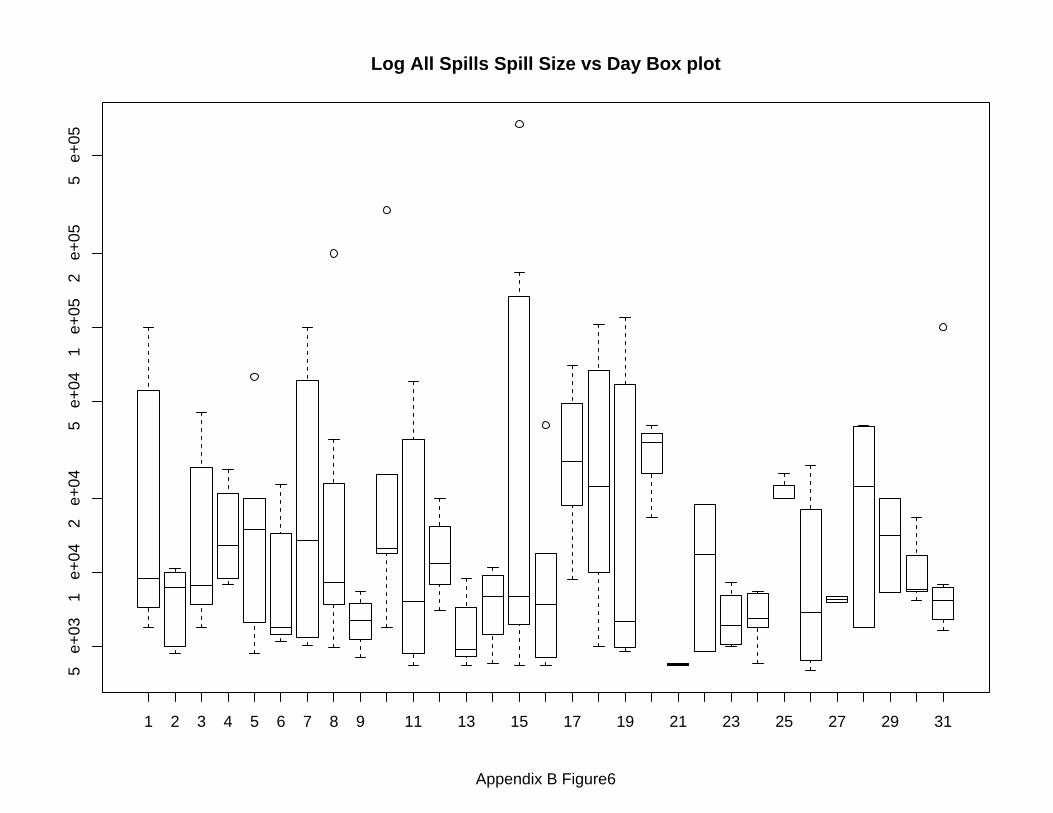
1 2 3 4 5 6 7 8 9 11 13 15 17 19 21 23 25 27 29 31
5 e
+03
1 e
+04
2 e
+04
5 e
+04
1 e
+05
2 e
+05
5 e
+05
Log All Spills Spill Size vs Day Box plot
Appendix B Figure6
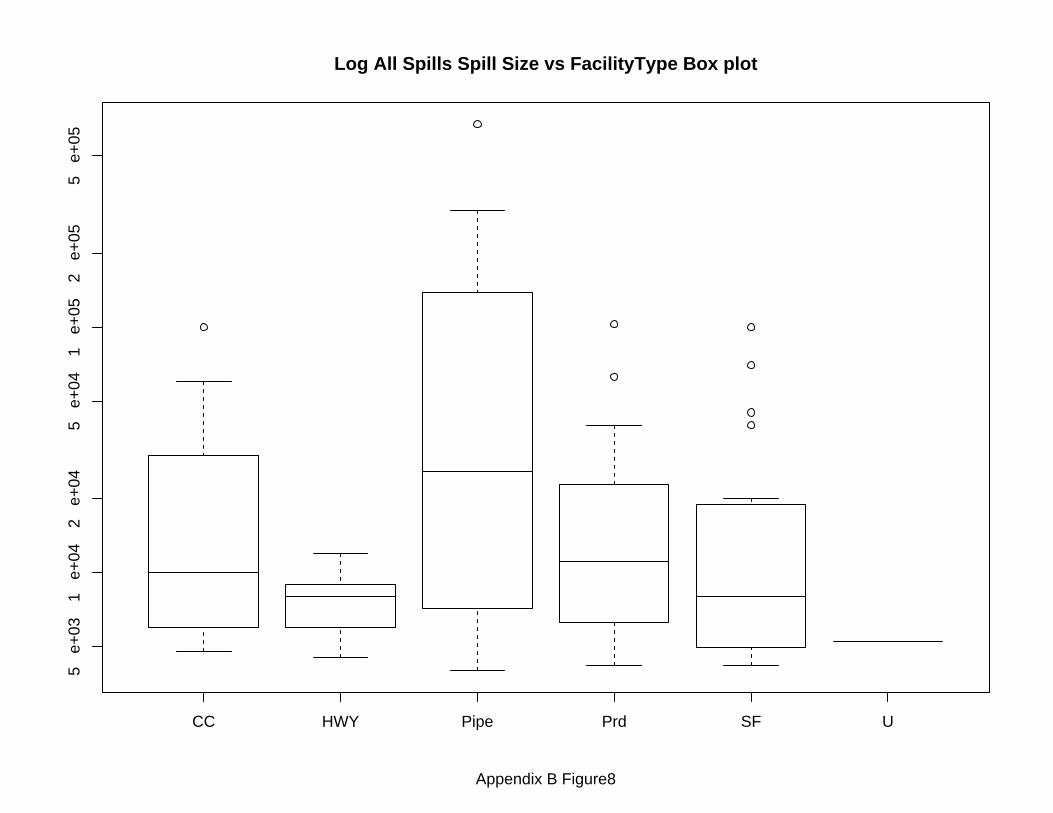
CC HWY Pipe Prd SF U
5 e
+03
1 e
+04
2 e
+04
5 e
+04
1 e
+05
2 e
+05
5 e
+05
Log All Spills Spill Size vs FacilityType Box plot
Appendix B Figure8
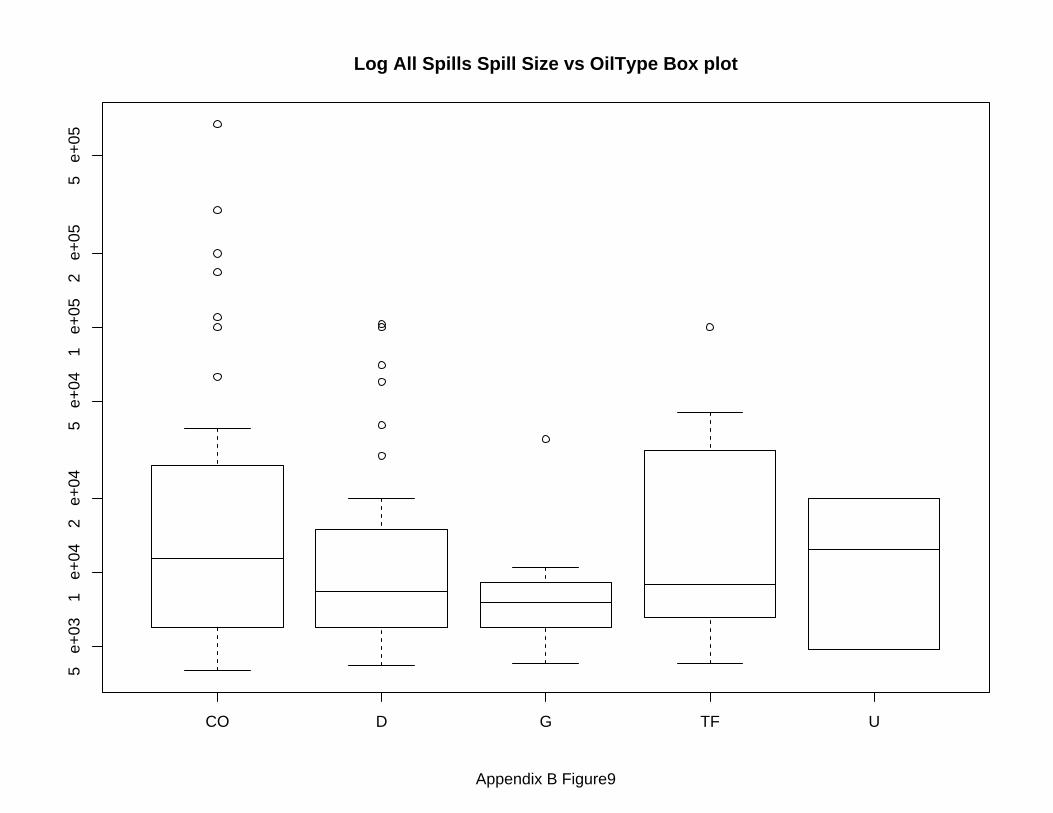
CO D G TF U
5 e
+03
1 e
+04
2 e
+04
5 e
+04
1 e
+05
2 e
+05
5 e
+05
Log All Spills Spill Size vs OilType Box plot
Appendix B Figure9
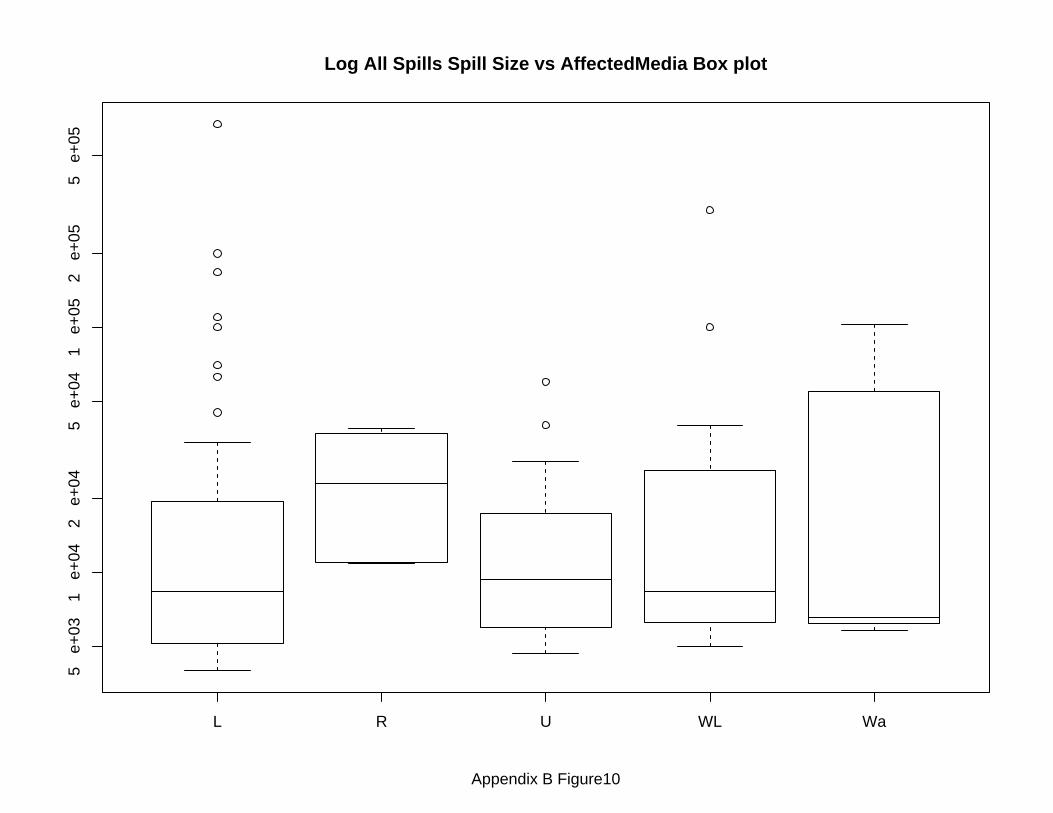
L R U WL Wa
5 e
+03
1 e
+04
2 e
+04
5 e
+04
1 e
+05
2 e
+05
5 e
+05
Log All Spills Spill Size vs AffectedMedia Box plot
Appendix B Figure10
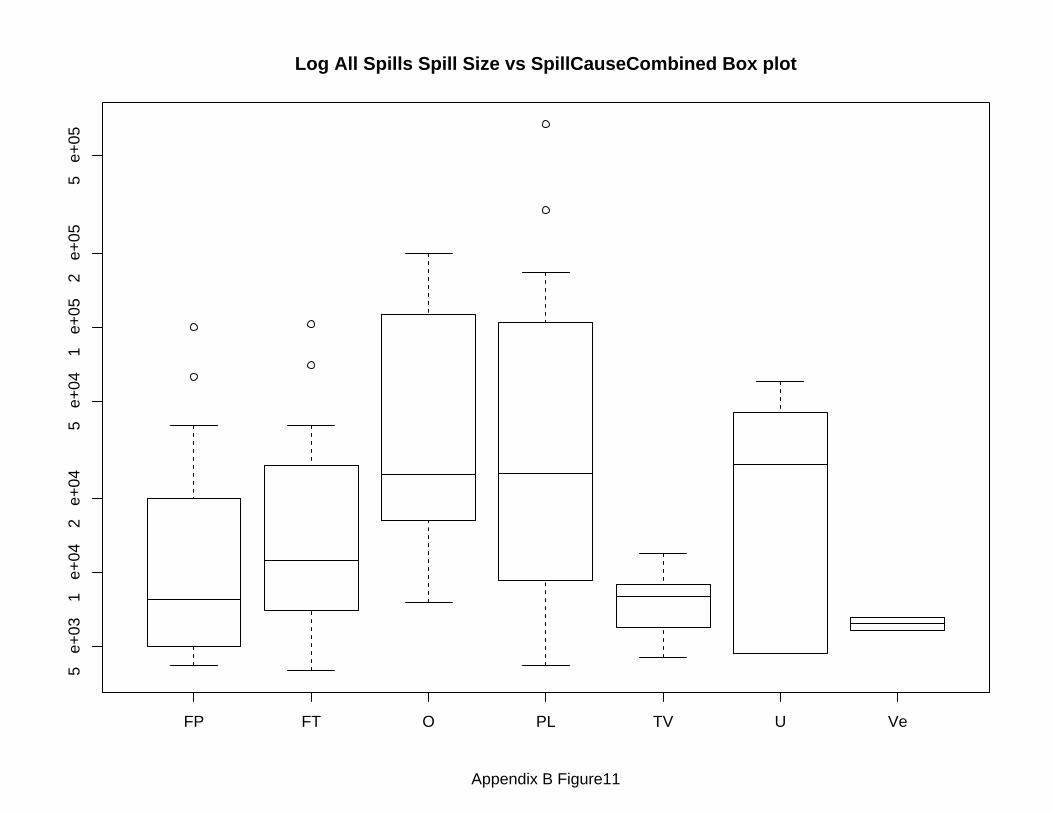
FP FT O PL TV U Ve
5 e
+03
1 e
+04
2 e
+04
5 e
+04
1 e
+05
2 e
+05
5 e
+05
Log All Spills Spill Size vs SpillCauseCombined Box plot
Appendix B Figure11