Embed Size (px)
Citation preview
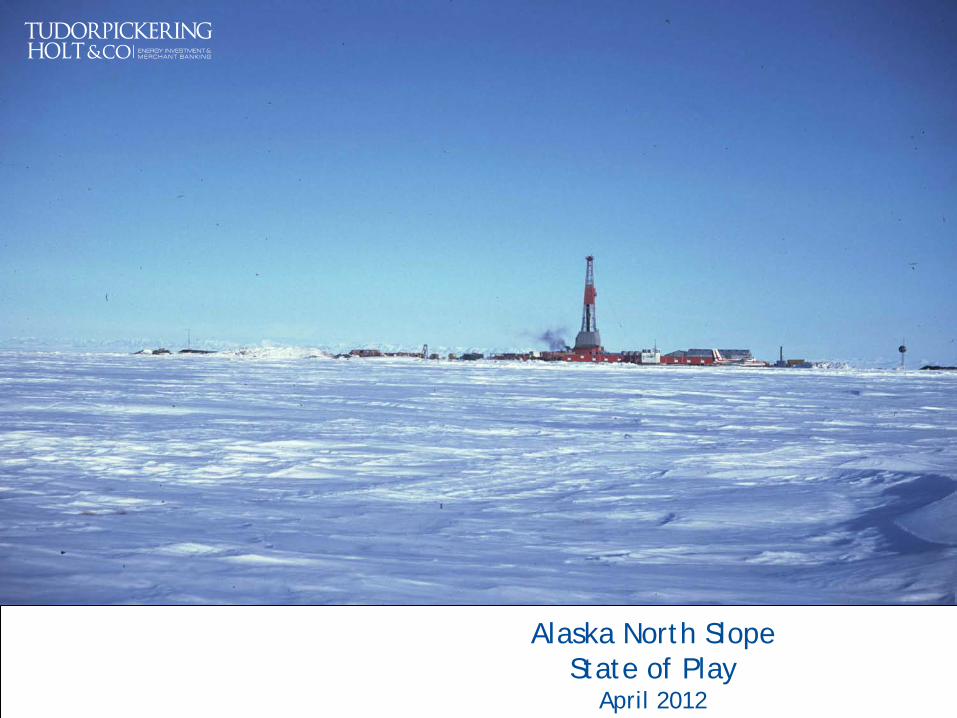
Alaska North Slope State of Play
April 2012
Agenda
Introduction I Background II Arrival of the Independents III Typical Field Considerations IV Conclusions V
2
As new technologies and operations enhance the economics E&P companies are increasingly looking to the Arctic region to search for new oil and gas reserves. This
book reviews the state of play on the Alaska North Slope for new Entrants
I - Introduction
3
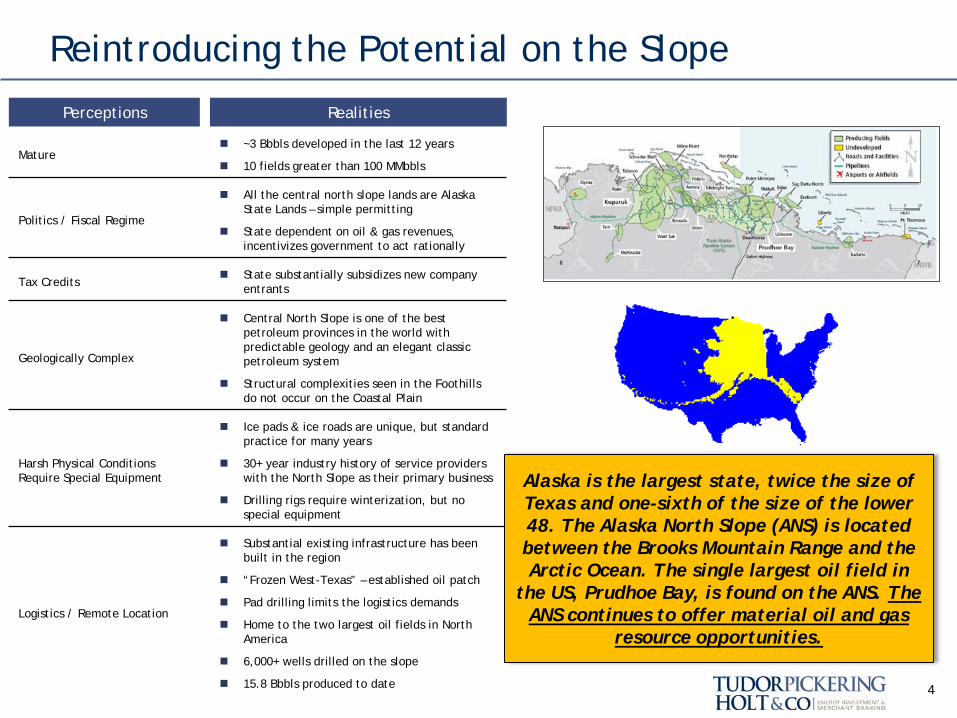
Reintroducing the Potential on the Slope
4
Perceptions Realities
Mature ~3 Bbbls developed in the last 12 years
10 fields greater than 100 MMbbls
Politics / Fiscal Regime
All the central north slope lands are Alaska State Lands – simple permitting
State dependent on oil & gas revenues, incentivizes government to act rationally
Tax Credits State substantially subsidizes new company
entrants
Geologically Complex
Central North Slope is one of the best petroleum provinces in the world with predictable geology and an elegant classic petroleum system
Structural complexities seen in the Foothills do not occur on the Coastal Plain
Harsh Physical Conditions Require Special Equipment
Ice pads & ice roads are unique, but standard practice for many years
30+ year industry history of service providers with the North Slope as their primary business
Drilling rigs require winterization, but no special equipment
Logistics / Remote Location
Substantial existing infrastructure has been built in the region
“Frozen West-Texas” – established oil patch
Pad drilling limits the logistics demands
Home to the two largest oil fields in North America
6,000+ wells drilled on the slope
15.8 Bbbls produced to date
Alaska is the largest state, twice the size of Texas and one-sixth of the size of the lower 48. The Alaska North Slope (ANS) is located between the Brooks Mountain Range and the Arctic Ocean. The single largest oil field in
the US, Prudhoe Bay, is found on the ANS. The ANS continues to offer material oil and gas
resource opportunities.
II - Background
5
The Context of 42 Years of ANS History
6
Petroleum potential was recognized as early as 1923 – surface oil pools. Exploration began in 1944
First oil discovered by ARCO at Prudhoe Bay 1968; Kuparuk was discovered in 1969 by Sinclair Oil
TAPS completed July 1977
North Slope oil Production peaked in 1988 at 2.01 mmbbls/d; Dec 2010 production 644 mbbls/d
Alpine was discovered in 1994 by ARCO
Exxon is moving forward with drilling and development activities at Pt. Thomson – production by YE 2014
In the 1970’s oil and gas production in the lower 48 entered a decline and the
discovery of oil at Prudhoe Bay offered significant domestic
supply on a world class – since then Alaska grew into the
nation’s most significant supply of domestic oil with two of the
largest oil fields in North America
Central North Slope expands with artificial gravel island fields – most recently Oooguruk, Nikaitchuq and Northstar
Independents arrive (AVCG/Armstrong initiates in early 2000)
Horizontal technology brought up from the lower 48 has a major impact
BP’s Milne Point CHOPS (“Cold Heavy Oil Production with Sand”) project starts up in 2010
Development underway at Pt. Thomson
Statute for royalty reduction for new projects
State provides substantial tax credits for projects
New leases being offered in previously closed areas: NPRA and some MMS lands
Activity Levels Remain Robust
7
Alaska North Slope fields
Alaska Oil & Gas Activity
Activity on the Slope
Active Wells
Permits
Reservoirs
Oooguruk
Nikaitchuq
A Region Historically Dominated by the Majors
8
Prudhoe Bay discovered in 1968 and subsequently developed by ARCO, BP, & Exxon
Alaska Development Charter in 1999 to improve competition
State agreed to BP-Arco merger with the condition of the sale of ARCO Alaska to Phillips in 2000
Conoco returns to the slope with their merger with Phillips in 2002
BP developed the first offshore field at Northstar, production begins in 2002
Exxon and other leaseholders have focused on the Point Thomson project – production expected in 2014
In 2008 Shell returned and dominated an Outer Continental Shelf lease sale with high bids totaling $2.1 billion
Strong desire to bring gas to Lower 48 – TransCanada/Exxon and BP/ConocoPhillips compete for the Alaska gas pipeline project
The North Slope operating environment has been historically dominated by the Majors, attributable to the huge capital costs required for infrastructure projects.
Influential events from the Majors
The North Slope’s Central Gas Facility is the largest gas handling facility in the world
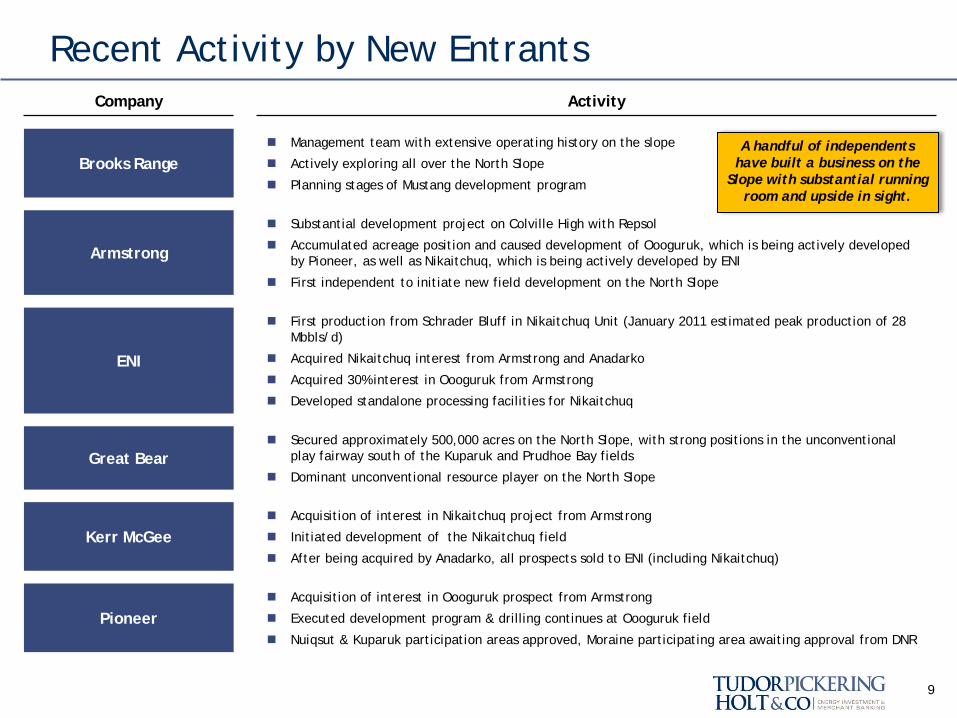
Recent Activity by New Entrants
9
Company Activity
Brooks Range Management team with extensive operating history on the slope
Actively exploring all over the North Slope
Planning stages of Mustang development program
Armstrong
Substantial development project on Colville High with Repsol
Accumulated acreage position and caused development of Oooguruk, which is being actively developed by Pioneer, as well as Nikaitchuq, which is being actively developed by ENI
First independent to initiate new field development on the North Slope
ENI
First production from Schrader Bluff in Nikaitchuq Unit (January 2011 estimated peak production of 28 Mbbls/d)
Acquired Nikaitchuq interest from Armstrong and Anadarko
Acquired 30% interest in Oooguruk from Armstrong
Developed standalone processing facilities for Nikaitchuq
Great Bear Secured approximately 500,000 acres on the North Slope, with strong positions in the unconventional
play fairway south of the Kuparuk and Prudhoe Bay fields
Dominant unconventional resource player on the North Slope
Kerr McGee Acquisition of interest in Nikaitchuq project from Armstrong
Initiated development of the Nikaitchuq field
After being acquired by Anadarko, all prospects sold to ENI (including Nikaitchuq)
Pioneer Acquisition of interest in Oooguruk prospect from Armstrong
Executed development program & drilling continues at Oooguruk field
Nuiqsut & Kuparuk participation areas approved, Moraine participating area awaiting approval from DNR
A handful of independents have built a business on the
Slope with substantial running room and upside in sight.
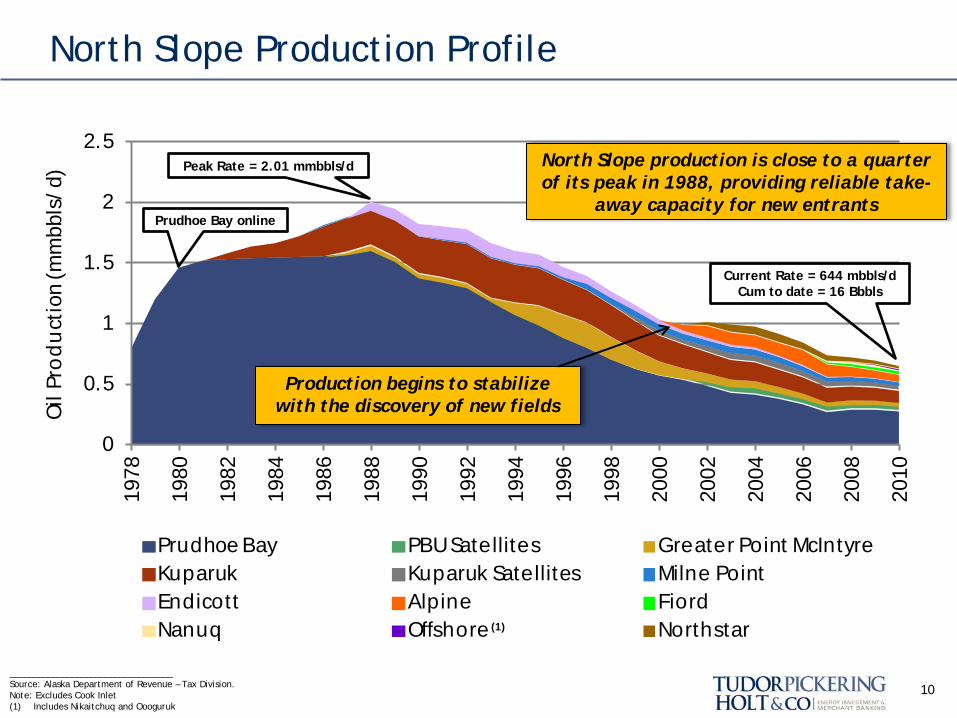
North Slope Production Profile
10
0
0.5
1
1.5
2
2.519
78
1980
1982
1984
1986
1988
1990
1992
1994
1996
1998
2000
2002
2004
2006
2008
2010
Oil
Pro
du
ctio
n (m
mbb
ls/d
)
Prudhoe Bay PBU Satellites Greater Point McIntyreKuparuk Kuparuk Satellites Milne PointEndicott Alpine FiordNanuq Offshore Northstar
North Slope production is close to a quarter of its peak in 1988, providing reliable take-
away capacity for new entrants
__________________________________ Source: Alaska Department of Revenue – Tax Division. Note: Excludes Cook Inlet (1) Includes Nikaitchuq and Oooguruk
Peak Rate = 2.01 mmbbls/d
Current Rate = 644 mbbls/d Cum to date = 16 Bbbls
Prudhoe Bay online
Production begins to stabilize with the discovery of new fields
(1)
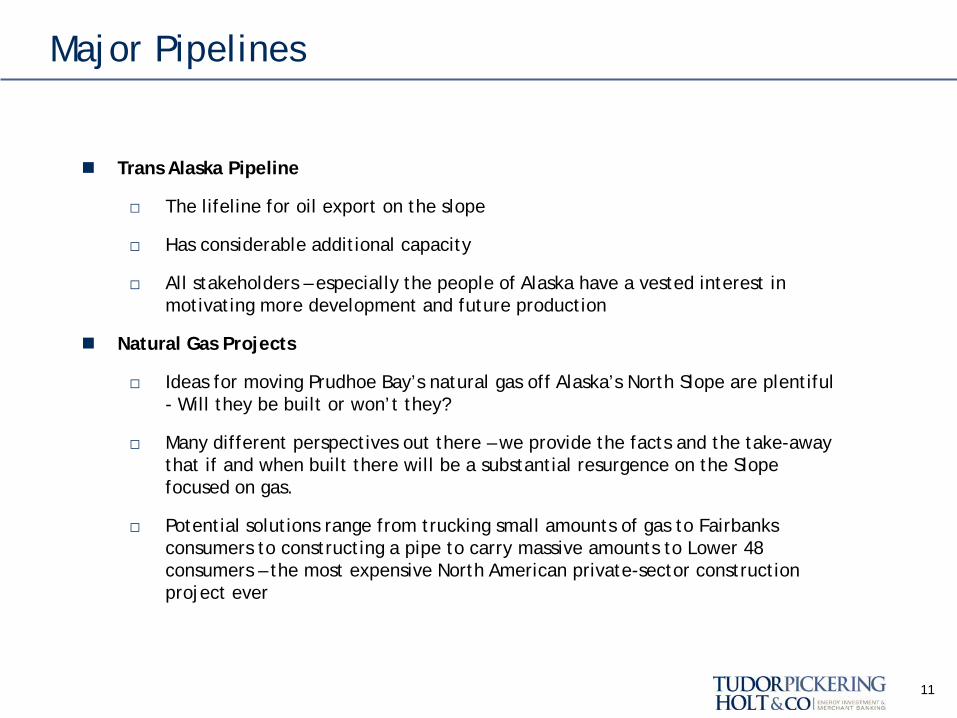
Major Pipelines
11
Trans Alaska Pipeline
□ The lifeline for oil export on the slope
□ Has considerable additional capacity
□ All stakeholders – especially the people of Alaska have a vested interest in motivating more development and future production
Natural Gas Projects
□ Ideas for moving Prudhoe Bay’s natural gas off Alaska’s North Slope are plentiful - Will they be built or won’t they?
□ Many different perspectives out there – we provide the facts and the take-away that if and when built there will be a substantial resurgence on the Slope focused on gas.
□ Potential solutions range from trucking small amounts of gas to Fairbanks consumers to constructing a pipe to carry massive amounts to Lower 48 consumers – the most expensive North American private-sector construction project ever
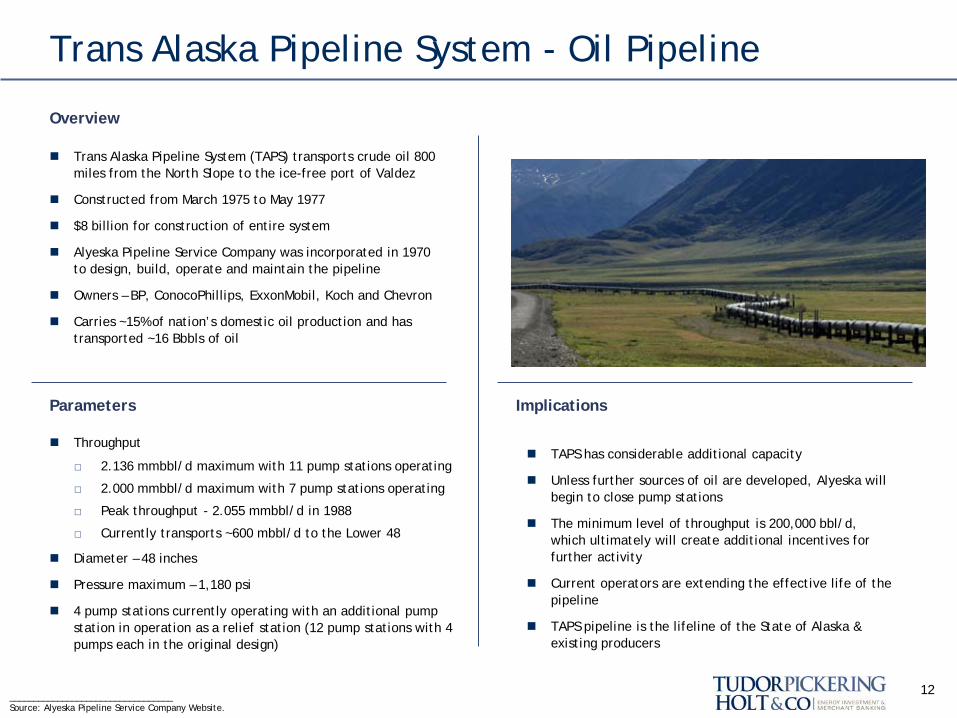
Trans Alaska Pipeline System - Oil Pipeline
Trans Alaska Pipeline System (TAPS) transports crude oil 800 miles from the North Slope to the ice-free port of Valdez
Constructed from March 1975 to May 1977
$8 billion for construction of entire system
Alyeska Pipeline Service Company was incorporated in 1970 to design, build, operate and maintain the pipeline
Owners – BP, ConocoPhillips, ExxonMobil, Koch and Chevron
Carries ~15% of nation’s domestic oil production and has transported ~16 Bbbls of oil
Overview
Throughput
□ 2.136 mmbbl/d maximum with 11 pump stations operating
□ 2.000 mmbbl/d maximum with 7 pump stations operating
□ Peak throughput - 2.055 mmbbl/d in 1988
□ Currently transports ~600 mbbl/d to the Lower 48
Diameter – 48 inches
Pressure maximum – 1,180 psi
4 pump stations currently operating with an additional pump station in operation as a relief station (12 pump stations with 4 pumps each in the original design)
TAPS has considerable additional capacity
Unless further sources of oil are developed, Alyeska will begin to close pump stations
The minimum level of throughput is 200,000 bbl/d, which ultimately will create additional incentives for further activity
Current operators are extending the effective life of the pipeline
TAPS pipeline is the lifeline of the State of Alaska & existing producers
Parameters
12 __________________________________ Source: Alyeska Pipeline Service Company Website.
Implications
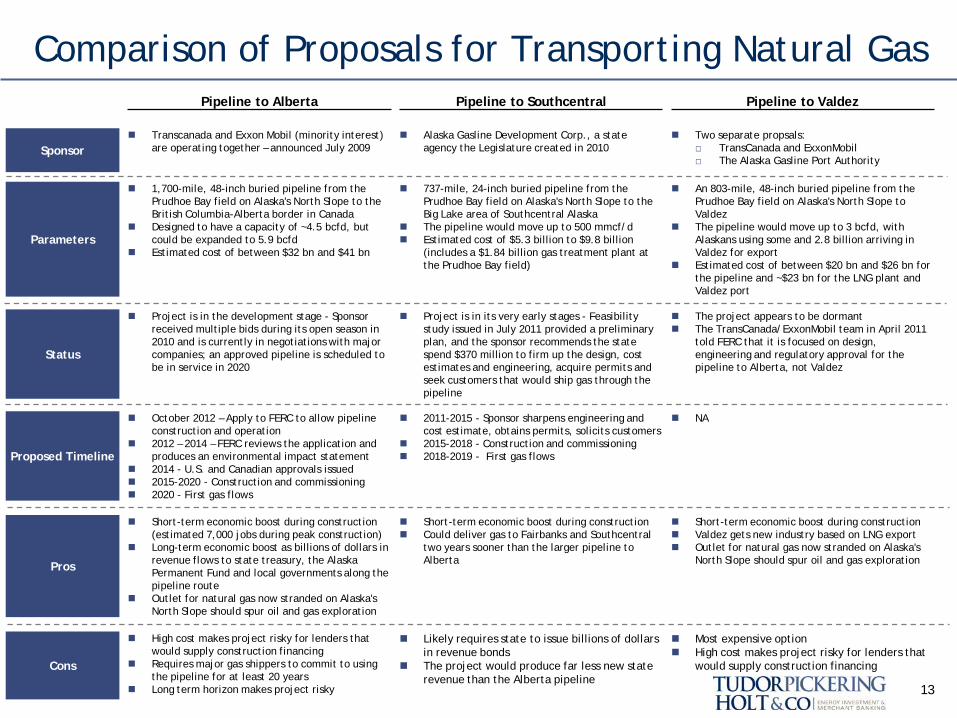
Pipeline to Alberta Pipeline to Southcentral Pipeline to Valdez
Sponsor Transcanada and Exxon Mobil (minority interest)
are operating together – announced July 2009 Alaska Gasline Development Corp., a state
agency the Legislature created in 2010 Two separate propsals:
□ TransCanada and ExxonMobil □ The Alaska Gasline Port Authority
Parameters
1,700-mile, 48-inch buried pipeline from the Prudhoe Bay field on Alaska's North Slope to the British Columbia-Alberta border in Canada
Designed to have a capacity of ~4.5 bcfd, but could be expanded to 5.9 bcfd
Estimated cost of between $32 bn and $41 bn
737-mile, 24-inch buried pipeline from the Prudhoe Bay field on Alaska's North Slope to the Big Lake area of Southcentral Alaska
The pipeline would move up to 500 mmcf/d Estimated cost of $5.3 billion to $9.8 billion
(includes a $1.84 billion gas treatment plant at the Prudhoe Bay field)
An 803-mile, 48-inch buried pipeline from the Prudhoe Bay field on Alaska's North Slope to Valdez
The pipeline would move up to 3 bcfd, with Alaskans using some and 2.8 billion arriving in Valdez for export
Estimated cost of between $20 bn and $26 bn for the pipeline and ~$23 bn for the LNG plant and Valdez port
Status
Project is in the development stage - Sponsor received multiple bids during its open season in 2010 and is currently in negotiations with major companies; an approved pipeline is scheduled to be in service in 2020
Project is in its very early stages - Feasibility study issued in July 2011 provided a preliminary plan, and the sponsor recommends the state spend $370 million to firm up the design, cost estimates and engineering, acquire permits and seek customers that would ship gas through the pipeline
The project appears to be dormant The TransCanada/ExxonMobil team in April 2011
told FERC that it is focused on design, engineering and regulatory approval for the pipeline to Alberta, not Valdez
Proposed Timeline
October 2012 – Apply to FERC to allow pipeline construction and operation
2012 – 2014 – FERC reviews the application and produces an environmental impact statement
2014 - U.S. and Canadian approvals issued 2015-2020 - Construction and commissioning 2020 - First gas flows
2011-2015 - Sponsor sharpens engineering and cost estimate, obtains permits, solicits customers
2015-2018 - Construction and commissioning 2018-2019 - First gas flows
NA
Pros
Short-term economic boost during construction (estimated 7,000 jobs during peak construction)
Long-term economic boost as billions of dollars in revenue flows to state treasury, the Alaska Permanent Fund and local governments along the pipeline route
Outlet for natural gas now stranded on Alaska's North Slope should spur oil and gas exploration
Short-term economic boost during construction Could deliver gas to Fairbanks and Southcentral
two years sooner than the larger pipeline to Alberta
Short-term economic boost during construction Valdez gets new industry based on LNG export Outlet for natural gas now stranded on Alaska's
North Slope should spur oil and gas exploration
Cons
High cost makes project risky for lenders that would supply construction financing
Requires major gas shippers to commit to using the pipeline for at least 20 years
Long term horizon makes project risky
Likely requires state to issue billions of dollars in revenue bonds
The project would produce far less new state revenue than the Alberta pipeline
Most expensive option High cost makes project risky for lenders that
would supply construction financing
13
Comparison of Proposals for Transporting Natural Gas
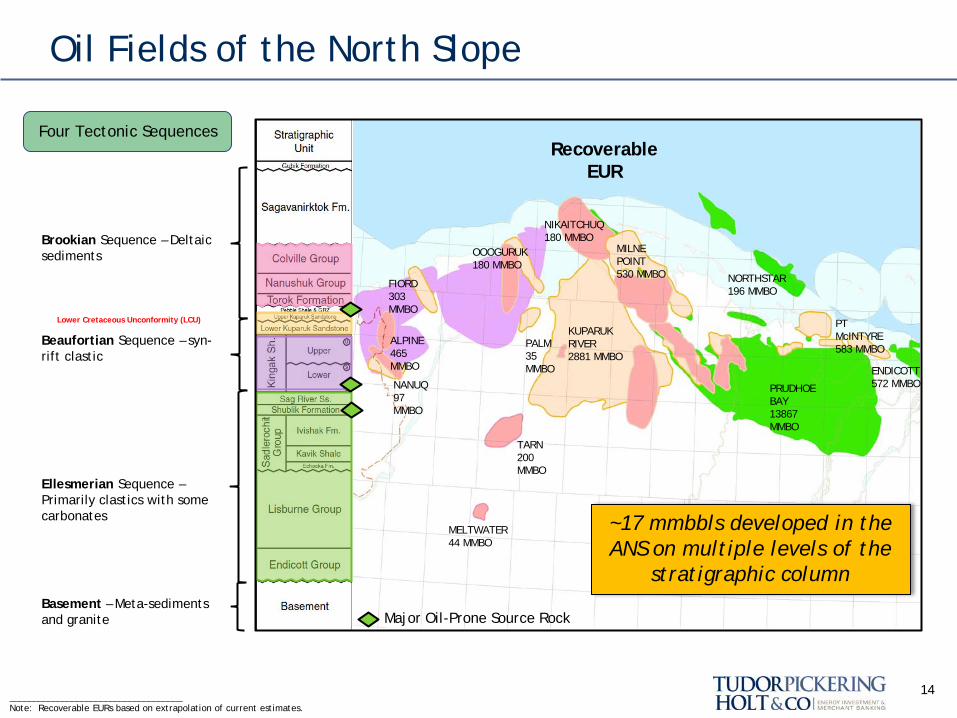
Oil Fields of the North Slope
14
FIORD 303 MMBO
ALPINE 465 MMBO
NANUQ 97 MMBO
OOOGURUK 180 MMBO
MELTWATER 44 MMBO
TARN 200 MMBO
PALM 35 MMBO
KUPARUK RIVER 2881 MMBO
MILNE POINT 530 MMBO NORTHSTAR
196 MMBO
PRUDHOE BAY 13867 MMBO
PT McINTYRE 583 MMBO
ENDICOTT 572 MMBO
NIKAITCHUQ 180 MMBO
Major Oil-Prone Source Rock
~17 mmbbls developed in the ANS on multiple levels of the
stratigraphic column
Recoverable EUR
____________________________________ Note: Recoverable EURs based on extrapolation of current estimates.
Four Tectonic Sequences
Basement – Meta-sediments and granite
Ellesmerian Sequence – Primarily clastics with some carbonates
Beaufortian Sequence – syn-rift clastic
Lower Cretaceous Unconformity (LCU)
Brookian Sequence – Deltaic sediments
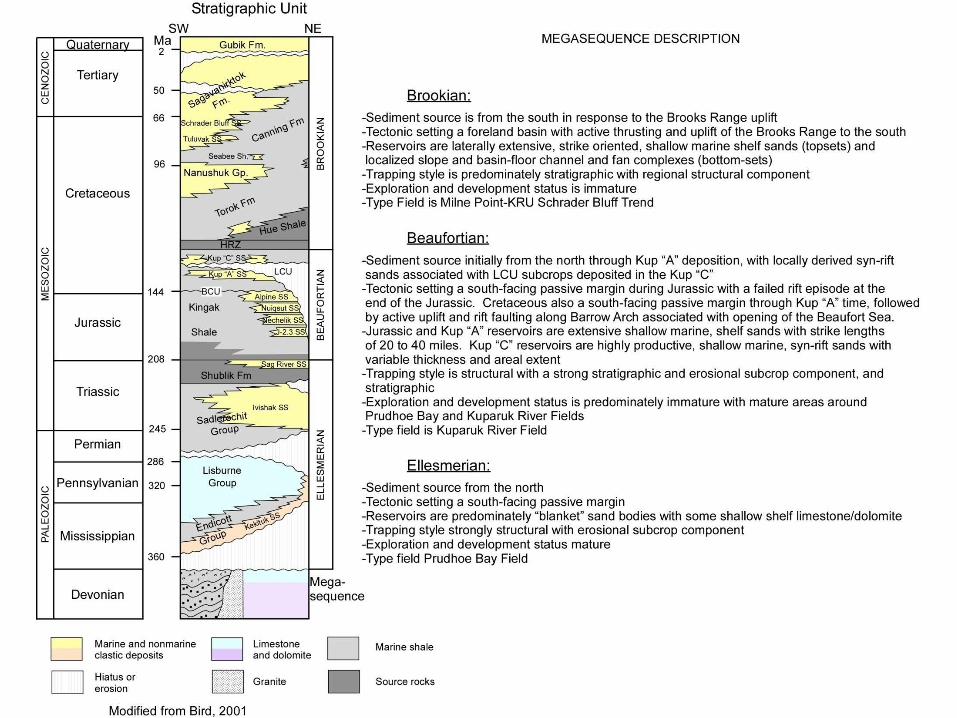
North Slope Geology
16
Oil and gas trapped along the Barrow Arch in both pre and post LCU sand bodies
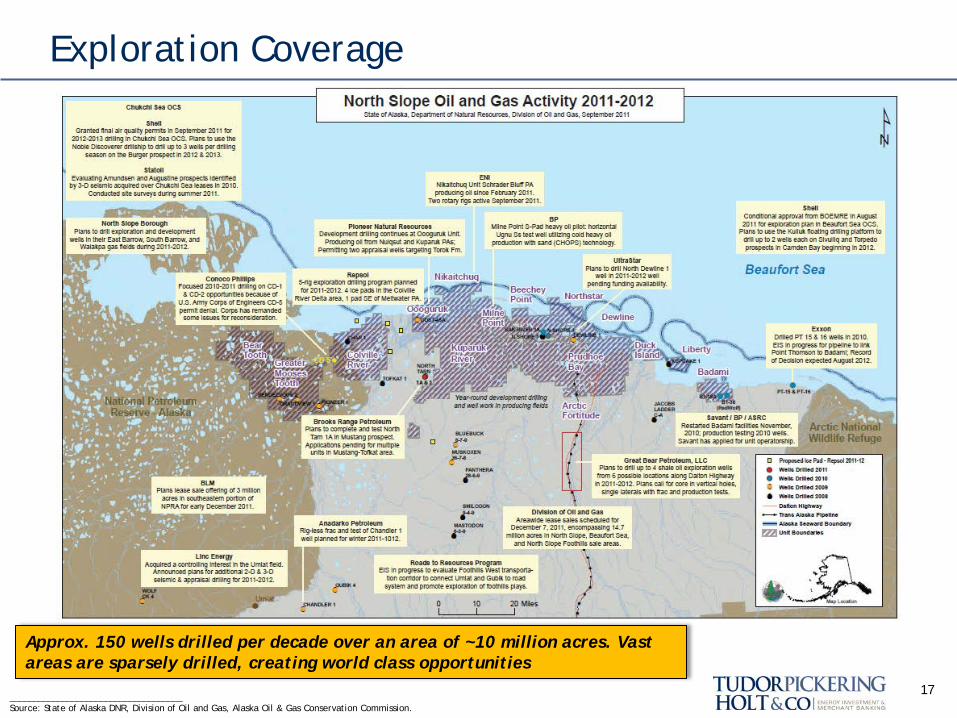
Exploration Coverage
17 ____________________________________ Source: State of Alaska DNR, Division of Oil and Gas, Alaska Oil & Gas Conservation Commission.
Approx. 150 wells drilled per decade over an area of ~10 million acres. Vast areas are sparsely drilled, creating world class opportunities
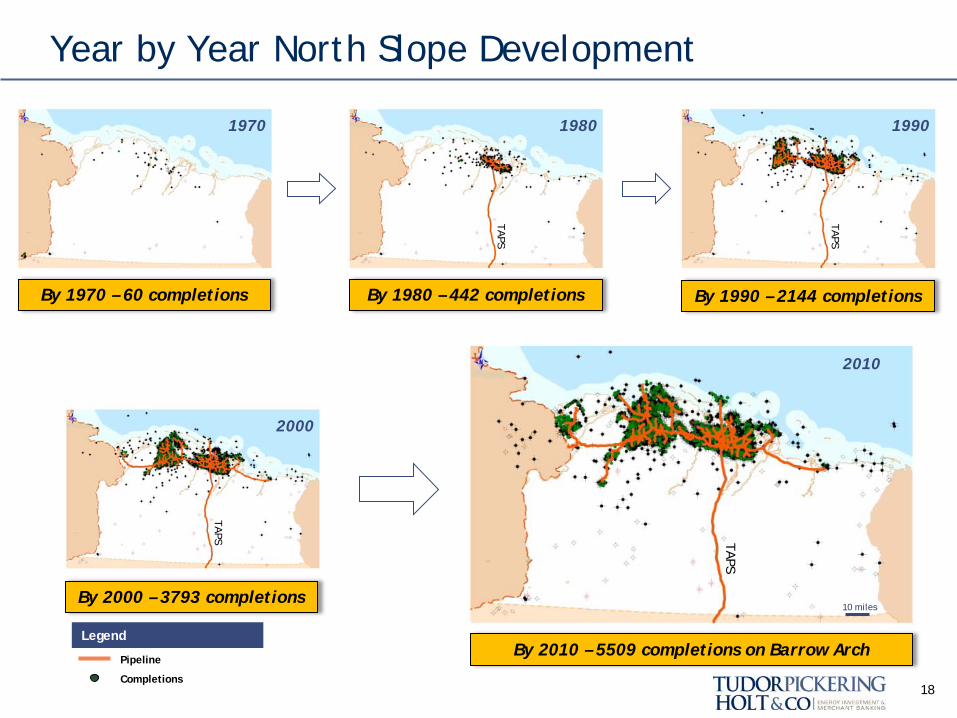
Year by Year North Slope Development
18
2010
2000
1990 1980 1970
By 1970 – 60 completions By 1980 – 442 completions By 1990 – 2144 completions
By 2000 – 3793 completions
By 2010 – 5509 completions on Barrow Arch
10 miles
TAPS
TAPS
TAPS
TAPS
Pipeline
Completions
Legend
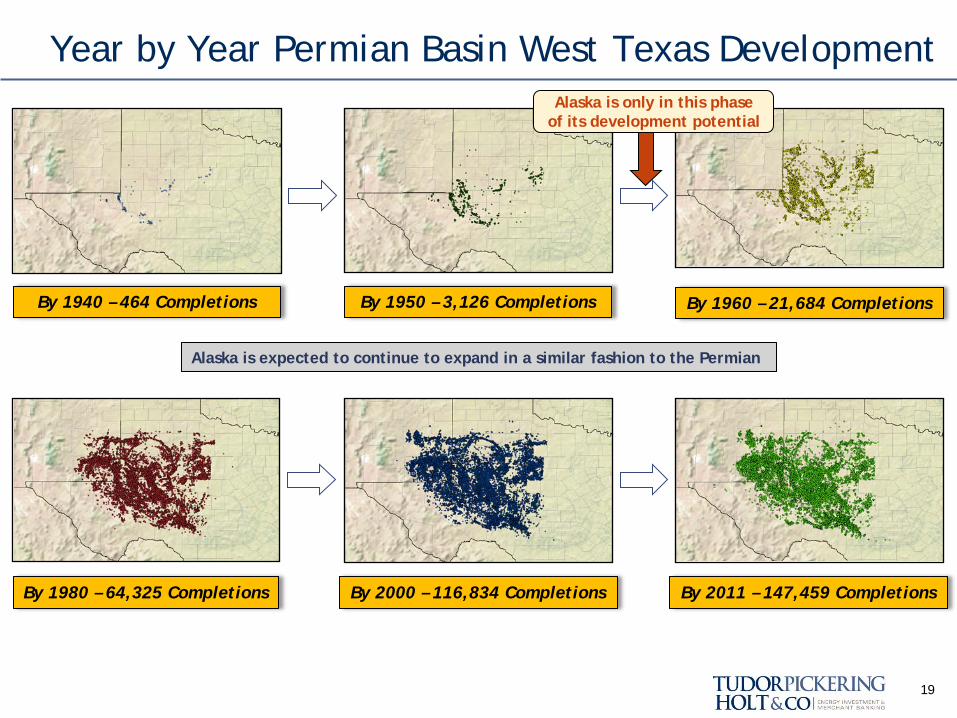
Year by Year Permian Basin West Texas Development
19
By 1940 – 464 Completions By 1950 – 3,126 Completions By 1960 – 21,684 Completions
By 1980 – 64,325 Completions By 2000 – 116,834 Completions By 2011 – 147,459 Completions
Alaska is expected to continue to expand in a similar fashion to the Permian
Alaska is only in this phase of its development potential
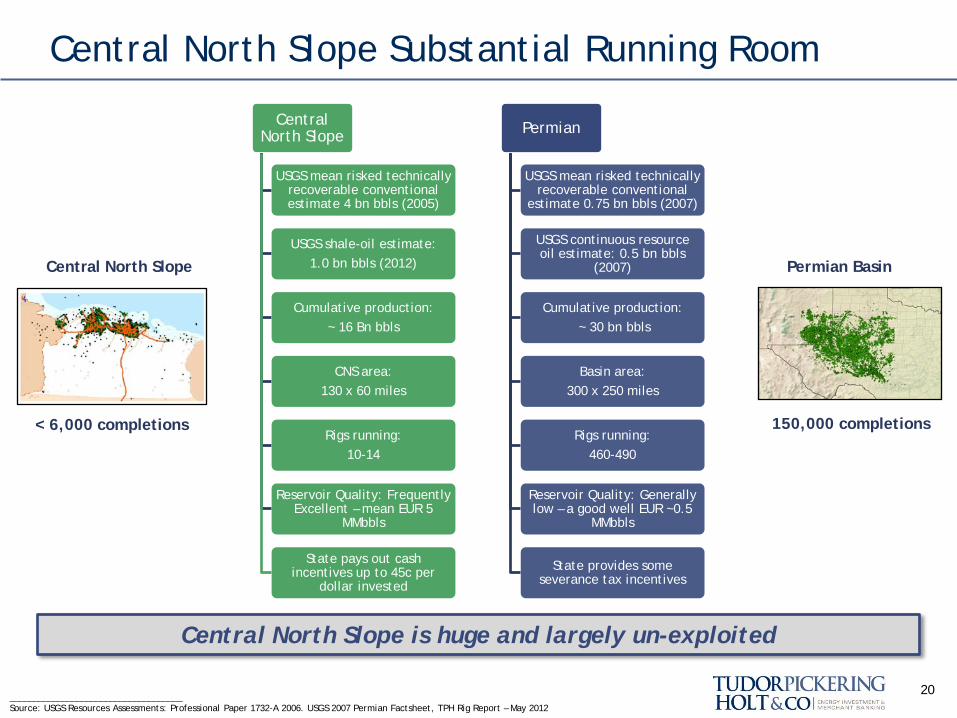
Central North Slope Substantial Running Room
20 ____________________________________ Source: USGS Resources Assessments: Professional Paper 1732-A 2006. USGS 2007 Permian Factsheet, TPH Rig Report – May 2012
Central North Slope
USGS mean risked technically recoverable conventional estimate 4 bn bbls (2005)
USGS shale-oil estimate: 1.0 bn bbls (2012)
Cumulative production: ~ 16 Bn bbls
CNS area: 130 x 60 miles
Rigs running: 10-14
Reservoir Quality: Frequently Excellent – mean EUR 5
MMbbls
State pays out cash incentives up to 45c per
dollar invested
Permian
USGS mean risked technically recoverable conventional
estimate 0.75 bn bbls (2007)
USGS continuous resource oil estimate: 0.5 bn bbls
(2007)
Cumulative production: ~ 30 bn bbls
Basin area: 300 x 250 miles
Rigs running: 460-490
Reservoir Quality: Generally low – a good well EUR ~0.5
MMbbls
State provides some severance tax incentives
150,000 completions
Permian Basin
< 6,000 completions
Central North Slope
Central North Slope is huge and largely un-exploited
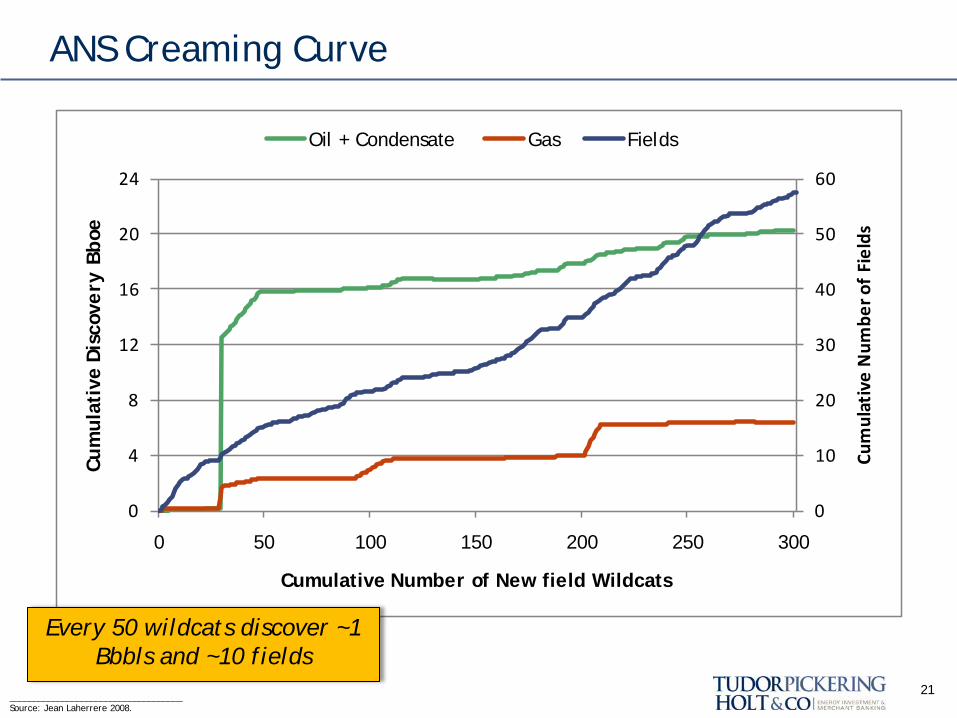
ANS Creaming Curve
21
0
10
20
30
40
50
60
0
4
8
12
16
20
24
0 50 100 150 200 250 300
Cum
ulat
ive
Num
ber o
f Fie
lds
Cum
ulat
ive
Disc
over
y Bb
oe
Cumulative Number of New field Wildcats
Oil + Condensate Gas Fields
Every 50 wildcats discover ~1 Bbbls and ~10 fields
____________________________________ Source: Jean Laherrere 2008.
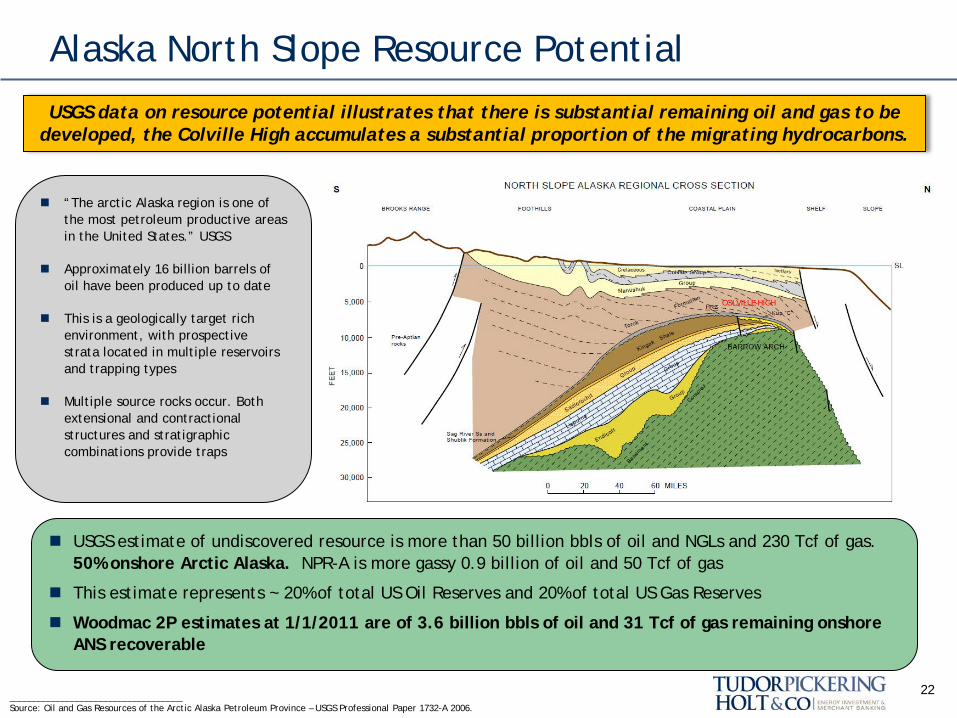
Alaska North Slope Resource Potential
22
“The arctic Alaska region is one of the most petroleum productive areas in the United States.” USGS
Approximately 16 billion barrels of oil have been produced up to date
This is a geologically target rich environment, with prospective strata located in multiple reservoirs and trapping types
Multiple source rocks occur. Both extensional and contractional structures and stratigraphic combinations provide traps
USGS data on resource potential illustrates that there is substantial remaining oil and gas to be developed, the Colville High accumulates a substantial proportion of the migrating hydrocarbons.
____________________________________ Source: Oil and Gas Resources of the Arctic Alaska Petroleum Province – USGS Professional Paper 1732-A 2006.
USGS estimate of undiscovered resource is more than 50 billion bbls of oil and NGLs and 230 Tcf of gas. 50% onshore Arctic Alaska. NPR-A is more gassy 0.9 billion of oil and 50 Tcf of gas
This estimate represents ~ 20% of total US Oil Reserves and 20% of total US Gas Reserves
Woodmac 2P estimates at 1/1/2011 are of 3.6 billion bbls of oil and 31 Tcf of gas remaining onshore ANS recoverable
COLVILLE HIGH
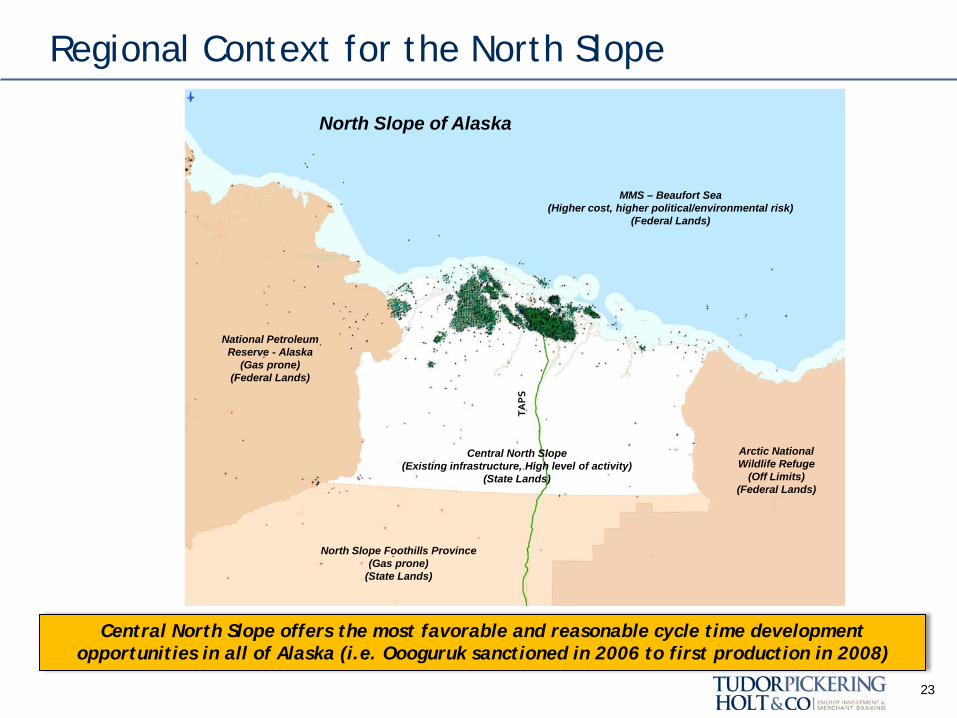
Regional Context for the North Slope
23
MMS – Beaufort Sea (Higher cost, higher political/environmental risk)
(Federal Lands)
North Slope Foothills Province (Gas prone)
(State Lands)
National Petroleum Reserve - Alaska
(Gas prone) (Federal Lands)
Arctic National Wildlife Refuge
(Off Limits) (Federal Lands)
TAP
S
North Slope of Alaska
Central North Slope (Existing infrastructure, High level of activity)
(State Lands)
Central North Slope offers the most favorable and reasonable cycle time development opportunities in all of Alaska (i.e. Oooguruk sanctioned in 2006 to first production in 2008)
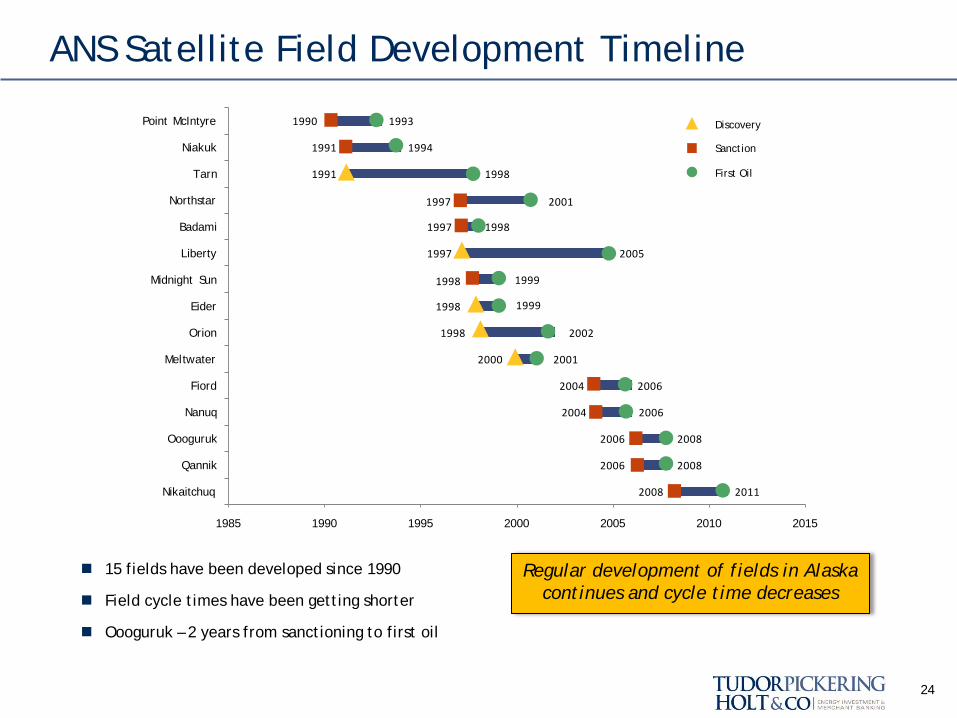
ANS Satellite Field Development Timeline
2011
2008
2008
2006
2006
2001
2002
1999
1999
2005
1998
2001
1998
1994
1993
2008
2006
2006
2004
2004
2000
1998
1998
1998
1997
1997
1997
1991
1991
1990
1985 1990 1995 2000 2005 2010 2015
Nikaitchuq
Qannik
Oooguruk
Nanuq
Fiord
Meltwater
Orion
Eider
Midnight Sun
Liberty
Badami
Northstar
Tarn
Niakuk
Point McIntyre Discovery
Sanction
First Oil
15 fields have been developed since 1990
Field cycle times have been getting shorter
Oooguruk – 2 years from sanctioning to first oil
Regular development of fields in Alaska continues and cycle time decreases
24
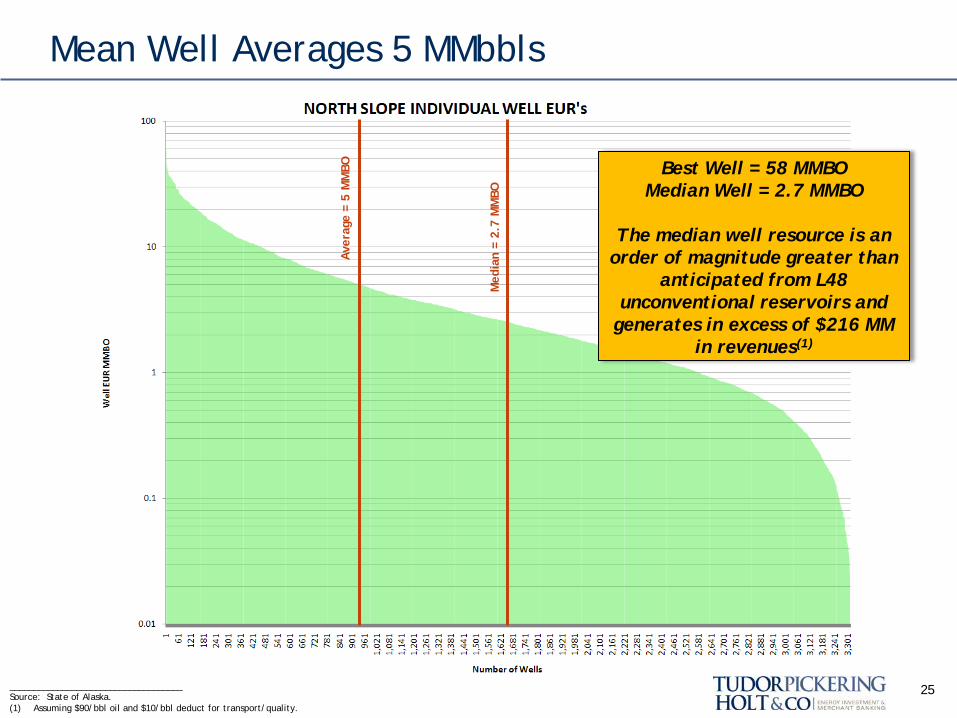
Mean Well Averages 5 MMbbls
25
Best Well = 58 MMBO Median Well = 2.7 MMBO
The median well resource is an
order of magnitude greater than anticipated from L48
unconventional reservoirs and generates in excess of $216 MM
in revenues(1) A
vera
ge =
5 M
MBO
Med
ian
= 2.
7 M
MBO
____________________________________ Source: State of Alaska. (1) Assuming $90/bbl oil and $10/bbl deduct for transport/quality.
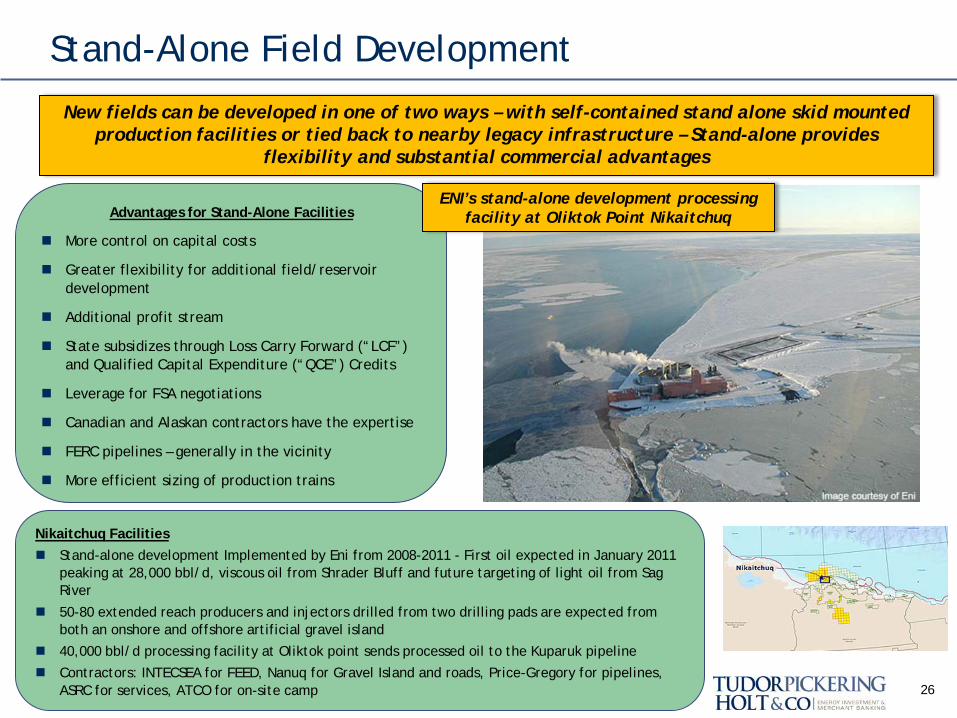
Stand-Alone Field Development
26
Advantages for Stand-Alone Facilities
More control on capital costs
Greater flexibility for additional field/reservoir development
Additional profit stream
State subsidizes through Loss Carry Forward (“LCF”) and Qualified Capital Expenditure (“QCE”) Credits
Leverage for FSA negotiations
Canadian and Alaskan contractors have the expertise
FERC pipelines – generally in the vicinity
More efficient sizing of production trains
New fields can be developed in one of two ways – with self-contained stand alone skid mounted production facilities or tied back to nearby legacy infrastructure – Stand-alone provides
flexibility and substantial commercial advantages
ENI’s stand-alone development processing facility at Oliktok Point Nikaitchuq
Nikaitchuq Facilities Stand-alone development Implemented by Eni from 2008-2011 - First oil expected in January 2011
peaking at 28,000 bbl/d, viscous oil from Shrader Bluff and future targeting of light oil from Sag River
50-80 extended reach producers and injectors drilled from two drilling pads are expected from both an onshore and offshore artificial gravel island
40,000 bbl/d processing facility at Oliktok point sends processed oil to the Kuparuk pipeline
Contractors: INTECSEA for FEED, Nanuq for Gravel Island and roads, Price-Gregory for pipelines, ASRC for services, ATCO for on-site camp
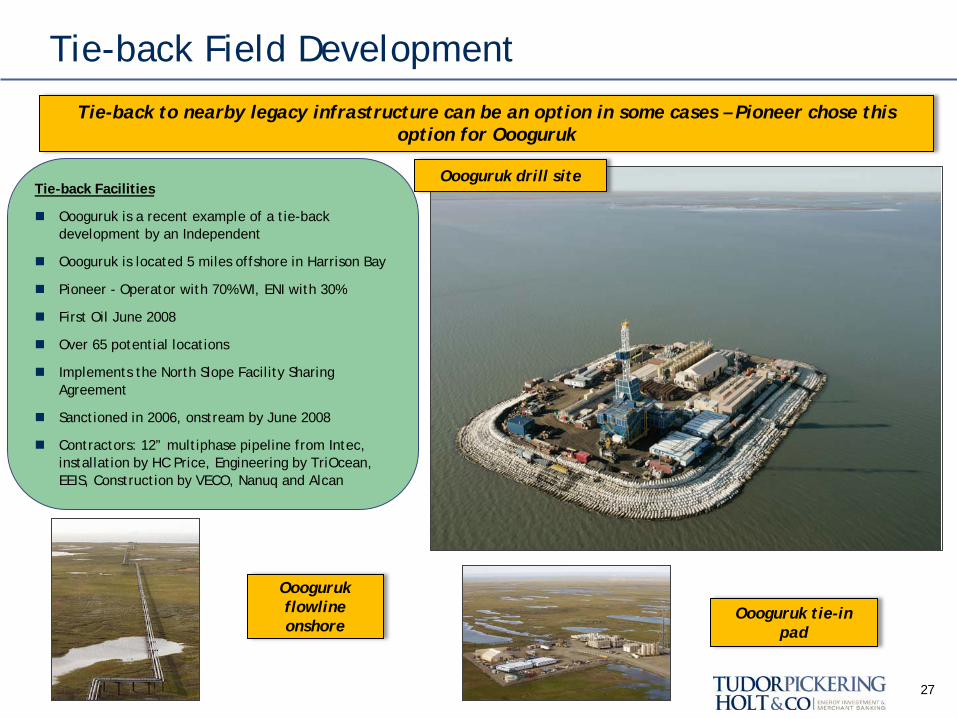
Tie-back Field Development
27
Tie-back Facilities
Oooguruk is a recent example of a tie-back development by an Independent
Oooguruk is located 5 miles offshore in Harrison Bay
Pioneer - Operator with 70% WI, ENI with 30%
First Oil June 2008
Over 65 potential locations
Implements the North Slope Facility Sharing Agreement
Sanctioned in 2006, onstream by June 2008
Contractors: 12” multiphase pipeline from Intec, installation by HC Price, Engineering by TriOcean, EEIS, Construction by VECO, Nanuq and Alcan
Tie-back to nearby legacy infrastructure can be an option in some cases – Pioneer chose this option for Oooguruk
Oooguruk flowline onshore
Oooguruk tie-in pad
Oooguruk drill site
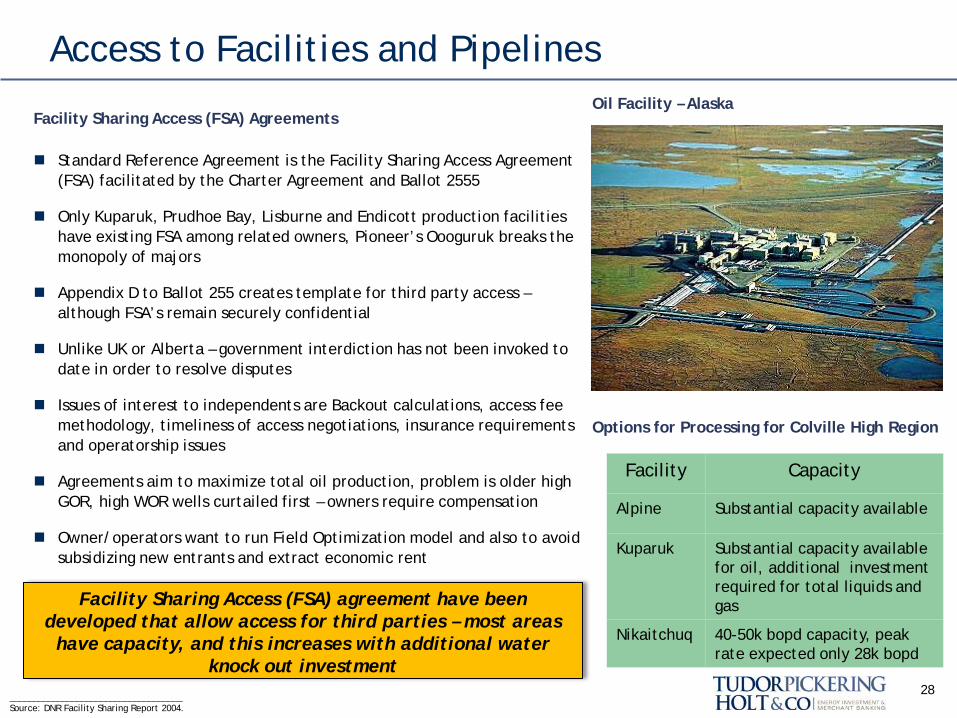
Access to Facilities and Pipelines
28
Standard Reference Agreement is the Facility Sharing Access Agreement (FSA) facilitated by the Charter Agreement and Ballot 2555
Only Kuparuk, Prudhoe Bay, Lisburne and Endicott production facilities have existing FSA among related owners, Pioneer’s Oooguruk breaks the monopoly of majors
Appendix D to Ballot 255 creates template for third party access – although FSA’s remain securely confidential
Unlike UK or Alberta – government interdiction has not been invoked to date in order to resolve disputes
Issues of interest to independents are Backout calculations, access fee methodology, timeliness of access negotiations, insurance requirements and operatorship issues
Agreements aim to maximize total oil production, problem is older high GOR, high WOR wells curtailed first – owners require compensation
Owner/operators want to run Field Optimization model and also to avoid subsidizing new entrants and extract economic rent
Facility Sharing Access (FSA) agreement have been developed that allow access for third parties – most areas
have capacity, and this increases with additional water knock out investment
Facility Capacity
Alpine Substantial capacity available
Kuparuk Substantial capacity available for oil, additional investment required for total liquids and gas
Nikaitchuq 40-50k bopd capacity, peak rate expected only 28k bopd
____________________________________ Source: DNR Facility Sharing Report 2004.
Options for Processing for Colville High Region
Facility Sharing Access (FSA) Agreements Oil Facility – Alaska
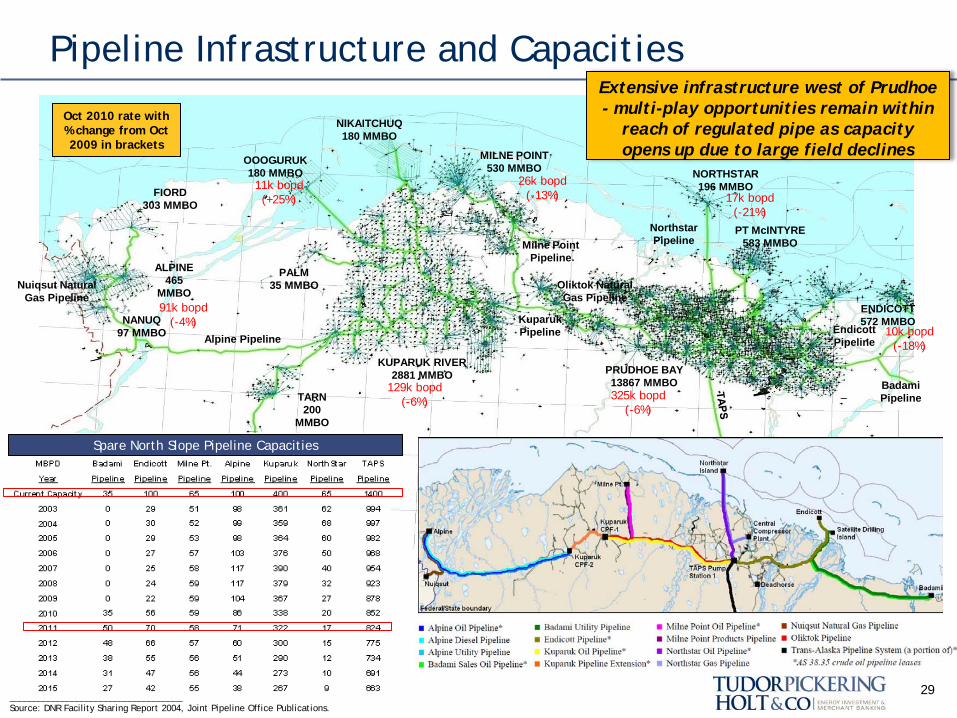
Pipeline Infrastructure and Capacities
29
FIORD 303 MMBO
ALPINE 465
MMBO
NANUQ 97 MMBO
OOOGURUK 180 MMBO
MELTWATER 44 MMBO
TARN 200
MMBO
PALM 35 MMBO
KUPARUK RIVER 2881 MMBO
MILNE POINT 530 MMBO NORTHSTAR
196 MMBO
PRUDHOE BAY 13867 MMBO
PT McINTYRE 583 MMBO
ENDICOTT 572 MMBO
NIKAITCHUQ 180 MMBO
North Slope Infrastructure Extensive infrastructure west of Prudhoe - multi-play opportunities remain within
reach of regulated pipe as capacity opens up due to large field declines
____________________________________ Source: DNR Facility Sharing Report 2004, Joint Pipeline Office Publications.
Alpine Pipeline Endicott Pipeline
Milne Point Pipeline
Northstar Pipeline
Badami Pipeline
Oliktok Natural Gas Pipeline
Nuiqsut Natural Gas Pipeline
Kuparuk Pipeline
325k bopd (-6%)
129k bopd (-6%)
Oct 2010 rate with % change from Oct 2009 in brackets
91k bopd (-4%)
17k bopd (-21%)
26k bopd (-13%)
10k bopd (-18%)
11k bopd (+25%)
Spare North Slope Pipeline Capacities
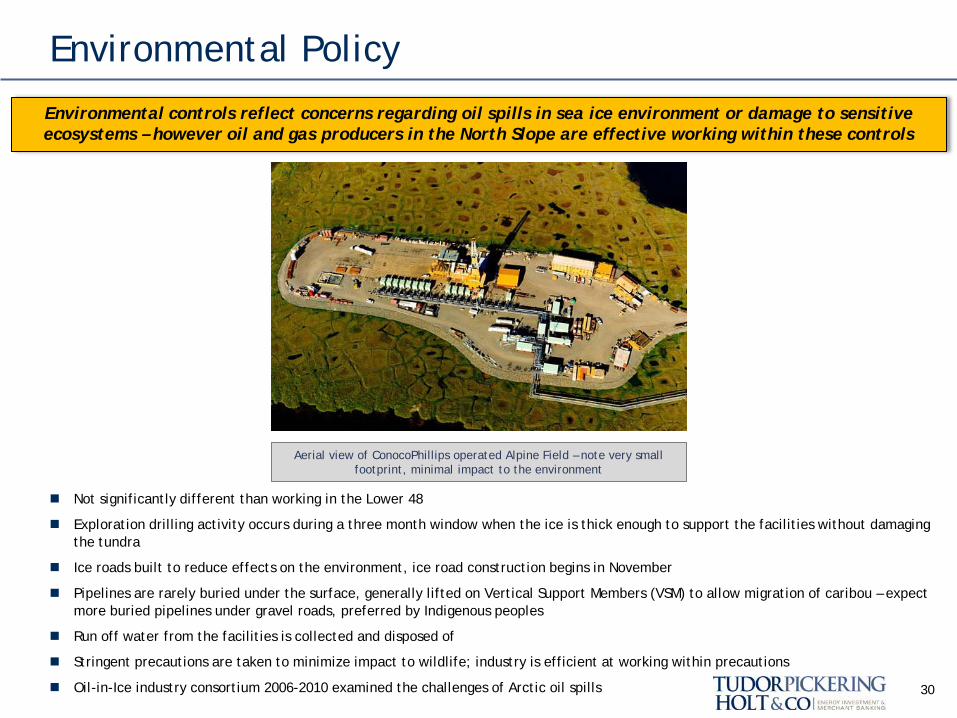
Environmental Policy
30
Environmental controls reflect concerns regarding oil spills in sea ice environment or damage to sensitive ecosystems – however oil and gas producers in the North Slope are effective working within these controls
Not significantly different than working in the Lower 48
Exploration drilling activity occurs during a three month window when the ice is thick enough to support the facilities without damaging the tundra
Ice roads built to reduce effects on the environment, ice road construction begins in November
Pipelines are rarely buried under the surface, generally lifted on Vertical Support Members (VSM) to allow migration of caribou – expect more buried pipelines under gravel roads, preferred by Indigenous peoples
Run off water from the facilities is collected and disposed of
Stringent precautions are taken to minimize impact to wildlife; industry is efficient at working within precautions
Oil-in-Ice industry consortium 2006-2010 examined the challenges of Arctic oil spills
Aerial view of ConocoPhillips operated Alpine Field – note very small footprint, minimal impact to the environment
Tax Rebates of Capital Expenditures
31
$0.45 of every dollar spent is rebated by the
Company in the two subsequent years Development
Capital
Exploration Capital
20% Qualified Capital Expenditure
25% Loss Carry Forward
40% Qualified Capital Expenditure
25% Loss Carry Forward
$0.65 of every dollar spent is rebated by the State in the two
subsequent years
True Capital Expenditures to the Operator
True Capital Expenditures to the Operator
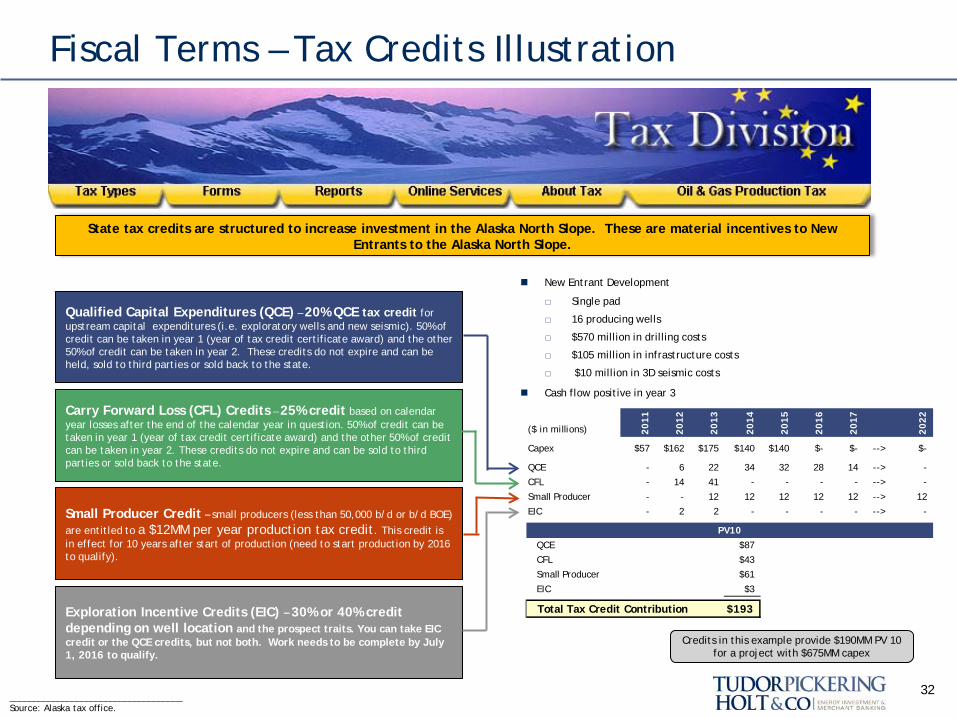
Fiscal Terms – Tax Credits Illustration
32 ____________________________________ Source: Alaska tax office.
State tax credits are structured to increase investment in the Alaska North Slope. These are material incentives to New Entrants to the Alaska North Slope.
Qualified Capital Expenditures (QCE) – 20% QCE tax credit for upstream capital expenditures (i.e. exploratory wells and new seismic). 50% of credit can be taken in year 1 (year of tax credit certificate award) and the other 50% of credit can be taken in year 2. These credits do not expire and can be held, sold to third parties or sold back to the state.
Carry Forward Loss (CFL) Credits – 25% credit based on calendar year losses after the end of the calendar year in question. 50% of credit can be taken in year 1 (year of tax credit certificate award) and the other 50% of credit can be taken in year 2. These credits do not expire and can be sold to third parties or sold back to the state.
Small Producer Credit – small producers (less than 50,000 b/d or b/d BOE) are entitled to a $12MM per year production tax credit. This credit is in effect for 10 years after start of production (need to start production by 2016 to qualify).
Exploration Incentive Credits (EIC) – 30% or 40% credit depending on well location and the prospect traits. You can take EIC credit or the QCE credits, but not both. Work needs to be complete by July 1, 2016 to qualify.
($ in millions) 2011
2012
2013
2014
2015
2016
2017
2022
Capex $57 $162 $175 $140 $140 $- $- --> $-
QCE - 6 22 34 32 28 14 --> -
CFL - 14 41 - - - - --> -
Small Producer - - 12 12 12 12 12 --> 12
EIC - 2 2 - - - - --> -
PV10QCE $87
CFL $43
Small Producer $61
EIC $3
Total Tax Credit Contribution $193
New Entrant Development
□ Single pad
□ 16 producing wells
□ $570 million in drilling costs
□ $105 million in infrastructure costs
□ $10 million in 3D seismic costs
Cash flow positive in year 3
Credits in this example provide $190MM PV 10 for a project with $675MM capex
Fiscal Terms - Taxes
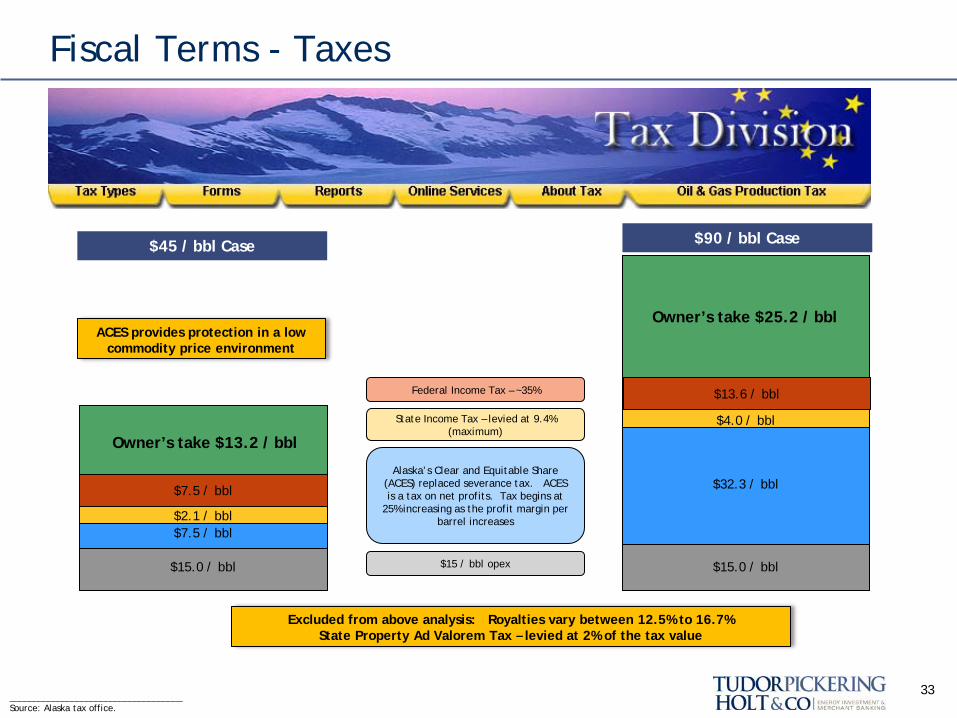
33 ____________________________________ Source: Alaska tax office.
$15.0 / bbl
$7.5 / bbl
$15 / bbl opex
$15.0 / bbl
$32.3 / bbl
$2.1 / bbl
$7.5 / bbl
Alaska’s Clear and Equitable Share (ACES) replaced severance tax. ACES is a tax on net profits. Tax begins at
25% increasing as the profit margin per barrel increases
State Income Tax – levied at 9.4% (maximum)
$4.0 / bbl
$13.6 / bbl Federal Income Tax – ~35%
Excluded from above analysis: Royalties vary between 12.5% to 16.7% State Property Ad Valorem Tax – levied at 2% of the tax value
Owner’s take $13.2 / bbl
Owner’s take $25.2 / bbl
$90 / bbl Case
ACES provides protection in a low commodity price environment
$45 / bbl Case
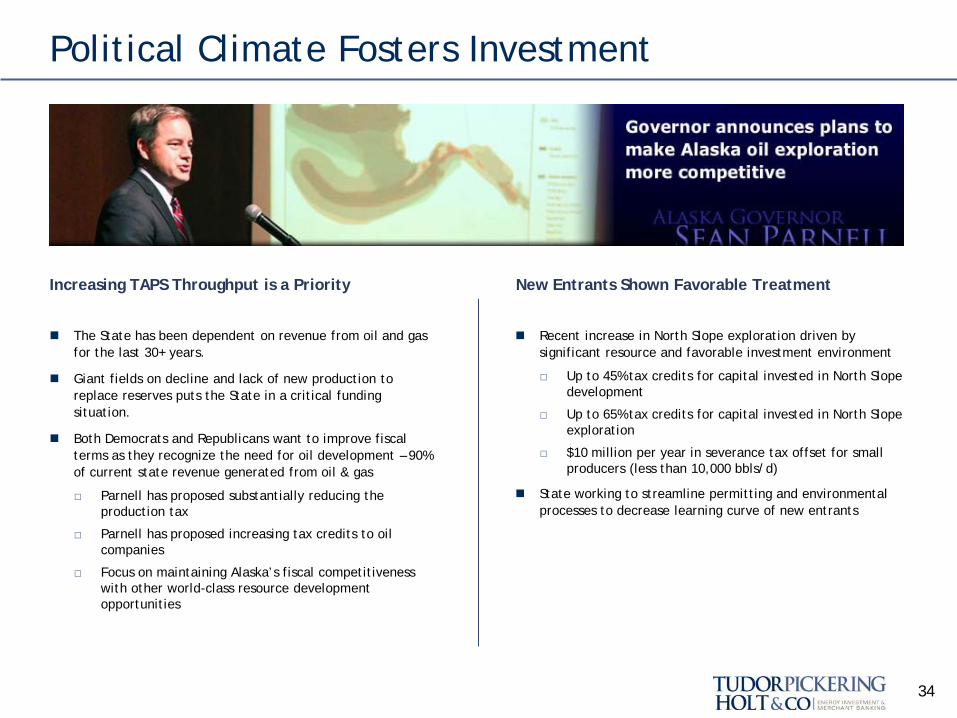
Political Climate Fosters Investment
The State has been dependent on revenue from oil and gas for the last 30+ years.
Giant fields on decline and lack of new production to replace reserves puts the State in a critical funding situation.
Both Democrats and Republicans want to improve fiscal terms as they recognize the need for oil development – 90% of current state revenue generated from oil & gas
□ Parnell has proposed substantially reducing the production tax
□ Parnell has proposed increasing tax credits to oil companies
□ Focus on maintaining Alaska’s fiscal competitiveness with other world-class resource development opportunities
Recent increase in North Slope exploration driven by significant resource and favorable investment environment
□ Up to 45% tax credits for capital invested in North Slope development
□ Up to 65% tax credits for capital invested in North Slope exploration
□ $10 million per year in severance tax offset for small producers (less than 10,000 bbls/d)
State working to streamline permitting and environmental processes to decrease learning curve of new entrants
Increasing TAPS Throughput is a Priority New Entrants Shown Favorable Treatment
34

III – Arrival of the Independents
35
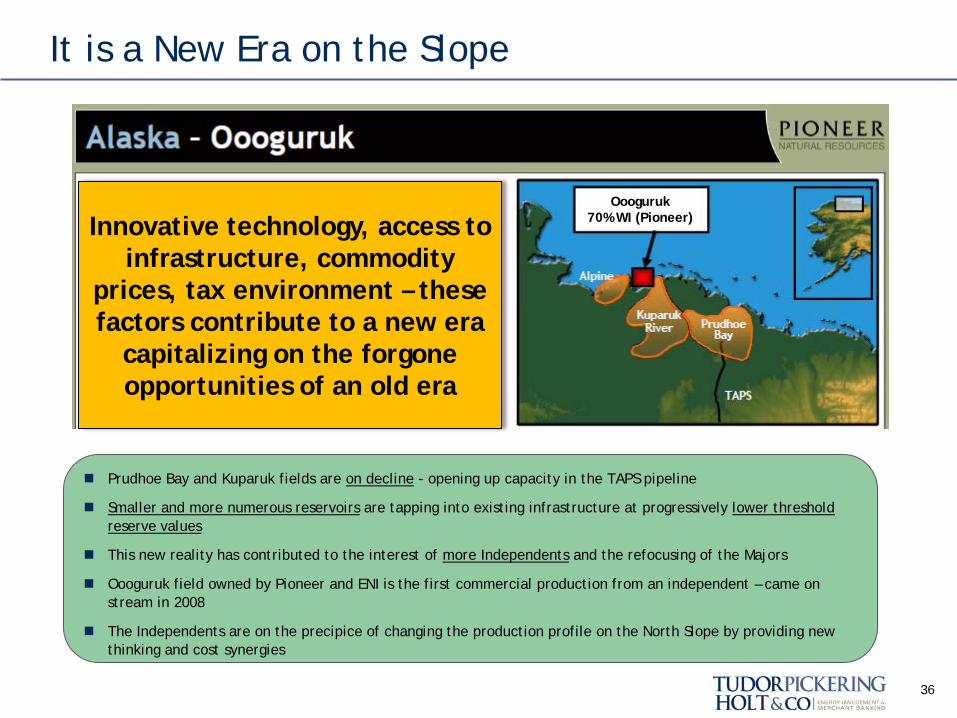
It is a New Era on the Slope
36
Prudhoe Bay and Kuparuk fields are on decline - opening up capacity in the TAPS pipeline
Smaller and more numerous reservoirs are tapping into existing infrastructure at progressively lower threshold reserve values
This new reality has contributed to the interest of more Independents and the refocusing of the Majors
Oooguruk field owned by Pioneer and ENI is the first commercial production from an independent – came on stream in 2008
The Independents are on the precipice of changing the production profile on the North Slope by providing new thinking and cost synergies
Innovative technology, access to infrastructure, commodity
prices, tax environment – these factors contribute to a new era
capitalizing on the forgone opportunities of an old era
Oooguruk 70% WI (Pioneer)
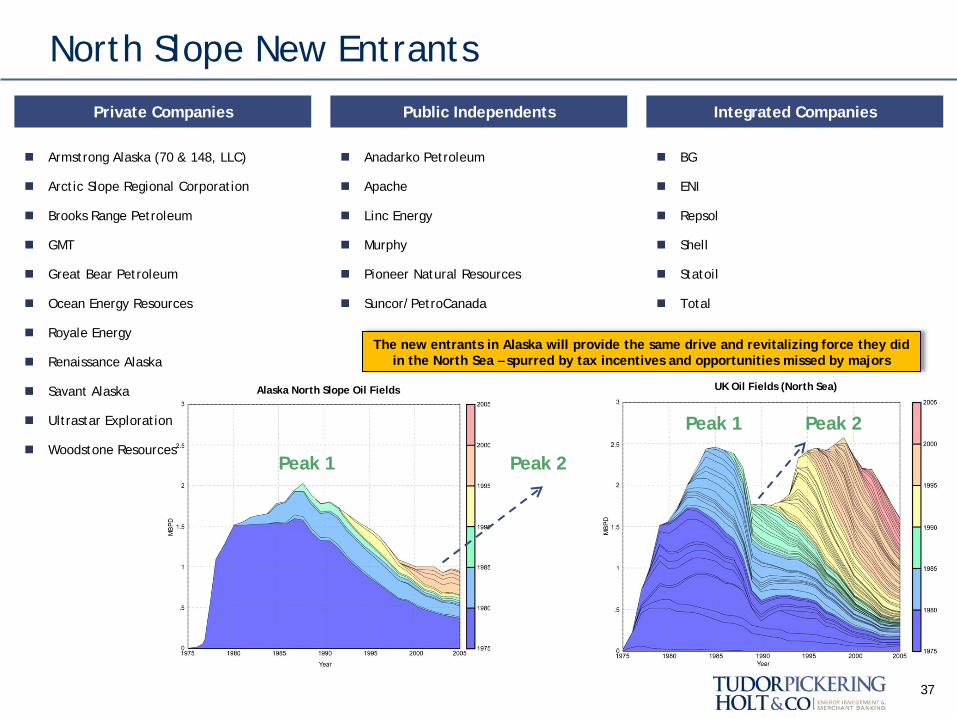
North Slope New Entrants
37
Private Companies Public Independents Integrated Companies
Armstrong Alaska (70 & 148, LLC)
Arctic Slope Regional Corporation
Brooks Range Petroleum
GMT
Great Bear Petroleum
Ocean Energy Resources
Royale Energy
Renaissance Alaska
Savant Alaska
Ultrastar Exploration
Woodstone Resources
Anadarko Petroleum
Apache
Linc Energy
Murphy
Pioneer Natural Resources
Suncor/PetroCanada
BG
ENI
Repsol
Shell
Statoil
Total
The new entrants in Alaska will provide the same drive and revitalizing force they did in the North Sea – spurred by tax incentives and opportunities missed by majors
UK Oil Fields (North Sea) Alaska North Slope Oil Fields
Peak 2 Peak 1
Peak 2 Peak 1
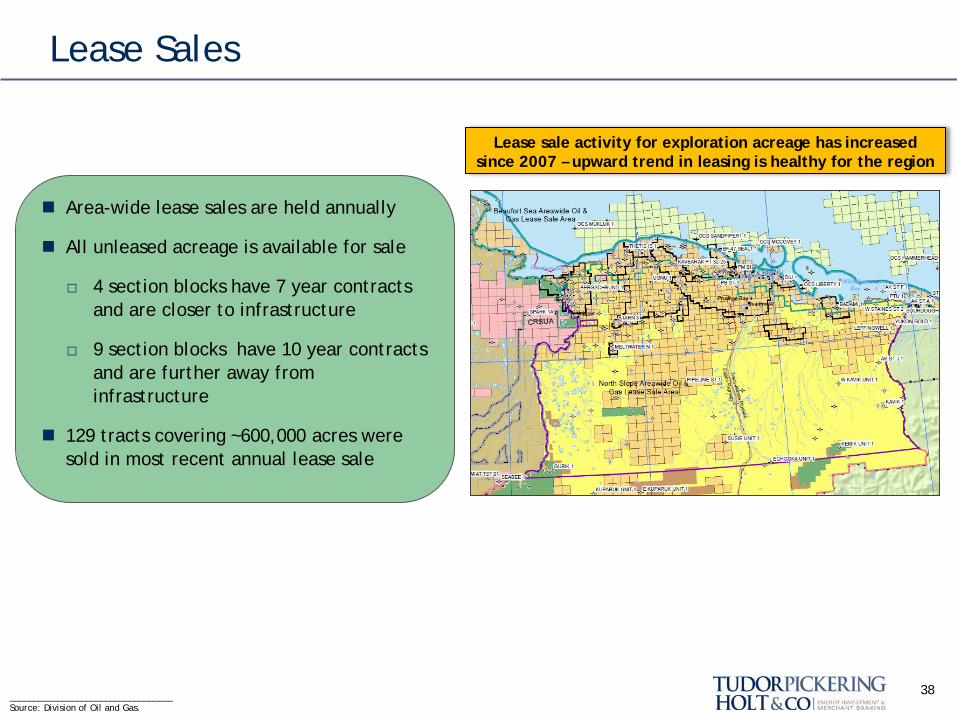
Lease Sales
38
Area-wide lease sales are held annually
All unleased acreage is available for sale
□ 4 section blocks have 7 year contracts and are closer to infrastructure
□ 9 section blocks have 10 year contracts and are further away from infrastructure
129 tracts covering ~600,000 acres were sold in most recent annual lease sale
__________________________________ Source: Division of Oil and Gas.
Lease sale activity for exploration acreage has increased since 2007 – upward trend in leasing is healthy for the region
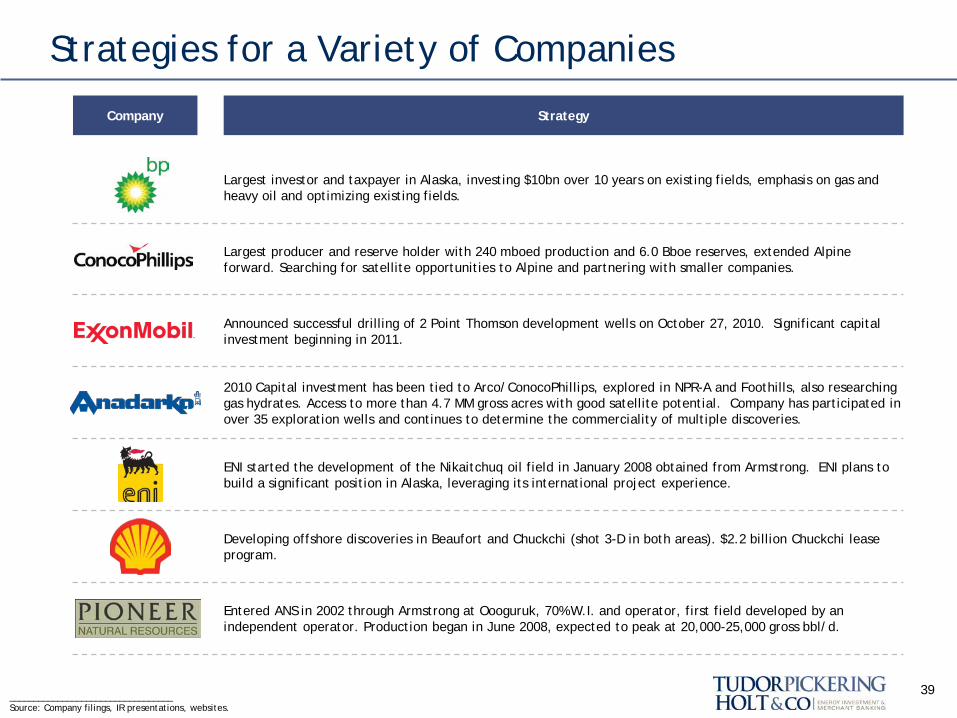
Company Strategy
Largest investor and taxpayer in Alaska, investing $10bn over 10 years on existing fields, emphasis on gas and heavy oil and optimizing existing fields.
Largest producer and reserve holder with 240 mboed production and 6.0 Bboe reserves, extended Alpine forward. Searching for satellite opportunities to Alpine and partnering with smaller companies.
Announced successful drilling of 2 Point Thomson development wells on October 27, 2010. Significant capital investment beginning in 2011.
2010 Capital investment has been tied to Arco/ConocoPhillips, explored in NPR-A and Foothills, also researching gas hydrates. Access to more than 4.7 MM gross acres with good satellite potential. Company has participated in over 35 exploration wells and continues to determine the commerciality of multiple discoveries.
ENI started the development of the Nikaitchuq oil field in January 2008 obtained from Armstrong. ENI plans to build a significant position in Alaska, leveraging its international project experience.
Developing offshore discoveries in Beaufort and Chuckchi (shot 3-D in both areas). $2.2 billion Chuckchi lease program.
Entered ANS in 2002 through Armstrong at Oooguruk, 70% W.I. and operator, first field developed by an independent operator. Production began in June 2008, expected to peak at 20,000-25,000 gross bbl/d.
Strategies for a Variety of Companies
39 __________________________________ Source: Company filings, IR presentations, websites.
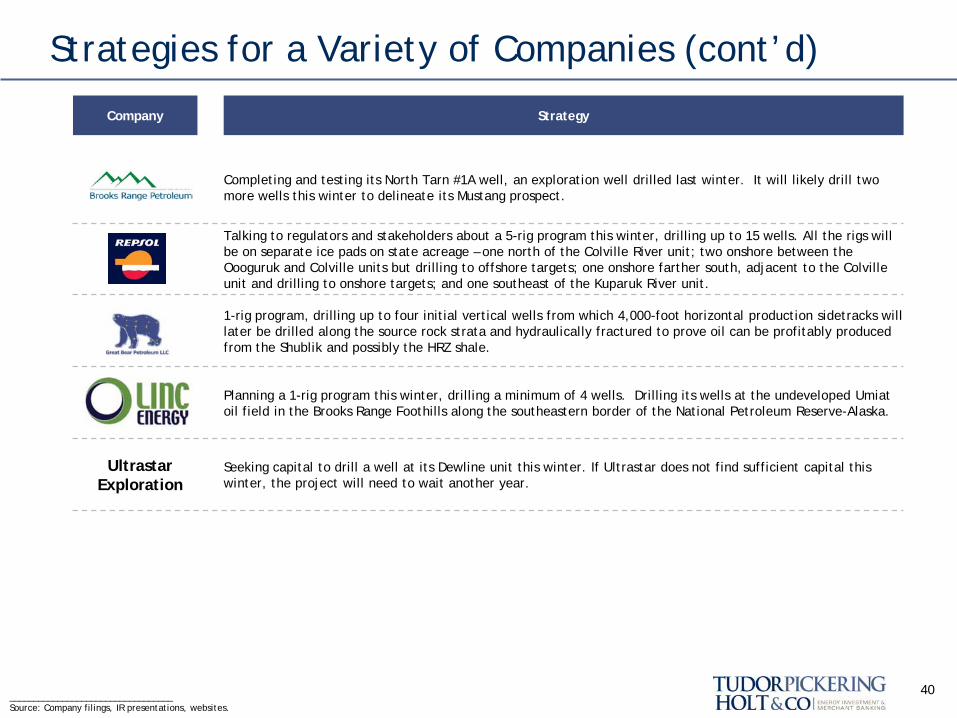
Company Strategy
Completing and testing its North Tarn #1A well, an exploration well drilled last winter. It will likely drill two more wells this winter to delineate its Mustang prospect.
Talking to regulators and stakeholders about a 5-rig program this winter, drilling up to 15 wells. All the rigs will be on separate ice pads on state acreage – one north of the Colville River unit; two onshore between the Oooguruk and Colville units but drilling to offshore targets; one onshore farther south, adjacent to the Colville unit and drilling to onshore targets; and one southeast of the Kuparuk River unit.
1-rig program, drilling up to four initial vertical wells from which 4,000-foot horizontal production sidetracks will later be drilled along the source rock strata and hydraulically fractured to prove oil can be profitably produced from the Shublik and possibly the HRZ shale.
Planning a 1-rig program this winter, drilling a minimum of 4 wells. Drilling its wells at the undeveloped Umiat oil field in the Brooks Range Foothills along the southeastern border of the National Petroleum Reserve-Alaska.
Seeking capital to drill a well at its Dewline unit this winter. If Ultrastar does not find sufficient capital this winter, the project will need to wait another year.
Strategies for a Variety of Companies (cont’d)
40 __________________________________ Source: Company filings, IR presentations, websites.
Ultrastar Exploration
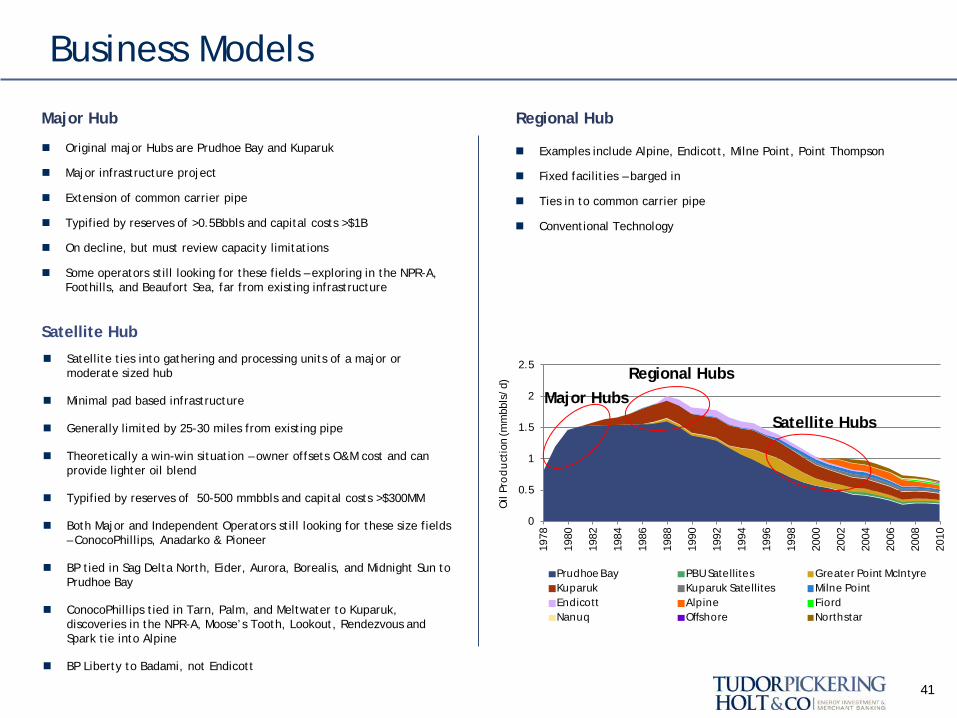
Business Models
Original major Hubs are Prudhoe Bay and Kuparuk
Major infrastructure project
Extension of common carrier pipe
Typified by reserves of >0.5Bbbls and capital costs >$1B
On decline, but must review capacity limitations
Some operators still looking for these fields – exploring in the NPR-A, Foothills, and Beaufort Sea, far from existing infrastructure
Examples include Alpine, Endicott, Milne Point, Point Thompson
Fixed facilities – barged in
Ties in to common carrier pipe
Conventional Technology
Major Hub
Regional Hub
41
0
0.5
1
1.5
2
2.5
1978
1980
1982
1984
1986
1988
1990
1992
1994
1996
1998
2000
2002
2004
2006
2008
2010
Oil
Pro
du
ctio
n (m
mbb
ls/d
)
Prudhoe Bay PBU Satellites Greater Point McIntyreKuparuk Kuparuk Satellites Milne PointEndicott Alpine FiordNanuq Offshore Northstar
Major Hubs Regional Hubs
Satellite Hubs
Satellite ties into gathering and processing units of a major or moderate sized hub
Minimal pad based infrastructure
Generally limited by 25-30 miles from existing pipe
Theoretically a win-win situation – owner offsets O&M cost and can provide lighter oil blend
Typified by reserves of 50-500 mmbbls and capital costs >$300MM
Both Major and Independent Operators still looking for these size fields – ConocoPhillips, Anadarko & Pioneer
BP tied in Sag Delta North, Eider, Aurora, Borealis, and Midnight Sun to Prudhoe Bay
ConocoPhillips tied in Tarn, Palm, and Meltwater to Kuparuk, discoveries in the NPR-A, Moose’s Tooth, Lookout, Rendezvous and Spark tie into Alpine
BP Liberty to Badami, not Endicott
Satellite Hub
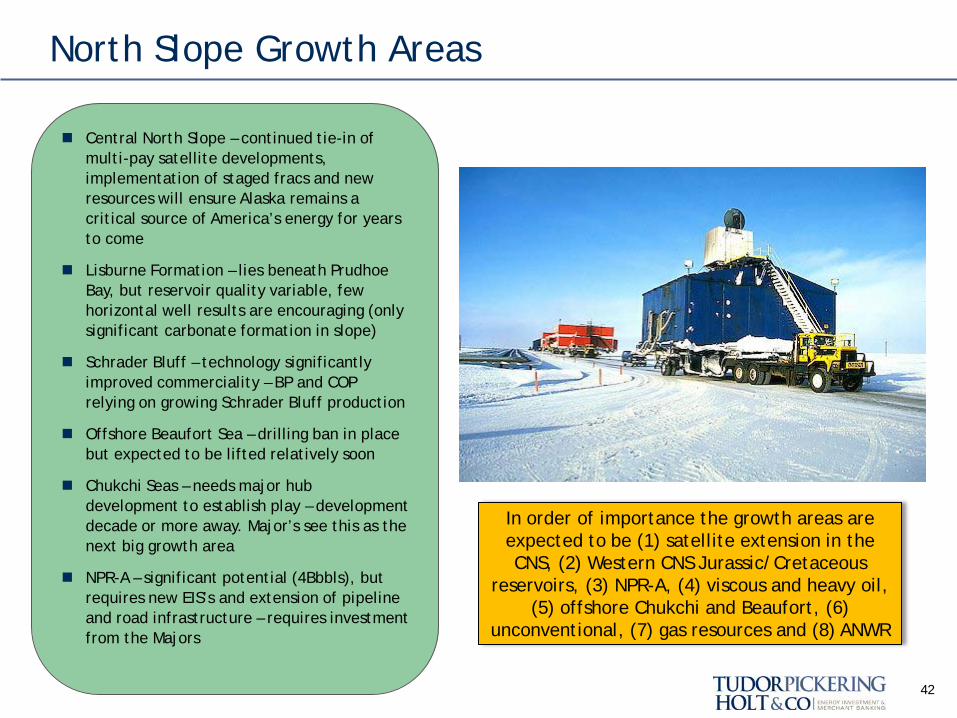
North Slope Growth Areas
42
Central North Slope – continued tie-in of multi-pay satellite developments, implementation of staged fracs and new resources will ensure Alaska remains a critical source of America’s energy for years to come
Lisburne Formation – lies beneath Prudhoe Bay, but reservoir quality variable, few horizontal well results are encouraging (only significant carbonate formation in slope)
Schrader Bluff – technology significantly improved commerciality – BP and COP relying on growing Schrader Bluff production
Offshore Beaufort Sea – drilling ban in place but expected to be lifted relatively soon
Chukchi Seas – needs major hub development to establish play – development decade or more away. Major’s see this as the next big growth area
NPR-A – significant potential (4Bbbls), but requires new EIS’s and extension of pipeline and road infrastructure – requires investment from the Majors
In order of importance the growth areas are expected to be (1) satellite extension in the CNS, (2) Western CNS Jurassic/Cretaceous
reservoirs, (3) NPR-A, (4) viscous and heavy oil, (5) offshore Chukchi and Beaufort, (6)
unconventional, (7) gas resources and (8) ANWR
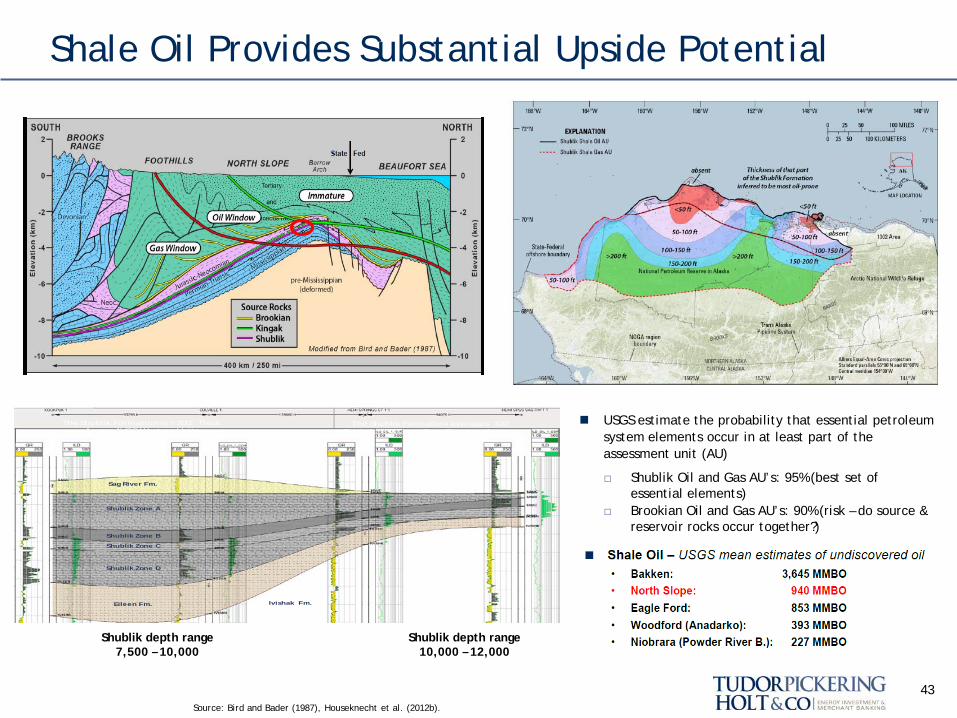
USGS estimate the probability that essential petroleum system elements occur in at least part of the assessment unit (AU)
□ Shublik Oil and Gas AU’s: 95% (best set of essential elements)
□ Brookian Oil and Gas AU’s: 90% (risk – do source & reservoir rocks occur together?)
Shale Oil Provides Substantial Upside Potential
43
The Shublik Formation is > 200’ ThickAcross AVCG Western Units
Shublik Zone A
Shublik Zone B
Shublik Zone C
Shublik Zone D
Eileen Fm.
Sag River Fm.
Ivishak Fm.
The Shublik Formation averages 100’ Thick Across Great Bear Easetern Acreage
Shublik depth range 7,500 – 10,000
Shublik depth range 10,000 – 12,000
Source: Bird and Bader (1987), Houseknecht et al. (2012b).
IV – Typical Field Considerations
44
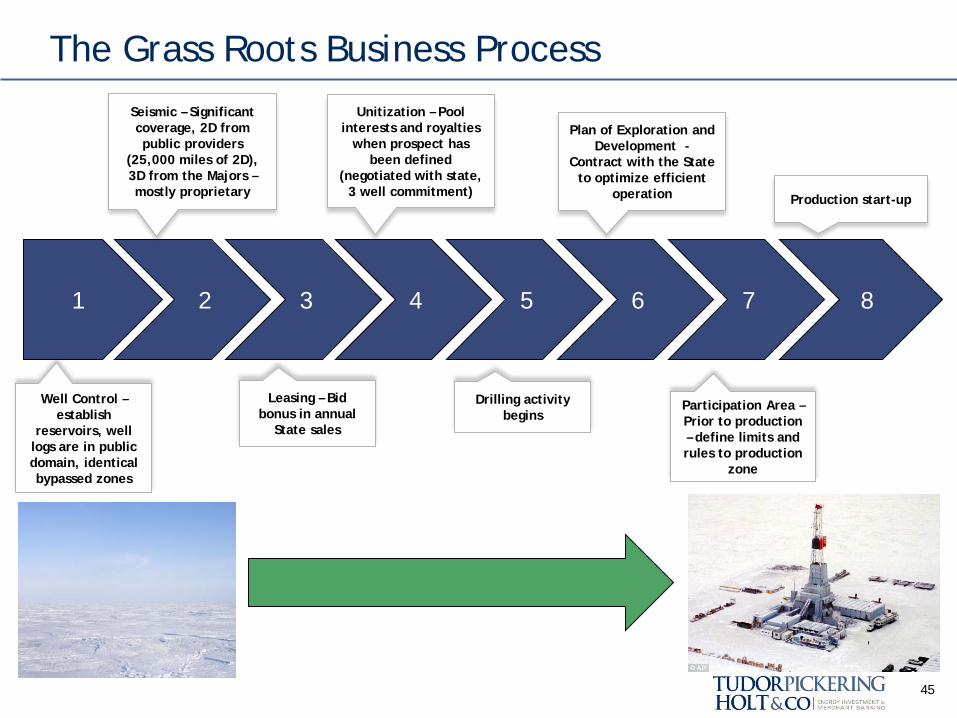
The Grass Roots Business Process
45
1 2 3 8 7 6 5 4
Well Control –establish
reservoirs, well logs are in public domain, identical bypassed zones
Seismic – Significant coverage, 2D from public providers
(25,000 miles of 2D), 3D from the Majors – mostly proprietary
Participation Area – Prior to production – define limits and rules to production
zone
Drilling activity begins
Leasing – Bid bonus in annual
State sales
Unitization – Pool interests and royalties
when prospect has been defined
(negotiated with state, 3 well commitment)
Plan of Exploration and Development -
Contract with the State to optimize efficient
operation Production start-up
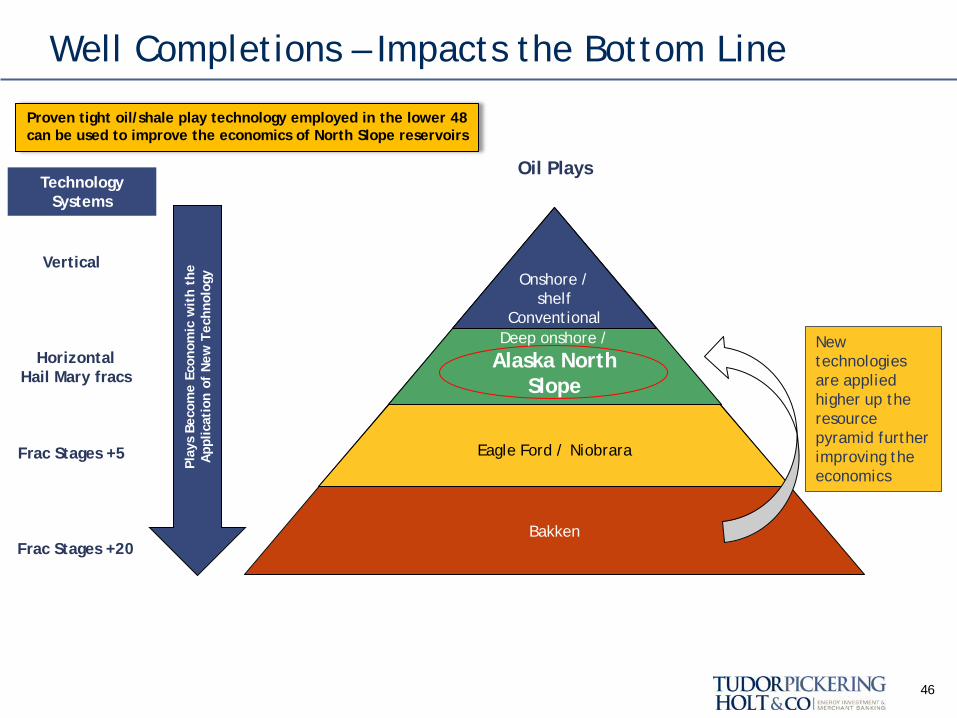
Well Completions – Impacts the Bottom Line
46
Bakken
Eagle Ford / Niobrara
Deep onshore /
Alaska North Slope
Onshore / shelf
Conventional
Vertical
Horizontal Hail Mary fracs
Frac Stages +5
Frac Stages +20
Play
s Be
com
e Ec
onom
ic w
ith
the
A
pplic
atio
n of
New
Tec
hnol
ogy
Oil Plays
Proven tight oil/shale play technology employed in the lower 48 can be used to improve the economics of North Slope reservoirs
New technologies are applied higher up the resource pyramid further improving the economics
Technology Systems
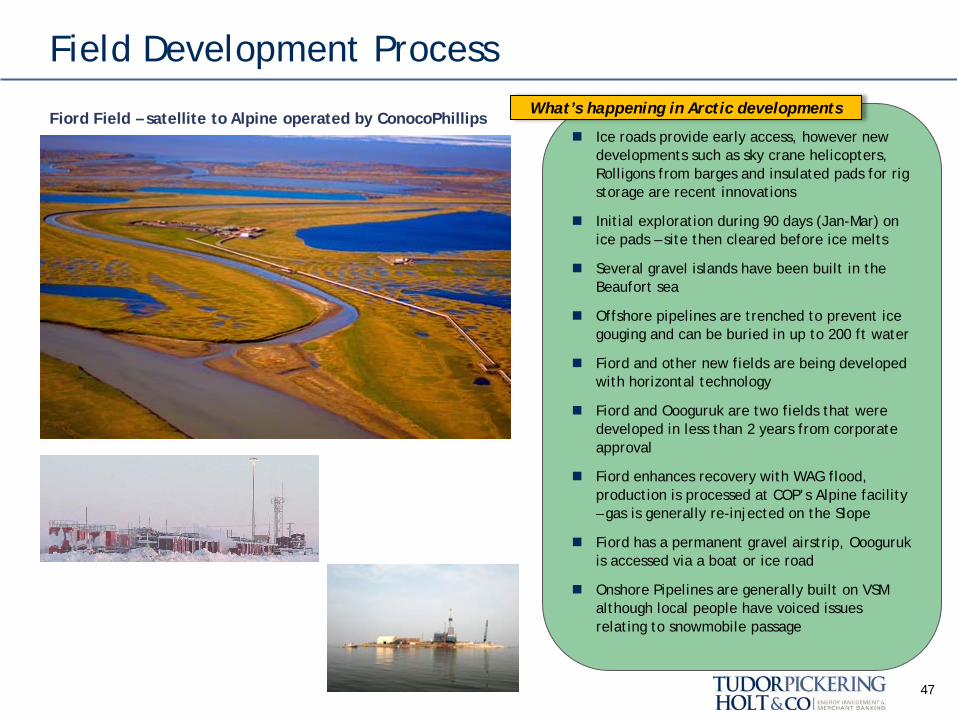
Field Development Process
47
Ice roads provide early access, however new developments such as sky crane helicopters, Rolligons from barges and insulated pads for rig storage are recent innovations
Initial exploration during 90 days (Jan-Mar) on ice pads – site then cleared before ice melts
Several gravel islands have been built in the Beaufort sea
Offshore pipelines are trenched to prevent ice gouging and can be buried in up to 200 ft water
Fiord and other new fields are being developed with horizontal technology
Fiord and Oooguruk are two fields that were developed in less than 2 years from corporate approval
Fiord enhances recovery with WAG flood, production is processed at COP’s Alpine facility – gas is generally re-injected on the Slope
Fiord has a permanent gravel airstrip, Oooguruk is accessed via a boat or ice road
Onshore Pipelines are generally built on VSM although local people have voiced issues relating to snowmobile passage
Fiord Field – satellite to Alpine operated by ConocoPhillips What’s happening in Arctic developments
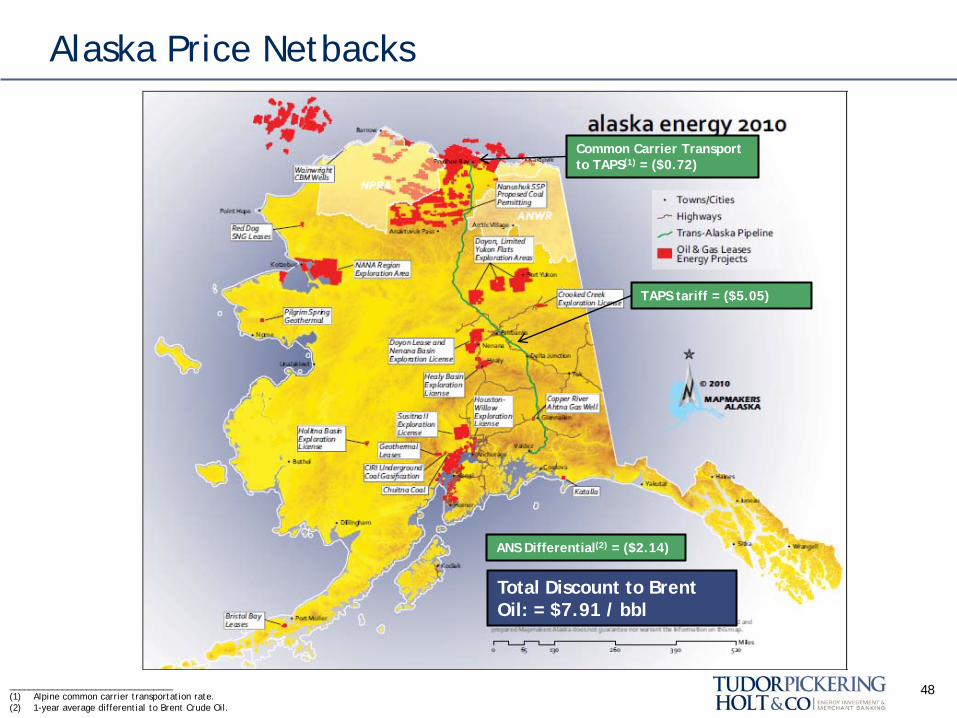
Alaska Price Netbacks
ANS Differential(2) = ($2.14)
TAPS tariff = ($5.05)
Common Carrier Transport to TAPS(1) = ($0.72)
48 __________________________________ (1) Alpine common carrier transportation rate. (2) 1-year average differential to Brent Crude Oil.
Total Discount to Brent Oil: = $7.91 / bbl
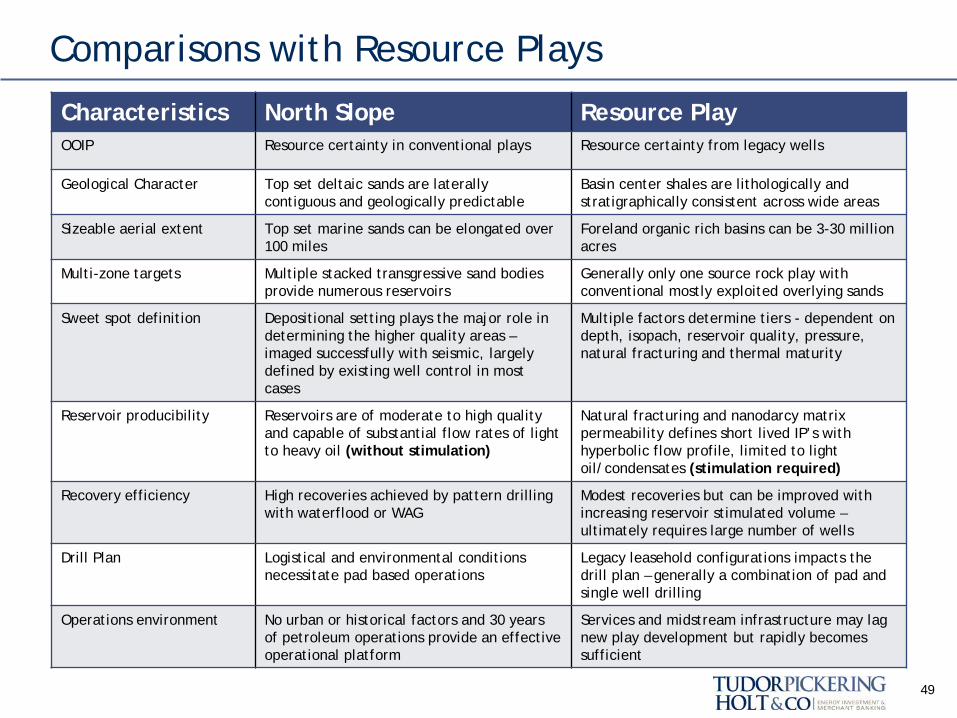
Comparisons with Resource Plays
49
Characteristics North Slope Resource Play OOIP Resource certainty in conventional plays Resource certainty from legacy wells
Geological Character Top set deltaic sands are laterally contiguous and geologically predictable
Basin center shales are lithologically and stratigraphically consistent across wide areas
Sizeable aerial extent Top set marine sands can be elongated over 100 miles
Foreland organic rich basins can be 3-30 million acres
Multi-zone targets Multiple stacked transgressive sand bodies provide numerous reservoirs
Generally only one source rock play with conventional mostly exploited overlying sands
Sweet spot definition Depositional setting plays the major role in determining the higher quality areas – imaged successfully with seismic, largely defined by existing well control in most cases
Multiple factors determine tiers - dependent on depth, isopach, reservoir quality, pressure, natural fracturing and thermal maturity
Reservoir producibility Reservoirs are of moderate to high quality and capable of substantial flow rates of light to heavy oil (without stimulation)
Natural fracturing and nanodarcy matrix permeability defines short lived IP’s with hyperbolic flow profile, limited to light oil/condensates (stimulation required)
Recovery efficiency High recoveries achieved by pattern drilling with waterflood or WAG
Modest recoveries but can be improved with increasing reservoir stimulated volume – ultimately requires large number of wells
Drill Plan
Logistical and environmental conditions necessitate pad based operations
Legacy leasehold configurations impacts the drill plan – generally a combination of pad and single well drilling
Operations environment No urban or historical factors and 30 years of petroleum operations provide an effective operational platform
Services and midstream infrastructure may lag new play development but rapidly becomes sufficient
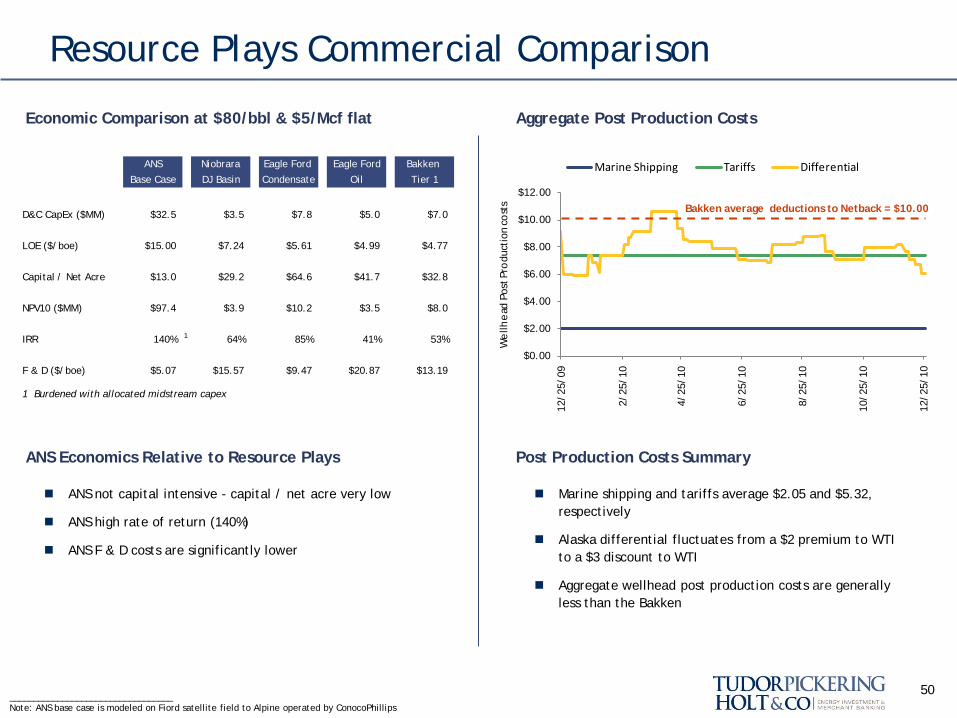
Resource Plays Commercial Comparison
Economic Comparison at $80/bbl & $5/Mcf flat Aggregate Post Production Costs
$0.00
$2.00
$4.00
$6.00
$8.00
$10.00
$12.00
12/2
5/09
2/25
/10
4/25
/10
6/25
/10
8/25
/10
10/2
5/10
12/2
5/10
We
llhe
ad P
ost P
rodu
ctio
n co
sts
Marine Shipping Tariffs Differential
Bakken average deductions to Netback = $10.00
__________________________________ Note: ANS base case is modeled on Fiord satellite field to Alpine operated by ConocoPhillips
ANS Niobrara Eagle Ford Eagle Ford Bakken
Base Case DJ Basin Condensate Oil Tier 1
D&C CapEx ($MM) $32.5 $3.5 $7.8 $5.0 $7.0
LOE ($/boe) $15.00 $7.24 $5.61 $4.99 $4.77
Capital / Net Acre $13.0 $29.2 $64.6 $41.7 $32.8
NPV10 ($MM) $97.4 $3.9 $10.2 $3.5 $8.0
IRR 140% 1 64% 85% 41% 53%
F & D ($/boe) $5.07 $15.57 $9.47 $20.87 $13.19
1 Burdened with allocated midstream capex
ANS not capital intensive - capital / net acre very low
ANS high rate of return (140%)
ANS F & D costs are significantly lower
Marine shipping and tariffs average $2.05 and $5.32, respectively
Alaska differential fluctuates from a $2 premium to WTI to a $3 discount to WTI
Aggregate wellhead post production costs are generally less than the Bakken
50
ANS Economics Relative to Resource Plays Post Production Costs Summary
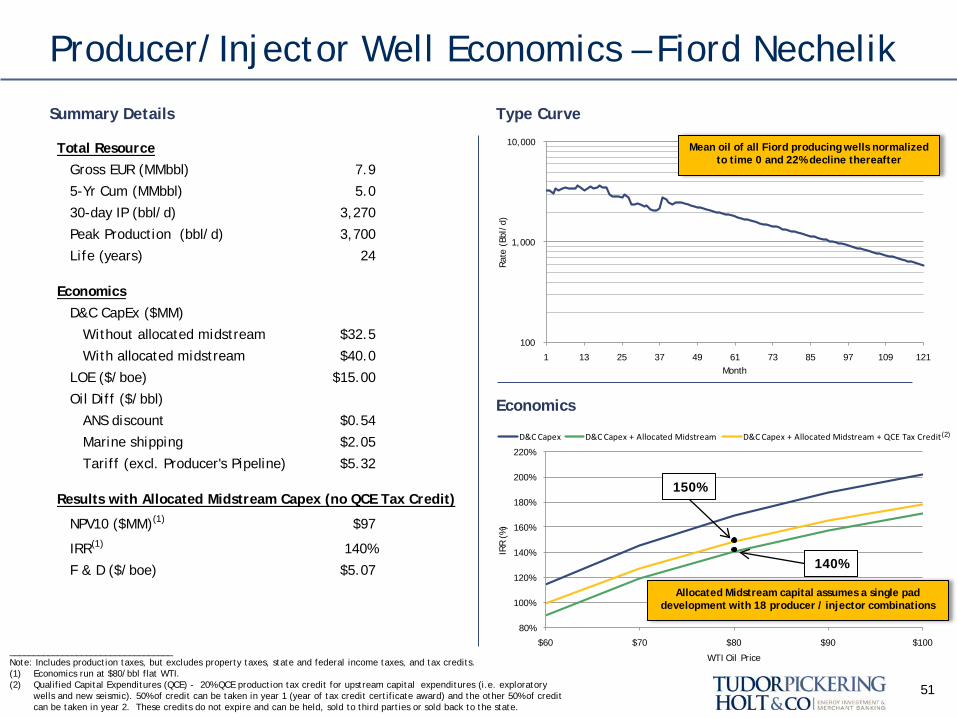
Producer/Injector Well Economics – Fiord Nechelik
Summary Details Type Curve
Economics
51
Total ResourceGross EUR (MMbbl) 7.9
5-Yr Cum (MMbbl) 5.0
30-day IP (bbl/d) 3,270
Peak Production (bbl/d) 3,700
Life (years) 24
EconomicsD&C CapEx ($MM)
Without allocated midstream $32.5
With allocated midstream $40.0
LOE ($/boe) $15.00
Oil Diff ($/bbl)
ANS discount $0.54
Marine shipping $2.05
Tariff (excl. Producer's Pipeline) $5.32
Results with Allocated Midstream Capex (no QCE Tax Credit)
NPV10 ($MM)(1) $97
IRR(1) 140%
F & D ($/boe) $5.07
100
1,000
10,000
1 13 25 37 49 61 73 85 97 109 121
Rat
e (B
bl/d
)
Month
80%
100%
120%
140%
160%
180%
200%
220%
$60 $70 $80 $90 $100
IRR
(%
)
WTI Oil Price
D&C Capex D&C Capex + Allocated Midstream D&C Capex + Allocated Midstream + QCE Tax Credit
__________________________________ Note: Includes production taxes, but excludes property taxes, state and federal income taxes, and tax credits. (1) Economics run at $80/bbl flat WTI. (2) Qualified Capital Expenditures (QCE) -. 20% QCE production tax credit for upstream capital expenditures (i.e. exploratory
wells and new seismic). 50% of credit can be taken in year 1 (year of tax credit certificate award) and the other 50% of credit can be taken in year 2. These credits do not expire and can be held, sold to third parties or sold back to the state.
Mean oil of all Fiord producing wells normalized to time 0 and 22% decline thereafter
Allocated Midstream capital assumes a single pad development with 18 producer / injector combinations
(2)
140%
150%
V – Conclusion
52
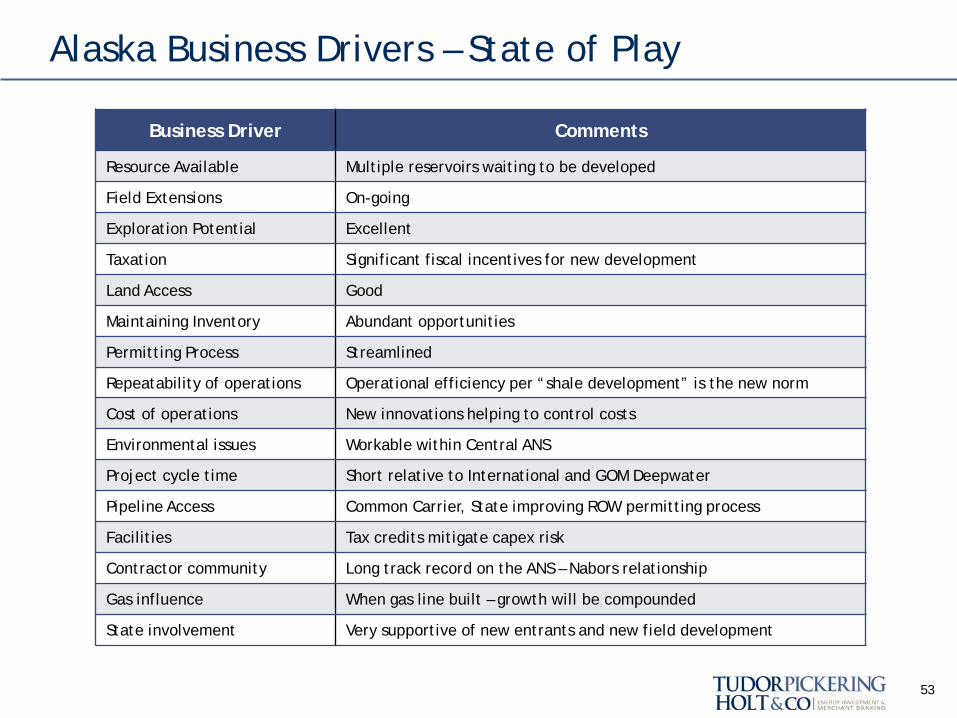
Alaska Business Drivers – State of Play
53
Business Driver Comments
Resource Available Multiple reservoirs waiting to be developed
Field Extensions On-going
Exploration Potential Excellent
Taxation Significant fiscal incentives for new development
Land Access Good
Maintaining Inventory Abundant opportunities
Permitting Process Streamlined
Repeatability of operations Operational efficiency per “shale development” is the new norm
Cost of operations New innovations helping to control costs
Environmental issues Workable within Central ANS
Project cycle time Short relative to International and GOM Deepwater
Pipeline Access Common Carrier, State improving ROW permitting process
Facilities Tax credits mitigate capex risk
Contractor community Long track record on the ANS – Nabors relationship
Gas influence When gas line built – growth will be compounded
State involvement Very supportive of new entrants and new field development
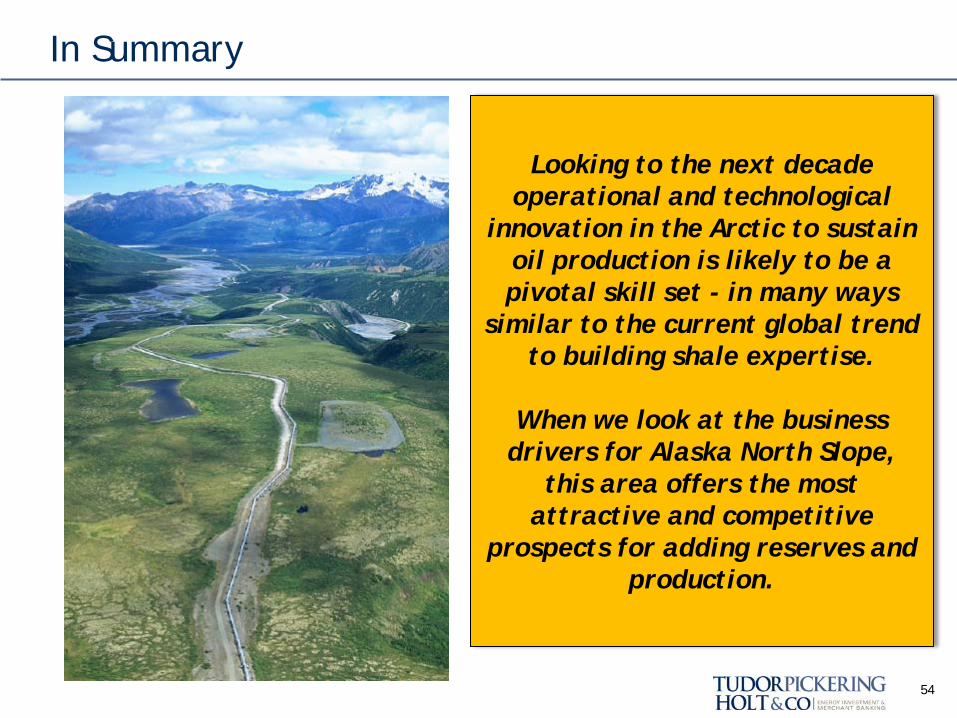
In Summary
54
Looking to the next decade operational and technological
innovation in the Arctic to sustain oil production is likely to be a pivotal skill set - in many ways
similar to the current global trend to building shale expertise.
When we look at the business
drivers for Alaska North Slope, this area offers the most
attractive and competitive prospects for adding reserves and
production.
Tudor, Pickering, Holt & Co., LLC is an integrated energy investment and merchant bank, providing high quality advice and services to institutional and corporate clients. Through the company’s broker-dealer, Tudor, Pickering, Holt & Co. Securities, Inc., the company offers securities and investment banking services to the energy community. The firm, headquartered in Houston, Texas, has approximately 90 employees and offices in Denver, Colorado; and in New York, New York. Its affiliate, Tudor, Pickering Holt & Co. International, LLP, is located in London, England. Contact Us Houston (Research, Sales and Trading): 713-333-2960 Houston (Investment Banking): 713-333-7100 Denver (Sales): 303-300-1900 Denver (Investment Banking): 303-300-1900 New York (Research, Sales): 212-220-9254 London: +011 44(0) 20 3008 6428 www.TudorPickeringHolt.com
Tudor, Pickering, Holt & Co. does not provide accounting, tax or legal advice. In addition, we mutually agree that, subject to applicable law, you (and your employees, representatives and other agents) may disclose any aspects of any potential transaction or structure described herein that are necessary to support any U.S. federal income tax benefits, and all materials of any kind (including tax opinions and other tax analyses) related to those benefits, with no limitations imposed by Tudor, Pickering, Holt & Co. The information contained herein is confidential (except for information relating to United States tax issues) and may not be reproduced in whole or in part. Tudor, Pickering, Holt & Co. assumes no responsibility for independent verification of third-party information and has relied on such information being complete and accurate in all material respects. To the extent such information includes estimates and forecasts of future financial performance (including estimates of potential cost savings and synergies) prepared by, reviewed or discussed with the managements of your company and/ or other potential transaction participants or obtained from public sources, we have assumed that such estimates and forecasts have been reasonably prepared on bases reflecting the best currently available estimates and judgments of such managements (or, with respect to estimates and forecasts obtained from public sources, represent reasonable estimates). These materials were designed for use by specific persons familiar with the business and the affairs of your company and Tudor, Pickering, Holt & Co. materials. Under no circumstances is this presentation to be used or considered as an offer to sell or a solicitation of any offer to buy, any security. Prior to making any trade, you should discuss with your professional tax, accounting, or regulatory advisers how such particular trade(s) affect you. This brief statement does not disclose all of the risks and other significant aspects of entering into any particular transaction. Tudor, Pickering, Holt & Co. International, LLP is authorized and regulated by the Financial Services Authority and is a separate but affiliated entity of Tudor, Pickering, Holt & Co. Securities, Inc.
About The Firm
Disclosure Statement
55
09.02.2010