Embed Size (px)
Citation preview
Estuary Structure and Function; Estuary Structure and Function;
Submarine Groundwater Submarine Groundwater
DischargeDischarge
OCN 623 – Chemical Oceanography31 March 2015
Reading: Willard S. Moore (2010) The effect of groundwater discharge on
the Ocean. Ann. Rev. Marine Sci.
© 2015 Frank Sansone
OutlineOutline
• River-water vs. sea-water concentrations
• Definitions of types of estuaries
• Mixing curves
• The mid-estuary turbidity maximum
• Submarine groundwater discharge
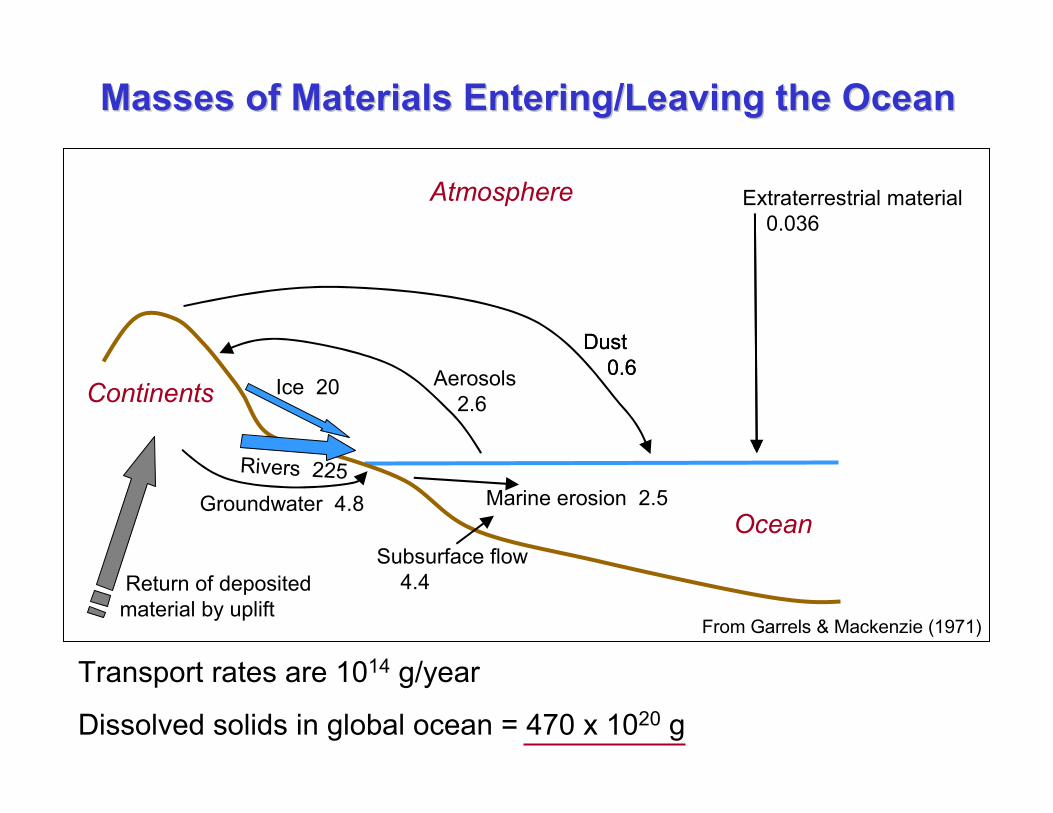
Masses of Materials Entering/Leaving the OceanMasses of Materials Entering/Leaving the Ocean
Transport rates are 1014 g/year
Dissolved solids in global ocean = 470 x 1020 g
From Garrels & Mackenzie (1971)
Return of deposited
material by uplift
Continents
Atmosphere
Ocean
Dust
0.6Aerosols
2.6
Extraterrestrial material
0.036
Marine erosion 2.5
Rivers 225
Ice 20
Groundwater 4.8
Subsurface flow
4.4
Dust
0.6

rw << sw
rw ≈ swNutrients
are
different!
RiverRiver--water and Seawater and Sea--water water
ConcentrationsConcentrations
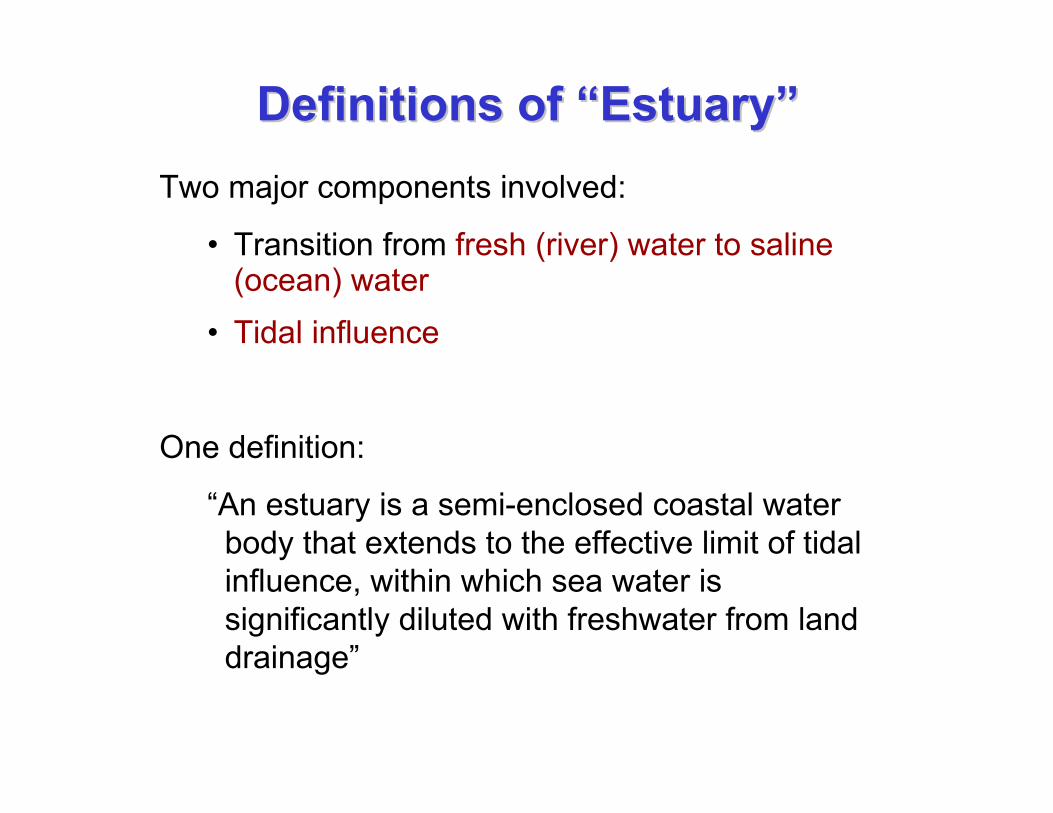
Definitions of Definitions of ““EstuaryEstuary””
Two major components involved:
• Transition from fresh (river) water to saline(ocean) water
• Tidal influence
One definition:
“An estuary is a semi-enclosed coastal water
body that extends to the effective limit of tidal
influence, within which sea water is
significantly diluted with freshwater from land
drainage”
• Estuarine ecosystems includes:
- The river channel, to the maximum upstream extent of tidal
influence
- The adjacent coastal waters, to the maximum extent of
freshwater flow
- Salt marshes and tidal flats that develop along the
shoreline, built up from riverine sediments deposited as river
flow rate slows at sea level; subject to daily tidal inundation
and exposure
• Estuaries are zones of mixing, displaying strong
salinity gradients from land to sea

Water Movement in EstuariesWater Movement in Estuaries
• River flow is essentially unidirectional
• As river water meets the sea, tidal oscillation
introduces a bi-directional (“in-out”) component to
flow
– This bi-directionality may be throughout the water
column (well-mixed estuary)
– Or there may be predominantly surface outflow
and deep inflow (salt-wedge estuary)
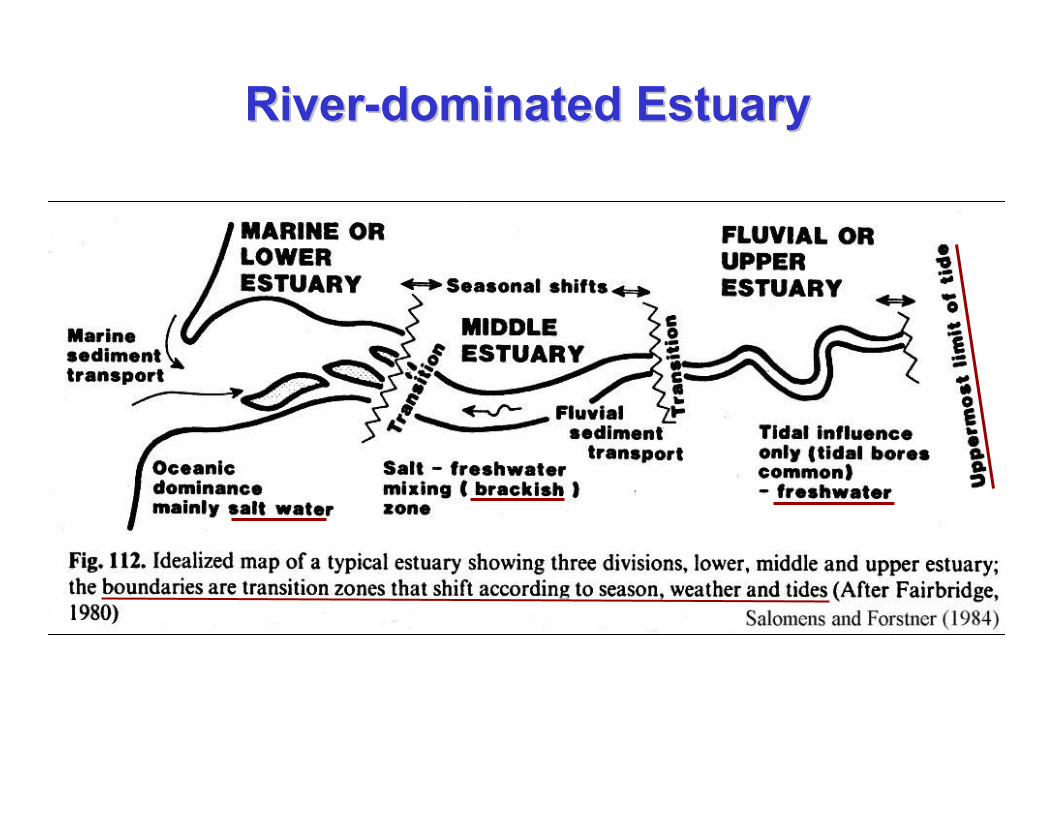
RiverRiver--dominated Estuarydominated Estuary
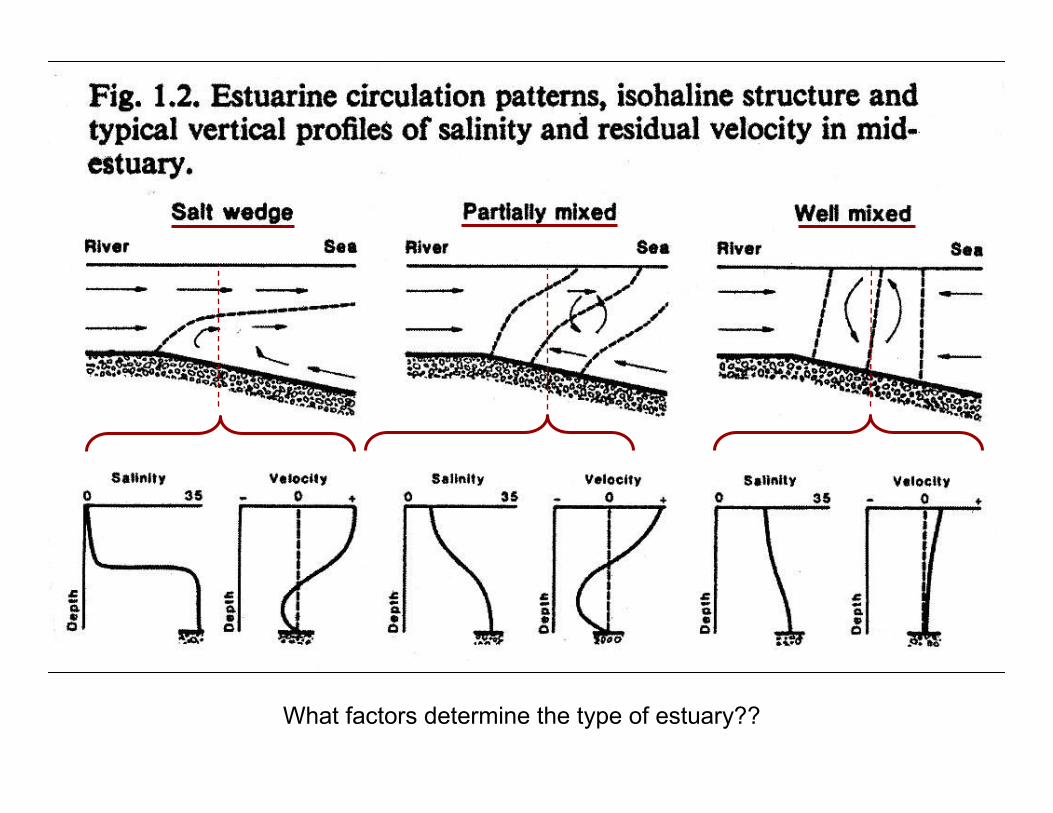
What factors determine the type of estuary??
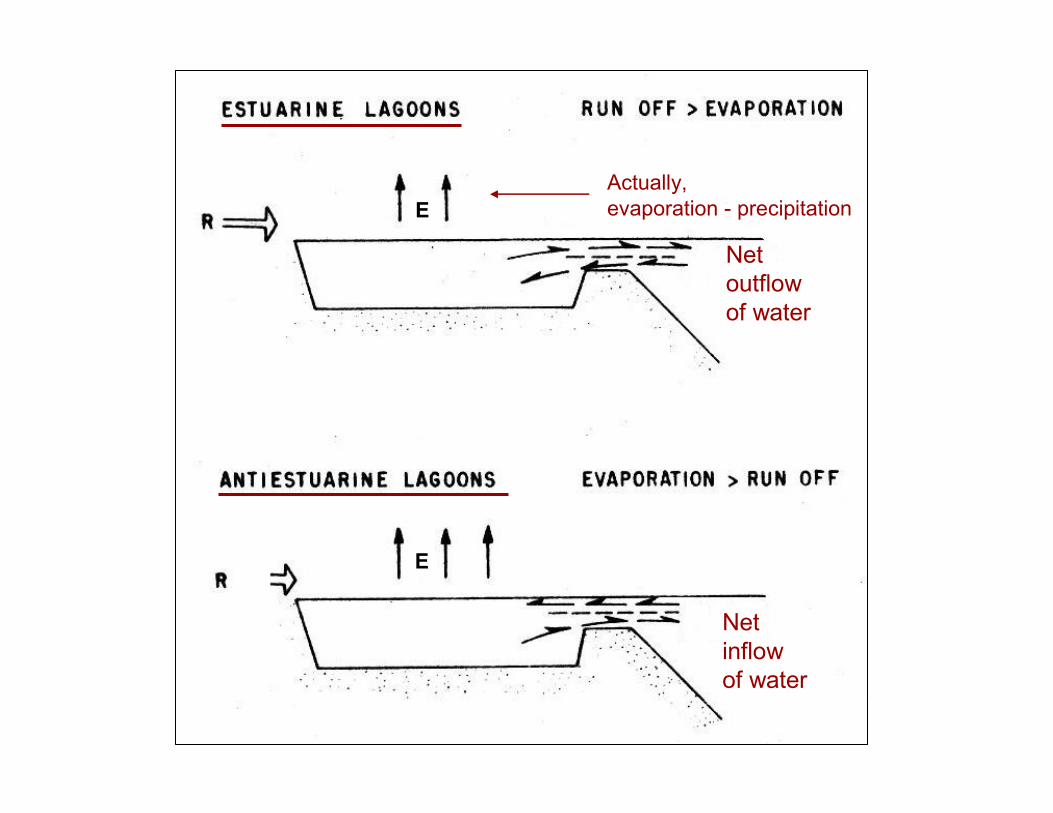
Net
outflow
of water
Net
inflow
of water
E
E
Actually,
evaporation - precipitation

Mixing CurvesMixing Curves
The Basic Tool for Studying River-Ocean Interactions
Assumes end-
members are constant
over the flushing time
of the estuary
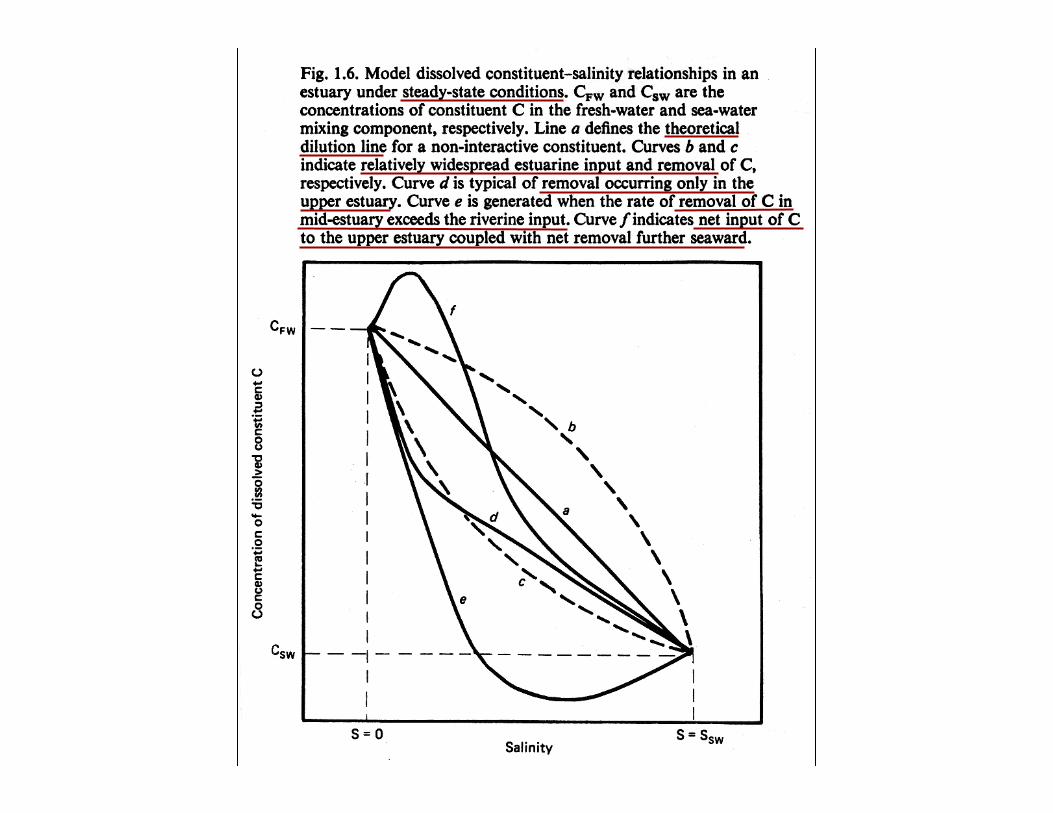

Data from multiple points
up-river
Greater
impact of
mid-estuary
input during
low flow
(summer)
An Example of Seasonal EffectsAn Example of Seasonal Effects
Salinity, g/kg
Dis
solv
ed p
hosphate
, uM
10 3020
1
2
3
4
5
6
High flow - Spring
Low flow - Summer
Dissolved phosphate as a function of salinity in the
Hudson River Estuary (adapted from Simpson et al. 1975)

Dennison and Abal (1999)
Estuarine Turbidity MaximumEstuarine Turbidity Maximum
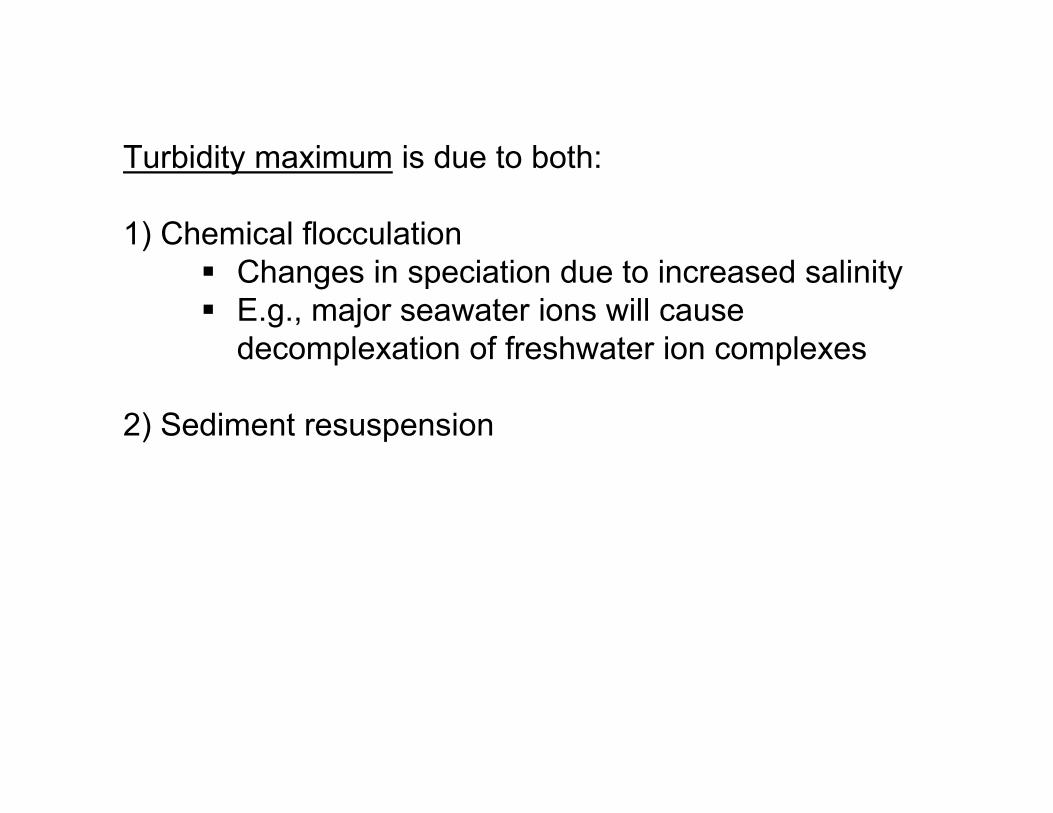
Turbidity maximum is due to both:
1) Chemical flocculation
� Changes in speciation due to increased salinity
� E.g., major seawater ions will cause
decomplexation of freshwater ion complexes
2) Sediment resuspension

A MidA Mid--estuary Trap for estuary Trap for
RiverborneRiverborne MaterialMaterial
Flocculation &
resuspension
S
E
A
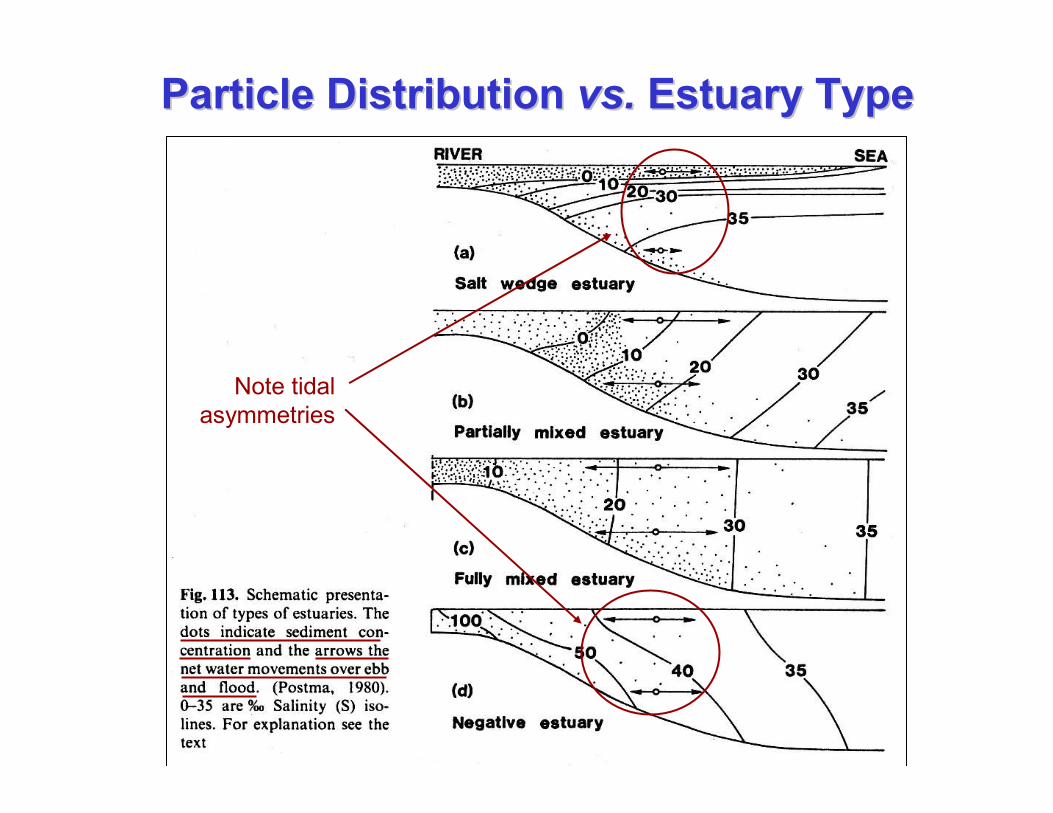
Note tidal
asymmetries
Particle Distribution Particle Distribution vs.vs. Estuary TypeEstuary Type

Effects Of The MidEffects Of The Mid--estuary Turbidity estuary Turbidity
MaximumMaximum
1. Scavenging of surface-active materials
• 70-100% of riverine Fe is removed (most at low salinity)
• 60-80% of humic acids is removed
• 5% of total DOM is removed
2. Increased turbidity
• Lower primary production
• Reduction of photochemical reaction rates
3. Enhanced transport rates downstream / offshore
• Enhanced sedimentation rates downstream / offshore

Computation of Annual Mean River FluxComputation of Annual Mean River Flux
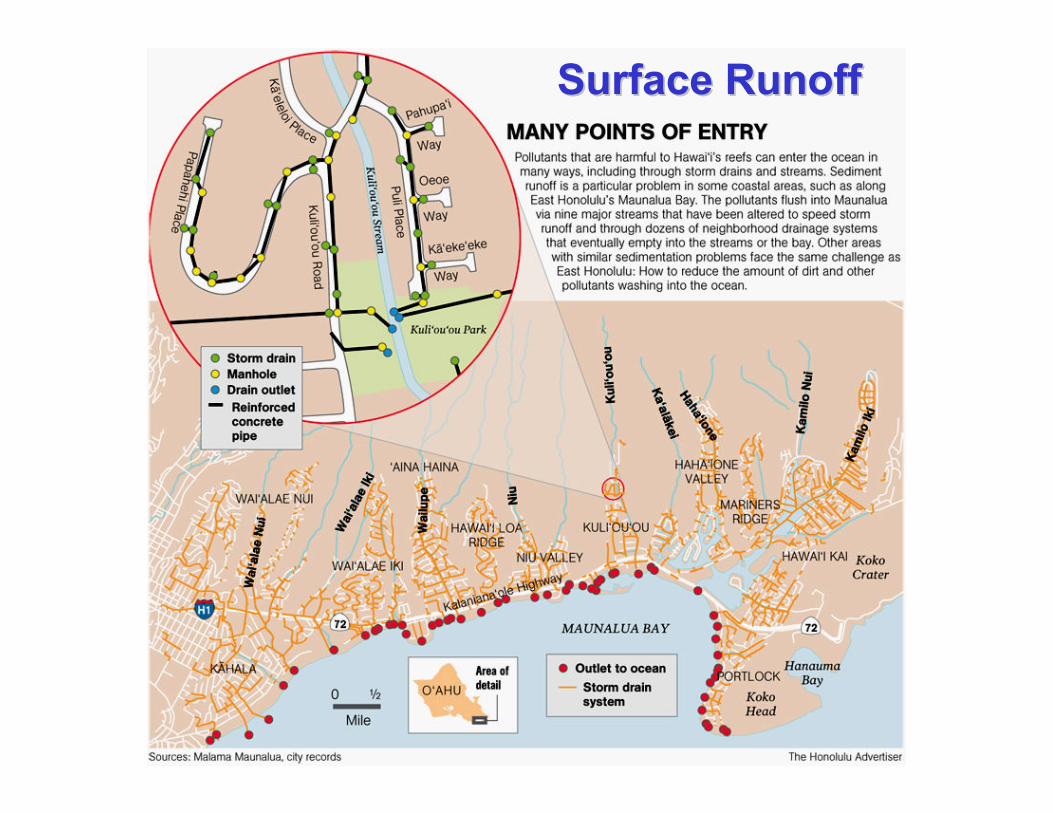
Surface RunoffSurface Runoff