Embed Size (px)
Citation preview
European Journal of Educational Research Volume 6, Issue 3, 235 - 259.
ISSN: 2165-8714 http://www.eu-jer.com/
An Overview of School Dropout in Central America: Unresolved Issues and New Challenges for Education Progress
Melissa A. Adelman World Bank, USA
Miguel Székely *1 Center for Education and Social Studies, MEXICO
Received: June 7, 2017 ▪ Revised: July 5, 2017 ▪ Accepted: July 14, 2017
Abstract: School dropout is a growing concern in Central America, and in Latin America as a whole, because of its consequences for economic productivity, the inclusiveness of growth, social cohesion, and increasing youth risks. This paper utilizes more than two decades of household survey data to construct a systematic overview of school dropout at the primary and secondary levels in Central America, focusing on recent trends in dropout patterns and their underlying causes. Within each country, poverty, rurality, and indigenous group membership are the strongest correlates of dropout, reflecting several underlying factors that affect the marginal benefits and costs of staying in school. Global and regional evidence increasingly points to common policy priorities for reducing dropout across Central America, including addressing remaining gaps in access at the pre-primary and secondary levels, improving the quality of education at all levels, and strengthening the coverage, targeting, and coherence of existing programs aimed at improving education outcomes. However, additional rigorous evaluations, including cost data, are needed to identify the most effective specific approaches in each country. JEL Classification: I2, I24, I25, I26, I28, O15
Keywords: Dropout, educational attainment, secondary education, Costa Rica, El Salvador, Guatemala, Honduras, Nicaragua, Panama, Central America. To cite this article: Adelman, M.A., & Székely, M. (2017). An overview of school dropout in central america: Unresolved issues and new challenges for education progress. European Journal of Educational Research, 6(3), 235-259. doi: 10.12973/eu-jer.6.3.235
Introduction
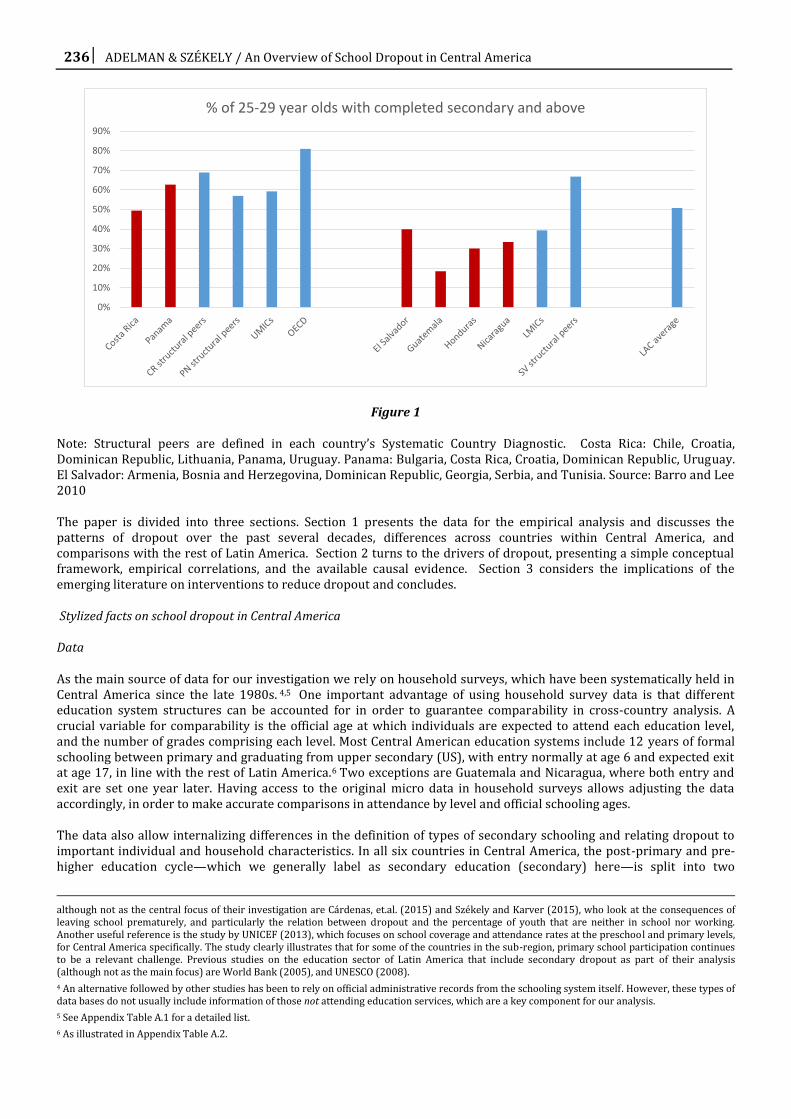
Low education quality on average, inequalities in both access and quality within countries, and risks that affect education for specific subgroups are widely recognized challenges in Central American education systems, and high dropout rates are a reflection of these challenges. 2 Dropout is a growing cause of concern in Central America, and in Latin America as a whole, due to its multiple consequences for economic productivity, the inclusiveness of growth, social cohesion, and increasing youth risks. In particular, as countries look to accelerate their growth, the inadequate skills of their workforces present a key constraint (World Bank 2014, 2015a and 2015b). Compared to countries at similar levels of development, countries in Central America are behind in terms of the educational attainment of their populations. As shown in Figure 1, fewer young adults in Costa Rica have completed secondary compared to structural peers, other upper-middle income countries, and the OECD, while Guatemala, Honduras, and Nicaragua all lag behind the lower-middle income country average.
This paper presents an analysis of school dropout, focusing on secondary dropout, in Central America, with the goal of providing a systematic overview of recent trends in dropout rates and their underlying drivers. To do this, we build on substantial recent research in Latin America on dropout and youth idleness (neither attending school nor working), in particular the conceptual framework presented in Behrman, de Hoyos, and Szekely (2015) and the cross-country cohort analysis by Bentaouet-Kattan and Székely (2015a).3
* Corresponding author:
Miguel Székely, Center for Education and Social Studies, MEXICO Email: [email protected]
1 The authors thank Pamela Mendoza and José Mola-Avila for their research assistance. The authors thank Pablo Acosta, Raja Bentaouet-Kattan, Laura Chioda, and Rafael de Hoyos for their valuable comments.
2 Highlighted for instance by Bruns and Luque (2015) and Cabrol and Székely (2013), among others.
3 A related study by Bassi, et.al. (2015) focuses on measuring secondary school dropout and graduation rates for the countries in the region, by using snapshots of household surveys up to the late 2000s. These authors conclude that dropout has declined, and point to the increase of school services and in the returns to secondary education as main causes for the reduction. Other related recent studies that analyze school dropout in the region,
236 ADELMAN & SZÉKELY / An Overview of School Dropout in Central America
Figure 1
Note: Structural peers are defined in each country’s Systematic Country Diagnostic. Costa Rica: Chile, Croatia, Dominican Republic, Lithuania, Panama, Uruguay. Panama: Bulgaria, Costa Rica, Croatia, Dominican Republic, Uruguay. El Salvador: Armenia, Bosnia and Herzegovina, Dominican Republic, Georgia, Serbia, and Tunisia. Source: Barro and Lee 2010
The paper is divided into three sections. Section 1 presents the data for the empirical analysis and discusses the patterns of dropout over the past several decades, differences across countries within Central America, and comparisons with the rest of Latin America. Section 2 turns to the drivers of dropout, presenting a simple conceptual framework, empirical correlations, and the available causal evidence. Section 3 considers the implications of the emerging literature on interventions to reduce dropout and concludes.
Stylized facts on school dropout in Central America
Data
As the main source of data for our investigation we rely on household surveys, which have been systematically held in Central America since the late 1980s. 4,5 One important advantage of using household survey data is that different education system structures can be accounted for in order to guarantee comparability in cross-country analysis. A crucial variable for comparability is the official age at which individuals are expected to attend each education level, and the number of grades comprising each level. Most Central American education systems include 12 years of formal schooling between primary and graduating from upper secondary (US), with entry normally at age 6 and expected exit at age 17, in line with the rest of Latin America.6 Two exceptions are Guatemala and Nicaragua, where both entry and exit are set one year later. Having access to the original micro data in household surveys allows adjusting the data accordingly, in order to make accurate comparisons in attendance by level and official schooling ages.
The data also allow internalizing differences in the definition of types of secondary schooling and relating dropout to important individual and household characteristics. In all six countries in Central America, the post-primary and pre-higher education cycle—which we generally label as secondary education (secondary) here—is split into two
although not as the central focus of their investigation are Cárdenas, et.al. (2015) and Székely and Karver (2015), who look at the consequences of leaving school prematurely, and particularly the relation between dropout and the percentage of youth that are neither in school nor working. Another useful reference is the study by UNICEF (2013), which focuses on school coverage and attendance rates at the preschool and primary levels, for Central America specifically. The study clearly illustrates that for some of the countries in the sub-region, primary school participation continues to be a relevant challenge. Previous studies on the education sector of Latin America that include secondary dropout as part of their analysis (although not as the main focus) are World Bank (2005), and UNESCO (2008).
4 An alternative followed by other studies has been to rely on official administrative records from the schooling system itself. However, these types of data bases do not usually include information of those not attending education services, which are a key component for our analysis.
5 See Appendix Table A.1 for a detailed list.
6 As illustrated in Appendix Table A.2.
0%
10%
20%
30%
40%
50%
60%
70%
80%
90%
% of 25-29 year olds with completed secondary and above
European Journal of Educational Research 237
segments. The first segment of lower secondary (LS) has a typical duration of 3 years, followed by another 3-year segment of US. Apart from allowing for consistent comparisons, relating ages with schooling levels is particularly important for normative reasons. While primary education is already compulsory in Central America, LS only become compulsory in Honduras in 2013, and is still not compulsory in Nicaragua (OEI 2010).7 Another important advantage of household surveys is their inclusion of a wide set of personal and household characteristics, as well as local labor market conditions, with which to correlate school dropout patterns.
Yet another advantage is that household surveys include representative samples of all age groups because they are normally structured around the demographics of each country. This allows us to follow the trajectory of different cohorts over time. The case of El Salvador, where 19 observations are available over a 24-year period, illustrates this. If one identifies all individuals ages 1-5 in the first survey of 1989, it is possible to locate the same group six years later in the 1995 survey, when they are ages 7-11, precisely the ages at which children are expected to be enrolled in primary in the country. It is therefore possible to identify the proportion actually in school to compute the net coverage of education services at this level. Six years later, in the year 2001, the same cohort can be identified again at ages 13-17, which is the age group expected to be attending secondary. Within the cohort, it is also possible to verify whether those ages 13-15 are actually enrolled in LS as expected, and if the older half of the cohort who are ages 16-17 are enrolled in US. With this information, net enrollment in both segments can be determined, as well as the share that is enrolled at a lower level (and therefore overage) and the share that is out of school. The following sub-sections implement this approach in order to identify patterns of secondary, LS, and US dropout over time in Central America, with comparisons to the rest of the region.
The general context: Progress in education in Central America over six decades
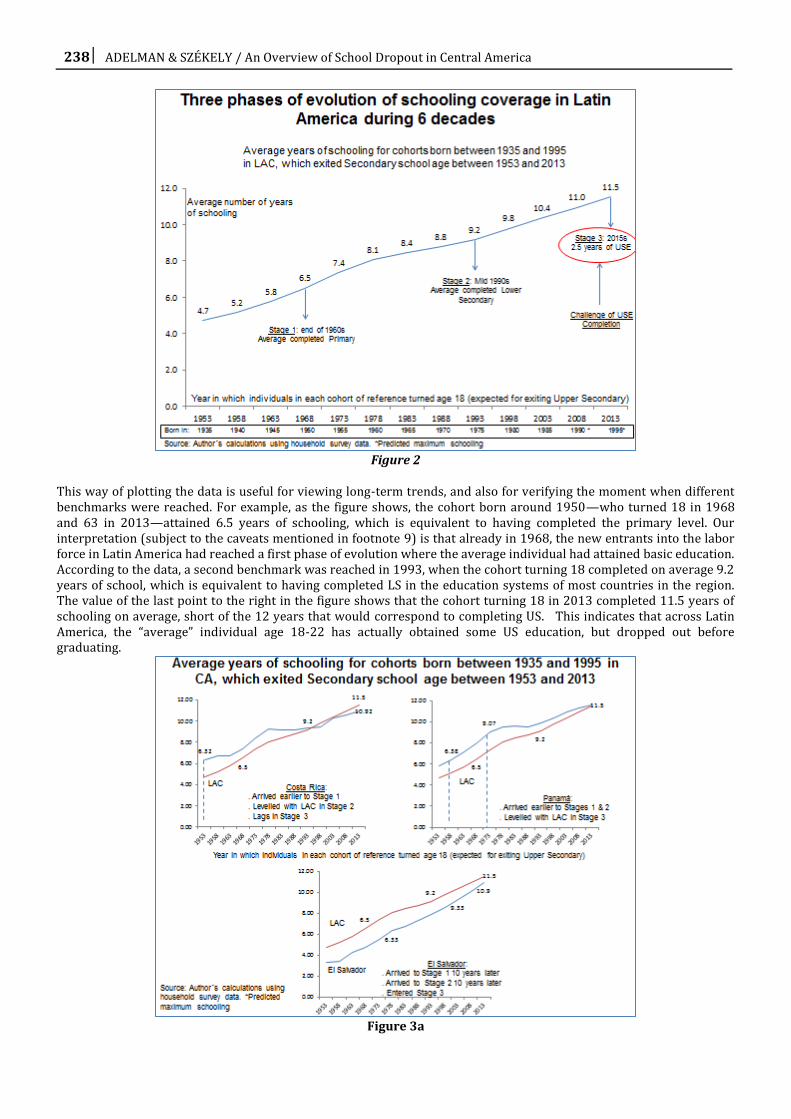
Taking a long-term regional view of the extent and speed of education progress helps to place the current dropout challenge in perspective. This is illustrated in Figure 2, which plots the average years of schooling of individuals belonging to different cohorts across all of Latin America, reported in the latest household survey available for each country (circa 2013). According to these estimations, individuals belonging to the cohort born in 1935-40, and who were ages 78-82 in the year of observation (that is, 2013), attained on average 4.7 years of schooling. 8 When comparing them to the average of 11.5 years of schooling attained by the cohort born 60 years later in 1990-1995, and who were ages 18-23 in 2013, we conclude that that there has been an increase of 6.8 years of average educational attainment across generations over the period.9
7 Some countries in Latin America with slightly different arrangements are Bolivia, Chile and the Dominican Republic where LS has a 2-year duration, while in Colombia and Peru secondary comprises 5 years and is not divided into two segments.
8 The year of birth of each cohort appears at the bottom of the Figure. For illustration, take again the case of El Salvador, where the latest household survey was held in 2013. In these data it is possible to identify, for instance, all individuals in the 78-82 age group, who by definition were born between 1935 and 1940, and thus turned 18 during the period 1953-58 -which is the age at which individuals are expected to have exited US and either continued to tertiary or entered the workforce. Since household surveys report the number of official years of schooling and the maximum level reached for all individuals, it is possible to determine the average schooling level of the cohort. Additionally, since schooling occurs at early ages and typically stops by ages 20-24, it is possible to interpret the result as the education acquired by the cohort during schooling age. The same exercise can be performed for all individuals who were age 18-22 in 2013, and were therefore born in the 1990-1995 period, as well as for all cohorts in between the two extremes. The Figure plots the average years of schooling for subsequent cohorts born between 1935 and 1995 for the 18 Latin American countries for which we have data –the data points correspond to unweighted regional averages.
9 Evidently, cohorts can change in composition over time and this can affect the averages obtained. Specifically, if there is differential mortality, emigration, or immigration, the averages will not reflect the profile of the same population over time, and can bias the picture. For instance, if those migrating outside of the country at prime age have relatively lower or higher education levels that those remaining in the country, the average years of schooling of those observed in the remaining cohort might be biased upward or downward, respectively. Unfortunately there is not sufficient data to correct for this for the countries included in our analysis, but we believe that the picture is still illustrative. In the case of mortality, if rates are higher the lower the education level, pictures such as that in Figure 2 would be upward biased.
238 ADELMAN & SZÉKELY / An Overview of School Dropout in Central America
Figure 2
This way of plotting the data is useful for viewing long-term trends, and also for verifying the moment when different benchmarks were reached. For example, as the figure shows, the cohort born around 1950—who turned 18 in 1968 and 63 in 2013—attained 6.5 years of schooling, which is equivalent to having completed the primary level. Our interpretation (subject to the caveats mentioned in footnote 9) is that already in 1968, the new entrants into the labor force in Latin America had reached a first phase of evolution where the average individual had attained basic education. According to the data, a second benchmark was reached in 1993, when the cohort turning 18 completed on average 9.2 years of school, which is equivalent to having completed LS in the education systems of most countries in the region. The value of the last point to the right in the figure shows that the cohort turning 18 in 2013 completed 11.5 years of schooling on average, short of the 12 years that would correspond to completing US. This indicates that across Latin America, the “average” individual age 18-22 has actually obtained some US education, but dropped out before graduating.
Figure 3a
European Journal of Educational Research 239
The overall trend in Latin America helps to place Central America in context, and to identify diversity within the sub-region. From this long-term perspective, there are clear differences between Costa Rica and Panama on the one hand, and Guatemala, Honduras, and Nicaragua on the other, with El Salvador somewhere in between. Figure 3a shows that Panama and Costa Rica reached the first benchmark of average primary completion around 15 years earlier than the Latin America average. Costa Rica levelled off with Latin America by reaching the second stage also in 1993, but has recently lost some ground—18 year olds in 2013 had attained an average of only 10.9 years of education. Panama reached the second stage of LS completion around 20 years before the Latin America average, but subsequently levelled off to the point that the latest cohort registers the same average years of schooling as the average for the region. El Salvador shows the opposite pattern, lagging behind the Latin America average by about 10 years in reaching the first two benchmarks, and then increasing faster and almost catching up, to the extent that the latest cohort falls short only about 0.6 years of schooling with respect to the region –with an average of 10.9 years completed, the same as Costa Rica. Thus, for Costa Rica, Panama, and El Salvador, the US dropout phenomenon is clearly a central challenge.
Figure 3b
Guatemala, Honduras, and Nicaragua also face this challenge, but additionally, they are still struggling with the issue of LS completion. As shown in Figure 3b, Guatemala and Honduras reached average primary school completion about 30 and 25 years after the Latin America average, respectively, and have just entered the second phase where the average individual of US exit age completes LS. Nicaragua reached the first benchmark more quickly (10 years later than the Latin America average), but also only recently reached the second benchmark of average LS completion.
For every country, national averages mask large within-country disparities, which will be explored in the subsequent sections. The picture that emerges is one of a sub-region facing new challenges of the 21st century, while still dealing with unresolved issues from the past.
Patterns of secondary dropout
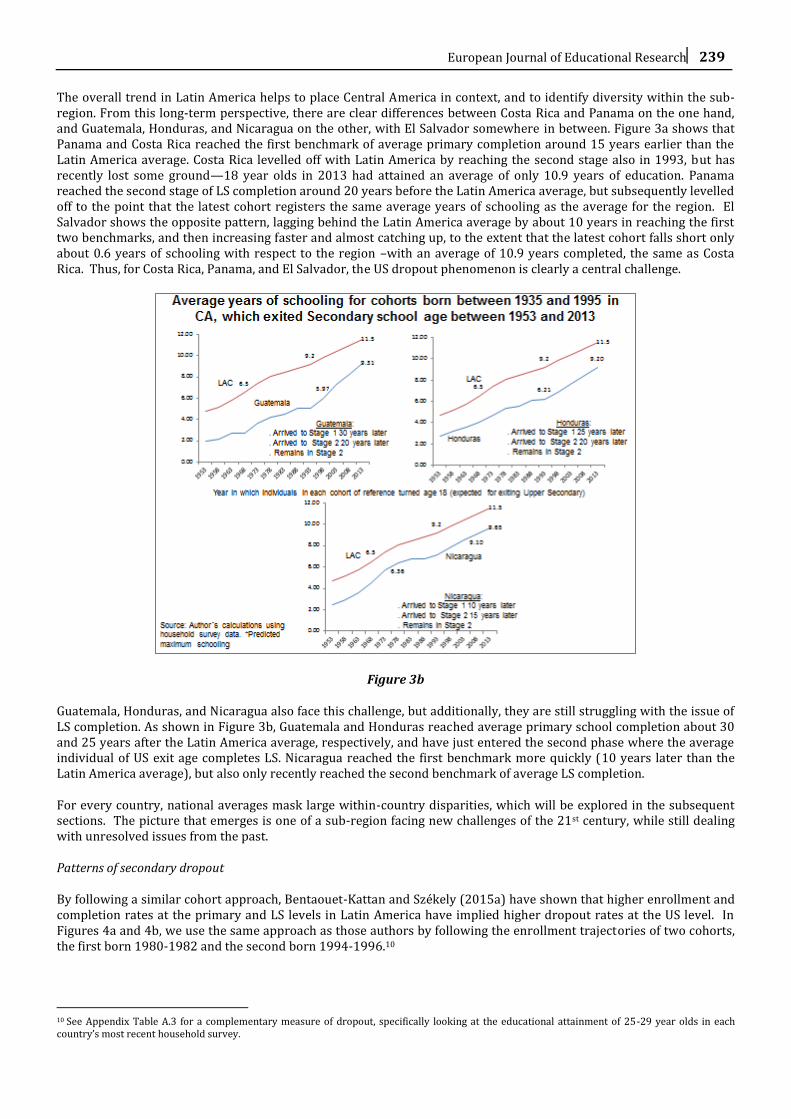
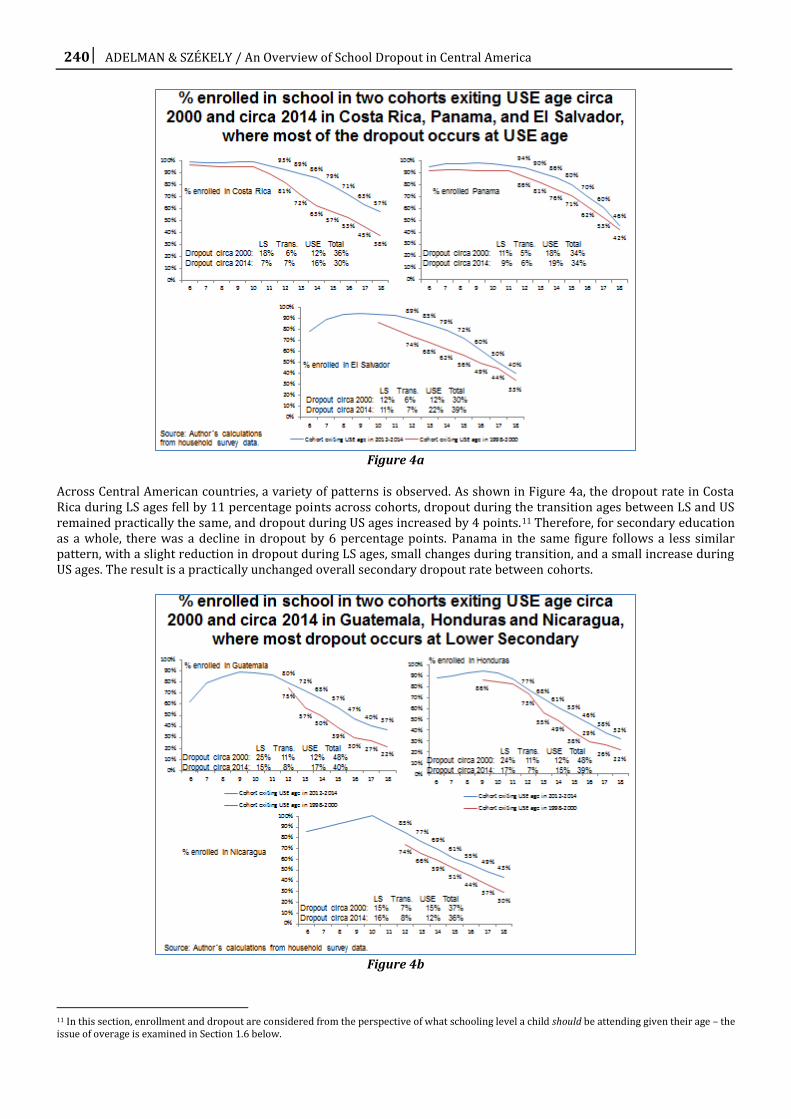
By following a similar cohort approach, Bentaouet-Kattan and Székely (2015a) have shown that higher enrollment and completion rates at the primary and LS levels in Latin America have implied higher dropout rates at the US level. In Figures 4a and 4b, we use the same approach as those authors by following the enrollment trajectories of two cohorts, the first born 1980-1982 and the second born 1994-1996.10
10 See Appendix Table A.3 for a complementary measure of dropout, specifically looking at the educational attainment of 25-29 year olds in each country’s most recent household survey.
240 ADELMAN & SZÉKELY / An Overview of School Dropout in Central America
Figure 4a
Across Central American countries, a variety of patterns is observed. As shown in Figure 4a, the dropout rate in Costa Rica during LS ages fell by 11 percentage points across cohorts, dropout during the transition ages between LS and US remained practically the same, and dropout during US ages increased by 4 points.11 Therefore, for secondary education as a whole, there was a decline in dropout by 6 percentage points. Panama in the same figure follows a less similar pattern, with a slight reduction in dropout during LS ages, small changes during transition, and a small increase during US ages. The result is a practically unchanged overall secondary dropout rate between cohorts.
Figure 4b
11 In this section, enrollment and dropout are considered from the perspective of what schooling level a child should be attending given their age – the issue of overage is examined in Section 1.6 below.
European Journal of Educational Research 241
The trajectories of the same two cohorts for El Salvador are shown in Figure 4b. Here, dropout during LS ages and during transition remained practically the same, but there is a considerable increase in dropout at US ages of 10 percentage points, which results in an increase from to 30 to 39 points in the overall dropout rate of youth of secondary school age. In Guatemala and Honduras, the overall secondary dropout rate declined, as greater declines at LS ages and transition compensated for increases at US ages. In Nicaragua, overall secondary dropout remained practically constant, although with a pattern opposite to that observed in the other five countries. In Nicaragua, LS and transition dropout both increased slightly, but the effect was counterbalanced by a reduction in dropout at US ages of 3 percentage points.
Table 1. % of dropout that occurs at each stage of secondary education for the cohort exiting US age circa 2012-2014
% of dropout occurring at
Country Lower Secondary In transition Upper Secondary Total
Costa Rica 23% 23% 53% 100%
Panama 25% 18% 57% 100%
El Salvador 27% 18% 55% 100%
Guatemala 37% 21% 42% 100%
Honduras 42% 19% 39% 100%
Nicaragua 43% 22% 34% 100%
Source: Author´s calculations from household surveys.
Table 1 summarizes the results for the latest cohort for Central America, and allows characterizing the different country patterns currently observed. In Costa Rica, Panama, and El Salvador, the majority of secondary dropout occurs during US ages. In Guatemala, Honduras, and Nicaragua somewhat similar proportions drop out during LS and US ages. In these last three countries, the emerging US dropout challenge is combined with still significant shares of youth leaving school prematurely during LS. In these same countries, it is important to note that about 20 percent of the younger cohort (those born 1994-1996) was out of school by the age of transition to LS, meaning that primary dropout, and in some cases even initial participation, also remain a challenge in these countries.
Figure 5
242 ADELMAN & SZÉKELY / An Overview of School Dropout in Central America
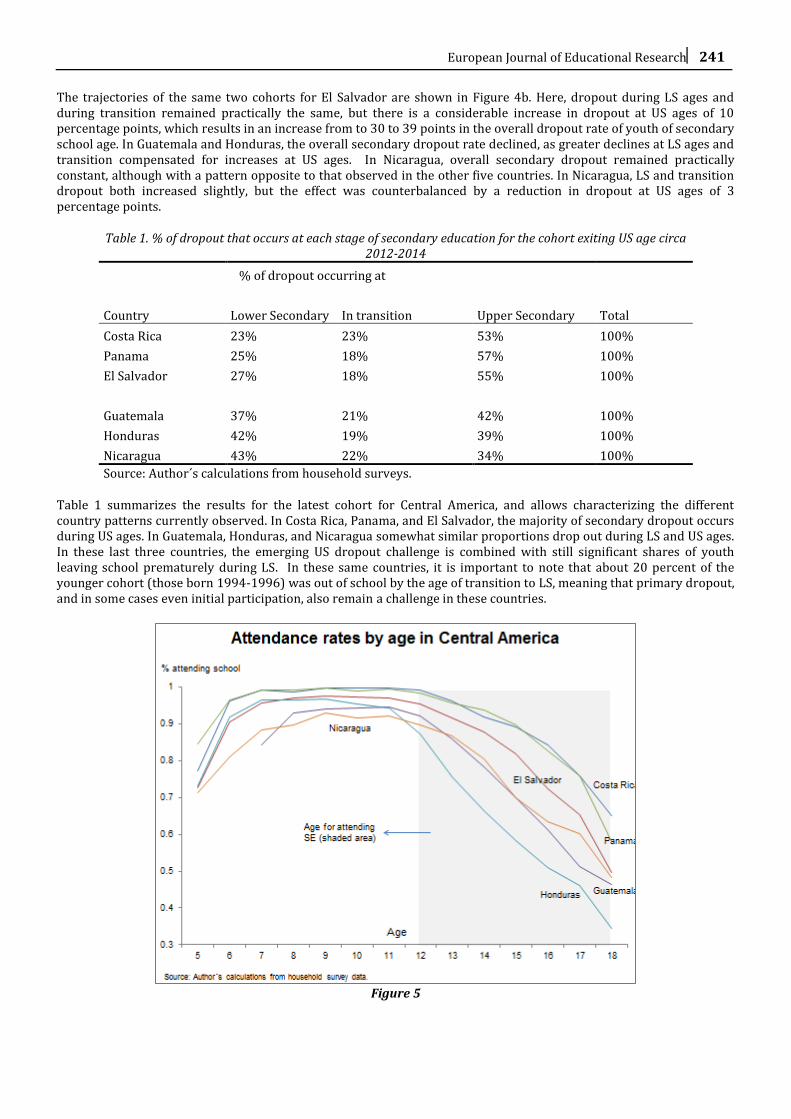
Cohort analysis such as that presented above helps to clarify the dynamic aspects of dropout that underlie the long-term changes shown in Figure 3. In order to complete the picture in terms of differences across countries, we also describe current levels of enrollment at different ages. Figure 5 plots the proportion of individuals ages 7-18 who were enrolled in the schooling system circa 2013. The main feature of the figure is that between ages 7 and 11, relatively small differences of around 10 percentage points are observed across the six Central American countries, with Nicaragua at the lower end of the spectrum, and Costa Rica and Panama at the upper end. 12
However, at age 12, when secondary entry is generally expected to occur, considerable and expanding disparities arise, to the extent that by age 17 the difference between the highest enrollment rates observed in Costa Rica and Panama (75 percent) are practically 30 percentage points higher than that observed in Honduras (46 percent). In between is El Salvador with an enrollment rate of 65 percent of 17 year olds, followed by Nicaragua with 60 percent, and Guatemala with 51 percent.
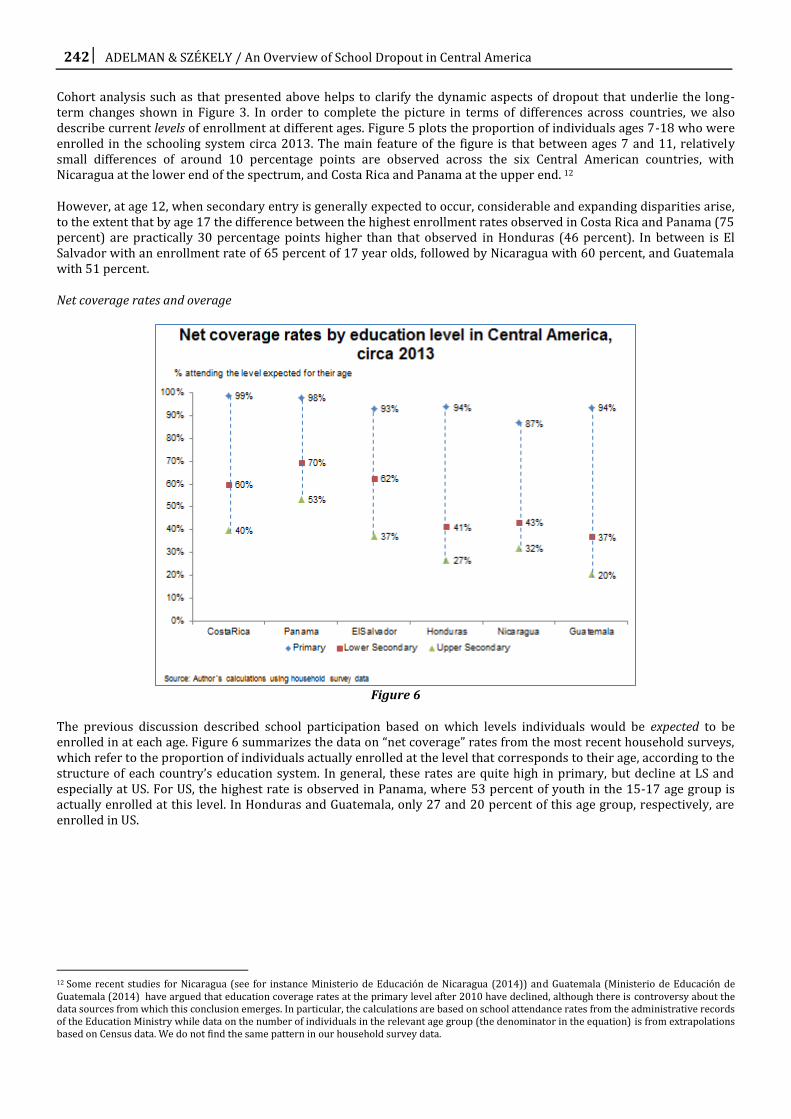
Net coverage rates and overage
Figure 6
The previous discussion described school participation based on which levels individuals would be expected to be enrolled in at each age. Figure 6 summarizes the data on “net coverage” rates from the most recent household surveys, which refer to the proportion of individuals actually enrolled at the level that corresponds to their age, according to the structure of each country’s education system. In general, these rates are quite high in primary, but decline at LS and especially at US. For US, the highest rate is observed in Panama, where 53 percent of youth in the 15-17 age group is actually enrolled at this level. In Honduras and Guatemala, only 27 and 20 percent of this age group, respectively, are enrolled in US.
12 Some recent studies for Nicaragua (see for instance Ministerio de Educación de Nicaragua (2014)) and Guatemala (Ministerio de Educación de Guatemala (2014) have argued that education coverage rates at the primary level after 2010 have declined, although there is controversy about the data sources from which this conclusion emerges. In particular, the calculations are based on school attendance rates from the administrative records of the Education Ministry while data on the number of individuals in the relevant age group (the denominator in the equation) is from extrapolations based on Census data. We do not find the same pattern in our household survey data.
European Journal of Educational Research 243
Figure 7
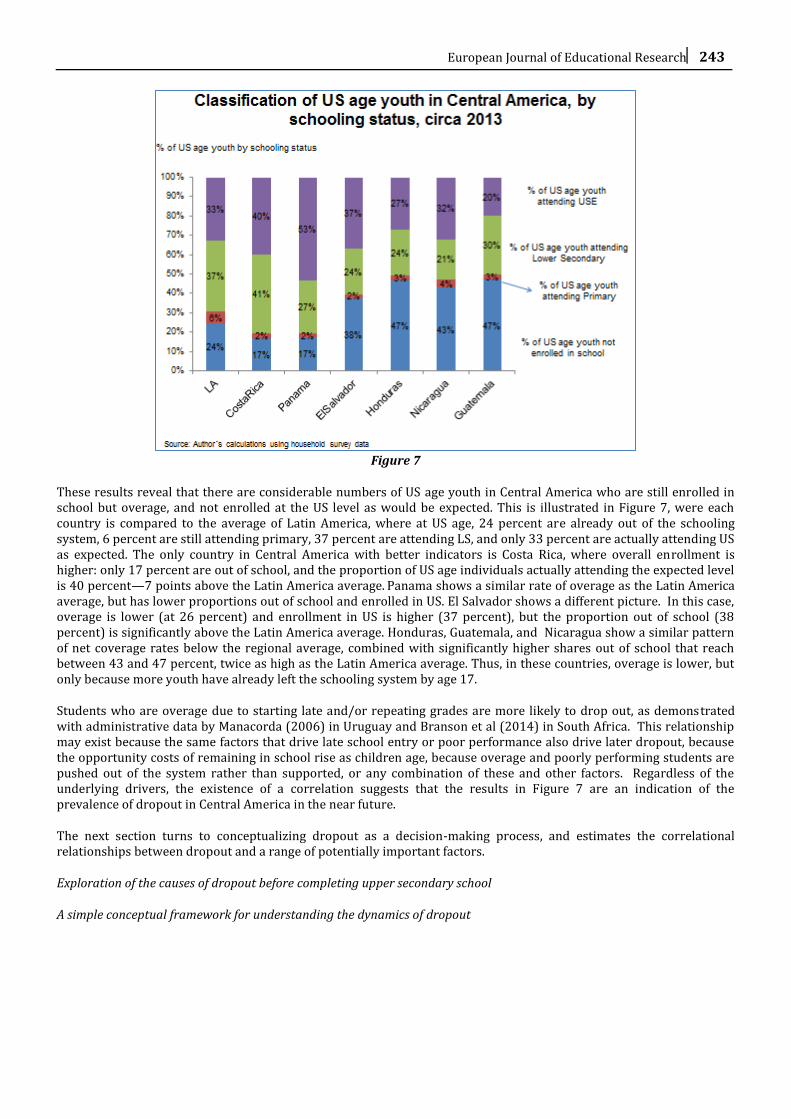
These results reveal that there are considerable numbers of US age youth in Central America who are still enrolled in school but overage, and not enrolled at the US level as would be expected. This is illustrated in Figure 7, were each country is compared to the average of Latin America, where at US age, 24 percent are already out of the schooling system, 6 percent are still attending primary, 37 percent are attending LS, and only 33 percent are actually attending US as expected. The only country in Central America with better indicators is Costa Rica, where overall enrollment is higher: only 17 percent are out of school, and the proportion of US age individuals actually attending the expected level is 40 percent—7 points above the Latin America average. Panama shows a similar rate of overage as the Latin America average, but has lower proportions out of school and enrolled in US. El Salvador shows a different picture. In this case, overage is lower (at 26 percent) and enrollment in US is higher (37 percent), but the proportion out of school (38 percent) is significantly above the Latin America average. Honduras, Guatemala, and Nicaragua show a similar pattern of net coverage rates below the regional average, combined with significantly higher shares out of school that reach between 43 and 47 percent, twice as high as the Latin America average. Thus, in these countries, overage is lower, but only because more youth have already left the schooling system by age 17.
Students who are overage due to starting late and/or repeating grades are more likely to drop out, as demonstrated with administrative data by Manacorda (2006) in Uruguay and Branson et al (2014) in South Africa. This relationship may exist because the same factors that drive late school entry or poor performance also drive later dropout, because the opportunity costs of remaining in school rise as children age, because overage and poorly performing students are pushed out of the system rather than supported, or any combination of these and other factors. Regardless of the underlying drivers, the existence of a correlation suggests that the results in Figure 7 are an indication of the prevalence of dropout in Central America in the near future.
The next section turns to conceptualizing dropout as a decision-making process, and estimates the correlational relationships between dropout and a range of potentially important factors.
Exploration of the causes of dropout before completing upper secondary school
A simple conceptual framework for understanding the dynamics of dropout
244 ADELMAN & SZÉKELY / An Overview of School Dropout in Central America
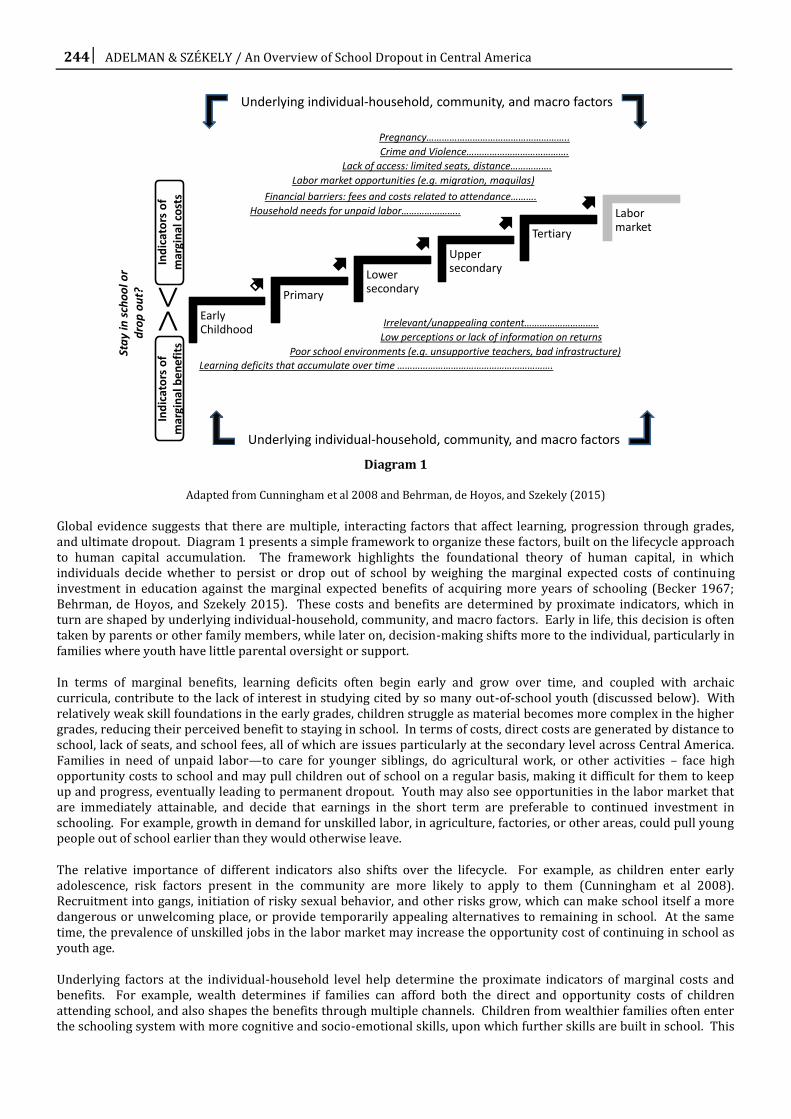
Diagram 1
Adapted from Cunningham et al 2008 and Behrman, de Hoyos, and Szekely (2015)
Global evidence suggests that there are multiple, interacting factors that affect learning, progression through grades, and ultimate dropout. Diagram 1 presents a simple framework to organize these factors, built on the lifecycle approach to human capital accumulation. The framework highlights the foundational theory of human capital, in which individuals decide whether to persist or drop out of school by weighing the marginal expected costs of continuing investment in education against the marginal expected benefits of acquiring more years of schooling (Becker 1967; Behrman, de Hoyos, and Szekely 2015). These costs and benefits are determined by proximate indicators, which in turn are shaped by underlying individual-household, community, and macro factors. Early in life, this decision is often taken by parents or other family members, while later on, decision-making shifts more to the individual, particularly in families where youth have little parental oversight or support.
In terms of marginal benefits, learning deficits often begin early and grow over time, and coupled with archaic curricula, contribute to the lack of interest in studying cited by so many out-of-school youth (discussed below). With relatively weak skill foundations in the early grades, children struggle as material becomes more complex in the higher grades, reducing their perceived benefit to staying in school. In terms of costs, direct costs are generated by distance to school, lack of seats, and school fees, all of which are issues particularly at the secondary level across Central America. Families in need of unpaid labor—to care for younger siblings, do agricultural work, or other activities – face high opportunity costs to school and may pull children out of school on a regular basis, making it difficult for them to keep up and progress, eventually leading to permanent dropout. Youth may also see opportunities in the labor market that are immediately attainable, and decide that earnings in the short term are preferable to continued investment in schooling. For example, growth in demand for unskilled labor, in agriculture, factories, or other areas, could pull young people out of school earlier than they would otherwise leave.
The relative importance of different indicators also shifts over the lifecycle. For example, as children enter early adolescence, risk factors present in the community are more likely to apply to them (Cunningham et al 2008). Recruitment into gangs, initiation of risky sexual behavior, and other risks grow, which can make school itself a more dangerous or unwelcoming place, or provide temporarily appealing alternatives to remaining in school. At the same time, the prevalence of unskilled jobs in the labor market may increase the opportunity cost of continuing in school as youth age.
Underlying factors at the individual-household level help determine the proximate indicators of marginal costs and benefits. For example, wealth determines if families can afford both the direct and opportunity costs of children attending school, and also shapes the benefits through multiple channels. Children from wealthier families often enter the schooling system with more cognitive and socio-emotional skills, upon which further skills are built in school. This
Early Childhood
Primary
Lower secondary
Upper secondary
Tertiary
Labor market
Learning deficits that accumulate over time …………………………………………………….Poor school environments (e.g. unsupportive teachers, bad infrastructure)
Irrelevant/unappealing content………………………..
Lack of access: limited seats, distance…………….
Household needs for unpaid labor…………………..
Labor market opportunities (e.g. migration, maquilas)
Pregnancy………………………………………………..
Crime and Violence………………………………….In
dic
ato
rs o
f m
argi
nal
be
nef
its
Ind
icat
ors
of
mar
gin
al c
ost
s Financial barriers: fees and costs related to attendance……….
Low perceptions or lack of information on returns
Underlying individual-household, community, and macro factors
Sta
y in
sch
oo
l or
dro
p o
ut?
Underlying individual-household, community, and macro factors
European Journal of Educational Research 245
concept of dynamic complementarity, that human capital built early makes subsequent investments in human capital more productive, implies that as children get older, those who did not build strong foundational skills in early childhood and primary school are likely to struggle more as they progress to secondary, reducing the benefits of continuing to attend (Cunha and Heckman 2007). Household wealth also affects individuals’ willingness to trade off between today and tomorrow (which may be considered an aspect of socio-emotional skills), and the information and perceptions individuals and their families have about the benefits of completing different levels of education.
Many community-level and macro characteristics also help determine costs and benefits. Access to school, particularly at the upper secondary (US) level, may be very limited in rural communities, while the quality of schooling services available is often low. Social and cultural norms around what levels of educational attainment are acceptable, and for whom, also factor into decision-making, as do the prevalence of teenage pregnancy, early marriage, participation in crime and violence, and migration -- all of which are highly relevant factors in Central America -- may be both causes and consequences of dropout. Beyond the community, economic growth and labor market trends both at the national and international levels affect government budgets and education policies, remittances, and job opportunities, which in turn affect the quality and accessibility of schooling, its affordability, and its opportunity cost.
These underlying factors are likely to interact within each level, and also across levels in important ways. For example, economic growth and strong local labor market conditions may increase household incomes, making more resources available for investing in the human capital of household members. However, the same opportunities might generate the additional effect of pulling youth out of school by increasing the opportunity cost of remaining enrolled and losing out on income generation possibilities. These economic changes may also influence the information set available to youth and their families, shaping their perceptions of the returns to education. The final result depends in part on the skill content of the increasing labor demand.
At all levels, negative shocks can have substantial impacts on schooling decisions. Health shocks to individual family members, major weather events that affect entire communities, and aggregate economic shocks can all impact on the short to medium-term tradeoff of costs and benefits to staying in school. Importantly, these short-term impacts affect what is often a long-term decision, as most youth who leave school do not return.
As shown in Table 1 above, countries in Central America differ in the segment of secondary where dropout takes place. Therefore, as discussed in the conceptual framework, the reasons for dropout are likely to vary from country to country, as well as along the schooling trajectory. A relevant source of information for understanding the causes of dropout is found in the same household surveys used so far, as most of them directly ask youth who have left the education system to register the main reasons why they decided to leave school.13
Figure 8
13 It should be mentioned that these are self-reported causes, and that a multiple choice format with pre-defined alternatives is provided for the answer. All possible reasons for dropout are not included, and the response is based on each young person´s perception of the cause of dropout, and also on their understanding of the meaning of the multiple choices provided for the answer.
246 ADELMAN & SZÉKELY / An Overview of School Dropout in Central America
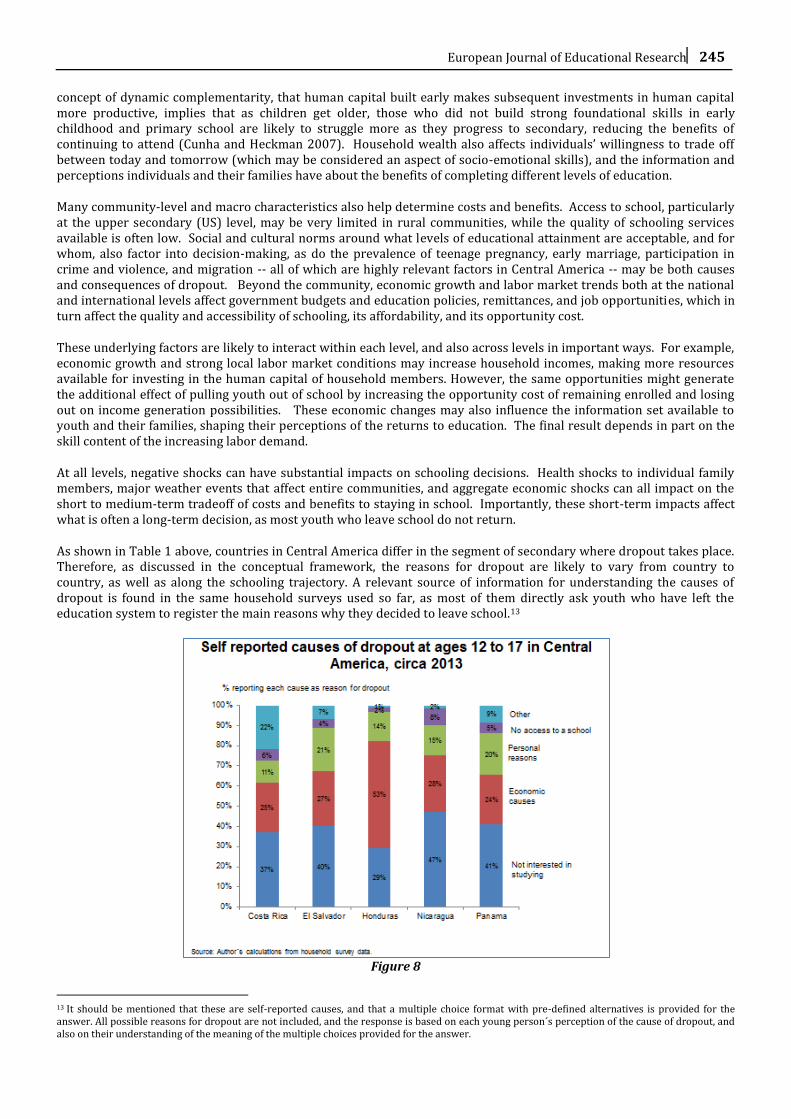
Figure 8 summarizes the self-reported causes for individuals of secondary school attendance age for the five Central American countries for which household surveys report this indicator. We have grouped the answers into five categories, comprising economic factors (related to having to work, insufficient family or personal income for investing in education, not enough resources for travelling to school or to purchase materials, etc., and poverty), personal factors (sickness, having to perform household responsibilities, pregnancy, marriage, etc.), not interested in studying (which includes categories such as “dislikes school”, “considers what schools teach to be irrelevant”, “thinks that what is learned in school is not relevant”, etc.), no access to education services, and other reasons that are not included in the previous categories.
In four of the five countries, the reason that most youth indicate as the primary cause for having dropped out is that they were not interested in studying: 37, 40, 41, and 47 percent report this as the main cause in Costa Rica, El Salvador, Nicaragua, and Panama, respectively. The second leading cause cited by youth is the lack of economic resources to continue attending school, with percentages around 25 percent in all five countries. Honduras stands out as the only country where the majority of youth reports economic causes as the main factor, with 53 percent, while only 29 percent express that lack of interest in studying is the main reason.
The importance of personal reasons varies from 11 percent in Costa Rica, to 20-21 percent in Panama and El Salvador. Access to education services is reported as the main cause by a relatively low share: in Nicaragua, 8 percent of youth out of school report that the reason why they do not attend is because the service is not available, while in Costa Rica, Panama, El Salvador, and Honduras the proportions are 6, 5, 4, and 2 percent, respectively. However, it is possible that this reason is correlated with economic factors, since access to education services can be associated with the economic capacity of individuals and households for financing transport costs to where the service is provided.
The declared reasons for dropping out also differ by gender. For males, economic reasons are most often cited, while females are more likely to cite personal reasons, including having to perform household tasks. In most countries, a larger share of males declare lack of interest as the main cause for having left school, although this category is highly relevant for females as well. In order to go beyond these individual perceptions, the following sections examine empirical correlations and causal evidence on dropouts, utilizing the structure of the conceptual framework presented above.
Empirical correlations: Personal and household characteristics
Rigorous assessment of the causal relationships suggested by the conceptual framework requires data that is unfortunately not readily available in Central America. In particular, long-term and detailed longitudinal data that follows individuals from early life through at least adolescence would allow researchers to link early indicators, such as primary learning outcomes, to eventual dropout. This type of data has not been collected. However, several natural experiments, caused by weather shocks in particular, have been exploited in Central America, the broader Latin America region, and globally – insights gained from these will be mentioned below.
Given the limited causal evidence, we focus in this section on verifying the existence and magnitude of correlations between dropout and the factors identified by the conceptual framework. In particular, we estimate the marginal effect of variables captured in household surveys on the probability of being enrolled in school in each country for youth ages 15 to 17.14 We estimate a probit regression for each country using the latest household survey available, first focusing on individual (X), household (H), and community (Z) characteristics:
(1)
14 This is an approximation for dropout, as a small share of the youth who are not enrolled were never enrolled, and another small share may return to the schooling system in the future.
European Journal of Educational Research 247
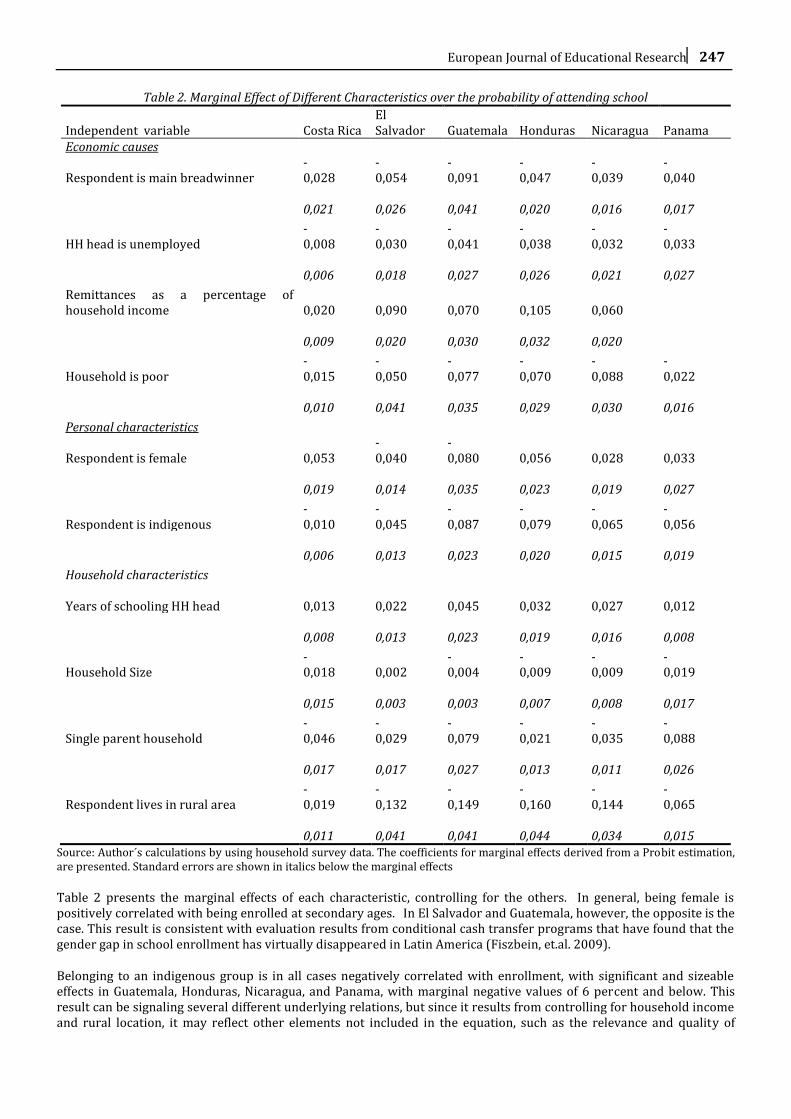
Table 2. Marginal Effect of Different Characteristics over the probability of attending school
Independent variable Costa Rica El Salvador Guatemala Honduras Nicaragua Panama
Economic causes
Respondent is main breadwinner - 0,028
- 0,054
- 0,091
- 0,047
- 0,039
- 0,040
0,021
0,026
0,041
0,020
0,016
0,017
HH head is unemployed
- 0,008
- 0,030
- 0,041
- 0,038
- 0,032
- 0,033
0,006
0,018
0,027
0,026
0,021
0,027
Remittances as a percentage of household income
0,020
0,090
0,070
0,105
0,060
0,009
0,020
0,030
0,032
0,020
Household is poor
- 0,015
- 0,050
- 0,077
- 0,070
- 0,088
- 0,022
0,010
0,041
0,035
0,029
0,030
0,016
Personal characteristics
Respondent is female 0,053
- 0,040
- 0,080
0,056
0,028
0,033
0,019
0,014
0,035
0,023
0,019
0,027
Respondent is indigenous
- 0,010
- 0,045
- 0,087
- 0,079
- 0,065
- 0,056
0,006
0,013
0,023
0,020
0,015
0,019
Household characteristics
Years of schooling HH head 0,013
0,022
0,045
0,032
0,027
0,012
0,008
0,013
0,023
0,019
0,016
0,008
Household Size
- 0,018
0,002
- 0,004
- 0,009
- 0,009
- 0,019
0,015
0,003
0,003
0,007
0,008
0,017
Single parent household
- 0,046
- 0,029
- 0,079
- 0,021
- 0,035
- 0,088
0,017
0,017
0,027
0,013
0,011
0,026
Respondent lives in rural area
- 0,019
- 0,132
- 0,149
- 0,160
- 0,144
- 0,065
0,011
0,041
0,041
0,044
0,034
0,015
Source: Author´s calculations by using household survey data. The coefficients for marginal effects derived from a Probit estimation, are presented. Standard errors are shown in italics below the marginal effects
Table 2 presents the marginal effects of each characteristic, controlling for the others. In general, being female is positively correlated with being enrolled at secondary ages. In El Salvador and Guatemala, however, the opposite is the case. This result is consistent with evaluation results from conditional cash transfer programs that have found that the gender gap in school enrollment has virtually disappeared in Latin America (Fiszbein, et.al. 2009).
Belonging to an indigenous group is in all cases negatively correlated with enrollment, with significant and sizeable effects in Guatemala, Honduras, Nicaragua, and Panama, with marginal negative values of 6 percent and below. This result can be signaling several different underlying relations, but since it results from controlling for household income and rural location, it may reflect other elements not included in the equation, such as the relevance and quality of
248 ADELMAN & SZÉKELY / An Overview of School Dropout in Central America
education, including access to bilingual education or the adaptation of national curriculums to local contexts, which are important issues in Panama and other countries (World Bank 2014a).15
In all countries, household poverty, an unemployed household head, and the youth playing the role of main breadwinner, are each negatively correlated with enrollment, but statistical significance varies. The negative effect of poverty is significant across countries, and is larger in Guatemala, Honduras, and Nicaragua.
We include in the estimation the share of household income that originates through remittances, in order to capture one of the channels through which migration, a particularly relevant factor in Central America, can influence enrollment. Among the five countries (all but Panama) for which data are available, remittances are significantly positively correlated with the probability of youth being enrolled in school at ages 12 to 17 in all but Costa Rica. The effects are particularly large in Honduras and El Salvador, with positive values of 11 and 9 percent, respectively.
The marginal effects of additional characteristics of the household are also relevant. In particular, we include a dummy variable for single-parent households which may relate to the amount of family support youth receive and what they are responsible for in the household. This may also be a mechanism through which migration affects dropout, since when an important breadwinner leaves the family unit, responsibilities are likely reassigned, with new demands on income-earning activities or household-related chores that may impose constraints on time use by secondary age youth, which can affect school attendance.16 The marginal effect on school enrollment of being in a single-parent household is negative in every country and significant in most cases.
If single-parenthood is associated with migration, the value of the marginal effect for this variable should be added to the positive effect of remittances to obtain a more complete sense of the overall effect. When doing so, we find that the positive effect of remittances on enrollment is canceled out in Costa Rica and Guatemala (although marginally). In the other countries where both effects can be measured, the positive effect prevails. These positive correlations, however, have not held up in research for El Salvador that attempts to control for a more complete set of factors that may affect both remittances and school participation through various techniques (Propensity Score Matching, Instrumental Variables, etc.) and by using panel data (Acosta 2011a; Acosta 2011b). In these papers, the author finds that both the gender of the migrant and the gender of the remaining youth matters – for example, while male migration does not significantly affect enrollment, female migration reduces it even though women send more remittances, potentially in line with the discussion of reassignment of household duties discussed above.
In general, we find that higher education levels of the household head tend to have a positive marginal effect on enrollment, but, holding other factors constant, is not significant in most countries.17 This variable is of interest for several reasons. One is that parental education can influence how much parents invest in their children’s human capital development from the beginning of life onwards. Additionally, as in the case of household income, it can be an indicator of the level of economic mobility in society, where a lower influence of parental education on children´s schooling would be an indication of greater mobility. To explore this further, we compute the unconditional correlation between parent´s education and the value of the schooling gap, measured as the difference between the number of years of schooling expected given the age of an individual and the actual number of years completed, for all individuals in the 12-17 age range (Ferreira et al 2012).
15 Indigenous group status is also self-reported, which may affect how these correlations are interpreted.
16 Evidently, there are other reasons why a household can be of single parent, but due to the high migration rates in some CA counties it is likely that an important source is precisely the exit of one parent that seeks employment in another region or country.
17 The lack of significance is not entirely surprising given how many other variables related to household head’s education are being controlled for, including household poverty and single-parent status
European Journal of Educational Research 249
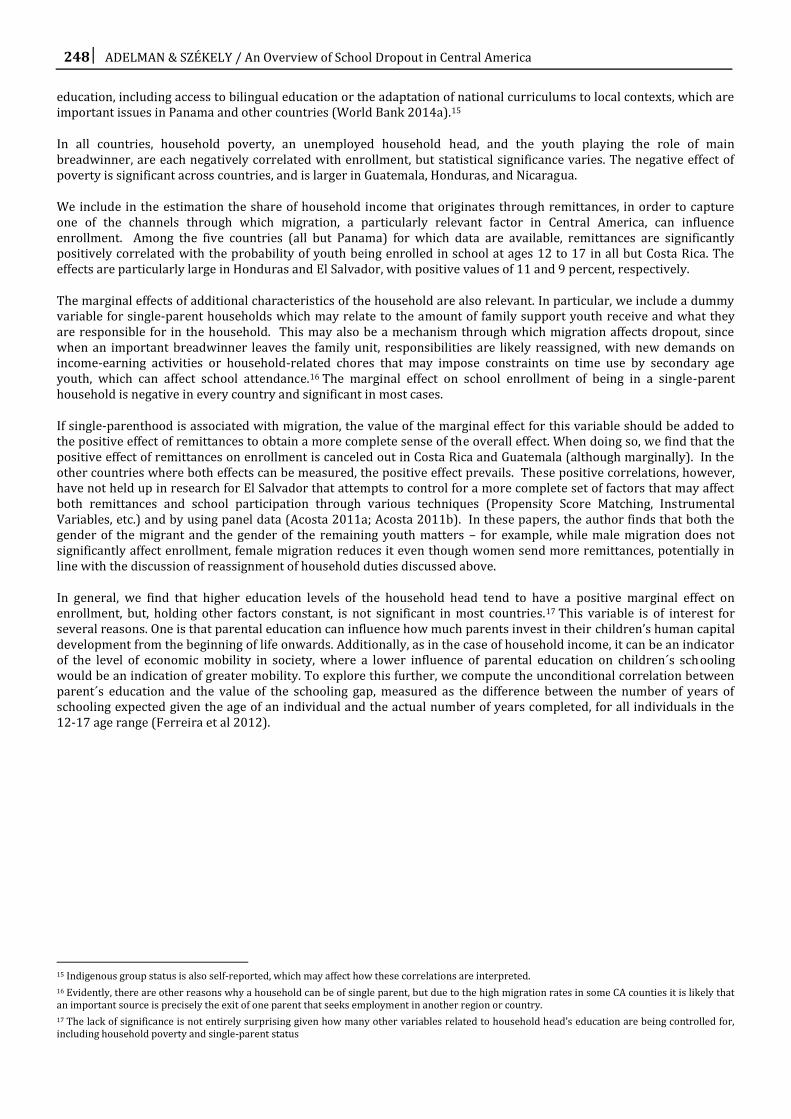
Table 3. Correlation coefficient between schooling gap for individuals between 12 and 17 years of age, and the number of years of schooling of the household head Country Circa 2000 Circa 2005 Circa 2012
Average LAC -44% -43% -37%
CostaRica -51% -44% -40%
ElSalvador -54% -48% -44%
Honduras -51% -50% -51%
Nicaragua -52% -52% -51%
Panama -52% -48% -46%
Guatemala -63% -50% -47%
Source: Author´s calculations with household survey data. Schooling gap is calculated as the value of expected years of formal education for a given age, and the actual years attained
Table 3 presents the results for each Central American country for circa 2000, 2005, and 2012. For each of these periods, the Latin American average is below the result for Central America, which suggests that in general, (schooling) mobility is lower in Central America. The countries with the highest correlation coefficients are Honduras and Nicaragua with values of 51 percent, suggesting that these two countries have the lowest educational mobility in the sub-region. Guatemala, Panama, and El Salvador follow with values of 47, 46, and 44 percent, respectively, and Costa Rica registers the lowest value with 40 percent. As for the evolution of these relationships, Guatemala is the country with the largest decline over time, followed by Panama, El Salvador, and Costa Rica. In contrast, Honduras and Nicaragua, show constant correlations since the year 2000, suggesting no progress in mobility.
The last set of marginal effects focuses on the location of households in rural versus urban areas. The estimates show that in all countries, living in a rural area is significantly correlated with the probability of being enrolled during secondary age, and notably, this is the marginal effect with the greatest magnitude in El Salvador, Guatemala, Honduras, and Nicaragua, where living in a rural area is associated with a reduced probability of enrolment of 13, 15, 16, and 14 percent, respectively. There are several channels through which geographic location can influence school attendance, and given that this effect results from an estimation that controls for personal and household characteristics, it is possible that this is capturing the effect of access to services, especially at the US levels. For example, in Honduras, analysis finds that over 1,000 additional secondary schools in rural areas would be needed to provide access for all secondary-age youth who are currently out of school, compared to the fewer than 200 that are currently operating today (World Bank 2014b).
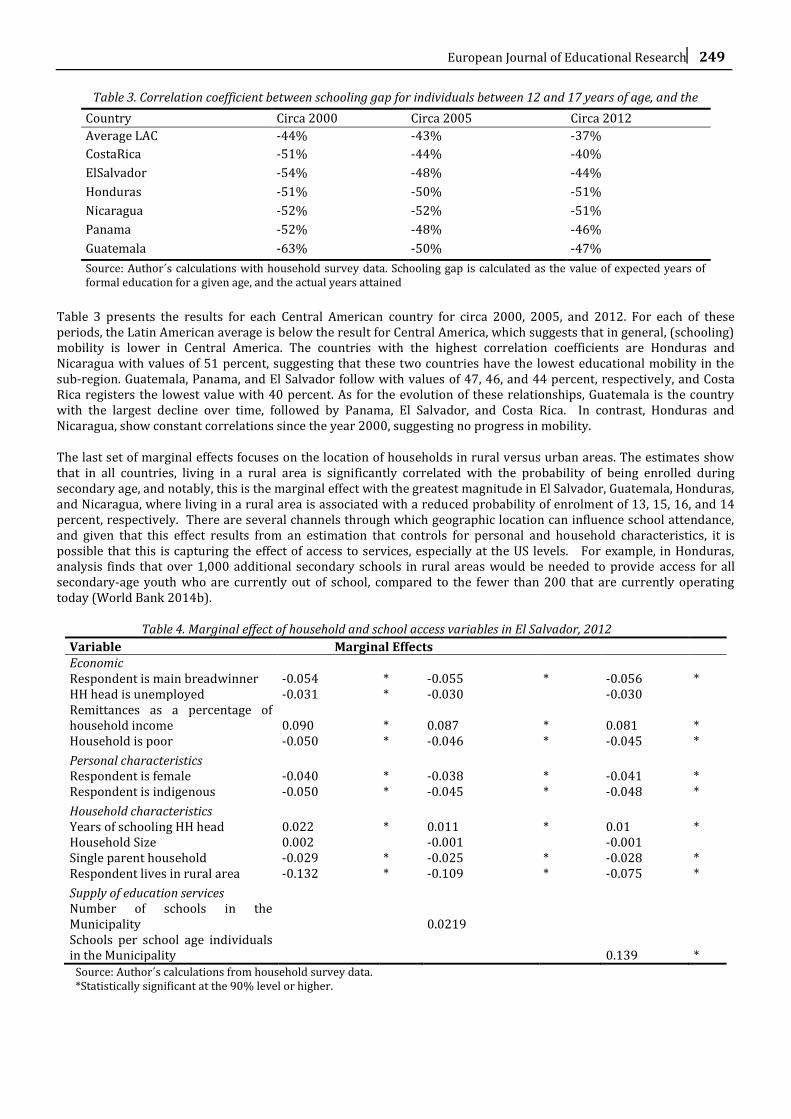
Table 4. Marginal effect of household and school access variables in El Salvador, 2012 Variable Marginal Effects
Economic Respondent is main breadwinner -0.054 * -0.055 * -0.056 * HH head is unemployed -0.031 * -0.030
-0.030
Remittances as a percentage of household income 0.090 * 0.087 * 0.081 * Household is poor -0.050 * -0.046 * -0.045 *
Personal characteristics Respondent is female -0.040 * -0.038 * -0.041 *
Respondent is indigenous -0.050 * -0.045 * -0.048 *
Household characteristics Years of schooling HH head 0.022 * 0.011 * 0.01 *
Household Size 0.002
-0.001
-0.001 Single parent household -0.029 * -0.025 * -0.028 *
Respondent lives in rural area -0.132 * -0.109 * -0.075 *
Supply of education services Number of schools in the
Municipality
0.0219 Schools per school age individuals
in the Municipality 0.139 * Source: Author´s calculations from household survey data. *Statistically significant at the 90% level or higher.
250 ADELMAN & SZÉKELY / An Overview of School Dropout in Central America
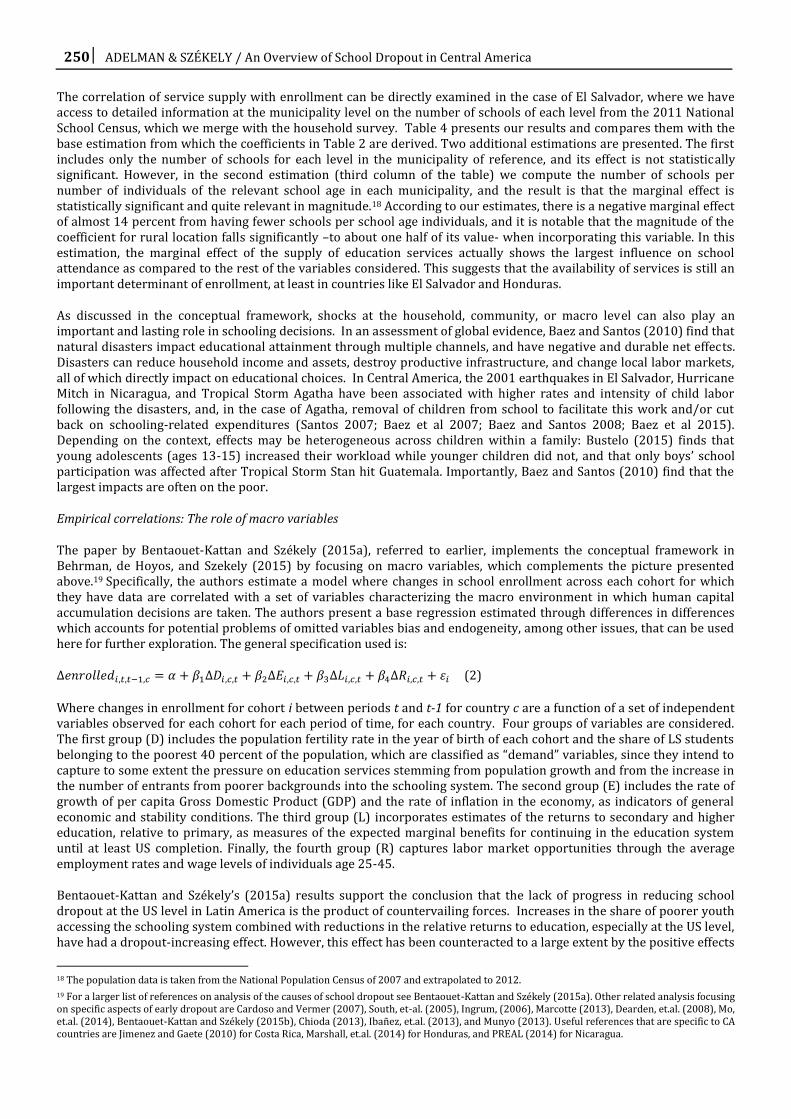
The correlation of service supply with enrollment can be directly examined in the case of El Salvador, where we have access to detailed information at the municipality level on the number of schools of each level from the 2011 National School Census, which we merge with the household survey. Table 4 presents our results and compares them with the base estimation from which the coefficients in Table 2 are derived. Two additional estimations are presented. The first includes only the number of schools for each level in the municipality of reference, and its effect is not statistically significant. However, in the second estimation (third column of the table) we compute the number of schools per number of individuals of the relevant school age in each municipality, and the result is that the marginal effect is statistically significant and quite relevant in magnitude.18 According to our estimates, there is a negative marginal effect of almost 14 percent from having fewer schools per school age individuals, and it is notable that the magnitude of the coefficient for rural location falls significantly –to about one half of its value- when incorporating this variable. In this estimation, the marginal effect of the supply of education services actually shows the largest influence on school attendance as compared to the rest of the variables considered. This suggests that the availability of services is still an important determinant of enrollment, at least in countries like El Salvador and Honduras.
As discussed in the conceptual framework, shocks at the household, community, or macro level can also play an important and lasting role in schooling decisions. In an assessment of global evidence, Baez and Santos (2010) find that natural disasters impact educational attainment through multiple channels, and have negative and durable net effects. Disasters can reduce household income and assets, destroy productive infrastructure, and change local labor markets, all of which directly impact on educational choices. In Central America, the 2001 earthquakes in El Salvador, Hurricane Mitch in Nicaragua, and Tropical Storm Agatha have been associated with higher rates and intensity of child labor following the disasters, and, in the case of Agatha, removal of children from school to facilitate this work and/or cut back on schooling-related expenditures (Santos 2007; Baez et al 2007; Baez and Santos 2008; Baez et al 2015). Depending on the context, effects may be heterogeneous across children within a family: Bustelo (2015) finds that young adolescents (ages 13-15) increased their workload while younger children did not, and that only boys’ school participation was affected after Tropical Storm Stan hit Guatemala. Importantly, Baez and Santos (2010) find that the largest impacts are often on the poor.
Empirical correlations: The role of macro variables
The paper by Bentaouet-Kattan and Székely (2015a), referred to earlier, implements the conceptual framework in Behrman, de Hoyos, and Szekely (2015) by focusing on macro variables, which complements the picture presented above.19 Specifically, the authors estimate a model where changes in school enrollment across each cohort for which they have data are correlated with a set of variables characterizing the macro environment in which human capital accumulation decisions are taken. The authors present a base regression estimated through differences in differences which accounts for potential problems of omitted variables bias and endogeneity, among other issues, that can be used here for further exploration. The general specification used is:
(2)
Where changes in enrollment for cohort i between periods t and t-1 for country c are a function of a set of independent variables observed for each cohort for each period of time, for each country. Four groups of variables are considered. The first group (D) includes the population fertility rate in the year of birth of each cohort and the share of LS students belonging to the poorest 40 percent of the population, which are classified as “demand” variables, since they intend to capture to some extent the pressure on education services stemming from population growth and from the increase in the number of entrants from poorer backgrounds into the schooling system. The second group (E) includes the rate of growth of per capita Gross Domestic Product (GDP) and the rate of inflation in the economy, as indicators of general economic and stability conditions. The third group (L) incorporates estimates of the returns to secondary and higher education, relative to primary, as measures of the expected marginal benefits for continuing in the education system until at least US completion. Finally, the fourth group (R) captures labor market opportunities through the average employment rates and wage levels of individuals age 25-45.
Bentaouet-Kattan and Székely’s (2015a) results support the conclusion that the lack of progress in reducing school dropout at the US level in Latin America is the product of countervailing forces. Increases in the share of poorer youth accessing the schooling system combined with reductions in the relative returns to education, especially at the US level, have had a dropout-increasing effect. However, this effect has been counteracted to a large extent by the positive effects
18 The population data is taken from the National Population Census of 2007 and extrapolated to 2012.
19 For a larger list of references on analysis of the causes of school dropout see Bentaouet-Kattan and Székely (2015a). Other related analysis focusing on specific aspects of early dropout are Cardoso and Vermer (2007), South, et-al. (2005), Ingrum, (2006), Marcotte (2013), Dearden, et.al. (2008), Mo, et.al. (2014), Bentaouet-Kattan and Székely (2015b), Chioda (2013), Ibañez, et.al. (2013), and Munyo (2013). Useful references that are specific to CA countries are Jimenez and Gaete (2010) for Costa Rica, Marshall, et.al. (2014) for Honduras, and PREAL (2014) for Nicaragua.
European Journal of Educational Research 251
on enrollment from lower fertility rates, greater economic stability, higher wages, and more employment opportunities, which could be promoting increased human capital investments through an income effect.
Table 5. Change in the value of independent variables explaining school dropout during 2000-2012
Demand side variables
Macro variables Labor market variables
(Ages 25-45)
Change in returns to schooling (Ages 25-55) Country Change in
Fertility Rate across Cohorts
Change in the % of poor youth graduating from LS
Annual Growth of Inflation GDP per Rate capita
Change in Real Average Wages
Change in Employment Rate
Higher Educ. Relative to Primary
US Relative to Primary
Costa Rica -1.33 15%
2.6% 15.0%
11.50% 7.0%
-19.6% -2.0%
El Salvador -1.69 12%
1.4% 4.0%
-6.40% 3.0%
-12.5% -30.7%
Guatemala -1.61 10%
0.8% 8.0%
-1.90% 8.0%
-19.7% -1.1%
Honduras -1.99 7%
2.1% 10.0%
0.00% 11.0%
13.6% 17.4%
Nicaragua -2.12 8%
1.7% 11.0%
8.20% 11.0%
6.1% -18.5%
Panama -0.53 6%
4.9% 3.0%
3.50% 12.0%
-9.7% -8.9%
Total Latin America -1.90
12% 2.5% 11.5% 9.30% 6.0% -3.5% -6.7%
Source: Betauet-Kattan and Székely (2015).
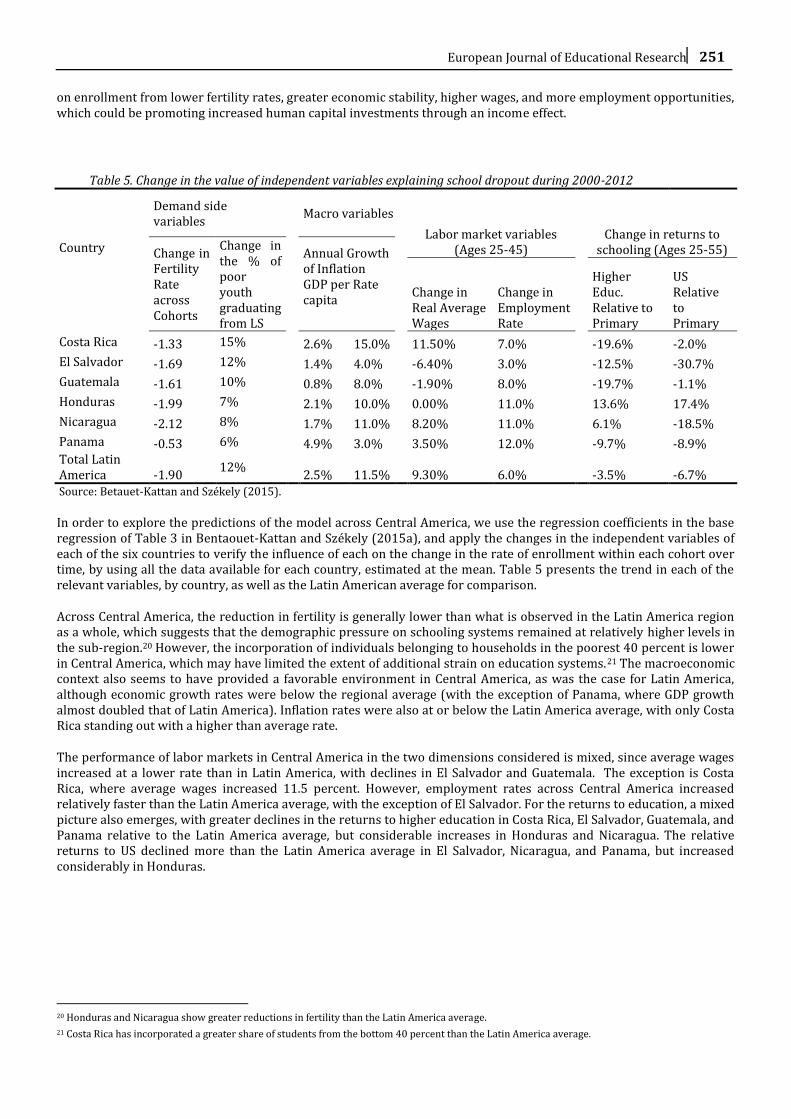
In order to explore the predictions of the model across Central America, we use the regression coefficients in the base regression of Table 3 in Bentaouet-Kattan and Székely (2015a), and apply the changes in the independent variables of each of the six countries to verify the influence of each on the change in the rate of enrollment within each cohort over time, by using all the data available for each country, estimated at the mean. Table 5 presents the trend in each of the relevant variables, by country, as well as the Latin American average for comparison.
Across Central America, the reduction in fertility is generally lower than what is observed in the Latin America region as a whole, which suggests that the demographic pressure on schooling systems remained at relatively higher levels in the sub-region.20 However, the incorporation of individuals belonging to households in the poorest 40 percent is lower in Central America, which may have limited the extent of additional strain on education systems.21 The macroeconomic context also seems to have provided a favorable environment in Central America, as was the case for Latin America, although economic growth rates were below the regional average (with the exception of Panama, where GDP growth almost doubled that of Latin America). Inflation rates were also at or below the Latin America average, with only Costa Rica standing out with a higher than average rate.
The performance of labor markets in Central America in the two dimensions considered is mixed, since average wages increased at a lower rate than in Latin America, with declines in El Salvador and Guatemala. The exception is Costa Rica, where average wages increased 11.5 percent. However, employment rates across Central America increased relatively faster than the Latin America average, with the exception of El Salvador. For the returns to education, a mixed picture also emerges, with greater declines in the returns to higher education in Costa Rica, El Salvador, Guatemala, and Panama relative to the Latin America average, but considerable increases in Honduras and Nicaragua. The relative returns to US declined more than the Latin America average in El Salvador, Nicaragua, and Panama, but increased considerably in Honduras.
20 Honduras and Nicaragua show greater reductions in fertility than the Latin America average.
21 Costa Rica has incorporated a greater share of students from the bottom 40 percent than the Latin America average.
252 ADELMAN & SZÉKELY / An Overview of School Dropout in Central America
Figure 9
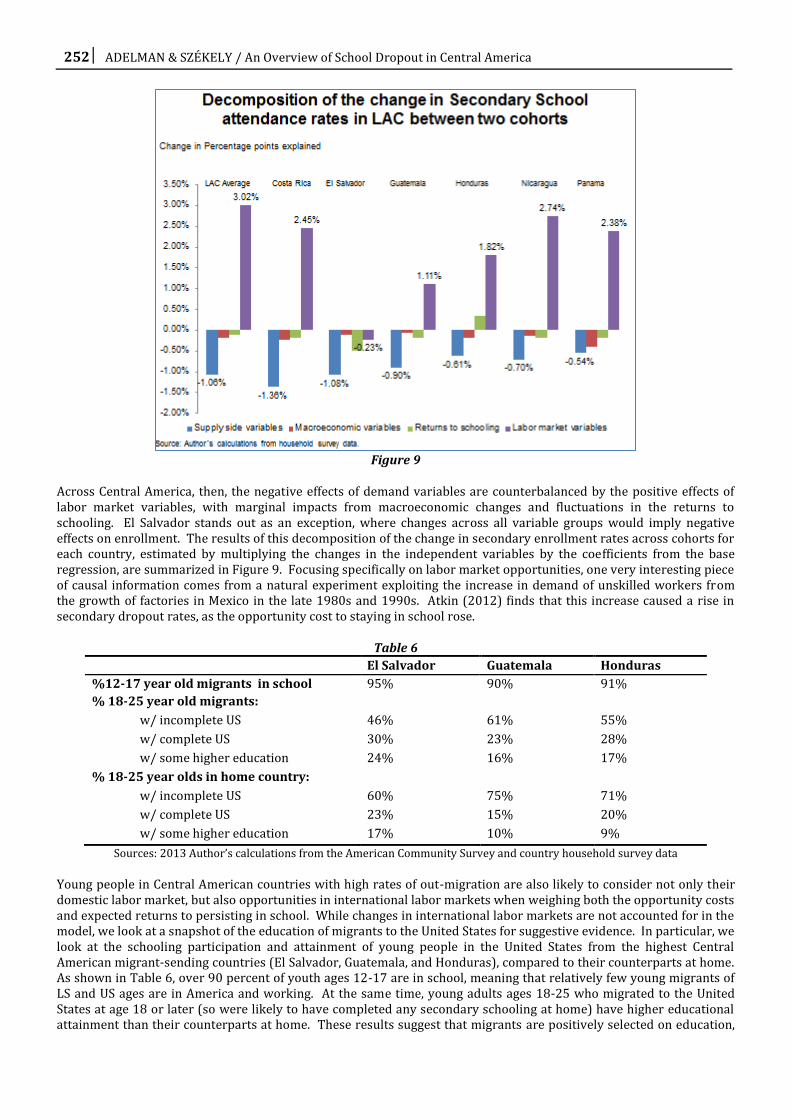
Across Central America, then, the negative effects of demand variables are counterbalanced by the positive effects of labor market variables, with marginal impacts from macroeconomic changes and fluctuations in the returns to schooling. El Salvador stands out as an exception, where changes across all variable groups would imply negative effects on enrollment. The results of this decomposition of the change in secondary enrollment rates across cohorts for each country, estimated by multiplying the changes in the independent variables by the coefficients from the base regression, are summarized in Figure 9. Focusing specifically on labor market opportunities, one very interesting piece of causal information comes from a natural experiment exploiting the increase in demand of unskilled workers from the growth of factories in Mexico in the late 1980s and 1990s. Atkin (2012) finds that this increase caused a rise in secondary dropout rates, as the opportunity cost to staying in school rose.
Table 6
El Salvador Guatemala Honduras
%12-17 year old migrants in school 95% 90% 91%
% 18-25 year old migrants:
w/ incomplete US 46% 61% 55%
w/ complete US 30% 23% 28%
w/ some higher education 24% 16% 17%
% 18-25 year olds in home country:
w/ incomplete US 60% 75% 71%
w/ complete US 23% 15% 20%
w/ some higher education 17% 10% 9%
Sources: 2013 Author’s calculations from the American Community Survey and country household survey data
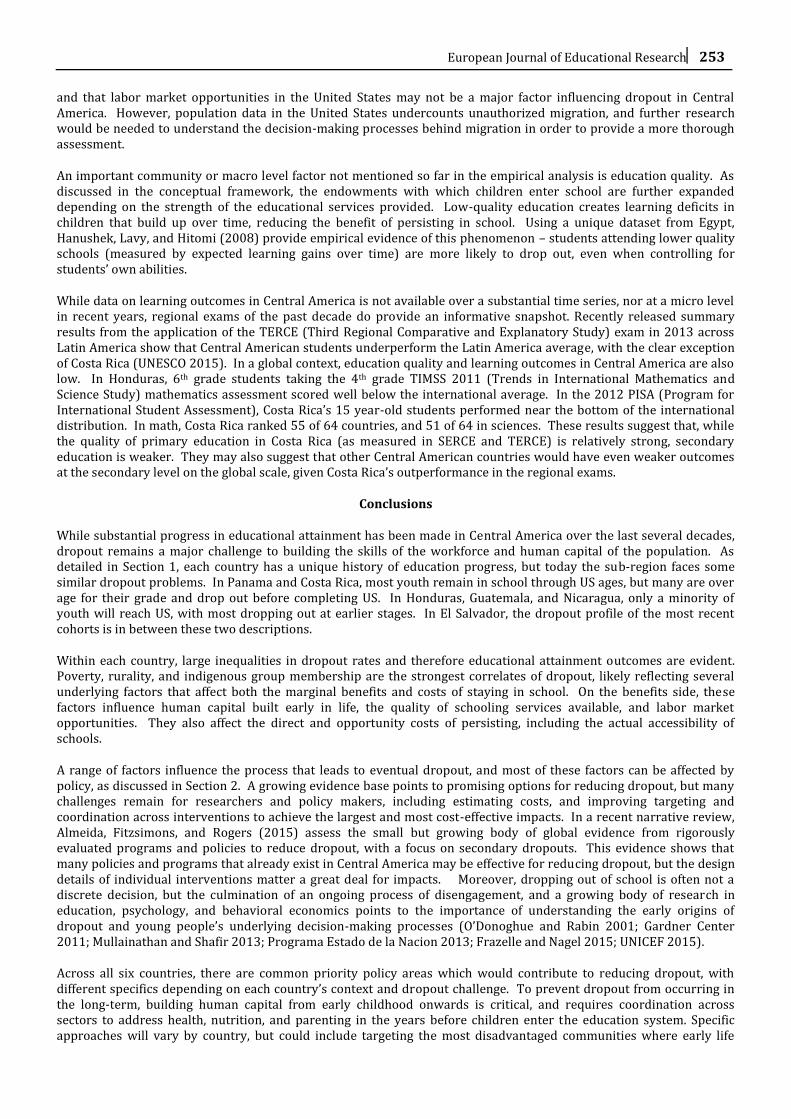
Young people in Central American countries with high rates of out-migration are also likely to consider not only their domestic labor market, but also opportunities in international labor markets when weighing both the opportunity costs and expected returns to persisting in school. While changes in international labor markets are not accounted for in the model, we look at a snapshot of the education of migrants to the United States for suggestive evidence. In particular, we look at the schooling participation and attainment of young people in the United States from the highest Central American migrant-sending countries (El Salvador, Guatemala, and Honduras), compared to their counterparts at home. As shown in Table 6, over 90 percent of youth ages 12-17 are in school, meaning that relatively few young migrants of LS and US ages are in America and working. At the same time, young adults ages 18-25 who migrated to the United States at age 18 or later (so were likely to have completed any secondary schooling at home) have higher educational attainment than their counterparts at home. These results suggest that migrants are positively selected on education,
European Journal of Educational Research 253
and that labor market opportunities in the United States may not be a major factor influencing dropout in Central America. However, population data in the United States undercounts unauthorized migration, and further research would be needed to understand the decision-making processes behind migration in order to provide a more thorough assessment.
An important community or macro level factor not mentioned so far in the empirical analysis is education quality. As discussed in the conceptual framework, the endowments with which children enter school are further expanded depending on the strength of the educational services provided. Low-quality education creates learning deficits in children that build up over time, reducing the benefit of persisting in school. Using a unique dataset from Egypt, Hanushek, Lavy, and Hitomi (2008) provide empirical evidence of this phenomenon – students attending lower quality schools (measured by expected learning gains over time) are more likely to drop out, even when controlling for students’ own abilities.
While data on learning outcomes in Central America is not available over a substantial time series, nor at a micro level in recent years, regional exams of the past decade do provide an informative snapshot. Recently released summary results from the application of the TERCE (Third Regional Comparative and Explanatory Study) exam in 2013 across Latin America show that Central American students underperform the Latin America average, with the clear exception of Costa Rica (UNESCO 2015). In a global context, education quality and learning outcomes in Central America are also low. In Honduras, 6th grade students taking the 4th grade TIMSS 2011 (Trends in International Mathematics and Science Study) mathematics assessment scored well below the international average. In the 2012 PISA (Program for International Student Assessment), Costa Rica’s 15 year-old students performed near the bottom of the international distribution. In math, Costa Rica ranked 55 of 64 countries, and 51 of 64 in sciences. These results suggest that, while the quality of primary education in Costa Rica (as measured in SERCE and TERCE) is relatively strong, secondary education is weaker. They may also suggest that other Central American countries would have even weaker outcomes at the secondary level on the global scale, given Costa Rica’s outperformance in the regional exams.
Conclusions
While substantial progress in educational attainment has been made in Central America over the last several decades, dropout remains a major challenge to building the skills of the workforce and human capital of the population. As detailed in Section 1, each country has a unique history of education progress, but today the sub-region faces some similar dropout problems. In Panama and Costa Rica, most youth remain in school through US ages, but many are over age for their grade and drop out before completing US. In Honduras, Guatemala, and Nicaragua, only a minority of youth will reach US, with most dropping out at earlier stages. In El Salvador, the dropout profile of the most recent cohorts is in between these two descriptions.
Within each country, large inequalities in dropout rates and therefore educational attainment outcomes are evident. Poverty, rurality, and indigenous group membership are the strongest correlates of dropout, likely reflecting several underlying factors that affect both the marginal benefits and costs of staying in school. On the benefits side, these factors influence human capital built early in life, the quality of schooling services available, and labor market opportunities. They also affect the direct and opportunity costs of persisting, including the actual accessibility of schools.
A range of factors influence the process that leads to eventual dropout, and most of these factors can be affected by policy, as discussed in Section 2. A growing evidence base points to promising options for reducing dropout, but many challenges remain for researchers and policy makers, including estimating costs, and improving targeting and coordination across interventions to achieve the largest and most cost-effective impacts. In a recent narrative review, Almeida, Fitzsimons, and Rogers (2015) assess the small but growing body of global evidence from rigorously evaluated programs and policies to reduce dropout, with a focus on secondary dropouts. This evidence shows that many policies and programs that already exist in Central America may be effective for reducing dropout, but the design details of individual interventions matter a great deal for impacts. Moreover, dropping out of school is often not a discrete decision, but the culmination of an ongoing process of disengagement, and a growing body of research in education, psychology, and behavioral economics points to the importance of understanding the early origins of dropout and young people’s underlying decision-making processes (O’Donoghue and Rabin 2001; Gardner Center 2011; Mullainathan and Shafir 2013; Programa Estado de la Nacion 2013; Frazelle and Nagel 2015; UNICEF 2015).
Across all six countries, there are common priority policy areas which would contribute to reducing dropout, with different specifics depending on each country’s context and dropout challenge. To prevent dropout from occurring in the long-term, building human capital from early childhood onwards is critical, and requires coordination across sectors to address health, nutrition, and parenting in the years before children enter the education system. Specific approaches will vary by country, but could include targeting the most disadvantaged communities where early life
254 ADELMAN & SZÉKELY / An Overview of School Dropout in Central America
outcomes are known to be weakest. Within school systems, both de jure and de facto access are in need of attention. In Nicaragua, making LS compulsory and expanding supply accordingly are necessary first steps, while in Honduras, El Salvador, and possibly Guatemala, expanding supply is needed to fulfill existing compulsory schooling laws. In Panama and Costa Rica, where US participation rates are highest, the focus may need to be more on practices within schools, in terms of increasing support for poorly performing students and changing school cultures to make universal completion the expectation.
The quality of education provided, on average and in particular to lower socioeconomic groups, is also a priority area which would contribute to preventing dropout. While learning outcomes at the primary level in Costa Rica are relatively strong on average, large differences across socioeconomic groups persist, and learning at the secondary level appears to be much weaker. In all other Central American countries, average learning outcomes at the primary level are low, and a host of promising reforms to increase autonomy, assessment, and accountability are at various stages of implementation in several countries. To the extent possible, rigorous evaluations of these efforts, such as the ones of teacher and principal trainings in El Salvador and Mexico, should be conducted and should include cost data to help inform policy making in the region and beyond.
To directly intervene among youth at high risk of dropping out, countries can consider developing early warning systems, and piloting comprehensive support programs for identified youth. Such an approach would be most promising in countries with strong administrative data, and would need to be targeted to the levels where dropout starts to occur at substantial rates. Given that dropout rates are so high, school or community-level programs might make more sense than individual-level programs.
Reforming the targeting, coverage, and coherence of existing programs would also help. Some existing conditional cash transfer and other support programs are not well-targeted, while others are well-targeted but are too small to cover the majority of the eligible. In addition, there may be opportunities to improve the design of existing programs to increase their impacts, based on insights from behavioral economics, for example by structuring the timing of transfers to maximize impacts on the decision to persist in school. Given that most countries have multiple social protection and school support programs aimed at overlapping populations, rationalizing and coordinating across programs may provide both increased impact and cost savings. Finally, based on the evidence that child labor is commonly used as a coping strategy in response to shocks in the region, rapid scale-up mechanisms for existing programs, in terms of expanding coverage or increasing support following shocks, could also play a role in reducing dropout.
References
Acosta, P. (2011)a. Female Migration and Child Occupation in Rural El Salvador. Population Research and Policy Review, 30(4), 569–589.
Acosta, P. (2011)b. School Attendance, Child Labour, and Remittances from International Migration in El Salvador. Journal of Development Studies, 47(6), 913-936.
Ambler, K., Aycinena D. and Yang. D. (2014). Channeling Remittances to Education: A Field Experiment Among Migrants from El Salvador. NBER Working Paper 20262. NBER: Cambridge, MA.
Atkin, D. (2012). Endogeneous Skill Acquisition and Export Manufacturing in Mexico. NBER Working Paper 18266. NBER: Cambridge, MA.
Avitabile, C. and Rafael de H. (2014). Heterogeneous Effects of Information about the Returns to Schooling on Student Learning: Evidence from a Randomized Control Trial in Mexico. World Bank Working Paper. World Bank: Washington, D.C.
Azevedo, J. P., Favara M., Haddock S., Lopez-Calva L., Muller M., and Perova E. (2012). Teenage Pregnancy and Opportunities in Latin American and the Caribbean. World Bank: Washington, D.C.
Javier, B., & Santos, I. (2007). Children’s Vulnerability to Weather Shocks: Natural Disasters as a Natural Experiment. Unpublished Working Paper.
Javier, B., & Santos, I. (2008). On Shaky Ground: The Effects of Earthquakes on Household Income and Poverty. United Nations Development Program: New York, NY.
European Journal of Educational Research 255
Javier, B., de la Fuente, A., & Santos, I. (2010). Do Natural Disasters Affect Human Capital? An Assessment Based on Existing Empirical Evidence. IZA Working Paper 5164.
Javier, B., Lucchetti, L., Genoni, M., & Salazar, M. (2015). Gone with the Storm: Rainfall Shocks and Household Wellbeing in Guatemala. World Bank Working Paper. World Bank: Washington, D.C
Barro, R. J., & Lee J. W. (2010). A New Dataset of Educational Attainment in the World, 1950-2010. Journal of Development Economics, 104, 184-198.
Bassi, M., Busso, M., & Muñoz, J. S. (2013). Is the Glass Half Empty of Half Full? School Enrollment, Graduation and Dropout Rates in Latin America. IDB Working Paper Series No. IDB-WP-492. Inter-American Development Bank: Washington, D.C.
Bentaouet-Kattan, R., and Székely, M. (2015)a. Analyzing the Dynamics of Upper Secondary Schooling in Latin America: A Cohort Approach. World Bank Working Paper. World Bank: Washington, D.C.
Bentaouet-Kattan, R., and Székely, M. (2015)b. Patterns, Consequences and Possible Causes of Dropout in Upper Secondary Education in Mexico. Education Research International, 2015, 1-12.
Branson, N., Hofmeyr, C., & Lam, D. (2014). Progress through school and the determinants of school dropout in South Africa. Development Southern Africa, 31(1), 106-126.
Bruck, T., Di Maio, M., & Miaari, S. H.. (2014). Learning the Hard Way: The Effect of Violent Conflict on Student Academic Achievement. Households in Conflict Network Working Paper 185. University of Sussex: Brighton, England.
Barbara, B., & Luque, J. (2015). Great Teachers: How to Raise Student Learning in Latin America and the Caribbean. World Bank: Washington, D.C.
Bustelo, M.. (2015). Bearing the Burden of Natural Disasters: Child Labor and Schooling in the Aftermath of Tropic Storm Stan in Guatemala. World Bank Working Paper. World Bank: Washington, D.C
Cárdenas, M., de Hoyos, R., & Székely M. (2015). Idle Youth in Latin America: a persistent problem in a decade of prosperity. Economia, 5, 1-40.
Cardoso, A.R., & D. Vermer. (2007). School drop-out and push-out factors in Brazil: The role of early parenthood, child labor, and poverty. World Bank Working Paper WPS4178. World Bank: Washington, D.C.
Cecchini, S., & Madariaga, A. (2011). Conditional Cash Transfer Programmes: The Recent Experience in Latin America and the Caribbean. UN ECLAC: Santiago, Chile.
Chioda, L. (2013). Crime and Violence over the Life cycle in Latin America and the Caribbean. World Bank: Washington, D.C.
Cunha, F., & Heckman, J. (2007). The technology of skill formation. American Economic Review, 97(2), 31-47.
Cunningham, W., McGinnis, L., Verdú, R. G., Tesliuc, C., & Verner, D. (2008). Youth At Risk in Latin America and the Caribbean: Understanding the Causes, Realizing the Potential. World Bank: Washington, D.C.
De la Nación, E. (2013). Estado de la Educación Costarricense. Estado de la Nación: San José, Costa Rica.
Dearden, L., C. Emmerson, C. Frayne, & Meghir, C. (2008). Conditional Cash Transfers and School Dropout Rates. Journal of Human Resources, 44(4), 827-857.
Dutcher, N., & Tucker, G. (1994). The Use of First and Second Languages in Education. Working paper. World Bank: Washington, D.C.
Edwards, A. C., & Ureta, M. (2003). International migration, remittances, and schooling: evidence from El Salvador. Journal of Development Economics, 72, 429– 461.
256 ADELMAN & SZÉKELY / An Overview of School Dropout in Central America
Ferreira, Francisco, Julian Messina, Jamele Rigolini, Luis-Felipe Lopez-Calva, Maria Ana Lugo, and Renos Vakis. 2012. Economic Mobility and the Rise of the Latin American Middle Class. World Bank: Washington, D.C.
Fiszbein, A., Schady, N., & Ferreira, Francisco H.G. (2009). Conditional cash transfers: reducing present and future poverty. World Bank: Washington, D.C.
Frazelle, S., & Nagel, A. (2015). A Practitioner’s Guide to Implementing Early Warning Systems.
Fryer, R. G. (2013). Information and Student Achievement: Evidence from a Cellular Phone Experiment. NBER Working Paper 19113.
Gardner Center. (2011). Using Early Warning Systems to Predict and Prevent Dropout: Youth Data Archive Policy Factsheet. Stanford University: Palo Alto, CA.
Hanushek, E. A., Lavy, V., & Kohtaro, H. (2008). Do Students Care About Quality? Detreminants of Dropout Behavior in Developing Countries. Journal of Human Capital, 2(1), 69-105.
Ibáñez, A.M, Rodríguez, C., & Zarruk, D. (2013). Crime, Punishment, and Schooling Decisions: Evidence from Colombian Adolescents. IDB Working Paper IDB-WP-413. Inter-American Development Bank: Washington, D.C.
Ingrum, A. (2006). High School Dropout Determinants: The Effect of Poverty and Learning Disabilities. The Park Place Economist, Volume XIV.
Jensen, R. (2010). The (Perceived) Returns to Education and the Demand for Schooling. The Quarterly Journal of Economics, 125(2), 515-548.
Jimenez, W., & Gaete, M. (2010). Abandono (deserción) escolar en la enseñanza secundaria en Costa Rica, 2009-2010. Ministerio de Educación Pública, Costa Rica.
Manacorda, M. (2006). Grade Failure, Drop out and Subsequent School Outcomes: Quasi-Experimental Evidence from Uruguayan Administrative Data, Mimeo, STICERD, London,
Marcotte, D. (2013). High school dropout and teen childbearing. Economics of Education Review, 34, 258–268.
Marshall, J.H., Aguilar, J. R., Alas, M., Castellanos, R. R., Castro, L., Enamorado, R., & Fonseca, E. (2014). Alternative Education Programmes and Middle School Dropout in Honduras. International Review of Education, 60, 51–77.
Ministerio de Educación de Nicaragua. (2014). Reporte de Implementación hasta 2013, Plan Estratégico de Educación (PEE) 2011-2015. Ministerio de Educación, Managua.
Ministerio de Educación de Guatemala. (2014). Informe de revisión nacional de la educación para todos, Guatemala 2000 – 2013. Guatemala.
Mo, D., Zhang, L., Yi, H., Luo, R., Rozelle, S., & Brinton, C. (2014). School Dropouts and Conditional Cash Transfers: Evidence from a Randomised Controlled Trial in Rural China's Junior High Schools. Journal of Development Studies 49(2): 190-207.
Mullainathan, S., & Shafir, E. Scarcity: Why Having Too Little Means So Much. Picador: NY.
Munyo, I. (2013). Youth Crime in Latin America: Key Determinants and Effective Public Policy Responses. The Brookings Institution.
Nguyen, T. (2008). Information, Role Models, and the Perceived Returns to Education. Unpublished manuscript.
O’Donoghue, T., & Matthew, R. (2001). Risky Behavior among Youths: Some Issues from Behavioral Economics. In Risky Behavior among Youths: An Economic Analysis, editor Jonathan Gruber. University of Chicago Press: Chicago, IL.
OEI. (2010). 2021 Metas Educativas: La Educación Que Queremos para la Generación de los Bicentenarios. Organización de Estados Iberoamericanos para la Educación: Madrid, Spain.
European Journal of Educational Research 257
Oreopoulos, P., & Salvanes, K. G. (2011). Priceless: The Nonpecuniary Benefits of Schooling. Journal of Economic Perspectives, 25(1), 159-184.
Patrinos, H. A., & Velez, E. (2009). Costs and benefits of Bilingual Education in Guatemala: A Partial Analysis. International Journal of Education Development, 29, 594-598.
PREAL. (2014). Calidad y Equidad para el Desarrollo Humano: Nicaragua. Nicaragua.
Pritchett, L., & Beatty, A. (2015). Slow Down, You’re Going Too Fast: Matching Curricula to Student Skill Levels. International Journal of Education Development, 40, 276-288.
Santos, I. (2007). Disentangling the Effects of Natural Disasters on Children: 2001 Earthquakes in El Salvador. Dissertation. Harvard University: Cambridge, MA.
Smith, D. L. (2003). The Impact of Neighborhood Violent Crime on School Attendance. Dissertation. The University of Cincinnati: Cincinnati, Ohio.
South, S., Haynie, D.L., & Bose, S. (2007). Student Mobility and School Dropout. Social Science Research, 36, 68–94.
Székely, M., & Karver, J. (2015). Out of School and Out of Work Youth in Latin America: A Cohort Approach. World Bank Working Paper. World Bank: Washington, D.C.
UNESCO. (2015). Primera Entrega de Resultados TERCE. UNESCO: Oficina de Santiago de Chile.
UNICEF. (2013). Completar la Escuela en Centro América: Los Desafíos Pendientes. UNICEF y Coordinación Educativa y Cultural Centroamericana.
UNICEF. (2015). Factores Asociados al Abandono del Sistema Educativo en la Transición Escolar. Panama.
World Bank. (2005). Central America Education Strategy: An Agenda for Action. World Bank: Washington, D.C.
World Bank. (2014)a. Panama Systematic Country Diagnostic: Locking in Success. World Bank: Washington, D.C.
World Bank. (2014)b. Central America Social Expenditures and Institutional Review: Honduras. World Bank: Washington, D.C.
World Bank. (2015)a. Costa Rica Systematic Country Diagnostic. World Bank: Washington, D.C.
World Bank. (2015)b. El Salvador Systematic Country Diagnostic: Building on Strengths for a New Generation. World Bank: Washington, D.C.
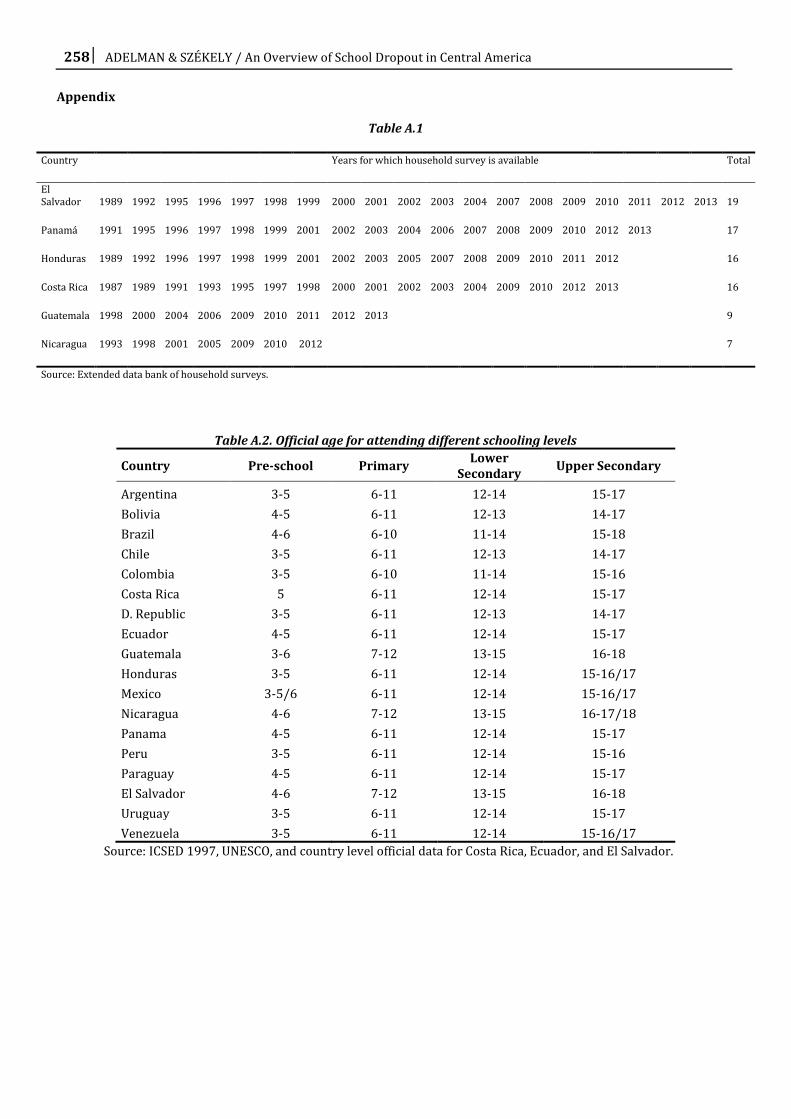
258 ADELMAN & SZÉKELY / An Overview of School Dropout in Central America
Appendix
Table A.1
Country Years for which household survey is available Total
El Salvador 1989 1992 1995 1996 1997 1998 1999 2000 2001 2002 2003 2004 2007 2008 2009 2010 2011 2012 2013 19
Panamá 1991 1995 1996 1997 1998 1999 2001 2002 2003 2004 2006 2007 2008 2009 2010 2012 2013 17
Honduras 1989 1992 1996 1997 1998 1999 2001 2002 2003 2005 2007 2008 2009 2010 2011 2012
16
Costa Rica 1987 1989 1991 1993 1995 1997 1998 2000 2001 2002 2003 2004 2009 2010 2012 2013
16
Guatemala 1998 2000 2004 2006 2009 2010 2011 2012 2013
9
Nicaragua 1993 1998 2001 2005 2009 2010 2012 7
Source: Extended data bank of household surveys.
Table A.2. Official age for attending different schooling levels
Country Pre-school Primary Lower
Secondary Upper Secondary
Argentina 3-5 6-11 12-14 15-17
Bolivia 4-5 6-11 12-13 14-17
Brazil 4-6 6-10 11-14 15-18
Chile 3-5 6-11 12-13 14-17
Colombia 3-5 6-10 11-14 15-16
Costa Rica 5 6-11 12-14 15-17
D. Republic 3-5 6-11 12-13 14-17
Ecuador 4-5 6-11 12-14 15-17
Guatemala 3-6 7-12 13-15 16-18
Honduras 3-5 6-11 12-14 15-16/17
Mexico 3-5/6 6-11 12-14 15-16/17
Nicaragua 4-6 7-12 13-15 16-17/18
Panama 4-5 6-11 12-14 15-17
Peru 3-5 6-11 12-14 15-16
Paraguay 4-5 6-11 12-14 15-17
El Salvador 4-6 7-12 13-15 16-18
Uruguay 3-5 6-11 12-14 15-17
Venezuela 3-5 6-11 12-14 15-16/17
Source: ICSED 1997, UNESCO, and country level official data for Costa Rica, Ecuador, and El Salvador.
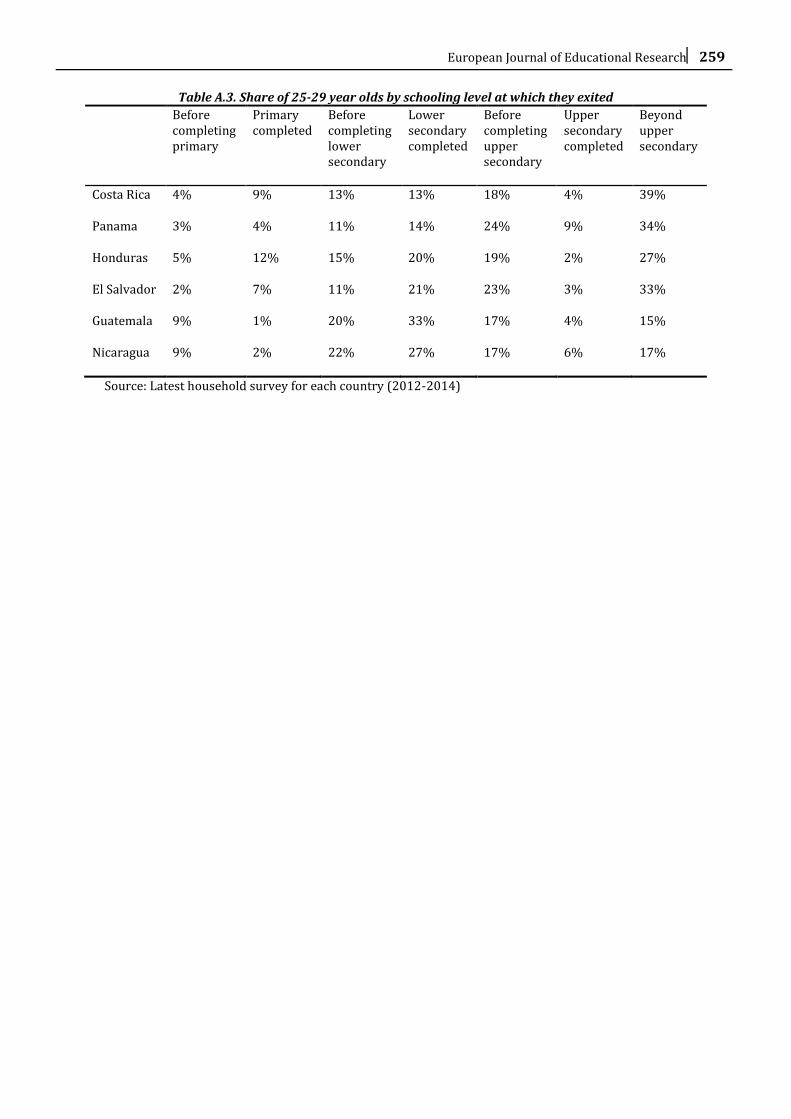
European Journal of Educational Research 259
Table A.3. Share of 25-29 year olds by schooling level at which they exited
Before completing primary
Primary completed
Before completing lower secondary
Lower secondary completed
Before completing upper secondary
Upper secondary completed
Beyond upper secondary
Costa Rica 4% 9% 13% 13% 18% 4% 39%
Panama 3% 4% 11% 14% 24% 9% 34%
Honduras 5% 12% 15% 20% 19% 2% 27%
El Salvador 2% 7% 11% 21% 23% 3% 33%
Guatemala 9% 1% 20% 33% 17% 4% 15%
Nicaragua 9% 2% 22% 27% 17% 6% 17%
Source: Latest household survey for each country (2012-2014)