Embed Size (px)
Citation preview
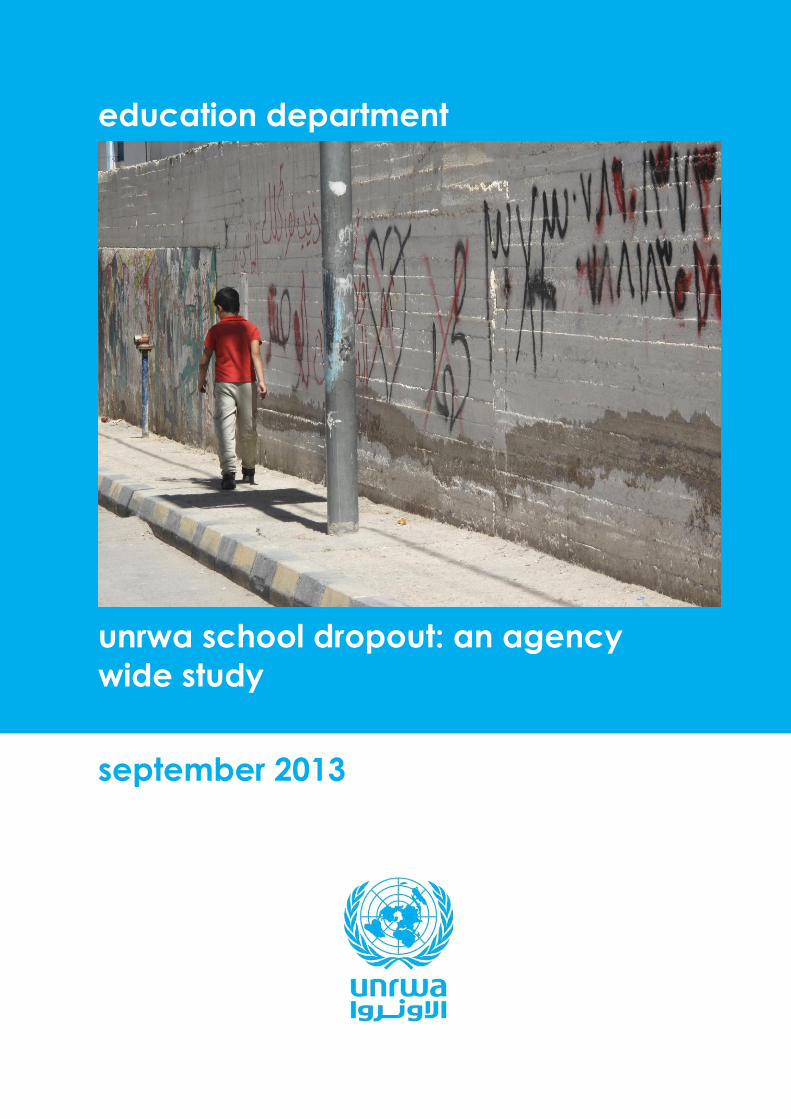
education department
unrwa school dropout: an agency
wide study
september 2013

i
unrwa school dropout:
an agency wide study
September 2013
ii
Gillian Hampden-Thompson of the University of York, UK prepared this report in
collaboration with American Institutes for Research (AIR), Washington, and with the
contribution of Gabrielle Bonnet and the support of Caroline Pontefract. The study was
designed, developed and the data collected by UNRWA educational colleagues from all five
Fields of UNRWA operation following training.
iii
contents
Foreword ............................................................................................................................ iv
introduction ........................................................................................................................ 1
background 1
Study findings 3
school dropout rates among Palestinian refugees .......................................................... 5
overall rates 5
sample statistics 6
characteristics of dropouts ............................................................................................... 7
dropout by background characteristics 7
dropout by grade 10
dropout by age 11
dropout by grade repetition 12
dropout by achievement 14
dropout by study habits 15
dropout by behaviour 16
dropout by school absence 17
dropout by social and economic risk factors 18
decision to dropout .......................................................................................................... 19
reasons for dropping out ................................................................................................. 20
reasons for dropping out, by selected characteristics .................................................. 22
gender 22
marital status 23
academic achievement 24
identifying clusters of reasons for dropping out ........................................................... 25
ranking of clusters 26
ranking of clusters by gender 26
grade repetition and dropping out .................................................................................. 27
timing of dropout and grade repetition 27
academic engagement and grade repetition 28
economic factors and grade repetition 30
additional information on dropouts in the West Bank ................................................... 31
warning signs ................................................................................................................... 34
data limitations ................................................................................................................. 36
appendix A. tables: reasons for dropout ........................................................................ 37
iv
Foreword
This report presents the findings of an agency wide study of drop out of students in UNRWA
schools, both at elementary and preparatory levels. The study was undertaken by UNRWA
educationalists in the five Fields of its operation, led by the Education Department, HQ, in
2011/2012. The sample relates to 170 schools across the five Fields. Analysis of the data
was carried out by the University of York, UK and the American Institutes for Research in
Washington, with the active engagement of the UNRWA team.
The study explores the reasons behind UNRWA student drop out from the perspective of
students themselves, their parents and the teachers. The purpose of the research was to
better understand what causes children to drop out, or as it is referred to in the report, „fade
out‟ (Hampden, G, 2013). Such understanding will better enable schools and teachers to
identify „warning signs‟ and „risk factors‟ so that preventative and support mechanisms can
be put in place.
Key findings of the study point to the need to address students‟ perception of their own
academic underachievement, a stated lack of interest in school and fear of exams. It also
highlights the importance of engagement of parents (or carers) in their child‟s learning and
ensuring their completion of schooling. For the UNRWA education system as a whole, the
findings suggest the need to consider the role of student grade repetition, as the study
shows that a child who has repeated a grade is ten times more likely to drop out of
schooling than a child who has not.
Overall this research, and its findings, make a valuable contribution to UNRWA‟s ongoing
strive for quality, evidenced based education for all children in all schools. It also contributes
to the wider discourse and our understanding of what the report describes as an „enduring
world issue‟.
Dr. Caroline Pontefract
Director of Education Department
UNRWA Headquarter, Amman
unrwa school drop out
september 2013
1
introduction
While school dropout is an enduring issue worldwide, relatively very little global research
has been conducted in this area. Lessening the prevalence of dropouts in all school
systems is an important issue. However, it becomes more salient in areas of the world
where school completion is vital for achieving many basic economic, social, and health
outcomes. Dropping out of school is often viewed as a single event in which a student
simply stops attending school one day. This is very rarely the case. Instead, school dropout
is often the result of a series of events or processes that culminate into the final action of
the student attending school for the very last time. Rather than referring to this as dropping
out, it could be characterized as fading out. Given this, there may be many points along the
process of fading out in which actions can be taken and the path to dropping out prevented.
Recognizing factors that are indicators of potential school dropout and reacting to them may
prevent students from leaving school prematurely.
background
The education reform vision of the United Nations Relief and Works Agency (UNRWA) is to
provide quality education that allows Palestine refugees to achieve their full potential, both
individually and as a member of the local and global community, towards active and
productive participation in social, political, economic, and cultural life.1 UNRWA is
responsible for running schools, delivering the curriculum, and the hiring, training, and
professional development of educational staff. As part of the reform, UNRWA has
developed a research strategy with the aim of supporting education decision and policy-
making. One key area within the UNRWA Research Strategy is a study of school dropout to
find concrete ways of better targeting UNRWA action to address dropout. The study
included analysis of the characteristics of students who drop out of school and the reasons
or situations that lead to dropping out. The collection and analysis of data from students
who have dropped out of Palestine refugee schools in Gaza, Jordan, Lebanon, Syria, and
the West Bank may reveal warning signs and risk factors that can be identified before the
student leaves school prematurely and help put in place interventions and supports to help
the student continue their education.
The analysis presented in this report is based on data collected from a sample of dropouts
from 172 schools in the five UNRWA Fields: Gaza, Jordan, Lebanon, Syria, and the West
Bank. The students dropped out in the elementary (Grades 1-6) or preparatory (Grades 7-9
in Gaza, Lebanon, Syria, West Bank, Grade 10 in Jordan) cycles, and came from either
single sex or co-educational schools. Sampling occurred in two different ways. In the West
Bank, Syria, and Jordan, a random sample consisting of 10 percent of all schools was
selected, and information from all dropouts within the selected schools was collected. In
Lebanon and Gaza, 10 percent of all dropouts across all schools were selected for the
1 www.unrwa.org
2
sample. Dropouts were defined as students who left school during the 2010–11 school
year2. They were interviewed by a school counselor, teacher counselor, head teacher,
guidance and counseling expert, or UNRWA research and development coordinator during
the year of 2012. The research gathered the following information:
Dropouts were provided with a list of 32 possible reasons for dropout and asked to
identify each as a major reason, a secondary reason, or as inapplicable to their
decision to drop out of school.
In addition to reasons for dropout, dropouts were asked who made the decision to
drop out (was it theirs or that of family members), their current situation (whether
they are currently working, studying in a technical or vocational education center, or
none of these), and whether they regret dropping out.
Further data regarding dropout students was collected from school records. This
information relates to the dropouts when they were still studying in school, in 2010-
2011.
In addition to information regarding students, the study gathered information from a
smaller number of parents and educators, allowing for the identification of any major
discrepancies in the perceptions of students and family and school actors.
The dropout rate was calculated as the percentage of students who dropped out during the
school year compared to all students who had been enrolled during the school year.
Dropout rates calculated in this report take into account the differing sample selection of
dropouts.
Data for Syria were collected at the school level and Field staff made an initial analysis
based on the paper forms that were collected, before any data entry. However, due to the
changing circumstances in the Field, the data collected from students became unavailable
and could not be entered for further analysis. Therefore, information on why students
dropped out is generally not available for Syria. However, results for Syria are presented
where possible.
The first section of this report presents overall and sample school dropout rates. The
second section examines the personal and school related characteristics of the dropouts.
The third section explores whose decision it was to drop out of school. The fourth and fifth
sections focus on the reasons the student‟s gave for why they dropped out. The sixth
section provides analysis that clusters the reasons given for dropout. The last section
provides information on the potential warning signs that may help schools identify students
who are particularly at risk of dropping out.
2 Therefore, in this study, dropout rates for a grade or a cycle refer to average dropout during a single school
year. This should not be confused with cumulative dropout rates that look at the total number of students, out of a given cohort starting the cycle, who dropout before finishing the cycle. „Cumulative‟ dropout over the course of basic education (i.e. the proportion of a cohort that does not make it to 10th grade), is actually close to 10 times higher than the average dropout rate found this study.
unrwa school drop out
september 2013
3
Study findings
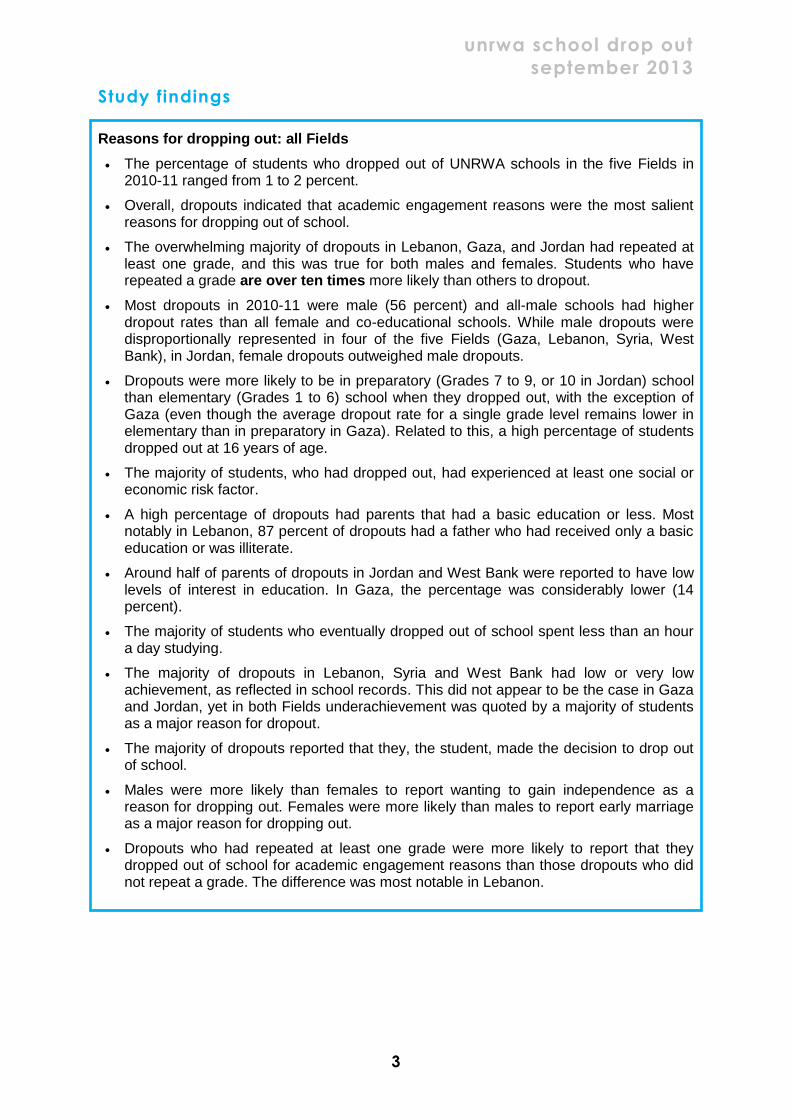
Reasons for dropping out: all Fields
The percentage of students who dropped out of UNRWA schools in the five Fields in 2010-11 ranged from 1 to 2 percent.
Overall, dropouts indicated that academic engagement reasons were the most salient reasons for dropping out of school.
The overwhelming majority of dropouts in Lebanon, Gaza, and Jordan had repeated at least one grade, and this was true for both males and females. Students who have repeated a grade are over ten times more likely than others to dropout.
Most dropouts in 2010-11 were male (56 percent) and all-male schools had higher dropout rates than all female and co-educational schools. While male dropouts were disproportionally represented in four of the five Fields (Gaza, Lebanon, Syria, West Bank), in Jordan, female dropouts outweighed male dropouts.
Dropouts were more likely to be in preparatory (Grades 7 to 9, or 10 in Jordan) school than elementary (Grades 1 to 6) school when they dropped out, with the exception of Gaza (even though the average dropout rate for a single grade level remains lower in elementary than in preparatory in Gaza). Related to this, a high percentage of students dropped out at 16 years of age.
The majority of students, who had dropped out, had experienced at least one social or economic risk factor.
A high percentage of dropouts had parents that had a basic education or less. Most notably in Lebanon, 87 percent of dropouts had a father who had received only a basic education or was illiterate.
Around half of parents of dropouts in Jordan and West Bank were reported to have low levels of interest in education. In Gaza, the percentage was considerably lower (14 percent).
The majority of students who eventually dropped out of school spent less than an hour a day studying.
The majority of dropouts in Lebanon, Syria and West Bank had low or very low achievement, as reflected in school records. This did not appear to be the case in Gaza and Jordan, yet in both Fields underachievement was quoted by a majority of students as a major reason for dropout.
The majority of dropouts reported that they, the student, made the decision to drop out of school.
Males were more likely than females to report wanting to gain independence as a reason for dropping out. Females were more likely than males to report early marriage as a major reason for dropping out.
Dropouts who had repeated at least one grade were more likely to report that they dropped out of school for academic engagement reasons than those dropouts who did not repeat a grade. The difference was most notable in Lebanon.
4
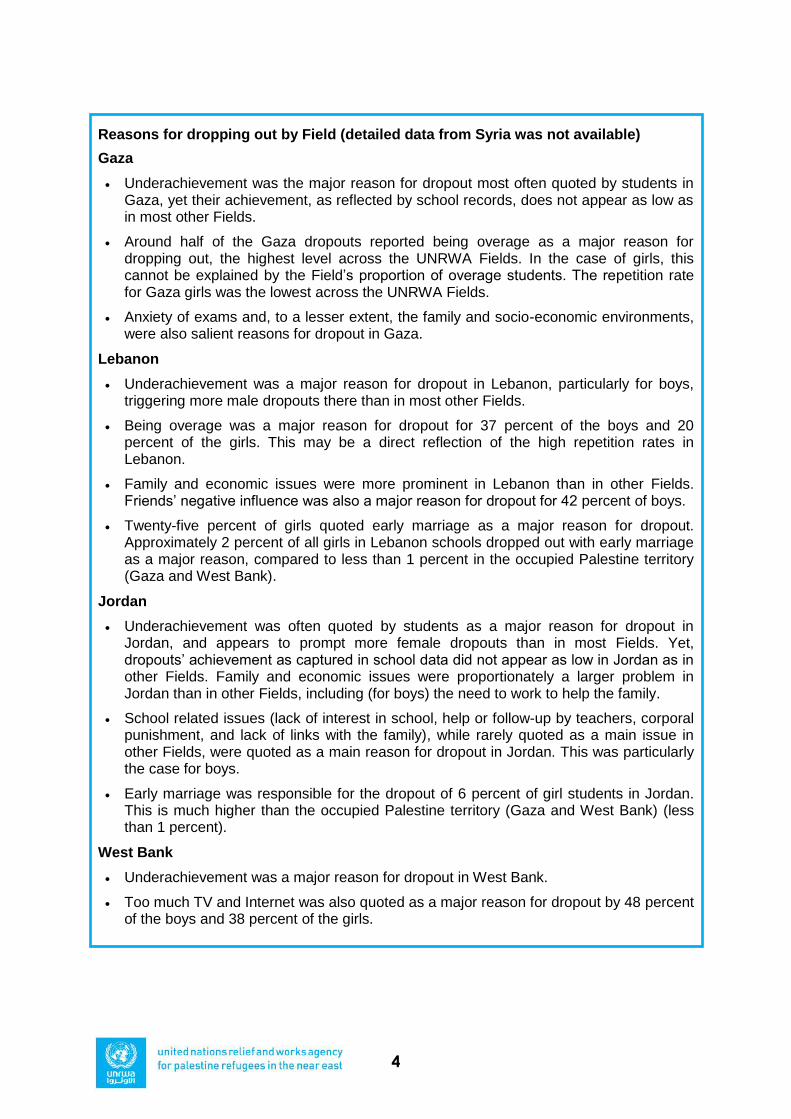
Reasons for dropping out by Field (detailed data from Syria was not available)
Gaza
Underachievement was the major reason for dropout most often quoted by students in Gaza, yet their achievement, as reflected by school records, does not appear as low as in most other Fields.
Around half of the Gaza dropouts reported being overage as a major reason for dropping out, the highest level across the UNRWA Fields. In the case of girls, this cannot be explained by the Field‟s proportion of overage students. The repetition rate for Gaza girls was the lowest across the UNRWA Fields.
Anxiety of exams and, to a lesser extent, the family and socio-economic environments, were also salient reasons for dropout in Gaza.
Lebanon
Underachievement was a major reason for dropout in Lebanon, particularly for boys, triggering more male dropouts there than in most other Fields.
Being overage was a major reason for dropout for 37 percent of the boys and 20 percent of the girls. This may be a direct reflection of the high repetition rates in Lebanon.
Family and economic issues were more prominent in Lebanon than in other Fields. Friends‟ negative influence was also a major reason for dropout for 42 percent of boys.
Twenty-five percent of girls quoted early marriage as a major reason for dropout. Approximately 2 percent of all girls in Lebanon schools dropped out with early marriage as a major reason, compared to less than 1 percent in the occupied Palestine territory (Gaza and West Bank).
Jordan
Underachievement was often quoted by students as a major reason for dropout in Jordan, and appears to prompt more female dropouts than in most Fields. Yet, dropouts‟ achievement as captured in school data did not appear as low in Jordan as in other Fields. Family and economic issues were proportionately a larger problem in Jordan than in other Fields, including (for boys) the need to work to help the family.
School related issues (lack of interest in school, help or follow-up by teachers, corporal punishment, and lack of links with the family), while rarely quoted as a main issue in other Fields, were quoted as a main reason for dropout in Jordan. This was particularly the case for boys.
Early marriage was responsible for the dropout of 6 percent of girl students in Jordan. This is much higher than the occupied Palestine territory (Gaza and West Bank) (less than 1 percent).
West Bank
Underachievement was a major reason for dropout in West Bank.
Too much TV and Internet was also quoted as a major reason for dropout by 48 percent of the boys and 38 percent of the girls.
unrwa school drop out
september 2013
5
school dropout rates among Palestinian refugees
overall rates
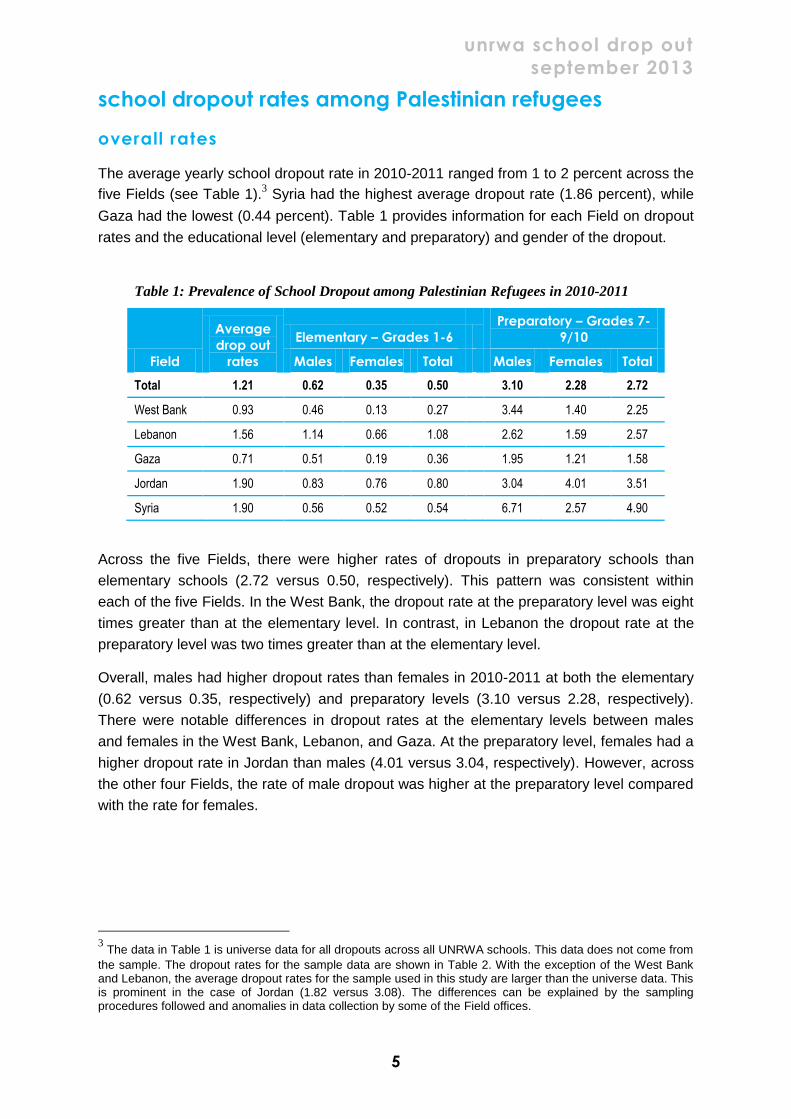
The average yearly school dropout rate in 2010-2011 ranged from 1 to 2 percent across the
five Fields (see Table 1).3 Syria had the highest average dropout rate (1.86 percent), while
Gaza had the lowest (0.44 percent). Table 1 provides information for each Field on dropout
rates and the educational level (elementary and preparatory) and gender of the dropout.
Table 1: Prevalence of School Dropout among Palestinian Refugees in 2010-2011
Field
Average
drop out
rates
Elementary – Grades 1-6
Preparatory – Grades 7-
9/10
Males Females Total Males Females Total
Total 1.21 0.62 0.35 0.50 3.10 2.28 2.72
West Bank 0.93 0.46 0.13 0.27 3.44 1.40 2.25
Lebanon 1.56 1.14 0.66 1.08 2.62 1.59 2.57
Gaza 0.71 0.51 0.19 0.36 1.95 1.21 1.58
Jordan 1.90 0.83 0.76 0.80 3.04 4.01 3.51
Syria 1.90 0.56 0.52 0.54 6.71 2.57 4.90
Across the five Fields, there were higher rates of dropouts in preparatory schools than
elementary schools (2.72 versus 0.50, respectively). This pattern was consistent within
each of the five Fields. In the West Bank, the dropout rate at the preparatory level was eight
times greater than at the elementary level. In contrast, in Lebanon the dropout rate at the
preparatory level was two times greater than at the elementary level.
Overall, males had higher dropout rates than females in 2010-2011 at both the elementary
(0.62 versus 0.35, respectively) and preparatory levels (3.10 versus 2.28, respectively).
There were notable differences in dropout rates at the elementary levels between males
and females in the West Bank, Lebanon, and Gaza. At the preparatory level, females had a
higher dropout rate in Jordan than males (4.01 versus 3.04, respectively). However, across
the other four Fields, the rate of male dropout was higher at the preparatory level compared
with the rate for females.
3 The data in Table 1 is universe data for all dropouts across all UNRWA schools. This data does not come from
the sample. The dropout rates for the sample data are shown in Table 2. With the exception of the West Bank and Lebanon, the average dropout rates for the sample used in this study are larger than the universe data. This is prominent in the case of Jordan (1.82 versus 3.08). The differences can be explained by the sampling procedures followed and anomalies in data collection by some of the Field offices.
6
sample statistics
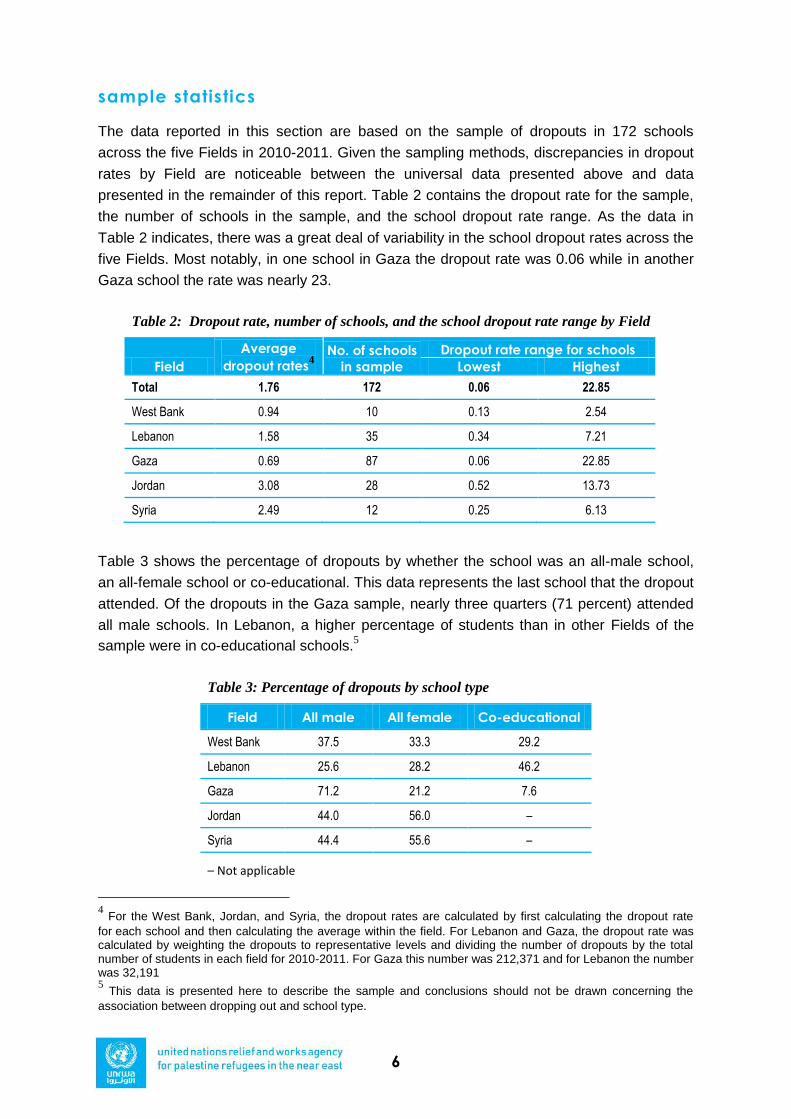
The data reported in this section are based on the sample of dropouts in 172 schools
across the five Fields in 2010-2011. Given the sampling methods, discrepancies in dropout
rates by Field are noticeable between the universal data presented above and data
presented in the remainder of this report. Table 2 contains the dropout rate for the sample,
the number of schools in the sample, and the school dropout rate range. As the data in
Table 2 indicates, there was a great deal of variability in the school dropout rates across the
five Fields. Most notably, in one school in Gaza the dropout rate was 0.06 while in another
Gaza school the rate was nearly 23.
Table 2: Dropout rate, number of schools, and the school dropout rate range by Field
Field
Average
dropout rates4
No. of schools
in sample
Dropout rate range for schools
Lowest Highest
Total 1.76 172 0.06 22.85
West Bank 0.94 10 0.13 2.54
Lebanon 1.58 35 0.34 7.21
Gaza 0.69 87 0.06 22.85
Jordan 3.08 28 0.52 13.73
Syria 2.49 12 0.25 6.13
Table 3 shows the percentage of dropouts by whether the school was an all-male school,
an all-female school or co-educational. This data represents the last school that the dropout
attended. Of the dropouts in the Gaza sample, nearly three quarters (71 percent) attended
all male schools. In Lebanon, a higher percentage of students than in other Fields of the
sample were in co-educational schools.5
Table 3: Percentage of dropouts by school type
Field All male All female Co-educational
West Bank 37.5 33.3 29.2
Lebanon 25.6 28.2 46.2
Gaza 71.2 21.2 7.6
Jordan 44.0 56.0 –
Syria 44.4 55.6 –
– Not applicable
4 For the West Bank, Jordan, and Syria, the dropout rates are calculated by first calculating the dropout rate
for each school and then calculating the average within the field. For Lebanon and Gaza, the dropout rate was calculated by weighting the dropouts to representative levels and dividing the number of dropouts by the total number of students in each field for 2010-2011. For Gaza this number was 212,371 and for Lebanon the number was 32,191 5 This data is presented here to describe the sample and conclusions should not be drawn concerning the
association between dropping out and school type.
unrwa school drop out
september 2013
7
characteristics of dropouts
This section explores the characteristics of the dropouts in the sample. These
characteristics are taken from the school records or from the interviews. This section also
relates, where relevant, the information on dropout characteristics with what students
identified as reasons for dropping out.
dropout by background characteristics
Gender
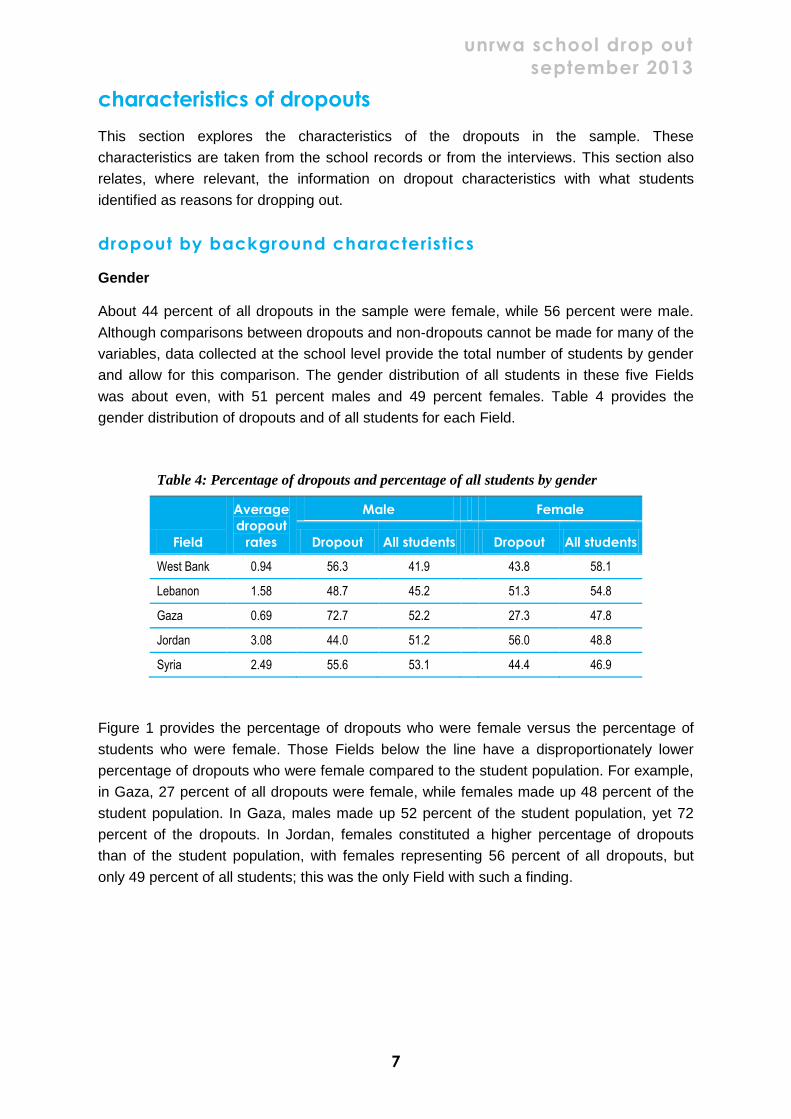
About 44 percent of all dropouts in the sample were female, while 56 percent were male.
Although comparisons between dropouts and non-dropouts cannot be made for many of the
variables, data collected at the school level provide the total number of students by gender
and allow for this comparison. The gender distribution of all students in these five Fields
was about even, with 51 percent males and 49 percent females. Table 4 provides the
gender distribution of dropouts and of all students for each Field.
Table 4: Percentage of dropouts and percentage of all students by gender
Field
Average
dropout
rates
Male Female
Dropout All students Dropout All students
West Bank 0.94 56.3 41.9 43.8 58.1
Lebanon 1.58 48.7 45.2 51.3 54.8
Gaza 0.69 72.7 52.2 27.3 47.8
Jordan 3.08 44.0 51.2 56.0 48.8
Syria 2.49 55.6 53.1 44.4 46.9
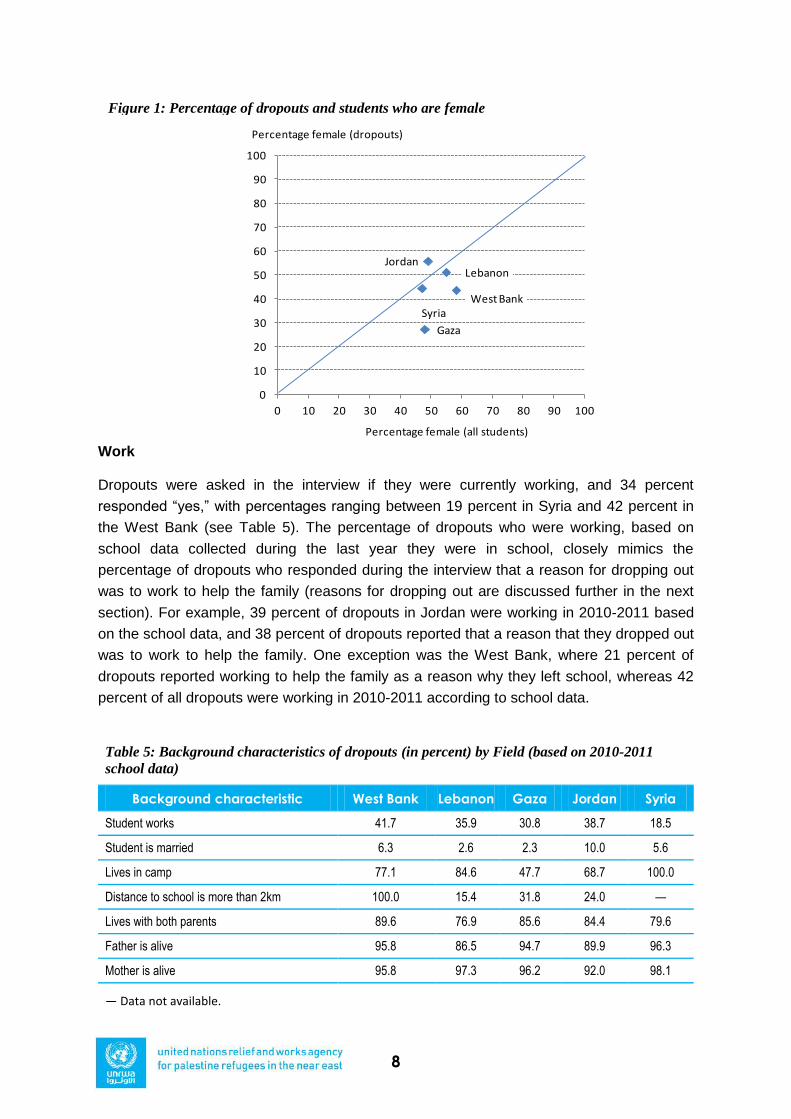
Figure 1 provides the percentage of dropouts who were female versus the percentage of
students who were female. Those Fields below the line have a disproportionately lower
percentage of dropouts who were female compared to the student population. For example,
in Gaza, 27 percent of all dropouts were female, while females made up 48 percent of the
student population. In Gaza, males made up 52 percent of the student population, yet 72
percent of the dropouts. In Jordan, females constituted a higher percentage of dropouts
than of the student population, with females representing 56 percent of all dropouts, but
only 49 percent of all students; this was the only Field with such a finding.
8
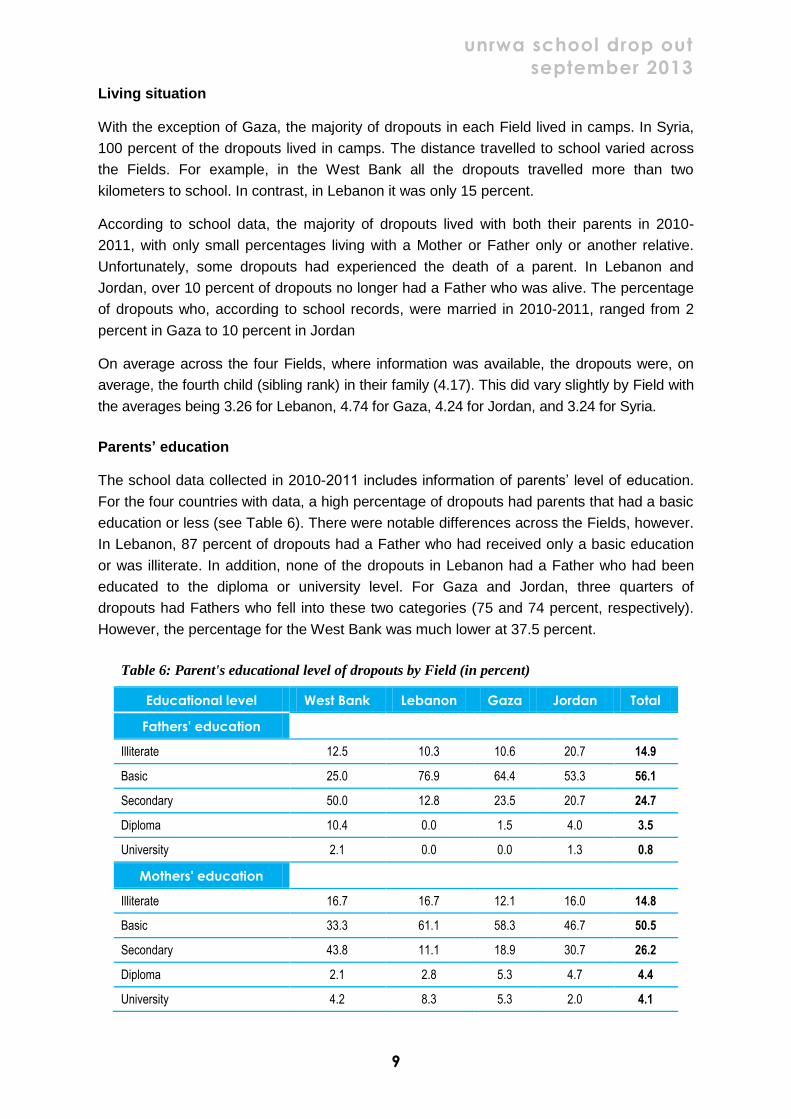
Work
Dropouts were asked in the interview if they were currently working, and 34 percent
responded “yes,” with percentages ranging between 19 percent in Syria and 42 percent in
the West Bank (see Table 5). The percentage of dropouts who were working, based on
school data collected during the last year they were in school, closely mimics the
percentage of dropouts who responded during the interview that a reason for dropping out
was to work to help the family (reasons for dropping out are discussed further in the next
section). For example, 39 percent of dropouts in Jordan were working in 2010-2011 based
on the school data, and 38 percent of dropouts reported that a reason that they dropped out
was to work to help the family. One exception was the West Bank, where 21 percent of
dropouts reported working to help the family as a reason why they left school, whereas 42
percent of all dropouts were working in 2010-2011 according to school data.
Table 5: Background characteristics of dropouts (in percent) by Field (based on 2010-2011
school data)
Background characteristic West Bank Lebanon Gaza Jordan Syria
Student works 41.7 35.9 30.8 38.7 18.5
Student is married 6.3 2.6 2.3 10.0 5.6
Lives in camp 77.1 84.6 47.7 68.7 100.0
Distance to school is more than 2km 100.0 15.4 31.8 24.0 —
Lives with both parents 89.6 76.9 85.6 84.4 79.6
Father is alive 95.8 86.5 94.7 89.9 96.3
Mother is alive 95.8 97.3 96.2 92.0 98.1
— Data not available.
West Bank
Lebanon
Gaza
Jordan
Syria
0
10
20
30
40
50
60
70
80
90
100
0 10 20 30 40 50 60 70 80 90 100
Percentage female (dropouts)
Percentage female (all students)
Figure 1: Percentage of dropouts and students who are female
unrwa school drop out
september 2013
9
Living situation
With the exception of Gaza, the majority of dropouts in each Field lived in camps. In Syria,
100 percent of the dropouts lived in camps. The distance travelled to school varied across
the Fields. For example, in the West Bank all the dropouts travelled more than two
kilometers to school. In contrast, in Lebanon it was only 15 percent.
According to school data, the majority of dropouts lived with both their parents in 2010-
2011, with only small percentages living with a Mother or Father only or another relative.
Unfortunately, some dropouts had experienced the death of a parent. In Lebanon and
Jordan, over 10 percent of dropouts no longer had a Father who was alive. The percentage
of dropouts who, according to school records, were married in 2010-2011, ranged from 2
percent in Gaza to 10 percent in Jordan
On average across the four Fields, where information was available, the dropouts were, on
average, the fourth child (sibling rank) in their family (4.17). This did vary slightly by Field with
the averages being 3.26 for Lebanon, 4.74 for Gaza, 4.24 for Jordan, and 3.24 for Syria.
Parents’ education
The school data collected in 2010-2011 includes information of parents‟ level of education.
For the four countries with data, a high percentage of dropouts had parents that had a basic
education or less (see Table 6). There were notable differences across the Fields, however.
In Lebanon, 87 percent of dropouts had a Father who had received only a basic education
or was illiterate. In addition, none of the dropouts in Lebanon had a Father who had been
educated to the diploma or university level. For Gaza and Jordan, three quarters of
dropouts had Fathers who fell into these two categories (75 and 74 percent, respectively).
However, the percentage for the West Bank was much lower at 37.5 percent.
Table 6: Parent's educational level of dropouts by Field (in percent)
Educational level West Bank Lebanon Gaza Jordan Total
Fathers' education
Illiterate 12.5 10.3 10.6 20.7 14.9
Basic 25.0 76.9 64.4 53.3 56.1
Secondary 50.0 12.8 23.5 20.7 24.7
Diploma 10.4 0.0 1.5 4.0 3.5
University 2.1 0.0 0.0 1.3 0.8
Mothers' education
Illiterate 16.7 16.7 12.1 16.0 14.8
Basic 33.3 61.1 58.3 46.7 50.5
Secondary 43.8 11.1 18.9 30.7 26.2
Diploma 2.1 2.8 5.3 4.7 4.4
University 4.2 8.3 5.3 2.0 4.1
10
In terms of mothers‟ education, a similar pattern emerged with mothers in the West Bank
having higher levels of education. Half of the mothers of dropouts in the West Bank were
educated to the secondary school level or above. This is in contrast to the other Fields with
data (Lebanon 22 percent, Gaza 29.5 percent, and Jordan 37.4 percent). Consistent with
the findings for fathers‟ education, low levels of education were found for the mothers of
dropouts. Over three quarters of dropouts in Lebanon had a mother who had only a basic
education or was illiterate.
Family engagement in education
The schools were asked in 2010-2011 to report how interested they thought the family of
the dropout was in education. Across the four Fields with data, schools reported that 40
percent of the students who eventually dropped out had a family that exhibited high or very
high levels of interest in education. However, a significant percentage of families were seen
as not being interested in education (Table 7).
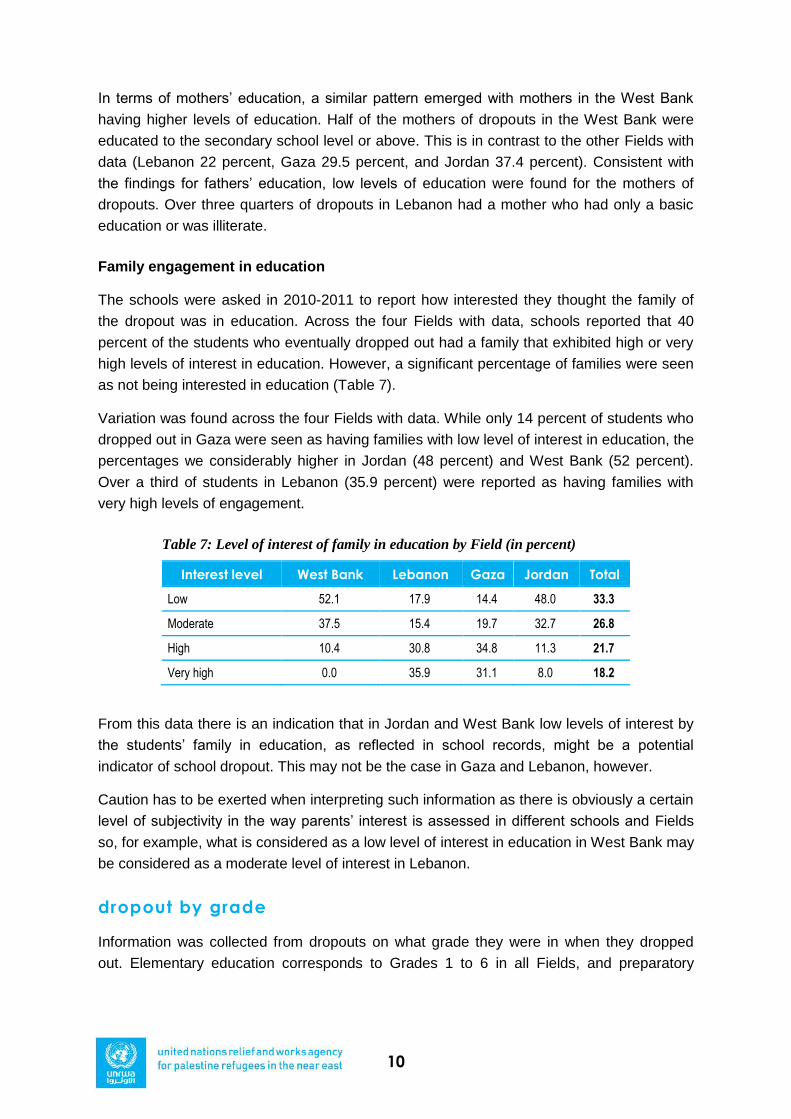
Variation was found across the four Fields with data. While only 14 percent of students who
dropped out in Gaza were seen as having families with low level of interest in education, the
percentages we considerably higher in Jordan (48 percent) and West Bank (52 percent).
Over a third of students in Lebanon (35.9 percent) were reported as having families with
very high levels of engagement.
Table 7: Level of interest of family in education by Field (in percent)
Interest level West Bank Lebanon Gaza Jordan Total
Low 52.1 17.9 14.4 48.0 33.3
Moderate 37.5 15.4 19.7 32.7 26.8
High 10.4 30.8 34.8 11.3 21.7
Very high 0.0 35.9 31.1 8.0 18.2
From this data there is an indication that in Jordan and West Bank low levels of interest by
the students‟ family in education, as reflected in school records, might be a potential
indicator of school dropout. This may not be the case in Gaza and Lebanon, however.
Caution has to be exerted when interpreting such information as there is obviously a certain
level of subjectivity in the way parents‟ interest is assessed in different schools and Fields
so, for example, what is considered as a low level of interest in education in West Bank may
be considered as a moderate level of interest in Lebanon.
dropout by grade
Information was collected from dropouts on what grade they were in when they dropped
out. Elementary education corresponds to Grades 1 to 6 in all Fields, and preparatory
unrwa school drop out
september 2013
11
education corresponds to Grades 7 to 9 in the West Bank, Lebanon, Gaza, and Syria and
Grades 7 to 10 in Jordan.
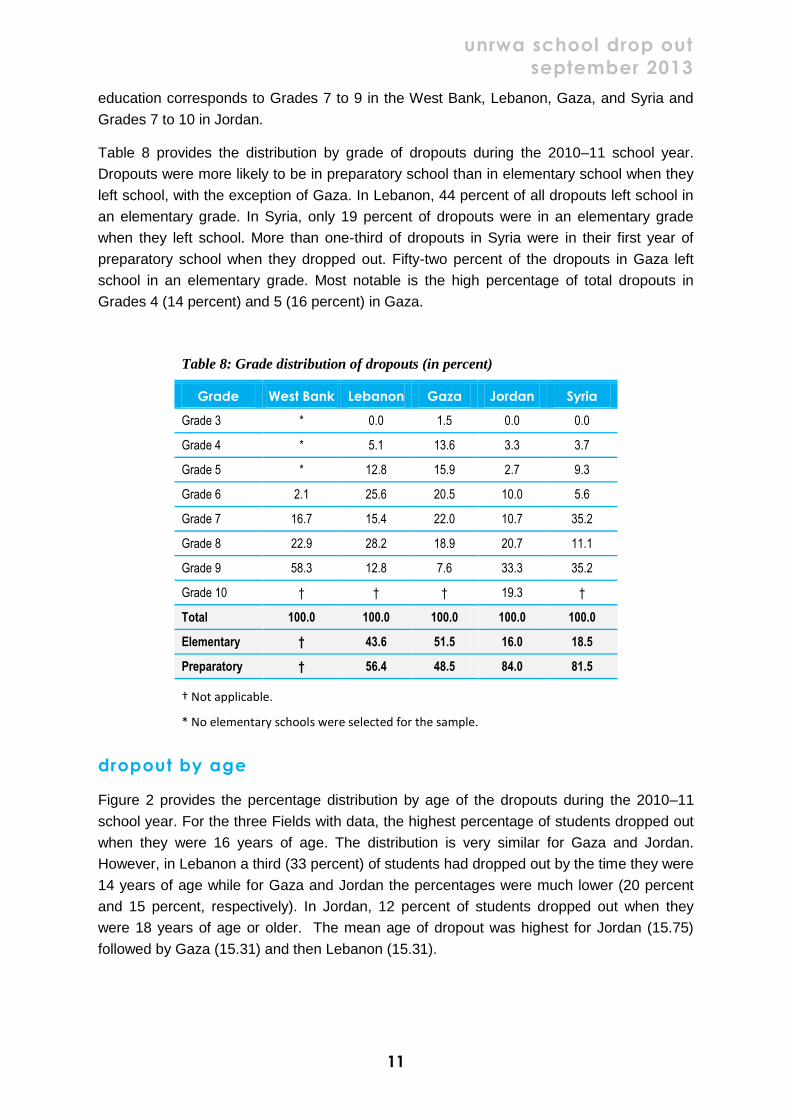
Table 8 provides the distribution by grade of dropouts during the 2010–11 school year.
Dropouts were more likely to be in preparatory school than in elementary school when they
left school, with the exception of Gaza. In Lebanon, 44 percent of all dropouts left school in
an elementary grade. In Syria, only 19 percent of dropouts were in an elementary grade
when they left school. More than one-third of dropouts in Syria were in their first year of
preparatory school when they dropped out. Fifty-two percent of the dropouts in Gaza left
school in an elementary grade. Most notable is the high percentage of total dropouts in
Grades 4 (14 percent) and 5 (16 percent) in Gaza.
Table 8: Grade distribution of dropouts (in percent)
Grade West Bank Lebanon Gaza Jordan Syria
Grade 3 * 0.0 1.5 0.0 0.0
Grade 4 * 5.1 13.6 3.3 3.7
Grade 5 * 12.8 15.9 2.7 9.3
Grade 6 2.1 25.6 20.5 10.0 5.6
Grade 7 16.7 15.4 22.0 10.7 35.2
Grade 8 22.9 28.2 18.9 20.7 11.1
Grade 9 58.3 12.8 7.6 33.3 35.2
Grade 10 † † † 19.3 †
Total 100.0 100.0 100.0 100.0 100.0
Elementary † 43.6 51.5 16.0 18.5
Preparatory † 56.4 48.5 84.0 81.5
† Not applicable.
* No elementary schools were selected for the sample.
dropout by age
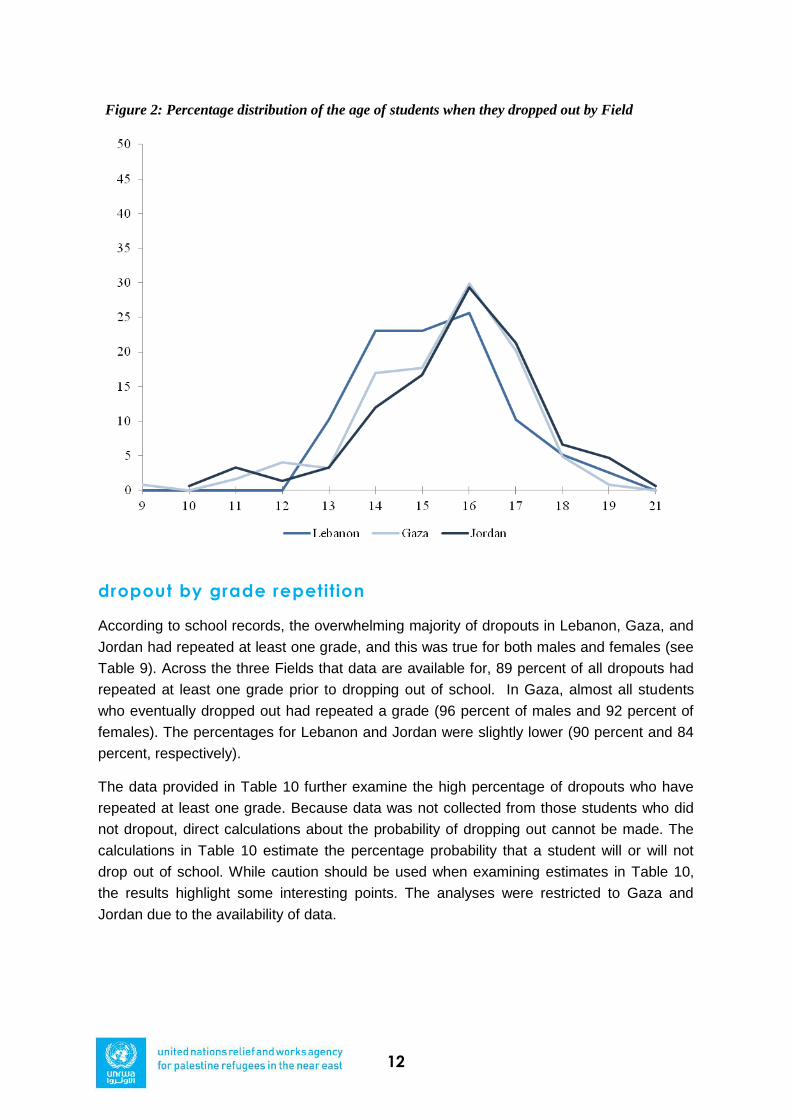
Figure 2 provides the percentage distribution by age of the dropouts during the 2010–11
school year. For the three Fields with data, the highest percentage of students dropped out
when they were 16 years of age. The distribution is very similar for Gaza and Jordan.
However, in Lebanon a third (33 percent) of students had dropped out by the time they were
14 years of age while for Gaza and Jordan the percentages were much lower (20 percent
and 15 percent, respectively). In Jordan, 12 percent of students dropped out when they
were 18 years of age or older. The mean age of dropout was highest for Jordan (15.75)
followed by Gaza (15.31) and then Lebanon (15.31).
12
Figure 2: Percentage distribution of the age of students when they dropped out by Field
dropout by grade repetition
According to school records, the overwhelming majority of dropouts in Lebanon, Gaza, and
Jordan had repeated at least one grade, and this was true for both males and females (see
Table 9). Across the three Fields that data are available for, 89 percent of all dropouts had
repeated at least one grade prior to dropping out of school. In Gaza, almost all students
who eventually dropped out had repeated a grade (96 percent of males and 92 percent of
females). The percentages for Lebanon and Jordan were slightly lower (90 percent and 84
percent, respectively).
The data provided in Table 10 further examine the high percentage of dropouts who have
repeated at least one grade. Because data was not collected from those students who did
not dropout, direct calculations about the probability of dropping out cannot be made. The
calculations in Table 10 estimate the percentage probability that a student will or will not
drop out of school. While caution should be used when examining estimates in Table 10,
the results highlight some interesting points. The analyses were restricted to Gaza and
Jordan due to the availability of data.
unrwa school drop out
september 2013
13
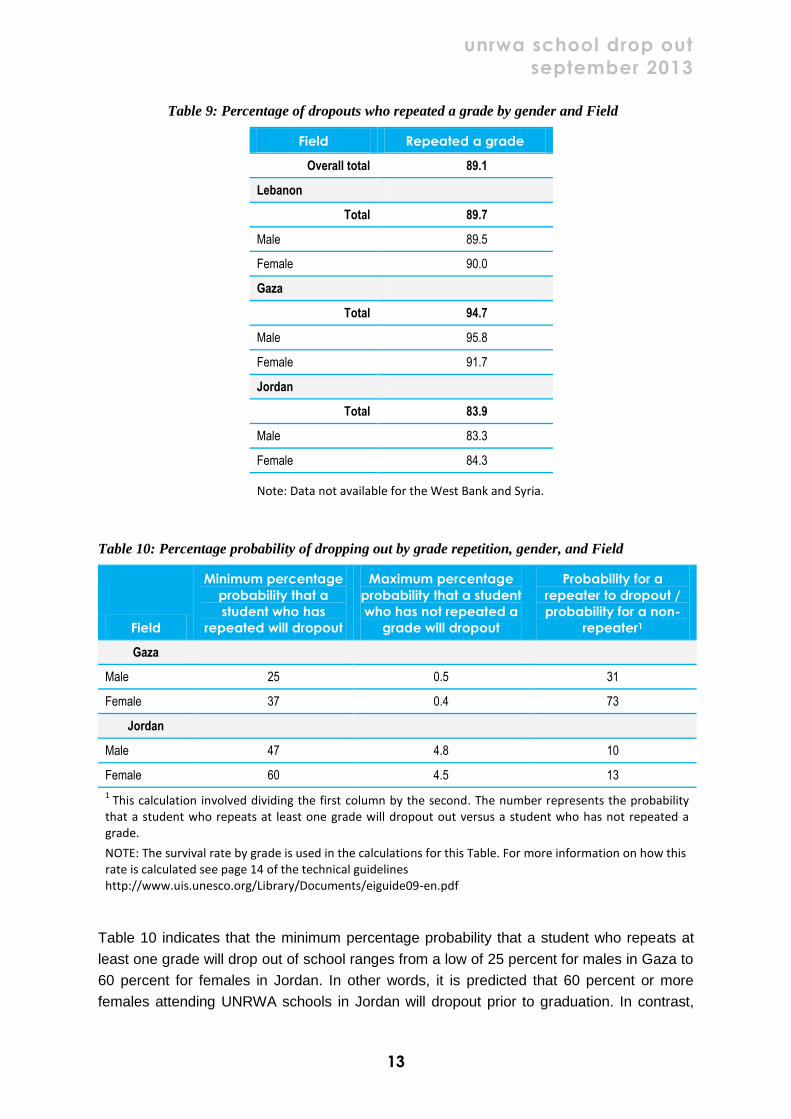
Table 9: Percentage of dropouts who repeated a grade by gender and Field
Field Repeated a grade
Overall total 89.1
Lebanon
Total 89.7
Male 89.5
Female 90.0
Gaza
Total 94.7
Male 95.8
Female 91.7
Jordan
Total 83.9
Male 83.3
Female 84.3
Note: Data not available for the West Bank and Syria.
Table 10: Percentage probability of dropping out by grade repetition, gender, and Field
Field
Minimum percentage
probability that a
student who has
repeated will dropout
Maximum percentage
probability that a student
who has not repeated a
grade will dropout
Probability for a
repeater to dropout /
probability for a non-
repeater1
Gaza
Male 25 0.5 31
Female 37 0.4 73
Jordan
Male 47 4.8 10
Female 60 4.5 13
1 This calculation involved dividing the first column by the second. The number represents the probability
that a student who repeats at least one grade will dropout out versus a student who has not repeated a grade.
NOTE: The survival rate by grade is used in the calculations for this Table. For more information on how this rate is calculated see page 14 of the technical guidelines http://www.uis.unesco.org/Library/Documents/eiguide09-en.pdf
Table 10 indicates that the minimum percentage probability that a student who repeats at
least one grade will drop out of school ranges from a low of 25 percent for males in Gaza to
60 percent for females in Jordan. In other words, it is predicted that 60 percent or more
females attending UNRWA schools in Jordan will dropout prior to graduation. In contrast,
14
the second column is the percentage probability that a student who has not repeated a
grade will drop out of school. As indicated in the Table, the percentages are low. In Gaza, it
is predicted that less than one percent of all students will drop out if they have never
repeated a grade. In Jordan, this percentage, while still relatively low, is just over four
percent.
It is estimated that a female who has repeated at least one grade in Gaza is 73 times more
likely to drop out than a female non-repeater (see column 3). Male repeaters in Gaza are 31
times more likely than male non-repeaters to not graduate from school. The difference in
odds for repeaters in Jordan are still noteworthy but far less so when compared to Gaza.
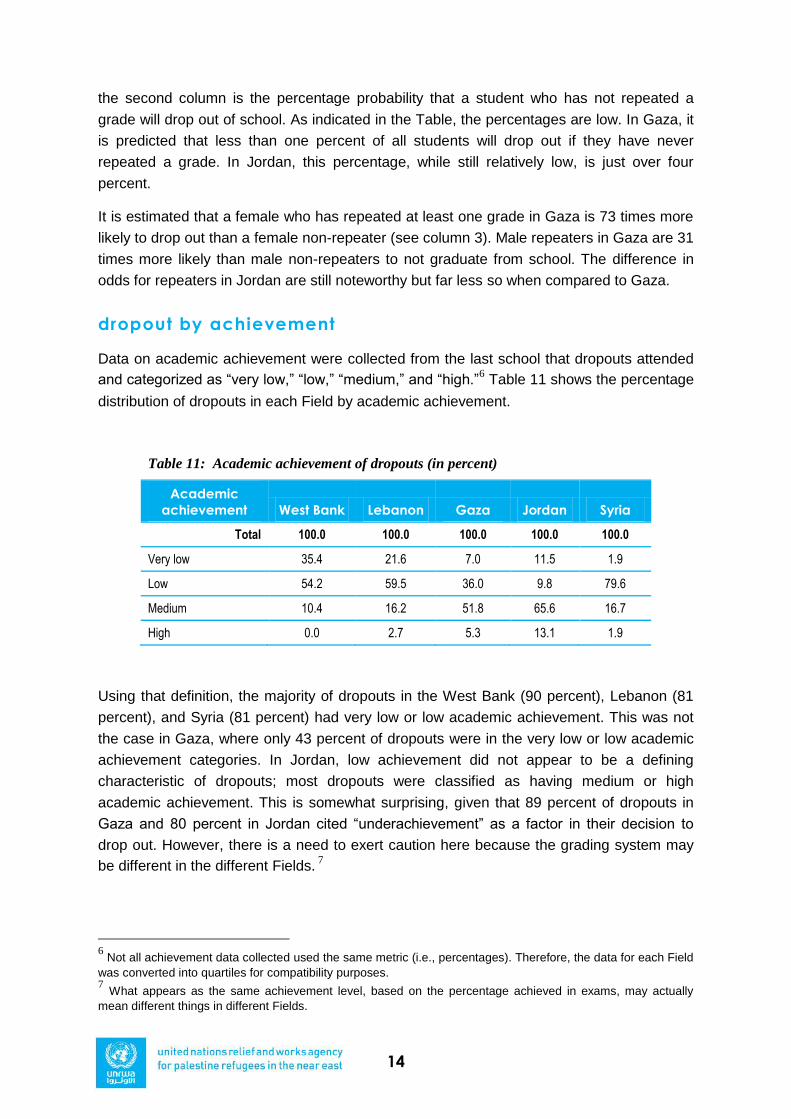
dropout by achievement
Data on academic achievement were collected from the last school that dropouts attended
and categorized as “very low,” “low,” “medium,” and “high.”6 Table 11 shows the percentage
distribution of dropouts in each Field by academic achievement.
Table 11: Academic achievement of dropouts (in percent)
Academic
achievement West Bank Lebanon Gaza Jordan Syria
Total 100.0 100.0 100.0 100.0 100.0
Very low 35.4 21.6 7.0 11.5 1.9
Low 54.2 59.5 36.0 9.8 79.6
Medium 10.4 16.2 51.8 65.6 16.7
High 0.0 2.7 5.3 13.1 1.9
Using that definition, the majority of dropouts in the West Bank (90 percent), Lebanon (81
percent), and Syria (81 percent) had very low or low academic achievement. This was not
the case in Gaza, where only 43 percent of dropouts were in the very low or low academic
achievement categories. In Jordan, low achievement did not appear to be a defining
characteristic of dropouts; most dropouts were classified as having medium or high
academic achievement. This is somewhat surprising, given that 89 percent of dropouts in
Gaza and 80 percent in Jordan cited “underachievement” as a factor in their decision to
drop out. However, there is a need to exert caution here because the grading system may
be different in the different Fields. 7
6 Not all achievement data collected used the same metric (i.e., percentages). Therefore, the data for each Field
was converted into quartiles for compatibility purposes. 7 What appears as the same achievement level, based on the percentage achieved in exams, may actually
mean different things in different Fields.
unrwa school drop out
september 2013
15
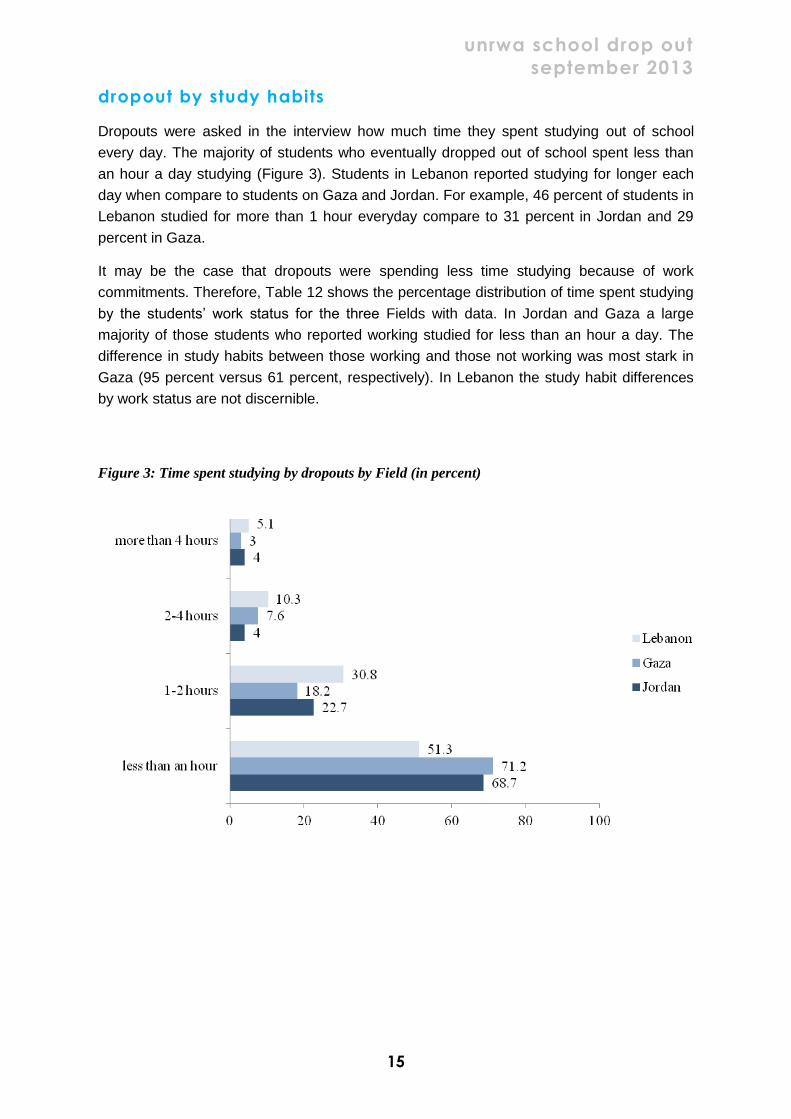
dropout by study habits
Dropouts were asked in the interview how much time they spent studying out of school
every day. The majority of students who eventually dropped out of school spent less than
an hour a day studying (Figure 3). Students in Lebanon reported studying for longer each
day when compare to students on Gaza and Jordan. For example, 46 percent of students in
Lebanon studied for more than 1 hour everyday compare to 31 percent in Jordan and 29
percent in Gaza.
It may be the case that dropouts were spending less time studying because of work
commitments. Therefore, Table 12 shows the percentage distribution of time spent studying
by the students‟ work status for the three Fields with data. In Jordan and Gaza a large
majority of those students who reported working studied for less than an hour a day. The
difference in study habits between those working and those not working was most stark in
Gaza (95 percent versus 61 percent, respectively). In Lebanon the study habit differences
by work status are not discernible.
Figure 3: Time spent studying by dropouts by Field (in percent)
16
Table 12: Percentage distribution of the work status of dropouts by time spent studying
and Field.
less than an hour 1-2 hours 2-4 hours more than 4 hours
Jordan
Not working 65.2 25.0 3.3 5.4
Working 74.1 19.0 5.2 1.7
Gaza
Not working 61.1 23.3 11.1 4.4
Working 95.0 5.0 0.0 0.0
Lebanon
Not working 56.0 28.0 12.0 0.0
Working 42.9 35.7 7.1 14.3
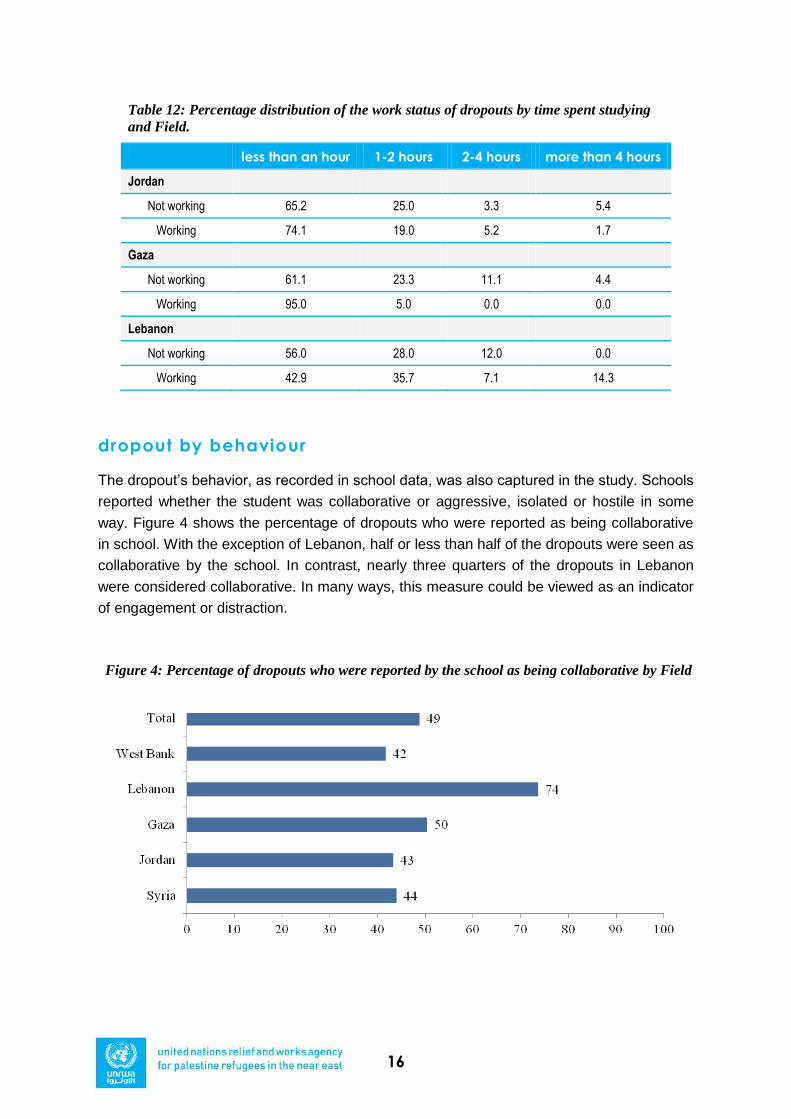
dropout by behaviour
The dropout‟s behavior, as recorded in school data, was also captured in the study. Schools
reported whether the student was collaborative or aggressive, isolated or hostile in some
way. Figure 4 shows the percentage of dropouts who were reported as being collaborative
in school. With the exception of Lebanon, half or less than half of the dropouts were seen as
collaborative by the school. In contrast, nearly three quarters of the dropouts in Lebanon
were considered collaborative. In many ways, this measure could be viewed as an indicator
of engagement or distraction.
Figure 4: Percentage of dropouts who were reported by the school as being collaborative by Field
unrwa school drop out
september 2013
17
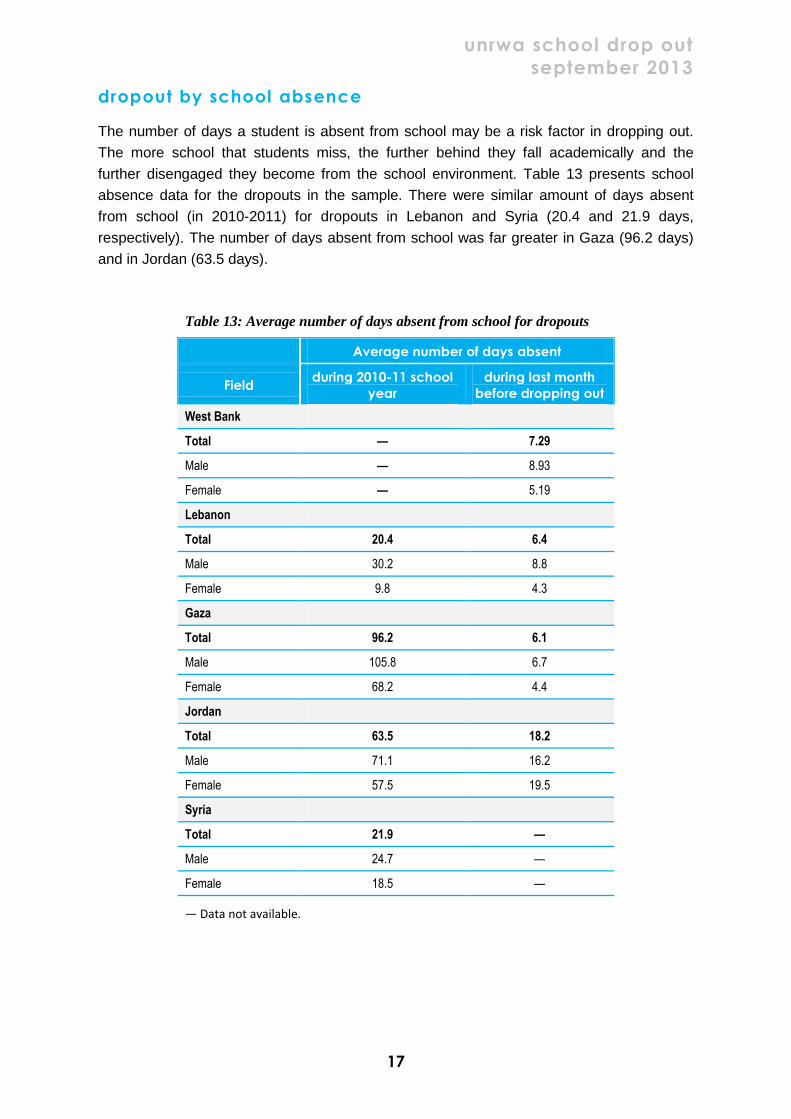
dropout by school absence
The number of days a student is absent from school may be a risk factor in dropping out.
The more school that students miss, the further behind they fall academically and the
further disengaged they become from the school environment. Table 13 presents school
absence data for the dropouts in the sample. There were similar amount of days absent
from school (in 2010-2011) for dropouts in Lebanon and Syria (20.4 and 21.9 days,
respectively). The number of days absent from school was far greater in Gaza (96.2 days)
and in Jordan (63.5 days).
Table 13: Average number of days absent from school for dropouts
Average number of days absent
Field during 2010-11 school
year
during last month
before dropping out
West Bank
Total — 7.29
Male — 8.93
Female — 5.19
Lebanon
Total 20.4 6.4
Male 30.2 8.8
Female 9.8 4.3
Gaza
Total 96.2 6.1
Male 105.8 6.7
Female 68.2 4.4
Jordan
Total 63.5 18.2
Male 71.1 16.2
Female 57.5 19.5
Syria
Total 21.9 —
Male 24.7 —
Female 18.5 —
— Data not available.
18
There are notable differences by gender. Across the Fields, males who dropped out had
more days absent from school in 2010-2011 than females. For example, in Lebanon, males
were absent, on average, a total of 30 days compared with females who were absent 10
days. Similar patterns can be observed across the other three Fields.
The above information depends on the date at which the student dropped out during the
year (start or end of the school year), therefore data on how many days the dropouts had
been absent in the month prior to dropping out was also collected from the schools (Table
13). As the data in Table 13 indicates, the dropouts missed school a number of days during
the last month. However, the number of days missed varied across Fields and by gender. In
Gaza and Lebanon, the dropouts missed an average of 6 days of school in the month prior
to dropping out. In both cases, males had slightly higher rates of absenteeism than females.
In the West Bank, the average number of days absent in the month prior to dropping out
was 7, with males being absent nearly 9 days on average compared with females who were
absent 5 days on average. The absenteeism data for Jordan appears higher than the other
Fields. Overall, dropouts in Jordan recorded 18 days of absence in the last month before
dropping out and females recorded higher levels of absenteeism than males (20 versus 16
days).
In the case of female dropouts, rates of absence from school during the school year may
not be a good “at-risk” indicator. This may particularly be the case in Lebanon where
females who dropped out only missed 5 days of school, on average, in the last month prior
to dropping out.
dropout by social and economic risk factors
There are a number of factors that can place a student at risk of dropping out. These may
include marriage, work, or death of a parent. The dropouts in this study were classified in
terms of having none, one, two, or three of these particular risk factors.
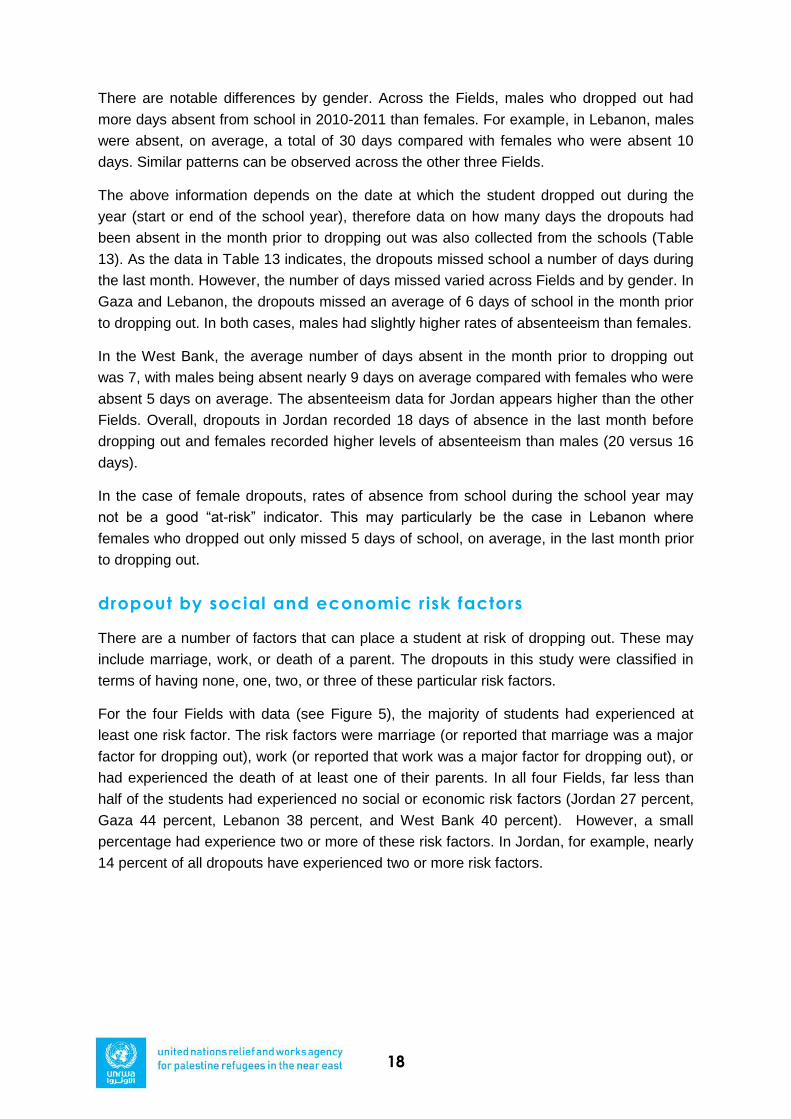
For the four Fields with data (see Figure 5), the majority of students had experienced at
least one risk factor. The risk factors were marriage (or reported that marriage was a major
factor for dropping out), work (or reported that work was a major factor for dropping out), or
had experienced the death of at least one of their parents. In all four Fields, far less than
half of the students had experienced no social or economic risk factors (Jordan 27 percent,
Gaza 44 percent, Lebanon 38 percent, and West Bank 40 percent). However, a small
percentage had experience two or more of these risk factors. In Jordan, for example, nearly
14 percent of all dropouts have experienced two or more risk factors.
unrwa school drop out
september 2013
19
Figure 5: Percent of dropouts by number of social and economic risk factors
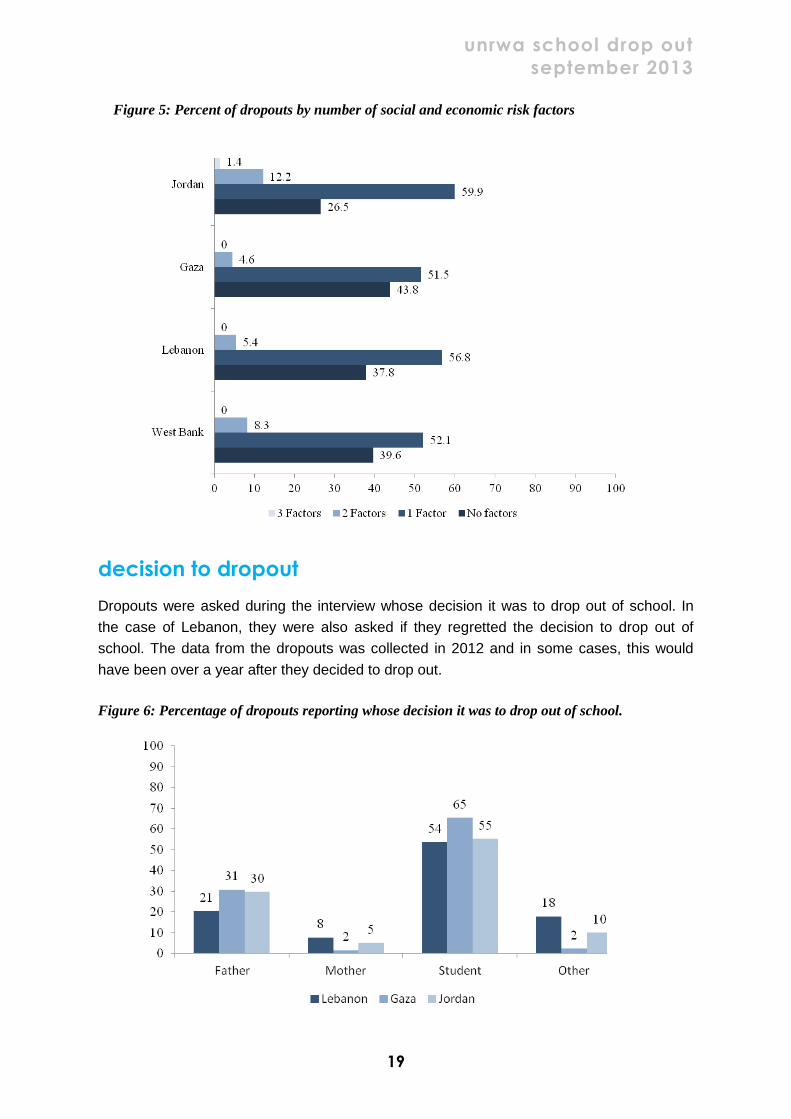
decision to dropout
Dropouts were asked during the interview whose decision it was to drop out of school. In
the case of Lebanon, they were also asked if they regretted the decision to drop out of
school. The data from the dropouts was collected in 2012 and in some cases, this would
have been over a year after they decided to drop out.
Figure 6: Percentage of dropouts reporting whose decision it was to drop out of school.
20
Across the three Fields with data, it is clear that in the majority of the cases, the student
reported that they, themselves, made the decision to drop out (see Figure 6). For schools
this is important information because if the student is making the decision there is an
opportunity to engage with them in a way it may not be possible with the students‟ parents.
In the case of Lebanon, 45 percent of the dropouts reported that they regretted dropping out
of school; fifty-five percent reported that they did not regret the decision.
reasons for dropping out
During the interview, dropouts were provided a list of 32 potential reasons for dropping out
of school and were asked if each reason was “not a reason,” “a major reason,” or a
“secondary reason” for leaving school. The reasons provided were grouped into four broad
categories: student-specific, school-related, family-related, and socioeconomic reasons.
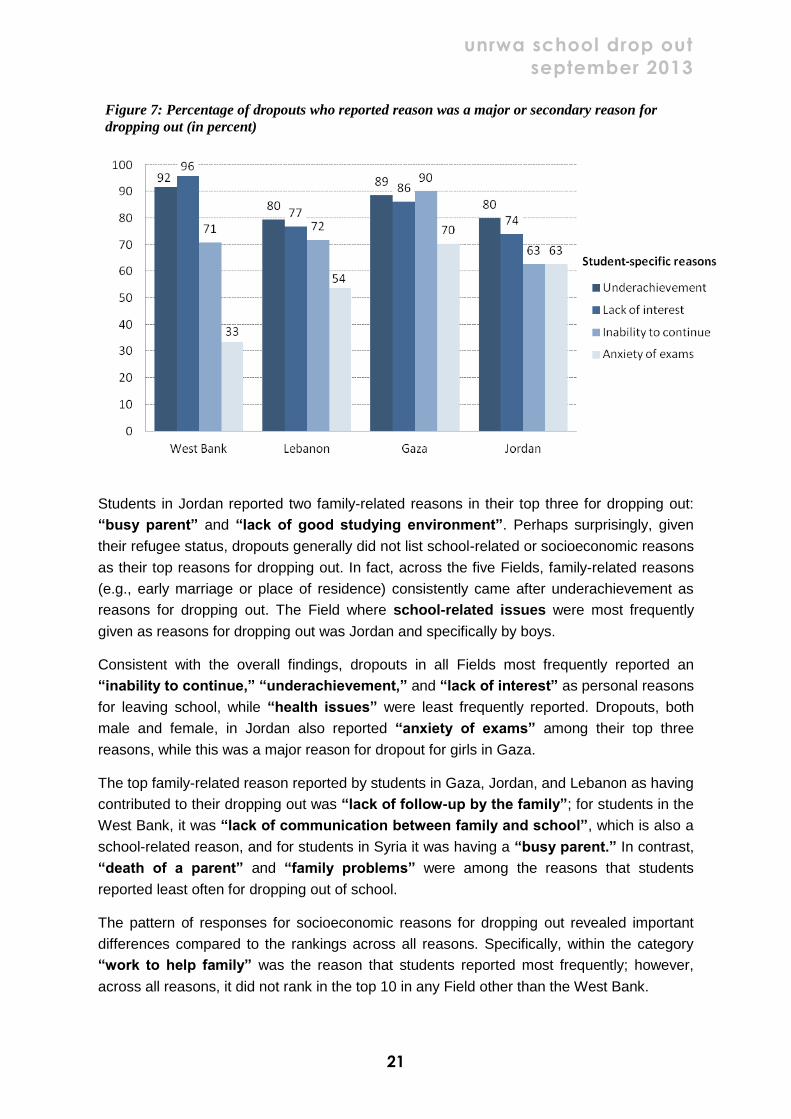
Across all four Fields, dropouts reported student-specific reasons as the top three reasons
that led to their dropping out of school. For example, the number one reason in Jordan and
Lebanon, and the number two reason in Gaza and the West Bank, was
“underachievement” (see Figure 7).8 Effectively, if students thought they were not going to
graduate, they dropped out of school. “Lack of interest” followed as the most commonly
reported reason for dropping out across all Fields. Meanwhile, dropouts in Gaza reported an
“inability to continue” as their first reason for dropping out.9
In terms of female dropouts in Gaza, 69 percent reported “being overage” as a reason for
dropping out (see Appendix A Tables). For 44 percent of female dropouts this was a major
reason for dropping out and is the reason with the highest percentage for females in all
Fields. In Lebanon, 20 percent reported that “being overage” was a major reason for them
dropping out of school. In terms of context, the average repetition rate for females in
Lebanon was 10.2 percent. Therefore, the girls‟ reports appear in line with the overall rates
of grade repetition. However, this is not the case with Gaza where 44 percent of female
dropouts reported “being overage” as a major reason for dropping out of school, but the
average repetition rate is the lowest across the five Fields at 1.5 percent.
8 Due to the on-going conflict in Syria, the student-level questionnaire data was not available for analysis. In this
section, data will be presented for four of the five Fields. 9 This statement is somewhat vague and it is difficult to interpret and give meaning to this result.
unrwa school drop out
september 2013
21
Figure 7: Percentage of dropouts who reported reason was a major or secondary reason for
dropping out (in percent)
Students in Jordan reported two family-related reasons in their top three for dropping out:
“busy parent” and “lack of good studying environment”. Perhaps surprisingly, given
their refugee status, dropouts generally did not list school-related or socioeconomic reasons
as their top reasons for dropping out. In fact, across the five Fields, family-related reasons
(e.g., early marriage or place of residence) consistently came after underachievement as
reasons for dropping out. The Field where school-related issues were most frequently
given as reasons for dropping out was Jordan and specifically by boys.
Consistent with the overall findings, dropouts in all Fields most frequently reported an
“inability to continue,” “underachievement,” and “lack of interest” as personal reasons
for leaving school, while “health issues” were least frequently reported. Dropouts, both
male and female, in Jordan also reported “anxiety of exams” among their top three
reasons, while this was a major reason for dropout for girls in Gaza.
The top family-related reason reported by students in Gaza, Jordan, and Lebanon as having
contributed to their dropping out was “lack of follow-up by the family”; for students in the
West Bank, it was “lack of communication between family and school”, which is also a
school-related reason, and for students in Syria it was having a “busy parent.” In contrast,
“death of a parent” and “family problems” were among the reasons that students
reported least often for dropping out of school.
The pattern of responses for socioeconomic reasons for dropping out revealed important
differences compared to the rankings across all reasons. Specifically, within the category
“work to help family” was the reason that students reported most frequently; however,
across all reasons, it did not rank in the top 10 in any Field other than the West Bank.
22
Further, “early marriage” was one of the top three socioeconomic reasons for students in
Gaza, Jordan, and the West Bank. It was, however, not among the top reasons except in
the West Bank. Jordan had the highest percentage of dropouts who identified early
marriage as a reason for dropping out. The percentage of a cohort who will dropout while
identifying early marriage as a major reason for dropout is below 1 percent in Gaza or West
Bank, while it is 6 percent in Jordan and 2 percent in Lebanon. If major and secondary
reasons for dropout are considered, 3 percent of girls in Lebanon will dropout while
identifying early marriage as a major or secondary reason for dropout, while this percentage
is 7 percent in Jordan, and 1.5 percent or less in West Bank and Gaza.
Finally, somewhat surprising is that 42 percent of boys in Lebanon identify the “influence
of wrong friends” as a major reason for dropping out, and 48 percent of boys and 38
percent of girls in West Bank identify “too much TV and internet” as a major reason for
dropout.
Taken together, the consistency of the reasons given for dropping out indicates that, largely,
student refugees discontinue their education for student-specific reasons, such as lack of
interest and underachievement, and for family-related reasons, such as having a busy
parent and a lack of communication between parents and teachers. Although students
report some school and socio-economic reasons for dropping out, these do not seem to be
the most important drivers behind students‟ decision to discontinue his or her education. It is
important to underline that these reasons, though student-specific or family-related can be
partly influenced upon by schools.
reasons for dropping out, by selected characteristics
gender
Across Gaza, Jordan, Lebanon, and the West Bank, males and females listed
“underachievement,” “lack of interest,” and an “inability to continue” as the first, second, and
third most common reasons for dropping out of school (see appendix Tables). “Anxiety of
exams” was also in the top five reasons. An interesting contrast between males and
females exists regarding “desire for independence,” “work to help family,” and “early
marriage.” Specifically, 39 percent of males reported independence as a major reason for
dropping out compared to only 8 percent of females. Meanwhile, 34 percent of males
reported “work to help family” as a major reason, compared with only 4 percent of females.
In contrast, 25 percent of females reported early marriage as a major reason, whereas only
5 percent of males did so.
Based on gender, student refugees in Gaza, the West Bank, and Jordan reflected the
overall findings for why students dropped out of school, particularly with “lack of interest”
and “underachievement.” Again, student-specific reasons were among the top five major
reasons for dropping out for both genders.
unrwa school drop out
september 2013
23
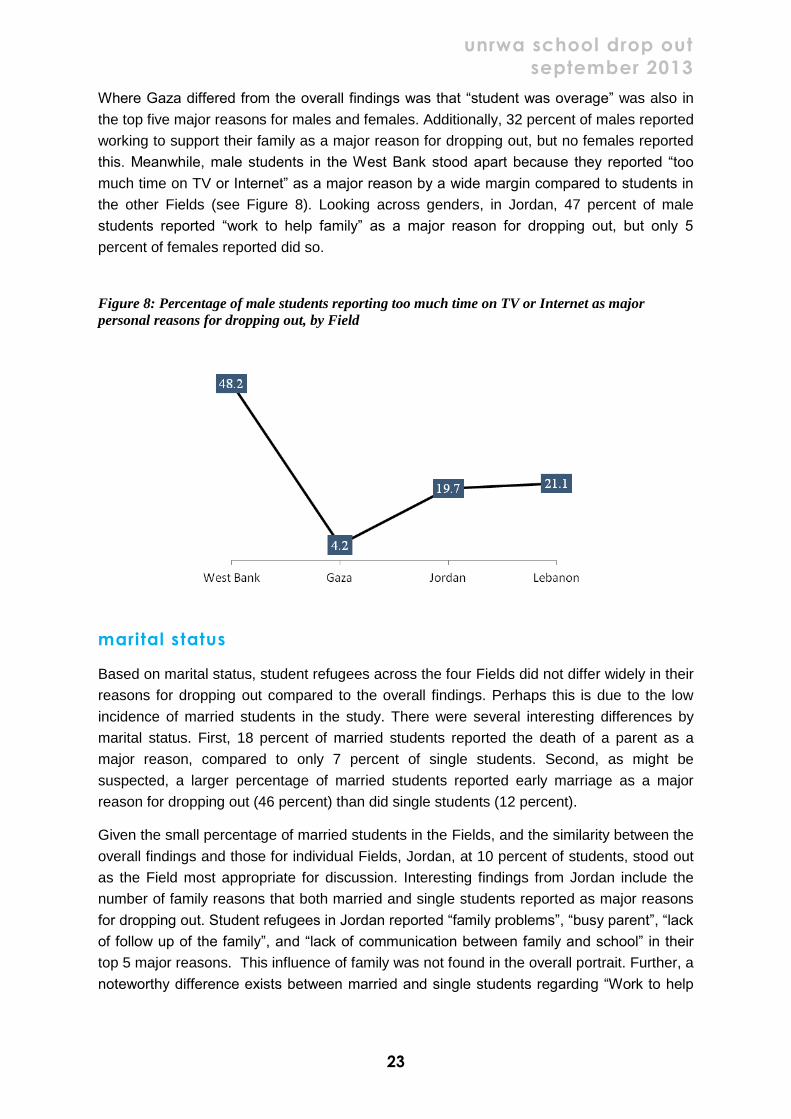
Where Gaza differed from the overall findings was that “student was overage” was also in
the top five major reasons for males and females. Additionally, 32 percent of males reported
working to support their family as a major reason for dropping out, but no females reported
this. Meanwhile, male students in the West Bank stood apart because they reported “too
much time on TV or Internet” as a major reason by a wide margin compared to students in
the other Fields (see Figure 8). Looking across genders, in Jordan, 47 percent of male
students reported “work to help family” as a major reason for dropping out, but only 5
percent of females reported did so.
Figure 8: Percentage of male students reporting too much time on TV or Internet as major
personal reasons for dropping out, by Field
marital status
Based on marital status, student refugees across the four Fields did not differ widely in their
reasons for dropping out compared to the overall findings. Perhaps this is due to the low
incidence of married students in the study. There were several interesting differences by
marital status. First, 18 percent of married students reported the death of a parent as a
major reason, compared to only 7 percent of single students. Second, as might be
suspected, a larger percentage of married students reported early marriage as a major
reason for dropping out (46 percent) than did single students (12 percent).
Given the small percentage of married students in the Fields, and the similarity between the
overall findings and those for individual Fields, Jordan, at 10 percent of students, stood out
as the Field most appropriate for discussion. Interesting findings from Jordan include the
number of family reasons that both married and single students reported as major reasons
for dropping out. Student refugees in Jordan reported “family problems”, “busy parent”, “lack
of follow up of the family”, and “lack of communication between family and school” in their
top 5 major reasons. This influence of family was not found in the overall portrait. Further, a
noteworthy difference exists between married and single students regarding “Work to help
24
family”. Zero married students reported “Work to help family” as a major reason for their
dropping out of school, while 26 percent of students reported it as a major reason.
academic achievement
Across the four Fields with data, “underachievement” was the number one major reason
that student refugees dropped out of school, with “lack of interest” as either the second and
third reasons for each level of achievement. Interestingly, family-related reasons were more
commonly reported based on academic achievement than were other student
characteristics. For example, 56 percent of high-achieving students reported “family
problems” as a major reason for dropping out, and 52 percent of high-achieving students
reported “lack of follow-up of the family” as a major reason.
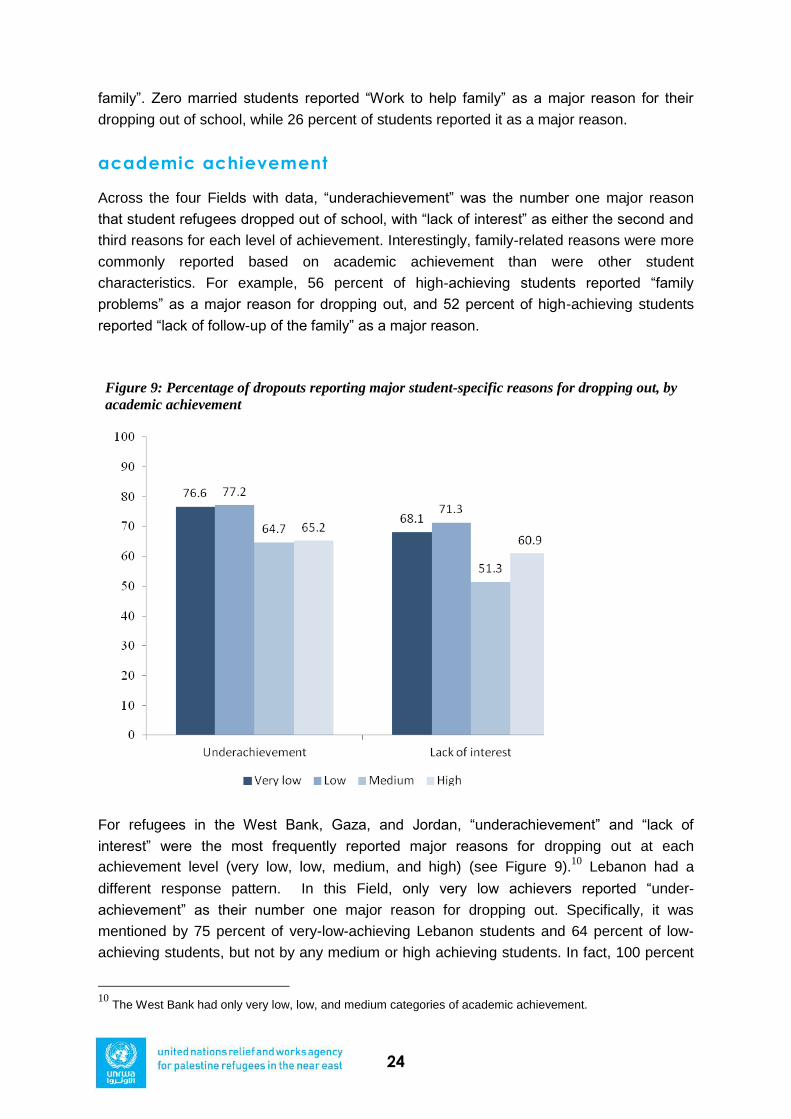
Figure 9: Percentage of dropouts reporting major student-specific reasons for dropping out, by
academic achievement
For refugees in the West Bank, Gaza, and Jordan, “underachievement” and “lack of
interest” were the most frequently reported major reasons for dropping out at each
achievement level (very low, low, medium, and high) (see Figure 9).10
Lebanon had a
different response pattern. In this Field, only very low achievers reported “under-
achievement” as their number one major reason for dropping out. Specifically, it was
mentioned by 75 percent of very-low-achieving Lebanon students and 64 percent of low-
achieving students, but not by any medium or high achieving students. In fact, 100 percent
10
The West Bank had only very low, low, and medium categories of academic achievement.
unrwa school drop out
september 2013
25
of high-achieving student refugees in Lebanon who dropped out reported an “inability to
continue,” “desire for independence,” “family problems,” and “early marriage” as their major
reason for dropping out. In Gaza, family-related reasons were mentioned more often than in
the other Fields.
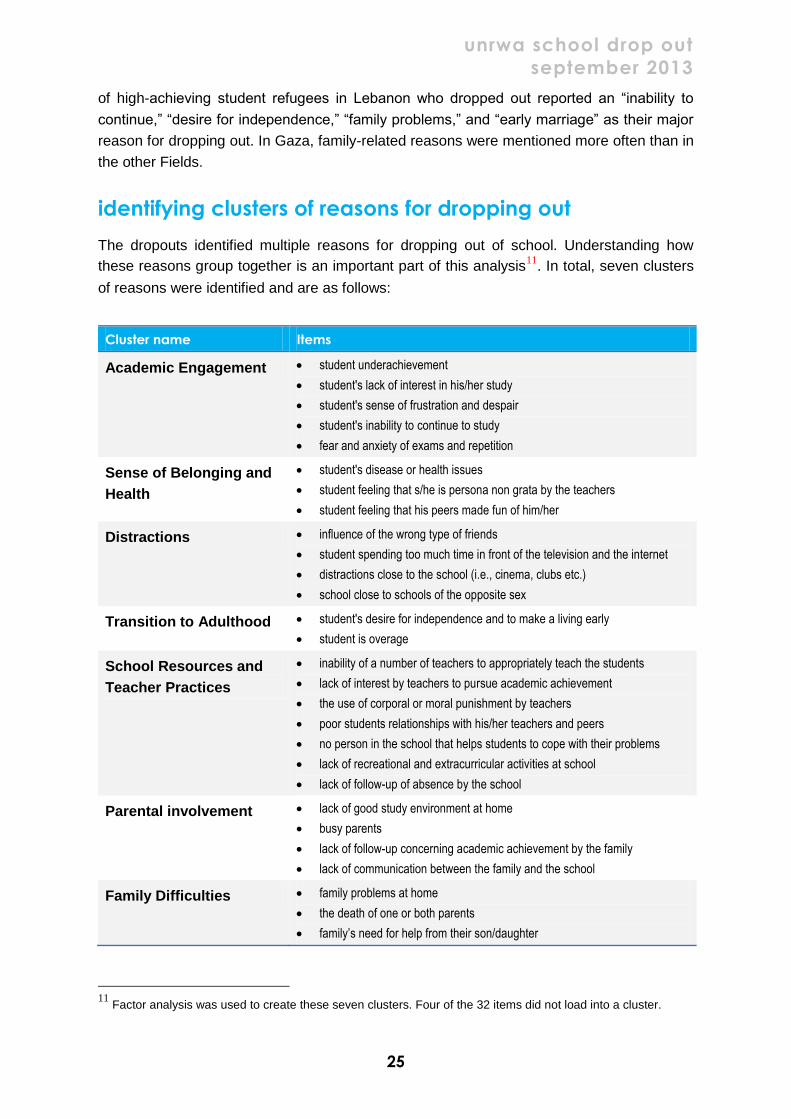
identifying clusters of reasons for dropping out
The dropouts identified multiple reasons for dropping out of school. Understanding how
these reasons group together is an important part of this analysis11
. In total, seven clusters
of reasons were identified and are as follows:
Cluster name Items
Academic Engagement student underachievement
student's lack of interest in his/her study
student's sense of frustration and despair
student's inability to continue to study
fear and anxiety of exams and repetition
Sense of Belonging and
Health
student's disease or health issues
student feeling that s/he is persona non grata by the teachers
student feeling that his peers made fun of him/her
Distractions influence of the wrong type of friends
student spending too much time in front of the television and the internet
distractions close to the school (i.e., cinema, clubs etc.)
school close to schools of the opposite sex
Transition to Adulthood student's desire for independence and to make a living early
student is overage
School Resources and
Teacher Practices
inability of a number of teachers to appropriately teach the students
lack of interest by teachers to pursue academic achievement
the use of corporal or moral punishment by teachers
poor students relationships with his/her teachers and peers
no person in the school that helps students to cope with their problems
lack of recreational and extracurricular activities at school
lack of follow-up of absence by the school
Parental involvement lack of good study environment at home
busy parents
lack of follow-up concerning academic achievement by the family
lack of communication between the family and the school
Family Difficulties family problems at home
the death of one or both parents
family’s need for help from their son/daughter
11
Factor analysis was used to create these seven clusters. Four of the 32 items did not load into a cluster.
26
ranking of clusters
When these clusters were compared within and across Fields, a number of patterns
emerged. Across all Fields with data, low academic engagement was identified by the
former students as being the most salient set of reasons for them dropping out of school.
This was the case overall and across the four Fields with data (see Table 14). Overall, the
second most important set of reasons for dropping out was lack of parental involvement
followed by reasons concerned with transition to adulthood. The fourth most salient set of
reasons was concerned with family difficulties, the fifth was school resources and teaching
practices, and the sixth was student experiencing various distractions.
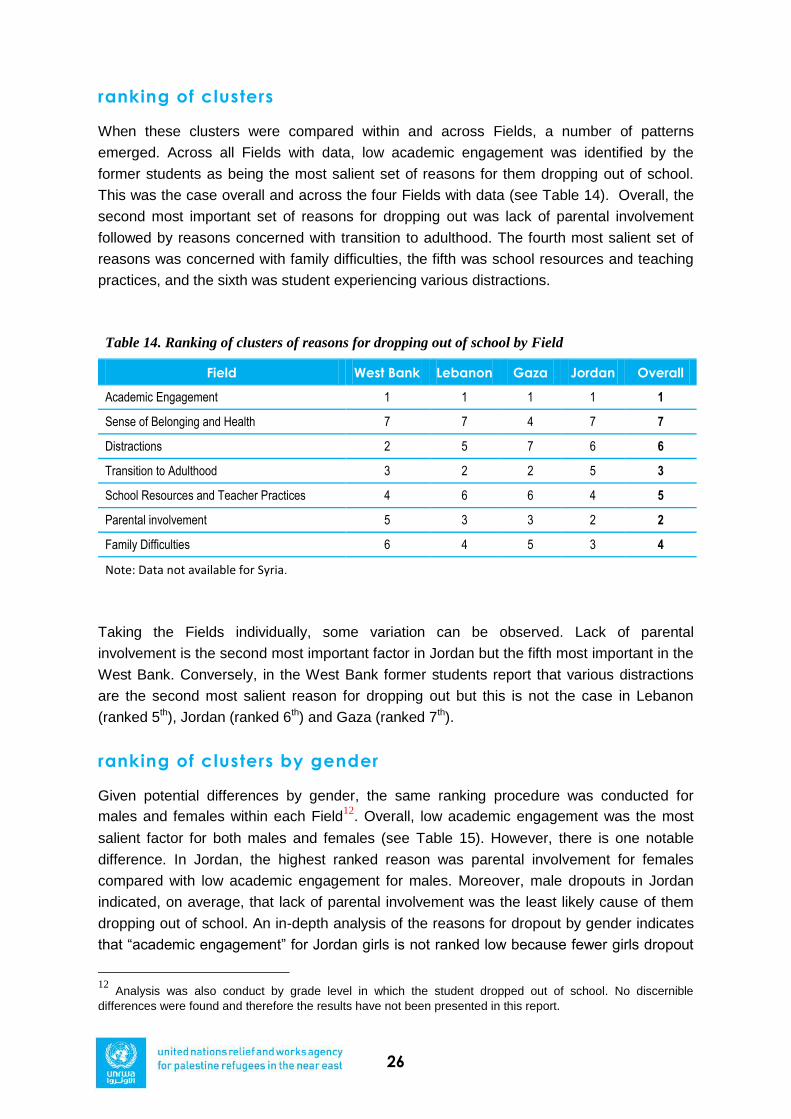
Table 14. Ranking of clusters of reasons for dropping out of school by Field
Field West Bank Lebanon Gaza Jordan Overall
Academic Engagement 1 1 1 1 1
Sense of Belonging and Health 7 7 4 7 7
Distractions 2 5 7 6 6
Transition to Adulthood 3 2 2 5 3
School Resources and Teacher Practices 4 6 6 4 5
Parental involvement 5 3 3 2 2
Family Difficulties 6 4 5 3 4
Note: Data not available for Syria.
Taking the Fields individually, some variation can be observed. Lack of parental
involvement is the second most important factor in Jordan but the fifth most important in the
West Bank. Conversely, in the West Bank former students report that various distractions
are the second most salient reason for dropping out but this is not the case in Lebanon
(ranked 5th), Jordan (ranked 6th) and Gaza (ranked 7th).
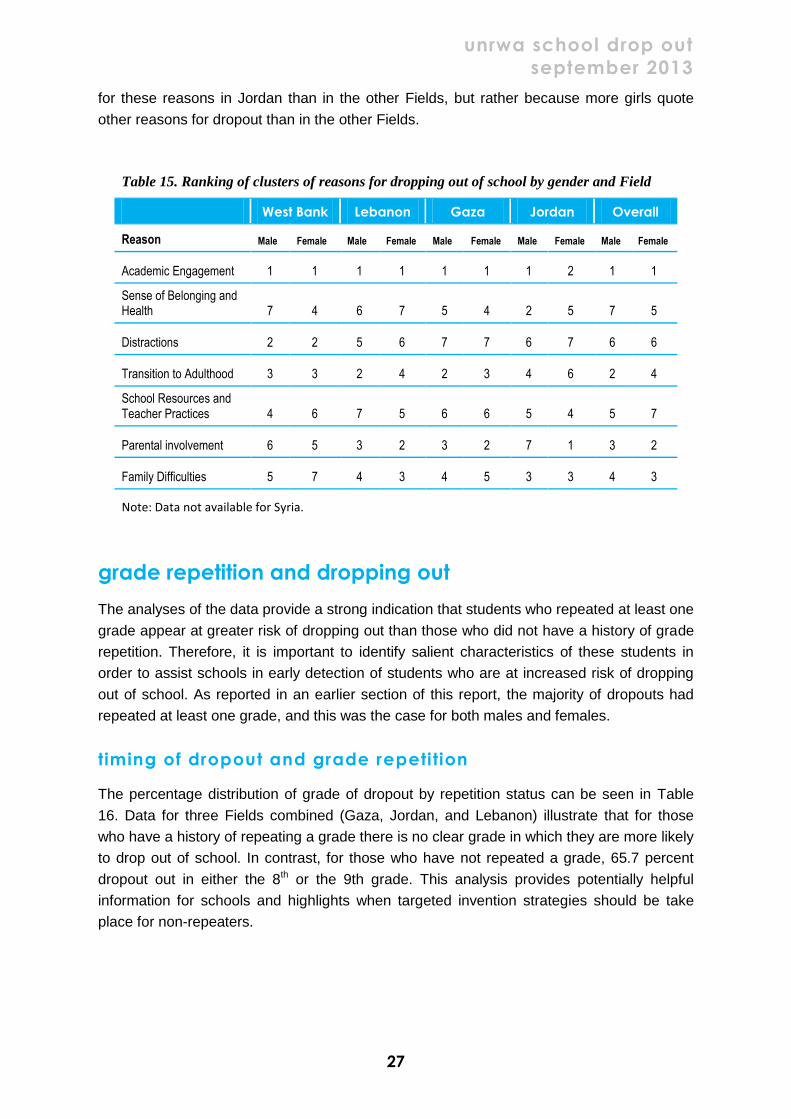
ranking of clusters by gender
Given potential differences by gender, the same ranking procedure was conducted for
males and females within each Field12
. Overall, low academic engagement was the most
salient factor for both males and females (see Table 15). However, there is one notable
difference. In Jordan, the highest ranked reason was parental involvement for females
compared with low academic engagement for males. Moreover, male dropouts in Jordan
indicated, on average, that lack of parental involvement was the least likely cause of them
dropping out of school. An in-depth analysis of the reasons for dropout by gender indicates
that “academic engagement” for Jordan girls is not ranked low because fewer girls dropout
12
Analysis was also conduct by grade level in which the student dropped out of school. No discernible
differences were found and therefore the results have not been presented in this report.
unrwa school drop out
september 2013
27
for these reasons in Jordan than in the other Fields, but rather because more girls quote
other reasons for dropout than in the other Fields.
Table 15. Ranking of clusters of reasons for dropping out of school by gender and Field
West Bank Lebanon Gaza Jordan Overall
Reason Male Female Male Female Male Female Male Female Male Female
Academic Engagement 1 1 1 1 1 1 1 2 1 1
Sense of Belonging and Health 7 4 6 7 5 4 2 5 7 5
Distractions 2 2 5 6 7 7 6 7 6 6
Transition to Adulthood 3 3 2 4 2 3 4 6 2 4
School Resources and Teacher Practices 4 6 7 5 6 6 5 4 5 7
Parental involvement 6 5 3 2 3 2 7 1 3 2
Family Difficulties 5 7 4 3 4 5 3 3 4 3
Note: Data not available for Syria.
grade repetition and dropping out
The analyses of the data provide a strong indication that students who repeated at least one
grade appear at greater risk of dropping out than those who did not have a history of grade
repetition. Therefore, it is important to identify salient characteristics of these students in
order to assist schools in early detection of students who are at increased risk of dropping
out of school. As reported in an earlier section of this report, the majority of dropouts had
repeated at least one grade, and this was the case for both males and females.
timing of dropout and grade repetition
The percentage distribution of grade of dropout by repetition status can be seen in Table
16. Data for three Fields combined (Gaza, Jordan, and Lebanon) illustrate that for those
who have a history of repeating a grade there is no clear grade in which they are more likely
to drop out of school. In contrast, for those who have not repeated a grade, 65.7 percent
dropout out in either the 8th or the 9th grade. This analysis provides potentially helpful
information for schools and highlights when targeted invention strategies should be take
place for non-repeaters.
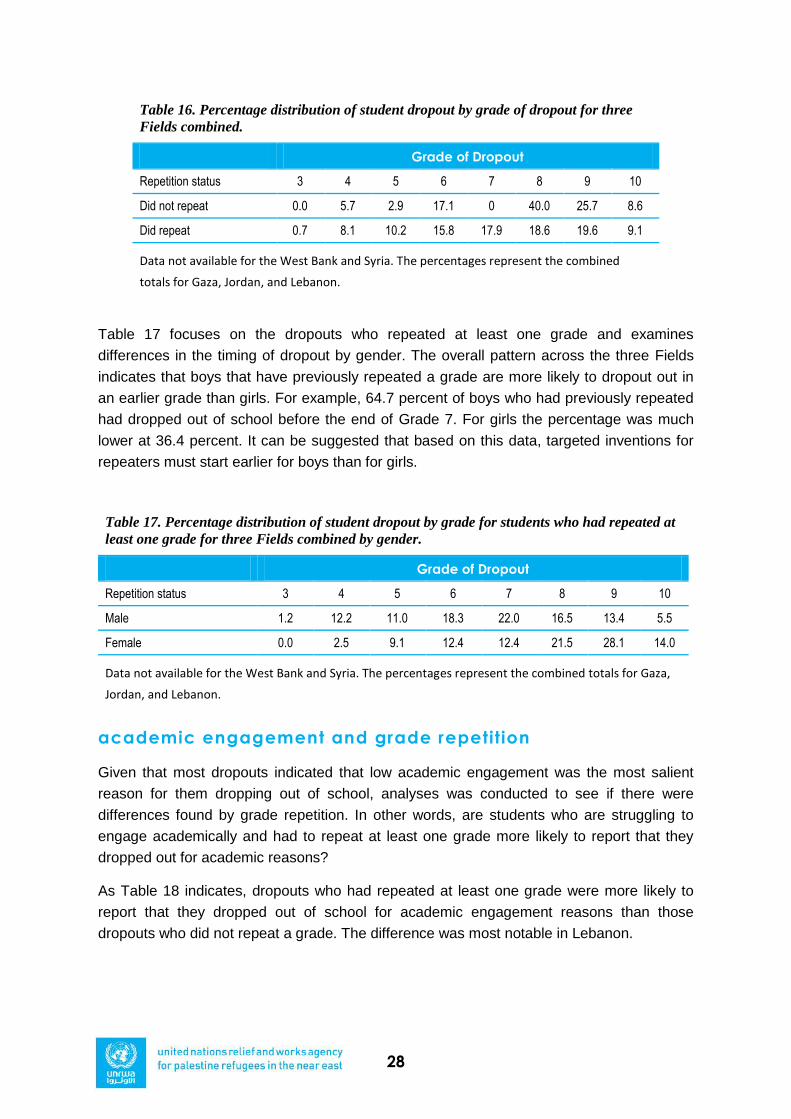
28
Table 16. Percentage distribution of student dropout by grade of dropout for three
Fields combined.
Grade of Dropout
Repetition status 3 4 5 6 7 8 9 10
Did not repeat 0.0 5.7 2.9 17.1 0 40.0 25.7 8.6
Did repeat 0.7 8.1 10.2 15.8 17.9 18.6 19.6 9.1
Data not available for the West Bank and Syria. The percentages represent the combined
totals for Gaza, Jordan, and Lebanon.
Table 17 focuses on the dropouts who repeated at least one grade and examines
differences in the timing of dropout by gender. The overall pattern across the three Fields
indicates that boys that have previously repeated a grade are more likely to dropout out in
an earlier grade than girls. For example, 64.7 percent of boys who had previously repeated
had dropped out of school before the end of Grade 7. For girls the percentage was much
lower at 36.4 percent. It can be suggested that based on this data, targeted inventions for
repeaters must start earlier for boys than for girls.
Table 17. Percentage distribution of student dropout by grade for students who had repeated at
least one grade for three Fields combined by gender.
Grade of Dropout
Repetition status 3 4 5 6 7 8 9 10
Male 1.2 12.2 11.0 18.3 22.0 16.5 13.4 5.5
Female 0.0 2.5 9.1 12.4 12.4 21.5 28.1 14.0
Data not available for the West Bank and Syria. The percentages represent the combined totals for Gaza,
Jordan, and Lebanon.
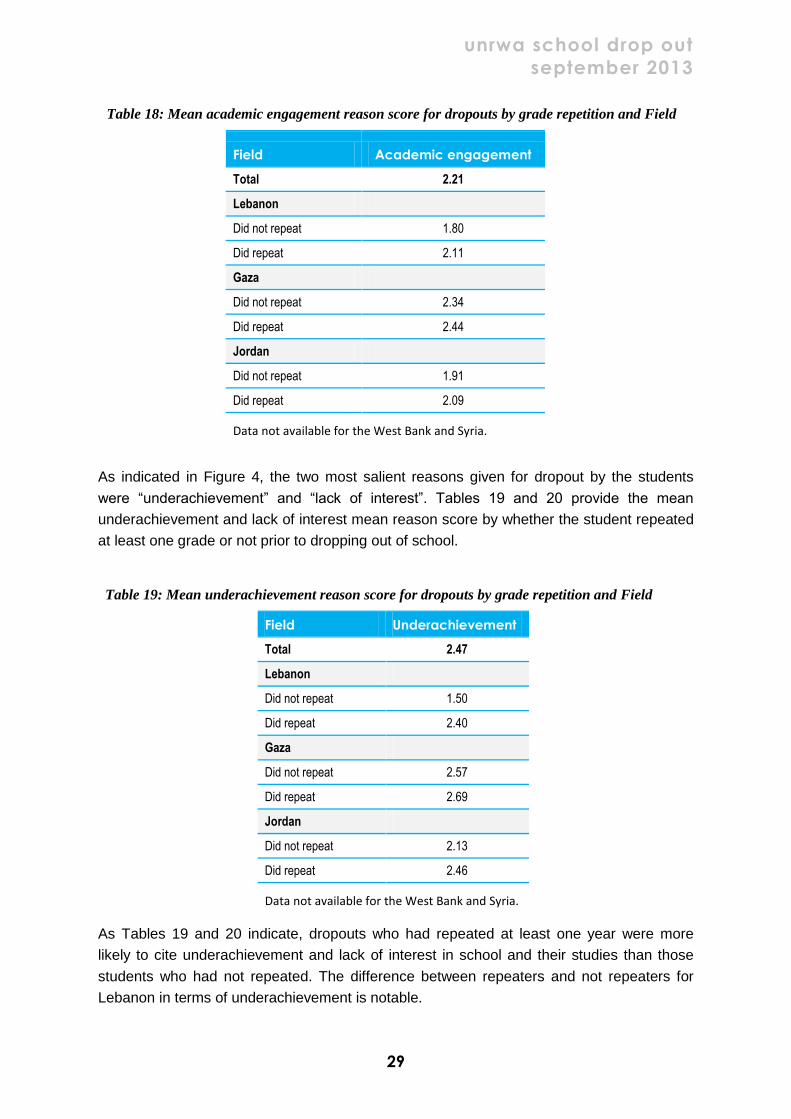
academic engagement and grade repetition
Given that most dropouts indicated that low academic engagement was the most salient
reason for them dropping out of school, analyses was conducted to see if there were
differences found by grade repetition. In other words, are students who are struggling to
engage academically and had to repeat at least one grade more likely to report that they
dropped out for academic reasons?
As Table 18 indicates, dropouts who had repeated at least one grade were more likely to
report that they dropped out of school for academic engagement reasons than those
dropouts who did not repeat a grade. The difference was most notable in Lebanon.
unrwa school drop out
september 2013
29
Table 18: Mean academic engagement reason score for dropouts by grade repetition and Field
Field Academic engagement
Total 2.21
Lebanon
Did not repeat 1.80
Did repeat 2.11
Gaza
Did not repeat 2.34
Did repeat 2.44
Jordan
Did not repeat 1.91
Did repeat 2.09
Data not available for the West Bank and Syria.
As indicated in Figure 4, the two most salient reasons given for dropout by the students
were “underachievement” and “lack of interest”. Tables 19 and 20 provide the mean
underachievement and lack of interest mean reason score by whether the student repeated
at least one grade or not prior to dropping out of school.
Table 19: Mean underachievement reason score for dropouts by grade repetition and Field
Field Underachievement
Total 2.47
Lebanon
Did not repeat 1.50
Did repeat 2.40
Gaza
Did not repeat 2.57
Did repeat 2.69
Jordan
Did not repeat 2.13
Did repeat 2.46
Data not available for the West Bank and Syria.
As Tables 19 and 20 indicate, dropouts who had repeated at least one year were more
likely to cite underachievement and lack of interest in school and their studies than those
students who had not repeated. The difference between repeaters and not repeaters for
Lebanon in terms of underachievement is notable.
30
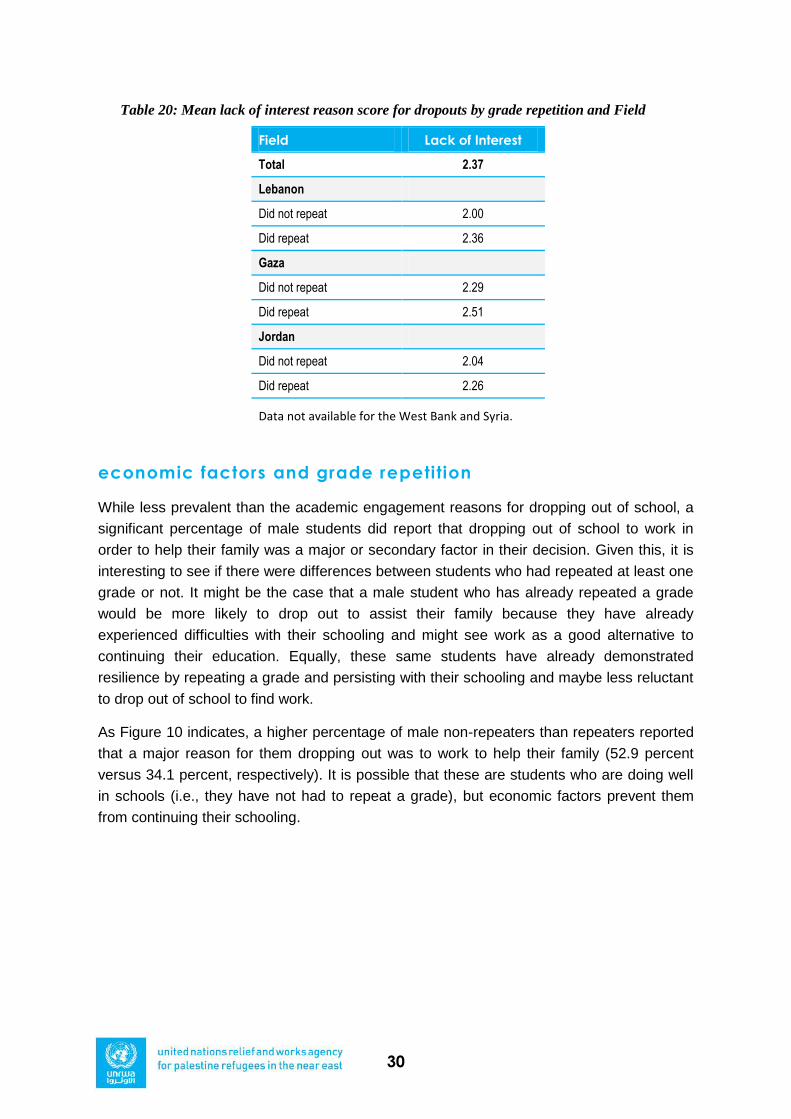
Table 20: Mean lack of interest reason score for dropouts by grade repetition and Field
Field Lack of Interest
Total 2.37
Lebanon
Did not repeat 2.00
Did repeat 2.36
Gaza
Did not repeat 2.29
Did repeat 2.51
Jordan
Did not repeat 2.04
Did repeat 2.26
Data not available for the West Bank and Syria.
economic factors and grade repetition
While less prevalent than the academic engagement reasons for dropping out of school, a
significant percentage of male students did report that dropping out of school to work in
order to help their family was a major or secondary factor in their decision. Given this, it is
interesting to see if there were differences between students who had repeated at least one
grade or not. It might be the case that a male student who has already repeated a grade
would be more likely to drop out to assist their family because they have already
experienced difficulties with their schooling and might see work as a good alternative to
continuing their education. Equally, these same students have already demonstrated
resilience by repeating a grade and persisting with their schooling and maybe less reluctant
to drop out of school to find work.
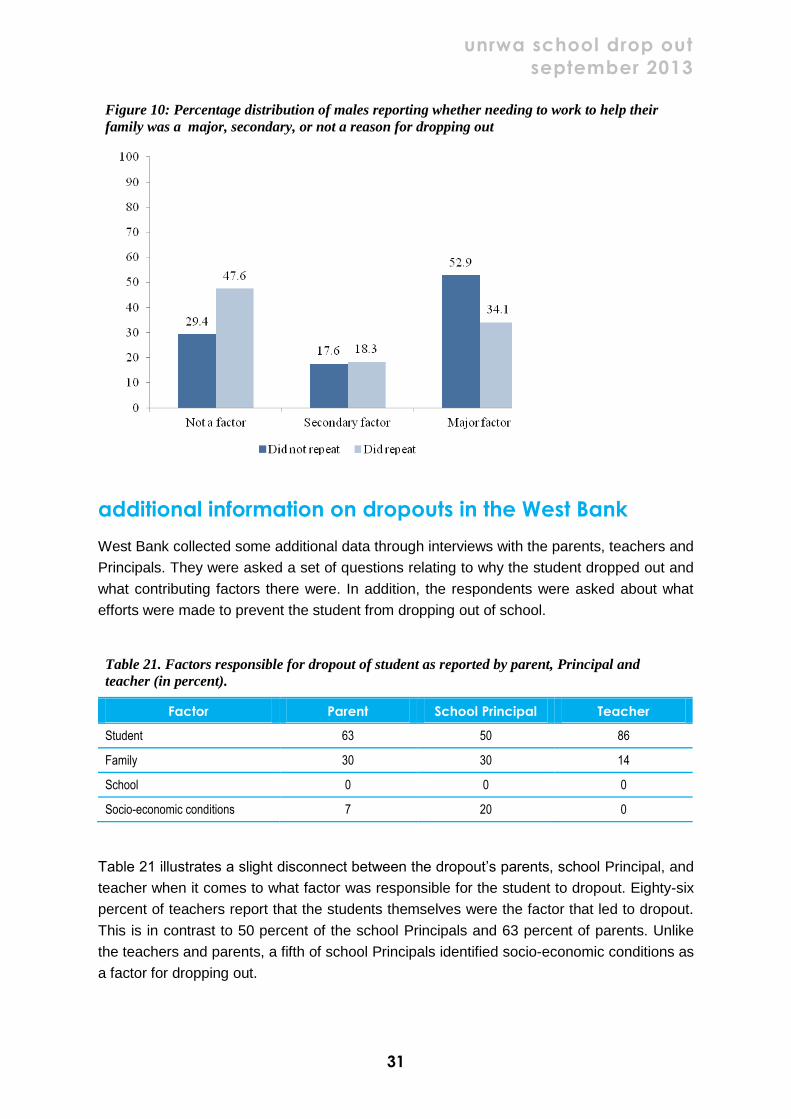
As Figure 10 indicates, a higher percentage of male non-repeaters than repeaters reported
that a major reason for them dropping out was to work to help their family (52.9 percent
versus 34.1 percent, respectively). It is possible that these are students who are doing well
in schools (i.e., they have not had to repeat a grade), but economic factors prevent them
from continuing their schooling.
unrwa school drop out
september 2013
31
Figure 10: Percentage distribution of males reporting whether needing to work to help their
family was a major, secondary, or not a reason for dropping out
additional information on dropouts in the West Bank
West Bank collected some additional data through interviews with the parents, teachers and
Principals. They were asked a set of questions relating to why the student dropped out and
what contributing factors there were. In addition, the respondents were asked about what
efforts were made to prevent the student from dropping out of school.
Table 21. Factors responsible for dropout of student as reported by parent, Principal and
teacher (in percent).
Factor Parent School Principal Teacher
Student 63 50 86
Family 30 30 14
School 0 0 0
Socio-economic conditions 7 20 0
Table 21 illustrates a slight disconnect between the dropout‟s parents, school Principal, and
teacher when it comes to what factor was responsible for the student to dropout. Eighty-six
percent of teachers report that the students themselves were the factor that led to dropout.
This is in contrast to 50 percent of the school Principals and 63 percent of parents. Unlike
the teachers and parents, a fifth of school Principals identified socio-economic conditions as
a factor for dropping out.
32
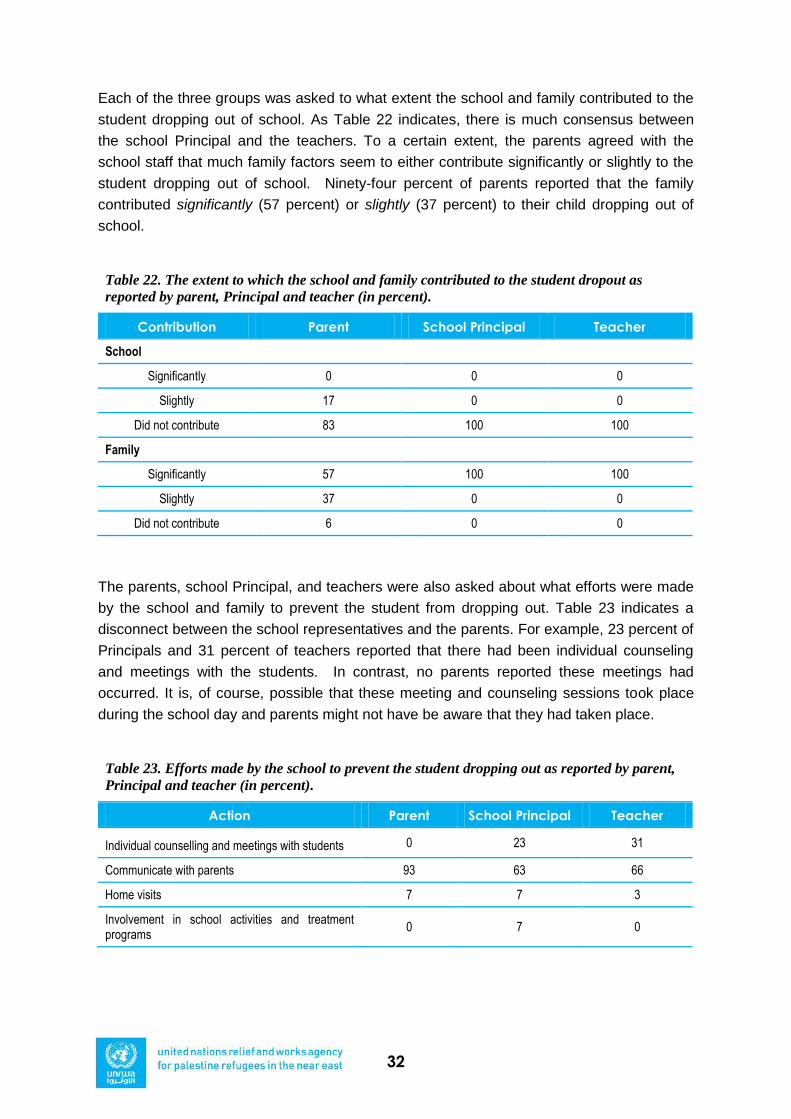
Each of the three groups was asked to what extent the school and family contributed to the
student dropping out of school. As Table 22 indicates, there is much consensus between
the school Principal and the teachers. To a certain extent, the parents agreed with the
school staff that much family factors seem to either contribute significantly or slightly to the
student dropping out of school. Ninety-four percent of parents reported that the family
contributed significantly (57 percent) or slightly (37 percent) to their child dropping out of
school.
Table 22. The extent to which the school and family contributed to the student dropout as
reported by parent, Principal and teacher (in percent).
Contribution Parent School Principal Teacher
School
Significantly 0 0 0
Slightly 17 0 0
Did not contribute 83 100 100
Family
Significantly 57 100 100
Slightly 37 0 0
Did not contribute 6 0 0
The parents, school Principal, and teachers were also asked about what efforts were made
by the school and family to prevent the student from dropping out. Table 23 indicates a
disconnect between the school representatives and the parents. For example, 23 percent of
Principals and 31 percent of teachers reported that there had been individual counseling
and meetings with the students. In contrast, no parents reported these meetings had
occurred. It is, of course, possible that these meeting and counseling sessions took place
during the school day and parents might not have be aware that they had taken place.
Table 23. Efforts made by the school to prevent the student dropping out as reported by parent,
Principal and teacher (in percent).
Action Parent School Principal Teacher
Individual counselling and meetings with students 0 23 31
Communicate with parents 93 63 66
Home visits 7 7 3
Involvement in school activities and treatment programs
0 7 0
unrwa school drop out
september 2013
33
Parents reported that they had been communicated with concerning their child (93 percent).
However, it is interesting to note few parents, Principals, and teachers reported that home
visits took place in order to help prevent the student dropping out.
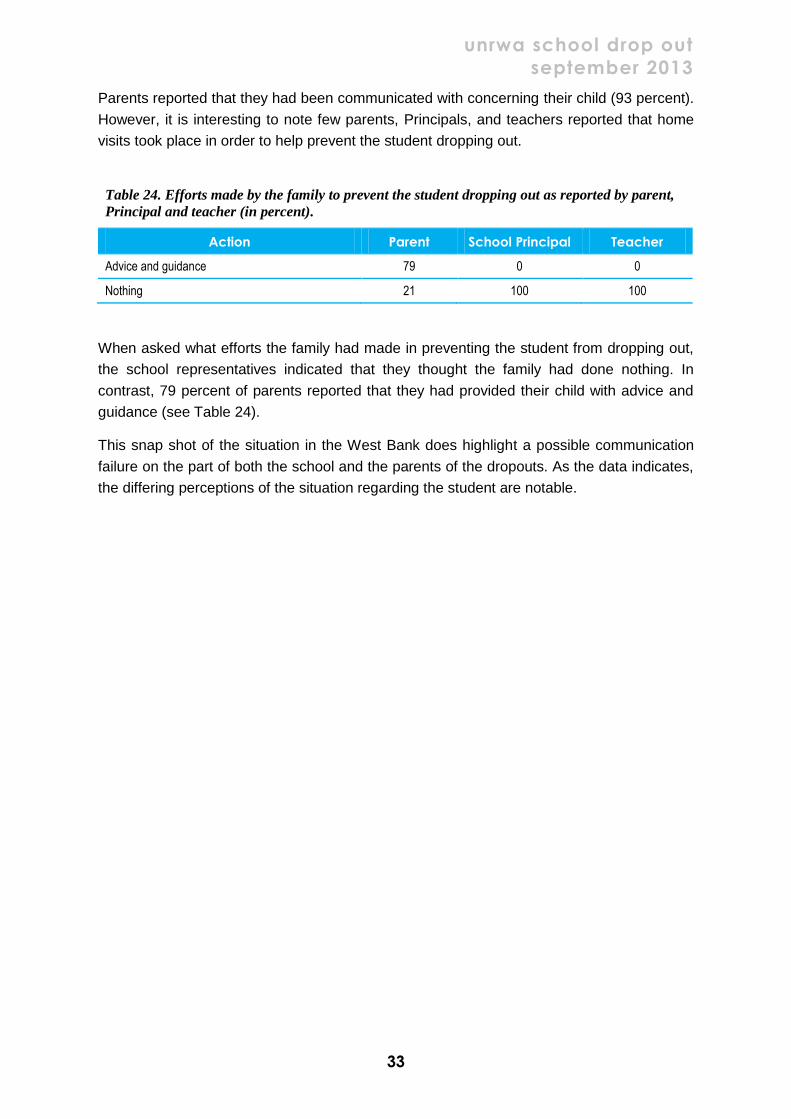
Table 24. Efforts made by the family to prevent the student dropping out as reported by parent,
Principal and teacher (in percent).
Action Parent School Principal Teacher
Advice and guidance 79 0 0
Nothing 21 100 100
When asked what efforts the family had made in preventing the student from dropping out,
the school representatives indicated that they thought the family had done nothing. In
contrast, 79 percent of parents reported that they had provided their child with advice and
guidance (see Table 24).
This snap shot of the situation in the West Bank does highlight a possible communication
failure on the part of both the school and the parents of the dropouts. As the data indicates,
the differing perceptions of the situation regarding the student are notable.
34
warning signs
In many ways, the analysis from the five Fields confirms what we already know. First,
dropouts struggle to engage with school. The dropouts in this study reported low
achievement, frequent absences from schools, and many had repeated a year of schooling.
These are, of course, all interrelated and it is often difficult to know which of these factors
precipitated the others. While there are a number of limitations to this study, such as no
comparison group of students who did not dropout, the results do provide schools with an
overall picture of the profile of Palestine refugees dropouts and provides analysis at the
Field rather than just the school level.
To determine indicators or potential warning signs of dropping out, the following may
provide assistance to Field officers and schools.
1. The overwhelming majority of dropouts have repeated a grade. In Gaza and Jordan,
further analysis could be undertaken which shows that at least a quarter of repeaters
will ultimately dropout, with repeaters being at least 10 times more likely than non-
repeaters to dropout. In this context, focusing on repeaters is a very good way of
targeting future dropouts.
2. If a student has repeated a grade, it is likely that they are struggling to engage more
generally with school. Dropouts who had repeated a grade were more likely to report
a number of academic engagement reasons for dropping out and not just
underachievement.
3. In using absence from school as a possible warning sign, schools should apply a
different metric for females than they do males. This research found that female
dropout‟s absence rate was low compared to the absence rates of male dropouts.
Therefore, for females, repeated absence from school may not be a good warning
sign that the student may be intending to drop out.
4. The majority of dropouts indicated that they themselves made the decision to drop
out of school. This provides schools an opportunity to engage with the student in a
way that would be more difficult if the students‟ parents were making the decision.
5. Student behavior is a good indicator of possible dropout. With the exception of
Lebanon, less than half of all dropouts were reported by their schools as being
collaborative. Frequent monitoring and reporting of student behavior, especially
those students that have other engagement issues, may be a useful strategy for
schools to adopt.
6. Dropouts view low academic engagement as the most salient reason for them
dropping out of school. Schools can influence a student‟s levels of achievement,
they can help them overcome their fear of exams, they can provide support for a
student who is frustrated, they can look to interest the student in their studies, they
can engage with families, and they can react and actively support a student who has
unrwa school drop out
september 2013
35
to repeat a grade. This research provides evidence to suggest that schools should
focus their efforts on engaging students in their learning and academic studies.
While other factors such as increasing parental involvement are important,
resources, time, and effort would be better allocated to engaging students in their
schooling.
7. There was little indication that the students dropped out because of school
resources or the practices of teachers. This is a positive outcome for schools. But, it
does indicate that while dropouts did not seem to blame schools for dropping out,
many reasons that they cited can be highly impacted by school practices. One thing
we might learn from the additional West Bank analyses is that schools need to think
about if and when they communicate with parents when a student appears at risk
from dropping out. While resource intensive, home visits may be a useful way
forward in ensuring effective communication and partnerships are forged with the
students‟ family.
8. While academic engagement was the most salient reason given by dropouts, there
were differences between males and females in the top two ranked sets of reasons.
It is important that schools consider these differences when planning strategies to
reduce the number of dropouts in their schools.
9. Nearly two-thirds of drop out students who have not repeated a grade go on to drop
out in Grade 8 or 9. Therefore, targeted interventions should take place for these
students prior to the beginning of 8th Grade. For those drop outs who have
previously repeated a grade, boys are likely to drop out before the end of Grade 7.
Therefore, targeted interventions for these students should begin prior to 7th Grade.
36
data limitations
The data presented here are based on Fieldwork in some areas experiencing conflict. While
every attempt has been made to ensure a representative sample, it is difficult to survey
highly mobile populations in changeable and unstable environments. The students, schools,
and families represented in the data may be different from non-sampled students, schools,
and families in unknown ways and these differences can introduce bias in the estimates
presented. In particular, Syria is experiencing ongoing conflict and while data was collected
in Syria, most of this data could not be entered and sent out for analysis.
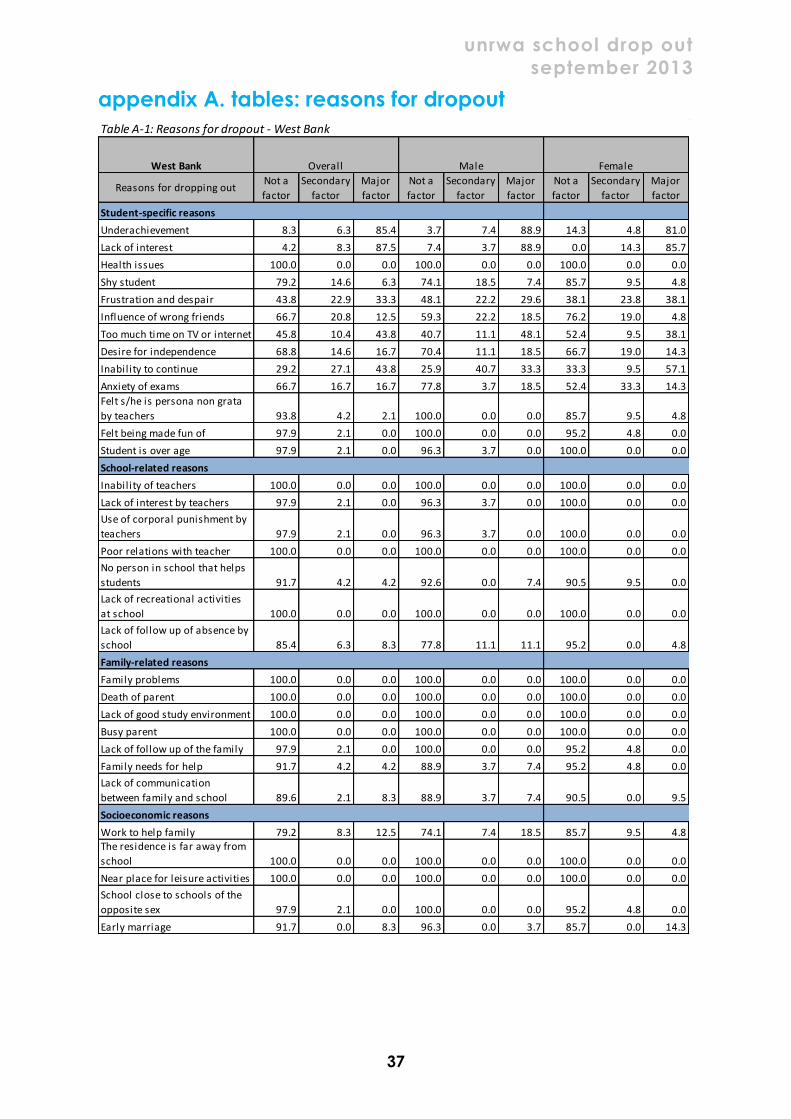
unrwa school drop out
september 2013
37
appendix A. tables: reasons for dropout
Table A-1: Reasons for dropout - West Bank
West Bank
Reasons for dropping outNot a
factor
Secondary
factor
Major
factor
Not a
factor
Secondary
factor
Major
factor
Not a
factor
Secondary
factor
Major
factor
Student-specific reasons
Underachievement 8.3 6.3 85.4 3.7 7.4 88.9 14.3 4.8 81.0
Lack of interest 4.2 8.3 87.5 7.4 3.7 88.9 0.0 14.3 85.7
Health issues 100.0 0.0 0.0 100.0 0.0 0.0 100.0 0.0 0.0
Shy student 79.2 14.6 6.3 74.1 18.5 7.4 85.7 9.5 4.8
Frustration and despair 43.8 22.9 33.3 48.1 22.2 29.6 38.1 23.8 38.1
Influence of wrong friends 66.7 20.8 12.5 59.3 22.2 18.5 76.2 19.0 4.8
Too much time on TV or internet 45.8 10.4 43.8 40.7 11.1 48.1 52.4 9.5 38.1
Desire for independence 68.8 14.6 16.7 70.4 11.1 18.5 66.7 19.0 14.3
Inability to continue 29.2 27.1 43.8 25.9 40.7 33.3 33.3 9.5 57.1
Anxiety of exams 66.7 16.7 16.7 77.8 3.7 18.5 52.4 33.3 14.3
Felt s/he is persona non grata
by teachers 93.8 4.2 2.1 100.0 0.0 0.0 85.7 9.5 4.8
Felt being made fun of 97.9 2.1 0.0 100.0 0.0 0.0 95.2 4.8 0.0
Student is over age 97.9 2.1 0.0 96.3 3.7 0.0 100.0 0.0 0.0
School-related reasons
Inability of teachers 100.0 0.0 0.0 100.0 0.0 0.0 100.0 0.0 0.0
Lack of interest by teachers 97.9 2.1 0.0 96.3 3.7 0.0 100.0 0.0 0.0
Use of corporal punishment by
teachers 97.9 2.1 0.0 96.3 3.7 0.0 100.0 0.0 0.0
Poor relations with teacher 100.0 0.0 0.0 100.0 0.0 0.0 100.0 0.0 0.0
No person in school that helps
students 91.7 4.2 4.2 92.6 0.0 7.4 90.5 9.5 0.0
Lack of recreational activities
at school 100.0 0.0 0.0 100.0 0.0 0.0 100.0 0.0 0.0
Lack of follow up of absence by
school 85.4 6.3 8.3 77.8 11.1 11.1 95.2 0.0 4.8
Family-related reasons
Family problems 100.0 0.0 0.0 100.0 0.0 0.0 100.0 0.0 0.0
Death of parent 100.0 0.0 0.0 100.0 0.0 0.0 100.0 0.0 0.0
Lack of good study environment 100.0 0.0 0.0 100.0 0.0 0.0 100.0 0.0 0.0
Busy parent 100.0 0.0 0.0 100.0 0.0 0.0 100.0 0.0 0.0
Lack of follow up of the family 97.9 2.1 0.0 100.0 0.0 0.0 95.2 4.8 0.0
Family needs for help 91.7 4.2 4.2 88.9 3.7 7.4 95.2 4.8 0.0
Lack of communication
between family and school 89.6 2.1 8.3 88.9 3.7 7.4 90.5 0.0 9.5
Socioeconomic reasons
Work to help family 79.2 8.3 12.5 74.1 7.4 18.5 85.7 9.5 4.8The residence is far away from
school 100.0 0.0 0.0 100.0 0.0 0.0 100.0 0.0 0.0
Near place for leisure activities 100.0 0.0 0.0 100.0 0.0 0.0 100.0 0.0 0.0
School close to schools of the
opposite sex 97.9 2.1 0.0 100.0 0.0 0.0 95.2 4.8 0.0
Early marriage 91.7 0.0 8.3 96.3 0.0 3.7 85.7 0.0 14.3
Overall Male Female
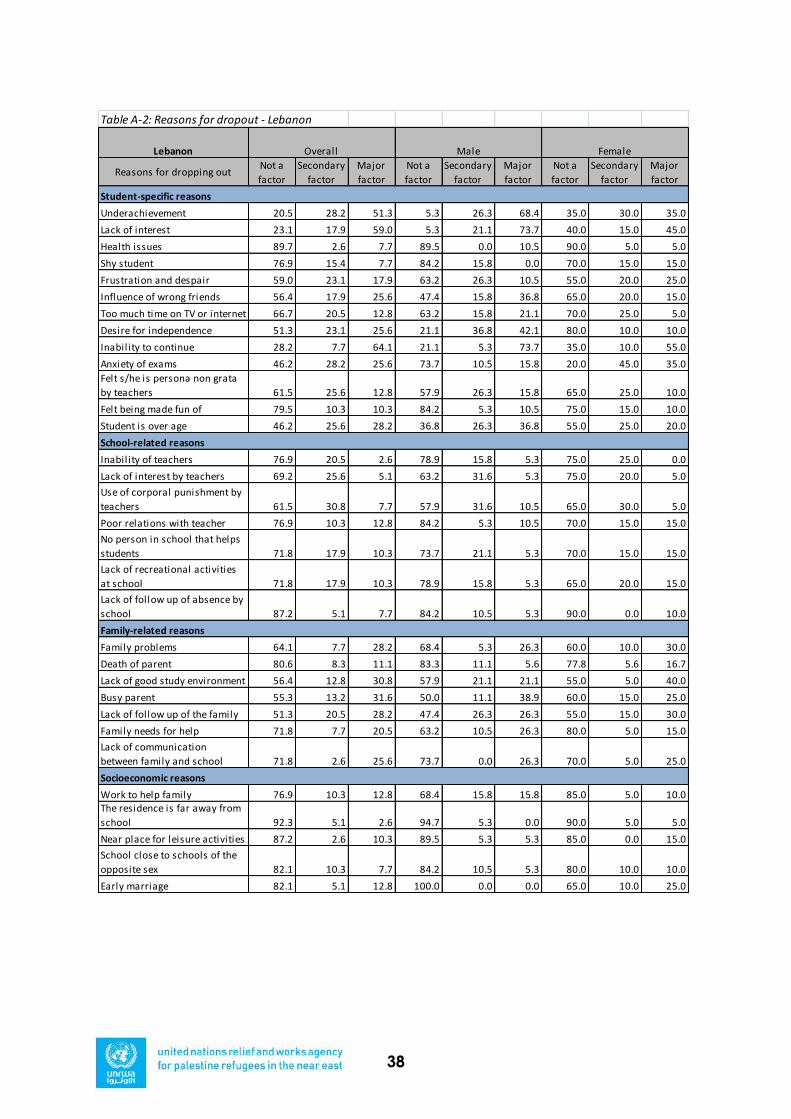
38
Table A-2: Reasons for dropout - Lebanon
Lebanon
Reasons for dropping outNot a
factor
Secondary
factor
Major
factor
Not a
factor
Secondary
factor
Major
factor
Not a
factor
Secondary
factor
Major
factor
Underachievement 20.5 28.2 51.3 5.3 26.3 68.4 35.0 30.0 35.0
Lack of interest 23.1 17.9 59.0 5.3 21.1 73.7 40.0 15.0 45.0
Health issues 89.7 2.6 7.7 89.5 0.0 10.5 90.0 5.0 5.0
Shy student 76.9 15.4 7.7 84.2 15.8 0.0 70.0 15.0 15.0
Frustration and despair 59.0 23.1 17.9 63.2 26.3 10.5 55.0 20.0 25.0
Influence of wrong friends 56.4 17.9 25.6 47.4 15.8 36.8 65.0 20.0 15.0
Too much time on TV or internet 66.7 20.5 12.8 63.2 15.8 21.1 70.0 25.0 5.0
Desire for independence 51.3 23.1 25.6 21.1 36.8 42.1 80.0 10.0 10.0
Inability to continue 28.2 7.7 64.1 21.1 5.3 73.7 35.0 10.0 55.0
Anxiety of exams 46.2 28.2 25.6 73.7 10.5 15.8 20.0 45.0 35.0
Felt s/he is persona non grata
by teachers 61.5 25.6 12.8 57.9 26.3 15.8 65.0 25.0 10.0
Felt being made fun of 79.5 10.3 10.3 84.2 5.3 10.5 75.0 15.0 10.0
Student is over age 46.2 25.6 28.2 36.8 26.3 36.8 55.0 25.0 20.0
Inability of teachers 76.9 20.5 2.6 78.9 15.8 5.3 75.0 25.0 0.0
Lack of interest by teachers 69.2 25.6 5.1 63.2 31.6 5.3 75.0 20.0 5.0
Use of corporal punishment by
teachers 61.5 30.8 7.7 57.9 31.6 10.5 65.0 30.0 5.0
Poor relations with teacher 76.9 10.3 12.8 84.2 5.3 10.5 70.0 15.0 15.0
No person in school that helps
students 71.8 17.9 10.3 73.7 21.1 5.3 70.0 15.0 15.0
Lack of recreational activities
at school 71.8 17.9 10.3 78.9 15.8 5.3 65.0 20.0 15.0
Lack of follow up of absence by
school 87.2 5.1 7.7 84.2 10.5 5.3 90.0 0.0 10.0
Family problems 64.1 7.7 28.2 68.4 5.3 26.3 60.0 10.0 30.0
Death of parent 80.6 8.3 11.1 83.3 11.1 5.6 77.8 5.6 16.7
Lack of good study environment 56.4 12.8 30.8 57.9 21.1 21.1 55.0 5.0 40.0
Busy parent 55.3 13.2 31.6 50.0 11.1 38.9 60.0 15.0 25.0
Lack of follow up of the family 51.3 20.5 28.2 47.4 26.3 26.3 55.0 15.0 30.0
Family needs for help 71.8 7.7 20.5 63.2 10.5 26.3 80.0 5.0 15.0
Lack of communication
between family and school 71.8 2.6 25.6 73.7 0.0 26.3 70.0 5.0 25.0
Work to help family 76.9 10.3 12.8 68.4 15.8 15.8 85.0 5.0 10.0The residence is far away from
school 92.3 5.1 2.6 94.7 5.3 0.0 90.0 5.0 5.0
Near place for leisure activities 87.2 2.6 10.3 89.5 5.3 5.3 85.0 0.0 15.0
School close to schools of the
opposite sex 82.1 10.3 7.7 84.2 10.5 5.3 80.0 10.0 10.0
Early marriage 82.1 5.1 12.8 100.0 0.0 0.0 65.0 10.0 25.0
Socioeconomic reasons
Overall Male Female
Student-specific reasons
School-related reasons
Family-related reasons
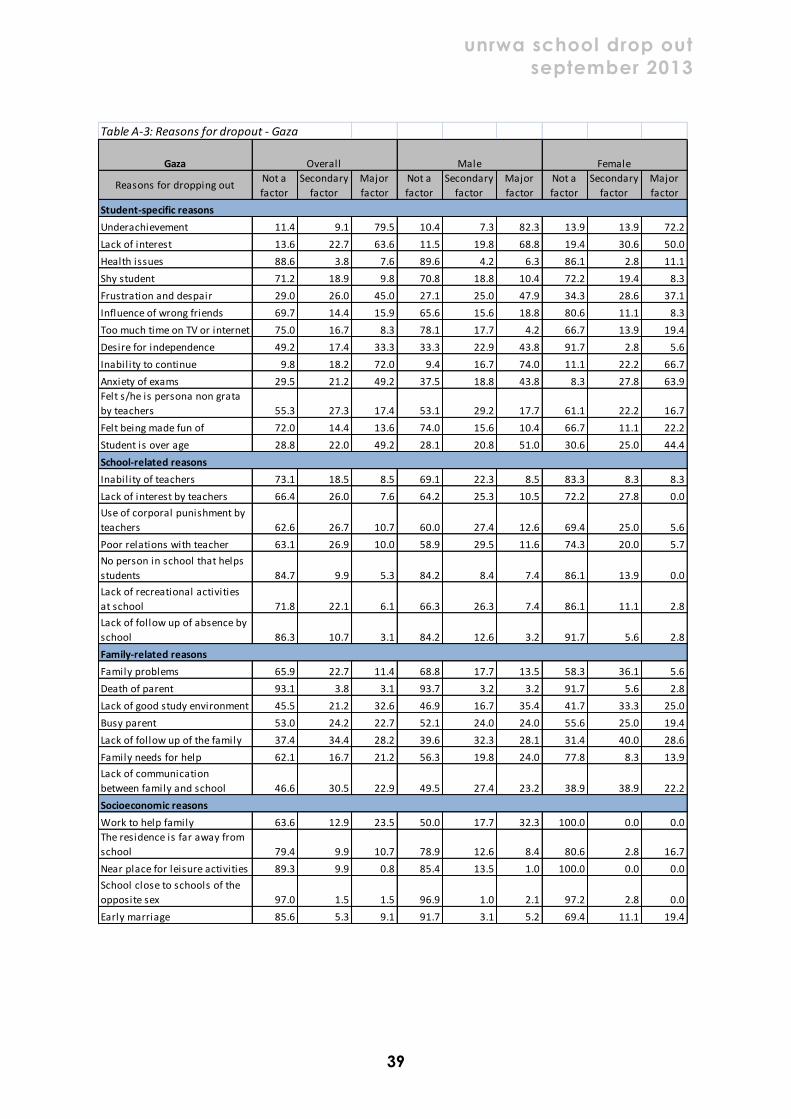
unrwa school drop out
september 2013
39
Table A-3: Reasons for dropout - Gaza
Gaza
Reasons for dropping outNot a
factor
Secondary
factor
Major
factor
Not a
factor
Secondary
factor
Major
factor
Not a
factor
Secondary
factor
Major
factor
Underachievement 11.4 9.1 79.5 10.4 7.3 82.3 13.9 13.9 72.2
Lack of interest 13.6 22.7 63.6 11.5 19.8 68.8 19.4 30.6 50.0
Health issues 88.6 3.8 7.6 89.6 4.2 6.3 86.1 2.8 11.1
Shy student 71.2 18.9 9.8 70.8 18.8 10.4 72.2 19.4 8.3
Frustration and despair 29.0 26.0 45.0 27.1 25.0 47.9 34.3 28.6 37.1
Influence of wrong friends 69.7 14.4 15.9 65.6 15.6 18.8 80.6 11.1 8.3
Too much time on TV or internet 75.0 16.7 8.3 78.1 17.7 4.2 66.7 13.9 19.4
Desire for independence 49.2 17.4 33.3 33.3 22.9 43.8 91.7 2.8 5.6
Inability to continue 9.8 18.2 72.0 9.4 16.7 74.0 11.1 22.2 66.7
Anxiety of exams 29.5 21.2 49.2 37.5 18.8 43.8 8.3 27.8 63.9
Felt s/he is persona non grata
by teachers 55.3 27.3 17.4 53.1 29.2 17.7 61.1 22.2 16.7
Felt being made fun of 72.0 14.4 13.6 74.0 15.6 10.4 66.7 11.1 22.2
Student is over age 28.8 22.0 49.2 28.1 20.8 51.0 30.6 25.0 44.4
Inability of teachers 73.1 18.5 8.5 69.1 22.3 8.5 83.3 8.3 8.3
Lack of interest by teachers 66.4 26.0 7.6 64.2 25.3 10.5 72.2 27.8 0.0
Use of corporal punishment by
teachers 62.6 26.7 10.7 60.0 27.4 12.6 69.4 25.0 5.6
Poor relations with teacher 63.1 26.9 10.0 58.9 29.5 11.6 74.3 20.0 5.7
No person in school that helps
students 84.7 9.9 5.3 84.2 8.4 7.4 86.1 13.9 0.0
Lack of recreational activities
at school 71.8 22.1 6.1 66.3 26.3 7.4 86.1 11.1 2.8
Lack of follow up of absence by
school 86.3 10.7 3.1 84.2 12.6 3.2 91.7 5.6 2.8
Family problems 65.9 22.7 11.4 68.8 17.7 13.5 58.3 36.1 5.6
Death of parent 93.1 3.8 3.1 93.7 3.2 3.2 91.7 5.6 2.8
Lack of good study environment 45.5 21.2 32.6 46.9 16.7 35.4 41.7 33.3 25.0
Busy parent 53.0 24.2 22.7 52.1 24.0 24.0 55.6 25.0 19.4
Lack of follow up of the family 37.4 34.4 28.2 39.6 32.3 28.1 31.4 40.0 28.6
Family needs for help 62.1 16.7 21.2 56.3 19.8 24.0 77.8 8.3 13.9
Lack of communication
between family and school 46.6 30.5 22.9 49.5 27.4 23.2 38.9 38.9 22.2
Work to help family 63.6 12.9 23.5 50.0 17.7 32.3 100.0 0.0 0.0
The residence is far away from
school 79.4 9.9 10.7 78.9 12.6 8.4 80.6 2.8 16.7
Near place for leisure activities 89.3 9.9 0.8 85.4 13.5 1.0 100.0 0.0 0.0
School close to schools of the
opposite sex 97.0 1.5 1.5 96.9 1.0 2.1 97.2 2.8 0.0
Early marriage 85.6 5.3 9.1 91.7 3.1 5.2 69.4 11.1 19.4
Socioeconomic reasons
Overall Male Female
Student-specific reasons
School-related reasons
Family-related reasons
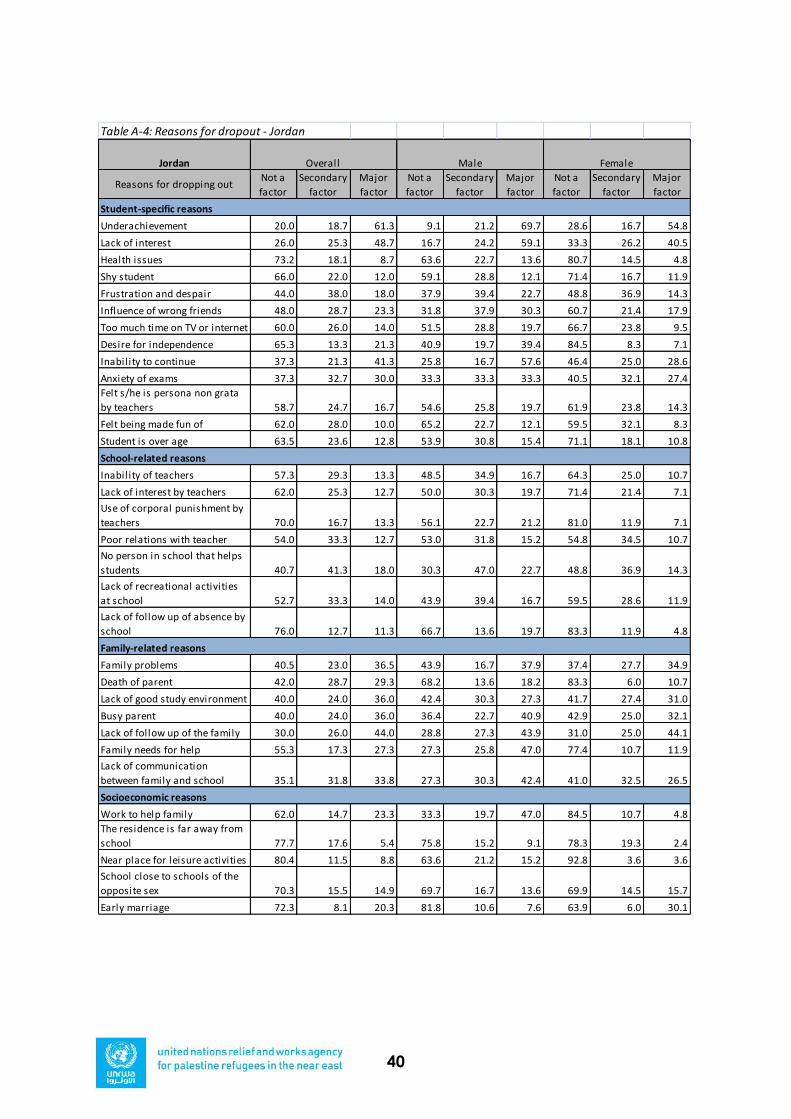
40
Table A-4: Reasons for dropout - Jordan
Jordan
Reasons for dropping outNot a
factor
Secondary
factor
Major
factor
Not a
factor
Secondary
factor
Major
factor
Not a
factor
Secondary
factor
Major
factor
Underachievement 20.0 18.7 61.3 9.1 21.2 69.7 28.6 16.7 54.8
Lack of interest 26.0 25.3 48.7 16.7 24.2 59.1 33.3 26.2 40.5
Health issues 73.2 18.1 8.7 63.6 22.7 13.6 80.7 14.5 4.8
Shy student 66.0 22.0 12.0 59.1 28.8 12.1 71.4 16.7 11.9
Frustration and despair 44.0 38.0 18.0 37.9 39.4 22.7 48.8 36.9 14.3
Influence of wrong friends 48.0 28.7 23.3 31.8 37.9 30.3 60.7 21.4 17.9
Too much time on TV or internet 60.0 26.0 14.0 51.5 28.8 19.7 66.7 23.8 9.5
Desire for independence 65.3 13.3 21.3 40.9 19.7 39.4 84.5 8.3 7.1
Inability to continue 37.3 21.3 41.3 25.8 16.7 57.6 46.4 25.0 28.6
Anxiety of exams 37.3 32.7 30.0 33.3 33.3 33.3 40.5 32.1 27.4
Felt s/he is persona non grata
by teachers 58.7 24.7 16.7 54.6 25.8 19.7 61.9 23.8 14.3
Felt being made fun of 62.0 28.0 10.0 65.2 22.7 12.1 59.5 32.1 8.3
Student is over age 63.5 23.6 12.8 53.9 30.8 15.4 71.1 18.1 10.8
Inability of teachers 57.3 29.3 13.3 48.5 34.9 16.7 64.3 25.0 10.7
Lack of interest by teachers 62.0 25.3 12.7 50.0 30.3 19.7 71.4 21.4 7.1
Use of corporal punishment by
teachers 70.0 16.7 13.3 56.1 22.7 21.2 81.0 11.9 7.1
Poor relations with teacher 54.0 33.3 12.7 53.0 31.8 15.2 54.8 34.5 10.7
No person in school that helps
students 40.7 41.3 18.0 30.3 47.0 22.7 48.8 36.9 14.3
Lack of recreational activities
at school 52.7 33.3 14.0 43.9 39.4 16.7 59.5 28.6 11.9
Lack of follow up of absence by
school 76.0 12.7 11.3 66.7 13.6 19.7 83.3 11.9 4.8
Family problems 40.5 23.0 36.5 43.9 16.7 37.9 37.4 27.7 34.9
Death of parent 42.0 28.7 29.3 68.2 13.6 18.2 83.3 6.0 10.7
Lack of good study environment 40.0 24.0 36.0 42.4 30.3 27.3 41.7 27.4 31.0
Busy parent 40.0 24.0 36.0 36.4 22.7 40.9 42.9 25.0 32.1
Lack of follow up of the family 30.0 26.0 44.0 28.8 27.3 43.9 31.0 25.0 44.1
Family needs for help 55.3 17.3 27.3 27.3 25.8 47.0 77.4 10.7 11.9
Lack of communication
between family and school 35.1 31.8 33.8 27.3 30.3 42.4 41.0 32.5 26.5
Work to help family 62.0 14.7 23.3 33.3 19.7 47.0 84.5 10.7 4.8
The residence is far away from
school 77.7 17.6 5.4 75.8 15.2 9.1 78.3 19.3 2.4
Near place for leisure activities 80.4 11.5 8.8 63.6 21.2 15.2 92.8 3.6 3.6
School close to schools of the
opposite sex 70.3 15.5 14.9 69.7 16.7 13.6 69.9 14.5 15.7
Early marriage 72.3 8.1 20.3 81.8 10.6 7.6 63.9 6.0 30.1
Socioeconomic reasons
Overall Male Female
Student-specific reasons
School-related reasons
Family-related reasons

unrwa school drop out
september 2013
41

42