Embed Size (px)
Citation preview

Aa
YMa
b
c
d
a
ARRA
KCADPP
1
htoMpr
h0
European Journal of Radiology 83 (2014) 2260–2267
Contents lists available at ScienceDirect
European Journal of Radiology
j ourna l h o mepage: www.elsev ier .com/ locate /e j rad
nalysis of decrease in lung perfusion blood volume with occlusivend non-occlusive pulmonary embolisms
ohei Ikedaa,∗, Norihiko Yoshimuraa, Yoshiro Horid, Yosuke Horii a, Hiroyuki Ishikawaa,otohiko Yamazakic, Yoshiyuki Notob, Hidefumi Aoyamaa
Department of Radiology, Niigata University Graduate School of Medical and Dental Science, JapanDepartment of Radiology, Niigata University Medical and Dental Hospital, JapanDepartment of Radiology, Niigata City General Hospital, JapanDepartment of Radiology, Showa University Fujigaoka Hospital, Japan
r t i c l e i n f o
rticle history:eceived 23 May 2014eceived in revised form 15 August 2014ccepted 22 August 2014
eywords:omputed tomographyngiographyual energyerfusionulmonary embolism
a b s t r a c t
Purpose: The aim of this study was to determine if lung perfusion blood volume (lung PBV) with non-occlusive pulmonary embolism (PE) differs quantitatively and visually from that with occlusive PE andto investigate if lung PBV with non-occlusive PE remains the same as that without PE.Materials and methods: Totally, 108 patients suspected of having acute PE underwent pulmonary dual-energy computed tomography angiography (DECTA) between April 2011 and January 2012. Presence ofPE on DECTA was evaluated by one radiologist. Two radiologists visually evaluated the PE distribution(segmental or subsegmental) and its nature (occlusive or non-occlusive) on DECTA and classified per-fusion in lung PBV as “decreased,” “slightly decreased,” and “preserved”. Two radiologists used a lung PBVapplication to set a region of interest (ROI) in the center of the lesion and measured HU values of an iodinemap. In the same slice as the ROI of the lesion and close to the lesion, another ROI was set in the normalperfusion area without PE, and HUs were measured. The proportion of lesions was compared betweenthe occlusive and non-occlusive groups. HUs were compared among the occlusive, non-occlusive, andcorresponding normal groups.Results: Twenty-five patients had 80 segmental or subsegmental lesions. There were 37 and 43 lesionsin the occlusive and non-occlusive groups, respectively. The proportion of decreased lesions was 73.0%(27/37) in the occlusive group, while that of preserved lesions in the non-occlusive group was 76.7%(33/43). There was a significant difference in the proportion of lesions (P < 0.001) between the two groups.
HUs of the iodine map were significantly higher in the non-occlusive group than in the occlusive group(33.8 ± 8.2 HU vs. 11.9 ± 6.1 HU, P < 0.001). There was no significant difference in HUs for the entire lesionbetween the non-occlusive (33.8 ± 8.2 HU) and corresponding normal group (34.5 ± 6.8 HU; P = 0.294).Conclusion: Iodine perfusion tended to be visually and quantitatively preserved in lungs with nonocclusivePE. Lung PBV is required to evaluate pulmonary blood flow.© 2014 Elsevier Ireland Ltd. All rights reserved.
. Introduction
Acute pulmonary embolism (PE) is a common disease with aigh mortality rate [1]. The technical development of multidetec-or computed tomography (MDCT) has contributed to the detectionf small embolisms in subsegmental pulmonary arteries. Therefore,
DCT has replaced scintigraphy and digital subtraction angiogra-hy as the first-line imaging tool for PE because of its high spatialesolution and short data acquisition time [2–4]. Lung perfusion
∗ Corresponding author. Tel.: +81 252272314.E-mail address: [email protected] (Y. Ikeda).
ttp://dx.doi.org/10.1016/j.ejrad.2014.08.015720-048X/© 2014 Elsevier Ireland Ltd. All rights reserved.
blood volume (lung PBV) images are generated by dual-energyimaging and are used for the diagnosis of PE. Dual-energy imagingenables selective visualization of the iodine component in tissueson the basis of attenuation differences at different energy levels[5,6]. An image of lung PBV is a fusion of an iodine distributionimage (iodine map) and a pulmonary computed tomography (CT)angiography (CTA) image. An iodine map is based on a three-material decomposition technique using iodine, air, and soft tissue[5]. Pulmonary dual-energy CTA (DECTA) does not expose patients
to any significant additional radiation exposure compared withstandard pulmonary CTA [7]. Perfusion defects in lung PBV are oftennot obvious in patients with non-occlusive lesions despite obviousPE observed on CTA [7,8]. One study on lung PBV reported that a
Y. Ikeda et al. / European Journal of Radiology 83 (2014) 2260–2267 2261
F . Thec
c((iwwP
2
2
si6p2rao
2
Mme31sFTst
altACpawa
H0si
ig. 1. Representative case of a “decreased” lesion and a “slightly decreased” lesionlassified as “decreased” (right).
orresponding perfusion defect was detected in 42 of 44 patients95.5%) with occlusive PE, whereas only two of the 33 patients6.1%) with non-occlusive PE were accompanied by a correspond-ng perfusion defect [7]. This study aimed to determine if lung PBV
ith non-occlusive PE differs quantitatively and visually from thatith occlusive PE and to investigate if lung PBV with non-occlusive
E remains the same as that without PE.
. Materials and methods
.1. Patients
Our institutional review board approved this retrospectivetudy, and informed consent was waived. Patient confidential-ty was protected. Totally, 108 (35 men, 73 women; mean age,2.2 ± 15.8 years; range, 12–88 years) patients with clinically sus-ected acute PE underwent DECTA between April 2011 and January012. The reasons for clinical diagnosis were acute chest pain, respi-atory discomfort, and perioperative increase in d-dimer levels,mong others. Patients with clinically suspected chronic PE basedn clinical records were excluded.
.2. CT imaging protocol
A dual-source CT scanner (Somatom Definition Flash; Siemensedical Solutions, Forchheim, Germany) using the dual-energyode was used to examine all patients. The following CT param-
ters were used: detector collimation, 2 mm × 64 mm × 0.6 mm;30-ms rotation time; pitch, 0.55; and tube voltage, 140 kV and00 kV. The tube current–time product varied for each patient. Thelice thickness was set to 1.0 mm and the increment to 1.0 mm.or all images, a medium-soft convolution kernel (D30) was used.he mixed DECTA images equivalent to 120-kV images were recon-tructed and obtained by deriving 40% of the image density fromhe 140-kV images and 60% from the 100-kV images.
On the basis of three-material decomposition of soft tissue, air,nd iodine, iodine distribution images (iodine map) of the lung andung PBV images were generated on a workstation (Syngo Acquisi-ion Workplace; Siemens Medical Solutions, Forchheim, Germany).n image of lung PBV is a fusion of an iodine map and a pulmonaryTA image. The normalization of the window in the iodine map waserformed by setting a region of interest (ROI) in the pulmonaryrtery trunk. The minimum CT value on the iodine map was −960,hile the maximum CT value was −600. The range was set to 4 on
scale of 1–10.A nonionic contrast medium (Iopamiron, 370 mgI/mL; Bayer
ealthcare, Berlin, Germany) was administered at a flow rate of.06 × BW mL/s for 20 s. Then, a mixture of contrast medium andaline (1:1 ratio) was administered at the same rate. The scan wasnitiated using a bolus-tracking technique with an ROI placed over
lesion in Lt. S1 + 2 is classified as “slightly decreased” (left). The lesion in Lt. S10 is
the pulmonary trunk, which triggered the scanner enhancementlevel of 250 HU. The trigger delay time was 10 s.
2.3. Analysis of DECTA images
The mixed DECTA images equivalent to 120-kV images wereevaluated. We used a PACS system (Synapse; Fujifilm, Tokyo,Japan). The window level and window width were appropriatelyadjusted. At first, the presence of PE in DECTA was evaluatedby one radiologist with 9 years of experience in cardiovascularimaging. Among all PE lesions, segmental or subsegmental lesionsthat did not extend to the proximal level were identified. Lesionsthat involved a shadow, such as pneumonia and atelectasis, wereexcluded.
Two radiologists with 9 (same as above) and 18 years ofexperience in cardiovascular imaging, respectively, independentlyevaluated segmental and subsegmental PE lesions. The PE dis-tribution (segmental or subsegmental) and nature (occlusive ornon-occlusive) were visually determined. When their original diag-nosis did not concur, the radiologists discussed their decisions andreached a consensus diagnosis.
A non-occlusive lesion was defined when the lumen in thelesion (even if only slightly) and peripheral vessel exhibited con-trast enhancement. An occlusive lesion was defined when boththe lumen in the lesion and the peripheral vessel were not con-trast enhanced. If the lesion extended over both the segmental andsubsegmental branches, it was regarded as the segmental lesion.
2.4. Analysis of lung PBV images
Two radiologists (same as above) independently evaluated lungPBV. This analysis was performed 5 months after the analysis ofDECTA to minimize the memory effect. The list of PE lesions withoutidentifying their nature (occlusive or non-occlusive) in the DECTAimages was used. The observers visually assessed only the lung PBVimages without examining the DECTA images. The perfusion of thelesion was classified as “decreased,” “slightly decreased,” and “pre-served” (Fig. 1). Classification was based on visual comparison withthe normal perfusion area without PE in the same patient. If therewere different interpretations of the lung PBV images, a final deci-sion was determined by discussion, as conducted for analysis of theDECTA images.
Two radiologists with 9 (same as above) and 12 years ofexperience in cardiovascular imaging, respectively, independentlymeasured the Hounsfield units (HUs). An ROI was set in the centerof each lesion’s perfusion area by using the lung PBV application of
the workstation software (Syngo Acquisition Workplace; SiemensHealthcare), and HUs of the iodine map were measured. Further-more, in the same slice as the ROI of the lesion and close to thelesion, another ROI was set in the normal perfusion area without PE,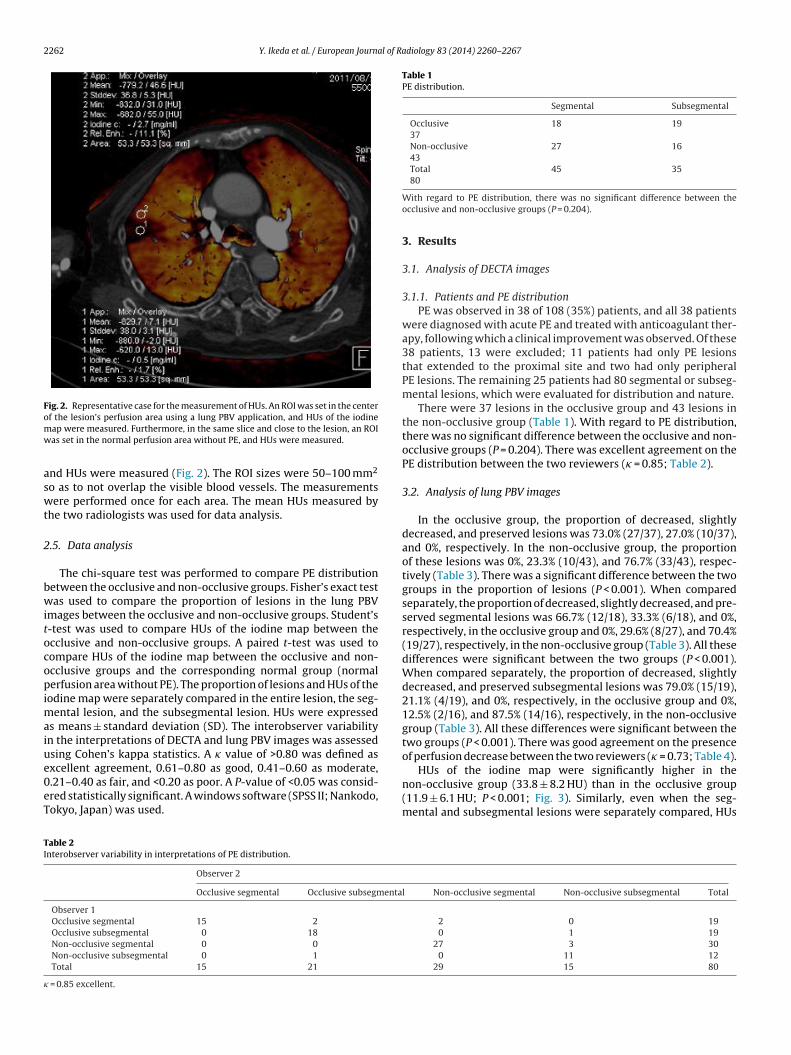
2262 Y. Ikeda et al. / European Journal of Radiology 83 (2014) 2260–2267
Fig. 2. Representative case for the measurement of HUs. An ROI was set in the centeromw
aswt
2
bwitocopimaiue0eT
Table 1PE distribution.
Segmental Subsegmental
Occlusive37
18 19
Non-occlusive43
27 16
Total80
45 35
TI
�
f the lesion’s perfusion area using a lung PBV application, and HUs of the iodineap were measured. Furthermore, in the same slice and close to the lesion, an ROIas set in the normal perfusion area without PE, and HUs were measured.
nd HUs were measured (Fig. 2). The ROI sizes were 50–100 mm2
o as to not overlap the visible blood vessels. The measurementsere performed once for each area. The mean HUs measured by
he two radiologists was used for data analysis.
.5. Data analysis
The chi-square test was performed to compare PE distributionetween the occlusive and non-occlusive groups. Fisher’s exact testas used to compare the proportion of lesions in the lung PBV
mages between the occlusive and non-occlusive groups. Student’s-test was used to compare HUs of the iodine map between thecclusive and non-occlusive groups. A paired t-test was used toompare HUs of the iodine map between the occlusive and non-cclusive groups and the corresponding normal group (normalerfusion area without PE). The proportion of lesions and HUs of the
odine map were separately compared in the entire lesion, the seg-ental lesion, and the subsegmental lesion. HUs were expressed
s means ± standard deviation (SD). The interobserver variabilityn the interpretations of DECTA and lung PBV images was assessedsing Cohen’s kappa statistics. A � value of >0.80 was defined as
xcellent agreement, 0.61–0.80 as good, 0.41–0.60 as moderate,.21–0.40 as fair, and <0.20 as poor. A P-value of <0.05 was consid-red statistically significant. A windows software (SPSS II; Nankodo,okyo, Japan) was used.able 2nterobserver variability in interpretations of PE distribution.
Observer 2
Occlusive segmental Occlusive subsegmenta
Observer 1Occlusive segmental 15 2
Occlusive subsegmental 0 18
Non-occlusive segmental 0 0
Non-occlusive subsegmental 0 1
Total 15 21
= 0.85 excellent.
With regard to PE distribution, there was no significant difference between theocclusive and non-occlusive groups (P = 0.204).
3. Results
3.1. Analysis of DECTA images
3.1.1. Patients and PE distributionPE was observed in 38 of 108 (35%) patients, and all 38 patients
were diagnosed with acute PE and treated with anticoagulant ther-apy, following which a clinical improvement was observed. Of these38 patients, 13 were excluded; 11 patients had only PE lesionsthat extended to the proximal site and two had only peripheralPE lesions. The remaining 25 patients had 80 segmental or subseg-mental lesions, which were evaluated for distribution and nature.
There were 37 lesions in the occlusive group and 43 lesions inthe non-occlusive group (Table 1). With regard to PE distribution,there was no significant difference between the occlusive and non-occlusive groups (P = 0.204). There was excellent agreement on thePE distribution between the two reviewers (� = 0.85; Table 2).
3.2. Analysis of lung PBV images
In the occlusive group, the proportion of decreased, slightlydecreased, and preserved lesions was 73.0% (27/37), 27.0% (10/37),and 0%, respectively. In the non-occlusive group, the proportionof these lesions was 0%, 23.3% (10/43), and 76.7% (33/43), respec-tively (Table 3). There was a significant difference between the twogroups in the proportion of lesions (P < 0.001). When comparedseparately, the proportion of decreased, slightly decreased, and pre-served segmental lesions was 66.7% (12/18), 33.3% (6/18), and 0%,respectively, in the occlusive group and 0%, 29.6% (8/27), and 70.4%(19/27), respectively, in the non-occlusive group (Table 3). All thesedifferences were significant between the two groups (P < 0.001).When compared separately, the proportion of decreased, slightlydecreased, and preserved subsegmental lesions was 79.0% (15/19),21.1% (4/19), and 0%, respectively, in the occlusive group and 0%,12.5% (2/16), and 87.5% (14/16), respectively, in the non-occlusivegroup (Table 3). All these differences were significant between thetwo groups (P < 0.001). There was good agreement on the presenceof perfusion decrease between the two reviewers (� = 0.73; Table 4).
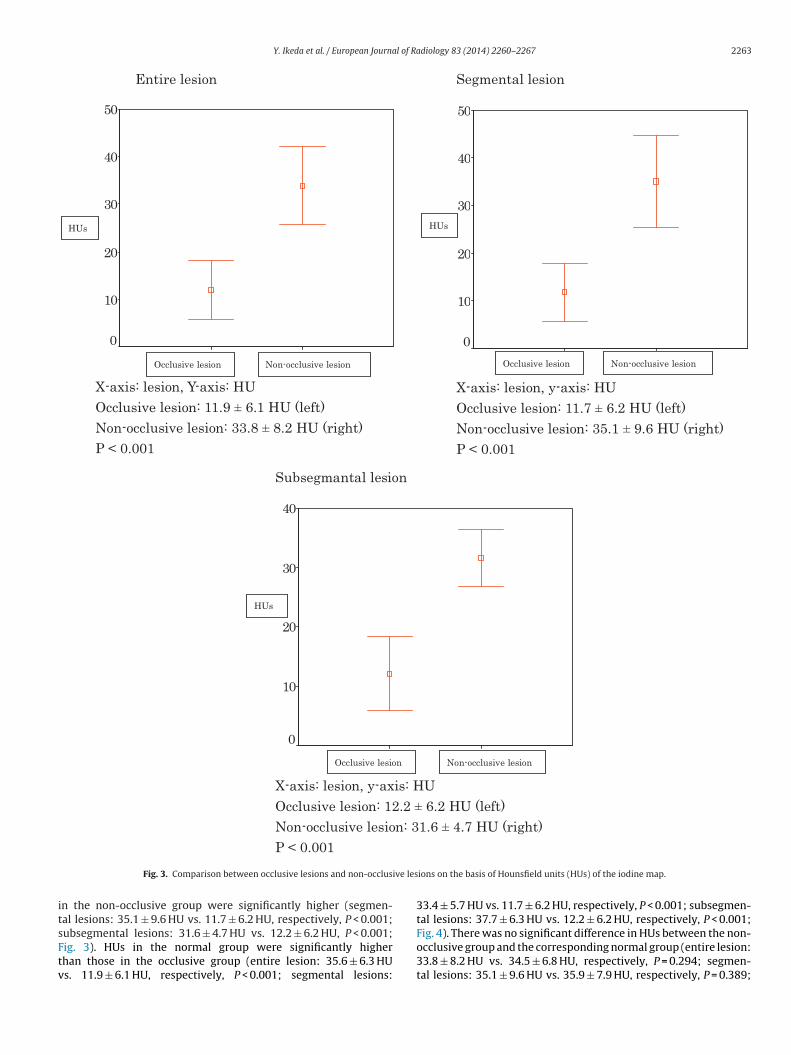
HUs of the iodine map were significantly higher in thenon-occlusive group (33.8 ± 8.2 HU) than in the occlusive group(11.9 ± 6.1 HU; P < 0.001; Fig. 3). Similarly, even when the seg-mental and subsegmental lesions were separately compared, HUs
l Non-occlusive segmental Non-occlusive subsegmental Total
2 0 190 1 19
27 3 300 11 12
29 15 80
Y. Ikeda et al. / European Journal of Radiology 83 (2014) 2260–2267 2263
X-axis: lesi on, Y-axis: HUOcclusive lesi on: 11.9 ± 6.1 HU (left )Non-occlu sive lesi on: 33 .8 ± 8.2 HU (ri ght)P < 0 .00 1
50
40
30
20
10
0Non-o cclusive lesionOcclusi ve lesi on
HUs
Segmental lesio nEntire lesion
X-axis: lesion, y-axis: HUOcclusive lesi on: 11.7 ± 6.2 HU (left )Non-occlu sive lesi on: 35 .1 ± 9.6 HU (ri ght)P < 0 .00 1
50
40
30
20
10
0Non-o cclusive lesionOcclusi ve lesi on
HUs
Subsegmantal lesion
X-axis: lesion, y-axis: HUOcclusive lesi on: 12 .2 ± 6.2 HU (l eft )Non-occlu sive lesi on: 31 .6 ± 4.7 HU (ri ght)
40
30
20
10
0Non-o cclusive lesionOcclusi ve lesi on
HUs
ive les
itsFtv
P < 0 .00 1Fig. 3. Comparison between occlusive lesions and non-occlus
n the non-occlusive group were significantly higher (segmen-al lesions: 35.1 ± 9.6 HU vs. 11.7 ± 6.2 HU, respectively, P < 0.001;
ubsegmental lesions: 31.6 ± 4.7 HU vs. 12.2 ± 6.2 HU, P < 0.001;ig. 3). HUs in the normal group were significantly higherhan those in the occlusive group (entire lesion: 35.6 ± 6.3 HUs. 11.9 ± 6.1 HU, respectively, P < 0.001; segmental lesions:ions on the basis of Hounsfield units (HUs) of the iodine map.
33.4 ± 5.7 HU vs. 11.7 ± 6.2 HU, respectively, P < 0.001; subsegmen-tal lesions: 37.7 ± 6.3 HU vs. 12.2 ± 6.2 HU, respectively, P < 0.001;
Fig. 4). There was no significant difference in HUs between the non-occlusive group and the corresponding normal group (entire lesion:33.8 ± 8.2 HU vs. 34.5 ± 6.8 HU, respectively, P = 0.294; segmen-tal lesions: 35.1 ± 9.6 HU vs. 35.9 ± 7.9 HU, respectively, P = 0.389;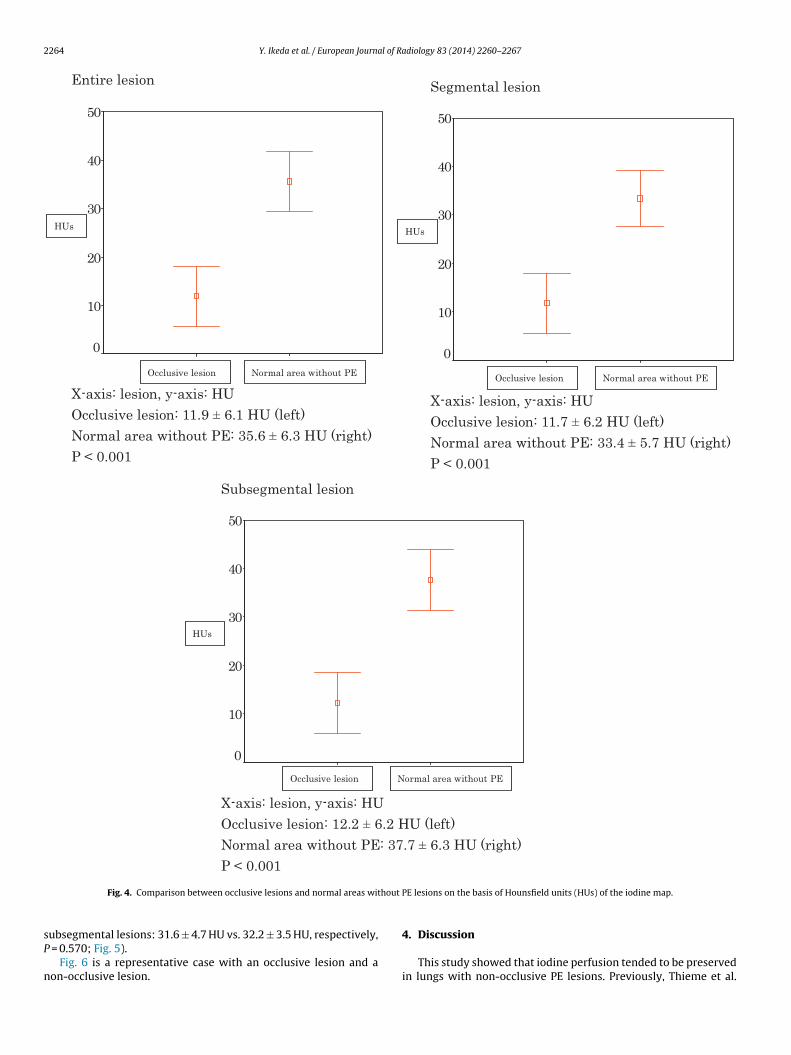
2264 Y. Ikeda et al. / European Journal of Radiology 83 (2014) 2260–2267
Entire lesion
X-axis: lesion, y-axis: HUOcclusive lesi on: 11.9 ± 6.1 HU (left )Normal area wi thout PE: 35 .6 ± 6 .3 H U (ri ght)P < 0 .00 1
50
40
30
20
10
0Normal area wit hout PEOcclusi ve lesi on
HUs
Segmental lesio n
X-axis: lesion, y-axis: HUOcclusive lesi on: 11.7 ± 6.2 HU (left )Normal area wi thout PE: 33 .4 ± 5 .7 H U (ri ght)P < 0 .00 1
50
40
30
20
10
0Normal area wit hout PEOcclusi ve lesi on
HUs
Subseg mental lesion
X-axis: lesion, y-axis: HUOcclusive lesi on: 12 .2 ± 6.2 HU (l eft )Normal area wi thout PE: 37 .7 ± 6 .3 H U (ri ght)P < 0 .00 1
50
40
30
20
10
0Normal area wit hout PEOcclusi ve lesi on
HUs
hout
sP
n
Fig. 4. Comparison between occlusive lesions and normal areas wit
ubsegmental lesions: 31.6 ± 4.7 HU vs. 32.2 ± 3.5 HU, respectively, = 0.570; Fig. 5).
Fig. 6 is a representative case with an occlusive lesion and aon-occlusive lesion.
PE lesions on the basis of Hounsfield units (HUs) of the iodine map.
4. Discussion
This study showed that iodine perfusion tended to be preservedin lungs with non-occlusive PE lesions. Previously, Thieme et al.

Y. Ikeda et al. / European Journal of Radiology 83 (2014) 2260–2267 2265
Entire lesi on
X-axis: lesion, y-axis: HUNon-occlu sive le sion: 33 .8 ± 8.2 HU (l eft )Normal area wi thout PE: 34 .5 ± 6 .8 H U (ri ght)P = 0 .29 4
50
40
30
20Non-occlusive lesion Normal area wit hout PE
HUs
Segmental lesio n
X-axis: lesion, y-axis: HUNon-occlu sive le sion: 35 .1 ± 9.6 HU (l eft )Normal area wi thout PE: 35 .9 ± 7 .9 H U (ri ght)P = 0 .38 9
50
40
30
20Non-occlusive lesion
HUs
Normal area without PE
Subseg mental lesion
X-axis: lesion, y-axis: HUNon-occlu sive le sion: 31 .6 ± 4.7 HU (l eft )Normal area wi thout PE: 32 .2 ± 3 .5 H U (ri ght)
38
36
34
32
30
28
26Non-o cclusive lesion Normal area wit hout PE
HUs
ithou
[tsoan
P = 0 .57 0Fig. 5. Comparison between non-occlusive lesions and normal areas w
7] reported similar results that were visually verified. In additiono the visual evaluation, our study quantitatively confirmed pre-erved perfusion in lungs with non-occlusive PE by measuring HUs
f the iodine map (Figs. 3–5). Hoey et al. [8] reported decreasedttenuation values in partially occluded lobes in chronic PE. Theovel approach taken in the present study was to measure thet PE lesions on the basis of Hounsfield units (HUs) of the iodine map.
attenuation values (HUs) in acute PE and to evaluate the lesions ineach segment or subsegment.
Our paper clarified that the degree of peripheral pulmonary
blood flow could not be predicted by assessing only the presenceor absence of PE on pulmonary CTA. Clark et al. [9] indicated thatpulmonary artery patency assessments should be included in clot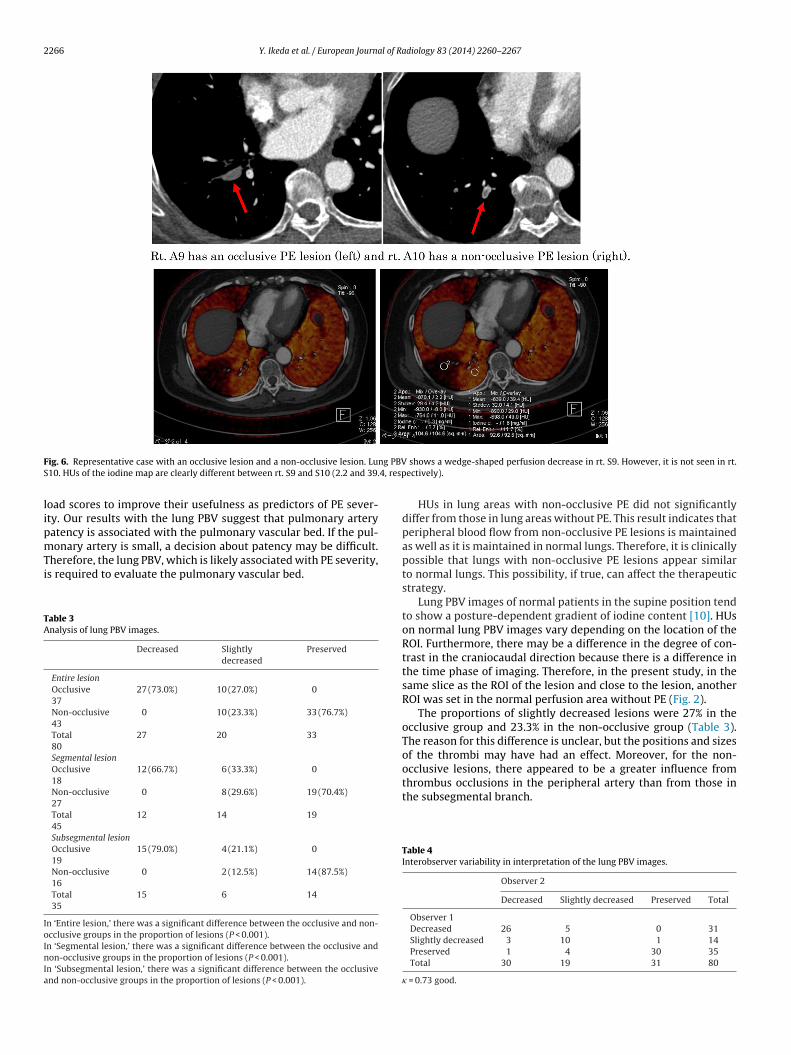
2266 Y. Ikeda et al. / European Journal of Radiology 83 (2014) 2260–2267
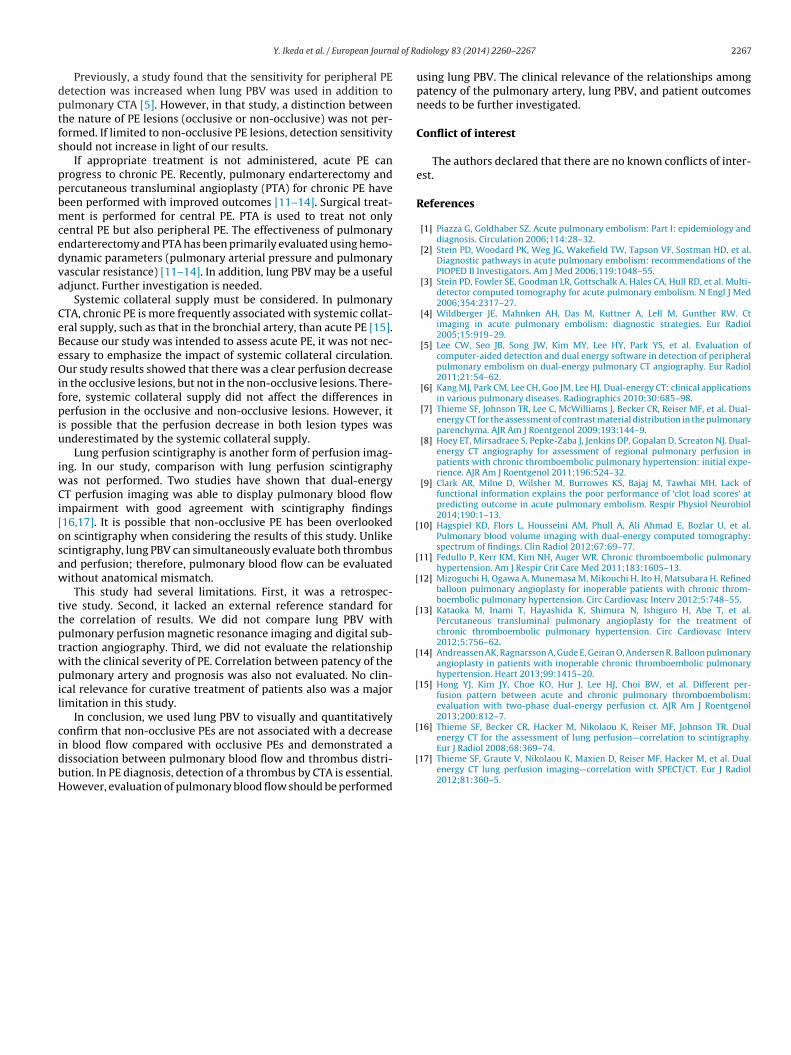
F ng PBVS 4, resp
lipmTi
TA
IoInIa
ig. 6. Representative case with an occlusive lesion and a non-occlusive lesion. Lu10. HUs of the iodine map are clearly different between rt. S9 and S10 (2.2 and 39.
oad scores to improve their usefulness as predictors of PE sever-ty. Our results with the lung PBV suggest that pulmonary arteryatency is associated with the pulmonary vascular bed. If the pul-
onary artery is small, a decision about patency may be difficult.herefore, the lung PBV, which is likely associated with PE severity,s required to evaluate the pulmonary vascular bed.
able 3nalysis of lung PBV images.
Decreased Slightlydecreased
Preserved
Entire lesionOcclusive37
27 (73.0%) 10 (27.0%) 0
Non-occlusive43
0 10 (23.3%) 33 (76.7%)
Total80
27 20 33
Segmental lesionOcclusive18
12 (66.7%) 6 (33.3%) 0
Non-occlusive27
0 8 (29.6%) 19 (70.4%)
Total45
12 14 19
Subsegmental lesionOcclusive19
15 (79.0%) 4 (21.1%) 0
Non-occlusive16
0 2 (12.5%) 14 (87.5%)
Total35
15 6 14
n ‘Entire lesion,’ there was a significant difference between the occlusive and non-cclusive groups in the proportion of lesions (P < 0.001).n ‘Segmental lesion,’ there was a significant difference between the occlusive andon-occlusive groups in the proportion of lesions (P < 0.001).
n ‘Subsegmental lesion,’ there was a significant difference between the occlusivend non-occlusive groups in the proportion of lesions (P < 0.001).
shows a wedge-shaped perfusion decrease in rt. S9. However, it is not seen in rt.ectively).
HUs in lung areas with non-occlusive PE did not significantlydiffer from those in lung areas without PE. This result indicates thatperipheral blood flow from non-occlusive PE lesions is maintainedas well as it is maintained in normal lungs. Therefore, it is clinicallypossible that lungs with non-occlusive PE lesions appear similarto normal lungs. This possibility, if true, can affect the therapeuticstrategy.
Lung PBV images of normal patients in the supine position tendto show a posture-dependent gradient of iodine content [10]. HUson normal lung PBV images vary depending on the location of theROI. Furthermore, there may be a difference in the degree of con-trast in the craniocaudal direction because there is a difference inthe time phase of imaging. Therefore, in the present study, in thesame slice as the ROI of the lesion and close to the lesion, anotherROI was set in the normal perfusion area without PE (Fig. 2).
The proportions of slightly decreased lesions were 27% in theocclusive group and 23.3% in the non-occlusive group (Table 3).The reason for this difference is unclear, but the positions and sizesof the thrombi may have had an effect. Moreover, for the non-occlusive lesions, there appeared to be a greater influence from
thrombus occlusions in the peripheral artery than from those inthe subsegmental branch.Table 4Interobserver variability in interpretation of the lung PBV images.
Observer 2
Decreased Slightly decreased Preserved Total
Observer 1Decreased 26 5 0 31Slightly decreased 3 10 1 14Preserved 1 4 30 35Total 30 19 31 80
� = 0.73 good.
l of Ra
dptfs
ppbmcedva
CeBeOifpiu
iwCi[osaw
ttptwpil
cidbH
[
[
[
[
[
[
[energy CT for the assessment of lung perfusion—correlation to scintigraphy.
Y. Ikeda et al. / European Journa
Previously, a study found that the sensitivity for peripheral PEetection was increased when lung PBV was used in addition toulmonary CTA [5]. However, in that study, a distinction betweenhe nature of PE lesions (occlusive or non-occlusive) was not per-ormed. If limited to non-occlusive PE lesions, detection sensitivityhould not increase in light of our results.
If appropriate treatment is not administered, acute PE canrogress to chronic PE. Recently, pulmonary endarterectomy andercutaneous transluminal angioplasty (PTA) for chronic PE haveeen performed with improved outcomes [11–14]. Surgical treat-ent is performed for central PE. PTA is used to treat not only
entral PE but also peripheral PE. The effectiveness of pulmonaryndarterectomy and PTA has been primarily evaluated using hemo-ynamic parameters (pulmonary arterial pressure and pulmonaryascular resistance) [11–14]. In addition, lung PBV may be a usefuldjunct. Further investigation is needed.
Systemic collateral supply must be considered. In pulmonaryTA, chronic PE is more frequently associated with systemic collat-ral supply, such as that in the bronchial artery, than acute PE [15].ecause our study was intended to assess acute PE, it was not nec-ssary to emphasize the impact of systemic collateral circulation.ur study results showed that there was a clear perfusion decrease
n the occlusive lesions, but not in the non-occlusive lesions. There-ore, systemic collateral supply did not affect the differences inerfusion in the occlusive and non-occlusive lesions. However, it
s possible that the perfusion decrease in both lesion types wasnderestimated by the systemic collateral supply.
Lung perfusion scintigraphy is another form of perfusion imag-ng. In our study, comparison with lung perfusion scintigraphy
as not performed. Two studies have shown that dual-energyT perfusion imaging was able to display pulmonary blood flow
mpairment with good agreement with scintigraphy findings16,17]. It is possible that non-occlusive PE has been overlookedn scintigraphy when considering the results of this study. Unlikecintigraphy, lung PBV can simultaneously evaluate both thrombusnd perfusion; therefore, pulmonary blood flow can be evaluatedithout anatomical mismatch.
This study had several limitations. First, it was a retrospec-ive study. Second, it lacked an external reference standard forhe correlation of results. We did not compare lung PBV withulmonary perfusion magnetic resonance imaging and digital sub-raction angiography. Third, we did not evaluate the relationshipith the clinical severity of PE. Correlation between patency of theulmonary artery and prognosis was also not evaluated. No clin-
cal relevance for curative treatment of patients also was a majorimitation in this study.
In conclusion, we used lung PBV to visually and quantitativelyonfirm that non-occlusive PEs are not associated with a decrease
n blood flow compared with occlusive PEs and demonstrated aissociation between pulmonary blood flow and thrombus distri-ution. In PE diagnosis, detection of a thrombus by CTA is essential.owever, evaluation of pulmonary blood flow should be performed[
diology 83 (2014) 2260–2267 2267
using lung PBV. The clinical relevance of the relationships amongpatency of the pulmonary artery, lung PBV, and patient outcomesneeds to be further investigated.
Conflict of interest
The authors declared that there are no known conflicts of inter-est.
References
[1] Piazza G, Goldhaber SZ. Acute pulmonary embolism: Part I: epidemiology anddiagnosis. Circulation 2006;114:28–32.
[2] Stein PD, Woodard PK, Weg JG, Wakefield TW, Tapson VF, Sostman HD, et al.Diagnostic pathways in acute pulmonary embolism: recommendations of thePIOPED II Investigators. Am J Med 2006;119:1048–55.
[3] Stein PD, Fowler SE, Goodman LR, Gottschalk A, Hales CA, Hull RD, et al. Multi-detector computed tomography for acute pulmonary embolism. N Engl J Med2006;354:2317–27.
[4] Wildberger JE, Mahnken AH, Das M, Kuttner A, Lell M, Gunther RW. Ctimaging in acute pulmonary embolism: diagnostic strategies. Eur Radiol2005;15:919–29.
[5] Lee CW, Seo JB, Song JW, Kim MY, Lee HY, Park YS, et al. Evaluation ofcomputer-aided detection and dual energy software in detection of peripheralpulmonary embolism on dual-energy pulmonary CT angiography. Eur Radiol2011;21:54–62.
[6] Kang MJ, Park CM, Lee CH, Goo JM, Lee HJ. Dual-energy CT: clinical applicationsin various pulmonary diseases. Radiographics 2010;30:685–98.
[7] Thieme SF, Johnson TR, Lee C, McWilliams J, Becker CR, Reiser MF, et al. Dual-energy CT for the assessment of contrast material distribution in the pulmonaryparenchyma. AJR Am J Roentgenol 2009;193:144–9.
[8] Hoey ET, Mirsadraee S, Pepke-Zaba J, Jenkins DP, Gopalan D, Screaton NJ. Dual-energy CT angiography for assessment of regional pulmonary perfusion inpatients with chronic thromboembolic pulmonary hypertension: initial expe-rience. AJR Am J Roentgenol 2011;196:524–32.
[9] Clark AR, Milne D, Wilsher M, Burrowes KS, Bajaj M, Tawhai MH. Lack offunctional information explains the poor performance of ‘clot load scores’ atpredicting outcome in acute pulmonary embolism. Respir Physiol Neurobiol2014;190:1–13.
10] Hagspiel KD, Flors L, Housseini AM, Phull A, Ali Ahmad E, Bozlar U, et al.Pulmonary blood volume imaging with dual-energy computed tomography:spectrum of findings. Clin Radiol 2012;67:69–77.
11] Fedullo P, Kerr KM, Kim NH, Auger WR. Chronic thromboembolic pulmonaryhypertension. Am J Respir Crit Care Med 2011;183:1605–13.
12] Mizoguchi H, Ogawa A, Munemasa M, Mikouchi H, Ito H, Matsubara H. Refinedballoon pulmonary angioplasty for inoperable patients with chronic throm-boembolic pulmonary hypertension. Circ Cardiovasc Interv 2012;5:748–55.
13] Kataoka M, Inami T, Hayashida K, Shimura N, Ishiguro H, Abe T, et al.Percutaneous transluminal pulmonary angioplasty for the treatment ofchronic thromboembolic pulmonary hypertension. Circ Cardiovasc Interv2012;5:756–62.
14] Andreassen AK, Ragnarsson A, Gude E, Geiran O, Andersen R. Balloon pulmonaryangioplasty in patients with inoperable chronic thromboembolic pulmonaryhypertension. Heart 2013;99:1415–20.
15] Hong YJ, Kim JY, Choe KO, Hur J, Lee HJ, Choi BW, et al. Different per-fusion pattern between acute and chronic pulmonary thromboembolism:evaluation with two-phase dual-energy perfusion ct. AJR Am J Roentgenol2013;200:812–7.
16] Thieme SF, Becker CR, Hacker M, Nikolaou K, Reiser MF, Johnson TR. Dual
Eur J Radiol 2008;68:369–74.17] Thieme SF, Graute V, Nikolaou K, Maxien D, Reiser MF, Hacker M, et al. Dual
energy CT lung perfusion imaging—correlation with SPECT/CT. Eur J Radiol2012;81:360–5.